Embed Size (px)
Citation preview
Visual Analytics with a Focus on TimeInvited Talk @ CNRS MAP 2015Marseille, 21nd January 2015
ALEXANDER [email protected], http://alex.timebench.orgSt. Poelten University of Applied Sciences, Institute of Creative\Media/Technologies

Why me?
7 years of research experience in Visual Analytics / Information Visualization with a Focus on TimeDanube University KremsVienna University of TechnologySt. Pölten University of Applied Sciences
7 peer-refereed journal articles, esp.TimeBench – a data model and open source softwareSurvey on Electronic Health Records Visualization
interest in cultural heritage as application domain
2

St. Pölten University of Applied Sciences
founded 1996 8 Bachelor's programmes7 Master's programmes> 2,000 studentsappr. 300 lecturers
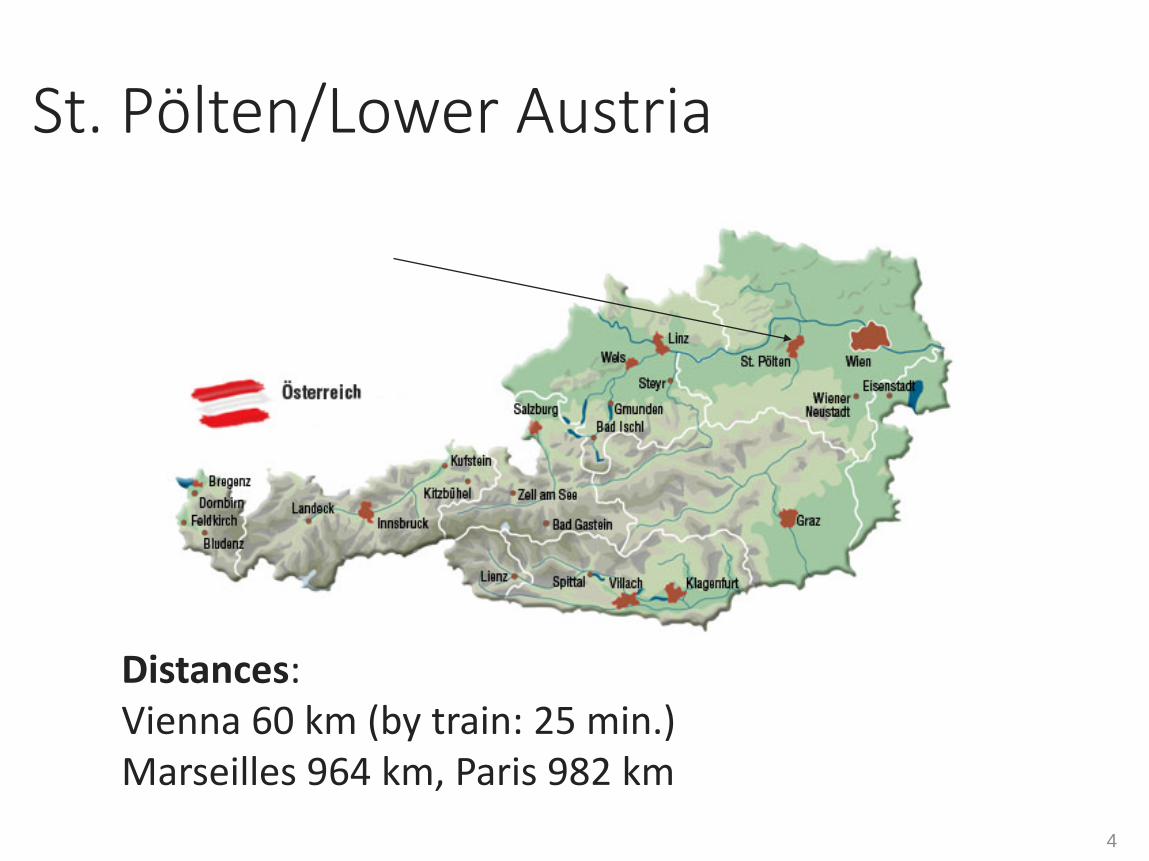
St. Pölten/Lower Austria
Distances: Vienna 60 km (by train: 25 min.)Marseilles 964 km, Paris 982 km
4

TV lab Usability lab
Electronics lab Audio lab

Media Computing Research Group
Multimedia Signal Processing & Retrieval
Markus Seidl, Matthias Zeppelzauer,Ewald Wieser
Information Visualization & Visual Analytics
Wolfgang Aigner, Christina Niederer, Alexander Rind, Markus Wagner, Andrea Haberson
Game Design & Human Computer Interaction
Peter Judmaier, Gernot Rottermanner, Bernhard Zeller
http://mc.fhstp.ac.at/ 6

Multi-touch HCI: The Revelation
7
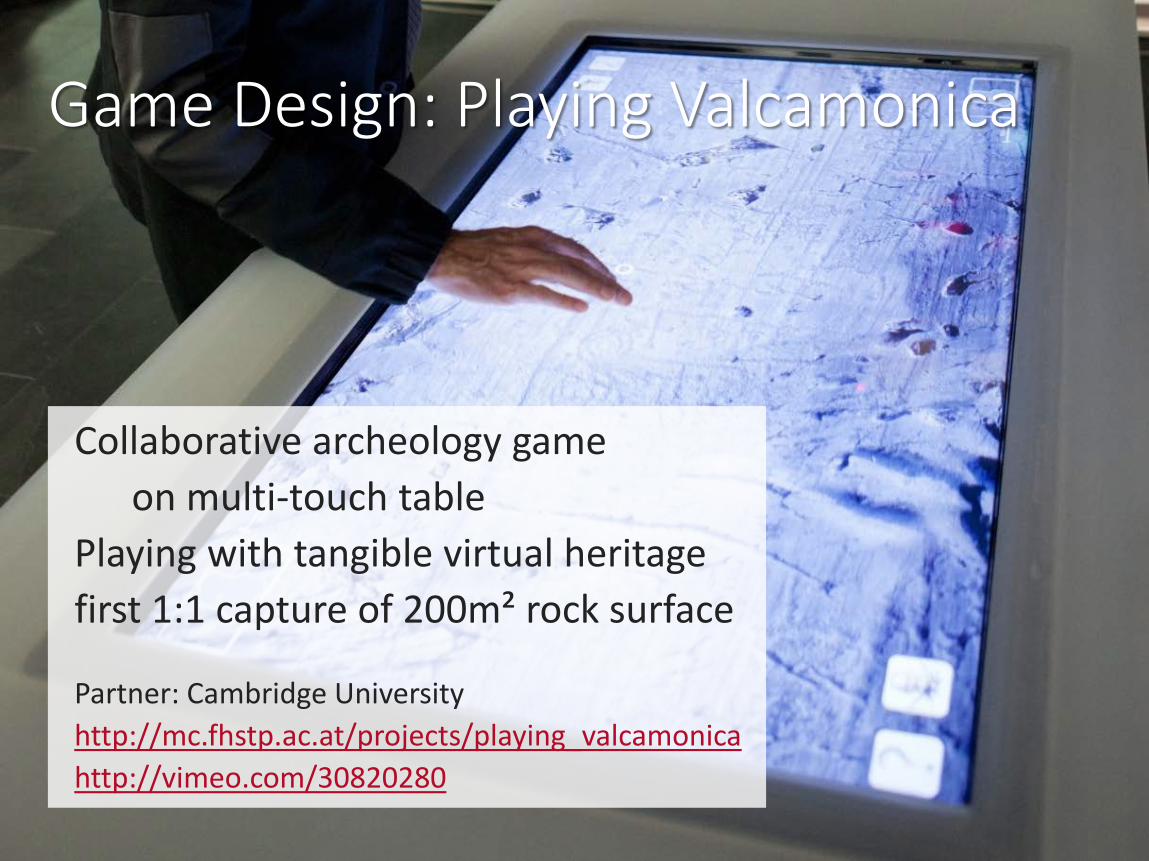
Game Design: Playing Valcamonica
Collaborative archeology gameon multi-touch table
Playing with tangible virtual heritagefirst 1:1 capture of 200m² rock surface
Partner: Cambridge University http://mc.fhstp.ac.at/projects/playing_valcamonicahttp://vimeo.com/30820280

Media Processing: 3D-Pitoti3D-Acquisition, Intelligent Processing, 3D Presentation of Rock Art
St. Pölten‘s Tasks:Petroglyph segmentation and classificationShape analysis, shape classification, Analysis of surface topology
Partners: Univ. of Nottingham , Univ. of Cambridge, CCSP, Bauhaus Univ. Weimar, TU Graz, Actron3D
Funding: EU FP7http://3d-pitoti.eu
[Seidl et al., 2014] 9

Media Retrieval: Social Event Detection
e.g., football match,concert, conference,…, events by location
e.g., flickr, instagram
MediaEval 2014SED Challenge
1
[Zaharieva et al., 2014] 10

Visual Analytics with a Focus on Time

IntroductionElectronic Health Records
Cultural Heritage
Text Corpora & Narratives
Business Transactions
Image: Brett Ryder (The Economist, 2010); Dudek & Blaise (2013) 12

“Visual Analytics is the science of analytical reasoning facilitated by
interactive visual interfaces.”[Thomas & Cook, 2005]
13

“Visual Analytics is the method to perform tasks involving datausing both computer-based analysis systems and human judgment facilitated by direct interaction with visual representations of data.”
[Rind, ca. 2015]
14

e.g., analyzing electronic health records
Challenges of Time-oriented Data
different time primitives
temporal indeterminacy
time
time-orientedmultivariate
sampled irregularly
[Aigner et al., 2011]
multiple granularities & cycles
15

Modeling
Visualizing
Interacting
Analyzing
16

Modeling Time & Time-Oriented Data
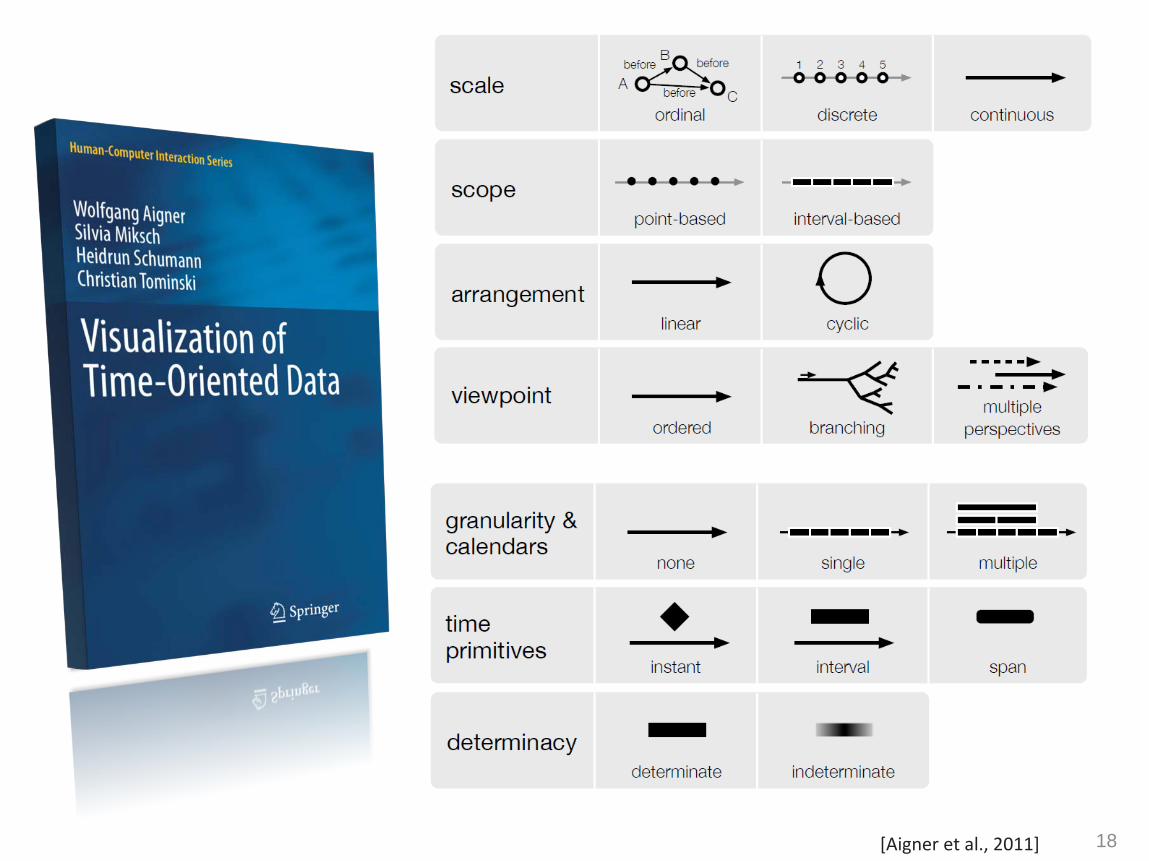
Characteristics of
[Aigner et al., 2011] 18
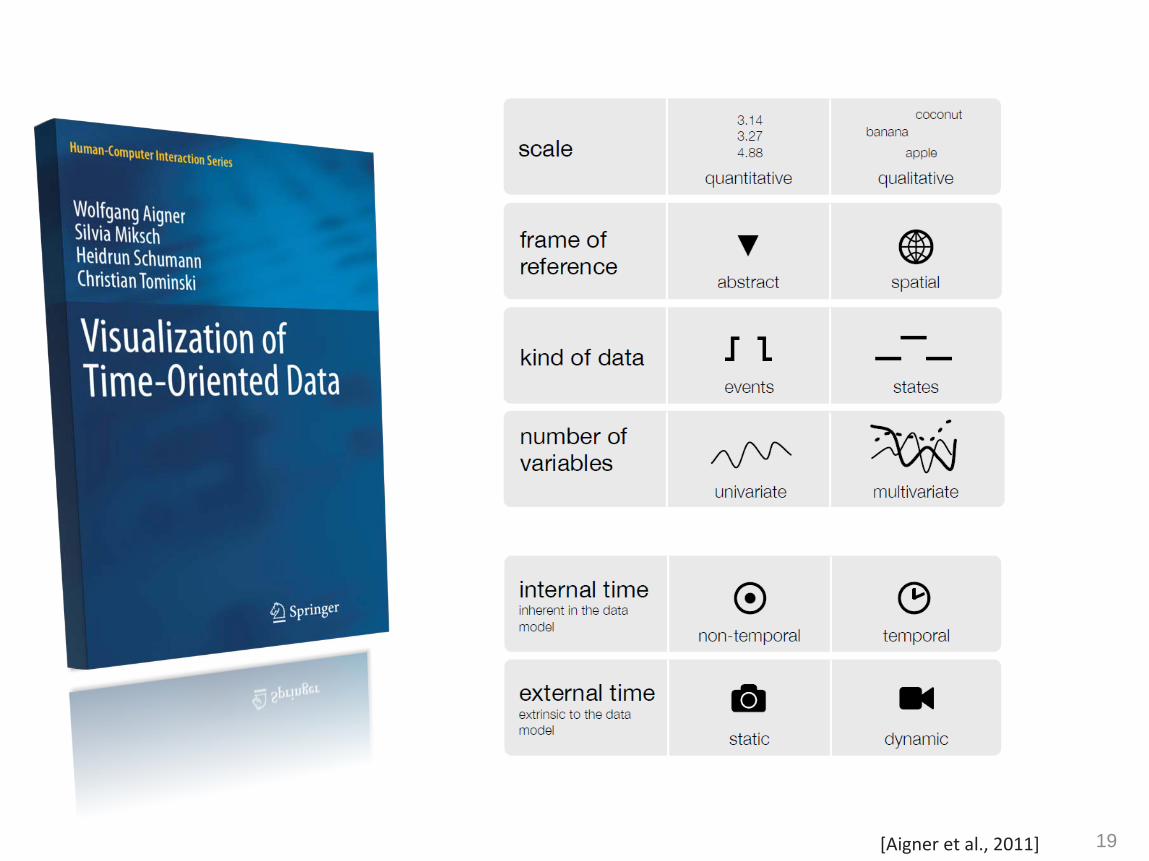
Characteristics of
[Aigner et al., 2011] 19

Challenging Aspect: Multiple Granularities & Cycles
20

Challenging Aspect: Multiple Granularities & Cycles
granularities … map time and integer numbers
[Bettini et al., 2000]21

Calendar Operations for Granularities
granularities … map time and integer numbers
granule … subset of time for a granularity and an identifier
[Bettini et al., 2000] 22

Calendar Operations based on Granularitiesanchor data on any granularity
convert granules to another granularity
roll-up / drill down
group granules by identifier
(e.g., every Wednesday in March)
shifting granules by a given number
check qualitative temporal relations23

Challenging Aspect:Different Time Primitives
1 time point
period between 2 time points
duration of a period (not anchored in time)
[Aigner et al., 2011] 24

Challenging Aspect: Temporal Indeterminacy
[Aigner et al., 2005] 25

multiple granularities & cycles different time primitives temporal indeterminacy
Rind, Lammarsch, Aigner, Alsallakh, Miksch: TimeBench: A Data Model and Software Library for Visual Analytics of Time-Oriented Data – VAST/TVCG, 2013
26

Challenging Aspect: Viewpoints
[Aigner et al., 2011] 27

VisualizingTime-Oriented Data
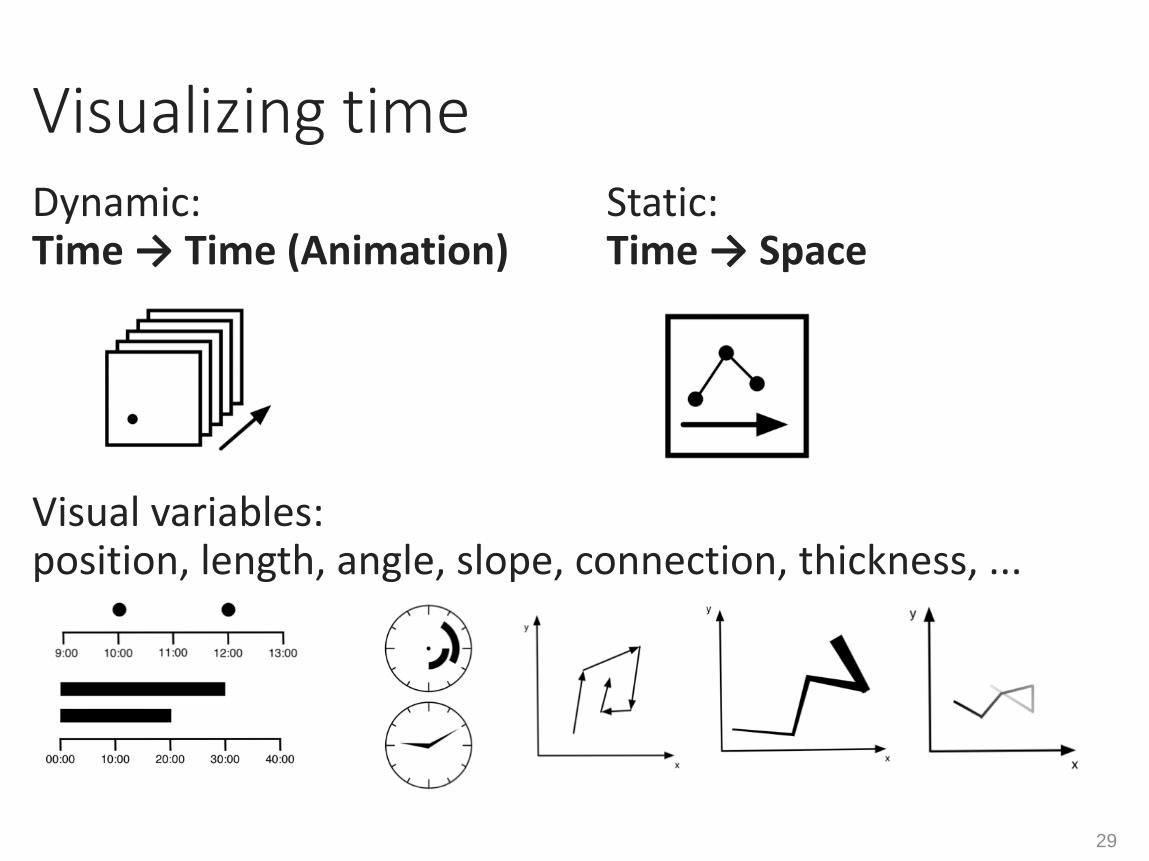
Visualizing timeDynamic: Static: Time → Time (Animation) Time → Space
Visual variables: position, length, angle, slope, connection, thickness, ...
29

TimeRider
Rind, Aigner, Miksch, Wiltner, Pohl, Drexler, Neubauer, Suchy: Visually Exploring Multivariate Trends in Patient Cohorts Using Animated Scatter Plots – HCII, 2011
30

VisuExplore
Rind, Aigner, Miksch, Wiltner, Pohl, Turic, Drexler: Visual Exploration of Time-oriented Patient Data for Chronic Diseases: Design Study and Evaluation– USAB, 2011 31
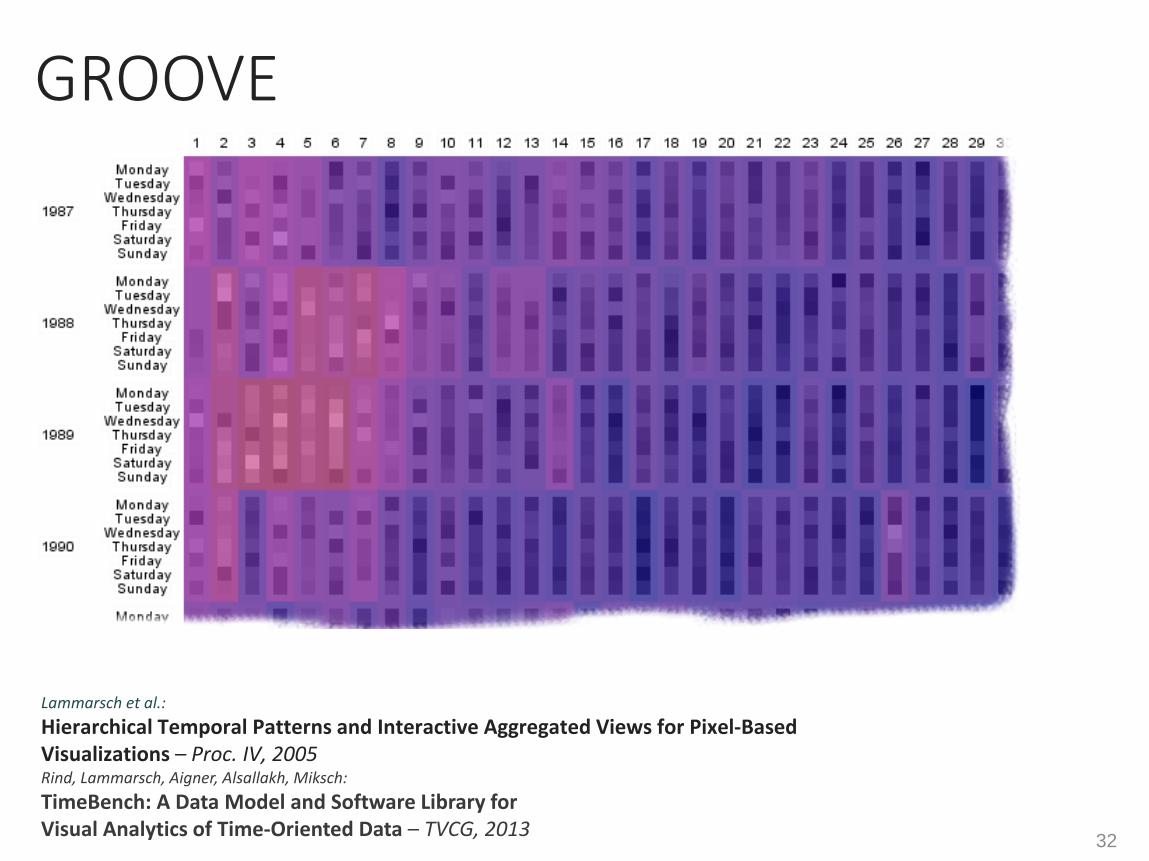
GROOVE
Lammarsch et al.:Hierarchical Temporal Patterns and Interactive Aggregated Views for Pixel-Based Visualizations – Proc. IV, 2005Rind, Lammarsch, Aigner, Alsallakh, Miksch: TimeBench: A Data Model and Software Library for Visual Analytics of Time-Oriented Data – TVCG, 2013 32

33
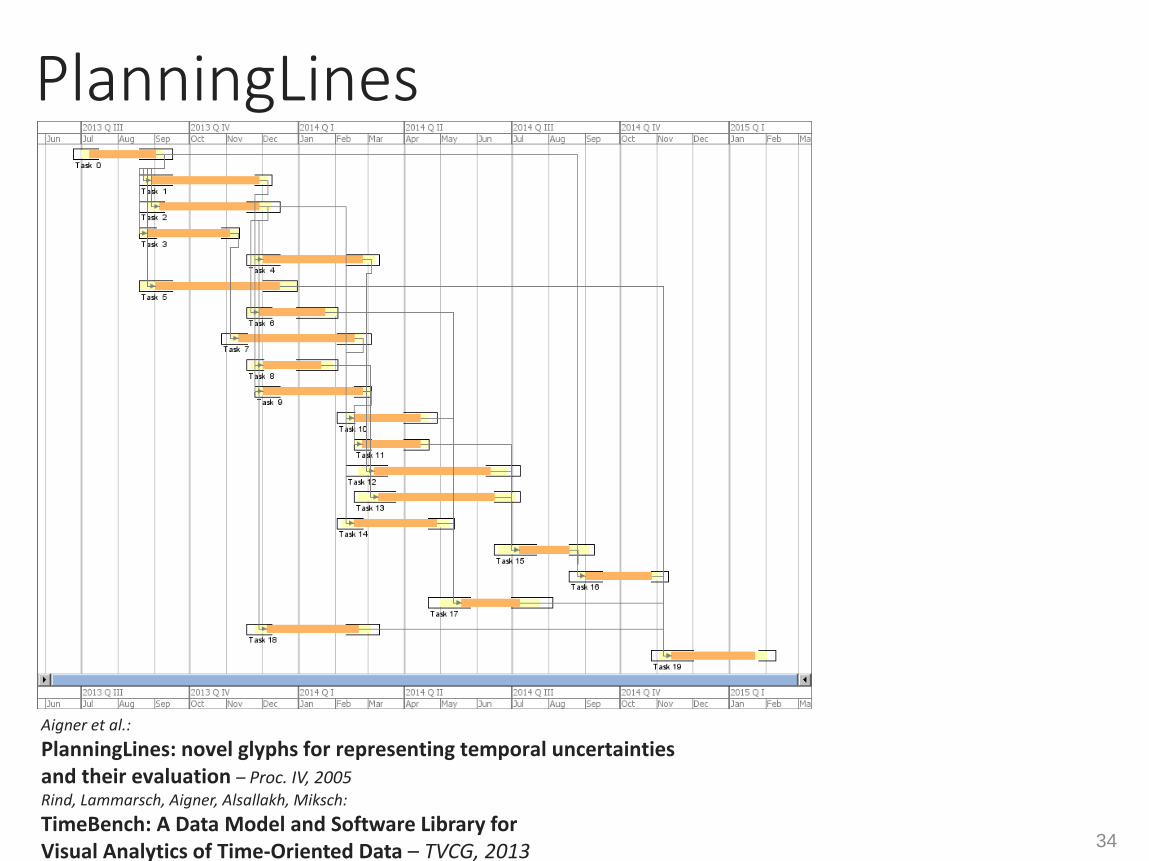
PlanningLines
Aigner et al.:PlanningLines: novel glyphs for representing temporal uncertainties and their evaluation – Proc. IV, 2005Rind, Lammarsch, Aigner, Alsallakh, Miksch: TimeBench: A Data Model and Software Library for Visual Analytics of Time-Oriented Data – TVCG, 2013 34

Interacting withTime-Oriented Data

Example: Historical Timelines
based on Deacon (1890) 36

Example: Historical Timelines
by Barbeu-Dubourg (1753) 37

Example: Historical Timelines
[measure tool]
Rind, Aigner, Miksch, Wiltner, Pohl, Turic, Drexler: Visual Exploration of Time-oriented Patient Data for Chronic Diseases: Design Study and Evaluation– USAB, 2011 38
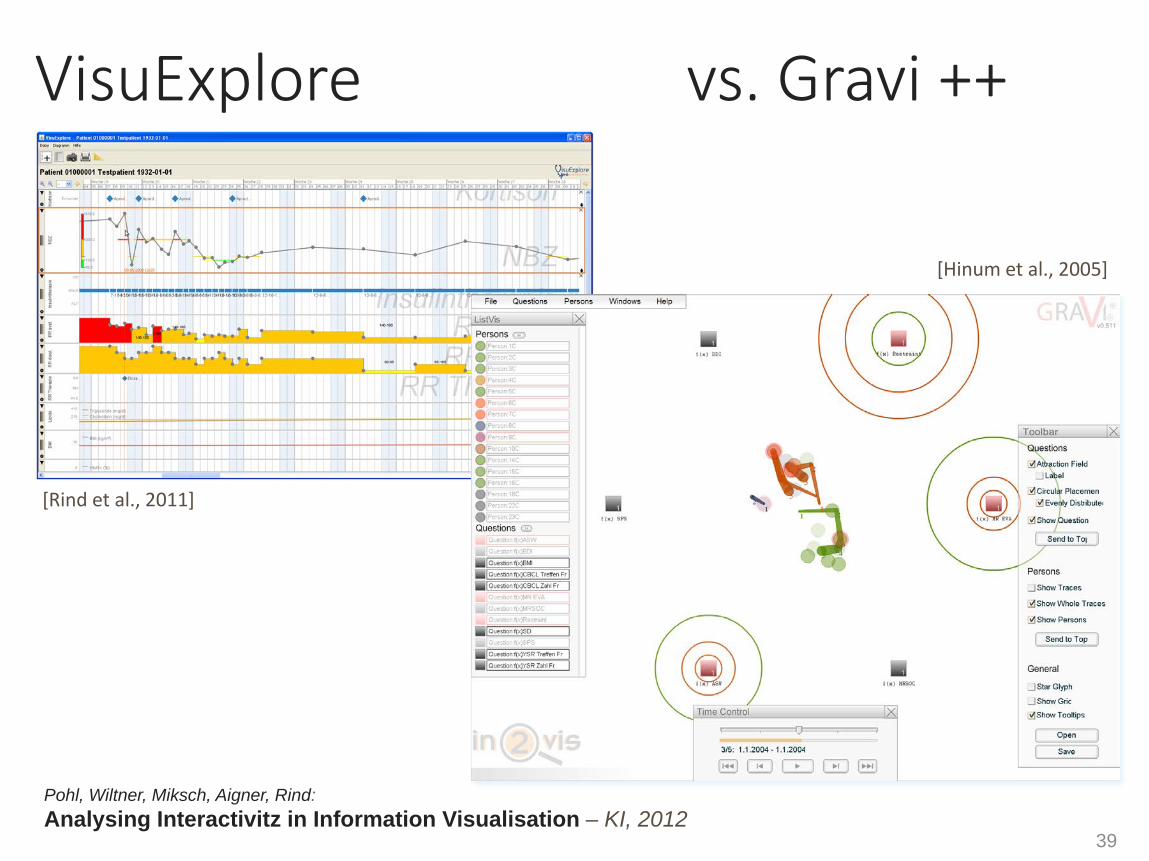
VisuExplore
[measure tool]
Pohl, Wiltner, Miksch, Aigner, Rind: Analysing Interactivitz in Information Visualisation – KI, 2012
vs. Gravi ++
[Hinum et al., 2005]
[Rind et al., 2011]
39

Reduces implementation effort for evaluation featuresConsistent and reproducible execution of study protocolsIntegrates well with existing visualization prototypesFree and open source software (@GitHub)
supports: controlled experiments • interaction logging • laboratory questionnaires • heuristicevaluations • insight diaries
Aigner, Hoffmann, Rind: EvalBench: Design and Implementation of a Software Library for Evaluation in Visualization - CGF, 2013
40

Automated Analysis of Time-Oriented Data
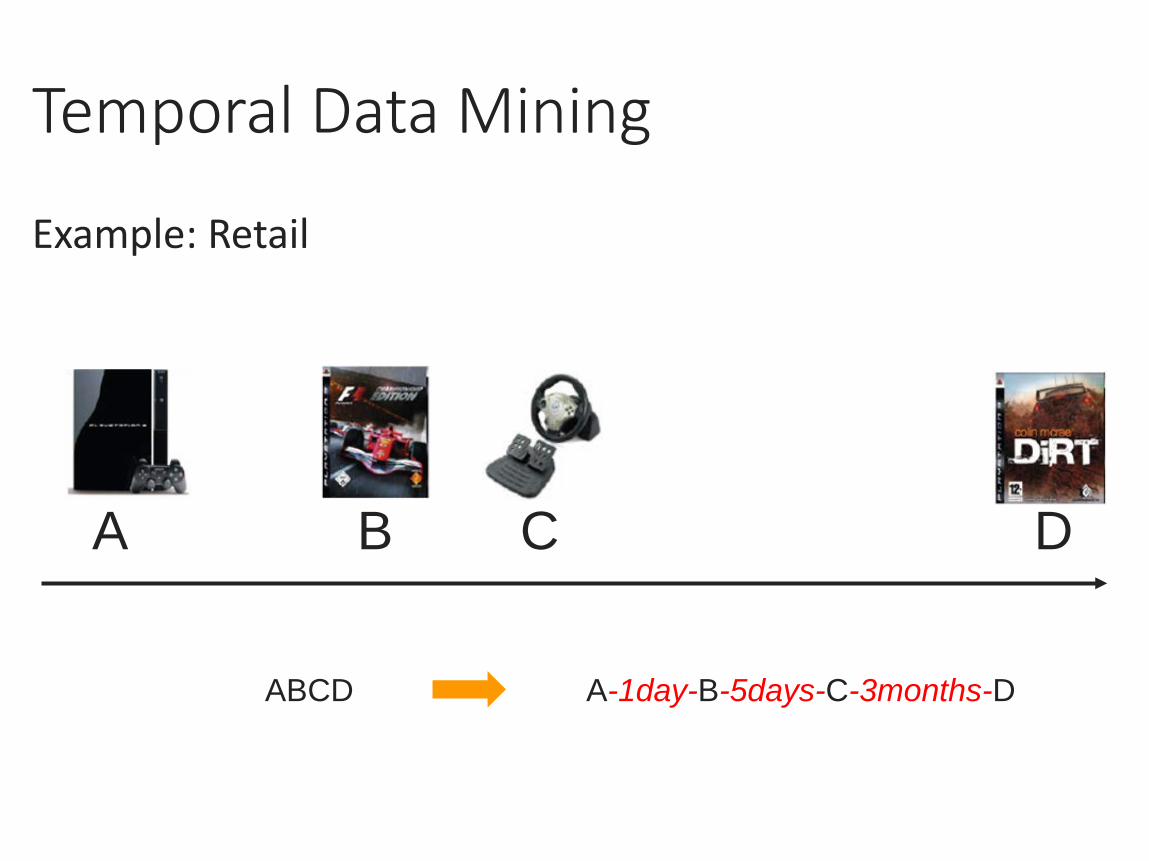
Temporal Data Mining
Example: Retail
A B C D
ABCD A-1day-B-5days-C-3months-D

MuTIny & MEMuRY
Lammarsch, Aigner, Bertone, Miksch, Rind: Mind the Time: Unleashing Temporal Aspects in Pattern Discovery – Computers & Graphics, 2014
Bertone, Lammarsch, Turic, Aigner, Miksch, Gärtner: MuTIny: A Multi-Time Interval Pattern Discovery Approach to Preserve the Temporal Information in Between - ECDM, 2010
Bertone, Lammarsch, Turic, Aigner, Miksch: Does Jason Bourne need Visual Analytics to catch the Jackal? - EuroVAST, 2010

Modeling
Visualizing
Interacting
Analyzing
45

Future ChallengesScience of interaction
What is the role and value of interactivity for sensemaking with visualizations?
Knowledge-Assisted Visual AnalyticsHow can the Visual Analytics process benefit from externalized and shared knowledge of analysts?
Event Sequences in SoftwareHow can we effectively analyze software behavior patterns, especially malicious behaviors?
Time in HumanitiesHow can we model time characteristics in narratives, plays, etc. such as multiple perspectives for visual analytics in humanities?
www.infovis-wiki.net www.evalbench.org www.timebench.org
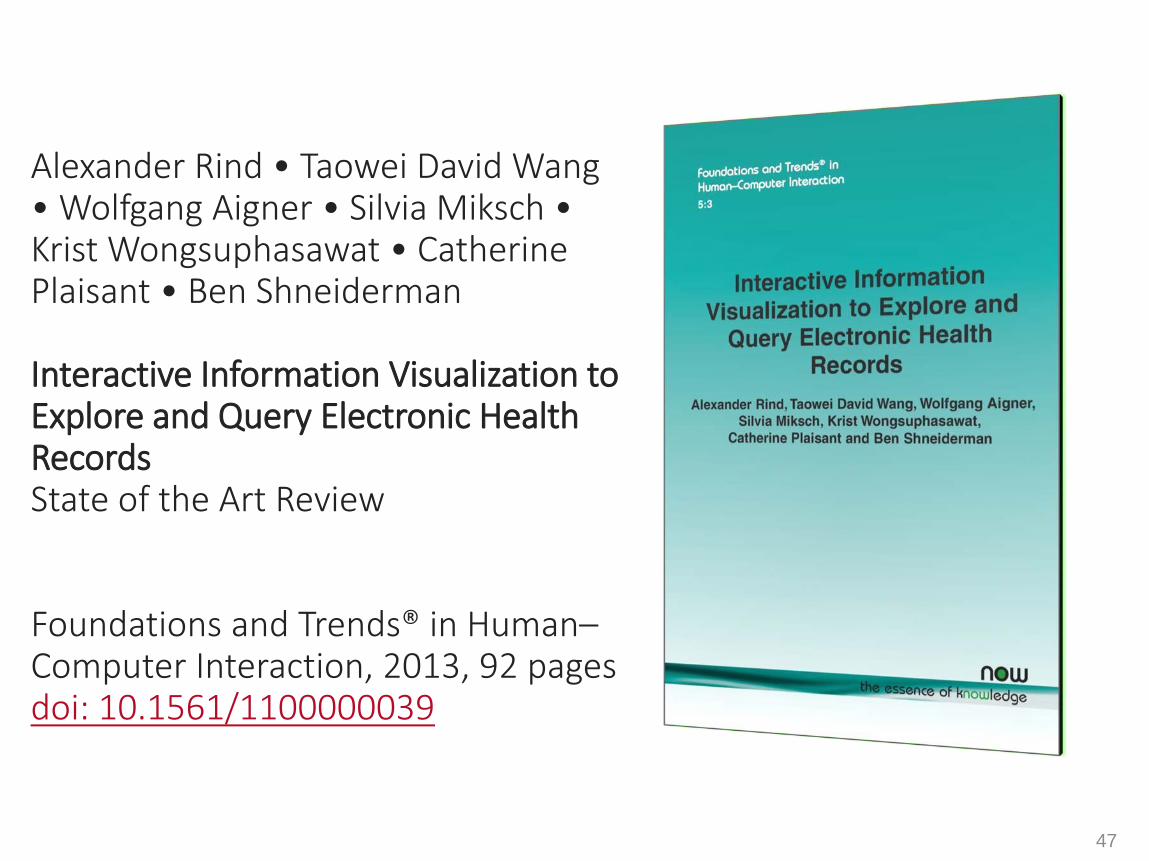
Alexander Rind • Taowei David Wang • Wolfgang Aigner • Silvia Miksch • Krist Wongsuphasawat • Catherine Plaisant • Ben Shneiderman
Interactive Information Visualization to Explore and Query Electronic Health RecordsState of the Art Review
Foundations and Trends® in Human–Computer Interaction, 2013, 92 pagesdoi: 10.1561/1100000039
47

www.timeviz.net
Wolfgang Aigner • Silvia Miksch • Heidrun Schumann • Christian TominskiVisualization of Time-Oriented Datawith a foreword by Ben Shneiderman
Springer1st Edition., 2011, XVIII, 286 p. 221 illus., 198 in color.Hardcover, ISBN 978-0-85729-078-6.
Table of ContentsIntroduction • Historical Background • Time & Time-Oriented Data • Visualization Aspects • Interaction Support • Analytical Support • Survey of Visualization Techniques • Conclusion
48

survey.timeviz.net
49

survey.timeviz.net
50

Acknowledgements
Supported by:
St. Pölten University of Applied SciencesInstitute of Creative\Media/Technologies, Media Computing Research Group
Vienna University of TechnologyLaura Bassi Centre of Exptertise for Visual Analytics Science and Technology
Danube University KremsDepartment of Information and Knowledge Engineering
Wolfgang Aigner, Bilal Alsallakh, Alessio Bertone, Markus Bögl, Felix Drexler, Paolo Federico, Peter Filzmoser, Johannes Gärtner, Eduard Gröller, Theresia Gschwandtner, Helwig Hauser, Klaus Hinum, Bernhard Hoisl, Stephan Hoffmann, Christian Kainz, Katharina Kaiser, Simone Kriglstein, Tim Lammarsch, Rui Ma, Eva Mayr, Luana Micallef, Silvia Miksch, Barbara Neubauer, Jürgen Pfeffer, Catherine Plaisant, Margit Pohl, Hanna Risku, Peter Rodgers, Thomas Schneider, Alexander Schratt, Heidrun Schumann, Andreas Seyfang, Ben Shneiderman, Michael Smuc, Nikolaus Suchy, Christian Tominski, Martin Tomitsch, Thomas Turic, TaoweiDavid Wang, Markus Wagner, Simone Wiltner, Florian Windhager, Eva Wohlfart, Krist Wongsuphasawat, Lukas Zenk
ReferencesAigner, W., Hoffmann, S., & Rind, A. (2013). EvalBench: A Software Library for Visualization Evaluation. Computer Graphics Forum, 32(3), 41–50.
doi:10.1111/cgf.12091Aigner, W., Miksch, S., Schumann, H., & Tominski, C. (2011). Visualization of Time-Oriented Data. Berlin: Springer.Aigner, W., Miksch, S., Thurnher, B., & Biffl, S. (2005). PlanningLines: novel glyphs for representing temporal uncertainties and their evaluation.
In Proc. 9th Int. Conf. Information Visualisation (pp. 457–463). IEEE. doi:10.1109/IV.2005.97Bertone, A., Lammarsch, T., Turic, T., Aigner, W., & Miksch, S. (2010). Does Jason Bourne need Visual Analytics to catch the Jackal? In J.
Kohlhammer & D. Keim (Eds.), Proc. 1st Int. Symp. Visual Analytics Science and Technology Held in Europe (EuroVAST 2010) (pp. 61–67). doi:10.2312/PE/EuroVAST/EuroVAST10/061-067
Bertone, A., Lammarsch, T., Turic, T., Aigner, W., Miksch, S., & Gaertner, J. (2010). MuTIny: A Multi-Time Interval Pattern Discovery Approach To Preserve The Temporal Information In Between. In Proc. IADIS European Conf. on Data Mining, ECDM (pp. 101–106). Freiburg, Germany.
Lammarsch, T., Aigner, W., Bertone, A., Gärtner, J., Mayr, E., Miksch, S., & Smuc, M. (2009). Hierarchical Temporal Patterns and Interactive Aggregated Views for Pixel-Based Visualizations. In Proc. 13th Int. Conf. Information Visualisation, 2009 (pp. 44–50). doi:10.1109/IV.2009.52
Lammarsch, T., Aigner, W., Bertone, A., Miksch, S., & Rind, A. (2014). Mind the time: Unleashing temporal aspects in pattern discovery. Computers & Graphics, 38, 38–50. doi:10.1016/j.cag.2013.10.007
Pohl, M., Wiltner, S., Miksch, S., Aigner, W., & Rind, A. (2012). Analysing Interactivity in Information Visualisation. KI - Künstliche Intelligenz, 26(2), 151–159. doi:10.1007/s13218-012-0167-6
Rind, A., Aigner, W., Miksch, S., Wiltner, S., Pohl, M., Drexler, F., … Suchy, N. (2011). Visually Exploring Multivariate Trends in Patient Cohorts Using Animated Scatter Plots. In M. M. Robertson (Ed.), Ergonomics and Health Aspects of Work with Computers (LNCS 6779, pp. 139–148). Heidelberg: Springer. doi:10.1007/978-3-642-21716-6_15
Rind, A., Aigner, W., Miksch, S., Wiltner, S., Pohl, M., Turic, T., & Drexler, F. (2011). Visual Exploration of Time-Oriented Patient Data for Chronic Diseases: Design Study and Evaluation. In A. Holzinger & K.-M. Simonic (Eds.), Information Quality in e-Health, Proc. USAB 2011 (LNCS7058, pp. 301–320). Heidelberg: Springer. doi:10.1007/978-3-642-25364-5_22
Rind, A., Lammarsch, T., Aigner, W., Alsallakh, B., & Miksch, S. (2013). TimeBench: A Data Model and Software Library for Visual Analytics of Time-Oriented Data. IEEE Transactions on Visualization and Computer Graphics, 19(12), 2247–2256. doi:10.1109/TVCG.2013.206
Rind, A., Wang, T. D., Aigner, W., Miksch, S., Wongsuphasawat, K., Plaisant, C., & Shneiderman, B. (2013). Interactive Information Visualization to Explore and Query Electronic Health Records. Foundations and Trends in Human–Computer Interaction, 5(3), 207–298. doi:10.1561/1100000039
Seidl, M., E. Wieser, M. Zeppelzauer, A. Pinz, & C. Breiteneder (2014). Graph-based Similarity of Petroglyphs. To appear in Workshop Proc. of "Where Computer Vision meets Art" ECCV - European Conf. on Computer Vision - 2014 Workshops, Zürich, CH, Springer.
Thomas, J. J., & Cook, K. A. (Eds.). (2005). Illuminating the Path: The Research and Development Agenda for Visual Analytics. IEEE. Zaharieva, M., Schopfhauser, D., Del Fabro, M., & Zeppelzauer, M. (2014). Clustering and Retrieval of Social Events in Flickr. In CEUR Workshop
Proc. (Vol. 1043, p. 2). Barcelona, Catalunya, Spain, October 16-17, 2014.52