Embed Size (px)
Citation preview
Visual Display of Quantitative Information 1
Visual Display of Quantitative Information
Neville Churcher(Thanks to Andy Cockburn)
Department of Computer Science & Software EngineeringUniversity of Canterbury
2014
Visual Display of Quantitative Information 2
Why?
P Explore dataP Reveal information in data (distribution, relationships, . . .P Make a pointP Illustrate an ideaP Give an exampleP Condense informationP Provide interestP . . .4 > 1 of the above

Visual Display of Quantitative Information 3
Metadata & Meta-considerations
P SourcesP Highlight original contributions, cite sourcesP Integration with textP Experimental conditions (equipment, subjects, settings,
parameters, . . . )P Spell checkP . . .

Visual Display of Quantitative Information 4
Considerations
P Big picture (focus + context)P SizeP LocationP Title, captionP UncertaintiesP OriginP ScaleP OutliersP LabelsP Significant figuresP Artifacts (avoid bitmaps, . . . )P Avoid misleading
Visual Display of Quantitative Information 5
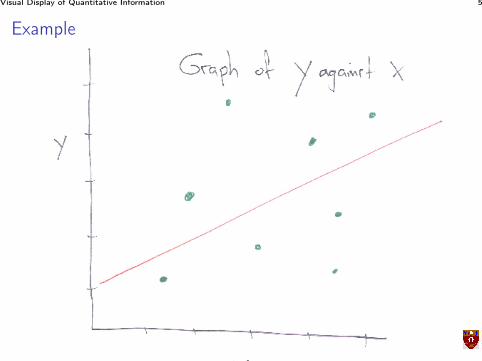
Example

Visual Display of Quantitative Information 6
Example

Visual Display of Quantitative Information 7
Example

Visual Display of Quantitative Information 8
Example

Visual Display of Quantitative Information 9
Example
Foo256324
Visual Display of Quantitative Information 10
Tables
P Good for showing exact (numeric) valuesP Multiple local comparisons practicableP Supplement text explanationP Not so good for trendsP Left-justify textP Right-justify numbers (align decimal points)P Significant figures
P Avoid data prisons (too many grid bars)P Unnecessary for few data values—minimum viable size?
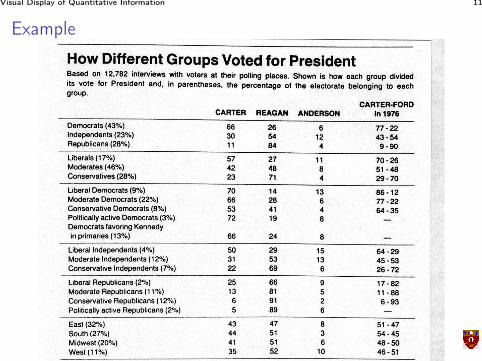
Visual Display of Quantitative Information 11
Example
Visual Display of Quantitative Information 12
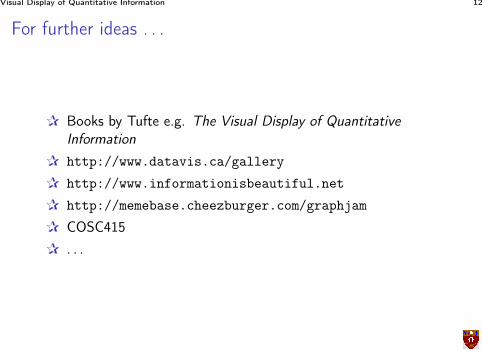
For further ideas . . .
P Books by Tufte e.g. The Visual Display of QuantitativeInformation
P http://www.datavis.ca/gallery
P http://www.informationisbeautiful.net
P http://memebase.cheezburger.com/graphjam
P COSC415P . . .

Visual Display of Quantitative Information 13
Summary


![The Visual Display of Quantitative Information...Visual Display of Quantitative Information" by Edward R. Tufte [1]. Chapter 1 Graphical Integrity When looking up graphical integrity](https://img.pdfslide.net/doc/110x75/5f02fef07e708231d407062b/the-visual-display-of-quantitative-information-visual-display-of-quantitative.jpg)


![[eBook] Edward Rolf Tufte - The Visual Display of Quantitative Information (1983)](https://img.pdfslide.net/doc/110x75/55cf9db1550346d033aec1c1/ebook-edward-rolf-tufte-the-visual-display-of-quantitative-information.jpg)