Embed Size (px)
Citation preview
Neuron, Vol. 31, 523–535, August 30, 2001, Copyright 2001 by Cell Press
Visual Search and Attention: ReviewA Signal Detection Theory Approach
The attentive, serial second stage has been invokedespecially to explain conjunction search. In conjunctionsearch, the target differs from the distractors by a unique
Preeti Verghese1
Smith Kettlewell Eye Research Institute2318 Fillmore StreetSan Francisco, California 94115 combination of features; the target cannot be character-
ized by a single unique attribute. An example of a con-junction search task is a target that is a bright verticalBackground
Visual search is an everyday task. One might search for line among distractors that are dark vertical lines andbright tilted lines. Neither brightness nor orientationa familiar face in a crowd, or a memo on a cluttered
desktop. The ease of search depends chiefly on how alone defines the target uniquely. Treisman and Gelade(1980) suggest that the second limited-capacity stage,distinguishable the target of search is from the back-
ground. For instance, it is hard to find a memo on a which depends on attention, integrates the features thatdefine the target. Attention is therefore thought to bedesktop cluttered with paper. The task becomes much
easier if the memo is a different color than all the other indispensable for successful conjunction search perfor-mance.pieces of paper on the desktop. Attention can also
improve visual search. Even if the memo is not dis- I will present a different approach to understandingvisual search and attention. This approach shows thattinguishable by color, it is easier to find if attention is
drawn to its location. For instance, the telephone might a large body of the psychophysical and physiologicalvisual search results can be explained without invokingring and as I turn to answer it, I might discover the memo
sitting next to the phone. In the course of this review, I a second limited-capacity attentive stage. In the scopeof this review, visual attention plays a role when observ-will consider visual search and attention, in turn, and will
present converging psychophysical and physiological ers are explicitly asked to attend to a location or feature,or when they are implicitly cued to a location or feature.evidence on the mechanisms that underlie these two
phenomena. There is a growing body of literature that suggests thatvisual attention selects objects rather than locations,The task of finding a target among distractors is in
general referred to as visual search. Typically there is a although the independence of attention to objects andto locations is still being debated (see Scholl, 2001 forsingle target that differs from the distractors along one
or more dimensions. Let us start with the simple case a review). In some cases, attention has been shownto select objects as complex as faces and surfacesin which the target differs from homogenous distractors
along a single dimension. Earlier search literature has (O’Craven et al., 1999; He and Nakayama, 1995). Theserepresentations are more complex than a simple con-typically measured search performance as the response
time required to find the target. Search is called serial junction of features and involve knowledge, classifica-tion, and recognition of stimulus categories. It is un-when search times increase with the number of elements
in the display, or parallel when search times are indepen- known whether these higher order processes can beincluded in the signal detection framework outlined be-dent of the number of items in the display. Consider
the case of searching for a tilted target among vertical low, but certainly this complex topic is outside the scopeof this review. Nevertheless, the signal detection theorydistractors. Search times are roughly independent of
the number of elements in the display when the tilt is approach is a general framework that applies to a broadrange of results involving visual search and attentionas large as 45�, but increase with the number of elements
when the target tilt is small (say 5�). According to the that generates quantitative predictions consistent withexperimental data.now classic feature integration theory (Treisman and
Gelade, 1980), search performance results from a two-stage visual process. The first stage of processing is Visual Search and Signal Detection Theorythought to occur before the influence of attention and More recently, a few researchers have proposed thatis called preattentive. It is made up of maps specialized signal detection theory (SDT), the standard model usedfor various “features”—dimensions such as color, orien- to predict human psychophysical thresholds, can be ap-tation, motion, and spatial frequency. These feature plied to visual search. SDT has successfully predictedmaps are thought to correlate to neurons selective for detection and discrimination in a search paradigm, withouta restricted range of values across each of these dimen- additional assumptions about limited-capacity. Instead ofsions. Elements in this first stage operate in parallel a two-stage process with a parallel, unlimited-capacityand allow simultaneous processing across the display, front end, followed by a limited-capacity attention stage,resulting in search times that are independent of the they have proposed a parallel stage followed by a simplenumber of items in the display. If the first stage does decision rule. SDT describes search accuracy with manynot isolate the target, then a second limited-capacity fewer assumptions than are required to predict re-serial stage is required, which focuses attention on sin- sponse time to find the target. So in the interests of agle items or groups of items in turn. This serial stage is simpler exposition, I will first present SDT as it appliesthought to account for search times that increase with to search accuracy, and then present SDT in the contextthe number of elements in the display. of response time. According to SDT, the elements in
a visual search display are internally represented asindependent, noisy random variables. Consider for in-1Correspondence: [email protected]
Neuron524
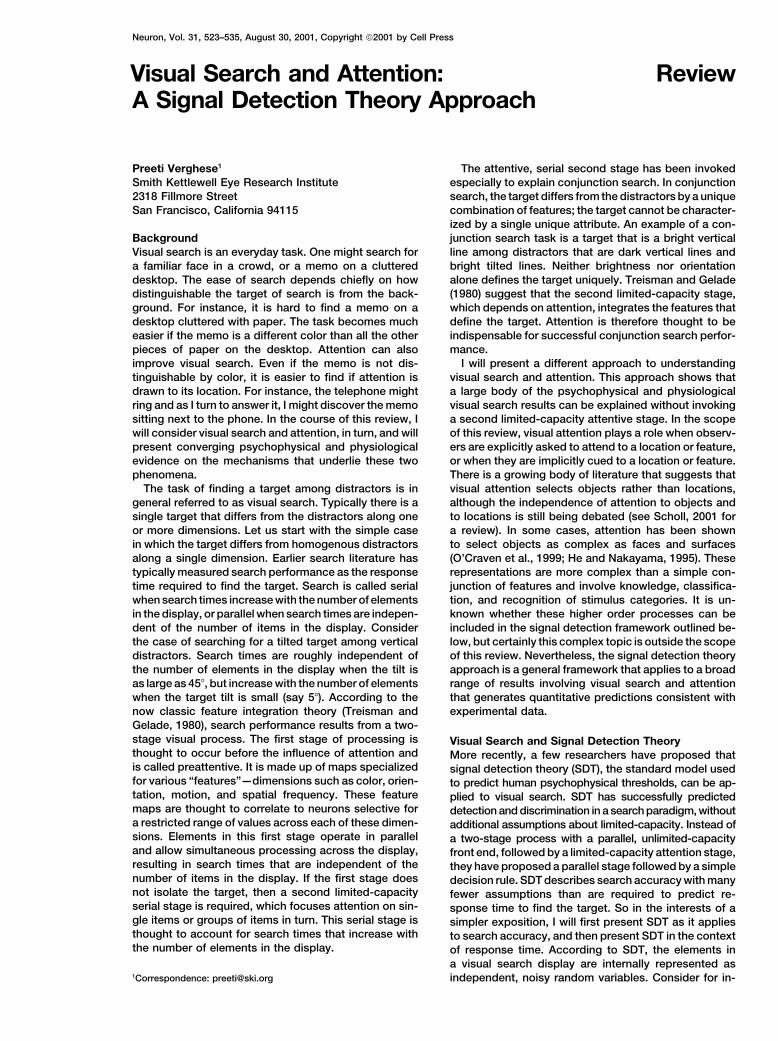
Figure 1. Examples of Easy and Difficult Search and a Graphical Representation of the Maximum Rule
(A) A search task with a single 45� target among vertical distractors. The orientation difference between target and distractors is large. (B)The response of a detector tuned to the target orientation (red curve) is a noisy distribution centered about a mean value. The response ofthe same detector to the distractor is a similar noisy distribution shifted to a lower mean value. For a 45� target and vertical distractors, thesedistributions barely overlap. (C) A graphical illustration of the distribution of the maximum value of eight samples from the distractor distribution(blue curve) as opposed to seven samples from the distractor distribution and one sample from the target distribution (red curve). Thedistribution of eight distractors is shifted slightly rightward, whereas the corresponding distribution for seven distractors and one target islargely unchanged. (D) The maximum rule for 32 distractors and for 31 distractors and 1 target. The distractors-only curve shifts furtherrightwards. (E) A search task with the same 45� target, but with distractors very slightly tilted counterclockwise from 45�. (F) The target distribution(red curve) is identical to (B), but the distractor distribution (blue curve) is shifted rightward, so that the two distributions corresponding tothe target and distractor overlap. (G) The distribution of the maximum of eight distractors overlaps significantly with the distribution for sevendistractors and one target. (H) This degree of overlap increases further as the number of elements in the display increases to 32. Proportioncorrect for each of these distributions is plotted on the top right of each graph.
stance an easy search task such as searching for a line the properties of the signal to be detected or discrimi-nated. In the case of the 45� target, the matched filtertilted 45� clockwise among vertical lines as shown in
Figure 1A. SDT assumes that the observer is monitoring is a detector at the location of the target with a preferredorientation of 45�, and a receptive field size that matchesthe output of a matched filter—a detector matched to
Review525
the target size; repeated presentations of the same stim- for the 45� target. Now a sample from the distractordistribution may be larger than a sample from the targetulus generate responses that vary about a mean value.
The probability of a given response strength is idealized distribution, leading to an incorrect response. Similarly,in the physiology domain, the distractor could evoke aas a bell-shaped Gaussian distribution that is centered
on this mean response value. The variability about the greater spike count than the target. The probability oferrors is thus inversely related to the orientation differ-mean is due to noise within the visual system, at the level
of the detector. A similar response profile is generated ence between the target and distractor lines. In this caseof the 45� target and the tilted distractors, the probabilityphysiologically when a neuron is presented with multiple
trials of the same stimulus (Bradley et al., 1987; New- of correctly identifying the target interval is 0.923. Theease of the discrimination task depends on the separa-some et al., 1989). The physiological equivalent of the
SDT framework is a neuron that is well suited to de- tion between the means of these distributions, which isdirectly related to the orientation difference betweentecting the target, i.e., one that has a receptive field that
includes the target location and a preferred orientation target and distractor.Discrimination also depends on the variability of thesethat matches the target tilt of 45�. The neural response
to multiple trials is a distribution of spike counts with a distributions. In this example, the variability of the distri-bution representing the vertical and tilted lines is as-mean spike rate and some variability about the mean.
Thus, the red distribution in Figure 1B represents both sumed to be the same. In the SDT framework, equalvariance implies that the internal representations arethe abstract SDT concept of a noisy internal representa-
tion generated by the tilted target, as well as the proba- equally noisy, while in the physiological framework itimplies that the variability of the response of the neuronbility of different spike counts in response to the tilted
target. SDT assumes that the vertical distractors gener- responding to the vertical and tilted lines is the same.(This is a simplifying assumption; experiments show thatate a smaller response from the filters selective to the
tilted target. Thus, the mean response level to a dis- the variability of spike rates is typically proportional tothe mean firing rate.) Both the mean separation betweentractor is smaller than the mean response to the target
(blue versus red distribution in Figure 1B). In the physio- target and distractors and the intrinsic variability ofthese representations determine how discriminable thelogical domain, neurons tuned to the tilted target will
have a smaller response to the vertical distractors, which target is from the distractor. The discriminability of thetarget from the background is defined as (�t��d)/�,also can be reasonably represented by the blue distribu-
tion in Figure 1B. For simplicity, I assume that the vari- where �t and �d refer to the means of the target anddistractor distributions, respectively, and � is the com-ances of the two distributions (red and blue) are the
same. mon standard deviation of these distributions. The distri-butions can be of any form, although a Gaussian distri-Discriminating Target from Distractor
Before I discuss how these distributions explain search bution has been historically assumed. Thus for a givenorientation difference between target and distractor,performance, let us consider the simple task of discrimi-
nating which one of two sequentially presented stimuli distributions with larger variance (noisier representa-tions/larger bandwidth) are less discriminable than dis-is more tilted. The responses to the target and distractor
are represented by the red and blue distributions, re- tributions with smaller variances. As the overlap be-tween the distributions increases, the probability that aspectively, of Figure 1B. In the SDT framework, the deci-
sion about whether a stimulus is a target or distractor sample (response) from the distractor distribution willbe more tilted than a sample (response) from the targetis reasonably based on which one produces a greater
response in a filter selective for the tilted target. Equiva- distribution also increases, leading to a higher probabil-ity of errors. Thus, signal detection theory makeslently, a physiological decision might be based on which
stimulus evokes a greater response in a neuron selective straightforward predictions about accuracy as a func-tion of discriminability.for the tilted target orientation. When the target and
distractor are widely separated in orientation as in this The abstract SDT distributions that I have introducedare similar to those that have been measured from corti-case, the target will almost always generate a larger
response. In this example, it is easy to discriminate the cal neurons. Bradley, Skottun, Ozhawa, Sclar, and Free-man (1987) used the signal detection theory frameworktarget from the distractor. The probability of correctly
identifying the 45� target is 0.999, and is shown in the to measure the ability of single striate cortical neu-rons to discriminate two orientations. They measuredtop right corner of the graph.
Consider a harder search task in which there is a much the number of trials that produced firing of differentstrengths. This histogram of spike counts was measuredsmaller difference in orientation between target and dis-
tractor. In Figure 1F, the target has the same orientation separately for the two orientations that were to be dis-criminated. Orientations close to the preferred orienta-as before, but the distractors are now tilted clockwise.
If a decision is based on the outputs of filters or neurons tion of the cell had higher mean spike rates, while orien-tations far from the preferred orientation had much lowerselective for the 45� target orientation, then the distribu-
tions corresponding to the distractor and target will mean spike rates. The separation between the histo-grams corresponding to two different orientations (onoverlap considerably. Note that the response to the 45�
target (red distribution) is in the same location as in the same side of the preferred orientation) increased asa function of orientation difference. The variance of theFigure 1B, but the response to the tilted distractors (blue
distribution) is shifted rightward, and is much closer to firing rate in response to a given orientation increasedwith the mean firing rate. Newsome, Britten, Movshon,the red distribution. This is because the tilted distractors
(as opposed to the vertical distractors) are more likely and Shadlen (1989) also used a similar technique tomeasure the ability of a single neuron in area MT toto evoke a response in the filters or neurons selective
Neuron526
signal motion direction. From the distribution of re- quickly with the number of distractors (Figures 1G and1H). When there are eight elements in the display, thesponses generated by each of the stimuli, Bradley et
al. (1987) and Newsome et al. (1989) determined the max distribution for the distractor-only case has thesame shape as the distribution described above (com-probability that a decision based on the neuronal re-
sponse would correctly detect the target of interest. pare blue curves in Figures 1G and 1C), but it now over-laps significantly with the max distribution of one targetSearching for a Target among Distractors
Now let us return to the problem of visual search. A and seven distractors (red curve in Figure 1G). The de-gree of overlap increases with the number of distractorssearch task is essentially a discrimination task with a
single target and multiple distractors. The effect of multi- so that the effective separation between the two maxdistributions decreases with set size (Figure 1H). Theple distractors on a search task is inherently related to
discriminability between target and distractor distribu- proportion correct for eight distractors has now fallento 0.778, and for 32 distractors is 0.680.tions. Let us assume that there are n elements in the
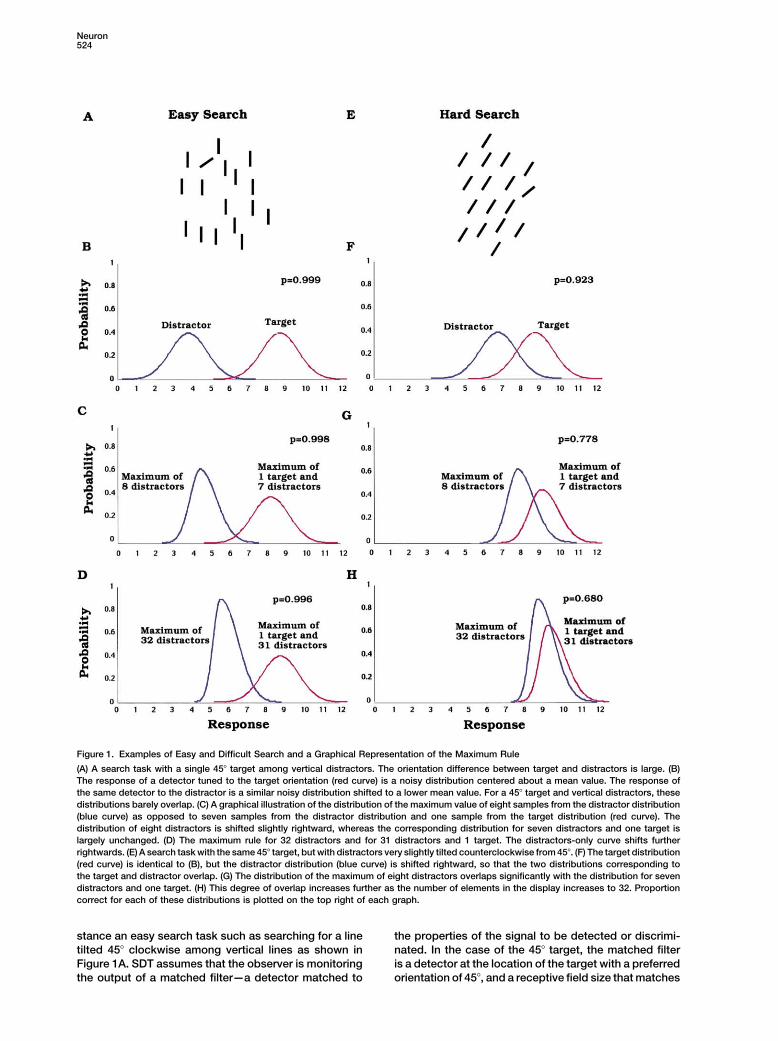
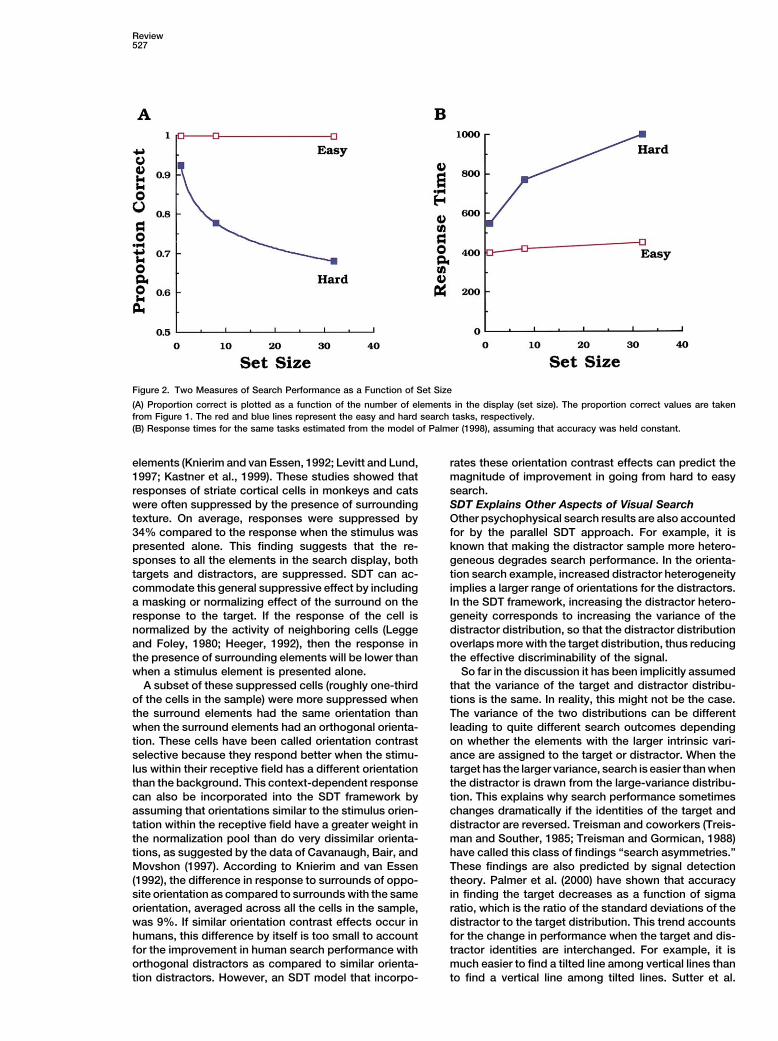
display, and that there is a detector (neuron) selective Figure 2A plots the probability of a correct responseas a function of set size, for both the easy and hardfor the target attribute at each of the element locations.
Based on the response of these units, the observer has search tasks. These values are taken from Figure 1.Performance is almost unchanged with increasing setto decide whether the display contained a target. It turns
out that for finding a single target, a decision based size in the easy search task, whereas performance fallsdramatically with set size for the hard search task. Figureon choosing the largest response across the units (the
maximum rule) is close to the best use of the available 2B plots performance at the same task when the morefamiliar response time measure is plotted versus setinformation, provided that the responses from each of
the units is independent (Nolte and Jaarsma, 1967). Un- size. The response time measures are approximatedfrom Palmer’s (1998) model, which predicts responseder these conditions, measuring the response of the
units to each of the distractors and the target is equiva- time as a function of set size, for a fixed accuracy level.I will defer a more detailed discussion of how SDT canlent to taking samples from the distractor and target
distributions, respectively. predict response time measures to a later section. Bothaccuracy and response time measures show that in-With the maximum rule, it is easy to illustrate the effect
of the number of elements in the display on search creasing set size has little effect on performance whensearch is easy and a significant effect when search isperformance. Consider an easy search task in which
the target and distractor distributions are far apart, a hard. Previously, the differences between these twokinds of search tasks were attributed to parallel andsituation sometimes referred to as “popout” (Figure 1A).
The distributions of the responses to a single distractor serial processing. Here I show that the strategy of basinga decision on the largest sample, along with the assump-and a single target overlap very little in this case (Figure
1B). The task is to decide which of two presentations tion of inherently noisy representations, accounts forthe effect of set size on visual search performance over(intervals) has the target. Both intervals have n elements:
one of the intervals has 1 target and n�1 distractors, the a large range of target-distractor difference. Large setsize effects are not necessarily due to an attentive bot-other has n distractors. Let us assume that the observer
looks for the largest value or maximum of the samples tleneck. In the SDT framework, set size effects dependon the discriminability of the target from the distractors;in each presentation and then chooses the presentation
interval that has the larger of the two maximum values; set size effects are small when discriminability is highand large when discriminability is low. This is not a serial-this decision rule is called the “Max Rule.” Consider the
case when there are only eight elements in the display. parallel dichotomy, but a whole continuum that dependson discriminability. Several psychophysical studies haveIn the distractor-only interval, the responses to the eight
distractors are represented by eight samples from the successfully used this framework to predict the effectof discriminability on search performance (Shaw, 1982,distractor distribution. The distribution of the maximum
of these eight samples is shifted toward the right tail of 1984; Graham et al., 1987; Pavel et al., 1992; Palmer etal., 1993; Verghese and Nakayama, 1994; Verghese andthe distribution for the single distractor (compare blue
curves in Figures 1B and 1C). When the display has one Stone, 1995; Eckstein et al., 2000). In these studies,calculations based on the largest response have donetarget and seven distractors, the responses are repre-
sented by seven samples from the distractor distribution a good job of predicting psychophysical search accu-racy as a function of the number of elements in theand one sample from the target distribution. The distri-
bution of the maximum of these samples (max distribu- display.Physiology of Search and Texture Discriminationtion) is virtually identical to the original target distribution
(compare red curves in Figures 1B and 1C). The observer The SDT approach has not been applied to physiologicalstudies of visual search so far. The neural responsesmakes a decision based on these two max distributions.
Note that even for larger values of n, say 32, the max to a target and to distractors can be approximated bysampling the distribution of responses of a prototypicaldistribution corresponding to distractors does not over-
lap significantly with the max distribution of the target cell selective for the target attribute to multiple presenta-tions of the target and distractor, respectively. This ap-plus distractors (Figure 1D). Therefore, there is hardly
any effect of the number of distractors on search perfor- proximation avoids the need to measure neural re-sponses to an array of target and distractors at differentmance, and finding the target is effortless. Proportion
correct with eight distractors and with 32 distractors is locations in the display simultaneously. Recent physio-logical evidence suggests that this simplifying assump-0.998 and 0.996, respectively.
When the target and distractor distributions are close tion may not be justified as it ignores the modulation ofa neuron’s response by the presence of surroundingtogether (Figure 1F), search performance degrades
Review527
Figure 2. Two Measures of Search Performance as a Function of Set Size
(A) Proportion correct is plotted as a function of the number of elements in the display (set size). The proportion correct values are takenfrom Figure 1. The red and blue lines represent the easy and hard search tasks, respectively.(B) Response times for the same tasks estimated from the model of Palmer (1998), assuming that accuracy was held constant.
elements (Knierim and van Essen, 1992; Levitt and Lund, rates these orientation contrast effects can predict themagnitude of improvement in going from hard to easy1997; Kastner et al., 1999). These studies showed that
responses of striate cortical cells in monkeys and cats search.SDT Explains Other Aspects of Visual Searchwere often suppressed by the presence of surrounding
texture. On average, responses were suppressed by Other psychophysical search results are also accountedfor by the parallel SDT approach. For example, it is34% compared to the response when the stimulus was
presented alone. This finding suggests that the re- known that making the distractor sample more hetero-geneous degrades search performance. In the orienta-sponses to all the elements in the search display, both
targets and distractors, are suppressed. SDT can ac- tion search example, increased distractor heterogeneityimplies a larger range of orientations for the distractors.commodate this general suppressive effect by including
a masking or normalizing effect of the surround on the In the SDT framework, increasing the distractor hetero-geneity corresponds to increasing the variance of theresponse to the target. If the response of the cell is
normalized by the activity of neighboring cells (Legge distractor distribution, so that the distractor distributionoverlaps more with the target distribution, thus reducingand Foley, 1980; Heeger, 1992), then the response in
the presence of surrounding elements will be lower than the effective discriminability of the signal.So far in the discussion it has been implicitly assumedwhen a stimulus element is presented alone.
A subset of these suppressed cells (roughly one-third that the variance of the target and distractor distribu-tions is the same. In reality, this might not be the case.of the cells in the sample) were more suppressed when
the surround elements had the same orientation than The variance of the two distributions can be differentleading to quite different search outcomes dependingwhen the surround elements had an orthogonal orienta-
tion. These cells have been called orientation contrast on whether the elements with the larger intrinsic vari-ance are assigned to the target or distractor. When theselective because they respond better when the stimu-
lus within their receptive field has a different orientation target has the larger variance, search is easier than whenthe distractor is drawn from the large-variance distribu-than the background. This context-dependent response
can also be incorporated into the SDT framework by tion. This explains why search performance sometimeschanges dramatically if the identities of the target andassuming that orientations similar to the stimulus orien-
tation within the receptive field have a greater weight in distractor are reversed. Treisman and coworkers (Treis-man and Souther, 1985; Treisman and Gormican, 1988)the normalization pool than do very dissimilar orienta-
tions, as suggested by the data of Cavanaugh, Bair, and have called this class of findings “search asymmetries.”These findings are also predicted by signal detectionMovshon (1997). According to Knierim and van Essen
(1992), the difference in response to surrounds of oppo- theory. Palmer et al. (2000) have shown that accuracyin finding the target decreases as a function of sigmasite orientation as compared to surrounds with the same
orientation, averaged across all the cells in the sample, ratio, which is the ratio of the standard deviations of thedistractor to the target distribution. This trend accountswas 9%. If similar orientation contrast effects occur in
humans, this difference by itself is too small to account for the change in performance when the target and dis-tractor identities are interchanged. For example, it isfor the improvement in human search performance with
orthogonal distractors as compared to similar orienta- much easier to find a tilted line among vertical lines thanto find a vertical line among tilted lines. Sutter et al.tion distractors. However, an SDT model that incorpo-
Neuron528
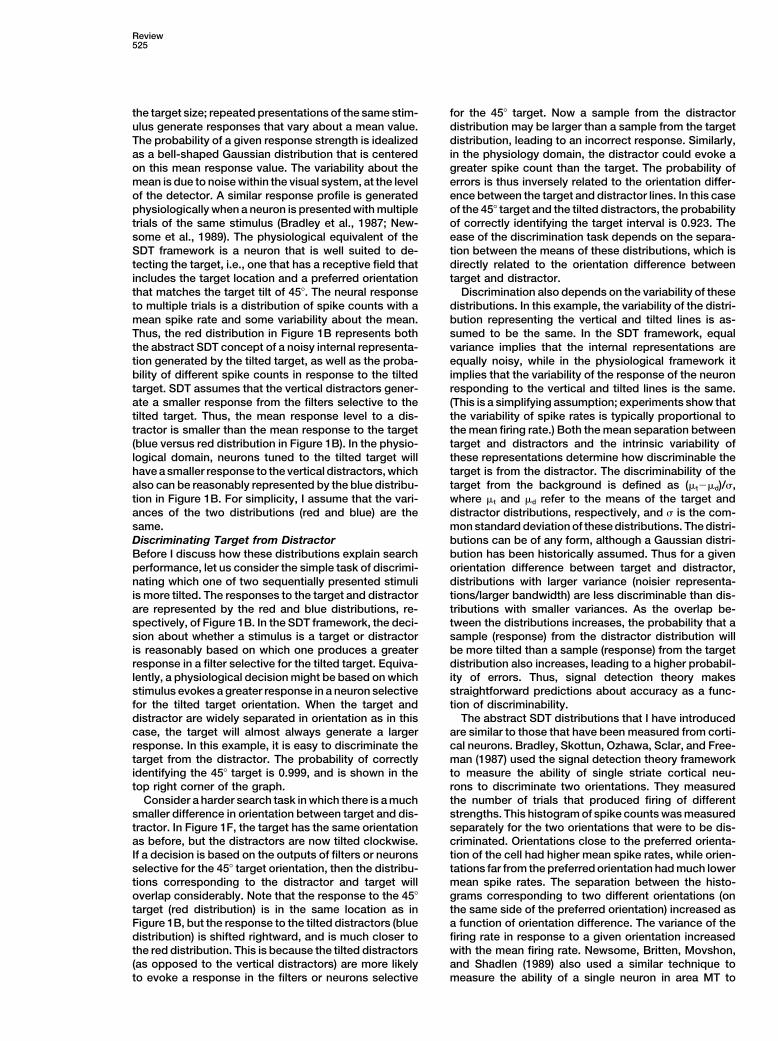
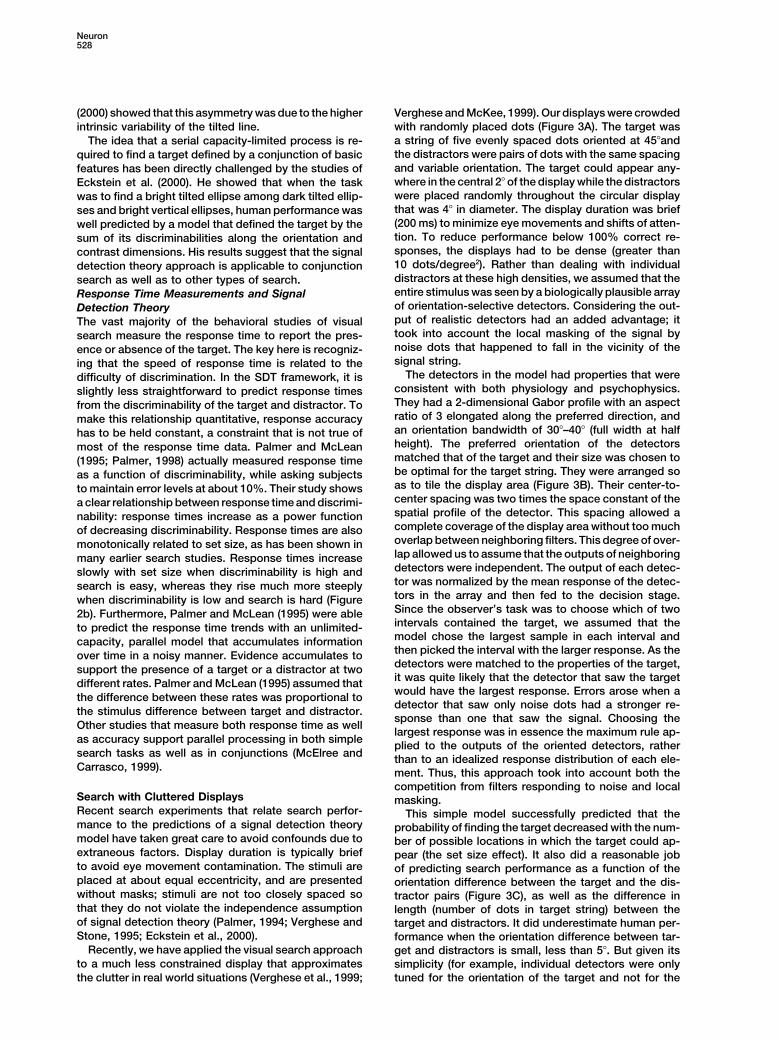
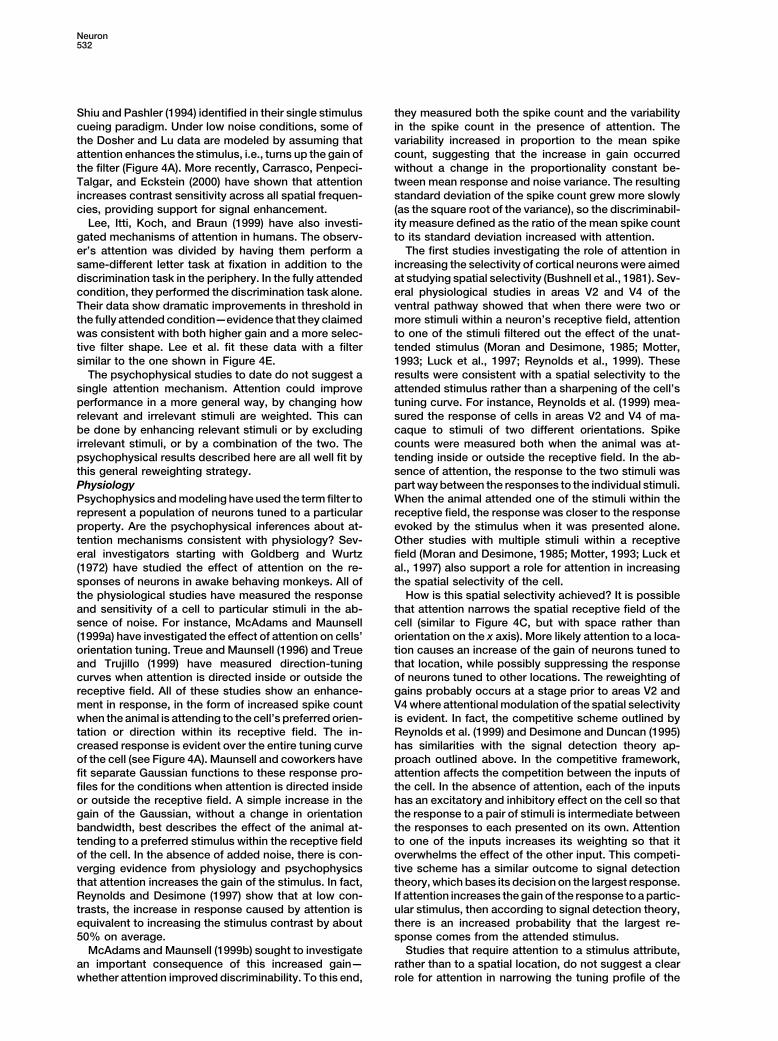
(2000) showed that this asymmetry was due to the higher Verghese and McKee, 1999). Our displays were crowdedwith randomly placed dots (Figure 3A). The target wasintrinsic variability of the tilted line.a string of five evenly spaced dots oriented at 45�andThe idea that a serial capacity-limited process is re-the distractors were pairs of dots with the same spacingquired to find a target defined by a conjunction of basicand variable orientation. The target could appear any-features has been directly challenged by the studies ofwhere in the central 2� of the display while the distractorsEckstein et al. (2000). He showed that when the taskwere placed randomly throughout the circular displaywas to find a bright tilted ellipse among dark tilted ellip-that was 4� in diameter. The display duration was briefses and bright vertical ellipses, human performance was(200 ms) to minimize eye movements and shifts of atten-well predicted by a model that defined the target by thetion. To reduce performance below 100% correct re-sum of its discriminabilities along the orientation andsponses, the displays had to be dense (greater thancontrast dimensions. His results suggest that the signal10 dots/degree2). Rather than dealing with individualdetection theory approach is applicable to conjunctiondistractors at these high densities, we assumed that thesearch as well as to other types of search.entire stimulus was seen by a biologically plausible arrayResponse Time Measurements and Signalof orientation-selective detectors. Considering the out-Detection Theoryput of realistic detectors had an added advantage; itThe vast majority of the behavioral studies of visualtook into account the local masking of the signal bysearch measure the response time to report the pres-noise dots that happened to fall in the vicinity of theence or absence of the target. The key here is recogniz-signal string.ing that the speed of response time is related to the
The detectors in the model had properties that weredifficulty of discrimination. In the SDT framework, it isconsistent with both physiology and psychophysics.slightly less straightforward to predict response timesThey had a 2-dimensional Gabor profile with an aspectfrom the discriminability of the target and distractor. Toratio of 3 elongated along the preferred direction, andmake this relationship quantitative, response accuracyan orientation bandwidth of 30�–40� (full width at halfhas to be held constant, a constraint that is not true ofheight). The preferred orientation of the detectorsmost of the response time data. Palmer and McLeanmatched that of the target and their size was chosen to(1995; Palmer, 1998) actually measured response timebe optimal for the target string. They were arranged soas a function of discriminability, while asking subjectsas to tile the display area (Figure 3B). Their center-to-to maintain error levels at about 10%. Their study showscenter spacing was two times the space constant of thea clear relationship between response time and discrimi-spatial profile of the detector. This spacing allowed anability: response times increase as a power functioncomplete coverage of the display area without too muchof decreasing discriminability. Response times are alsooverlap between neighboring filters. This degree of over-monotonically related to set size, as has been shown inlap allowed us to assume that the outputs of neighboringmany earlier search studies. Response times increasedetectors were independent. The output of each detec-slowly with set size when discriminability is high andtor was normalized by the mean response of the detec-search is easy, whereas they rise much more steeplytors in the array and then fed to the decision stage.when discriminability is low and search is hard (FigureSince the observer’s task was to choose which of two2b). Furthermore, Palmer and McLean (1995) were ableintervals contained the target, we assumed that theto predict the response time trends with an unlimited-model chose the largest sample in each interval andcapacity, parallel model that accumulates informationthen picked the interval with the larger response. As theover time in a noisy manner. Evidence accumulates todetectors were matched to the properties of the target,support the presence of a target or a distractor at twoit was quite likely that the detector that saw the targetdifferent rates. Palmer and McLean (1995) assumed thatwould have the largest response. Errors arose when athe difference between these rates was proportional todetector that saw only noise dots had a stronger re-
the stimulus difference between target and distractor.sponse than one that saw the signal. Choosing the
Other studies that measure both response time as welllargest response was in essence the maximum rule ap-
as accuracy support parallel processing in both simple plied to the outputs of the oriented detectors, rathersearch tasks as well as in conjunctions (McElree and than to an idealized response distribution of each ele-Carrasco, 1999). ment. Thus, this approach took into account both the
competition from filters responding to noise and localSearch with Cluttered Displays masking.Recent search experiments that relate search perfor- This simple model successfully predicted that themance to the predictions of a signal detection theory probability of finding the target decreased with the num-model have taken great care to avoid confounds due to ber of possible locations in which the target could ap-extraneous factors. Display duration is typically brief pear (the set size effect). It also did a reasonable jobto avoid eye movement contamination. The stimuli are of predicting search performance as a function of theplaced at about equal eccentricity, and are presented orientation difference between the target and the dis-without masks; stimuli are not too closely spaced so tractor pairs (Figure 3C), as well as the difference inthat they do not violate the independence assumption length (number of dots in target string) between theof signal detection theory (Palmer, 1994; Verghese and target and distractors. It did underestimate human per-Stone, 1995; Eckstein et al., 2000). formance when the orientation difference between tar-
Recently, we have applied the visual search approach get and distractors is small, less than 5�. But given itsto a much less constrained display that approximates simplicity (for example, individual detectors were only
tuned for the orientation of the target and not for thethe clutter in real world situations (Verghese et al., 1999;
Review529
Figure 3. Search in a Dense Display
(A) The stimulus contained a 5-dot target string among oriented distractor pairs. In this example, the target and distractors have the sameorientation. The arrow points to the location of the target string.(B) The overlapping circles represent the array of oriented filters that were used to model performance in this search task. The enlarged filterson the right show a filter responding to target and distractors, and another responding to distractors alone.(C) Comparison of data for three observers (symbols) and the model (dashed line). Thresholds, in terms of reciprocal noise density to reachcriterion performance, are plotted as a function of orientation difference between target and distractor.
spacing of the dots in the string), it is impressive how est, or by cueing these attributes. Attention can also bedivided by having the observer perform a concurrentwell it predicted human performance. Our results indi-
cate that the signal detection approach, combined with task. Some studies suggest that features and locationsmay not always be the units of attention. Attention maybiologically plausible detectors, can predict perfor-
mance in more realistic search tasks with crowded dis- be directed to parts of objects (Vecera et al., 2000), tosingle objects (Duncan, 1984; see also review by Scholl,plays.2001), to groups of objects (Driver et al., 1994), or tosurfaces (He and Nakayama, 1995). The complexity ofThe Role of Visual Attention in Search
Psychophysics and Modeling the attentional unit might evolve with increasing levelsof visual processing. For example, the phenomenon ofAlthough many aspects of search performance can be
explained with SDT as shown above, visual attention object attention, which involves attention to all featuresthat define an object, might depend on how well thecan influence performance in a search task. This section
of the review is devoted to understanding how attention object is segmented from the rest of the visual scene,as well as how familiar the observer is with that categoryworks. I assume that attention can be manipulated by
informing the observer of the location or feature of inter- of objects. For the purposes of this review, we consider
Neuron530
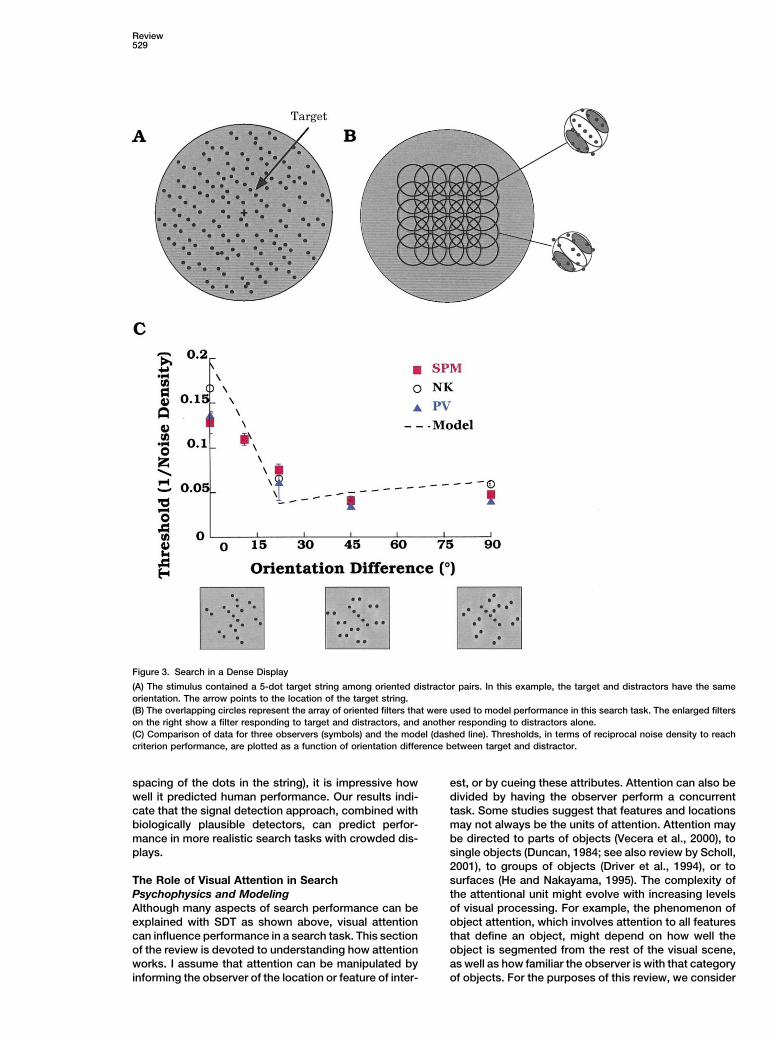
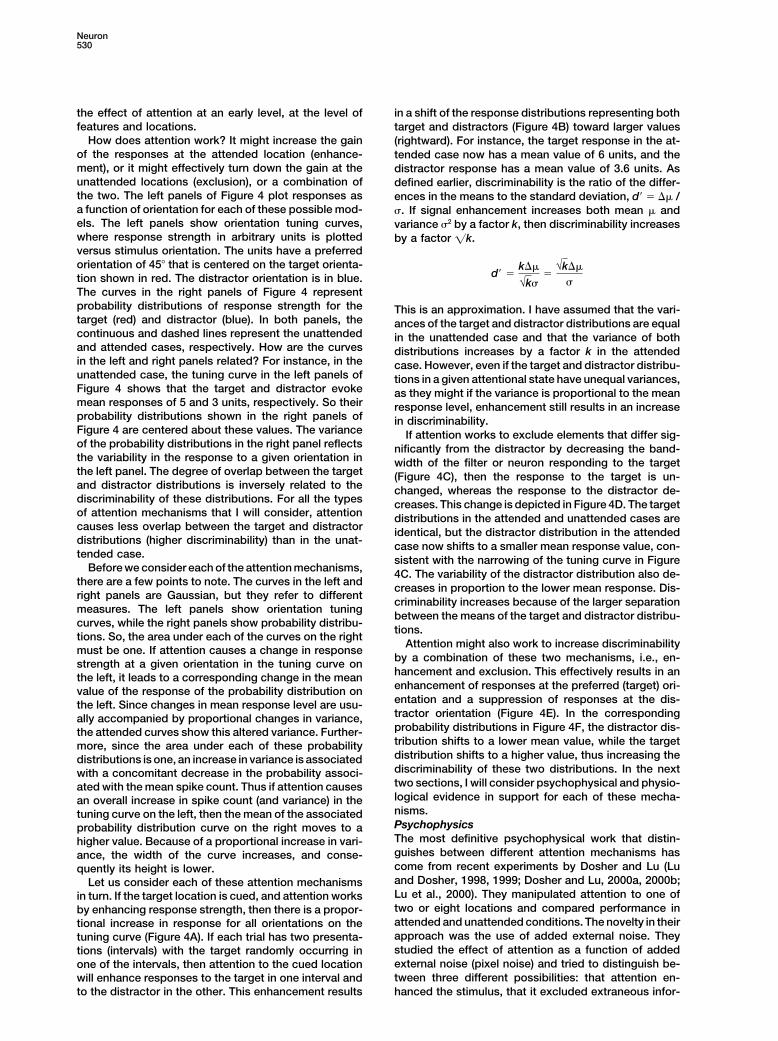
the effect of attention at an early level, at the level of in a shift of the response distributions representing bothfeatures and locations. target and distractors (Figure 4B) toward larger values
How does attention work? It might increase the gain (rightward). For instance, the target response in the at-of the responses at the attended location (enhance- tended case now has a mean value of 6 units, and thement), or it might effectively turn down the gain at the distractor response has a mean value of 3.6 units. Asunattended locations (exclusion), or a combination of defined earlier, discriminability is the ratio of the differ-the two. The left panels of Figure 4 plot responses as ences in the means to the standard deviation, d� � �� /a function of orientation for each of these possible mod- �. If signal enhancement increases both mean � andels. The left panels show orientation tuning curves, variance �2 by a factor k, then discriminability increaseswhere response strength in arbitrary units is plotted by a factor �k.versus stimulus orientation. The units have a preferredorientation of 45� that is centered on the target orienta-
d� �k��
√k��
√k��
�tion shown in red. The distractor orientation is in blue.The curves in the right panels of Figure 4 representprobability distributions of response strength for the This is an approximation. I have assumed that the vari-target (red) and distractor (blue). In both panels, the ances of the target and distractor distributions are equalcontinuous and dashed lines represent the unattended in the unattended case and that the variance of bothand attended cases, respectively. How are the curves distributions increases by a factor k in the attendedin the left and right panels related? For instance, in the case. However, even if the target and distractor distribu-unattended case, the tuning curve in the left panels of tions in a given attentional state have unequal variances,Figure 4 shows that the target and distractor evoke as they might if the variance is proportional to the meanmean responses of 5 and 3 units, respectively. So their response level, enhancement still results in an increaseprobability distributions shown in the right panels of in discriminability.Figure 4 are centered about these values. The variance If attention works to exclude elements that differ sig-of the probability distributions in the right panel reflects nificantly from the distractor by decreasing the band-the variability in the response to a given orientation in width of the filter or neuron responding to the targetthe left panel. The degree of overlap between the target (Figure 4C), then the response to the target is un-and distractor distributions is inversely related to the changed, whereas the response to the distractor de-discriminability of these distributions. For all the types creases. This change is depicted in Figure 4D. The targetof attention mechanisms that I will consider, attention distributions in the attended and unattended cases arecauses less overlap between the target and distractor identical, but the distractor distribution in the attendeddistributions (higher discriminability) than in the unat- case now shifts to a smaller mean response value, con-tended case. sistent with the narrowing of the tuning curve in Figure
Before we consider each of the attention mechanisms, 4C. The variability of the distractor distribution also de-there are a few points to note. The curves in the left and creases in proportion to the lower mean response. Dis-right panels are Gaussian, but they refer to different
criminability increases because of the larger separationmeasures. The left panels show orientation tuning
between the means of the target and distractor distribu-curves, while the right panels show probability distribu-
tions.tions. So, the area under each of the curves on the right
Attention might also work to increase discriminabilitymust be one. If attention causes a change in response
by a combination of these two mechanisms, i.e., en-strength at a given orientation in the tuning curve onhancement and exclusion. This effectively results in anthe left, it leads to a corresponding change in the meanenhancement of responses at the preferred (target) ori-value of the response of the probability distribution onentation and a suppression of responses at the dis-the left. Since changes in mean response level are usu-tractor orientation (Figure 4E). In the correspondingally accompanied by proportional changes in variance,probability distributions in Figure 4F, the distractor dis-the attended curves show this altered variance. Further-tribution shifts to a lower mean value, while the targetmore, since the area under each of these probabilitydistribution shifts to a higher value, thus increasing thedistributions is one, an increase in variance is associateddiscriminability of these two distributions. In the nextwith a concomitant decrease in the probability associ-two sections, I will consider psychophysical and physio-ated with the mean spike count. Thus if attention causeslogical evidence in support for each of these mecha-an overall increase in spike count (and variance) in thenisms.tuning curve on the left, then the mean of the associatedPsychophysicsprobability distribution curve on the right moves to aThe most definitive psychophysical work that distin-higher value. Because of a proportional increase in vari-guishes between different attention mechanisms hasance, the width of the curve increases, and conse-come from recent experiments by Dosher and Lu (Luquently its height is lower.and Dosher, 1998, 1999; Dosher and Lu, 2000a, 2000b;Let us consider each of these attention mechanismsLu et al., 2000). They manipulated attention to one ofin turn. If the target location is cued, and attention workstwo or eight locations and compared performance inby enhancing response strength, then there is a propor-attended and unattended conditions. The novelty in theirtional increase in response for all orientations on theapproach was the use of added external noise. Theytuning curve (Figure 4A). If each trial has two presenta-studied the effect of attention as a function of addedtions (intervals) with the target randomly occurring inexternal noise (pixel noise) and tried to distinguish be-one of the intervals, then attention to the cued locationtween three different possibilities: that attention en-will enhance responses to the target in one interval and
to the distractor in the other. This enhancement results hanced the stimulus, that it excluded extraneous infor-
Review531
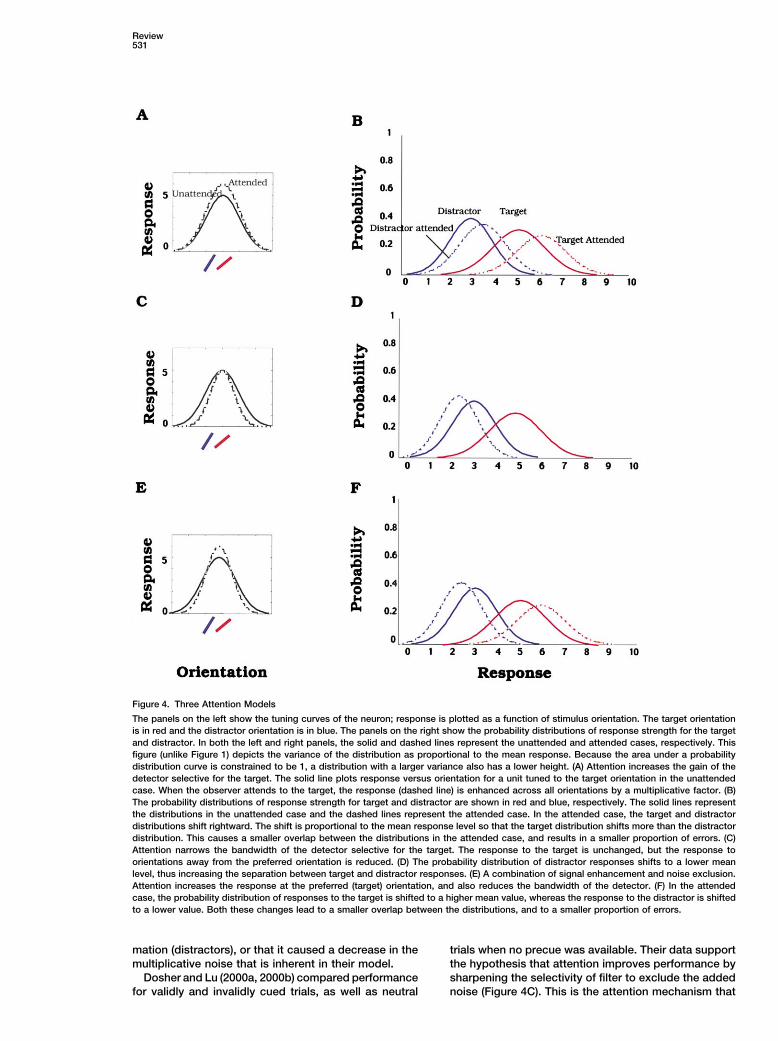
Figure 4. Three Attention Models
The panels on the left show the tuning curves of the neuron; response is plotted as a function of stimulus orientation. The target orientationis in red and the distractor orientation is in blue. The panels on the right show the probability distributions of response strength for the targetand distractor. In both the left and right panels, the solid and dashed lines represent the unattended and attended cases, respectively. Thisfigure (unlike Figure 1) depicts the variance of the distribution as proportional to the mean response. Because the area under a probabilitydistribution curve is constrained to be 1, a distribution with a larger variance also has a lower height. (A) Attention increases the gain of thedetector selective for the target. The solid line plots response versus orientation for a unit tuned to the target orientation in the unattendedcase. When the observer attends to the target, the response (dashed line) is enhanced across all orientations by a multiplicative factor. (B)The probability distributions of response strength for target and distractor are shown in red and blue, respectively. The solid lines representthe distributions in the unattended case and the dashed lines represent the attended case. In the attended case, the target and distractordistributions shift rightward. The shift is proportional to the mean response level so that the target distribution shifts more than the distractordistribution. This causes a smaller overlap between the distributions in the attended case, and results in a smaller proportion of errors. (C)Attention narrows the bandwidth of the detector selective for the target. The response to the target is unchanged, but the response toorientations away from the preferred orientation is reduced. (D) The probability distribution of distractor responses shifts to a lower meanlevel, thus increasing the separation between target and distractor responses. (E) A combination of signal enhancement and noise exclusion.Attention increases the response at the preferred (target) orientation, and also reduces the bandwidth of the detector. (F) In the attendedcase, the probability distribution of responses to the target is shifted to a higher mean value, whereas the response to the distractor is shiftedto a lower value. Both these changes lead to a smaller overlap between the distributions, and to a smaller proportion of errors.
mation (distractors), or that it caused a decrease in the trials when no precue was available. Their data supportthe hypothesis that attention improves performance bymultiplicative noise that is inherent in their model.
Dosher and Lu (2000a, 2000b) compared performance sharpening the selectivity of filter to exclude the addednoise (Figure 4C). This is the attention mechanism thatfor validly and invalidly cued trials, as well as neutral
Neuron532
Shiu and Pashler (1994) identified in their single stimulus they measured both the spike count and the variabilityin the spike count in the presence of attention. Thecueing paradigm. Under low noise conditions, some of
the Dosher and Lu data are modeled by assuming that variability increased in proportion to the mean spikecount, suggesting that the increase in gain occurredattention enhances the stimulus, i.e., turns up the gain of
the filter (Figure 4A). More recently, Carrasco, Penpeci- without a change in the proportionality constant be-tween mean response and noise variance. The resultingTalgar, and Eckstein (2000) have shown that attention
increases contrast sensitivity across all spatial frequen- standard deviation of the spike count grew more slowly(as the square root of the variance), so the discriminabil-cies, providing support for signal enhancement.
Lee, Itti, Koch, and Braun (1999) have also investi- ity measure defined as the ratio of the mean spike countto its standard deviation increased with attention.gated mechanisms of attention in humans. The observ-
er’s attention was divided by having them perform a The first studies investigating the role of attention inincreasing the selectivity of cortical neurons were aimedsame-different letter task at fixation in addition to the
discrimination task in the periphery. In the fully attended at studying spatial selectivity (Bushnell et al., 1981). Sev-eral physiological studies in areas V2 and V4 of thecondition, they performed the discrimination task alone.
Their data show dramatic improvements in threshold in ventral pathway showed that when there were two ormore stimuli within a neuron’s receptive field, attentionthe fully attended condition—evidence that they claimed
was consistent with both higher gain and a more selec- to one of the stimuli filtered out the effect of the unat-tended stimulus (Moran and Desimone, 1985; Motter,tive filter shape. Lee et al. fit these data with a filter
similar to the one shown in Figure 4E. 1993; Luck et al., 1997; Reynolds et al., 1999). Theseresults were consistent with a spatial selectivity to theThe psychophysical studies to date do not suggest a
single attention mechanism. Attention could improve attended stimulus rather than a sharpening of the cell’stuning curve. For instance, Reynolds et al. (1999) mea-performance in a more general way, by changing how
relevant and irrelevant stimuli are weighted. This can sured the response of cells in areas V2 and V4 of ma-caque to stimuli of two different orientations. Spikebe done by enhancing relevant stimuli or by excluding
irrelevant stimuli, or by a combination of the two. The counts were measured both when the animal was at-tending inside or outside the receptive field. In the ab-psychophysical results described here are all well fit by
this general reweighting strategy. sence of attention, the response to the two stimuli waspart way between the responses to the individual stimuli.Physiology
Psychophysics and modeling have used the term filter to When the animal attended one of the stimuli within thereceptive field, the response was closer to the responserepresent a population of neurons tuned to a particular
property. Are the psychophysical inferences about at- evoked by the stimulus when it was presented alone.Other studies with multiple stimuli within a receptivetention mechanisms consistent with physiology? Sev-
eral investigators starting with Goldberg and Wurtz field (Moran and Desimone, 1985; Motter, 1993; Luck etal., 1997) also support a role for attention in increasing(1972) have studied the effect of attention on the re-
sponses of neurons in awake behaving monkeys. All of the spatial selectivity of the cell.How is this spatial selectivity achieved? It is possiblethe physiological studies have measured the response
and sensitivity of a cell to particular stimuli in the ab- that attention narrows the spatial receptive field of thecell (similar to Figure 4C, but with space rather thansence of noise. For instance, McAdams and Maunsell
(1999a) have investigated the effect of attention on cells’ orientation on the x axis). More likely attention to a loca-tion causes an increase of the gain of neurons tuned toorientation tuning. Treue and Maunsell (1996) and Treue
and Trujillo (1999) have measured direction-tuning that location, while possibly suppressing the responseof neurons tuned to other locations. The reweighting ofcurves when attention is directed inside or outside the
receptive field. All of these studies show an enhance- gains probably occurs at a stage prior to areas V2 andV4 where attentional modulation of the spatial selectivityment in response, in the form of increased spike count
when the animal is attending to the cell’s preferred orien- is evident. In fact, the competitive scheme outlined byReynolds et al. (1999) and Desimone and Duncan (1995)tation or direction within its receptive field. The in-
creased response is evident over the entire tuning curve has similarities with the signal detection theory ap-proach outlined above. In the competitive framework,of the cell (see Figure 4A). Maunsell and coworkers have
fit separate Gaussian functions to these response pro- attention affects the competition between the inputs ofthe cell. In the absence of attention, each of the inputsfiles for the conditions when attention is directed inside
or outside the receptive field. A simple increase in the has an excitatory and inhibitory effect on the cell so thatthe response to a pair of stimuli is intermediate betweengain of the Gaussian, without a change in orientation
bandwidth, best describes the effect of the animal at- the responses to each presented on its own. Attentionto one of the inputs increases its weighting so that ittending to a preferred stimulus within the receptive field
of the cell. In the absence of added noise, there is con- overwhelms the effect of the other input. This competi-tive scheme has a similar outcome to signal detectionverging evidence from physiology and psychophysics
that attention increases the gain of the stimulus. In fact, theory, which bases its decision on the largest response.If attention increases the gain of the response to a partic-Reynolds and Desimone (1997) show that at low con-
trasts, the increase in response caused by attention is ular stimulus, then according to signal detection theory,there is an increased probability that the largest re-equivalent to increasing the stimulus contrast by about
50% on average. sponse comes from the attended stimulus.Studies that require attention to a stimulus attribute,McAdams and Maunsell (1999b) sought to investigate
an important consequence of this increased gain— rather than to a spatial location, do not suggest a clearrole for attention in narrowing the tuning profile of thewhether attention improved discriminability. To this end,
Review533
cell to attributes such as orientation or motion direction field. The reduced variance of the response might be a(see Figure 4C). Early studies by Spitzer, Moran, and reflection of the narrower tuning (increased directionDesimone (1988) showed that neurons in V4 responded selectivity) of the cell.more vigorously and more selectively while the animal At what stage of cortical processing does attentionperformed a hard orientation discrimination task than modulate neuronal responses? Attention clearly affectswith an easy task. While they did not explicitly manipu- processing in extrastriate areas V2 and V4, and in arealate attention, they inferred that the animal was paying MT. Areas V2 and MT receive direct projections frommore attention in the hard condition than in the easy area V1, so it is important to determine the role of atten-condition. Their measure of selectivity was the orienta- tion in modulating responses of V1 cells. Evidence fromtion tuning bandwidth of the cells. Although it does ap- physiology is mixed. Motter (1993) shows that in thepear that the bandwidth of the population of their cells presence of competing stimuli, V1 cells show a modula-decreased on average, a more careful analysis by Mc- tion of responses if attention is directed within the re-Adams and Maunsell (1999a) suggests that when the ceptive field. However, Luck et al. (1997) failed to findbaseline activity is subtracted from the cell’s response, an effect of attention on the response of V1 cells whenthe decrease in bandwidth is much less clear. Treue and a single stimulus was presented to the cell. EvidenceTrujillo (1999) explicitly set out to measure the effect of from functional magnetic resonance imaging (fMRI)attention to a stimulus attribute rather than to a location studies suggest that attention modulates the responsein space. They recorded the response of MT neurons of V1 neurons. Gandhi, Heeger, and Boynton (1999)to stimuli that moved in the cells’ preferred direction. showed that cueing the observer to attend to one ofThe animal was always attending to a location outside two locations while performing a motion discriminationthe receptive field, either to a stimulus moving in the task increased the response at a site corresponding tocell’s preferred direction or to a stimulus moving in the the cued location in area V1. Brefczynski and DeYoenull direction. Attending to the preferred-direction stim- (1999) measured the pattern of activation when humanulus increased the response from the recorded cell, observers were required to shift attention from one loca-whereas attending to the null direction stimulus de- tion to the next in a dense stimulus array. The patterncreased its response. Treue and Trujillo characterize of MRI activation in area V1 corresponded to the patternthese effects as changes in gain, rather than changes of attention shifts. A study by Martinez et al. (1999)in the direction tuning of the cell. While individual cells resolves the discrepancy between some of the physiol-do not show evidence for narrowing of their tuning func- ogy studies that show no effect of attention in area V1,tions, attention might achieve filter sharpening by modu- and the fMRI studies that do. They compared humanlating the response of a population of cells tuned to the fMRI responses and event related potentials (ERPs) inattended direction. Attention does appear to increase the same attention task. While the fMRI response (aver-the gain of neurons tuned to the attended attribute while aged over multiple 20 s stimulus presentations) showedsuppressing neurons tuned to a very different attribute. a modulation of responses in area V1 by attention, theThis modulation is analogous to the stimulus enhance- ERP data indicate that area V1 is not the first area toment and distractor exclusion mechanisms that have be modulated by attention. Rather, the ERP shows thatbeen proposed to explain the psychophysical data. the earliest attention-modulated responses occur in ex-
Physiological evidence for attention acting through a trastriate areas at a latency of about 70–75 ms, and onlycombination of signal enhancement and possibly nar- appear in area V1 subsequently. A likely possibility forrower bandwidth (as shown in Figure 4E) comes from a the discrepancy between the physiology and fMRI stud-study by Croner and Albright (1999). They had macaque ies is that response in V1 is due to feedback from highermonkeys discriminate the direction of motion of coher- areas that are directly modulated by attention.ently moving signals in dynamic noise (as in Newsome The other attention mechanism, filtering out the effectand Pare, 1988). In addition to this behavioral measure,
of unattended stimuli, has been observed only at higherthey recorded from cells in area MT. In the control condi-
levels starting at V2 and MT. V1 receptive fields aretion, the signal dots were the same color as the noise.
typically too small to accommodate the multiple stimuliIn the “attended” condition, the signal dots were coloredthat have been considered in these studies. It is likelydifferently, thus potentially cueing the animal to theirthat the attention-modulated sharpening of the neuronallocations. Croner and Albright (1999) report improvedresponse profile observed in these higher areas is dueneurometric and psychometric functions in the attendedto a selection of a subset of V1 responses that feed intocase. They attribute the improvement in the attendedthese higher-level neurons, similar to the competitivecase to both a larger mean response motion in the pre-scheme suggested by Reynolds et al. (1999).ferred direction of the cell, as well as a reduced variabil-
ity of this response. The larger mean response is consis-Conclusiontent with signal enhancement. The decrease in theThis review has introduced the concept of discriminabil-variability of the cell’s response (a narrowing of the prob-ity in search and has shown how the signal detectionability distributions in the right of Figure 4) is potentiallytheory approach, based on noisy internal representa-related to a decreased bandwidth. Recall that severaltions of these stimuli, accounts for the psychophysicaldots typically fall within the cells receptive field in areadata. Furthermore, adding a biologically plausible arrayMT. A few of these are signal dots moving in the pre-of filters to this signal detection framework predictsferred direction of the cell, amidst several noise dotssearch performance in dense visual displays. Visual at-moving in random directions. Thus the variability of thetention has been implicated in searching for targetscell’s response is partly due to the heterogeneity of the
motion direction of the noise dots within its receptive among distractors, but it is only recently that converging
Neuron534
sponses to orientation and motion contrast in cat striate cortex. Vis.evidence from physiology and psychophysics has clari-Neurosci. 16, 587–600.fied the mechanisms by which attention influencesKnierim, J.J., and van Essen, D.C. (1992). Neuronal responses tosearch. Attention acts mainly by enhancing the responsestatic texture patterns in area V1 of the alert macaque monkey. J.to the attended stimulus, and by restricting the rangeNeurophysiol. 67, 961–980.
of units responding to the stimulus, so as to excludeLee, D.K., Itti, L., Koch, C., and Braun, J. (1999). Attention activatesdistractors and noise. The response gain associatedwinner-take-all competition among visual filters. Nat. Neurosci. 2,
with signal enhancement seems to occur in a way that 375–381.increases the discriminability of the signal. Thus atten- Legge, G.E., and Foley, J.M. (1980). Contrast masking in humantion improves visual search by increasing the response vision. J. Opt. Soc. Am. A 70, 1459–1470.to the target and by excluding distractors. Levitt, J.B., and Lund, J.S. (1997). Contrast dependence of contex-
tual effects in primate visual cortex. Nature 387, 73–76.Acknowledgments Lu, Z.L., and Dosher, B.A. (1998). External noise distinguishes atten-
tion mechanisms. Vision Res. 38, 1183–1198.I would like to thank Suzanne McKee, John Palmer, Tony Movshon,
Lu, Z.L., and Dosher, B.A. (1999). Characterizing human perceptualJohn Maunsell, and an anonymous referee for their insightful com-inefficiencies with equivalent internal noise. J. Opt. Soc. Am. A Opt.ments on this review. This work was supported by NEI grant RO1Image Sci. Vis. 16, 764–778.EY12038 and by NASA grant NAG 9-1163.Lu, Z.L., Liu, C.Q., and Dosher, B.A. (2000). Attention mechanismsfor multi-location first- and second-order motion perception. VisionReferencesRes. 40, 173–186.
Luck, S.J., Chelazzi, L., Hillyard, S.A., and Desimone, R. (1997).Bradley, A., Skottun, B.C., Ohzawa, I., Sclar, G., and Freeman, R.D.Neural mechanisms of spatial selective attention in areas V1, V2,(1987). Visual orientation and spatial frequency discrimination: aand V4 of macaque visual cortex. J. Neurophysiol. 77, 24–42.comparison of single neurons and behavior. J. Neurophysiol. 57,
755–772. Martinez, A., Anllo-Vento, L., Sereno, M.I., Frank, L.R., Buxton, R.B.,Dubowitz, D.J., Wong, E.C., Hinrichs, H., Heinze, H.J., and Hillyard,Brefczynski, J.A., and DeYoe, E.A. (1999). A physiological correlateS.A. (1999). Involvement of striate and extrastriate visual corticalof the ‘spotlight’ of visual attention. Nat. Neurosci. 2, 370–374.areas in spatial attention. Nat. Neurosci. 2, 364–369.Bushnell, M.C., Goldberg, M.E., and Robinson, D.L. (1981). Behav-McAdams, C.J., and Maunsell, J.H.R. (1999a). Effects of attentionioral enhancement of visual responses in monkey cortex. I. Modula-on orientation-tuning functions of single neurons in macaque corti-tion in posterior parietal cortex related to selective visual attention.cal area V4. J. Neurosci. 19, 431–441.J. Neurophysiol. 46, 755–772.McAdams, C.J., and Maunsell, J.H. (1999b). Effects of attention onCarrasco, M., Penpeci-Talgar, C., and Eckstein, M. (2000). Spatialthe reliability of individual neurons in monkey visual cortex. Neuroncovert attention increases contrast sensitivity across the CSF: sup-23, 765–773.port for signal enhancement. Vision Res. 40, 1203–1215.McElree, B., and Carrasco, M. (1999). The temporal dynamics ofCavanaugh, J.R., Bair, W., and Movshon, J.A. (1997). Orientationvisual search: evidence for parallel processing in feature and con-selective setting of contrast gain by the surrounds of macaquejunction searches. J. Exp. Psychol. Hum. Percept. Perform. 25,striate cortex neurons. Abstr. Soc. Neurosci. 23, 567.1517–1539.
Croner, L., and Albright, T.D. (1999). Segmentation by color influ-Moran, J., and Desimone, R. (1985). Selective attention gates visualences responses of motion-sensitive neurons in the cortical middleprocessing in the extrastriate cortex. Science 229, 782–784.temporal area. J. Neurosci. 19, 3935–3951.Motter, B.C. (1993). Focal attention produces spatially selective pro-Desimone, R., and Duncan, J. (1995). Neural mechanisms of selec-cessing in visual cortical areas V1, V2, and V4 in the presence oftive visual attention. Annu. Rev. Neurosci. 18, 193–222.competing stimuli. J. Neurophysiol. 70, 909–919.
Dosher, B.A., and Lu, Z. (2000a). Mechanisms of perceptual attentionNewsome, W.T., and Pare, E.B. (1988). Selective impairment of mo-in precuing of location. Vision Res. 40, 1269–1292.tion perception following ibotenic acid lesions of the middle tempo-
Dosher, B.A., and Lu, Z.L. (2000b). Noise exclusion in spatial atten- ral visual area of macaque monkey. J. Neurosci. 8, 2201–2211.tion. Psychol. Sci. 11, 139–146.
Newsome, W.T., Britten, K.R., Movshon, J.A., and Shadlen, M.Driver, J., Baylis, G., Goodrich, S., and Rafal, R. (1994). Axis-based (1989). Single neurons and perception of visual motion. In Neuralneglect for visual shapes. Neuropsychologia 32, 1353–1365. Mechanisms of Visual Perception, D.M.-K. Lam, and C. D. Gilbert,Duncan, J. (1984). Selective attention and the organization of visual eds., Proceedings of the Retina Research Foundation, Volume 2.information. J. Exp. Psychol. Gen. 113, 501–517. (The Woodlands, TX: Portfolio Publishing Company).Eckstein, M.P., Thomas, J.P., Palmer, J., and Shimozaki, S.S. (2000). Nolte, L.W., and Jaarsma, D. (1967). More on the detection of oneA signal detection model predicts the effects of set size on visual of M orthogonal signals. J. Acoust. Soc. Am. 41, 497–505.search accuracy for feature, conjunction, triple conjunction, and O’Craven, K., Downing, P., and Kanwisher, N. (1999). fMRI evidencedisjunction displays. Percept. Psychophys. 62, 425–451. for objects as the units of attentional selection. Nature 401, 584–587.Gandhi, S.P., Heeger, D.J., and Boynton, G.M. (1999). Spatial atten- Palmer, J. (1994). Set-size effects in visual search: the effect oftion affects brain activity in human primary visual cortex. Proc. Natl. attention is independent of the stimulus for simple tasks. Vision Res.Acad. Sci. USA 96, 3314–3319. 34, 1703–1721.Goldberg, M.E., and Wurtz, R.H. (1972). Activity of superior colliculus Palmer, J. (1998). Attentional effects in visual search: relating searchin the behaving monkey. II. Effect of attention on neuronal re- accuracy and search time. In Visual Attention, R. Wright, ed. (Newsponses. J. Neurophysiol. 35, 560–574. York: Oxford University Press), pp. 295–306.Graham, N., Kramer, P., and Yager, D. (1987). Signal-detection mod- Palmer, J., and McLean, J. (1995). Imperfect, unlimited capacity,els for multidimensional stimuli: Probability distributions and combi- parallel search yields large set-size effects. Paper presented at thenation rules. J. Math. Psychol. 31, 366–409. Society of Mathematical Psychology, Irvine, CA.He, Z.J., and Nakayama, K. (1995). Visual attention to surfaces in Palmer, J., Ames, C.T., and Lindsey, D.T. (1993). Measuring the3-D space. Proc. Natl. Acad. Sci. USA 92, 11155–11159. effect of attention on simple visual search. J. Exp. Psychol. Hum.Heeger, D.J. (1992). Normalization of cell responses in cat striate Percept. Perform. 19, 108–130.cortex. Vis. Neurosci. 9, 181–197. Palmer, J., Verghese, P., and Pavel, M. (2000). The psychophysics
of visual search. Vision Res. 40, 1227–1268.Kastner, S., Nothdurft, H.C., and Pigarev, I.N. (1999). Neuronal re-
Review535
Pavel, M., Econopouly, J., and Landy, M.S. (1992). Psychophysicsof rapid visual search. Invest. Ophthalmol. Vis. Sci. Suppl. 33, 1355.
Reynolds, J.H., and Desimone, R. (1997). Attention and contrasthave similar effects on competitive interactions in macaque V4.Abstr. Soc. Neurosci. 302.
Reynolds, J.H., Chelazzi, L., and Desimone, R. (1999). Competitivemechanisms subserve attention in macaque areas V2 and V4. J.Neurosci. 19, 1736–1753.
Scholl, B.J. (2001). Objects and attention: the state of the art. Cogni-tion 80, 1–46.
Shaw, M.L. (1982). Attending to multiple sources of information: I.The integration of information in decision making. Cognit. Psychol.14, 353–409.
Shaw, M.L. (1984). Division of attention among spatial locations: afundamental difference between detection of letters and detectionof luminance increments. In Attention and Performance, Vol. X, H.B.Bouma and D.G. Bouwhuis, eds. (Lawrence Erlbaum Associates),pp. 109–121 .
Shiu, L.-P., and Pashler, H. (1994). Negligible effect of spatial precu-ing on identification of single digits. J. Exp. Psychol. Hum. Percept.Perform. 20, 1037–1054.
Spitzer, H., Desimone, R., and Moran, J. (1988). Increased attentionenhances both behavioral and neuronal performance. Science 240,338–340.
Sutter, A., dela Cruz, R., and Sheft, S. (2000). Noisy, independentprocessing of features in visual search explains search asymmetries.Invest. Ophthalmol. Vis. Sci. Suppl. 41, 423.
Treisman, A., and Gormican, S. (1988). Feature analysis in earlyvision: Evidence form search asymmetries. Psychol. Rev. 95, 15–48.
Treisman, A., and Souther, J. (1985). Search asymmetry: A diagnos-tic for preattentive processing of separable features. J. Exp. Psy-chol. Gen. 114, 285–310.
Treisman, A.M., and Gelade, G. (1980). A feature-integration theoryof attention. Cognit. Psychol. 12, 97–136.
Treue, S., and Martinez Trujillo, J.C. (1999). Feature-based attentioninfluences motion processing gain in macaque visual cortex. Nature399, 575–579.
Treue, S., and Maunsell, J.H. (1996). Attentional modulation of visualmotion processing in cortical areas MT and MST. Nature 382,539–541.
Vecera, S., Behrmann, M., and McGoldrick, J. (2000). Selective atten-tion to parts of an object. Psychonom. Bull. Rev. 7, 301–308.
Verghese, P., and McKee, S. (1999). Searching for patterns in noise.Perception Suppl. 28, 55c.
Verghese, P., and Nakayama, K. (1994). Stimulus discriminability invisual search. Vision Res. 34, 2453–2467.
Verghese, P., and Stone, L.S. (1995). Combination of speed informa-tion across space. Vision Res. 35, 2811–2823.
Verghese, P., Watamaniuk, S.N.J., McKee, S.P., and Grzywacz, N.M.(1999). Local motion detectors cannot account for the detectabilityof an extended trajectory in noise. Vision Res. 39, 19–30.