Embed Size (px)
Citation preview
VISUAL SURVEILLANCE TECHNIQUES IN AN
ENTRANCE MONITORING APPLICATION
Daniel Wojtaszek
A Thesis submitted to the Faculty of Graduate and PostdoctoralStudies in partial fulfillment of the requirements for the degree of
Master of Applied Science, Electrical Engineering
September 2002
Ottawa-Carleton Institute for Electrical and Computer EngineeringSchool of Information Technology and Engineering
University of OttawaOttawa, Ontario, Canada
c© Daniel Wojtaszek, 2002

Contents
List of Figures iv
Abstract vii
Acknowledgements viii
1 Introduction 1
1.1 Computer Vision . . . . . . . . . . . . . . . . . . . . . . . . . . . . . 1
1.2 Visual Surveillance . . . . . . . . . . . . . . . . . . . . . . . . . . . . 1
1.3 Objectives . . . . . . . . . . . . . . . . . . . . . . . . . . . . . . . . . 4
2 Literature Review 6
2.1 Segmentation Using Background Subtraction . . . . . . . . . . . . . . 6
2.2 People Detection . . . . . . . . . . . . . . . . . . . . . . . . . . . . . 9
2.3 Colour Feature Extraction and Matching . . . . . . . . . . . . . . . . 11
2.4 Person Tracking . . . . . . . . . . . . . . . . . . . . . . . . . . . . . . 13
2.5 Activity Recognition . . . . . . . . . . . . . . . . . . . . . . . . . . . 15
3 Camera Placement 17
4 Background Subtraction 22
4.1 Background Subtraction Algorithm . . . . . . . . . . . . . . . . . . . 22
4.2 Segmentation Results . . . . . . . . . . . . . . . . . . . . . . . . . . . 27
ii
5 Person Detection 31
5.1 Detection Algorithm . . . . . . . . . . . . . . . . . . . . . . . . . . . 31
5.2 Person Detection Results . . . . . . . . . . . . . . . . . . . . . . . . . 35
6 Person Recognition 39
6.1 Feature Extraction Algorithm . . . . . . . . . . . . . . . . . . . . . . 40
6.2 People Matching Algorithm . . . . . . . . . . . . . . . . . . . . . . . 48
6.3 Recognition Results . . . . . . . . . . . . . . . . . . . . . . . . . . . . 50
7 Person Tracking 58
7.1 Tracking Algorithm . . . . . . . . . . . . . . . . . . . . . . . . . . . . 59
7.2 Entered or Exited the Room . . . . . . . . . . . . . . . . . . . . . . . 60
7.3 Tracking Results . . . . . . . . . . . . . . . . . . . . . . . . . . . . . 61
8 Discussion 66
8.1 Results . . . . . . . . . . . . . . . . . . . . . . . . . . . . . . . . . . . 66
8.2 Thesis Contributions . . . . . . . . . . . . . . . . . . . . . . . . . . . 68
8.3 Future Work . . . . . . . . . . . . . . . . . . . . . . . . . . . . . . . . 68
A Sequences Showing Segmentation Results 70
B Sequences Showing Person Detection Results 98
C Sequences Showing Person Tracking Results 120
Bibliography 129
iii

List of Figures
1.1 An image of the entrance to the V.I.V.A. lab . . . . . . . . . . . . . . 4
3.1 Diagram showing the position and angle of the camera with respect to
the door and floor of the scene from (a) side view, (b) directly above 18
3.2 (a) an image taken when the camera is close to the floor; (b) an image
taken when the camera is very close to the door; (c) an image taken
when the camera is too far from the door; (d) an image taken when
the camera is above the scene looking straight down . . . . . . . . . . 21
4.1 (a) an image of a person’s silhouette extracted without the use of ei-
ther median filtering or morphological operations; (b) an image of a
person’s silhouette extracted with the use of both median filtering and
morphological operations . . . . . . . . . . . . . . . . . . . . . . . . . 26
4.2 (a) an image of a person’s silhouette extracted without the use of ei-
ther median filtering or morphological operations; (b) an image of a
person’s silhouette extracted with the use of both median filtering and
morphological operations . . . . . . . . . . . . . . . . . . . . . . . . . 27
4.3 (a) an image of two people; (b) an image showing the result of segmen-
tation . . . . . . . . . . . . . . . . . . . . . . . . . . . . . . . . . . . 29
4.4 (a) an image of a person who is in between the camera and a recently
opened door; (b) an image showing the result of segmentation . . . . 30
iv

5.1 (a) Segmented image of two people. (b) Image showing two people with
the region in which the percentage of pixels is computed to determine
if a person is detected . . . . . . . . . . . . . . . . . . . . . . . . . . 34
5.2 (a) an image showing the silhouettes of two people; (b) an image show-
ing neither person being detected . . . . . . . . . . . . . . . . . . . . 36
5.3 (a) an image showing the silhouettes of two people; (b) an image show-
ing neither person being detected . . . . . . . . . . . . . . . . . . . . 37
5.4 (a) an image showing the silhouette of a person; (b) an image showing
two false detections . . . . . . . . . . . . . . . . . . . . . . . . . . . . 38
6.1 sample images showing 4 detected persons and their head regions . . 44
6.2 sample images showing 4 detected persons and their head regions . . 45
6.3 sample images showing 4 detected persons, their head regions and the
colour extraction regions . . . . . . . . . . . . . . . . . . . . . . . . . 46
6.4 Images of three different people and the corresponding contour dia-
grams of the two chrominance dimensions . . . . . . . . . . . . . . . 47
6.5 A graph showing recognition rate vs. the number of people currently
in the room . . . . . . . . . . . . . . . . . . . . . . . . . . . . . . . . 52
6.6 A graph showing the values of D when each person’s leaving sequence
and entering sequence are compared to each other . . . . . . . . . . . 52
6.7 A graph showing Davg, the average values of D, when each person’s
leaving sequence is compared to every other person’s entering sequence 53
6.8 An image representing a person leaving (0) and four images repre-
senting a person entering along with the corresponding measure of
dissimilarity . . . . . . . . . . . . . . . . . . . . . . . . . . . . . . . . 55
6.9 An image representing a person leaving (0) and four images repre-
senting a person entering along with the corresponding measure of
dissimilarity . . . . . . . . . . . . . . . . . . . . . . . . . . . . . . . . 56
v

6.10 An image representing a person leaving (0) and four images repre-
senting a person entering along with the corresponding measure of
dissimilarity . . . . . . . . . . . . . . . . . . . . . . . . . . . . . . . . 57
7.1 Two images in which one of the people in the scene was not tracked . 62
7.2 The next image in the sequence after that of the lower image shown
Fig. 7.1 . . . . . . . . . . . . . . . . . . . . . . . . . . . . . . . . . . 62
7.3 Three images each of which show the paths of each of the three people
shown in sequence 3 of appendix C . . . . . . . . . . . . . . . . . . . 65
vi

Abstract
In this thesis, the methods of video analysis for visual surveillance are studied in order
to develop an algorithm that detects, tracks and recognizes people at an entrance to
a room. To detect people, background subtraction and silhouette analysis are used.
To track and recognize people, the colour of a person’s clothing is used.
Each background pixel is modeled using a single Gaussian distribution. This
model is updated using the corresponding pixel intensity and the variation in intensity
of the pixel from one image in the sequence to the next. A pixel in the current image
is considered foreground if its intensity is not within a given number of standard
deviations of the corresponding background pixel model.
Silhouette analysis is used to determine if a foreground region represents a person.
The curvature of the top portion of a silhouette is analyzed to determine if it conforms
to the shape of a person’s head. Then the percentage of foreground pixels in a region of
size proportional to the width of a detected head and immediately below the detected
head is determined. If this value is large enough then a person is detected.
To track and recognize people, colour histograms extracted from each person’s
clothing in a luminance and perceptually uniform chrominance space are compared
using the Earth Mover’s Distance. Clothing colour is extracted from the same region
defined for person detection. The goal is to determine whether a person has entered
or exited the room and to associate a sequence showing a person leaving the room
with the previously recorded sequence showing that same person entering.
vii

Acknowledgements
I would like to thank my supervisor Dr. Robert Laganiere for giving me this oppor-
tunity to work with him. I benefited greatly from his guidance and I will continue to
do so for the rest of my academic and professional career.
I would like to thank my parents and my sister for their support and encourage-
ment. I would like to thank my colleagues in the V.I.V.A. lab for their help. Thanks
especially to those who helped me test my algorithms by walking in and out of the
lab.
viii

Chapter 1
Introduction
1.1 Computer Vision
Computer vision involves capturing digital images of a scene and using a computer
to analyze these images in order to extract the desired information. To achieve this
objective, one may be inclined to design a computer to mimic the human visual
system. Wandell [14] reasons that the human brain interprets images using statistical
inferences based on prior knowledge of the physical characteristics of our universe
and the objects in it. Many vision algorithms have been developed based on this
reasoning. For example an algorithm which tracks people in a sequence of images can
be simplified if the assumption is made that people walk upright on the floor and not
on the ceiling or walls. With the development of faster computers and better digital
image capturing devices many of these algorithms are being applied to accomplish a
variety of tasks such as inspecting objects, interpreting image sequences and modelling
real three dimensional environments.
1.2 Visual Surveillance
Before video cameras were common, surveillance involved having people directly ob-
serve the locations which one desired to keep under surveillance. When video cameras
1

2
became common and relatively inexpensive, these observers were replaced by several
cameras and, most commonly, a person viewing the scenes on video screens from
a central location along with a device to record the output from the cameras. A
problem with this type of system is that a person can only focus on one scene at a
time and is prone to distraction from duty thus some activities may not be reacted
to promptly. A solution to this problem is to use computers to process, analyze and
react to the images from the cameras.
Common objectives of computer automated visual surveillance systems are to
detect and classify all human activities in a scene. Consequently many methods have
been developed to accomplish these objectives. Detecting and classifying all human
activities in a scene can be broken down into the following steps: image acquisition,
background extraction, moving objects segmentation, person detection and person
tracking. The information obtained from the execution of these steps can be analyzed
by the computer to identify the activities that take place and attempt to recognize
the detected people. The computer can also be programmed to record and retrieve
this information.
Image acquisition involves projecting the three dimensional reality of the scene
onto a two dimensional image that is then used as an input to the computer. Project-
ing the three dimensional scene onto a two dimensional image can be done using any
type of video camera that produces an image of the scene that has as little distortion
as possible. For example a camera with a fisheye lense is not desired for this applica-
tion. The main challenge of image retrieval is choosing the position and orientation
of the video camera such that human activity can be detected and classified.
Background extraction involves estimating the intensity value (vector, if colour is
being used) of each pixel in the image when the pixel represents a part of a background
object given a sequence of images. The main challenge of background extraction is
obtaining an accurate estimate of the intensity value (vector) in the presence of image
sensor noise, lighting variations and moving objects.
Segmentation of moving objects involves deciding whether a pixel in an image

3
corresponds to a foreground object or a background object. How well moving objects
are segmented depends on how well the background is extracted therefore the main
challenge is accurately segmenting moving objects in the presence of image sensor
noise using a background model that is not likely to be perfectly accurate.
Person detection involves analyzing the result of moving object segmentation to
determine if a foreground region represents one or more persons. The main challenge
of detecting a person using shape information is that the shape of each person’s body
differs from everyone else’s to varying degrees, a person can move his appendages
(arms, legs, hands, ...) in many ways which can change his shape, and the foreground
regions may not accurately represent the shape of the person.
Person tracking involves determining the path of each person as he passes through
the scene. The main challenge of person tracking is determining the correspondence
of a person detected in one image with the same person detected in previous images
if there are more than one person in the scene.
Visual surveillance techniques are being employed in a large variety of scenarios
and for many purposes. One scenario in which it is desired to employ visual surveil-
lance techniques is the entrance to a room with restricted access. The purpose of
surveying the entrance to such a room can be to record all activity, to determine who
is in the room at any given moment, etc.
The environment in which a surveillance system is designed to monitor greatly
influences the methods used. For the purposes of visual surveillance the most impor-
tant environmental factors are the lighting, the expected activity in the scene being
observed and the amount of motion in the background.
Some situations such as multiple people interaction, people occluded by other
people, or people occluded by large moving background objects (eg. a door opening
and closing) may cause the system to not detect or track people passing through the
scene.

4
Figure 1.1: An image of the entrance to the V.I.V.A. lab
1.3 Objectives
The objective of this work is to capture an image sequence of the entrance to a room
at a minimum rate of two frames per second, to record any activity in this scene, to
keep count of how many people are in the laboratory at any given time and to keep
a record of the activity that occurs in the laboratory. The scene under observation
shows the entrance portion of the lab and also includes a view of a door giving access
to an adjacent room. Fig. 1.1 is an image of the scene taken from the camera being
used in this application.
Specifically, the algorithms developed for this system detect, track and recognize
people in indoor scenes. The algorithms were tested by implementing them on a
personal computer connected to a camera via the USB port and using this setup to
observe the entrance to the V.I.V.A. lab.
The following is a list and a brief description of each algorithm in the order in
which they are performed for every cycle.
1. The background is estimated by computing the weighted sum between the cur-
rent image in the sequence and the previous estimate of the background. The
value of the weight for each pixel in the current image depends on the motion
that occurred between the pixel in this image and the same pixel in the previous
image. Segmentation is accomplished by applying a threshold to the absolute

5
difference between the current image and the background estimation.
2. To detect a person, the foreground regions resulting from segmentation are
analyzed to determine if the shape of a head appears on the border of the
foreground regions and if a body is below a detected head.
3. Tracking is done by determining temporal correspondences between the people
detected in the current image and those detected in previous images using a
similar method used for person recognition. In this case the histogram extracted
from a person detected in the current image is compared to the histogram
extracted from any person detected in previous images.
4. To recognize a person, colour histograms on a luminance and perceptually uni-
form chrominance space are extracted and accumulated from each image of a
person’s clothing as they are being tracked in the scene. To compare histograms,
a metric called the earth mover’s distance [27] is used.

Chapter 2
Literature Review
2.1 Segmentation Using Background Subtraction
This section describes several methods that were previously developed to estimate
the background and segment foreground objects in image sequences.
The first step in segmentation using background subtraction is estimating the
background. Given a sequence of images of the scene under surveillance, the back-
ground is estimated as an image such that each pixel in this image has an intensity
value(s) that visually resembles the corresponding portion of the background. De-
pending on the method of background estimation, each pixel may have more than
one intensity value, each of which represents a different estimate of the background at
that pixel. The result of background estimation should yield one or more images that
look very similar to the scene under observation excluding any foreground objects.
Background subtraction refers to the comparison of each pixel of the current image
with a set of pixels in the neighborhood of the corresponding pixel in the background
image(s). This comparison usually involves subtracting the intensity value of a pixel in
the current image and the intensity value of the corresponding pixel in the background
image and applying a threshold to this result to determine if the pixel in the current
image represents a part of a foreground object.
When developing a method of background estimation and subtraction, one must
6

7
take into consideration the scene which the system will observe. Depending on the
scene being observed, one may need to consider changes in lighting conditions, changes
to the background, constant motion in the background, the occurrence of shadows
and small movements of the image capture device when developing a background
estimation technique.
[16] models the background using the pixel-wise temporal median over a set of L
previous images in the sequence and computes the absolute difference in pixel
intensity between the current image and the background. Then the absolute
difference in edge density between the current image and the background image
is computed. A threshold is applied to both of these differences and the resulting
binary images are combined using a logical or operation to form the segmented
image. The values of both thresholds are determined experimentally.
[1] thresholds temporal difference images and uses tensor voting to segment the fore-
ground region so that each segment represents a single object. The value of the
threshold is determined experimentally.
[9] thresholds the absolute difference between each incoming image and an adaptive
background image which is updated using temporal integration. The value of
the threshold is determined experimentally.
[30] models each pixel in the background image as a single Gaussian distribution. A
pixel is labelled as foreground if its value is not within a predetermined number
of standard deviations of the Gaussian distribution.
[26] models each pixel in the background image as a mixture of Gaussian distribu-
tions. For each pixel in the incoming image, if the pixel has a value that is
within a constant multiplied by the standard deviation of one of its Gaussian
distributions with a high enough weight, then the pixel is labeled as part of the
background.
8
[31] models the background using an adaptive Hidden Markov Model (HMM). The
HMM is trained with a set of images of the scene void of any significant mov-
ing objects using the Baum-Welch algorithm with the average intensity of the
images as the observations. Each state in this model represents each known
possibility of the background. The viterbi algorithm is performed to determine
the most likely state of the background given the observation from which any
object that is not a part of the background will be segmented via background
subtraction and the application of a threshold.
[33] models each pixel in the background image as a Gaussian random variable by
estimating the probability density function of each pixel in the background
image using a fixed number of recent intensity values of the pixel and a Normal
kernel estimator function. To reduce the effects of shadows on segmentation,
only the chrominance values of each pixel are used to estimate the density
function. Segmentation is achieved by using the corresponding density function
estimate to compute the probability that the current value of a pixel represents
a background object. If the probability is below a threshold then the current
value of this pixel represents a foreground object. To remove any false positive
foreground detections due to any motion in the background (eg trees moving
because of wind), the maximum of several probabilities that the current value
of a pixel represents a background object is determined and if this probability
is greater than a threshold then the current value of this pixel represents a
background object. These probabilities are computed using the density function
of every pixel in a small neighborhood of the pixel under consideration.
The most widely used methods of background extraction and image segmentation
compare the current image with a reference or background image. Any pixels in the
current image which differ according to some criteria from the background image
are labeled as foreground pixels. The main difference between these methods is how
the background is determined. The most common approaches use either a mixture
of Gaussians or temporal median to estimate the background image. Another less
9
commonly used method segments images by comparing the current image with one
or more previous images.
The methods described in [9] [26] [16] were designed to segment images taken of
outdoor scenes while the methods described in [31] [1] take only indoor scenes into
consideration.
2.2 People Detection
This section describes several previously developed methods to detect people in im-
ages.
To detect people in images a pattern recognition technique must be used. Pattern
recognition usually proceeds as follows:
1. Certain desired features are extracted from the data.
2. The extracted features are compared with a model of a known pattern using a
method that yields either a pattern match or not. The method of comparison
may be based on statistics, neural networks, etc.
In the case of detecting people in images, the most commonly desired features to
be extracted from the image data are shape features. These features may be detected
foreground regions, edges, corners, etc.
The main issue is choosing what features to extract, what model to use and what
comparison method to use such that a person can be detected in a wide variety of
common poses and in the presence of noise in the extracted features.
[1] observes that the curvature of the head and shoulders of most people are very
similar to each other in that the top of each shoulder and head have relatively
little curvature in the vertical direction when compared to the curvature of the
sides of the head. This characteristic is exploited by approximating the first
derivative with respect to the horizontal coordinates of the curvature of the

10
top portion of each foreground region as a feature and determines if the shape
of a head and shoulders is present by locating regions with a low value of the
derivative (these regions may correspond to the top of a head or shoulder) along
with regions with a high value of the derivative (these regions may correspond
to the side of a head).
[9] observes that the silhouettes of most pedestrian poses are very similar to each
other with respect to several characteristics of their shapes such as extremes of
curvature, area, aspect ratio, etc. Likewise for cyclists. To detect pedestrians
and cyclists the features that represent these shape characteristics are extracted
from each foreground silhouette. A foreground silhouette is classified as one or
more pedestrians or a cyclist by determining if the extracted features satisfy a
set of predetermined conditions.
[4] observes that when a person is walking, their head is usually almost directly above
their torso. To detect people walking through the scene the extreme convex
points of curvature and the vertical projection histogram of each foreground
region are extracted. If a peak in the histogram is close to an extreme convex
point of curvature then there is a head of a person in this region. If more than
one head is detected in the same foreground silhouette then the local geometry
of this silhouette is used to segment it into separate people.
[28] observes that the silhouette of most people who are standing have very similar
aspect ratios and areas, and that a person’s head is usually almost directly
above their torso. To subdivide each foreground region into separate people a
horizontal and vertical projection histogram, area of the foreground region and
the foreground region aspect ratio are used.
[29] observes that people in a lineup at a retail store check out each have been in line
for different lengths of time and that each person moves independently of other
people. Each individual person in a foreground region is detected by grouping

11
the foreground pixels according to the amount of time the pixels are labeled
foreground and according to the motion the foreground pixels.
[30] makes the same observations as [4] as well as observing that most people walk
in a similar manner to each other. The shape and vertical projection of the
foreground regions are used to detect people. Then motion templates are used
to recognize walking motion which is used to verify person detection.
[6] observes that the shape of a person can still be seen if edge detection is used. The
shape of a person is extracted using a pseudo two dimensional hidden Markov
model of edge features extracted from sample images of a person before the
system is brought on line. When the system is on line, the Viterbi algorithm is
used to segment people from the background in an image.
The most common approach to people detection involves analyzing the result of
motion based image segmentation using some criteria. The shape of the foreground
region is commonly used whereas foreground temporal properties as in [29] are rarely
used. A less common, more computationally expensive and more flexible method
employs edge detection and a complex statistical model to detect people.
2.3 Colour Feature Extraction and Matching
This section describes several previously developed methods that use colour to either
segment an image or to recognize an object in an image.
To use colour information to accomplish a task one must take into consideration
image acquisition noise and lighting conditions. Minimizing the effect of image ac-
quisition noise and lighting conditions on how well a method accomplishes a given
task requires using an appropriate colour representation, an appropriate method to
extract colour information from an image and an appropriate method of analyzing
the extracted colour information to achieve the best results possible.
12
[5] recognizes people by accumulating the colour of all the foreground pixels which
are identified as part of a single person into a measurement vector. They then
determine if the features extracted from different images of people match using
a χ2 probability function. The colour representation used is a non-uniformly
quantized version of the (y,u,v) colour space.
[11] recognizes objects by using constrained active appearance models as the fea-
tures and an optimization technique for matching by minimizing the difference
between a synthesized model image and the target image.
[17] uses colour moments of varying order and degree as features to recognize colour
patterns even with changes in illumination and viewing position. The (r,g,b)
colour space is used.
[18] recognizes objects by using histograms constructed using both the colour of each
pixel and the relative spatial locations of each pixel in an image with respect to
all other pixels in this image. Two such histograms are compared by computing
their intersection. If the result is large enough then the histograms are said to
represent the same object. The (r,g,b) colour space is used.
[19] approximates the physical properties of Lambertian surfaces from several train-
ing images and uses statistical models to segment images according to differing
materials.
[20] presents several colour ratio gradients that are invariant to object pose and
lighting conditions. Colour ratio gradient histograms are used in a quadtree-
based split and merge segmentation to segment an image by texture. The goal
of this is to retrieve images from a database that show the same object that is
shown in a query image.
[26] presents a method to compare two multidimensional histograms. A measure of
dissimilarity between two histograms is computed by determining the minimum
amount of ”work” required to ”move” the contents, or weight, of each bin in one

13
histogram to a corresponding bin with similar weight in the other histogram.
This metric is used to compare colour histograms for the purpose of image
retrieval. The CIE-Lab colour space is used because of its perceptual uniformity.
[8] presents a method to compare two multidimensional histograms. A measure of
similarity between two histograms is computed by determining the intersection
between the histograms. The intersection is the sum of the minimum value of
each corresponding bin taken over all bins in the histogram.
These methods show that colour can be used to segment images, to find images in
a database, to recognize objects or to recognize colour patterns. The issues considered
in these publications were lighting conditions, object pose and sensor noise.
The most commonly used colour features involve computing various types of his-
tograms with the choice of colour space depending on the expected conditions under
which the images will be acquired.
2.4 Person Tracking
This section describes a few previously developed methods used to track people in a
sequence of images.
The purpose of tracking is to determine the trajectory (actual or image projected)
of every person that passes through the scene under surveillance. This involves detect-
ing every person within view of the camera, determining his location, and determining
the correspondence between a person detected in one image and the same person that
was detected in previous images. To determine this correspondence the trajectory of
every person that was detected in previous images and a person’s appearance may be
used.
Trajectory information usually refers to the position, velocity and acceleration
of an object. This information is normally used under the assumption that objects
do not undergo many extreme changes in acceleration while moving. For example,
if a person is traveling at a certain velocity and acceleration when it is detected at

14
a certain position in an image then the next position that this person is likely to
be detected can be extrapolated using this information. A person’s trajectory is
estimated using the position of a person in each image of the sequence. This estimate
may be subjected to errors due to inaccurate segmentation.
Appearance information refers to any visual characteristics that can be used to
distinguish one person from most other people. An example of such a characteristic
is a person’s face. Such appearance information may be subjected to noise during
image acquisition, and to variations in the appearance of the person due to changes
in pose and lighting conditions.
[6] tracks a single person using a Kalman filter whose state vector consists of the
location, velocity and bounding box dimensions of the person. The assumption
made is that the velocity of the person does not change significantly from one
image of the sequence to the next.
[10] tracks multiple people by assuming that the position of a person changes by a
small distance from one image to the next in the sequence. Tracking, therefore,
is done by searching an area of the current image surrounding the last known
position of a person. If a person is detected in this area then this person is
matched with the person detected in the previous frame.
[4] tracks multiple people by using intensity characteristics of a person’s head and
estimates of each person’s velocity and acceleration. The median position and
edges of foreground pixels are used estimate the position of each person.
[5] tracks multiple people by using colour features extracted from the entire body of
each person. These features are compared using the χ2 probability function.
[2] tracks multiple people by using the points of extreme curvature on the boundary
of each extracted silhouette and a local search to match these features across
different images in the sequence. The velocity of each feature is estimated and
the features are grouped according velocity. Each of these groups of features
represents a different person.

15
All information used to track a person can be classified as either motion or ap-
pearance information. Motion information can include the spatial distance between
an object detected in one frame and the same object detected in the next, the velocity
of an object over several frames and the acceleration of an object over several frames.
Appearance information can include colour and intensity features such as edges and
corners.
2.5 Activity Recognition
This section describes a few previously developed methods which recognize certain
activities in a sequence of images.
The goal of activity recognition is to determine what each detected object is doing.
The most common class of methods used to recognize activity are those that track one
or more objects to determine their trajectories and then analyze these to ascertain
what these objects are doing. These methods may detect and track whole objects
such as a person or a car, or they may detect and track parts of an object such as
a person’s head or hands. The types of activities that these methods may recognize
are those that involve motion such as a person walking, a person pressing a button,
a car entering or leaving a parking lot, etc.
Another class of methods uses an object’s pose to determine what that object is
doing. Such methods may be used to recognize what an object is doing when it is
not moving. For example, these methods may be used to determine if a person is
standing, sitting, pointing, etc.
[21] recognizes human activity by using the motion of a person’s head. A person’s
head is tracked and the change in position of the head from one image of the
sequence to the next for each image in the sequence is the extracted feature
vector. Conditional probabilities are used to determine how likely a certain
activity is given the extracted feature.
[22] recognizes hand gestures by estimating hand motion and using a time-delay

16
neural network to classify this motion. Motion is estimated using motion fields
which then are used to segment each image into regions of similar motion. The
motion fields are computed using region matching across successive images.
[23] recognizes person to person interaction by analyzing for each image in the se-
quence the relative distance between two people, the rate of change of the
relative distance between the two people, and each person’s absolute velocity.
Matching is done using minimum absolute difference between the features of a
detected interaction and the training set of interactions.
[24] recognizes activity of a person by extracting the angles of the torso, upper and
lower legs as a feature vector and uses the nearest neighbor to classify the
feature vector. These angles are extracted using skeletonization of foreground
silhouettes.
[25] recognizes object activity by analyzing the shape, location and orientation of a
generalized cylinder created by the 2d projections of a moving object on to the
image plane for each image of the sequence. Here, the third dimension is time.
To compensate for the view point of the current action possibly being different
than the view point of the training set, epipolar lines and the fundamental
matrix are used to compare features.
Each of these methods was developed to recognize a specific, predetermined set
of activities. Most of these methods rely on the motion of certain body parts. Other
methods use the shape of the object.

Chapter 3
Camera Placement
This chapter presents several issues related to placing the camera in visual surveillance
applications.
The placement of the camera has a great influence on how well the surveillance
application performs. The methods used in the application should be taken into
account when deciding where to place the camera.
Placing the camera to observe an entrance to a room involves setting the values
of the following parameters.
dh : The perpendicular distance between the camera and the plane in which the door
to the lab lies.
dv : The perpendicular distance between the camera and the floor.
a : The camera view angle with respect to the vertical.
h : The horizontal, perpendicular distance between the camera and the plane per-
pendicular to the door which passes through the edge of the door nearest to the
camera.
b : The camera view angle with respect to the horizontal.
17

18
(a)
(b)
Figure 3.1: Diagram showing the position and angle of the camera with respect tothe door and floor of the scene from (a) side view, (b) directly above

19
Fig. 3.1 shows two diagrams which visually indicate the physical meaning of each
parameter.
There are a few factors which one must take into consideration when deciding how
to set up the camera to observe a scene.
1. Structure surrounding the scene.
2. Amount of irrelevant activity taking place within the view of the camera.
3. Effect on recognition rate.
4. Effect on person detection.
The structure surrounding the scene refers to the walls, ceiling and any large
fixed objects which are on the border of the open area where people will be passing
through. These must be considered when choosing a location for the camera because
the camera must be attached to something so that it has an unobstructed view of the
scene and it is stationary.
We would like to minimize the probability of irrelevant activity occurring within
the camera’s view because any images in which there is some motion will be stored on
a hard disk. Therefore, any irrelevant activity within the camera’s view will result in
wasted memory space. Since the purpose of this application is to detect any person
entering or leaving via the entrance under observation, any activity not related to
someone entering or leaving is considered irrelevant. A good place to put the camera,
in order to satisfy the above criterion, is in the room facing the entrance and not so
far from the entrance that most of the room is within the view of the camera. Fig.
3.2 (c) shows how placing the camera too far from the entrance may result in more
irrelevant activity occurring within the camera’s field of view.
The recognition rate of this system depends, among other things, on how much
information can be extracted from a person passing through the scene. A camera
that is placed very close to the door, (d ≈ 0) and is facing the door, see Fig. 3.2 (b),
will capture a small number of high resolution images of anyone passing through the

20
scene. A camera that is placed very far from the door (d À 0), see Fig. 3.2 (c), will
capture a large number of low resolution images of anyone passing through the scene.
Some situations may arise which require the off line determination of the identity of
a person who has entered the lab so each image of this person should clearly show his
face (taking for granted that his face is not covered up). This consideration eliminates
using a direct overhead view (a ≈ 0o), see Fig. 3.2 (d).
A situation which may occur in a scene being observed by a camera is there are
people in the scene who are directly between the camera and some other people in the
scene thus these people are not detected, see Fig. 3.2 (a). To reduce the frequency
of this situation occurring, f must be set as high as the first and third considerations
allow. Once f and d are set then a is set so that the top of the door to the lab is
approximately aligned with the top of the captured images. Fig. 3.2 (d) shows how
a camera that is placed directly above the scene and facing down greatly reduces
occlusions but also makes recognition more difficult.
If background subtraction is used for person detection then a rapidly changing
background such as a door opening and closing could prevent people from being
detected. The frequency of occurrence of this situation can be reduced by selecting
the position of the camera so that in the most common situations anyone passing
through the scene will not be directly between the door and the camera for most
of the time that they are in the scene. More specifically h and d should be set to
minimize the frequency of occurrence of this situation. Once h and d are set then b
is set so that the entire scene can be viewed from the camera.

21
(a) (b)
(c) (d)
Figure 3.2: (a) an image taken when the camera is close to the floor; (b) an imagetaken when the camera is very close to the door; (c) an image taken when the camerais too far from the door; (d) an image taken when the camera is above the scenelooking straight down

Chapter 4
Background Subtraction
This chapter discusses how to segment foreground objects from the background of
the image.
The foreground regions of an image are extracted by a pixel wise comparison
between this image and a background image. Any pixels which differ by more than a
threshold are labeled as foreground (white) pixels in a binary image. All other pixels
are labeled as background (black). The background model used is similar to that
used in [26] with the main difference being that each pixel will be modeled using only
one Gaussian distribution and the coefficient used to update the mean and variance
of the model is computed by comparing two consecutive images. Indeed observing
an indoor scene with good lighting conditions, stable background, and with moving
objects (people) of relatively important size does not necessitate the use of a more
complex background model such as the model presented in [26] with each pixel being
modeled using a mixture of Gaussian distributions. This method was chosen because
it yields good results for our scenario with minimum complexity.
4.1 Background Subtraction Algorithm
For the purpose of detecting motion and foreground segmentation the luminance of
each pixel is used because experiments have shown that the foreground was segmented
22
23
reasonably well using the luminance.
The following is a list of symbols and their descriptions representing values and
data used to perform foreground segmentation.
Yt : The luminance component of image t in the image sequence.
Mt : An image where each pixel represents the running average of the observed
intensity values at that pixel in each image of the sequence up to and including
image t.
Vt : An image where each pixel represents the variance of the observed intensity
values at that pixel in each image of the sequence up to and including image t.
At : An image where each pixel is used as a weighting factor when updating both
Mt and Vt. 0 ≤ At ≤ 1
abs(I) : Yields an image in which each pixel has a value equal to the absolute value
of the corresponding pixel in the image I.
Dt : An image where each pixel represents the absolute difference between Yt and
Mt−1.
Ncoef : The number of coefficients in the median filter applied to Dt.
Tt : An image where each pixel represents the threshold applied to the corresponding
pixel in Dt.
Bt : A binary image that represents the result of segmentation.
Ndile : The number of times morphological dilation and erosion are performed on Bt.
No : The number of foreground pixels in Bt.
Nc : The minimum number of foreground pixels in Bt required to perform person
detection.
24
Nm : The maximum number of foreground pixels in Bt permitted to perform person
detection.
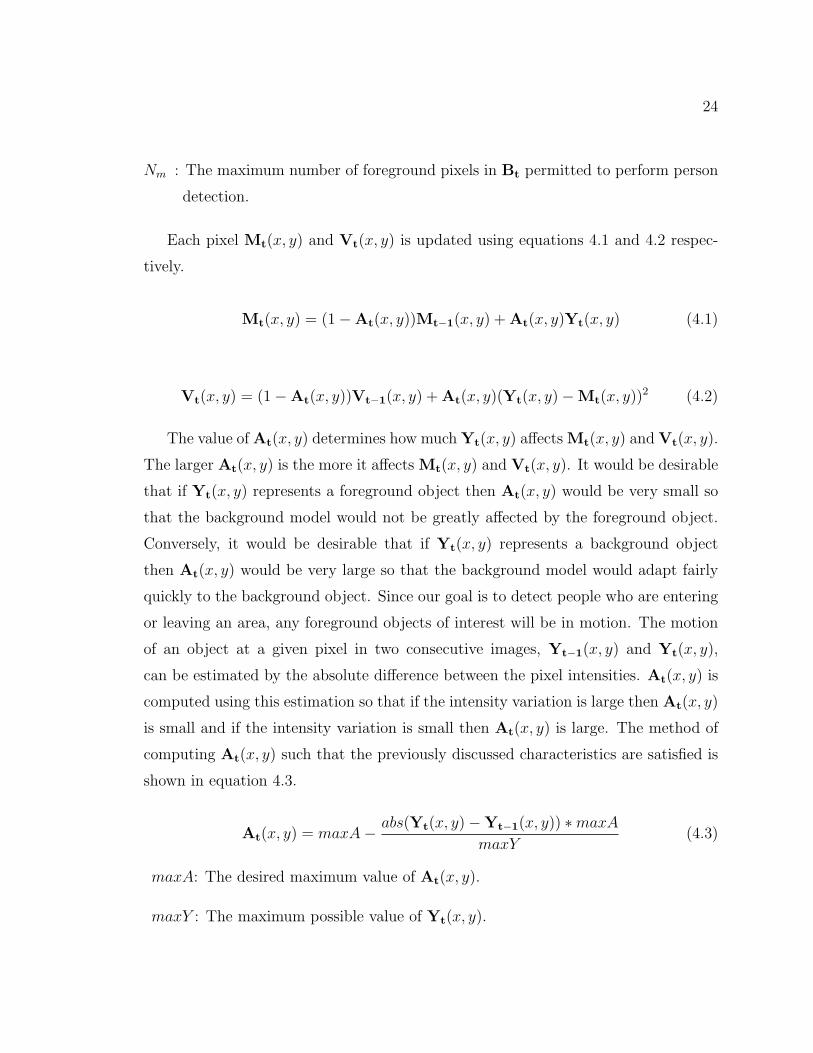
Each pixel Mt(x, y) and Vt(x, y) is updated using equations 4.1 and 4.2 respec-
tively.
Mt(x, y) = (1−At(x, y))Mt−1(x, y) + At(x, y)Yt(x, y) (4.1)
Vt(x, y) = (1−At(x, y))Vt−1(x, y) + At(x, y)(Yt(x, y)−Mt(x, y))2 (4.2)
The value of At(x, y) determines how much Yt(x, y) affects Mt(x, y) and Vt(x, y).
The larger At(x, y) is the more it affects Mt(x, y) and Vt(x, y). It would be desirable
that if Yt(x, y) represents a foreground object then At(x, y) would be very small so
that the background model would not be greatly affected by the foreground object.
Conversely, it would be desirable that if Yt(x, y) represents a background object
then At(x, y) would be very large so that the background model would adapt fairly
quickly to the background object. Since our goal is to detect people who are entering
or leaving an area, any foreground objects of interest will be in motion. The motion
of an object at a given pixel in two consecutive images, Yt−1(x, y) and Yt(x, y),
can be estimated by the absolute difference between the pixel intensities. At(x, y) is
computed using this estimation so that if the intensity variation is large then At(x, y)
is small and if the intensity variation is small then At(x, y) is large. The method of
computing At(x, y) such that the previously discussed characteristics are satisfied is
shown in equation 4.3.
At(x, y) = maxA− abs(Yt(x, y)−Yt−1(x, y)) ∗maxA
maxY(4.3)
maxA: The desired maximum value of At(x, y).
maxY : The maximum possible value of Yt(x, y).
25
From equation 4.3 it can be shown that if abs(Yt(x, y) − Yt−1(x, y)) ≈ maxY
then At(x, y) ≈ 0; also if abs(Yt(x, y)−Yt−1(x, y)) ≈ 0 then At(x, y) ≈ maxA.
Each pixel intensity, Yt(x, y), is compared to the background model via equation
4.4 and the corresponding pixel, Bt(x, y) is labeled either foreground or background,
1 or 0 respectively, by applying a threshold to Dt using equation 4.6.
Dt(x,y) = abs(Yt(x, y)−Mt−1(x, y)) (4.4)
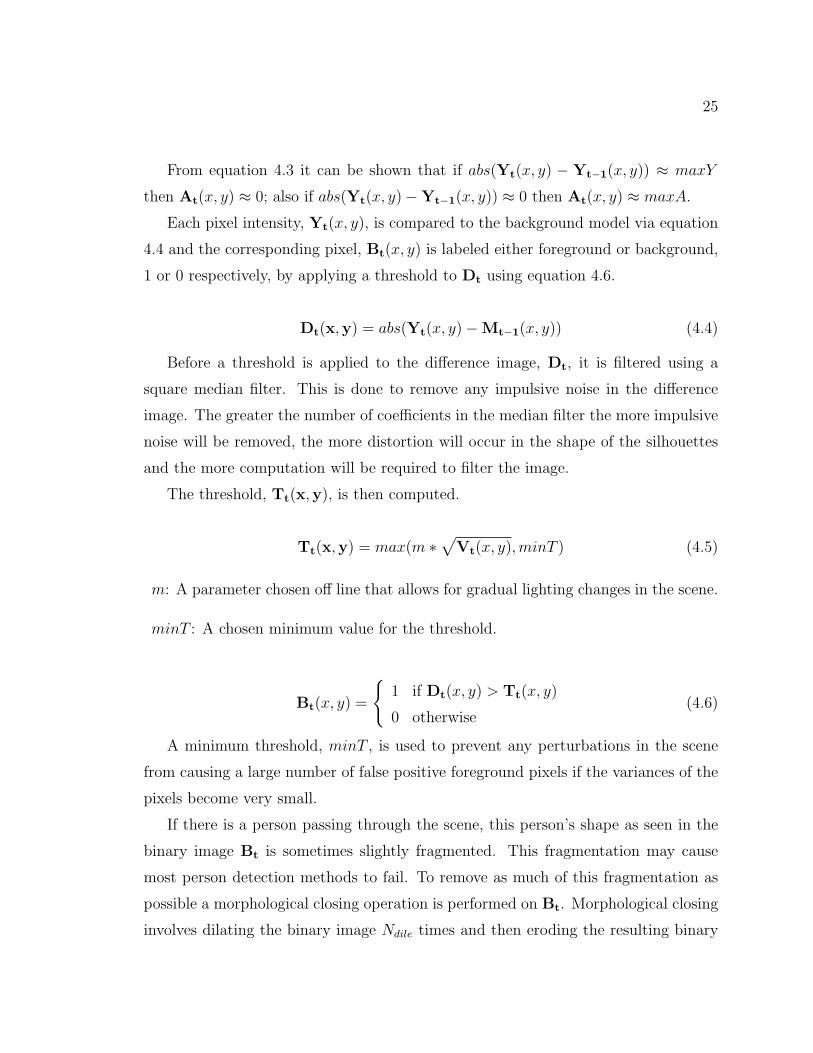
Before a threshold is applied to the difference image, Dt, it is filtered using a
square median filter. This is done to remove any impulsive noise in the difference
image. The greater the number of coefficients in the median filter the more impulsive
noise will be removed, the more distortion will occur in the shape of the silhouettes
and the more computation will be required to filter the image.
The threshold, Tt(x,y), is then computed.
Tt(x,y) = max(m ∗√
Vt(x, y),minT ) (4.5)
m: A parameter chosen off line that allows for gradual lighting changes in the scene.
minT : A chosen minimum value for the threshold.
Bt(x, y) =
{1 if Dt(x, y) > Tt(x, y)
0 otherwise(4.6)
A minimum threshold, minT , is used to prevent any perturbations in the scene
from causing a large number of false positive foreground pixels if the variances of the
pixels become very small.
If there is a person passing through the scene, this person’s shape as seen in the
binary image Bt is sometimes slightly fragmented. This fragmentation may cause
most person detection methods to fail. To remove as much of this fragmentation as
possible a morphological closing operation is performed on Bt. Morphological closing
involves dilating the binary image Ndile times and then eroding the resulting binary

26
(a) (b)
Figure 4.1: (a) an image of a person’s silhouette extracted without the use of eithermedian filtering or morphological operations; (b) an image of a person’s silhouetteextracted with the use of both median filtering and morphological operations
image the same number of times. The greater Ndile is the larger the gaps and holes
that will be filled in by the operation, the more distortion in the silhouette shape will
occur, and the more computations that will be required to perform the operation.
Fig. 4.1 and Fig. 4.2 show segmented images with and without the use of me-
dian filtering and morphological operations. These images show that median filtering
removes most of the false positive foreground regions and that morphological opera-
tions improve the shape of a person’s extracted silhouette. They also show that these
operations cause some small deviations from the proper shape of the silhouettes.
The number of pixels in Bt which have a value of one is counted to give No.
If No is greater than a predetermined constant, Nc, and less than a predetermined
constant, Nm, then there is enough activity in the scene that may be caused by a
person and there is not so much activity that further analysis will yield erroneous
results. If this condition is satisfied then person detection is performed. How Nc is
determined depends on a number of factors. Nc should be directly related to the
smallest expected image size of a person. This size depends on the smallest expected
actual size of a person, the furthest expected distance of the camera from a person
and the dimensions, in pixels, of the image. The main issue here is if Nc is too large
then significant activities will be missed; if Nc is too small then many insignificant

27
(a) (b)
Figure 4.2: (a) an image of a person’s silhouette extracted without the use of eithermedian filtering or morphological operations; (b) an image of a person’s silhouetteextracted with the use of both median filtering and morphological operations
activities will be unnecessarily analyzed. Conversely, Nm should be chosen to be small
enough to prevent unnecessary analysis of the foreground regions and large enough
to allow the analysis of meaningful foreground regions.
Many video cameras automatically adjust the image exposure time to the current
lighting conditions so when such a video camera is activated, the first few images
captured will initially be too bright and will darken gradually until the proper expo-
sure time is reached. This change in brightness will cause the background subtraction
method to yield erroneous results so when the system is first activated, the first few
captured images are discarded.
4.2 Segmentation Results
This section presents several images that were segmented using the method described
in this chapter.
For all segmentation results shown, the following are the values of each parameter
used.
maxA = 0.05
28
maxY = 255
m = 3
minT = 5
Ncoef = 25
Ndile = 5
Nc = 40
Nm = 50000
Sequences 1 and 2 in Appendix A show the segmented images of two people passing
through the scene under surveillance. As you can see, the silhouettes of each person,
formed using the segmentation method, fairly closely resembles the actual shape of
the person for most images in the sequence.
Any deviations in the shape of the silhouette from the actual shape of the person
may have many possible causes. A few such causes could be the similarity between
the colour of a part of a person and the colour of the background at the same position,
or the partial occlusion of a person by an object, or a door being opened behind a
person.
The similarity between the colour of part of a person and the colour of the back-
ground estimate at the same image position could have two causes. It could be caused
by coincidence that this part of the person is very similar in colour to the part of
the scene behind this person or it could be caused by the background adaptation
incorporating this person into the estimate of the background.
Some of these deviations appear as square holes in the silhouette. These holes are
due to the colour of the background object at these positions being very similar to
the colour of the foreground objects at the same positions. These holes are square
because the morphological operations applied to the silhouette after segmentation use
the eight point connectivity rule when erosion is applied. This type of erosion changes

29
(a) (b)
Figure 4.3: (a) an image of two people; (b) an image showing the result of segmenta-tion
a foreground pixel into a background pixel if it is adjacent to a background pixel. So
if there is a hole that is one pixel in size in a foreground region then a single erosion
operation will enlarge this hole making it a square that is three pixels wide. Further
application of erosion operations will enlarge this square.
Some foreground regions that do not correspond to a moving object are very
small when compared to the foreground regions that correspond to people. These
false positive foreground regions are caused by CCD sensor noise, or by shadows or
reflections of a moving object in the scene. Fig. 4.3 shows an example of the extracted
silhouette of a person whose shape is affected by false positive foreground regions.
These regions are so small that the shape of the silhouette still fairly closely resembles
the shape of the person.
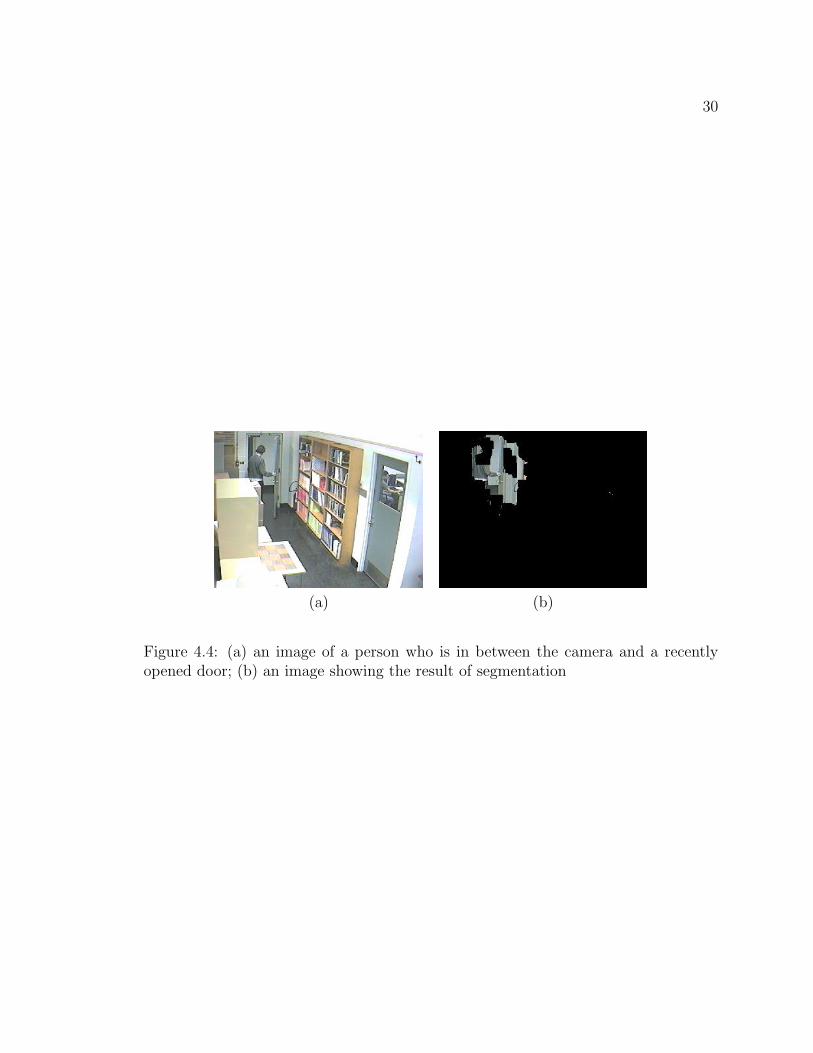
Large false positive foreground regions are caused by either a door being opened
or by a sudden extreme change in the illumination of the scene. Fig. 4.4 shows the
result of segmentation when a door has been opened. From this figure, we can see
that the foreground silhouette does not represent the shape of the person.
Two sequences of images that show people passing through the scene and the
corresponding extracted foreground regions can be found in appendix A.
30
(a) (b)
Figure 4.4: (a) an image of a person who is in between the camera and a recentlyopened door; (b) an image showing the result of segmentation
Chapter 5
Person Detection
Once the silhouettes have been formed they must be analyzed to determine if they
represent one or more people. The goal of person detection is to estimate the location
of each person in an image and what regions of the image correspond to each person.
This must be done because sometimes one silhouette represents multiple people or
sometimes a silhouette does not represent any people.
The part of a person’s body that undergoes the least amount of change in shape
and whose shape is most consistently and accurately represented by the silhouette
obtained by background subtraction is a person’s head. These characteristics make
detecting the shape of a person’s head in a silhouette relatively fast and easy when
compared to detecting the shape of other parts of a person’s body. It is for this reason
that we search for the shape of a person’s head in a silhouette to detect a person.
5.1 Detection Algorithm
We search for the head of each person in the scene by first locating all local vertical
peaks on the boundary of each silhouette using Quasi-Topological Codes in a similar
fashion to what was done in [9]. This method scans a binary image from left to right
using a rectangular, two element window with two rows and one column.
31

32
(u
l
)
The scan can be in one of six possible states after a location in the image has
been scanned. The state of the scan after a location has been scanned depends on the
previous state of the scan and the values of u and l at that location. The following
table shows what the next state of the scan will be for given values of u and l and
a given previous state. Each state and transition was chosen so that every possible
combination of the values u and l as well as every possible order in which these
combinations occur are accounted for, and there are no terminal states.
Inputs States/Output
u l 0 1 2 3 4 5
0 0 0 0/o 0 0 0 0
0 1 1 1 1 4 4 1
1 0 2 2/o 2 5 2 5
1 1 3 3 3 3 3 3
If the scan produces an output ’o’, then the location in the image in which this
output has been produced is a local vertical peak.
From each local peak found, the silhouette boundary is scanned in the left and
right directions recording the curvature using a square four element window.
p1 p2
p4 p3
c = p1 + 2p2 + 4p3 + 8p4 (5.1)
p1, p2, p3, p4 = 0 or 1
c : A value representing the curvature of the silhouette boundary at a given pixel.

33
Mconv : The minimum number of pixels on the silhouette boundary that have a
convex curvature for the silhouette to be considered as representing a person’s
head.
Mdrop : the minimum number of pixels on the silhouette boundary that have a vertical
orientation for the silhouette to be considered as representing a person’s head.
Mscan : the maximum number of scan iterations.
The value of c determines what the curvature of the boundary at a certain point
is. If tracing the silhouette boundary starting from the maximum point in the left and
right directions yields a convex curve and then a vertical drop, then this boundary
is likely to be the boundary of a head. A convex curve is achieved when c = 12
for a minimum number of scan iterations, Mconv. A vertical drop is achieved when
c = 9, or c = 11 for a minimum number of scan iterations, Mdrop. If either one of
these conditions is not satisfied before Mscan iterations in either direction have been
executed then the scan is stopped and the local peak probably does not represent a
person’s head.
Next, the width of each putative head is determined by recording the horizontal
coordinate of the pixel on the boundary of the head which is furthest left of the local
maximum point and the pixel on the boundary of the head which is furthest right of
the local maximum point.
The final criteria for determining if each putative head is in fact a person’s head
is that it must have a body under it. To determine this, a region is defined for each
putative head which is bounded horizontally by the extreme horizontal coordinates
of the boundary of the head found above, on top by the vertical coordinate of the
maximum point and on the bottom by the vertical coordinate of the top plus the
width of the head multiplied by some constant.
b : The Estimated vertical coordinate of the bottom of the torso.
my : The vertical coordinate of the peak of the putative head.

34
(a) (b)
Figure 5.1: (a) Segmented image of two people. (b) Image showing two people withthe region in which the percentage of pixels is computed to determine if a person isdetected
w : The estimated width of the putative head.
k : An approximate value of the ratio of the height of a person’s head above the
bottom of their torso to the width of their head.
Mbody : The minimum percentage of pixels in the torso region of the binary image
that are foreground required for this region to be considered a person.
b = my + k ∗ w (5.2)
Where my is the vertical coordinate of the maximum point, k is the expected
ratio of a person’s height to the width of his head, and w is the width of the head.
In this application we limit the height to the length from the top of the head to the
beginning of the legs. The possible head is considered above a body if this defined
region of the binary image has a percentage of pixels labeled as foreground that is
greater than a given value, Mbody. Fig. 5.1 shows a segmented image of two people in
the scene and an image in which the region defined above is indicated for each person
by black rectangles.

35
A person that is detected according to the above criteria may not be entering or
exiting the room. This person will likely not be considered to be entering or exiting
the room by the people tracking algorithm which takes into consideration how many
times the same person is detected and the location of this person each time they are
detected.
5.2 Person Detection Results
This section presents the results of performing the person detection method described
at the beginning of this chapter on the segmented images presented in chapter 4.
The results of person detection shown were generated using the following param-
eter values.
Mconv = 3
Mdrop = 3
Mscan = 20
k = 5
Mbody = 0.7
The sequences in Appendix B show the segmented images and the original images
with black rectangle indicating the people that have been detected.
The most important characteristic of these sequences is that every person who
passes through the scene under observation has been detected at least twice. Any
instance in which a person was not detected was due either to poor segmentation,
partial occlusion, or a door being open behind the person. When there were people
in the scene and they were not occluded by an opening or closing door or by another
person, then these people were detected 94.3 percent of the time. This value was
computed by looking at 240 images of at least one person in the scene and counting
how many times every person who satisfied the above criteria was not detected.

36
(a) (b)
Figure 5.2: (a) an image showing the silhouettes of two people; (b) an image showingneither person being detected
Fig. 5.2 shows how two people were not detected even though they were in the
scene. One person was not detected because the door was being opened resulting in an
extracted silhouette that does not represent the person’s head. The other person was
not detected because a large part of this person’s body was not labeled as foreground
and thus not enough pixels in the rectangle shown in Fig. 5.1.
Fig. 5.3 shows how two people were not detected even though they were in the
scene. One person was not detected because the shape of the extracted silhouette in
the region of this person’s head does not fit the criterion for head detection defined
in this chapter. The other person was not detected because shape of one side of
this person’s head was not accurately represented by the extracted silhouette. This
inaccuracy was caused by the other person in the image being in such a position
behind this person that part of this person’s head is between the camera and the
other person.
Some false detections did occur but they will not be mistaken as objects of interest
by the tracking algorithm due to their low frequency of occurrence and inconsistency
of the colour of the part of the scene contained within the corresponding black rectan-
gles. Two hundred forty images in which activity was occurring yielded thirteen false
positive detections. This means that false positive detections occur approximately

37
(a) (b)
Figure 5.3: (a) an image showing the silhouettes of two people; (b) an image showingneither person being detected
5.4 percent of the time.
Fig. 5.4 shows two false detections that occurred in an image. These were the
result of the shape of certain regions of the extracted silhouettes which, by chance,
fit the criteria defined in this chapter for the shape of a person’s head and body.

38
(a) (b)
Figure 5.4: (a) an image showing the silhouette of a person; (b) an image showingtwo false detections

Chapter 6
Person Recognition
In order to monitor the activities which occur in the room under observation, we
have to be able to recognize a person that passes in front of the camera. More
specifically our goal is to associate a sequence showing a person leaving the room
with the previously recorded sequence showing that same person entering the room.
To distinguish between different people we decided to use colour information extracted
from each person’s clothing. This will work well if the observed people wear a good
variety of clothing and if we expect that they will not change their clothing once inside
the room. Since this system monitors an area where people are passing through and
therefore are seen from different angles, we choose not to use skin or hair colours.
These attributes are more likely to be similar between different people and are more
difficult to reliably extract from different angles. Moreover clothing colour information
is generally radially invariant. In other words, the colour of one’s clothing tends to
stay the same whether it is viewed from the front or the back of a person. Facial
features are not used because a single camera which captures images at 320x240
resolution is used to monitor an area that is too large to get an image of a person’s
face with high enough resolution to successfully perform facial recognition.
39

40
6.1 Feature Extraction Algorithm
To extract colour information, a three dimensional histogram is used. We choose
to use a histogram because, as will be shown later, the histograms of the colours
extracted from people wearing different coloured clothing are clearly different whereas
histograms of the same person taken at different times are more similar to each other.
A three dimensional histogram is used because all psycho-visual experiments that
have been performed have concluded that each colour that the human visual system
can see can be composed by a linear combination of three primary colours. These
primary colours can be considered as the basis vectors of a vector space. This vector
space is commonly referred to as a colour space. For example, the most commonly
used colour space uses certain shades of red, green and blue as its primary colours.
Any colour in a colour space is represented by a three dimensional vector so as a vector
in one vector space can be transformed to a vector in another vector space, a colour
in one colour space can be converted to a colour in another colour space. The choice
of colour space depends on the purpose of representing colour in an application. In
this application where different colours must be distinguished from each other based
on human perception a perceptually uniform colour space is used.
Two of the primary colours used describe the chrominance, qu′ and qv′ , defined
by the CIE Uniform Chromaticity Scale and the third primary colour describes the
luminance defined by the y component of the CIE XYZ colour space.
Note that only pixels that are labeled as foreground and do not represent a part
of the person’s head will be added to the histogram.
y = 0.2127R + 0.7152G + 0.0722B (6.1)
x = 0.4125R + 0.3576G + 0.1804B (6.2)
z = 0.0193R + 0.1192G + 0.9502B (6.3)
41
qu′ =4x
x + 15y + 3z(6.4)
qv′ =9y
x + 15y + 3z(6.5)
R : The red component of a pixel’s colour from the Rec 709 Primaries.
G : The green component of a pixel’s colour from the Rec 709 Primaries.
B : The blue component of a pixel’s colour from the Rec 709 Primaries.
y : The y component of a pixel’s colour from the CIE XYZ colour space.
x : The x component of a pixel’s colour from the CIE XYZ colour space.
z : The z component of a pixel’s colour from the CIE XYZ colour space.
qv′ : A chrominance of a pixel’s colour from a perceptually uniform colour space.
qu′ : A chrominance of a pixel’s colour from a perceptually uniform colour space.
The chrominance defined above are perceptually uniform which means that two
colours which are at a fixed Euclidean distance from each other on the (qu′ , qv′) plane
will have the same relative perceptual difference to a human no matter where these
colours are located on the (qu′ , qv′) plane. This characteristic allows one to decide
numerically which pair of colours look more alike given several colours.
The luminance of a colour signal represents most of the energy in the colour
signal so it is more susceptible to lighting variations and shadow effects than the
chrominance. For this reason it is desirable to be able to quantize the luminance
more coarsely than the chrominance. This is why we convert the colour signal from
RGB to luminance and chrominance.
42
The domain of each dimension of the histogram is chosen to be the range of
the corresponding colour component. The number of bins and the bin boundaries
are chosen off line and are fixed. These parameters are fixed to make accumulating
colour information from several images of the same person in the image sequence into
a single histogram more efficient. The number of bins, in other words the coarseness
of quantization, for each dimension is chosen depending on how much computational
power is available. The higher the number of bins, the better the recognition results
and the more computational power required.
The alternative to this would be to make the histogram dimension range, bin
sizes and bin boundaries depend on the colour data being processed. For example the
range of the dimension representing the luminance will have an upper bound equal
to the maximum luminance value found in the image and the lower bound equal to
the minimum luminance value found in the image. The drawback to using such a
flexible histogram is that if a histogram is created from the data in one image then
it cannot be used to accumulate the data from any other images. Therefore it would
be inefficient to use a flexible colour histogram to accumulate the colour information
taken from several images of a person into a single histogram.
Another important factor in extracting the colour of a person’s clothing is from
what region in the image to extract the colour. This region should most likely be void
of any background, parts of other people, skin or hair. A simple region that satisfies
this criterion is a rectangular region below the person’s neck. Choosing to extract the
colour from this region greatly reduces the possibility of colours from other people in
the image being mixed with the colours extracted from the person of interest due to
overlap of body parts. The area of the head and neck of a person is approximated
by a rectangular region of width equal to that of the head and height proportional
to the width. Fig. 6.1 and Fig. 6.2 show the areas of the heads and necks, region
enclosed by the black squares, of several people. Fig. 6.3 shows the head regions and
the colour extraction regions of several people. The width and height of the head and
colour extraction regions are defined as follows:

43
head region width: width of the head.
head region height: twice the width of the head.
colour extraction region width: width of the head.
colour extraction region height: three times the width of the head.
To demonstrate how the colour histogram of a person is more similar to the colour
histogram of the same person taken at a different time than the colour histograms
taken from different people, Fig. 6.4 shows two images of the same person, one taken
from the front and the other taken from behind, and two images, each of a different
person taken from the front. Contour diagrams of the chromaticity dimensions of the
colour histograms extracted as described above are shown beside their corresponding
images. The two histograms taken from the same person are much more similar to
each other than those taken from the other people.
When a person passes through the scene this person is tracked and the luminance
and chrominance information discussed above is accumulated from every image of the
person as he passes through the scene into the colour histogram. The histogram is
then normalized so that each bin now contains the percentage of the total number
of pixels accumulated in the histogram. This procedure is performed for each person
passing through the scene resulting in a different histogram being created for each
person regardless of how many people are passing through the scene at any given time.
The method used to track each person is presented in chapter 7. In the cases when a
histogram extracted from a person does not represent the true colour of this person’s
clothing this histogram will likely not be added to the cumulative histogram because
of the tracking algorithm. The tracking algorithm has a criterion that the measure of
dissimilarity between a current histogram and a histogram extracted from a person
currently being tracked must be less than a given value for the current histogram to
be added to the cumulative histogram.

44
Figure 6.1: sample images showing 4 detected persons and their head regions

45
Figure 6.2: sample images showing 4 detected persons and their head regions

46
Figure 6.3: sample images showing 4 detected persons, their head regions and the colourextraction regions

47
Figure 6.4: Images of three different people and the corresponding contour diagrams ofthe two chrominance dimensions

48
6.2 People Matching Algorithm
To compare two histograms a measure of dissimilarity is computed using the Earth
Mover’s Distance, EMD, presented in [27]. For this measure, one of the histograms,
called the source histogram, is like several piles of earth on a field where each pile
represents a bin in the histogram, the mass of earth in each pile represents the value
of the histogram at the corresponding bin and the field represents the domain of each
dimension of the histogram. The other histogram, called the destination histogram is
like several holes in a field where a hole represents a bin in the histogram, the volume
of each hole represents the value of the histogram at the corresponding bin and the
field is the same as the field described for the source histogram. The EMD is the
minimum energy required to fill the holes in the field with the earth from the piles in
the field.
If a perceptually uniform colour space is used then the EMD is a true numerical
measure of the perceptual difference between two sets of colours. Since the EMD
also considers the distance between the bins in one histogram and those in the other
as well as the value of each bin, it is less prone to error due to noise than methods
that compare each bin in one histogram to only the corresponding bin in the other
histogram.
Computation of the EMD given two, three dimensional colour histograms, Hs and
Hd, proceeds as follows.
signature: represents a histogram as an array in which each element corresponds
to a bin in the histogram. Each element consists of the coordinates of the
corresponding bin and the value of the histogram at this bin.
Sx: signature that represents Hx.
iyxj: index of the y dimension in the j’th element of Sx.
iquxj : index of the qu dimension in the j’th element of Sx.
iqvxj: index of the qv dimension in the j’th element of Sx.
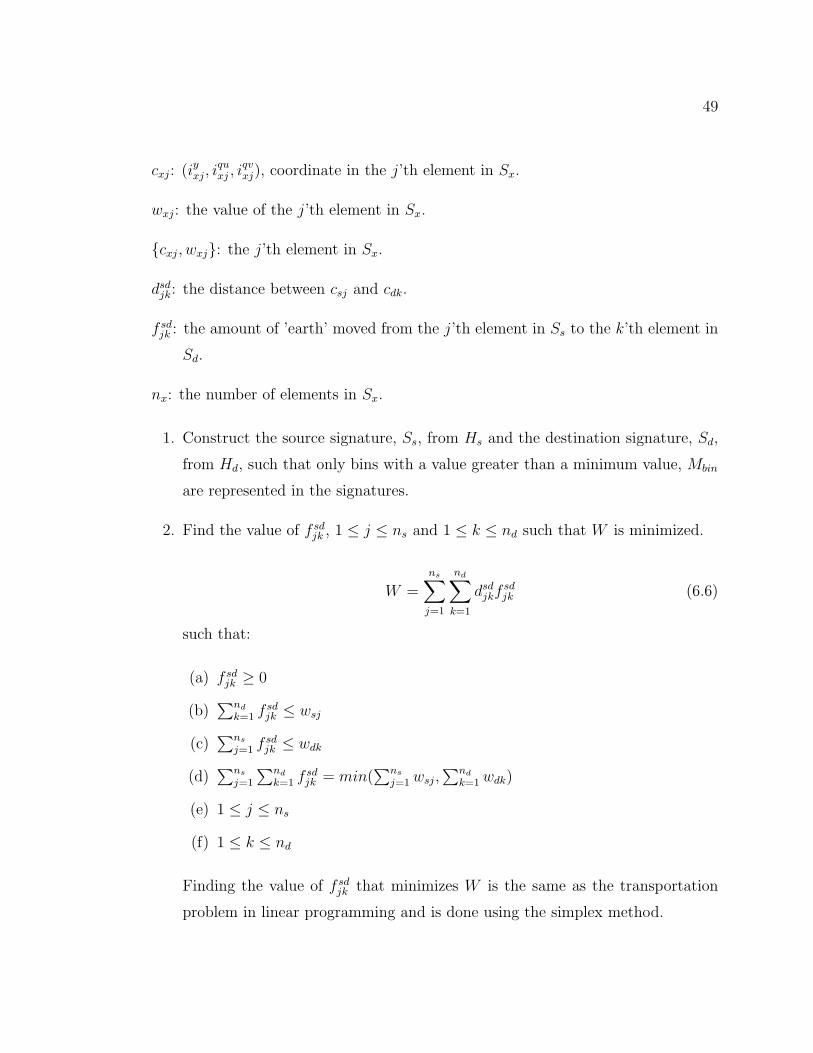
49
cxj: (iyxj, iquxj , i
qvxj), coordinate in the j’th element in Sx.
wxj: the value of the j’th element in Sx.
{cxj, wxj}: the j’th element in Sx.
dsdjk: the distance between csj and cdk.
f sdjk : the amount of ’earth’ moved from the j’th element in Ss to the k’th element in
Sd.
nx: the number of elements in Sx.
1. Construct the source signature, Ss, from Hs and the destination signature, Sd,
from Hd, such that only bins with a value greater than a minimum value, Mbin
are represented in the signatures.
2. Find the value of f sdjk , 1 ≤ j ≤ ns and 1 ≤ k ≤ nd such that W is minimized.
W =ns∑
j=1
nd∑
k=1
dsdjkf
sdjk (6.6)
such that:
(a) f sdjk ≥ 0
(b)∑nd
k=1 f sdjk ≤ wsj
(c)∑ns
j=1 f sdjk ≤ wdk
(d)∑ns
j=1
∑nd
k=1 f sdjk = min(
∑ns
j=1 wsj,∑nd
k=1 wdk)
(e) 1 ≤ j ≤ ns
(f) 1 ≤ k ≤ nd
Finding the value of f sdjk that minimizes W is the same as the transportation
problem in linear programming and is done using the simplex method.

50
3. The measure of dissimilarity, D, is found.
D =
∑ns
j=1
∑nd
k=1 dsdjkf
sdjk∑ns
j=1
∑nd
k=1 f sdjk
(6.7)
When several sequences of people passing through the seen are compared to a new
image sequence in this way, the two sequences which yield the lowest value for D are
considered the most likely to be the same person.
Person recognition is performed to find the correspondence between a person who
has just left the room and a person who was in the room immediately before the
person left the room.
6.3 Recognition Results
To measure the effectiveness of the recognition method we proceeded as follows:
1. Image sequences of twenty different people are captured. Two sequences are
captured for each person: one of the person entering the lab and one of the
person leaving the lab.
2. n out of the twenty people are randomly selected and these people are assumed
to be in the lab.
3. The matching technique is used to compare a person’s leaving sequence to each
entering sequence of the people in the lab before this person left. If the mini-
mum value of D is less than a threshold and is generated from comparing two
sequences of the same person then recognition is successful. Else the recognition
is unsuccessful and the leaving person cannot be found in the room.
4. Step 3 is repeated using a different person’s leaving sequence until each of the
n people has been the leaving person.

51
5. Steps 2 to 4 are repeated ensuring that a different set of n people are chosen
each time until each of the twenty people have been included in at least one of
these sets.
6. Steps 2 to 5 are repeated for each value of n ranging from two to twenty.
Recognition rate for each value of n, Rn, is then calculated.
Rn = N sn/N t
n (6.8)
N sn: The number times step 3 is performed for the same value of n and results in
a successful recognition.
N tn: The total number of times step 3 is performed for the same value of n and
results in either a successful recognition or not.
These results were generated using histograms with 16 bins for the two chromi-
nance dimensions, 8 bins for the luminance dimension and the value of Mbin equal to
0.1.
Fig. 6.5 shows a graph of recognition rate, Rn versus the number of people in the
lab, n. This graph shows that the average recognition rate is at least eighty percent.
Fig. 6.6 shows the values of D when each person’s leaving sequence and entering
sequence are compared to each other. Fig. 6.7 shows the average values of D when
each person’s leaving sequence is compared to every other person’s entering sequence.
These two figures demonstrate how comparing a person’s leaving sequence to every
other person’s entering sequence yields, on average, significantly higher values of D
than when a person’s leaving and entering sequence are compared to each other.
Fig. 6.8, Fig. 6.9 and Fig. 6.10 show sample images taken from sequences in
which a person is leaving the room (image 0 in each figure) and sample images taken
from sequences in which a person is entering the room (images 1 - 4 in each figure)
along with the corresponding measure of dissimilarity. For example, in Fig. 6.8 the
measure of dissimilarity between sequence 0 and sequence 1 is 0.87, the measure of
dissimilarity between sequence 0 and sequence 2 is 0.85, and so on. Each histogram
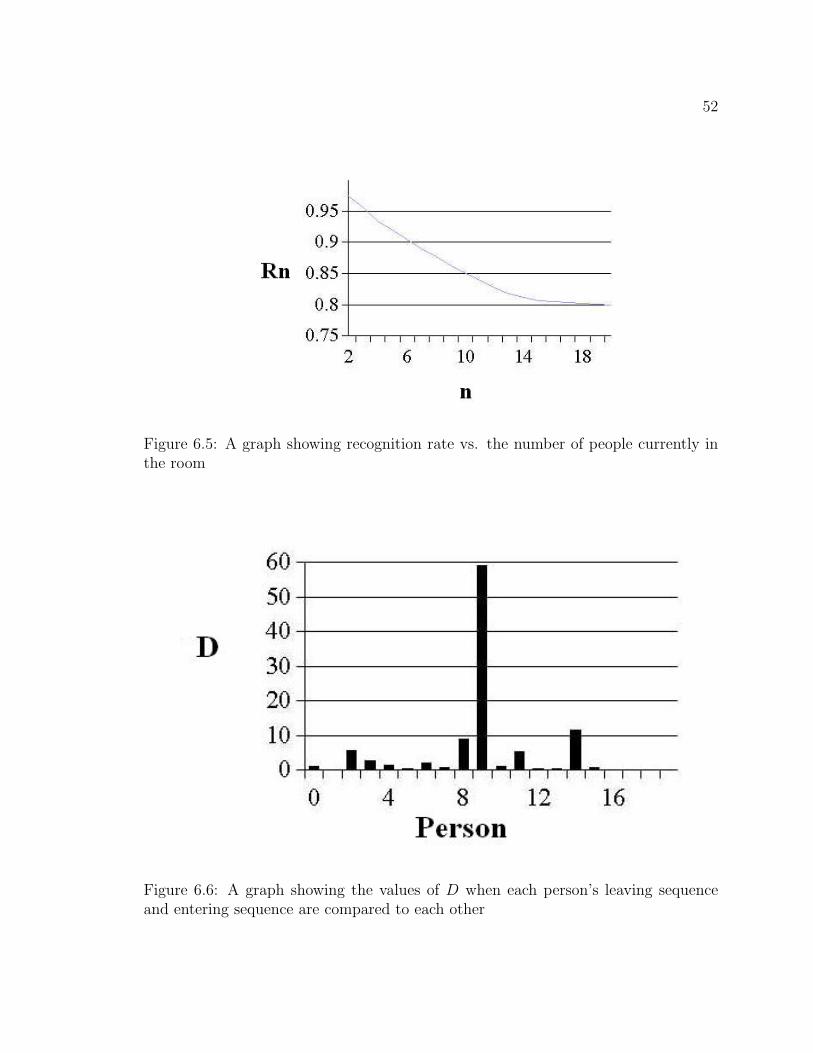
52
Figure 6.5: A graph showing recognition rate vs. the number of people currently inthe room
Figure 6.6: A graph showing the values of D when each person’s leaving sequenceand entering sequence are compared to each other
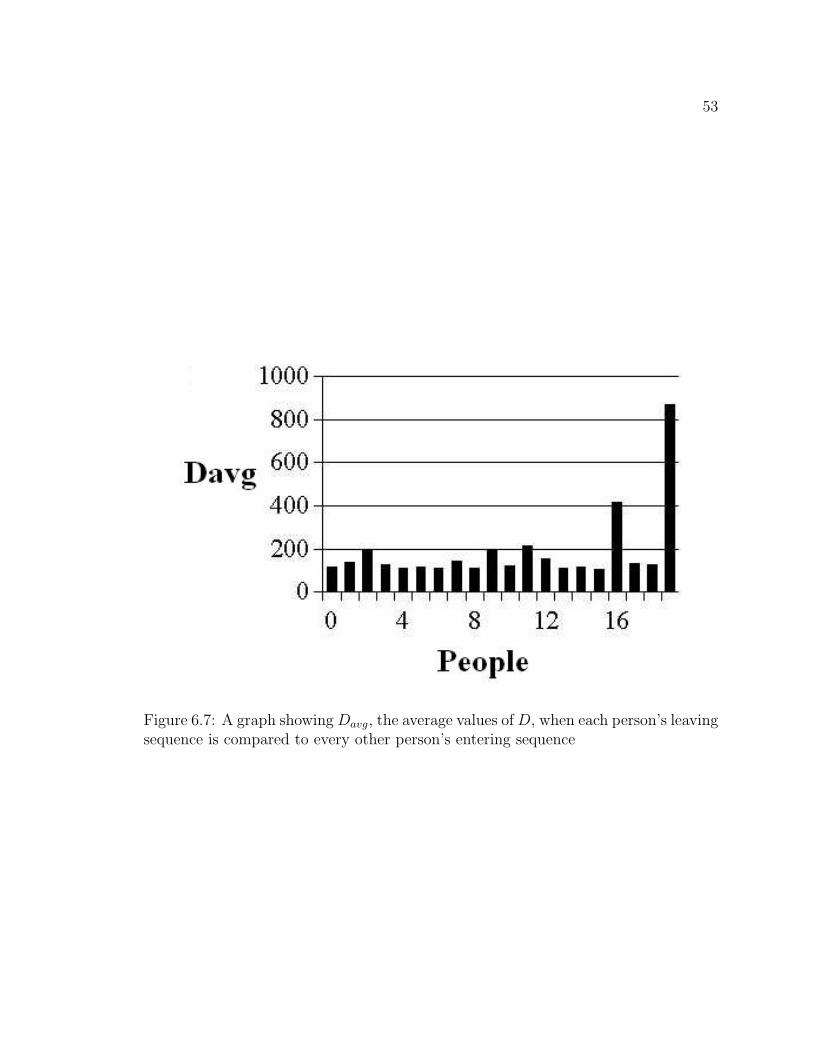
53
Figure 6.7: A graph showing Davg, the average values of D, when each person’s leavingsequence is compared to every other person’s entering sequence

54
that was used to compute the measure of dissimilarity was accumulated from each
image of the person in a sequence. For example if a person was detected in five
images while entering the room then the histogram used to recognize this person is
accumulated from each of the five images of this person.
From these figures you can see that the lowest values of D occur when comparing
a person’s leaving sequence with that same person’s entering sequence most of the
time. The exception being in Fig. 6.8, for sequences 0 and 2 which yield a lower value
than that yielded by sequences 0 and 1 which contain the same person. This failed
recognition is due to the similarity of clothing between the two people.
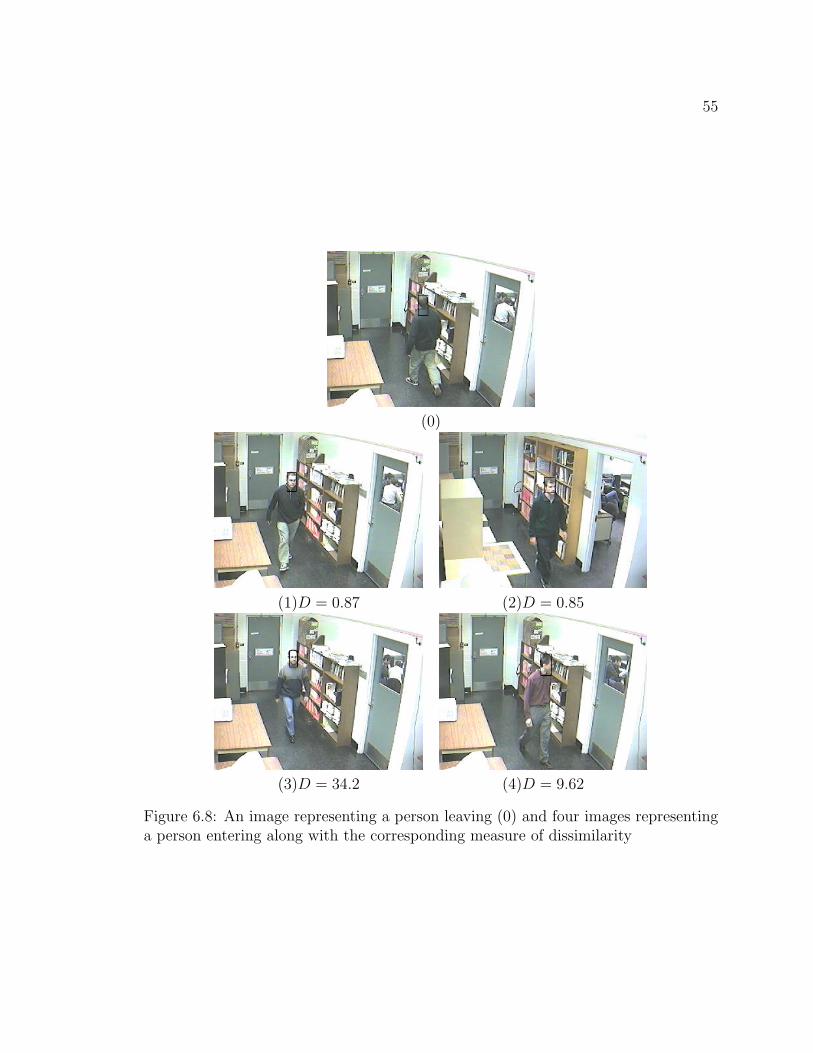
55
(0)
(1)D = 0.87 (2)D = 0.85
(3)D = 34.2 (4)D = 9.62
Figure 6.8: An image representing a person leaving (0) and four images representinga person entering along with the corresponding measure of dissimilarity

56
(0)
(1)D = 5.75 (2)D = 10.4
(3)D = 67.7 (4)D = 115.14
Figure 6.9: An image representing a person leaving (0) and four images representinga person entering along with the corresponding measure of dissimilarity

57
(0)
(1)D = 1 (2)D = 211.96
(3)D = 34.88 (4)D = 27.75
Figure 6.10: An image representing a person leaving (0) and four images representinga person entering along with the corresponding measure of dissimilarity

Chapter 7
Person Tracking
When monitoring the entrance of a room we need to determine whether any detected
person has entered or left the room. To do this each person who is detected in the
scene under observation must be tracked to find from which direction this person
entered the scene and which direction this person left the scene. For example, if a
person entered the scene from the direction of the door and left the scene in the
direction of the room then this person most likely entered the room. We track a
person by using the colour of their clothing, in a similar way as was described in
chapter 6, to determine if this person is the same person that was detected in recent
frames of the sequence. After this person has left the scene, the frame indices of when
this person was detected and the person’s position in each of these frames are used
to determine if this person has entered or left the room. The position of a person
detected in previous images is not used because the system operates at such a low
frame rate, two frames per second. When the frame rate is very low the number
of times a person is detected is usually too small to be able to accurately estimate
a person’s velocity or acceleration due to errors in the measurement of the position
of a person. Also the acceleration of a person can change significantly resulting in
significant errors in an estimate of a person’s velocity or acceleration.
58
59
7.1 Tracking Algorithm
For each frame of the sequence, the tracking information of each person currently
being tracked is updated according to the results of person detection on the current
frame and the results of people matching between people detected in the current
frame and those currently being tracked.
Dt: The measure of dissimilarity computed using the EMD between the colour
histogram extracted from an image of a person detected in the current image
and the colour histogram extracted from the last image of a person currently
being tracked. The colour space and number of histogram bins used are the
same as was used for person recognition.
Mt: The maximum value of Dt for which the two people being compared can be
considered the same person.
When people are detected and no one is currently being tracked then these de-
tected people have probably just entered the scene and a track is initiated for each
person detected.
When people are detected in the current frame and at least one person is currently
being tracked then Dt is computed between each person detected and each person
currently being tracked. All detected/tracked pairs for which Dt is greater than Mt
are removed from contention as possible matches. Then each person currently being
tracked is updated with the info from a person detected in the current frame if the
value of Dt for this pair is smaller than that of any other pair involving either of these
two people. If any person that is detected in the current frame does not get matched
with any person currently being tracked then this person has probably just entered
the scene and a track is initiated for this person. If a person who is currently being
tracked and has not been matched to a person that has been detected in at least one
of N consecutive frames since they were last detected then this person has probably
left the scene and a decision is made on whether this person has entered or left the
room based on their tracking information.

60
Tracking information for each person includes their position, the index of the
frame in which they were detected and their extracted colour histogram. The centre
of the colour extraction region of a person is used as that person’s position. Tracking
information is updated by adding the position of the person detected in the current
frame and the current frame index to the tracking information. Also the previous
colour histogram extracted from the person currently being tracked is replaced by
the colour histogram extracted from the current image of the person.
7.2 Entered or Exited the Room
Once a person has left the scene a decision must be made as to whether this person
has entered or exited the room. This is done using this person’s tracking information
described in the previous section.
In order for successfully determine whether someone has entered or exited the
room the camera should be placed such that the image position of a person standing
in the doorway is different than that of a person standing further in the room.
If the relative positions between the image pixel coordinates representing an area
of the scene near the door and those furthest in the room are known then a person’s
displacement, the difference between the coordinate of the person when they were last
detected and that of when they were first detected, can be used to determine whether
this person entered or exited the room. This is done by converting the displacement
vector into polar coordinates and assigning one set of angles to people entering and
the supplementary set of angles to people exiting.
Choosing which set of angles corresponds to which activity depends on how the
camera is placed and is determined experimentally.

61
7.3 Tracking Results
This section presents the results of tracking two people in an image sequence using
the method described in this chapter.
All parameters pertaining to person matching used to generate these results are
the same as those used for generating person recognition results.
Two sequences in appendix C show two people passing through the scene. Each
person detected in the current image is compared to each person detected in the
previous image using the method presented in chapter 6. For example, the top two
images in sequence 1 show two people. The person indicated by the red rectangle
and the letter ’B’ in the lower image is compared to
1. the person indicated by the red rectangle and the letter ’B’ in the upper image
yielding DBB = 1.23.
2. the person indicated by the blue rectangle and the letter ’A’ in the upper image
yielding DBA = 59.21.
Similarly the person indicated by the blue rectangle and the letter ’A’ in the lower
image is compared to
1. the person indicated by the red rectangle and the letter ’B’ in the upper image
yielding DAB = 47.83.
2. the person indicated by the blue rectangle and the letter ’A’ in the left hand
image yielding DAA = 2.9.
Tracking is successful when either DBB or DAA is less than DBA and DAB and
both DBB and DAA are less than Mt. The red rectangle and the letter ’B’ always
correspond to the same person in a sequence; likewise for the blue rectangle and the
letter ’A’.
Fig. 7.1 shows two consecutive images, the top image being the previous frame and
the bottom image being the current frame, in which tracking is lost for one person.

62
DBB = 84.85 DBA = 40.31 DAB = 27.56 DAA = 3.82
Figure 7.1: Two images in which one of the people in the scene was not tracked
Figure 7.2: The next image in the sequence after that of the lower image shown Fig.7.1

63
If Mt is set equal to 10 then tracking for one person is lost for one frame. This
value of Mt was determined experimentally and was found to minimize the number
of false matches while minimizing the number of true matches that are removed due
to this threshold. At the beginning of the sequence there were two active tracks.
The tracking loss occurred in the lower frame shown Fig. 7.1. Person ’A’ is properly
tracked in both frames. Person ’B’, however, was not tracked properly because the
value of DBB between the two images in Fig. 7.1 was greater than Mt. When this
occurred a new track was initiated using the information extracted from the image
of person ’B’ in the lower frame. There were three active tracks after this occurred.
Then the two people detected in the next frame, shown in Fig. 7.2, were compared
to each of the three active tracks with the results being as follows:
DAA = 4.16: Result of the comparison between the image of person ’A’ in the lower
image shown in Fig. 7.1 and that of person ’A’ in the image shown in Fig. 7.2.
DAB1 = 40.58: Result of the comparison between the image of person ’A’ in the
image shown in Fig. 7.2 and that of person ’B’ in the upper image shown in
Fig. 7.1.
DAB2 = 53.48: Result of the comparison between the image of person ’A’ in the
image shown in Fig. 7.2 and that of person ’B’ in the lower image shown in
Fig. 7.1.
DBA = 30.95: Result of the comparison between the image of person ’B’ in the
image shown in Fig. 7.2 and that of person ’A’ in the lower image shown in
Fig. 7.1.
DBB1 = 1.35: Result of the comparison between the image of person ’B’ in the image
shown in Fig. 7.2 and that of person ’B’ in the upper image shown in Fig. 7.1.
DBB2 = 94.25: Result of the comparison between the image of person ’B’ in the
image shown in Fig. 7.2 and that of person ’B’ in the lower image shown in
Fig. 7.1.

64
The track of person ’B’ created from the lower frame of Fig. 7.1 was not continued
because DBB2 was greater than Mt. It turned out that this track was terminated N
frames after the frame shown as the lower image in Fig. 7.1 because no detected
person was matched to this track in any of these frames. The original track of person
’B’ created from the first frame in sequence 1 of appendix C was continued because
DBB1 was less than Mt and less than DAB1. It turned out that this track was continued
throughout the the rest of sequence 1 of appendix C.
The loss of tracking was caused by a person quickly changing the direction he was
facing and thus the part of his clothing that was different in colour from that of the
previous image was in the colour extraction region.
Sequence 3 in appendix C shows three people walking through the scene and Fig.
7.3 shows three images, each of which shows the path of each of the three people
extracted from this sequence. This figure shows that each person in the scene was
tracked in the presence of occlusions and the path that each person took was fairly
accurately determined.

65
Figure 7.3: Three images each of which show the paths of each of the three peopleshown in sequence 3 of appendix C

Chapter 8
Discussion
8.1 Results
The effectiveness of the motion segmentation and person detection method is shown
in sequences 1, 2, 3 and 4. The foreground segmentation method is effective at
segmenting a person’s head and body from the cluttered background. As can be seen
in sequences 1 and 2, the lower region of the silhouette does not represent the shape
of the person as closely as the upper region does. But this does not significantly
hinder the effectiveness of the person detection method because only features taken
from the upper part of the silhouette are used.
The method used to determine whether a silhouette represents a person or not uses
a few assumptions: the top edge of the silhouette of a person’s head is horizontal at
its highest point and then curves downwards to become nearly vertical on both sides,
people do not wear anything on their head which would cause the silhouette of their
head to deviate significantly from the normal shape, and everyone is upright when
they pass through the scene. The assumption about the shape of a person’s head is
not very stringent which minimizes the probability of false negatives. This was done to
avoid using any computationally expensive pattern recognition techniques. A problem
with this is that false positives can occur because of objects moving in the scene whose
shape satisfies the first assumption or because of badly formed silhouettes. The first
66
67
problem can only be solved using a more stringent assumption but then false negatives
will occur more frequently. The effect of the second problem is negligible because it
is usually caused by any combination of noise, shadows or reflections which rarely
repeat in consecutive images so they are not likely to cause a false positive tracking.
From Fig. 6.5, the person recognition method described in section 6.2 is very
effective when there are only a few people in the lab and the recognition rate decreases
as the number of people in the lab increases. This is expected because even if no
recognition is used, the probability of finding a correct match by guessing decreases
as the number of people in the lab increases and the more people there are the more
likely it is for two or more people to be wearing clothing with very similar colours.
Since the colour of a person’s clothing, as seen from the camera, depends on the
light reflecting off it, the colour of light in the scene must not change significantly
between the time someone enters the room and when they leave for the person to be
recognized. As can be seen in sequences 1 - 6, the lighting near the entrance to the
lab remains approximately the same in all images of the scene.
Sequences 5 and 6 are two examples of the system tracking two people who are
passing through the scene. As was mentioned in section 7.1, tracking is done by using
colour. Spatial information such as position and velocity could also be used but this
information becomes obsolete when there is too much time between two consecutive
instances in which the same person is detected. The reason for this is that a person
can change the direction in which he is moving within this time thus any predictions
of the next position of a person made using position, velocity and acceleration are not
going to be accurate. The minimum time between two consecutive instances in which
the same person is detected is equal to the frame period and their is no maximum time
because it is possible that a person may go several frames without being detected.

68
8.2 Thesis Contributions
This thesis has made contributions in two areas, image segmentation and people
matching, and has resulted in two publications [34] [35].
To segment images into foreground and background, the background model is
updated using an adaptive coefficient for each pixel in the image. This coefficient
adapts to the amount of variation in pixel intensity across a set of images in the
sequence. This results in the background model adapting more quickly to any changes
in the actual background.
To match people in a sequence of images clothing colour is used as the distin-
guishing characteristic, clothing colour is extracted using histograms defined on a
luminance and perceptually uniform chrominance space and the Earth Mover’s Dis-
tance [27] is used as a measure of dissimilarity between histograms. People matching
is used to track people as they pass through the scene and to recognize people who
have previously been in the scene. A person is tracked by matching each person de-
tected in an image with the proper person that was detected in previous images. A
person is recognized by accumulating the clothing colour extracted from each image
of a person as they pass through the scene into a histogram and using it to match the
sequence in which this person entered the room with the proper sequence in which
this person exited the room.
These algorithms, along with one that detects people in binary images, were de-
signed and implemented to run in real time at two frames per second on an Intel
Pentium 2 processor running at 266 MHz with an image resolution of 320×240. This
implementation was tested using image sequences of the entrance to the V.I.V.A.
laboratory.
8.3 Future Work
As with any system, this system can be improved upon if more resources are used. By
adding more processing power, either by using a faster processor, or by using more

69
processors, or both, this system can be made more flexible so that it can be used in a
wider variety of environments. As was previously mentioned, this can be done by using
a more complex foreground segmentation method which detects shadows. Foreground
segmentation can also be improved by detecting reflections. More complex models
of the background which take into consideration any rapidly changing regions of
the background can be used. Thus the door opening will not prevent anyone from
being detected. With additional processing power the image capture period can
be reduced which would improve the effectiveness of the recognition and tracking
methods. Another resource one can add to the system is an additional camera. If
placed in the right position, an additional camera could reduce or even eliminate the
possibility of occlusions and increase the recognition rate.
The focus of future work will be on improving the recognition method. One
way to improve recognition may be to isolate the lower and upper garments which
a person wears. To do this, the location of the bottom of the upper garment (the
shirt for example) and the top of the lower garment (pants for example) must be
determined. Determining this location may be done using colours and textures as well
as the locations of these colours and textures. This would improve person recognition
because spatial information related to the location of colours on a person’s clothing
is being used so a person wearing a blue shirt and black pants will be distinguished
from a person wearing a black shirt and blue pants.

Appendix A
Sequences Showing Segmentation
Results
70

71
Sequence 1
0 0
1 1
2 2
3 3

72
4 4
5 5
6 6
7 7
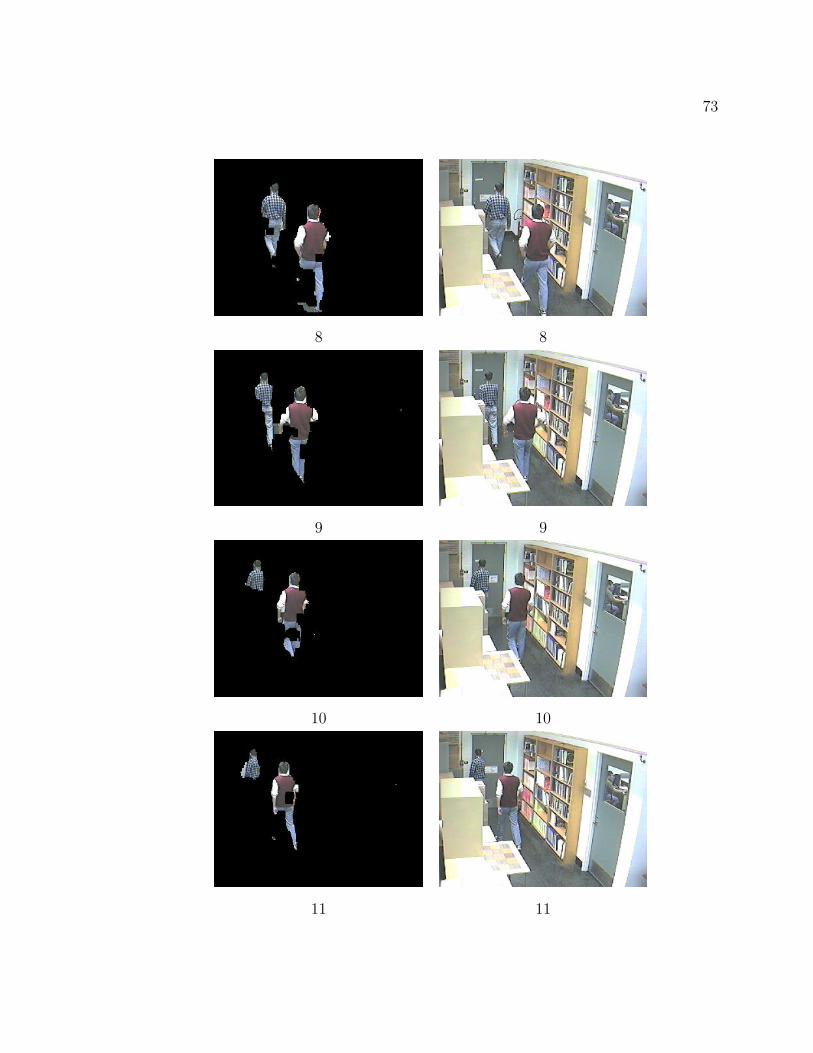
73
8 8
9 9
10 10
11 11
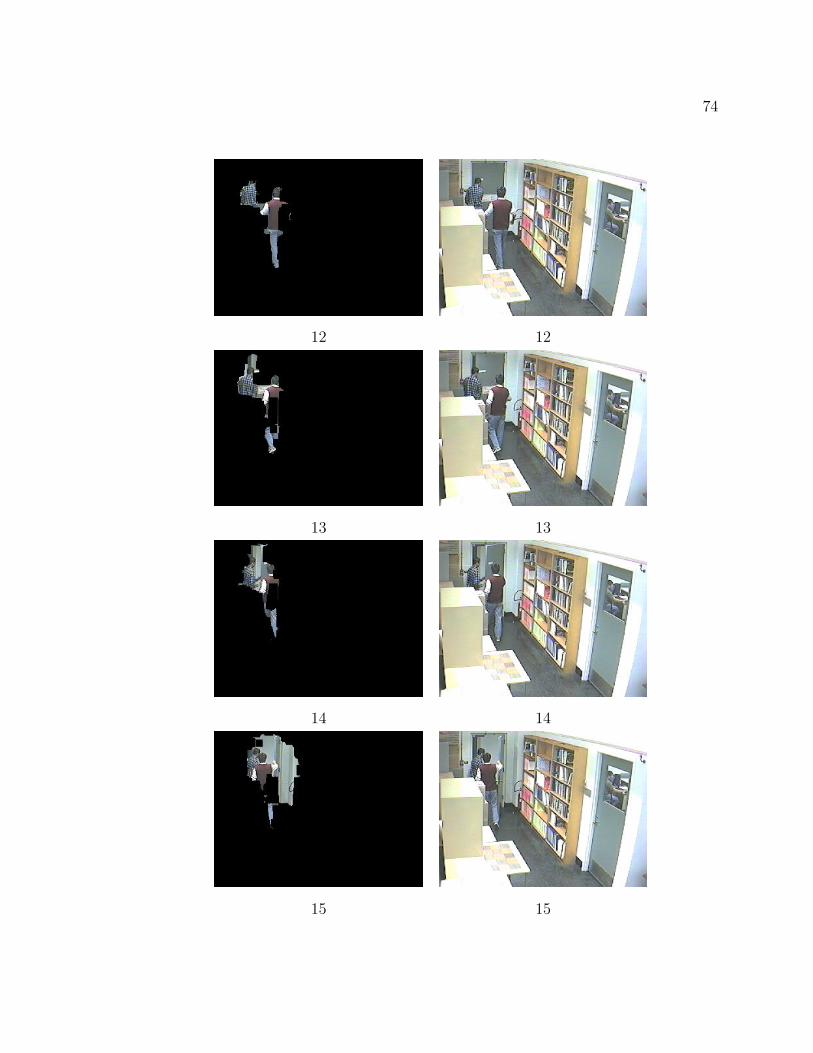
74
12 12
13 13
14 14
15 15
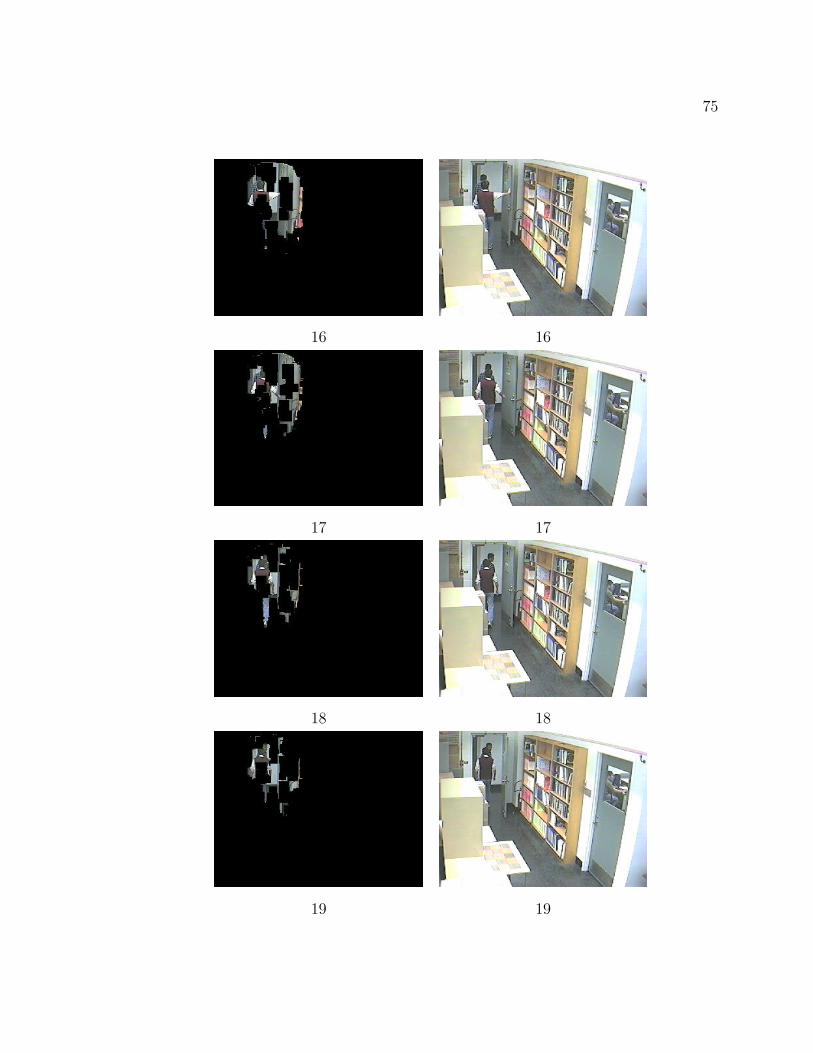
75
16 16
17 17
18 18
19 19

76
20 20
21 21
22 22
23 23
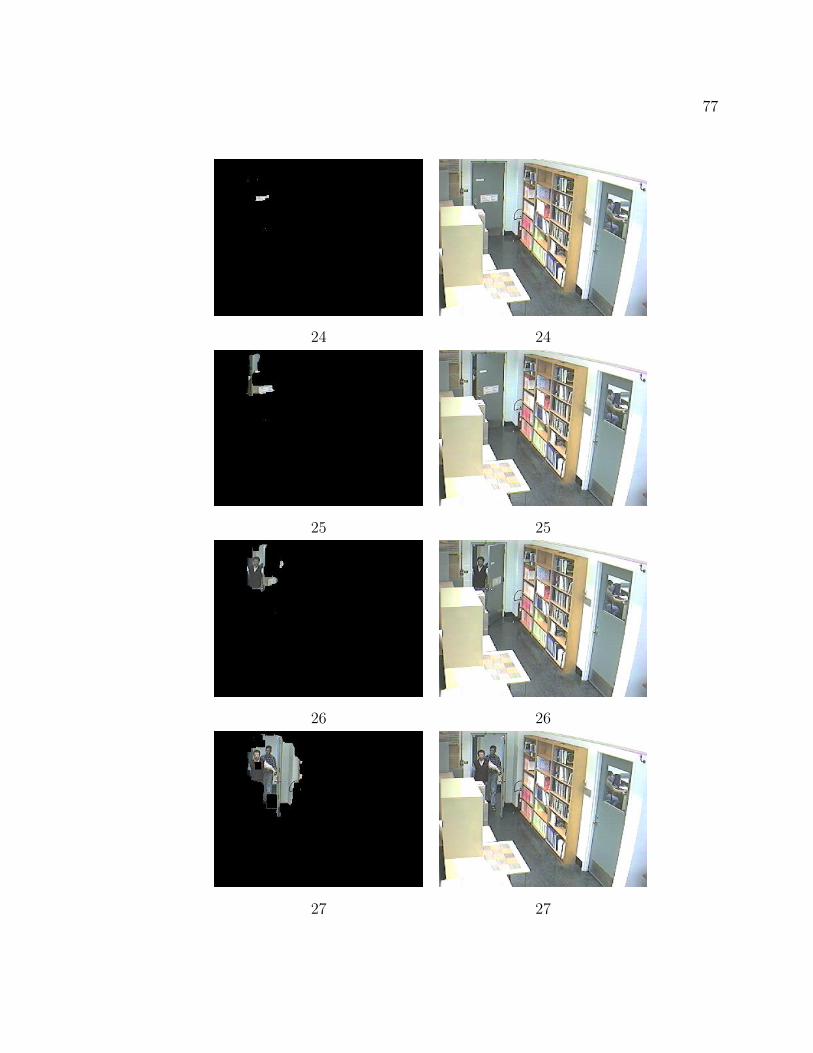
77
24 24
25 25
26 26
27 27
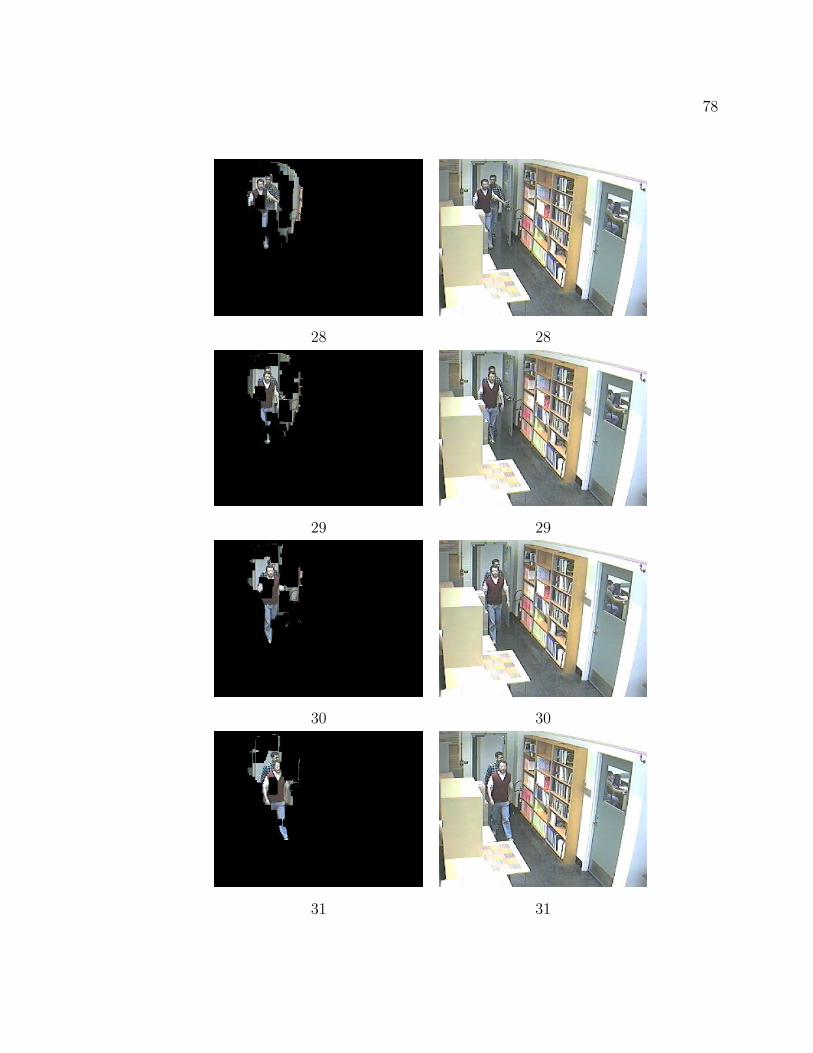
78
28 28
29 29
30 30
31 31
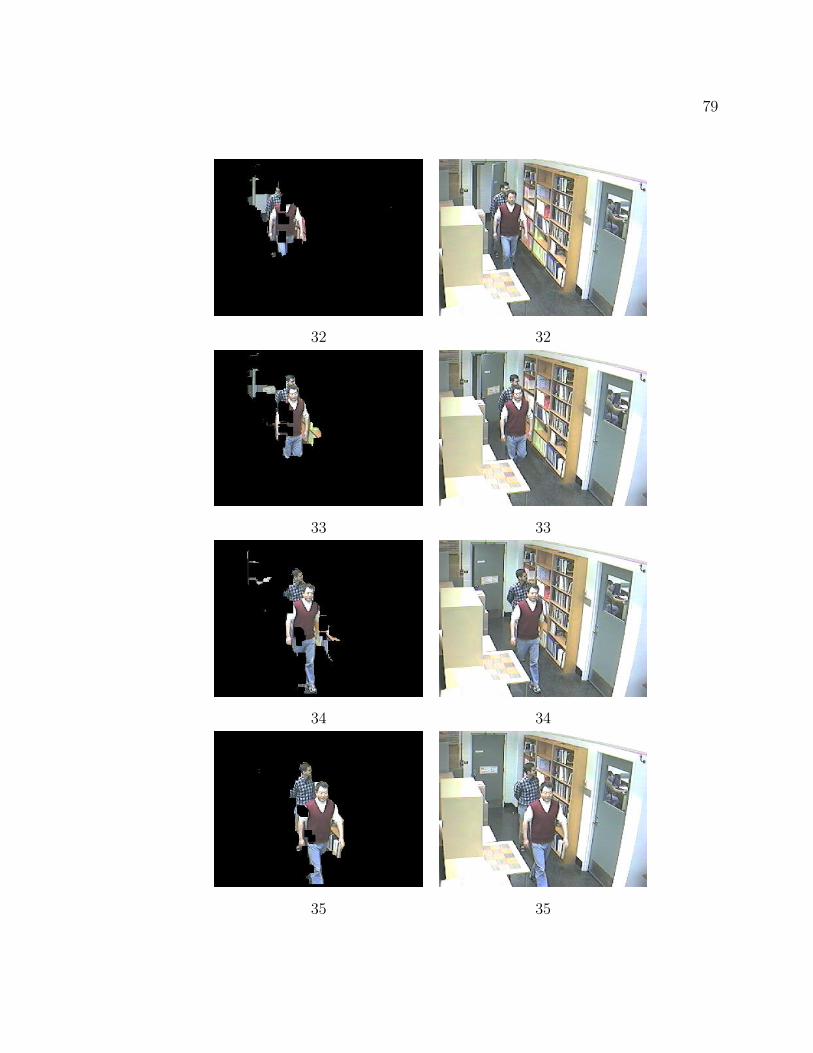
79
32 32
33 33
34 34
35 35
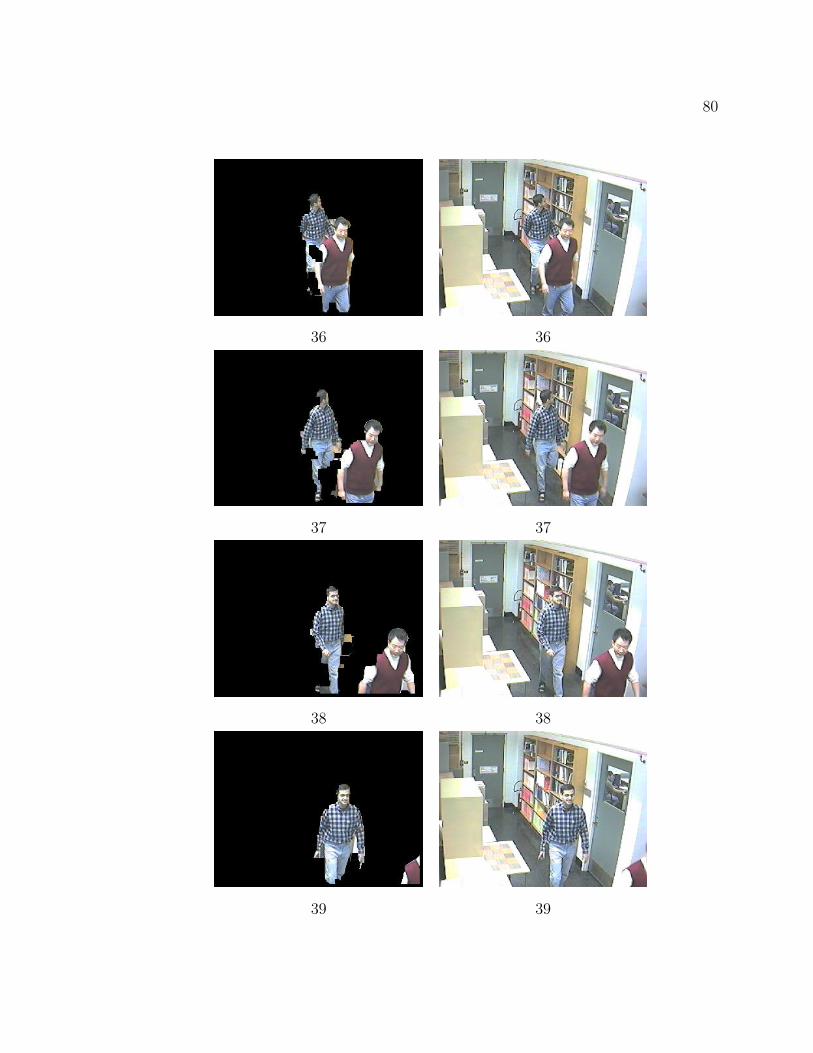
80
36 36
37 37
38 38
39 39

81
40 40
41 41
42 42
43 43

82
44 44

83
Sequence 2
0 0
1 1
2 2
3 3
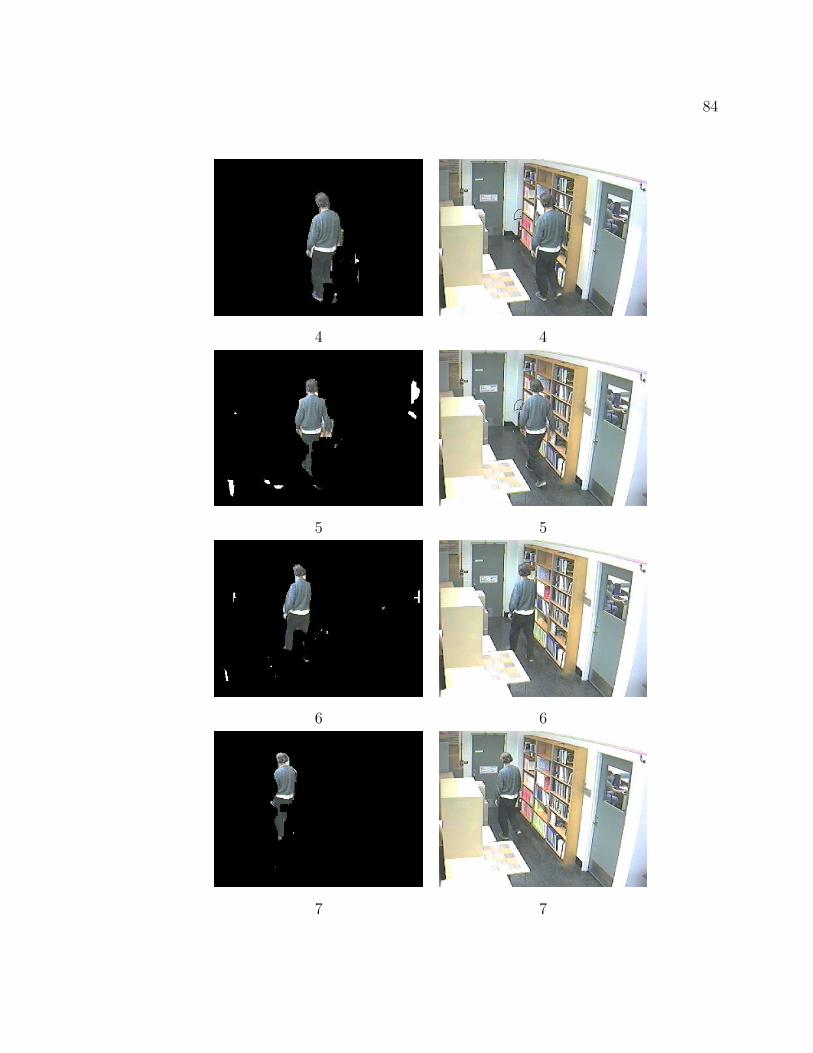
84
4 4
5 5
6 6
7 7

85
8 8
9 9
10 10
11 11

86
12 12
13 13
14 14
15 15

87
16 16
17 17
18 18
19 19

88
20 20
21 21
22 22
23 23

89
24 24
25 25
26 26
27 27

90
28 28
29 29
30 30
31 31

91
32 32
33 33
34 34
35 35
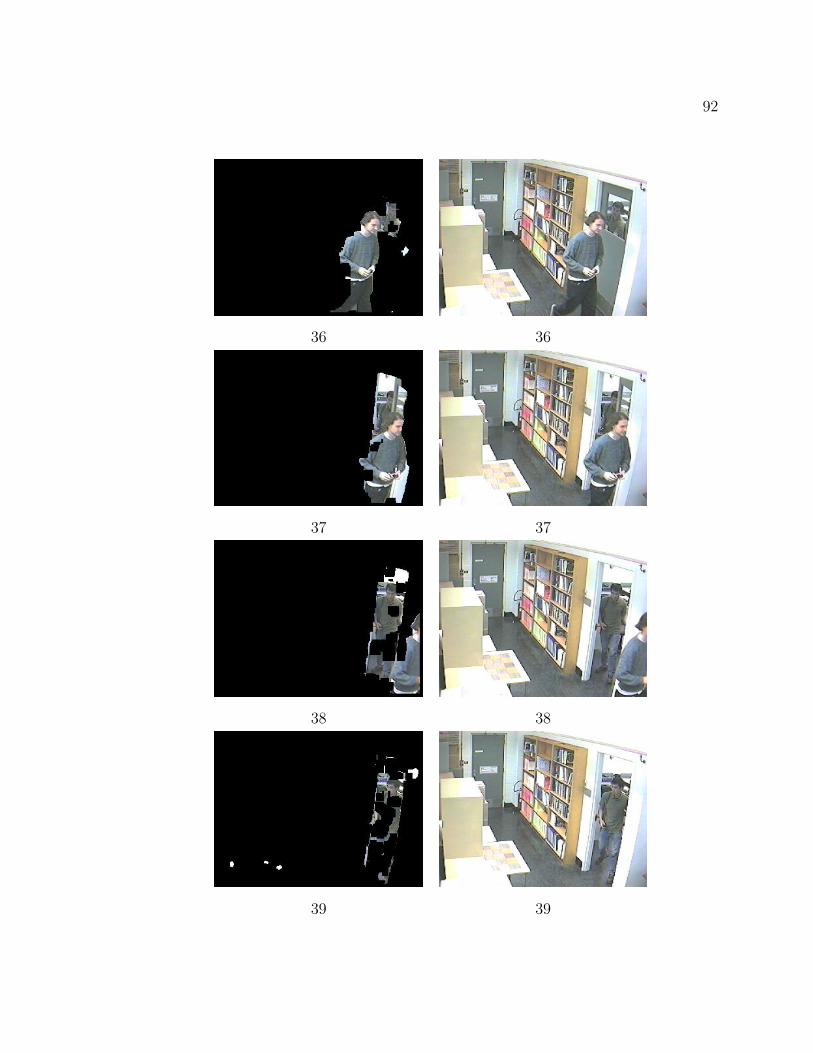
92
36 36
37 37
38 38
39 39

93
40 40
41 41
42 42
43 43

94
44 44
45 45
46 46
47 47
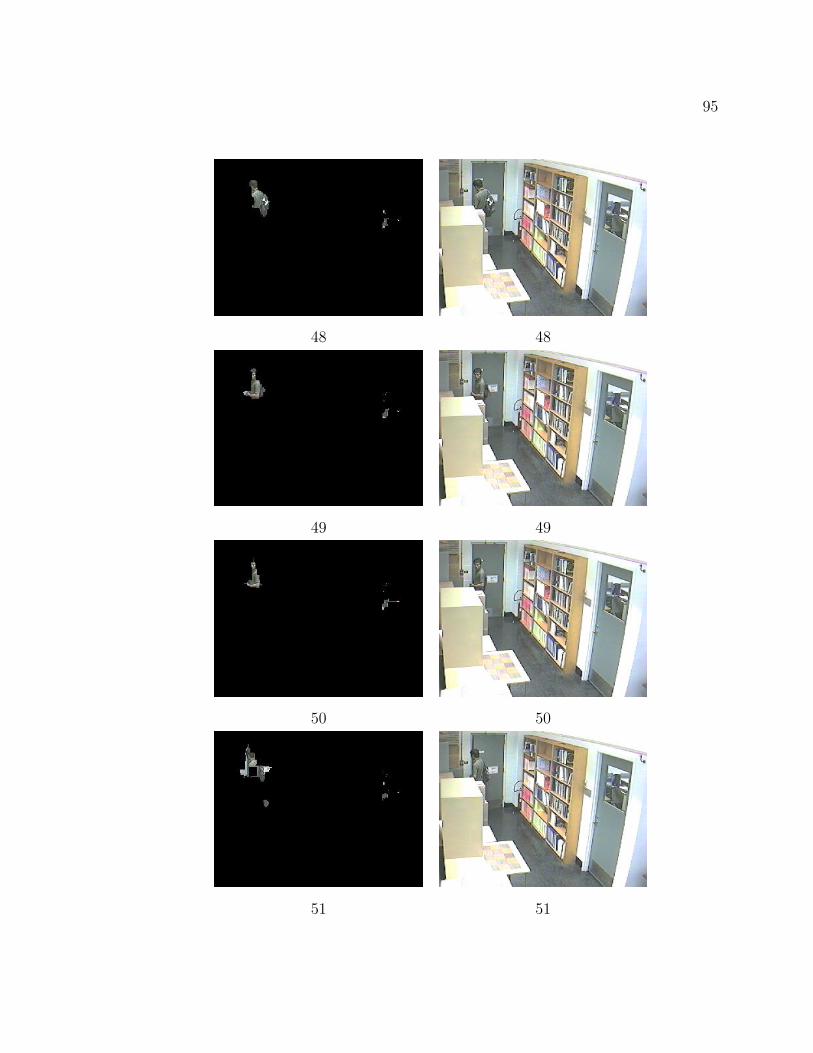
95
48 48
49 49
50 50
51 51

96
52 52
53 53
54 54
55 55

97
56 56
57 57
58 58
59 59
Appendix B
Sequences Showing Person
Detection Results
98

99
Sequence 1
0 0
1 1
2 2
3 3
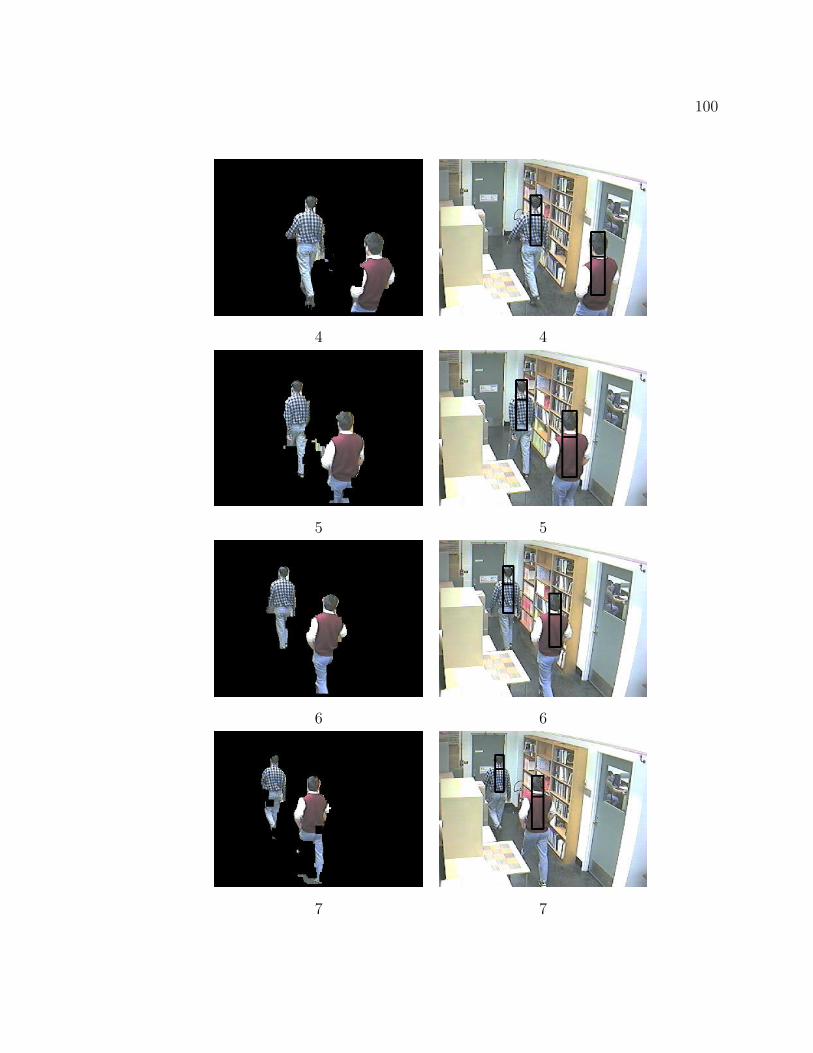
100
4 4
5 5
6 6
7 7

101
8 8
9 9
10 10
11 11
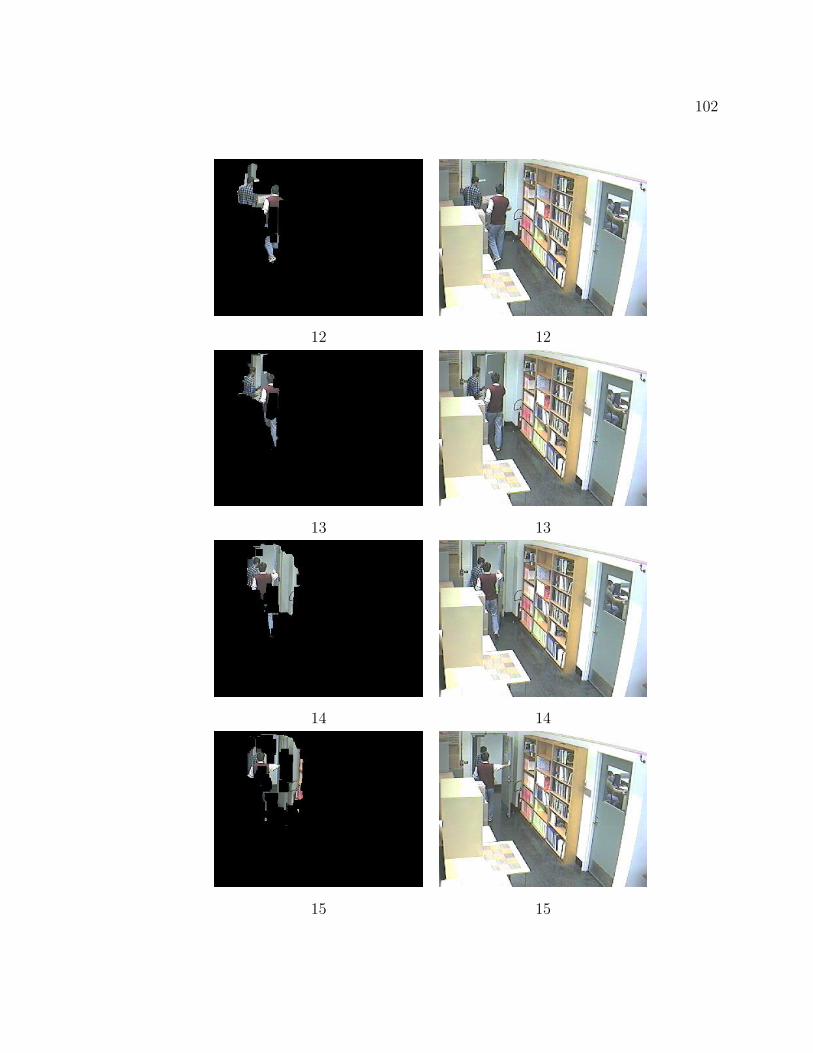
102
12 12
13 13
14 14
15 15

103
16 16
17 17
18 18
19 19

104
20 20
21 21
22 22
23 23
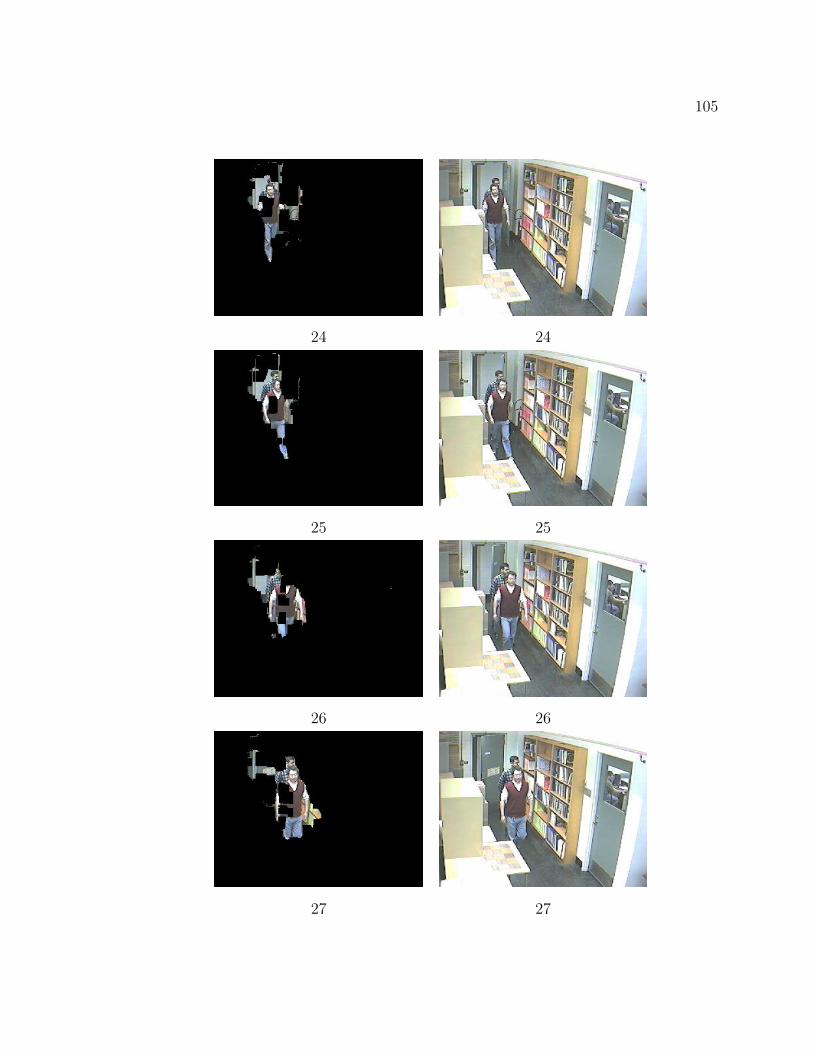
105
24 24
25 25
26 26
27 27

106
28 28
29 29
30 30
31 31

107
32 32
33 33
34 34
35 35
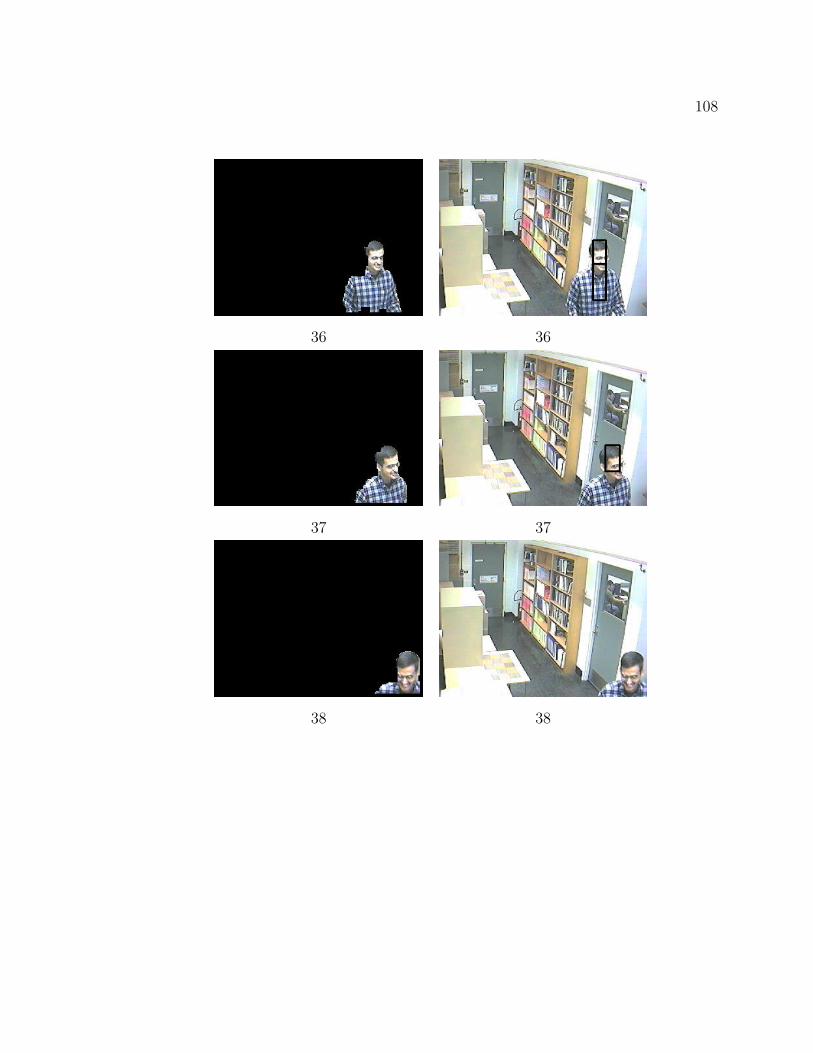
108
36 36
37 37
38 38
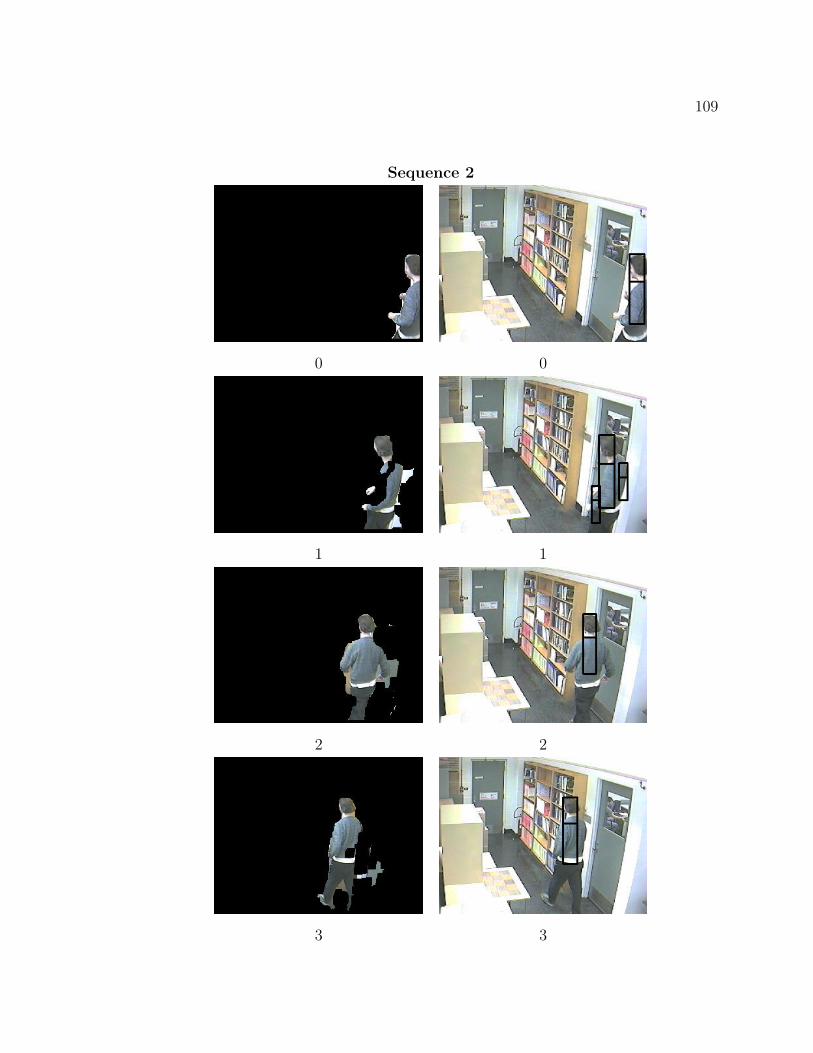
109
Sequence 2
0 0
1 1
2 2
3 3

110
4 4
5 5
6 6
7 7

111
8 8
9 9
10 10
11 11
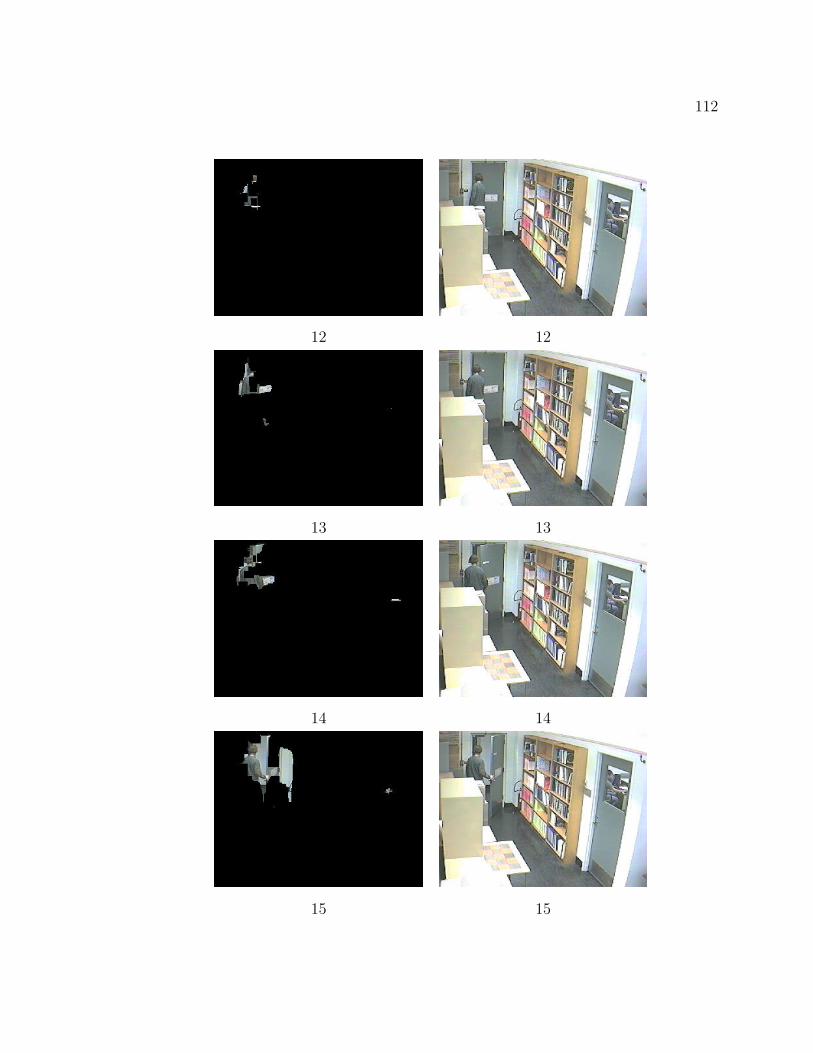
112
12 12
13 13
14 14
15 15

113
16 16
17 17
18 18
19 19

114
20 20
21 21
22 22
23 23

115
24 24
25 25
26 26
27 27

116
28 28
29 29
30 30
31 31

117
32 32
33 33
34 34
35 35

118
36 36
37 37
38 38
39 39

119
40 40
41 41

Appendix C
Sequences Showing Person
Tracking Results
120
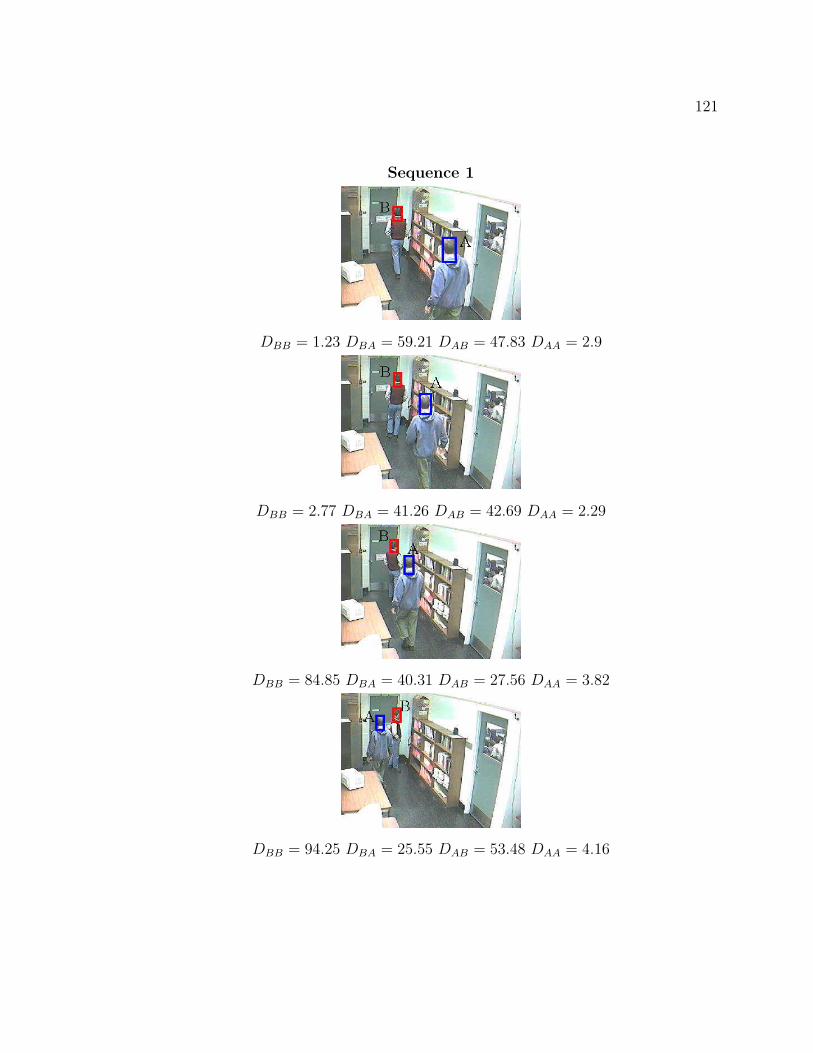
121
Sequence 1
DBB = 1.23 DBA = 59.21 DAB = 47.83 DAA = 2.9
DBB = 2.77 DBA = 41.26 DAB = 42.69 DAA = 2.29
DBB = 84.85 DBA = 40.31 DAB = 27.56 DAA = 3.82
DBB = 94.25 DBA = 25.55 DAB = 53.48 DAA = 4.16
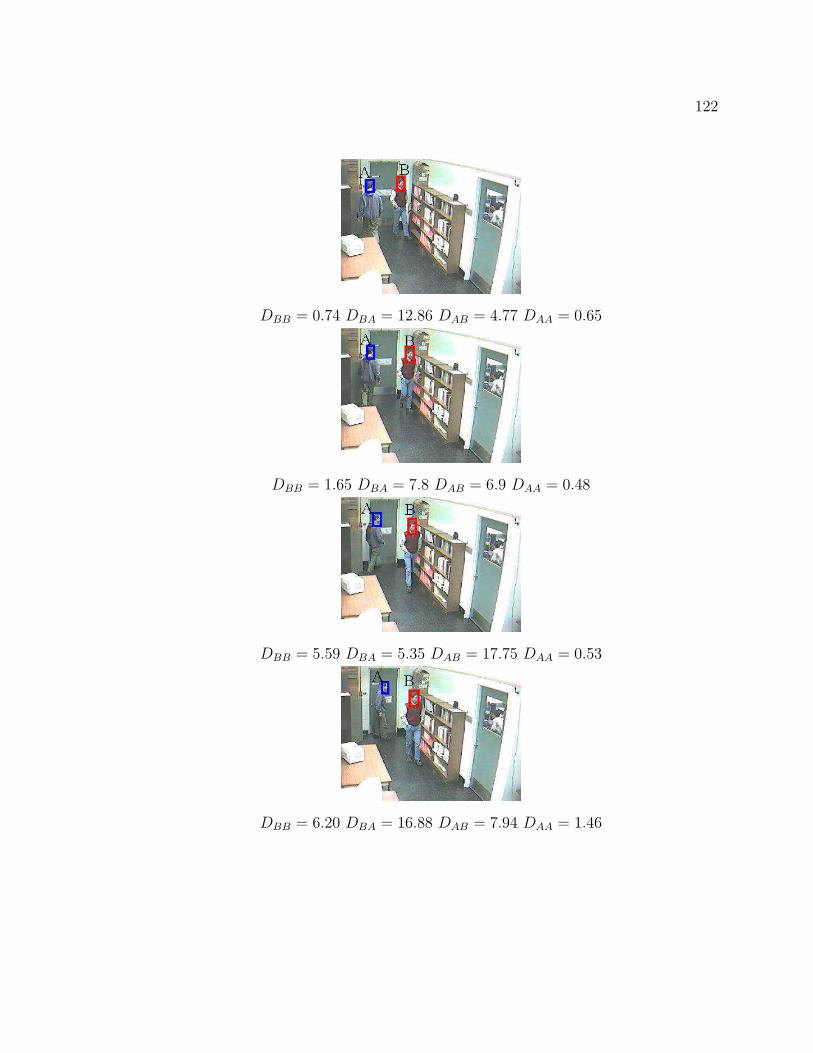
122
DBB = 0.74 DBA = 12.86 DAB = 4.77 DAA = 0.65
DBB = 1.65 DBA = 7.8 DAB = 6.9 DAA = 0.48
DBB = 5.59 DBA = 5.35 DAB = 17.75 DAA = 0.53
DBB = 6.20 DBA = 16.88 DAB = 7.94 DAA = 1.46
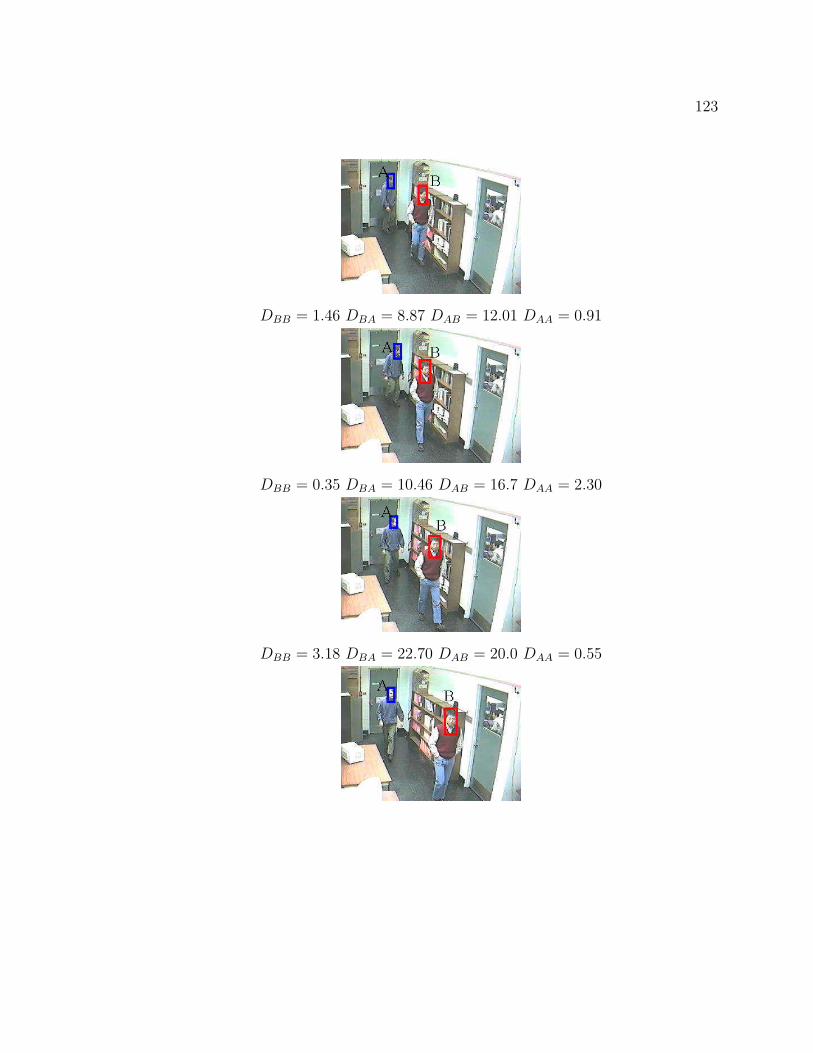
123
DBB = 1.46 DBA = 8.87 DAB = 12.01 DAA = 0.91
DBB = 0.35 DBA = 10.46 DAB = 16.7 DAA = 2.30
DBB = 3.18 DBA = 22.70 DAB = 20.0 DAA = 0.55

124
Sequence 2
DBB = 0.43 DBA = 59.62 DAB = 56.41 DAA = 2.24
DBB = 0.34 DBA = 60.04 DAB = 55.21 DAA = 0.6
DBB = 0.44 DBA = 51.49 DAB = 28.42 DAA = 4.97
DBB = 1.03 DBA = 30.95 DAB = 83.82 DAA = 21.87

125
DBB = 0.51 DBA = 102.36 DAB = 28.45 DAA = 3.76
DBB = 0.7 DBA = 25.1 DAB = 40.36 DAA = 0.68

126
Sequence 3
0 1
2 3
4 5
6 7

127
8 9
10 11
12 13
14 15

128
16 17
18 19
20 21
22 23

Bibliography
[1] M. Lee, ”Detecting People in Cluttered Indoor Scenes” Proceedings of CVPR,
pp. 804-809, 2000.
[2] J. Segen, S. Pingali, ”A Camera-Based System for Tracking People in Real Time”
Proceedings of ICPR, pp. 63-67, 1996.
[3] H. Tao, H. Sawhney, R. Kumar, ”A Sampling Algorithm for Tracking Multiple
Objects” Proceedings of Vision Algorithms ’99, pp. 53-68, Sept. 1999.
[4] I. Haritaoglu, D. Harwood, L. Davis, ”Hydra: Multiple People Detection and
Tracking Using Silhouettes” Proceedings of Second IEEE International Work-
shop on Visual Surveillance, pp 6-13, June. 1999.
[5] J. Orwell, P. Remagnino, G.A. Jones, ”Multicamera Colour Tracking” Proceed-
ings of Second IEEE International Workshop on Visual Surveillance, pp 14-21,
June. 1999.
[6] G. Rigoll, B. Winterstein, S. Muller, ”Robust Person Tracking in Real Scenar-
ios with Non-Stationary Background Using a Statistical Computer Vision Ap-
proach” Proceedings of Second IEEE International Workshop on Visual Surveil-
lance, pp 41-47, June. 1999.
[7] M. Harville, G. Gordon, J. Woodfill, ”Foreground Segmentation Using Adap-
tive Mixture Models in colour and Depth” Proceedings of IEEE Workshop on
Detection of Events In Video, pp 3-11, July. 2001.
129

130
[8] M. J. Swain, D. H. Ballard, ”Colour Indexing” International Journal of Computer
Vision, 7:1, pp 11-32, 1991.
[9] J. Heikkila, O. Silven, ”A Real-Time System for Monitoring of Cyclists and
Pedestrians” Proceedings of Second IEEE International Workshop on Visual
Surveillance, pp 74-81, June. 1999.
[10] T.E. Boult, R. Micheals, X. Gao, P. Lewis, C. Power, W. Yin, A. Erkan, ”Frame-
Rate Omnidirectional Surveillance and Tracking of Camouflaged and Occluded
Targets” Proceedings of Second IEEE International Workshop on Visual Surveil-
lance, pp 48-55, June. 1999.
[11] T.F. Cootes, C.J. Taylor, ”Constrained Active Appearance Models” Proceedings
of Eighth IEEE International Conference on Computer Vision, pp 748-754, July.
2001.
[12] P.L. Rosin, ”Thresholding for Change Detection” Proceedings of ICCV, Jan.
1998, pp. 274-279.
[13] D.M. Gavrila, ”The Analysis of Human Motion and Its Application for Visual
Surveillance” Proceedings of Second IEEE International Workshop on Visual
Surveillance, pp 3-5, June. 1999.
[14] B.A. Wandell, Foundations of Vision, Sinauer Associates, Inc. 1995.
[15] T. Horprasert, D. Harwood, L.S. Davis, ”A Robust Background Subtraction and
Shadow Detection” Proc. ACCV 2000, Taipei, Taiwan, January, 2000.
[16] Q. Zhou, J.D. Aggarwal, ”Tracking and Classifying Moving Objects from Video”
Proceedings 2nd IEEE Int. Workshop on Pets, Kauai, Hawaii, USA, Dec. 2001.
[17] F. Mindra, T. Moons, L. Van Gool, ”Recognizing colour Patterns Irrespective
of Viewpoint and Illumination” Proceedings IEEE Conf. on CVPR, vol 1, pp
368-373, June, 1999.

131
[18] P. Chang, J. Krumm, ”Object Recognition with colour Cooccurrence His-
tograms” Proceedings IEEE Conf. on CVPR, vol 2, pp 498-504, June, 1999.
[19] Y. Tsin, R.T. Collins, V. Ramesh, T. Kanade, ”Bayesian colour Constancy for
Outdoor Object Recognition” Proceedings IEEE Conf. on CVPR, 2001.
[20] T. Gevers, A.W.M. Smeulders, ”colour Constant Ratio Gradients for Image Seg-
mentation and Similarity of Texture Objects”, ISBN 0-7695-1272-0/01, IEEE,
2001.
[21] A. Madabhushi, J.K. Aggarwal, ”A Bayesian Approach to Human Activity
Recognition” Proceedings 2nd IEEE Int. Workshop on Visual Surveillance, pp
25- 32, June, 1999.
[22] M. Yang, N. Ahuja, ”Recognizing Hand Gesture Using Motion Trajectories”
Proceedings 2nd IEEE Int. Conference on Computer Vision and Pattern Recog-
nition, pp 466-472, June, 1999.
[23] K. Sato, J.K. Aggarwal, ”Tracking and Recognizing Two-person Interactions in
Outdoor Image Sequences” Proceedings of 2001 IEEE Workshop on Multi-Object
Tracking, pp 87-94, July, 2001.
[24] A. Ali, J.K. Aggarwal, ”Segmentation and Recognition of Continuous Human Ac-
tivity” Proceedings of IEEE Workshop on Detection and Recognition of Events
in Video, pp 28-35, July, 2001.
[25] T. Syeda-Mahmood, A. Vasilescu, ”Recognizing action events from multiple
viewpoints” Proceedings of IEEE Workshop on Detection and Recognition of
Events in Video, pp 64-72, July, 2001.
[26] A. Mittal, D. Huttenlocher, ”Scene Modeling for Wide Area Surveillance and
Image Synthesis” Proc. IEEE Conf. CVPR, 2000.

132
[27] Y. Rubner, C. Tomasi, L. J. Guibas, ”The Earth Mover’s Distance as a Met-
ric for Image Retrieval”. Technical Report STAN-CS-TN-98-86, Departement of
Computer Science, Stanford University, Sept. 1998.
[28] L. M. Fuentes, S. A. Velastin, ”People Tracking in Surveillance Applications”.
Proceedings 2nd IEEE Workshop on PETS, Kauai, Hawaii, USA, Dec. 2001.
[29] I. Haritaoglu, M. Flickner, ”Detection and Tracking of Shopping Groups in
Stores”. Proceedings of IEEE International Conference on CVPR, 2001.
[30] T. Zhao, R. Nevatia, F. Lv, ”Segmentation and Tracking of Multiple Humans in
Complex Situations”. Proceedings of IEEE International Conference on CVPR,
2001.
[31] B. Stenger, V. Ramesh, N. Paragios, F. Coetzee, J.M. Buhmann, ”Topology Free
Hidden Markov Models: Application to Background Modelling”. Proc. 8th Int.
Conf. on Computer Vision, vol. 1, pp 294-301, July, 2001.
[32] A.D. Jepson, D.J. Fleet, T.F. El-Maraghi, ”Robust Online Appearance Models
for Visual Tracking”. Proceedings of IEEE International Conference on CVPR,
2001.
[33] A. Elgammal, D. Harwood, L. Davis, ”Non-parametric Model for Background
Subtraction”. Sixth ECCV, 2000.
[34] D. Wojtaszek and R. Laganire, ”Tracking and Recognizing People in Colour
using the Earth Mover’s Distance”. IEEE Int. Workshop on Haptic Virtual En-
vironments, (Ottawa, ON,) pp. 91-96, Nov. 2002.
[35] D. Wojtaszek and R. Laganire, ”Using Color Histograms to Recognize People in
Real Time Visual Surveillance,” Int. Conf. On Signal, Speech and Image Pro-
cessing, Greece, pp. 3261-3264, Sept 2002.