Embed Size (px)
Citation preview

Visual & VirtualConfigure-Price-Quote (CPQ) ReportApril 2017, Version 2
© 2017 Novus CPQ Consulting, Inc. All Rights Reserved

© 2017 Novus CPQ Consulting, Inc. All Rights Reserved
Visual & Virtual CPQ ReportAs of April 2017
About this Report
The use of Configure-Price-Quote (CPQ) tools for the sales process continues to increase. This is true for all kinds of products, large and small, expensive and cheap as well as common and exclusive. One way to gain and hold the attention of a CPQ User is to visualize the product while it is configured. This is powerful because it provides an emotional attachment for the user to their custom configured product. The available visualization aids run the gamut from simple 2D to very cool 3D images and all the way to state of the art immersive Virtual Reality (VR) technology or to mix real environments with virtual environments afforded by Augmented Reality (AR) technology. This offers new and interesting ways to present a product for current visual CPQ customers while it also challenges CPQ vendors to find innovative ways to stay ahead of their competition.
The important question that all CPQ vendors and their customers’ need answered is, “do these visual additions to CPQ indeed make a difference to the bottom line, and at what cost?”
We at Novus CPQ Consulting wanted to find the answer to this critical question so we surveyed ten Config- ure-Price-Quote (CPQ) vendors and sixteen of their customers to discover: the role product visualization plays in CPQ Solutions, now and going forward the visualization technologies that are most promising for improving CPQ productivity and efficiency the expectation of CPQ vendors and customers from visual and virtual CPQ Solutions the Key Challenges for CPQ vendors and customers to adopt 3D CPQ Solutions the maintenance requirements for visual and virtual CPQ Solutions
Report Methodology
To determine the answers to the above questions, we researched information for various visualization tech- niques used in CPQ (2D, 3D, Virtual Reality, Augmented Reality). We prepared and sent survey questionnaires to leading CPQ vendors and their customers and conducted interviews with each of them. This report is the culmination of our analysis and evaluation of the data thus received.
The Report was prepared by:
Frank Sohn, Novus CPQ Consulting, Inc.Anjali Mulgaonkar, Novus CPQ Consulting, Inc.
6 CPQ Vendors from North America participated
4 CPQ Vendors from Europe participated

© 2017 Novus CPQ Consulting, Inc. All Rights Reserved
EXECUTIVE SUMMARY................................................................................................................... 4
WHAT IS VISUAL & VIRTUAL CONFIGURE/PRICE/QUOTE (CPQ)?............................................... 6BRIEF OVERVIEW OF TECHNIQUES USED IN VISUAL & VIRTUAL CPQ(DEFINITIONS AND EXAMPLES).................................................................................................... 7
HOW BIG IS THE VISUAL & VIRTUAL CPQ MARKET?................................................................... 11
WHICH INDUSTRIES BENEFIT FROM CPQ VISUALIZATION SOLUTIONS..................................... 12
WHERE CAN CUSTOMERS AND PROSPECTS LEARN MORE?...................................................... 13
WHAT ROI FOR CPQ VISUALIZATION SOLUTIONS CAN YOU EXPECT ...................................... 14

© 2017 Novus CPQ Consulting, Inc. All Rights Reserved Novus Research 1-4
Executive Summary
The Sales Process for many products is going through a fundamental transformation where the use of ecom-merce websites for sales is not only commonplace but also essential. Buyers custom-configure a product and make the purchase decision at a time and place of their choosing without the benefit of a sales person by their side. The addition of images and pictures to the configuration process in Configure-Price-Quote (CPQ) tools greatly simplifies the sales process for all users of CPQ tools. Note that this also includes Sales and Channel Partner Teams.The need for product visualization is not new and while in some cases static images may be good enough for customers, mature technologies like 2D and 3D have been used for this purpose for a while now. Today newer technologies like Virtual Reality (VR) and Augmented Reality (AR) have become available and some CPQ ven-dors and their customers determine how they can best use them.While 3D, VR and AR certainly bring with it a “cool” vibe; each of these technologies has its unique benefits and challenges. CPQ customers without visualization capabilities are pushing forward with more visual capabil-ities and those who already have visualization capabilities are exploring ways to move up the chain of visu-alization technologies from 2D to 3D to VR/AR. All along, CPQ vendors are upgrading their CPQ tool offering to keep up and stay ahead of the competition in the visual and virtual CPQ markets. While they push forward, the important question that all CPQ vendors and their customers need answered is, “do these cool visual additions to CPQ indeed make a difference to the bottom line, and at what cost” . For CPQ vendors it is important to understand how big the visual and virtual CPQ market is. CPQ vendors and customers want to understand for which industries and products these offerings may work. To find the answers, we at Novus CPQ Consulting, Inc. surveyed and interviewed several leading CPQ vendors and their customers.
Please note: In this report, the term “vendor” is used for the provider of the CPQ tools; “customer” for the customer of the vendor who have products to sell and “end-user” or “buyer” to denote the person who uses the CPQ tool to make the purchase. We also use the term “visualization” to include both visual (2D, 3D) and virtual (VR, AR) technologies.

© 2017 Novus CPQ Consulting, Inc. All Rights Reserved Novus Research 1-5
Here is an overview of our research
1. Top Findings:
While the majority of new CPQ customers do not require visualization, more customers have started asking for it and existing customers are adding visualization to their CPQ solution at a rapid pace. Use of 2D and 3D visualization in CPQ is well established with confirmed benefits for customers while use of VR and AR for CPQ is still in an early experimental stage. It is also worth noting that while 2D is considered yesterday’s technology by some vendors, it still has the most users for most customers. Many Visual & Virtual CPQ vendors expect strong growth for VR and AR as well as 2D and 3D solutions Some industries consider the move to 3D and potentially AR/VR as critical since they expect that this will become the new standard.Size of visual & virtual CPQ Market is unknownA range of devices is used for product visualization from larger powerful desktops to portable devices like tablets, laptops and smart phones to specialized hardware for VR and AR.VR Tools are mostly used in Sales Offices that have all the required equipment. VR Hardware is more advanced than AR Hardware. The day-to-day use of VR (Example: HTC Vive, Oculus Rift) and AR (Ex-ample: MS HoloLens) equipment is rare. Many customers also tie in these visual images throughout their ERP (Enterprise Resource Planning) system for an efficient and error free order fulfillment of the configured product greatly enhancing the customer satisfaction rate.
2. Opportunities:
Expect more visual solutions (2D, 3D) on ecommerce Websites to attract new users (Example: Millen-nials). Education for visual & virtual configuration tools is insufficient for both vendors as well as their cus-tomers.Most customers mentioned that they did not find much online information for visual & virtual CPQ Tools. Once they decided on a CPQ vendor they got (almost) all information from them exclusively. This model will need to change to become scalable. This may be a business opportunity for education providers. Every industry that benefits from a visual product inspection may benefit from using a visual configu-ration tool. To see a list of industries that currently use visual configuration tools see page 23. For ROI information see page 28.Business Opportunity for companies to develop an industry standard service, that allows easy and fast 3D CAD model creation that is ready to import in any CPQ tool.

© 2017 Novus CPQ Consulting, Inc. All Rights Reserved Novus Research 1-6
What is Visual & Virtual Configure/Price/Quote (CPQ)?
Configure-Price-Quote (CPQ) visualization is the graphical display of a product to the user on a desktop, lap-top, headset or any mobile device. The product display occurs using visual techniques like 2D, 3D or virtual technology like Virtual Reality (VR) or Augmented Reality (AR).To be complete we need to mention Mixed Reality. Mixed Reality refers to all possible variations and compo-sitions of real and virtual objects. We do not cover Augmented Virtuality or other Realities/Virtualities but if you want to learn more about that go here or read more in “Infinite Possibility – Creating Customer Value on the Digital Frontier” from Pine II, B. Joseph and Kim C. Korn.
Note: Simple definitions for these terms follow this section while the details are included later in the report. These techniques are used in CPQ tools to simplify the customization of physical products for an enhanced user experience where the user “sees” the product they are buying through all the steps of configuration of that product. Once the product is configured the visual product image is connected to the quote. Many customers also tie in these visual images throughout their ERP system for an efficient and error free order fulfillment of the configured product.
3. Challenges:
It is potentially a large effort in time and money to build a visual CPQ solution. This means that im-plementation costs for a visual CPQ Project can be 20-30% higher than for a non-visual CPQ Project. Some participating vendors mentioned for example that virtually created environments would not look as good as real environments any time soon. While some customers mentioned that older generations of business users were reluctant to use newer technologies. See “Opportunities” paragraph above.While customers are very confident of the benefits of visualization in their CPQ tools, measuring ROI is challenging for the majority. It is important to note that all participating customers (from large global Enterprises to SMB Businesses) felt confident that the investment paid off through increased sales and cost savings (Example: prevention of configuration errors resulting in internal time and money savings by eliminating the costly re-dos and thereby increasing customer satisfaction.). Participating customers expect strong growth from Retail, Furniture, Apparel and Manufacturing Industries (Example: up to 25% of manufacturing companies may benefit from Visual & Virtual CPQ)Adoption of virtual CPQ tools (VR, AR) will become more mainstream when available hardware be- comes better and cheaper and more standardized (Example: users can use mobile devices instead of a headset or glasses).

© 2017 Novus CPQ Consulting, Inc. All Rights Reserved Novus Research 1-7
Brief overview of techniques used in Visual & Virtual CPQ (Definitions and Exam-ples)
The graphical display of the product during the configuration step occurs using 2D, 3D, VR and AR tech-niques. A brief introduction to these techniques is included below.
2D 2D stands for two-dimensional. A 2D drawing (or image) is any computer-generated drawing or image that has two dimensions like width and height (X and Y axis). These drawings or images can be created with computer-aided design (CAD) Software like Autodesk, Solidworks, PTC or without CAD software by using photos. 2D drawings (or images) are typically used for simple products or when a customer has special requirements (e.g. large floor plans). Many vendors use 2D models to attach product visualizations to the quote.

© 2017 Novus CPQ Consulting, Inc. All Rights Reserved Novus Research 1-8
3D 3D stands for three-dimensional. A 3D model is any computer-generated model that has three dimen-sions such as width, height and depth. These models can be created with CAD software like Autodesk-Inventor, Solidworks, PTC or without CAD Software. 3D Models are typically used for more complex products or when multiple product views and interactive product behavior as well as product animation are important.

© 2017 Novus CPQ Consulting, Inc. All Rights Reserved Novus Research 1-9
Virtual Reality (VR)Virtual reality is a completely artificial, computer-generated environment that is presented to the end-us-er via a headset creating the visual impression that the presented environment is real. The user has an immersive experience with the product that he is buying. Sometimes another headset is used for sound to enhance the visual experience. To control certain elements in the Virtual Reality environment hand controllers may be used.

© 2017 Novus CPQ Consulting, Inc. All Rights Reserved Novus Research 1-10
Augmented Reality (AR)While virtual reality is a completely artificial environment, augmented reality mixes a user’s real envi-ronment with an artificial environment in real time. Augmented Reality is created using mobile devices such as laptops, tablets and smart phones as well as in dedicated devices like Microsoft HoloLens. A key advantage of dedicated AR devices is that they allow hands free operation.

© 2017 Novus CPQ Consulting, Inc. All Rights Reserved Novus Research 1-11
How big is the Visual & Virtual CPQ Market?
As Configure-Price-Quote specialists, we notice that visualization capabilities are still considered a niche in the overall CPQ Market.Separate reports and predictions are available for 1. The growth of the overall CPQ market, and 2. The growth of the VR and AR market
No Report is available for the growth of the overall CPQ visualization (2D, 3D, VR and AR) market.
1. Gartner predicts in this report that the CPQ Market will grow 20% annually through 2020
2. The growth forecasts for Virtual and Augmented Reality differ considerably between different market researchers, the general consensus is that the growth will be substantial, which means that the percentage growth will be in triple digits (at least) until 2020 and beyond.
In this report, we examine what impact this enormous growth in visualization capabilities is expected to have on Configure-Price-Quote (CPQ) Solutions and what the customer should expect while embarking or growing in his visual and virtual CPQ journey.
In this IDC report the worldwide revenue for Augmented and Virtual Reality is forecasted to grow from $5.2 billion in 2016 to $162 billion in 2020.
In this Digi Capital report the expectation is that worldwide revenue will be $120 billion in 2020, where $30 billion is expected from Virtual Reality and $90 billion from Augmented Reality.
This Forbes report states that Goldman Sachs is predicting a $80 billion revenue market in 2025, with $45 billion from Hardware and $35 billion from Software Sales.
© 2017 Novus CPQ Consulting, Inc. All Rights Reserved Novus Research 1-12
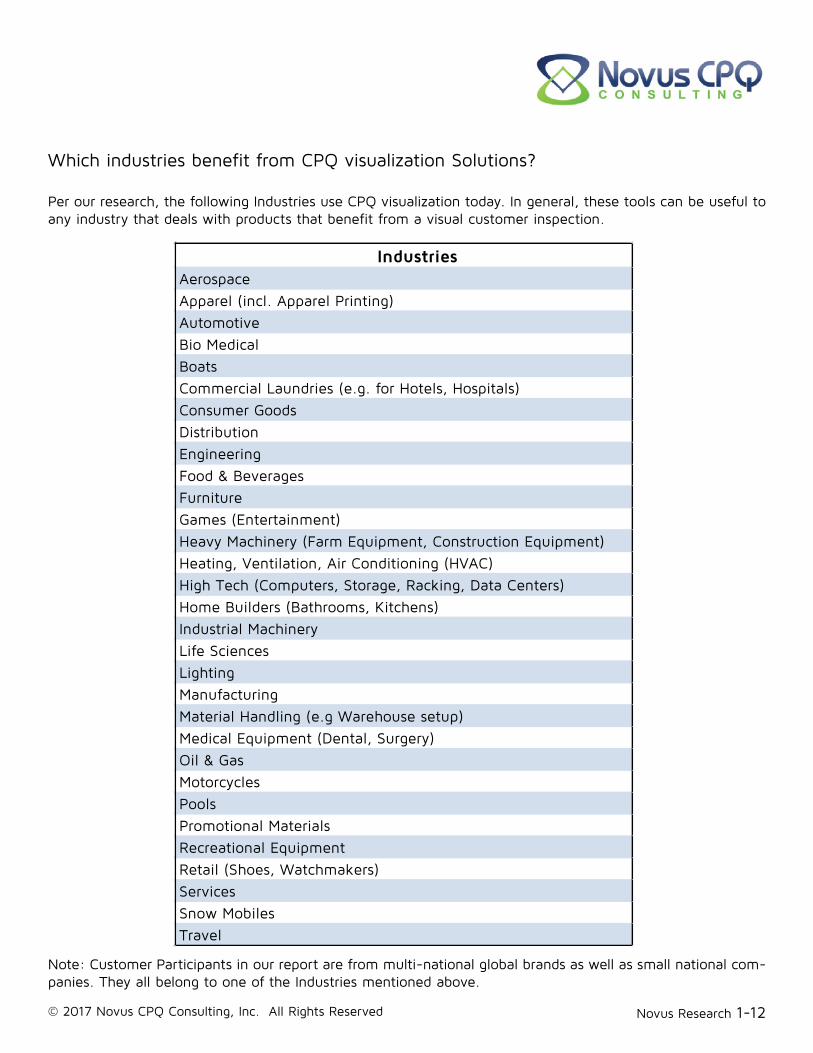
Which industries benefit from CPQ visualization Solutions?
Per our research, the following Industries use CPQ visualization today. In general, these tools can be useful to any industry that deals with products that benefit from a visual customer inspection.
Note: Customer Participants in our report are from multi-national global brands as well as small national com-panies. They all belong to one of the Industries mentioned above.
IndustriesAerospaceApparel (incl. Apparel Printing)AutomotiveBio MedicalBoatsCommercial Laundries (e.g. for Hotels, Hospitals)Consumer GoodsDistributionEngineeringFood & BeveragesFurnitureGames (Entertainment)Heavy Machinery (Farm Equipment, Construction Equipment)Heating, Ventilation, Air Conditioning (HVAC)High Tech (Computers, Storage, Racking, Data Centers)Home Builders (Bathrooms, Kitchens)Industrial Machinery Life SciencesLightingManufacturingMaterial Handling (e.g Warehouse setup)Medical Equipment (Dental, Surgery)Oil & GasMotorcyclesPoolsPromotional MaterialsRecreational EquipmentRetail (Shoes, Watchmakers)ServicesSnow Mobiles Travel

© 2017 Novus CPQ Consulting, Inc. All Rights Reserved Novus Research 1-13
Where can customers and prospects learn more?
Many Report participants (Vendors and Customers) mentioned a general lack of information in the visual and virtual CPQ space. Customers mainly get their information directly from their vendors in 1:1 meetings or proof of concept demos created especially for their field. Vendors may also:
But there is almost no vendor agnostic, cross-industry information that is freely available. While companies like Gartner and Forrester offer information in this space this is frequently not used by SMB customers due to the associated costs.
Provide reference customers in similar fields
Some vendors offer online Knowledge Bases, blogs on their websites or online Portals
Point to certain trade shows where a prospect can have a hands-on experience (for Example with Virtual Reality)
Hardware For currently available VR Headsets check this link
Books, Magazines, Websites, etc. Practical Tips for Augmented Reality (German)
To learn more about requirements for VR an AR Mass Adoption read this Entrepreneur Article
SAP Press Book on Variant Configuration – Check with SAP
Virtual Reality VR explained
And one more article that explains Virtual Reality
Training See websites of Visual & Virtual CPQ Vendors above
Events (check the Novus CPQ Events Website for upcoming events) Configurator Work Group (CWG) Conference (US/EMEA)
SAP Variant Configuration Day
Sapphire / ASUG Conferences

© 2017 Novus CPQ Consulting, Inc. All Rights Reserved Novus Research 1-14
What Return on Investment (ROI) for CPQ visualization solutions can you expect?
While most participating customers stated that Return on Investment is challenging to measure all are con-vinced that their visual and/or virtual CPQ investment is paying off. All concede that it is a considerable effort (especially if it is integrated into their ERP systems) and a critical component for success is a well-planned Change Management effort. It is important that all stakeholders are educated about its benefits and buy into the effort! All participating customers are moving forward and adding more Products to their visual & virtual CPQ Solutions.
Some example benefits that customers mentioned:
Select Product Line sales increased by 20%.
Increased Sales by showing up sell and cross sell options for products that Sales Rep would frequently miss to offer.
Visual presentation of products leads to less configuration errors resulting in increased customer satis-faction and measurable cost savings by not having to redo the faulty orders.
The ‘wow” experience for users resulting in emotional attachment to the configured product.
Being ahead of the competition by ordering something their competitors do not offer.
Visualization minimized the time from product configuration to quote from weeks to hours.
Optimized Business Processes lead to time savings (cost reduction).
Lead Generation increased 10 times!
Offering Visual configuration helped them to get ahead of the competition.
Reduced quoting time from 3-5 days to 15 minutes
Close Ratio increased from 30-40% to 60-70%
Some metrics that customers used to measure ROI:
How many users use the solution?
Who is using the solution?
How much do (different) users use the solution?
How many quotes are created with the solution?
How much time is between product configuration and order?
What is the average $ value of a quote that was prepared with this solution?

© 2017 Novus CPQ Consulting, Inc. All Rights Reserved Novus Research 1-15
About Novus CPQ Consulting, Inc.
© 2017 Novus CPQ Consulting, Inc. All rights reserved. This publication may not be reproduced or distributed in any form without Novus CPQ Consulting, Inc. prior written permission. You have purchased a one-person subscription to download and/or access this publication. The information contained in this publication has been obtained from sources believed to be reliable. Novus CPQ Consulting, Inc. disclaims all warranties as to the accuracy, completeness or adequacy of such information and shall have no liability for errors, omissions or inadequacies in such information. This publication consists of the opinions of Novus CPQ Consulting, Inc. and should not be construed as statements of fact. The opinions expressed herein are subject to change without notice. Novus CPQ Consulting, Inc. provides Configure-Price-Quote research and advisory services to a range of companies. Novus CPQ Consulting, Inc is a private company.
Note: The full report contains the following additional information and can be purchased at www.novuscpq.com/resources/research
Journey of the typical customer into visual and virtual CPQ Different ways of adding visual experience in CPQ Solutions Use 2D only (Basics, Key Challenges, Training, Maintenance) Use 3D only (Basics, Key Challenges, Training, Maintenance) Use a combination of 2D and 3D Key takeaway of 2D vs 3D decision Virtual Reality (Basics, Key Challenges, Training, Maintenance) Augmented Reality (Basics, Key Challenges, Training, Maintenance) Planning budget for visual & virtual CPQ Solutions CPQ vendors with visual & virtual capabilities Future trends to look out for