Embed Size (px)
Citation preview
Visualising Cycle Hire Docking Stationswith OD Maps
The giCentreCity University London
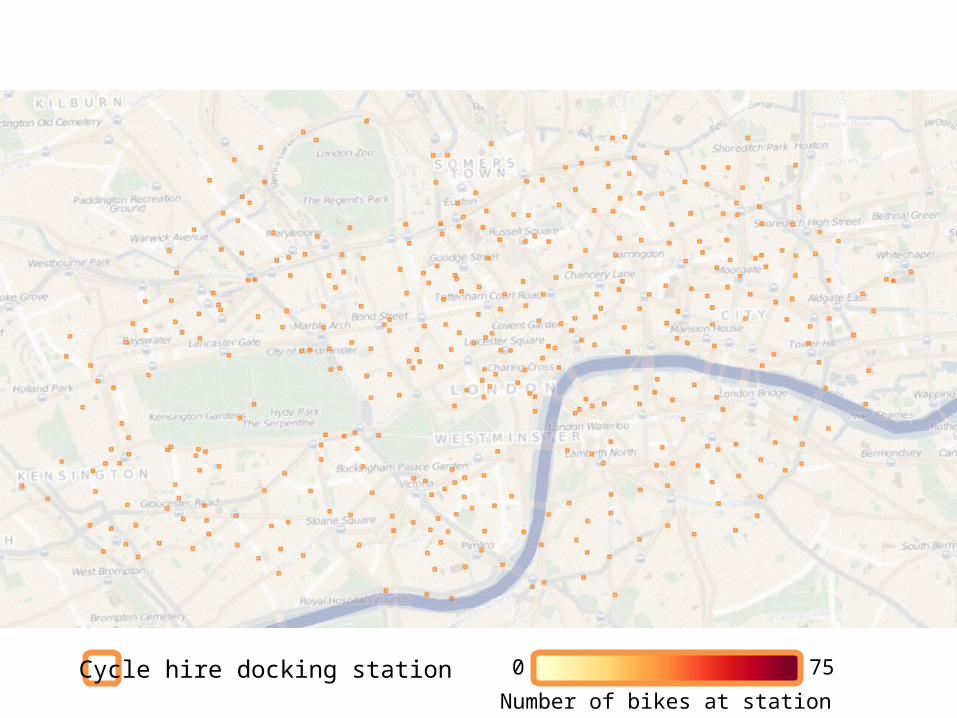
Cycle hire docking stationNumber of bikes at station
0 75

390 docking stations arranged in a grid
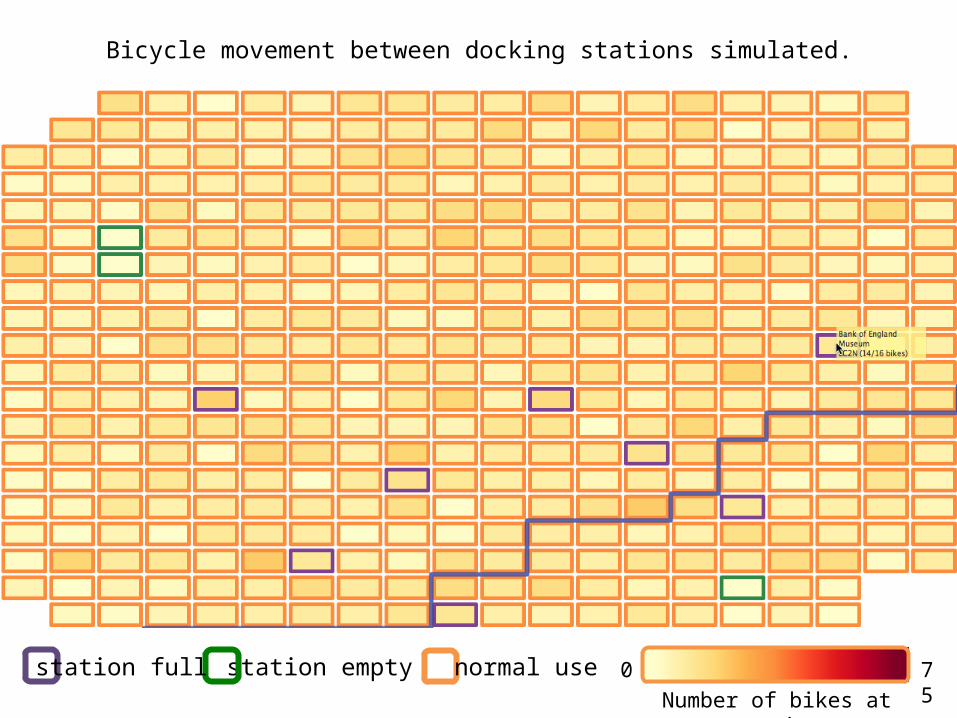
Bicycle movement between docking stations simulated.
station emptystation full normal useNumber of bikes at station
0 75
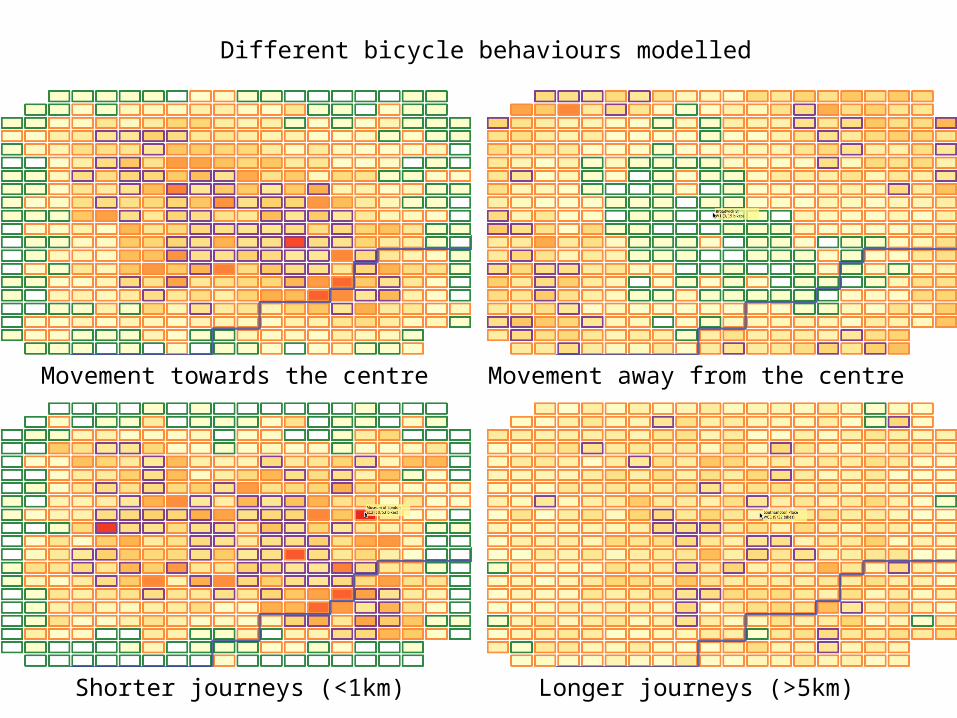
Different bicycle behaviours modelled
Movement towards the centre Movement away from the centre
Shorter journeys (<1km) Longer journeys (>5km)
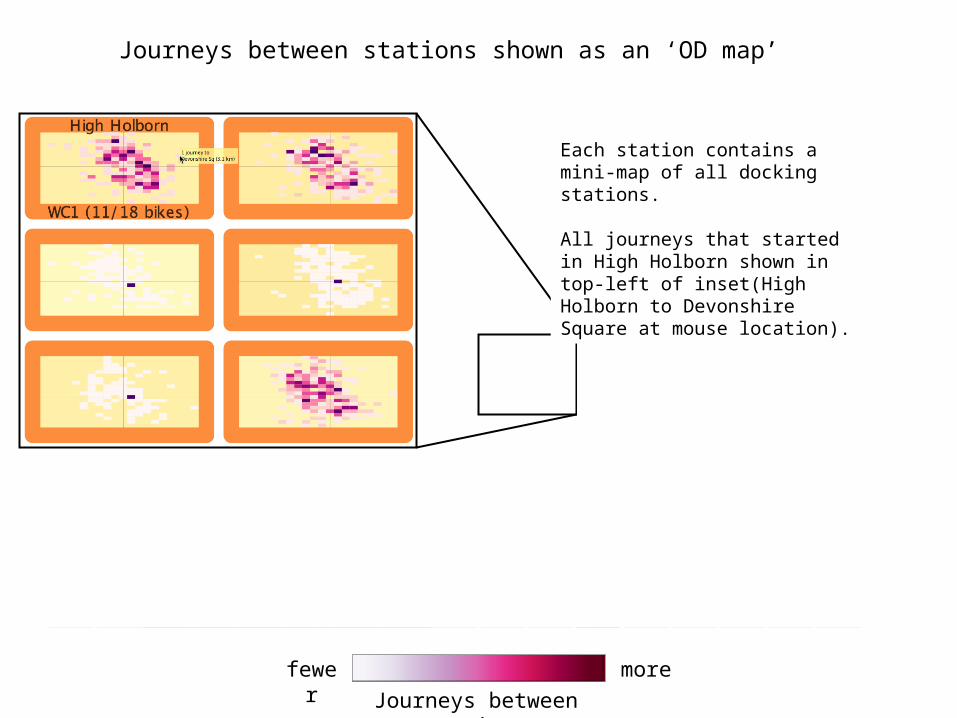
Journeys between stations shown as an ‘OD map’
Journeys between stations
fewer more
Each station contains a mini-map of all docking stations.
All journeys that started in High Holborn shown in top-left of inset(High Holborn to Devonshire Square at mouse location).
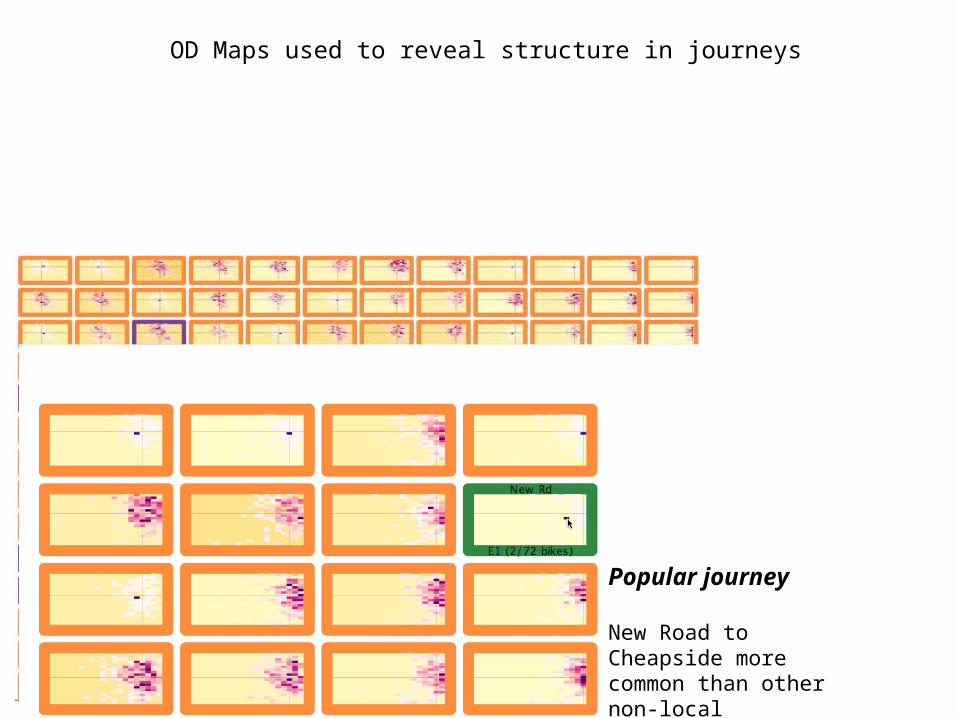
OD Maps used to reveal structure in journeys
Short journey behaviour
All destinations close tothe bike station (at crosshairs)
Vandalised bikes at Snow Hill
Bike station full (purple border), but no outward journeys (blank cell).
Popular journey
New Road to Cheapside more common than other non-local journeys.

For more information on visualisation of bicycle hire behaviour and other transport data:
The giCentreSchool of InfomaticsCity University LondonEC1V 0HB
Web: www.gicentre.orgEmail: Dr Jo Wood: [email protected]: 020 7040 0146