Embed Size (px)
Citation preview
Visualization of Uncertainty and Reasoning
Torre Zuk and Sheelagh Carpendale
University of Calgary{zuk,sheelagh}@cpsc.ucalgary.ca
Abstract. This article gathers and consolidates the issues involved in uncertaintyrelating to reasoning and analyzes how uncertainty visualizations can supportcognitive and meta-cognitive processes. Uncertainty in data is paralleled by un-certainty in reasoning processes, and while uncertainty in data is starting to getsome of the visualization research attention it deserves, the uncertainty in thereasoning process is thus far often overlooked. While concurring with the impor-tance of incorporating data uncertainty visualizations, we suggest also developingclosely integrated visualizations that provide support for uncertainty in reasoning.
1 Introduction
Uncertainty and its complement certainty are fundamental parts of any analytic or rea-soning process and relate to important cognitive constraints in using any visualization.To inform the design process we review and coalesce many important aspects of rea-soning under uncertainty and discuss these with regard to implications for visualization.For each of these aspects we consider reasoning and representational requirements andassess the potential for exploiting visual support. Based on our analysis of the impact ofuncertainty in the reasoning processes, we propose that these receive increased consid-eration in the design of visualization systems. For instance, when appropriate this couldinclude an additional visual component focusing on reasoning uncertainty and supportfor introspection. For this reasoning support we contribute design considerations anddescribe an example system for medical diagnosis.
In the analytic reasoning process, often choosing the visual representation drives theexploration for an iteration of searching, comprehension building, or hypothesis testing.The inability to transform or change this representation is the representational primacythat Amar and Stasko consider a limitation of many current visualizations [1]. In addi-tion to options for alternate representations, it is important to augment a representationwith uncertainty in order to allow potential interpretations of the data to be considered.Hepting has described an analogous process for visual interfaces as “begin with an in-complete articulation of a context and allow the user to interactively develop and refineit” [16]. Leaving uncertainty out of a data visualization promotes assumptions that leadto more uncertainty in the reasoning process and the viewer may not be aware of thisuncertainty. With insight problems (e.g. the 9-dot problem [30]) searching representa-tion space may be key and Gestalt may even hinder the process [30]. Thus providingcues about uncertainty in representation may promote consideration of other represen-tations and help further the exploration. Based on and extending the impact of datauncertainty visualization, we suggest that representing the reasoning process may aid
A. Butz et al. (Eds.): SG 2007, LNCS 4569, pp. 164–177, 2007.c© Springer-Verlag Berlin Heidelberg 2007
Visualization of Uncertainty and Reasoning 165
in determining both the next reasoning step, and the assessment of the solution. Furtherthis visual representation specifically designed to support the reasoning process shouldalso incorporate uncertainty to provide transparency of confidence.
Given that both knowledge and representation are coupled to uncertainty, we willpresent arguments to illustrate that uncertainty of reasoning as well as uncertainty indata should be visualized and if possible integrated in a manner that supports the rea-soning process. Even well-defined problems such as proving a premise using predicatelogic usually requires an external aid (visualization, such as hand drawn sketches) dueto the limits of working memory. When adding the complexity of uncertain data or ac-tions, one would expect Bayesian reasoning or some form of satisficing [37] would alsobenefit from visualization support.
2 Cognition, Uncertainty, and Visualization
In this section we have gathered together the central components of several discus-sions of reasoning and cognition and discuss them in light of uncertainty visualization.For our discussion we define reasoning very loosely and consider how knowledge con-structs, heuristics and biases, and temporal constraints impact reasoning and discussthe potential for uncertainty visualization. We close this section by delineating types ofreasoning uncertainty.
2.1 Knowledge Constructs
Thomas and Cook describe three higher order knowledge constructs: arguments,causality, and models of estimation [38]. Arguments are “logical inferences linkingevidence and other reasoning artifacts into defensible judgments of greater knowledgevalue” [38]. Causality is an understanding of the action-reaction relationship. Modelsof estimation provide for the use of powerful abstractions in interpreting the data andproviding estimates of solutions. We will discuss these three constructs in terms of theirrelationship to visualization.
Arguments and Visualization: Visualizing an argument formalizes it for introspec-tion and collaboration. Arguments are one of the reasoning steps of problem solving,and the presence of uncertainty is what creates an ill-structured problem. Paraphrasingvan Bruggen [44], an ill-structured problem has: an ambiguous and incomplete problemspecification, a lack of clear stopping criteria, multiple information sets and represen-tations with no clear indication of relevance, and incomplete knowledge of operationsor solution path. Solving ill-structured problems often requires non-linear progression,partial solutions, and representational refinement [44], for which extra cognitive supportwill be beneficial.
Complex problems and arguments are also more likely to require external assess-ment or benefit from collaborative refinement. Without a representation of the currentuncertainty in different analytic strategies resource management is difficult. By visu-alizing which areas have uncertainty and are making the problem ill-structured, usersmay more easily monitor progress and decide to divert resources to reduce the mostsignificant uncertainty.
166 T. Zuk and S. Carpendale
Causality and Visualization: More causality may be perceived than your visualiza-tion intends. Causality is often perceptually linked to temporality. Michotte [27] foundthat with the movement of patches of light, the relative timing of motion could createthe strong perception of causal relationships. Likewise with less abstract occurrencespeople will often assume causality based on temporal relationships. Due to this per-ception, animation may enhance the communication of causality and should be usedcarefully if causality is not to be inferred.
Reasoning about causality under uncertainty may also utilize heuristics that are proneto error and bias. Tversky and Kahneman found that if one event (C) was naturallyviewed as a cause of another (E), then even if they had equal probabilities their par-ticipants would be biased in favor of causal inferences over diagnostic inferences (i.e.believe P(E|C) > P(C|E) even though P(C) = P(E) ⇒ P(E|C) = P(C|E)) [43]. Fur-thermore they found that people were biased toward weighing evidence for causal im-pact in the future versus diagnostic reasoning about the past. Kahneman and Millerhypothesize that alternatives to the effect are more available to the mind than alterna-tives to the cause [20], and so leading the user to consider more causes could reducethis bias. When there is an effect with an uncertain cause this might be visually inducedby showing additional dangling links back from the effect.
Models of Estimation and Visualization: A visualization is a model which adds itsown uncertainty. Applying any models of estimation requires a jump from the concreteto the abstract. This may likely increase uncertainty by requiring assumptions, introduc-ing translation errors, or adding in the stochastic variability of a model. Any uncertaintythis abstraction process introduces should be visualized to keep under considerationwhen interpreting the model results. The propagation of errors is also important to con-sider when using models as the input uncertainty will often be increased, potentially bysomething as simple as the addition of variables.
2.2 Reasoning Heuristics and Biases
An exemplar of reasoning heuristics and biases may be found from user predictioncalibration. Griffin and Tversky [14] state in the assessment of evidence that overcon-fidence often resulted when the evidence strength (extremeness) was high and weight(predictive validity) low. For example, there may be a bias toward rejecting the nullhypothesis when the means are very different even when there are large standard de-viations. Under-confidence often resulted when the strength of evidence was low butthe weight high (i.e. a moderate impression based on extensive data) [14]. An examplemay be the failure to confidently communicate the need to address climate change. Onemight help address these biases by showing the merged strength-weight visually.
For information systems Turpin and Plooy [42] review the decision-making heuris-tics and biases: representativeness, availability, adjustment and anchoring, problem ordecision framing, and automation. Their literature review found real world examplesproviding some evidence for each of these types. They touch on the role of how infor-mation systems may elicit biases as well as aid in debiasing, and also suggest innovativerepresentations and decision process support may reduce bias. They conclude by call-ing for more field research to better quantify the effects of these biases in relation toother problems such as data quality. The debate continues as to how frequently these
Visualization of Uncertainty and Reasoning 167
heuristics and biases occur outside the laboratory [14], but they are certainly relevant todesign when considering user constraints.
We provide a subset of these heuristics and biases, most from the foundational col-lections on the subject [14, 19], and others as cited. We have organized these into threecategories based on visualization strategies that may potentially mitigate them. The cat-egories are: associations, ignorance of rules, and application of rules. Mental associa-tions have a conscious and subconscious influence on reasoning. Rules encompass thesimple cognitive constructs for inferring information (e.g. a theorem) all the way up tomethods for forming arguments. We will describe each in turn along with visualizationstrategies that may be beneficial.
Associations and Visualization: A visualization is impacted both positively andnegatively by associations it triggers. Associations may bias the reasoning process invarious ways. One major type is the affect or reliance on the associated “good” or “bad”response to a stimulus [36], which Norman has recently discussed in relation to itsimpact on design [29]. Availability of instances in the mind for estimating probabilityform another type: retrievability of instances is important when the size of a set isestimated by availability of instances [19]; if instances are not available, the ease ofimagining them will act as availability [19]; illusory correlation when the frequency ofco-occurrence may be estimated based on strength of association [19], and a recencybias results in the overweighting of recent events [41].
Visualizations can provide access to huge amounts of data and thereby reduce the bi-ases of one’s own limited associations. By providing high density visual queries that canbe quickly modified one may be influenced less by expectations and let the data provideits own associations. Using a computer to analyze the data and make a visualizationbased on a fixed set of rules inherently reduces these types of biases.
Ignorance of Rules and Visualization: If a visualization does not convey to theviewer the meanings of its representation(s) the user may fail to form the correct inter-pretations and arguments. Ignorance of rules (often statistical) can also lead to poor rea-soning and the representativeness heuristics [19]. These include: insensitivity to priorprobabilities (e.g. Bayes’ rule not applied); small sample expected to be as representa-tive of population as a larger sample; failure to consider regression to the mean; miscon-ceptions of chance (e.g. representativeness of a random process as a whole expected inshort sequences); irrelevant data may be used as a predictor; and the illusion of validitywhere redundancy in inputs reduces accuracy but increases confidence.
While visual representations themselves may not promote statistical ignorance, theyrarely go the one step further to aid statistical interpretation. Even the basic box andwhisker plots tailored for hypothesis testing are in rare use. Visualizations have thepotential to alleviate these issues by integrating realizations of other potential outcomesand integrating statistical information with drill downs.
Application of Rules and Visualization: Direct visual support for reasoning mayassist with the application of rules. Any given strategy or application of rules may pro-vide an inferior result, as is possible with the adjustment and anchoring set of heuristics.A selection of these are: insufficient adjustment when an initial estimate is weightedtoo strongly during subsequent revisions (and may be based on irrelevant data) [6, 19];adjustment from single event probability produces overestimate of conjunctions and
168 T. Zuk and S. Carpendale
underestimate of disjunctions [19]; a tendency to be overconfident in decisions or es-timates [8, 17]; automation or technology dependency leading to errors of omissionand commission [4, 33, 42]; and overestimated confidence in the ability of a prioripredicting past events (i.e. hindsight is 20:20) [8]. Similar to the application of rulescategory, the use of heuristics in software programs dealing with complex problems isalso common-place and they need to be understood by the user to avoid introducinginterpretation errors.
Many visualizations do not include visual explanations of the mapping of data, algo-rithms and uncertainty, but this is crucial for avoiding these types of biases. This classof reasoning shortfalls will be greatly aided by a visualization of the reasoning processitself. Any reasoning visualization may provide grounds for review, analysis, and col-laboration; thereby opening up what might be a hidden and flawed decision process.Just as MacEachren noted for visualization errors [23], we can group reasoning errorsinto Type I, reaching conclusions that are not supported, and Type II, failure to reachconclusions that are supported.
When these biases or heuristics are likely to manifest in a user’s reasoning, we canmake attempts to debias or provide alternative heuristics (or algorithms). Fischhoff re-viewed some of these attempts for overconfidence and hindsight bias, and found onlypartial success [8]. The review was organized around three categories: faulty tasks (at-tempts such as raise stakes, clarify instructions, ...), faulty judges (warn of problem,train extensively, ...), and mismatch between judge and task (make knowledge explicit,search for discrepant information, ...). There is greater potential for cognitive supportwith visualization systems as the offloaded tasks may use algorithms that do not suf-fer from these issues, and may dynamically attempt debiasing, but the danger of theautomation heuristic also needs to be considered.
For many problems, heuristics can provide fast and accurate enough approximationsfor the task at hand. Gigerenzer et al. compared some satisficing methods (fast andfrugal heuristics) against some “optimal” algorithms (e.g. Bayesian networks) repre-senting unbounded rationality [13]. With complete knowledge and across 20 real-worldscenarios some simple heuristic strategies (minimalist and take the best) were foundto perform comparably to the algorithms [13]. If specific heuristics are accepted foruse as standard operating procedures we may look at providing visualization support toenhance them further or to reveal when they can not be trusted.
Arnott [2] has provided a taxonomy of biases and proposed a general decision sup-port design methodology utilizing these theories. Watkins [45] also reviewed many cog-nitive heuristics and biases and believed that they are worth considering for uncertaintyvisualization. While we agree that they are an important design consideration, espe-cially when providing a decision support tool, we should be wary of their potentialimpact on the analysis and discovery process, and so should perform research on theirrole in visualization in general.
If we assume two cognitive models of reasoning: associative and rule-based [34],then some issues may be more related to one system. The associative system may be di-rectly affected by Gestalt and a visualizations’ ability to convey the required uncertaintyfor immediate processing and consideration. There may be the flexibility in rule-basedreasoning to use methods that avoid the drawbacks of potential heuristics and biases.
Visualization of Uncertainty and Reasoning 169
With the more general rule-based reasoning we have the potential to learn and utilizeproblem solving “programs” that have been validated to some extent, but perhaps at thecost of sacrificing creativity and imagination (associative). A graphical or visualizationsystem should try to provide assistance to both systems but avoid leading users to theautomation heuristic.
2.3 Uncertainty and Reasoning Time-Frames
One fundamental constraint on the reasoning process is time. Time stress and other sit-uational attributes can distort our perception leading directly to biases [25]. This distor-tion adds uncertainty, confounding the uncertainty that may have led to the time stress.Strategies will vary based on the amount of time resources available. At a high level itmay be similar to game strategies in which search space (e.g. minimax tree) is prunedbased on the time allowed. Cognitive models such as Cohen et al.’s Metarecognition [3]have been proposed for time limited decision-making. In these cognitive models visu-alizations may illustrate uncertainty of the data, but visual support of meta-reasoningmay be the area where they can contribute the most.
Watkins created and analyzed an uncertainty glyph to depict three types of uncer-tainty and their sum in a decision support system [45]. One interesting finding was thatall analyst participants agreed somewhat or stronger that in general “uncertainty visual-ization would degrade the ability of most analysts and decision-makers to respond to or‘interpret a scenario’ in a timely manner”. The majority thought, however, it would notoverload decision-makers in less time-constrained situations, and were not comfortableadding data with associated uncertainty to a knowledge base without an uncertaintyvisualization.
Delay is also Lipshitz and Strauss’ first conceptual proposition: uncertainty in thecontext of action is a sense of doubt that blocks or delays action [22]. They cite Dewey’sstatement that problem solving is triggered by a sense of doubt that stops routine action[5], but dropped the important aspect that uncertainty triggers problem solving that ne-cessitates neither blocking or much delay. One should note that changes in uncertaintymay trigger action, and that delay can be the optimal “action”. An example of this maybe the space shuttle Challenger disaster, for which the criticality of data quality hasbeen discussed by Fisher and Kingma [9]. Tufte has also analyzed the space shuttleChallenger and Columbia disasters from a visualization point of view [40, 41], and onemay argue the most significant uncertainty was not in the data but in the reasoning.
2.4 Types of Reasoning Uncertainty
There are many taxonomies of uncertainty to be found in different domains. Lipshitzand Strauss found in a study of military decision makers that they distinguished be-tween inadequate understanding, incomplete information, and undifferentiated alterna-tives [22]. Different strategies were employed based on these types of uncertainty. Thustask considerations may dictate the types of uncertainty that are significant. Hence wewould suggest a user and task centered approach be taken with uncertainty issues.
Thomson et al. have constructed a typology for visualizing uncertainty in geospa-tially referenced data [39]. They considered Pang et al.’s low-level classification [31]
170 T. Zuk and S. Carpendale
Table 1. Extending Thomson et al.’s typology of uncertainty [39] to reasoning
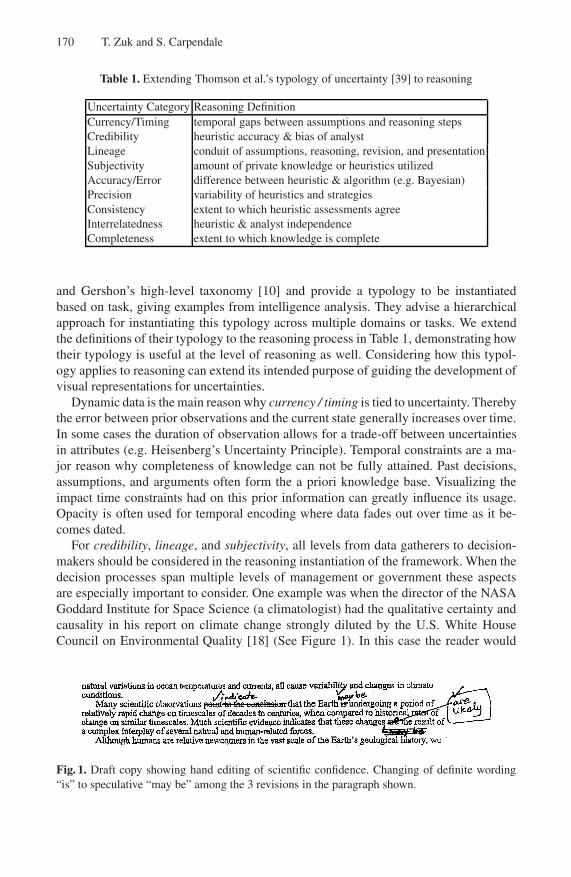
Uncertainty Category Reasoning DefinitionCurrency/Timing temporal gaps between assumptions and reasoning stepsCredibility heuristic accuracy & bias of analystLineage conduit of assumptions, reasoning, revision, and presentationSubjectivity amount of private knowledge or heuristics utilizedAccuracy/Error difference between heuristic & algorithm (e.g. Bayesian)Precision variability of heuristics and strategiesConsistency extent to which heuristic assessments agreeInterrelatedness heuristic & analyst independenceCompleteness extent to which knowledge is complete
and Gershon’s high-level taxonomy [10] and provide a typology to be instantiatedbased on task, giving examples from intelligence analysis. They advise a hierarchicalapproach for instantiating this typology across multiple domains or tasks. We extendthe definitions of their typology to the reasoning process in Table 1, demonstrating howtheir typology is useful at the level of reasoning as well. Considering how this typol-ogy applies to reasoning can extend its intended purpose of guiding the development ofvisual representations for uncertainties.
Dynamic data is the main reason why currency / timing is tied to uncertainty. Therebythe error between prior observations and the current state generally increases over time.In some cases the duration of observation allows for a trade-off between uncertaintiesin attributes (e.g. Heisenberg’s Uncertainty Principle). Temporal constraints are a ma-jor reason why completeness of knowledge can not be fully attained. Past decisions,assumptions, and arguments often form the a priori knowledge base. Visualizing theimpact time constraints had on this prior information can greatly influence its usage.Opacity is often used for temporal encoding where data fades out over time as it be-comes dated.
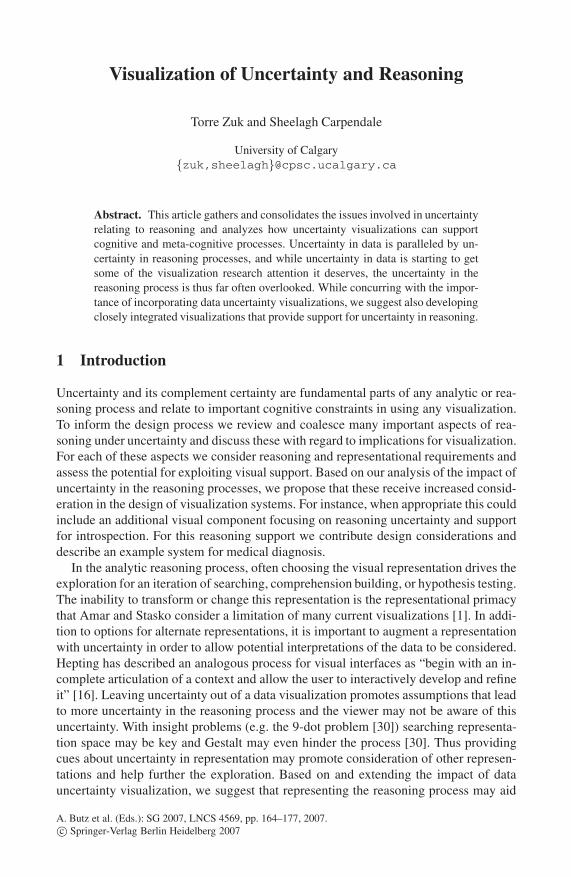
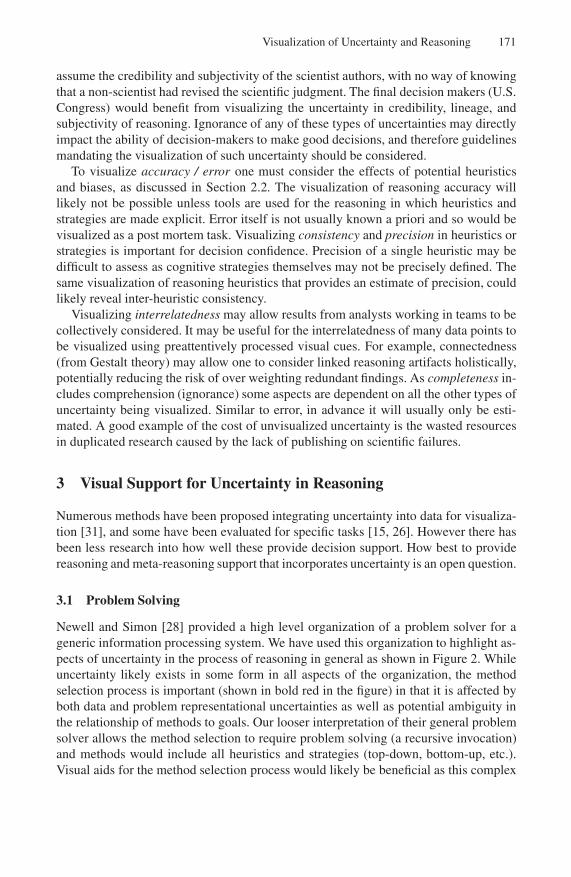
For credibility, lineage, and subjectivity, all levels from data gatherers to decision-makers should be considered in the reasoning instantiation of the framework. When thedecision processes span multiple levels of management or government these aspectsare especially important to consider. One example was when the director of the NASAGoddard Institute for Space Science (a climatologist) had the qualitative certainty andcausality in his report on climate change strongly diluted by the U.S. White HouseCouncil on Environmental Quality [18] (See Figure 1). In this case the reader would
Fig. 1. Draft copy showing hand editing of scientific confidence. Changing of definite wording“is” to speculative “may be” among the 3 revisions in the paragraph shown.
Visualization of Uncertainty and Reasoning 171
assume the credibility and subjectivity of the scientist authors, with no way of knowingthat a non-scientist had revised the scientific judgment. The final decision makers (U.S.Congress) would benefit from visualizing the uncertainty in credibility, lineage, andsubjectivity of reasoning. Ignorance of any of these types of uncertainties may directlyimpact the ability of decision-makers to make good decisions, and therefore guidelinesmandating the visualization of such uncertainty should be considered.
To visualize accuracy / error one must consider the effects of potential heuristicsand biases, as discussed in Section 2.2. The visualization of reasoning accuracy willlikely not be possible unless tools are used for the reasoning in which heuristics andstrategies are made explicit. Error itself is not usually known a priori and so would bevisualized as a post mortem task. Visualizing consistency and precision in heuristics orstrategies is important for decision confidence. Precision of a single heuristic may bedifficult to assess as cognitive strategies themselves may not be precisely defined. Thesame visualization of reasoning heuristics that provides an estimate of precision, couldlikely reveal inter-heuristic consistency.
Visualizing interrelatedness may allow results from analysts working in teams to becollectively considered. It may be useful for the interrelatedness of many data points tobe visualized using preattentively processed visual cues. For example, connectedness(from Gestalt theory) may allow one to consider linked reasoning artifacts holistically,potentially reducing the risk of over weighting redundant findings. As completeness in-cludes comprehension (ignorance) some aspects are dependent on all the other types ofuncertainty being visualized. Similar to error, in advance it will usually only be esti-mated. A good example of the cost of unvisualized uncertainty is the wasted resourcesin duplicated research caused by the lack of publishing on scientific failures.
3 Visual Support for Uncertainty in Reasoning
Numerous methods have been proposed integrating uncertainty into data for visualiza-tion [31], and some have been evaluated for specific tasks [15, 26]. However there hasbeen less research into how well these provide decision support. How best to providereasoning and meta-reasoning support that incorporates uncertainty is an open question.
3.1 Problem Solving
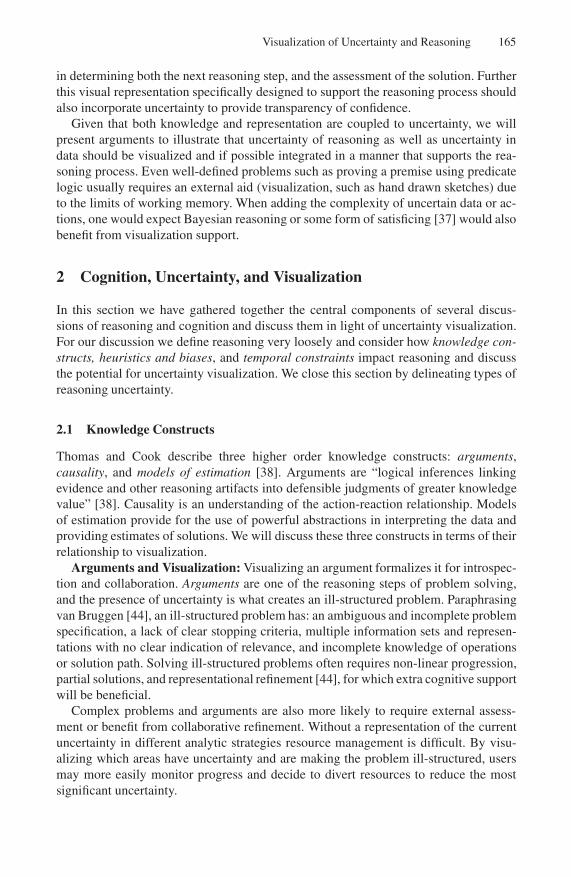
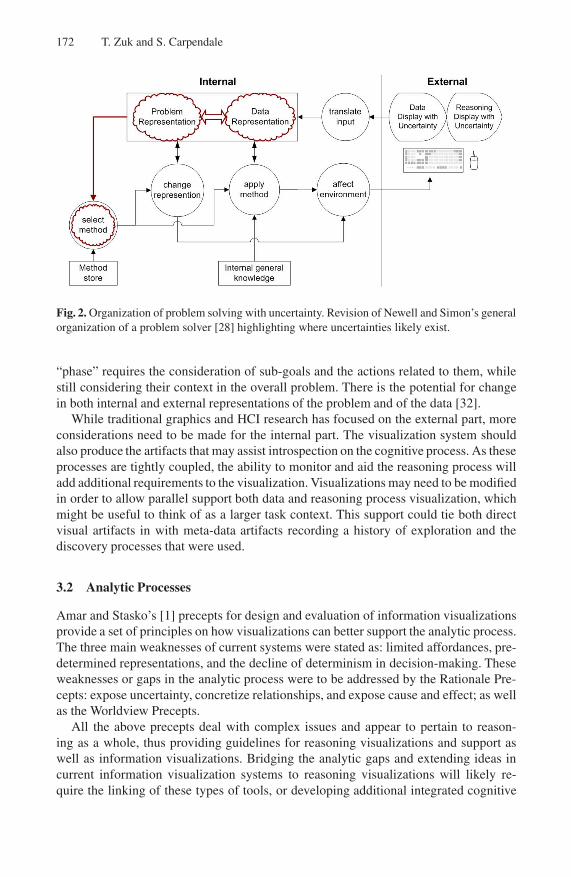
Newell and Simon [28] provided a high level organization of a problem solver for ageneric information processing system. We have used this organization to highlight as-pects of uncertainty in the process of reasoning in general as shown in Figure 2. Whileuncertainty likely exists in some form in all aspects of the organization, the methodselection process is important (shown in bold red in the figure) in that it is affected byboth data and problem representational uncertainties as well as potential ambiguity inthe relationship of methods to goals. Our looser interpretation of their general problemsolver allows the method selection to require problem solving (a recursive invocation)and methods would include all heuristics and strategies (top-down, bottom-up, etc.).Visual aids for the method selection process would likely be beneficial as this complex
172 T. Zuk and S. Carpendale
Fig. 2. Organization of problem solving with uncertainty. Revision of Newell and Simon’s generalorganization of a problem solver [28] highlighting where uncertainties likely exist.
“phase” requires the consideration of sub-goals and the actions related to them, whilestill considering their context in the overall problem. There is the potential for changein both internal and external representations of the problem and of the data [32].
While traditional graphics and HCI research has focused on the external part, moreconsiderations need to be made for the internal part. The visualization system shouldalso produce the artifacts that may assist introspection on the cognitive process. As theseprocesses are tightly coupled, the ability to monitor and aid the reasoning process willadd additional requirements to the visualization. Visualizations may need to be modifiedin order to allow parallel support both data and reasoning process visualization, whichmight be useful to think of as a larger task context. This support could tie both directvisual artifacts in with meta-data artifacts recording a history of exploration and thediscovery processes that were used.
3.2 Analytic Processes
Amar and Stasko’s [1] precepts for design and evaluation of information visualizationsprovide a set of principles on how visualizations can better support the analytic process.The three main weaknesses of current systems were stated as: limited affordances, pre-determined representations, and the decline of determinism in decision-making. Theseweaknesses or gaps in the analytic process were to be addressed by the Rationale Pre-cepts: expose uncertainty, concretize relationships, and expose cause and effect; as wellas the Worldview Precepts.
All the above precepts deal with complex issues and appear to pertain to reason-ing as a whole, thus providing guidelines for reasoning visualizations and support aswell as information visualizations. Bridging the analytic gaps and extending ideas incurrent information visualization systems to reasoning visualizations will likely re-quire the linking of these types of tools, or developing additional integrated cognitive
Visualization of Uncertainty and Reasoning 173
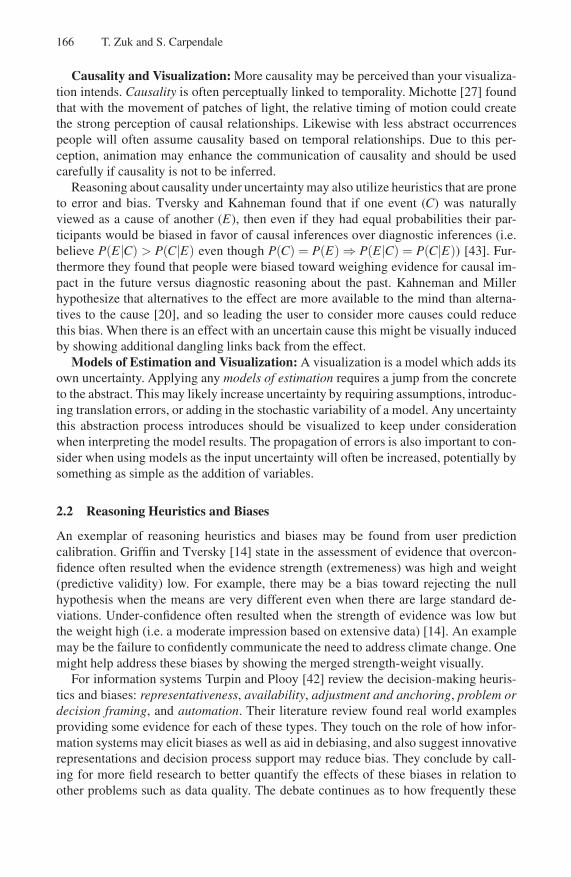
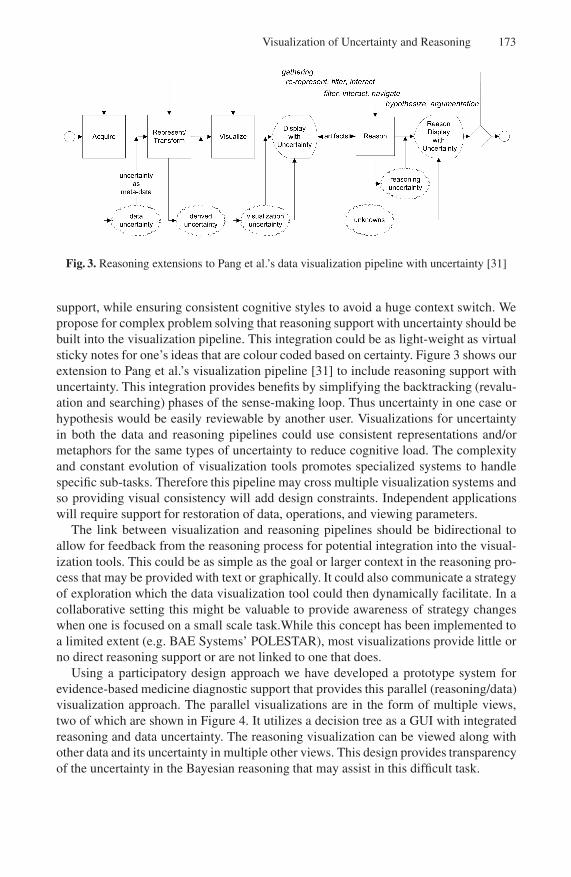
Fig. 3. Reasoning extensions to Pang et al.’s data visualization pipeline with uncertainty [31]
support, while ensuring consistent cognitive styles to avoid a huge context switch. Wepropose for complex problem solving that reasoning support with uncertainty should bebuilt into the visualization pipeline. This integration could be as light-weight as virtualsticky notes for one’s ideas that are colour coded based on certainty. Figure 3 shows ourextension to Pang et al.’s visualization pipeline [31] to include reasoning support withuncertainty. This integration provides benefits by simplifying the backtracking (revalu-ation and searching) phases of the sense-making loop. Thus uncertainty in one case orhypothesis would be easily reviewable by another user. Visualizations for uncertaintyin both the data and reasoning pipelines could use consistent representations and/ormetaphors for the same types of uncertainty to reduce cognitive load. The complexityand constant evolution of visualization tools promotes specialized systems to handlespecific sub-tasks. Therefore this pipeline may cross multiple visualization systems andso providing visual consistency will add design constraints. Independent applicationswill require support for restoration of data, operations, and viewing parameters.
The link between visualization and reasoning pipelines should be bidirectional toallow for feedback from the reasoning process for potential integration into the visual-ization tools. This could be as simple as the goal or larger context in the reasoning pro-cess that may be provided with text or graphically. It could also communicate a strategyof exploration which the data visualization tool could then dynamically facilitate. In acollaborative setting this might be valuable to provide awareness of strategy changeswhen one is focused on a small scale task.While this concept has been implemented toa limited extent (e.g. BAE Systems’ POLESTAR), most visualizations provide little orno direct reasoning support or are not linked to one that does.
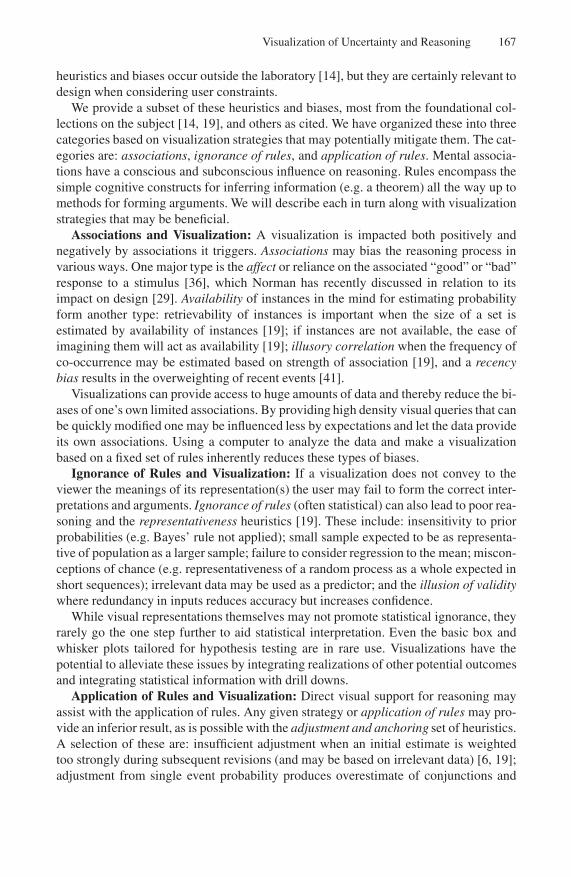
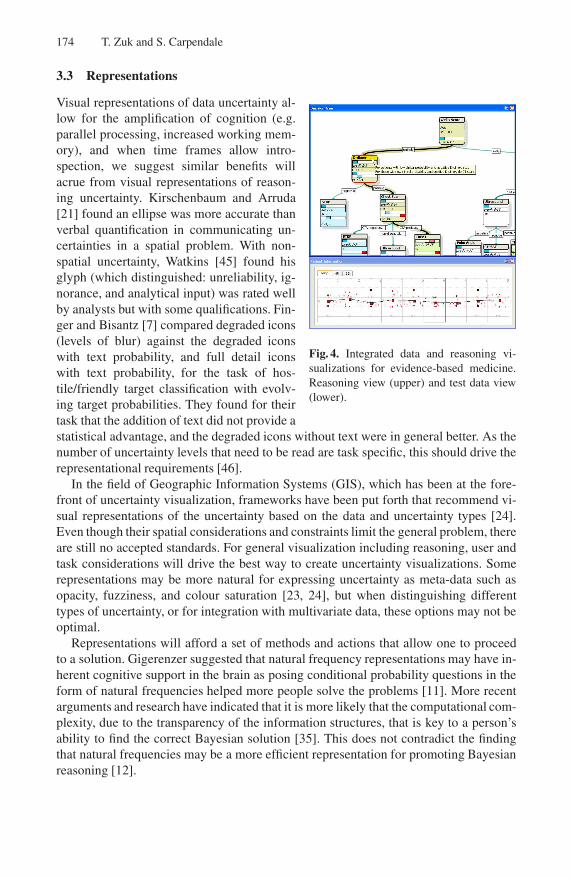
Using a participatory design approach we have developed a prototype system forevidence-based medicine diagnostic support that provides this parallel (reasoning/data)visualization approach. The parallel visualizations are in the form of multiple views,two of which are shown in Figure 4. It utilizes a decision tree as a GUI with integratedreasoning and data uncertainty. The reasoning visualization can be viewed along withother data and its uncertainty in multiple other views. This design provides transparencyof the uncertainty in the Bayesian reasoning that may assist in this difficult task.
174 T. Zuk and S. Carpendale
3.3 Representations
Fig. 4. Integrated data and reasoning vi-sualizations for evidence-based medicine.Reasoning view (upper) and test data view(lower).
Visual representations of data uncertainty al-low for the amplification of cognition (e.g.parallel processing, increased working mem-ory), and when time frames allow intro-spection, we suggest similar benefits willacrue from visual representations of reason-ing uncertainty. Kirschenbaum and Arruda[21] found an ellipse was more accurate thanverbal quantification in communicating un-certainties in a spatial problem. With non-spatial uncertainty, Watkins [45] found hisglyph (which distinguished: unreliability, ig-norance, and analytical input) was rated wellby analysts but with some qualifications. Fin-ger and Bisantz [7] compared degraded icons(levels of blur) against the degraded iconswith text probability, and full detail iconswith text probability, for the task of hos-tile/friendly target classification with evolv-ing target probabilities. They found for theirtask that the addition of text did not provide astatistical advantage, and the degraded icons without text were in general better. As thenumber of uncertainty levels that need to be read are task specific, this should drive therepresentational requirements [46].
In the field of Geographic Information Systems (GIS), which has been at the fore-front of uncertainty visualization, frameworks have been put forth that recommend vi-sual representations of the uncertainty based on the data and uncertainty types [24].Even though their spatial considerations and constraints limit the general problem, thereare still no accepted standards. For general visualization including reasoning, user andtask considerations will drive the best way to create uncertainty visualizations. Somerepresentations may be more natural for expressing uncertainty as meta-data such asopacity, fuzziness, and colour saturation [23, 24], but when distinguishing differenttypes of uncertainty, or for integration with multivariate data, these options may not beoptimal.
Representations will afford a set of methods and actions that allow one to proceedto a solution. Gigerenzer suggested that natural frequency representations may have in-herent cognitive support in the brain as posing conditional probability questions in theform of natural frequencies helped more people solve the problems [11]. More recentarguments and research have indicated that it is more likely that the computational com-plexity, due to the transparency of the information structures, that is key to a person’sability to find the correct Bayesian solution [35]. This does not contradict the findingthat natural frequencies may be a more efficient representation for promoting Bayesianreasoning [12].
Visualization of Uncertainty and Reasoning 175
Cognitive support may be given by providing uncertainty or ambiguity in represen-tations to provide clues to potential representational transformations or new representa-tions. User interactivity in selecting the representation, while often difficult to providein a visualization, implicitly communicates to the viewer that there is uncertainty in theoptimal representation(s). At a meta level, visualizing your own reasoning process canalso reveal a bias or suggest a new strategy. Representations of the reasoning processwhich illustrate uncertainty will help one perform this introspection.
4 Conclusion
We have described how the cognitive issues of reasoning under uncertainty relate tovarious aspects of visualization and provided some guidance as to how one may addressthese issues. As a result of the complexity and uncertainty in the reasoning process wesee potential in the integration of data and reasoning visualizations. This integrationof the discovery process and sense-making loops, would provide a direct visualizationof the entire analytic process, and might facilitate the exposure of analytic gaps. Withoutthis type of cognitive support monitoring the effect of uncertainty in the data and theanalytic process will be extremely difficult.
When we create new support there is a potential hazard if the external visualiza-tion does not diminish cognitive load, it may in fact raise it, thereby preventing theformation of schemata [44]. Therefore when the performance of sub-tasks require com-plete attention this level of integration may be more useful as an analytic context oran audit trail. Multiple views or the easy movement of reasoning artifacts between thetwo visualization systems could maintain this context without adding cognitive load.The visualization we briefly introduced (medical diagnostic support) illustrated that forsome problem areas a reasoning component can exist as a natural and central compo-nent of the interface. As uncertainty abounds in the reasoning process we expect thatvisualization of the uncertainty will enhance problem-solving and decision-making.
Acknowledgements
We gratefully thank NSERC for funding this research and the Government Account-ability Project for providing source material.
References
[1] Amar, R., Stasko, J.: Knowledge precepts for design and evaluation of information visual-izations. Visualization and Computer Graphics, IEEE Trans. on 11(4), 432–442 (2005)
[2] Arnott, D.: Cognitive biases and decision support systems development: a design scienceapproach. Information Systems Journal 16, 55–78 (2006)
[3] Cohen, M.S., Freeman, J.T., Wolf, S.: Metarecognition in time-stressed decision making:Recognizing, critiquing, and correcting. Human Factors 38(2), 206–219 (1996)
[4] Cohen, M.S., Parasuraman, R., Freeman, J.T.: Trust in decision aids: A model and its train-ing implications. In: Proceedings 1998 Command and Control Research and TechnologySymposium (1998)
176 T. Zuk and S. Carpendale
[5] Dewey, J.: How We Think. Dover Publications (1997)[6] Edwards, W.: Conservatism in human information processing. In: Kahneman, D., Slovic,
P., Tversky, A. (eds.) Judgment under Uncertainty: Heuristics and biases, pp. 359–369.Cambridge University Press, Cambridge (1982)
[7] Finger, R., Bisantz, A.M.: Utilizing graphical formats to convey uncertainty in a decisionmaking task. Theoretical Issues in Ergonomics Science 3(1), 1–25 (2002)
[8] Debiasing, B.F.: In: D. Kahneman et al editor, Judgment under Uncertainty: Heuristics andbiases, pp. 422–444. Cambridge University Press, Cambridge (1982)
[9] Fisher, C.W., Kingma, B.R.: Criticality of data quality as exemplified in two disasters. In-formation and Management 39, 109–116 (2001)
[10] Gershon, N.: Short note: Visualization of an imperfect world. IEEE Computer Graphics andApplications 18(4), 43–45 (1998)
[11] Gigerenzer, G., Hoffrage, U.: How to improve bayesian reasoning without instruction: Fre-quency formats. Psychological Review 102(4), 648–704 (1995)
[12] Gigerenzer, G., Hoffrage, U.: Overcoming difficulties in bayesian reasoning: A reply toLewis and Keren (1999) and Mellers and McGraw (1999). Psychological Review 106(2),425–430 (1999)
[13] Gigerenzer, G., Czerlinski, J., Marignon, L.: How good are fast and frugal heuristics. In:Gilovich, T., et al.(ed.) Heuristics and Biases: The Psychology of Intuitive Judgment, pp.559–581. Cambridge University Press, Cambridge (2003)
[14] Griffin, D., Tversky, A.: The weighing of evidence and the determinants of confidence. In:Gilovich, T., et al. (ed.) Heuristics and Biases: The Psychology of Intuitive Judgment, pp.230–249. Cambridge University Press, Cambridge (2003)
[15] Grigoryan, G., Rheingans, P.: Point-based probabilistic surfaces to show surface uncertainty.IEEE Transactions on Visualization and Computer Graphics 10(5), 564–573 (2004)
[16] Hepting, D.H.: Towards a visual interface for information visualization. In: InformationVisualisation, 2002. Proc. Sixth International Conference on, pp. 295–302. IEEE ComputerSociety Press, Los Alamitos (2002)
[17] Howell, W.C., Burnett, S.A.: Uncertainty measurement. Organizational Behaviour and Hu-man Performance 22, 45–68 (1978)
[18] C.B.S. Broadcasting Inc.: Rewriting the science. 2006. (visited April 2007) http://www.cbsnews.com/stories/2006/03/17/60minutes/main1415985.shtml
[19] Kahneman, D., Slovic, P., Tversky, A. (eds.): Judgment under Uncertainty: Heuristics andbiases. Cambridge University Press, Cambridge (1982)
[20] Kahneman, D., Miller, D.T.: Norm theory: Comparing reality to its alternatives. In:Gilovich, T., Griffin, D., Kahneman, D. (eds.) Heuristics and Biases: The Psychology ofIntuitive Judgment, pp. 348–366. Cambridge University Press, Cambridge (2003)
[21] Kirschenbaum, S.S., Arruda, J.E.: Effects of graphic and verbal probability information oncommand decision making. Human Factors 36(3), 406–418 (1994)
[22] Lipshitz, R., Strauss, O.: Coping with uncertainty: A naturalistic decision-making analysis.Organizational Behaviour and Human Decision Processes 69, 149–163 (1997)
[23] MacEachren, A.M.: Visualizing uncertain information. Cartographic Perspective 13, 10–19(1992)
[24] MacEachren, A.M., Robinson, A., Hopper, S., Gardner, S., Murray, R.: Visualizing geospa-tial information uncertainty: What we know and what we need to know. Cartography andGeographic Information Science 32(3), 139–160 (2005)
[25] Mandel, R.: Perception, Decision Making and Conflict. University Press of America, Wash-ington, D.C. (1979)
Visualization of Uncertainty and Reasoning 177
[26] Masalonis, A., Mulgund, S., Song, L., Wanke, C., Zobell, S.: Using probabilistic demandprediction for traffic flow management decision support. In: Proceedings of the 2004 AIAAGuidance, Navigation, and Control Conference. American Institute of Aeronautics and As-tronautics (2004)
[27] Michotte, A.: The Perception of Causality. Methuen, London, Translated by T. Miles andE. Miles (1963)
[28] Newell, A., Simon, H.A.: Human Problem Solving. Prentice-Hall Inc, New Jersey (1972)[29] Norman, D.A.: Emotional Design: Why We Love (Or Hate) Everyday Things. Basic Books
(2003)[30] Novick, L.R., Bassok, M.: Problem solving. In: Holyoak, K.J., Morrison, R.G. (eds.) The
Cambridge Handbook of Thinking and Reasoning, pp. 321–349. Cambridge UniversityPress, Cambridge (2005)
[31] Pang, A.T., Wittenbrink, C.M., Lodha, S.K.: Approaches to uncertainty visualization. The.Visual Computer 13(8), 370–390 (1997)
[32] Scaife, M., Rogers, Y.: External cognition: how do graphical representations work? Int. J.Human Computer Studies 45, 185–213 (1996)
[33] Skitka, L.J., Mosier, K.L., Burdick, M.: Does automation bias decision-making? Int. J.Human-Computer Studies 51, 991–1006 (1999)
[34] Sloman, S.A.: Two systems of reasoning. In: Gilovich, T., Griffin, D., Kahneman, D. (eds.)Heuristics and Biases: The Psychology of Intuitive Judgment, pp. 379–396. CambridgeUniversity Press, Cambridge (2003)
[35] Sloman, S.A., Over, D., Slovak, L., Stibel, J.M.: Frequency illusions and other fallacies.Organizational Behaviour and Human Decision Processes 91, 296–309 (2003)
[36] Slovic, P., Finucane, M., Peters, E., MacGregor, D.G.: The affect heuristic. In: Gilovich,T., Griffin, D., Kahneman, D. (eds.) Heuristics and Biases: The Psychology of IntuitiveJudgment, pp. 397–420. Cambridge University Press, Cambridge (2003)
[37] Stirling, W.C.: Satisficing Games and Decision Making. Cambridge University Press, Cam-bridge, UK (2003)
[38] Thomas, J.J., Cook, K.A. (eds.): Illuminating the Path: The Research and DevelopmentAgenda for Visual Analytics. IEEE Computer Society (2005)
[39] Thomson, J., Hetzler, E., MacEachren, A., Gahegan, M., Pavel, M.: A typology for visual-izing uncertainty. In: Proc. SPIE & IS&T Conf. Electronic Imaging. Visualization and DataAnalysis 2005, vol. 5669, pp. 146–157 (2005)
[40] Tufte, E.R.: Visual Explanations. Graphics Press, Cheshire, CT (1997)[41] Tufte, E.R.: Beautiful Evidence. Graphics Press, Cheshire, CT (2006)[42] Turpin, M., du Plooy, N.: Decision-making biases and information systems. In: Decision
Support in an Uncertain and Complex World: The IFIP TC8/WG8.3 International Confer-ence 2004, pp. 782–792 (2004)
[43] Tversky, A., Kahneman, D.: Causal schemas in judgements of uncertainty. In: Gilovich,T., Griffin, D., Kahneman, D. (eds.) Heuristics and Biases: The Psychology of IntuitiveJudgment, Cambridge University Press, Cambridge (2003)
[44] van Bruggen, J.M., Boshuizen, H.P.A., Kirshner, P.A.: A cognitive framework for coop-erative problem solving with argument visualization. In: Kirshner, P.A. (ed.) VisualizatingArgumentation: Software Tools for Collaboration and Educational Sense-Making, pp. 25–47. Springer, Heidelberg (2003)
[45] Watkins, E.T.: Improving the analyst and decision-maker’s perspective through uncertaintyvisualization. In: Master’s thesis, Air Force Institute of Technology, Wright-Patterson AirForce Base, Ohio (2000)
[46] Zuk, T., Carpendale, M.S.T., Glanzman, W.D.: Visualizing temporal uncertainty in 3D vir-tual reconstructions. In: Proc. of the 6th International Symposium on Virtual Reality, Ar-chaeology and Cultural Heritage (VAST 2005), pp. 99–106 (2005)