Embed Size (px)
Citation preview

03/11/09 www.cac.cornell.edu
Visualization on TeraGrid at TACC
Drew DolgertCornell Center for Advanced Computing

03/11/09 www.cac.cornell.edu
TeraGrid-Scale Visualization atTexas Advanced Computing Center
• Ranger: Sun cluster, 3936 nodes, 62976 cores• Spur: Sun vis. Cluster, 128 cores, 1TB MEM, 32 GPU
• TeraGrid scale• Run remotely• Modern tools

03/11/09 www.cac.cornell.edu
Ranger Job Batch System
Assign jobSend jobranger schedulerExecute
job
• You give the scheduler a script. It goes, runs it when it has time.
• You don't get to login to the compute nodes where the work is done.

03/11/09 www.cac.cornell.edu
Ranger Jobs Run in Batch#!/bin/bash
#$ -V # Inherit the submission environmen#$ -cwd # Start job in submission dir#$ -N visit.job # Job name#$ -j y # stderr and stdout into stdo#$ -o $HOME/$JOB_NAME.o$JOB_ID # Name of the output file#$ -pe 16way 16 # Request 1 Ranger node#$ -q normal # Queue name#$ -A TG-MyTGAcct # Account#$ -l h_rt=01:00:00 # runtime (hh:mm:ss) - 1 hour
# configure environment for visitmodule purgemodule load TACCmodule delete pgi mvapich CTSSV4module load intel mvapichmodule load vis mesa visit/1.10.0
# run visitvisit -cli -nowin –s myVisItScript.py

03/11/09 www.cac.cornell.edu
• ssh to spur.tacc.utexas.edu• Submit a job to get access to vis[1-7,big] node.• Run many ways
– Ssh to spur, then ssh to the node from spur.– Run VNC to the node, through spur.– Do something in the job script.– Let the application connect to the node, through spur.
spur
vis1
visbigvis7
vis6vis5
vis4
vis2
vis3Incoming
connections

03/11/09 www.cac.cornell.edu
Spur Nodes
• Each node has multiple GPUs.• The batch job can assign a GPU to your processes.• 4 quad-core AMD Opteron processors• 4 GPUs, NVIDIA FX 5600• 128 GB RAM (visbig has 256 GB)
No GPU on Ranger nodes.32 GB memory on Ranger node.

03/11/09 www.cac.cornell.edu
What Software is on Spur?
• Paraview• VisIt• Ensight• Amira (on vis6) • IDL General purpose
Capable of complicated 3DParallel processing capable

03/11/09 www.cac.cornell.edu
VisIt Example
03/11/09 www.cac.cornell.edu
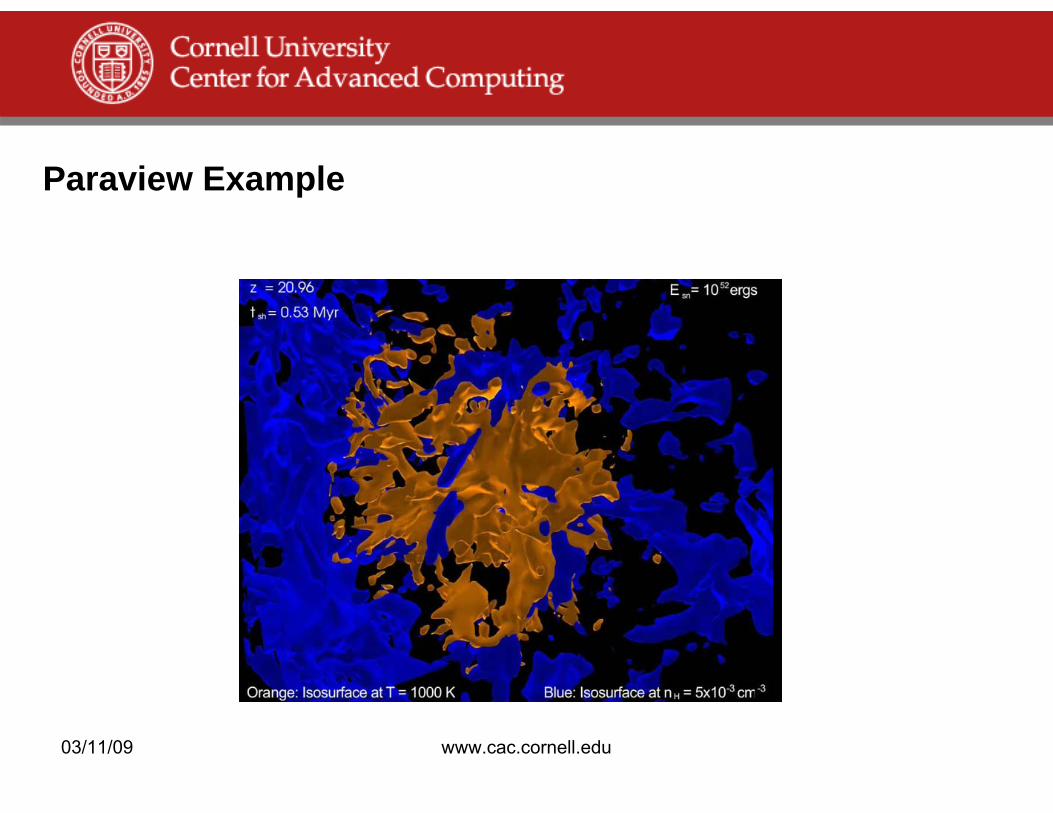
Paraview Example
03/11/09 www.cac.cornell.edu
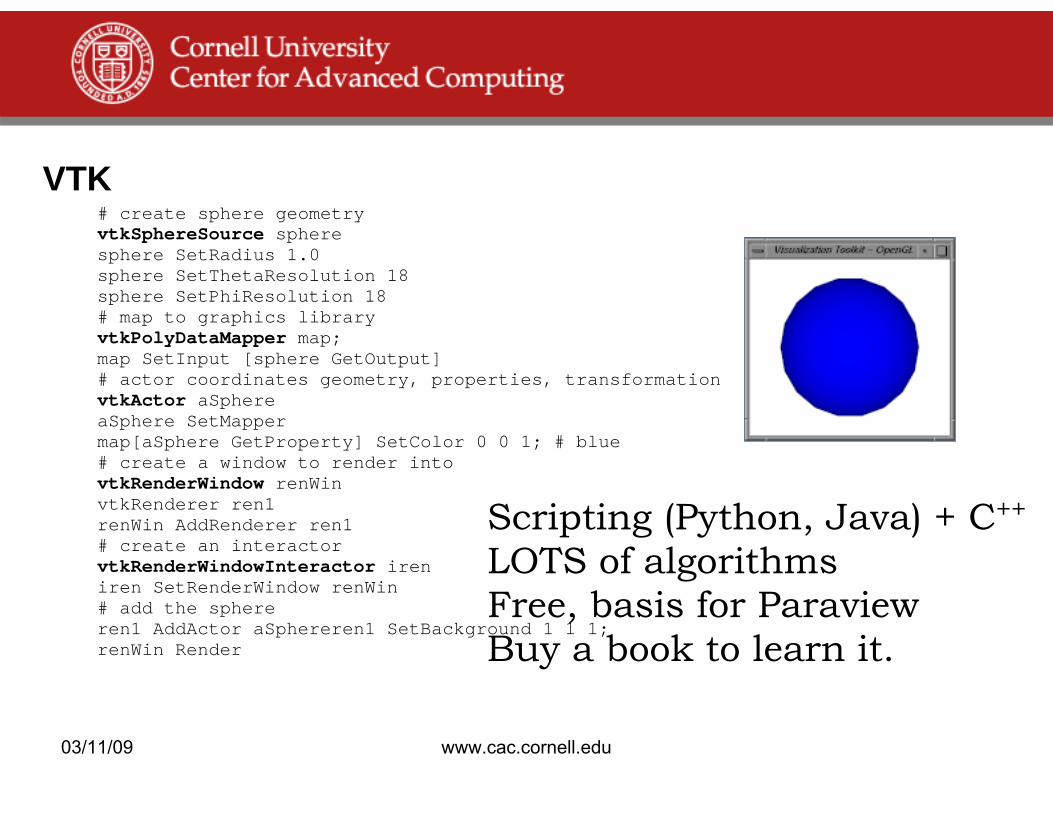
VTK# create sphere geometryvtkSphereSource spheresphere SetRadius 1.0sphere SetThetaResolution 18sphere SetPhiResolution 18# map to graphics libraryvtkPolyDataMapper map;map SetInput [sphere GetOutput]# actor coordinates geometry, properties, transformationvtkActor aSphereaSphere SetMapper map[aSphere GetProperty] SetColor 0 0 1; # blue# create a window to render intovtkRenderWindow renWinvtkRenderer ren1renWin AddRenderer ren1# create an interactorvtkRenderWindowInteractor ireniren SetRenderWindow renWin# add the sphereren1 AddActor aSphereren1 SetBackground 1 1 1;renWin Render
Scripting (Python, Java) + C++
LOTS of algorithmsFree, basis for ParaviewBuy a book to learn it.

03/11/09 www.cac.cornell.edu
Spur Software Supporting Players
• Mesa – Software OpenGL alternative.• Imagemagick – 2D image manipulation.• Netpbm – Converts all sorts of images.• Qt – Windowing toolkit• CUDA SDK – To program GPUs.• Regular cluster stuff (anything you can do I can do better)
– MPI, OpenMP in many versions.– Hmmer, Amber, Charm– Petsc, fftw3, metis, scalapack, gotoblas
• Whatever you install in your home directory.
03/11/09 www.cac.cornell.edu
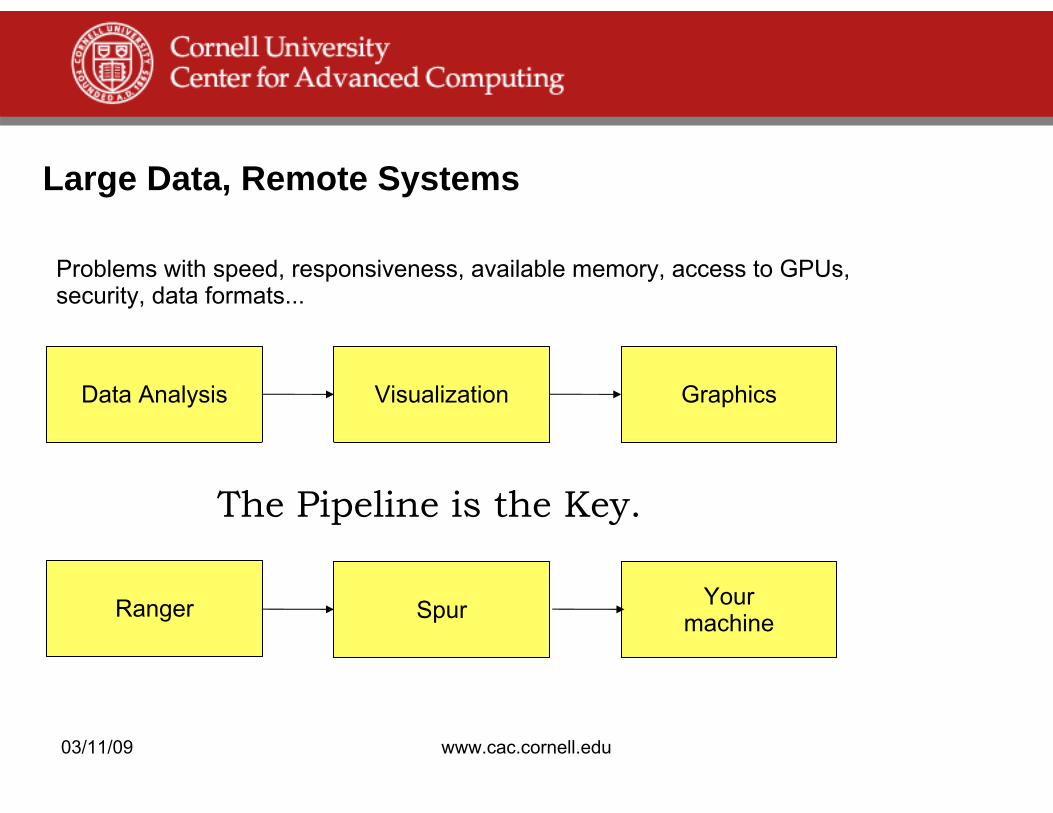
Large Data, Remote Systems
Data Analysis Visualization Graphics
The Pipeline is the Key.
Ranger Spur Yourmachine
Problems with speed, responsiveness, available memory, access to GPUs,security, data formats...
03/11/09 www.cac.cornell.edu
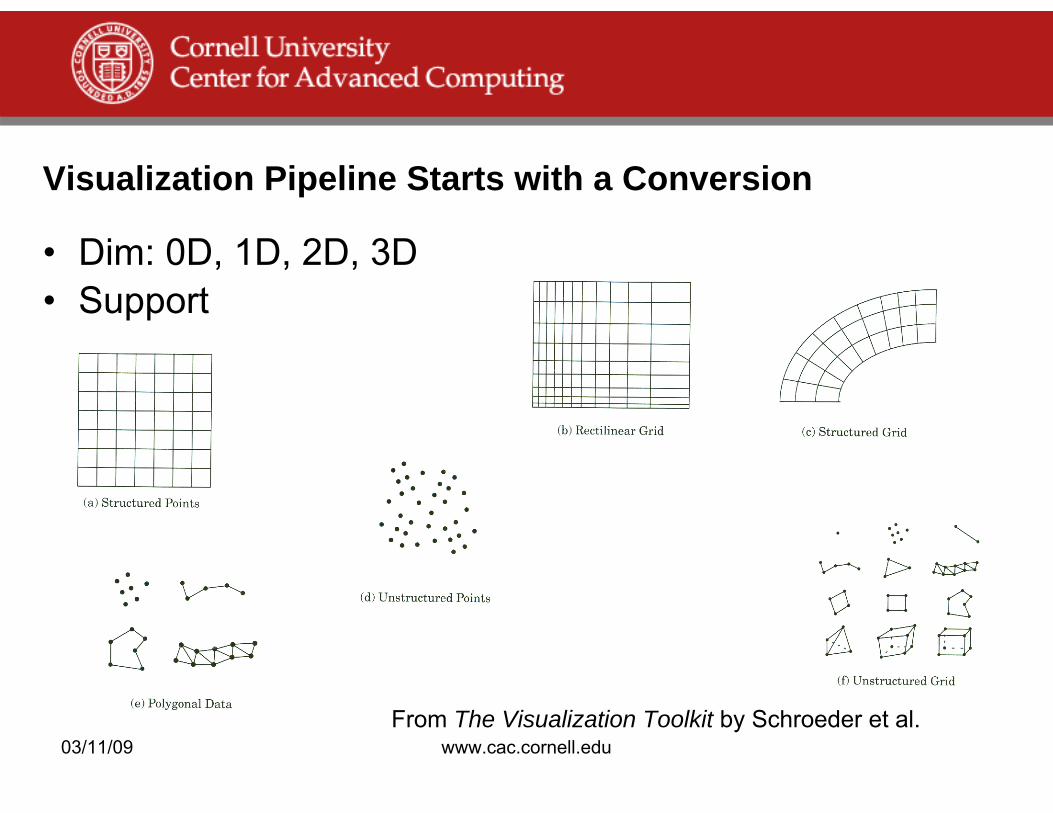
Visualization Pipeline Starts with a Conversion
• Dim: 0D, 1D, 2D, 3D• Support
From The Visualization Toolkit by Schroeder et al.

03/11/09 www.cac.cornell.edu
Then Put Data on that Support
• Scalar / Vector / Tensor• Point pairs, materials• Discrete, pseudo-cont.• Nominal, ordinal,
interval, ratio.• Node-centered
or links.Input datasets will have lists of scalar, vector, and tensor data associated with given supports.

03/11/09 www.cac.cornell.edu
Graph Layout: Visualization of the hierarchical topology of the international web cache. Developed by B. Huffaker at the Cooperative Association for Internet Data Analysis
Sequoiaview uses Treemaps for Harddisk Visualisation
Parallel Coordinates http://www.comp.leeds.ac.uk/richardh/astro/index.html
Different data formatsInformation Visualization.

03/11/09 www.cac.cornell.edu
The Pipeline Begins
• Read Data• Translate it to application format• Execute Module A• Execute Module B• Write result to file or screen
How large is the data after each step?What are your goals for doing it better?What can be done in parallel?
Read
Contour
Slice
Display

03/11/09 www.cac.cornell.edu
Example: Molecular Dynamics
• Start with x,y,z, atom type at each timestep.• One pipeline associates a colored sphere with each
atom. Displays it to a 1024x768 image.– atoms -> scalar (atom type) in space -> polygons w/scalar ->
polygons w/color -> rendered pixels– Polygons larger than atom file. Rendered smaller than either.
• Another pipeline computes electronic energy, finds isovalues in it, and shows semi-transparent surfaces around the atoms.– Atoms -> scalar on a regular 3D grid -> polygons w/scalar– Some of calculation is scientific, some visualization.

03/11/09 www.cac.cornell.edu
Parallel Visualization Pipeline
• With many processors, split up the data when you read.
• Each process works onits part of the dataset.
• Aggregate for display.
Read
Contour
Slice
Display
Read
Contour
Slice
Display
Read
Contour
Slice
Display
Read
Contour
Slice
Display

03/11/09 www.cac.cornell.edu
Task Parallelism
TimestepsProcesses 1 2 3 4 5
1 Read file 1 Isosurface Cut plane 12 Read file 2 Streamlines 2 Render3 Read file 3 Triangulate 3 Decimate 3 Glyph 3
Running an MPI-parallel isosurface algorithm on several nodes isless efficient than running it on a single node, although it takeslonger. Task parallelism can offer more speed if it is balanced.

03/11/09 www.cac.cornell.edu
Pipeline Parallelism
TimestepsProcesses 1 2 3 4 5
1 Read file 1 Read file 2 Read File 32 Isosurface 1 Isosurface 2 Isosurface 33 Render 1 Render 2 Render 3
• If process 1 can read faster, process 3 better at rendering.
• Increases render rate without decreasing efficiency

03/11/09 www.cac.cornell.edu
TimestepsProcesses 1 2 3
1 Read partition 1 Isosurface partition 1 Render partition 12 Read partition 2 Isosurface partition 2 Render partition 23 Read partition 3 Isosurface partition 3 Render partition 3
Data Parallel
• When one computer can't handle a filter's memory requirements.
• Some algorithms handle whole dataset with many CPUs.
• Others can be run completely independently on each CPU.

03/11/09 www.cac.cornell.edu
Domain Decomposition for Data Parallel
• Some algorithms need neighbors, called ghosting.
boo

03/11/09 www.cac.cornell.edu
Decomposition Imbalance
• Irregular grids don't decompose nicely.• Subsequent modules may
worsen imbalance.• Paraview uses D3:
Distributed Data Decompositionto rebalance.
• Can be done anywhere in the pipeline.
0 1
2 3

03/11/09 www.cac.cornell.edu
Architecture for Parallel Visualization
• Data servers for numerics, render for graphics• TCP to coordinate MPI• “server”=data+render• Start client then
Start servers with MPI.• Renderers like GPUs.
Client
render
render
render
render
render
data
data
data
data
data
dataTCPTCP
MPI
03/11/09 www.cac.cornell.edu
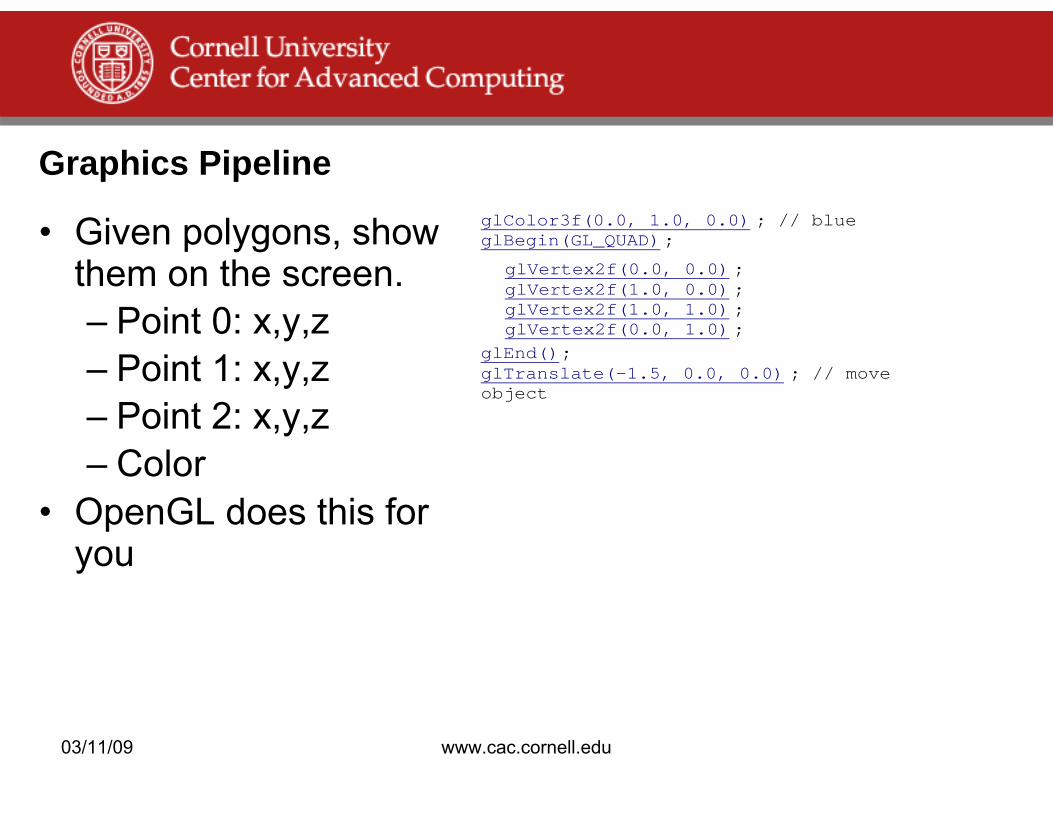
Graphics Pipeline
• Given polygons, show them on the screen.– Point 0: x,y,z– Point 1: x,y,z– Point 2: x,y,z– Color
• OpenGL does this for you
glColor3f(0.0, 1.0, 0.0) ; // blueglBegin(GL_QUAD);
glVertex2f(0.0, 0.0) ;glVertex2f(1.0, 0.0) ;glVertex2f(1.0, 1.0) ;glVertex2f(0.0, 1.0) ;
glEnd();glTranslate(-1.5, 0.0, 0.0) ; // moveobject

03/11/09 www.cac.cornell.edu
object camera
Camera – Lighting – Object
light
Near and farclipping planes

03/11/09 www.cac.cornell.edu
What's Wrong?

03/11/09 www.cac.cornell.edu
Answers
• The camera can point the wrong way.• Lights are off.• Object beyond near and far clipping planes.• OpenGL polygons can be one-sided, transparent from
behind.• Flickering polygons can happen when two polygons
nearly overlap. May need to offset them artificially.

03/11/09 www.cac.cornell.edu
Who's In Front Is A Problem
object
camera
light
Near and farclipping planes
object
Especially for transparency.
• Z-buffer• Sorting

03/11/09 www.cac.cornell.edu
Sorting Among Servers
• Uses tree, binary methods for opaque polygons.• Important for speed.• Transparency can have artifacts.• “Disable Ordered
Compositing”
From The Paraview Guide by Amy Squillacote.

03/11/09 www.cac.cornell.edu
Graphics Pipeline
ModelingTransformation Trivial Rejection
Display
Illumination ViewingTransformation
RasterizationProjectionClipping

03/11/09 www.cac.cornell.edu
Graphics Pipeline In English
• Squeeze the world of your polygons into a normalized box.
• Rotate, translate, and scale them according to camera and model positions.
• Figure out what color they should be from lighting.• Flatten them to a 2D world.• Scan through the lines, turning them into pixels.• (Along the way, cut out anything that won't be visible.)
Geometry, then Rasterization.

03/11/09 www.cac.cornell.edu
Big Data and Graphics
• Big data usually means lots of geometry.• Rasterization is a function of the size of the display
screen.
Draw thesepolygons
Draw thesepixels
Show thisscientific data
VNCX Windows with GLX
Copy data fromRanger to yourdesktop.
Chromium

03/11/09 www.cac.cornell.edu
X Windows and X Display Protocol
• Messages like:– Use Courier-New.– Make a Window.– Draw a Menu.– Show bitmap.
• GLX, OpenGL for X Windows– Gives a context to OpenGL programs.– Sends polygons over the wire.– Your workstation's card does drawing.– Xming, Exceed don't do it. Exceed3D does. From wikipedia
03/11/09 www.cac.cornell.edu
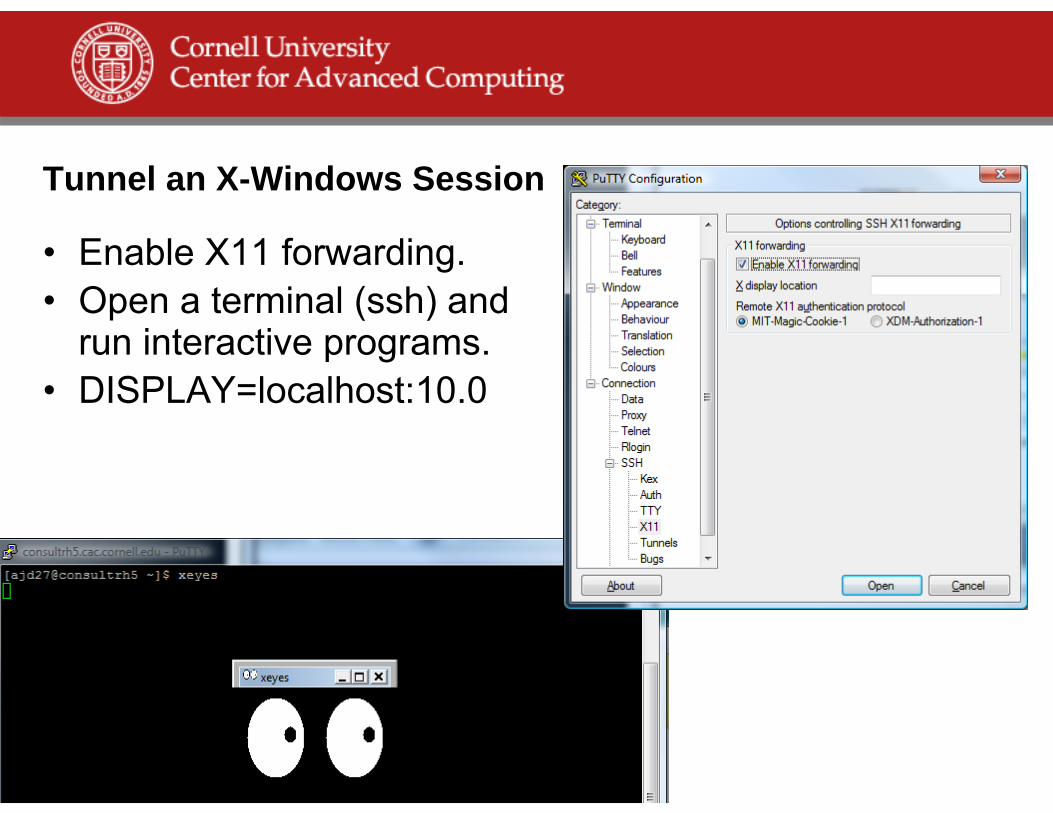
Tunnel an X-Windows Session
• Enable X11 forwarding.• Open a terminal (ssh) and
run interactive programs.• DISPLAY=localhost:10.0

03/11/09 www.cac.cornell.edu
VNC Virtual Network Computing
server client
• Sends remote framebuffers = rectangle of pixels• OpenGL done on remote machine.• Starts a desktop on the remote machine (:1, :2).• Listens on port 5901, 5902...• Has its own vncpassword.• Must use ssh tunnel for security.

03/11/09 www.cac.cornell.edu
Secure Shell Tunneling
SpurYourMachine
Ssh connection
Server listens on port 5901.
SSH listens on port 5901
Your applicationconnects tolocalhost:5901
Your application is actuallytalking to spur:5901.

03/11/09 www.cac.cornell.edu
Weigh Alternatives for the Last Mile
• Single screen, lots of triangles -> VNC• Many screens -> Maybe Sage or Chromium• Lots of processing, little output -> Paraview client
locally, gets data from cluster.• VNC is a generally good bet.

03/11/09 www.cac.cornell.edu
Parallelism in All PartsData
GenerationVisualization
PipelineGraphicsPipeline
compute visdata render display
compute visdata render display
compute visdata render display
• Memory limitations, transparency, network latency, GPUs, decomposition algorithms

03/11/09 www.cac.cornell.edu
What's Slow?
• Each click or spin of the model.– Under VNC, message to TACC and back has latency.– With X-Windows, rotation could be done locally.
• Watching a movie of data.– Depends more on bandwidth.– 1280X1024 pixels of 24 bits at 12 times a second = 360
MBps• Lots of data.
– Reading from disk.– Doing the actual calculation.– GPU always helpful rendering, sometimes helpful earlier.

03/11/09 www.cac.cornell.edu
Complications
• 62976 cores wrote your atom data.– Save to /scratch/tgusername to read from spur.– Do some processing by each core before writing that data.– Visualize it while it runs.
• Your data lives far from spur.– TeraGrid connections are much faster and cheaper.– What can you preprocess to make transfer smaller?
The line between analysis and visualization is blurry. Save / transfer what you need.

03/11/09 www.cac.cornell.edu
Human Pipeline
• Can you really see all those little triangles?• 1x1 pixel has no color• 3D + colors + movement? Funny glasses?• Depth of understanding of complex data comes
more from speed of interaction, ability to shift focus, than from increasing complexity of what we see.