Embed Size (px)
Citation preview
Visualization/dissemination of 3D Cadastre
Barbara CEMELLINI, The Netherlands, Rod THOMPSON, Australia,
Marian DE VRIES, The Netherlands, and Peter VAN OOSTEROM, The Netherlands
Key words: 3D cadastre, visualization, web-viewer
SUMMARY
More and more countries in the world are developing 3D Cadastre. To make cadastral
information available to the potential users, both cadastral sector professionals and normal
citizens, the Web can be used as dissemination platform. However, visualization of 3D cadastral
information is still a challenge.
Some of the main issues are: occlusion, distortion, unbounded volumes, perception of position,
size and shape of an object. For orientation purposes, it is important to include reference objects
to help us understand the location of the parcels in the real world. Although, the resulting higher
number of objects makes the clear visualization even more challenging.
We therefore first investigate the requirements to obtain a proper, clear and not misleading
visualisation of 3D cadastral parcels through a geo-web viewer. We explore how to handle the
above-mentioned issues such as occlusion, distortion and ambiguous perception (in terms of
position, size and shape) of objects while interacting with 3D cadastre. Also, techniques for
combining the visualization of legal boundaries (cadastral parcels) and real-world objects
(topography) are analysed.
The overall technical architecture of a system for the dissemination 3D Cadastral parcels is
presented, starting with the storage of the data at the backend server (DBMS and webserver)
and the possible encodings for data transfer (such as XML, JSON, glTF) to the client. WebGL
based solutions at client side are preferred as these do not require the download of a plugin in
the web browser, while still offering many well performing visualization and interaction
options.
Visualization/dissemination of 3D Cadastral Information (9591)
Barbara Cemellini (Netherlands), Thompson Rod (Australia), Marian de Vries and Peter van Oosterom (Netherlands)
FIG Congress 2018
Embracing our smart world where the continents connect: enhancing the geospatial maturity of societies
Istanbul, Turkey, May 6–11, 2018
Visualization/dissemination of 3D Cadastre
Barbara CEMELLINI, The Netherlands, Rod THOMPSON, Australia,
Marian DE VRIES, The Netherlands, and Peter VAN OOSTEROM, The Netherlands
1. MOTIVATION
In recent years, many countries have or are considering to extend their cadastral registration
systems into the third dimension. The reason of this choice is given by three main factors: the
increase in private property values, the higher density and raising complexity of buildings over
the last 50 years (i.e. buildings above roads/railways, buildings leaning on top of each other,
etc.) and the growing 3D approach in other fields which made 3D cadastre technologically
feasible (van Oosterom & Stoter, 3D Cadastre in an International Context - Legal,
organizational and technological aspects , 2006).
The aim of cadastre is to make information available to everyone, thus sharing and visualising
it on the web would help to fulfil this purpose. An interactive 3D visualization system
representing the third geometric dimension in a flexible way would give the user the possibility
to explore the complexity of the 3D world and overcome most of the issues of 2D techniques
(Pouliot, et al., 2017).
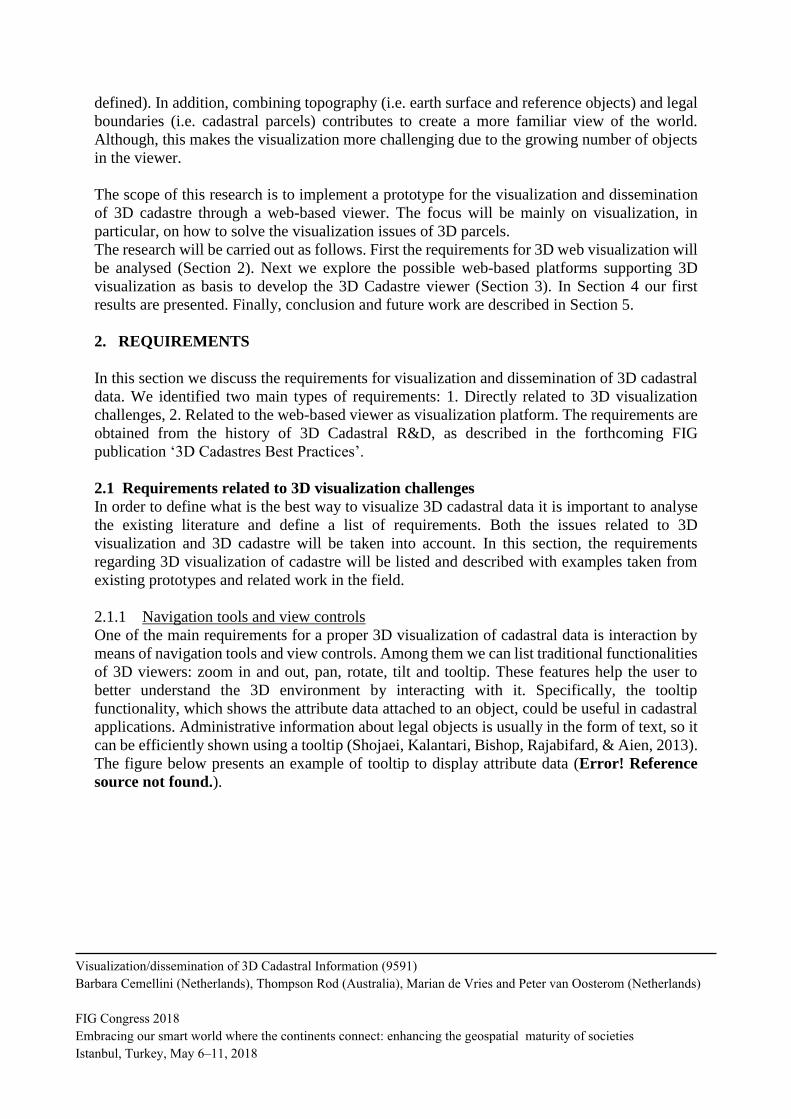
The advantages of a 3D representation of cadastral data over a 2D representation are
summarized in Figure 1. The left image shows the difficulty to associate different owners to a
unique 2D parcel, while the problem can be easily solved with a 3D representation. The central
image presents a complex situation in which a road passes under a building and therefore there
is an interference in the land rights that can be solved with a 3D representation showing the
situation in more detail. Finally, the right image represents a building and an underground
infrastructure, in 2D the underground objects would be hidden by the earth surface, while in 3D
they can be easily visualised.
Figure 1 - Limitations of 2D cadastre (Zare Zardiny & Hakimpour, 2015)
Nevertheless, the creation of a proper 3D visualisation of cadastral data presents several
challenges. The typical issues of 3D visualization such as occlusion, distortion and difficulties
in the perception of position, size and shape of objects are combined with the issues related to
3D cadastre like unbounded volumes representing certain parcels (i.e. no upper height level
Visualization/dissemination of 3D Cadastral Information (9591)
Barbara Cemellini (Netherlands), Thompson Rod (Australia), Marian de Vries and Peter van Oosterom (Netherlands)
FIG Congress 2018
Embracing our smart world where the continents connect: enhancing the geospatial maturity of societies
Istanbul, Turkey, May 6–11, 2018
defined). In addition, combining topography (i.e. earth surface and reference objects) and legal
boundaries (i.e. cadastral parcels) contributes to create a more familiar view of the world.
Although, this makes the visualization more challenging due to the growing number of objects
in the viewer.
The scope of this research is to implement a prototype for the visualization and dissemination
of 3D cadastre through a web-based viewer. The focus will be mainly on visualization, in
particular, on how to solve the visualization issues of 3D parcels.
The research will be carried out as follows. First the requirements for 3D web visualization will
be analysed (Section 2). Next we explore the possible web-based platforms supporting 3D
visualization as basis to develop the 3D Cadastre viewer (Section 3). In Section 4 our first
results are presented. Finally, conclusion and future work are described in Section 5.
2. REQUIREMENTS
In this section we discuss the requirements for visualization and dissemination of 3D cadastral
data. We identified two main types of requirements: 1. Directly related to 3D visualization
challenges, 2. Related to the web-based viewer as visualization platform. The requirements are
obtained from the history of 3D Cadastral R&D, as described in the forthcoming FIG
publication ‘3D Cadastres Best Practices’.
2.1 Requirements related to 3D visualization challenges
In order to define what is the best way to visualize 3D cadastral data it is important to analyse
the existing literature and define a list of requirements. Both the issues related to 3D
visualization and 3D cadastre will be taken into account. In this section, the requirements
regarding 3D visualization of cadastre will be listed and described with examples taken from
existing prototypes and related work in the field.
2.1.1 Navigation tools and view controls
One of the main requirements for a proper 3D visualization of cadastral data is interaction by
means of navigation tools and view controls. Among them we can list traditional functionalities
of 3D viewers: zoom in and out, pan, rotate, tilt and tooltip. These features help the user to
better understand the 3D environment by interacting with it. Specifically, the tooltip
functionality, which shows the attribute data attached to an object, could be useful in cadastral
applications. Administrative information about legal objects is usually in the form of text, so it
can be efficiently shown using a tooltip (Shojaei, Kalantari, Bishop, Rajabifard, & Aien, 2013).
The figure below presents an example of tooltip to display attribute data (Error! Reference
source not found.).
Visualization/dissemination of 3D Cadastral Information (9591)
Barbara Cemellini (Netherlands), Thompson Rod (Australia), Marian de Vries and Peter van Oosterom (Netherlands)
FIG Congress 2018
Embracing our smart world where the continents connect: enhancing the geospatial maturity of societies
Istanbul, Turkey, May 6–11, 2018
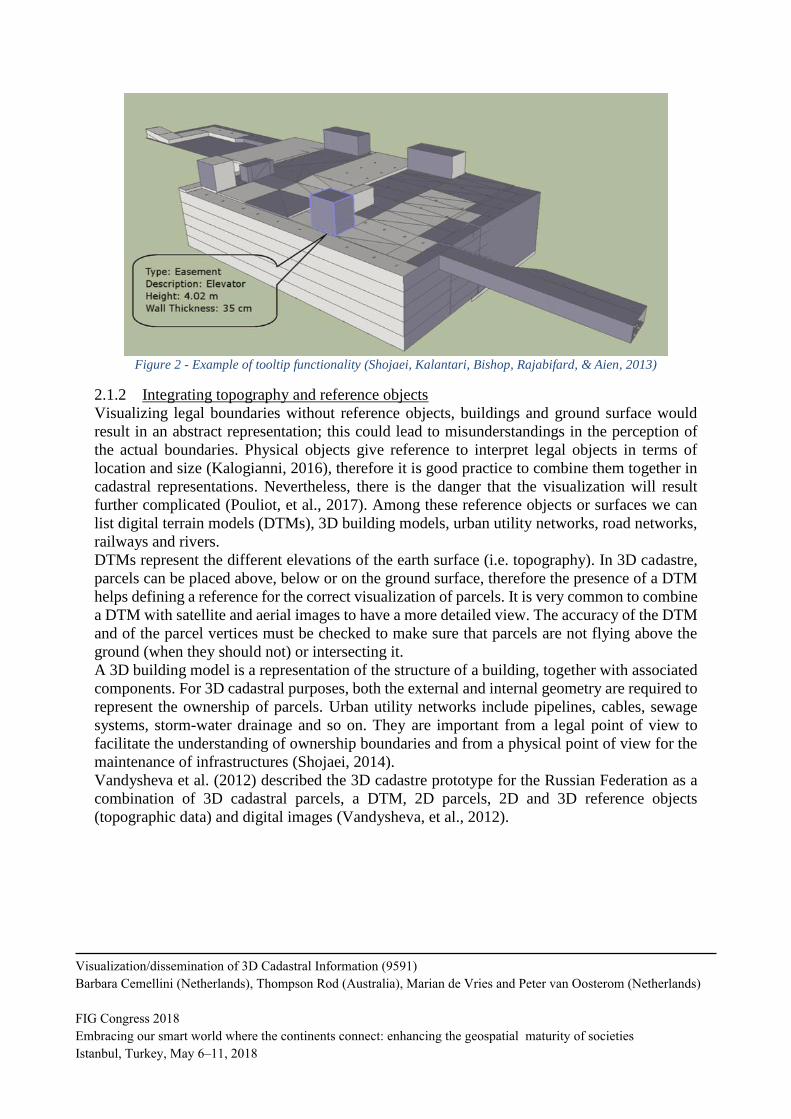
Figure 2 - Example of tooltip functionality (Shojaei, Kalantari, Bishop, Rajabifard, & Aien, 2013)
2.1.2 Integrating topography and reference objects
Visualizing legal boundaries without reference objects, buildings and ground surface would
result in an abstract representation; this could lead to misunderstandings in the perception of
the actual boundaries. Physical objects give reference to interpret legal objects in terms of
location and size (Kalogianni, 2016), therefore it is good practice to combine them together in
cadastral representations. Nevertheless, there is the danger that the visualization will result
further complicated (Pouliot, et al., 2017). Among these reference objects or surfaces we can
list digital terrain models (DTMs), 3D building models, urban utility networks, road networks,
railways and rivers.
DTMs represent the different elevations of the earth surface (i.e. topography). In 3D cadastre,
parcels can be placed above, below or on the ground surface, therefore the presence of a DTM
helps defining a reference for the correct visualization of parcels. It is very common to combine
a DTM with satellite and aerial images to have a more detailed view. The accuracy of the DTM
and of the parcel vertices must be checked to make sure that parcels are not flying above the
ground (when they should not) or intersecting it.
A 3D building model is a representation of the structure of a building, together with associated
components. For 3D cadastral purposes, both the external and internal geometry are required to
represent the ownership of parcels. Urban utility networks include pipelines, cables, sewage
systems, storm-water drainage and so on. They are important from a legal point of view to
facilitate the understanding of ownership boundaries and from a physical point of view for the
maintenance of infrastructures (Shojaei, 2014).
Vandysheva et al. (2012) described the 3D cadastre prototype for the Russian Federation as a
combination of 3D cadastral parcels, a DTM, 2D parcels, 2D and 3D reference objects
(topographic data) and digital images (Vandysheva, et al., 2012).
Visualization/dissemination of 3D Cadastral Information (9591)
Barbara Cemellini (Netherlands), Thompson Rod (Australia), Marian de Vries and Peter van Oosterom (Netherlands)
FIG Congress 2018
Embracing our smart world where the continents connect: enhancing the geospatial maturity of societies
Istanbul, Turkey, May 6–11, 2018

2.1.3 Transparency
Another requirement is transparency, which can be interpreted as opacity/transparency at
different levels. Transparency can be applied in order to show the interior of a 3D model. This
feature is convenient to visualise and distinguish physical and legal objects (Vandysheva, et al.,
2012), for example, in Figure 3 two levels of transparency have been used to enhance the
difference between legal boundaries and buildings.
Figure 3 – Use of transparency to enhance the difference between physical and legal objects (Pouliot, et al.,
2017)
Similar techniques have also been explored, for instance ‘dynamic’ transparency is able to
improve object discovery behind opaque surfaces (Figure 4).
Figure 4 - Example of dynamic transparency feature (Pouliot, et al., 2017)
Additionally, Wang and others (2016) made a research project to assess the usability of
transparency in 3D cadastre visualization. They used three different degrees of transparency to
Visualization/dissemination of 3D Cadastral Information (9591)
Barbara Cemellini (Netherlands), Thompson Rod (Australia), Marian de Vries and Peter van Oosterom (Netherlands)
FIG Congress 2018
Embracing our smart world where the continents connect: enhancing the geospatial maturity of societies
Istanbul, Turkey, May 6–11, 2018
represent three types of boundaries: physical, administrative and linked boundary (both physical
and administrative). The result of the research showed that three levels of transparency were
enough to demarcate legal parcels and their physical counterparts (Wang, Pouliot, & Hubert,
2016).
2.1.4 Object selection
The selection of objects is a very important interaction technique for the success of any 3D
visualization tool (Pouliot, Hubert, Wang, Ellul, & Rajabifard, 2016). Clicking on an object
with the mouse or touching the object (if we are using a touch device), is referred to as object
selection. Selection can also be performed on administrative data, for example, it is possible to
show or select all the parcels owned by the same person. A direct consequence of the selection
is the highlighting of the feature, usually by changing its colour to make it better visible
(Shojaei, 2014).
An example of selection can be found in the 3D cadastre prototype for the Russian Federation
described by Vandysheva et al. (2012). The object selection was used to show the available 3D
objects starting from a 2D representation. Therefore, the user must click on the 2D objects
marked as having 3D information available in order to visualize them in three dimensions
(Vandysheva, et al., 2012).
2.1.5 Object search
A step beyond ‘object selection’ there is a more advanced functionality, the object search. This
search allows the user to find required information in a quick and easy way. It can be carried
out both on spatial and non-spatial data, and it can be based on address, name, geocode,
coordinates, etc. The user only needs to type the input and the system will zoom to the desired
object or location (Shojaei, 2014). A variant of ‘object search’ is the ‘active set search’. The
concept of active set refers to a group of objects which has been selected and saved for further
processing (van Oosterom, Maessen, & Quak, Spatial, Thematic and Temporal Views, 2000).
Thanks to this functionality, a group of parcels with the same characteristics can also be found
easily.
2.1.6 Wireframe display
A wireframe view is a representation of a 3D object exclusively by means of its edges. It can
be used to enhance the rendering speed when a large amount of data is loaded. In cadastral
applications, the wireframe view can also help the user to see through objects and overcome
occlusion issues that can obstacle the correct perception of the parcels. Figure 5 below shows
an example of wireframe display. In addition, wireframe display can be applied to unselected
parcels to provide context and distinguish them from the highlighted ones (Shojaei, 2014).
Visualization/dissemination of 3D Cadastral Information (9591)
Barbara Cemellini (Netherlands), Thompson Rod (Australia), Marian de Vries and Peter van Oosterom (Netherlands)
FIG Congress 2018
Embracing our smart world where the continents connect: enhancing the geospatial maturity of societies
Istanbul, Turkey, May 6–11, 2018

Figure 5 - Example of wireframe display (Shojaei, 2014)
2.1.7 Explode view
Explode view is used in 3D cadastre applications to show the internal components of complex
units (for example, apartment buildings). This functionality displaces the components in space
separated by a given distance, therefore all the components of an entity are slightly shifted from
their original location (Shojaei, 2014). Among others, Ying et al. (2016) explored the explode
view functionality; they started from a connected set (left of Figure 6) and using displacement
equations they created the exploded view (right of Figure 6) to have a better visualization of
the inner unit (Ying, et al., 2016).
Figure 6 - Explode view example (Ying, et al., 2016)
2.1.8 Sliding
The sliding tool is similar to explode view since it also has the function to better show the
internal geometry of a 3D object which is otherwise occluded by the surrounding features.
Usually this tool moves an object horizontally in a specified direction, i.e. the floor of an
apartment building, to reveal its internal structure. By looking at the interior geometry of the
Visualization/dissemination of 3D Cadastral Information (9591)
Barbara Cemellini (Netherlands), Thompson Rod (Australia), Marian de Vries and Peter van Oosterom (Netherlands)
FIG Congress 2018
Embracing our smart world where the continents connect: enhancing the geospatial maturity of societies
Istanbul, Turkey, May 6–11, 2018
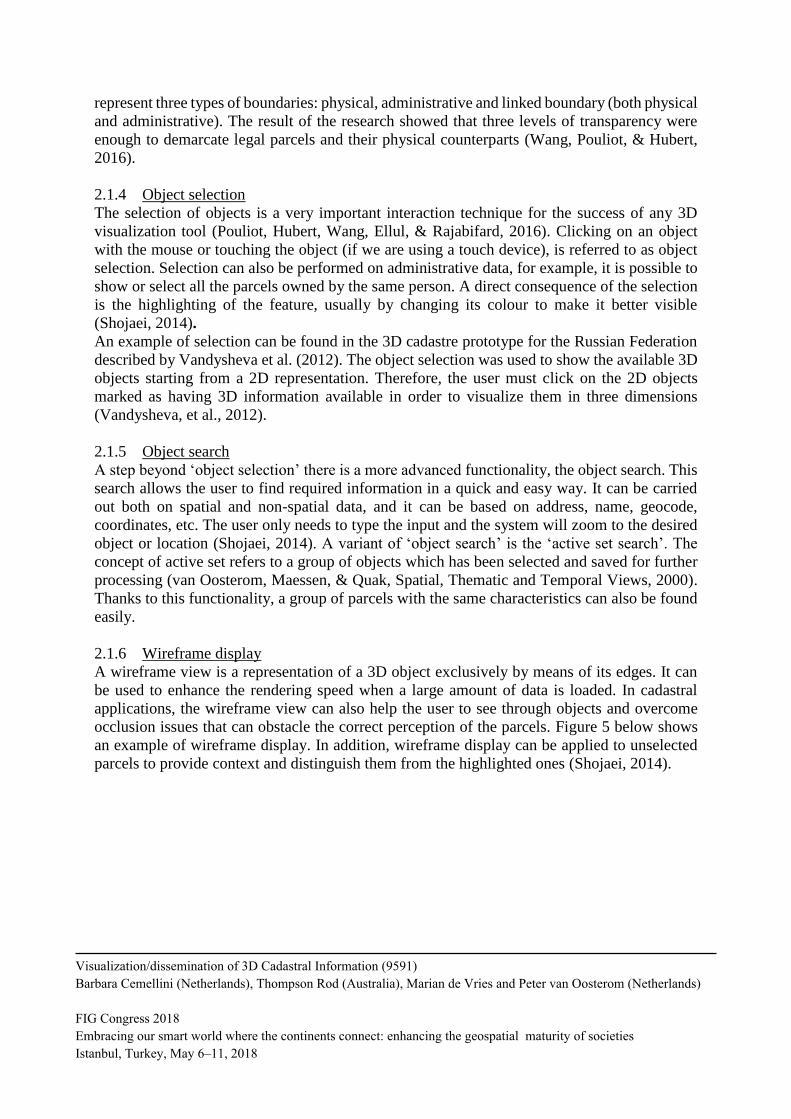
parcels the user can better understand the subdivision of the space (Shojaei, 2014). This
functionality can also be used to slide the floors of a building on top of each other to make
comparisons (Figure 7).
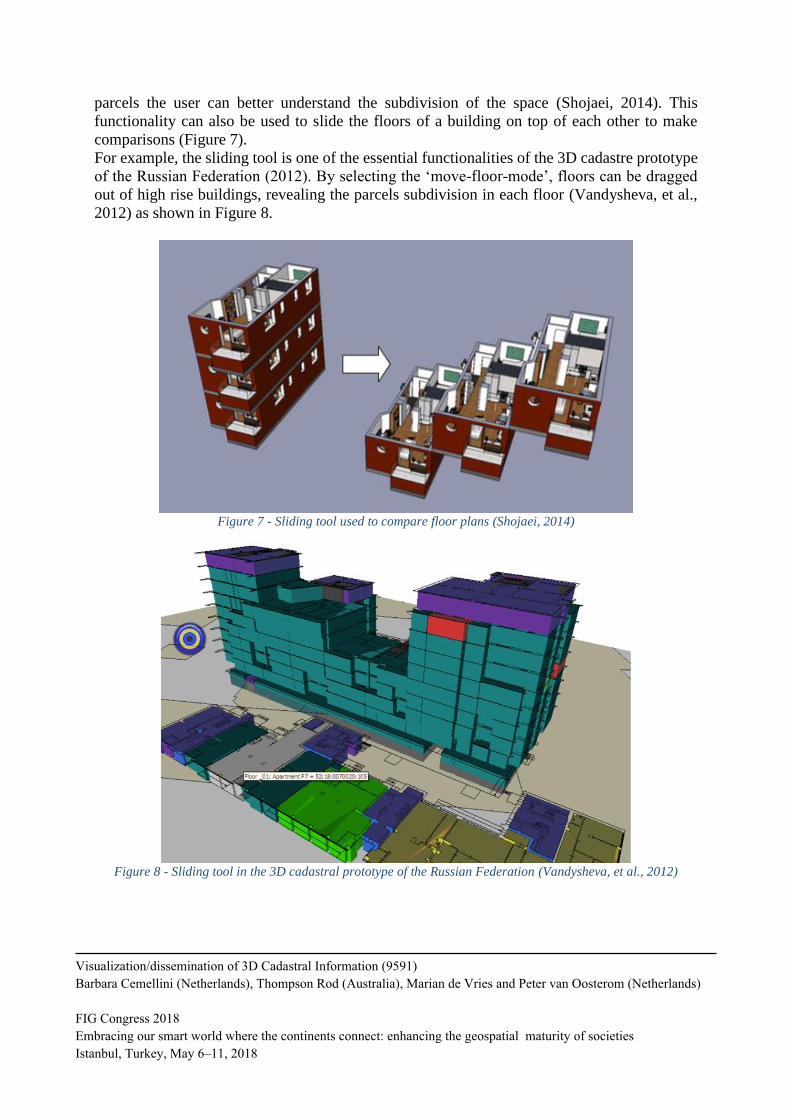
For example, the sliding tool is one of the essential functionalities of the 3D cadastre prototype
of the Russian Federation (2012). By selecting the ‘move-floor-mode’, floors can be dragged
out of high rise buildings, revealing the parcels subdivision in each floor (Vandysheva, et al.,
2012) as shown in Figure 8.
Figure 7 - Sliding tool used to compare floor plans (Shojaei, 2014)
Figure 8 - Sliding tool in the 3D cadastral prototype of the Russian Federation (Vandysheva, et al., 2012)
Visualization/dissemination of 3D Cadastral Information (9591)
Barbara Cemellini (Netherlands), Thompson Rod (Australia), Marian de Vries and Peter van Oosterom (Netherlands)
FIG Congress 2018
Embracing our smart world where the continents connect: enhancing the geospatial maturity of societies
Istanbul, Turkey, May 6–11, 2018
2.1.9 Cross-section view
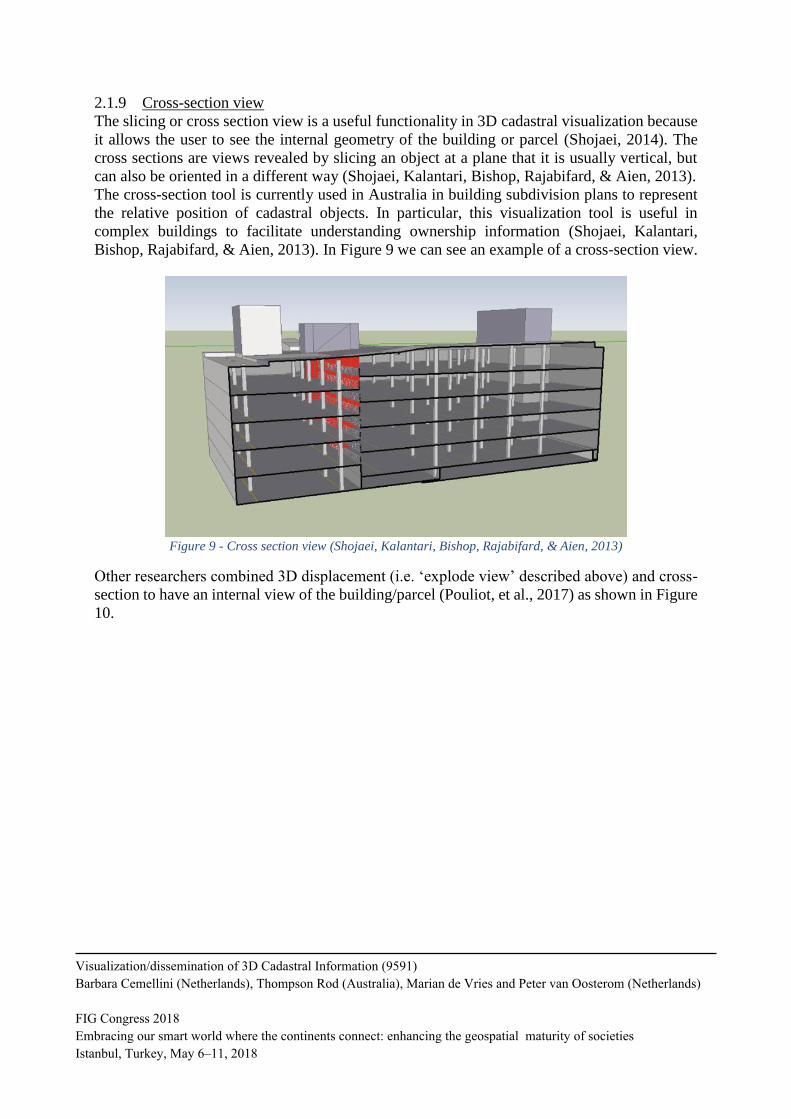
The slicing or cross section view is a useful functionality in 3D cadastral visualization because
it allows the user to see the internal geometry of the building or parcel (Shojaei, 2014). The
cross sections are views revealed by slicing an object at a plane that it is usually vertical, but
can also be oriented in a different way (Shojaei, Kalantari, Bishop, Rajabifard, & Aien, 2013).
The cross-section tool is currently used in Australia in building subdivision plans to represent
the relative position of cadastral objects. In particular, this visualization tool is useful in
complex buildings to facilitate understanding ownership information (Shojaei, Kalantari,
Bishop, Rajabifard, & Aien, 2013). In Figure 9 we can see an example of a cross-section view.
Figure 9 - Cross section view (Shojaei, Kalantari, Bishop, Rajabifard, & Aien, 2013)
Other researchers combined 3D displacement (i.e. ‘explode view’ described above) and cross-
section to have an internal view of the building/parcel (Pouliot, et al., 2017) as shown in Figure
10.
Visualization/dissemination of 3D Cadastral Information (9591)
Barbara Cemellini (Netherlands), Thompson Rod (Australia), Marian de Vries and Peter van Oosterom (Netherlands)
FIG Congress 2018
Embracing our smart world where the continents connect: enhancing the geospatial maturity of societies
Istanbul, Turkey, May 6–11, 2018
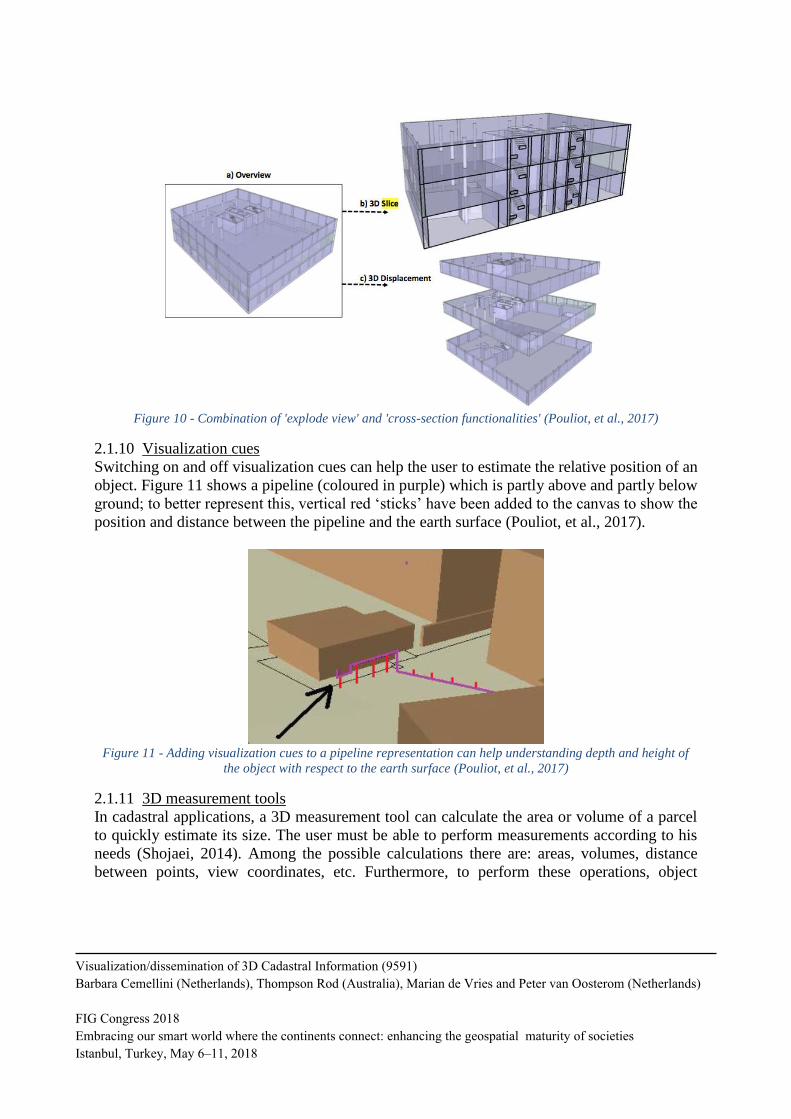
Figure 10 - Combination of 'explode view' and 'cross-section functionalities' (Pouliot, et al., 2017)
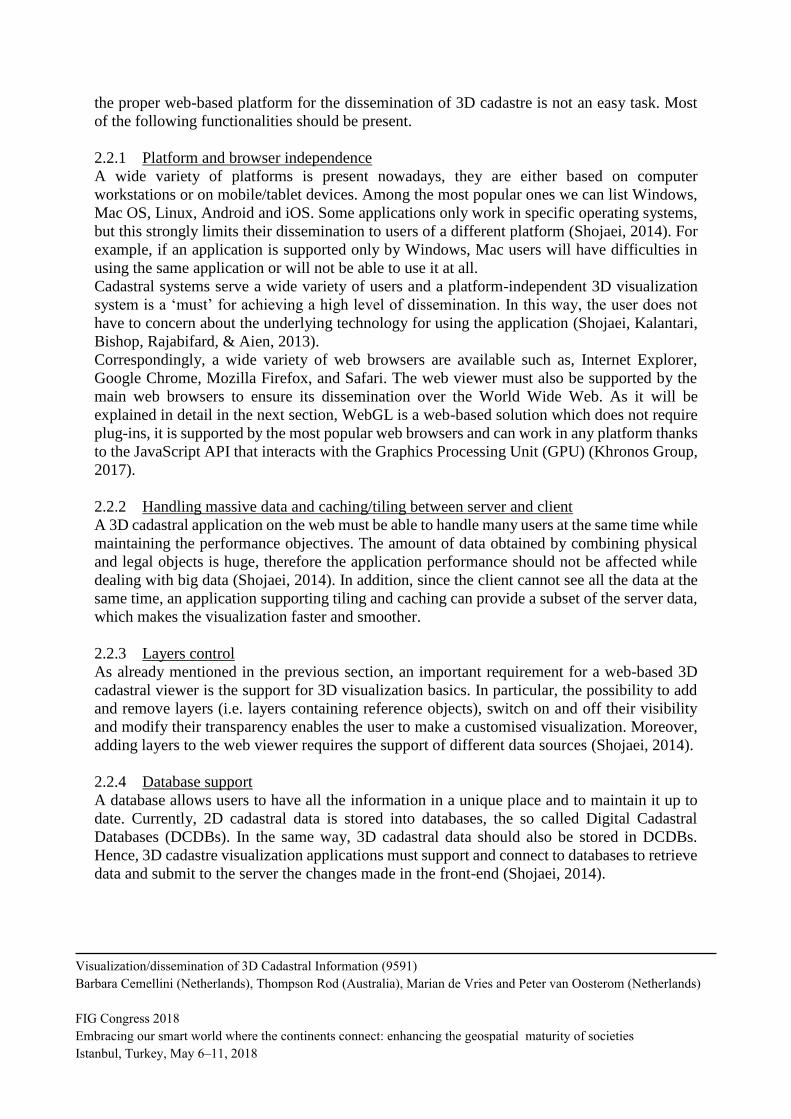
2.1.10 Visualization cues
Switching on and off visualization cues can help the user to estimate the relative position of an
object. Figure 11 shows a pipeline (coloured in purple) which is partly above and partly below
ground; to better represent this, vertical red ‘sticks’ have been added to the canvas to show the
position and distance between the pipeline and the earth surface (Pouliot, et al., 2017).
Figure 11 - Adding visualization cues to a pipeline representation can help understanding depth and height of
the object with respect to the earth surface (Pouliot, et al., 2017)
2.1.11 3D measurement tools
In cadastral applications, a 3D measurement tool can calculate the area or volume of a parcel
to quickly estimate its size. The user must be able to perform measurements according to his
needs (Shojaei, 2014). Among the possible calculations there are: areas, volumes, distance
between points, view coordinates, etc. Furthermore, to perform these operations, object
Visualization/dissemination of 3D Cadastral Information (9591)
Barbara Cemellini (Netherlands), Thompson Rod (Australia), Marian de Vries and Peter van Oosterom (Netherlands)
FIG Congress 2018
Embracing our smart world where the continents connect: enhancing the geospatial maturity of societies
Istanbul, Turkey, May 6–11, 2018

snapping should be implemented to allow the user to make accurate measurements (Shojaei,
Kalantari, Bishop, Rajabifard, & Aien, 2013).
2.1.12 3D buffer
The 3D buffer functionality creates a buffer around an object. This feature can be suitable for
querying and selecting neighbouring objects to a 3D object; for instance, assessment of
constraints in a specific area and creation of an ‘active set’ of objects. The 3D buffer
functionality must be possible both for cadastral parcels and for physical objects in order to
support various analyses. The features within the buffer are then selected for further processing
(Shojaei, 2014). In the figure below, a 3D buffer example of a pipeline is shown (Figure 12).
Figure 12 - Example of a 3D buffer of a pipeline (Shojaei, 2014)
2.1.13 Display partly unbounded objects and ‘complex’ geometries
Legal objects can be both bounded and unbounded. Bounded objects have a defined volume,
so they are relatively easy to represent. On the other hand, unbounded objects are more
challenging for 3D cadastre visualization since their volume is undefined. These unbounded
objects are for example parcels that continue infinitely towards the sky or below ground level.
A 3D cadastre application should be able to show them in a non-misleading way. Some
researchers suggested their representation in two dimensions as the most efficient method
(Shojaei, Kalantari, Bishop, Rajabifard, & Aien, 2013). Moreover, 3D bounded objects can also
be rather complex to represent; examples are, non-2-manifold geometries and curved boundary
surfaces. The support for these complex geometries is crucial to represent the different shapes
of buildings in modern cities. Curved surfaces boundaries are difficult to represent; therefore,
a solution could be the approximation of the curved surface.
2.2 Requirements related to the web-based viewer as a visualization platform
In addition to the functionalities related to 3D visualization, the web viewer requirements must
be considered too. One of the main aims of cadastre is to make information available to
everybody and the web is a powerful tool which can make this happen. Consequently, the choice
of the most appropriate web platform is crucial. Having a good 3D visualization would be
useless if the platform in which the data is visualised is not suitable for that purpose. Choosing
Visualization/dissemination of 3D Cadastral Information (9591)
Barbara Cemellini (Netherlands), Thompson Rod (Australia), Marian de Vries and Peter van Oosterom (Netherlands)
FIG Congress 2018
Embracing our smart world where the continents connect: enhancing the geospatial maturity of societies
Istanbul, Turkey, May 6–11, 2018
the proper web-based platform for the dissemination of 3D cadastre is not an easy task. Most
of the following functionalities should be present.
2.2.1 Platform and browser independence
A wide variety of platforms is present nowadays, they are either based on computer
workstations or on mobile/tablet devices. Among the most popular ones we can list Windows,
Mac OS, Linux, Android and iOS. Some applications only work in specific operating systems,
but this strongly limits their dissemination to users of a different platform (Shojaei, 2014). For
example, if an application is supported only by Windows, Mac users will have difficulties in
using the same application or will not be able to use it at all.
Cadastral systems serve a wide variety of users and a platform-independent 3D visualization
system is a ‘must’ for achieving a high level of dissemination. In this way, the user does not
have to concern about the underlying technology for using the application (Shojaei, Kalantari,
Bishop, Rajabifard, & Aien, 2013).
Correspondingly, a wide variety of web browsers are available such as, Internet Explorer,
Google Chrome, Mozilla Firefox, and Safari. The web viewer must also be supported by the
main web browsers to ensure its dissemination over the World Wide Web. As it will be
explained in detail in the next section, WebGL is a web-based solution which does not require
plug-ins, it is supported by the most popular web browsers and can work in any platform thanks
to the JavaScript API that interacts with the Graphics Processing Unit (GPU) (Khronos Group,
2017).
2.2.2 Handling massive data and caching/tiling between server and client
A 3D cadastral application on the web must be able to handle many users at the same time while
maintaining the performance objectives. The amount of data obtained by combining physical
and legal objects is huge, therefore the application performance should not be affected while
dealing with big data (Shojaei, 2014). In addition, since the client cannot see all the data at the
same time, an application supporting tiling and caching can provide a subset of the server data,
which makes the visualization faster and smoother.
2.2.3 Layers control
As already mentioned in the previous section, an important requirement for a web-based 3D
cadastral viewer is the support for 3D visualization basics. In particular, the possibility to add
and remove layers (i.e. layers containing reference objects), switch on and off their visibility
and modify their transparency enables the user to make a customised visualization. Moreover,
adding layers to the web viewer requires the support of different data sources (Shojaei, 2014).
2.2.4 Database support
A database allows users to have all the information in a unique place and to maintain it up to
date. Currently, 2D cadastral data is stored into databases, the so called Digital Cadastral
Databases (DCDBs). In the same way, 3D cadastral data should also be stored in DCDBs.
Hence, 3D cadastre visualization applications must support and connect to databases to retrieve
data and submit to the server the changes made in the front-end (Shojaei, 2014).
Visualization/dissemination of 3D Cadastral Information (9591)
Barbara Cemellini (Netherlands), Thompson Rod (Australia), Marian de Vries and Peter van Oosterom (Netherlands)
FIG Congress 2018
Embracing our smart world where the continents connect: enhancing the geospatial maturity of societies
Istanbul, Turkey, May 6–11, 2018
2.2.5 Support different models (vector/polyhedral, raster/voxel, point clouds)
As already discussed above, the combination of physical and legal objects further complicates
the visualization issues. Reference topographic objects are buildings, pipelines, roads, bridges,
railways, waterways, etc. and they can be represented in different ways such as raster or voxel
representations, vector or polyhedral surfaces and even smart point clouds (Pouliot, et al.,
2017). Therefore, a viewer supporting a wide variety of models allows diverse datasets to
coexist in the same environment.
2.2.6 Support of basic topographic visualization
A 3D web viewer should support basic 3D topographic visualization both for the content or
information model, and for the encoding, which is the actual exchange format. Many data
formats and specifications currently exist to store, deliver and exchange 3D data. The most
popular ones are: CityGML, KML, X3D, GeoVRML, GML, DWG, 3DS, shapefile, Collada,
3D PDF, IFC and LandXML. For a more detailed explanation about the formats see Davood
Shojaei PhD thesis (Shojaei, 2014).
2.2.7 Support for geo-referencing
A 3D cadastral system contains geo-data. Geo-data is information about a geographic location
and it is produced in different coordinate systems. For this reason, a good 3D cadastre
visualization platform should support (Stoter , Ploeger, & van Oosterom, 2012) various
horizontal and vertical coordinate systems. In addition, real world coordinates (absolute
coordinates with an origin on the surface of the earth) need to be translated into screen
coordinates (relative coordinates with origin on the top left part of the screen) to be visualised
on a computer (Pouliot, et al., 2017).
2.2.8 Ensure spatial validity (3D vector topology)
Integrating topology in 3D cadastral applications can be of great benefit for two main reasons:
efficiently render 3D data and carry out various types of analyses. An application lacking
topological support may have information redundancy and therefore it will require more
resources to render the data. Topological structures enable spatial analyses such as, identify
adjacency, intersection, connectivity, containment and disjunction between objects, which can
be useful for users of 3D cadastre. Checking spatial validity makes sure that all the parcels are
closed and valid both in 2D and 3D. For example, complex 3D cadastral objects, such as
apartment buildings, are composed by parcels sharing many faces which should not overlap or
intersect, but align with each other to ensure a valid subdivision of the space. On the other hand,
in the case of unbounded volumes using vector topology can give invalid results (Shojaei,
2014).
2.2.9 Underground view
Modern cities are growing and becoming more complex, both above and below the earth
surface. Many underground developments such as pipelines, shops, parking spaces, tunnels,
etc. are now present in urban areas. Lacking underground visualization will lead to a non-
Visualization/dissemination of 3D Cadastral Information (9591)
Barbara Cemellini (Netherlands), Thompson Rod (Australia), Marian de Vries and Peter van Oosterom (Netherlands)
FIG Congress 2018
Embracing our smart world where the continents connect: enhancing the geospatial maturity of societies
Istanbul, Turkey, May 6–11, 2018

reality-like view of the world. The possibility of displaying the underground physical and legal
objects in 3D cadastre applications is, therefore, of primary importance. In order to have an
underground view, the camera should be able to move under the terrain. Although this
requirement can seem quite straightforward, many 3D web viewers lack this functionality, an
example is Google Earth (Shojaei, 2014). Figure 13 shows an example of underground view of
a 3D model.
Figure 13 - Example of underground view (Shojaei, 2014)
2.2.10 Open source platform
An open source platform is a platform that provides the source code of the application to the
users. The advantage of an open source solution is that the community is encouraged to
participate and possibly contribute to the development of the applications (Shojaei, 2014).
2.2.11 Possibility for the platform to be extended
Since cadastre visualization has specific needs, which are rather different from the ones of
traditional 3D visualization, using an extensible platform will give the possibility for the
software developer to build a custom-made application that perfectly fits the purpose of 3D
cadastre (Shojaei, 2014).
2.2.12 2D overview map (orientation)
Including a 2D overview map in the 3D cadastre web viewer would give a vertical view over
the scene. This will help the user to understand the location of the camera with respect to the
3D world. The 2D overview map is very much used in games and it is generally a small
rectangle on the corner of the canvas to provide orientation during navigation (Shojaei, 2014).
3. ANALYSIS OF WEBVIEWER OPTIONS
Choosing the appropriate visualization application for 3D cadastre is a big challenge because
of the wide variety available due to the ever-growing new technologies. For this reason, a good
knowledge of existing platforms and their capabilities can help building a successful cadastral
Visualization/dissemination of 3D Cadastral Information (9591)
Barbara Cemellini (Netherlands), Thompson Rod (Australia), Marian de Vries and Peter van Oosterom (Netherlands)
FIG Congress 2018
Embracing our smart world where the continents connect: enhancing the geospatial maturity of societies
Istanbul, Turkey, May 6–11, 2018
prototype (Shojaei, 2014). The web viewers analysed will be based on the cutting-edge WebGL
technology, mainly because of its plug-in free interface.
3.1 What is WebGL?
As described by the Khronos Group (2017) who developed it, WebGL is a cross-platform open
source web standard for a low-level 3D graphics API based on OpenGL ES (Khronos Group,
2017). The API context is obtained from the HTML5 <canvas> element, which means that no
plugin is required in the web browser to use the application (Pereira, 2013). Since WebGL is a
low-level API, drawing a simple 3D model needs a lot of work. Consequently, several open
source JavaScript libraries have been developed to simplify the programming process. One of
the most popular ones is three.js which provides higher level access to the API to make
programming simpler (Shojaei, 2014).
A big advantage of WebGL is that it brings 3D into the web without the installation of plug-ins
and it is implemented directly into the web browser. Most browser vendors like Apple, Google
and Mozilla are members of the WebGL Working Group (Khronos Group, 2017). Hence,
WebGL is supported by all major browsers and it works on many mobile platforms (Mackey,
2017). The payoff in using WebGL is that it is much faster than the 2D canvas context, so it
performs rather well in case of complex visualizations. Also, it can produce a degree of realism
and configurability that is hardly possible with other solutions (Danchilla, 2012).
Although WebGL represents the state-of-the-art in 3D graphics for the web, some limitations
must be pointed out. First of all, visualizing massive datasets in WebGL can be an issue. Often
browsers and mobile devices have a limited amount of cache memory which cannot be
exceeded. Hence a smooth visualization is not always possible. Secondly, WebGL has been
designed for today’s graphic cards, therefore old generation computers may not support it
(Shojaei, 2014).
In addition, setting up WebGL without a framework is not convenient due to the amount of
work needed to build up the application from scratch. For this reason, a good option is use an
existing WebGL based viewer in which many of the functionalities needed are already
implemented and some others can be added (Danchilla, 2012).
3.2 iTowns
iTowns is an open source JavaScript/WebGL framework for 3D geospatial data visualization
based on Three.js (iTowns , 2017). It was initially developed by the French Institut national de
l’information géographique et forestière (IGN) to combine street images and terrestrial Lidar
point cloud data that were acquired by the ‘Stereopolis’ mapping vehicle (IGN, 2015). iTowns
is a powerful framework for fast and easy prototyping via a modern web interface. Recently the
platform developed from version 1 to 2. The new version contains a complete package of 3D
visualization tools making it a good candidate for the visualization of 3D cadastre, the only
concern is about speed and user experience. The platform is primarily designed to handle
various types of geo-data and to make precise 3D measurements (iTowns , 2017). In the
following image, we can see an example of an application based on iTowns (14).
Visualization/dissemination of 3D Cadastral Information (9591)
Barbara Cemellini (Netherlands), Thompson Rod (Australia), Marian de Vries and Peter van Oosterom (Netherlands)
FIG Congress 2018
Embracing our smart world where the continents connect: enhancing the geospatial maturity of societies
Istanbul, Turkey, May 6–11, 2018
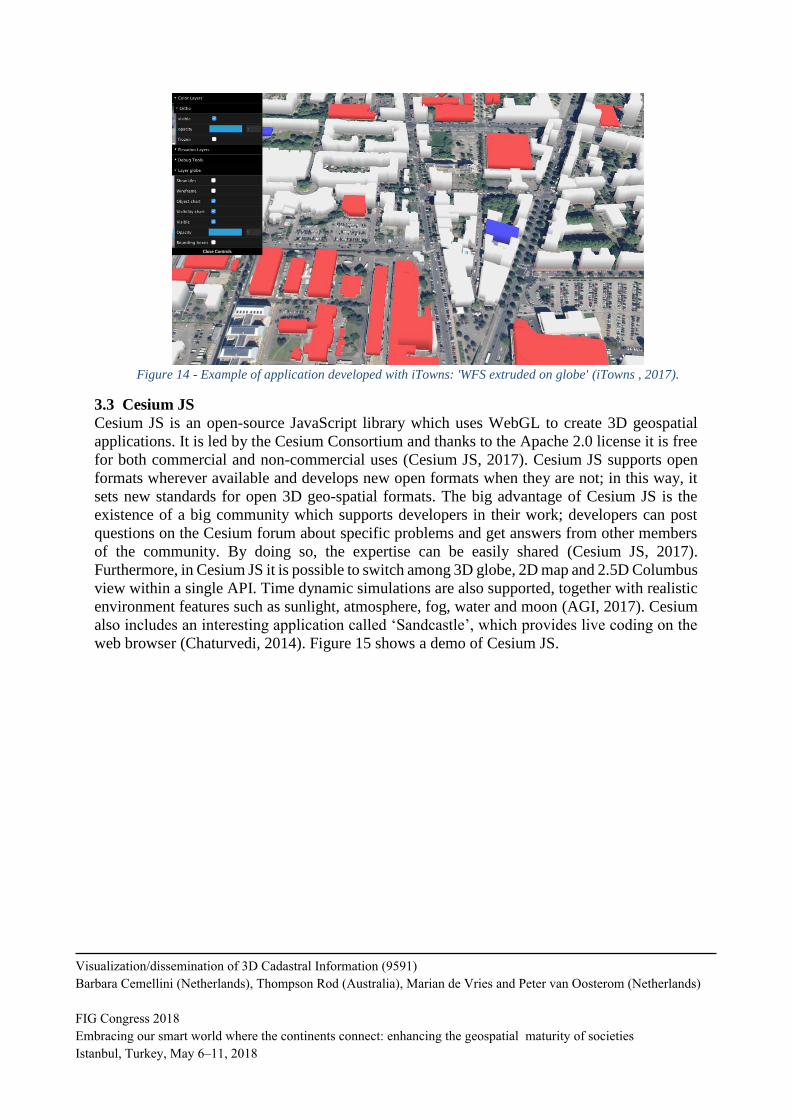
Figure 14 - Example of application developed with iTowns: 'WFS extruded on globe' (iTowns , 2017).
3.3 Cesium JS
Cesium JS is an open-source JavaScript library which uses WebGL to create 3D geospatial
applications. It is led by the Cesium Consortium and thanks to the Apache 2.0 license it is free
for both commercial and non-commercial uses (Cesium JS, 2017). Cesium JS supports open
formats wherever available and develops new open formats when they are not; in this way, it
sets new standards for open 3D geo-spatial formats. The big advantage of Cesium JS is the
existence of a big community which supports developers in their work; developers can post
questions on the Cesium forum about specific problems and get answers from other members
of the community. By doing so, the expertise can be easily shared (Cesium JS, 2017).
Furthermore, in Cesium JS it is possible to switch among 3D globe, 2D map and 2.5D Columbus
view within a single API. Time dynamic simulations are also supported, together with realistic
environment features such as sunlight, atmosphere, fog, water and moon (AGI, 2017). Cesium
also includes an interesting application called ‘Sandcastle’, which provides live coding on the
web browser (Chaturvedi, 2014). Figure 15 shows a demo of Cesium JS.
Visualization/dissemination of 3D Cadastral Information (9591)
Barbara Cemellini (Netherlands), Thompson Rod (Australia), Marian de Vries and Peter van Oosterom (Netherlands)
FIG Congress 2018
Embracing our smart world where the continents connect: enhancing the geospatial maturity of societies
Istanbul, Turkey, May 6–11, 2018
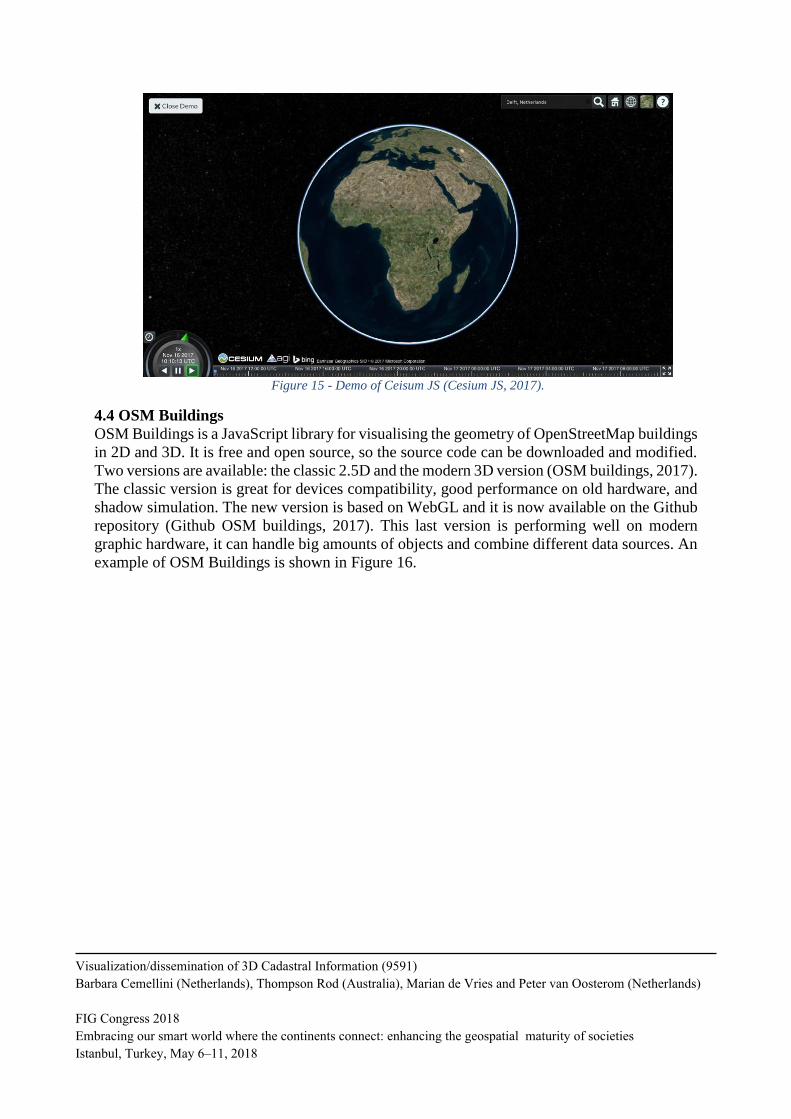
Figure 15 - Demo of Ceisum JS (Cesium JS, 2017).
4.4 OSM Buildings
OSM Buildings is a JavaScript library for visualising the geometry of OpenStreetMap buildings
in 2D and 3D. It is free and open source, so the source code can be downloaded and modified.
Two versions are available: the classic 2.5D and the modern 3D version (OSM buildings, 2017).
The classic version is great for devices compatibility, good performance on old hardware, and
shadow simulation. The new version is based on WebGL and it is now available on the Github
repository (Github OSM buildings, 2017). This last version is performing well on modern
graphic hardware, it can handle big amounts of objects and combine different data sources. An
example of OSM Buildings is shown in Figure 16.
Visualization/dissemination of 3D Cadastral Information (9591)
Barbara Cemellini (Netherlands), Thompson Rod (Australia), Marian de Vries and Peter van Oosterom (Netherlands)
FIG Congress 2018
Embracing our smart world where the continents connect: enhancing the geospatial maturity of societies
Istanbul, Turkey, May 6–11, 2018
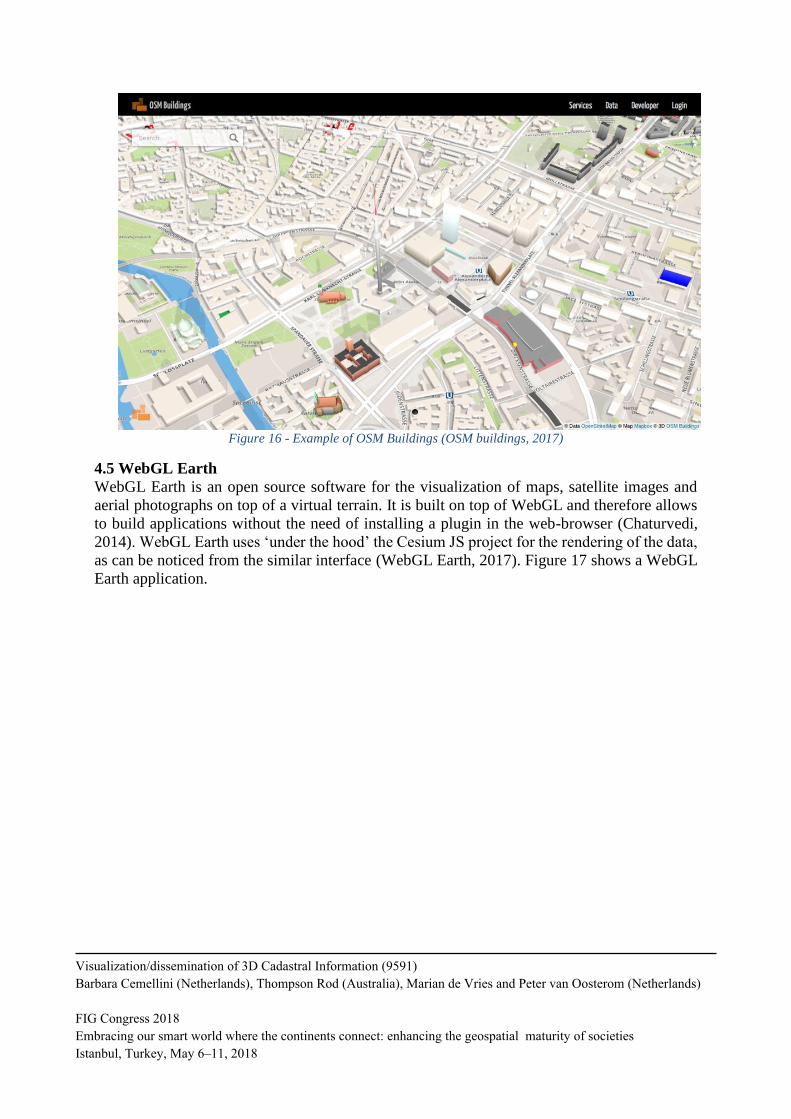
Figure 16 - Example of OSM Buildings (OSM buildings, 2017)
4.5 WebGL Earth
WebGL Earth is an open source software for the visualization of maps, satellite images and
aerial photographs on top of a virtual terrain. It is built on top of WebGL and therefore allows
to build applications without the need of installing a plugin in the web-browser (Chaturvedi,
2014). WebGL Earth uses ‘under the hood’ the Cesium JS project for the rendering of the data,
as can be noticed from the similar interface (WebGL Earth, 2017). Figure 17 shows a WebGL
Earth application.
Visualization/dissemination of 3D Cadastral Information (9591)
Barbara Cemellini (Netherlands), Thompson Rod (Australia), Marian de Vries and Peter van Oosterom (Netherlands)
FIG Congress 2018
Embracing our smart world where the continents connect: enhancing the geospatial maturity of societies
Istanbul, Turkey, May 6–11, 2018
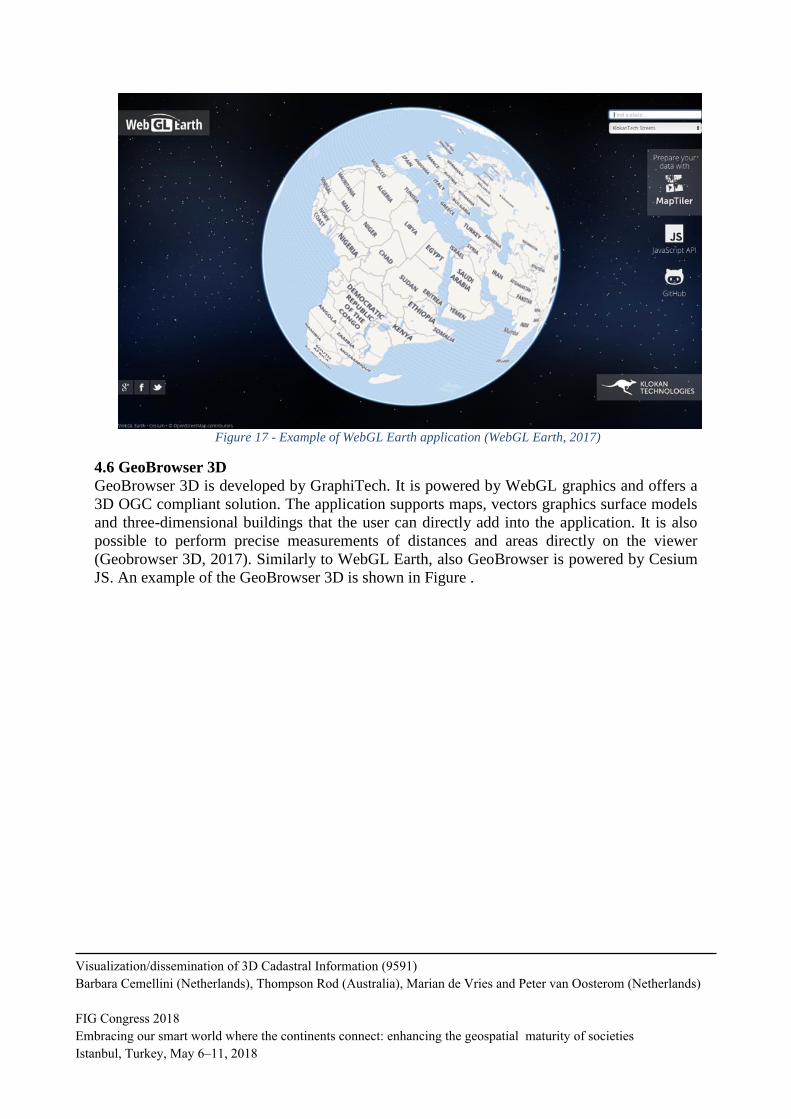
Figure 17 - Example of WebGL Earth application (WebGL Earth, 2017)
4.6 GeoBrowser 3D
GeoBrowser 3D is developed by GraphiTech. It is powered by WebGL graphics and offers a
3D OGC compliant solution. The application supports maps, vectors graphics surface models
and three-dimensional buildings that the user can directly add into the application. It is also
possible to perform precise measurements of distances and areas directly on the viewer
(Geobrowser 3D, 2017). Similarly to WebGL Earth, also GeoBrowser is powered by Cesium
JS. An example of the GeoBrowser 3D is shown in Figure .
Visualization/dissemination of 3D Cadastral Information (9591)
Barbara Cemellini (Netherlands), Thompson Rod (Australia), Marian de Vries and Peter van Oosterom (Netherlands)
FIG Congress 2018
Embracing our smart world where the continents connect: enhancing the geospatial maturity of societies
Istanbul, Turkey, May 6–11, 2018
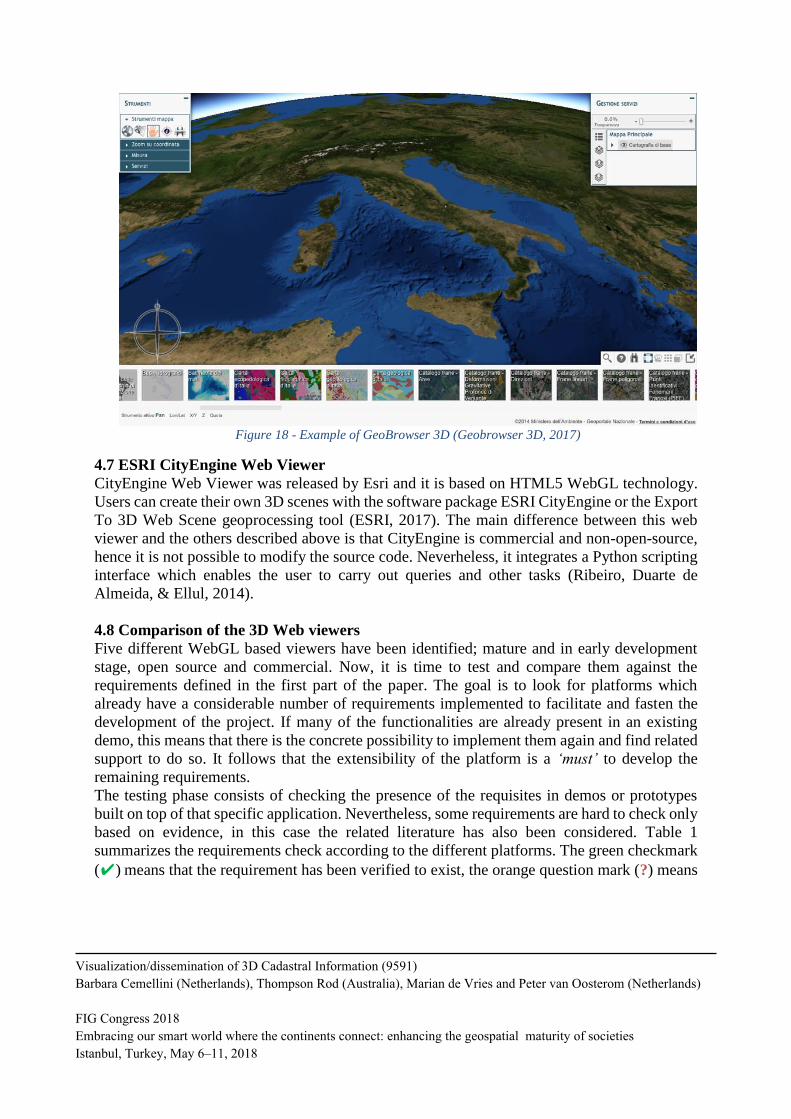
Figure 18 - Example of GeoBrowser 3D (Geobrowser 3D, 2017)
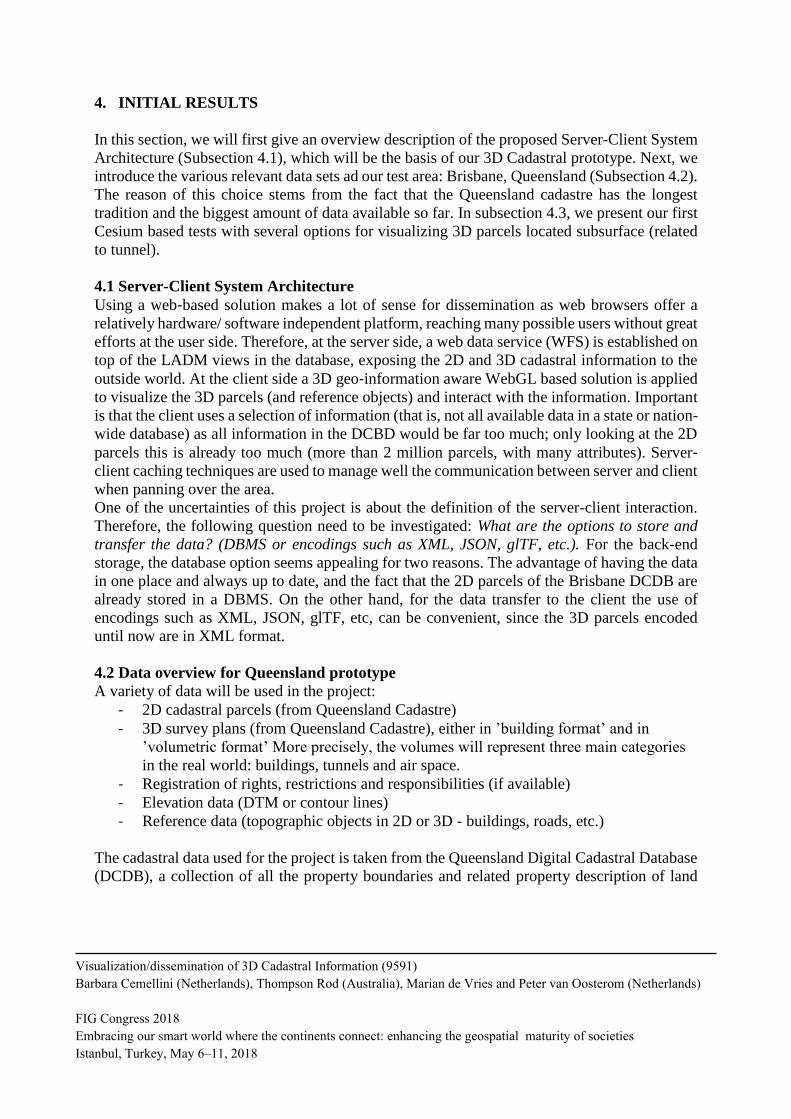
4.7 ESRI CityEngine Web Viewer
CityEngine Web Viewer was released by Esri and it is based on HTML5 WebGL technology.
Users can create their own 3D scenes with the software package ESRI CityEngine or the Export
To 3D Web Scene geoprocessing tool (ESRI, 2017). The main difference between this web
viewer and the others described above is that CityEngine is commercial and non-open-source,
hence it is not possible to modify the source code. Neverheless, it integrates a Python scripting
interface which enables the user to carry out queries and other tasks (Ribeiro, Duarte de
Almeida, & Ellul, 2014).
4.8 Comparison of the 3D Web viewers
Five different WebGL based viewers have been identified; mature and in early development
stage, open source and commercial. Now, it is time to test and compare them against the
requirements defined in the first part of the paper. The goal is to look for platforms which
already have a considerable number of requirements implemented to facilitate and fasten the
development of the project. If many of the functionalities are already present in an existing
demo, this means that there is the concrete possibility to implement them again and find related
support to do so. It follows that the extensibility of the platform is a ‘must’ to develop the
remaining requirements.
The testing phase consists of checking the presence of the requisites in demos or prototypes
built on top of that specific application. Nevertheless, some requirements are hard to check only
based on evidence, in this case the related literature has also been considered. Table 1
summarizes the requirements check according to the different platforms. The green checkmark
(✔) means that the requirement has been verified to exist, the orange question mark (?) means
Visualization/dissemination of 3D Cadastral Information (9591)
Barbara Cemellini (Netherlands), Thompson Rod (Australia), Marian de Vries and Peter van Oosterom (Netherlands)
FIG Congress 2018
Embracing our smart world where the continents connect: enhancing the geospatial maturity of societies
Istanbul, Turkey, May 6–11, 2018
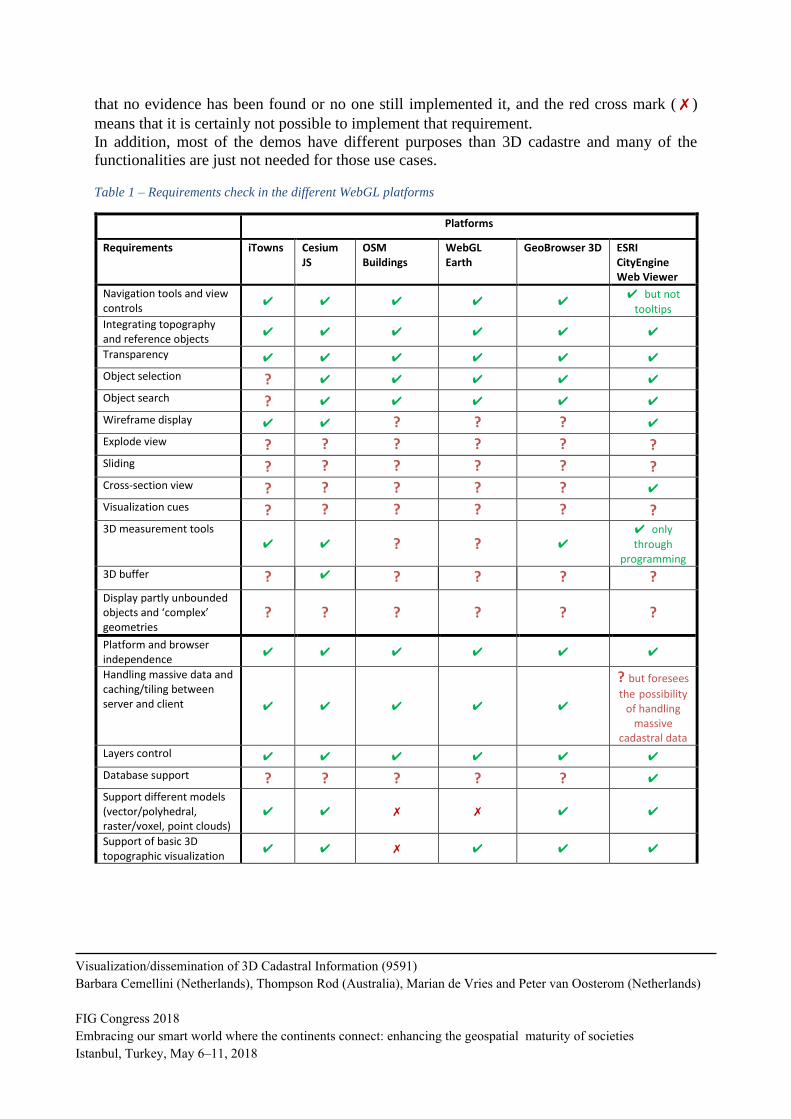
that no evidence has been found or no one still implemented it, and the red cross mark (✗)
means that it is certainly not possible to implement that requirement.
In addition, most of the demos have different purposes than 3D cadastre and many of the
functionalities are just not needed for those use cases.
Table 1 – Requirements check in the different WebGL platforms
Platforms
Requirements iTowns Cesium JS
OSM Buildings
WebGL Earth
GeoBrowser 3D ESRI CityEngine Web Viewer
Navigation tools and view controls
✔ ✔ ✔ ✔ ✔ ✔ but not
tooltips
Integrating topography and reference objects
✔ ✔ ✔ ✔ ✔ ✔
Transparency ✔ ✔ ✔ ✔ ✔ ✔
Object selection ? ✔ ✔ ✔ ✔ ✔
Object search ? ✔ ✔ ✔ ✔ ✔
Wireframe display ✔ ✔ ? ? ? ✔
Explode view ? ? ? ? ? ?
Sliding ? ? ? ? ? ?
Cross-section view ? ? ? ? ? ✔
Visualization cues ? ? ? ? ? ?
3D measurement tools
✔ ✔ ? ? ✔ ✔ only
through programming
3D buffer ? ✔ ? ? ? ?
Display partly unbounded objects and ‘complex’ geometries
? ? ? ? ? ?
Platform and browser independence
✔ ✔ ✔ ✔ ✔ ✔
Handling massive data and caching/tiling between server and client ✔ ✔ ✔ ✔ ✔
? but foresees
the possibility of handling
massive cadastral data
Layers control ✔ ✔ ✔ ✔ ✔ ✔
Database support ? ? ? ? ? ✔
Support different models (vector/polyhedral, raster/voxel, point clouds)
✔ ✔ ✗ ✗ ✔ ✔
Support of basic 3D topographic visualization
✔ ✔ ✗ ✔ ✔ ✔
Visualization/dissemination of 3D Cadastral Information (9591)
Barbara Cemellini (Netherlands), Thompson Rod (Australia), Marian de Vries and Peter van Oosterom (Netherlands)
FIG Congress 2018
Embracing our smart world where the continents connect: enhancing the geospatial maturity of societies
Istanbul, Turkey, May 6–11, 2018
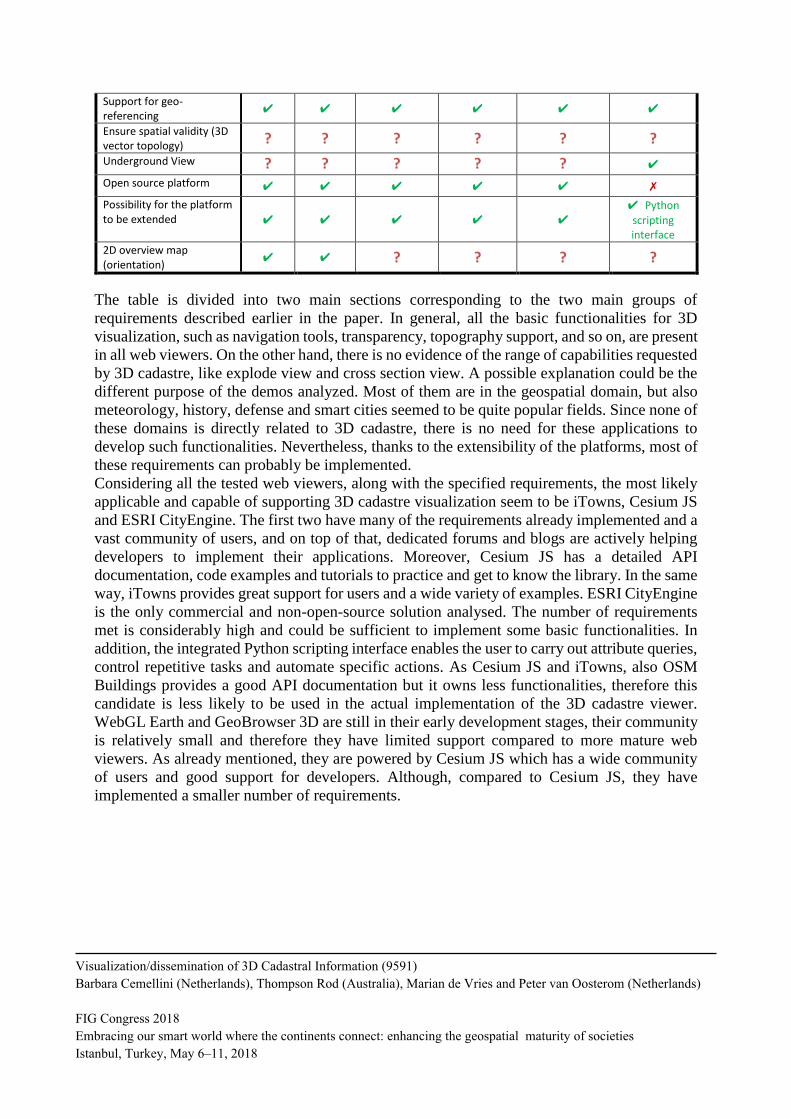
Support for geo-referencing
✔ ✔ ✔ ✔ ✔ ✔
Ensure spatial validity (3D vector topology) ? ? ? ? ? ?
Underground View ? ? ? ? ? ✔
Open source platform ✔ ✔ ✔ ✔ ✔ ✗
Possibility for the platform to be extended ✔ ✔ ✔ ✔ ✔
✔ Python
scripting interface
2D overview map (orientation)
✔ ✔ ? ? ? ?
The table is divided into two main sections corresponding to the two main groups of
requirements described earlier in the paper. In general, all the basic functionalities for 3D
visualization, such as navigation tools, transparency, topography support, and so on, are present
in all web viewers. On the other hand, there is no evidence of the range of capabilities requested
by 3D cadastre, like explode view and cross section view. A possible explanation could be the
different purpose of the demos analyzed. Most of them are in the geospatial domain, but also
meteorology, history, defense and smart cities seemed to be quite popular fields. Since none of
these domains is directly related to 3D cadastre, there is no need for these applications to
develop such functionalities. Nevertheless, thanks to the extensibility of the platforms, most of
these requirements can probably be implemented.
Considering all the tested web viewers, along with the specified requirements, the most likely
applicable and capable of supporting 3D cadastre visualization seem to be iTowns, Cesium JS
and ESRI CityEngine. The first two have many of the requirements already implemented and a
vast community of users, and on top of that, dedicated forums and blogs are actively helping
developers to implement their applications. Moreover, Cesium JS has a detailed API
documentation, code examples and tutorials to practice and get to know the library. In the same
way, iTowns provides great support for users and a wide variety of examples. ESRI CityEngine
is the only commercial and non-open-source solution analysed. The number of requirements
met is considerably high and could be sufficient to implement some basic functionalities. In
addition, the integrated Python scripting interface enables the user to carry out attribute queries,
control repetitive tasks and automate specific actions. As Cesium JS and iTowns, also OSM
Buildings provides a good API documentation but it owns less functionalities, therefore this
candidate is less likely to be used in the actual implementation of the 3D cadastre viewer.
WebGL Earth and GeoBrowser 3D are still in their early development stages, their community
is relatively small and therefore they have limited support compared to more mature web
viewers. As already mentioned, they are powered by Cesium JS which has a wide community
of users and good support for developers. Although, compared to Cesium JS, they have
implemented a smaller number of requirements.
Visualization/dissemination of 3D Cadastral Information (9591)
Barbara Cemellini (Netherlands), Thompson Rod (Australia), Marian de Vries and Peter van Oosterom (Netherlands)
FIG Congress 2018
Embracing our smart world where the continents connect: enhancing the geospatial maturity of societies
Istanbul, Turkey, May 6–11, 2018
4. INITIAL RESULTS
In this section, we will first give an overview description of the proposed Server-Client System
Architecture (Subsection 4.1), which will be the basis of our 3D Cadastral prototype. Next, we
introduce the various relevant data sets ad our test area: Brisbane, Queensland (Subsection 4.2).
The reason of this choice stems from the fact that the Queensland cadastre has the longest
tradition and the biggest amount of data available so far. In subsection 4.3, we present our first
Cesium based tests with several options for visualizing 3D parcels located subsurface (related
to tunnel).
4.1 Server-Client System Architecture
Using a web‐based solution makes a lot of sense for dissemination as web browsers offer a
relatively hardware/ software independent platform, reaching many possible users without great
efforts at the user side. Therefore, at the server side, a web data service (WFS) is established on
top of the LADM views in the database, exposing the 2D and 3D cadastral information to the
outside world. At the client side a 3D geo‐information aware WebGL based solution is applied
to visualize the 3D parcels (and reference objects) and interact with the information. Important
is that the client uses a selection of information (that is, not all available data in a state or nation-
wide database) as all information in the DCBD would be far too much; only looking at the 2D
parcels this is already too much (more than 2 million parcels, with many attributes). Server‐client caching techniques are used to manage well the communication between server and client
when panning over the area.
One of the uncertainties of this project is about the definition of the server-client interaction.
Therefore, the following question need to be investigated: What are the options to store and
transfer the data? (DBMS or encodings such as XML, JSON, glTF, etc.). For the back-end
storage, the database option seems appealing for two reasons. The advantage of having the data
in one place and always up to date, and the fact that the 2D parcels of the Brisbane DCDB are
already stored in a DBMS. On the other hand, for the data transfer to the client the use of
encodings such as XML, JSON, glTF, etc, can be convenient, since the 3D parcels encoded
until now are in XML format.
4.2 Data overview for Queensland prototype
A variety of data will be used in the project:
- 2D cadastral parcels (from Queensland Cadastre)
- 3D survey plans (from Queensland Cadastre), either in ’building format’ and in
’volumetric format’ More precisely, the volumes will represent three main categories
in the real world: buildings, tunnels and air space.
- Registration of rights, restrictions and responsibilities (if available)
- Elevation data (DTM or contour lines)
- Reference data (topographic objects in 2D or 3D - buildings, roads, etc.)
The cadastral data used for the project is taken from the Queensland Digital Cadastral Database
(DCDB), a collection of all the property boundaries and related property description of land
Visualization/dissemination of 3D Cadastral Information (9591)
Barbara Cemellini (Netherlands), Thompson Rod (Australia), Marian de Vries and Peter van Oosterom (Netherlands)
FIG Congress 2018
Embracing our smart world where the continents connect: enhancing the geospatial maturity of societies
Istanbul, Turkey, May 6–11, 2018
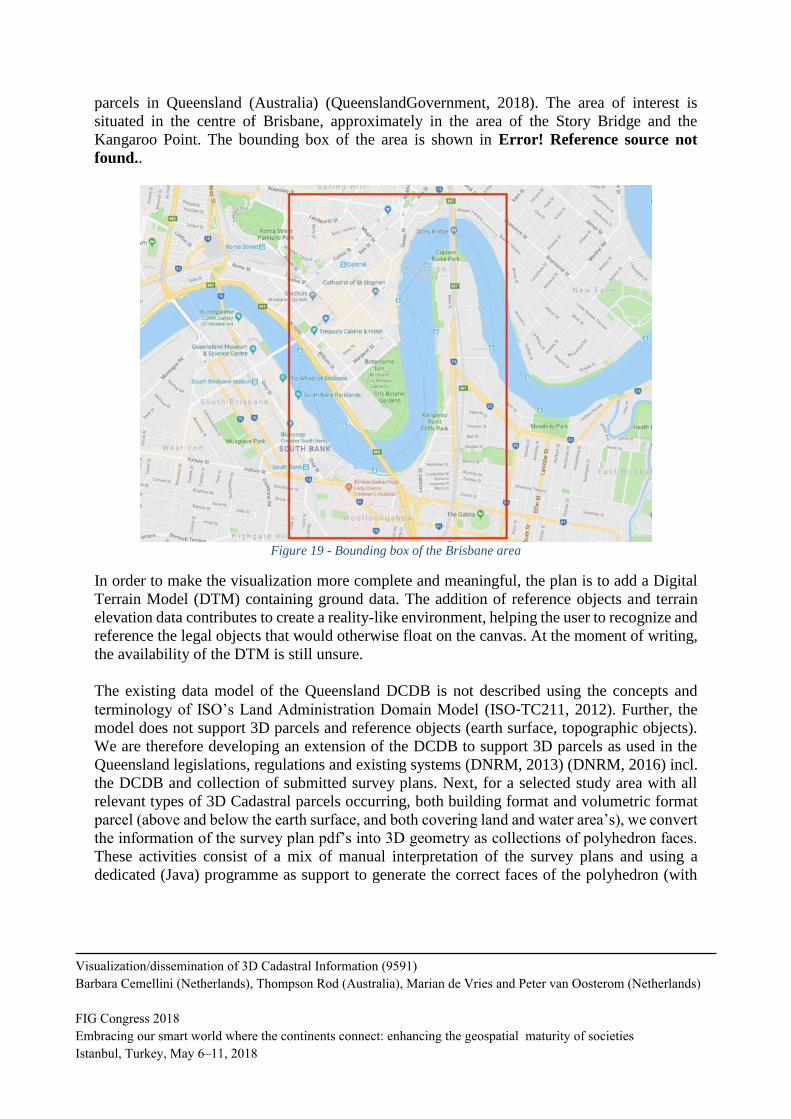
parcels in Queensland (Australia) (QueenslandGovernment, 2018). The area of interest is
situated in the centre of Brisbane, approximately in the area of the Story Bridge and the
Kangaroo Point. The bounding box of the area is shown in Error! Reference source not
found..
Figure 19 - Bounding box of the Brisbane area
In order to make the visualization more complete and meaningful, the plan is to add a Digital
Terrain Model (DTM) containing ground data. The addition of reference objects and terrain
elevation data contributes to create a reality-like environment, helping the user to recognize and
reference the legal objects that would otherwise float on the canvas. At the moment of writing,
the availability of the DTM is still unsure.
The existing data model of the Queensland DCDB is not described using the concepts and
terminology of ISO’s Land Administration Domain Model (ISO‐TC211, 2012). Further, the
model does not support 3D parcels and reference objects (earth surface, topographic objects).
We are therefore developing an extension of the DCDB to support 3D parcels as used in the
Queensland legislations, regulations and existing systems (DNRM, 2013) (DNRM, 2016) incl.
the DCDB and collection of submitted survey plans. Next, for a selected study area with all
relevant types of 3D Cadastral parcels occurring, both building format and volumetric format
parcel (above and below the earth surface, and both covering land and water area’s), we convert
the information of the survey plan pdf’s into 3D geometry as collections of polyhedron faces.
These activities consist of a mix of manual interpretation of the survey plans and using a
dedicated (Java) programme as support to generate the correct faces of the polyhedron (with
Visualization/dissemination of 3D Cadastral Information (9591)
Barbara Cemellini (Netherlands), Thompson Rod (Australia), Marian de Vries and Peter van Oosterom (Netherlands)
FIG Congress 2018
Embracing our smart world where the continents connect: enhancing the geospatial maturity of societies
Istanbul, Turkey, May 6–11, 2018
connections between neighbour faces, right orientation, etc.). Currently only planar faces are
supported, but survey surfaces do occur (e.g. cylinder patches) and they need to be supported
also in the near future (most likely via approximations). The polyhedron faces are then loaded
in the prototype version of the extended DCDB (stored in PostgreSQL/PostGIS) and combined
with other 2D and 3D spatial data. In this way, it would be possible to check if a collection of
3D parcels is not overlapping. So far, this is still the ‘internal side’ of the 3D Cadastre in
Queensland. The next step will be the dissemination and visualization of the 3D parcels.
4.3 Initial results with Cesium based webviewer
Initially, the research is focussing on the capabilities of Cesium JS for the visualization and
dissemination of 3D cadastre. The first aspect that has been taken into account is regarding the
visualization of the 3D parcels with respect to the earth surface; namely, whether it is possible
to properly visualize parcels, both above and below the ground surface.
The main issue is that the topic of ‘underground geometries’ is not included in the
documentation and, therefore, not supported by Cesium JS. However, being this a very popular
discussion topic, several developers found different options to overcome this problem.
The three main options are:
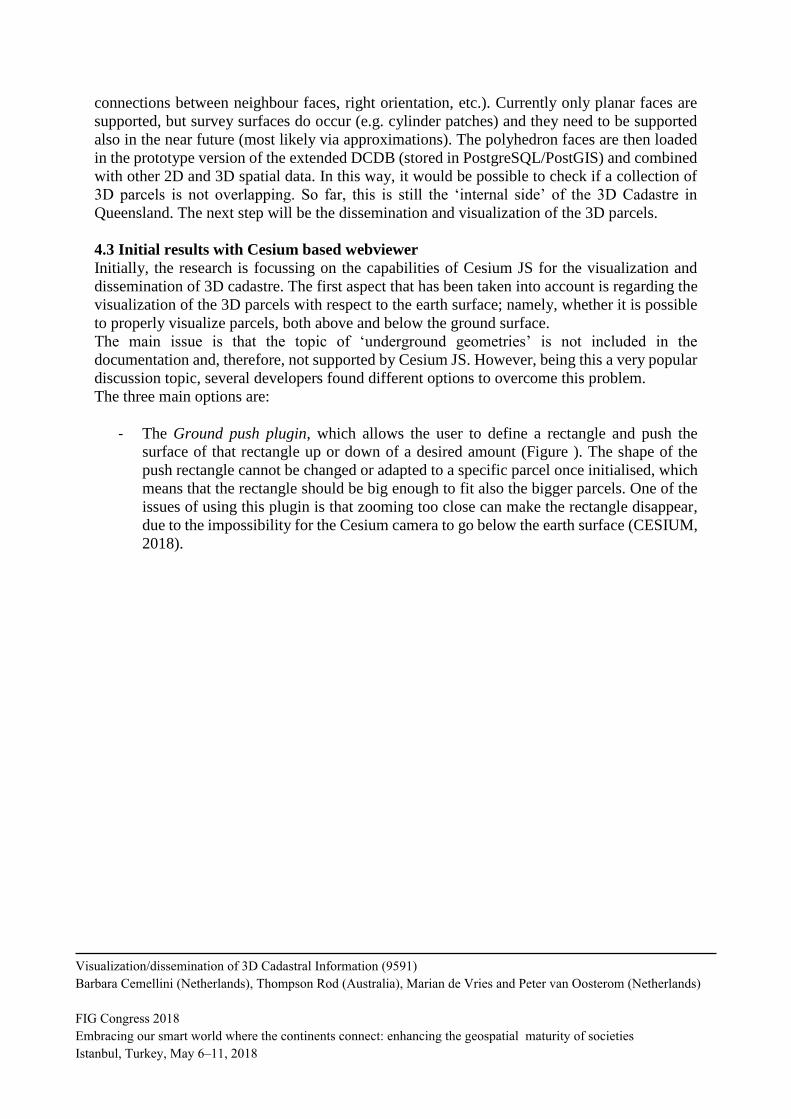
- The Ground push plugin, which allows the user to define a rectangle and push the
surface of that rectangle up or down of a desired amount (Figure ). The shape of the
push rectangle cannot be changed or adapted to a specific parcel once initialised, which
means that the rectangle should be big enough to fit also the bigger parcels. One of the
issues of using this plugin is that zooming too close can make the rectangle disappear,
due to the impossibility for the Cesium camera to go below the earth surface (CESIUM,
2018).
Visualization/dissemination of 3D Cadastral Information (9591)
Barbara Cemellini (Netherlands), Thompson Rod (Australia), Marian de Vries and Peter van Oosterom (Netherlands)
FIG Congress 2018
Embracing our smart world where the continents connect: enhancing the geospatial maturity of societies
Istanbul, Turkey, May 6–11, 2018
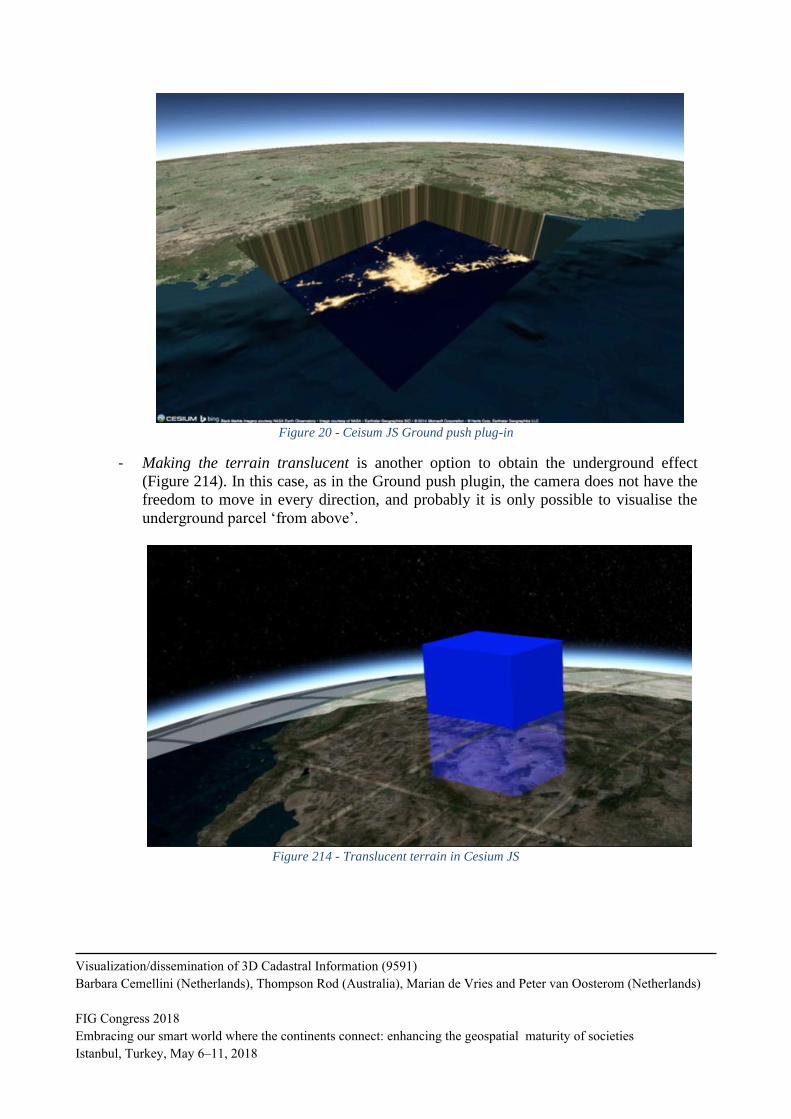
Figure 20 - Ceisum JS Ground push plug-in
- Making the terrain translucent is another option to obtain the underground effect
(Figure 214). In this case, as in the Ground push plugin, the camera does not have the
freedom to move in every direction, and probably it is only possible to visualise the
underground parcel ‘from above’.
Figure 214 - Translucent terrain in Cesium JS
Visualization/dissemination of 3D Cadastral Information (9591)
Barbara Cemellini (Netherlands), Thompson Rod (Australia), Marian de Vries and Peter van Oosterom (Netherlands)
FIG Congress 2018
Embracing our smart world where the continents connect: enhancing the geospatial maturity of societies
Istanbul, Turkey, May 6–11, 2018
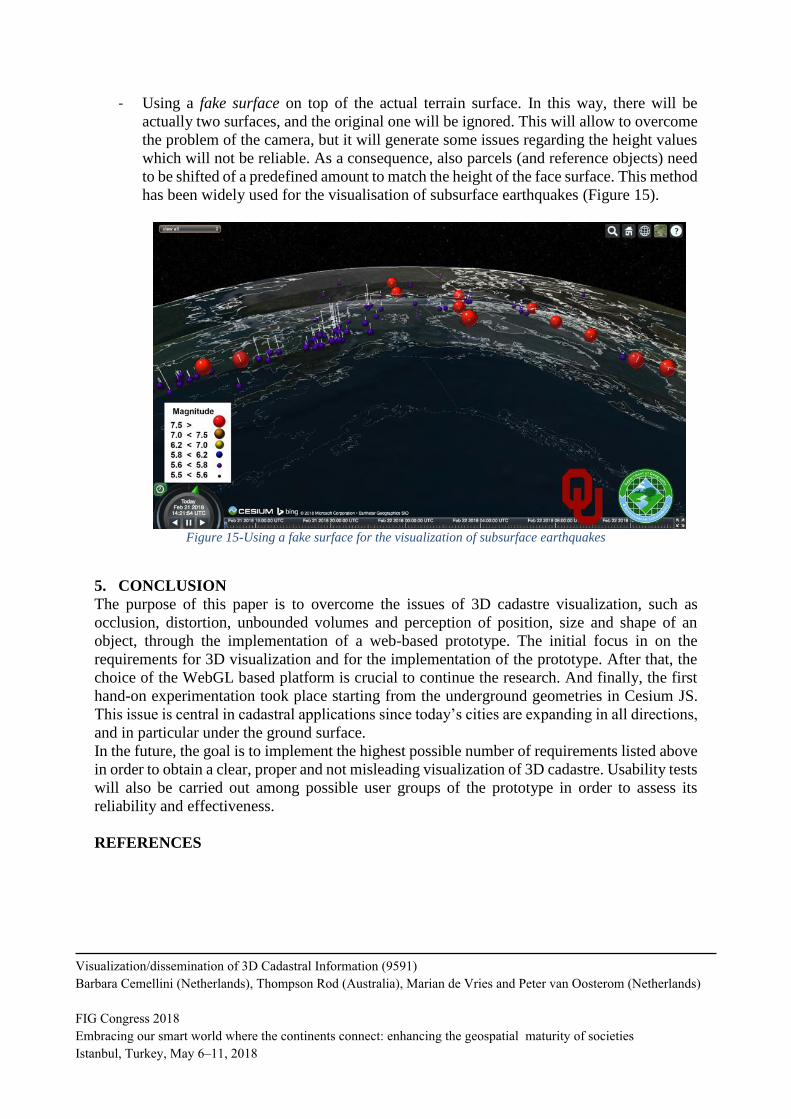
- Using a fake surface on top of the actual terrain surface. In this way, there will be
actually two surfaces, and the original one will be ignored. This will allow to overcome
the problem of the camera, but it will generate some issues regarding the height values
which will not be reliable. As a consequence, also parcels (and reference objects) need
to be shifted of a predefined amount to match the height of the face surface. This method
has been widely used for the visualisation of subsurface earthquakes (Figure 15).
Figure 15-Using a fake surface for the visualization of subsurface earthquakes
5. CONCLUSION
The purpose of this paper is to overcome the issues of 3D cadastre visualization, such as
occlusion, distortion, unbounded volumes and perception of position, size and shape of an
object, through the implementation of a web-based prototype. The initial focus in on the
requirements for 3D visualization and for the implementation of the prototype. After that, the
choice of the WebGL based platform is crucial to continue the research. And finally, the first
hand-on experimentation took place starting from the underground geometries in Cesium JS.
This issue is central in cadastral applications since today’s cities are expanding in all directions,
and in particular under the ground surface.
In the future, the goal is to implement the highest possible number of requirements listed above
in order to obtain a clear, proper and not misleading visualization of 3D cadastre. Usability tests
will also be carried out among possible user groups of the prototype in order to assess its
reliability and effectiveness.
REFERENCES
Visualization/dissemination of 3D Cadastral Information (9591)
Barbara Cemellini (Netherlands), Thompson Rod (Australia), Marian de Vries and Peter van Oosterom (Netherlands)
FIG Congress 2018
Embracing our smart world where the continents connect: enhancing the geospatial maturity of societies
Istanbul, Turkey, May 6–11, 2018

AGI. (2017). (Analytical Graphics, Inc.) Retrieved November 11, 2017, from AGI:
https://www.agi.com/products/open-source
Cesium JS. (2017). Retrieved November 12, 2017, from Cesium JS: https://cesiumjs.org
Chaturvedi, K. (2014). Web based 3D analysis and visualization using HTML5 and WebGL.
University of Twente, Faculty of Geo-information Science and Earth Observation -
Department of Geoinformatics, Enschede, The Netherlands.
Danchilla, B. (2012). Beginning WebGL for HTML5. Apress.
ESRI. (2017). About CityEngine Web Viewer. Retrieved November 14, 2017, from ArcGIS:
http://doc.arcgis.com/en/arcgis-online/reference/about-cityengine-web-viewer.htm
Geobrowser 3D. (2017). Retrieved November 16, 2017, from http://geobrowser3d.com
Github OSM buildings. (2017). Retrieved November 16, 2017, from Github:
https://github.com/OSMBuildings/OSMBuildings
IGN. (2015). Retrieved November 5, 2017, from Institut national de l’information géographique
et forestière: http://www.ign.fr/institut/innovation/itowns
iTowns . (2017). Retrieved November 4, 2017, from http://www.itowns-project.org
Khronos Group. (2017). WebGL overview. Retrieved November 6, 2017, from Khronos Group:
https://www.khronos.org/webgl/
Mackey, A. (2017). Why you should learn WebGL . Retrieved November 6, 2017, from
Pluralsight: https://www.pluralsight.com/blog/software-development/webgl-basics
OSM buildings. (2017). Retrieved November 14, 2017, from https://osmbuildings.org
Pereira, K. (2013). Water Simulation on WebGL and Three.js. Bachelor thesis, The University
of Southern Mississippi, Department of Computer Science.
Pouliot, J., Ellul, C., Hubert, F., Wang, C., Rajabifard, A., Kalantari, M., . . . Ying, S. (2017).
Best Practices in 3D Cadastre Visualization and New Opportunities.
QueenslandGovernment. (2018). Digital cadastral data. Retrieved from https://
www.business.qld.gov.au/running-business/support-assistance/ mapping-data-
imagery/data/digital-cadastral.
Ribeiro, A., Duarte de Almeida, J.-P., & Ellul, C. (2014). Exploring CityEngine as a
Visualisation Tool for 3D Cadastre. 4th International Workshop on FIG 3D Cadastres,
(pp. 197-218). Dubai, United Arab Emirates.
Shojaei, D. (2014). 3D Cadastral Visualisation: Understanding Users’ Requirements. Phd
thesis, University of Melbourne, Centre for Spatial Data Infrastructures (SDIs) and Land
Administration,Department of Infrastructure Engineering - School of Engineering,
Melbourne.
van Oosterom, P., & Stoter, J. (2006). 3D Cadastre in an International Context - Legal,
organizational and technological aspects. (T. a. Group, Ed.) CRC Press.
WebGL Earth. (2017). Retrieved from WebGL Earth:
https://www.webglearth.com/#ll=20.66614,24.55521;alt=16340753;h=43.173;t=-
0.400
Zare Zardiny , A., & Hakimpour, F. (2015). 3D Web Services for Visualization and Data
Sharing in 3D Cadastre. International Journal of 3-D Information Modeling (IJ3DIM),
15.
Visualization/dissemination of 3D Cadastral Information (9591)
Barbara Cemellini (Netherlands), Thompson Rod (Australia), Marian de Vries and Peter van Oosterom (Netherlands)
FIG Congress 2018
Embracing our smart world where the continents connect: enhancing the geospatial maturity of societies
Istanbul, Turkey, May 6–11, 2018
BIOGRAPHICAL NOTES
Barbara Cemellini BSc Urban Planning at Politecnico di Milano and now MSc Geomatics
student at Delft University of Technology. She is currently working on her MSc thesis project
on the topic of the current paper.
Rodney James Thompson has been working in the spatial information field since 1985. He
designed and led the implementation of the Queensland Digital Cadastral Data Base, and is now
advising on spatial database technology with an emphasis on 3D and temporal issues. He
obtained a PhD at the Delft University of Technology in December 2007.
Marian de Vries holds an MSc in Economic and Social History from the Free University
Amsterdam, The Netherlands (VU). She worked some years at the Free University and the
University of Nijmegen, then switched to become a software developer. Since 2001 she works
as researcher at the Section GIS Technology, OTB, Delft University of Technology. Focus of
her research is on distributed geo-information systems. She participated in a number of projects
for large data providers in the Netherlands such as Rijkswaterstaat and the Dutch Cadastre.
Peter van Oosterom obtained an MSc in Technical Computer Science in 1985 from Delft
University of Technology, the Netherlands. In 1990 he received a PhD from Leiden University.
From 1985 until 1995 he worked at the TNO-FEL laboratory in The Hague. From 1995 until
2000 he was senior information manager at the Dutch Cadastre, where he was involved in the
renewal of the Cadastral (Geographic) database. Since 2000, he is professor at the Delft
University of Technology, and head of the ‘GIS Technology’ Section, Department OTB,
Faculty of Architecture and the Built Environment, Delft University of Technology, the
Netherlands. He is the current chair of the FIG Working Group on ‘3D Cadastres’.
Visualization/dissemination of 3D Cadastral Information (9591)
Barbara Cemellini (Netherlands), Thompson Rod (Australia), Marian de Vries and Peter van Oosterom (Netherlands)
FIG Congress 2018
Embracing our smart world where the continents connect: enhancing the geospatial maturity of societies
Istanbul, Turkey, May 6–11, 2018
CONTACTS
Barbara Cemellini
Delft University of Technology
Faculty of Architecture and the Built Environment
MSc Geomatics for the Built Environment
2600 GA Delft
THE NETHERLANDS
Tel.: +39 3358188438
E-mail: [email protected]
Rod Thompson
Delft University of Technology,
Faculty of Architecture and the Built Environment
Department OTB, Section GIS-technology
P.O. Box 5030
2600 GA Delft
THE NETHERLANDS
E-mail: [email protected]
Marian de Vries
Delft University of Technology,
Faculty of Architecture and the Built Environment
Department OTB, Section GIS-technology
P.O. Box 5030
2600 GA Delft
THE NETHERLANDS
Tel. +31 15 2784268
E-mail: [email protected]
Peter van Oosterom
Delft University of Technology
Faculty of Architecture and the Built Environment
Department OTB, Section GIS-technology
P.O. Box 5030
2600 GA Delft
THE NETHERLANDS
Tel.: +31 15 2786950
E-mail: P.J.M.vanOosterom@tudelft.
Visualization/dissemination of 3D Cadastral Information (9591)
Barbara Cemellini (Netherlands), Thompson Rod (Australia), Marian de Vries and Peter van Oosterom (Netherlands)
FIG Congress 2018
Embracing our smart world where the continents connect: enhancing the geospatial maturity of societies
Istanbul, Turkey, May 6–11, 2018