Embed Size (px)
Citation preview
Killen Visualizations of project interdependencies for portfolio decision making
675481- 1
DSI (Decision Sciences Institute) Annual Conference, Baltimore Maryland, Nov 16-19 2013.
VISUALIZATIONS OF PROJECT INTERDEPENDENCIES FOR
PORTFOLIO DECISION MAKING: EVALUATION THROUGH
DECISION EXPERIMENTS.
Catherine P Killen University of Technology, Sydney, Australia
Faculty of Engineering and Information Technology
PO Box 123, Broadway NSW 2007, Australia
email: [email protected] ph:+612 9514 1830
ABSTRACT
Decision making is central to an organization’s management of its investments across a portfolio
of projects. Cognitive fit theory proposes that decision quality will be enhanced when there is
alignment between the information emphasized in visual data representations and the important
aspects of the decision problem. This study explores the effect of different methods of
representing project interdependency data on the resulting decision quality in a simulated project
portfolio management decision scenario. The findings, based on a sample of 264 experiments,
show that the type of data representation used may influence the quality of the resulting decision
and that the use of network mapping displays is correlated with the best results.
Keywords: Project portfolio management; data representations; visualization; network mapping;
cognitive fit
INTRODUCTION
Decision making is central to an organization’s management of its investments across a portfolio
of projects through project portfolio management (PPM). PPM is an organizational capability of
growing importance in an increasingly complex project landscape (Levine, 2005; Cicmil et al.,
2006; Jonas, 2010). By managing projects from a portfolio level and evaluating all projects and
their interrelationships, PPM aims to improve the performance of the project portfolio as a whole.
Portfolio decisions are responsible for ensuring resource adequacy, dynamic agility, and strategic
alignment using a portfolio-level rather than a project-level perspective (Floricel and Ibanescu,
2008; Petit, 2011). However, PPM decisions are subject to limitations in human cognitive
capability to analyze a variety of information in limited time. PPM processes are designed to
assist such decision making by providing a holistic view of the project portfolio, ensuring that
data are available and offering representation methods and tools to facilitate analysis of project
data (Cooper et al., 2001; De Reyck et al., 2005; Kester et al., 2011). Organizational success
depends on appropriate PPM methods and tools that improve the quality of these portfolio-level
decisions.
See interactive project portfolio map referenced in this paper : www.optimice.com.au/projectinterdependencies.php
Killen Visualizations of project interdependencies for portfolio decision making
675481- 2
The interdependencies between projects add to the complexity of PPM decision making and must
be considered along with financial, strategic, risk, resource and other factors. Portfolios of
complex and interdependent projects are increasingly common and there is an identified need for
better tools to understand and manage the relationships between projects. New processes, tools,
and techniques are regularly proposed and evaluated in PPM literature and research (Archer and
Ghasemzadeh, 1999; Dickinson et al., 2001; Dawidson, 2006; Kester et al., 2009). However,
measuring the effect of a new tool or method is difficult because each organizational environment
is different and there are many uncontrollable factors that influence project performance. While
research in organizational settings can provide valuable insights, such settings do not provide a
reliable and static environment where it is possible generalize findings. Simulated decision
challenges in a controlled setting can complement organization based research by testing the
effects of changes in a systematic method in an experimental fashion.
This paper draws upon theories of bounded rationality and cognitive fit to explore alternative data
representation methods for the management of project interdependencies. The research employs
controlled experimentation in a classroom setting to test the ability of three different data
representation formats to enhance understanding of project interdependencies to support PPM
decision making.
LITERATURE REVIEW
PPM decision making and project interdependencies
PPM is a set of organizational activities that provides a holistic framework for the management
of the project portfolio. The literature highlights that PPM is primarily a strategic decision-
making process which involves identifying, minimizing and diversifying risk, identifying and
responding to changes, and understanding, accepting and making trade-offs (Kester et al., 2011;
Levine 2005). PPM decisions require consideration of multiple factors and the ability to envision
alternative future consequences of project decisions across a portfolio. Decision making quality
has a major influence on project portfolio success (Matheson and Menke, 1994).
Best practice studies indicate that high-performing organizations use carefully compiled
executive-level teams, often called portfolio review boards (PRB), to make portfolio decisions
(Cooper et al., 2001; Dickinson et al., 2001; Killen et al., 2008). The decision making requires a
central view of all projects in the portfolio and the PRB is informed by methods that facilitate
group decision making including portfolio maps and other graphical and visual displays (De
Maio et al., 1994; Cooper et al., 2001; Mikkola, 2001); however, the maps must be customized
for effective portfolio decision making (Phaal et al., 2006). The use of such visual data
representations is correlated with better portfolio performance (Cooper et al., 2001: Killen et al.,
2008).
PPM decisions consider the portfolio as a whole, but often treat each project as an isolated entity.
The presence of interdependencies between projects can cause unpredictable interactions and
reactions in the system (Aritua et al., 2009; Perminova et al., 2008; Collyer and Warren, 2009),
and it is widely accepted that organizations must be able to understand the dependencies between
projects in their portfolio in order to make appropriate project decisions for the best portfolio
outcomes (Verma and Sinha, 2002; Blau et al., 2004).
See interactive project portfolio map referenced in this paper : www.optimice.com.au/projectinterdependencies.php
Killen Visualizations of project interdependencies for portfolio decision making
675481- 3
The management of interdependences is acknowledged as an area of weakness for PPM (Elonen
and Artto, 2003). Some organizations record interdependency information along with other
attributes in a project database, however the ability to use this data for decision making is limited.
Interdependencies are sometimes displayed on a dependency matrix grid to inform management
and support decision making, however these displays do not readily identify multi-step
dependencies (Dickinson et al., 2001; Danilovic and Browning, 2007). To meet the challenges of
PPM, especially as complexity and uncertainty increase, researchers are active in developing and
evaluating new decision-making tools (Aritua et al., 2009).
Bounded rationality and PPM decision making
The bulk of PPM literature assumes that decisions are made on a rational basis within a
structured PPM process. However, some authors question this assumption and find that other
influences on PPM decisions can result in less than rational outcomes (Eskerod et al., 2004;
Christiansen and Varnes, 2008). Humans also have a tendency for bias towards excessive
optimism; however, a PPM process can address such human shortcomings by improving
transparency in the decision-making process (Lovallo and Sibony, 2006). In addition, humans are
subject to ‘bounded rationality’ (Simon, 1955), which limits their ability to interpret the large
amounts of data required in PPM decision making, and results in decisions that are not always
rational. Decisions are often required to be made without complete and accurate information.
This and the human cognitive limitations in interpreting the information, and the finite amount of
time available to make decisions, contribute to the ‘bounded rationality' that affects PPM decision
making, especially in complex and dynamic environments.
Most PPM decisions involve human judgment, often in an executive review meeting or PRB
where each individual’s experience, diversity, and judgment contributes to a powerful team
perspective for decision making. However, complex decisions are strongly affected by human
cognitive constraints (Foreman and Selly, 2002). Humans are limited in their ability to recognize
interdependencies and resultant flow-on effects from their decisions and actions in complex
systems. While human capabilities are limited, research suggests that visualization techniques can
compensate for limitations in working memories (Tergan and Keller, 2005).
Managers are asked to make decisions based on increasing volumes of information (Shim et al.,
2002), and the time available to digest and analyze the information is often limited (Agor, 1986;
Dane and Pratt, 2007). Decisions made with inadequate time are likely to be made with limited
evaluation of alternatives and exhibit lower decision quality (Ahituv et al., 1998; Janis and Mann,
1977; Svenson and Maule, 1993). For example, time pressure is a factor contributing to budget
over-runs in project management environments (Williams, 2005; Cicmil et al., 2006). In this
environment of incomplete information, limited cognitive capabilities, and limited time, PPM
decisions are often affected by bounded rationality and therefore may not be optimal (Blichfeldt
and Eskerod, 2008). PPM processes and tools aim to alleviate one or more of these challenges to
improve decisions – for example by filtering and formatting information in a way that aids
interpretation in the time available and within human cognitive limits. Many forms of computer-
based decision support systems have been suggested, with the aim of streamlining decision
making and thus making better use of decision-making time (Shim et al., 2002). However, while
many highly computerized solutions have been offered, there is little evidence of the use of such
methods in PPM practice.
See interactive project portfolio map referenced in this paper : www.optimice.com.au/projectinterdependencies.php
Killen Visualizations of project interdependencies for portfolio decision making
675481- 4
Cognitive fit and data representation tools
The cognitive fit theory explains how the fit between the method used to represent data and the
nature of the decision task affects the quality of the resulting decision (Vessey, 1991). Different
types of data representations emphasize different aspects of the data (for example tables usually
provide symbolic representation while graphics may display spatial relationships) while the needs
of decision-making tasks vary in the information required from the data. The decision maker
must create a mental model to analyze the data with respect to the task to arrive at a solution.
When the data representation and the decision making task are aligned, this cognitive fit is
proposed to enhance decision-making ability by enabling the decision maker to directly apply the
interpretation of the data representation to the problem-solving task. However, when the two are
not aligned, the decision maker must perform further conversions of the data in order to address
the problem, resulting in lower decision accuracy and higher time requirements.
A number of experimental studies provide support for cognitive fit theory. For example, a study
of forecasting in an accounting setting demonstrated that alignment between the data and task
dimensionality (3D visualizations of multi-dimensional data) improved the quality of the forecast
(Dull and Tegarden, 1999). In another study, graphical representations of geographical adjacency
and proximity in maps were found to provide increasing benefits as task complexity increased
(Smelcer and Carmel, 1997). Cognitive fit is used to explain the relationship between buyer
behavior and different web formats that display the same information (Hong, Thong, and Tam,
2004) and an experimental study of knowledge and expertise visualization methods found that
decision speed was enhanced when compared to tabular information, but not decision quality
(Huang et al., 2006). A fractional factorial experiment showed that graphs provided better fit in a
study of bankruptcy predictions; the graphs provided integrative spatial information while
preserving the characteristics of the underlying data. The cognitive fit model relies not only on
the task and the data representation; the spatial visualization abilities and other individual
differences are also at play in the relationship between the task, data representation and quality of
the decision (Smelcer and Carmel, 1997; Vessey, 1991).
Visual representations and decision making
The combination of human cognitive skills and visual representations of data that have strong
cognitive fit with the decision problem have the potential to greatly enhance PPM decision
making. Visual data representations that harness the executive decision makers’ experience and
judgment will provide particular benefits in the PRB team environment. Visual representations of
data are shown to assist with the analysis of complex data (Mikkola, 2001) and help
communicate and shape strategic thinking (Warglien and Jacobides, 2010). These visual
representations can provide an effective format for representing and communicating information
to support strategic decision making by illustrating complex multi-dimensional aspects of
decision problems in a simple and powerful manner (Meyer, 1991). Visual information is
cognitively processed while preserving spatial orientations and interrelationships. Research has
found that graphical data displays can aid in the attention, agreement, and retention of strategic
information (Kernbach and Eppler, 2010).
Improvements in computers and software-based tools offer many new methods for collecting and
displaying information (Dansereau and Simpson, 2009). Human skills in analysis and pattern
See interactive project portfolio map referenced in this paper : www.optimice.com.au/projectinterdependencies.php
Killen Visualizations of project interdependencies for portfolio decision making
675481- 5
finding combined with computer-generated graphics produce a powerful and flexible cognitive
system, taking advantage of the strengths of both humans and computers (Tergan and Keller,
2005).
The power of visualizations to support decision making is only beginning to be exploited, and
there is a need for more research in this area (Warglien and Jacobides, 2010). Cognitive fit is
important, and visual representations of information must be customized for the task to best
facilitate decision making. Some decisions require visualizations that display multiple factors,
capture historical events, and reveal complex relationships (Platts and Tan, 2004). Matrix
displays have particular strengths in evaluating and sharing information (Bresciani and Eppler,
2010), and can present multiple types of information in ‘2½-dimensional’ displays that are very
powerful if well designed (Warglien, 2010).
A wide range of software solutions are available to assist with PPM data management and
decision making. These software solutions range from targeted utilities for the creation of
specific graphical displays to comprehensive systems that aim to support all aspects of the PPM
process. A visual ‘dashboard’ is often included in PPM solutions, and most support the
development of visual data displays such as portfolio maps.
Network maps as a visual PPM tool
While portfolio maps are a form of visual data representation that shows benefits when applied in
PPM (Killen et al, 2008; Cooper et al, 2001), they have limitations in that they do not show the
relationships between projects. Network maps, on the other hand, visually display relationships
between nodes in a network and reveal accumulated network effects (Scott, 2008) and are easily
created by software-based tools. Network maps can reveal patterns more clearly than verbal or
matrix displays and have been shown to provide benefits for decision making in mathematics,
biology and economics (Hanneman and Riddle, 2005). A common form of network mapping,
social network analysis (SNA), facilitates organizational decisions through the display of
relationships between people or organizations (Cross et al., 2002; Anklam et al., 2005; Scott,
2008).
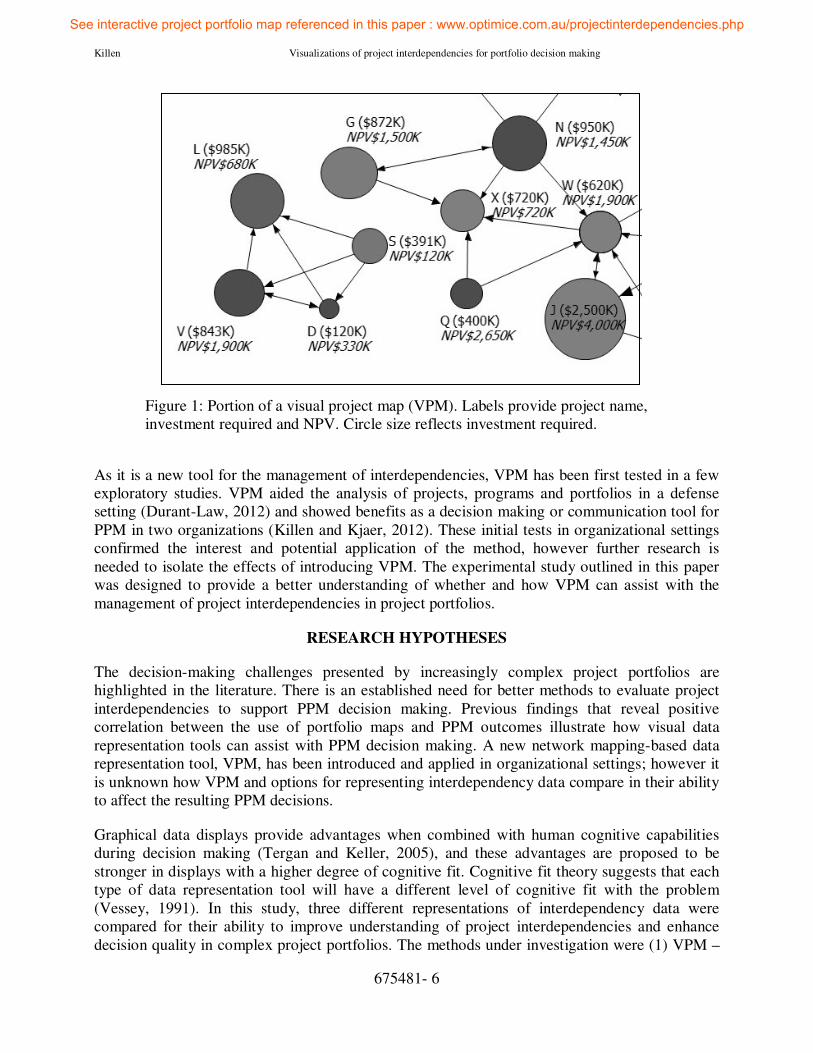
In complex project portfolios, interdependencies often exist in a web of interactions. Therefore
network mapping displays, with their ability to visualize ‘webs’ of connections between nodes,
may have high cognitive fit with the problem of understanding and managing project
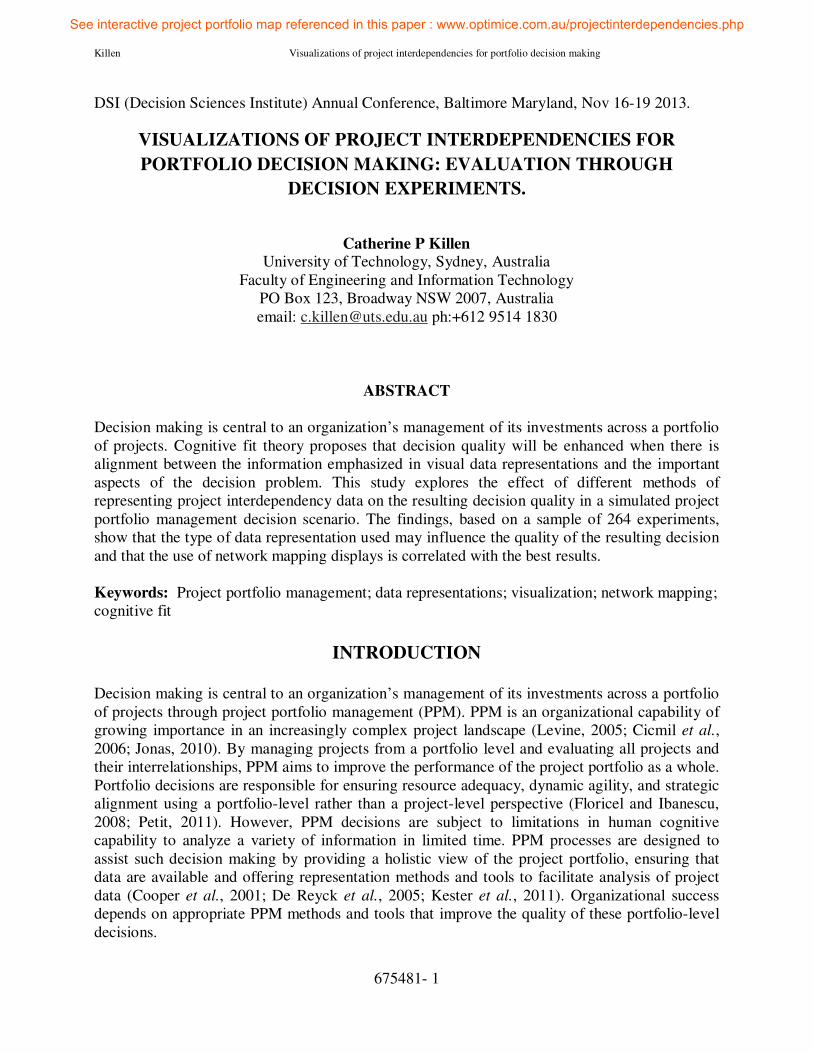
interdependencies. ‘Visual project maps’ (VPM) have been proposed as a method to apply
network mapping approaches to project portfolios to improve the understanding of project
interdependencies (Killen et al., 2009; Killen and Kjaer, 2012). VPM displays each project as a
node in the network and uses arrows to identify relationships or interdependencies between
nodes. The creation of VPM displays are aided by network mapping software such as NetDraw
(Borgatti, 2002) or NodeXL (Hansen et al., 2011). Figure 1 shows an example of a VPM type of
display.
See interactive project portfolio map referenced in this paper : www.optimice.com.au/projectinterdependencies.php
Killen Visualizations of project interdependencies for portfolio decision making
675481- 6
As it is a new tool for the management of interdependencies, VPM has been first tested in a few
exploratory studies. VPM aided the analysis of projects, programs and portfolios in a defense
setting (Durant-Law, 2012) and showed benefits as a decision making or communication tool for
PPM in two organizations (Killen and Kjaer, 2012). These initial tests in organizational settings
confirmed the interest and potential application of the method, however further research is
needed to isolate the effects of introducing VPM. The experimental study outlined in this paper
was designed to provide a better understanding of whether and how VPM can assist with the
management of project interdependencies in project portfolios.
RESEARCH HYPOTHESES
The decision-making challenges presented by increasingly complex project portfolios are
highlighted in the literature. There is an established need for better methods to evaluate project
interdependencies to support PPM decision making. Previous findings that reveal positive
correlation between the use of portfolio maps and PPM outcomes illustrate how visual data
representation tools can assist with PPM decision making. A new network mapping-based data
representation tool, VPM, has been introduced and applied in organizational settings; however it
is unknown how VPM and options for representing interdependency data compare in their ability
to affect the resulting PPM decisions.
Graphical data displays provide advantages when combined with human cognitive capabilities
during decision making (Tergan and Keller, 2005), and these advantages are proposed to be
stronger in displays with a higher degree of cognitive fit. Cognitive fit theory suggests that each
type of data representation tool will have a different level of cognitive fit with the problem
(Vessey, 1991). In this study, three different representations of interdependency data were
compared for their ability to improve understanding of project interdependencies and enhance
decision quality in complex project portfolios. The methods under investigation were (1) VPM –
Figure 1: Portion of a visual project map (VPM). Labels provide project name,
investment required and NPV. Circle size reflects investment required.
See interactive project portfolio map referenced in this paper : www.optimice.com.au/projectinterdependencies.php
Killen Visualizations of project interdependencies for portfolio decision making
675481- 7
a network mapping display, (2) Dependency matrices – a matrix display and (3) Tabular list – a
list of dependencies within a column of a spreadsheet or database.
VPM displays, with an ability to directly represent the connections between interdependent
projects, and to visually reveal the multi-step dependencies that are not easily seen in the other
displays, are proposed to have the highest degree of cognitive fit and therefore to contribute most
strongly to decision quality.
Therefore, the first hypotheses addressed in this study are:
H1: The type of tool used to evaluate project interdependencies will be correlated with the
quality of the resulting PPM decisions in complex project portfolios.
H1(a): VPM displays will contribute to better quality PPM decisions than the
other tools in complex project portfolios.
Time pressure is another challenge highlighted in the literature; time pressure can have
detrimental effects on decision-making ability (Janis and Mann, 1977; Svenson and Maule, 1993;
Ahituv et al., 1998). As time pressures are often unavoidable, it follows that tools that reduce the
perception of time pressure or the negative effects of time pressure will enhance PPM decision
making. Graphical data representations can allow data to be cognitively processed while
preserving spatial orientations and interrelationships (Meyer, 1991) and therefore may require
less data conversion to evaluate interrelationships. It is proposed that the different visual tools
possess different degrees of cognitive fit with the task and will provide different levels of time
saving benefits in the analysis of interdependencies. VPM displays are proposed to have the
highest degree of cognitive fit and to alleviate time pressure better than the other tools. If users
are more likely to feel they have enough time to make a decision with a particular tool, then that
tool is more likely to provide benefits in less time, reduce the negative effects of time pressures,
and lead to better decisions. The second and third hypotheses are:
H2: The type of tool used to evaluate project interdependencies will be correlated with the
perception of the adequacy of the time allocated to the decision task.
H2(a): Users of VPM displays will report higher levels of time adequacy than
users of other tools.
H3: Perception of time adequacy positively relates to the quality of the resulting decision.
A higher degree of cognitive fit should enhance the power of human cognitive capabilities to
accurately recognize the interdependency relationships in the project portfolio. VPM displays are
proposed to have the highest level of cognitive fit with the interdependency evaluation task, and
should therefore result in better interdependency understanding. Therefore the fourth set of
hypotheses is:
H4: The type of tool used to evaluate project interdependencies will be correlated with the
level of understanding of the interdependencies in the portfolio.
See interactive project portfolio map referenced in this paper : www.optimice.com.au/projectinterdependencies.php
Killen Visualizations of project interdependencies for portfolio decision making
675481- 8
H4(a): Users of VPM displays will report higher levels of understanding of the
interdependencies in the portfolio.
Improved understanding of the interdependencies in the portfolio is desirable because it should
lead to better decisions. A system with better cognitive fit that enhances human cognitive
capabilities to understand interdependencies is only of value if that understanding is translated
into better decisions. We propose that the quality of the decision will be related to the level of
understanding of project interdependencies. Therefore the fifth hypothesis is:
H5: The level of understanding of project interdependencies is positively related to the
quality of the decision.
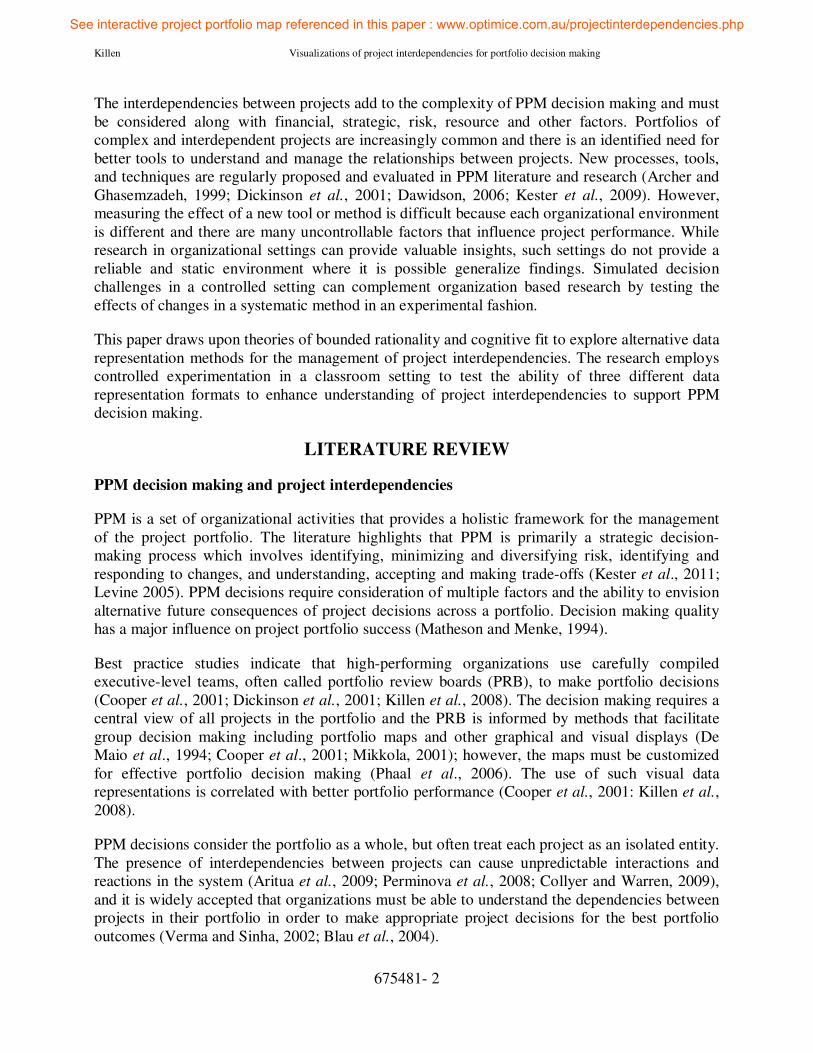
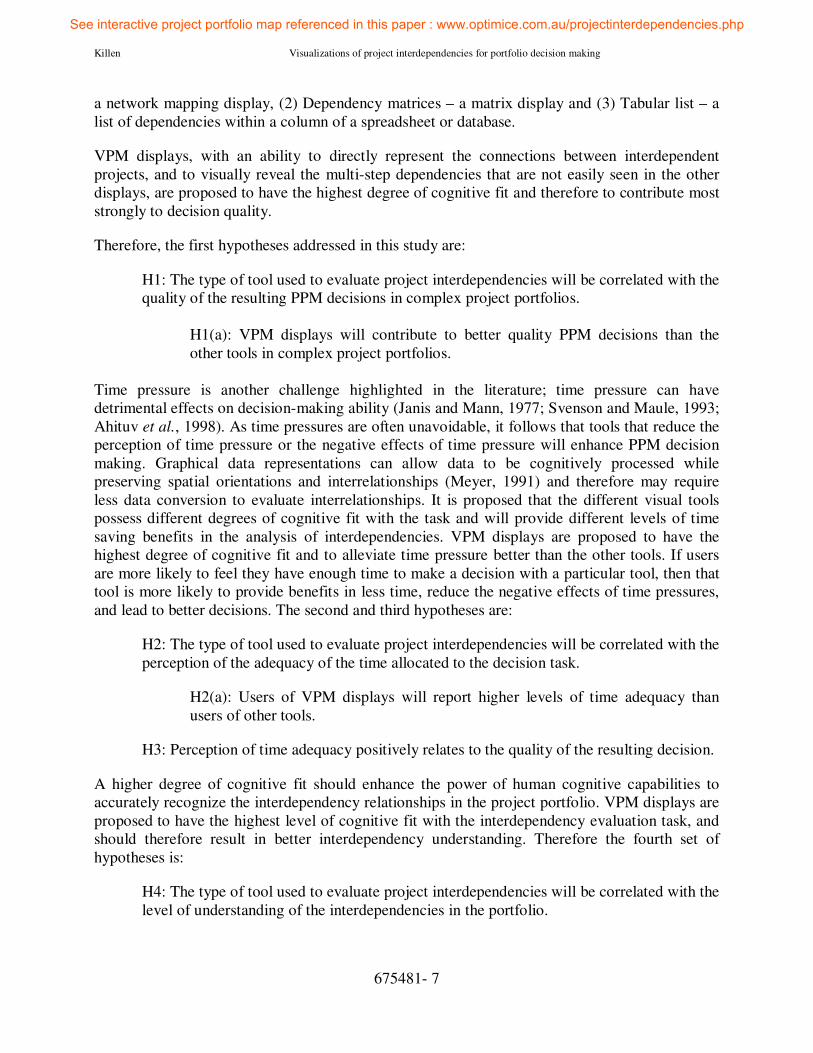
Figure 2 displays the five hypothesized relationships between the type of tool used to visualize
project interdependencies and the resulting decision quality.
Figure 2: Conceptual model linking the type of tool, perception of adequacy of time,
level of interdependency understanding and decision quality.
RESEARCH METHOD
Methodology
A simulated decision task in a controlled classroom setting was used to test the five hypotheses.
Although experimental research is common in fields like psychology, economics, or marketing, it
is not common in project management or PPM research and the research reported in this paper
represents an exploratory application of experimental research in such settings. The few related
studies reported in the literature include experimental approaches to simulate resource allocation
and sharing decisions in a project environment (Bendoly and Swink, 2007) and to understand
decision-making processes and learning effects in the project and portfolio management domain
(Arlt, 2011).
See interactive project portfolio map referenced in this paper : www.optimice.com.au/projectinterdependencies.php
Killen Visualizations of project interdependencies for portfolio decision making
675481- 9
Experimentation was selected to complement organization-based research in this study by
providing a reliable and controllable environment where the effects of changes can be measured.
The experimentation in the current study was designed to balance the principles of realism and
simplicity as summarized by Grossklags (2007). A degree of realism was included by proposing
a plausible scenario based in a business environment. Simplifying the scenario enabled the
participants to focus on the central task, and the controlled setting removed many of the
confounding factors that would impact research in an organizational setting.
Experimental data displays
The experiment evaluated and compared the use of different methods of presenting project
interdependency data. Three different types of data displays were developed for this study; VPM
(the network mapping display), a Dependency Matrix, and a Tabular List. Each of the displays
contains the same information, and each has been color coded to highlight the strategic
importance of the projects in the portfolio. A rainbow spectrum was employed where red and
orange were used to highlight highly strategically important projects, and green and blue were
used for projects that are less important strategically. In addition to strategic importance and
dependency data, the scenario also included financial information (investment and projected
return on investment).
The Tabular List and the Dependency Matrix displays were created based on approaches
commonly used in industry to represent project interdependencies. The Tabular List presents
project interdependencies in a single column as part of a spreadsheet. The Dependency Matrix
display provides a deeper level of detail by highlighting dependency relationships in the cell
corresponding to the pair of interdependent projects (in the row and column).
The newly proposed method, VPM, visualizes project interdependencies based on a network
mapping approach. An increasing range of network mapping tools facilitate the creation of such
displays, making it practical to consider the introduction of such displays to support PPM
decisions. The VPM display (as per the sample in Figure 1) is proposed to have the highest level
of cognitive fit with the interdependency analysis problem, as each interdependent set of projects
is directly connected by an arrow, and as the multi-level interdependencies are also easy to
visualize.
The experiment reported below was designed to reveal the potential influence of the type of data
representation on the resulting decision. Visual displays were created based on identical project
interdependency data in each of these three formats and randomly assigned to research
participants as detailed below.
Research design and experimental session detail
Postgraduate students participated in this study as part of a course in technology management.
Students are often used as research subjects in experimental research and can provide relevant
input when they have an appropriate background (Arlt, 2011; Bendoly and Swink, 2007; Dull and
Tegarden, 1999). The student participants in this study have completed an engineering or
technical undergraduate degree and are already familiar with project management concepts which
aided their suitability as research participants. However, it must be acknowledged that the use of
students may introduce bias as there may be a lower degree of diversity among the group and
See interactive project portfolio map referenced in this paper : www.optimice.com.au/projectinterdependencies.php
Killen Visualizations of project interdependencies for portfolio decision making
675481- 10
common source bias may result, and they do not usually possess the same level of experience and
maturity as practicing managers involved with PPM decisions. Participation in the research
provided advantages to the students as the topic is relevant in industry and served to augment and
extend their education. As this research involved students, the university ethics clearance was
obtained and the research was designed so that participation was voluntary and confidential.
The research design was pilot tested twice, first with seven participants and then with twelve.
Following feedback from the pilot testing, the presentation of project data and the visual data
displays were adjusted and the procedure for the warm-up task was refined. The pilot testing was
also designed to capture results in five-minute increments to help determine the optimal time
limit for the experiment, a ‘trial and error’ approach commonly taken in such research (Svenson
and Maule, 1993). The pilot testing indicated that 15 minutes was about the right amount of time
– enough for most students to absorb the data and make a decision but within a tight enough
timeframe to highlight the effect of time pressure.
The experiment was embedded in an 80-minute educational session on the topic of PPM and
project interdependency management. At the end of the experiment students were asked to fill out
a short survey that collected data on the decisions made and on the participants’ perceptions of
time adequacy, confidence with the decision and degree of understanding of the project
interdependencies. The decision scenario was developed based on a realistic challenge – it asked
students to reduce the budget by ten per cent by selecting one or more projects to cancel (remove
from the portfolio). The scenario was complex due to the high number of interdependencies
between projects in the portfolio.
During the class session, students were randomly assigned one of the three tools for their decision
task, and were provided with a set of materials for the task using their assigned tool. A warm-up
task conducted before the main decision task helped students learn about the use of their assigned
tool and aimed to reduce the learning effects inherent in the experiment by allowing students to
move up on the learning curve. During the main decision task, students evaluated identical data
on the 26 projects in a generic project portfolio. The following information was provided for each
project: investment and net present value projections, a rating for degree of strategic fit, and
information on project interdependencies in one of three data display formats. For simplicity, all
project interdependencies were assumed to be equal; varying types and strengths of relationships
were not considered. Students were given 15 minutes to complete the decision task. In this time,
they were required to review the information provided and decide which project or projects to
cancel to trim the portfolio budget by ten per cent. During the decision process, students were
asked to balance the following considerations with equal weighting: the interdependencies
between projects and any flow-on effects from their decisions to cancel projects; the impact on
strategic fit; and the return on investment. Although simplified for the purposes of this
experiment, this type of scenario where multiple types of data must be balanced reflects the
challenges faced by PPM decision makers.
Survey and item development
The research participants recorded their decision and provided responses for several items in a
short survey immediately following the 15 minute decision experiment. The eight items that were
designed to test the hypotheses are listed in Table A1 in Appendix A. The items CORR and
See interactive project portfolio map referenced in this paper : www.optimice.com.au/projectinterdependencies.php
Killen Visualizations of project interdependencies for portfolio decision making
675481- 11
DRATE were rated based on each participant’s decision. The remaining items employed
anchored 5-point Likert scales to collect perception-based responses from the participants.
Three measures of decision quality were used to test Hypothesis 1 and determine whether the
type of tool used to evaluate project interdependencies is correlated with the quality of the
resulting PPM decisions. Based on the decision entered by the participant, a binary rating
(CORR) was created with a value of 1 for the correct decision and 0 for any other decision, and
another rating (DRATE) was rated on a scale of 1–5 based on how well the decision balances the
required criteria and represents an optimal decision, with 5 representing the optimal decision and
1 the least optimal or most nonsensical decision. The rating acknowledged the gradation in
decision quality, but required the use of judgment that could introduce bias. To reduce this bias,
two researchers participated in a blind rating process (with no knowledge of the tool used or class
session of the participant) and then discussed their decisions and agreed on the final ratings for
DRATE. The third measure of decision quality is a perception-based item (CONF) that measures
participants’ confidence in their decision. Perception-based responses are often used in survey
research and are accepted as reliable indicators of reality. These three decision-quality ratings
were correlated with tool type to address H1.
Hypothesis 2 proposed that the type of tool used to evaluate project interdependencies will be
correlated with the perception of the adequacy of the time allocated to the decision task, and
Hypothesis 3 proposed that perception of time adequacy positively relates to the quality of the
resulting decision. To test H2 and H3, two items on the research participants’ perceptions of time
adequacy for understanding the tool (TTUT) and to make the decision (TTMD) were correlated
with decision quality measures and tool type.
Hypothesis 4 suggests that the type of tool used will be correlated with the level of understanding
of the interdependencies. Three final items assessed whether the tool used was instrumental in the
understanding of project interdependencies and portfolio effects of decisions (TUINT and
TUIMP), and whether the interdependency information influenced the decision made (IINFD).
Findings from these items are correlated tool type to address H4.
Hypothesis 5 proposes that the level of understanding of project interdependencies is positively
related to the quality of the decision. The items TUINT, TUIMP and IINFD are correlated with
decision quality measures to test H5.
Data collection and analysis
The experimentation was conducted in seven postgraduate technology management classes
during 2011 and 2012 and resulted in 264 valid survey responses from 271 students. Responses
were considered invalid if participants did not identify which tool they used during the
experiment or selected more than one tool; these invalid responses were ignored during the data
analysis. The valid responses represented a random allocation of tools across the seven class
sections; 91 participants used a VPM display, 87 used the Dependency matrix and 86 used a
Tabular representation. Although the experiment was designed to allocate the tools equally across
the sample, the numbers are slightly different due to the use of seven class sections where class
numbers are not always divisible by three and the removal of some invalid surveys.
Mean and standard deviations for the survey items are presented in Table A1 in Appendix A.
See interactive project portfolio map referenced in this paper : www.optimice.com.au/projectinterdependencies.php
Killen Visualizations of project interdependencies for portfolio decision making
675481- 12
The student’s t-test for independent samples (referred to as the t-test) was used to evaluate
responses between groups of respondents based on tool type used during the experiment.
Groupings were set up for users (1) and non-users (0) for each tool. Levene’s test for equality of
variance was used to determine the applicability to the ‘equal variance assumed’ or the ‘equal
variance not assumed’ t-test values (Collis and Hussey, 2003; Garson, 2012). The level of
significance of the differences in means based on these groupings is identified in figures 3, 4 and
5 using the symbol * for findings that are significant at 0.10 or better.
The student's t-test was also used to test for any significant differences in responses based on the
class session. Independent sample t- tests were conducted between pairs representing all
combinations of the seven classes. No significant differences were found between item responses
based on the class session attended.
Bivariate Pearson correlations were used to test correlation between the 5-point scale items. Tests
for normal distribution revealed acceptable kurtosis of the data; however, data for a few of the
items were negatively skewed, and so nonparametric analyses were also conducted using
Kendall's tau and Spearman test. These tests confirmed the significant relationships identified
using Pearson’s Chi squared tests with only minor differences between the Pearson results.
Therefore, for simplicity the data have been reported using the Pearson format. All statistical
results represent two-tailed analysis. Significance levels are reported for each correlation.
FINDINGS AND DISCUSSION
All but one of the primary hypotheses identified on the conceptual model in Figure 2 were
supported by the findings. The only exception was that no significant difference was found
between perceptions of time adequacy and tool use to support Hypothesis 2. The findings related
to each hypothesis are detailed below.
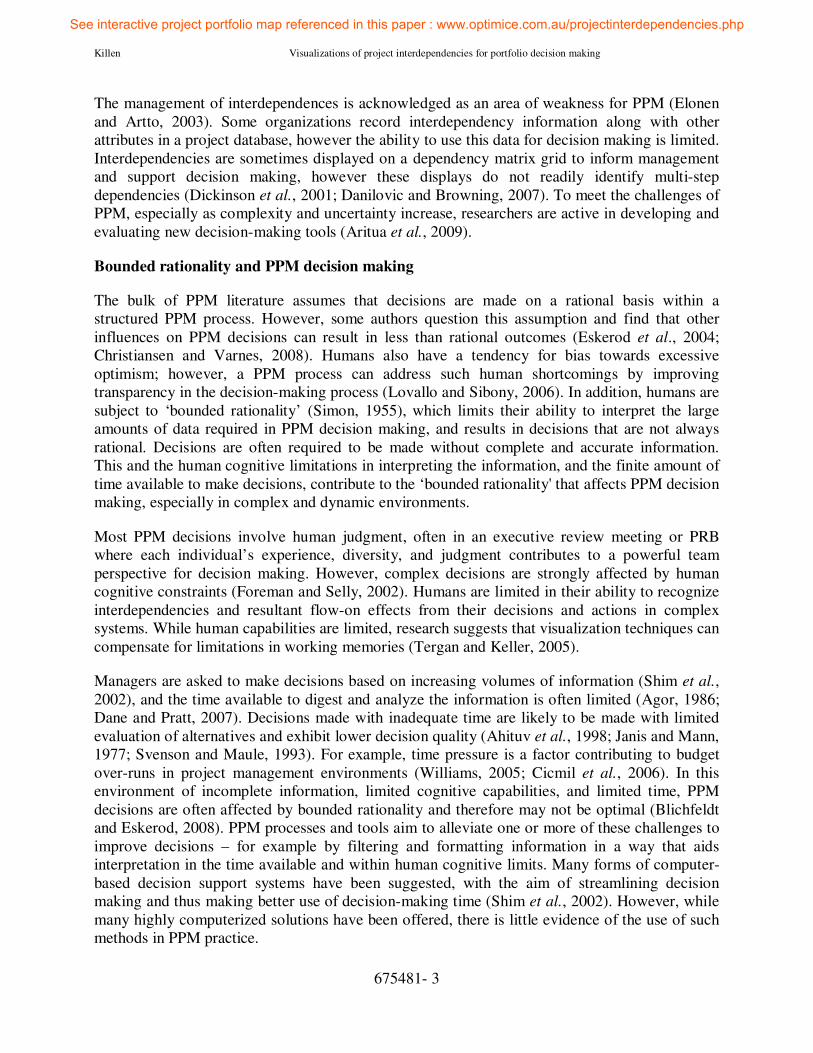
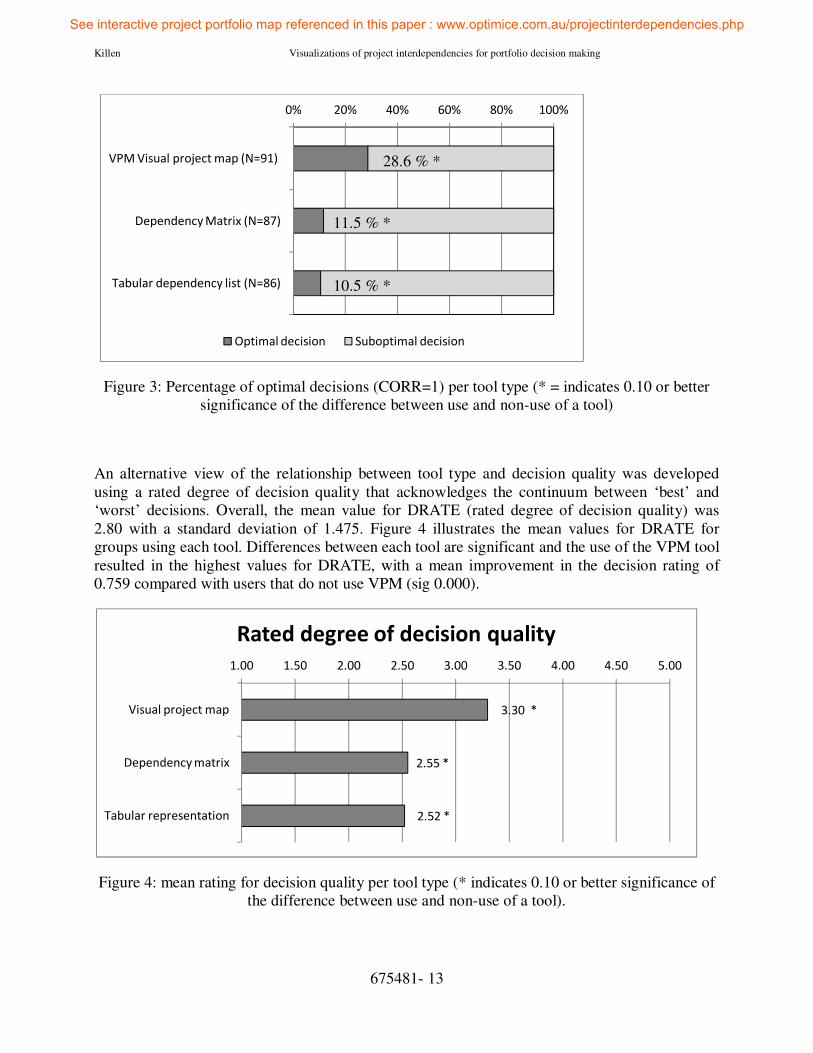
Hypothesis 1: The three measures of decision quality were used to determine whether tool type is
related to decision quality. Overall, 17 per cent of respondents arrived at the correct and optimal
decision (CORR = 1) during the decision task. As shown in Figure 3, the percentage of research
participants that made the optimal decision was highest for the group that used the network
mapping VPM tool, with 28.6 percent of the participants achieving an optimal decision in the
time allowed. Just over ten and eleven percent of the decisions made using the other tools, the
dependency matrix and the Tabular list were optimal.
See interactive project portfolio map referenced in this paper : www.optimice.com.au/projectinterdependencies.php
Killen Visualizations of project interdependencies for portfolio decision making
675481- 13
Figure 3: Percentage of optimal decisions (CORR=1) per tool type (* = indicates 0.10 or better
significance of the difference between use and non-use of a tool)
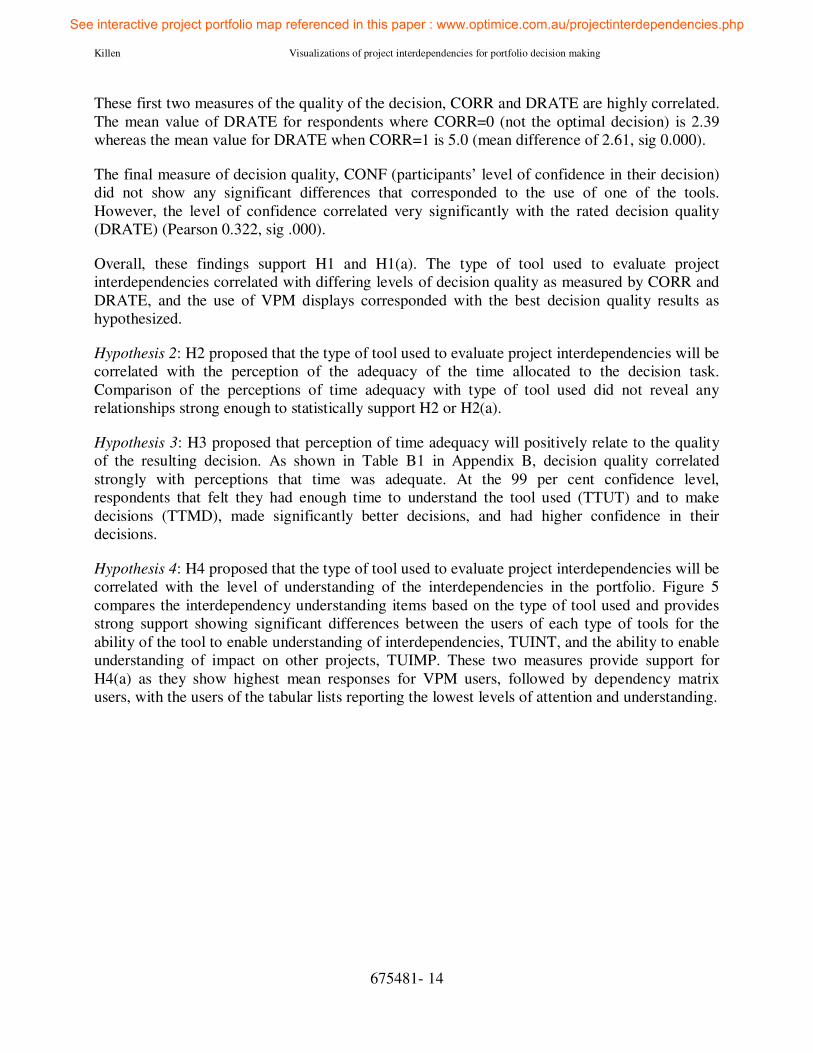
An alternative view of the relationship between tool type and decision quality was developed
using a rated degree of decision quality that acknowledges the continuum between ‘best’ and
‘worst’ decisions. Overall, the mean value for DRATE (rated degree of decision quality) was
2.80 with a standard deviation of 1.475. Figure 4 illustrates the mean values for DRATE for
groups using each tool. Differences between each tool are significant and the use of the VPM tool
resulted in the highest values for DRATE, with a mean improvement in the decision rating of
0.759 compared with users that do not use VPM (sig 0.000).
Figure 4: mean rating for decision quality per tool type (* indicates 0.10 or better significance of
the difference between use and non-use of a tool).
0% 20% 40% 60% 80% 100%
VPM Visual project map (N=91)
Dependency Matrix (N=87)
Tabular dependency list (N=86)
Optimal decision Suboptimal decision
3.30 *
2.55 *
2.52 *
1.00 1.50 2.00 2.50 3.00 3.50 4.00 4.50 5.00
Visual project map
Dependency matrix
Tabular representation
Rated degree of decision quality
10.5 % *
11.5 % *
28.6 % *
See interactive project portfolio map referenced in this paper : www.optimice.com.au/projectinterdependencies.php
Killen Visualizations of project interdependencies for portfolio decision making
675481- 14
These first two measures of the quality of the decision, CORR and DRATE are highly correlated.
The mean value of DRATE for respondents where CORR=0 (not the optimal decision) is 2.39
whereas the mean value for DRATE when CORR=1 is 5.0 (mean difference of 2.61, sig 0.000).
The final measure of decision quality, CONF (participants’ level of confidence in their decision)
did not show any significant differences that corresponded to the use of one of the tools.
However, the level of confidence correlated very significantly with the rated decision quality
(DRATE) (Pearson 0.322, sig .000).
Overall, these findings support H1 and H1(a). The type of tool used to evaluate project
interdependencies correlated with differing levels of decision quality as measured by CORR and
DRATE, and the use of VPM displays corresponded with the best decision quality results as
hypothesized.
Hypothesis 2: H2 proposed that the type of tool used to evaluate project interdependencies will be
correlated with the perception of the adequacy of the time allocated to the decision task.
Comparison of the perceptions of time adequacy with type of tool used did not reveal any
relationships strong enough to statistically support H2 or H2(a).
Hypothesis 3: H3 proposed that perception of time adequacy will positively relate to the quality
of the resulting decision. As shown in Table B1 in Appendix B, decision quality correlated
strongly with perceptions that time was adequate. At the 99 per cent confidence level,
respondents that felt they had enough time to understand the tool used (TTUT) and to make
decisions (TTMD), made significantly better decisions, and had higher confidence in their
decisions.
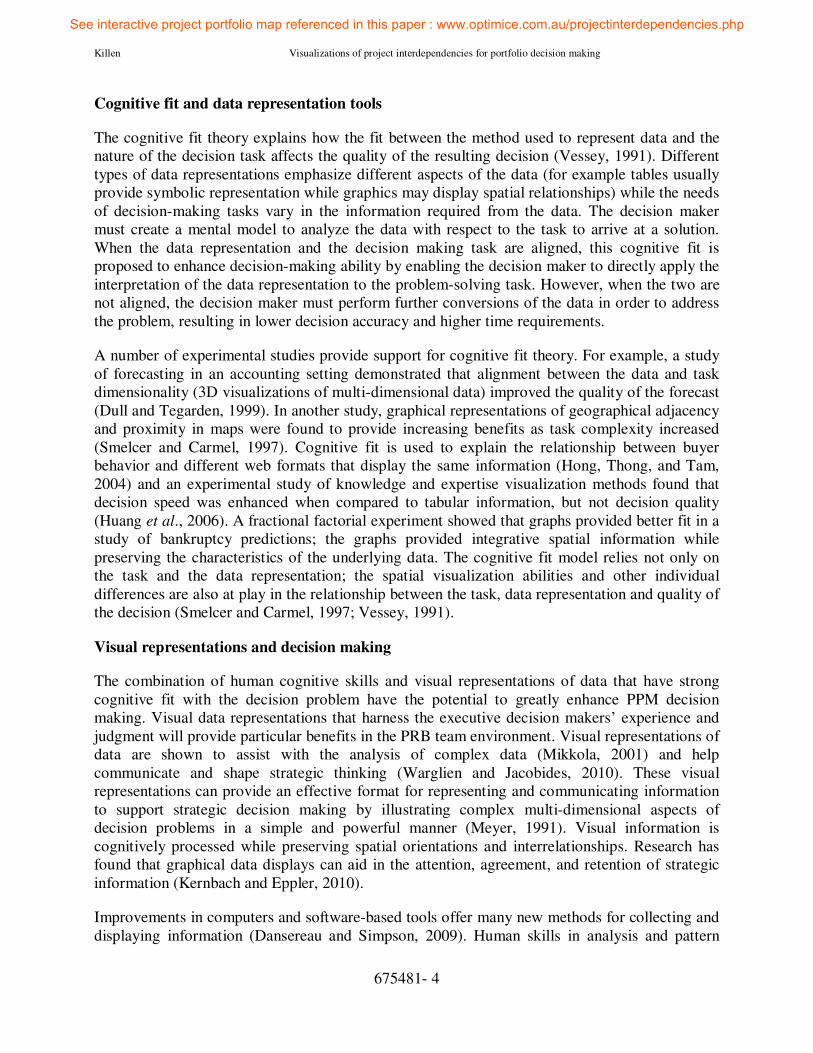
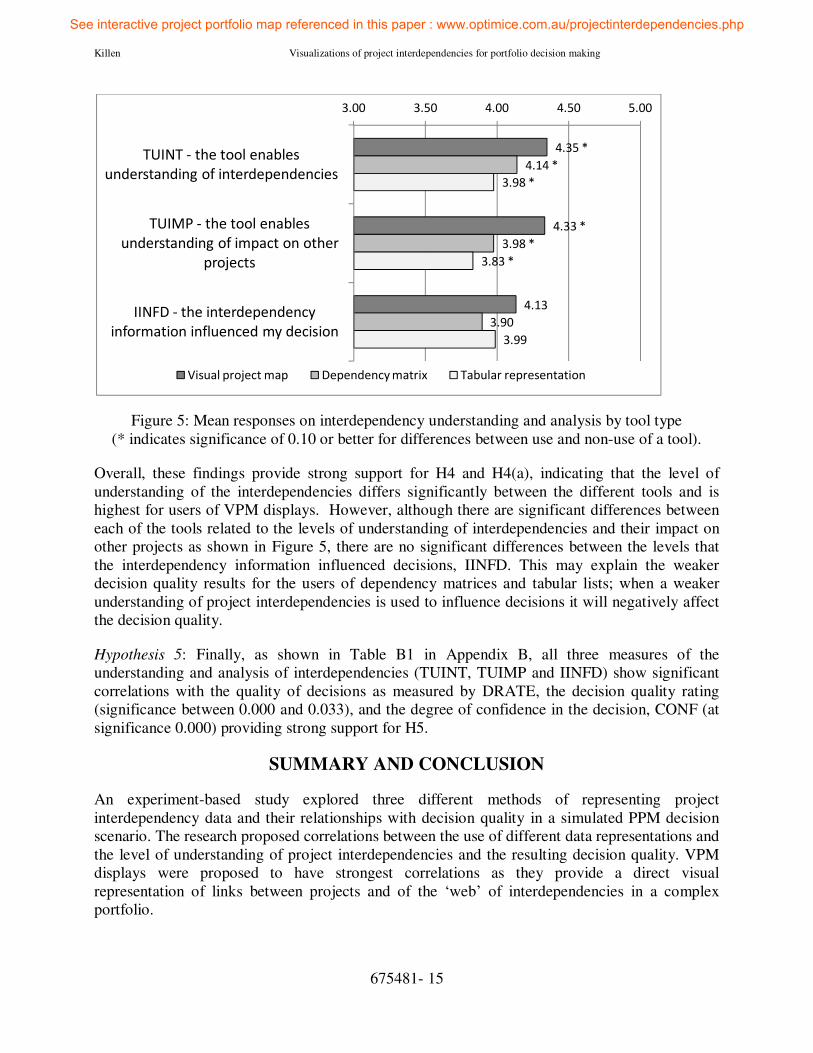
Hypothesis 4: H4 proposed that the type of tool used to evaluate project interdependencies will be
correlated with the level of understanding of the interdependencies in the portfolio. Figure 5
compares the interdependency understanding items based on the type of tool used and provides
strong support showing significant differences between the users of each type of tools for the
ability of the tool to enable understanding of interdependencies, TUINT, and the ability to enable
understanding of impact on other projects, TUIMP. These two measures provide support for
H4(a) as they show highest mean responses for VPM users, followed by dependency matrix
users, with the users of the tabular lists reporting the lowest levels of attention and understanding.
See interactive project portfolio map referenced in this paper : www.optimice.com.au/projectinterdependencies.php
Killen Visualizations of project interdependencies for portfolio decision making
675481- 15
Figure 5: Mean responses on interdependency understanding and analysis by tool type
(* indicates significance of 0.10 or better for differences between use and non-use of a tool).
Overall, these findings provide strong support for H4 and H4(a), indicating that the level of
understanding of the interdependencies differs significantly between the different tools and is
highest for users of VPM displays. However, although there are significant differences between
each of the tools related to the levels of understanding of interdependencies and their impact on
other projects as shown in Figure 5, there are no significant differences between the levels that
the interdependency information influenced decisions, IINFD. This may explain the weaker
decision quality results for the users of dependency matrices and tabular lists; when a weaker
understanding of project interdependencies is used to influence decisions it will negatively affect
the decision quality.
Hypothesis 5: Finally, as shown in Table B1 in Appendix B, all three measures of the
understanding and analysis of interdependencies (TUINT, TUIMP and IINFD) show significant
correlations with the quality of decisions as measured by DRATE, the decision quality rating
(significance between 0.000 and 0.033), and the degree of confidence in the decision, CONF (at
significance 0.000) providing strong support for H5.
SUMMARY AND CONCLUSION
An experiment-based study explored three different methods of representing project
interdependency data and their relationships with decision quality in a simulated PPM decision
scenario. The research proposed correlations between the use of different data representations and
the level of understanding of project interdependencies and the resulting decision quality. VPM
displays were proposed to have strongest correlations as they provide a direct visual
representation of links between projects and of the ‘web’ of interdependencies in a complex
portfolio.
4.35 *
4.33 *
4.13
4.14 *
3.98 *
3.90
3.98 *
3.83 *
3.99
3.00 3.50 4.00 4.50 5.00
TUINT - the tool enables
understanding of interdependencies
TUIMP - the tool enables
understanding of impact on other
projects
IINFD - the interdependency
information influenced my decision
Visual project map Dependency matrix Tabular representation
See interactive project portfolio map referenced in this paper : www.optimice.com.au/projectinterdependencies.php
Killen Visualizations of project interdependencies for portfolio decision making
675481- 16
The findings, based on a sample of 264 experiments, support and extend research that
demonstrates the benefits of graphical data displays when compared with numerical and text-
based information. The type of tool used to represent project interdependencies is correlated with
differing levels of PPM decision quality (in support of H1). The use of VPM, the newly proposed
network mapping approach, is correlated with the highest levels of decision quality indicating
that the cognitive fit between the representation and the task may be strongest and that VPM has
the potential to improve the quality of PPM decision making for complex project portfolios.
The importance of reducing time pressure in decision making is highlighted by the strong
correlation between adequacy of time and improved decision quality (in support of H3), however
no statistical difference was found in the perception of time adequacy between users of different
tools (H2 was not supported).
The findings confirmed significant differences between tool type and the level of
interdependency understanding and showed that users of VPM reported the highest levels of
understanding (in support of H4). These findings provide further evidence that the VPM displays
may have the strongest cognitive fit with the task of understanding interdependencies. Finally,
the research reveals a very strong relationship between the level of understanding of the
interdependencies and the decision quality (in support of H5). These findings show that the use
of VPM is most strongly correlated with high levels of understanding of project
interdependencies and of the flow-on effects of project decisions across the portfolio, and suggest
that this understanding may contribute to higher decision quality.
Limitations and implications for future research: The experimental design outlined in this study
illustrates how an experiment-based study can be useful in PM and PPM research, especially as a
complement to organization-based research. There are limitations inherent in controlled
experimentation that should be kept in mind, for example the results may be biased due to the
design of the experiment or the fact that the use of students may not represent managerial
decision making. In addition, the simplification of the scenario may skew the results and it is not
known whether the inclusion of additional factors such as risk or project sponsorship levels
would affect the findings. In addition, the management of interdependencies is more complex
than illustrated in the scenario, and the method should be tested with multiple types or strengths
of dependencies. Finally this research measured the decisions made by individuals and this may
not accurately reflect group decision making which is central to PPM. Future experiments could
test a different combination of factors and/or incorporate group decisions, and should aim to
triangulate findings with organization-based research for improved validity and reliability.
Two aspects of the findings raise specific questions and suggest a need for further testing. First
although the study showed a clear relationship between time and decision quality, none of the
tools provided significant benefits through increased perceptions of time adequacy. Therefore
more research is required to determine whether and how data representation methods can
alleviate the time pressure and how they can be designed to efficiently enlist human cognitive
capabilities in processing visual information. In addition, the findings suggest that the degree to
which the interdependency information was used to influence the decision was not significantly
affected by the differences between the levels of understanding reported. This misalignment
could explain some of the lower quality decision outcomes, and could be investigated further to
See interactive project portfolio map referenced in this paper : www.optimice.com.au/projectinterdependencies.php
Killen Visualizations of project interdependencies for portfolio decision making
675481- 17
better understand the link between the level of understanding and the degree of application of that
understanding to the problem.
Previous research on VPM conducted in organizational settings shows that organizational culture
is an important factor in promoting information sharing and communication to support decision-
making processes and tools (Killen and Kjaer, 2012). This experiment-based study did not
explore such factors and although it was created to reflect decision challenges in organizations,
such an experiment is not sufficient to draw conclusions about professional practice. However, as
a complement to organization-based research, the experimental study has provided increased
confidence in the findings through triangulation of the results. While the organizational study
provided real-life experience and feedback on the use of VPM, due to the complexity of
organizational environments it was not able to isolate the influence of VPM or to directly
compare it with other methods. The research reported in this paper compensates for these
limitations by using a controlled experimental setting where only one variable is adjusted (the
type of data representation) and by analyzing and comparing the resulting decisions. The findings
from the experimentation reinforce the findings from the organizational research; both show
benefits from the use of VPM in improving understanding of project interdependencies.
Experiment-based studies are not common in PM and PPM research, but show the potential to
complement and augment organization-based studies. Researchers should consider extending and
refining experiment-based approaches to enhance PM and PPM studies in the future.
Implications for management: The findings of this study highlight the importance of fit between
the methods or tools employed and the problem at hand, mirroring findings from PPM research
that demonstrate the need to tailor methods and tools to each situation. The use of visual data
representations is supported, with the caveat that management should carefully consider the types
of information required to support decisions and ensure that there is a good cognitive fit with the
aspects of the data emphasized by visual data representations. With respect to the management of
project interdependencies, the findings suggest that management should investigate whether
visual displays, VPM in particular, can provide benefits in their organizations. The research
supports the design and/or selection of software tools that create visual data displays to aid PPM
decision making, especially highlighting the need for tools to manage interdependencies. In
addition, the strong relationship between perceptions of time adequacy and improved decision
quality supports efforts to reduce time pressure in decision environments. Managers should bear
in mind that these results are based on a simulated decision task in a classroom setting that does
not represent the full complexity of an organizational decision.
In conclusion, a controlled decision experiment has highlighted the influence of different data
representations on PPM decisions. The study complements earlier organization-based research
and provides a practical example of experimentation in project and portfolio management
research. Network mapping data visualizations are found to be associated with higher levels of
understanding of project interdependencies and better decision quality than the tabular or matrix-
based data representation methods indicating that network mapping displays may have better
cognitive fit with the task. These findings highlight the value of visual data representations,
illustrate the value of designing data representations that are fit for the decision task, and suggest
that network mapping data representations may have the potential to improve the quality of
decisions in the management of complex project portfolios.
See interactive project portfolio map referenced in this paper : www.optimice.com.au/projectinterdependencies.php
Killen Visualizations of project interdependencies for portfolio decision making
675481- 18
APPENDIX A
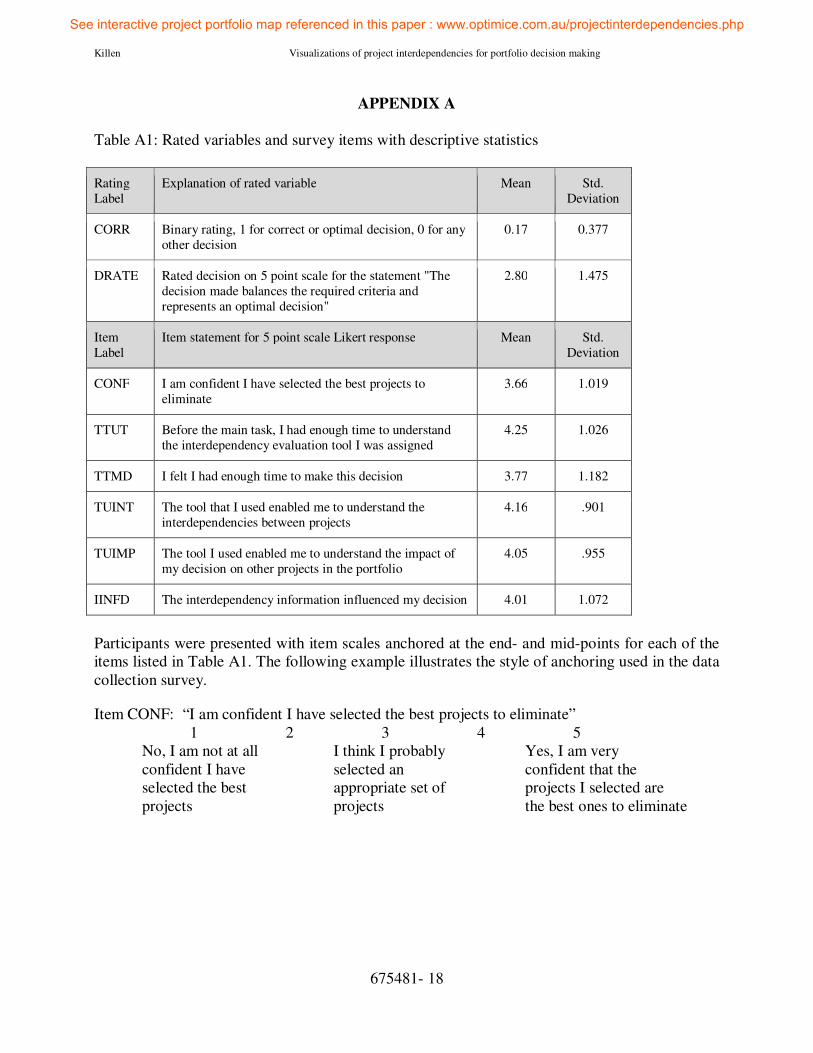
Table A1: Rated variables and survey items with descriptive statistics
Rating
Label
Explanation of rated variable Mean Std.
Deviation
CORR Binary rating, 1 for correct or optimal decision, 0 for any
other decision
0.17 0.377
DRATE Rated decision on 5 point scale for the statement "The
decision made balances the required criteria and
represents an optimal decision"
2.80 1.475
Item
Label
Item statement for 5 point scale Likert response Mean Std.
Deviation
CONF I am confident I have selected the best projects to
eliminate
3.66 1.019
TTUT Before the main task, I had enough time to understand
the interdependency evaluation tool I was assigned
4.25 1.026
TTMD I felt I had enough time to make this decision 3.77 1.182
TUINT The tool that I used enabled me to understand the
interdependencies between projects
4.16 .901
TUIMP The tool I used enabled me to understand the impact of
my decision on other projects in the portfolio
4.05 .955
IINFD The interdependency information influenced my decision 4.01 1.072
Participants were presented with item scales anchored at the end- and mid-points for each of the
items listed in Table A1. The following example illustrates the style of anchoring used in the data
collection survey.
Item CONF: “I am confident I have selected the best projects to eliminate”
1 2 3 4 5
No, I am not at all I think I probably Yes, I am very
confident I have selected an confident that the
selected the best appropriate set of projects I selected are
projects projects the best ones to eliminate
See interactive project portfolio map referenced in this paper : www.optimice.com.au/projectinterdependencies.php
Killen Visualizations of project interdependencies for portfolio decision making
675481- 19
APPENDIX B
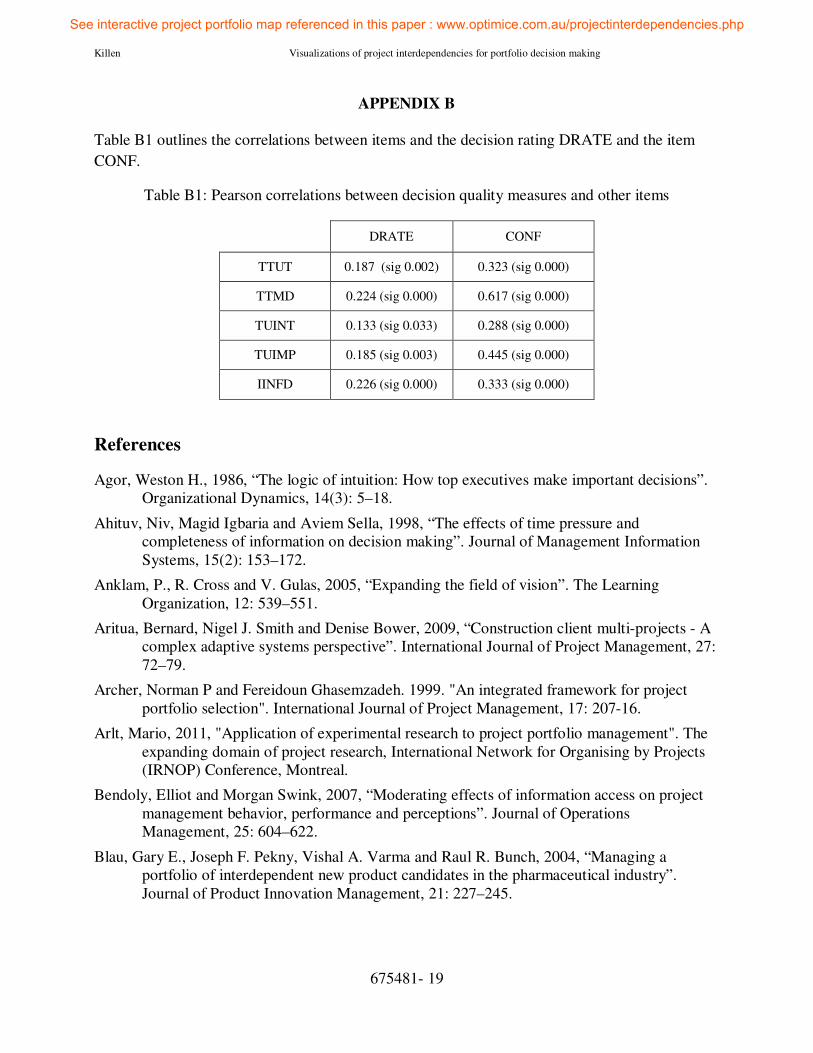
Table B1 outlines the correlations between items and the decision rating DRATE and the item
CONF.
Table B1: Pearson correlations between decision quality measures and other items
DRATE CONF
TTUT 0.187 (sig 0.002) 0.323 (sig 0.000)
TTMD 0.224 (sig 0.000) 0.617 (sig 0.000)
TUINT 0.133 (sig 0.033) 0.288 (sig 0.000)
TUIMP 0.185 (sig 0.003) 0.445 (sig 0.000)
IINFD 0.226 (sig 0.000) 0.333 (sig 0.000)
References
Agor, Weston H., 1986, “The logic of intuition: How top executives make important decisions”.
Organizational Dynamics, 14(3): 5–18.
Ahituv, Niv, Magid Igbaria and Aviem Sella, 1998, “The effects of time pressure and
completeness of information on decision making”. Journal of Management Information
Systems, 15(2): 153–172.
Anklam, P., R. Cross and V. Gulas, 2005, “Expanding the field of vision”. The Learning
Organization, 12: 539–551.
Aritua, Bernard, Nigel J. Smith and Denise Bower, 2009, “Construction client multi-projects - A
complex adaptive systems perspective”. International Journal of Project Management, 27:
72–79.
Archer, Norman P and Fereidoun Ghasemzadeh. 1999. "An integrated framework for project
portfolio selection". International Journal of Project Management, 17: 207-16.
Arlt, Mario, 2011, "Application of experimental research to project portfolio management". The
expanding domain of project research, International Network for Organising by Projects
(IRNOP) Conference, Montreal.
Bendoly, Elliot and Morgan Swink, 2007, “Moderating effects of information access on project
management behavior, performance and perceptions”. Journal of Operations
Management, 25: 604–622.
Blau, Gary E., Joseph F. Pekny, Vishal A. Varma and Raul R. Bunch, 2004, “Managing a
portfolio of interdependent new product candidates in the pharmaceutical industry”.
Journal of Product Innovation Management, 21: 227–245.
See interactive project portfolio map referenced in this paper : www.optimice.com.au/projectinterdependencies.php
Killen Visualizations of project interdependencies for portfolio decision making
675481- 20
Blichfeldt, Bodil Stilling and Pernille Eskerod. 2008. "Project portfolio management - There's
more to it than what management enacts". International Journal of Project Management,
26: 357-65.
Borgatti, S., 2002, NetDraw: Graph Visualization Software. Harvard, MA: Analytic
Technologies.
Bresciani, Sabrina and Martin J Eppler, 2010, “Choosing knowledge visualizations to augment
cognition: the manager’s view”. Paper presented to the Information Visualisation (IV)
2010 14th International Conference on Information Visualisation, London, 2010.
Christiansen, J K and C Varnes, 2008, “From models to practice: Decision making at portfolio
meetings”. International Journal of Quality and Reliability Management, 25 (1), 87-101.
Cicmil, Svetlana, Terry Williams, Janice Thomas and Damian Hodgson, 2006, “Rethinking
Project Management: Researching the actuality of projects”. International Journal of
Project Management, 24: 675–686.
Collis, Jill and Roger Hussey, 2003, Business Research: A Practical Guide for Undergraduate and
Postgraduate Students New York: Palgrave Macmillan.
Collyer, Simon and C. M. J. Warren, 2009, “Project management approaches for dynamic
environments”. International Journal of Project Management, 27: 355–364.
Cooper, R. G., Scott J. Edgett and E. J. Kleinschmidt, 2001, “Portfolio management for new
product development: Results of an industry best practices study”. R and D Management,
31: 361–381.
Cross, Rob, Stephen P. Borgatti and Andrew Parker, 2002, “Making invisible work visible: Using
social network analysis to support strategic collaboration”. California Management
Review, 44(2): 25–46.
Dane, Erik and Michael G. Pratt, 2007, “Exploring intuition and its role in managerial decision
making”. Academy of Management Review, 32: 33–54.
Danilovic, Mike and Tyson R. Browning, 2007, “Managing complex product development
projects with design structure matrices and domain mapping matrices”. International
Journal of Project Management, 25: 300–314.
Dansereau, Donald F. and D. Dwayne Simpson, 2009, “A picture is worth a thousand words: The
case for graphic representations”. Professional Psychology: Research and Practice, 40:
104–110.
Dawidson, Ola. 2006. Project portfolio management – an organising perspective. PhD Thesis,
Gothenburg, Sweden:: Chalmers University of Technology; 2006.
De Maio, A, R Verganti, and M Corso, 1994, “A multi-project management framework for new
product development”. European Journal of Operational Research, 78 (2), 178-191.
De Reyck, Bert, Yael Grushka-Cockayne, Martin Lockett, Sergio Ricardo Calderini, Marcio
Moura and Andrew Sloper, 2005, “The impact of project portfolio management on
information technology projects”. International Journal of Project Management, 23: 524–
537.
See interactive project portfolio map referenced in this paper : www.optimice.com.au/projectinterdependencies.php
Killen Visualizations of project interdependencies for portfolio decision making
675481- 21
Dickinson, Michael W., Anna C. Thornton and Stephen Graves, 2001, “Technology Portfolio
Management: Optimizing interdependent projects over multiple time periods”. IEEE
Transactions on Engineering Management, 48: 518–527.
Dull, Richard B. and David P. Tegarden, 1999. “A Comparison of Three Visual Representations
of Complex Multidimensional Accounting Information. Journal of Information Systems”,
13 (2): 117-131.
Durant-Law, Graham Alan, 2012, Network project management: Visualising collective
knowledge to better understand and model a project-portfolio. Doctor of Philosophy
Thesis, Faculty of Business and Government, The University of Canberra, Canberra.
Elonen, Suvi and Karlos A. Artto, 2003, “Problems in managing internal development projects in
multi-project environments”. International Journal of Project Management, 21: 395–402.
Eskerod, P, B S Blichfeldt, and A S Toft, 2004, “Questioning the rational assumption underlying
decision-making within project portfolio management literature”. PMI Research
Conference, London, 11-14 July.
Floricel, Serghei and Mihai Ibanescu. 2008. "Using R&D portfolio management to deal with
dynamic risk". R and D Management, 38: 452-67.
Foreman, E. and M. A. Selly, 2002, Decision by Objectives. Singapore: World Scientific
Publishing Company.
Garson, G. David, 2012, Testing Statistical Assumptions. Asheboro, NC, USA: Statistical
Associates Publishing.
Grossklags, Jen, 2007, “Experimental economics and experimental computer science: A survey”.
Paper presented at the Workshop on Experimental Computer Science (ExpCS’07), ACM
Federated Computer Research Conference (FCRC). San Diego, CA.
Hanneman, Robert A. and Mark Riddle, 2005, Introduction to social network methods. Riverside,
CA University of California, Riverside (published in digital form at
http://faculty.ucr.edu/~hanneman/).
Hansen, Derek, Ben Shneiderman and Marc A. Smith, 2011, Analyzing Social Media Networks
with NodeXL: Insights from a Connected World. Amsterdam: Morgan Kaufman,
Elsevier.
Hong, W., J.Thong, and K. Tam, 2004, “The effects of information format and shopping task on
consumers' online shopping behavior: A cognitive fit perspective”. Journal of
Management Information Systems, 21(3): 149 - 184.
Huang, Z., H. Chen, F. Guo, J. J. Xu, S. Wu and W-H. Chen, 2006, “Expertise visualization: An
implementation and study based on cognitive fit theory”. Decision Support Systems,
42(2006): 1539-1557.
Janis, Irving L. and Leon Mann, 1977, Decision making: A psychological analysis of conflict,
choice, and commitment. New York: Free Press.
Jonas, Daniel. 2010. "Empowering project portfolio managers: How management involvement
impacts project portfolio management performance". International Journal of Project
Management, 28: 818-31.
See interactive project portfolio map referenced in this paper : www.optimice.com.au/projectinterdependencies.php
Killen Visualizations of project interdependencies for portfolio decision making
675481- 22
Kernbach, S. and Martin J. Eppler, 2010, “The use of visualization in the context of business
strategies: An experimental evaluation”. Paper presented to the Information Visualisation
(IV) 2010 14th International Conference on Information Visualisation, London, 2010.
Kester, Linda, Abbie Griffin, Erik Jan Hultink and Kristina Lauche. 2011. "Exploring Portfolio
Decision-Making Processes". Journal of Product Innovation Management, 28: 641-61.
Kester, Linda, Erik Jan Hultink and Kristina Lauche. 2009. "Portfolio decision-making genres: A
case study". Journal of Engineering and Technology Management, 26: 327-41.
Killen, Catherine P., Robert A. Hunt and E. J. Kleinschmidt, 2008, “Project portfolio
management for product innovation”. International Journal of Quality and Reliability
Management, 25(1): 24–38.
Killen, Catherine P. and Cai Kjaer, 2012, “Understanding project interdependencies: the role of
visual representation, culture and process”. International Journal of Project Management,
forthcoming. doi: 10.1016/j.ijproman.2012.01.018.
Killen, Catherine P., Brooke Krumbeck, Cai Kjaer and Graham Alan Durant-Law, 2009,
“Managing project interdependencies: exploring new approaches”. Paper presented to the
Asia Pacific Expert Seminar (APES2009): Managing Projects, Programs And Ventures In
Times Of Uncertainty And Disruptive Change, Sydney, Australia, 2009.
Kim, Jongbae and Wilemon David, 2007, “The learning organization as facilitator of complex
NPD projects”. Creativity & Innovation Management, 16(2): 176–191.
Levine, Harvey A., 2005, Project Portfolio Management: A Practical Guide to Selecting Projects,
Managing Portfolios, and Maximizing Benefits. San Francisco, CA, Chichester: Jossey-
Bass; John Wiley distributor.
Lovallo, D P and O Sibony, 2006, “Distortions and deceptions in strategic decisions”. McKinsey
Quarterly, (1), 18-29.
Matheson, J E and M M Menke, 1994, “Using decision quality principles to balance your R&D
portfolio”. Research Technology Management, 37 (3), 38-43.
Meyer, Alan D., 1991, “Visual data in organizational research”. Organization Science, 2: 218–
236.
Mikkola, Juliana Hsuan, 2001, “Portfolio management of R&D projects: Implications for
innovation management”. Technovation, 21: 423–435.
Perminova, O., M. Gustafsson and K. Wikström, 2008, “Defining uncertainty in projects: A new
perspective”. International Journal of Project Management, 26: 73–79.
Petit, Yvan. 2011. "Project Portfolios in Dynamic Environments: Organizing for Uncertainty".
The expanding domain of project research, International Network for Organising by
Projects (IRNOP) Conference, Montreal.
Phaal, R, C J P Farrukh, and D R Probert, 2006, “Technology management tools: Concept,
development and application”. Technovation, 26 (3), 336-344.
Platts, Ken and Kim Hua Tan, 2004, “Strategy visualisation: knowing, understanding, and
formulating”. Management Decision, 42: 667–676.
Scott, John, 2008, Social Network Analysis: A Handbook. Thousand Oaks, CA: Sage
Publications.
See interactive project portfolio map referenced in this paper : www.optimice.com.au/projectinterdependencies.php
Killen Visualizations of project interdependencies for portfolio decision making
675481- 23
Shim, J.P., Merrill Warkentin, James F. Courtney, Daniel J. Power, Ramesh Sharda and Christer
Carlsson, 2002, “Past, present, and future of decision support technology”. Decision
Support Systems, 33(2): 111–126.
Simon, Herbert Alexander, 1955, “A behavioral model of rational choice”. Quarterly Journal of
Economics, 69(1): 99–118.
Smelcer, J. B., and E. Carmel, 1997, “The Effectiveness of Different Representations for
Managerial Problem Solving: Comparing Tables and Maps. Decision Sciences”, 28(2):
391-420.
Svenson, Ola and A. John Maule (eds), 1993, Time Pressure and Stress in Human Judgment and
Decision Making. New York: Plenum Press.
Tergan, S.-O. and T. Keller (eds), 2005, Knowledge and Information Visualisation. Berlin:
Springer-Verlag.
Umanath, N.S. and Iris Vessey, 1995, “Multiattribute data presentation and human judgment: a
cognitive fit perspective”. Decision Sciences 25 (5,6): 795-824.
Verma, Devesh and Kingshuk K Sinha, 2002, “Toward a theory of project interdependencies in
high tech R&D environments”. Journal of Operations Management, 20: 451–468.
Vessey, Iris, 1991, “Cognitive fit: a theory-based analysis of the graphs versus tables literature.”
Decision Sciences, 22(2): 219-41.
Warglien, Massimo, 2010, “Seeing, thinking and deciding: some research questions on strategy
and vision”. Paper presented to the Academy of Management Meeting, August 6th,
Montreal.
Warglien, Massimo and Michael G. Jacobides, 2010, “The power of representations: From
visualization, maps and categories to dynamic tools”. Paper presented to the Academy of
Management Meeting, August 6th, Montreal.
Williams, Terry, 2005, “Assessing and building on project management theory in the light of
badly over-run projects”. IEEE Transactions on Engineering Management, 52: 497–508.
See interactive project portfolio map referenced in this paper : www.optimice.com.au/projectinterdependencies.php