Embed Size (px)
Citation preview
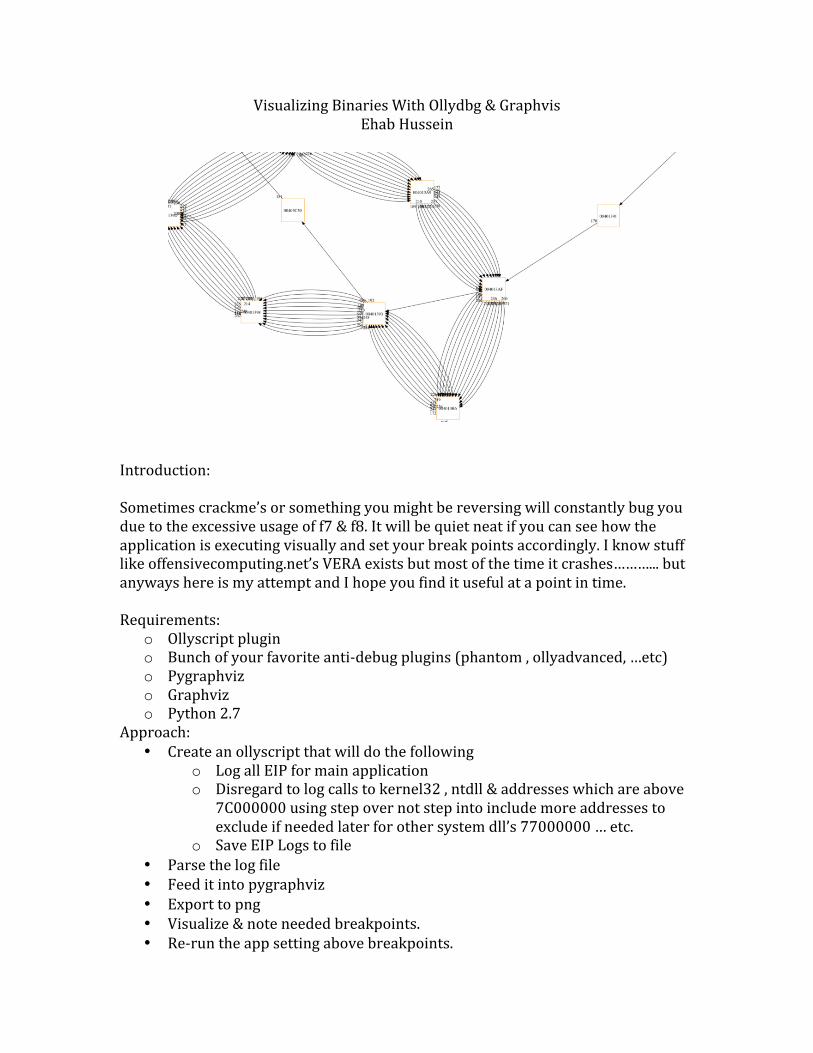
Visualizing Binaries With Ollydbg & Graphvis Ehab Hussein
Introduction: Sometimes crackme’s or something you might be reversing will constantly bug you due to the excessive usage of f7 & f8. It will be quiet neat if you can see how the application is executing visually and set your break points accordingly. I know stuff like offensivecomputing.net’s VERA exists but most of the time it crashes………... but anyways here is my attempt and I hope you find it useful at a point in time. Requirements:
o Ollyscript plugin o Bunch of your favorite anti-‐debug plugins (phantom , ollyadvanced, …etc) o Pygraphviz o Graphviz o Python 2.7
Approach: • Create an ollyscript that will do the following
o Log all EIP for main application o Disregard to log calls to kernel32 , ntdll & addresses which are above
7C000000 using step over not step into include more addresses to exclude if needed later for other system dll’s 77000000 … etc.
o Save EIP Logs to file • Parse the log file • Feed it into pygraphviz • Export to png • Visualize & note needed breakpoints. • Re-‐run the app setting above breakpoints.

An example follows below:
STEP 1: run the app and fiddle around with it.
Load the binary into Olly. In this case the message box is nagging about compression which is basically UPX. Scroll down the the last jmp which will be the entry point to the main binary.
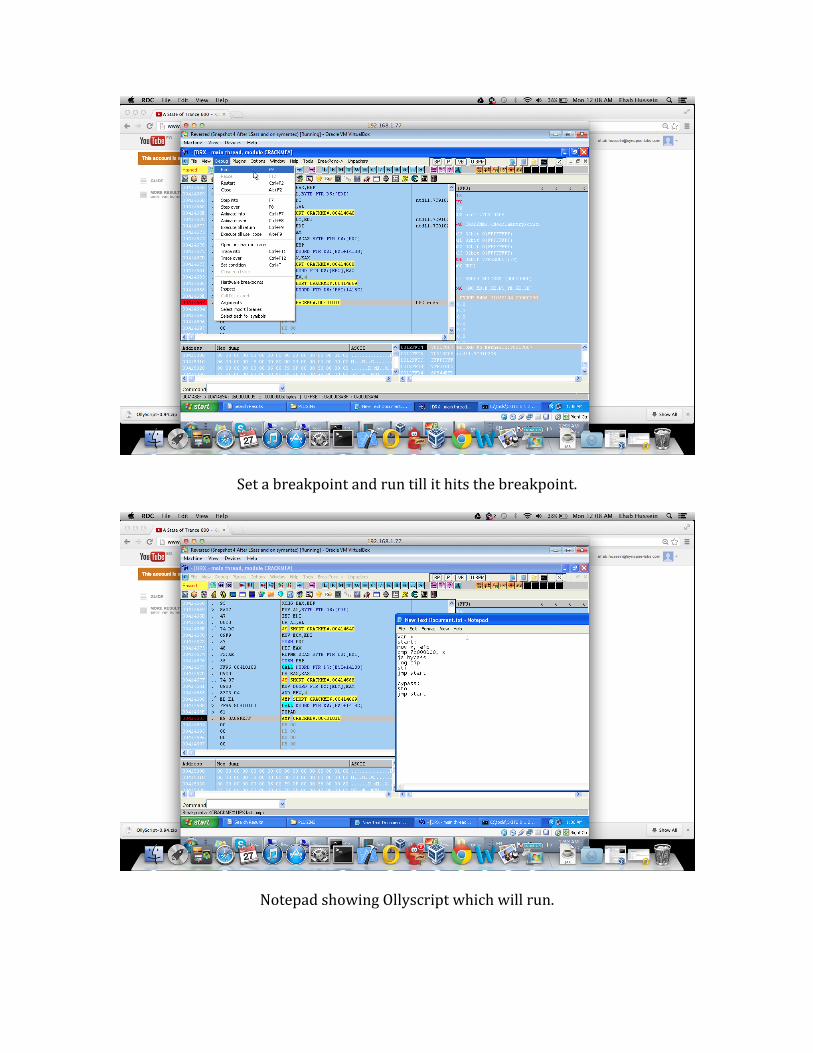
Set a breakpoint and run till it hits the breakpoint.
Notepad showing Ollyscript which will run.

Clear The Log Window Save the Log to a file name

saved log file to desktop
var x start: mov x, eip cmp 7c000000, x ja bypass Log eip sti jmp start bypass: sto jmp start
Ollyscript that will be used next

Run The olly script
Crackme’s EIP is getting always logged in the log window

CrackMe started to ask for input
On each input EIP is being logged so we can know if any input gets shoved into a
function Process terminated.

Close Log file
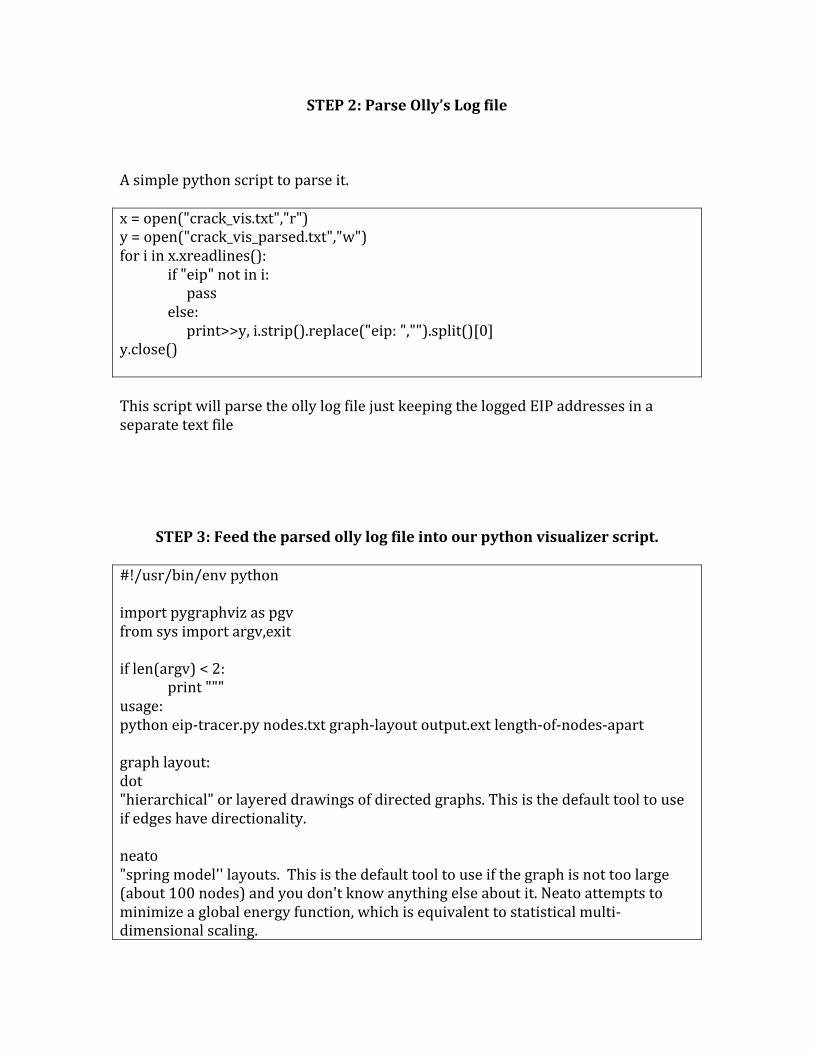
STEP 2: Parse Olly’s Log file
A simple python script to parse it. x = open("crack_vis.txt","r") y = open("crack_vis_parsed.txt","w") for i in x.xreadlines(): if "eip" not in i: pass else: print>>y, i.strip().replace("eip: ","").split()[0] y.close() This script will parse the olly log file just keeping the logged EIP addresses in a separate text file
STEP 3: Feed the parsed olly log file into our python visualizer script.
#!/usr/bin/env python import pygraphviz as pgv from sys import argv,exit if len(argv) < 2: print """ usage: python eip-‐tracer.py nodes.txt graph-‐layout output.ext length-‐of-‐nodes-‐apart graph layout: dot "hierarchical" or layered drawings of directed graphs. This is the default tool to use if edges have directionality. neato "spring model'' layouts. This is the default tool to use if the graph is not too large (about 100 nodes) and you don't know anything else about it. Neato attempts to minimize a global energy function, which is equivalent to statistical multi-‐dimensional scaling.

fdp "spring model'' layouts similar to those of neato, but does this by reducing forces rather than working with energy. sfdp multiscale version of fdp for the layout of large graphs. twopi radial layouts, after Graham Wills 97. Nodes are placed on concentric circles depending their distance from a given root node. circo circular layout, after Six and Tollis 99, Kauffman and Wiese 02. This is suitable for certain diagrams of multiple cyclic structures, such as certain telecommunications networks. Extensions canon cmap cmapx cmapx_np dot eps fig gd gd2 gif gv imap imap_np ismap jpe jpeg jpg pdf plain plain-‐ext png ps ps2 svg svgz tk vml vmlz vrml wbmp x11 xdot xlib length of nodes apart 0 to 10 (prefered 3) """ exit() arr = [] arr.append("START") G = pgv.AGraph(strict=False,directed=True) for i,j in enumerate(open(argv[1],'r').xreadlines()): arr.append(j.strip()) #G.add_edge() #G.add_edge("START",arr[0]) for i,j in enumerate(arr): try: G.add_edge(arr[i],arr[i+1],taillabel=i) except IndexError: G.add_edge(arr[i],"END") G.graph_attr['label']='Ollydbg Binary visualizer' G.node_attr['shape']='square' G.node_attr['color']='orange'
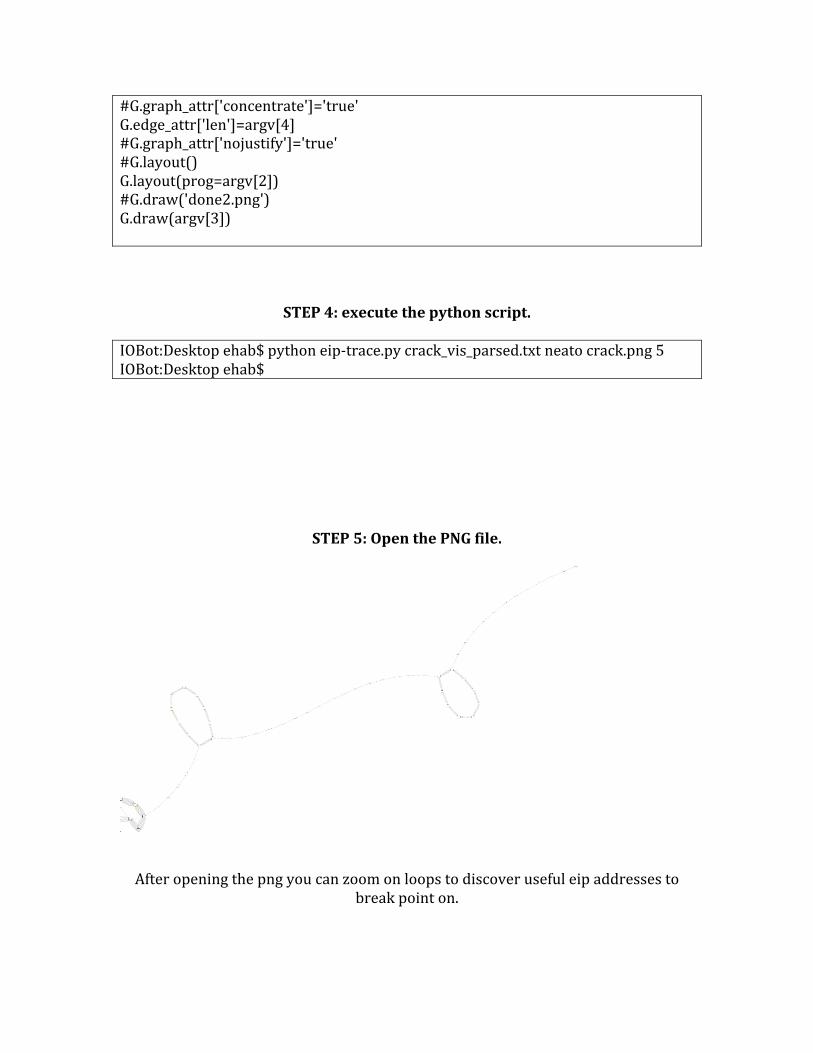
#G.graph_attr['concentrate']='true' G.edge_attr['len']=argv[4] #G.graph_attr['nojustify']='true' #G.layout() G.layout(prog=argv[2]) #G.draw('done2.png') G.draw(argv[3])
STEP 4: execute the python script.
IOBot:Desktop ehab$ python eip-‐trace.py crack_vis_parsed.txt neato crack.png 5 IOBot:Desktop ehab$
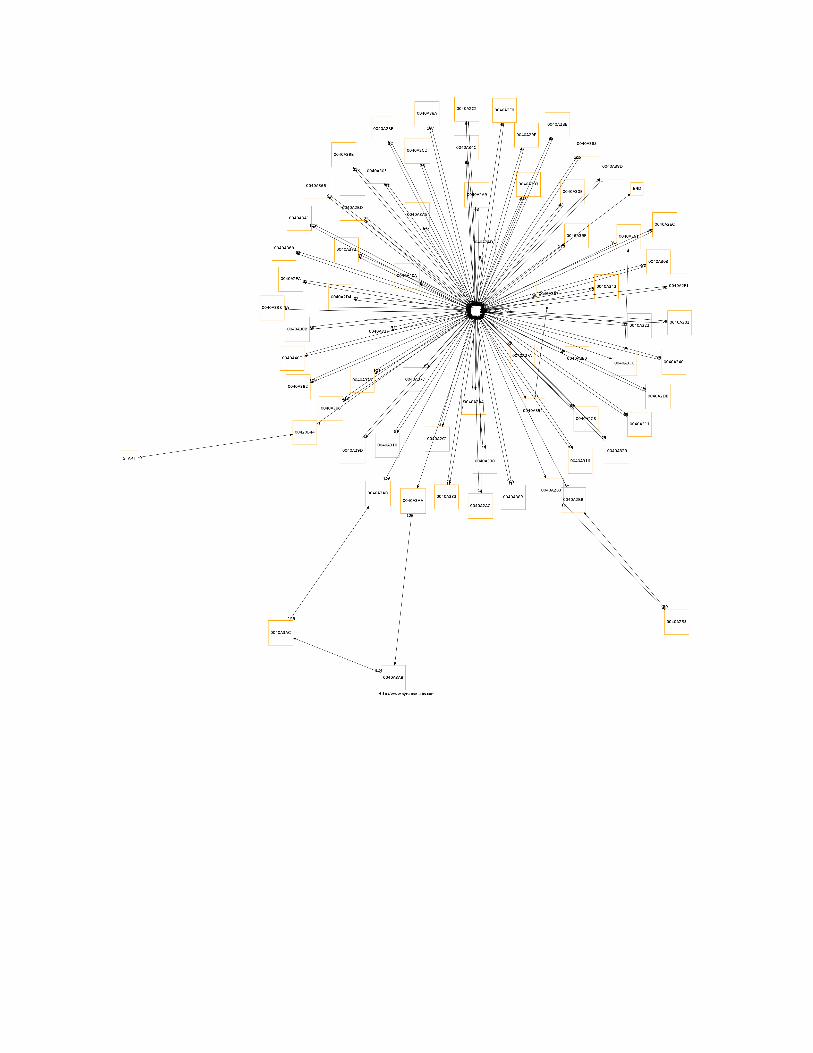
STEP 5: Open the PNG file.
After opening the png you can zoom on loops to discover useful eip addresses to break point on.
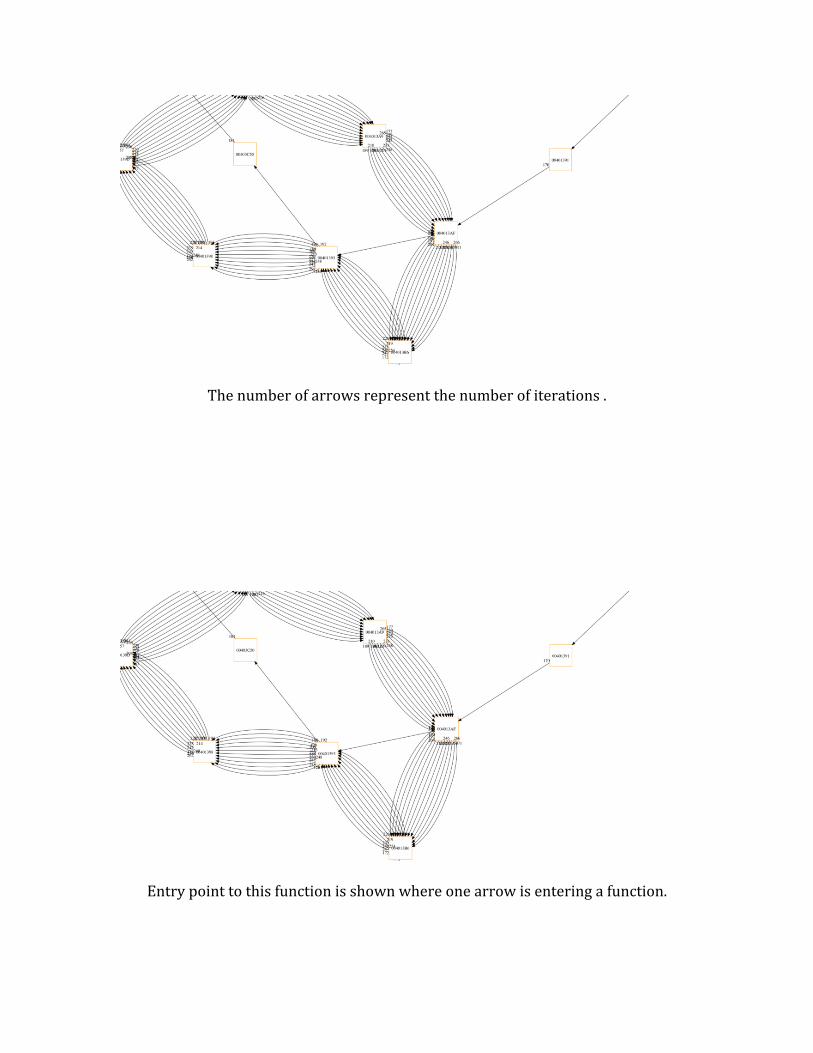
The number of arrows represent the number of iterations .
Entry point to this function is shown where one arrow is entering a function.
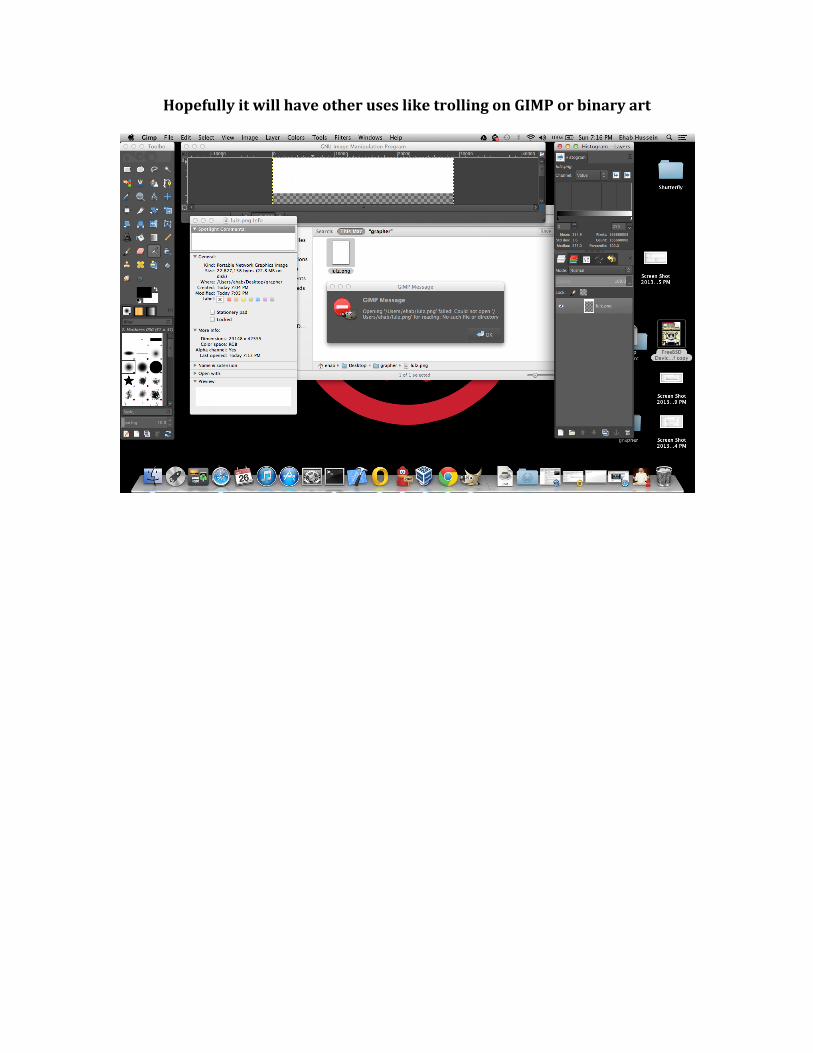
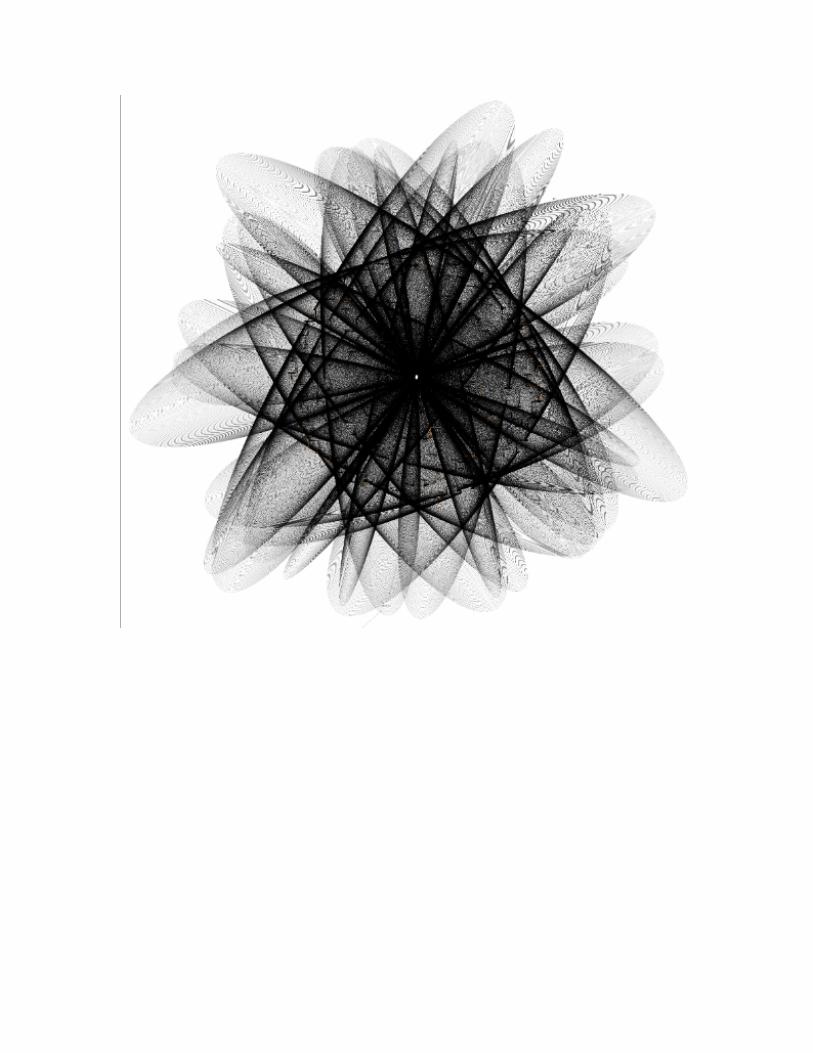
Hopefully it will have other uses like trolling on GIMP or binary art

Happy Cracking & reversing.


![Learn OllyIce Debugger - 2nd Edition Private Learningpersian]-comprehensive... · HKEY_CLASSES_ROOT\dllfile\shell\Open with OllyDbg HKEY_CLASSES_ROOT\dllfile\shell\Open with OllyDbg\command](https://img.pdfslide.net/doc/110x75/5d5c959f88c9937c298bb23d/learn-ollyice-debugger-2nd-edition-private-learning-persian-comprehensive.jpg)


![ﻥﺎﻬﺟ ﺮﮔﺎﺒﻳﺩ ﻦﻳﺮﺘﻳﻮﻗ ﺵﺯﻮﻣﺁ …persian]-ollydbg... · ﺶﻳﺎﻤﻧ ollydbg ﺭﺩ ﻪﻛ ﻱﺩﺍﺪﻋﺍ ﻪﻛ ﺪﻴﻨﻛ ﺖﻗﺩ](https://img.pdfslide.net/doc/110x75/5bc10b6709d3f2840b8be677/-persian-ollydbg.jpg)