Embed Size (px)
Citation preview
Research Article
Visualizing the effect of hypoxia on !uorescence kinetics in livingHeLa cells using the !uorescent ubiquitination-based cell cycleindicator (Fucci)
Atsushi Kaida, Masahiko Miura!
Oral Radiation Oncology, Department of Oral Restitution, Graduate School of Medical and Dental Sciences, Tokyo Medical and Dental University,1-5-45 Yushima, Bunkyo-ku, Tokyo 113-8549, Japan
A R T I C L E I N F O R M A T I O N A B S T R A C T
Article Chronology:Received 13 August 2011Revised version received9 October 2011Accepted 26 October 2011Available online 3 November 2011
Fluorescent proteins are widely used for the direct visualization of events such as gene expressionand subcellular localization in mammalian cells. It is well established that oxygen is required forformation of functional chromophore; however, the effect of hypoxia on fluorescence emissionhas rarely been studied. For this purpose, under hypoxic conditions, we investigated thekinetics of red and green fluorescence in HeLa cells from two fluorescent proteins, monomericKusabira Orange 2 (mKO2) and monomeric Azami Green (mAG), respectively, using thefluorescent ubiquitination-based cell cycle indicator (Fucci). In this system, cells in G1 or otherphases emit red or green fluorescence, respectively. We found that hypoxia abrogated both redand green fluorescence about ~10 h after the treatment, although their protein levels were almostmaintained. The treatment did not significantly affect fluorescence in cells constitutively expres-sing the same fluorescent proteins lacking the ubiquitin ligase-binding domains. The abrogation offluorescence resulted from a combination of ubiquitination-dependent degradation of pre-existing functional proteins during specific cell cycle phases, and the expression of newly synthe-sized non-fluorescent proteins containing non-oxidized chromophore during hypoxic treatment.Indeed, non-fluorescent cells after hypoxic treatment gradually developed fluorescence afterreoxygenation in the presence of cycloheximide; kinetics of recovery were much faster for mAGthan for mKO2. Using the Fucci system, we could clearly visualize for the first time the effect ofhypoxia on the fluorescence kinetics of proteins expressed in living mammalian cells.
© 2011 Elsevier Inc. All rights reserved.
Keywords:Fluorescent proteinMonomeric Azami Green (mAG)Monomeric Kusabira Orange 2 (mKO2)HypoxiaFluorescent ubiquitination-based cellcycle indicator (Fucci)
Introduction
The green fluorescent protein (GFP) was originally identified inthe bioluminescent jellyfish Aequorea victoria by Shimomuraet al. [1]; thereafter, many GFP-like proteins have been discoveredand developed [2–5]. GFP-like proteins now play pivotal roles inthe field of molecular biology and cellular biology, especially in
direct visualization of cellular events including gene expression,subcellular localization, and protein interactions [3,6,7]. The mo-lecular basis of GFP's function and chromophore formation hasalso been extensively studied; the most notable characteristic isthat the chromophore forms intrinsically [3,8,9]. The formationof functional chromophore in GFP-like proteins involves threemajor steps: protein folding, cyclization of the tripeptide
E X P E R I M E N T A L C E L L R E S E A R C H 3 1 8 ( 2 0 1 2 ) 2 8 8 – 2 9 7
! Corresponding author. Fax: +81 3 5803 5897.E-mail address: [email protected] (M. Miura).
0014-4827/$ – see front matter © 2011 Elsevier Inc. All rights reserved.doi:10.1016/j.yexcr.2011.10.016
Ava i l ab l e on l i ne a t www.sc i enced i r ec t . com
www.e l sev i e r . com/ loca te /yexc r
chromophore motif, and oxidation of the cyclized chromophore;these steps appear to be commonly required for the maturationof a range of chromophores [2,3]. Molecular oxygen appears tobe essential for the oxidation reaction at the 3rd step, and the re-action is likely to be rate-limiting [2,8,10]. The kinetics of the oxi-dation process have been studied, using Escherichia coli or yeastcells expressing GFP and cultured under anaerobic conditions[2,9,11,12]. However, such properties have never been studied inliving mammalian cells.
The fluorescent ubiquitination-based cell cycle indicator(Fucci) was developed to visualize the dynamics of cell cycle pro-gression [13]. HeLa-Fucci cells express two fusion proteins: mono-meric Kusabira Orange 2 (mKO2) fused to amino acids 30–120 ofCdt1, which includes the Cy motif, a binding site for the E3 ligase,SCFSkp2; and monomeric Azami Green (mAG) fused to amino acids1–110 of Geminin, which includes the nuclear localizing signal(NLS) and the destruction box, a binding site for the E3 ligase,APC/CCdh1. This combination of fusion proteins causes cells toemit red fluorescence at G1 phase and green fluorescence in S/G2/M phases. Cells emit no fluorescence at early G1 phase imme-diately after mitosis, and emit both red and green fluorescence atG1/S transition.We believe that this systemwill contribute greatlyto the elucidation of complicated cell cycle kinetics in solid tu-mors, including hypoxic subpopulations, that arise followinganti-cancer treatment in pre-clinical studies of cancer therapeu-tics. Considering that oxygen is required for the formation of afunctional chromophore [2,10–12], it is conceivable that fluores-cence kinetics may be influenced under low oxygen tension in liv-ing mammalian cells. Elucidation of such properties is importantfor accurate determination of true cell cycle kinetics based on in-terpretation of the fluorescence behavior of Fucci in vivo. In thisstudy, using the Fucci model, we explored for the first time the ef-fect of low oxygen tension on fluorescence kinetics of mAG andmKO2 expressed in HeLa-Fucci cells.
Material and methods
Cell lines and culture conditions
HeLa cells expressing the Fucci probes (HeLa-Fucci) were providedby the RIKEN BRC through the National Bio-Resource Project of theMEXT, Japan. HeLa cells were obtained from the Health Science Re-search Resources Bank (Sendai, Japan). Cells were maintained inDMEM (Sigma-Aldrich, St. Louis, MO) without antibiotics supple-mented with 10% fetal bovine serum, at 37 °C in a 5% CO2 humidi-fied atmosphere.
Plasmids and transfection
A humanized monomeric Azami-Green (phmAG1-MC1) expres-sion vector and a humanized monomeric Kusabira-Orange 2(phmKO2-MC1) expression vector were purchased from Medicaland Biological Laboratories (Nagoya, Japan). To establish HeLacells constitutively expressing mAG or mKO2, parent cells weretransfected with each plasmid using Lipofectamine LTX (Invitro-gen, Carlsbad, CA) agents. Transfected cells were selected with1.0 mg/ml Geneticin (Sigma-Aldrich, St. Louis, MO) and resultantclones were developed. Clones expressing strong fluorescencewere established and designated HeLa-mAG and HeLa-mKO2.
Drug treatment and irradiation
Cells were treated with 3 mM hydroxyurea (HU) (Sigma-Aldrich,St. Louis, MO) or 20 !g/ml cycloheximide (CHX) (Sigma-Aldrich,St. Louis, MO). Cells were also irradiated at a dose of 10 Gy withan RX-650 cabinet X-radiator system (130 kVp, 5 mA, 0.5 mm Alfiltration) (Faxitron, Lincolnshire, IL) at a dose rate of 0.781 Gy/min. After each treatment, fluorescence was observed or cellswere prepared for Western blotting at the indicated times.
Fluorescent imaging
Fluorescent images were taken using a BIOREVO BZ-9000 fluores-cence microscope (KEYENCE, Osaka, Japan). For the time-lapseimaging, cells were held in an incubation chamber at 37 °C orroom temperature in a humidified atmosphere containing 5%CO2 (Tokai Hit, Fujinomiya, Japan), except in the case of hypoxictreatment as described below. For quantitative analysis of fluores-cent cells, the percentages of green, red, orange (both green andred), and non-fluorescent cells were determined by counting atleast 100 cells in three independent fields.
Hypoxic treatment
When almost anoxic conditions are required in radiobiological stud-ies, e.g., in order to determine oxygen enhancement ratio [14], glasspetri dishes instead of plastic dishes have been used in conjunctionwith a gas mixture of 95% N2 and 5% CO2, in order to overcome theproblem of dissolved oxygen contained in plastic dishes [15,16].However, for other purposes, plastic dishes are commonly used[17–22]; indeed, glass petri dishes with thick bottoms are not suit-able for high quality cell imaging. Therefore, in this study we estab-lished hypoxic conditions by a combination of plastic culture dishesand an AnaeroPack-Anaero 5% system (Mitsubishi Gas Chemical,Tokyo, Japan) [18,20–22], using catalysts that contain sodium ascor-bate as the principal ingredient in conjunctionwith a carbon dioxideabsorber to scavenge the carbon dioxide in a tightly closed 2.5 L jar(Mitsubishi Gas Chemical) [21]. This is a much simpler methodthan using the mixed gas. The oxygen tension (pO2) in the atmo-sphere was monitored by putting an OXY-1 oxygen monitor(JIKCO, Tokyo, Japan) in the jar, alongwith the catalyst and the plas-tic dishes containing HeLa cells andmedium. The entire experimen-tal rig wasmaintained at 37 °C. The kinetics after hypoxic treatmentare presented in Supplementary Fig. 1. We confirmed that this sys-tem could reproducibly and rapidly decrease the pO2 in the atmo-sphere rapidly, reaching pO2<0.1% within an hour, in accordancewith the manufacturer's data (Mitsubishi Gas Chemical).
Cells were plated in tissue culture plastic dishes and sub-cultured for 24 h before hypoxic treatment. Dishes were put intoa plastic jar (2.5 L) with a bag including the catalyst and the jarwas closed tightly. The jar was maintained at 37 °C or room tem-perature for the indicated times. The CO2 tension is maintainedat 5% for at least 24 h in this condition [18,20]. For the time-lapse imaging of cells in hypoxia, the time-lapse observation pro-tocol using the fluorescence microscope was adapted to a small-volume jar (0.5 L; Mitsubishi Gas Chemical). The incubationchamber was not used in this experiment; the pre-incubated jarcontaining the dish at 37 °C was transferred to the stage of thefluorescence microscope, and cells were observed at the roomtemperature for a short period. In all hypoxic experiments, the
289E X P E R I M E N T A L C E L L R E S E A R C H 3 1 8 ( 2 0 1 2 ) 2 8 8 – 2 9 7
Anaero-Indicator (Mitsubishi Gas Chemical) was used to confirmthat the pO2 in the atmosphere remained at <0.1%.
Flow cytometric analysis
Immediately after treatments, collected culture medium and trypsi-nized cells were centrifuged, and cell pellets were washed in ice-cold phosphate-buffered saline (PBS). Cells were fixed in ice-cold70% ethanol in PBS for at least 30 min on ice. After fixation, cellswere re-washed in ice-cold PBS and incubated in 0.5 !g/ml 7-AADsolution (BD Bioscience, San Jose, CA). Finally, fixed single cell sus-pensions were passed through a nylon mesh. Each sample was ana-lyzedwith a FACScalibur flow cytometer (Becton Dickinson, FranklinLakes, NJ) using the FlowJo software (Tree Star, Ashland, OR).
Western blotting
Monomeric Azami-Green (mAG), monomeric Kusabira-Orange 2(mKO2), von Hippel–Lindau protein (pVHL), and actin weredetected by Western blotting. Briefly, cells were lysed with Mam-malian Protein Extraction Reagent (M-PER) (Pierce, Rockford, IL)and equal amounts of cell lysate were separated using SDS-PAGE. The proteins were transferred to nitrocellulose membranes,and the membranes were blocked in 2% ECL advance blockingagent (GE Healthcare, Uppsala, Sweden) in Tris-buffered salinewith Triton X-100. Proteins were detected with specific primaryantibodies for mAG, mKO2 (Medical and Biological Laboratories,Nagoya, Japan), pVHL (clone Ig32; BD Pharmingen, San Diego,CA), and actin (clone C4; Millipore, Billerica, MA). Specific proteinswere visualized by using secondary antibodies conjugated withhorseradish peroxidase (Santa Cruz Biotechnology, Santa Cruz,CA) and the ECL Western Blotting Detection reagents (GE Health-care). Protein expression levels were quantified using the Image J1.44 software (available from a website at http://rsbweb.nih.gov/ij/) and expressed as normalized by actin expression levels.
Kinetic analysis of !uorescence recovery after reoxygenation
Immediately after the hypoxic treatment for 16 h, cells were trea-ted with CHX (20 !g/ml) and held in an incubation chamber at37 °C in a humidified atmosphere containing 5% CO2, and visual-ized by time-lapse microscope. For fluorescence intensity analysis,images were taken every 4 min or 20 min intervals. Four cellsshowing green or red fluorescence after recovery were selected,and fluorescence intensity within each nucleus was quantifiedusing the Dynamic Cell Count software (KEYENCE, Osaka, Japan).Green and red fluorescence signals were robustly detectable4 min and 40 min after admission of air, respectively. The fluores-cence intensity was plotted against time; curves were then nor-malized by simple subtraction so that the initial measurablepoints start at zero, and fluorescence intensity was re-plottedagainst time t. These curves were fitted to the following equationusing the KaleidaGraph 3.6 (Synergy Software, Reading, PA):
F ! s 1!exp !kt" #f g
where F represents fluorescence intensity at time t, s representssaturated intensity of fluorescence at t=", and k represents therate constant. Time constant " was also determined using theequation "=(ln2)/k.
Statistical analysis
Mean values were statistically compared using the two-tailed t-test. p Values <0.05 were considered statistically significant.
Results
Fluorescence from HeLa-Fucci cells is abrogated underhypoxic conditions
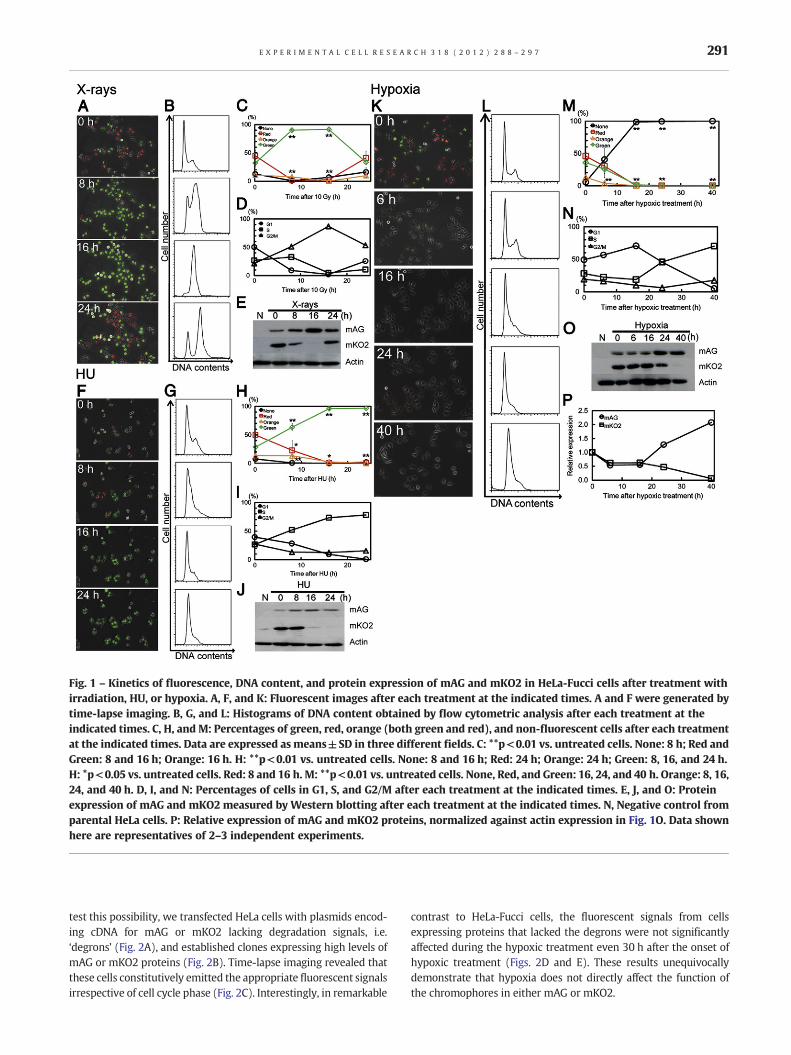
Using HeLa-Fucci cells, we previously reported that X-irradiationgradually increased the number of cells emitting green fluores-cence, reaching a peak about 16 h after irradiation; thereafter,the number decreased again. The kinetics corresponded closelyto the accumulation and release kinetics of G2/M phase cells[23,24]. In the present study, we confirmed that the kinetics ofthe fluorescence were consistent not only with the cell cyclechange, but also with protein expression levels of mAG andmKO2 (Figs. 1A–E). A similar relationship among fluorescence,cell cycle change, and protein expression levels was also observedafter hydroxyurea (HU) treatment. However, HU induces arrest inor near early S phase [25–27] (Figs. 1F–J); therefore, HU-arrestedcells should emit only green fluorescence following the G1/S tran-sition, confirming our previous study [24]. Thus the kinetics ofFucci fluorescence correlated well with those of cell cycle distribu-tion and protein expression levels following these treatments.
When cells were incubated in hypoxic conditions, the resultswere quite different. The number of cells emitting either red orgreen fluorescence decreased gradually, and almost no cells emit-ted fluorescence up to 10–16 h after the onset of hypoxic treat-ment (Fig. 1K). The fluorescence signals never returnedthereafter up to 40 h (Fig. 1K). In the Fucci system, there is ashort period at early G1 phase immediately after the end of mitosisduring which cells exhibit no fluorescence or no reporter proteinexpression [13]. However, 6 and 16 h after the onset of hypoxictreatment both mAG and mKO2 protein levels were comparableto those in control cells albeit with a slight decrease (Figs. 1O andP); therefore, it was unlikely that cells were completely arrestedat early G1 phase. The level of mKO2 protein gradually decreasedafter the complete disappearance of fluorescence, and becameundetectable about 40 h after the treatment (Figs. 1K,M, and O).Judging from fluorescent protein expression and DNA content, itis likely that partial G1 arrest first occurs ~16 h after hypoxic treat-ment; subsequently, cells accumulate slowly in early S-phase dur-ing hypoxic treatment (Figs. 1L,N,O, and P). These cell cycle eventsoccur after both red and green fluorescence signals are almost ab-rogated. In this hypoxic condition, cell viability remained higheven 40 h after treatment; dead cells floating in medium were ob-served only rarely and viability as determined by Trypan blue ex-clusion test was 95%. Therefore, we tentatively concluded thatthe fluorescence kinetics observed during the hypoxic treatmentmight be independent of cell cycle progression.
Fluorescence from cells constitutively expressing mAG andmKO2 is retained under hypoxic conditions
It may be possible that hypoxia directly affects the function of thechromophores of fluorescent proteins, because oxygen is an essen-tial factor in the formation of functional chromophores [2,8]. To
290 E X P E R I M E N T A L C E L L R E S E A R C H 3 1 8 ( 2 0 1 2 ) 2 8 8 – 2 9 7
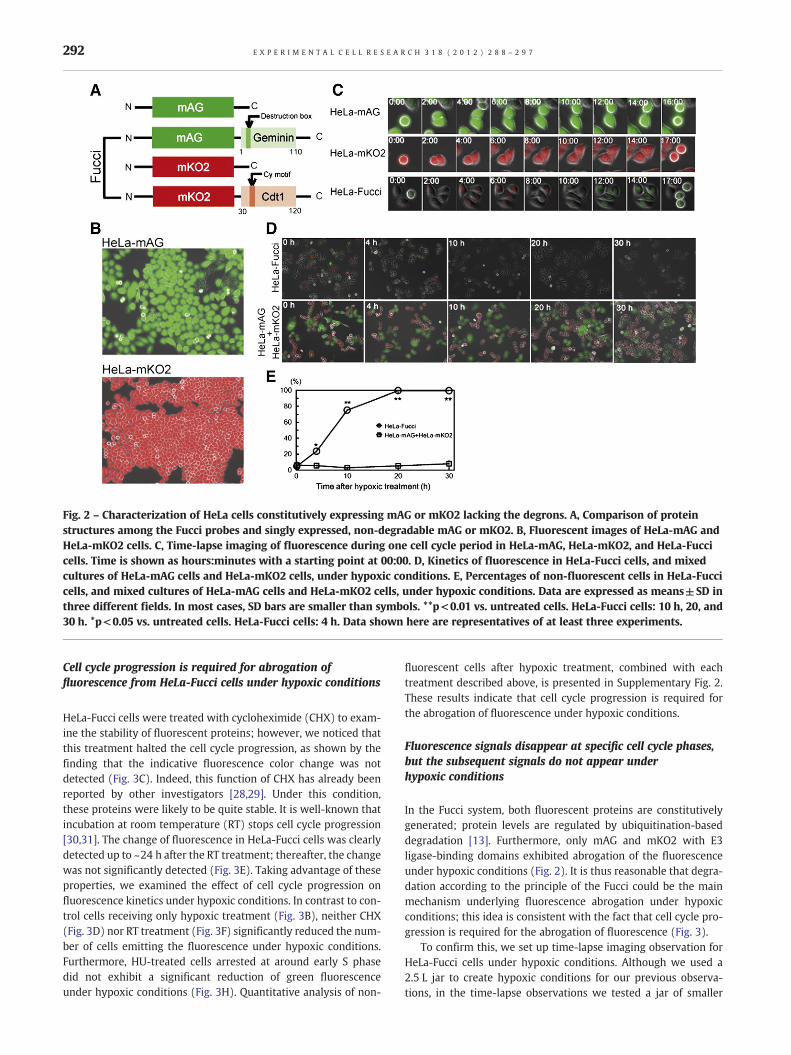
test this possibility, we transfected HeLa cells with plasmids encod-ing cDNA for mAG or mKO2 lacking degradation signals, i.e.‘degrons’ (Fig. 2A), and established clones expressing high levels ofmAG or mKO2 proteins (Fig. 2B). Time-lapse imaging revealed thatthese cells constitutively emitted the appropriate fluorescent signalsirrespective of cell cycle phase (Fig. 2C). Interestingly, in remarkable
contrast to HeLa-Fucci cells, the fluorescent signals from cellsexpressing proteins that lacked the degrons were not significantlyaffected during the hypoxic treatment even 30 h after the onset ofhypoxic treatment (Figs. 2D and E). These results unequivocallydemonstrate that hypoxia does not directly affect the function ofthe chromophores in either mAG or mKO2.
Fig. 1 – Kinetics of fluorescence, DNA content, and protein expression of mAG and mKO2 in HeLa-Fucci cells after treatment withirradiation, HU, or hypoxia. A, F, and K: Fluorescent images after each treatment at the indicated times. A and F were generated bytime-lapse imaging. B, G, and L: Histograms of DNA content obtained by flow cytometric analysis after each treatment at theindicated times. C, H, and M: Percentages of green, red, orange (both green and red), and non-fluorescent cells after each treatmentat the indicated times. Data are expressed as means±SD in three different fields. C: **p<0.01 vs. untreated cells. None: 8 h; Red andGreen: 8 and 16 h; Orange: 16 h. H: **p<0.01 vs. untreated cells. None: 8 and 16 h; Red: 24 h; Orange: 24 h; Green: 8, 16, and 24 h.H: *p<0.05 vs. untreated cells. Red: 8 and 16 h. M: **p<0.01 vs. untreated cells. None, Red, and Green: 16, 24, and 40 h. Orange: 8, 16,24, and 40 h. D, I, and N: Percentages of cells in G1, S, and G2/M after each treatment at the indicated times. E, J, and O: Proteinexpression of mAG and mKO2 measured by Western blotting after each treatment at the indicated times. N, Negative control fromparental HeLa cells. P: Relative expression of mAG and mKO2 proteins, normalized against actin expression in Fig. 1O. Data shownhere are representatives of 2–3 independent experiments.
291E X P E R I M E N T A L C E L L R E S E A R C H 3 1 8 ( 2 0 1 2 ) 2 8 8 – 2 9 7
Cell cycle progression is required for abrogation of!uorescence from HeLa-Fucci cells under hypoxic conditions
HeLa-Fucci cells were treated with cycloheximide (CHX) to exam-ine the stability of fluorescent proteins; however, we noticed thatthis treatment halted the cell cycle progression, as shown by thefinding that the indicative fluorescence color change was notdetected (Fig. 3C). Indeed, this function of CHX has already beenreported by other investigators [28,29]. Under this condition,these proteins were likely to be quite stable. It is well-known thatincubation at room temperature (RT) stops cell cycle progression[30,31]. The change of fluorescence in HeLa-Fucci cells was clearlydetected up to ~24 h after the RT treatment; thereafter, the changewas not significantly detected (Fig. 3E). Taking advantage of theseproperties, we examined the effect of cell cycle progression onfluorescence kinetics under hypoxic conditions. In contrast to con-trol cells receiving only hypoxic treatment (Fig. 3B), neither CHX(Fig. 3D) nor RT treatment (Fig. 3F) significantly reduced the num-ber of cells emitting the fluorescence under hypoxic conditions.Furthermore, HU-treated cells arrested at around early S phasedid not exhibit a significant reduction of green fluorescenceunder hypoxic conditions (Fig. 3H). Quantitative analysis of non-
fluorescent cells after hypoxic treatment, combined with eachtreatment described above, is presented in Supplementary Fig. 2.These results indicate that cell cycle progression is required forthe abrogation of fluorescence under hypoxic conditions.
Fluorescence signals disappear at speci"c cell cycle phases,but the subsequent signals do not appear underhypoxic conditions
In the Fucci system, both fluorescent proteins are constitutivelygenerated; protein levels are regulated by ubiquitination-baseddegradation [13]. Furthermore, only mAG and mKO2 with E3ligase-binding domains exhibited abrogation of the fluorescenceunder hypoxic conditions (Fig. 2). It is thus reasonable that degra-dation according to the principle of the Fucci could be the mainmechanism underlying fluorescence abrogation under hypoxicconditions; this idea is consistent with the fact that cell cycle pro-gression is required for the abrogation of fluorescence (Fig. 3).
To confirm this, we set up time-lapse imaging observation forHeLa-Fucci cells under hypoxic conditions. Although we used a2.5 L jar to create hypoxic conditions for our previous observa-tions, in the time-lapse observations we tested a jar of smaller
Fig. 2 – Characterization of HeLa cells constitutively expressing mAG or mKO2 lacking the degrons. A, Comparison of proteinstructures among the Fucci probes and singly expressed, non-degradable mAG or mKO2. B, Fluorescent images of HeLa-mAG andHeLa-mKO2 cells. C, Time-lapse imaging of fluorescence during one cell cycle period in HeLa-mAG, HeLa-mKO2, and HeLa-Fuccicells. Time is shown as hours:minutes with a starting point at 00:00. D, Kinetics of fluorescence in HeLa-Fucci cells, and mixedcultures of HeLa-mAG cells and HeLa-mKO2 cells, under hypoxic conditions. E, Percentages of non-fluorescent cells in HeLa-Fuccicells, and mixed cultures of HeLa-mAG cells and HeLa-mKO2 cells, under hypoxic conditions. Data are expressed as means±SD inthree different fields. In most cases, SD bars are smaller than symbols. **p<0.01 vs. untreated cells. HeLa-Fucci cells: 10 h, 20, and30 h. *p<0.05 vs. untreated cells. HeLa-Fucci cells: 4 h. Data shown here are representatives of at least three experiments.
292 E X P E R I M E N T A L C E L L R E S E A R C H 3 1 8 ( 2 0 1 2 ) 2 8 8 – 2 9 7

Fig. 3 – Effect of cell cycle inhibition on fluorescence emission in HeLa-Fucci cells under hypoxic conditions. A and B: Control. C and D: CHX treatment. Cells were treated with 20 !g/mlCHX for 2 h, and observation started in the presence of CHX (=0 h). Hypoxic treatment also started 2 h after the CHX treatment. E and F: Room temperature treatment (RT). Cells weretreated at room temperature for 24 h and then observation was started at 0 h. Hypoxic treatment was started 24 h after RT treatment in normoxia. G and H: hydroxyurea (HU)treatment. Cells were treated with 3 mM HU for 24 h, and then observation started in the presence of HU (=0 h). Hypoxic treatment was started 24 h after the HU treatment. A, C, E,and G: Time-lapse images; B, D, F, and H: Images of different fields in different dishes. A representative experiment of two to three performed is shown.
293EX
PER
IM
EN
TA
LCELL
RESEA
RCH
318
(2012)
288–297
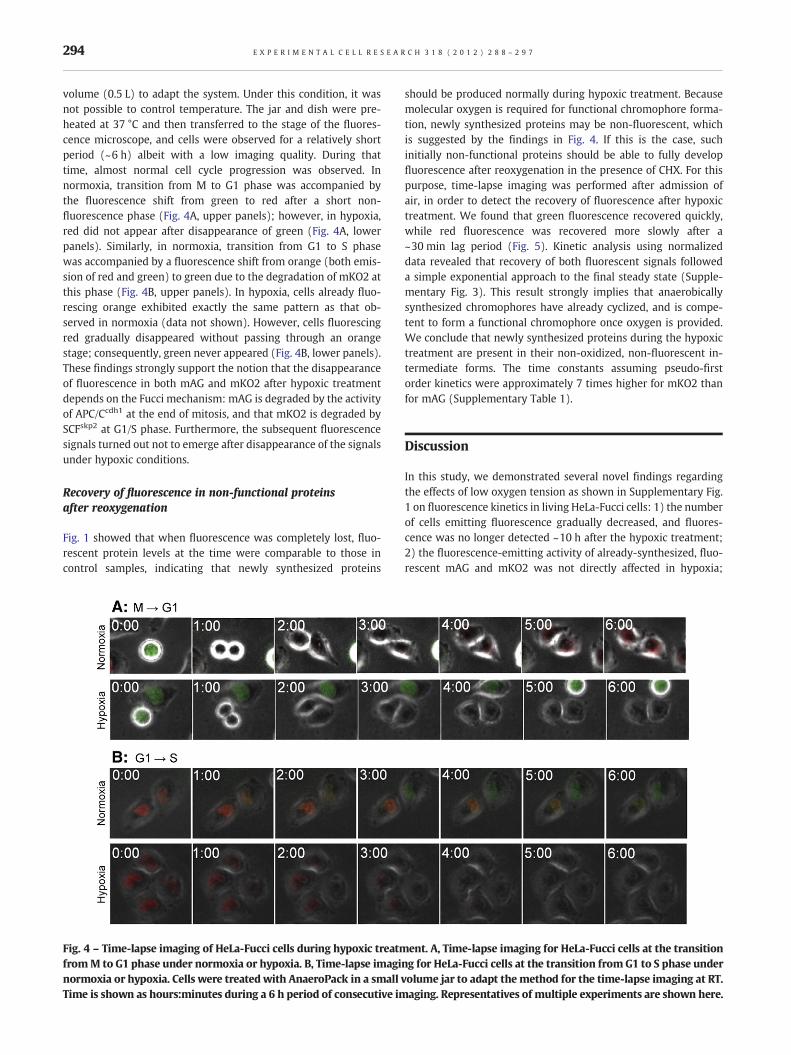
volume (0.5 L) to adapt the system. Under this condition, it wasnot possible to control temperature. The jar and dish were pre-heated at 37 °C and then transferred to the stage of the fluores-cence microscope, and cells were observed for a relatively shortperiod (~6 h) albeit with a low imaging quality. During thattime, almost normal cell cycle progression was observed. Innormoxia, transition from M to G1 phase was accompanied bythe fluorescence shift from green to red after a short non-fluorescence phase (Fig. 4A, upper panels); however, in hypoxia,red did not appear after disappearance of green (Fig. 4A, lowerpanels). Similarly, in normoxia, transition from G1 to S phasewas accompanied by a fluorescence shift from orange (both emis-sion of red and green) to green due to the degradation of mKO2 atthis phase (Fig. 4B, upper panels). In hypoxia, cells already fluo-rescing orange exhibited exactly the same pattern as that ob-served in normoxia (data not shown). However, cells fluorescingred gradually disappeared without passing through an orangestage; consequently, green never appeared (Fig. 4B, lower panels).These findings strongly support the notion that the disappearanceof fluorescence in both mAG and mKO2 after hypoxic treatmentdepends on the Fucci mechanism: mAG is degraded by the activityof APC/Ccdh1 at the end of mitosis, and that mKO2 is degraded bySCFskp2 at G1/S phase. Furthermore, the subsequent fluorescencesignals turned out not to emerge after disappearance of the signalsunder hypoxic conditions.
Recovery of !uorescence in non-functional proteinsafter reoxygenation
Fig. 1 showed that when fluorescence was completely lost, fluo-rescent protein levels at the time were comparable to those incontrol samples, indicating that newly synthesized proteins
should be produced normally during hypoxic treatment. Becausemolecular oxygen is required for functional chromophore forma-tion, newly synthesized proteins may be non-fluorescent, whichis suggested by the findings in Fig. 4. If this is the case, suchinitially non-functional proteins should be able to fully developfluorescence after reoxygenation in the presence of CHX. For thispurpose, time-lapse imaging was performed after admission ofair, in order to detect the recovery of fluorescence after hypoxictreatment. We found that green fluorescence recovered quickly,while red fluorescence was recovered more slowly after a~30 min lag period (Fig. 5). Kinetic analysis using normalizeddata revealed that recovery of both fluorescent signals followeda simple exponential approach to the final steady state (Supple-mentary Fig. 3). This result strongly implies that anaerobicallysynthesized chromophores have already cyclized, and is compe-tent to form a functional chromophore once oxygen is provided.We conclude that newly synthesized proteins during the hypoxictreatment are present in their non-oxidized, non-fluorescent in-termediate forms. The time constants assuming pseudo-firstorder kinetics were approximately 7 times higher for mKO2 thanfor mAG (Supplementary Table 1).
Discussion
In this study, we demonstrated several novel findings regardingthe effects of low oxygen tension as shown in Supplementary Fig.1 on fluorescence kinetics in living HeLa-Fucci cells: 1) the numberof cells emitting fluorescence gradually decreased, and fluores-cence was no longer detected ~10 h after the hypoxic treatment;2) the fluorescence-emitting activity of already-synthesized, fluo-rescent mAG and mKO2 was not directly affected in hypoxia;
Fig. 4 – Time-lapse imaging of HeLa-Fucci cells during hypoxic treatment. A, Time-lapse imaging for HeLa-Fucci cells at the transitionfromM to G1 phase under normoxia or hypoxia. B, Time-lapse imaging for HeLa-Fucci cells at the transition from G1 to S phase undernormoxia or hypoxia. Cells were treated with AnaeroPack in a small volume jar to adapt the method for the time-lapse imaging at RT.Time is shown as hours:minutes during a 6 h period of consecutive imaging. Representatives of multiple experiments are shown here.
294 E X P E R I M E N T A L C E L L R E S E A R C H 3 1 8 ( 2 0 1 2 ) 2 8 8 – 2 9 7
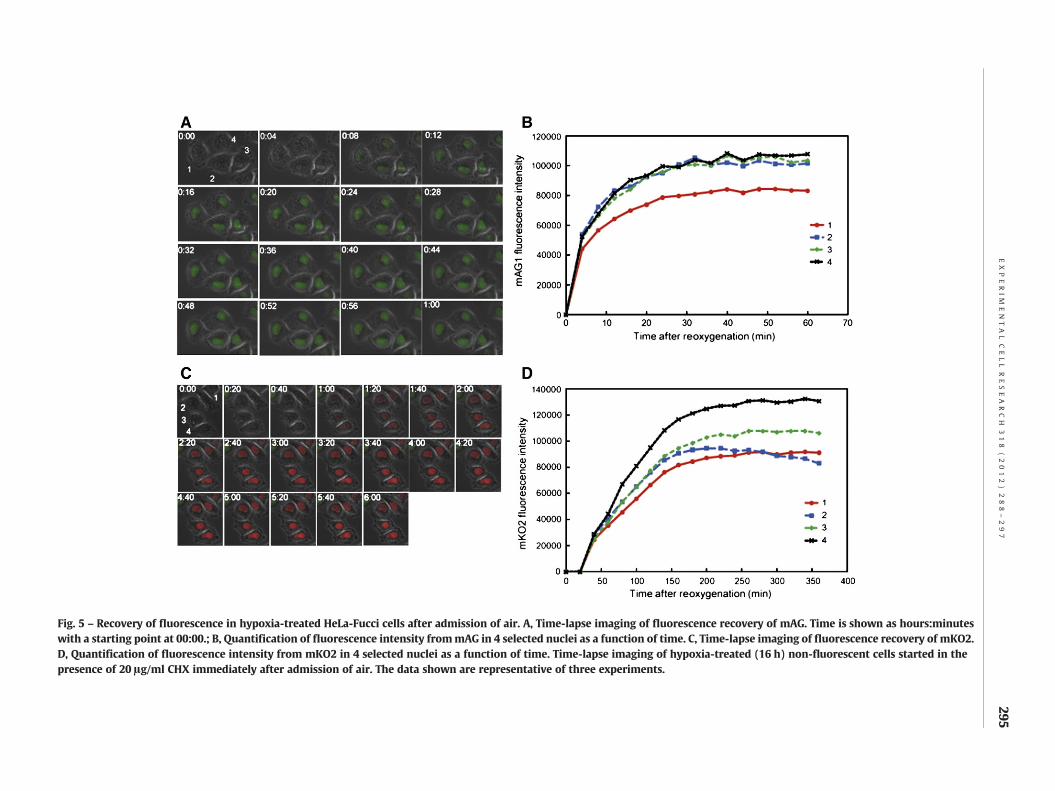
Fig. 5 – Recovery of fluorescence in hypoxia-treated HeLa-Fucci cells after admission of air. A, Time-lapse imaging of fluorescence recovery of mAG. Time is shown as hours:minuteswith a starting point at 00:00.; B, Quantification of fluorescence intensity frommAG in 4 selected nuclei as a function of time. C, Time-lapse imaging of fluorescence recovery of mKO2.D, Quantification of fluorescence intensity from mKO2 in 4 selected nuclei as a function of time. Time-lapse imaging of hypoxia-treated (16 h) non-fluorescent cells started in thepresence of 20 !g/ml CHX immediately after admission of air. The data shown are representative of three experiments.
295EX
PER
IM
EN
TA
LCELL
RESEA
RCH
318
(2012)
288–297
3) the abrogation of fluorescence resulted from a combination of thedegradation of already-synthesized mAG and mKO2, depending onthe principle of Fucci, and generation of non-oxidized proteins,which do not contribute to fluorescence emission; 4) the recoverykinetics of the fluorescence after reoxygenation in the presence ofCHX exhibited pseudo-first order kinetics, confirming the accumula-tion of non-oxidized intermediates; and 5) the time constants forthe oxidization of fluorescent proteins were approximately 7 timeshigher in mKO2 than in mAG. The kinetics of fluorescence disap-pearance thus reflected that of degradation of functional proteinsthat were synthesized before hypoxic treatment.
We combined plastic dishes and the AnaeroPack-Anaero 5%system, which reproducibly brought the oxygen tension (pO2) to<0.1% in the atmosphere within an hour, in order to create hypox-ic conditions and retain high quality cell imaging. We could notdetermine the kinetics of pO2 in the medium; however, it is astrong prediction that the pO2 in the medium should reproduciblydecrease and reach the same level as in the gas above, though at aslower rate than in the atmosphere. In this condition, cell cycleprogression and high cell viability could be maintained for a sig-nificant interval thereafter. These conditions allowed us to clarifyfor the first time the effects of low oxygen tension on fluorescenceemission from proteins expressed in mammalian cells.
Liu et al. recently reported that the expression of von Hippel–Lindau tumor-suppressor protein (pVHL) is decreased as rapidlyas 4 h after hypoxic treatment, and is a novel substrate of APC/CCdh1 [32]. The authors could partly explain the mechanism as afunction of the APC/CCdh1 activity in G1-arrested cells after hypox-ic treatment. However, that was insufficient to explain the speedof degradation; apparent G1 arrest occurs around 16 h after hyp-oxic treatment. Therefore, the authors proposed a mechanism ofdegradation of pVHL also by other E3 ligases activated after ashift to hypoxia [32]. Indeed, we could confirm that pVHL wascompletely degraded as rapidly as 6 h after a shift to hypoxia,and was not detected up to 40 h in our hypoxia system (Supple-mentary Fig. 4A and B). We considered the possibility that a sec-ondary factor might be involved in the disappearance of mAGfluorescence, because the kinetics were very similar (Figs. 1Kand M); however, the mAG probe is refractory to the ligase activ-ity and seems not to be its substrate, as shown in SupplementaryFig. 4. Even if the mAG probe is a substrate, simple degradationof proteins in a cell cycle-independent manner cannot by itselffully explain the findings. Thus, the possible involvement of thesecondary factor could be ruled out. To the best of our knowledge,the mAG probe is not degraded by factors other than APC/CCdh1. Sofar, only the combined events, degradation of the limited quanti-ties of mature fluorescent probes according to the Fucci principleand synthesis of non-oxidized immature probes, can explain allphenomena occurring after hypoxic treatment.
Azami Green (AG) was cloned from the Galaxeidae coral byMiyawaki and his colleagues [4]; the identity between AG and en-hanced GFP (EGFP) at the amino acid level is only 5.7%, despite thefact that the proteins share a similar spectral profile. AG initiallyforms a tight tetrameric complex, which results in poor labeling ofsubcellular structures. Therefore, to increase its utility in visualizingsubcellular events, AG was adapted to a monomeric form (mAG) bythe introduction of three amino acid substitutions. Compared toEGFP, mAG has a brighter fluorescence and amore rapidmaturationspeed under normoxic conditions [4]. Kusabira Orange (KO) wascloned from Fungia concinna coral also by Miyawaki and his
colleagues, and similarly adapted to the monomeric form [5]. Inthe development of Fucci, a fast folding variant mKO2 and mAGwere used to visualize the dynamics of cell cycle progression [13].Three dimensional analysis of the crystal structure of mKO revealeda novel three-ring chromophore developed autocatalytically fromthe Cys-Tyr-Glu tripeptide that constitutes the chromophore; thematuration process involves complicated oxidization steps [33].The slow kinetics of oxidation for mKO2 obtained in this study canbe attributed to its complex oxidation process. Heim et al. [10]reported that in Escherichia coli expressing GFP under hypoxic con-ditions, the time constant for oxidation of GFP was ~120 min; Sie-mering et al. [11] reported that the time constant was ~10 min inyeast cells expressing GFP under hypoxic conditions. Although theprimary structure of mAG is quite different from that of GFP [4],the time constant for mAG expressed in HeLa-Fucci cells was~7 min, close to that of GFP expressed in yeast cells. In mammaliancells, the oxidation process inmAGmay not be rate limiting for chro-mophore maturation, as Siemering et al. implied in the case of yeastcells [11]. Further studywill be required in order to elucidate the de-tailed oxidation mechanism and explain the slower kinetics ob-served for mKO2 in mammalian cells.
Hypoxic fractions in solid tumors experience varying levels of ox-ygen tension, depending on the distance from tumor vessels [34,35];this is referred to as chronic hypoxia. Furthermore, oxygen tensionperiodically fluctuates due to a periodical closure and reopening oftumor vessels [35,36]; this is known as acute or cycling hypoxia.When Fucci is eventually used to analyze cell cycle kinetics of hypox-ic fractions in solid tumors that experience such complicated oxygenkinetics, fluorescence kineticsmay be influenced independent of cellcycle; therefore, care should be takenwhen interpreting the true cellcycle from the fluorescence behavior in vivo.
In conclusion, we visualized the effects of hypoxia on fluores-cence kinetics in living mammalian cells using the Fucci system,which could differentiate between already-synthesized functionalfluorescent proteins present before hypoxic treatment from newlysynthesized non-fluorescent proteins present after hypoxic treat-ment. Furthermore, the kinetics of oxidization were quite differentdepending on the type of fluorescent protein. These properties offluorescent proteins under hypoxic conditions should be consid-ered when they are applied to hypoxic situations, according tothe purpose of the study.
Supplementary data associated with this article can be found,in the online version, at doi:10.1016/j.yexcr.2011.10.016.
Acknowledgment
We thank Drs. A. Miyawaki and A. Sakaue-Sawano for providingthe HeLa cells expressing the Fucci probes and critical reading ofthe manuscript. This study was supported in part by the Programfor Promotion of Fundamental Studies of Health Sciences of theNational Institute of Biomedical Innovation (NIBIO).
R E F E R E N C E S
[1] O. Shimomura, F.H. Johnson, Y. Saiga, Extraction, purification andproperties of aequorin, a bioluminescent protein from theluminous hydromedusan, Aequorea, J. Cell. Comp. Physiol. 59(1962) 223–239.
296 E X P E R I M E N T A L C E L L R E S E A R C H 3 1 8 ( 2 0 1 2 ) 2 8 8 – 2 9 7
[2] R. Heim, D.C. Prasher, R.Y. Tsien, Wavelength mutations andposttranslational autoxidation of green fluorescent protein, Proc.Natl. Acad. Sci. U. S. A. 91 (1994) 12501–12504.
[3] R.Y. Tsien, The green fluorescent protein, Annu. Rev. Biochem. 67(1998) 509–544.
[4] S. Karasawa, T. Araki, M. Yamamoto-Hino, A. Miyawaki, Agreen-emitting fluorescent protein from Galaxeidae coral and itsmonomeric version for use in fluorescent labeling, J. Biol. Chem.278 (2003) 34167–34171.
[5] S. Karasawa, T. Araki, T. Nagai, H. Mizuno, A. Miyawaki,Cyan-emitting and orange-emitting fluorescent proteins as adonor/acceptor pair for fluorescence resonance energy transfer,Biochem. J. 381 (2004) 307–312.
[6] D.A. Zacharias, R.Y. Tsien, Molecular biology and mutation ofgreen fluorescent protein, Methods Biochem. Anal. 47 (2006)83–120.
[7] B.N. Giepmans, S.R. Adams, M.H. Ellisman, R.Y. Tsien, Thefluorescent toolbox for assessing protein location and function,Science 312 (2006) 217–224.
[8] A.B. Cubitt, R. Heim, S.R. Adams, A.E. Boyd, L.A. Gross, R.Y. Tsien,Understanding, improving and using green fluorescent protein,Trends Biochem. Sci. 20 (1995) 448–455 (1995).
[9] M. Ormo, A.B. Cubitt, K. Kallio, L.A. Gross, R.Y. Tsien, S.J.Remingston, Crystal structure of the Aequorea victoria greenfluorescent protein, Science 272 (1996) 1392–1395.
[10] R. Heim, A.B. Cubitt, R.Y. Tsien, Improved green fluorescence,Nature 373 (1995) 663–664.
[11] K.R. Siemering, R. Golbik, R. Sever, J. Haseloff, Mutations thatsuppress the thermosensitivity of green fluorescent protein, Curr.Biol. 6 (1996) 1653–1663.
[12] B.G. Reid, G.C. Flynn, Chromophore formation in greenfluorescent protein, Biochemistry 36 (1997) 6786–6791.
[13] A. Sakaue-Sawano, H. Kurosawa, T. Morimura, A. Hanyu, H.Hama, H. Osawa, S. Kashiwagi, K. Fukami, T. Miyata, H. Miyoshi, T.Imamura, M. Ogawa, H. Masai, A. Miyawaki, Visualizingspatiotemporal dynamics of multicellular cell-cycle progression,Cell 132 (2008) 487–498.
[14] E.J. Hall, J. Giaccia, Repair of radiation damage and the dose rateeffect, in: E.J. Hall, J. Giaccia (Eds.), Radiobiology for theRadiologist, 6th ed., Lippincott Williams & Wilkins, Philadelphia,2009, pp. 85–105.
[15] J.D. Chapman, J. Sturrock, J.W. Boag, J.O. Crookall, Factors affectingthe oxygen tension around cells growing in plastic petri dishes,Int. J. Radiat. Biol. 17 (1979) 305–328.
[16] N. Chan, M. Koritzinsky, H. Zhao, R. Bindra, P.M. Glazer, S. Powell,A. Belmaaza, B. Wouters, R.G. Bristow, Chronic hypoxia decreasessynthesis of homologous recombination proteins to offsetchemoresistance and radioresistance, Cancer Res. 68 (2008)605–614.
[17] H. Harada, S. Itasaka, S. Kizaka-Kondoh, K. Shibuya, K. Shinomiya,M. Hiraoka, The Akt/mTOR pathway assures the synthesis ofHIF-1alpha protein in a glucose- and reoxygenation-dependentmanner in irradiated tumors, J. Biol. Chem. 284 (2008)5332–5342.
[18] K. Matsumoto, T. Arao, K. Tanaka, H. Kaneda, K. Kudo, Y. Fujita, D.Tamura, K. Aomatsu, T. Tamura, Y. Yamada, N. Saijo, K. Nishio,mTOR signal and hypoxia-inducible factor-1 alpha regulate CD133expression in cancer cells, Cancer Res. 69 (2009) 7160–7164.
[19] H. Okuyama, H. Endo, T. Akashika, K. Kikuya, M. Inoue,Downregulation of c-MYC protein levels contributes to cancercell survival under dual deficiency of oxygen and glucose, CancerRes. 70 (2010) 10213–10223.
[20] C. Katoh, T. Osanai, H. Tomita, K. Okumura, Brain natriureticpeptide is released from human astrocytoma cell line U373MG
under hypoxia: a possible role in anti-apoptosis, J. Endocrinol.208 (2011) 51–57.
[21] T. Kamiya, A.H. Kwon, T. Kanemaki, Y. Matsui, S. Uetsuji, T.Okumura, Y. Kamiyama, A simplified model of hypoxic injury inprimary cultured rat hepatocytes, In Vitro Cell. Dev. Biol. Anim.34 (1998) 131–137.
[22] Y. Sato, H. Endo, H. Okuyama, T. Takeda, H. Iwahashi, A. Imagawa,K. Yamagata, I. Shimomura, M. Inoue, Cellular hypoxia ofpancreatic #-cells due to high levels of oxygen consumption forinsulin secretion in vitro, J. Biol. Chem. 286 (2011) 12524–12532.
[23] M. Ishikawa, Y. Ogihara, M. Miura, Visualization of radiation-induced cell cycle-associated events in tumor cells expressing thefusion protein of Azami Green and the destruction box of humanGeminin, Biochem. Biophys. Res. Commun. 389 (2009) 426–430.
[24] A. Kaida, N. Sawai, K. Sakaguchi, M. Miura, Fluorescence kineticsin HeLa cells after treatment with cell cycle arrest inducersvisualized with Fucci (fluorescent ubiquitination-based cell cycleindicator), Cell Biol. Int. 35 (2011) 359–363.
[25] R.A. Tobey, N. Oishi, H.A. Crissman, Cell cycle synchronization:reversible induction of G2 synchrony in cultured rodent andhuman diploid fibroblasts, Proc. Natl. Acad. Sci. U. S. A. 87 (1990)5104–5108.
[26] H. Nishitani, S. Taraviras, Z. Lygerou, T. Nishimoto, The humanlicensing factor for DNA replication Cdt1 accumulates in G1 andis destabilized after initiation of S-phase, J. Biol. Chem. 276(2001) 44905–44911.
[27] A. Kurose, T. Tanaka, X. Huang, F. Traganos, W. Dai, Z.Darzynkiewicz, Effects of hydroxyurea and aphidicolin onphosphorylation of ataxia telangiectasia mutated on Ser 1981and histone H2AX on Ser 139 in relation to cell cycle phase andinduction of apoptosis, Cytometry A 69 (2006) 212–221.
[28] X. Liu, J.M. Yang, S.S. Zhang, X.Y. Liu, D.X. Liu, Induction of cellcycle arrest at G1 and S phases and camp-dependentdifferentiation in C6 glioma by low concentration ofcycloheximide, BMC Cancer 10 (2010) 684.
[29] L. Zhang, A. Wali, C.V. Ramana, A.K. Rish, Cell growth inhibitionby okadaic acid involves gut-enriched Kruppel-like factormediated enhanced expression of c-Myc, Cancer Res. 67 (2007)10198–10206.
[30] M.M. Elkind, H. Sutton-Gilbert, W.B. Moses, T. Alescio, R.B. Swain,Radiation response of mammalian cells in culture: V.Temperature dependence of the repair of X-ray damage insurviving cells, Radiat. Res. 25 (1965) 359–376.
[31] E.J. Hall, J. Giaccia, Repair of radiation damage and the dose rateeffect, in: E.J. Hall, J. Giaccia (Eds.), Radiobiology for theRadiologist, 6th ed., Lippincott Williams & Wilkins, Philadelphia,2009, pp. 60–84.
[32] W. Liu, H. Xin, D.T. Eckert, J.A. Brown, J.R. Gnarra, Hypoxia and cellcycle regulation of the von Hippel–Lindau tumor suppressor,Oncogene 30 (2011) 21–31.
[33] A. Kikuchi, E. Fukumura, S. Karasawa, H. Mizuno, A. Miyawaki, S.Yoshitsugu, Structural characterization of a thiazoline-containingchromophore in an orange fluorescent protein, monomericKusabira Orange, Biochemistry 47 (2008) 11573–11580.
[34] R.H. Thomlinson, L.H. Gray, The histological structure of somehuman lung cancers and the possible implications forradiotherapy, Br. J. Cancer 9 (1955) 539–549.
[35] H. Yasui, S. Matsumoto, N. Devasahayam, J.P. Munasinghe, R.Choudhuri, S. Subramanian, J.B. Mitchell, M.C. Krishna, Low-fieldmagnetic resonance imaging to visualize chronic and cyclinghypoxia in tumor-bearing mice, Cancer Res. 70 (2010)6427–6436.
[36] S. Matsumoto, H. Yasui, J.B. Mitchell, M.C. Krishna, Imagingcycling tumor hypoxia, Cancer Res. 70 (2010) 10019–10023.
297E X P E R I M E N T A L C E L L R E S E A R C H 3 1 8 ( 2 0 1 2 ) 2 8 8 – 2 9 7


![[Monster, Familiar] Kaida](https://img.pdfslide.net/doc/110x75/577cd8d31a28ab9e78a21244/monster-familiar-kaida.jpg)
