Embed Size (px)
Citation preview

www.elsevier.com/locate/visres
Vision Research 45 (2005) 2037–2057
Visually perceived vertical (VPV): induced changes in orientationby 1-line and 2-line roll-tilted and pitched visual fields
Wenxun Li *, Leonard Matin
Clarence H. Graham Memorial Laboratory of Visual Science, Department of Psychology Columbia University, Schermerhorn Hall,
New York, NY 10027, USA
Received 5 September 2003
Abstract
We report a series of nine experiments which show that a single roll-tilted line in darkness induces changes of the orientation
perceived as vertical (VPV) that are similar in magnitude and direction to those measured by Witkin and Asch (1948a) [Studies
in space orientation. I. Perception of the upright with displaced visual fields. Journal of Experimental Psychology, 38, 762–782] with
the classical square 4-sided frame, and we describe the configuration-independent mass-action rules by which the influences of the
individual lines influences are combined. Clockwise (cw) and counterclockwise (ccw) orientations of a line produce cw and ccw dis-
placements of the VPV setting, respectively, with effect magnitude increasing approximately linearly with line orientation (e.g., a
66.25�-long line at 25� horizontal eccentricity that varies in roll-tilt through ±13.2� around vertical generates a systematic variation
in VPV over ±7�). The slope of the VPV-vs-roll-tilt function increases with line length along a negatively accelerated exponential
function (length constant = 17.1�). The influences of two bilaterally symmetric lines combine linearly and algebraically and the com-
bined influence is linearly related to the sum of the VPVs for the 1-line components with a slope equal to 0.91 for short lines and 0.66
for long lines; thus, VPV for short lines manifests nearly complete additive summation, but for long lines, the 2-line VPV is nearer to
the average of the VPV values for the two components measured separately. The effectiveness of the conjunction of two line seg-
ments within a visual scene does not depend on their separate orientations, only on their sum. Individual lines from pitched-only
planes or from combinations of such planes generate identical influences to those generated from lines in frontoparallel planes with
the same image orientations at the eye of the observer (their ‘‘retinal orientations’’). Retinal orientation is the key to the induction of
VPV change independently of the line�s plane of origin.
� 2005 Elsevier Ltd. All rights reserved.
Keywords: Visually perceived vertical; Space perception; Spatial orientation; Linear summation; Egocentric localization; Spatial Induction
1. Introduction
In a classic series of articles Witkin and Asch brought
the study of the visual perception of egocentric spatial
orientation into the arena of modern science. They
manipulated the orientation (roll-tilt) of the field ofview, first, by replicating Wertheimer�s experiment with
the subject viewing the visual field presented by a tilted
0042-6989/$ - see front matter � 2005 Elsevier Ltd. All rights reserved.
doi:10.1016/j.visres.2005.01.014
* Corresponding author. Tel.: +1 212854 4325; fax: +1 212854 3609.
E-mail addresses: [email protected] (W. Li), matin@columbia.
edu (L. Matin).
mirror (Asch & Witkin, 1948a; Wertheimer, 1912), then
by having the subject view a large well-illuminated roll-
tilted room containing furniture attached to the floor
and walls that filled the field of view while the subject re-
mained erect in physical space (Asch & Witkin, 1948b),
and then by roll-tilting a large luminous square frame inthe subject�s frontoparallel plane in otherwise total dark-
ness (Witkin & Asch, 1948). The main psychophysical
measurement was the subject�s setting of a rod within
a frontoparallel plane to appear vertical (we refer to this
as a VPV setting). Tilting the view in the mirror, rotating
the room, or rotating the frame from an orientation in

2038 W. Li, L. Matin / Vision Research 45 (2005) 2037–2057
which the main lines in the visual field deviated from an
erect orientation relative to gravity typically resulted in
the physically vertical rod appearing to deviate from
vertical in the direction opposite to the tilt of the field
of view; for the rod to appear vertical, it had to be set
to a roll-tilt within the frontoparallel plane in the samedirection as the field of view. Asch and Witkin (1948a)
stated, ‘‘The present experiment has provided striking
evidence of the predominance of the visual framework
over postural factors in perception of the upright’’. They
drew similar conclusions in their subsequent articles.
The conclusion has held up remarkably well. The sub-
stantial involvement of the body-referenced mechanism1
has also been made clear along with the contribution bythe visual field to VPV (see Gibson & Mowrer, 1938),
and the work by Witkin and Asch (see particularly, Wit-
kin, 1949) and subsequent work has helped to delineate
the body-referenced mechanism�s contribution in rela-
tion to influences from the visual field (Bauermeister,
1964; Chelette, Li, Esken, & Matin, 1995; Dichgans,
Held, Young, & Brandt, 1972; Dichgans & Brandt,
1974; DiZio, Li, Lackner, & Matin, 1997; Higashiyama& Koga, 1998; Held, Dichgans, & Bauer, 1975; Howard
& Childerson, 1994; Li, Dallal, & Matin, 2001; Mittels-
taedt, 1986, 1988, 1992, 1997; Schone, 1964; Trousse-
lard, Cian, Nougier, Pla, & Raphel, 2003; see Howard,
1982; Howard & Templeton, 1966 for earlier
summaries).
The square roll-tilted frame was originally employed
by Witkin and Asch as a reduced and readily manipula-ble surrogate for the normal visual environment. How-
ever, since that work, the basis for the influence of the
frame has also become a subject of study in itself. The
nearly invariable use of the square frame as an entity
whose parameters were varied while retaining its square-
ness and its closed figural character in a very large num-
ber of studies indicates the frame�s treatment as a
unitary gestalt; an emphasis on the configurational as-pects of the square frame has been at the center of sub-
stantial research efforts in several laboratories concerned
with the basis for the frame�s influence: Witkin and Asch
first suggested that the perceptual ambiguity of the phy-
sically tilted square—it sometimes appeared as a tilted
diamond and at others as a tilted square—had a bearing
on the VPV settings; a similar view regarding the frame�s
1 The term �body-referenced mechanism� was introduced (Matin &
Fox, 1989) to refer to the combination of all extraretinal influences on
the perception of interest—here the visual perception of vertical—
including extraretinal eye position information, extraretinal head
orientation information (including information regarding the head
relative to the body and the head relative to gravity), other effects of
gravity on the body, pressure cues from the surfaces of the body, joint
receptors, and the vestibular organ; it includes, in addition, the basic
local sign information from the visual target employed to measure the
discrimination itself. There is some overlap with the term ‘‘postural
factors’’ as employed by Witkin and Asch (1948).
appearance as a diamond was later expressed by Wende-
roth and Beh (1977), and Wenderoth (1977, 1982). As an
interpretation of experiments in which the orientation of
the frame was systematically varied, Beh, Wenderoth,
and Purcell (1971) had proposed a ‘‘main axes hypo-
thesis’’ which stated that VPV settings were biased inthe direction of the main axes of the inducing frame
where ‘‘main axes’’ included all axes of symmetry of a
frame, including the main diagonals of the square frame,
not only the two axes parallel to the sides of the frame.
They continued to explore this with triangles and hexa-
gons as inducing figures in experiments measuring VPV,
originally reporting support for it (Beh & Wenderoth,
1972), and subsequently reporting mixed support forthe hypothesis from work with partial frames (2-line-
angle and 2-line-parallel stimuli) in Wenderoth and Beh
(1977) and Wenderoth (1977). In work centered on other
configurational aspects of the frame, Ebenholtz and his
colleagues replaced the entire tilted frame with its four
corners or with filled circles at its corners (Streibel,
Barnes, Julness, & Ebenholtz, 1980), and from small ef-
fects with corners only they concluded that Koffka�s the-ory (1935) regarding field organization in perception, as
applied to the square frame�s influence on VPV, did not
hold.
A sizable number of studies manipulated the para-
meters of the frame as a unitary stimulus, including
the separation between rod and frame both within the
frontoparallel plane and in depth, the orientation of
the frame, the area of the frame and the length of therod, separately, together, and in conjunction with other
measures of frame size, and/or in conjunction with var-
iation of body tilt or head tilt (e.g., Ebenholtz, 1977,
1985; Ebenholtz & Benzchawel, 1977; Gogel & Newton,
1975; Poquin, Ohlmann, & Barraud, 1998; Wenderoth,
1977; Zoccolotti, Antonucci, & Spinelli, 1993). Spinelli,
Antonucci, Goodenough, Pizzamiglio, and Zoccolotti
(1991) systematically varied the orientation and size ofthe frame over a 90� range and described their angle
functions as a weighted sum of the relative amplitudes
of the first two Fourier components and also reported
reduced effects with smaller frames. Ebenholtz and his
colleagues had further demonstrated that the influence
on VPV was due to retinal size, not perceived size (Ebe-
nholtz, 1977; Ebenholtz & Callan, 1980). In addition to
the numerous explorations of these and other parame-ters, the square frame was treated as the concrete
embodiment of the concept of frame of reference and
become the focus of numerous experimental and theo-
retical articles in space perception, in cognition, and in
the study of connections between cognition and person-
ality where it has become known as the rod-and-frame
test (e.g., Bertini, Pizzamiglio, & Wapner, 1986; Gold-
stein & Chance, 1965; Hudson, Li, & Matin, 1997; Hud-son, Li, & Matin, submitted for publication; Linn &
Peterson, 1985; Sherman, 1969; Wapner & Demick,

W. Li, L. Matin / Vision Research 45 (2005) 2037–2057 2039
1991; Weiner, 1955 Witkin, 1977; Witkin, Dyk, Fater-
son, Goodenough, & Karp, 1962; Witkin & Gooden-
ough, 1977, 1981; Witkin, Karp, & Goodenough,
1959; Witkin et al., 1954).
While the perception of squareness of the frame cer-
tainly depends on the configurational aspects of thephysical stimulus (i.e., specific relations between the re-
lative orientations, relative locations, and lengths of
the four constituent lines) leading to its unitary percep-
tual quality, whether the effect of the frame in influenc-
ing the orientation perceived as vertical is connected
with such qualities or has another basis is a question
that has not been addressed experimentally. The present
article begins to address this by studying the influenceon VPV of single lines (‘‘1-line stimulus’’) and pairs of
lines (‘‘2-line stimulus’’) in darkness in order to assess
whether such configuration-dependence is necessary
for the induction effect. The experiments are concerned
with: (1) the influence of the individual roll-tilted line;
(2) the rules of combination for influences between
two simultaneously viewed lines of the same or different
orientations; (3) whether inducing lines from differentlypitched planes and their combinations have the same or
different influences on VPV as do those from the fronto-
parallel plane; (4) whether the induction effect depends
on the test rod being roll-tilted around an axis in the
same plane from which the inducer arises.
2. Method
The nine experiments reported in the present article
have been grouped into four sets and will be reported
here as Expts. 1–4 (Fig. 1). Expts. 1, 2, and 3 employed
roll-tilted inducing lines of various orientations and
lengths at one or both of two bilaterally symmetric loca-
tions in the frontoparallel plane. Expt. 4 employed
inducing lines from pitched-only planes that stimulatedthe same retinal orientations2 as did the lines in the
frontoparallel plane in Expt. 3. However, stimulation
at the retina from the lines from different planes with
the same retinal orientation was not identical; the
parameters of stimulation from the different planes dif-
fered along several different dimensions as shown in
Table 1 and described in Section 2.3 below.
2 We use the term ‘‘retinal orientation’’ to designate the orientation
of the geometric image of the line in the spherical approximation to
the eye (see Fig. 2b and Fig. 3 and Eq. (1)) under the assumption that
the eye is erect, and that projection is through a pupil centered in the
midfrontal plane of the sphere. The angle specifying retinal orientation
on this spherical projection is the angle of intersection of the great
circle containing the image of the line with the circumference of the
midfrontal plane.
2.1. General
On each trial of each of the experiments, the mono-
cularly viewing subject (S), seated straddling a stool with
head stabilized by a chinrest, viewed a visual field consist-
ing of either a 1-line stimulus at a horizontal eccentricityof 25� to the left or to the right of the median plane of the
viewing eye, or a 2-line stimulus that consisted of the two
lines simultaneously presented at the two bilaterally sym-
metric locations (Fig. 2a). On each trial the S set the 4.9�-long x 6 0-wide test line to appear vertical; the test line was
located within a frontoparallel plane at 1 m from the S
and was centered in the median plane of the viewing
eye at eye level. Viewing was with the right eye; visionin the left eye was occluded by an eye patch.
In Expts. 1–3 the surfaces containing the inducing
stimulus were erect and frontoparallel 1 m in front of
the viewing eye; the roll-tilt of the inducing line was va-
ried by rotating the line around its center. In Expts. 1
and 3, the seven roll-tilts of each 1-line stimulus were
±13.2�, ±9.1�, or ±4.3�, or the erect condition (0�); in
Expt. 2 the roll-tilts were ±15�, ±10�, ±5�, and 0� (Table1). The experimenter�s settings of inducer orientation
were accurate within approximately 6 minarc. A nega-
tive (�) sign designates counterclockwise (ccw) roll-tilt
and a positive (+) sign designates clockwise (cw) roll-tilt.
In Expt. 1 nine inducing line lengths were examined; in
Expts. 2 and 3 the lines were 12� long (‘‘short lines’’) and
66.25� long (‘‘long lines’’), respectively.
In Expt. 4 the surfaces containing the inducing lineswere pitched around a horizontal axis in the frontoparal-
lel plane. When the surface containing a line was erect and
frontoparallel, the line was vertical, 66.25�-long, and cen-
tered at 25� horizontal eccentricity at eye level; the
pitched-from-vertical line retained its orientation relative
to the surface at all pitches. The seven pitches were ±30�,±20�, ±10�, or 0� (erect); a negative (�) sign designates
topbackward pitch and a positive (+) sign designatestopforward pitch. Each of the pitched-from-vertical ori-
entations employed in Expt. 4 produced a retinal orienta-
tion of the inducing line that was identical to one of those
produced by one of the roll-tilted lines in Expt. 3. Table 1
contains the correspondences between the roll-tilted and
pitched-from-vertical inducing lines on the right side of
the median plane in accord with the geometry of Figs. 2
and 3; the correspondences for the left lines are identicalexcept for the sign reversal between topforward and top-
backward pitched-from-vertical lines.
2.1.1. Stimulus display
Each inducing line consisted of a strip of phosphores-
cent tape that received a brief exposure (�2 min) to nor-
mal room illumination prior to each experimental run;
this was refreshed for approximately 30–60 s followingeach set of 4 VPV measurements. Each of the two strips
was 144 cm · 0.2 cm with a luminance of approximately

Roll-Tilted Inducing Lines,
Frontoparallel Plane
Pitched-from-Vertical Inducing Lines, Pitched Plane
Number of Lines
Line Length
Experiment Number
Inducing Line
Laterality
2-Line Combinations
Number of Inducing Line Orientations
or Orientation Combinations
1-Line 2-Line
LongShortVariable (3° -66.25°)
LongShort
2a1 3a 2b 3b 3c
Left Right Left Right
ParallelEqual -and-
Opposite
all all
2-Line1-Line
Long Long
4a 4b 4c
Left RightRight
ParallelEqual -and-
Oppositeall
(12°) (12°)(66.25°) (66.25°) (66.25°) (66.25°)
Both Both BothBoth Both
7 7 7 7 7 7 7 7 7 7 749 49 49
Fig. 1. The tree structure displays the main aspects of the inducing lines that provide the basis for organizing the nine original experiments into the
four sets as Expts. 1, 2, 3, and 4.
2040 W. Li, L. Matin / Vision Research 45 (2005) 2037–2057
0.01 mL (EG&G photometer/radiometer 550); each
strip was attached to a separate plastic bar mounted
on a separate modified, standalone, rotatable, and
height-adjustable blackboard (104 cm · 154 cm) byattachment with velcro at the top and bottom. Each
bar could be translated or roll-tilted in any direction
independently. The two strips were symmetrically placed
with respect to the midsagittal plane of the subject�sviewing eye at horizontal eccentricities of ±25�. As mea-
sured at the normal to the S�s eye from the erect black-
board each luminous strip subtended a 66.25� by 6
minarc visual angle at the viewing distance of 1 m. Whenshorter stimuli were required appropriate segments at
both ends of the line(s) were covered with light shields
(see Section 2.3 and Table 1 for more detail). There were
two reasons for the use of separate rotatable surfaces for
each of the two lines: (1) Expts. 4b and 4c required the
two lines to be set at different pitches simultaneously.
(2) The test line needed to remain erect within the
frontoparallel plane and centered regardless of the ori-entations of the inducing lines. The test line was
mounted on a third, separate freestanding erect surface
positioned between the two pitchable surfaces contain-
ing the inducing lines. The axis for rotation of the test
line in the frontoparallel plane was through the test
line�s center, and the S�s eye level was set on this axis
by adjustments of the stool/chinrest; the test line was
mounted at its center on the front surface of a machinedmetal protractor with a 16 1/8 in. radius with tic marks
separated by 0.25� on its rear surface; data for the con-
centric test line was recorded to the nearest 0.25�.
2.1.2. Procedure
The same general procedure was followed in all
four sets of experiments. A method of adjustment with
hunting was employed for setting the test line. A trialbegan with the S�s eyes closed, and following the
experimenter�s setting of the test line to an orientation
that was well out of the region of uncertainty for a
VPV setting, the S was instructed to open his/her eyes,
fixate the center of the test line, and report whether it
needed to be rotated to the left or right in order to
appear vertical; immediately after reporting the subject
closed his/her eyes, whereupon the experimenter resetthe test line by a variable amount and instructed the
S to reopen his/her eyes and report again. The se-
quence was repeated until the S indicated that the test
line was at VPV. Four such settings were made before
proceeding to another inducer orientation or, with the
2-line stimuli, another combination of inducer line ori-
entations. Two of each set of four trials began with
the test line�s initial orientation far ccw relative to truevertical, two began at a cw orientation far from
vertical; the four were sequenced in abba order. The
seven different orientations or orientation combina-
tions examined in a session were sequenced by an
independent random order in different sessions in each
experiment; different random orders were employed
for different Ss. In each session a series of four
trials was run in total darkness prior to the sevenmain conditions, and a second four-trial series in
total darkness was run following the seven main
conditions.

Table 1
The values for the main parameters and variables for the lines employed in Expts 2, 3, and 4
Roll-
tilt
Equivalent
pitch
Extent of
line segment
Elevation of
line�s endpoint
Eccentricity
of line
Viewing distance
(cm)
Elevation of
normal to line
Geometric widths of
line image (minarc)
Ratio of
geometric widths
of retinal image
Below
eye
level
Above
eye
level
Below
normal
to line
Above
normal
to line
Total Top of
line above
eye level
Bottom of
line below
eye level
At
top
At
bottom
At
normal
to line
At
eye
level
To
normal to
surface
To
eye
level
Relative to
eye level
To normal
to line
Top Bottom Top/
Normal
Bottom/
Normal
(a) Expt. 2: Roll-tilted-from-vertical 1-line (right side) stimulus
�15 5.90 6.03 �0.25 12.18 11.93 5.86 5.73 23.44 26.25 23.37 25 100 100 6.10 5.72 5.72 5.46 1.00 0.96
�10 5.94 6.03 1.82 10.15 11.96 5.95 5.86 23.91 25.79 24.27 25 100 100 4.16 5.68 5.67 5.50 1.00 0.97
�5 5.97 6.02 3.91 8.08 11.99 6.00 5.95 24.38 25.33 24.82 25 100 100 2.10 5.66 5.63 5.54 0.99 0.98
0 6.00 6.00 6.00 6.00 12.00 6.00 6.00 24.85 24.85 25.00 25 100 100 0.00 5.65 5.59 5.59 0.99 0.99
5 6.02 5.97 8.08 3.91 11.99 5.95 6.00 25.33 24.38 24.82 25 100 100 �2.10 5.66 5.54 5.63 0.98 0.99
10 6.03 5.94 10.15 1.82 11.96 5.86 5.95 25.79 23.91 24.27 25 100 100 �4.16 5.68 5.50 5.67 0.97 1.00
15 6.03 5.90 12.18 �0.25 11.93 5.73 5.86 26.25 23.44 23.37 25 100 100 �6.10 5.72 5.46 5.72 0.96 1.00
(b) Expt. 3: Roll-tilted-from-vertical 1-line (right side) stimulus
�13.2 �30 34.99 22.00 39.87 17.12 56.99 21.48 34.09 15.89 24.78 21.47 21.99 100 100 4.77 5.95 5.88 4.46 0.99 0.75
�9.1 �20 36.14 26.24 39.76 22.62 62.38 25.94 35.70 17.55 23.72 23.40 23.66 100 100 3.59 5.79 5.55 4.44 0.96 0.77
�4.3 �10 35.31 30.01 37.24 28.02 65.32 29.92 35.20 19.15 22.28 24.59 24.67 100 100 1.93 5.68 5.21 4.61 0.92 0.81
0 0 33.13 33.13 33.13 33.13 66.25 33.13 33.13 20.73 20.73 25.00 25.00 100 100 0.00 5.65 4.88 4.88 0.86 0.86
4.3 10 30.01 35.31 28.02 37.24 65.32 35.20 29.92 22.28 19.15 24.59 24.67 100 100 �1.93 5.68 4.61 5.21 0.81 0.92
9.1 20 26.24 36.14 22.62 39.76 62.38 35.70 25.94 23.72 17.55 23.40 23.66 100 100 �3.59 5.79 4.44 5.55 0.77 0.96
13.2 30 22.00 34.99 17.12 39.87 56.99 34.09 21.48 24.78 15.89 21.47 21.99 100 100 �4.77 5.95 4.46 5.88 0.75 0.99
(c) Expt. 4: Pitched-from-vertical 1-line (right side) stimulus
�13.2 �30 34.99 22.00 7.37 49.62 56.99 21.48 34.09 15.89 24.78 25 21.99 100 115.47 �26.95 5.65 3.88 5.61 0.69 0.99
�9.1 �20 36.14 26.24 17.88 44.49 62.38 25.94 35.70 17.55 23.72 25 23.66 100 106.42 �18.06 5.65 4.24 5.43 0.75 0.96
�4.3 �10 35.31 30.01 26.23 39.09 65.32 29.92 35.20 19.15 22.28 25 24.67 100 101.54 �9.05 5.65 4.57 5.17 0.81 0.93
0 0 33.13 33.13 33.13 33.13 66.25 33.13 33.13 20.73 20.73 25 25.00 100 100.00 0.00 5.65 4.88 4.88 0.86 0.86
4.3 10 30.01 35.31 39.09 26.23 65.32 35.20 29.92 22.28 19.15 25 24.67 100 101.54 9.05 5.65 5.17 4.57 0.93 0.81
9.1 20 26.24 36.14 44.49 17.88 62.38 35.70 25.94 23.72 17.55 25 23.66 100 106.42 18.06 5.65 5.43 4.24 0.96 0.75
13.2 30 22.00 34.99 49.62 7.37 56.99 34.09 21.48 24.78 15.89 25 21.99 100 115.47 26.95 5.65 5.61 3.88 0.99 0.69
(a) Expt. 2 with 12�-long roll-tilted stimuli on a frontoparallel plane; (b) Expt. 3 with 66.25�-long roll-tilted stimuli on a frontoparallel plane; (c) Expt. 4 with 66.25�-long pitched-from-vertical stimuli
on a pitched-only plane. Values for extent of line segment, elevation of line endpoint, line eccentricity, and elevation of normal relative to eye level are in degrees visual angles.
Notes: (a) The tabulated values are for the right line; for the left line, line eccentricity is negative (�). (b) The relation between pitch and roll reverses sign for the left line (i.e. for the left line, negative
(�) pitch values correspond to positive (+) roll-tilt values and vice-versa). (c) The table distinguishes between the normal to the line and the normal to the frontoparallel or pitched-only surface
containing the line. The normal to the surface lies in the median plane of the viewing eye.
W.Li,L.Matin/VisionResea
rch45(2005)2037–2057
2041

Left Roll-tiltedInducing Line
L. E R. E
Test LineSet toAppearVertical
Occluder
25o
Eye
A
A'
A"
B
B'
B"
Nodal Plane for A, A' and A"
Nodal Plane for B, B' and B"
(a) (b)
Right Roll-tiltedInducing Line
25o
Fig. 2. (a) A sketch of the spatial arrangement employed to measure the orientation of visually perceived vertical (VPV) as influenced by the roll-
tilted inducing lines in Expts. 1–3. The arrows adjacent to the inducing lines indicate that they were independently set by the experimenter to one of
the clockwise or counterclockwise orientations (Table 1), or was erect. For the conditions in which a 1-line stimulus was employed, the other line was
removed. The test line was centered in the median plane of the viewing (right) eye and was adjusted to appear vertical by means of the subject�sinstruction (VPV setting). In Expt. 4 each of seven orientations of the pitched-from-vertical line(s) (oriented as line A 0 or B0 in panel (b)) was
employed; the retinal orientation of each pitched-from-vertical line was identical to one of the orientations of the roll-tilted line in Expt. 3 (see Section
2 for further details). (b) Lines from three different planes in space that produce identical retinal orientations: A, A 0, and A00 lie in the same nodal
plane and stimulate the same retinal orientation; B, B 0, and B00 lie in the same nodal plane and stimulate the same retinal orientation. Lines A and B
lie in the frontoparallel plane and are located bilaterally symmetrically relative to the median plane of the viewing eye; they are also oriented
bilaterally symmetrically (i.e., roll-tilted at equal and opposite orientations—counter-roll-tilted). Lines A 0 and B 0 are pitched-from-vertical and
parallel as are A00 and B00.
2042 W. Li, L. Matin / Vision Research 45 (2005) 2037–2057
2.1.3. Subjects
Although several Ss were run in more than one exper-
iment, only WL (one of the authors) acted as a subject in
all of them. Each S provided complete data in all condi-
tions of any experiment in which s/he participated. Expt.
1 (Fig. 1) employed 3 Ss (2 males, 1 female; ages 19–22
years + WL); Expts. 2a and 2b employed 6 Ss (3 males, 3
females; ages 20–22 years + WL); Expts. 3a and 4a em-ployed 5 Ss (2 males, 3 females; ages 19–22 years + WL);
Expts. 3b and 4b employed 4 Ss (3 males, 1 female; ages
20–22 + both authors); Expts. 3c and 4c employed 6 Ss
(3 males, 3 females; ages 20–22 years + WL). With the
exception of the authors all Ss were Columbia under-
graduates who were paid an hourly wage for participat-
ing; recruitment and the experimental protocol met the
requirements of the human subject committee at Colum-bia University.
2.2. The four sets of experiments
Expt. 1: Variable length (3�—66.25�) roll-tilted induc-ing line from a frontoparallel plane:
1-line conditions: Expt. 1 measured VPV for each of
the seven line orientations at each of nine lengths ofthe right roll-tilted inducing line: 3�, 6�, 9�, 12�, 18�,24�, 32�, 48�, and 66.25�, with each length run in a dif-
ferent randomized order in a separate session.
Expt. 2: Short (12�-long) roll-tilted inducing linesfrom a frontoparallel plane:
Expt. 2a (1-line conditions): The roll-tilted 1-line
inducing stimulus was presented on the left side (one ses-
sion) or right side (separate randomly ordered session)
of the median plane.
Expt. 2b (2-line conditions: 49 orientation combina-
tions): Each of the 49 conditions involved one of the
seven roll-tilted orientations of the short left line in
combination with one of the seven roll-tilted orienta-
tions of the short right line. In a session only one left line
roll-tilt was employed along with all seven roll-tilts ofthe right line. The order of left line roll-tilt was random-
ized separately among sessions for each S. The entire
experiment occupied seven sessions for each S.
Expt. 3: Long (66.25�-long) roll-tilted inducing linesfrom a frontoparallel plane:
Expt. 3a (1-line conditions): The roll-tilted 1-line
inducing stimulus was presented on the left side (one ses-
sion) or right side (separate randomly ordered session)of the median plane.
Expt. 3b (2-line conditions: parallel or equal-and-
opposite line pairs): The seven orientations of a parallel,
2-line stimulus was run in one session; the seven combi-
nations of equal-and-opposite orientation line pairs
were run in a separate session.
Expt. 3c (2-line conditions: 49 orientation combina-
tions): Each of the 49 conditions involved one of the se-ven roll-tilted orientations of the long left line in
combination with one of the seven roll-tilted orienta-
tions of the long right line. Each of the seven conditions
in a given session involved the same left line orientation
along with a different 1 of the seven right line orienta-
tions. Each S was run in seven sessions, with a different
left line in each session.
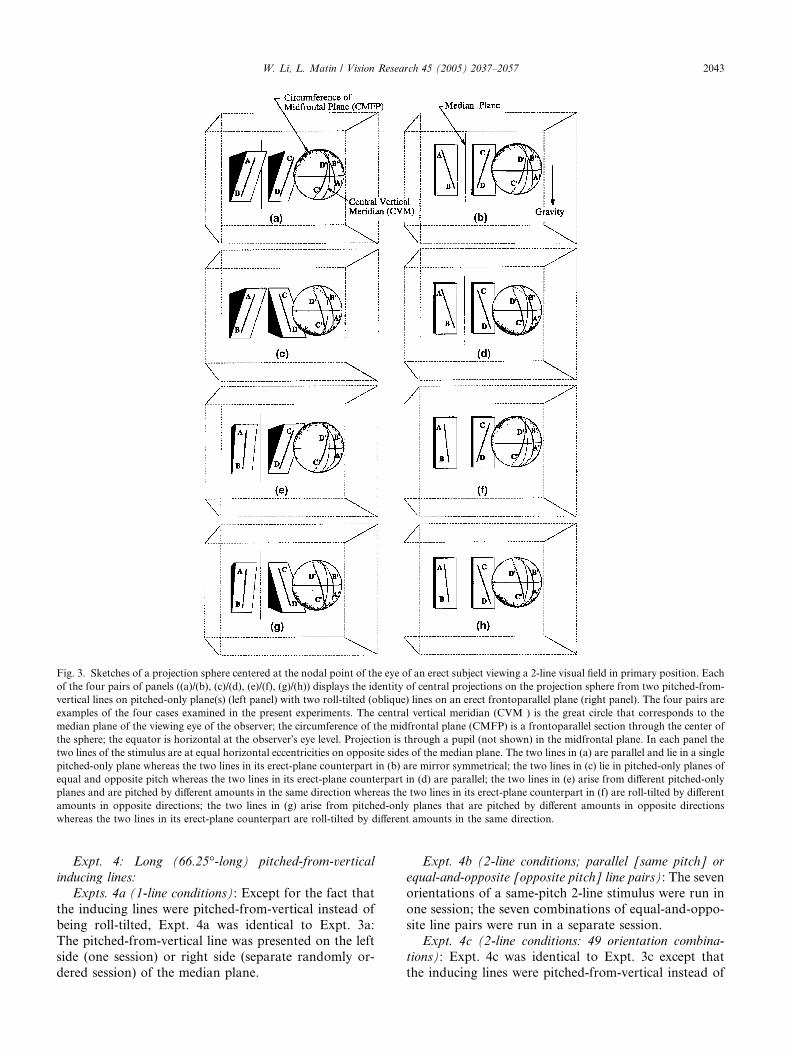
Fig. 3. Sketches of a projection sphere centered at the nodal point of the eye of an erect subject viewing a 2-line visual field in primary position. Each
of the four pairs of panels ((a)/(b), (c)/(d), (e)/(f), (g)/(h)) displays the identity of central projections on the projection sphere from two pitched-from-
vertical lines on pitched-only plane(s) (left panel) with two roll-tilted (oblique) lines on an erect frontoparallel plane (right panel). The four pairs are
examples of the four cases examined in the present experiments. The central vertical meridian (CVM ) is the great circle that corresponds to the
median plane of the viewing eye of the observer; the circumference of the midfrontal plane (CMFP) is a frontoparallel section through the center of
the sphere; the equator is horizontal at the observer�s eye level. Projection is through a pupil (not shown) in the midfrontal plane. In each panel the
two lines of the stimulus are at equal horizontal eccentricities on opposite sides of the median plane. The two lines in (a) are parallel and lie in a single
pitched-only plane whereas the two lines in its erect-plane counterpart in (b) are mirror symmetrical; the two lines in (c) lie in pitched-only planes of
equal and opposite pitch whereas the two lines in its erect-plane counterpart in (d) are parallel; the two lines in (e) arise from different pitched-only
planes and are pitched by different amounts in the same direction whereas the two lines in its erect-plane counterpart in (f) are roll-tilted by different
amounts in opposite directions; the two lines in (g) arise from pitched-only planes that are pitched by different amounts in opposite directions
whereas the two lines in its erect-plane counterpart are roll-tilted by different amounts in the same direction.
W. Li, L. Matin / Vision Research 45 (2005) 2037–2057 2043
Expt. 4: Long (66.25�-long) pitched-from-vertical
inducing lines:
Expts. 4a (1-line conditions): Except for the fact that
the inducing lines were pitched-from-vertical instead of
being roll-tilted, Expt. 4a was identical to Expt. 3a:
The pitched-from-vertical line was presented on the leftside (one session) or right side (separate randomly or-
dered session) of the median plane.
Expt. 4b (2-line conditions; parallel [same pitch] or
equal-and-opposite [opposite pitch] line pairs): The seven
orientations of a same-pitch 2-line stimulus were run in
one session; the seven combinations of equal-and-oppo-
site line pairs were run in a separate session.
Expt. 4c (2-line conditions: 49 orientation combina-
tions): Expt. 4c was identical to Expt. 3c except that
the inducing lines were pitched-from-vertical instead of

2044 W. Li, L. Matin / Vision Research 45 (2005) 2037–2057
being roll-tilted. Each of the 49 conditions involved one
of the seven pitched-from-vertical orientations of the
long left line in combination with one of the seven
pitched-from-vertical orientations of the long right line.
Seven conditions were run in a given session with only
one right line pitch in combination with all seven left linepitches; the entire experiment thus took seven sessions
with a different left line in each session.
2.3. Relations between roll-tilted lines on frontoparallel
planes and pitched-from-vertical lines on pitched-only
planes and some second-order adjustments
Seven roll-tilts in the frontoparallel plane employedin Expt. 3 were originally chosen so that the orientation
and location of the image of each line matched the cal-
culated projected orientation of the pitched-from-verti-
cal line for one of the pitches to be utilized in Expt. 4
(see Figs. 2 and 3 and Table 1). Eq. (1) is the transform
between the visual pitch, h, of a plane that contains a
pitched-from-vertical line at a horizontal eccentricity,
l, and the roll-tilt, q, of a line within a frontoparallelplane that possesses the equivalent roll-tilt (same retinal
orientation; see footnote 2) to that of the pitched-from-
vertical line for the case in which the plane is pitched-
only and the normal to the plane lies at a fixed distance
from the eye (see Appendix in Li & Matin, 1996 for der-
ivation and details):
q ¼ arctanðtan l � sin hÞ: ð1ÞSimply transforming the physical orientation of a
pitched-from-vertical line on a pitched-only plane to a
roll-tilted line on a frontoparallel plane so that the reti-
nal orientation of the line and viewing distance to the
surface would remain constant introduces six differences
between the retinal stimulus of the line in the two differ-
ent physical planes: (1) Whereas the normal line of vi-sual direction to the pitched-from-vertical line from
the viewing eye declines with increasing topbackward
pitch or with decreasing topforward pitch, it rises with
equivalent-pitch changes in obliqueness of the roll-tilted
lines on the erect frontoparallel plane that correspond to
these real-pitch changes. Since the normal line of visual
direction to a line stimulus intersects the line at a dis-
tance from the eye that is shortest for any point onthe line, the gradient of geometric width of the retinal
image of the line is broadest at this intersection with
the normal; and since the normal undergoes oppositely
directed changes in elevation with real pitch as com-
pared to the corresponding equivalent pitch, so too do
the centers of these width gradients and thus the entire
gradients (Table 1). (2) As a consequence of these oppo-
sitely directed variations in the width gradients, the gra-dients of luminous flux in the roll-tilted and the
equivalent roll-tilted lines also change in opposite direc-
tions with change in roll-tilt than they do with equiva-
lent roll-tilt. (3) The individual pitched-from-vertical
line possesses different depth gradients for different
pitches; these are larger than the comparable depth gra-
dients for the roll-tilted lines in the erect plane which
stimulate identical retinal orientations to those stimu-
lated by the pitched-from-vertical lines (Table 1), pro-ducing different stimuli to accommodation. (4) There
are small differences in line length. (5) There are small
differences in height-in-the-field of the lines. (6) There
are small differences in line eccentricity. We did not at-
tempt to modify the differences in (1)–(3); thus, the prox-
imal stimulation from the roll-tilted lines and lines of
equivalent roll-tilt was not completely equated. How-
ever, by adjustment of the oblique-line stimulus, wedid eliminate the three other differences ((4)–(6)), that
could have influenced the comparison; this involved
small height changes of the physical line stimuli and
appropriate covering of their ends to equalize projected
length in comparable conditions of Expts. 3 and 4. Fol-
lowing the adjustment of height-in-the-field and length
of an oblique line, in Expt. 3 the line was horizontally
translated by the small amount required to set the eccen-tricity at true eye level to the same value as for the com-
parable condition for the pitched-from-vertical line (see
Table 1).
3. Results
The mean value of the settings from the four succes-sive trials for each S in a condition will be treated below
as the VPV for the condition for that S. In describing the
results for each condition, the slope of the VPV-vs-roll-
tilt function or VPV-vs-equivalent-roll-tilt function will
be treated as the main measure of interest. Each slope
makes use of VPV values from seven line orientations
for each S and provides the single most reliable bias-free
measure of sensitivity of the VPV response to the visualinducer, and thus also the most sensitive basis for
comparison.
Fig. 4 displays the growth of sensitivity with length of
the single inducing line from Expt. 1; the growth is well-
fit by the negatively accelerated exponential function
with a length constant of 17.1� and an asymptote at
0.55; fits for each of the 3 Ss is similar to the average
curve shown, but possess different asymptotes, 0.39,0.63, and 0.68, leading to the large statndard error of
the means (SEMs) for the averages with the longer lines.
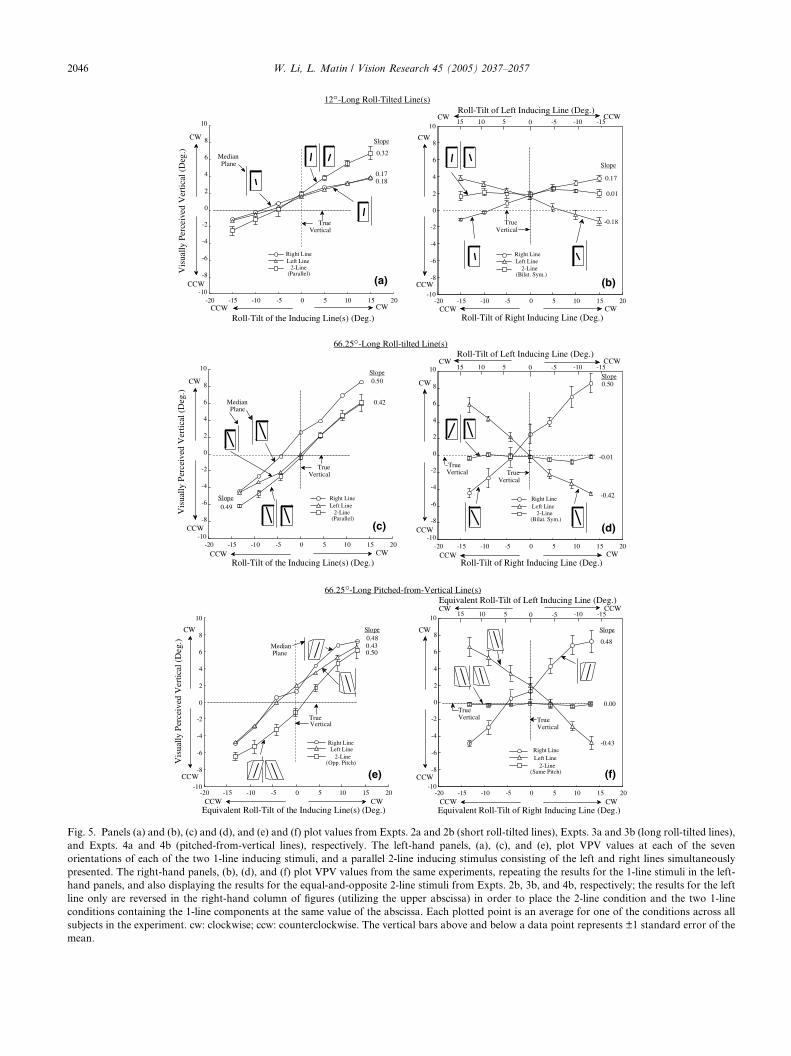
The average results from Expts. 2, 3, and 4 compar-
ing the 1-line and parallel-only 2-line stimuli for the
short roll-tilted line, the long roll-tilted line, and the long
pitched-from-vertical line (equivalent roll-tilt) are dis-
played in Fig. 5a, c, and e respectively (see Fig. 3d and
c). The difference in slopes between each of the short1-line results, 0.18 and 0.17, for the left and right lines,

3 In Expts. 2b and 3c, the orientation of the left line was fixed
throughout a session and varied between sessions whereas the
orientation of the right line was varied within each session (the
�variable�); in Expt. 4c, the right line was fixed throughout a session
and the orientation of the left line was varied within a session (see
Method). In Fig. 6, however, the orientation of the right line is plotted
on the abscissa and the orientation of the left line is shown as the
parameter of the set of functions in each of the three experiments. The
analogous graphs with the roles of parameter and variable inter-
changed (not shown) are essentially indistinguishable in each case,
indicating that the results did not depend on whether the different
orientation combinations into which a given line entered was run in a
single session or spread across sessions.
Fig. 4. The curve is the best fitting exponential (least squares) to the
average slopes of the VPV-vs-roll-tilt functions from Expt. 1. At each
of the nine line lengths the seven roll-tilts employed were ±13.1�, ±9.2�,±4.3�, or 0�. The vertical bars above and below a data point represents
±1 standard error of the mean.
W. Li, L. Matin / Vision Research 45 (2005) 2037–2057 2045
respectively, and the short parallel-only 2-line slope,
0.32, is significant (p < .01, 5 df), but the difference be-
tween the sum of the two 1-line slopes, 0.35, and the2-line slope is not significant; thus, these short-line re-
sults approximate complete linearly additive summa-
tion. The slope values for the long real and equivalent
roll-tilted 1-line inducers in Fig. 5c and e, respectively,
are similar, with 0.42 and 0.50 for real roll-tilt and
0.43 and 0.48 for equivalent roll-tilt (t = 0.536,
p > 0.61 for the left line conditions; t = 0.368, p > 0.72
for the right line conditions). Neither long-1-line slopediffered significantly from the corresponding 2-line slope
which equaled 0.49 and 0.50 in the two long-line cases;
thus, the 2-line slope in each long-line case closely
approximates the average of the corresponding 1-line
slopes.
The seven 2-line inducers for which the 2 paired mem-
bers have equal and opposite roll-tilt orientations and
the corresponding pitched-from-vertical pairs (e.g.,Fig. 3b and a) are of additional interest. The average re-
sults for these 2-line functions are displayed in Fig. 5b
for the short-lines (Expt. 2b), in Fig. 5d for the long
roll-tilted lines (Expt. 3b), and in Fig. 5f for the
pitched-from-vertical case (Expt. 4b); the VPV-vs-roll-
tilt (or equivalent roll-tilt) slope in all three cases are flat
with best-fitting slopes of 0.01, �0.01, and 0.00, respec-
tively, indicating that the influences of the inducing linesis algebraically additive.
The forty nine-condition results of Expts. 2b, 3c, and
4c are displayed in Fig. 6a, c, and e, respectively, show-
ing that for short and long roll-tilted lines and for
pitched-from-vertical lines, when the orientation of
one of the two simultaneously presented lines is con-
stant, VPV changes linearly with the orientation of the
other line.3 In each case, for a more clockwise orienta-
tion of the first (parameterized) roll-tilted or equivalent
roll-tilted line, the entire linear function is shifted to
more clockwise VPV values, but the slope of the func-
tion does not change. Both of these aspects—the essen-tial constancy of the slope and the linear shift of the
function (change in the y intercept) with roll-tilt or
equivalent roll-tilt of the parameterized line—are clear
in Fig. 7a and b, respectively. The slopes of the short-
line results in Fig. 6a range from 0.15 to 0.18. The slopes
of the long roll-tilted and pitched-from-vertical lines are
extremely similar to each other with slope values that
range from of 0.30 to 0.34 for the pitched-from-verticalcase and from 0.30 to 0.33 for the roll-tilted case; the
y-intercept varied from �2.4� to 5.3� for the pitched-
from-vertical case and �2.9� to 4.8� for the roll-tilted
case, respectively. The magnitude of the slopes in Fig.
7a indicate the variation in magnitude of the influence
of the orientation of a second line (e.g., the right line)
on VPV when another equally long line of a single ori-
entation is present simultaneously (e.g., the left line).The existence of smaller slopes for the short roll-tilted
lines in Fig. 6a than those of the long real and equivalent
roll-tilted lines are an indication of the lessened influence
of the variation of the orientation of the second short
line, and goes along with the smaller difference in y-
intercept among the short-line functions than among
the long-line functions (Fig. 7b), a result that also indi-
cates the lessened influence of the variation of theparameterized short line as compared to the influence
of the parameterized long line. Although Expts. 3c and
4c provided considerable opportunity for differences be-
tween the long roll-tilted and pitched-from-vertical
(equivalent roll-tilt) line stimuli to be revealed with re-
gard to their ability for inducing changes in VPV, none
have appeared. The two sets of results as displayed
above in Figs. 6 and 7 appear essentially indistinguish-able in every way. A closer look at the consistency of
individual Ss across the two experiments is afforded by
Fig. 8a. The marked (and statistically significant;
p < .0001, 292 df) correlation across the two
15
66.25 -Long Pitched-from-Vertical Line(s)
66.25 -Long Roll-tilted Line(s)
20151050-5-10-15-20-10
-8
-6
-4
-2
0
2
4
6
8
10
CW
CCW
CCW CW
Right LineLeft Line
2-Line(Same Pitch)
Slope
-0.43
0.48
0.00
CW CCWEquivalent Roll-Tilt of Left Inducing Line (Deg.)
TrueVertical True
Vertical
(f)
20151050-5-10-15-20-10
-8
-6
-4
-2
0
2
4
6
8
10
Vis
ually
Per
ceiv
edV
ertic
al(D
eg.)
CW
CCW
CCW CW
Right LineLeft Line
2-Line(Opp. Pitch)
Slope
0.430.48
0.50
o
TrueVertical
(e)
MedianPlane
20151050-5-10-15-20-10
-8
-6
-4
-2
0
2
4
6
8
10
CW
CCW
CCW CW
Right LineLeft Line
2-Line(Bilat. Sym.)
Slope
-0.18
0.17
0.01
CW CCW
12 -Long Roll-Tilted Line(s)Roll-Tilt of Left Inducing Line (Deg.)
Roll-Tilt of Right Inducing Line (Deg.)
(b)
TrueVertical
20151050-5-10-15-20-10
-8
-6
-4
-2
0
2
4
6
8
10
Vis
ually
Perc
eive
dV
ertic
al(D
eg.)
CW
CCW
CCW CW
Right LineLeft Line
2-Line(Parallel)
Slope
0.18
0.32
0.17
Roll-Tilt of the Inducing Line(s) (Deg.)
(a)
o
TrueVertical
MedianPlane
20151050-5-10-15-20-10
-8
-6
-4
-2
0
2
4
6
8
10
CW
CCW
CCW CW
Right LineLeft Line
2-Line(Bilat. Sym.)
Slope
-0.42
0.50
-0.01
CW CCWRoll-Tilt of Left Inducing Line (Deg.)
Roll-Tilt of Right Inducing Line (Deg.)
(d)
TrueVertical
TrueVertical
-10
-8
-6
-4
-2
0
2
4
6
8
10
20151050-5-10-15-20
CW
CCW
CCW CW
Right LineLeft Line
2-Line(Parallel)
Slope
0.49
0.50
0.42
Roll-Tilt of the Inducing Line(s) (Deg.)
(c)
o
TrueVertical
Slope
Vis
ually
Per
ceiv
edV
ertic
al(D
eg.)
MedianPlane
15 10 5 0 -5 -10 -15
15 10 5 0 -5 -10 -15
10 5 0 -5 -10 -15
Fig. 5. Panels (a) and (b), (c) and (d), and (e) and (f) plot values from Expts. 2a and 2b (short roll-tilted lines), Expts. 3a and 3b (long roll-tilted lines),
and Expts. 4a and 4b (pitched-from-vertical lines), respectively. The left-hand panels, (a), (c), and (e), plot VPV values at each of the seven
orientations of each of the two 1-line inducing stimuli, and a parallel 2-line inducing stimulus consisting of the left and right lines simultaneously
presented. The right-hand panels, (b), (d), and (f) plot VPV values from the same experiments, repeating the results for the 1-line stimuli in the left-
hand panels, and also displaying the results for the equal-and-opposite 2-line stimuli from Expts. 2b, 3b, and 4b, respectively; the results for the left
line only are reversed in the right-hand column of figures (utilizing the upper abscissa) in order to place the 2-line condition and the two 1-line
conditions containing the 1-line components at the same value of the abscissa. Each plotted point is an average for one of the conditions across all
subjects in the experiment. cw: clockwise; ccw: counterclockwise. The vertical bars above and below a data point represents ±1 standard error of the
mean.
2046 W. Li, L. Matin / Vision Research 45 (2005) 2037–2057

-10
-8
-6
-4
-2
0
2
4
6
8
10
4032241680-8-16-24-32-40-10
-8
-6
-4
-2
0
2
4
6
8
10
y = 2.02 + 0.16x(r = 0.99)
Vis
ually
Per
ceiv
ed V
ertic
al (
Deg
.)
CW
CCW
True Vertical
-10
-8
-6
-4
-2
0
2
4
6
8
10
20151050-5-10-15-20
-13.2-9.1-4.304.39.113.2
Equivalent Roll-Tilt of Right Inducing Line (Deg.)
Vis
ually
Per
ceiv
ed V
ertic
al (
Deg
.)
CW
CCW
CCW CW
Avg. of 6 Subj.
Equiv. Roll-Tilt ofLeft Inducing Line
(Deg.)
66.25 -Long Pitched-From-Vertical 2-Line Inducero
-10
-8
-6
-4
-2
0
2
4
6
8
10
20151050-5-10-15-20
13.29.14.30-4.3-9.1-13.2
Vis
ually
Per
ceiv
ed V
ertic
al (
Deg
.)
CW
CCW
Avg. of 6 Subj.
Roll-Tilt ofLeft Inducing Line
(Deg.)
66.25 -Long Roll-Tilted (Oblique) 2-Line Inducer
-10
-8
-6
-4
-2
0
2
4
6
8
10
20151050-5-10-15-20
151050
-5-10-15
Vis
ually
Per
ceiv
ed V
ertic
al (
Deg
.)
CW
CCW
Avg. of 6 Subj.
Roll-Tilt ofLeft Inducing Line
(Deg.)
CCW CWRoll-Tilt of Right Inducing Line (Deg.)
(a) (b)
(c) (d)
(e) (f)
12 -Long Roll-Tilted (Oblique) 2-Line Inducero
o
Avg. of 6 Subj.
y = 0.85 + 0.31x(r = 0.996)
Sum of Roll-Tilts of 2 Lines (Deg.)CCW CW
Vis
ually
Per
ceiv
ed V
ertic
al (
Deg
.)
CW
CCW
True Vertical
4032241680-8-16-24-32-40-10
-8
-6
-4
-2
0
2
4
6
8
10
y = 1.46 + 0.31x(r = 0.995)
Sum of Equivalent Roll-Tilts of 2 Lines (Deg.)CCW CW
Vis
ually
Per
ceiv
ed V
ertic
al (
Deg
.)
CW
CCW
TrueVertical
Avg. of 6 Subj.
Avg. of 6 Subj.
4032241680-8-16-24-32-40
Fig. 6. The solid, upward-sloping lines connecting the data points in the left-hand panels, (a), (c), and (e), display the average values of visually
perceived vertical (VPV) for the six subjects in each of the three 49-condition 2-line experiments: Expt. 2b with the roll-tilted short lines (12�-long),
Expt. 3c with the roll-tilted long lines (66.25�-long), and Expt. 4c with the pitched-from-vertical (equivalent roll-tilt) long lines (66.25�-long). Each
VPV value is plotted with the roll-tilt (or equivalent roll-tilt) of the right line on the abscissa and the roll-tilt (in (e) the equivalent roll-tilt) of the left
line as the parameter as displayed by the symbol in the legend on the figure. The solid dark line in each panel connects the set of seven points for the
conditions in which the roll-tilts (or equivalent roll-tilts) of the two simultaneously viewed lines are parallel (see Fig. 3c and d). In (a) the light dotted
lines connect points for which the sum of the two roll-tilts are identical for all connected points; in (c) and (e) they connect points for which deviations
from identity of the sums of roll-tilts or equivalent roll-tilts are small (see footnote 4). In the right-hand panels (b) and (d) the average VPV for each
of the 49 2-line condition experiments is plotted against the sum of the roll-tilts of the two lines of the stimulus in Expts. 2b and 3c, respectively, and
in panel (f) the average VPV is plotted against the sum of the equivalent roll-tilts of Expt. 4c. Standard error of the means (SEMs) are not displayed in
the figure since doing so would make for much too crowded a set of figures; we summarize their values: The average SEMs are 0.43, 0.61, and 0.69 for
all conditions in Expts. 2b, 3c, and 4c, respectively; the ranges of the SEMs are 0.27–0.54, 0.25–1.03, and 0.17–0.93 for all conditions in Expts. 2b, 3c,
and 4c, respectively.
W. Li, L. Matin / Vision Research 45 (2005) 2037–2057 2047
experiments, +0.95, is, of course, a consequence of the
third variable, roll-tilt/equivalent roll-tilt. However, the
average correlation between the VPVs in the two
experiments for a given one of the 49 combinations of
roll-tilt/equivalent roll-tilt, +0.67 (essentially a partial
correlation), is itself substantial—and is completely free
of any influence of the roll-tilt/equivalent roll-tilt vari-
able; this indicates a great deal of consistency in the
Long
20151050-5-10-15-200
0.1
0.2
0.3
0.4
(a)
Short
Line Length
Real
Equiv.Roll-Tilt
Roll-Tilt (or Equivalent Roll-Tilt) of Parameterized Line (Deg.)
Slo
pe o
f V
PV-v
s-R
oll-
Tilt
(or
Equ
ival
ent R
oll-
Tilt
) Fu
nctio
n (D
eg.) Avg. of 6 Subj.
-4
4
y-i
nter
cept
of
VPV
-vs-
Rol
l-T
ilt
Avg. of 6 Subj.
-3
-2
-1
0
1
2
3
5
6
20151050-5-10-15-20
(b)
(or
Equ
ival
ent R
oll-
Tilt
) F
unct
ion
(Deg
.) CW
CCW
Roll-Tilt (or Equivalent Roll-Tilt) of Parameterized Line (Deg.)
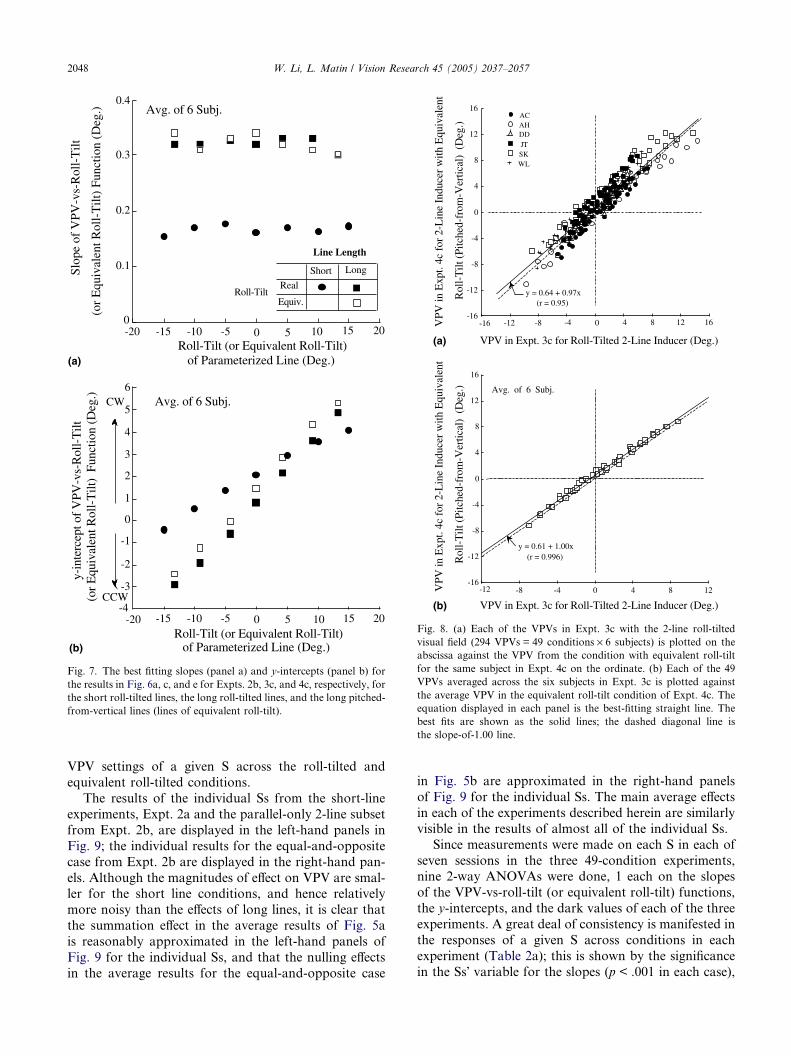
Fig. 7. The best fitting slopes (panel a) and y-intercepts (panel b) for
the results in Fig. 6a, c, and e for Expts. 2b, 3c, and 4c, respectively, for
the short roll-tilted lines, the long roll-tilted lines, and the long pitched-
from-vertical lines (lines of equivalent roll-tilt).
1612840-4-8-12-16-16
-12
-8
-4
0
4
8
12
16
AH
SK
DD
WL
AC
JT
VPV
in E
xpt.
4c f
or 2
-Lin
e In
duce
r w
ith E
quiv
alen
t
Rol
l-T
ilt (
Pitc
hed-
from
-Ver
tical
) (
Deg
.)
VPV in Expt. 3c for Roll-Tilted 2-Line Inducer (Deg.)
y = 0.64 + 0.97x (r = 0.95)
(a)
(b)
12840-4-8-12-16
-12
-8
-4
0
4
8
12
16
VPV in Expt. 3c for Roll-Tilted 2-Line Inducer (Deg.)
VPV
in E
xpt.
4c f
or 2
-Lin
e In
duce
r w
ith E
quiv
alen
t
Rol
l-T
ilt (
Pitc
hed-
from
-Ver
tical
) (
Deg
.)
y = 0.61 + 1.00x(r = 0.996)
Avg. of 6 Subj.
Fig. 8. (a) Each of the VPVs in Expt. 3c with the 2-line roll-tilted
visual field (294 VPVs = 49 conditions · 6 subjects) is plotted on the
abscissa against the VPV from the condition with equivalent roll-tilt
for the same subject in Expt. 4c on the ordinate. (b) Each of the 49
VPVs averaged across the six subjects in Expt. 3c is plotted against
the average VPV in the equivalent roll-tilt condition of Expt. 4c. The
equation displayed in each panel is the best-fitting straight line. The
best fits are shown as the solid lines; the dashed diagonal line is
the slope-of-1.00 line.
2048 W. Li, L. Matin / Vision Research 45 (2005) 2037–2057
VPV settings of a given S across the roll-tilted and
equivalent roll-tilted conditions.
The results of the individual Ss from the short-line
experiments, Expt. 2a and the parallel-only 2-line subset
from Expt. 2b, are displayed in the left-hand panels in
Fig. 9; the individual results for the equal-and-opposite
case from Expt. 2b are displayed in the right-hand pan-
els. Although the magnitudes of effect on VPV are smal-ler for the short line conditions, and hence relatively
more noisy than the effects of long lines, it is clear that
the summation effect in the average results of Fig. 5a
is reasonably approximated in the left-hand panels of
Fig. 9 for the individual Ss, and that the nulling effects
in the average results for the equal-and-opposite case
in Fig. 5b are approximated in the right-hand panels
of Fig. 9 for the individual Ss. The main average effects
in each of the experiments described herein are similarly
visible in the results of almost all of the individual Ss.
Since measurements were made on each S in each of
seven sessions in the three 49-condition experiments,nine 2-way ANOVAs were done, 1 each on the slopes
of the VPV-vs-roll-tilt (or equivalent roll-tilt) functions,
the y-intercepts, and the dark values of each of the three
experiments. A great deal of consistency is manifested in
the responses of a given S across conditions in each
experiment (Table 2a); this is shown by the significance
in the Ss� variable for the slopes (p < .001 in each case),

Vis
ually
Perc
eive
dV
ertic
al(D
eg.)
-10
-8
-6
-4
-2
0
2
4
6
8
10CW
CCW
Right LineLeft Line2-Line
(Parallel) (a)
VerticalTrue
Subj.: AC Subj.: AC
-10
-8
-6
-4
-2
0
2
4
6
8
10
CW
CCW
Right LineLeft Line
2-Line(Bilat. Sym.)
15 10 5 0 -5 -10 -15CW CCW
Roll-Tilt of Left Inducing Line (Deg.)
(b)
TrueVertical
-4
-2
0
2
4
6
8CW
CCW (c)
Subj.: AS
-6
-4
-2
0
2
4
6CW
CCW (e)
Subj.: EB
-2
0
2
4
6CW
CCW(g)
Subj.: RD
-4
-2
0
2
4
6
CW
CCW (i)
Subj.: RU
20151050-5-10-15-20-8
-6
-4
-2
0
2
4
6
8
10
12CW
CCW
CCW CW
Roll-Tilt of the Inducing Line(s) (Deg.)
(k)
Subj.: WL
-4
-2
0
2
4
6
8CW
CCW (d)
Subj.: AS
20151050-5-10-15-20-8
-6
-4
-2
0
2
4
6
8
10
12CW
CCW
CCW CW
Roll-Tilt of Right Inducing Line (Deg.)
(l)
Subj.: WL
-6
-4
-2
0
2
4
6CW
CCW (f)
Subj.: EB
-2
0
2
4
6CW
CCW (h)
Subj.: RD
-4
-2
0
2
4
6
CW
CCW (j)
Subj.: RU
Fig. 9. These are the short-line (12�-long line) results for each of the 6
individual subjects displayed in the form shown in the display of the
average results in Fig. 5a and b. Each panel in the left-hand column
displays the results for one of the six subjects for the 1-line conditions
in Expt. 2a and the 2-line subset for which the 2 roll-tilted lines were
parallel in Expt. 2b; the adjacent panel in the right-hand column
displays the results for the same subject for the conditions from Expt.
2b in which the 2-line inducers were bilaterally symmetric (equal-and-
opposite roll-tilt orientations) along with a replot of the 1-line
conditions from Expt. 2a; the results in the right-hand panels for the
left line only are reversed (upper abscissa) in order to place the 2-line
condition and the two 1-line conditions containing the 1-line compo-
nents at the same value of the abscissa.
W. Li, L. Matin / Vision Research 45 (2005) 2037–2057 2049
the y-intercepts (p < .001 for Expts. 2b and 4c; p < .03
for Expt. 3c), and the dark values (p < .001 in each case).
Kendall�s coefficient of concordance (W) (Kendall,
1955) confirmed these outcomes regarding subject con-
sistency. Similar less complete statistics done on several
of the other experiments demonstrated similar consis-tency. The failure at significance for the parameter dif-
ferences for the slopes and dark values (Table 2a)
show that order of stimulus presentation within and
across sessions was unimportant for these measures;
the significant F values for the y-intercepts show the sig-
nificant influence of the orientation of the line of con-
stant orientation within a session (Fig. 6a,c,e, and Fig.
7b).Summary statistics for the standard deviations (SDs),
y-intercepts, and dark values, are shown in Table 2b.
The average SD across Ss in all conditions was 0.98�;the average y-intercept across conditions in all experi-
ments was 1.15�; the average dark VPV across Ss in
all conditions was 0.79�. Since the settings of VPV are
highly dependent on signals regarding the direction
and magnitude of the gravitoinertial vector, one mightexpect a close connection between the dark VPV and
the y-intercept of the VPV-vs-roll-tilt function, and in
fact, such a relation does exist in several of the cases
for which a reasonable determination could be made.
Thus, in two of the long 1-line experiments, Expt. 3a
(left and right lines combined) and Expt. 4a (left and
right lines combined), the best-fitting straight line to
the y-intercept-vs-dark value functions (each subject isa single point) had slopes of 0.92 and 1.66 with correla-
tions of +0.72 and +0.82, significant at the 0.002 and
0.0003 levels, respectively. However, although the
relations were positive, in neither of the corresponding
2-line cases, 3b or 4b, was the dark value/y-intercept cor-
relation significant; nor was the relation significant in
Expt. 2 for the short 2-line case.
4. Discussion
Witkin and Asch reduced the visual frame of refer-
ence for the perception of verticality in the fully struc-
tured, well-illuminated visual field to the square frame
from the frontoparallel plane in darkness. The present
experiments have carried the experimental reductiontwo steps further. They have shown that not only is
the full square frame not necessary in order to generate
substantial, systematic influences on VPV, but also that
a single, peripherally presented stationary line, whose
variation in orientation is sufficient to generate a varia-
tion in VPV of about the same magnitude as that gener-
ated by the full square frame, need not even come from
the frontoparallel plane; a line from a pitched-only planesuffices. The results in Figs. 4–6 also indicate that not
only is the frame-as-an-entity not an aspect of an

4 Deviations from identity of the roll-tilt (or equivalent roll-tilt) sums
of connected points in Fig. 6c and e are small, the largest being equal
to 0.6� (between 8.6� and 9.2�); these variations result from the fact
that the spacing between the orientations of individual lines was not
uniform; consequently, the sums of the roll-tilts in the two long-line
experiments (Expts. 3c and 4c) were not always identical (e.g.,
4.6� + 4.6� is not identical to 13.2� � 4.6�). All connected points in
Fig. 6a, however, are for data for which the sums of the roll-tilts for all
connected points are identical.
Table 2
Results of ANOVAs on the slopes of the VPV-vs-roll-tilt (or equivalent roll-tilt) functions, the y-intercepts, and the dark values of the Expts. 2b, 3c,
and 4c (upper portion); the standard deviation of VPV, the y-intercepts, and the dark VPV of the Experiments 1–4 (all values are in degrees) (lower
portion)
Expt. Measure ANOVA Kendall�s coefficient of
concordance
Subj. Diff. Param. Diff.
F df Sig. level F df Sig. level W df Sig. level
2b Slope 8.72 5 0.001 0.27 6 0.95 0.48 6 0.01
y-Intercept 9.96 5 0.001 35.75 6 0.001 0.61 6 0.01
Dark value 16.30 5 0.001 0.96 6 0.47 0.76 6 0.01
3c Slope 44.86 5 0.001 0.77 6 0.60 0.96 6 0.01
y-Intercept 2.96 5 0.03 33.78 6 0.001 0.37 6 0.05
Dark value 40.36 5 0.001 0.42 6 0.86 0.76 6 0.01
4c Slope 20.03 5 0.001 0.83 6 0.56 0.61 6 0.01
y-inter. 10.93 5 0.001 49.40 6 0.001 0.62 6 0.01
Dark value 51.44 5 0.001 0.84 6 0.55 0.91 6 0.01
Expt. Standard deviations y-Intercepts Dark VPVs
Avg. Range Avg. Range Avg. Range
1 1.09 0.90–1.26 1.31 �0.05–2.34 0.77 0.24–1.66
2 0.94 0.91–0.95 1.85 0.50–3.08 1.09 0.31–2.38
3 0.82 0.64–1.07 0.61 �1.05–4.21 0.45 �1.56–3.13
4 1.05 1.00–1.31 1.00 �0.81–3.93 0.91 �0.87–2.72
Avg. 0.98 1.15 0.79
Note: Each average is taken across all subjects in all conditions of the experiment.
Each end of a range is the most extreme value for any subject under any condition.
2050 W. Li, L. Matin / Vision Research 45 (2005) 2037–2057
arrangement required for combining influences from
individual lines on VPV, but neither is a right angle be-
tween lines or a common orientation for the lines a ne-
cessary component of the inducer.
The key to the influence of the individual line on VPV
is the retinal orientation (see footnote 2). The magnitude
of the influence by the single inducing line grows with its
orientation over the ±15� range of inducer roll-tilts orequivalent roll-tilts employed in the present experiments,
and for a given line orientation the influence grows also
with the length of the line, reaching a maximum under
our conditions of about ±7� for a 66.25�-long inducer
with a roll-tilt or equivalent roll-tilt of ±13.2�. The influ-
ence of two short parallel lines from bilaterally symmet-
ric locations are combined to generate a considerably
larger influence than either generates alone; with anypair of orientations the combined influence approxi-
mates the linearly additive sum of the separate influences
of the two constituent lines, with the value decreasing to
zero for lines with equal-and-opposite orientations. On
the other hand, the additional influence of a second
simultaneously presented long parallel line beyond that
generated by a first long line is small, being limited by
the approach to the asymptote of the first line; thusthe resulting magnitude of influence on VPV approxi-
mates the average of the two separately measured influ-
ences for any combination of orientations, also reaching
zero for two lines with equal-and-opposite orientations.
4.1. Linear independence among influences of individual
lines
The results in Fig. 6a, c, and e contain the average re-
sults from the three 49-condition experiments with the
short 2-line roll-tilted stimuli, the long 2-line roll-tilted
stimuli, and the long 2-line pitched-from-vertical (equiv-
alent roll-tilt) stimuli, respectively. Each of the sevensolid, approximately parallel lines connects a set of
seven points for which the left line orientation is fixed
and the right line orientation varies. The dark solid line
of large slope connects the seven points for which the
two inducing lines are parallel in each panel. Each light
dotted line connects a set of points for which the sum of
the roll-tilts or equivalent roll-tilts of the two lines is
either fixed (Fig. 6a) or very nearly fixed (Fig. 6c ande; see4). The close approximation to parallel horizontal
lines of the dotted lines in each left-hand panel indicates
the close approach to constancy of VPV for a given sum
W. Li, L. Matin / Vision Research 45 (2005) 2037–2057 2051
of roll-tilts or equivalent roll-tilts, a relation displayed
directly in the right-hand column. The slopes of the
functions in Fig. 6c and e for the long lines are the same
(0.31), providing another indication of the essential
identity of influence for lines of the same retinal orienta-
tion from different physical planes. The slopes for bothlong-line functions in Fig. 6c and e are considerably lar-
ger than the slope for the short lines in Fig. 6a (0.16), a
result that is traceable to the smaller change of influence
of the short individual line with variation in roll-tilt than
change for the long line, and is another manifestation of
the sensitivity difference with length as measured by
the slope functions for the individual lines (Fig. 5a, c,
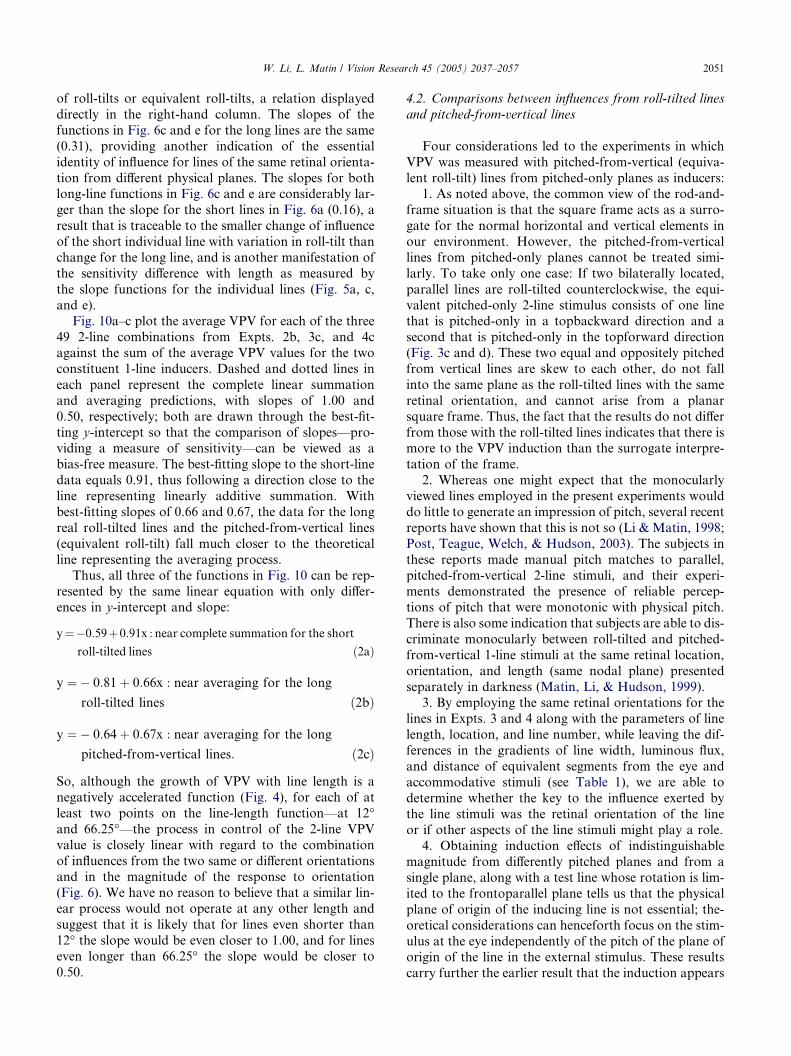
and e).Fig. 10a–c plot the average VPV for each of the three
49 2-line combinations from Expts. 2b, 3c, and 4c
against the sum of the average VPV values for the two
constituent 1-line inducers. Dashed and dotted lines in
each panel represent the complete linear summation
and averaging predictions, with slopes of 1.00 and
0.50, respectively; both are drawn through the best-fit-
ting y-intercept so that the comparison of slopes—pro-viding a measure of sensitivity—can be viewed as a
bias-free measure. The best-fitting slope to the short-line
data equals 0.91, thus following a direction close to the
line representing linearly additive summation. With
best-fitting slopes of 0.66 and 0.67, the data for the long
real roll-tilted lines and the pitched-from-vertical lines
(equivalent roll-tilt) fall much closer to the theoretical
line representing the averaging process.Thus, all three of the functions in Fig. 10 can be rep-
resented by the same linear equation with only differ-
ences in y-intercept and slope:
y¼�0:59þ0:91x : near complete summation for the short
roll-tilted lines ð2aÞ
y ¼� 0:81 þ 0:66x : near averaging for the long
roll-tilted lines ð2bÞ
y ¼� 0:64 þ 0:67x : near averaging for the long
pitched-from-vertical lines: ð2cÞ
So, although the growth of VPV with line length is a
negatively accelerated function (Fig. 4), for each of at
least two points on the line-length function—at 12�and 66.25�—the process in control of the 2-line VPV
value is closely linear with regard to the combination
of influences from the two same or different orientationsand in the magnitude of the response to orientation
(Fig. 6). We have no reason to believe that a similar lin-
ear process would not operate at any other length and
suggest that it is likely that for lines even shorter than
12� the slope would be even closer to 1.00, and for lines
even longer than 66.25� the slope would be closer to
0.50.
4.2. Comparisons between influences from roll-tilted lines
and pitched-from-vertical lines
Four considerations led to the experiments in which
VPV was measured with pitched-from-vertical (equiva-
lent roll-tilt) lines from pitched-only planes as inducers:1. As noted above, the common view of the rod-and-
frame situation is that the square frame acts as a surro-
gate for the normal horizontal and vertical elements in
our environment. However, the pitched-from-vertical
lines from pitched-only planes cannot be treated simi-
larly. To take only one case: If two bilaterally located,
parallel lines are roll-tilted counterclockwise, the equi-
valent pitched-only 2-line stimulus consists of one linethat is pitched-only in a topbackward direction and a
second that is pitched-only in the topforward direction
(Fig. 3c and d). These two equal and oppositely pitched
from vertical lines are skew to each other, do not fall
into the same plane as the roll-tilted lines with the same
retinal orientation, and cannot arise from a planar
square frame. Thus, the fact that the results do not differ
from those with the roll-tilted lines indicates that there ismore to the VPV induction than the surrogate interpre-
tation of the frame.
2. Whereas one might expect that the monocularly
viewed lines employed in the present experiments would
do little to generate an impression of pitch, several recent
reports have shown that this is not so (Li & Matin, 1998;
Post, Teague, Welch, & Hudson, 2003). The subjects in
these reports made manual pitch matches to parallel,pitched-from-vertical 2-line stimuli, and their experi-
ments demonstrated the presence of reliable percep-
tions of pitch that were monotonic with physical pitch.
There is also some indication that subjects are able to dis-
criminate monocularly between roll-tilted and pitched-
from-vertical 1-line stimuli at the same retinal location,
orientation, and length (same nodal plane) presented
separately in darkness (Matin, Li, & Hudson, 1999).3. By employing the same retinal orientations for the
lines in Expts. 3 and 4 along with the parameters of line
length, location, and line number, while leaving the dif-
ferences in the gradients of line width, luminous flux,
and distance of equivalent segments from the eye and
accommodative stimuli (see Table 1), we are able to
determine whether the key to the influence exerted by
the line stimuli was the retinal orientation of the lineor if other aspects of the line stimuli might play a role.
4. Obtaining induction effects of indistinguishable
magnitude from differently pitched planes and from a
single plane, along with a test line whose rotation is lim-
ited to the frontoparallel plane tells us that the physical
plane of origin of the inducing line is not essential; the-
oretical considerations can henceforth focus on the stim-
ulus at the eye independently of the pitch of the plane oforigin of the line in the external stimulus. These results
carry further the earlier result that the induction appears

Averaging Process:
1086420-2-4-6-8-10-10
-8
-6
-4
-2
0
2
4
6
8
10
VPV
for
2-L
ine
Indu
cer
(Deg
.)
(a)
(b)
(c)
[(Left-Line VPV) + (Right-Line VPV)]
12 -Long Roll-Tilted (Oblique) Line(s)
Additive SummationProcess: Slope = 1.0
Slope = 0.5
y = -0.59 + 0.91xr = .99
Best Linear Fit to Data
Sum of VPVs for 1-Line Stimuli (Deg.)
CW
CCW
CCW CW
o
1612840-4-8-12-16-16
-12
-8
-4
0
4
8
12
16
VPV
for
2-L
ine
Indu
der
(Deg
.)
[(Left-Line VPV) + (Right-Line VPV)]
66.25 -Long Roll-Tilted (Oblique) Line(s)(Frontoparallel Plane)
Additive SummationProcess: Slope = 1.0
Averaging Process: Slope = 0.5
y = -0.81 + 0.66xr = .99
Best Linear Fit to Data
Sum of VPVs for 1-Line Stimuli (Deg.)
CW
CCW
CCW CW
o
1612840-4-8-12-16-16
-12
-8
-4
0
4
8
12
16
[(Left-Line VPV) + (Right-Line VPV)]
66.25 -Long Pitched-from-Vertical Line(s)(Pitched Plane)
Additive SummationProcess: Slope = 1.0
Averaging Process: Slope = 0.5
y = -0.64 + 0.67xr = .99
Best Linear Fit to Data
Sum of VPVs for 1-Line Stimuli (Deg.)
VPV
for
2-L
ine
Indu
cer
(Deg
.)
CW
CCW
CCW CW
o
Fig. 10. Each of the three panels plots the VPV for the 2-line inducer against the sum of the VPVs for the two constituent 1-line stimuli measured
separately for one of the three 49-condition 2-line experiments: Expt. 2a (left + right lines) vs. Expt. 2b in panel a; Expt. 3a (left + right lines) vs. Expt.
3c in panel b; Expt. 4a (left + right lines) vs. Expt. 4c in panel c. The slopes of the two theoretical straight lines shown in each panel are those that
would result if the total visual influence contributing to the 2-line VPV was the sum of the contributions of the two constituent lines (‘‘additive
summation process’’) and the average of the VPVs of the two continuous lines (‘‘averaging process’’) respectively; both the slope value and the y-
intercept for the equation in each panel are from the least squares best fitting straight line.
2052 W. Li, L. Matin / Vision Research 45 (2005) 2037–2057

W. Li, L. Matin / Vision Research 45 (2005) 2037–2057 2053
to work as well across a frame and a rod that lie in
frontoparallel planes of different depth as it does within
a single frontoparallel plane (Ebenholtz & Glaser, 1982;
Gogel & Newton, 1975).
4.3. The basis for the rod-and-frame effect lies in the
influence of lines in a mass action rule
The present results show that the frame-organized-
into-a-square is not necessary for the influences from a
roll-tilted visual field to be manifested. The magnitude
of the effects we measure with the single line or with
two lines are as large as those originally measured with
the full frame by Witkin and Asch. The linear equations(2a)–(2c) accurately describe the rule for combination
for two lines of the same or different orientations.
Although the present results were only obtained at a sin-
gle pair of eccentricities and over a limited range of ori-
entation, we have measured the same rule (with different
constants) to be operative at each of two different pairs
of eccentricities over a much more complete set of reti-
nal orientations in another full set of experiments (Li& Matin, 2002, in press). We thus suggest that the rule
is likely to hold more generally. Although our carpen-
tered environments do contain long lines that parallel
the horizontal and vertical, most of the objects in our
environments—both carpentered and natural—contain
short extents of lines, many of which—if not most—
are near vertical or horizontal. It is reasonable to think
that neural mechanisms have developed that wouldmake use of any conjunction of these pieces within a vi-
sual scene with no requirement that they form the rela-
tively rare configuration of a square or any other specific
configuration and we thus refer to the generality of the
configuration-independence of the linear combination
as a rule of mass action.5
4.4. The functional basis for the influence of line
orientation on VPV
While at least a substantial portion of the influence of
the square frame on VPV has a basis in the relation of
the square�s arms to the orientations of the vertical
5 The term ‘‘configuration-independence’’ here refers to the finding
that the combined influence on VPV of either two short lines or two
long lines depends only on the sum of the roll-tilts of the two bilaterally
symmetric lines and not on their separate roll-tilts, e.g., if the roll-tilts
of two lines of a given length are �15� and +10�, the influence of the
two presented together will be essentially indistinguishable from the
influence of two lines of the same length whose roll-tilts are �5� and 0�;(see Fig. 6); a similar statement may be couched in terms of the VPVs
generated by the lines (see Fig. 10). The term ‘‘mass action’’ refers to
the finding that the influence on VPV as a deviation from the dark
baseline or from the y-intercept increases with the deviation of the
magnitude of the sum of the separate VPVs of the two lines or of their
orientations, and not on the individual values themselves.
and horizontal in gravity-based physical space, as noted
earlier, this has not been the exclusive basis for investi-
gating the influence of the frame; nor has an explanation
for the rod-and-frame effect been presented. It is reason-
able to think that the effect is a piece of an overall com-
pensatory mechanism for roll-tilt of the head and/orhead-and-body that normally serves to maintain percep-
tual constancy of orientation, and that this piece does
the major work in maintaining constancy in an erect,
illuminated environment. This suggests that when a ret-
inal orientation change is generated by a change in the
physical roll-tilt of the visual stimulus instead of by a
change in roll-tilt of the head and/or head-and-body,
the errors in VPV result from the unusual relation be-tween the orientations of the main lines of organization
of the visual field and the direction of the gravitoinertial
vector, and/or the relation between the main lines of the
visual field and the median plane of the body (cf., Mit-
telstaedt, 1986, 1988, 1992, 1997; Rock, 1954). The exis-
tence of a VPV-vs-head-and-body tilt function in total
darkness in which VPV variation is small relative to
the magnitude of the change of retinal image orientationassociated with the rotation of head-and-body (Bauer-
meister, 1964), indicates that along with the influence
from the visual field, VPV constancy involves a major
contribution of signals from the body-referenced mech-
anism. Changes in perceived head-and-body tilt (Witkin,
1949) and perceived head tilt in the presence of a tilted
frame (Ebenholtz & Benzchawel, 1977) have been re-
ported, and, since such effects would be a consequenceof an interaction between the visual system and the
body-referenced mechanism, they could be a sign of an
additional contribution to a compensatory mechanism
for head-and-body tilt.
Although the present experiments have been exclu-
sively concerned with the influence of visual stimulation
on VPV, there are several aspects of the present results
that bear on the influence of the body-referenced mecha-nism: Not only do the individual subjects manifest a great
deal of consistency in their susceptibility to visual influ-
ences as measured by the slope of the VPV-vs roll-tilt
or equivalent roll-tilt responses across conditions of an
experiment as described above, but they also manifest
considerable individual consistency in dark values and
the y-intercepts. Since the dark value is measured in the
absence of any visual stimulation except for the short testline itself, it provides a measure of the operation of the
body-referenced mechanism. Since the y-intercept is a
measure of biasing in an erect visual field that actually de-
pends on measurements with different retinal orienta-
tions (and presumably would tend to average them
out), it may also be taken to reflect the operation of the
body-referenced mechanism, and this is supported by
the generally high correlations with the dark values. Wit-kin and Asch (1948) and Witkin (1949) have previously
described large individual differences and considerable

2054 W. Li, L. Matin / Vision Research 45 (2005) 2037–2057
individual consistency of their subjects across tasks. The
statistical analyses of our results for both the VPV values
under induction by lines and in darkness provide strong
and broad support for both of these aspects.
The identical inducing lines that were employed in the
present experiments were reported to induce large influ-ences on another aspect of the egocentric perception of
space—the perception of elevation—as measured by
the subject�s setting of a small circular target in the med-
ian plane to an elevation that appeared to correspond to
eye level (VPEL setting) (Li et al., 2001; Li & Matin,
1996; Matin & Li, 1992, 1994a, 1994b, 1994c, 1995a,
1995b, 1999, 2000, 2001; Post et al., 2003). The visual
induction of changes in VPEL generated by changes inthe parameters of orientation and length of the 1-line
and 2-line stimuli follows quantitative variations that
are nearly identical to those that we have found to hold
for the induction of changes in VPV in the present
experiments, both for roll-tilted lines and for pitched-
from-vertical lines. Thus: (1) Within the range of roll-
tilts and equivalent roll-tilts examined in the present
experiments the deviation of VPEL from a baselinevalue (y-intercept) increases in opposite directions with
opposite directions of deviation-from-vertical of the
roll-tilt of the inducing line; the increase is nearly linear
with the deviation-from-vertical of line orientation. (2)
Induction by 1-line stimuli on VPEL approximates a
negatively accelerated exponential with a length con-
stant averaging 15.1� (close to the 17.1� length constant
in Exp. 1 above for VPV). (3) For two lines with anycombination of orientations VPEL manifests linear
summation across a 50� bilaterally symmetric extent of
the monocular visual field, with nearly complete summa-
tion for short lines with slope functions as in Fig. 10
equal to 0.99 (0.91 in Expt. 3c for VPV), and a close ap-
proach to averaging for long lines: 0.58 for real roll-tilt
for VPEL and 0.61 for equivalent roll-tilt, (0.66 and 0.67
for real roll-tilt and equivalent roll-tilt respectively).However, there is one very important difference be-
tween the processing of VPV and VPEL: Whereas for
lines in the frontoparallel plane, parallel roll-tilted lines
on opposite sides of the median plane generate influ-
ences of the same sign on VPV and bilaterally symmetric
roll-tilted lines (counterrolled lines) generate influences
of opposite signs, for VPEL the opposite is true: parallel
roll-tilted lines on opposite sides of the median planegenerate influences of opposite sign and bilaterally sym-
metric roll-tilted lines generate influences of the same
sign; these same differences hold true for lines of equiv-
alent roll-tilt. This difference in processing the identical
stimuli for the two perceptual dimensions of elevation
and roll-tilt is an important indication of the visual sys-
tem�s ability to maintain perceptual constancy in both
dimensions simultaneously, employing two differentmechanisms for processing the same stimulus to do so
(Matin & Li, 1994c).
4.5. Neural mediation of the visual influence on VPV
The strong similarities together with the important
differences in visual influence on the two dimensions of
egocentric space perception, as measured by VPV and
VPEL, provides some support for the view that the neu-ral processing for them both is common up to the point
in higher level processing at which the sign reversal that
separates them is generated; such a bifurcation point in
processing is likely to lie beyond V1. Our recent report
(Shavit, Li, Semanek, & Matin, 2004) of a significant
correlation (r = +0.45) for sensitivity-to-induction by
2-line stimuli between the VPEL and VPV discrimina-
tions across 30 subjects supports this view of commonlower level processing of the visual influence followed
by separate higher level processing for the two
discriminations.
The sensitivity of the setting of VPV to the orienta-
tion of the individual inducing line suggests connec-
tions to the properties of orientationally selective
neural units in V1. Such connections offer the great
theoretical advantage of suggesting a first stage in theneurophysiological and neuroanatomical substrate for
processing these inducing stimuli. Although receptive
fields in V1 are no larger than about 3� (Hubel & Wie-
sel, 1974, 1977), some V1 units have been reported in
which the influence of length grows with negative
acceleration to lengths up to as much as 16� (Gilbert,
1977), presumably as a consequence of horizontal sum-
mation across single neural units with the same orien-tation selectivity serving adjacent retinal areas (Gilbert
& Wiesel, 1983; Ts�o, Gilbert, & Wiesel, 1986). This is
consistent with the increase of summation of the VPV
influence with line length we describe above where: (1)
summation approximates a negatively accelerated
exponential with a 17.1� length constant (Fig. 4), (2)
summation between two lines laid end to end is as
great as between two spatially separated lines (Figs. 4and 5a), (3) linear summation (using algebraic quanti-
ties) is manifested between two line segments of any
combination of orientations horizontally separated by
50� that are processed in the different hemiretinas of
the same eye and thus in different cerebral hemispheres
(Figs. 5,6,10).
Based on these considerations we proposed a 4-chan-
nel neuromathematical model that closely predicts thequantitative results of more than five sets of experiments
measuring VPEL (Matin & Li, 2001). Two of the chan-
nels process orientation on one side of the median plane
and two on the other side, with one of the two on each
side processing cw retinal orientation and the other ccw
orientation; the two cw channels reverse sign on oppo-
site sides of the median plane as do the ccw channels.
A very similar model, without the sign reversal acrossthe median plane, predicts the present results with
VPV (Matin & Li, 2002).

W. Li, L. Matin / Vision Research 45 (2005) 2037–2057 2055
However, in recent work (Shavit, Li, & Matin, 2004),
we have varied the global orientation of an array of
short parallel lines and the orientation of the individual
lines in the array (their local orientations) indepen-
dently, and found that the influence on both VPV and
on VPEL of the global orientation manifests an influ-ence equal to that generated by the local orientation of
a single continuous line of the same length where global
and local orientations are identical. The orientation-
selective neural units in V1 have only been reported to
respond to local orientation but not global orientation,
and we have suggested that the influence on both VPEL
and VPV are a consequence of the retinotopic location
information from the orientation-selective and/or non-orientation-selective neural units in V1 being passed
on to a higher-level processor where the global orienta-
tion is generated. With this modification—utilization of
the location information from the initial processing in
V1 instead of the orientation information and the con-
struction of global orientation by higher level process-
ing—the previously proposed neuromathematical model
continues to account for the previous results and forthose involving the separation of local and global orien-
tations as well.
Finally, it is worth noting that although V1 may be
an early stage of processing of the visual influence on
VPV and VPEL, important influences from the body-
referenced mechanism may already play a role: Thus,
a substantial percentage of V1 neurons has been re-
ported to be sensitive to vestibular input and head orien-tation input (Denny & Adorjani, 1972; Grusser &
Grusser-Cornehls, 1960; Horn, Stechler, & Hill, 1972;
Jung, Kornhuber, & Da Fonseca, 1963; Tomko, Bar-
baro, & Ali, 1981). It appears likely that the relative
weighting given to vision and the body-referenced mech-
anism works well over a large range of variation, in con-
formity with the large individual variations in
susceptibility to the visual influence on VPV and VPELmeasured psychophysically, and the neurophysiological
findings in V1 raise the possibility that such relative
weighting is begun as early as V1 or earlier.
Acknowledgement
The work described in this paper was supported byGrant EY10534 from the National Eye Institute, NIH
and Grant 91-0146 from the US Air Force Office of Sci-
entific Research.
References
Asch, S. E., & Witkin, H. A. (1948a). Studies in space orientation. I.
Perception of the upright with displaced visual fields. Journal of
Experimental Psychology, 38, 325–337.
Asch, S. E., & Witkin, H. A. (1948b). Studies in space orientation. II.
Perception of the upright with displaced visual fields and with body
tilted. Journal of Experimental Psychology, 38, 455–477.
Bauermeister, M. (1964). Effect of body tilt on apparent verticality,
apparent body position, and their relation. Journal of Experimental
Psychology, 67, 142–147.
Beh, H., & Wenderoth, P. (1972). The effect of frame shape on the
angular function of the rod-and-frame illusion. Perception &
Psychophysics, 11, 5–37.
Beh, H., Wenderoth, P., & Purcell, A. T. (1971). The angular function
of a rod-and-frame illusion. Perception & Psychophysics, 9,
353–355.
Bertini, M., Pizzamiglio, L., & Wapner, S. (1986). Field dependence in
psychological theory, research, and application. Hillsdale, NJ:
Lawremce Erlbaum Associates, Inc.
Chelette, T., Li, W., Esken, R., & Matin, L. (1995). Visual perception
of eye level (VPEL) under high g while viewing a pitched visual
field. Annual Meeting of Aerospace Medical Association, A55.
Denny, D., & Adorjani, C. (1972). Orientation specificity of visual
cortical neurons after head tilt. Experimental Brain Research, 14,
312–317.
Dichgans, J., & Brandt, T. (1974). The psychophysics of visually
induced perception of self-motion and tilt. In F. O. Schmitt & F. G.
Worden (Eds.), The neurosciences, third study program
(pp. 123–129). Cambridge, MA: MIT Press.
Dichgans, J., Held, R., Young, L. R., & Brandt, T. (1972). Moving
visual scenes influence the apparent direction of gravity. Science,
178, 1217–1219.
DiZio, P., Li, W., Lackner, J. R., & Matin, L. (1997). Combined
influences of gravitoinertial force level and visual field pitch on
visually perceived eye level. Journal of Vestibular Research, 7,
381–392.
Ebenholtz, S. M. (1977). Determinants of the rod-and-frame effect:
The role of retinal size. Perception & Psychophysics, 22, 531–538.
Ebenholtz, S. M. (1985). Absence of relational determination in the
rod-and-frame effect. Perception & Psychophysics, 37, 303–306.
Ebenholtz, S. M., & Benzchawel, T. L. (1977). The rod and frame effect
and induced head tilt as a function of observation distance.
Perception & Psychophysics, 22, 491–496.
Ebenholtz, S. M., & Callan, J. W. (1980). Modulation of the rod and
frame effect: Retinal angle vs. apparent size. Psychological
Research, 42, 327–334.
Ebenholtz, S. M., & Glaser, G. W. (1982). Absence of depth processing
in the large-frame rod-and-frame effect. Perception & Psychophys-
ics, 32, 134–140.
Gibson, J. J., & Mowrer, O. H. (1938). Determinants of the perceived
vertical and horizontal. Psychological Review, 45, 300–323.
Gilbert, C. D. (1977). Laminar differences in receptive field properties
of cell in cat primar visual cortex. Journal of Physiology, London,
268, 391–421.
Gilbert, C. D., & Wiesel, T. N. (1983). Clustered intrinsic connections
in cat visual cortex. Journal of Neuroscience, 3, 1116–1133.
Gogel, W. C., & Newton, R. E. (1975). Depth adjacency and the rod-
and-frame illusion. Perception & Psychophysics, 18, 163–171.
Goldstein, A. G., & Chance, J. E. (1965). Effects of practice on sex-
related differences on performance on Embedded Figures. Psycho-
nomic Science, 3, 361–362.
Grusser, O. J., & Grusser-Cornehls, V. (1960). Mikroelektrodenun-
tersuchungen zur Konvergenz vestibularer und retinaler afferenzen
an einzelnen Neuronen des optischen Cortex der Katze. Pflugers
Archiv, 270, 227–288.
Held, R., Dichgans, J., & Bauer, J. A. (1975). Characteristics of
moving visual areas influenceing spatial orientation. Vision
Research, 15, 357–365.
Higashiyama, A., & Koga, K. (1998). Apparent body tilt and postural
aftereffect. Perception & Psychophysics, 60, 331–347.

2056 W. Li, L. Matin / Vision Research 45 (2005) 2037–2057
Horn, G., Stechler, G., & Hill, R. M. (1972). Receptive fields of units
in the visual cortex of the cat in the presence and absence of bodily
tilt. Experimental Brain Research, 15, 113–132.
Howard, I. P. (1982). Human visual orientation. New York: John
Wiley.
Howard, I. P., & Childerson, L. (1994). The contribution of motion,
the visual frame, and visual polarity to sensation of body tilt.
Perception, 23, 753–762.
Howard, I. P., & Templeton, W. B. (1966). Human spatial orientation.
New York: John Wiley.
Hubel, D. H., & Wiesel, T. N. (1974). Uniformity of monkey striate
cortex: A parallel relationship between field size, scatter, and
magnification factor. Journal of Comparative Neurology, 158,
295–306.
Hubel, D. H., & Wiesel, T. N. (1977). Functional architecture of
macaque monkey visual cortex. Proceedings of the Royal Society,
London B,, 198, 1–59.
Hudson, T., Li, W., & Matin, L. (1997). Individual differences in
cognitive styles and perception. Eastern Psychological Association,
68, 80.
Hudson, T., Li, W., & Matin, L. (submitted for publication). The field-
dependence/independence cognitive style does not control the
spatial perception of elevation.
Jung, R., Kornhuber, H. H., & Da Fonseca, J. S. (1963). Multisensory
convergence on cortical neurons: Neuronal effects of visual,
acoustic and vestibular stimuli in the superior convolutions of the
cat�s cortex. Progress in Brain Research, 1, 207–240.
Kendall, M. G. (1955). Rank correlation methods. London: C. Griffin.
Koffka, K. (1935). Gestalt psychology. NY: Harcourt Brace.
Li, W., Dallal, N., & Matin, L. (2001). Influences of visual pitch and
visual yaw on visually perceived eye level (VPEL) and straight
ahead (VPSA) for erect and rolled-to-horizontal observers. Vision
Research, 41, 2873–2894.
Li, W., & Matin, L. (1996). Visually perceived eye level is influenced
identically by lines from erect and pitched planes. Perception, 25,
831–852.
Li, W., & Matin, L. (1998). Change in visually perceived eye level
without change in perceived pitch. Perception, 27, 553–572.
Li, W., & Matin, L. (2002). Decomposition of the influence of the
frame. III. The whole is less than the sum of its parts. 2nd Annual
Meeting of Vision Sciences Society, 2, 181.
Li, W., & Matin, L. (in press). The rod-and-frame effect: The whole is
less than the sum of its parts. Perception.
Linn, M. C., & Peterson, A. C. (1985). Emergence and characterisation
of sex differences in spatial ability: A meta-analysis. Child Devel-
opment, 56, 1479–1498.
Matin, L., & Fox, C. (1989). Visually perceived eye level and perceived
elevation of objects: Linearly additive influences from visual field
pitch and from gravity. Vision Research, 29, 315–324.
Matin, L., & Li, W. (1992). Visually perceived eye level: Changes
induced by a pitched-from-vertical 2-line visual field. Journal of
Experimental Psychology: Human Perception and Performance, 18,
257–289.
Matin, L., & Li, W. (1994a). The influence of the orientation of a
stationary single line in darkness on the visual perception of eye
level. Vision Research, 34, 311–330.
Matin, L., & Li, W. (1994b). Spatial summation among parallel lines
across wide separation (50�): Spatial localization and the Great
Circle Model. Vision Research, 34, 2577–2598.
Matin, L., & Li, W. (1994c). Mirror symmetry and parallelism: two
opposite rules for the identity transform in space perception and
their unified treatment by the Great Circle Model. Spatial Vision, 8,
469–489.
Matin, L., & Li, W. (1995a). Multimodal basis for egocentric spatial
localization and orientation. Journal of Vestibular Research, 5,
499–518.
Matin, L., & Li, W. (1995b). Light and Dark adaptation of visually
perceived eye level controlled by visual pitch. Perception &
Psychophysics, 57, 84–104.
Matin, L., & Li, W. (1999). Averaging and summation of influences on
visually perceived eye level between two long lines differing in pitch
or roll-tilt. Vision Research, 39, 307–329.
Matin, L., & Li, W. (2000). Linear combinations of signals from two
lines of the same or different orientations. Vision Research, 40,
517–527.
Matin, L., & Li, W. (2001). Neural model for processing the influence
of visual orientation on visually perceived eye level (VPEL). Vision
Research, 41, 2845–2872.
Matin, L., & Li, W. (2002). The influence of individual roll-tilted lines
and their combinations on perceived vertical (VPV): Experiments
and theory. 25th European Conference on Visual Perception. In
Perception. Vol. 31. (p. 30).
Matin, L., Li, W., & Hudson, T. (1999). Monocular discrimination
between a pitched-from-vertical and roll-tilted line from the same
nodal plane. Investigative Ophthalmology & Visual Science, 40/4,
S43.
Mittelstaedt, H. (1986). The subjective vertical as a function of visual
and extraretinal cues. Acta Psychologica, 63, 63–85.
Mittelstaedt, H. (1988). The information processing structure of the
subjective vertical. A cybernetic bridge between its psychophysics
and its neurobiology. In H. Marko, G. Hauske, & A. Struppler
(Eds.), Processing structures for perception and action
(pp. 217–263). Weinhein: Verlag Chemie.
Mittelstaedt, H. (1992). Somatic versus vestibular gravity reception in
man. In B. Cohen, D. L. Tomko, & F. E. Guedry (Eds.), Sensing
and controlling motion, vestibular and sensorimotor function. Annals
of the New York Academy of Sciences (Vol. 656, pp. 124–139). New
York Academy of Sciences.
Mittelstaedt, H. (1997). Interaction of eye-, head-, and trunk-bound
information in spatial perception and control. Journal of Vestibular
Research, 7, 283–302.
Poquin, D., Ohlmann, T., & Barraud, P. A. (1998). Isotropic visual
field effect on spatial orientation and egocentric localization.
Spatial Vision, 11(3), 261–278.
Post, R. B., Teague, J. M., Welch, R. B., & Hudson, T. E. (2003).
Visually perceived eye level with reversible pitch stimuli: Implica-
tions for the great circle and implicit surface models. Perception,
32, 1073–1092.
Rock, I. (1954). The perception of the egocentric orientation of a line.
J. Experimental Psychology, 48, 367–374.
Schone, H. (1964). On the role of gravity in human spatial orientation.
Aerospace medicine, 35, 764–772.
Shavit, A. Y., Li, W., Semanek, D., & Matin, L. (2004). Individual
differences in sensitivity to induction-by-line: Covariation between
perceived elevation (VPEL) and perceived vertical (VPV)
[Abstract]. Journal of Vision, 4(8), 383a, Available from http://
journalofvision.org/4/8/383/ doi:10.1167/4.8.383.
Shavit, A. Y., Li, W., & Matin, L. (2004). Influences of global and
local orientations of line segments on perceived eye level. Abstracts
of the 45th Annual Meeting. Psychonomic Society, 9, 112–
113.
Sherman, J. (1969). Problem of sex differences in space perception and
aspects of intellectual functioning. Psychological Review, 74,
290–299.
Spinelli, D., Antonucci, G., Goodenough, D., Pizzamiglio, L., &
Zoccolotti, P. (1991). Psychophysiological mechanisms underlying
the rod-and-frame illusion. In S. Wapner & J. Demick (Eds.), Field
dependence-independence: Cognitive style across the life span
(pp. 37–60). Hillsdale, NJ: Lawremce Erlbaum Associates, Inc.
Streibel, M. J., Barnes, R., Julness, G. D., & Ebenholtz, S. M. (1980).
Determinants of the rod-and-frame effect: Role of organization and
subjective contour. Perception & Psychophysics, 27, 136–140.

W. Li, L. Matin / Vision Research 45 (2005) 2037–2057 2057
Tomko, D. L., Barbaro, N. M., & Ali, F. N. (1981). Effect of body tilt
on receptive field organization of simple visual cortical neurons in
unanestetized cats. Experimental Brain Research, 43, 309–314.
Trousselard, M., Cian, C., Nougier, V., Pla, S., & Raphel, C. (2003).
Contribution of somesthetic cues to the perception of body
orientation and subjective visual vertical. Perception & Psycho-
physics, 65, 1179–1187.
Ts�o, D. Y., Gilbert, C. D., & Wiesel, T. N. (1986). Relationships
between horizontal interactions and functional architecture in cat
striate cortex as revealed by cross- correlation analysis. Journal of
Neuroscience, 6, 1160–1170.
Wapner, S., & Demick, J. (1991). Field dependence-independence:
Cognitive style across the life span. Hillsdale, NJ: Lawremce
Erlbaum Associates, Inc.
Weiner, M. (1955). Effects of training in space orientation on
perception of the upright. Journal of Experimental Psychology,
49(5), 367–373.
Wenderoth, P. (1977). An analysis of the rod-and-frame illusion and its
variants. In R. H. Day & G. V. Stanley (Eds.), Studies in perception
(pp. 95–141). Perth: Univesity of Western Australia Press.
Wenderoth, P. (1982). Fine�s frame and perceived tilt. Perceptual and
Motor Skills, 54, 763–766.
Wenderoth, P., & Beh, H. (1977). Component analysis of orientation
illusions. Perception, 6, 57–75.
Wertheimer, M. (1912). Experimentelle Studien Uber das Sehen von
Bewegung. Zeitschrift fur Psychologie, 61, 161–262.
Witkin, H. A. (1949). Perception of body position and of the position
of the visual field. Psychol Monograph, 63(7), 1–46.
Witkin, H. A. (1977). Cognitive styles in personal and cultural
adaptation. Heinz Werner Lecture Series (Vol. XI). Clark Univer-
sity Press.
Witkin, H. A., & Asch, S. E. (1948). Studies in space perception. IV.
Further experiments on perception of the upright with displaced
visual fields. Journal of Experimental Psychology, 38, 762–782.
Witkin, H. A., Dyk, R. B., Faterson, H. F., Goodenough, D. R., &
Karp, S. A. (1962). Psychological differentiation. New York: Wiley
& Sons.
Witkin, H. A., & Goodenough, D. R. (1977). Field dependence and
interpersonal behavior. Psychological Bulletin, 84(4), 661–
688.
Witkin, H. A., & Goodenough, D. R. (1981). Cognitive styles: essence
and origins. Psychological issues, Monogr. 51. (whole monogr: x+1-
141pp.) International Universities Press.
Witkin, H. A., Karp, S. A., & Goodenough, D. R. (1959). Dependence
in alcoholics. Quarterly Journal of Studies on Alcohol, 20, 493–504.
Witkin, H. A., Lewis, H. B., Hertzman, M., Machover, K., Meissner,
P. B., & Wapner, S. (1954). Personality through perception. New
York: Harper & Brothers.
Zoccolotti, P., Antonucci, G., & Spinelli, D. (1993). The gap between
rod and frame influences the rod-and-frame effect with small
and large inducing displays. Perception & Psychophysics, 54,
14–19.

![E P} vPv }v vP]v procurement and supplyzeritenetwork.com/wp-content/uploads/2018/12/D4_CIPS_May_2018.pdfDiploma in procurement and supply E P} vPv }v vP]v procurement and supply](https://img.pdfslide.net/doc/110x75/5f496792f6c25b408e18f7c2/e-p-vpv-v-vpv-procurement-and-diploma-in-procurement-and-supply-e-p-vpv-v-vpv.jpg)


![W v ]vPv ( l À] D u]Ì}oíñuPllP /s vPv u]v}( víñuPllP /sµv](https://img.pdfslide.net/doc/110x75/616a363311a7b741a3500764/w-v-vpv-l-d-uoupllp-s-vpv-uv-vupllp.jpg)


![Pengaplik Shiori vPv l o} ]D} (XXXX PENGAPLIKASIAN TEKNIK](https://img.pdfslide.net/doc/110x75/6169cda211a7b741a34b894d/pengaplik-shiori-vpv-l-o-d-xxxx-pengaplikasian-teknik-.jpg)