Embed Size (px)
Citation preview
Vita Life Sciences Limited Appendix 4D For the half year ended 30 June 2010
i
Please see attached 30 June 2010 Half Yearly Report for Vita Life Sciences Limited (ASX - VSC). This announcement is made pursuant to Listing rule 4.2A.3. For all enquiries please contact Mr Terry Kong Company Secretary Vita Life Sciences Limited Telephone 03 9867 2811
Fax 03 9820 5957
To : Company Announcements
Company: Australian Securities Exchange Fax No.: 02 9227 0334
Date: 23 August 2010 No. of pages 28 incl. cover
From: Terry Kong Fax No.: 03 9820 5957
Subject : Appendix 4D

1
1. Company details Name of entity
VITA LIFE SCIENCES LIMITED
ABN or equivalent company reference
Half year ended (‘current period’)
Half year ended (‘previous period’)
35 003 190 421 30 June 2010 30 June 2009
2. Results for announcement to the market
Percentage
Change 2010
% A$
Revenue up 15.44 9,511,139
Profit before income tax up 187.22 319,717
Net profit after tax up 161.65 225,621
Net profit attributable to members up 161.65 225,621
Dividends (distributions)
Interim dividend per share Nil Nil
Final dividend per share Nil Nil
Record date for determining entitltements to dividends
Amount per
security
Franked amount per
security
N/A
2.6 Brief explanation of any of the figures in 2.1 to 2.4 above necessary to enable the figures
to be understood.
Half Year Performance Vita Life’s revenue of $9.51 million for the 1
st half was $1.27m or 15.4% higher than the
corresponding period in 2009. Strong sales growth was achieved in the Group’s Australian Established business unit by 15.7% and the six fold sales growth made by New business units, in particular, the Group’s Malaysian multi-level marketing (“MLM”) business unit. The Group’s consolidated profit after tax was $0.23 million (1
st Half 09: loss after tax of $0.37
million) and includes: Proceeds received from Pan Pharmaceuticals Liquidator of $0.68 million (1
st Half 09: Nil);
A charge of $0.41 million (1
st Half 09: $0.37 million) in legal and professional costs associated
with the Group’s claim against the Commonwealth of Australia (“Pan TGA Claim”); and
2
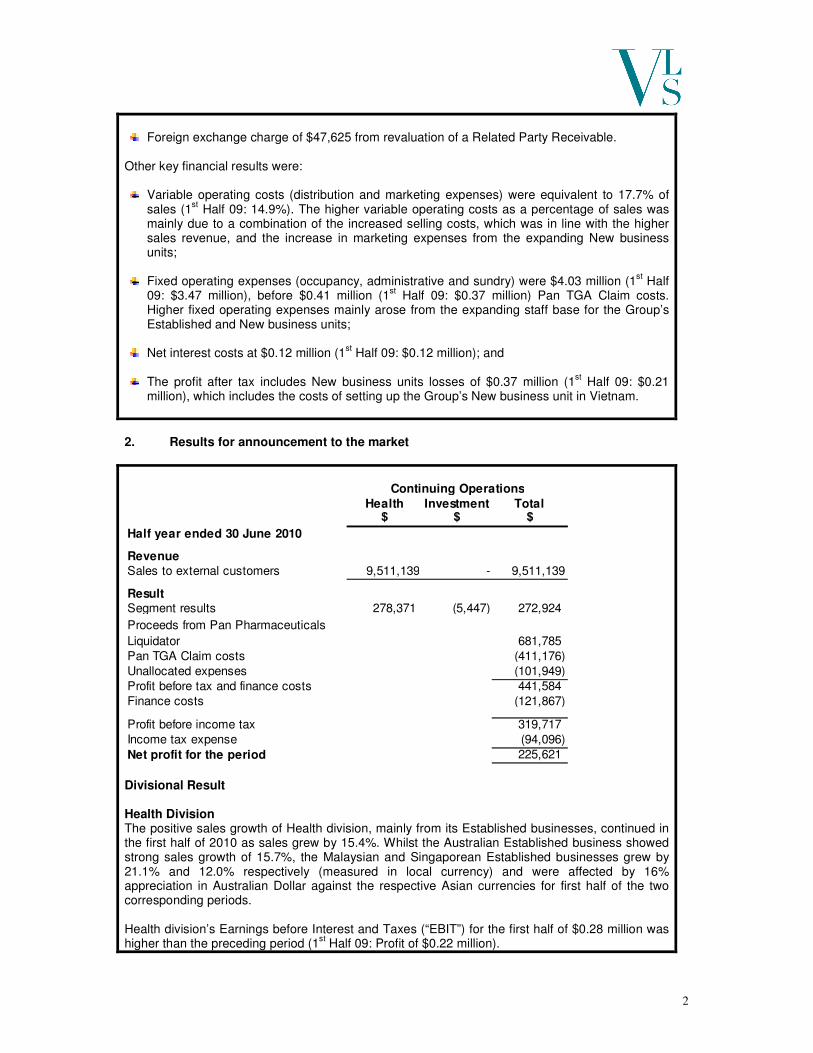
Foreign exchange charge of $47,625 from revaluation of a Related Party Receivable.
Other key financial results were:
Variable operating costs (distribution and marketing expenses) were equivalent to 17.7% of sales (1
st Half 09: 14.9%). The higher variable operating costs as a percentage of sales was
mainly due to a combination of the increased selling costs, which was in line with the higher sales revenue, and the increase in marketing expenses from the expanding New business units;
Fixed operating expenses (occupancy, administrative and sundry) were $4.03 million (1
st Half
09: $3.47 million), before $0.41 million (1st Half 09: $0.37 million) Pan TGA Claim costs.
Higher fixed operating expenses mainly arose from the expanding staff base for the Group’s Established and New business units;
Net interest costs at $0.12 million (1
st Half 09: $0.12 million); and
The profit after tax includes New business units losses of $0.37 million (1
st Half 09: $0.21
million), which includes the costs of setting up the Group’s New business unit in Vietnam.
2. Results for announcement to the market
Health Investment Total$ $ $
Half year ended 30 June 2010
RevenueSales to external customers 9,511,139 - 9,511,139
ResultSegment results 278,371 (5,447) 272,924
Proceeds from Pan Pharmaceuticals
Liquidator 681,785Pan TGA Claim costs (411,176)Unallocated expenses (101,949)Profit before tax and finance costs 441,584Finance costs (121,867)
Profit before income tax 319,717Income tax expense (94,096)
Net profit for the period 225,621
Continuing Operations
Divisional Result Health Division The positive sales growth of Health division, mainly from its Established businesses, continued in the first half of 2010 as sales grew by 15.4%. Whilst the Australian Established business showed strong sales growth of 15.7%, the Malaysian and Singaporean Established businesses grew by 21.1% and 12.0% respectively (measured in local currency) and were affected by 16% appreciation in Australian Dollar against the respective Asian currencies for first half of the two corresponding periods. Health division’s Earnings before Interest and Taxes (“EBIT”) for the first half of $0.28 million was higher than the preceding period (1
st Half 09: Profit of $0.22 million).

3
Investment Division The Group has an equity interest of 6.3% (profit share of 20.1%) in a property project in Malaysia. The Investment division did not record any revenue during the period and the loss of $5,447 (1
st
Half 09: $9,182) was mainly administrative costs. New Businesses The revenue contributions of New Business units in China, Malaysia and Thailand continued to grow, contributing 6.4% of Group’s sales revenue (1
st Half 09: 1.3%).
The New business units’ progress during the 2010 period can be summarised as follows: • The MLM business unit gained positive momentum and contributed 6.0% of the Group’s sales
revenue for the period (1st Half 09: 0.2% of Group’s sales revenue). The loss for the period
resulted from a combination of marketing activities expanding distributor base and increased staff base to support a growing business. Directors expect 2010 second half performance to improve as the distributor base expands. An encouraging point to note is in July 2010, the MLM business unit recorded its highest monthly sales and a maiden profit for the month;
• In the first half of 2010, continued efforts were made to obtain product approvals in the Republic of China, Hong Kong and Vietnam. Revenue contribution was minimal and losses were incurred due to set-up and marketing expenses. The continued efforts from these exciting ventures will bring meaningful revenue and enhance shareholders’ value in the medium to long term;
• In 2010, the Thailand business unit showed positive growth as sales doubled, as compared to
the preceding period, and was profitable for the first quarter of the year. However, the operation was adversely affected by the political situation in the country in the second quarter of the year. Nevertheless the impact to the Group was immaterial; and
• The Group obtained the approval from the Vietnam authority to commence the sale of over-
the-counter products in late 2009. The approval will enable the Group to replicate the successes of the Group’s Established business units. Set-up costs of approximately $60,000 were invested during the period under review. Selling activities are expected to commence in the third quarter of 2010.
Outlook for the Second Half of 2010 The Health division’s Established Business sales are expected to continue a similar sales growth trend for the full financial year. The New Business units in China, Malaysia and Thailand are expected to continue to expand. The Group’s operating performance remains encouraging. However, the Pan TGA Claim costs are expected to negatively impact the Group’s full year financial results.
3. Net tangible assets
30 June 2010 30 June 2009 Net Tangible Assets/ (Liabilities) per security $0.08 $0.06

4
4. Entities over which control has been gained or lost during the period
Control over entities
Name of entity (or group of entities) PT Vitahealth Indonesia
Loss of control over entities
Name of entity (or group of entities) Not applicable.
5. Dividends
Not applicable
6. Dividend Reinvestment plans
Not applicable
7. Details of associates and joint venture entities
Place of
Incorporation30 June 2010 30 June 2009
% %
Investment details
Name of Company Unlisted
- Mitre Focus Sdn Bhd Malaysia 6.3 6.3 - Vita Life Sciences (Thailand) Co. Ltd Thailand 49.0 49.0 - Vitahealth (Thailand) Co. Ltd Thailand 74.0 74.0
Ownership Interest
8. Information on Audit or Review This interim report is based on accounts to which one of the following applies The accounts have been subject to review � The accounts are in the process of being subject to review � The accounts have not yet been reviewed �
Description of likely dispute or qualification if the accounts have not yet been audited or subject to review or are in the process of being audited or subjected to review.
Not applicable
9. For foreign entities, which accounting standards were used in compiling this report.
International Financial Reporting Standard - IFRS

Vita Life Sciences Limited
Half Year Report June 2010
Vita Life Sciences Limited and its Controlled Entities ABN 35 003 190 421
ii
Contents
Managing Director’s Review 1
Directors’ Report 5
Auditor’s Independence Declaration 6
Consolidated Statement of Comprehensive Income 7
Consolidated Statement of Financial Position 8
Consolidated Statement of Cash Flow 9
Consolidated Statement of Changes in Equity 10
Notes to the Financial Statements 11
Directors’ Declaration 17
Independent Review Report 18
General Information 20
1
Managing Director’s Review
OVERVIEW We are pleased to present Vita Life Sciences Limited’s (“Vita Life” or the “Group”) results for the half year ended 30 June 2010. Vita Life’s revenue of $9.51 million for the 1
st half was $1.27m or 15.4% higher than the corresponding
period in 2009. Strong sales growth was achieved in the Group’s Australian Established business unit by 15.7% and the six fold sales growth made by New business units, in particular, the Group’s Malaysian multi-level marketing (“MLM”) business unit. The Group’s consolidated profit after tax was $0.23 million (1
st Half 09: loss after tax of $0.37 million) and
includes: Proceeds received from Pan Pharmaceuticals Liquidator of $0.68 million (1
st Half 09: Nil);
A charge of $0.41 million (1
st Half 09: $0.37 million) in legal and professional costs associated with
the Group’s claim against the Commonwealth of Australia (“Pan TGA Claim”); and
Foreign exchange charge of $47,625 from revaluation of a Related Party Receivable. Other key financial results were:
Variable operating costs (distribution and marketing expenses) were equivalent to 17.7% of sales (1st
Half 09: 14.9%). The higher variable operating costs as a percentage of sales was mainly due to a combination of the increased selling costs, which was in line with the higher sales revenue, and the increase in marketing expenses from the expanding New business units;
Fixed operating expenses (occupancy, administrative and sundry) were $4.03 million (1
st Half 09:
$3.47 million), before $0.41 million (1st Half 09: $0.37 million) Pan TGA Claim costs. Higher fixed
operating expenses mainly arose from the expanding staff base for the Group’s Established and New business units;
Net interest costs at $0.12 million (1
st Half 09: $0.12 million); and
The profit after tax includes New business units losses of $0.37 million (1
st Half 09: $0.21 million),
which includes the costs of setting up the Group’s New business unit in Vietnam.
Divisional Result Health Division The positive sales growth of Health division, mainly from its Established businesses, continued in the first half of 2010 as sales grew by 15.4%. Whilst the Australian Established business showed strong sales growth of 15.7%, the Malaysian and Singaporean Established businesses grew by 21.1% and 12.0% respectively (measured in local currency) and were affected by 16% appreciation in Australian Dollar against the respective Asian currencies for first half of the two corresponding periods. Health division’s Earnings before Interest and Taxes (“EBIT”) for the first half of $0.28 million was higher than the preceding period (1
st Half 09: Profit of $0.22 million).
2
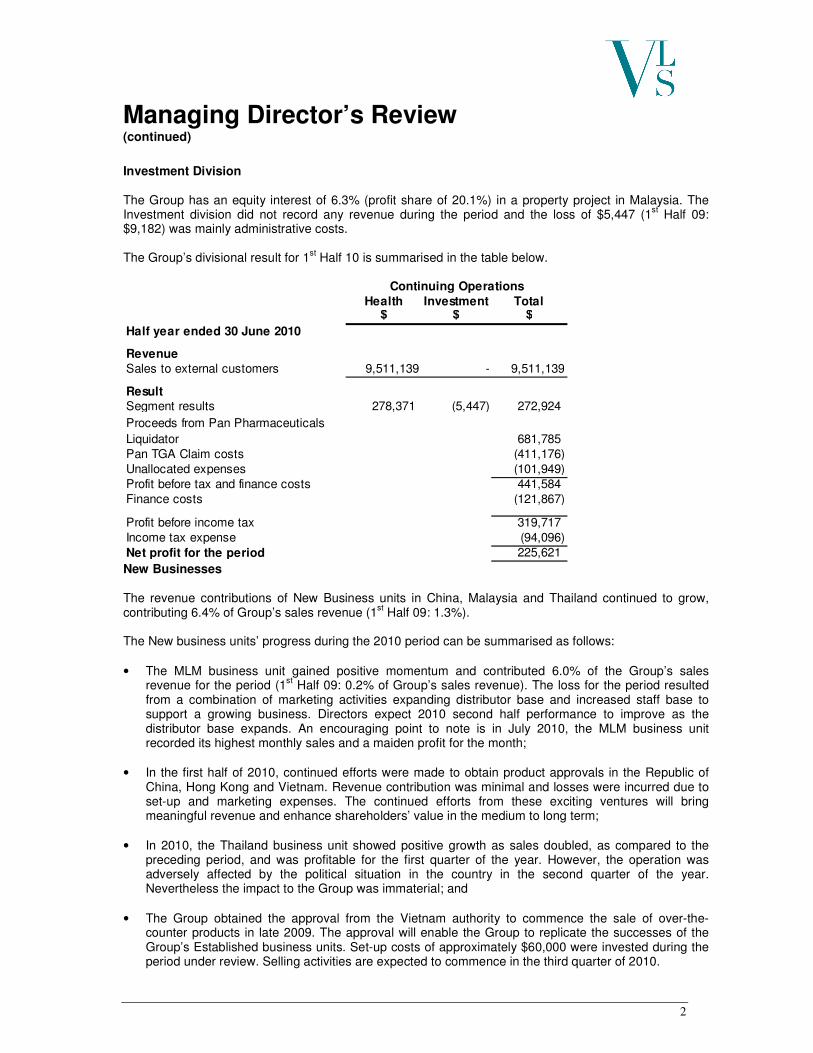
Investment Division The Group has an equity interest of 6.3% (profit share of 20.1%) in a property project in Malaysia. The Investment division did not record any revenue during the period and the loss of $5,447 (1
st Half 09:
$9,182) was mainly administrative costs. The Group’s divisional result for 1
st Half 10 is summarised in the table below.
Health Investment Total$ $ $
Half year ended 30 June 2010
RevenueSales to external customers 9,511,139 - 9,511,139
ResultSegment results 278,371 (5,447) 272,924
Proceeds from Pan Pharmaceuticals
Liquidator 681,785Pan TGA Claim costs (411,176)Unallocated expenses (101,949)Profit before tax and finance costs 441,584Finance costs (121,867)
Profit before income tax 319,717Income tax expense (94,096)
Net profit for the period 225,621
Continuing Operations
New Businesses The revenue contributions of New Business units in China, Malaysia and Thailand continued to grow, contributing 6.4% of Group’s sales revenue (1
st Half 09: 1.3%).
The New business units’ progress during the 2010 period can be summarised as follows: • The MLM business unit gained positive momentum and contributed 6.0% of the Group’s sales
revenue for the period (1st Half 09: 0.2% of Group’s sales revenue). The loss for the period resulted
from a combination of marketing activities expanding distributor base and increased staff base to support a growing business. Directors expect 2010 second half performance to improve as the distributor base expands. An encouraging point to note is in July 2010, the MLM business unit recorded its highest monthly sales and a maiden profit for the month;
• In the first half of 2010, continued efforts were made to obtain product approvals in the Republic of China, Hong Kong and Vietnam. Revenue contribution was minimal and losses were incurred due to set-up and marketing expenses. The continued efforts from these exciting ventures will bring meaningful revenue and enhance shareholders’ value in the medium to long term;
• In 2010, the Thailand business unit showed positive growth as sales doubled, as compared to the
preceding period, and was profitable for the first quarter of the year. However, the operation was adversely affected by the political situation in the country in the second quarter of the year. Nevertheless the impact to the Group was immaterial; and
• The Group obtained the approval from the Vietnam authority to commence the sale of over-the-
counter products in late 2009. The approval will enable the Group to replicate the successes of the Group’s Established business units. Set-up costs of approximately $60,000 were invested during the period under review. Selling activities are expected to commence in the third quarter of 2010.
Managing Director’s Review (continued)

3
Cash flow The table below summarises the cash movements during the period.
30 June 2010
$'000
Reported Profit Before Interest, Tax, Depreciation & Amortisation (EBITDA) 496
Less: Proceeds from Pan Pharmaceuticals Liquidator (682)
Add: TGA Claim's legal and professional costs 411
EBITDA from operations 225
Increase / decrease in assets and liabilities (1 Jan - 30 June 2010)
Increase in trade and other receivables (2)
Increase in inventories (880)
Increase in other assets (75)
Decrease in trade and other payables 772
Decrease in other liabilities 80
120
Proceeds from Pan Pharmaceuticals Liquidator 682
TGA Claim's legal and professional costs (411)
Effect of foreign exchange translation of assets and liabilities 273
Adjustment for non-cash items (17)
Interest expense (net) (119)
Income tax expense (94)
Net cash flows from operating activities 434
Net cash flows used in investing activities (86)
Net cash flows used in financing activities (125)
Cash movement during the period 223 The operating net inflow of $0.44 million (1
st Half 09: Net outflow of $0.49 million) was largely attributed to
the proceeds from Pan Pharmaceuticals Liquidator and the foreign currency translation of Group’s assets and liabilities of $0.68 million and $0.27 million respectively. Overall, the net cash inflow for the period was $0.22 million (1
st Half 09: Net cash outflow $0.69 million)
for the aforementioned reasons, $0.09 million purchases of property, plant and equipment, and a $0.12 million loan to the Group’s associate. At 30 June 2010, the Group’s cash and cash equivalent position was $1.22 million (1
st Half 09: $1.08
million).
Managing Director’s Review (continued)
4
Outlook for the Second Half of 2010 The Health division’s Established Business sales are expected to continue a similar sales growth trend for the full financial year. The New Business units in China, Malaysia and Thailand are expected to continue to expand. The Group’s operating performance remains encouraging. However, the Pan TGA Claim costs are expected to negatively impact the Group’s full year financial results. Eddie L S Tie Managing Director
20 August 2010
Managing Director’s Review (continued)

5
Directors’ Report
The Directors of Vita Life Sciences Limited (“Company” or “Vita Life”) submit their report together with the financial report for Vita Life and its controlled entities for the half year ended 30 June 2010.
DIRECTORS
The names of the Company’s directors in office throughout and since the end of the last financial year are set out below. Mr V R Gould Non-executive chairman Mr Eddie L S Tie Managing director Mr J S Sharman Non-executive director All directors have been in office since the start of the financial year to the date of this report unless otherwise stated.
PRINCIPAL ACTIVITIES
During the period in review the principal continuing activities of the consolidated entity consisted of formulating, packaging, sales and distribution of vitamins and supplements and investment.
OPERATING AND FINANCIAL REVIEW
Operating Results for the Half Year
For the reporting period the economic entity recorded a consolidated profit after tax attributable to members of $225,621 (2009: Loss after tax of $365,964).
DIVIDENDS
No dividend was declared or paid during the half year ended 30 June 2010.
SIGNIFICANT EVENTS AFTER BALANCE DATE
There is no subsequent event after balance date that affects the operating results or financial position of the Company and its subsidiaries.
AUDITOR’S INDEPENDENCE DECLARATION
The Directors have received an Independence Declaration from the external auditor, Russell Bedford NSW. A copy of this Declaration follows the Directors Report. Signed in accordance with a resolution of the Directors
Eddie L S Tie Managing Director 20 August 2010

7
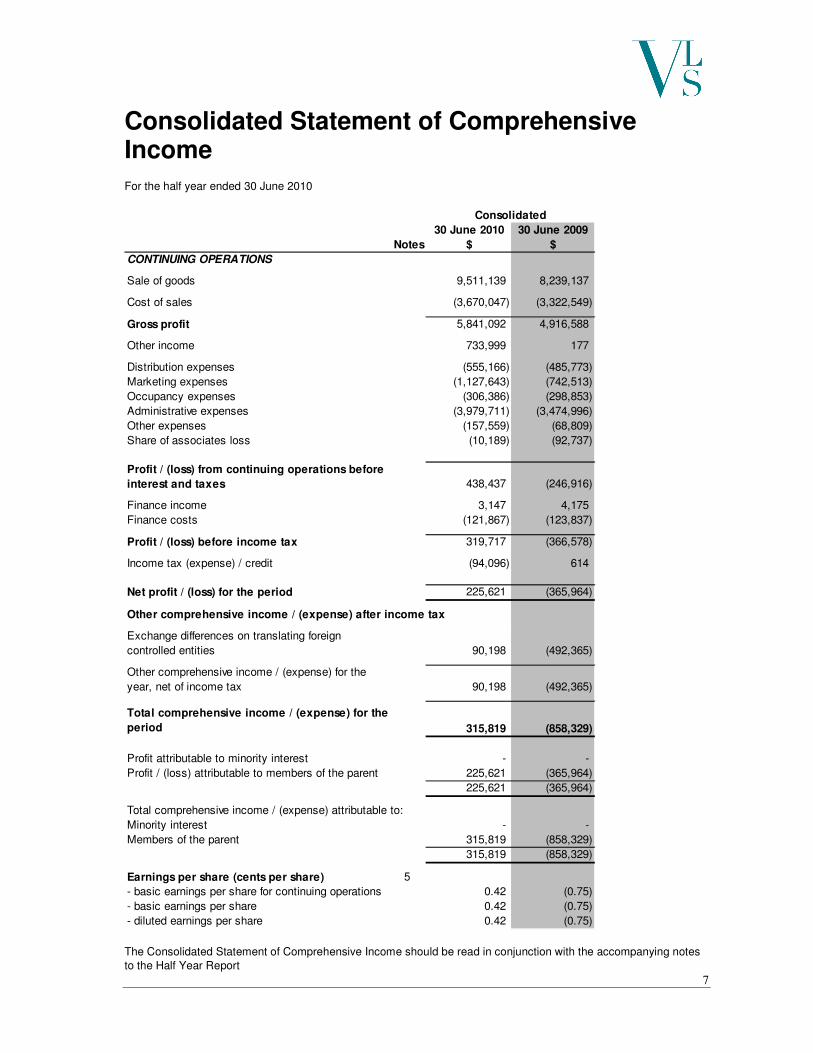
Consolidated Statement of Comprehensive Income
For the half year ended 30 June 2010
30 June 2010 30 June 2009
Notes $ $
CONTINUING OPERATIONS
Sale of goods 9,511,139 8,239,137
Cost of sales (3,670,047) (3,322,549)
Gross profit 5,841,092 4,916,588
Other income 733,999 177
Distribution expenses (555,166) (485,773)
Marketing expenses (1,127,643) (742,513)
Occupancy expenses (306,386) (298,853)
Administrative expenses (3,979,711) (3,474,996)
Other expenses (157,559) (68,809)
Share of associates loss (10,189) (92,737)
Profit / (loss) from continuing operations before
interest and taxes 438,437 (246,916)
Finance income 3,147 4,175
Finance costs (121,867) (123,837)
Profit / (loss) before income tax 319,717 (366,578)
Income tax (expense) / credit (94,096) 614
Net profit / (loss) for the period 225,621 (365,964)
Other comprehensive income / (expense) after income tax
Exchange differences on translating foreign
controlled entities 90,198 (492,365)
Other comprehensive income / (expense) for the
year, net of income tax 90,198 (492,365)
Total comprehensive income / (expense) for the
period 315,819 (858,329)
Profit attributable to minority interest - -
Profit / (loss) attributable to members of the parent 225,621 (365,964)
225,621 (365,964)
Total comprehensive income / (expense) attributable to:
Minority interest - -
Members of the parent 315,819 (858,329)
315,819 (858,329)
Earnings per share (cents per share) 5
- basic earnings per share for continuing operations 0.42 (0.75)
- basic earnings per share 0.42 (0.75)
- diluted earnings per share 0.42 (0.75)
Consolidated
The Consolidated Statement of Comprehensive Income should be read in conjunction with the accompanying notes
to the Half Year Report
8
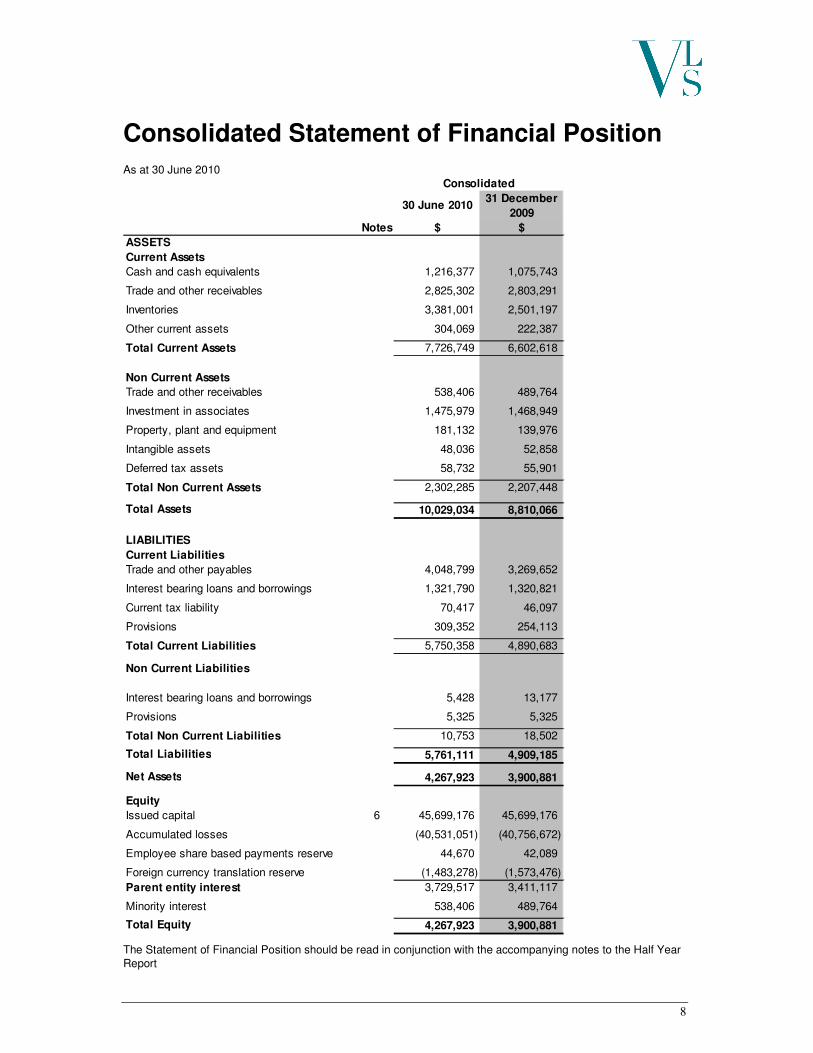
Consolidated Statement of Financial Position
As at 30 June 2010
30 June 201031 December
2009
Notes $ $
ASSETS
Current Assets
Cash and cash equivalents 1,216,377 1,075,743
Trade and other receivables 2,825,302 2,803,291
Inventories 3,381,001 2,501,197
Other current assets 304,069 222,387
Total Current Assets 7,726,749 6,602,618
Non Current Assets
Trade and other receivables 538,406 489,764
Investment in associates 1,475,979 1,468,949
Property, plant and equipment 181,132 139,976
Intangible assets 48,036 52,858
Deferred tax assets 58,732 55,901
Total Non Current Assets 2,302,285 2,207,448
Total Assets 10,029,034 8,810,066
LIABILITIES
Current Liabilities
Trade and other payables 4,048,799 3,269,652
Interest bearing loans and borrowings 1,321,790 1,320,821
Current tax liability 70,417 46,097
Provisions 309,352 254,113
Total Current Liabilities 5,750,358 4,890,683
Non Current Liabilities
Interest bearing loans and borrowings 5,428 13,177
Provisions 5,325 5,325
Total Non Current Liabilities 10,753 18,502
Total Liabilities 5,761,111 4,909,185
Net Assets 4,267,923 3,900,881
Equity
Issued capital 6 45,699,176 45,699,176
Accumulated losses (40,531,051) (40,756,672)
Employee share based payments reserve 44,670 42,089
Foreign currency translation reserve (1,483,278) (1,573,476)
Parent entity interest 3,729,517 3,411,117
Minority interest 538,406 489,764
Total Equity 4,267,923 3,900,881
Consolidated
The Statement of Financial Position should be read in conjunction with the accompanying notes to the Half Year Report
9
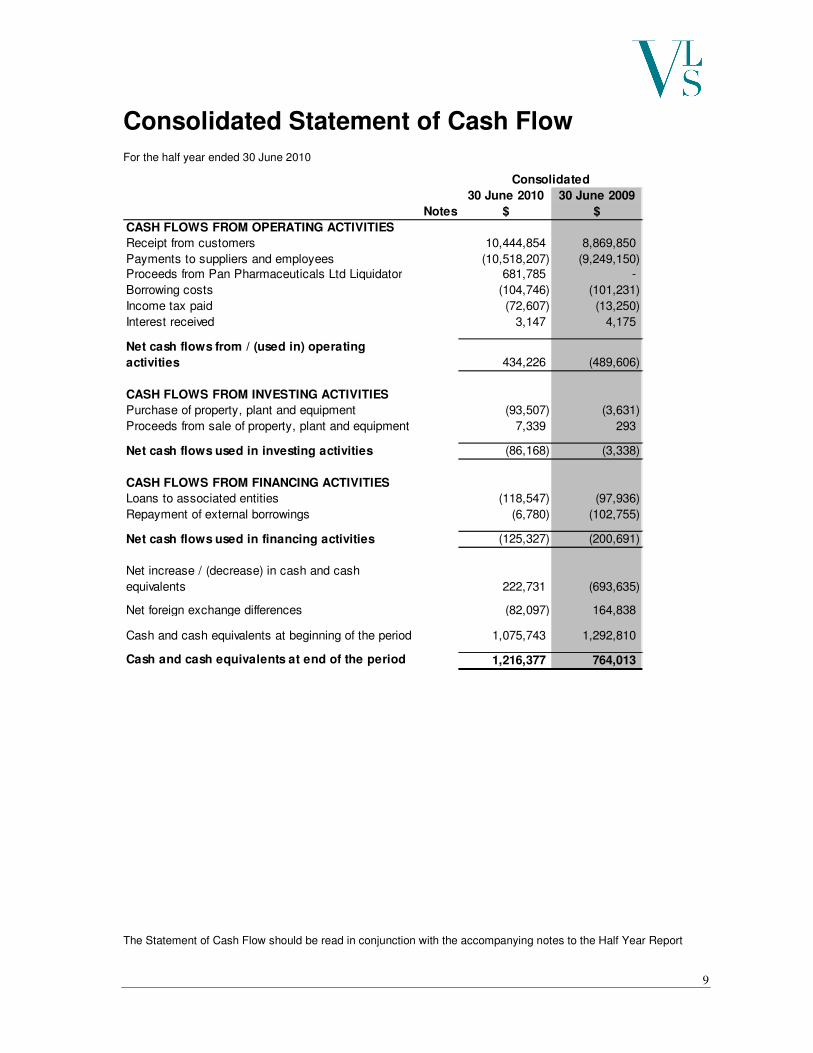
Consolidated Statement of Cash Flow
For the half year ended 30 June 2010
30 June 2010 30 June 2009
Notes $ $
CASH FLOWS FROM OPERATING ACTIVITIES
Receipt from customers 10,444,854 8,869,850
Payments to suppliers and employees (10,518,207) (9,249,150)Proceeds from Pan Pharmaceuticals Ltd Liquidator 681,785 -
Borrowing costs (104,746) (101,231)
Income tax paid (72,607) (13,250)
Interest received 3,147 4,175
Net cash flows from / (used in) operating
activities 434,226 (489,606)
CASH FLOWS FROM INVESTING ACTIVITIES
Purchase of property, plant and equipment (93,507) (3,631)
Proceeds from sale of property, plant and equipment 7,339 293
Net cash flows used in investing activities (86,168) (3,338)
CASH FLOWS FROM FINANCING ACTIVITIES
Loans to associated entities (118,547) (97,936)
Repayment of external borrowings (6,780) (102,755)
Net cash flows used in financing activities (125,327) (200,691)
Net increase / (decrease) in cash and cash
equivalents 222,731 (693,635)
Net foreign exchange differences (82,097) 164,838
Cash and cash equivalents at beginning of the period 1,075,743 1,292,810
Cash and cash equivalents at end of the period 1,216,377 764,013
Consolidated
The Statement of Cash Flow should be read in conjunction with the accompanying notes to the Half Year Report

10
Consolidated Statement of Changes in Equity
for the half year ended 30 June 2010
$ $ $ $ $ $ $
CONSOLIDATED
Balance at 1 Jan 2009 44,549,823 (40,428,479) 30,009 (928,498) 3,222,855 622,769 3,845,624
Loss attributable to members of parent entity - (365,964) - - (365,964) - (365,964)
Employee share option scheme - - 3,536 - 3,536 - 3,536
Exchange difference on translation of minority
interests - - - - - (96,268) (96,268)
Total comprehensive expense for the period - - - (492,365) (492,365) - (492,365)
Balance at 30 June 2009 44,549,823 (40,794,443) 33,545 (1,420,863) 2,368,062 526,501 2,894,563
Balance at 1 Jan 2010 45,699,176 (40,756,672) 42,089 (1,573,476) 3,411,117 489,764 3,900,881
Profit attributable to members of parent entity - 225,621 - - 225,621 - 225,621
Employee share option scheme - - 2,581 - 2,581 - 2,581
Exchange difference on translation of minority
interests - - - - - 48,642 48,642
Total comprehensive income for the period - - - 90,198 90,198 - 90,198
Balance at 30 June 2010 45,699,176 (40,531,051) 44,670 (1,483,278) 3,729,517 538,406 4,267,923
Total
Issued
Capital Accumulated
Losses
Employee Share
Based Payments
Reserve
Foreign
Currency
Translation
Reserve
Attributable to
Equity Holders of
Parent
Minority
Interests
The Statement of Changes in Equity should be read in conjunction with the accompanying notes to the Half Year Report

11
Notes to the Financial Statements
for the half year ended 30 June 2010
1. CORPORATE INFORMATION
The Half Year financial report of Vita Life Sciences Limited (“Vita Life”) for the half year ended 30 June 2010 was authorised for issue by a resolution of the directors on 20 August 2010. Vita Life is a Company limited by shares incorporated and domiciled in Australia whose shares are publicly traded on the Australian Securities Exchange (“ASX”). The nature of the operations and principal activities of the Group are described in the Director’s Report.
2. BASIS OF PREPARATION
The Half Year financial report is a general-purpose financial report, which has been prepared in accordance with the requirements of the Corporations Act 2001 and applicable Accounting Standards including AASB 134 Interim Financial Reporting. Compliance with Accounting Standards ensures that the financial statements notes comply with International Financial Reporting Standards. The financial report has also been prepared on a historical cost basis. The Half Year financial report does not include all notes of the type normally included within the annual financial report and therefore cannot be expected to provide as full an understanding of the financial performance, financial position and financing and investing activities of the consolidated entity as the full financial report. It is recommended that the Half Year financial report be read in conjunction with the annual report for the year ended 31 December 2009 and considered together with any public announcements made by Vita Life Sciences Limited during the half year ended 30 June 2010 in accordance with the continuous disclosure obligations of the ASX Listing Rules. The financial report is presented in Australian dollars. The accounting policies adopted are consistent with those in prior reporting periods.

12
3. SEGMENT REPORTING
Australia Singapore Malaysia Others Total$ $ $ $ $
Half year ended 30 June
2010
RevenueSales to external customers 4,520,340 1,686,146 3,173,052 131,601 9,511,139
Segment resultsProfit / (loss) before tax and
finance costs 292,245 # 135,179 91,466 (67,117) 451,773
Finance costs (104,665) (662) (15,245) (1,295) (121,867)Share of loss of associates - - (10,189) - (10,189)Profit before income tax 319,717Income tax expense (94,096)
Net profit for the period 225,621
Assets and liabilities
Segment assets 4,550,568 1,339,960 2,506,911 155,616 8,553,055 Investment in associates 1,475,979 Total assets 10,029,034
Segment liabilities 3,856,533 743,012 1,119,908 41,658 5,761,111
Total liabilities 5,761,111
Other segment Capital expenditure (2,034) (853) (90,075) (545) (93,507)Depreciation (12,507) (6,527) (24,979) (8,354) (52,367)Amortisation - (1,297) (3,669) - (4,966)
Continuing Operations
# Includes legal and professional costs incurred in Australia associated with claim against the Therapeutic Goods Administration (“TGA”) / Commonwealth of Australia of $0.41 million and proceed from Pan Pharmaceutical Liquidator of $0.68 million.
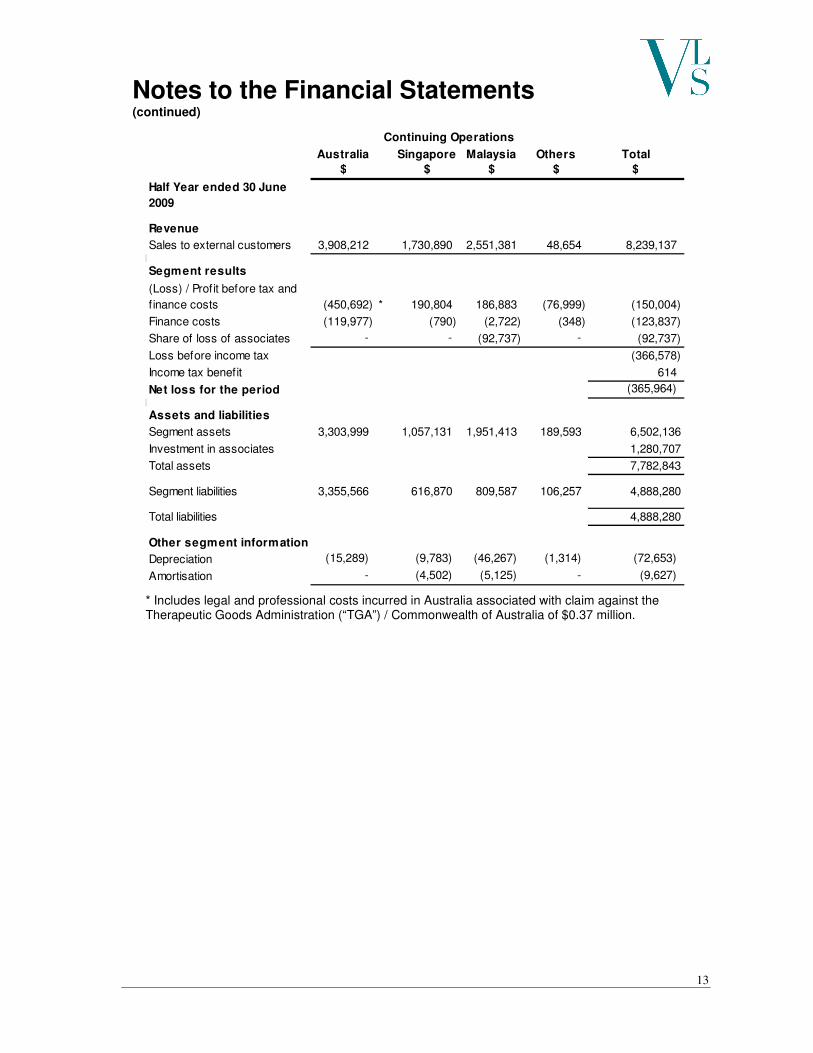
Notes to the Financial Statements (continued)
13
Australia Singapore Malaysia Others Total
$ $ $ $ $
Half Year ended 30 June
2009
Revenue
Sales to external customers 3,908,212 1,730,890 2,551,381 48,654 8,239,137
Segment results
(Loss) / Profit before tax and
finance costs (450,692) * 190,804 186,883 (76,999) (150,004)
Finance costs (119,977) (790) (2,722) (348) (123,837)
Share of loss of associates - - (92,737) - (92,737)
Loss before income tax (366,578)
Income tax benefit 614
Net loss for the period (365,964)
Assets and liabilities
Segment assets 3,303,999 1,057,131 1,951,413 189,593 6,502,136
Investment in associates 1,280,707
Total assets 7,782,843
Segment liabilities 3,355,566 616,870 809,587 106,257 4,888,280
Total liabilities 4,888,280
Other segment information
Depreciation (15,289) (9,783) (46,267) (1,314) (72,653)
Amortisation - (4,502) (5,125) - (9,627)
Continuing Operations
* Includes legal and professional costs incurred in Australia associated with claim against the Therapeutic Goods Administration (“TGA”) / Commonwealth of Australia of $0.37 million.
Notes to the Financial Statements (continued)
14
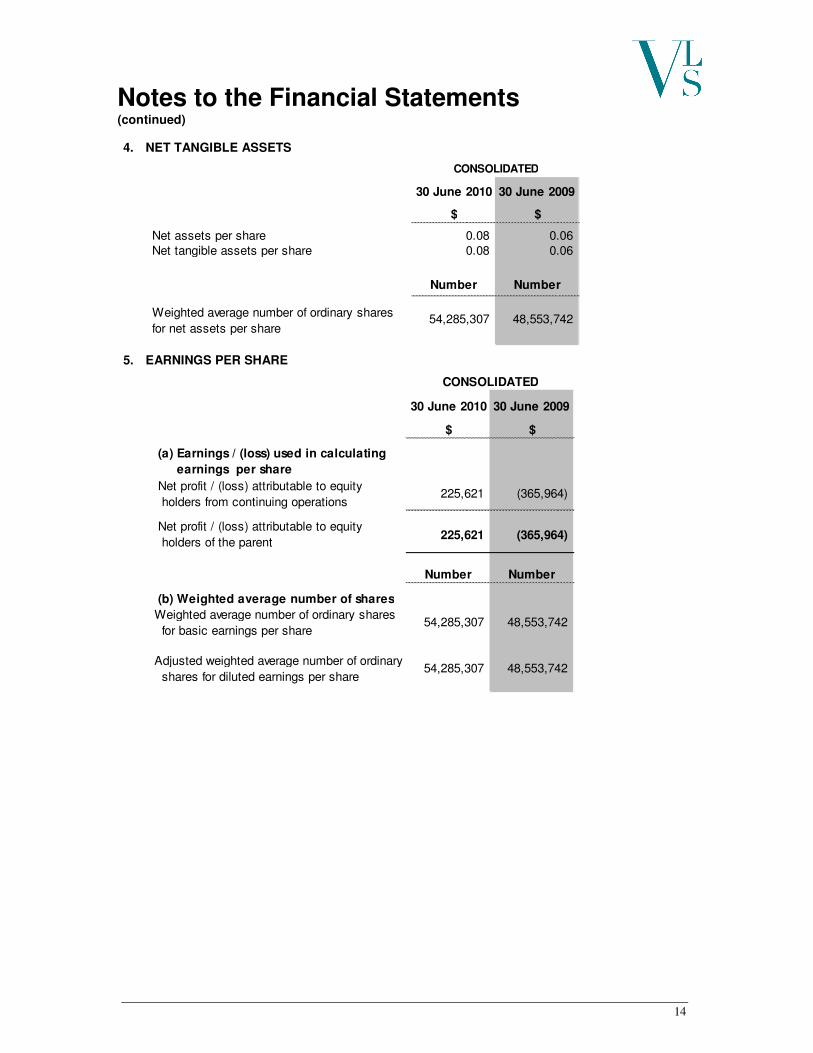
4. NET TANGIBLE ASSETS
30 June 2010 30 June 2009
$ $
Net assets per share 0.08 0.06 Net tangible assets per share 0.08 0.06
Number Number
54,285,307 48,553,742
CONSOLIDATED
Weighted average number of ordinary shares
for net assets per share
5. EARNINGS PER SHARE
30 June 2010 30 June 2009
$ $
(a) Earnings / (loss) used in calculating
earnings per share
Net profit / (loss) attributable to equity
holders from continuing operations 225,621 (365,964)
Net profit / (loss) attributable to equity
holders of the parent 225,621 (365,964)
Number Number
(b) Weighted average number of shares
Weighted average number of ordinary shares
for basic earnings per share54,285,307 48,553,742
Adjusted weighted average number of ordinary
shares for diluted earnings per share54,285,307 48,553,742
CONSOLIDATED
Notes to the Financial Statements (continued)

15
6. CONTRIBUTED EQUITY
30 June 201031 December
200930 June 2010
31 December
2009
Number Number $ $
Issued and paid up capital
Ordinary shares 54,285,307 54,285,307 45,699,176 45,699,176
Ordinary shares
Balance at beginning of the period/ year 54,285,307 48,580,228 45,699,176 44,549,823
Shares issued during the year - 6,250,000 - 1,250,000
Share issue costs - - - (54,302)
Share buy back - (254,921) - (46,345)
Cancellation of Plan Shares of certain
employees and Director - (1,375,000) - -
Issued of shares to employee / director - 1,085,000 - -
Balance at end of the period/ year 54,285,307 54,285,307 45,699,176 45,699,176
7. COMMITMENTS
There are no significant changes to the commitments as previously disclosed in the Annual Report for the financial year ended 31 December 2009.
8. EVENTS AFTER THE BALANCE SHEET DATE
There is no subsequent event after balance date that affects the operating results or financial position of the Company and its subsidiaries.
9. CONTINGENCIES
Contingent assets
Pan TGA Claim
From 2003 onwards, the Group suffered substantial losses as a consequence of the Pan (In Liquidation) product recall which resulted from regulatory action taken by the Therapeutic Goods Administration (“TGA”) against Pan in April 2003. The Group filed a Statement of Claim against the Commonwealth of Australia in April 2009 for alleged misfeasance in public office and negligence by the TGA and its officers. The legal case is presently in the “discovery” stage with a hearing expected in early 2011. The quantum of the Company’s damages is currently being evaluated by an independent expert. The Company has incurred legal and professional expenses of $411,176 for the period ended 30 June 2010 (2009: $372,337).
Notes to the Financial Statements (continued)
16
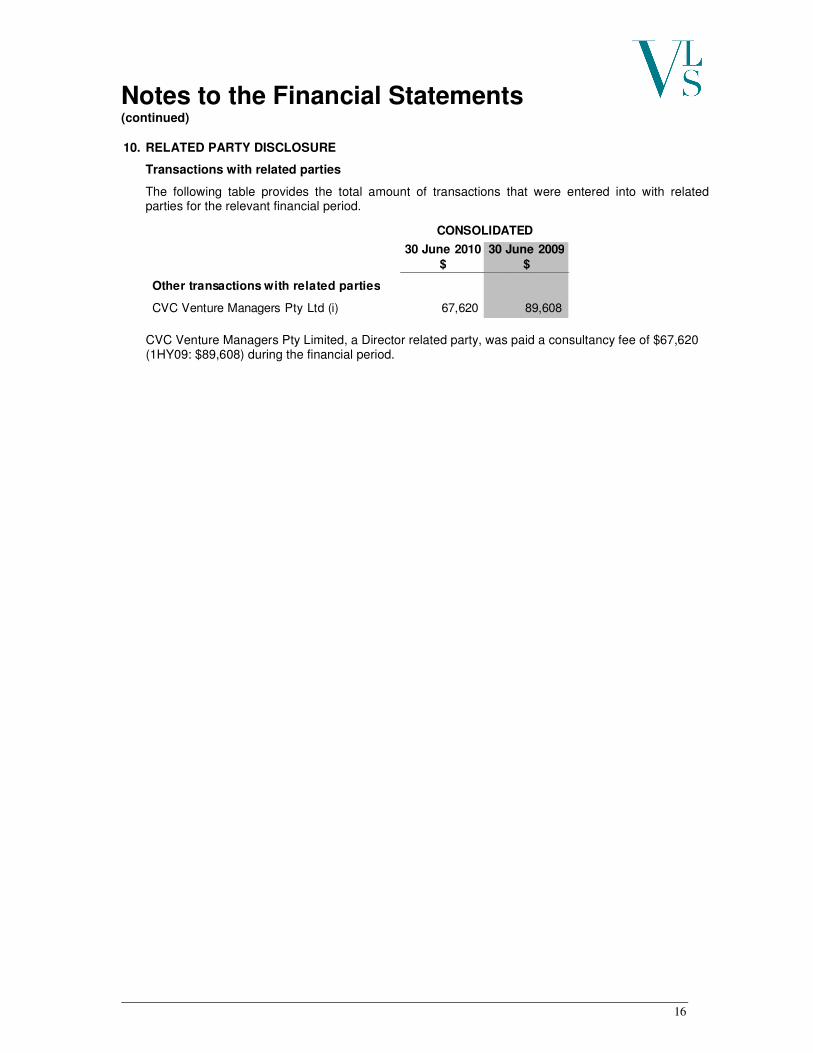
10. RELATED PARTY DISCLOSURE
Transactions with related parties
The following table provides the total amount of transactions that were entered into with related parties for the relevant financial period.
30 June 2010 30 June 2009
$ $
Other transactions with related parties
CVC Venture Managers Pty Ltd (i) 67,620 89,608
CONSOLIDATED
CVC Venture Managers Pty Limited, a Director related party, was paid a consultancy fee of $67,620 (1HY09: $89,608) during the financial period.
Notes to the Financial Statements (continued)

17
Directors’ Declaration
In the opinion of the directors of Vita Life Sciences Limited:
1. (a) The financial statements and notes of the consolidated entity are in accordance with the Corporations Act 2001, including:
(i) giving a true and fair view of the consolidated entity’s financial position as at 30 June 2010 and its performance for the half-year ended on that date; and
(ii) complying with Accounting Standard AASB 134 Interim Financial Reporting, Corporations Regulations 2001 and other mandatory professional reporting requirements.
(b) There are reasonable grounds to believe that the consolidated entity will be able to pay its debts as and when they become due and payable.
Signed in accordance with a resolution of the directors:
Eddie L S Tie
Managing Director
20 August 2010

20
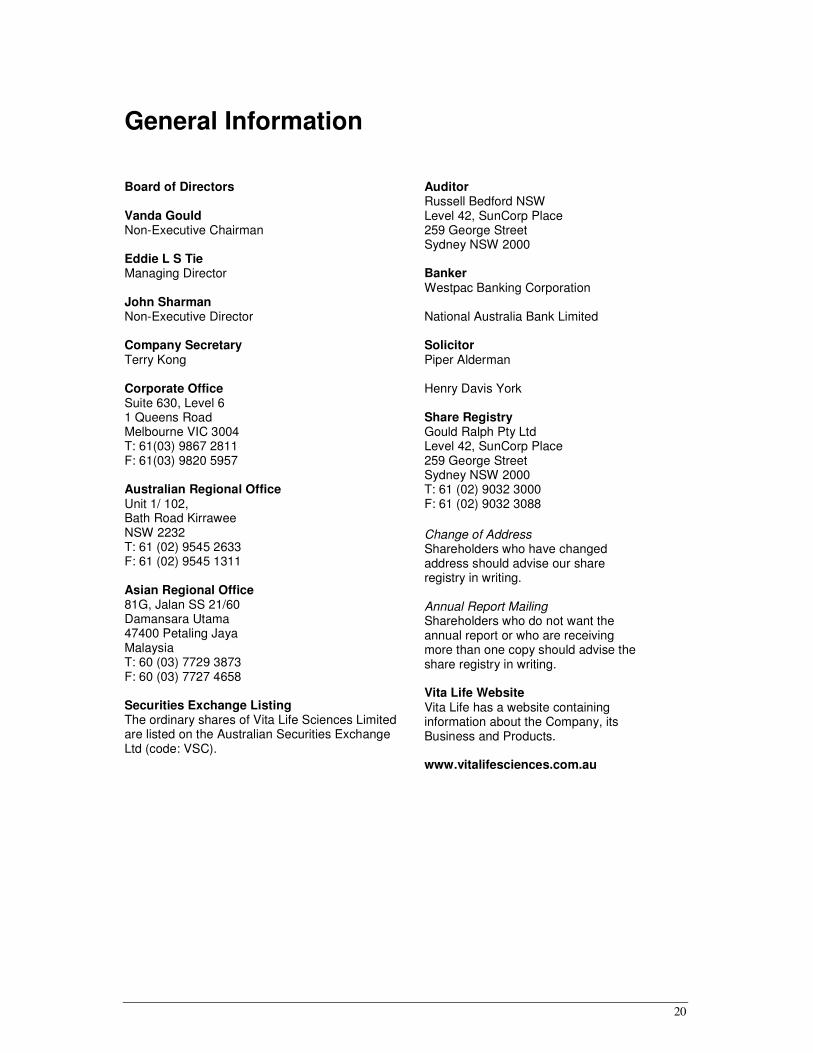
General Information
Board of Directors Vanda Gould Non-Executive Chairman Eddie L S Tie Managing Director John Sharman Non-Executive Director Company Secretary Terry Kong Corporate Office Suite 630, Level 6 1 Queens Road Melbourne VIC 3004 T: 61(03) 9867 2811 F: 61(03) 9820 5957 Australian Regional Office Unit 1/ 102, Bath Road Kirrawee NSW 2232 T: 61 (02) 9545 2633 F: 61 (02) 9545 1311 Asian Regional Office 81G, Jalan SS 21/60 Damansara Utama 47400 Petaling Jaya Malaysia T: 60 (03) 7729 3873 F: 60 (03) 7727 4658 Securities Exchange Listing The ordinary shares of Vita Life Sciences Limited are listed on the Australian Securities Exchange Ltd (code: VSC).
Auditor Russell Bedford NSW Level 42, SunCorp Place 259 George Street Sydney NSW 2000 Banker Westpac Banking Corporation National Australia Bank Limited Solicitor Piper Alderman Henry Davis York Share Registry Gould Ralph Pty Ltd Level 42, SunCorp Place 259 George Street Sydney NSW 2000 T: 61 (02) 9032 3000 F: 61 (02) 9032 3088
Change of Address Shareholders who have changed address should advise our share registry in writing. Annual Report Mailing Shareholders who do not want the annual report or who are receiving more than one copy should advise the share registry in writing. Vita Life Website Vita Life has a website containing information about the Company, its Business and Products. www.vitalifesciences.com.au

21