Embed Size (px)
Citation preview
Vital Dye Reaction and Granule Localization in Periplasmof Escherichia coliLiyan Ping1*, Despoina A. I. Mavridou2, Eldon Emberly3*, Martin Westermann4, Stuart J. Ferguson2*
1Department of Bioorganic Chemistry, Max Planck Institute for Chemical Ecology, Jena, Germany, 2Department of Biochemistry, University of Oxford, Oxford, United
Kingdom, 3 Physics Department, Simon Fraser University, Burnaby, British Columbia, Canada, 4Centre of Electron microscopy, The University Hospital, Friedrich Schiller
University of Jena, Jena, Germany
Abstract
Background: Tetrazolium salts are widely used in biology as indicators of metabolic activity – hence termed vital dyes – buttheir reduction site is still debated despite decades of intensive research. The prototype, 2,3,5- triphenyl tetrazoliumchloride, which was first synthesized a century ago, often generates a single formazan granule at the old pole of Escherichiacoli cells after reduction. So far, no explanation for their pole localization has been proposed.
Method/Principal Findings: Here we provide evidence that the granules form in the periplasm of bacterial cells. A source ofreducing power is deduced to be thiol groups destined to become disulfides, since deletion of dsbA, coding for thiol-oxidase, enhances the formation of reduced formazan. However, pervasive reduction did not result in a random distributionof formazan aggregates. In filamentous cells, large granules appear at regular intervals of about four normal cell-lengths,consistent with a diffusion-to-capture model. Computer simulations of a minimal biophysical model showed that the polelocalization of granules is a spontaneous process, i.e. small granules in a normal size bacterium have lower energy at thepoles. This biased their diffusion to the poles. They kept growing there and eventually became fixed.
Conclusions:We observed that formazan granules formed in the periplasm after reduction of tetrazolium, which calls for re-evaluation of previous studies using cell-free systems that liberate inaccessible intracellular reductant and potentiallygenerate artifacts. The localization of formazan granules in E. coli cells can now be understood. In living bacteria, the seedsformed at or migrated to the new pole would become visible only when that new pole already became an old pole, becauseof the relatively slow growth rate of granules relative to cell division.
Citation: Ping L, Mavridou DAI, Emberly E, Westermann M, Ferguson SJ (2012) Vital Dye Reaction and Granule Localization in Periplasm of Escherichia coli. PLoSONE 7(6): e38427. doi:10.1371/journal.pone.0038427
Editor: Benfang Lei, Montana State University, United States of America
Received April 13, 2012; Accepted May 9, 2012; Published June 4, 2012
Copyright: � 2012 Ping et al. This is an open-access article distributed under the terms of the Creative Commons Attribution License, which permits unrestricteduse, distribution, and reproduction in any medium, provided the original author and source are credited.
Funding: This work was funded by NSERC and the Canadian Institute for Advanced Research (CIFAR), the Wellcome Trust (grant number 092532) and the Max-Planck Society. The funders had no role in study design, data collection and analysis, decision to publish, or preparation of the manuscript.
Competing Interests: The authors have declared that no competing interests exist.
* E-mail: [email protected] (LP); [email protected] (EE); [email protected] (SJF)
Introduction
Tetrazolium salts have been widely used in assays that measure
cell proliferation. Some of them form water-soluble formazans
after reduction, while others form insoluble granules [1]. Their
applications in eukaryotic systems are exemplified by the large-
scale drug-screening programs hosted by the National Institutes of
Health. These dyes also have applications in microbiology, e.g., 5-
cyano-2,3-ditolyl tetrazolium chloride (CTC) was used to enu-
merate metabolically active bacteria in environmental samples
[1,2,3] as well as in stationary phase cultures [4]. The rationale
behind these applications is that in a cell culture or living tissue,
dye reduction is proportional to cell metabolic activity. However,
not all living cells in a culture show the reduction activity, and
reduction is significantly influenced by factors such as the type of
dye, the pH of the medium, and cell line in use [1,3,5].
Understanding the reduction mechanism is therefore critical for
developing the next generation of dyes as well as for evaluating
current results. As vital dyes, tetrazolium salts are known to accept
hydrogen from the respiratory oxidation system, and is often
assumed to be reduced intracellularly [1,6].However, the use of cell-
free systems to identify reduction sites has been only partially
successful in eukaryotic systems [1]. Accumulating evidence
indicates that in vivo reduction pathways are very different from
those in in vitro systems, e.g. inhibitors of the succinate:ubiquinone
oxidoreductase pathway can completely block CTC reduction in
membrane vesicles but have no effect on intact Escherichia coli cells
[7].
2,3,5- triphenyl tetrazolium chloride (TTC) was synthesized
a century ago and is the prototype of all tetrazolium dyes [1].
Lederberg applied it toE. coli in 1948, and observed large granules at
one of the two cell poles [8]. Berg and Turner used these granules as
the pole marker to study cell orientation in swimming bacteria [9].
One of the two bacterial cell poles is derived from the septum (new
pole), while the other is inherited from the parental generation (old
pole) [10]. We have shown previously that the granules were often
located at the old pole [11]. Spontaneous localization of self-
aggregating proteins in bacteria has been described for membrane
receptors [10,12], cytoplasmic proteins such as DivIVA [13,14] and
PopZ [15,16], andmisfolded proteins [17]. A variety of mechanisms
have been proposed to explain the patterns fromdiffusion to capture
[18], to membrane curvature [19,20] and to nucleoid occlusion
PLoS ONE | www.plosone.org 1 June 2012 | Volume 7 | Issue 6 | e38427

[17,21]. Here, we provide for the first time experimental and
theoretical evidence that TTC is reduced in the periplasm and that
aggregation of small molecules, such as the reduced formazan, at the
cell poles is a spontaneous process.
Results and Discussion
Granules Formed in the Periplasm of E. coli CellsFormazan granules are often found at the old pole of E. coli
cells. We have already shown that the granules refracted
fluorescence from GFP fused to the membrane serine receptor
Tsr, making the pole look dimmer than non-treated cells [11],
suggesting an out-of-membrane localization. When E. coli cells
were fractionated as described by Ausubel et al. [22] with the
EDTA (ethylenediaminetetraacetate) treatment step omitted,
after digestion of the outer cell membrane and release of the
periplasm; the insoluble granules were obviously floating in the
periplasmic fraction (Data not shown). Transmission electron
microscopy (TEM) performed on strain LMG194 that was
employed for studying granules localization before [11]
confirmed that large formazan granules were mainly formed
in the periplasm and localized at the poles of the cell (Fig. 1).
Using TEM we were also able to detect randomly distributed
tiny lateral granules (Fig. 1C), which would not be observed by
light microscopy. It is worth noting that the formazan granules
are electron lucent due to their chemical composition, and even
slightly lighter than the areas of the periplasm devoid of
granules on TEM images. We only consider that a tiny granule
is present when we observe a particle with low uniform electron
density that is at least twice as thick as the width of the
periplasm and is clearly bound by the electron dense
cytoplasmic membrane and cell wall. In some cases, concentric
contour lines on the cutting surface of the granule were also
visible (Fig. 1E), suggesting that formazan had precipitated layer
by layer. At many locations on the TEM images, the triple-
layered cytoplasmic membrane was clearly visible (Fig. 1F),
demonstrating that neither the granule formation nor the
sample preparation caused any mechanical damage or dissolu-
tion of the cytoplasmic membrane [23]. Granules that were not
large enough to be visualized under the light microscope were
cap-shaped (Fig. 1H). The centers of these granules were often
located on one side of the pole cap. The large granules visible
under the light microscope were round on the tip side and
exhibited random extrusions on the side facing the cytoplasmic
membrane (Fig. 1I).
A great number of enzymatic and non-enzymatic biological
reductants are known to reduce tetrazolium dyes in vitro [1].
However, most of these molecules are inaccessible to the vital dyes
in a living cell. To our knowledge, the experiments presented here
provide the first evidence that reduced formazan forms granules in
the bacterial periplasm (Fig. 1). The turgor pressure from the
cytoplasm probably plays an important role in shaping the
granules: they are cap-shaped at the cell pole when they are small
but compress the cytoplasmic membrane with random extrusions
when they are large. In long filamentous cells, the larger volume of
cytoplasm allows for a more extensive membrane deformation;
the granules at the pole can grow much larger and remain round
(Fig. S1).
The localization of formazan granules in living eukaryotic
cells has been shown to depend on the permeability of cellular
membranes to the dyes under investigation. 3-(4,5-dimethylthia-
zol-2-yl)-2,5-diphenyltetrazolium bromide (MTT) and TTC can
readily cross some eukaryotic plasma membranes [24,25], but
not the mitochondrial inner membrane [26]. CTC, however,
cannot efficiently pass through the eukaryotic plasma membrane
[24]. The majority of MTT-granules were formed adjacent to
the mitochondrial inner membrane [24,27], and most of the
CTC-granules co-localized with the plasma membrane [24,28].
It could be said that the bacterial cytoplasmic membrane plays
a dual role, that of the eukaryotic plasma membrane and of the
mitochondrial inner membrane. Therefore, the accumulation of
TTC-granules in the bacterial periplasm is consistent with the
localization of formazan granules in eukaryotic cells.
TTC Reduction PathwayTo elucidate the pathway of TTC reduction in the bacterial
periplasm, null mutants of proteins from two pathways that play
a major role in determining the redox state of this compartment
were analyzed (Table S1). Oxidative protein folding in the
periplasm of Gram-negative bacteria relies on the concerted
action of five proteins comprising the Disulfide bond formation
(Dsb) system that functions through a series of thiol-disulfide
exchange reactions. The thiol-oxidase DsbA is responsible for the
formation of disulfide bonds for proteins in the periplasm [29]. Its
active oxidized form is maintained by the transmembrane protein
DsbB, which is oxidized by ubiquinone [30]. Wrongly-formed
disulfide bonds are corrected by DsbC [31], which acquires its
reducing power from the transmembrane protein DsbD [32].
DsbD also reduces DsbG, which has a role in protecting single
cysteines from oxidation to sulfenic acid on folded periplasmic
proteins [33]. Another source of reducing power in the bacterial
periplasm is c-type cytochrome maturation (Ccm) system, specif-
ically the CcmG component which is a periplasmic thioredoxin-
like protein [34].
We tested mutants in the Dsb pathway that blocked either the
reducing power inlet (DdsbD) or the oxidizing power outlet
(DdsbA). The accumulation of formazan granules in DdsbD strain
showed no difference from the parental strain (Fig. 2). However,
the reduction of TTC was significantly enhanced in the DdsbAstrain under identical growth conditions. The extensive accumu-
lation of granules in the dsbA deletion strain was obvious even by
simply examining the intense red color of the cell culture (inset). In
the dsbA and dsbD double deletion strain, the formation of granules
was at the same levels as in the parental strain. When the whole
ccm operon was deleted, no change in granule formation was
observed (Fig. 2).
This result indicates that the reduction of TTC in bacterial cells
is rather non-specific. The redox potential in the periplasmic space
of E. coli cell is 2165 mV [35], while the reduction potential of
TTC at pH 6.72 is 280 mV [36]. Therefore, many components
of the bacterial periplasmic redox system can reduce TTC at
a physiological pH. The lack of the main oxidative protein DsbA,
nevertheless, resulted in a more reducing periplasm, which can
explain the enhanced TTC reduction. Very aerobic conditions
could compensate for the lack of DsbA; however, in the present
work the cells grew microaerobically. When the electron flow from
the cytoplasm was blocked through deleting DsbD, the TTC
reduction in the DdsbA strain returned to a level similar to that of
wild-type cells. The antagonistic effect of a dsbD deletion further
supported the assumption of non-specific reduction.
The electrons transferred into the periplasm by DsbD and
other transporters eventually go back to terminal oxidases and
oxygen [34,35]. We hereby tested the influence of the essential
isoprenoid quinone components of the respiratory electron
transport chain on TTC reduction. The reduction activity of
the ubiquinone-deficient strain AN385 under anoxic condition
and of the menaquinone-deficient strain AN386 under oxic
condition were not significantly different from the parent strain
Vital Dye Reaction in E. coli Cells
PLoS ONE | www.plosone.org 2 June 2012 | Volume 7 | Issue 6 | e38427

AN387 under same conditions (Table S1). However, in strain
AN384, which is deficient on both ubiquinone and metaquine,
TTC could not be reduced. This result is consistent with the
general assumption that the reducing power is derived from
cellular respiration and also the observation on Lactococcus lactis
cells, which perform lactic acid fermentation and contain only
menaquinone [37], deleting menaquinone biosynthesis genes in
L. lactis completely blocks the reduction of tetrazolium violet
[38]. Nevertheless, the existence of a major terminal reductase
for TTC that is DsbA-dependent could still be considered.
However, the tested potential periplasmic oxidoreductases,
including DsbD, CcmG, and CcmH (Our Ccm-null strain
includes deletion of CcmG and of the N-terminal domain of
CcmH) did not implicate any of these proteins.
Diffusion of Formazan in PeriplasmTTC is reduced non-specifically in the periplasm, but most cells
contain only one large granule at the pole [11]. To further
understand the mechanism of granule localization, we generated
filamentous cells using cephalexin [39] (Fig. 3). The average length
of filaments under investigation was 19.7 mm, which equals 9.4
normal cell-lengths (CLs). Here CL was defined as the average
length of newborn cells in a normal population (the value of the
lower quartile of a random sample was used for approximation
(n= 160). Like normal cells, 70% of the filaments contained a large
granule at the old pole (Fig. 3A). Lateral granules on filaments
were regularly spaced (Fig. 3 B). The average distance between
two formazan granules and between the granules and poles was
6.7 CLs. The most granule-rich region on the lateral periplasm
was about two CLs away from the new pole. Very few granules
Figure 1. Transmission electron microscopy images of E. coli cells containing formazan granules. Scale bars equal 400 nm. A,Longitudinal section of a control cell growing in medium without tetrazolium. B, Longitudinal section of a cell growing in the presence of TTC. Theformazan granule is located at the right pole of the cell. C, Expanded view of the boxed area in panel. The cytoplasmic membrane is indicated bya closed arrow. B. The small lateral granule is indicated by an open arrow. D, Expanded view of the pole area of the control cell. E, Expanded view ofthe pole of a cell growing in TTC. The concentric contour lines on the cutting surface of the granule are indicated by open arrowheads. F, A furtherexpanded picture of a cell pole, showing the concentric contour lines (open arrowhead) and the cytoplasmic membrane (closed arrow). G, Anultrathin section in which three control cells were cut at different positions, the bottom one being at the tip of the pole. H, Ultrathin sections of polesof cells growing in a medium containing tetrazolium for 12 h. (upper panels: longitudinal sections; lower panels: transverse sections). I, Sections ofthe poles of cells growing in the presence of tetrazolium for 18 h (upper panels: longitudinal sections; lower panels: transverse sections).doi:10.1371/journal.pone.0038427.g001
Vital Dye Reaction in E. coli Cells
PLoS ONE | www.plosone.org 3 June 2012 | Volume 7 | Issue 6 | e38427

Vital Dye Reaction in E. coli Cells
PLoS ONE | www.plosone.org 4 June 2012 | Volume 7 | Issue 6 | e38427

were found at the same distance from the old pole (Fig. 3C).
However, the granule number significantly increased at 4 CLs
from the old pole.
The distribution of granules on filaments can be explained by
a diffusion to capture scheme. In such a mechanism, a large
granule acts as an sink for all nearby diffusing formazan molecules,
that sets up a formazan concentration gradient which is
characterized by a diffusion length that depends on the diffusion
coefficient of formazan in the periplasm and on the rate at which it
is being added to the periplasmic space. The periplasmic space in
cephalexin-induced filamentous cells is continuous [40]. Slowly
aggregating but quickly diffusing substances such as the insoluble
formazan formed regularly spaced granules, because existing
granules capture all the formazan molecules within the diffusion
length and suppress the formation and growth of others nearby
(Fig. 3D). On TEM images of normal sized cells, small randomly
distributed lateral granules were indeed sometimes observed
(Fig. 1C). This experiment indicates that pre-existing granules
could create a formazan gradient up to 3–4 CLs long. The
distance between two sinks should be doubled (7 CLs) as
experimentally determined. A normal cell is much shorter than
the formazan diffusible distance, therefore only one large granule
could be formed (Fig. 3D).
Simulation of Granule Localization and ExperimentalVerificationThe diffusion to capture theory, however, could not explain the
polar localization of granules. A minimal biophysical model of
formazan aggregation and diffusion in the periplasmic space was
therefore constructed. The inner and outer membranes were
modeled as rigid hard walls, defining a confining shell in which
formazan molecules can diffuse and aggregate (Fig. S2). Molecules
were modeled as spherical particles with a diameter s were added
uniformly within the periplasmic space at a constant rate. An
isotropic attractive interaction between particles governed by
a Lennard-Jones potential with a well depth e that allows them to
grow as aggregates was given by
V rij� �
~4es
rij
� �12
{s
rij
� �6" #
where rij is the distance between particles i and j. We explored
granule formation at various rate of addition, strength of
interaction and size of the periplasmic space.
If granule formation and positioning in the periplasm is at
equilibrium, we would expect the distribution of granules to be
consistent with the free energy of a granule at a given position.
Positions corresponding to lower energy would be more frequently
occupied. We therefore looked at the total energy, i.e. the
interaction energy between particles, for different numbers of
formazan particles and granule positions in the periplasm.
Simulations of the model revealed that small spherical granules
have a much lower energy at the pole compared to midcell
(Fig. 4A). We found that the average number of molecules in
a granule at the pole is larger than that at midcell for equal
concentration of molecules in periplasm. We attribute this to
a smaller off-rate at the pole that particles dissociate from the
granule due to spatial constrains compared to midcell. For larger
granules that achieved disk-like shapes, the energy difference
between the pole and midcell became less significant (Fig. 4 A).
Given the small difference in energy between large midcell and
pole granules, if the system could come to equilibrium, the spatial
distribution of granules would be more uniform than experimen-
tally observed, where granules localize at the poles in ,70% of
cells (For example see Fig. S5).
Since the observed localization frequency is different from what
would be expected from equilibrium arguments, we explored the
effect on localization due to the rate of addition of molecules.
Regardless of addition rate, a seed was likely to form anywhere
within the periplasmic space (Fig. 4B). If molecules were added at
a rate faster than that required for them to diffuse to the lower
energy position at the pole, the seeds could be trapped in the local
energy minimum at midcell. If molecules were added slowly
enough so that the small aggregates had enough time to migrate to
the pole, then they formed a large aggregate there and reached
a quasi-steady state. The experimentally observed ratio of pole-
granule containing cells was obtained when the addition rate was
slower than the typical time of a seed to diffuse from midcell to the
pole (Fig. 4C). The simulation also revealed that the peak of large
aggregates was slightly off pole, due to the increased entropy
associated with that location, in good agreement with the
experimental data (Fig. 4D and Fig. 1).
We also explored how granule formation depends on the width
of the periplasmic space and the strength of molecular interaction.
In both very wide and very narrow periplasms, the distribution of
granules was far more uniform (Fig. S3). These results make
intuitive sense as in wider periplasms, the geometrical constraint
on granule growth and distribution was reduced; while in
narrower periplasms, seeds growing in essentially 2D directions
must reach a much larger size to overcome the energy barrier.
When we varied the interaction energy between particles, we
found that seeds formed at higher concentrations with lower
interaction energy. They still tended to migrate to the pole, though
the quasi-steady location was more variable; with higher in-
teraction energy, seeds formed more frequently, and there were
more granules forming at non-pole locations (Fig. S3).
The periplasm at the cell poles is a favored place for
localization. It has been demonstrated that GFP expressed in the
periplasm relocates to the pole when subjected to a mild osmotic
shock [41]. The osmotic shock provides a mechanical force to
propel GFP proteins into the energetically more favorable
location. GFP is huge (4.5 nm63.5 nm63.5 nm) compared to
the narrow periplasmic space (about 10 nm). The periplasm is also
full of biological ‘gel’ [23,42] and the diffusion coefficient of GFP
in the periplasm has been measured as 2.6 mm2/s, much lower
than in cytoplasm [40]. A formazan molecule, that is about 155
times smaller than GFP and its small aggregates would diffuse
more readily towards the pole.
The diffusion constant of small molecules in water at room
temperature has been estimated to be ,1,000 mm2/s [43].
Without additional obstacle, a formazan molecule can diffuse
1 mm in 0.5 ms. The diffusion coefficient of a particle is
reciprocally proportional to the square root of its size according
Figure 2. Formazan granule formation in different E. colimutants. Scale bars equal 20 mm. Granules were false-colored in dark magenta. Thetop two lines show the parental strain (MC1000) and its derivatives: the dsbD deletion, the dsbA deletion, and the dsbA/dsbD double mutant strains.The third line shows the parental strain (MC1061) and the Ccm null mutant derived from it. Photos of the corresponding cell cultures after growth inthe presence of TTC are shown at the top-right corner of each DIC image. The percentage of cells containing different numbers of granules for eachstrain is compared in the histogram at the bottom of the figure.doi:10.1371/journal.pone.0038427.g002
Vital Dye Reaction in E. coli Cells
PLoS ONE | www.plosone.org 5 June 2012 | Volume 7 | Issue 6 | e38427
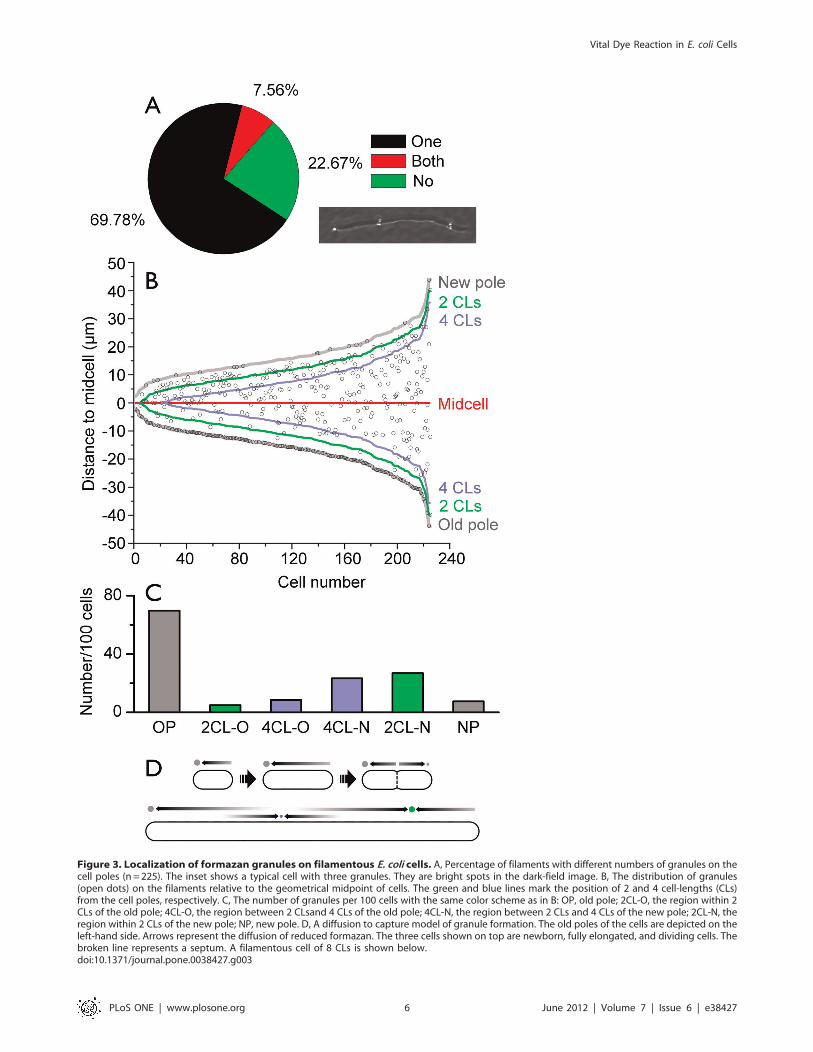
Figure 3. Localization of formazan granules on filamentous E. coli cells. A, Percentage of filaments with different numbers of granules on thecell poles (n = 225). The inset shows a typical cell with three granules. They are bright spots in the dark-field image. B, The distribution of granules(open dots) on the filaments relative to the geometrical midpoint of cells. The green and blue lines mark the position of 2 and 4 cell-lengths (CLs)from the cell poles, respectively. C, The number of granules per 100 cells with the same color scheme as in B: OP, old pole; 2CL-O, the region within 2CLs of the old pole; 4CL-O, the region between 2 CLsand 4 CLs of the old pole; 4CL-N, the region between 2 CLs and 4 CLs of the new pole; 2CL-N, theregion within 2 CLs of the new pole; NP, new pole. D, A diffusion to capture model of granule formation. The old poles of the cells are depicted on theleft-hand side. Arrows represent the diffusion of reduced formazan. The three cells shown on top are newborn, fully elongated, and dividing cells. Thebroken line represents a septum. A filamentous cell of 8 CLs is shown below.doi:10.1371/journal.pone.0038427.g003
Vital Dye Reaction in E. coli Cells
PLoS ONE | www.plosone.org 6 June 2012 | Volume 7 | Issue 6 | e38427

to Stokes–Einstein equation [43]. The diffusion coefficient of
a formazan molecule in periplasm, according to the GFP value,
can be estimated as ,372 mm2/s. A formazan molecule would
thus diffuse 1 mm in ,1.3 ms. Considering the potentially great
interaction between GFP and the cell membranes, we expect the
diffusion rate of formazan molecules de facto to be faster.
Our computer simulation indicated that the experimentally
observed granule localization could be obtained only if the TTC
reduction rate was slower than the time requires for a seed to
defuse from midcell to the pole. It is worth noting that the TTC
reduction in E. coli cells is slow. To observe enough granule-
containing cells, bacteria were either cultivated in liquid culture at
23uC [9,11], or on Petri dish [8]. Under fast growth conditions,
the granule-containing cells were hard to analyze due to the
dilution effect of cell division. To roughly estimate the reduction
rate in periplasm, we measured six largest granule cutting surfaces
on the ultrathin sections of cells growing for 2 h, 4 h, and 6 h in
the presence of TTC (Fig. S4). The granule volume was estimated
as a 10-mm-thick flat sheet, because membrane deformation did
not occur up to 12-h incubation (Fig. 1). This result indicated that
a granule needs ,10 s to grow large enough to be trapped in the
periplasm and the cell reduced one TTC molecule per 6 ms, much
longer than the time needed for them to diffuse to the pole. The
simulation also indicated that high reduction rate would enhance
the non-pole localization of granules. We increased the reduction
rate by adding more TTC into the medium (Fig. S5). As expected,
the number of non-pole granules and the number of multiple-
granule cells increased when more TTC was supplemented.
Final RemarksTTC is very likely reduced in periplasm non-specifically. The
ubiquitous thioredoxin super-family proteins in E. coli periplasm
might play a prominent role in vital dye reduction. This
assumption is potentially applicable to intact eukaryotic cells. It
has been observed that chemicals blocking sulfhydryl groups
inhibited TTC reduction as efficiently as those decoupling
respiration and phosphorylation in plant tissues [44]. The
sulfhydryl groups and the formazan reduction has also been
observed to co-localize [45]. In human neutrophils, only the
activity of glutathione reductase, not the respiration oxidoreduc-
tases, shows a strong correlation with the reduction of nitroblue
tetrazolium [46].
The bacterial periplasm provides a unique geometry for
aggregating molecules to diffuse and to grow. The localization
pattern would not be obtained in very wide or restrained spaces. A
diffusion to capture model had been used to explain the regular
spacing of lateral clusters of chemo-receptors along the cell body
[12,18] and this scenario is also applicable to small molecules, such
as reduced formazan in periplasm. Using a minimal model, we
showed that the periplasm at the cell poles is the most energetically
favorable position for diffusing small molecules, and explained why
the prominent granules often localize to the pole.
Figure 4. Computer simulation of the formazan diffusion in cell periplasm. A, Average free energy of a granule as a function of its center ofmass (DECOM) along the longitudinal cell axis. The energy of the granule at the poles was taken as zero. The curves correspond to different numbersof particles. B, Frequency of granule location as a function of position on the cell and aggregate size (N). The heat map of particles added at fast rate(Nadd =10,000 MC steps) is shown above. The map of granules added at slow rate (Nadd = 50,000 MC steps) is shown below. The top color schemeshows the frequency value. C, Probability of granule localizing to different positions on cell at slow addition rate. Line colors are the same as in A. D,Snapshots of three critical steps of aggregate formation in a simulation movie. I, initial randomly diffusing particles; II, a seed forms stochastically; III,diffusion to and growth at the energetically favored cell pole.doi:10.1371/journal.pone.0038427.g004
Vital Dye Reaction in E. coli Cells
PLoS ONE | www.plosone.org 7 June 2012 | Volume 7 | Issue 6 | e38427

This model is potentially applicable to other self-aggregating
small molecules entering the bacterial periplasm. Different
molecules have different interaction energy, hence different
aggregate localization pattern. The granule localization in
eukaryotic cells would follow the same rule with a more
sophisticated geographical boundary condition. It is also applica-
ble to analogous systems, such as the chemoeffectors in
chemotaxis. Chemoeffectors bind to the corresponding receptors
or ligand-binding proteins, which would serve as a sink [47]. The
formation of a maltose-binding-protein pole cap in E. coli upon
maltose induction supports this assumption [48]. Interestingly,
both clustering of receptors and migration of effectors are
spontaneous processes favoring the cell poles. Whether these are
simply biological spandrels or the manifestation of physical
principles governing the evolution of rod-shaped bacteria would
be an interesting question to address in the future.
Materials and Methods
Bacterial Strains and Growth ConditionsMC1000 [49] and MC1000DdsbD [32] have been published
previously. Strain MC1000DdsbA and strain MC1000DdsbA/DdsbD were gifts from Prof. Linda Thony-Meyer. Strain UT481
was a gift from Prof. Piet. A. J. de Boer. Strain AW405 was a gift
from Prof. S. Parkinson. Strain AN384, AN385, AN386 and
AN387 [50] were gifts from James A Imlay. LMG194 was
obtained from Invitrogen. Bacteria were cultivated according to
the published procedure [11] unless otherwise specified. In brief,
a single colony was grown at 23uC and shaken at 160 rpm with
aeration (doubling time: 147617 min) to early stationary phase
(OD600 = 1.1). 100 ml of this culture was used to inoculate 10 ml of
fresh medium that was then incubated at the same temperature for
12 h with aeration. TTC (0.005% w/w), if needed, was added
0.5 h after inoculation.
Transmission Electron MicroscopyStrain LMG194 was cultivated in LB medium with TTC for
12 h and 18 h. Cultures without TTC were used as controls. Cells
were spun at 10,000 g for 60 s and resuspended in 16phosphate
buffered saline (PBS). The pellet was washed with PBS 3 times and
fixed overnight with 4% glutaraldehyde. Cells were kept in PBS at
4uC before use. Samples were further fixed with 1% osmium
tetroxide in sodium cacodylate buffer for 2 h and were dehydrated
with ethanol in serially increased concentration. Cells were
infiltrated with araldite resin and the resin was cured at 60uCfor 48 h. Embedded samples were sectioned on a LKB 8800A
Ultratome III (LKB Produkter AB, Bromma, Sweden). Ultra-thin
sections were placed on Formvar-coated grids and contrasted with
lead citrate for electron microscopy (EM 902; Zeiss, Oberkochen,
Germany). To measure the growth rate of granules in periplasm,
the cells of strain AW405 growing for 2 h, 4 h, and 6 h after
addition of TTC were harvested and sectioned. Six largest cutting
surfaces of granules were selected, and the areas were measured
using ImageJ 1.37 V (National Institutes of Health, Bethesda, MD,
USA). The volumes of the granules were approximated as a flat
sheet of 10 nm thick.
TTC Reduction in Different E. coli StrainsAll mutant strains (Table S1) were grown in parallel with their
parent strains for a given set of experiments. Samples used for
microscopy were prepared as following: One ml of each cell
culture was centrifuged at 5,600 g for 1 min, cell pellets were
resuspended in 100 ml of growth medium, and then further diluted
5-fold with motility buffer (11.2 g l21 K2HPO4, 4.8 g l21
KH2PO4 and 0.029 g l21 EDTA). One ml of the final suspension
was immobilized on glass slides by 1% agarose gel and examined
by Differential Interface Contrast (DIC) microscopy using a 2506oil lens on a commercial Nikon TE2000/TIRF microscope. Strain
AN384, AN385 and the parent strain AN387 was cultivated
anaerobically in the presence of 1 mM 4-hydroxybenzoic acid in
a sealed tube filled with argon, and assays were performed
anaerobically with cells resuspended in fresh medium without 4-
hydroxybenzoic acid. To further evaluate the influence of TTC
reduction rate on granule localization, the cells of strain AW405
were cultivated in the presence of 0.005%, 0.05% and 0.1% TTC
for 12 h, 10 h, and 8 h respectively. Five ml cell cultures were
directly mounted on SuperFrost Ultra Plus adhesion slides
(Thermo Scientific). Imaged was taken with an Axioskop
microscope (100 6 oil lens, Carl Zeiss). The granules that
appeared as black spots were counted manually on randomly
taken bright field images.
Cell Filamentation Induced by CephalexinStrain LMG194 was grown in LB and was induced with 60 mg/
ml cephalexin as described [51]. Cells mounted on SuperFrost
Ultra Plus adhesion slides were imaged using an Axioskop
microscope. The formazan granules appeared as bright spots on
the dark-field images (Fig. 2A inset). The images were analyzed
using ImageJ. Formazan granules within the cavity of the pole or
immediately adjacent to the base of the pole were regarded as pole
granules. On cells with zero or two pole granules, the pole farther
away from the nearest lateral granule was assigned as the old pole.
Computer Simulation of Granule FormationThe periplasm was modeled as a cylindrical shell of length,
L, capped with two hemispheres of inner and outer radius, RI and
RO, representing the radii of the inner and outer membranes
respectively (Fig. S2). The system was modeled using a cell with an
aspect ratio of (L+2RO)/2RO = 2. The membrane boundaries were
considered to be hard walls. For these simulations, L =2RO =8s,and the outer membrane radius RO =4s. The inner radius was
chosen as RI =2.6s in most simulations except when the influence
of spatial constraint was considered. The energy of interaction
between formazan particles was taken to be e = nkBT, where n= 2
for most simulations except when the influence of interaction
energy was evaluated.
The system was simulated using a Metropolis Monte Carlo
(MC) method at constant temperature. In a single MC sweep,
every particle was randomly moved with a maximum step size of
dr = 0.1s. Random moves were either accepted if the total energy
was lowered, or rejected based on the Metropolis criterion. A
given MC sweep through all particles can be interpreted as a single
step in time, where all particles have had a chance to diffuse some
distance dr. To construct the energy landscape of a granule as
a function of its position in the cell, a fixed number of particles
were added to the space and the location and energy of the
granule was periodically sampled over a long equilibration run and
the averages calculated. To build up the frequency of aggregate
locations, 150 independent MC simulations starting from one
particle to a final particle number, N were performed. The rate of
addition of formazan to the periplasm was simulated by adding
one particle randomly within the periplasm every Nadd MC sweeps.
Thus by making Nadd larger or smaller, different rates of addition
of formazan could be studied. The number of particles, the
number of particles in the largest granule, the position of the
center of mass of the largest granule, and the energy of the system
was retrieved at fixed intervals in a simulation.
Vital Dye Reaction in E. coli Cells
PLoS ONE | www.plosone.org 8 June 2012 | Volume 7 | Issue 6 | e38427

Supporting Information
Figure S1 Transmission electron microscopy images ofa formazan granule in a filamentous cell of E. coli strainUT481.(DOC)
Figure S2 Schematic of cell geometry used for simula-tion.(DOC)
Figure S3 Heat map of aggregate sizes corresponding todifferent periplamic locations (horizontal axis) anddifferent numbers of particles per cell (vertical axis).(DOC)
Figure S4 Estimation of the growth rate of formazangranules in E. coli periplasm.(DOC)
Figure S5 The localization of formazan granules in cellsof strain AW405 growing in medium supplemented withdifferent amount of TTC.
(DOC)
Table S1 Bacterial strains and their TTC reductionactivities.
(DOC)
Acknowledgments
We are grateful to Linda Thony-Meyer, Piet A. J. de Boer, and Sandy
Parkinson for providing us with bacterial strains. We thank Howard C.
Berg for suggesting the TEM experiment. We thank also Jim Henle, Emily
Wheeler, Saeed Saberi, and Mahdi Karamati for many useful discussions.
Author Contributions
Conceived and designed the experiments: LP DAIM EE SJF. Performed
the experiments: LP DAIM EE MW. Analyzed the data: LP DAIM EE.
Contributed reagents/materials/analysis tools: LP EE MW SJF. Wrote the
paper: LP DAIM EE SJF.
References
1. Berridge MV, Herst PM, Tan AS (2005) Tetrazolium dyes as tools in cell
biology: New insights into their cellular reduction. In: El-Gewely MR, ed.
Biotechnology Annual Review. Amsterdam: Elsevier. pp 127–152.
2. Schaule G, Flemming HC, Ridgway HF (1993) Use of 5-cyano-2,3-ditolyl
tetrazolium chloride for quantifying planktonic and sessile respiring bacteria in
drinking water. Appl Environ Microbiol 59: 3850–3857.
3. Ullrich S, Karrasch B, Hoppe HG, Jeskulke K, Mehrens M (1996) Toxic effects
on bacterial metabolism of the redox dye 5-cyano-2,3-ditolyl tetrazolium
chloride. Appl Environ Microbiol 62: 4587–4593.
4. Kaprelyants AS, Kell DB (1993) Dormancy in stationary-phase cultures of
Micrococcus luteus: Flow cytometric analysis of starvation and resuscitation. Appl
Environ Microbiol 59: 3187–3196.
5. Johno H, Takahashi S, Kitamura M (2010) Influences of acidic conditions on
formazan assay: A cautionary note. Appl Biochem Biotechnol 162: 1529–1535.
6. Throneberry GO, Smith FG (1953) The effect of triphenyltetrazolium chloride
on oat embryo respiration. Science 117: 13–15.
7. Smith JJ, McFeters GA (1997) Mechanisms of INT (2-(4-iodophenyl)-3-(4-
nitrophenyl)-5-phenyl tetrazolium chloride), and CTC (5-cyano-2,3-ditolyl
tetrazolium chloride) reduction in Escherichia coli K-12. J Microbiol Meth 29:
161–175.
8. Lederberg J (1948) Detection of fermentative variants with tetrazolium.
J Bacteriol 56: 695.
9. Berg HC, Turner L (1995) Cells of Escherichia coli swim either end forward. Proc
Natl Acad Sci USA 92: 477–479.
10. Ping L, Weiner B, Kleckner N (2008) Tsr-GFP accumulates linearly with time at
cell poles, and can be used to differentiate ‘old’ versus ‘new’ poles, in Escherichia
coli. Mol Microbiol 69: 1427–1438.
11. Ping L (2010) The asymmetric flagellar distribution and motility of Escherichia
coli. J Mol Biol 397: 906–916.
12. Greenfield D, McEvoy AL, Shroff H, Crooks GE, Wingreen NS, et al. (2009)
Self-organization of the Escherichia coli chemotaxis network imaged with super-
resolution light microscopy. PLoS Biol 7: e1000137.
13. Ramamurthi KS, Losick R (2009) Negative membrane curvature as a cue for
subcellular localization of a bacterial protein. Proc Natl Acad Sci USA.
14. Lenarcic R, Halbedel S, Visser L, Shaw M, Wu LJ, et al. (2009) Localisation of
DivIVA by targeting to negatively curved membranes. EMBO J 28: 2272–2282.
15. Bowman GR, Comolli LR, Zhu J, Eckart M, Koenig M, et al. (2008) A
polymeric protein anchors the chromosomal origin/ParB complex at a bacterial
cell pole. Cell 134: 945–955.
16. Ebersbach G, Briegel A, Jensen GJ, Jacobs-Wagner C (2008) A self-associating
protein critical for chromosome attachment, division, and polar organization in
Caulobacter. Cell 134: 956–968.
17. Winkler J, Seybert A, Konig L, Pruggnaller S, Haselmann U, et al. (2010)
Quantitative and spatio-temporal features of protein aggregation in Escherichia
coli and consequences on protein quality control and cellular ageing. EMBO J
29: 910–923.
18. Wang H, Wingreen NS, Mukhopadhyay R (2008) Self-organized periodicity of
protein clusters in growing bacteria. Phys Rev Lett 101: 218101.
19. Howard M (2004) A mechanism for polar protein localization in bacteria. J Mol
Biol 335: 655–663.
20. Huang KC, Mukhopadhyay R, Wingreen NS (2006) A curvature-mediated
mechanism for localization of lipids to bacterial poles. PLoS Comput Biol 2:
e151.
21. Saberi S, Emberly E (2010) Chromosome driven spatial patterning of proteins inbacteria. PLoS Comput Biol 6: e1000986.
22. Ausubel FM, Brent R, Kingston RE, Moore DD, Seidman JG, et al. (1989)
Current Protocols in Molecular Biology. New York: John Wiley & Sons, Inc.
23. Graham LL, Beveridge TJ, Nanninga N (1991) Periplasmic space and theconcept of the periplasm. Trends Biochem Sci 16: 328–329.
24. Bernas T, Dobrucki JW (2000) The role of plasma membrane in bioreduction of
two tetrazolium salts, MTT, and CTC. Arch Biochem Biophys 380: 108–116.
25. Currier HB, Day BE (1954) The tetrazolium reaction in yeast. Science 119: 817.
26. Berridge MV, Tan AS (1993) Characterization of the cellular reduction of 3-(4,5-dimethylthiazol-2-Yl)-2,5-diphenyltetrazolium bromide (MTT) subcellular
localization, substrate dependence, and involvement of mitochondrial electron-transport in MTT reduction. Arch Biochem Biophys 303: 474–482.
27. Bernas T, Dobrucki J (2002) Mitochondrial and nonmitochondrial reduction of
MTT: Interaction of MTT with TMRE, JC-1, and NAO mitochondrialfluorescent probes. Cytometry 47: 236–242.
28. Bernas T, Dobrucki J (1999) Reduction of a tetrazolium salt, CTC, by intact
HepG2 human hepatoma cells: Subcellular localisation of reducing systems.Biochim Biophys Acta 1451: 73–81.
29. Shouldice SR, Heras B, Walden PM, Totsika M, Schembri MA, et al. (2011)
Structure and function of DsbA, a key bacterial oxidative folding catalyst.Antioxid Redox Signal 14: 1729–1760.
30. Inaba K, Murakami S, Suzuki M, Nakagawa A, Yamashita E, et al. (2006)
Crystal structure of the DsbB-DsbA complex reveals a mechanism of disulfidebond generation. Cell 127: 789–801.
31. McCarthy AA, Haebel PW, Torronen A, Rybin V, Baker EN, et al. (2000)
Crystal structure of the protein disulfide bond isomerase, DsbC, from Escherichia
coli. Nat Struct Mol Biol 7: 196–199.
32. Stewart EJ, Katzen F, Beckwith J (1999) Six conserved cysteines of the
membrane protein DsbD are required for the transfer of electrons from the
cytoplasm to the periplasm of Escherichia coli. EMBO J 18: 5963–5971.
33. Depuydt M, Leonard SE, Vertommen D, Denoncin K, Morsomme P, et al.
(2009) A periplasmic reducing system protects single cysteine residues from
oxidation. Science 326: 1109–1111.
34. Sanders C, Turkarslan S, Lee D-W, Daldal F (2010) Cytochrome c biogenesis:
the Ccm system. Trends Microbiol 18: 266–274.
35. Ito K, Inaba K (2008) The disulfide bond formation (Dsb) system. Curr OpinStruct Biol 18: 450–458.
36. Barnes EM (1956) Tetrazolium reduction as a means of differentiating
Streptococcus faecalis from Streptococcus faecium. J Gen Microbiol 14: 57–68.
37. Collins MD, Jones D (1981) Distribution of isoprenoid quinone structural typesin bacteria and their taxonomic implication. Microbiol Mol Biol Rev 45:
316–354.
38. Tachon S, Michelon D, Chambellon E, Cantonnet M, Mezange C, et al. (2009)Experimental conditions affect the site of tetrazolium violet reduction in the
electron transport chain of Lactococcus lactis. Microbiology 155: 2941–2948.
39. Pogliano J, Pogliano K, Weiss DS, Losick R, Beckwith J (1997) Inactivation ofFtsI inhibits constriction of the FtsZ cytokinetic ring and delays the assembly of
FtsZ rings at potential division sites. Proc Natl Acad Sci USA 94: 559–564.
40. Mullineaux CW, Nenninger A, Ray N, Robinson C (2006) Diffusion of greenfluorescent protein in three cell environments in Escherichia coli. J Bacteriol 188:
3442–3448.
41. Santini C-L, Bernadac A, Zhang M, Chanal A, Ize B, et al. (2001) Translocation
of jellyfish green fluorescent protein via the tat system of Escherichia coli and
Vital Dye Reaction in E. coli Cells
PLoS ONE | www.plosone.org 9 June 2012 | Volume 7 | Issue 6 | e38427

change of Its periplasmic localization in response to osmotic up-shock. J Biol
Chem 276: 8159–8164.
42. Prisco U, Leung C, Xirouchaki C, Jones CH, Heath JK, et al. (2005) Residue-
specific immobilization of protein molecules by size-selected clusters. J R Soc
Interface 2: 169–175.
43. Berg HC (1993) Random walks in biology. Princeton: Princeton University
Press.
44. Roberts LW (1951) Survey of factors responsible for reduction of 2,3,5-
triphenyltetrazolium chloride in plant meristems. Science 113: 692–693.
45. Roberts LW, Lucchese G (1955) Sulfhydryl localization and tetrazolium
reduction. 1. Reversible inhibition of its reduction by N-ethyl maleimide. Stain
Technol 30: 291–298.
46. Perianin A, Labro-Bryskier MT, Marquetty C, Hakim J (1984) Glutathione
reductase and nitroblue tetrazolium reduction deficiencies in neutrophils ofpatients with primary idiopathic myelofibrosis. Clin Exp Immunol 57: 244–248.
47. Neumann S, Hansen CH, Wingreen NS, Sourjik V (2010) Differences in
signalling by directly and indirectly binding ligands in bacterial chemotaxis.EMBO J 29: 3484–3495.
48. Maddock JR, Alley MR, Shapiro L (1993) Polarized cells, polar actions.J Bacteriol 175: 7125–7129.
49. Casadaban MJ, Cohen SN (1980) Analysis of gene control signals by DNA
fusion and cloning in Escherichia coli. J Mol Biol 138: 179–207.50. Imlay JA (1995) A metabolic enzyme that rapidly produces superoxide, fumarate
reductase of Escherichia coli. J Biol Chem 270: 19767–19777.51. Maki N, Gestwicki JE, Lake EM, Kiessling LL, Adler J (2000) Motility and
chemotaxis of filamentous cells of Escherichia coli. J Bacteriol 182: 4337–4342.
Vital Dye Reaction in E. coli Cells
PLoS ONE | www.plosone.org 10 June 2012 | Volume 7 | Issue 6 | e38427