Embed Size (px)
Citation preview

www.caymanchem.comCustomer Service 800.364.9897Technical Support 888.526.53511180 E. Ellsworth Rd · Ann Arbor, MI · USA
Vitamin D ELISA Kit
Item No. 501050

3GENERAL INFORMATION
TABLE OF CONTENTS GENERAL INFORMATION 3 Materials Supplied
4 Safety Data4 Precautions5 If You Have Problems5 Storage and Stability5 Materials Needed but Not Supplied
INTRODUCTION 6 Background7 About This Assay9 DescriptionofAChECompetitiveELISAs10 Biochemistry of Acetylcholinesterase12 Definition of Key Terms
PRE-ASSAY PREPARATION 13 Buffer Preparation14 Sample Preparation15 Sample Purification
ASSAY PROTOCOL 17 Preparation of Assay-Specific Reagents20 Plate Set Up21 Performing the Assay
ANALYSIS 24 Calculations26 Performance Characteristics
RESOURCES 32 Troubleshooting33 References34 Plate Template35 Notes35 Warranty and Limitation of Remedy
GENERAL INFORMATION
Materials Supplied
Item Number Item 96 wells Quantity/Size
480 wells Quantity/Size
401052 Vitamin D ELISA Monoclonal Antibody 1 vial/100 dtn 1 vial/500 dtn
401050 Vitamin D AChE Tracer 1 vial/100 dtn 1 vial/500 dtn
401054 25-hydroxy Vitamin D3 ELISA Standard 1 vial 1 vial
400060 ELISA Buffer Concentrate (10X) 2 vials/10 ml 4 vials/10 ml
400062 Wash Buffer Concentrate (400X) 1 vial/5 ml 1 vial/12.5 ml
400035 Polysorbate 20 1 vial/3 ml 1 vial/3 ml
400658/400659 Rabbit Anti-Sheep IgG Precoated Plate 1 plate 5 plates
400012 96-Well Cover Sheet 1 cover 5 covers
400050 Ellman’s Reagent 3 vials/100 dtn 6 vials/250 dtn
400040 ELISA Tracer Dye 1 vial 1 vial
400042 ELISA Antiserum Dye 1 vial 1 vial
If any of the items listed above are damaged or missing, please contact our Customer Service department at (800) 364-9897 or (734) 971-3335. We cannot accept any returns without prior authorization.

4 GENERAL INFORMATION 5GENERAL INFORMATION
! WARNING: THIS PRODUCT IS FOR RESEARCH ONLY - NOT FORHUMAN OR VETERINARY DIAGNOSTIC OR THERAPEUTIC USE.
Safety DataThis material should be considered hazardous until further information becomes available. Do not ingest, inhale, get in eyes, on skin, or on clothing. Wash thoroughly after handling. Before use, the user must review the complete Safety Data Sheet, which has been sent via email to your institution.
PrecautionsPleasereadtheseinstructionscarefullybeforebeginningthisassay.The reagents in this kit have been tested and formulated to work exclusively with Cayman Chemical’s AChE ELISA Kits. This kit may not perform as described if any reagent or procedure is replaced or modified.When compared to quantification by LC/MS or GC/MS, it is not uncommon for immunoassays to report higher analyte concentrations. While LC/MS or GC/MS analyses typically measure only a single compound, antibodies used in immunoassays sometimes recognize not only the target molecule, but also structurally related molecules, including biologically relevant metabolites. In many cases, measurement of both the parent molecule and metabolites is more representative of the overall biological response than is the measurement of a short-lived parent molecule. It is the responsibility of the researcher to understand the limits of both assay systems and to interpret their data accordingly.
If You Have ProblemsTechnicalServiceContactInformation
Phone: 888-526-5351 (USA and Canada only) or 734-975-3888Fax: 734-971-3641Email: [email protected]: M-F 8:00 AM to 5:30 PM EST
In order for our staff to assist you quickly and efficiently, please be ready to supply the lot number of the kit (found on the outside of the box).
Storage and StabilityThis kit will perform as specified if stored as directed at -20°C and used before the expiration date indicated on the outside of the box.
Materials Needed But Not Supplied1. A plate reader capable of measuring absorbance between 405-420 nm.2. Adjustable pipettes and a repeating pipettor.3. A source of ‘UltraPure’ water. Water used to prepare all ELISA reagents and
buffers must be deionized and free of trace organic contaminants (‘UltraPure’). Use activated carbon filter cartridges or other organic scavengers. Glass distilled water (even if double distilled), HPLC-grade water, and sterile water (for injections) are not adequate for ELISA. NOTE: UltraPure water is available for purchase from Cayman (Item No. 400000).
4. Materials used for Sample Preparation and Purification (see pages 14 and 15).

6 INTRODUCTION 7INTRODUCTION
INTRODUCTION
BackgroundVitamin D functions to regulate the intestinal absorption of calcium and phosphorous in order to promote healthy bone growth, immune function, and cell communication. Vitamin D is also reported to have extra-skeletal effects in the cardiovascular, endocrine, and central nervous systems. The primary synthesis of functional vitamin D begins in the skin, where a cholesterol by-product (7-dehydro cholesterol) is acted upon by UV light to form vitamin D3 (also known as cholecalciferol). Vitamin D3 is transported through the bloodstream, attached to the vitamin D binding protein, to the liver where it is converted to 25-hydroxy vitamin D3 (also known as 25(OH)D3 or calcidiol). This product is then transported to the kidney where it is further converted to 1,25-dihydroxy cholecalciferol (also known as calcitriol or 1,25(OH)2D3) the biologically active form. Active 1,25(OH)2D3 is very short-lived, and is rapidly metabolized to its deactivated forms.1,2
Vitamin D3 can also be obtained from the diet or through dietary supplements, bypassing the requirement for UV activation of the skin. Another dietary form obtained from yeast or fungi, vitamin D2 (ergocalciferol), can also be used to produce active 1,25(OH)2D2 using a similar biosynthetic route, with the production of 25(OH)D2 primarily in the liver and biologically active 1,25(OH)2D2 in the kidneys.2
Because of the short half-life of the biologically active 1,25(OH)D form, this Vitamin D assay primarily detects the more metabolically stable forms, 25(OH)D3 and 25(OH)D2. Accurate detection of these forms requires that they be displaced from the vitamin D binding protein prior to measurement.2,3 Normal human plasma values of 25(OH)D are between 30 and 100 ng/ml and persons with plasma values <30 ng/ml are considered vitamin D deficient.1
About This AssayCayman’s Vitamin D ELISA Kit is a competitive assay that can be used for Vitamin D quantification in plasma or serum. Other sample types have not been validated and suitability should be determined by the researcher. The assay has a range from 0.19-25 ng/ml and a sensitivity (80% B/B0) of approximately 0.5 ng/ml.

8 INTRODUCTION 9INTRODUCTION
DescriptionofAChECompetitiveELISAs4,5
This assay is based on the competition between vitamin D and a vitamin D-acetyl-cholinesterase (AChE) conjugate (Vitamin D Tracer) for a limited number of vitamin D-specific sheep monoclonal antibody binding sites. Because the concentration of the Vitamin D Tracer is held constant while the concentration of vitamin D varies, the amount of Vitamin D Tracer that is able to bind to the sheep monoclonal antibody will be inversely proportional to the concentration of vitamin D in the well. This sheep monoclonal antibody-vitamin D (either free or tracer) complex binds to the rabbit polyclonal anti-sheep IgG that has been previously attached to the well. The plate is washed to remove any unbound reagents and then Ellman’s Reagent (which contains the substrate to AChE) is added to the well. The product of this enzymatic reaction has a distinct yellow color and absorbs strongly at 412 nm. The intensity of this color, determined spectrophotometrically, is proportional to the amount of Vitamin D Tracer bound to the well, which is inversely proportional to the amount of free vitamin D present in the well during the incubation; or
Absorbance ∝ [Bound Vitamin D Tracer] ∝ 1/[vitamin D]A schematic of this process is shown below in Figure 2.
1. Incubate with tracer, an�body, and either standard or sample.
2. Wash to remove all unbound reagents.
3. Develop the well with Ellman’s Reagent.
Plates are pre-coated with rabbit polyclonal an�-sheep IgG and blocked with a proprietary formula�on of proteins.
= Rabbit Polyclonal An�-Sheep IgG
= Blocking proteins
= AChE linked to Vitamin D (tracer)
= Specific an�body to Vitamin D
= Free Vitamin D
Figure2.SchematicoftheAChEELISA
HO
HO
HO
OH
OH
OH
OH
OH
OH
OH
OH
Diet/Supplementa�on
Skin/UV exposure
7-dehydro cholesterol
vitamin D3
25-OH vitamin D3
1, 25(OH)2 vitamin D3
Liver25 (OH)ase
1 (OH)ase
Kidney24 (OH)ase
24, 25-OH vitamin D3
1, 24, 25(OH)3 vitamin D3
Kidney24 (OH)ase
Biological Response
HO
HO
Figure1.VitaminD3 metabolic pathway

10 INTRODUCTION 11INTRODUCTION
Biochemistry of AcetylcholinesteraseThe electric organ of the electric eel, E. electricus, contains an avid AChE capable of massive catalytic turnover during the generation of its electrochemical discharges. The electric eel AChE has a clover leaf-shaped tertiary structure consisting of a triad of tetramers attached to a collagen-like structural fibril. This stable enzyme is capable of high turnover (64,000 s-1) for the hydrolysis of acetylthiocholine.A molecule of the analyte covalently attached to a molecule of AChE serves as the tracer in AChE enzyme immunoassays. Quantification of the tracer is achieved by measuring its AChE activity with Ellman’s Reagent. This reagent consists of acetylthiocholine and 5,5’-dithio-bis-(2-nitrobenzoic acid). Hydrolysis of acetylthiocholine by AChE produces thiocholine (see Figure 3, on page 11). The non-enzymatic reaction of thiocholine with 5,5’-dithio-bis-(2-nitrobenzoic acid) produces 5-thio-2-nitrobenzoic acid, which has a strong absorbance at 412 nm (ε = 13,600).AChE has several advantages over other enzymes commonly used for enzyme immunoassays. Unlike horseradish peroxidase, AChE does not self-inactivate during turnover. This property of AChE also allows redevelopment of the assay if it is accidentally splashed or spilled. In addition, the enzyme is highly stable under the assay conditions, has a wide pH range (pH 5-10), and is not inhibited by common buffer salts or preservatives. Since AChE is stable during the development step, it is unnecessary to use a ‘stop’ reagent, and the plate may be read whenever it is convenient.
O
SN+ Acetylthiocholine
O
O- -SN+ Thiocholine
S S NO2O2N
COO--OOC
5,5'-dithio-bis-(2-Nitrobenzoic Acid)
SS
O2N
-OOC
N+
NO2
COO-
-S
5-thio-2-Nitrobenzoic Acidλmax: 412 nm
ε: 13,600
Figure3.Reactioncatalyzedbyacetylcholinesterase

13PRE-ASSAY PREPARATION12 INTRODUCTION
DefinitionofKeyTerms
Blank: background absorbance caused by Ellman’s Reagent. The blank absorbance should be subtracted from the absorbance readings of all the other wells, including NSB wells.
TotalActivity: total enzymatic activity of the AChE-linked tracer. This is analogous to the specific activity of a radioactive tracer.
NSB (Non-Specific Binding): non-immunological binding of the tracer to the well. Even in the absence of specific antibody a very small amount of tracer still binds to the well; the NSB is a measure of this low binding. Do not forget to subtract the Blank absorbance values.
B0(MaximumBinding): maximum amount of the tracer that the antibody can bind in the absence of free analyte.
%B/B0(%Bound/MaximumBound): ratio of the absorbance of a particular sample or standard well to that of the maximum binding (B0) well.
Standard Curve: a plot of the %B/B0 values versus concentration of a series of wells containing various known amounts of analyte.
Dtn: determination, where one dtn is the amount of reagent used per well.
Cross Reactivity: numerical representation of the relative reactivity of this assay towards structurally related molecules as compared to the primary analyte of interest. Biomolecules that possess similar epitopes to the analyte can compete with the assay tracer for binding to the primary antibody. Substances that are superior to the analyte in displacing the tracer result in a cross reactivity that is greater than 100%. Substances that are inferior to the primary analyte in displacing the tracer result in a cross reactivity that is less than 100%. Cross reactivity is calculated by comparing the mid-point (50% B/B0) value of the tested molecule to the mid-point (50% B/B0) value of the primary analyte when each is measured in assay buffer using the following formula:
% Cross Reac�vity = 50% B/B0 value for the primary analyte50% B/B0 value for the potenal cross reactant
x 100%[ ]
PRE-ASSAY PREPARATION
NOTE: Water used to prepare all ELISA reagents and buffers must be deionized and free of trace organic contaminants (‘UltraPure’). Use activated carbon filter cartridges or other organic scavengers. Glass distilled water (even if double distilled), HPLC-grade water, and sterile water (for injections) are not adequate for ELISA. UltraPure water may be purchased from Cayman (Item No. 400000).
BufferPreparationStore all diluted buffers at 4°C; they will be stable for about two months.1. ELISABufferPreparation
Dilute the contents of one vial of ELISA Buffer Concentrate (10X) (Item No. 400060) with 90 ml of UltraPure water. Be certain to rinse the vial to remove any salts that may have precipitated. NOTE: It is normal for the concentrated buffer to contain crystalline salts after thawing. These will completely dissolve upon dilution with water.
2. WashBufferPreparation
5 ml vial Wash Buffer Concentrate (400X) (96-well kit; Item No. 400062): Dilute to a total volume of 2 liters with UltraPure water and add 1 ml of Polysorbate 20 (Item No. 400035).
OR12.5 ml vial Wash Buffer Concentrate (400X) (480-well kit; Item No.400062): Dilute to a total volume of 5 liters with UltraPure water and add 2.5 ml of Polysorbate 20 (Item No. 400035).
Smaller volumes of Wash Buffer can be prepared by diluting the Wash Buffer Concentrate 1:400 and adding Polysorbate 20 (0.5 ml/liter of Wash Buffer).NOTE: Polysorbate 20 is a viscous liquid and cannot be measured by a regular pipette. A positive displacement pipette or a syringe should be used to deliver small quantities accurately.

14 PRE-ASSAY PREPARATION 15PRE-ASSAY PREPARATION
SamplePreparationThis assay has been validated for plasma and serum. Proper sample storage and preparation are essential for consistent and accurate results. Please read this section thoroughly before beginning the assay.
GeneralPrecautions • All samples must be free of organic solvents prior to assay.• Samples should be assayed immediately after collection; samples that
cannot be assayed immediately should be stored at -80°C.• Samples of sheep and goat origin may contain antibodies which interfere
with the assay by binding to the rabbit anti-sheep plate. We recommend that all sheep and goat samples be purified prior to use in this assay.
Plasma
Collect blood in vacutainer tubes containing heparin, EDTA, or sodium citrate. To obtain plasma, centrifuge samples at 1,500 x g for 15 minutes. Samples should be assayed immediately after collection. Samples that cannot be assayed immediately should be stored at -80°C. To process samples, follow the Sample Purification methods beginning on page 15.
SerumCollect blood in vacutainer tubes suitable for serum collection. To obtain serum, incubate tubes for 30 minutes at room temperature and then centrifuge samples for 15 minutes at 1,500 x g. Samples should be assayed immediately after collection. Samples that cannot be assayed immediately should be stored at -80°C. To process samples, follow the Sample Purification methods beginning on page 15.
SamplePurificationThis assay has been validated in plasma and serum. Other matrix types should be checked for interference before embarking on a large number of sample measurements. If the sample is suspected to contain vitamin D binding protein, follow the purification protocol described for plasm/serum. To test for interference, dilute one or two test samples to obtain at least two different dilutions of each sample between approximately 0.6 and 6 ng/ml (i.e., between ~20-80% B/B0). If the two dilutions of the sample show good correlation (differ by 20% or less) in the final calculated Vitamin D concentration, purification is not required. If you do not see good correlation of the different dilutions, purification is advised.
Purification Protocol
Materials Needed1. Acetone2. 1.5 ml polypropylene centrifuge tubes
Plasma/SerumSampleExtractionVitamin D is bound to a vitamin D binding protein. The following procedure is a simple method to strip the vitamin D from the binding protein. 1. Aliquot a desired amount of plasma or serum into a clean 1.5 ml polypropylene
centrifuge tube, add 2 volumes of acetone, vortex, and centrifuge at 10,000 x g for 10 minutes.
2. Carefully remove the supernatant and place into a clean glass test tube.3. Evaporate the supernatant under a gentle stream of nitrogen at 37°C.4. Reconstitute the sample with a volume of ELISA Buffer equal to the original
sample volume.

17ASSAY PROTOCOL16 PRE-ASSAY PREPARATION
150
200
250
300
25-O
H V
itam
in D
mea
sure
d in
sam
ple
(n
g/m
l)
Concentration of 25-OH Vitamin D3 added (ng/ml)
0 50 100 150 2000
100
250
50
Slope = 1.04y-intercept = 45.6 ng/mlr2 = 0.997
Figure4.RecoveryofVitaminDfromhumanplasmaHuman plasma samples were spiked with 25-OH Vitamin D3, purified as described in the Sample Preparation and Sample Purification sections, and then analyzed using the Vitamin D ELISA Kit. The y-intercept corresponds to the amount of 25-OH Vitamin D in unspiked human plasma. Error bars represent standard deviations obtained from multiple dilutions of each sample.
ASSAY PROTOCOL
PreparationofAssay-SpecificReagents
25-hydroxyVitaminD3 ELISA StandardTo prepare the standard for use in ELISA: obtain eight clean test tubes and number them #1 through #8. Aliquot 1,980 µl ELISA Buffer to tube #1 and 500 µl ELISA Buffer to tubes #2-8. Equilibrate a pipette tip in ethanol by repeatedly filling and expelling the tip with ethanol several times. Using the equilibrated pipette tip, transfer 20 µl of the 25-hydroxy Vitamin D3 ELISA Standard (Item No. 401054) to tube #1 and mix thoroughly. The concentration of this solution will be 25 ng/ml. Serially dilute the standard by removing 500 µl from tube #1 and placing in tube #2; mix thoroughly. Next, remove 500 µl from tube #2 and place it into tube #3; mix thoroughly. Repeat this process for tubes #4-8. These diluted standards should not be stored for more than 24 hours.
2.5 µg/mlStandard
20 µl 500 µl 500 µl 500 µl 500 µl 500 µl 500 µl 500 µl
1.98 mlELISABu�er
500 µlELISABu�er
Final
25ng/ml
S1 S2 S3 S4 S5 S6 S7 S8
12.5ng/ml
6.25ng/ml
3.12ng/ml
1.56ng/ml
0.78ng/ml
0.39ng/ml
0.19ng/ml
500 µlELISABu�er
500 µlELISABu�er
500 µlELISABu�er
500 µlELISABu�er
500 µlELISABu�er
500 µlELISABu�er
Figure5.PreparationoftheVitaminDstandards

18 ASSAY PROTOCOL 19ASSAY PROTOCOL
VitaminDAChETracerReconstitute the Vitamin D AChE Tracer as follows:
100 dtn Vitamin D AChE Tracer (96-well kit; Item No. 401050): Reconstitute with 6 ml ELISA Buffer.
OR500dtnVitaminDAChETracer(480-wellkit;ItemNo.401050): Reconstitute with 30 ml ELISA Buffer.
Store the reconstituted Vitamin D AChE Tracer at 4°C (do not freeze!). For long term tracer stability (>1 week), storage in polypropylene is recommended. When stored in polypropylene, the tracer should be stable for four weeks. A 20% surplus of tracer has been included to account for any incidental losses.
TracerDyeInstructions(optional) This dye may be added to the tracer, if desired, to aid in visualization of tracer- containing wells. Add the dye to the reconstituted tracer at a final dilution of 1:100 (add 60 µl of dye to 6 ml tracer or add 300 µl of dye to 30 ml of tracer).
VitaminDELISAMonoclonalAntibodyReconstitute the Vitamin D ELISA Monoclonal Antibody as follows:
100 dtn Vitamin D ELISA Monoclonal Antibody (96-well kit; Item No.401052): Reconstitute with 6 ml ELISA Buffer.
OR500 dtnVitamin D ELISAMonoclonal Antibody (480-well kit; Item No.401052): Reconstitute with 30 ml ELISA Buffer.
Store the reconstituted Vitamin D ELISA Monoclonal Antibody at 4°C. It will be stable for at least four weeks. A 20% surplus of antibody has been included to account for any incidental losses.
AntiserumDyeInstructions(optional) This dye may be added to the antibody, if desired, to aid in visualization of antibody-containing wells. Add the dye to the reconstituted antibody at a final dilution of 1:100 (add 60 µl of dye to 6 ml antibody or add 300 µl of dye to 30 ml of antibody).

20 ASSAY PROTOCOL 21ASSAY PROTOCOL
Plate Set UpThe 96-well plate(s) included with this kit is supplied ready to use. It is not necessary to rinse the plate(s) prior to adding the reagents. NOTE: If you do not need to use all the strips at once, place the unused strips back in the plate packet and store at 4°C. Be sure the packet is sealed with the desiccant inside. Each plate or set of strips must contain a minimum of two blanks (Blk), two non-specific binding wells (NSB), three maximum binding wells (B0), and an eight point standard curve run in duplicate. NOTE: Each assay must contain this minimum configuration in order to ensure accurate and reproducible results. Each sample should be assayed at two dilutions and each dilution should be assayed in duplicate. For statistical purposes, we recommend assaying samples in triplicate.A suggested plate format is shown in Figure 6, below. The user may vary the location and type of wells present as necessary for each particular experiment. The plate format provided below has been designed to allow for easy data analysis using a convenient spreadsheet offered by Cayman (see page 24, for more details). We suggest you record the contents of each well on the template sheet provided (see page 34).
Blk - BlankTA - Total Ac�vityNSB - Non-Specific BindingB0 - Maximum BindingS1-S8 - Standards 1-81-24 - Samples
A
B
C
D
E
F
G
H
1 2 3 4 5 6 7 8 9 10 11 12S1
S2
S3
S4
S5
S6
S7
S8 S8
S7
S6
S5
S4
S3
S2
S1
8
7
6
5
4
3
2
1
8
7
6
5
4
3
2
1
8
7
6
5
4
3
2
1
16
15
14
13
12
11
10
9
16
15
14
13
12
11
10
9
16
15
14
13
12
11
10
9
24
23
22
21
20
19
18
17
24
23
22
21
20
19
18
17 17
24
23
22
21
20
19
18
Blk
Blk
NSB
NSB
B0
B0
B0
TA
Figure6.Sampleplateformat
Performing the Assay
PipettingHints
• Use different tips to pipette each reagent.• Before pipetting each reagent, equilibrate the pipette tip in that
reagent (i.e., slowly fill the tip and gently expel the contents, repeat several times).
• Do not expose the pipette tip to the reagent(s) already in the well.
Addition of the Reagents1. ELISABuffer
Add 100 µl ELISA Buffer to NSB wells. Add 50 µl ELISA Buffer to B0 wells. If culture medium was used to dilute the standard curve, substitute 50 µl of culture medium for ELISA Buffer in the NSB and B0 wells (i.e., add 50 µl culture medium to NSB and B0 wells and 50 µl ELISA Buffer to NSB wells).
2. 25-hydroxyVitaminD3 ELISA StandardAdd 50 µl from tube #8 to both of the lowest standard wells (S8). Add 50 µl from tube #7 to each of the next two standard wells (S7). Continue with this procedure until all the standards are aliquoted. The same pipette tip should be used to aliquot all the standards. Before pipetting each standard, be sure to equilibrate the pipette tip in that standard.
3. SamplesAdd 50 µl of sample per well. Each sample should be assayed at a minimum of two dilutions. Each dilution should be assayed in duplicate (triplicate recommended).
4. VitaminDAChETracerAdd 50 µl to each well except the TA and the Blk wells.
5. VitaminDELISAMonoclonalAntibodyAdd 50 µl to each well except the TA, the NSB, and the Blk wells.

22 ASSAY PROTOCOL 23ASSAY PROTOCOL
Well ELISABuffer Standard/Sample Tracer Antibody
Blk - - - -
TA - - 5 µl (at devl. step) -
NSB 100 µl - 50 µl -
B0 50 µl - 50 µl 50 µl
Std/Sample - 50 µl 50 µl 50 µl
Table1.Pipettingsummary
Incubation of the PlateCover each plate with plastic film (Item No. 400012) and incubate overnight (~16-24 hrs) at room temperature.
Development of the Plate1. Reconstitute Ellman’s Reagent immediately before use (20 ml of reagent is
sufficient to develop 100 wells):100dtnvialEllman’sReagent(96-wellkit;ItemNo.400050): Reconstitute with 20 ml of UltraPure water.
OR
250dtnvialEllman’sReagent(480-wellkit;ItemNo.400050): Reconstitute with 50 ml of UltraPure water.
NOTE: Reconstituted Ellman’s Reagent is unstable and should be used the same day it is prepared; protect the Ellman’s Reagent from light when not in use. Extra vials of the reagent have been provided should a plate need to be re-developed or multiple assays run on different days.
2. Empty the wells and rinse five times with Wash Buffer. 3. Add 200 µl of Ellman’s Reagent to each well.4. Add 5 µl of tracer to the TA wells.5. Cover the plate with plastic film. Optimum development is obtained by using
an orbital shaker equipped with a large, flat cover to allow the plate(s) to develop in the dark at room temperature. This assay typically develops (i.e., B0 wells ≥0.3 A.U. (blank subtracted)) in 60-90 minutes.
Reading the Plate1. Wipe the bottom of the plate with a clean tissue to remove fingerprints, dirt,
etc. 2. Remove the plate cover being careful to keep Ellman’s Reagent from
splashing on the cover. NOTE: Any loss of Ellman’s Reagent will affect the absorbance readings. If Ellman’s Reagent is present on the cover, use a pipette to transfer the Ellman’s Reagent into the well. If too much Ellman’s Reagent has splashed on the cover to easily redistribute back into the wells, wash the plate three times with wash buffer and repeat the development with fresh Ellman’s Reagent.
3. Read the plate at a wavelength between 405 and 420 nm. The absorbance may be checked periodically until the B0 wells have reached a minimum of 0.3 A.U. (blank subtracted). The plate should be read when the absorbance of the B0 wells are in the range of 0.3-1.5 A.U. (blank subtracted). If the absorbance of the wells exceeds 2.0, wash the plate, add fresh Ellman’s Reagent and let it develop again.

24 ANALYSIS 25ANALYSIS
ANALYSISMany plate readers come with data reduction software that plot data automatically. Alternatively a spreadsheet program can be used. The data should be plotted as either %B/B0 versus log concentration using a four-parameter logistic fit or as logit B/B0 versus log concentration using a linear fit. NOTE: Cayman has a computer spreadsheet available for data analysis. Please contact Technical Service or visit our website (www.caymanchem.com/analysis/elisa) to obtain a free copy of this convenient data analysis tool.
Calculations
Preparation of the DataThe following procedure is recommended for preparation of the data prior to graphical analysis.NOTE: If the plate reader has not subtracted the absorbance readings of the blank wells from the absorbance readings of the rest of the plate, be sure to do that now.1. Average the absorbance readings from the NSB wells.2. Average the absorbance readings from the B0 wells.3. Subtract the NSB average from the B0 average. This is the corrected B0 or
corrected maximum binding.4. Calculate the B/B0 (Sample or Standard Bound/Maximum Bound) for the
remaining wells. To do this, subtract the average NSB absorbance from the S1 absorbance and divide by the corrected B0 (from Step 3). Repeat for S2-S8 and all sample wells. (To obtain %B/B0 for a logistic four-parameter fit, multiply these values by 100.)
NOTE: The TA values are not used in the standard curve calculations. Rather, they are used as a diagnostic tool; the corrected B0 divided by the actual TA (10X measured absorbance) will give the %Bound. This value should closely approximate the %Bound that can be calculated from the Sample Data (see page 26). Erratic absorbance values and a low (or no) %Bound could indicate the presence of organic solvents in the buffer or other technical problems (see page 32 for Troubleshooting).
Plot the Standard CurvePlot %B/B0 for standards S1-S8 versus Vitamin D concentration using linear (y) and log (x) axes and perform a 4-parameter logistic fit.Alternative Plot - The data can also be lineraized using a logit transformation. The equation for this conversion is shown below. NOTE: Do not use %B/B0 in this calculation.
logit(B/B0)=ln[B/B0/(1-B/B0)]
Plot the data as logit (B/B0) versus log concentrations and perform a linear regression fit.
Determine the Sample ConcentrationCalculate the B/B0 (or %B/B0) value for each sample. Determine the concentration of each sample using the equation obtained from the standard curve plot. NOTE: Remember to account for any concentration or dilution of the sample prior to the addition to the well. Samples with %B/B0 values greater than 80% or less than 20% should be re-assayed as they generally fall out of the linear range of the standard curve. A 20% or greater disparity between the apparent concentration of two different dilutions of the same sample indicates interference which could be eliminated by purification.
26 ANALYSIS 27ANALYSIS
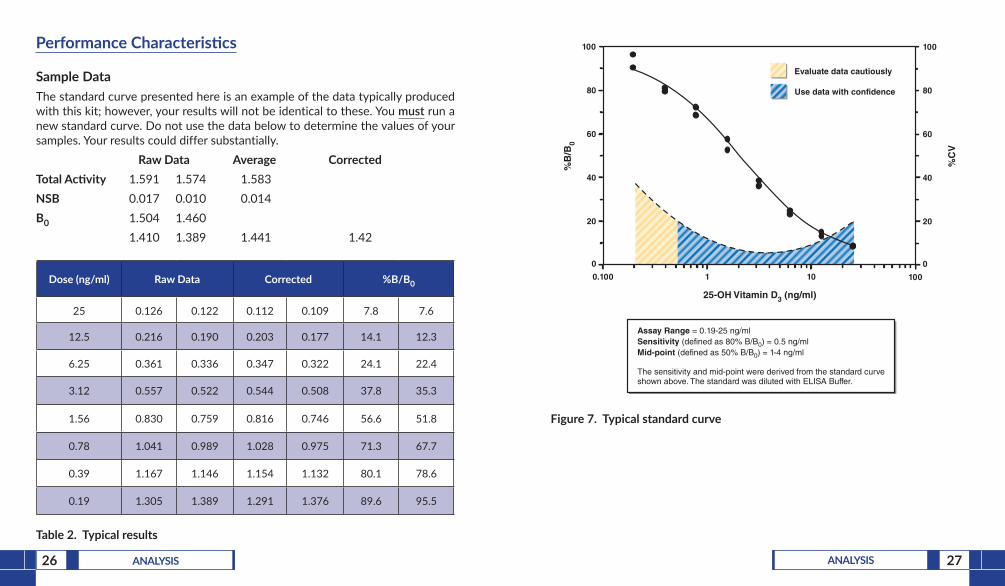
PerformanceCharacteristics
Sample DataThe standard curve presented here is an example of the data typically produced with this kit; however, your results will not be identical to these. You must run a new standard curve. Do not use the data below to determine the values of your samples. Your results could differ substantially. Raw Data Average CorrectedTotalActivity 1.591 1.574 1.583NSB 0.017 0.010 0.014B0 1.504 1.460 1.410 1.389 1.441 1.42
Dose(ng/ml) Raw Data Corrected %B/B0
25 0.126 0.122 0.112 0.109 7.8 7.6
12.5 0.216 0.190 0.203 0.177 14.1 12.3
6.25 0.361 0.336 0.347 0.322 24.1 22.4
3.12 0.557 0.522 0.544 0.508 37.8 35.3
1.56 0.830 0.759 0.816 0.746 56.6 51.8
0.78 1.041 0.989 1.028 0.975 71.3 67.7
0.39 1.167 1.146 1.154 1.132 80.1 78.6
0.19 1.305 1.389 1.291 1.376 89.6 95.5
Table2.Typicalresults
%B
/B0
%C
V
0
20
40
60
80
100
0
20
40
60
80
100
25-OH Vitamin D3 (ng/ml)
0.100 10 1001
Evaluate data cautiously
Use data with confidence
Assay Range = 0.19-25 ng/mlSensitivity (defined as 80% B/B0) = 0.5 ng/mlMid-point (defined as 50% B/B0) = 1-4 ng/ml
The sensitivity and mid-point were derived from the standard curve shown above. The standard was diluted with ELISA Buffer.
Figure7.Typicalstandardcurve

28 ANALYSIS 29ANALYSIS
Precision:The intra-assay CVs have been determined at multiple points on the standard curve. These data are summarized in the graph on page 27 and in the table below.
Dose(ng/ml) %CV* Intra-assayvariation
25 18.3
12.5 11.1
6.25 7.3
3.12 8.0
1.56 9.8
0.78 12.3
0.39 19.7
0.19 42.1
Table3.Intra-assayvariation*%CV represents the variation in concentration (not absorbance) as determined using a reference standard curve.
Level Average (ng/ml)
%CVIntra-assayvariation
Average (ng/ml)
%CVInter-assayvariation
High 72.1 8.4 53.7 4.2
Medium 39.9 13.9 36.7 6.3
Low 22.0 4.5 22.2 6.0
Table4.PlasmasamplevalidationPlasma samples containing a high, medium, or low level of Vitamin D3 were measured 60 times each using a single set of reagents. The calculated %CV is reported as intra-assay variance. A separate series of serum samples containing a high, medium, or low level of Vitamin D3 were measured four times each using eight independent sets of reagents. The calculated %CV is reported as inter-assay variance.

30 ANALYSIS 31ANALYSIS
Time Post-Supplementation (weeks)
0 5 10 1515
20
30
35
45
20
25
4025
-OH
Vit
amin
D3
(ng
/ml)
Figure8.SupplementationgraphA vitamin D deficient volunteer was supplemented with 2,000 IU vitamin D3 per day. Plasma samples were collected on a weekly basis for ELISA analysis. The points shown are averages of two dilutions assayed in triplicate.
Cross Reactivity:
Compound CrossReactivity
25-OH Vitamin D3 100%
1,25-(OH)2 Vitamin D2 265%
25-OH Vitamin D2 200%
1,25-(OH)2 Vitamin D3 100%
24,25-(OH)2 Vitamin D2 14%
24,25-(OH)2 Vitamin D3 4.2%
Vitamin D2 2.8%
Vitamin D3 <0.01%
Table5.CrossReactivityoftheVitaminDELISA

32 RESOURCES 33RESOURCES
RESOURCES
Troubleshooting
Problem Possible Causes RecommendedSolutions
Erratic values; dispersion of duplicates
A. Trace organic contaminants in the water source
B. Poor pipetting/technique
A. Replace activated carbon filter or change source of UltraPure water
High NSB (>10% of B0) A. Poor washing B. Exposure of NSB wells to
specific antibody
A. Rewash plate and redevelop
Very low B0 A. Trace organic contaminants in the water source
B. Plate requires additional development time
C. Dilution error in preparing reagents
A. Replace activated carbon filter or change source of UltraPure water
B. Return plate to shaker and re-read later
Low sensitivity (shift in dose response curve)
Standard is degraded Replace standard
Analyses of two dilutions of a biological sample do not agree (i.e., more than 20% difference)
Interfering substances are present
Purify sample prior to analysis by ELISA6
Only Total Activity (TA) wells develop
Trace organic contaminants in the water source
Replace activated carbon filter or change source of UltraPure water
References1. Gröber, U., Spitz, J., Reichrath, J., et al. Vitamin D: Update 2013: From rickets
prophylaxis to general preventive healthcare. Dermatoendocrinol. 5(3), 331-347 (2013).
2. Makin, H.L.J. and Gower, D.B. Analysis of Vitamin D, Their Metabolites and Analogues, Chapter 11, in Steroid analysis. Springer, London, 967-1096 (2010).
3. Romagnoli, E., Pepe, J., Piemonte, S., et al. Management of endocrine disease: Value and limitations of assessing vitamin D nutritional status and advised levels of vitamin D supplementation. Eur. J. Endocrinol. 169(4), R59-R69 (2013).
4. Maclouf, J., Grassi, J., and Pradelles, P. Development of enzyme-immunoassay techniques for the measurement of eicosanoids, Chapter 5, in Prostaglandin and Lipid Metabolism in Radiation Injury. Walden, T.L., Jr. and Hughes, H.N., editors, Plenum Press, Rockville, 355-364 (1987).
5. Pradelles, P., Grassi, J., and Maclouf, J.A. Enzyme immunoassays of eicosanoids using acetylcholinesterase as label: An alternative to radioimmunoassay. Anal. Chem. 57, 1170-1173 (1985).
6. Maxey, K.M., Maddipati, K.R., and Birkmeier, J. Interference in enzyme immunoassays. J. Clin. Immunoassay 15, 116-120 (1992).

34 RESOURCES 35RESOURCES
A B C D E F G H
12
34
56
78
910
1112
NOTES
WarrantyandLimitationofRemedyBuyer agrees to purchase the material subject to Cayman’s Terms and Conditions.Complete Terms and Conditions including Warranty and Limitation of Liability information can be found on our website.This document is copyrighted. All rights are reserved. This document may not, in whole or part, be copied, photocopied, reproduced, translated, or reduced to any electronic medium or machine-readable form without prior consent, in writing, from Cayman Chemical Company.©12/08/2016, Cayman Chemical Company, Ann Arbor, MI, All rights reserved. Printed in U.S.A.


![1 Dr Mughals Vitamin D talk [Read-Only] dr mughals vitamin d talk.pdf · Vitamin D Zulf Mughal Consultantin Paediatric Bone Disorders ... Vitamin D stores acquired during fetal life](https://img.pdfslide.net/doc/110x75/5b93e73f09d3f2012e8c317b/1-dr-mughals-vitamin-d-talk-read-only-dr-mughals-vitamin-d-talkpdf-vitamin.jpg)