Embed Size (px)
Citation preview

Vitro Reports Record Quarterly Sales; Up 14.5% in 2Q’08
San Pedro Garza García, Nuevo León, México – July 24, 2008 – Vitro S.A.B. de C.V. (BMV: VITROA; NYSE: VTO) one of the world's largest producers and distributors of glass products, today announced 2Q'08 unaudited results. Year over year consolidated sales rose 14.5 percent while EBITDA declined 15.6 percent. The consolidated EBITDA margin dropped to 11.7 percent from 15.8 percent in the same period last year, following a 45 percent increase in natural gas prices.
Commenting on the results for the quarter, Enrique Osorio, Chief Financial Officer, said “Our business fundamentals remain strong. Demand rose in most segments of our business. On a comparable basis, sales for the quarter reached an all-time high of $725 million. Higher energy costs, however, impacted EBITDA for the quarter. But, overall we are confident in the health of the business as we look ahead.”
FINANCIAL HIGHLIGHTS*2Q'08 2Q'07 % Change
Consolidated Net Sales 725 634 14.5%Glass Containers 393 328 19.5%Flat Glass 325 298 9.1%
Cost of Sales 540 455 18.7%Gross Income 185 179 3.7%
Mr. David González, President of Glass Containers business unit, commented, “This was another excellent quarter for containers. We posted record comparable sales driven by strong volume increases across the board. Domestic sales were up more than 22 percent year-over-year, and export sales rose almost 12 percent, including those to the US market, proving again that this is a fairly defensive business to economic downturns. Foreign subsidiaries also were strong with sales growth of almost 22 percent.” “EBITDA, in turn, decreased 6 percent year-over-year as higher energy prices, cost of raw materials and the impact of having two cosmetics glass container plants working in parallel as we transition production to our new plant in Toluca continue to impact this business. However, cost reduction programs, increased efficiencies, productivity and capacity utilization offset a large portion of these higher costs,” continued Mr. González.
Gross Margins 25.6% 28.2% -2.6 ppSG&A 143 122 17.5%SG&A % of sales 19.7% 19.2% 0.5 ppEBIT 42 57 -25.6%EBIT Margins 5.8% 9.0% -3.2 ppEBITDA 85 100 -15.6%
Glass Containers 64 68 -5.9%Flat Glass 22 29 -24.7%
EBITDA Margins 11.7% 15.8% -4.1 ppNet Income 5 10 -49.9%Net Income Margins 0.7% 1.6% -1 ppTotal Debt 1,426 1,373 3.9%
Short Term Debt 143 45 217.4%Long Term Debt 1,283 1,328 -3.4%
Average life of debt 6.2 7.4
Cash & Cash Equivalents(1) 77 212 -63.7%Total Net Debt 1,349 1,161 16.2%* Million US$ Nominal
(1) Cash & Cash Equivalents include restricted cash which corresponded to cash collateralizing debt and derivatives instruments accounted for in other current assets. As of 2Q'08, the restricted cash included US$33 million deposited in a trust to repay debt and interests.
Commenting on Flat Glass business unit, Mr. Hugo Lara noted, “Flat Glass sales rose 9 percent this quarter, also achieving a quarterly record. Sales in our US subsidiary remained flat and have begun to show signs of recovery despite weak market conditions, as we focus on larger value added commercial projects. Vitro Cristalglass, our Spanish subsidiary, continued to grow despite the contraction in residential construction in the country. Our recently acquired French subsidiary is helping to partially offset a challenging second half for Vitro Cristalglass. Auto glass sales to the OEM market remained strong, as small to mid size cars rose from 24 percent to 43 percent of our portfolio over the past year. Sales to the domestic float glass market also performed well as construction activity in Mexico continues to grow with no sign of weakness evident. EBITDA, in turn, fell 25 percent driven by higher energy and raw material costs and a lower contribution from Vitro America and Vitro Cristalglass.” Addressing the balance sheet, Mr. Osorio noted, “Net debt to EBITDA rose to 3.6 times from 3.3 times in the first quarter of the year, as capital expenditures to strengthen Vitro’s market position and expand our client base increased. The average cost of debt, in turn, dropped 30 basis points year-over-year to 9.2 percent.”

2
“This quarter demonstrates once again the resilience of our business. We will continue to build on Vitro’s strong position in the glass industry, while taking the steps to manage to the extent possible the volatility in natural gas prices,” Mr. Osorio closed. All figures provided in this announcement are in accordance with Mexican Financial Reporting Standards (Mexican FRS or NIFs) issued by the Mexican Board for Research and Development of Financial Reporting Standards (CINIF), except otherwise indicated. Dollar figures are in nominal US dollars and are obtained by dividing nominal pesos for each month by the end of month fix exchange rate published by Banco de Mexico. In the case of the Balance Sheet, US dollar translations are made at the fix exchange rate as of the end of the period. Certain amounts may not sum due to rounding. All figures and comparisons are in US dollar terms, unless otherwise stated, and may differ from the peso amounts due to the difference between inflation and exchange rates.
This announcement contains historical information, certain management’s expectations, estimates and other forward-looking information regarding Vitro, S.A.B. de C.V. and its Subsidiaries (collectively the “Company”). While the Company believes that these management’s expectations and forward looking statements are based on reasonable assumptions, all such statements reflect the current views of the Company with respect to future events and are subject to certain risks and uncertainties that could cause actual results to differ materially from those contemplated in this report. Many factors could cause the actual results, performance or achievements of the Company to be materially different from any future results, performance or achievements that may be expressed or implied by such forward-looking statements, including, among others, changes in general economic, political, governmental and business conditions worldwide and in such markets in which the Company does business, changes in interest rates, changes in inflation rates, changes in exchange rates, the growth or reduction of the markets and segments where the Company sells its products, changes in raw material prices, changes in energy prices, particularly gas, changes in the business strategy, and other factors. Should one or more of these risks or uncertainties materialize, or should the underlying assumptions prove incorrect, actual results may vary materially from those described herein as anticipated, believed, estimated or expected. The Company does not assume any obligation, to and will not update these forward-looking statements. The assumptions, risks and uncertainties relating to the forward-looking statements in this report include those described in the Company’s annual report in form 20-F file with the U.S. Securities and Exchange Commission, and in the Company’s other filings with the Mexican Comisión Nacional Bancaria y de Valores.
Jun-08 Jun-07Inflation in Mexico
Quarter 0.5% -0.4%LTM 5.2% 4.0%
Inflation in USAQuarter 2.1% 1.9%LTM 4.4% 3.1%
Exchange RateClosing 10.2841 10.7946
DevaluationQuarter -3.9% -2.2%LTM -4.7% -4.2%
This report on Form 6-K is incorporated by reference into the Registration Statement on Form F-4 of Vitro, S.A.B. de C.V. (Registration Number 333-144726). NEW ACCOUNTING PRINCIPLES
In 2007 and January 2008, the CINIF issued the following NIFs and Interpretations of Financial Reporting Standards (INIFs), which became effective for fiscal years beginning on January 1, 2008:
• NIF B-2, Statement of Cash Flows. • NIF B-10, Effects of Inflation. • NIF B-15, Translation of Foreign Currencies. • NIF D-3, Employee Benefits. • NIF D-4, Taxes on Income. • INIF 5, Recognition of the Additional Consideration Agreed to at the Inception of a Derivative Financial Instrument to Adjust It to Fair Value. • INIF 6, Timing of Formal Hedge Designation. • INIF 7, Application of Comprehensive Income or Loss Resulting From a Cash Flow Hedge on a Forecasted Purchase of a Non-Financial Asset. • INIF 8, Effects of the Business Flat Tax (IETU) • INIF 9, Presentation of Comparative Financial Statements Prepared under NIF B-10
Some of the significant changes established by these standards are as follows: • NIF B-2, Statement of Cash Flows.- This NIF establishes general rules for the presentation, structure and preparation of a cash flow statement, as well as the disclosures supplementing such statement, which replaces the statement of changes in financial position. NIF B-2 requires that the statement show a company's cash inflows and outflows during the period. Line items should be preferably presented gross. Cash flows from financing activities are now presented below those from investing activities (a departure from the statement of changes in financial position). In addition, NIF B-2 allows entities to determine and present their cash flows from operating activities using either the direct or the indirect method. • NIF B-10, Effects of Inflation.- CINIF defines two economic environments: a) inflationary environment, when cumulative inflation of the three preceding years is 26 percent or more, in which case, the effects of inflation should be recognized using the comprehensive method; and b) non-inflationary environment, when cumulative inflation of the three preceding years is less than 26 percent, in which case, no inflationary effects should be recognized in the financial statements. Additionally, NIF B-10 eliminates the replacement cost and specific indexation methods for inventories and fixed assets, respectively, and requires that the cumulative gain or loss from holding non-monetary assets be reclassified to retained earnings, if such gain or loss is realized; the gain or loss that is not realized will be maintained in stockholders' equity and charged to current earnings of the period in which the originating item is realized. • NIF B-15, Translation of Foreign Currencies.- NIF B-15 eliminates classification of integrated foreign operations and foreign entities and incorporates the concepts of accounting currency, functional currency and reporting currency. NIF B-15 establishes the procedures to translate the financial information of a foreign subsidiary: i) from the accounting to the functional currency; and ii) from the functional to the reporting currency, and allows entities to present their financial statements in a reporting currency other than their functional currency. • NIF D-3, Employee Benefits.- This NIF includes current and deferred PSW (Profit Sharing to Workers). Deferred PSW should be calculated using the same methodology established in NIF D-4. It also includes the career salary concept and the amortization period of most items is reduced to five years. The beginning balance of gains and losses from severance benefits should be amortized against the results of 2008. • NIF D-4, Income Taxes .- This NIF relocates accounting for current and deferred PSW to NIF D-3, eliminates the permanent difference concept, redefines and incorporates various definitions and requires that the cumulative income tax (“ISR”) effect be reclassified to retained earnings, unless it is identified with some of the other comprehensive income items that have not been applied against current earnings. • INIF 5, Recognition of the Additional Consideration Agreed To at the Inception of a Derivative Financial Instrument to Adjust It to Fair Value.- INIF 5 states that any additional consideration agreed to at the inception of a derivative financial instrument to adjust it to its fair value at that time should be part of the instrument's initial fair value and not subject to amortization as established by paragraph 90 of Bulletin C-10. INIF 5 also establishes that the effect of the change should be prospectively recognized, affecting results of the period in which this INIF becomes effective. If the effect of the change is material, it should be disclosed. • INIF 6, Timing of Formal Hedge Designation.- INIF 6 states that hedge designations may be made as of the date a derivative financial instrument is contracted, or at a later date, provided its effects are prospectively recognized as of the date when formal conditions are met and the instrument qualifies as a hedging relationship. Paragraph 51 a) of Bulletin C-10 only considered the hedge designation at the inception of the transaction. • INIF 7, Application of Comprehensive Income or Loss Resulting From a Cash Flow Hedge on a Forecasted Purchase of a Non-Financial Asset.- INIF 7 states that the effect of a hedge reflected in other comprehensive income or loss resulting from a forecasted purchase of a non-financial asset should be capitalized

3
within the cost of such asset, whose price is set through a hedge, rather than reclassifying the effect to the results of the period affected by the asset, as required by Paragraph 105 of Bulletin C-10. The effect of this change should be recognized by applying any amounts recorded in other comprehensive income or loss to the cost of the acquired asset, as of the effective date of this INIF. • INIF 8, Effects of the Business Flat Tax (IETU).- Due to the new tax law, the INIF 8 provides the guidance for the deferred tax recording methodology given the two income tax regimes (ISR and IETU), depending on the tax regime the company will substantially operate according to its financial projections. • INIF 9, Presentation of Comparative Financial Statements Prepared under NIF B-10.- INIF 9 states that financial data for year 2008 is presented in nominal pesos while for previous periods it is expressed in constant pesos as of December 31, 2007. Due to the above mentioned situation, financial data for last twelve months 2008 is a combination of nominal pesos (for those months of year 2008) and constant pesos as of December 31, 2007 (for those months of year 2007).
SPECIAL NOTE REGARDING NON-GAAP FINANCIAL MEASURES
A body of generally accepted accounting principles is commonly referred to as “GAAP”. A non-GAAP financial measure is generally defined by the SEC as one that purports to measure historical or future financial performance, financial position or cash flows but excludes or includes amounts that would not be so adjusted in the most comparable U.S. GAAP measure. We disclose in this report certain non-GAAP financial measures, including EBITDA. EBITDA for any period is defined as consolidated net income (loss) excluding (i) depreciation and amortization, (ii) non-cash items related to pension liabilities, (iii) total net comprehensive financing cost (which is comprised of net interest expense, exchange gain or loss, monetary position gain or loss and other financing costs and derivative transactions), (iv) other expenses, net, (v) income tax, (vi) provision for employee retirement obligations, (vii) cumulative effect of change in accounting principle, net of tax and (viii) (income) loss from discontinued operations.
In managing our business we rely on EBITDA as a means of assessing our operating performance and a portion of our management’s compensation and employee profit sharing plan is linked to EBITDA performance. We believe that EBITDA can be useful to facilitate comparisons of operating performance between periods and with other companies because it excludes the effect of (i) depreciation and amortization, which represents a non-cash charge to earnings, (ii) certain financing costs, which are significantly affected by external factors, including interest rates, foreign currency exchange rates and inflation rates, which have little or no bearing on our operating performance, (iii) income tax and tax on assets and statutory employee profit sharing, which is similar to a tax on income and (iv) other expenses or income not related to the operation of the business. EBITDA is also a useful basis of comparing our results with those of other companies because it presents operating results on a basis unaffected by capital structure and taxes.
We also calculate EBITDA in connection with covenants related to some of our financings. We believe that EBITDA enhances the understanding of our financial performance and our ability to satisfy principal and interest obligations with respect to our indebtedness as well as to fund capital expenditures and working capital requirements. EBITDA is not a measure of financial performance under U.S. GAAP or Mexican FRS. EBITDA should not be considered as an alternate measure of net income or operating income, as determined on a consolidated basis using amounts derived from statements of operations prepared in accordance with Mexican FRS, as an indicator of operating performance or as cash flows from operating activity or as a measure of liquidity. EBITDA has material limitations that impair its value as a measure of a company’s overall profitability since it does not address certain ongoing costs of our business that could significantly affect profitability such as financial expenses and income taxes, depreciation, pension plan reserves or capital expenditures and associated charges. The EBITDA presented herein relates to Mexican FRS, which we use to prepare our consolidated financial statements.
Vitro, S.A.B. de C.V. (BMV: VITROA; NYSE: VTO), is one of the largest glass manufacturers in the world. Through our subsidiary companies we offer products with the highest quality standards and reliable services to satisfy the needs of two distinct business sectors: glass containers and flat glass. Our manufacturing facilities produce, process, distribute and sell a wide range of glass products that offer excellent solutions to multiple industries that include: wine, beer, cosmetic, pharmaceutical, food and beverage, as well as the automotive and construction industry. Also, we supply raw materials, machinery and industrial equipment to different industries. We constantly strive to improve the quality of life for our employees as well as the communities in which we do business by generating employment and economic prosperity thanks to our permanent focus on quality and continuous improvement as well as consistent efforts to promote sustainable development. Our World Headquarters are located in Monterrey, Mexico where Vitro was founded in 1909 and now embarks major facilities and a broad distribution network in ten countries in the Americas and Europe. Additionally, it exports its products to over 50 countries around the World. For more information, you can access Vitro’s Website at: http://www.vitro.com
Second Quarter 2008 results Conference Call and Web cast
Friday, July 25, 2008 11:00 AM U.S. EST – 10:00 A.M. Monterrey time
A live web cast of the conference call will be available to investors and the media at http://www.vitro.com. A replay of the web cast will be available through the end of the day on August 7, 2008. For inquiries regarding the conference call, please contact Barbara Cano or Susan Borinelli of Breakstone Group via telephone at (646) 452-2334, or via email at [email protected]
Investor Relations Adrian Meouchi / Angel Estrada
Vitro S.A.B. de C.V. + (52) 81-8863-1765 / 1730
[email protected]@vitro.com
U.S. agency Susan Borinelli / Barbara Cano
Breakstone Group (646) 452-2334
[email protected]@breakstone-group.com
Media Relations Albert Chico
Vitro, S.A.B. de C.V. + (52) 81-8863-1661
For further information, please contact:
DETAILED FINANCIAL INFORMATION FOLLOWS: Consolidated Results Sales 5 EBIT and EBITDA 5 Consolidated Financing Result 6

4
Taxes 7 Consolidated Net Income 8 Capital Expenditures 8 Consolidated Financial Position 8 Cash Flow 10 Key Developments 12 Glass Containers 17 Flat Glass 18 Consolidated Financial Statements 20 Segmented Information 21

5
Consolidated Results
Sales Consolidated net sales for 2Q’08 increased 14.5 percent YoY to US$725 million from US$634 million last year. For LTM 2008, consolidated net sales rose 9.1 percent to US$2,689 million from US$2,465 in LTM 2007. Glass Containers sales for the quarter rose YoY by 19.5 percent while Flat Glass sales grew 9.1 percent over the same time period. During the quarter domestic, export and foreign subsidiaries’ sales increased 22.7 percent, 6.3 percent and 10.2 percent YoY respectively. Table 1: Total Sales
YoY% YoY% YoY%2Q'08 2Q'07 Change 6M'08 6M'07 Change 2008 2007 Change
Pesos(1)
Total Consolidated Sales 7,503 7,078 6.0 14,384 13,966 3.0 29,009 28,098 3.2
Glass Containers 4,061 3,647 11.3 7,671 7,190 6.7 15,119 14,506 4.2 Flat Glass 3,359 3,347 0.3 6,547 6,600 (0.8) 13,538 13,179 2.7
Domestic Sales 3,292 2,958 11.3 6,166 5,814 6.1 12,359 11,930 3.6 Export Sales 1,764 1,733 1.8 3,432 3,316 3.5 6,790 6,328 7.3 Foreign Subsidiaries 2,446 2,387 2.5 4,786 4,837 (1.1) 9,860 9,840 0.2
Nominal DollarsTotal Consolidated Sales 725 634 14.5 1,365 1,236 10.4 2,689 2,465 9.1
Glass Containers 393 328 19.5 728 641 13.6 1,404 1,282 9.5 Flat Glass 325 298 9.1 621 580 7.1 1,252 1,147 9.1
Domestic Sales 326 266 22.7 596 517 15.2 1,156 1,055 9.6 Export Sales 166 156 6.3 320 296 8.2 626 561 11.6 Foreign Subsidiaries 233 211 10.2 449 423 6.1 907 850 6.7
% Foreign Currency Sales* / Total Sales 55% 58% -3 pp 56% 58% -2.2 pp 57% 57% -0.2 pp% Export Sales / Total Sales 23% 25% -1.8 pp 23% 24% -0.4 pp 23% 23% 0.6 pp
* Exports + Foreign Subsidiaries
Table 1 Sales
(Million)LTM
(1) Financial data for year 2008 is presented in nominal pesos while for previous periods it is expressed in constant pesos as of December 31, 2007. For more details please refer to the note regarding new Mexican Financial Reporting Standards on page 2.
EBIT and EBITDA
Consolidated EBIT for the quarter decreased 25.6 percent YoY to US$42 million from US$57 million last year. EBIT margin decreased 3.2 percentage points to 5.8 percent from 9.0 percent. On a LTM basis, consolidated EBIT increased 2.5 percent to US$217 million from US$212 million in LTM 2007. During this same period of time, EBIT margin decreased 50 basis points to 8.1 percent from 8.6 percent.
EBIT for the quarter at Glass Containers decreased by 8.9 percent YoY, while at Flat Glass EBIT decreased by 45.3 percent.
Consolidated EBITDA for the quarter declined by 15.6 percent to US$85 million from US$100 million in 2Q’07. The EBITDA margin decreased 4.1 percentage points YoY to 11.7 percent from 15.8 percent and was negatively affected, among other factors, by higher energy and raw materials costs and transition of production of our new cosmetics glass container plant. On a LTM basis, consolidated EBITDA decreased 8.8 percent to US$360 million from US$395 million in LTM 2007.
During the quarter, EBITDA at Glass Containers decreased 5.9 percent YoY to US$64 million from US$68 million while EBITDA at Flat Glass decreased 24.7 percent YoY to US$22 million from US$29 million. For details on both business units please refer to page 17 and 18, respectively.
6
Table 2: EBIT and EBITDA
YoY% YoY% YoY%2Q'08 2Q'07 Change 6M'08 6M'07 Change 2008 2007 Change
Pesos(1)
Consolidated EBIT 439 640 (31.4) 892 1,240 (28.1) 2,356 2,425 (2.9) Margin 5.8% 9.0% -3.2 pp 6.2% 8.9% -2.7 pp 8.1% 8.6% -0.5 pp
Glass Containers 398 469 (15.2) 781 928 (15.8) 1,938 1,955 (0.9) Flat Glass 90 183 (50.7) 190 348 (45.2) 625 625 0.1
Consolidated EBITDA 876 1,120 (21.8) 1,746 2,219 (21.3) 3,906 4,514 (13.5) Margin 11.7% 15.8% -4.1 pp 12.1% 15.9% -3.8 pp 13.5% 16.1% -2.6 pp
Glass Containers 665 760 (12.5) 1,288 1,536 (16.1) 2,853 3,220 (11.4) Flat Glass 227 331 (31.4) 466 641 (27.2) 1,146 1,292 (11.3)
Nominal DollarsConsolidated EBIT 42 57 (25.6) 85 109 (22.6) 217 212 2.5 Margin 5.8% 9.0% -3.2 pp 6.2% 8.8% -2.6 pp 8.1% 8.6% -0.5 pp
Glass Containers 38 42 (8.9) 74 83 (10.4) 179 172 3.9 Flat Glass 9 16 (45.3) 18 30 (39.3) 57 53 7.7
Consolidated EBITDA 85 100 (15.6) 166 196 (15.6) 360 395 (8.8) Margin 11.7% 15.8% -4.1 pp 12.1% 15.9% -3.8 pp 13.4% 16.0% -2.6 pp
Glass Containers 64 68 (5.9) 122 137 (10.5) 264 284 (6.9) Flat Glass 22 29 (24.7) 44 56 (20.5) 105 111 (5.4)
(1) Financial data for year 2008 is presented in nominal pesos while for previous periods it is expressed in constant pesos as of December 31, 2007. For more details please refer to the note regarding new Mexican Financial Reporting Standards on page 2.
Table 2EBIT and EBITDA
(Million)LTM
Consolidated Financing Result Consolidated financing result for the quarter decreased 41.0 percent YoY to US$23 million compared with US$39 million during 2Q’07. This was mainly driven by a non-cash foreign exchange gain of US$56 million compared with a non-cash foreign exchange gain of US$19 million during 2Q’07. During 2Q’08, the Mexican peso experienced a 3.9 percent appreciation compared with a 2.2 percent appreciation in the same period last year. In addition, a US$2 million reduction in interest expense related to the refinancing done at the beginning of last year also contributed to lower the total consolidated financing result. These factors more than offset higher other financial expenses of US$45 million compared with US$31 million during 2Q’07 as a result of lower value in derivative transactions. The decrease in monetary position is the result of the elimination of this effect at the beginning of year 2008 due to the new Mexican Financial Reporting Standards (please refer to the related note on page 2). On a LTM basis, total consolidated financing result decreased 20.6 percent YoY to US$100 million from US$126 million driven by a combination of favorable factors: a non-cash foreign exchange gain of US$64 million compared with a non-cash foreign exchange gain of US$33 million during LTM 2007 driven by a 4.7 percent appreciation experienced by the Mexican peso in LTM 2008 compared with a 4.2 percent appreciation in the same period last year; and lower interest expense of US$141 million compared with US$155 million, as a result of a decrease in the interest rate. The above mentioned factors more than offset lower interest income as well as lower monetary position due to the reason mentioned in the previous paragraph.

7
Table 3: Total Financing Result
YoY% YoY% YoY%2Q'08 2Q'07 Change 6M'08 6M'07 Change 2008 2007 Change
Pesos(1)
Interest Expense (353) (404) (12.5) (714) (892) (20.0) (1,525) (1,767) (13.7) Interest Income 8 80 (90.2) 24 124 (80.6) 75 203 (62.9) Other Financial Expenses(2) (472) (343) 37.6 (522) (397) 31.5 (634) (703) (9.7) Foreign Exchange (Loss) 578 207 179.5 796 46 1,633.3 656 371 77.1
Monetary Position (Loss)(3)(0) 23 -- (0) 142 -- 329 458 (28.1)
Total Financing Result (239) (437) (45.2) (416) (978) (57.4) (1,099) (1,438) (23.6)
Nominal DollarsInterest Expense (34) (36) (5.3) (68) (79) (14.1) (141) (155) (8.9) Interest Income 1 7 (89.3) 2 11 (79.4) 7 18 (61.6) Other Financial Expenses(2) (45) (31) 47.0 (50) (36) 40.8 (60) (62) (3.4) Foreign Exchange (Loss) 56 19 200.0 76 5 1,547.4 64 33 94.5 Monetary Position (Loss)(3)
(0) 2 -- (0) 12 -- 30 40 (25.6) Total Financing Result (23) (39) (41.0) (40) (86) (54.1) (100) (126) (20.6)
(3) According with the new Mexican Financial Reporting Standards, the monetary position effect was eliminated at the beginning of year 2008. For further details please refer to the note regarding new Mexican Financial Reporting Standards on page 2.
Table 3 Total Financing Result
(Million)LTM
(2) Includes derivative transactions and interest related to factoring transactions
(1) Financial data for year 2008 is presented in nominal pesos while for previous periods it is expressed in constant pesos as of December 31, 2007. For more details please refer to the note regarding new Mexican Financial Reporting Standards on page 2.
Taxes Total income tax increased from an expense of US$4 million in 2Q’07 to an expense of US$13 million during this quarter. Accrued income tax increased to US$8 million from US$3 million in 2Q’07 due to higher taxable profits in our Mexican operations and in some of our foreign operations in the U.S. and Europe. In addition, during this quarter we posted a deferred income tax of US$5 million compared to US$2 million during 2Q’07 mainly due to the amortization of tax loss carryforwards by subsidiaries with taxable profits. Table 4: Taxes
YoY% YoY% YoY%2Q'08 2Q'07 Change 6M'08 6M'07 Change 2008 2007 Change
Pesos(1)
Accrued Income Tax 83 29 182.0 181 90 100.9 486 130 274.5 Deferred Income Tax (gain) 48 20 136.9 (103) 33 -- (487) 512 --
Total Income Tax 131 50 163.6 78 123 (36.1) (1) 642 --
Nominal DollarsAccrued Income Tax 8 3 214.4 17 8 119.9 45 11 304.7 Deferred Income Tax (gain) 5 2 155.6 (9) 3 -- (45) 45 --
Total Income Tax 13 4 190.1 8 11 (27.5) 0 56 (99.5) (1) Financial data for year 2008 is presented in nominal pesos while for previous periods it is expressed in constant pesos as of December 31, 2007. For more details please refer to the note regarding new Mexican Financial Reporting Standards on page 2.
Table 4 Taxes
(Million)LTM

8
Consolidated Net Income During 2Q’08 the Company recorded a consolidated net income of US$5 million compared to a net income of US$10 million during the same period last year. This variation is the result of two factors: lower EBIT of US$42 million compared with US$57 million in the second quarter last year mainly due to higher energy and raw materials costs and transition of production of our new cosmetics glass container plant; and higher income taxes of US$13 million compared with US$4 million. The above mentioned factors were partially offset by a US$16 million decrease in total financing result mainly derived from a higher appreciation of the Mexican peso during the second quarter of this year when compared with the appreciation of 2Q’07.
Consolidated Net Income(million dollars)
5
-23 -1 -13
42
EBITTotal
Financing Result
Other Expenses Taxes Consolidated
Net Income
Consolidated Net Income(million dollars)
5
-23 -1 -13
42
EBITTotal
Financing Result
Other Expenses Taxes Consolidated
Net Income
Capital Expenditures (CapEx) Capital expenditures for the quarter totaled US$57 million, compared with US$66 million in 2Q’07. Glass Containers represented 84 percent of total capex and was mainly invested in two major furnace repairs, the transfer of Vidriera México’s (“Vimex”) facilities to Toluca and maintenance. Flat Glass accounted for 16 percent and was mainly invested in the acquisition of the assets of Verres et Glaces d’Epinay (now named Vitro Cristalglass France SAS), equipment upgrade in the Automotive business and maintenance.
Consolidated Financial Position
Net debt, which is calculated by deducting cash and cash equivalents as well as restricted cash accounted for in current and other long term assets, increased QoQ by US$85 million to US$1,349 million. On a YoY comparison, net debt increased US$188 million.
As of 2Q’08, the Company had a cash balance of US$77 million, of which US$43 million was recorded as cash and cash equivalents and US$34 million was classified as other current assets. The US$34 million is restricted cash, which is composed of cash collateralizing debt and cash deposited in a trust to repay debt and interests on the covenant defeasance of the Vitro Envases Norteamerica, S.A. de C.V. (“VENA”) Senior Notes due 2011 that was paid in July 23, 2008. Cash collateralizing debt corresponds to US$1 million recorded at Flat Glass and the cash deposited in a trust to repay debt and interests corresponded to US$33 million recorded at Glass Containers.
Consolidated gross debt as of June 30, 2008 totaled US$1,426 million, a QoQ increase of US$24 million and a YoY increase of US$53 million. As of 2Q’08, consolidated short-term debt includes US$30 million associated with the covenant defeasance of the Senior Notes due 2011 at VENA mentioned above.

9
2Q'08 1Q'08 4Q'07 3Q'07 2Q'07
Interest Coverage(EBITDA/ Total Net Financial Exp.) (Times) LTM 1.9 2.1 2.2 2.1 2.0
Leverage(Total Debt / EBITDA) (Times) LTM 3.8 3.6 3.4 3.5 3.4(Total Net Debt / EBITDA) (Times) LTM 3.6 3.3 2.9 3.1 3.0
Total Debt 1,426 1,402 1,373 1,382 1,373Short-Term Debt(1) 143 132 87 80 45 Long-Term Debt 1,283 1,270 1,286 1,302 1,328
Cash and Equivalents(2) 77 138 186 173 212 Total Net Debt 1,349 1,264 1,186 1,209 1,161
Currency Mix (%) dlls&Euros/Pesos 97/3 98/2 98/2 98/2 98/2
Table 5Debt Indicators
(Million dollars; except as indicated)
(2) Cash & Cash Equivalents include restricted cash which corresponded to cash collateralizing debt and derivative instruments accounted for in current and other long term assets. As of 2Q'08, the restricted cash included US$33 million deposited in a trust that was used to repay debt and interests (see note 1).
(1) 2Q'08 short term debt included US$30 million associated with the covenant defeasance of the Senior Notes due 2011 at VENA that was paid in July 23, 2008. The required cash was recorded as restricted cash. On July 23, 2008 the restricted cash was freed from the trust and used to pay down the outstanding balance.
• The Company’s average life of debt as of 2Q’08 was 6.2 years compared with 7.4 years for 2Q’07.
• Short-term debt as of June 30, 2008, increased by US$98 million to 10 percent as a percentage of total debt, compared with 3 percent in 2Q’07.
10%
5%
95%
87%
90%
8%
90%
5%
3%
5%
2%
Dollars
Source
Debt Profile as of June 30, 2008:
Euros
Floating Rate + Fixed spread
Market Conditions
Currency
Maturity
Rate
Fixed Rate
Pesos
Long TermCurrent maturities of LT DebtShort Term
Banks Market
(1) LIBOR, TIIE and CETE base rates(2) The interest payments of US$500 million debt were swapped from fixed dollar rate to variable peso rate until 2012.
The interest payments of US$500 million debt were swapped from fixed dollar rate to fixed peso rate until 2012.
(1) (1)
(2)
• Revolving debt, including trade-related debt, accounted for 53 percent of total short-term debt. This type of
debt is usually renewed within 28 to 180 days. • Current maturities of long-term debt, including current maturities of market debt, increased by US$62 million
to US$67 million from US$5 million as of June 30, 2007. As of 2Q’08 current maturities of long-term debt represented 47 percent of short-term debt.

10
• As of June 30, 2008 Vitro had an aggregate of US$141 million in off-balance sheet financing related to sales of receivables and receivable securitization programs. Flat Glass recorded US$75 million and Glass Containers recorded US$66 million.
Debt Amortization Schedule
(million dollars)
76 8 27
304
936
47
208
2008 2009 2010 2011 2012 2013-On
Short Term Current Maturities of LT Long Term
123 28 8 304
936
27
Debt Amortization Schedule(million dollars)
76 8 27
304
936
47
208
2008 2009 2010 2011 2012 2013-On
Short Term Current Maturities of LT Long Term
123 28 8 304
936
27
• Maturities for 2008 include long-term “Certificados Bursátiles”, the covenant defeasance of the VENA Senior
Notes due 2011 and Credit Facilities at the subsidiary level.
• Maturities from 2009 and thereafter include, among others, long-term “Certificados Bursátiles”, the Senior Notes due in 2012, Senior Notes due in 2013 and Senior Notes due in 2017 at the Holding Company level.
Cash Flow
Cash flow before CapEx and dividends decreased to negative US$3 million from US$24 million in 2Q’07. This was principally the result of higher taxes paid in cash, lower EBITDA and increased net interest expense. Lower working capital needs partially offset the reduced cash flow. Available cash and increased debt were used to fund the negative US$3 million mentioned above and the US$57 million in CapEx investments compared with US$66 million in 2Q’07. On a LTM basis, the Company recorded cash flow before CapEx and dividends of US$126 million compared with US$161 million in LTM 2007. The above mentioned decrease, partially offset by a US$66 million reduction in net interest expense, was mainly due to higher cash taxes paid, lower EBITDA and increased working capital needs. This cash flow coupled with available cash was used to fund the US$244 million CapEx investments, which in part was used to increase capacity at Glass Containers to satisfy higher demand from our customers.

11
Table 6: Cash Flow Analysis
YoY% YoY% YoY%2Q'08 2Q'07 Change 6M'08 6M'07 Change 2008 2007 Change
Pesos(2)
EBITDA 876 1,120 (21.8) 1,746 2,219 (21.3) 3,906 4,514 (13.5) Net Interest Expense(3),(4) (533) (482) 10.5 (958) (828) 15.7 (1,343) (2,214) (39.3) Working Capital(5) (52) (262) (80.3) (748) (277) 170.2 (441) (221) 99.9 Cash Taxes (paid) recovered(6) (330) (118) 180.9 (374) (209) 79.5 (696) (247) 182.1
Cash Flow before Capex and Dividends (38) 259 -- (334) 906 -- 1,426 1,833 (22.2)
Capex (588) (730) (19.4) (1,281) (1,333) (3.9) (2,642) (2,010) 31.4 Dividends (170) (141) 20.7 (170) (169) 0.8 (209) (180) 16.2
Net Free Cash Flow (797) (612) -- (1,785) (596) 199.3 (1,425) (357) 299.5
Nominal DollarsEBITDA 85 100 (15.6) 166 196 (15.6) 360 395 (8.8) Net Interest Expense(3),(4) (51) (43) 19.3 (91) (73) 23.8 (125) (191) (34.4) Working Capital(5) (5) (23) (79.5) (69) (23) 203.7 (43) (21) 107.8 Cash Taxes (paid) recovered(6) (32) (11) 197.2 (36) (19) 90.7 (65) (22) 195.8
Cash Flow before Capex and Dividends (3) 24 -- (30) 81 -- 126 161 (21.5)
Capex (57) (66) (13.4) (121) (119) 2.3 (244) (178) 37.4 Dividends (17) (13) 27.9 (17) (15) 7.1 (20) (16) 22.2
Net Free Cash Flow (76) (55) -- (168) (53) 218.6 (138) (33) 316.2
(3) Includes derivative transactions, and other financial expenses and products. Includes interest rate swap transaction in which Vitro pays variable peso rates on a monthly basis and receives semi-annual payments of fixed dollar rate.(4) 1Q'07 does not include additional interests and transaction fees associated with the debt refinancing completed at the beginning of year 2007.(5) Includes: Clients, inventories, suppliers, other current assets and liabilities, IVA (Value Added Tax) and ISCAS taxes (Salary Special Tax)(6) Includes PSW (Profit Sharing to Workers)
Table 6Cash Flow from Operations Analysis(1)
(Million)LTM
(2) Financial data for year 2008 is presented in nominal pesos while for previous periods it is expressed in constant pesos as of December 31, 2007. For more details please refer to the note regarding new Mexican Financial Reporting Standards on page 2.
(1) This statement is a Cash Flow statement and it does not represent a Statement of Cash Flow according with Mexican FRS

12
Key Developments
LEGAL Vitro files a lawsuit for the invalid acquisition of its shares
On June 26, 2008 the Company announced, in relation with the press release issued on April 30, 2008, that and in addition to evaluating other legal actions, it filed a lawsuit against Banco Nacional de México, S.A., Institución de Banca Múltiple (Banamex) and a subsidiary of Grupo Financiero Banamex, S.A. and of Citigroup , requesting the court to declare null and void the acquisition and ownership of Vitro’s common shares by Banamex due to the violation of Vitro’s by-laws. Vitro’s current by-laws provide that no foreign person or foreign entity or any Mexican company that allows a foreign person or company to own any equity participation in its capital may own or acquire Vitro’s issued common shares. Also, Vitro’s by-laws provide that in case the above restriction is violated, such acquisition of shares shall be null and void and the Company shall not recognize such buyer as the legal owner and in consequence it shall not be able to exercise any of the common share’s corporate or economic rights. The Company wished to clarify that any foreign citizen or company is allowed to participate in Vitro by acquiring the Company’s ADR’s currently traded in the New York Stock Exchange. The Mexican courts have granted a petition by Vitro to immobilize such common shares, pending definitive resolution of the action filed by Vitro.
CNBV's requirement regarding the controversy of the ownership of shares
On July 4, 2008 the Company, as ordered by the Comisión Nacional Bancaria y de Valores ("CNBV") on July 3, 2008, informed:
On April 24, 2008, Vitro, through a written notification informed the CNBV about the events that occurred on its annual shareholders meeting held on April 17th, 2008, regarding the certificate of shareholders ownership of shares held in deposit at Acciones y Valores Banamex, S.A. de C.V. ("Accival"). In such certification issued by Accival, Banco Nacional de Mexico, S.A. (Banamex) appears as the owner of approximately 14.94 percent of the outstanding shares of Vitro. In its written notification, Vitro in general terms, specified to the CNBV that it estimated that such ownership of shares resulted in a violation of at least two of the articles of its bylaws, without considering any other violation to the Ley del Mercado de Valores, refer to as "Mexican Law of the Securities Market".
Basically, Vitro indicated that (i) first, the bylaws prohibit the acquisition by any person or group of persons acting in concert, in one or more transactions, more than 9.9 percent of Vitro's outstanding shares without the prior written approval of its Board of Directors. As of July 4, 2008, Banamex had not requested any approval to acquire more than 9.9 percent of Vitro's outstanding shares, (ii) second, the bylaws expressly provide that the shares may not be acquired, either directly or indirectly by foreign persons or foreign companies or entities or by Mexican companies that do not prohibit in its bylaws the ownership of any part of its capital by a foreign person.
As provided for in the bylaws of Banamex, such bylaws do not contain a prohibition of ownership of its capital by a foreign person as requested by the bylaws of Vitro. Such events were informed to the CNBV as provided in article 355 and other articles of the Mexican Law of the Securities Markets in order to initiate the applicable investigations, without excluding any other action that Vitro could initiate in this respect. The above was also informed through a written notification dated April 30, 2008. Additionally, on June 26, 2008 Vitro also informed that it initiated litigation against Banamex in the Mexican courts, requesting the court to declare null and void the acquisition and ownership of any of Vitro's common shares by Banamex, due to the violation of its bylaws and that the Mexican courts had granted a petition to immobilize such shares.
Through a written notification dated July 2, 2008, delivered to Vitro on July 3, 2008, the CNBV responded the following:
"…With regards to this particular issue, we inform you, that this Commission, in exercise of its authority to supervise and in order to know with certainty the ownership of the outstanding shares of the issuer (Vitro's

13
shares), which on April 17, 2008, were held at an open account in "Acciones y Valores Banamex, S.A. de C.V., Casa de Bolsa, integrante del Grupo Financiero Banamex" (Accival), and at "Banco Nacional de Mexico, S.A., integrante del Grupo Financiero Banamex" (Banamex), requested to both financial intermediaries the lists of such accounts on that particular date, indicating the account number, complete name of the holder and co-holder, and the amount and series of the shares.
From the analysis of the information presented by Accival and Banamex, it is inferred that the 53,567,082 Vitro shares, referenced to in your notification, are held by multiple trusts formed at Banamex, whose settlors-beneficiares are different persons.
Based in the forgoing and considering that the information contained in this notification results relevant for public investors to make decisions, it is required to the company to, as specified on articles 106, second to last paragraph and 360 of the Mexican Law of the Securities Market, that no later than the next business day of the receipt of this notification, they shall reveal the information contained in the two paragraphs above, as well as the references made in this notice to your April 24, 2008 notification, as a relevant event, through the electronic system to publish information of the Bolsa Mexicana de Valores, S.A. de C.V., called "Emisnet"."
The above is made available to the general public as expressly required by the CNBV. Vitro estimates that the information included in the notification by the CNBV regarding the conflict of ownership of the shares of Vitro through certain trusts in Banamex, as referred to above, do not resolve the violation of Vitro's bylaws, due to, among other things, the fact that the identity of the settlors- beneficiaries is not revealed. Also, Vitro has not received evidence that confirms the conclusion inferred by the CNBV. Therefore, Vitro is evaluating the information provided by the CNBV, in order to determine the appropriate actions and remedies, as well as to assure the compliance to its bylaws and to the Mexican Law of the Securities Market.
Vitro confirms its position after Banamex’s response
On July 9, 2008 the Company informed that in relation with the statements contained in the press release issued by Banco Nacional de México, S.A. (Banamex), subsidiary of Citibank, N.A and with the problems discovered a few days before the annual shareholders meeting held on April 17th, 2008:
The Company has complied at all times with all legal dispositions that are related to any disclosure contained in the “Ley del Mercado de Valores” referred to as the Mexican Law of Securities Market, by posting notices or communications of relevant events in the “Emisnet”. The actions adopted by Vitro do not intend to take anything from anyone, much less from any domestic or foreign minority shareholder that legally acquired shares issued by the Company, in conformity with the mechanisms allowed and established in the law and our bylaws, on the contrary, precisely to protect them and the Company, Vitro encourages to meet and comply with the bylaws, which are the law for the shareholders, as well as to meet and comply with the laws of our country and Vitro rejects and defends itself form any hostile acts that violate with such laws.
It is not Vitro that confuses any shareholders participation of Banamex in Vitro, but on the contrary it is either Banamex, who confuses or pretends to confuse not only such shareholders participation but the public, the authorities and third parties, by claiming and by trying to exercise rights as shareholder as though it was its own at the Annual Shareholders Meeting of Vitro and now it simply tries to deny any ownership. The current bylaws of Vitro have existed for more than one year and a half (more than nineteen months) and since, are public, are registered in the public registry of commerce, are available in its internet web-site and at the Mexican Sock Exchange in accordance with all legal dispositions. It is important to mention that at Vitro’s Extraordinary Shareholders Meeting held on November 26th, 2006, in which its bylaws were modified to adopt its existing language, including its fifth clause, related to ownership of its equity by foreigners, Banamex voted in favor, and if any of its customers do not feel to be adequately informed about this situation, he or she should ask its banking services supplier about it.
Vitro has exercised certain actions to protect itself and its minority shareholders from hostile acts that are contrary to the law. Vitro believes that the law will prevail in our country’s legal framework and will not stop before any

14
threat to the company or the company’s administration, and will continue to defend its rights and the rights of all its legitimate shareholders through the applicable legal mechanisms.
Court of Appeals confirms decision of lower court denying Pilkington’s opposition to the merger of Vitro Plan into Viméxico
On June 30, 2008 the Company announced that its subsidiary Viméxico, S.A. de C.V. (Viméxico), was notified of the final decision issued by the Appeals Court of the Fourth Circuit, ratifying the decision issued by the lower court denying Pilkington Group Limited’s (Pilkington) opposition to the resolutions adopted at the Extraordinary Shareholders Meeting held on December 11th, 2006 of the now extinct company Vitro Plan, S.A. de C.V. (Vitro Plan). As a result of this decision of the Appeals Court, in accordance with article 200 of the Mexican General Law of Corporations, all of the above mentioned resolutions are valid and binding for all shareholders, including those who voted against such resolutions. In addition, the Appeals Court confirmed the dismissal of all claims demanded by Pilkington in its original complaint and confirmed the validity of the merger of Vitro Plan into Viméxico approved at the Extraordinary Shareholders Meeting of the now extinct Vitro Plan. At the same time, the Appeals Court confirmed the decision to condemn Pilkington to pay Viméxico attorneys fees and expenses including those incurred during Appeals proceedings; such amount will be calculated upon the execution of the decision. Despite the fact that Pilkington may still appeal this decision through an “Amparo” proceedings, Vitro, S.A.B. de C.V., based in the opinion of its attorneys in charge of this case, believes that such proceedings will not succeed and the decisions issued by the lower court and the appeals court will be confirmed.
AWARDS The Mexican Association for Containers and Packaging (AMEE) awards 43 Vitro containers in its contest
On June 25, 2008 the Company announced that for the second consecutive year it was awarded the “Stellar Export Packaging Award” that is given by the Mexican Association of Containers and Packaging Manufacturers (AMEE). The AMEE also gave awards to another 43 Vitro glass containers and bottles for the liquor, wine, pharmaceutical, food, cosmetics and beverage industries in its “Stellar Container and Packaging Contest 2008”. In addition to these awards, Vitro won 5 awards in May on behalf of the Glass Packaging Institute known as (GPI) in their yearly competition “Clear Choice Awards”.
Vitro continues its leadership position upon receiving the 2007 National Quality Award
On May 7, 2008 the Company announced that Clínica Vitro was awarded the 2007 National Quality Award, in the category of Health Institutions, by Eduardo Sojo, Secretary of Economy for Mexico, in a ceremony that took place in the Alcazar Salon in the Chapultepec Castle in Mexico City. The National Award for Quality is a public recognition that is awarded annually in Mexico to those organizations that distinguish themselves by embracing “best practices” in management of Total Quality and therefore become role models to follow. This is the sixth time that Vitro has been awarded this important prize with the other occasions being in 1995, 1998, 1999, 2000 y 2005.
Five Vitro glass containers win awards in the USA
On May 6, 2008 the Company announced that the Glass Packaging Institute (GPI) awarded Vitro Packaging, a subsidiary of Vitro in the United States, five of the twelve yearly awards “Clear Choice Awards 2008”. The “Clear Choice Awards” is the only program that awards manufacturing companies for consumer products that are packaged in glass containers. The variables that are taken into consideration for determining the winners are: esthetics, creativity, form, functionality and attractiveness to the market.

15
Vitro Honored by General Motors as a 2007 Supplier of the Year
On April 29, 2008 the Company received the General Motors 2007 Supplier of the Year award for its significant contributions to GM’s global product and performance achievements. The GM Supplier of the Year award began as a global program in 1992. Winners are selected by a global team of executives from purchasing, engineering, manufacturing and logistics who base their decisions on supplier performance in quality, service, technology and price.
RATINGS Vitro’s rating and outlook affirmed by Fitch Ratings
On April 28, 2008 the Company’s rating was affirmed at B by Fitch Ratings (Fitch). At the same time, Fitch upgraded the national scale long term rating to BBB-(mex) from BB+(mex). The ratings for Vitro are based in the Company’s strong business position in the production of glass in Mexico, geographic revenue diversification and hard currency generation. Vitro’s export revenues and sales from foreign subsidiaries located in the United States, Spain, Portugal, Central America and South America totaled US$1.48 billion in 2007 and represented 57.9 percent of total consolidated revenues. More than 80 percent of Vitro’s total revenues are linked to the US dollar. The ratings also incorporate the continued challenging operating environment for Vitro. Average natural gas prices for 2008 are expected to be higher than in 2007 and construction and automotive industries cyclicality due to the slowdown in the US and Mexican economies, could affect the Company’s performance.
Vitro’s ratings reflect the Company’s improved financial profile and capital structure after the refinancing process completed at the beginning of 2007, which consisted in the offering of US$1.0 billion Senior Unsecured Notes in two tranches, US$300 million and US$700 million with final maturity scheduled for 2012 and 2017, respectively. With this transaction Vitro mitigated short-term refinancing and liquidity risks and eliminated structural subordination following the take out of secured operating subsidiary debt
Vitro’s rating and outlook affirmed by Standard & Poor’s
On April 23, 2008 the Company’s corporate rating was affirmed at B by Standard & Poor's (S&P) Ratings Services. The ratings are supported by the Company's leading position in glass containers and its significant share of the Mexican flat-glass market. They also reflect its export activities and international operations, which contribute about 58 percent of total revenues.
Vitro has a manageable maturity schedule, with short-term debt representing only 6 percent of total debt. Additional flexibility is derived from the Company’s ability to defer expansion capital expenditures during the year. As of Dec. 31, 2007, cash in hand (about $150 million) and restricted cash (about $36 million earmarked to repay debt and interests in July 2008 of the senior notes issued by the glass-containers business) compared favorably with debt maturities of $87 million during the next 12 months.
The stable outlook reflects S&P’s opinion that Vitro's liquidity is adequate to meet its debt maturities during 2008 and considers the S&P’s expectation that financial performance could weaken this year.
Vitro’s rating and outlook affirmed by Moody’s
On April 14, 2008 the Company’s B2 corporate family rating and its stable outlook were affirmed by Moody’s. According to Moody’s, Vitro’s actual ratings reflect the solid domestic and international market positions of its glass container division, the fairly defensive nature of the glass container business which generates the bulk of consolidated earnings, and positive operating performance trends in recent years despite higher input costs and intense competition. In addition, over the past years, earnings growth has been driven by a favorable economic environment and solid demand, cost efficiencies and successful efforts to move towards higher priced value-added products, which have been gradually strengthening Vitro's competitive position, in particular in flat glass.
16
The ratings also take into account Vitro's solid liquidity position, with material cash reserves and a comfortable debt maturity profile after last year's debt restructuring, which largely offset continued negative free cash flow.
The stable outlook reflects Moody’s view that Vitro currently has room at the B2 rating level to absorb some impact from the weakening economic environment on cash generation and credit metrics. The outlook also incorporates the rating agency’s expectation of a stable to modestly growing earnings contribution from glass containers and some deterioration at flat glass.
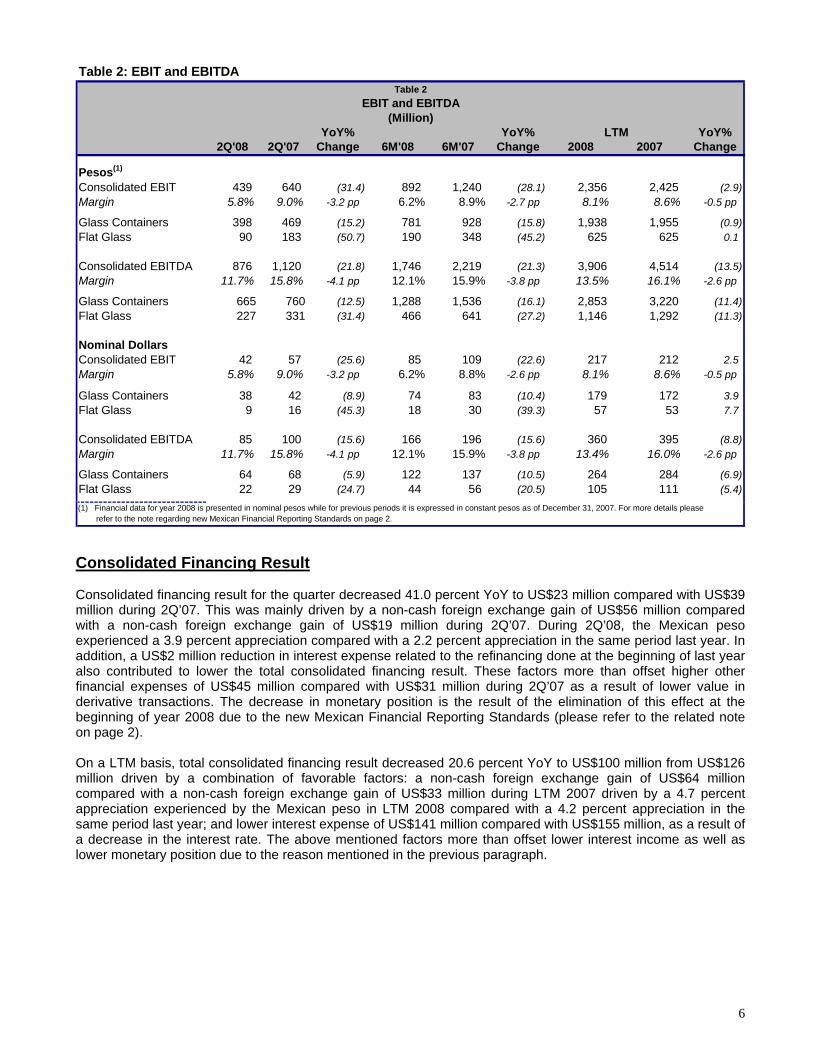
OTHER Vitro receives notice of put option exercise concerning shares of Vitro Cristalglass
On July 22, 2008, the Company announced that its subsidiary Viméxico, S.A. de C.V. (Viméxico) has been notified by the Prado Family members and Invergar Participaciones Inmobiliarias, S.L., that they are exercising their right and option to sell their 40 percent stake in the European joint venture Vitro Cristalglass, S.L. (Vitro Cristalglass). Consistent with the terms of such notice, Viméxico is analyzing the alternatives to acquire these shares with due date September 10, 2008 in an estimated amount of $31 million Euros. The commitment, which is described on our 20-F, is consistent with the terms established in the purchase agreement signed in May of 2001 when Vitro acquired 60 percent of the European company.
Vitro’s subsidiary in Spain acquires Verres et Glaces d’Epinay
On April 1, 2008 the Company, through its subsidiary Vitro Cristalglass S.L., completed the acquisition of the assets of Verres et Glaces d’Epinay, the Paris-based value-added flat glass company, for $3.6 million Euros. This acquisition is in line with the Company’s strategic plan to broaden its geographic coverage in Europe and strengthen its position in the value-added products and services market. The new company, named Vitro Cristalglass France SAS (“Vitro Cristalglass France”), is dedicated to the transformation and distribution of flat glass to the French residential and commercial construction market.

17
Glass Containers (52 percent of LTM 2008 Consolidated Sales)
Sales Sales for the quarter increased 19.5 percent YoY to US$393 million from US$328 million.
The main drivers behind the 22.8 percent YoY increase in domestic sales were higher volumes across all segments coupled with an overall improved price mix.
Export sales increased 11.7 percent due to an improved price mix in the food, soft drinks and wine & liquor markets coupled with higher volumes in the CFT (Cosmetics, Fragrances & Toiletries) and wine & liquor segments.
Sales from Glass Containers’ foreign subsidiaries rose 21.9 percent YoY as a result of the increased demand in Central and South America.
EBIT and EBITDA EBIT for the quarter decreased 8.9 percent YoY to US$38 million from US$42 million in 2Q’07. EBITDA for the same period decreased 5.9 percent to US$64 million from US$68 million. During this quarter, EBIT and EBITDA were benefited by higher volumes and improved production efficiencies which optimized fixed costs absorption as well as the current cost reduction initiatives. The positive effect of the above mentioned factors was offset by higher energy and raw materials costs and costs associated with the transfer of Vimex’s facilities to Vitro Cosmos (“Cosmos”) in Toluca.
EBITDA from Mexican glass containers operations, which is Glass Container’s core business and represents approximately 78 percent of total EBITDA, declined 15 percent YoY due to the above mentioned factors.
Table 7: Glass Containers
YoY% YoY% YoY%2Q'08 2Q'07 Change 6M'08 6M'07 Change 2008 2007 Change
Pesos(1)
Consolidated Net sales 4,061 3,647 11.3 7,671 7,190 6.7 15,119 14,506 4.2 Net Sales Domestic Sales 2,314 2,097 10.3 4,295 4,145 3.6 8,522 8,349 2.1 Exports 1,134 1,040 9.0 2,187 1,995 9.6 4,219 3,943 7.0 Foreign Subsidiaries 613 510 20.1 1,194 1,050 13.7 2,383 2,215 7.6 EBIT 398 469 (15.2) 781 928 (15.8) 1,938 1,955 (0.9) EBITDA 665 760 (12.5) 1,288 1,536 (16.1) 2,853 3,220 (11.4)
EBIT Margin 9.8% 12.9% -3.1 pp 10.2% 12.9% -2.7 pp 12.8% 13.5% -0.7 ppEBITDA Margin 16.4% 20.8% -4.4 pp 16.8% 21.4% -4.6 pp 18.9% 22.2% -3.3 pp
Nominal DollarsConsolidated Net sales 393 328 19.5 728 641 13.6 1,404 1,282 9.5 Domestic Sales 231 188 22.8 416 368 13.1 798 734 8.7 Export Sales 105 94 11.7 202 179 13.1 388 351 10.6 Foreign Subsidiaries 56 46 21.9 110 94 16.5 219 197 10.9 EBIT 38 42 (8.9) 74 83 (10.4) 179 172 3.9 EBITDA 64 68 (5.9) 122 137 (10.5) 264 284 (6.9)
EBIT Margin 9.8% 12.8% -3 pp 10.2% 12.9% -2.7 pp 12.8% 13.4% -0.6 ppEBITDA Margin 16.4% 20.8% -4.4 pp 16.8% 21.3% -4.5 pp 18.8% 22.1% -3.3 pp
Glass ContainersDomestic (Millions of Units) 1,305 1,194 9.3 2,468 2,421 2.0 4,888 4,965 (1.5) Exports (Millions of Units) 352 344 2.1 698 653 7.0 1,392 1,330 4.6 Total 1,657 1,539 7.7 3,166 3,073 3.0 6,280 6,295 (0.2)
Capacity utilization (furnaces)* 94% 92% 2 pp
Alcali (Thousands Tons sold)** 169 153 10.2 333 310 7.5 636 627 1.5
Table 7 Glass Containers
(Million)LTM
(1) Financial data for year 2008 is presented in nominal pesos while for previous periods it is expressed in constant pesos as of December 31, 2007. For more details please refer to the note regarding new Mexican Financial Reporting Standards on page 2.* Includes furnaces being repaired** Includes sodium carbonate, sodium bicarbonate, sodium chlorine, calcium chlorine

18
Flat Glass (47 percent of LTM 2008 Consolidated Sales)
Sales Flat Glass sales for the quarter increased 9.1 percent YoY to US$325 million from US$298 million.
Domestic sales increased 23.9 percent YoY mainly as result of higher volumes in the automotive business line coupled with a better price mix and stable volumes in the float glass market.
Export sales decreased 2.0 percent YoY due to lower Auto Glass Replacement (“AGR”) sales but were partially offset by higher float glass volumes sold to South American markets. The AGR export sales reduction was driven by a decrease in volumes as the Company is using that capacity to supply the Original Equipment Manufacturer (“OEM”) market.
Automotive sales grew 10.4 percent YoY driven by higher sales in the OEM business line and in the domestic AGR market. OEM sales increased as a result of higher volumes derived from new platforms, including the Nissan Sentra platform which started on 3Q’07. AGR sales in the domestic market increased mainly as a result of an improved product mix coupled with higher volumes.
Sales from foreign subsidiaries increased 6.9 percent YoY to US$176 million from US$165 million. Sales at Vitro Cristalglass, the Spanish subsidiary, increased 11 percent YoY due to the new production line for value-added laminated glass in “La Rozada” facility and a better price mix coupled with a stronger Euro. Sales at Vitro Colombia increased 19 percent compared with the same quarter last year mainly due to a stronger Colombian peso. Sales at Vitro America, the U.S. subsidiary, were affected by the anticipated slowdown in the demand from the residential construction market and to a lesser extent by a decrease in sales to the commercial construction market.
EBIT & EBITDA EBIT decreased 45.3 percent YoY to US$9 million from US$16 million while EBITDA decreased 24.7 percent YoY to US$22 million from US$29 million. During the same period, EBIT and EBITDA margins decreased 2.7 and 3.1 percentage points respectively.
On a YoY comparison, higher energy and raw materials costs coupled with a lower contribution from Vitro America and Vitro Cristalglass had a negative impact on the EBIT and EBITDA generation. This situation was partially offset by stabilized prices in the domestic float glass market and improved capacity utilization at the Automotive business.

19
Table 8: Flat Glass
YoY% YoY% YoY%2Q'08 2Q'07 Change 6M'08 6M'07 Change 2008 2007 Change
Pesos(1)
Consolidated Net sales 3,359 3,347 0.3 6,547 6,600 (0.8) 13,538 13,179 2.7 Net Sales Domestic Sales 895 778 15.0 1,711 1,493 14.6 3,491 3,169 10.2 Exports 630 693 (9.0) 1,244 1,320 (5.8) 2,571 2,385 7.8 Foreign Subsidiaries 1,833 1,876 (2.3) 3,592 3,786 (5.1) 7,476 7,625 (1.9) EBIT 90 183 (50.7) 190 348 (45.2) 625 625 0.1 EBITDA 227 331 (31.4) 466 641 (27.2) 1,146 1,292 (11.3)
EBIT Margin 2.7% 5.5% -2.8 pp 2.9% 5.3% -2.4 pp 4.6% 4.7% -0.1 ppEBITDA Margin 6.7% 9.9% -3.2 pp 7.1% 9.7% -2.6 pp 8.5% 9.8% -1.3 pp
Nominal DollarsConsolidated Net sales 325 298 9.1 621 580 7.1 1,252 1,147 9.1 Domestic Sales 87 70 23.9 164 134 22.6 326 285 14.6 Export Sales 61 62 (2.0) 118 117 0.7 238 210 13.3 Foreign Subsidiaries 176 165 6.9 339 329 3.2 688 652 5.4 EBIT 9 16 (45.3) 18 30 (39.3) 57 53 7.7 EBITDA 22 29 (24.7) 44 56 (20.5) 105 111 (5.4)
EBIT Margin 2.7% 5.4% -2.7 pp 2.9% 5.1% -2.2 pp 4.5% 4.7% -0.2 ppEBITDA Margin 6.7% 9.8% -3.1 pp 7.1% 9.6% -2.5 pp 8.4% 9.8% -1.4 pp
VolumesFlat Glass (Thousands of m2R)(2) 35,303 33,425 5.6 67,410 64,294 4.8 135,905 125,816 8.0
Capacity utilizationFlat Glass furnaces(3) 99% 109% -10.2 ppFlat Glass auto 90% 80% 10.1 pp
(2) m2R = Reduced Squared Meters(3) Capacity utilization may sometimes be greater than 100 percent because pulling capacity is calculated based on a certain number of changes in glass color & thickness, determined by historical averages.
Table 8Flat Glass(Million)
LTM
(1) Financial data for year 2008 is presented in nominal pesos while for previous periods it is expressed in constant pesos as of December 31, 2007. For more details please refer to the note regarding new Mexican Financial Reporting Standards on page 2.

20
Seco
nd Q
uart
erLa
st T
wel
ve M
onth
s
INC
OM
E ST
ATE
MEN
T Pe
sos(1
)N
omin
al D
olla
rsC
onst
ant P
esos
Peso
s(1)
N
omin
al D
olla
rs
Item
2008
2007
% V
ar.
2008
2007
% V
ar.
2008
2007
% V
ar.
2008
2007
% V
ar.
2008
2007
% V
ar.
2008
2007
% V
ar.
1C
onso
lidat
ed N
et S
ales
7,50
3
7,
078
6.0
72
5
63
4
14.5
14
,384
13
,966
3.
0
1,
365
1,23
6
10.4
29,0
09
28,0
98
3.2
2,68
9
2,
465
9.1
2C
ost o
f Sal
es5,
586
5,08
0
10
.0
54
0
45
5
18.7
10
,666
10
,028
6.
4
1,
012
888
14.0
20,8
25
20,1
56
3.3
1,93
1
1,
769
9.2
3G
ross
Inco
me
1,91
7
1,
998
(4.1
)
185
179
3.
7
3,71
8
3,93
8
(5.6
)
35
3
348
1.3
8,
184
7,94
2
3.
1
75
7
697
8.
7
4
SG
&A
Exp
ense
s1,
478
1,35
8
8.
8
143
122
17
.5
2,82
6
2,69
8
4.7
268
23
9
12
.2
5,
828
5,51
6
5.
7
54
1
485
11
.5
5O
pera
ting
Inco
me
439
64
0
(31.
4)
42
57
(2
5.6)
892
1,24
0
(28.
1)
85
10
9
(2
2.6)
2,35
6
2,
425
(2.9
)
217
21
2
2.5
6O
ther
Exp
ense
s (In
com
e), n
et15
36
(5
8.0)
1
3
(54.
2)
21
48
2
(9
5.6)
2
42
(95.
2)
40
8
187
11
7.8
37
16
13
9.3
7In
tere
st E
xpen
se(3
53)
(4
04)
(1
2.5)
(34)
(3
6)
(5.3
)
(714
)
(8
92)
(68)
(7
9)
(1
4.1)
(1,5
25)
(1
,767
)
(1
3.7)
(1
41)
(155
)
(8
.9)
8In
tere
st In
com
e8
80
(9
0.2)
1
7
(89.
3)
24
12
4
(8
0.6)
2
11
(79.
4)
75
20
3
(62.
9)
7
18
(6
1.6)
9
Oth
er F
inan
cial
Exp
ense
s (n
et)
(472
)
(343
)
37.6
(45)
(3
1)
47.0
(5
22)
(397
)
31
.5
(50)
(3
6)
40
.8
(6
34)
(703
)
(9.7
)
(60)
(6
2)
(3.4
)
10
Exc
hang
e Lo
ss57
8
207
17
9.5
56
19
200.
0
79
6
46
1,
633.
3
76
5
1,54
7.4
656
37
1
77.1
64
33
94
.5
11G
ain
from
Mon
et. P
ositi
on(0
)
23
--(0
)
2
--
(0)
14
2
--
(0)
12
--
329
45
8
(28.
1)
30
40
(25.
6)
12To
tal F
inan
cing
Res
ult
(239
)
(437
)
(45.
2)
(2
3)
(39)
(4
1.0)
(416
)
(9
78)
(57.
4)
(40)
(8
6)
(5
4.1)
(1,0
99)
(1
,438
)
(2
3.6)
(1
00)
(126
)
(2
0.6)
11 13
Inc.
(los
s) b
ef. T
ax18
4
167
10
.3
18
15
21
.5
455
(220
)
--
43
(1
9)
--
849
80
0
6.1
80
70
13.6
14
Inco
me
Tax
131
50
163.
6
13
4
190.
1
78
12
3
(3
6.1)
8
11
(27.
5)
(1
)
64
2
--0
56
(99.
5)
15N
et In
c. (l
oss)
Con
t. O
pns.
53
11
7
(54.
6)
5
10
(49.
9)
37
6
(3
43)
--35
(30)
--85
0
159
43
5.6
79
14
47
4.6
16
Inco
me
(loss
)of D
isco
nt. O
per.
-
-
--
-
-
---
-
---
-
---
-
--
-
0
--
17In
com
e on
dis
posa
l of d
isco
ntin
ued
oper
atio
ns-
-
---
-
--
-
-
--
-
-
--
-
(29)
--
-
(3)
--18
Ext
raor
dina
ry It
ems,
Net
-
-
--
-
-
---
-
---
-
---
-
--
-
-
--19
Net
Inco
me
(Los
s)53
117
(5
4.6)
5
10
(4
9.9)
376
(343
)
--
35
(3
0)
--
850
12
9
556.
8
79
11
603.
2
20N
et In
com
e (lo
ss) o
f Maj
. Int
.41
85
(5
2.0)
4
8
(47.
7)
33
8
(4
08)
--31
(35)
--73
3
100
63
5.2
69
9
647.
7
21N
et In
com
e (lo
ss) o
f Min
. Int
.12
32
(6
1.6)
1
3
(55.
9)
38
65
(4
1.5)
4
5
(3
2.9)
116
30
292.
7
11
2
40
8.3
Peso
s(1)
Ite
mB
ALA
NC
E SH
EET
2008
2007
% V
ar.
2008
2007
% V
ar.
FIN
AN
CIA
L IN
DIC
ATO
RS
2Q'0
82Q
'07
22C
ash
& C
ash
Equ
ival
ents
441
1,
972
(77.
6)
43
17
7
(75.
8)
D
ebt/E
BIT
DA
(LTM
, tim
es)
3.8
3.4
23Tr
ade
Rec
eiva
bles
1,71
9
1,
603
7.3
16
7
14
2
18.0
E
BIT
DA
/ Tot
al N
et F
in. E
xp. (
LTM
, tim
es)
1.9
2.0
24In
vent
orie
s3,
969
4,06
4
(2
.3)
38
6
36
4
5.9
D
ebt /
(Deb
t + E
quity
) (tim
es)
0.6
0.6
25O
ther
Cur
rent
Ass
ets
4,05
5
2,
955
37.2
394
266
48
.4
Deb
t/Equ
ity (t
imes
)1.
5
1.
8
26To
tal C
urre
nt A
sset
s10
,184
10
,595
(3.9
)
990
949
4.
4
Tota
l Lia
b./S
tock
h. E
quity
(tim
es)
2.3
2.6
Cur
r. A
sset
s/C
urr.
Liab
. (tim
es)
1.3
2.0
27P
rop.
, Pla
nt &
Equ
ipm
ent
18,3
24
16,6
57
10
.0
1,
782
1,
495
19.1
S
ales
/Ass
ets
(tim
es)
0.9
0.9
28D
efer
red
Ass
ets
2,64
3
2,
393
10.4
257
211
21
.7
EP
S (P
s$) *
0.11
0.
24
29O
ther
Lon
g-Te
rm A
sset
s94
752
(8
7.5)
9
67
(8
6.5)
EP
AD
R (U
S$)
*0.
03
0.06
30
Tota
l Ass
ets
31,2
45
30,3
98
2.
8
3,03
8
2,72
3
11
.6
* B
ased
on
the
wei
ghte
d av
erag
e sh
ares
out
stan
ding
.31
Sho
rt-Te
rm &
Cur
r. D
ebt
1,46
7
51
8
183.
2
14
3
45
21
7.4
OTH
ER
DA
TA32
Trad
e P
ayab
les
2,19
1
2,
266
(3.3
)
213
202
5.
5
# S
hare
s Is
sued
(tho
usan
ds)
386,
857
38
6,85
7
33O
ther
Cur
rent
Lia
bilit
ies
3,96
3
2,
621
51.2
385
235
64
.3
34To
tal C
urr.
Liab
.7,
621
5,40
4
41
.0
74
1
48
1
53.9
#
Ave
rage
Sha
res
Out
stan
ding
35Lo
ng-T
erm
Deb
t13
,200
14
,783
(10.
7)
1,
283
1,
328
(3.4
)
(thou
sand
s)35
8,50
5
358,
538
36O
ther
LT
Liab
ilitie
s85
1
1,66
7
(4
9.0)
83
149
(4
4.5)
37To
tal
Liab
ilitie
s21
,671
21
,855
(0.8
)
2,10
7
1,95
9
7.
6
# E
mpl
oyee
s24
,245
23,8
50
38M
ajor
ity in
tere
st7,
753
6,66
9
16
.3
75
4
60
0
25.7
39
Min
ority
Inte
rest
1,82
1
1,
874
(2.8
)
177
164
7.
7
40To
tal S
har.
Equi
t y9,
574
8,54
3
12
.1
93
1
76
4
21.8
(1)
Fin
anci
al d
ata
for y
ear 2
008
is p
rese
nted
in n
omin
al p
esos
whi
le fo
r pre
viou
s pe
riods
it is
exp
ress
ed in
con
stan
t pes
os a
s of
Dec
embe
r 31,
200
7. F
or m
ore
deta
ils p
leas
e re
fer t
o th
e no
te re
gard
ing
new
Mex
ican
Fin
anci
al R
epor
ting
Sta
ndar
ds o
n pa
ge 2
.
CO
NSO
LID
ATE
DVI
TRO
, S.A
.B. D
E C
.V. A
ND
SU
BSI
DIA
RIE
SC
ON
SOLI
DAT
ED F
INAN
CIA
L ST
ATEM
ENTS
FOR
TH
E P
ERIO
DS
, (M
ILLI
ON
)
N
omin
al D
olla
rs
Janu
ary
- Jun
e
Nom
inal
Dol
lars
VITR
O, S
.A.B
. DE
C.V
. AN
D S
UB
SID
IAR
IES
CO
NSO
LID
ATED
FIN
ANC
IAL
STAT
EMEN
TSA
s of
Jun
e 30
, (M
illio
n)

21
Seco
nd Q
uart
erJa
nuar
y - J
une
Last
Tw
elve
Mon
ths
Nom
inal
Dol
lars
Con
stan
t Pes
osN
omin
al D
olla
rsPe
sos(1
)N
omin
al D
olla
rs
2008
2007
%20
0820
07%
2008
2007
%20
0820
07%
2008
2007
%20
0820
07%
GLA
SS C
ON
TAIN
ERS
Net
Sal
es4,
081
3,65
6
11
.6%
394
32
9
19.8
%7,
685
7,
213
6.
5%72
9
64
3
13
.5%
15,1
47
14
,567
4.0%
1,40
7
1,28
8
9.3%
Inte
rd. S
ales
20
9
13
5.9%
2
1
15
6.3%
14
23
-37.
4%1
2
-29.
8%29
61
-5
3.0%
3
5
-49.
1%C
on. N
et S
ales
4,06
1
3,
647
11.3
%39
3
328
19
.5%
7,67
1
7,19
0
6.7%
728
641
13.6
%15
,119
14,5
06
4.
2%1,
404
1,
282
9.
5%Ex
pts.
1,
134
1,04
0
9.
0%10
5
94
11
.7%
2,18
7
1,99
5
9.6%
202
179
13.1
%4,
219
3,
943
7.
0%38
8
35
1
10
.6%
EBIT
398
46
9
-15.
2%38
42
-8
.9%
781
928
-15.
8%74
83
-10.
4%1,
938
1,
955
-0
.9%
179
172
3.9%
Mar
gin (2
)9.
8%12
.9%
9.8%
12.8
%10
.2%
12.9
%10
.2%
12.9
%12
.8%
13.5
%12
.8%
13.4
%EB
ITD
A66
5
760
-1
2.5%
64
68
-5.9
%1,
288
1,
536
-1
6.1%
122
137
-10.
5%2,
853
3,
220
-1
1.4%
264
284
-6.9
%M
argi
n (2)
16.4
%20
.8%
16.4
%20
.8%
16.8
%21
.4%
16.8
%21
.3%
18.9
%22
.2%
18.8
%22
.1%
Gla
ss c
onta
iner
s vo
lum
es (
MM
Pie
ces)
D
omes
tic1,
305
1,19
4
9.
3%2,
468
2,
421
2.
0%4,
888
4,
965
-1
.5%
Exp
orts
352
34
4
2.1%
698
653
7.0%
1,39
2
1,33
0
4.6%
Tota
l:Dom
.+Ex
p.1,
657
1,53
9
7.
7%3,
166
3,
073
3.
0%6,
280
6,
295
-0
.2%
Soda
Ash
(Tho
usan
d To
ns)
169
15
3
10.2
%33
3
31
0
7.
5%63
6
62
7
1.
5%
FLA
T G
LASS
Net
Sal
es3,
375
3,35
0
0.
7%32
6
298
9.
5%6,
573
6,
607
-0
.5%
623
580
7.4%
13,5
71
13
,187
2.9%
1,25
5
1,14
8
9.3%
Inte
rd. S
ales
16
3
53
7.2%
2
0
58
5.0%
26
7
25
9.1%
2
1
28
5.2%
33
8
30
7.6%
3
1
332.
5%C
on. N
et S
ales
3,35
9
3,
347
0.3%
325
29
8
9.1%
6,54
7
6,60
0
-0.8
%62
1
58
0
7.
1%13
,538
13,1
79
2.
7%1,
252
1,
147
9.
1%Ex
pts.
63
0
693
-9
.0%
61
62
-2.0
%1,
244
1,
320
-5
.8%
118
117
0.7%
2,57
1
2,38
5
7.8%
238
210
13.3
%EB
IT90
18
3
-50.
7%9
16
-45.
3%19
0
34
8
-4
5.2%
18
30
-3
9.3%
625
625
0.1%
57
53
7.7%
Mar
gin (2
)2.
7%5.
5%2.
7%5.
4%2.
9%5.
3%2.
9%5.
1%4.
6%4.
7%4.
5%4.
6%EB
ITD
A22
7
331
-3
1.4%
22
29
-24.
7%46
6
64
1
-2
7.2%
44
56
-2
0.5%
1,14
6
1,29
2
-11.
3%10
5
11
1
-5
.4%
Mar
gin
(2)
6.7%
9.9%
6.7%
9.8%
7.1%
9.7%
7.1%
9.6%
8.5%
9.8%
8.4%
9.7%
Flat
Gla
ss V
olum
es (T
hous
and
m2R
)(3)
Con
st +
Aut
o35
,303
33,4
25
5.6%
67,4
10
64
,294
4.
8%13
5,90
5
125,
816
8.
0%
CO
NSO
LID
ATE
D (4
)
Net
Sal
es7,
540
7,08
9
6.
4%72
9
635
14
.9%
14,4
23
13
,996
3.1%
1,36
9
1,23
9
10.5
%29
,070
28,1
67
3.
2%2,
694
2,
472
9.
0%In
terd
. Sal
es36
11
22
7.4%
4
1
25
3.5%
40
30
33.3
%4
3
45.2
%61
69
-1
1.1%
6
6
-4.4
%
Con
. Net
Sal
es7,
503
7,07
8
6.
0%72
5
634
14
.5%
14,3
84
13
,966
3.0%
1,36
5
1,23
6
10.4
%29
,009
28,0
98
3.
2%2,
689
2,
465
9.
1%Ex
pts.
1,
764
1,73
3
1.
8%16
6
156
6.
3%3,
432
3,
316
3.
5%32
0
29
6
8.
2%6,
790
6,
328
7.
3%62
6
56
1
11
.6%
EBIT
439
64
0
-31.
4%42
57
-2
5.6%
892
1,24
0
-28.
1%85
109
-22.
6%2,
356
2,
425
-2
.9%
217
212
2.5%
Mar
gin (2
)5.
8%9.
0%5.
8%9.
0%6.
2%8.
9%6.
2%8.
8%8.
1%8.
6%8.
1%8.
6%EB
ITD
A87
6
1,12
0
-2
1.8%
85
10
0
-15.
6%1,
746
2,
219
-2
1.3%
166
196
-15.
6%3,
906
4,
514
-1
3.5%
360
395
-8.8
%M
argi
n (2
)11
.7%
15.8
%11
.7%
15.8
%12
.1%
15.9
%12
.1%
15.9
%13
.5%
16.1
%13
.4%
16.0
%
(2)
EBIT
and
EB
ITD
A M
argi
ns c
onsi
der C
onso
lidat
ed N
et S
ales
.(3
) m2R
= R
educ
ed S
quar
ed M
eter
s(4
) In
clud
es c
orpo
rate
com
pani
es a
nd o
ther
's s
ales
and
EBI
T.
SEG
MEN
TED
INFO
RM
ATIO
NFO
R T
HE
PE
RIO
DS
, (M
ILLI
ON
)
VITR
O, S
.A.B
. DE
C.V
. AN
D S
UB
SID
IAR
IES
(1)
Fina
ncia
l dat
a fo
r yea
r 200
8 is
pre
sent
ed in
nom
inal
pes
os w
hile
for p
revi
ous
perio
ds it
is e
xpre
ssed
in c
onst
ant p
esos
as
of D
ecem
ber 3
1, 2
007.
For
mor
e de
tails
ple
ase
refe
r to
the
note
rega
rdin
g ne
w M
exic
an F
inan
cial
Rep
ortin
g
Sta
ndar
ds o
n pa
ge 2
.
Peso
s(1)