Embed Size (px)
Citation preview

Series 3
VIY®3Ground Penetrating Radar
Plannerver 3.9.1.24User Manual

© Transient Technologies 2004…2017
Transient Technologies LLCoffice 604, 13, Evgena Sverstuka str., Kyiv 02660, UkrainePhone: +380 (44) 240-85-94E-mail: [email protected]: www.viy.ua
VIY® – registered trademark of Transient Technologies LLC
All pictures in this User Manual are given for reference purpose only, and may differ from actual product appearance.
Product design and specification may be changed by manufacturer without notification.
ContentsGeneral Information ......................................................................................................5
Idea of Planner program.......................................................................................................5VIY3 program package.........................................................................................................5Computer Requirements ......................................................................................................5Terms and Definitions ...........................................................................................................5
Program description .....................................................................................................7Main menu ..............................................................................................................................7Project window ......................................................................................................................7
Objects Tree .........................................................................................................................8Project Plan ............................................................................................................................11Area of Displayed GPR profiles............................................................................................12
Getting started ...............................................................................................................15Software installation .............................................................................................................15Before sounding process......................................................................................................15Base Line and profiles arrangement ....................................................................................15
Creating the project ...............................................................................................................16Adding plan/map of the location to project ...........................................................................16Adding a new profile .............................................................................................................20Adding the saved profile to the project .................................................................................21Deleting profile from the site.................................................................................................21Assigning another profile as etalon ......................................................................................21Re-opening of the profile .....................................................................................................21Modifying the profile in Synchro3 .........................................................................................21Batch processing of GPR profiles ........................................................................................21Modifying the profile position ................................................................................................21
Markers of underground objects ..........................................................................................22Adding underground object marker ......................................................................................22Adding surface markers .......................................................................................................22Deleting markers ..................................................................................................................22Modifying markers parameters .............................................................................................22
Data transfer...........................................................................................................................223D View ...........................................................................................................................24
Project preparation for 3D View ...........................................................................................24Creating 3D View .................................................................................................................243D View window ...................................................................................................................25Working with 3D View ..........................................................................................................25The limits of interpolation area .............................................................................................27The interpolation parameters ...............................................................................................28Cross-sections of interpolation area .....................................................................................28Saving 3D View ....................................................................................................................30Open saved 3D View ............................................................................................................31Deleting 3D View ..................................................................................................................31
Reports ...........................................................................................................................32Creating a report from the plan area ....................................................................................32Report creating from the 3D View window ...........................................................................33Editing of the report objects..................................................................................................34Selecting objects to edit .......................................................................................................34Changing parameters of the selected object ........................................................................35Report saving .......................................................................................................................35Report opening .....................................................................................................................35Report deleting .....................................................................................................................36
Data export to AutoCad .........................................................................................................36

5
5
General Information
General Information
Idea of Planner programPlanner program is designed to map GPR data and detected underground objects on a plan or a map. This program helps users to manage sounding process with VIY®3 GPR on some a territory.
VIY3 program packagePlanner program is included in VIY3 software package as a mapping tool. Another program of this package (Synchro3) is served for managing of a sounding process and for GPR data processing.
Computer RequirementsThe system requirements for the Synchro3 software are:
• Computer (laptop) operated by Windows XP, Windows 7, Windows 8, Windows 10• Intel® Pentium® M, CPU frequency higher than 1500 MHz• Memory at least 512 MB• Port USB2.0• At least 100MB free space on hard drive
Terms and DefinitionsThis User Manual uses the following terms and definitions.
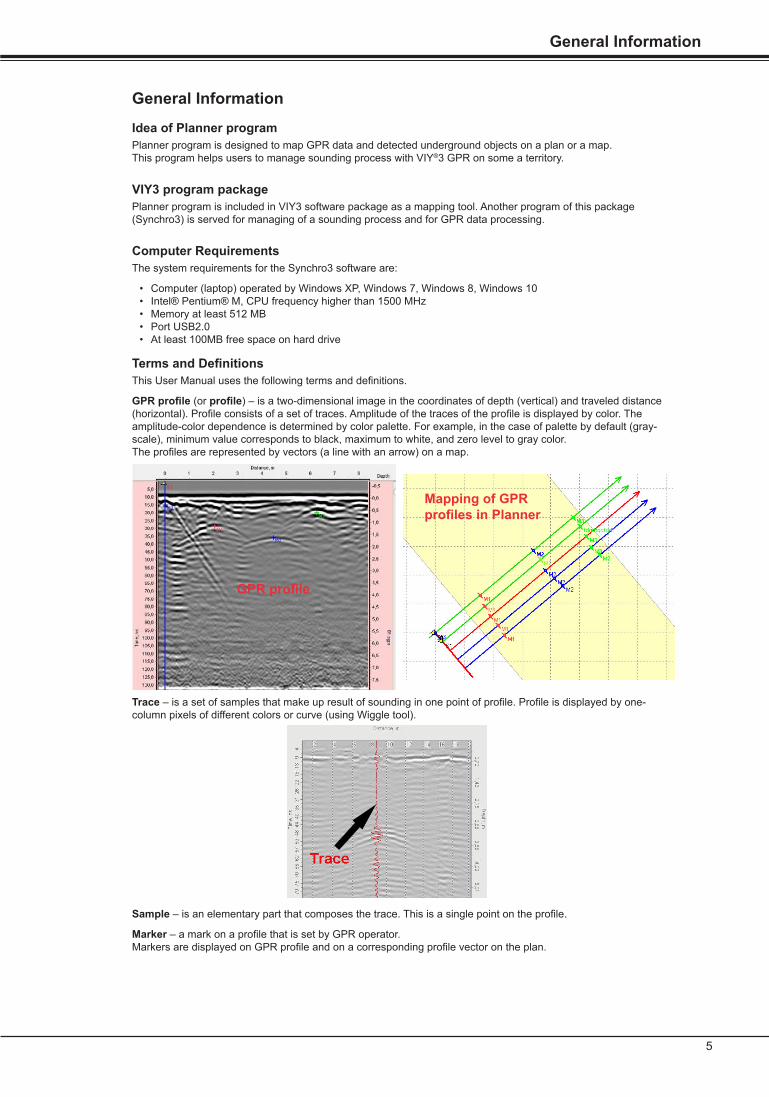
GPR profile (or profile) – is a two-dimensional image in the coordinates of depth (vertical) and traveled distance (horizontal). Profile consists of a set of traces. Amplitude of the traces of the profile is displayed by color. The amplitude-color dependence is determined by color palette. For example, in the case of palette by default (gray-scale), minimum value corresponds to black, maximum to white, and zero level to gray color. The profiles are represented by vectors (a line with an arrow) on a map.
Trace – is a set of samples that make up result of sounding in one point of profile. Profile is displayed by one-column pixels of different colors or curve (using Wiggle tool).
Sample – is an elementary part that composes the trace. This is a single point on the profile.
Marker – a mark on a profile that is set by GPR operator. Markers are displayed on GPR profile and on a corresponding profile vector on the plan.
Mapping of GPR profiles in Planner
GPR profile

76
General Information
Base line – is a line on a plan. The profiles (vectors) are placed in relation to it.
Site – a complex of data, including: base line, profiles (vectors) and markers. One site may content unlimited quantity of profiles and only one base line.
Object tree – a tree-structured list of all objects of a project: sites and markers.
Etalon profile – a selected (etalon) GPR profile of each site. In Object tree the etalon profile is marked by check mark . Planner program can display profiles that were acquired by different GPR antennas with different settings of GPR and of odometer. The program uses one of the profiles that is selected as etalon, to display all the profiles with the equal settings, filters that were applied, and on an equal scale.
In the new site the first added profile will be set by default as the etalon profile.
Project – consists of one or more sites.
Base lines

7
Program descriptionGeneral Information
Program description
Main menuPlanner program has Multiple document interface (MDI), that allows user to open many projects at the same time. The Main menu contains Menu and the field with tools and buttons.
Project windowEach project is displayed in its own window.
The Project window is split to 3 parts (see in picture from left to right):
• Objects Tree with objects properties;
• Project Plan;
• Displayed GPR profiles.
Each part has its own tools panel with control buttons. By moving (left-right) the separator between the Project Plan part and Displayed GPR profiles part you can change the dimensions of the parts (showed by bidirectional arrows on the picture above). If necessary, you can hide the part of Objects Tree, by clicking on the border between Project Plan and Objects Tree (marked by a red circle on the picture above).
98
Program description
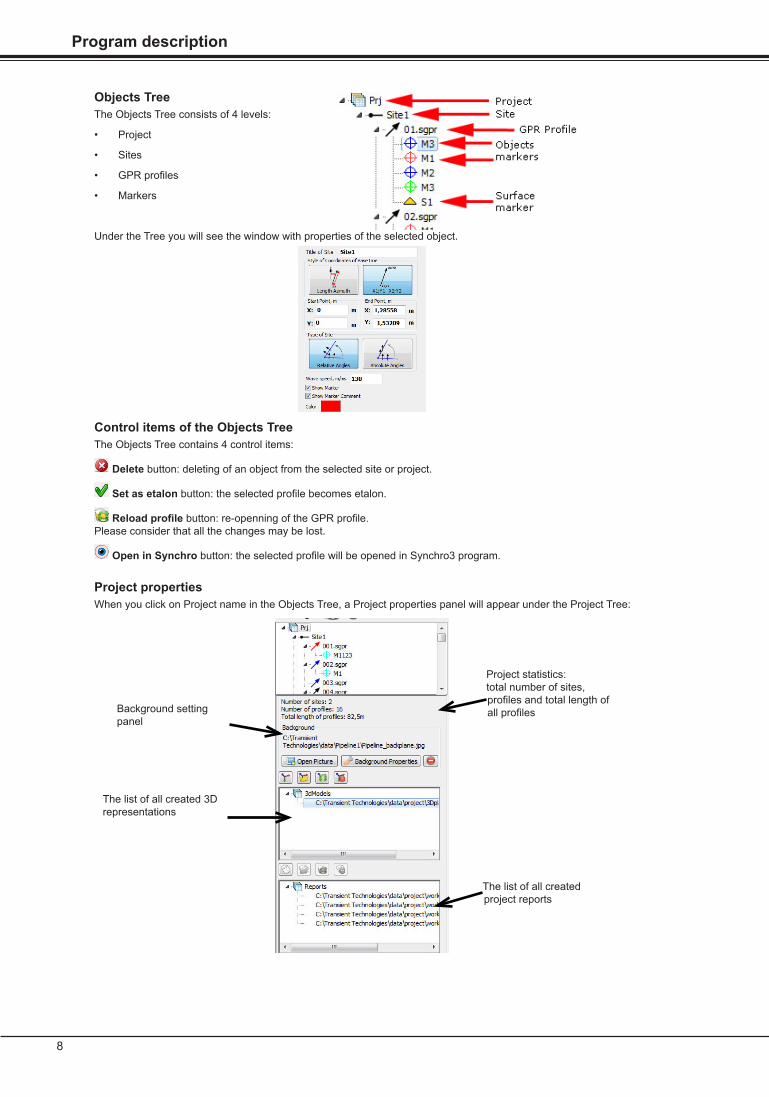
Objects TreeThe Objects Tree consists of 4 levels:
• Project
• Sites
• GPR profiles
• Markers
Under the Tree you will see the window with properties of the selected object.
Control items of the Objects TreeThe Objects Tree contains 4 control items:
Delete button: deleting of an object from the selected site or project.
Set as etalon button: the selected profile becomes etalon.
Reload profile button: re-openning of the GPR profile. Please consider that all the changes may be lost.
Open in Synchro button: the selected profile will be opened in Synchro3 program.
Project propertiesWhen you click on Project name in the Objects Tree, a Project properties panel will appear under the Project Tree:
Project statistics: total number of sites, profiles and total length of all profilesBackground setting
panel
The list of all created 3D representations
The list of all created project reports

9
Program descriptionProgram description
Site propertiesEach new created site by default has the name of Site1, Site2 and so on.
When you click on Site name in the Objects Tree, a Site properties panel will appear under the Project Tree.
In the upper part of the panel you can find a statistics about total number of the profiles and total length of all site profiles:
Below you will see a panel of the site’s Base Line properties. You can define the style of Base Line coordinates in two ways:
• By defining the coordinates of the Start and Finish points of the Base Line:
• By defining the Start point, length and an azimuth of the Base Line.
On the Site properties panel you can also set the way of defining of the profiles coordinates:
• You can set the angle where the profile crosses the Base Line (Relative Angles),

1110
Program description
• Or you can set the azimuth of the profile (Absolute Angles).
You can change Wave speed in the Site properties.
You can select the color for the by clicking on Color button Base Line.
9When you add profiles to the site, this parameter will be defined by the wave speed of the etalon profile. Therefore, the wave speed of the site and of all profiles will be equal to the wave speed of etalon profile. If you change the wave speed of the site, the wave speeds of all the site’s profiles will be changed equally.
9 All numerical parameters in the program you can enter in two ways: by inputting numbers from a keyboard or with arrows on a keyboard Up and Down↑ or ↓. Is the last way is selected, a single click on ↑ or ↓ increases/decreases the number by 1. With Shift button held, the pressing of ↑ or ↓ button leads to increasing/decreasing of parameter by 10. When you enter a new number from the keyboard, the number cell will change its color for yellow. After pressing Enter the color of the cell will change for white and the parameter will be set.
In the Show panel you can find the control flags to show or hide visual parameters on the plan and on GPR profiles:
11
Program descriptionProgram description
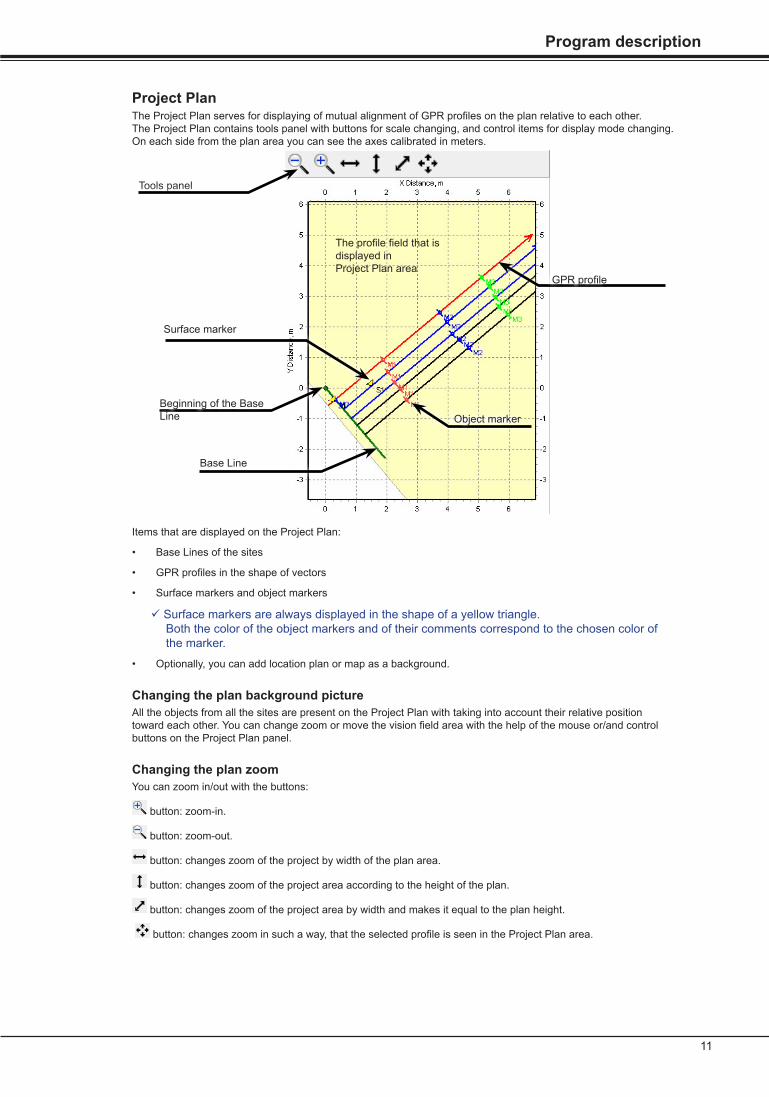
Project PlanThe Project Plan serves for displaying of mutual alignment of GPR profiles on the plan relative to each other. The Project Plan contains tools panel with buttons for scale changing, and control items for display mode changing. On each side from the plan area you can see the axes calibrated in meters.
Items that are displayed on the Project Plan:
• Base Lines of the sites
• GPR profiles in the shape of vectors
• Surface markers and object markers
9 Surface markers are always displayed in the shape of a yellow triangle. Both the color of the object markers and of their comments correspond to the chosen color of the marker.
• Optionally, you can add location plan or map as a background.
Changing the plan background pictureAll the objects from all the sites are present on the Project Plan with taking into account their relative position toward each other. You can change zoom or move the vision field area with the help of the mouse or/and control buttons on the Project Plan panel.
Changing the plan zoomYou can zoom in/out with the buttons:
button: zoom-in.
button: zoom-out.
button: changes zoom of the project by width of the plan area.
button: changes zoom of the project area according to the height of the plan.
button: changes zoom of the project area by width and makes it equal to the plan height.
button: changes zoom in such a way, that the selected profile is seen in the Project Plan area.
Tools panel
Base Line
Beginning of the Base Line
The profile field that is displayed in Project Plan area
Object marker
GPR profile
Surface marker

1312
Program description
Shift of the viewing areaTo shift the viewing area press and hold right mouse button, and move the cursor with the viewing area to a new place.
Area of Displayed GPR profilesThe area of Displayed GPR profiles shows profiles that were acquired by Synchro3 program. The profiles are displayed in that area if one of profile or marker is selected in the Objects Tree. If the project name or site name is selected in the Objects Tree, this area will be empty.
Control tools of the Area of Displayed GPR profiles push-to-lock button: turn on the mode of object markers adding. When you turn it on, drop-out list will
appear next to that button. You can choose the color of the marker from it. Turn the button off when you finish object markers editing.
push-to-lock button: turn on the mode of surface markers adding. Turn the button off when you finish surface markers editing.
push-to-lock button: turn on the mode of surface and object markers deleting. Turn the button off when you finish markers deleting.
In the upper right angle of the Area of Displayed GPR profiles you will find drop-out list , that serves for profiles zoom adjusting. By default all the profiles are displayed with zoom of 50%.
Tools panel
Time scale Height
scale
Object marker
Surface marker
Distance
Scrolling by height
13
Program descriptionProgram description
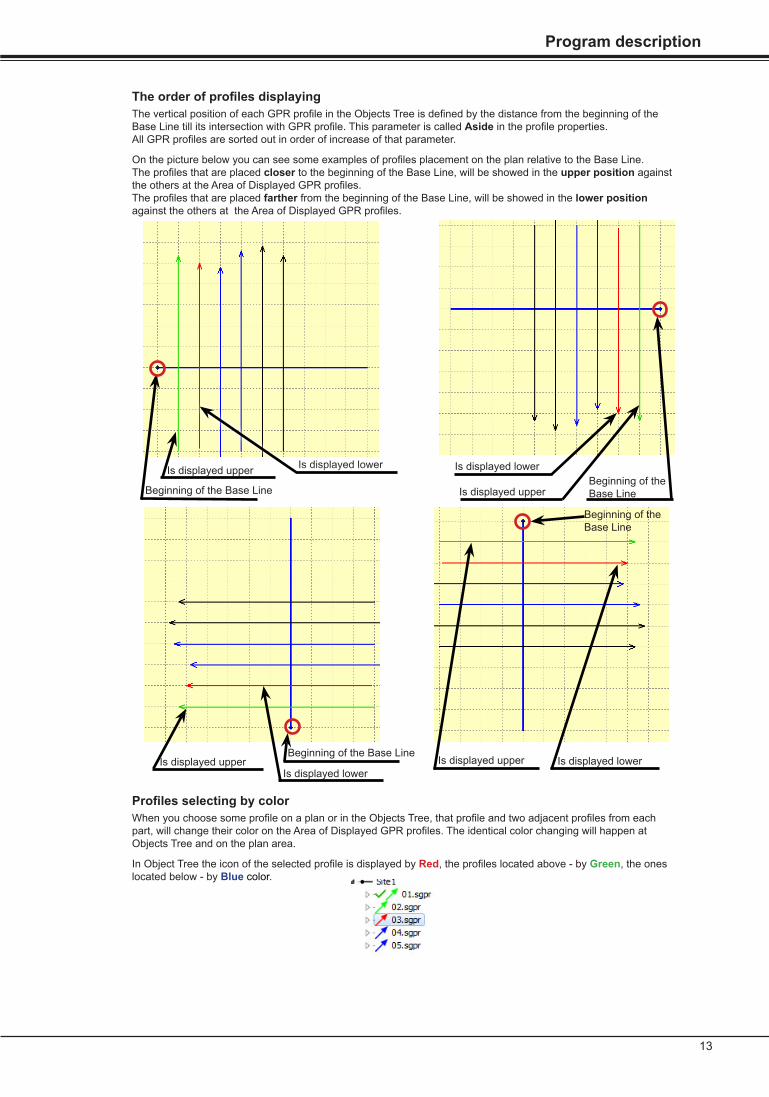
The order of profiles displayingThe vertical position of each GPR profile in the Objects Tree is defined by the distance from the beginning of the Base Line till its intersection with GPR profile. This parameter is called Aside in the profile properties. All GPR profiles are sorted out in order of increase of that parameter.
On the picture below you can see some examples of profiles placement on the plan relative to the Base Line. The profiles that are placed closer to the beginning of the Base Line, will be showed in the upper position against the others at the Area of Displayed GPR profiles. The profiles that are placed farther from the beginning of the Base Line, will be showed in the lower position against the others at the Area of Displayed GPR profiles.
Profiles selecting by colorWhen you choose some profile on a plan or in the Objects Tree, that profile and two adjacent profiles from each part, will change their color on the Area of Displayed GPR profiles. The identical color changing will happen at Objects Tree and on the plan area.
In Object Tree the icon of the selected profile is displayed by Red, the profiles located above - by Green, the ones located below - by Blue color.
Beginning of the Base Line
Beginning of the Base Line
Is displayed upper Is displayed lower
Is displayed upper
Is displayed lower
Is displayed upperIs displayed lower
Is displayed lowerIs displayed upper
Beginning of the Base Line
Beginning of the Base Line

1514
Program description
On the plan area the profiles will be displayed with the same colors.
The same changing has place in the Area of Displayed GPR profiles. The right and left side panels of the profiles have corresponding colors.
The Area of Displayed GPR profiles can contain up to 5 profiles. The icons of the profiles that are not displayed in the Area of Displayed GPR profiles, will be displayed as Black on the plan and in the Objects Tree.

15
Getting startedProgram description
Getting started
Software installationPlanner program is included in VIY3 software package and is been installed during the software installation. The installation process is described in Synchro. User Manual.
Before sounding processBefore sounding process you should:
• Clean the location place from big objects that may hinder the sounding process
• Make the plan of sounding taking into account any features of the location (trees, holes etc.)
If you have plan (or map) of the location, you can use in as a background for the Planner project.
Base Line and profiles arrangementYou should perform the sounding by straight movement of the antenna unit on the surface.
There is constant contact of GPR with the ground demanded during whole sounding process.
Place the tape-measure on the test-ground so that all the further profiles cross the tape-measure line. The tape-measure line will be the Base Line for the current site.
Wrong tape-measure placement (yellow line). The red profiles on that example don’t cross the Base Line.
Two straight GPR profiles
One curved GPR profile

1716
Getting started
Correct placement of the tape-measure. All the profiles cross the Base Line.
Creating the projectLaunch Planner program. In the program menu choose Project > Create Project or just click button Create Project on the tools panel.
New project window will appear. The project will have one site with the name of Site1. The Base Line of the site will be placed in the zero point of coordinates. Its length by default - 10 m. Azimuth - 90 degree. Change Base Line coordinates to necessary. By default the measurements will be taken in relative coordinates.
Set the initial point of the Base Line : Start Point X=0, Y=0; And the final point: End Point X= (length of the tape-measure line), Y=0.
9 Afterwards, you can export project data to AutoCad, having set the absolute coordinates of the initial and final points of the Base Line of the first site. The coordinates of all objects exported within project in AutoCad will be absolute too.
Adding plan/map of the location to projectTo add a plan/map to the project please make sure that plan/map file is in graphic format(*. jpg or *.bmp).

17
Getting startedGetting started
You can use a fragment of Google maps as a background for the project:
In order to add a picture of the plan/map, select the name of the project in the Objects Tree and click Open button, that is located at Background panel:
Then select the necessary file and click Open. The location plan/map will appear in the plan area:

1918
Getting started
Before beginning of the sounding process you should calibrate plan/map scale:
• Click button that is located on Background panel.
Background Properties window will appear:
Background Properties window contains the following control elements:
Zoom-out
Zoom-in
Zoom at screen. Fits the background picture in the Background Properties window.
Zoom of 100%. Displays the picture with in the real size.
Reset of the measure points. All the scale markers and a referencing marker return to their initial position.
In the upper right corner you can see Distance and Angle boxes. In the Angle box you can enter a value of the angle that you want to turn the background picture on. Distance box serves for background scale adjusting.
Adjusting the scale of background pictureIn the left corner of the window you can find a referencing marker and also two scale markers
• Place the referencing marker to the selected reference point on the plan/map.
9 For the first site, this point will correspond to the Base Line’s reference point (with zero coordinates). The reference points of all the others sites will be counted from this same point.
• Find some object on the plan/map that you can easily identify on the place. The object should be chosen so that you could measure with a tape-measure one of its dimension. The chosen object might be: street width, the distance between buildings, a width of a building wall etc. Accurately measure this distance with the tape-measure.

19
Getting startedGetting started
• In the Background Properties window place two scale markers to the selected points that correspond to the ones on the place.
• Enter the value of measured distance (in meters) into the Distance box.
• Click Ок.
The plan/map background scale has been calibrated.
9 The same calibration procedure you can do with Google maps screenshot.

2120
Getting started
Adding a new profile
Choose in the menu Sites&profiles > Create Profile or just click the button Create New Profile on the tools panel. As a result, Synchro3 program will launch. A new profile will be created in it. Connect GPR to the laptop and make all necessary settings (please refer to Synchro. User Manual to have more detailed information about all antenna settings and sounding process).
Start sounding, moving antenna unit along a straight line till its crossing with the tape-measure line (Base Line).
When the center of the antenna unit crosses the Base Line, click the button in Synchro program (or just press Insert on the laptop keyboard).
The following dialogue window will appear:
• The distance “By course” will be measured automatically by odometer.
• You should enter the number (in meters) in “Aside“ box. Check the distance on the tape-measure, on which the center of the antenna unit crossed the tape-measure.
• Enter into the “Angle” box an angle at which antenna unit crossed the tape-measure (by default it is 90°)
• Or enter into the “Azimuth” box an absolute azimuth relative to North direction.
• Click OK and continue moving the antenna unit.
* “By height”.This is an optional parameter. You can enter the height of the profile relative to a base line plane. Having finished the sounding, save the profile on the hard drive of your laptop. The profile will be added to the current Site of you Planner project. The crossing point of the profile with the Base Line corresponds to “By course“ and “Aside“ parameters, and the crossing angle to “Angle“ value.
Place the antenna unit to a new point, according to your sounding plan, and repeat the same process with a new profile.

21
Getting startedGetting started
Adding the saved profile to the project
Choose in menu Sites&profiles> Open Profile or just click button on the tools panel. As a result, the Open SGPR Files dialogue will appear. Select on or several profile files to be added.
Deleting profile from the siteChoose necessary profile in the Objects Tree, click Delete button on the tools panel that is placed above the Objects Tree. The profile will be deleted from the site and project.
9 After deleting the profile from the project, the profile file will remain on the laptop’s hard drive.
9 If the selected profile is set as etalon, Planner program does not let it to be deleted. Before deleting such a profile, set another profile as an etalon one.
Assigning another profile as etalonSelect necessary profile in the Objects Tree and click the button in the project tools panel. The etalon profile will be re-assigned.
Re-opening of the profileIf GPR profile that is included in the current project has been changed by other program, you can restore it. Select the profile in the Objects Tree and click the button in the project tools panel. The selected profile will be re-opened anew.
Modifying the profile in Synchro3In Planner program you can edit the arrangement of the profile on the plan, and modify all the markers. To be able to modify more profile parameters, including profile processing, you should open the profile in Synchro3 program. To do that, select the profile in the Objects Tree or on the plan and click the button Open in Synchro on the tools panel. Synchro3 program will open this profile. Do all the necessary modifications of the profile and then save it in Synchro3. After saving the profile file, the updated profile will appear in Planner program.
Batch processing of GPR profilesIf you want to modify different all profiles at the same time, first you should do all needed modifications of the selected profile with Synchro3 program (please read previous section). Then in the Objects Tree of the Planner program select this profile and right click on it. In a drop-out list select Batch processing, all as selected. After that all the profiles from the current site will be processed identically.
Modifying the profile positionIf necessary, you can modify the position of the profile after it was added in the project. Select the profile in the Objects Tree. Under the Objects Tree the setting panel will appear where you can change all the profile position data.
You can enter the value of demanded parameter from the keyboard or increase/decrease it with keyboard keys Up or Down (↑ or ↓).
9 All the profiles in the Objects Tree are sorted out by increment of Aside parameter (the distance on the tape-measure from the beginning of the Base Line till the crossing point of the profile with the Base Line). Therefore, changing Aside parameter will lead to re-sorting of the profiles in the Object Tree.

2322
Getting started
Markers of underground objectsNow that all the profiles were added and properly arranged in the site, you may mark on the profiles underground objects that have been found.
Adding underground object markerClick the button on the tools panel of the area of Displaying of GPR profiles. Next to this button a drop-out list of the marker color will appear . Select the color of the new marker and add it into the profile. New mark of selected color will appear on the profile (area of Displayed GPR profiles). The same marker will appear in the Objects Tree and on the plan.
Adding surface markersTo add a surface marker click the button and put the marker in the needed point of the profile. A new surface marker will appear on the profile - yellow triangle. The same marker will appear on the plan and in the Objects Tree.
9 The surface markers differ from the object markers because they are always visible on the upper part of GPR profile, not depending on vertical scrolling of the profile.
Deleting markersYou can delete markers either from the Objects Tree or directly on the profile. Choose the marker on the Objects Tree and click the Delete button on the tools panel. Or choose the profile in the area of Displayed GPR profiles, click Delete Marker button on the tools panel, then move the cursor to the requested marker and click on it. The marker will be deleted. When you move the cursor over the marker, the cursor icon will change from to .
Modifying markers parametersWhen you select marker in the Objects Tree, Marker settings panel will appear in the project window:
Object markers settings panel Surface markers settings panel
All parameters you can enter in two ways: by inputting numbers from a keyboard or with arrows keys on a keyboard Up and Down ↑ or ↓. When you change one of them, the marker will move in area of Displayed GPR profiles and on the plan at the same time.
Data transferWhen you save the project, a project file with extension .mpsgpr will be saved on a hard drive of your laptop. This file contains the links to all the GPR profiles files from the project. Planner program allows you to use GPR profiles that are located in different places, including ones located in the network. This is why there is not enough just to copy .mpsgpr file for transferring to another computer.
To transfer project data you should copy the project. Choose in the program menu Project > Copy Project. In the windows that appeared choose the way where you want to save the project files and create a name of project file. As a result, the program will copy the main project file to the indicated location, and also all the other necessary files to the folder with the same name as a project file’s.

23
Getting startedGetting started
Errors occurring during data transferIf you copied a project .mpsgpr file and all the files of GPR profiles to a new location on your computer or to another computer with the help of file manager, you will see the following dialogue window when you open the project file from the new location:
Here you can either enter a new files path or just click the button on the right to select necessary files or folder. Etalon file is selected by yellow in this dialogue window. When new files paths are entered, click Continue. If paths of some files are wrong, these profiles will be marked by Grey color in the Objects Tree, they will be absent on the plan, and you will see crosshatched regions in the area of Displayed GPR profiles instead of these profiles.
To restore the link to ‘lost‘ profile, select it in the Objects Tree and click button Reload Profile . Then select the right path to that file and click Open.
If the path to the etalon file is lost during data transfer, the following window will appear when you open the project:
Drop-out list will contain all available profiles files of the site of current project. You should appoint a new etalon file instead the old one.

2524
3D View
3D ViewOne of the features of Planner program is creating of 3D View of GPR data.
Project preparation for 3D ViewSelect on the plan a region that you want it to be represented in 3D. Place the selected profiles in center of the plan area. To do that, change the plan window size or its scale, move the plan to fit a necessary area into the plan window.
9 Please take into account that only the part of the project that is visible on the plan will get to 3D View.
Creating 3D ViewWhen the project preparation is done, select Sites&profiles> 3D View > New in the main Planner menu. Or just select the name of the project in the Objects Tree - project properties panel will appear below. Find New 3D View button in that panel. As a result, a new window of 3D View will appear.

25
3D View3D View
3D View windowThe window of 3D View contains Tools panel with different control items and 3D View area.
Upper control panel contains the following buttons:
- Open saved 3D View
- Save current 3D View
- Delete saved 3D View. This 3D will be deleted from the project. The corresponding file .mp3dmodel also will be deleted.
- Create a report
- Group of buttons that represent the 3D picture from different sides. Six positions for different six planes, and an isometric view.
- Palette dialogue window will appear
Working with 3D ViewAfter creating a new 3D View, the selected part of the project will appear in 3D area, that contains followings items:
• GPR profiles in the form of rectangular planes
• Coordinate axes
• Surface plane with translucent plan of selected project site
• All markers on the profiles

2726
3D View
You can turn on/off different items in 3D area. Set corresponding marks in the set-boxes on the panel Show:
Profiles - Turn on/off all profiles on 3D view
Interpolation - Turn on/off an interpolation result (if it has been created)
XYZ Grid - Turn on/off the grids on all six planes
Axis - Turn on/off 3D axes
Plan - Turn on/off translucent plan as a background
If necessary, you can change zoom of 3D view with View zoom slider in the Zoom panel:
In 3D View the markers are showed as spheres of appropriate color. To change dimension of the markers use Size of Markers slider:
To turn marker off, decrease its size to zero.
To rotate 3D view to any position, use any mouse button. You can always turn 3D view to any of six planes, or return it to default position with group of keys on the upper tools panel:
The rotation of 3D view in different planes allows user to see clearly mutual alignment of different elements of the project.

27
3D View3D View
The limits of interpolation areaAfter creating/opening 3D View, its visible region is limited by yellow lines. These limits correspond to the selected area borders on the plan.
The area where data interpolation will be built, can differ from 3D View area. By default, the program defines the interpolation area automatically. The interpolation area includes the space only that contains initial data: GPR profiles.
To turn on/off showing of the interpolation area, press Shift+C.
The interpolation area is bordered in the screen by thin white lines. Rotation and scaling of 3D view takes place around the center of the interpolation area.
You can change manually the boundaries of the interpolation area. To do that, use sliders from Boundaries panel:
When interpolation is created, the sliders from Boundaries panel allows user to change positions of cross sections of resulting 3D object. The sliders movement is permitted inside the limits of interpolation area only. If you want to create a new interpolation, having changed the existing boundaries, take off the flag of Interpolation check-box in Show panel, and then move the boundaries to necessary positions.

2928
3D View
The interpolation parametersTo be able to analyze 3D data, you should perform GPR data interpolation. As a result of interpolation, you will get 3D data area with the even grid. Cutting this area by cross-sections you can make different zones of it open to view. For example, if you make a horizontal cross-section on demanded depth, you will get so-called C-scan.
You can change interpolation parameters in Interpolation panel.
By default, Planner program sets all the interpolation parameters automatically. But is necessary, you can change these parameters.
Step,m (by axes X, Y and Z) : sets the grid step (in meters) for each coordinate. On the right from each box you can see Num box, where steps number is displayed, according to the chosen grid step.
The increase of grid step leads to decrease of the volume of computed data and to interpolation time reduction. At the same time, the increase of grid step leads to the worsening of the resolution in 3D View.
Radius,m: changes the interpolation radius. Please notice that radius for X and Y axes differs from the radius of Z axis. This is concerned with the difference in discrete step along each axis.
When all the parameters are set, click Start Interpolation button. The button inscription will change for Stop Interpolation. The progress indicator will appear below. You can stop at any moment the interpolation process by clicking Stop Interpolation button.
Cross-sections of interpolation areaWhen the interpolation process is finished, you will see the result of the process on display as a parallelepiped, filled with GPR data. The data step is equal to the chosen grid step. Now you can perform a cross-section of interpolation area by using sliders from the Boundaries panel.
Or you can use a keyboard:
• Cross section that is orthogonal to Z axis: to move this cross-section along Z axis, use keys combinations Z+↑ or Z+↓. The cross-section plane will move according to the selected grid step of the interpolation. To select upper/lower plane: Z+→ or Z+←. Cross-section moving with enlarged step: Shift+Z+↑ or Shift+Z+↓.
• Cross section that is orthogonal to Y axis: to move this cross-section along Y axis, use keys combinations Y+↑ or Y+↓. The cross-section plane will move according to the selected grid step of the interpolation. To select upper/lower plane: Y+→ or Y+←. Cross-section moving with enlarged step: Shift+Y+↑ or Shift+Y+↓.
• Cross section that is orthogonal to X axis: to move this cross-section along X axis, use keys combinations X+↑ or X+↓. The cross-section plane will move according to the selected grid step of the interpolation. To select upper/lower plane: X+→ or X+←. Cross-section moving with enlarged step: Shift+X+↑ or Shift+X+↓.

29
3D View3D View
Examples of cross-sections
On the example above upper Z plane is selected. Below you can see: lower Z plane is selected. Key combination (Z+→) was pressed:

3130
3D View
The cross-section moving along Z axis (used key combination Z+↓):
You can find out the current position coordinates of the cross-section plane by 3D View scale, or from data on coordinates panel located in the left lower corner of the program window:
On the example above the upper Z plane is located on the depth of 1.97m, and the lower one - on 6.53m.
Saving 3D ViewPlanner program has a possibility of saving 3D View for using its results further. To save it, click Save 3D View button in the upper tools panel.

31
3D View3D View
Open saved 3D ViewYou can open previously saved 3D View from the project window (3D view panel or Sites&profiles > 3D View).
Or you can open saved 3D View directly from 3D View window, clicking Open 3D View on the tools panel.
Deleting 3D ViewYou can open previously saved 3D View from the project window.
Or you can delete saved 3D View directly from 3D View window, clicking Delete 3D View on the tools panel.
After that the current 3D View will be deleted from the project and the corresponding file with .mp3dmodel extension will also be deleted from the computer’s hard disk.

3332
Reports
ReportsPlanner program has means of report creating. The report represents a fragment of the plan or 3D view with marked graphical elements and captions. The reports are saved as separate files on a hard disc of your computer ,each project can have unlimited number of reports. When you finish editing the report, you can save it as an image for further use in other documents.
Creating a report from the plan areaIn the project window, changing the horizontal dimension of plan area and its scale, attain the best position and size of your further report window.
In the Planner main menu choose Sites&profiles> Reports> New. New report window with selected plan fragment will appear.
33
ReportsReports
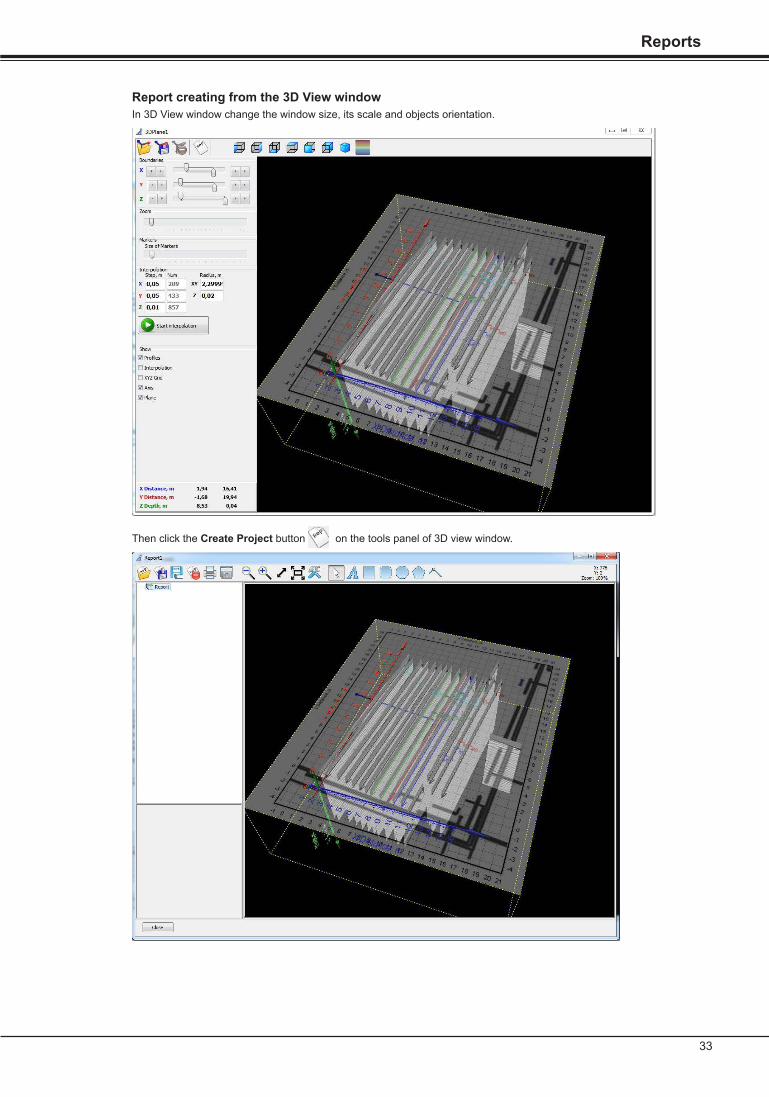
Report creating from the 3D View windowIn 3D View window change the window size, its scale and objects orientation.
Then click the Create Project button on the tools panel of 3D view window.

3534
Reports
Editing of the report objectsReport may contain different graphical objects: text, rectangles, rounded rectangles, ellipses, polygons and polylines.
To add a new object click on corresponding button on the tools panel and then click on the report image. - Add text
- Add rectangle
- Add rounded rectangle
- Add ellipse
- Add polygon
- Add polyline
Selecting objects to editYou can select the object for editing, by clicking on it on the report image or just select the object in the Objects Tree.
When the object is selected, its line in the Objects Tree will be marked, and in the report image you will see small blue rectangles around the object .

35
ReportsReports
Changing parameters of the selected objectWhen some object is selected, you will see a object edit panel in the lower corner of the window. There you can change necessary parameters:
Report savingTo save a report click the Save Report button on the report tools panel or Save Report as button . In the appeared window enter file name and click Save.
Report opening
If you need to open another project during current project editing, just click Open Report button on the report tools panel.
You can also open report from the project window: in the main menu choose Sites&profiles> Reports> (select necessary report line). There is third way of report opening exists: in the Objects Tree of the project window select the line with the name of project: Prj.
The project settings panel will appear in the lower part of the Objects Tree. There you will see the list of all reports related to the current project, and the reports tools panel.
Select the necessary report line and click Open Report button .

3636
Reports
Report deleting
You can delete the report directly from the report window, clicking Delete Report button on the report tools panel.
Another way to delete the report: select the project name Prj line in the Objects Tree of he project window.
The project settings panel will appear in the lower part of the Objects Tree. .
Select the necessary project line and click Delete report button.
9When deleted in program, the report will be deleted from the project, and the report file will be deleted from the hard drive of your computer.
Data export to AutoCadTo export project data to AutoCad select in the main menu Project> Export to DXF. In the appeared dialogue window select the objects to be exported and their grouping way.
In DXF file the position of all the objects will be given in relative coordinates. To have the absolute coordinates of the exported objects you need to enter the absolute coordinates of the beginning and the end of the Base Line in Site1.