Embed Size (px)
Citation preview
VMD Tutorial Ho Chi Minh City, 12/01/2012
Emiliano Ippoliti: [email protected] A Unix-like operating system is assumed to be used in this tutorial. Each file mentioned below can also be found on the folder:
/data/work/VMD
To do your tests and exercises, work in your own folder that you can create in the directory:
/data/work
by the command:
mkdir /data/work/your_name/ Inside this directory create the folder for this tutorial:
mkdir /data/work/your_name/VMD Then go to this folder:
cd /data/work/your_name/VMD
1 – Protein Data Bank The Protein Data Bank (PDB) archive is the single worldwide repository of information about the (experimentally resolved) 3D structures of large biological molecules, including proteins and nucleic acids. The data, typically obtained by X-ray crystallography or NMR spectroscopy and submitted by biologists and biochemists from around the world, are freely accessible on the Internet via the websites of its member organizations as for example the RCSB (Fig. 1):
http://www.rcsb.org The structures in the archive range from tiny proteins and bits of DNA to complex molecular machines like the ribosome. Each structure is identified by a unique PDB code. Searches on the database can be done by different keywords. The PDB is a key resource in areas of structural biology, such as structural genomics. Most major scientific journals, and some funding agencies, such as the NIH in the USA, now require scientists to submit their structure data to the PDB. If the contents of the PDB are thought of as primary data, then there are hundreds of derived (i.e., secondary) databases that categorize the data differently. For example, both SCOP1 1 http://scop.mrc-‐lmb.cam.ac.uk/scop/
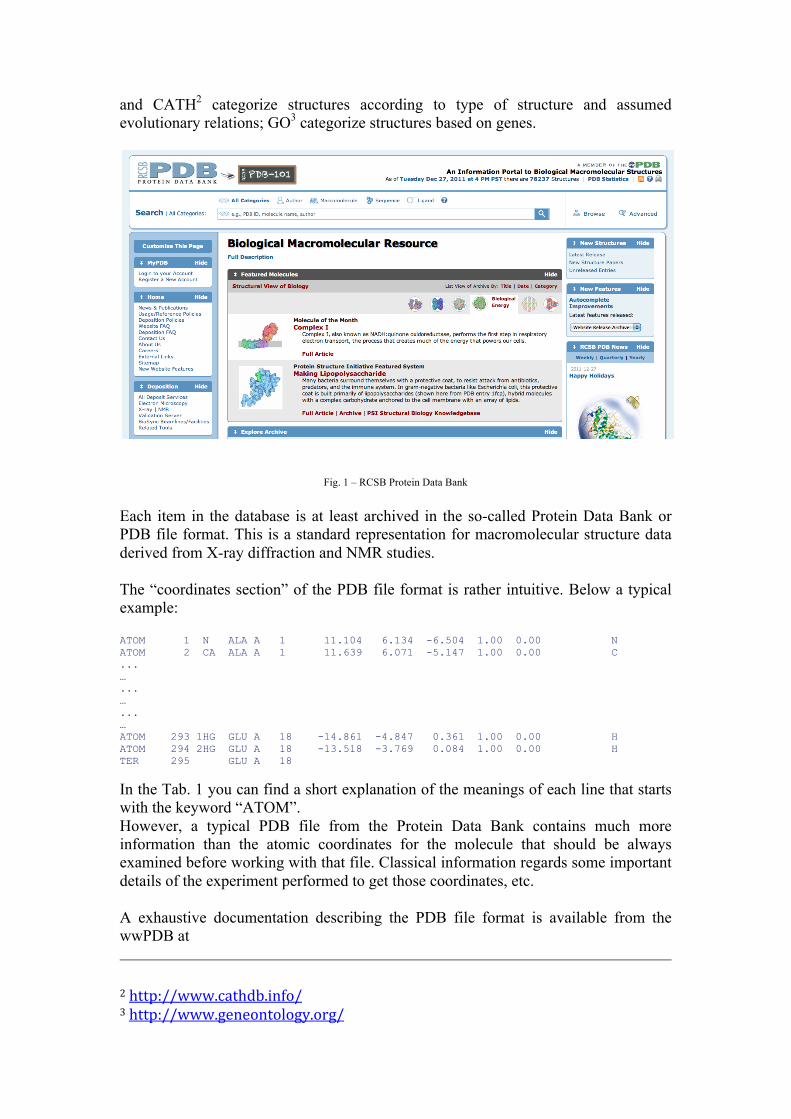
and CATH2 categorize structures according to type of structure and assumed evolutionary relations; GO3 categorize structures based on genes.
Fig. 1 – RCSB Protein Data Bank Each item in the database is at least archived in the so-called Protein Data Bank or PDB file format. This is a standard representation for macromolecular structure data derived from X-ray diffraction and NMR studies. The “coordinates section” of the PDB file format is rather intuitive. Below a typical example: ATOM 1 N ALA A 1 11.104 6.134 -6.504 1.00 0.00 N ATOM 2 CA ALA A 1 11.639 6.071 -5.147 1.00 0.00 C ... … ... … ... … ATOM 293 1HG GLU A 18 -14.861 -4.847 0.361 1.00 0.00 H ATOM 294 2HG GLU A 18 -13.518 -3.769 0.084 1.00 0.00 H TER 295 GLU A 18
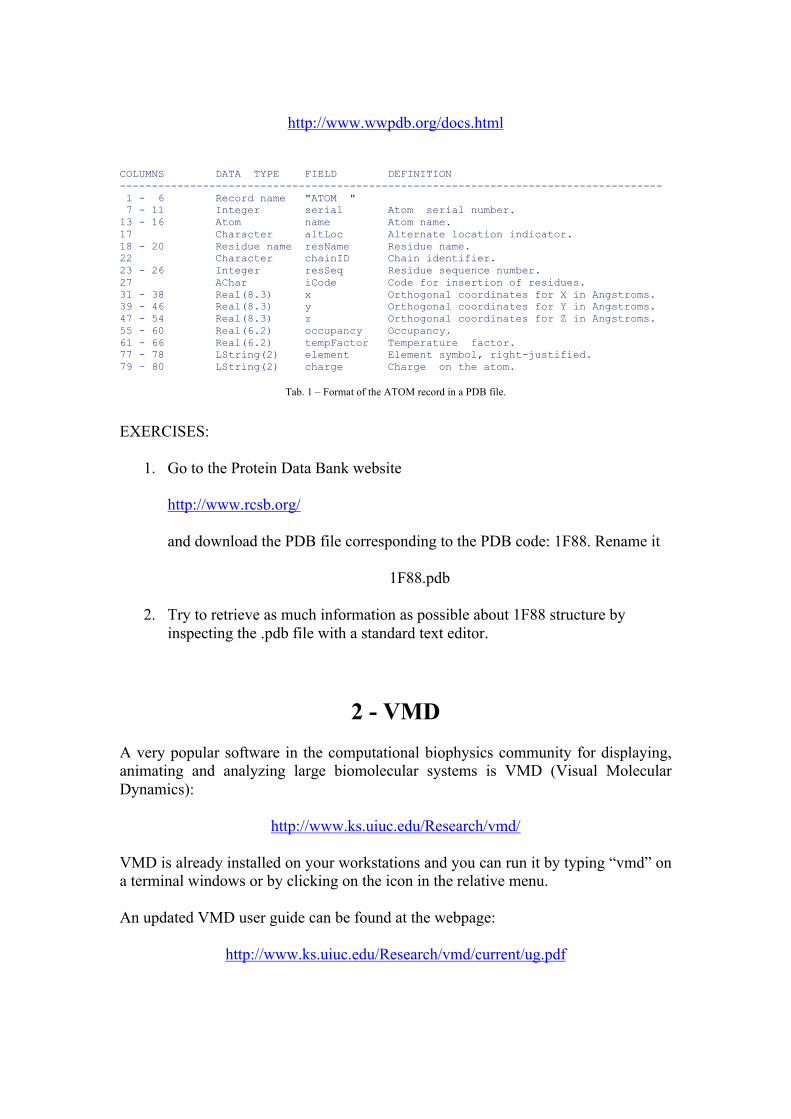
In the Tab. 1 you can find a short explanation of the meanings of each line that starts with the keyword “ATOM”. However, a typical PDB file from the Protein Data Bank contains much more information than the atomic coordinates for the molecule that should be always examined before working with that file. Classical information regards some important details of the experiment performed to get those coordinates, etc. A exhaustive documentation describing the PDB file format is available from the wwPDB at 2 http://www.cathdb.info/ 3 http://www.geneontology.org/
http://www.wwpdb.org/docs.html
COLUMNS DATA TYPE FIELD DEFINITION ------------------------------------------------------------------------------------- 1 - 6 Record name "ATOM " 7 - 11 Integer serial Atom serial number. 13 - 16 Atom name Atom name. 17 Character altLoc Alternate location indicator. 18 - 20 Residue name resName Residue name. 22 Character chainID Chain identifier. 23 - 26 Integer resSeq Residue sequence number. 27 AChar iCode Code for insertion of residues. 31 - 38 Real(8.3) x Orthogonal coordinates for X in Angstroms. 39 - 46 Real(8.3) y Orthogonal coordinates for Y in Angstroms. 47 - 54 Real(8.3) z Orthogonal coordinates for Z in Angstroms. 55 - 60 Real(6.2) occupancy Occupancy. 61 - 66 Real(6.2) tempFactor Temperature factor. 77 - 78 LString(2) element Element symbol, right-justified. 79 - 80 LString(2) charge Charge on the atom.
Tab. 1 – Format of the ATOM record in a PDB file.
EXERCISES:
1. Go to the Protein Data Bank website http://www.rcsb.org/ and download the PDB file corresponding to the PDB code: 1F88. Rename it
1F88.pdb
2. Try to retrieve as much information as possible about 1F88 structure by inspecting the .pdb file with a standard text editor.
2 - VMD
A very popular software in the computational biophysics community for displaying, animating and analyzing large biomolecular systems is VMD (Visual Molecular Dynamics):
http://www.ks.uiuc.edu/Research/vmd/
VMD is already installed on your workstations and you can run it by typing “vmd” on a terminal windows or by clicking on the icon in the relative menu. An updated VMD user guide can be found at the webpage:
http://www.ks.uiuc.edu/Research/vmd/current/ug.pdf

Fig. 2 – The 4 main windows of a VMD session EXERCISES:
1. How many windows are opened when you run VMD? What is their names? What is your guess about their specific function?
2. Open the 1F88.pdb file with VMD:
vmd 1F88.pdb
3 - The Example In this tutorial, as an example, we will analyze an experimentally resolved 3D-structure of a Rhodopsin protein from the bovine. Rhodopsin, also known as visual purple, is a biological pigment of the retina that is responsible for both the formation of the photoreceptor cells and the first events in the perception of light. Rhodopsins belong to the G-protein coupled receptor family and are extremely sensitive to light, enabling vision in low-light conditions.4 Exposed to 4 Litmann B.J., Mitchell D.C. (1996). "Rhodopsin structure and function". In Lee AG. Rhodopsin and G-Protein Linked Receptors, Part A (Vol 2, 1996) (2 Vol Set). Greenwich, Conn: JAI Press. pp. 1–32. ISBN 1-‐55938-‐659-‐2.
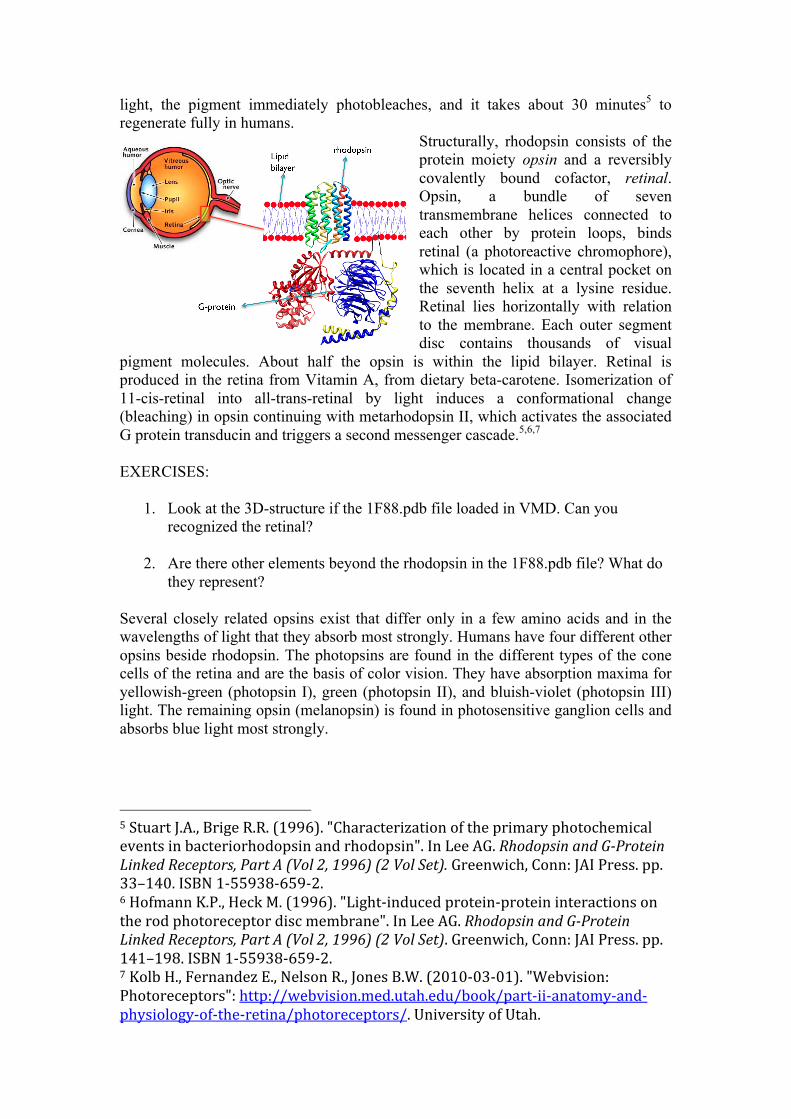
light, the pigment immediately photobleaches, and it takes about 30 minutes5 to regenerate fully in humans.
Structurally, rhodopsin consists of the protein moiety opsin and a reversibly covalently bound cofactor, retinal. Opsin, a bundle of seven transmembrane helices connected to each other by protein loops, binds retinal (a photoreactive chromophore), which is located in a central pocket on the seventh helix at a lysine residue. Retinal lies horizontally with relation to the membrane. Each outer segment disc contains thousands of visual
pigment molecules. About half the opsin is within the lipid bilayer. Retinal is produced in the retina from Vitamin A, from dietary beta-carotene. Isomerization of 11-cis-retinal into all-trans-retinal by light induces a conformational change (bleaching) in opsin continuing with metarhodopsin II, which activates the associated G protein transducin and triggers a second messenger cascade.5,6,7 EXERCISES:
1. Look at the 3D-structure if the 1F88.pdb file loaded in VMD. Can you recognized the retinal?
2. Are there other elements beyond the rhodopsin in the 1F88.pdb file? What do they represent?
Several closely related opsins exist that differ only in a few amino acids and in the wavelengths of light that they absorb most strongly. Humans have four different other opsins beside rhodopsin. The photopsins are found in the different types of the cone cells of the retina and are the basis of color vision. They have absorption maxima for yellowish-green (photopsin I), green (photopsin II), and bluish-violet (photopsin III) light. The remaining opsin (melanopsin) is found in photosensitive ganglion cells and absorbs blue light most strongly.
5 Stuart J.A., Brige R.R. (1996). "Characterization of the primary photochemical events in bacteriorhodopsin and rhodopsin". In Lee AG. Rhodopsin and G-Protein Linked Receptors, Part A (Vol 2, 1996) (2 Vol Set). Greenwich, Conn: JAI Press. pp. 33–140. ISBN 1-‐55938-‐659-‐2. 6 Hofmann K.P., Heck M. (1996). "Light-‐induced protein-‐protein interactions on the rod photoreceptor disc membrane". In Lee AG. Rhodopsin and G-Protein Linked Receptors, Part A (Vol 2, 1996) (2 Vol Set). Greenwich, Conn: JAI Press. pp. 141–198. ISBN 1-‐55938-‐659-‐2. 7 Kolb H., Fernandez E., Nelson R., Jones B.W. (2010-‐03-‐01). "Webvision: Photoreceptors": http://webvision.med.utah.edu/book/part-‐ii-‐anatomy-‐and-‐physiology-‐of-‐the-‐retina/photoreceptors/. University of Utah.
Recent data supports that it is a functional monomer as opposed to a dimer, which was the paradigm of G-coupled protein receptors for many years.8
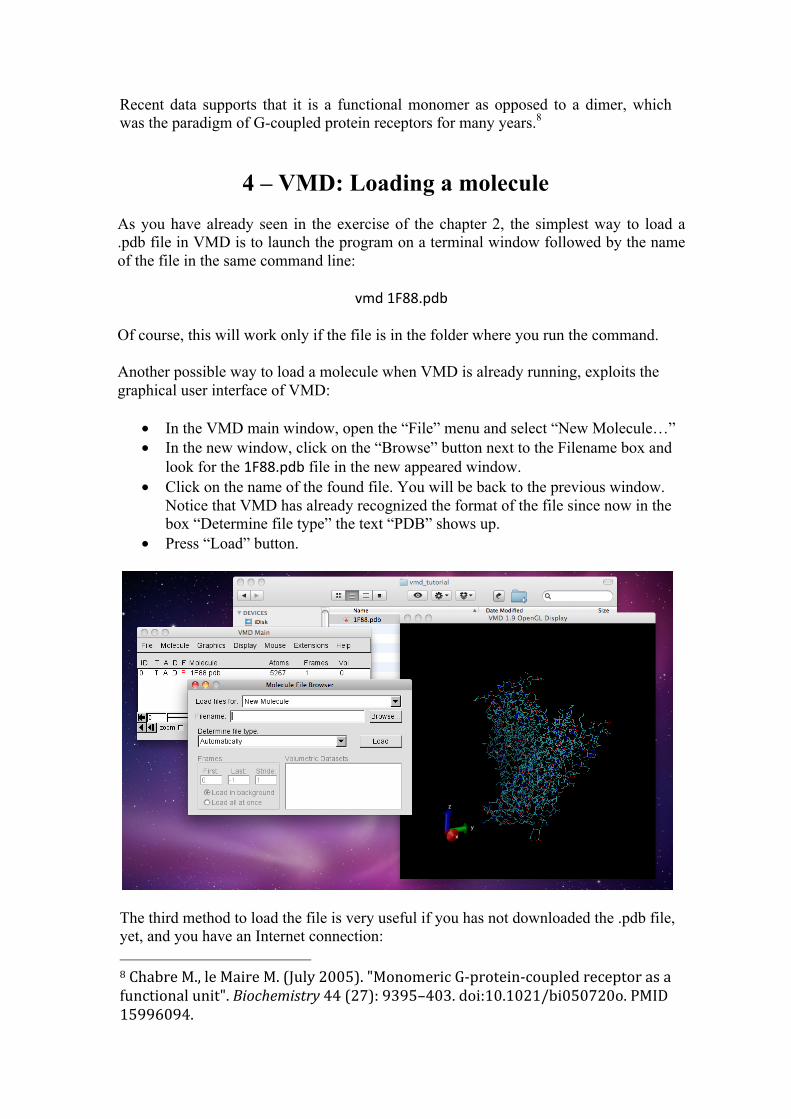
4 – VMD: Loading a molecule As you have already seen in the exercise of the chapter 2, the simplest way to load a .pdb file in VMD is to launch the program on a terminal window followed by the name of the file in the same command line:
vmd 1F88.pdb Of course, this will work only if the file is in the folder where you run the command. Another possible way to load a molecule when VMD is already running, exploits the graphical user interface of VMD:
• In the VMD main window, open the “File” menu and select “New Molecule…” • In the new window, click on the “Browse” button next to the Filename box and
look for the 1F88.pdb file in the new appeared window. • Click on the name of the found file. You will be back to the previous window.
Notice that VMD has already recognized the format of the file since now in the box “Determine file type” the text “PDB” shows up.
• Press “Load” button.
The third method to load the file is very useful if you has not downloaded the .pdb file, yet, and you have an Internet connection: 8 Chabre M., le Maire M. (July 2005). "Monomeric G-‐protein-‐coupled receptor as a functional unit". Biochemistry 44 (27): 9395–403. doi:10.1021/bi050720o. PMID 15996094.
• In the VMD main window, open the “File” menu and select “New Molecule…” • Write the PDB code in the “Filename” box. • Press “Load” button.
EXERCISES
1. Test the functionality of the three methods to load a PDB file on VMD.
5 – VMD: Displaying a molecule
In the “VMD OpenGL Display” window:
• Clicking and keeping pressed the left button of the mouse on the molecule you can move it around a default point.
• Use the central button of the mouse to zoom in and out the view. • The right button allows you to move the molecule in a different way.
In the “VMD Main” window click on the Mouse menu. A menu will show up with different entries which can change the mouse behavior in the VMD OpenGL Display window (the same effect can be obtained simply by pressing the letter on the keyboard reported on the right of the menu line when you are on the VMD OpenGL Display window):
• Rotation mode: is the initial default mode experienced previously. • Translation mode: you can use the mouse to move the molecule by
translating it. • Scale mode: you can zoom in and out with the mouse. • Center: clicking on a point in the molecule you will change the point
around which the molecule will rotate in the rotation mode. • Label:
o Atoms: if you click on ONE molecule’s atom some information on the atom will show up (and more related information can be read on the third VMD window).
o Bonds: if you click on TWO molecule’s atoms in sequence the distance among them will show up (and more related information can be read on the third VMD window).
o Angles: if you click on THREE molecule’s atoms in sequence the angle formed by them will show up (and more related information can be read on the third VMD window).
o Dihedrals: if you click on FOUR molecule’s atoms in sequence the dihedral angle formed by them will show up (and more related information can be read on the third VMD window).
• Move: o Atom: you can select and move a single atom keeping the rest fixed.
o Residue: you can select an atom and move the residue it belongs to, keeping the rest fixed.
o Fragment: you can select an atom and move the fragment it belongs to, keeping the rest fixed.
o Molecule: you can select an atom and move the molecule it belongs to, keeping the rest fixed.
o Rep: you can select an atom and move the representation (see below for the VMD concept of representation) it belongs to, keeping the rest fixed.
• Add/Remove bonds: click on TWO molecule’s atoms in sequence you will create (if it does not exist) or remove (if it is already present) the bond between them.
Refer to the VMD User Manual for a description of the other options in the menu. If you want to come back to the initial default visualization of the loaded system chosen by VMD, open the menu “Display” in the VMD Main window and select the Reset View entry. EXERCISES
1. Change the visualization modes described in the chapter by using the keyboard buttons in place of the menu entries.
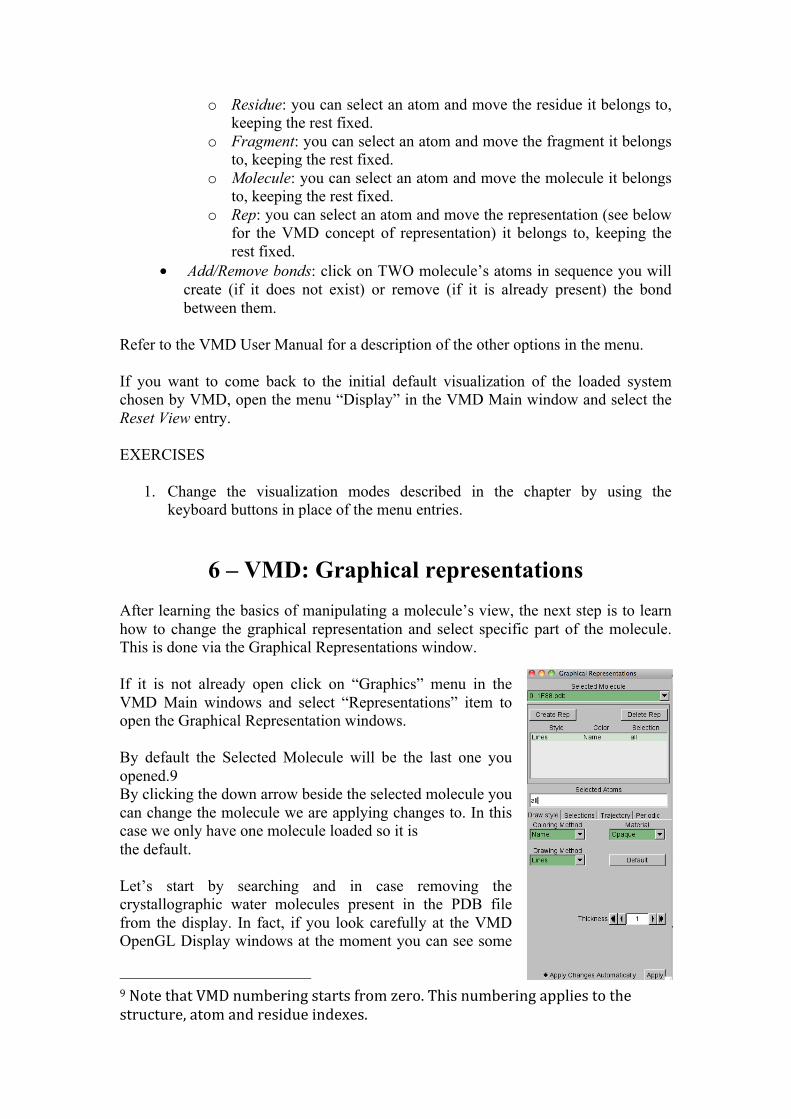
6 – VMD: Graphical representations After learning the basics of manipulating a molecule’s view, the next step is to learn how to change the graphical representation and select specific part of the molecule. This is done via the Graphical Representations window. If it is not already open click on “Graphics” menu in the VMD Main windows and select “Representations” item to open the Graphical Representation windows. By default the Selected Molecule will be the last one you opened.9 By clicking the down arrow beside the selected molecule you can change the molecule we are applying changes to. In this case we only have one molecule loaded so it is the default. Let’s start by searching and in case removing the crystallographic water molecules present in the PDB file from the display. In fact, if you look carefully at the VMD OpenGL Display windows at the moment you can see some
9 Note that VMD numbering starts from zero. This numbering applies to the structure, atom and residue indexes.
little red dots. These are the oxygen atoms of water molecules10 that were in the PBD file. To identify them with certainty we can proceed this way:
• Change in the “Selected Atoms” box the word all with the word waters.
• Hit “Apply” or press enter. The molecule should disappear and only some red dots should remain.
• Replace the selection Lines in the “Drawing method” box with CPK in order to change the way the atoms are represented on the screen from points to spheres.
• Enlarge the “Sphere Scale” till when you manage to see the oxygen atoms. • Finally, bring back the sphere scale to 1.0.
We can visualize back the molecule without the oxygen atoms by exploiting again the “Selected Atoms” box:
• Replace the selection waters with the words all not waters
• Hit “Apply” or press enter. The protein will show up again without the water red dots but something is change: remember that now you are using the CPK representation! While this example might not seem a stunning use of such a selection it is very useful when looking at explicit solvent calculations since often the water molecules will obscure your protein or system of interest. “not” is really a Boolean operator: all the common Boolean operators (and, or, not) can be used in the “Selected Atoms”. On the screen you really see two protein molecules. That is because the asymmetric crystallographic unit is composed by to molecules. We want to focus only on one of them. To select the first one, for instance:
• Delete the text in the current selection box and click on the “Selections” tab. Here you can pick the selection you want in the “Selected Atoms” box.
• To this end, seek the chain word in the “Keyword” box and double click on it. The word will appear in the “Selected atoms” box.
• Double click on A in the “Value” box. An “A” will be put next the word “chain” in the “Selected atoms” box: “chain A” is how the first protein is
10 The hydrogen atoms in this PDB file are not present as is usual for PDB file obtained from X-‐ray experiments.
named in the PDB file.
Note, if you already know what command to type, it is also possible to simply type it in this box, as we did to remove the water, if we know what we want. To make the visualization easier, we may want to change the view to a Cartoon view so we can see the structure more clearly:
• Come back to the previous menu by clicking on the “Draw style” tab. • In “Coloring Method” box select
Secondary Structure This will change the coloring to one where different residues are colored differently depending on the secondary structure they are part of.
• Next, select Cartoon from the “Drawing Method” box. You can also try NewCartoon which is available starting from VMD 1.8.3.
If you look in the PDB file (or in the list of Value for the keyword “elements” in the “Selections” tab) there are some zinc atoms in the structure. We want to highlight them together the protein to help, for example, understanding their role. We will do this by creating a second representation for this molecule and selecting only those residues with the name ZN:
• In the “Graphical Representations” window click on the top button “Create Rep”: a second representation, identical to the previous one, will be created.
• Click on the “Selections” tab. We want to select only residues that have the name ZN.
• Delete the text in the “Selected Atoms” box. • Double click on resname in the “Keyword” box. This should add “resname”
to the “Selected Atoms” text box. • Then, scroll down the list of values and double click on ZN and hit “Apply”. • Now we can go back to the “Draw Style” tab. As it stands not much has
happened to our molecule’s representation. This is because the draw style is still set to NewCartoon. Let’s change it to CPK (or VDW) so we can see the Zn residues and increase the Sphere Scale to 3.5. Make sure that the second of the two representations is highlighted as above: we don’t want to change the entire protein to CPK as this will make the structure very difficult to see.
• Finally, change the Coloring Method to ColorID, and choose the number 5 in the box next to the Coloring Method to color the selected residues in orange. You should now be able to see the orange Zn atoms together the NewCartoon structure.
You can temporarily turn off either of the representations by double clicking on it’s name in the representation list. Try it, double click on the one that has chain A as its selection. You should be left with just the Zn atoms. Double click on it again and you’ll get the protein back.
We can make more complicated selections. Let’s suppose for instance that we want to select all of the residues around a Zn atom:
• Create a new selection by clicking again on Create Rep and temporarily turn off the previous ones.
• In the “Selected Atoms” box, after having deleted the existing text, type the following commands:
same residues as within 5 of name ZN
and press enter.
All of the residues within 5 Å from the zinc atoms will be displayed.
If you want to select only the close residues of one specific Zn atom we should first identify it somehow:
• Press the button 1 on the keyboard and click with the left button of the mouse on the selected Zn atom.
• The number that will show up next the atom is its resid (e.g. 910). More information about the atom can be read in the third window of VMD (index, resname, etc).
• We could use this information for example this way: same residues as within 5 of resid 910
At this point, from the “Drawing Method” box, change the representation style to licorice or CPK. You may want to try also different coloring methods. EXERCISES
1. In the procedure above four Zn atoms showed up. Two of them are close to the structure, while other two seem very far: what do the latter ones represent?
2. Identify all the secondary structure elements in the rhodopsin that were described previously.
3. Draw the chain B of the protein 1F88 with
• The protein in New Cartoon representation and Secondary Structure coloring method.
• Water in VDW representation with colorID/red coloring method • The rest in licorice representation and name coloring method
4. How many different kind of molecules you find in the rest part? Their names?
7 – VMD: Comparing structures
At this point let us see how to compare two or more structures. From the “Molecule File Browser” window, let us load the structure with the PDB code: 2RH1:
• Click and open the “File” menu • Select “New Molecule…” entry
As you have seen before, you can do it in one step by inserting such a PDB code in the “Filename” box: VMD will contact the Protein Data Bank and will download the file for you. The two structures will be visualized in the VMD OpenGL Display window but they are not close each other. Sometimes, You cannot even be able to properly see the new structure just because it has a different reference system. So, we need to overlap the two proteins:
• Open the menu “Extensions” in the VMD Main window, then choose “Analysis” and finally click on “MultiSeq”.
• In the untitled.multiseq window tick the two structures you want to align: o 1F88_A (i.e. the chain A of 1F88 protein) o 2RH1
• Click on the button “Tool” in this window and select “Stamp Structural Alignment”: a new window will show up where some options can be choosen.
• In the “Align the following” section of this new window, select “Market Structures”. All the other options can be left at their default values.
• Press OK • Use “Reset view” in the Display menu of the VMD Main window to force
VMD to recalculate its best view point of this new protein system.
Look at the VMD OpenGL Display window: the two proteins are now “partially” overlapped. If you change the representation to NewCartoon for both the structures you can probably make easier your understanding about the overlapping result:11 the alignment algorithm recognized the 7-helices common structure in the two files and overlap them. EXERCISES
1. What are the structural differences of the 2HR1 protein with respect the 1F88 one?
2. What is the 2HR1 domain that was not overlapped to 1F88_A? Notice that VMD has another routine for structural alignment that can be recalled by selecting in sequence Extensions/Analysis/RSMD Calculator. It aligns by minimizing the residue-residue mean square distance. However, this routine is rather limited because it can align only two structures that has the same sequence and even the
11 Make sure that in the Graphical representation window the Selected Molecule be the one just loaded and it should be referred to as molecule 1.
numbering has to match! Therefore, in order to use it, for example in our case, we should have restricted the residues the algorithm should take into account by specifying them in the text box of the RSMD Calculator. with the usual VMD syntax. To visually quantify the level of overlap we can proceed this way:
• In the untitled.multiseq window click on the button “View”, choose then “Coloring” and select “Apply to Marked”.
• Click again on “View” Coloring and choose: o “RSMD” to color the molecules according to the value of the root
mean square distance between the corresponding atoms o “Qres” to color the molecules according to value of the structural
identity Q12 per residue (Qres) obtained in the alignment. Qres is the contribution from each residue to the overall Q value of aligned structures.
The blue areas represent regions where the physical quantity used for the overlap evaluation have very low values (molecules highly conserved at those points), the red regions represent the areas with very high values (there is no correspondence in structural proximities at these points) and the gray regions have intermediate values. A more detailed colored correspondence can be observed looking at the main frame in the untitled.multiseq window. Sometimes it can happen that even the MultiSeq alignment procedure fails. In these rare case only a manual rotation of one of the two structures can allow structural alignment. We can do this by
• double clicking on the letter “F” that is beside the molecule that we do not want to move in the VMD Main window. It should change from red to black when you double click on it;
• then going back to the VMD OpenGL Display window and use the mouse to move (rotate and translate) only the other structure.
12 Eastwood, M.P., C. Hardin, Z. Luthey-‐Schulten, and P.G. Wolynes. ``Evaluating the protein structure-‐prediction schemes using energy landscape theory.'' IBM J. Res. Dev. 45: 475-‐497, 2001. URL: http://www.research.ibm.com/journal/rd/453/eastwood.pdf