Embed Size (px)
Citation preview
For Use Only by VMware and VMware Solution Providers
Not a Customer Deliverable
VMware HealthAnalyzer Installation and User Guide
Release 5.2.0
May 2017
VMware HealthAnalyzer Installation and User Guide
© 2017 VMware, Inc. All rights reserved.
Page 2 of 54
© 2017 VMware, Inc. All rights reserved. This product is protected by U.S. and international copyright and intellectual property laws. This product is covered by one or more patents listed at http://www.vmware.com/download/patents.html.
VMware is a registered trademark or trademark of VMware, Inc. in the United States and/or other jurisdictions. All other marks and names mentioned herein may be trademarks of their respective companies.
VMware, Inc. 3401 Hillview Ave Palo Alto, CA 94304 www.vmware.com
VMware HealthAnalyzer Installation and User Guide
© 2017 VMware, Inc. All rights reserved.
Page 3 of 54
Contents
About This Document ............................................................................. 5
Intended Audience ................................................................................................................. 5
Support, Feedback and Questions ......................................................................................... 5
1. Introducing VMware HealthAnalyzer ................................................ 6
1.1 Overview ........................................................................................................................ 6
1.2 Security .......................................................................................................................... 7
2. Installing and Configuring VMware HealthAnalyzer .......................... 8
2.1 System Requirements .................................................................................................... 8
2.2 Installing and Configuring VMware HealthAnalyzer ....................................................... 8
3. Working with VMware HealthAnalyzer ........................................... 16
3.1 Setting Up Access to vCenter Server, View Connection Server, App Volumes Manager, NSX Manager and NSX Controller ............................................................................................... 16
3.2 Using the Project Explorer ........................................................................................... 24
3.3 Using the Workbench ................................................................................................... 43
3.4 Importing and Exporting Projects and Log Files .......................................................... 53
VMware HealthAnalyzer Installation and User Guide
© 2017 VMware, Inc. All rights reserved.
Page 4 of 54
List of Figures
Figure 1. VMware HealthAnalyzer Processing ............................................................................................. 6
Figure 2. VMware HealthAnalyzer Application Installation Workflow ........................................................... 9
Figure 3. VMware HealthAnalyzer Virtual Appliance Installation Workflow ................................................ 10
Figure 4. Project Explorer ........................................................................................................................... 24
Figure 5. Workbench Workflow ................................................................................................................... 43
Figure 6. Workbench Panels ....................................................................................................................... 43
Figure 7. Click the Arrow to Display the Project Guide ............................................................................... 44
Figure 8. Best Practices List ....................................................................................................................... 45
Figure 9. Analysis Steps ............................................................................................................................. 48
Figure 10. Observations Tab....................................................................................................................... 50
Figure 11. Findings Tab .............................................................................................................................. 50
Figure 12. Data Table ................................................................................................................................. 51
Figure 13. Project Guide ............................................................................................................................. 52
VMware HealthAnalyzer Installation and User Guide
© 2017 VMware, Inc. All rights reserved.
Page 5 of 54
About This Document
This guide provides the following information about VMware HealthAnalyzer:
Installation and configuration instructions.
Instructions on creating new folders and projects, collecting data, working with a project, and defining and generating a Health Check Report.
The contents of this document are also available from the Help link in the VMware HealthAnalyzer user interface.
Intended Audience
This information is intended for use only by VMware Professional Services consultants and VMware partners who have a current Services Software Solutions subscription.
Support, Feedback and Questions
Contact [email protected] if you have questions, require support, or have suggestions for improving the VMware HealthAnalyzer documentation.
VMware HealthAnalyzer Installation and User Guide
© 2017 VMware, Inc. All rights reserved.
Page 6 of 54
1. Introducing VMware HealthAnalyzer
VMware HealthAnalyzer automates the collection and analysis of VMware Horizon®, VMware vSphere®, VMware NSX® for vSphere inventory, including configuration and utilization data.
1.1 Overview
VMware HealthAnalyzer analyzes VMware Horizon®, VMware vSphere®, VMware NSX® for vSphere inventory data, creates findings and observations, recommends grades, and allows you to edit grades and observations according to data categorized by Health Check best practices. Use the VMware HealthAnalyzer web user interface to review collected data and generate a Health Check Report for your customer.
The data collected by VMware HealthAnalyzer is categorized by best practices and presented in a project.
Figure 1. VMware HealthAnalyzer Processing
VMware HealthAnalyzer provides consistent, scalable data collection:
vSphere – Data can be collected from a specified VMware vCenter Server® and other systems within the vSphere infrastructure.
Horizon – Data for analysis of desktop systems can be captured from a View Connection Server, App Volumes Manager and all of the systems with related data within the vSphere infrastructure.
NSX for vSphere – Data can be collected from VMware NSX Manager™ (standalone or Cross-vCenter setup) and VMware NSX Controller™ instances.
A project with data can be exported to a file, or a previously captured project with data can be imported. A report in Microsoft Word format can be created for review and delivery to a customer.
VMware HealthAnalyzer Installation and User Guide
© 2017 VMware, Inc. All rights reserved.
Page 7 of 54
1.2 Security
To collect VMware vCenter® data, VMware HealthAnalyzer connects to vCenter Server over port 443 using the VMware API. To collect data from View Connection Server, VMware HealthAnalyzer uses a proprietary protocol over port 443. To collect data from VMware App Volumes Manager, VMware HealthAnalyzer uses REST API over port 443. To collect data from VMware NSX, VMware HealthAnalyzer uses REST API over port 443 to collect data from NSX Manager and SSH protocol over port 22 to collect data from NSX Controller instances.
During data collection, the communication between VMware HealthAnalyzer and the target servers is secured with HTTPS (HTTP over SSL, default port 443). For the VMware HealthAnalyzer virtual appliance, data is stored in a local database protected by VMDK file system security. For the VMware HealthAnalyzer application, the file is protected by default Windows or Mac security. VMware HealthAnalyzer collects only general inventory, configuration, and some utilization information.
VMware HealthAnalyzer requires only read-only permission for vCenter, read-only administrator role for the View Connection Server, administrator permission for App Volumes Manager, and read-only administrator permission for NSX Manager and NSX Controller for data collection, so consultants or administrators can use the inherent security and authorization feature to create an account without compromising the security of the customer’s vSphere, View, and NSX environments. VMware HealthAnalyzer does not store the password of the read-only account or any customer account.
VMware HealthAnalyzer uses the following ports.
Table 1. VMware HealthAnalyzer Network Ports
Port Protocol Description
22 SSH Inbound TCP port that is used by an administrator to log in to the VMware HealthAnalyzer virtual appliance to perform maintenance tasks. This port is not used by the VMware HealthAnalyzer application.
This port is also used for outbound collection tasks to external NSX Controllers.
443
HTTPS
Outbound TCP port that is used by VMware HealthAnalyzer to retrieve data from the customer’s vCenter Server, NSX Manager and App Volumes Manager. This port is specified when configuring VMware HealthAnalyzer to retrieve data and might be different depending on the customer’s environment.
8080 HTTP Inbound TCP port that is used by the VMware HealthAnalyzer user interface.
80 and 8080 HTTP Both inbound TCP ports are used by the VMware HealthAnalyzer virtual appliance user interface.
41984 Port used for the VMware HealthAnalyzer database.
41985 Port used for VMware HealthAnalyzer database event service.
5480 HTTPS Inbound TCP port used to access the VMware HealthAnalyzer virtual appliance management web interface from a web browser.
VMware HealthAnalyzer Installation and User Guide
© 2017 VMware, Inc. All rights reserved.
Page 8 of 54
2. Installing and Configuring VMware HealthAnalyzer
The following sections describe how to install and configure VMware HealthAnalyzer.
2.1 System Requirements
VMware HealthAnalyzer is available as a Java application or as a virtual appliance. The VMware HealthAnalyzer user interface uses HTML and JavaScript, and is accessed through a web browser. Before installing VMware HealthAnalyzer, confirm that the following system requirements are satisfied.
Platform options:
o Use Microsoft Windows Server (2008 or later), Windows (7 or later) or Apple Mac (Lion, Mountain Lion, Mavericks, Yosemite, El Capitan, or Sierra).
o Directly import and power on the OVA file containing the VMware HealthAnalyzer virtual appliance using the VMware vSphere Client™ (4.0 or later), VMware Workstation™ (9 or later), or VMware Fusion® (5 or later).
At least 3 GB RAM.
JRE 1.7 (JRE 1.8 64-bit is recommended)
Note Do not run HealthAnalyzer on the same machine that runs vCenter Server or View Conection Server or App Volumes Manager, to avoid port conflict, and resource contention issues. To avoid performance issues, do not run VMware HealthAnalyzer Collector from a shared folder or a USB drive.
2.2 Installing and Configuring VMware HealthAnalyzer 2
Before installing VMware HealthAnalyzer, verify that you have satisfied all of the system requirements and review the VMware HealthAnalyzer Release Notes for information that might affect your installation.
2.2.1 Downloading the VMware HealthAnalyzer Installation Package
VMware consultants can download VMware HealthAnalyzer and associated materials from VM Vault. Search for VMware HealthAnalyzer and follow the on-screen instructions to download.
VMware partners who have a current Services Software Solutions subscription can download VMware HealthAnalyzer and associated materials from Partner Central.
To download VMware HealthAnalyzer software and documentation from Partner Central
1. Log in to Partner Central.
2. Click the Sales tab.
3. Scroll down to Grow Your Consulting Practice.
4. Click Services Software Solutions.
5. Scroll to the VMware HealthAnalyzer section.
6. In the Software Download section, click the link to the software package that you want to install and follow the on-screen instructions.
2.2.2 Installing the VMware HealthAnalyzer Application
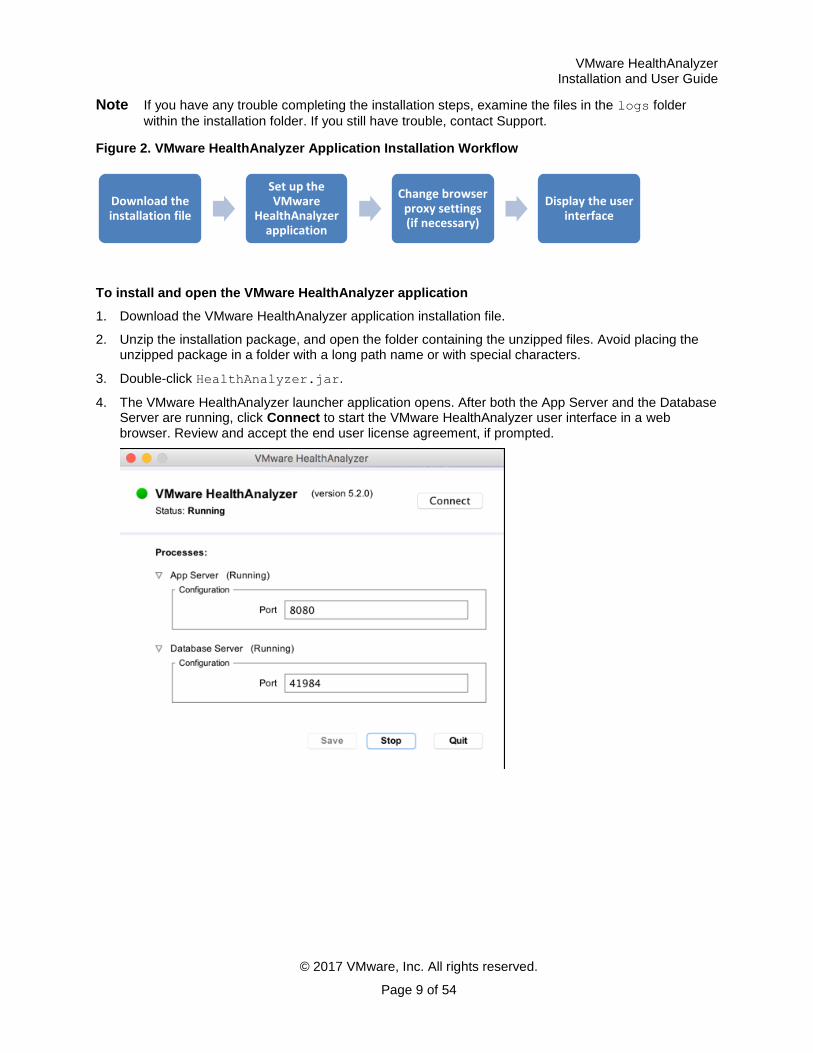
The high-level steps required to install the VMware HealthAnalyzer application and display the VMware HealthAnalyzer user interface are shown in the following figure.
VMware HealthAnalyzer Installation and User Guide
© 2017 VMware, Inc. All rights reserved.
Page 9 of 54
Note If you have any trouble completing the installation steps, examine the files in the logs folder
within the installation folder. If you still have trouble, contact Support.
Figure 2. VMware HealthAnalyzer Application Installation Workflow
To install and open the VMware HealthAnalyzer application
1. Download the VMware HealthAnalyzer application installation file.
2. Unzip the installation package, and open the folder containing the unzipped files. Avoid placing the unzipped package in a folder with a long path name or with special characters.
3. Double-click HealthAnalyzer.jar.
4. The VMware HealthAnalyzer launcher application opens. After both the App Server and the Database Server are running, click Connect to start the VMware HealthAnalyzer user interface in a web browser. Review and accept the end user license agreement, if prompted.
Download the installation file
Set up the VMware
HealthAnalyzer application
Change browser proxy settings(if necessary)
Display the user interface
VMware HealthAnalyzer Installation and User Guide
© 2017 VMware, Inc. All rights reserved.
Page 10 of 54
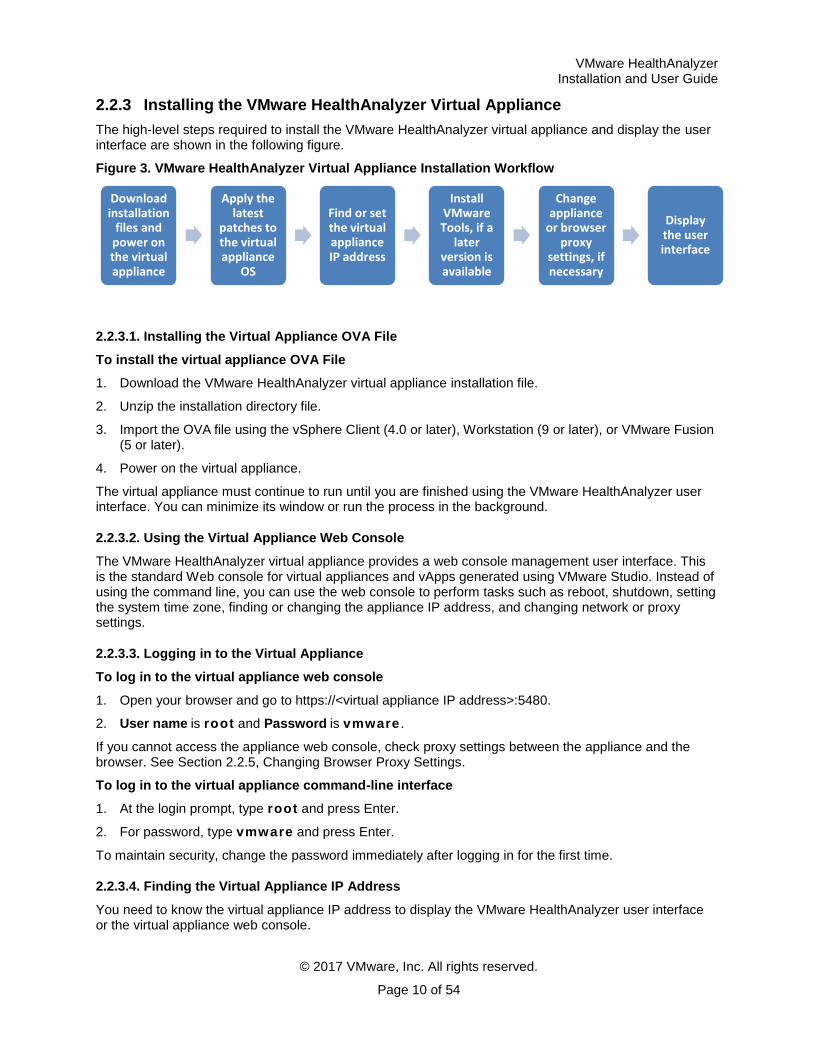
2.2.3 Installing the VMware HealthAnalyzer Virtual Appliance
The high-level steps required to install the VMware HealthAnalyzer virtual appliance and display the user interface are shown in the following figure.
Figure 3. VMware HealthAnalyzer Virtual Appliance Installation Workflow
2.2.3.1. Installing the Virtual Appliance OVA File
To install the virtual appliance OVA File
1. Download the VMware HealthAnalyzer virtual appliance installation file.
2. Unzip the installation directory file.
3. Import the OVA file using the vSphere Client (4.0 or later), Workstation (9 or later), or VMware Fusion (5 or later).
4. Power on the virtual appliance.
The virtual appliance must continue to run until you are finished using the VMware HealthAnalyzer user interface. You can minimize its window or run the process in the background.
2.2.3.2. Using the Virtual Appliance Web Console
The VMware HealthAnalyzer virtual appliance provides a web console management user interface. This is the standard Web console for virtual appliances and vApps generated using VMware Studio. Instead of using the command line, you can use the web console to perform tasks such as reboot, shutdown, setting the system time zone, finding or changing the appliance IP address, and changing network or proxy settings.
2.2.3.3. Logging in to the Virtual Appliance
To log in to the virtual appliance web console
1. Open your browser and go to https://<virtual appliance IP address>:5480.
2. User name is root and Password is vmware .
If you cannot access the appliance web console, check proxy settings between the appliance and the browser. See Section 2.2.5, Changing Browser Proxy Settings.
To log in to the virtual appliance command-line interface
1. At the login prompt, type root and press Enter.
2. For password, type vmware and press Enter.
To maintain security, change the password immediately after logging in for the first time.
2.2.3.4. Finding the Virtual Appliance IP Address
You need to know the virtual appliance IP address to display the VMware HealthAnalyzer user interface or the virtual appliance web console.
Download installation
files and power on the virtual appliance
Apply the latest
patches to the virtual appliance
OS
Find or set the virtual appliance IP address
Install VMware Tools, if a
later version is available
Change appliance
or browser proxy
settings, if necessary
Displaythe user interface
VMware HealthAnalyzer Installation and User Guide
© 2017 VMware, Inc. All rights reserved.
Page 11 of 54
To display the virtual appliance IP address from the vSphere Client
1. Power on the virtual appliance.
2. Open the vSphere Client.
3. Click the Summary or Console tab to display the IP address.
To display the virtual appliance IP address from Workstation
1. Power on the virtual appliance.
2. The IP address is displayed as the virtual appliance starts.
To display the virtual appliance IP address from the command-line
Type ifconfig at an appliance command-line prompt. Use the eth0 inet address.
2.2.3.5. Configuring the Virtual Appliance to use a Static IP Address
By default, the virtual appliance is configured to use DHCP, but you can configure it to use a static IP address.
To configure a static IP address from the web console
1. Open the VMware HealthAnalyzer virtual appliance web console.
2. Click the Network tab, and click Address.
3. Select Use the following IP settings.
4. Enter the IP address and other network parameters (Netmask, Gateway, Preferred DNS Server, Alternate DNS Server, Hostname) and click Save Settings.
2.2.3.6. Changing Virtual Appliance Proxy Settings
If there is a proxy server set up between the virtual appliance and the internet or vCenter, configure the virtual appliance to use the proxy server.
To configure the proxy
1. Open the VMware HealthAnalyzer virtual appliance web console.
2. Click the Network tab.
3. Click Proxy.
4. Select Use a Proxy Server.
5. Enter the information about the proxy server:
Proxy Server – Enter the IP address or fully qualified domain name of the proxy server.
Proxy Port – Enter the port used by the proxy server.
6. Click Save Settings.
2.2.4 Changing the Tomcat Process Memory
You can change the amount of memory allocated to the Tomcat process for VMware HealthAnalyzer. You might need to increase the amount of memory allocated if you are using VMware HealthAnalyzer in a large environment. The procedure differs depending on whether you are using the VMware HealthAnalyzer virtual appliance or the Java application.
To change the amount of Tomcat memory with a virtual appliance
1. Log in to the virtual appliance using the user root and password vmware .
VMware HealthAnalyzer Installation and User Guide
© 2017 VMware, Inc. All rights reserved.
Page 12 of 54
2. Open the configuration file using vi or another text editor:
vi /usr/share/vha/tomcat/conf/vha-tomcat-memory
3. Locate the default value of 2048 and change it to your desired value. This is the amount of memory allocated to Tomcat in megabytes.
4. Restart the appliance with the following command:
shutdown –r now
5. You can confirm that the memory value changed by issuing the following command and reviewing the
argument –Xmx.
ps –ef | grep catalina
To change the amount of Tomcat memory using the Java application
1. Quit the VMware HealthAnalyzer Java application.
2. Go to the directory where the VMware HealthAnalyzer Java application was unzipped.
3. Open the configuration file using a text or XML editor:
<unzipped location>/resources/applicationContext.xml
4. Locate the util:map XML section that contains memory settings by searching for vha-start.
Change the –Xmx value to the desired value. For example, to change the Tomcat memory to
1024 MB, change the XML as follows:
<util:map id="vha-start" map-class="java.util.LinkedHashMap">
<entry key="java" value="" />
<entry key="-Xmx1024m" value="" />
5. Save the file, and start the VMware HealthAnalyzer Java application.
2.2.5 Changing Browser Proxy Settings
Your customer might use proxies as part of their corporate firewall. A proxy server acts as an intermediary between a client computer and the internet by intercepting requests and contacting the target server to make the request on behalf of the client. Proxies offer fast access to cached content, filter content, and hide computers from the Internet to improve security.
However, a proxy server will also prevent the VMware HealthAnalyzer user interface from accessing the appliance because it does not recognize that the appliance is running locally. If you are running the VMware HealthAnalyzer on a LAN that runs behind a proxy server, you probably need to change the proxy settings before you can display the VMware HealthAnalyzer user interface. VMware recommends that you bypass the proxy by configuring your browser proxy settings to add the VMware HealthAnalyzer virtual appliance to the list of addresses that do not use a proxy.
If there is no proxy server, ignore these procedures.
To change proxy settings for Firefox
1. Start your Firefox browser.
2. Click Tools > Options.
3. Click the Network tab.
4. Click Settings.
5. Select Manual proxy configuration if it is not already selected.
6. In the No proxy for text box, type a comma delimiter followed by the appliance IP address.
VMware HealthAnalyzer Installation and User Guide
© 2017 VMware, Inc. All rights reserved.
Page 13 of 54
7. Click OK in each dialog box until you have exited.
To change proxy settings for Internet Explorer
1. Start your Internet Explorer browser.
2. Click Tools > Internet Options.
3. Click the Connections tab.
4. Click LAN Settings.
5. Click Advanced.
6. In the text box labeled Do not use proxy server for addresses beginning with, type a semicolon delimiter after any existing entries, followed by the appliance IP address.
7. Click OK in each dialog box until you have exited.
2.2.6 Displaying the VMware HealthAnalyzer User Interface
All project setup, data review, analysis, and reporting is performed using the VMware HealthAnalyzer user interface. The first time you display the user interface you might be asked to agree to the EULA.
To display the VMware HealthAnalyzer user interface using the VMware HealthAnalyzer application
1. Start your browser.
2. Enter the URL as http://localhost:8080.
If you cannot access the user interface, check the browser proxy settings and verify that there is no port conflict with another application. Verify that both the application server and database server start. If you
have any trouble accessing the user interface, examine the files in the logs folder within the installation
folder to see if there are any port conflicts with another application.
To display the VMware HealthAnalyzer user interface using the VMware HealthAnalyzer virtual appliance
1. Start your browser.
2. Enter the URL as http://<virtual appliance IP address>.
2.2.6.1. Port Settings
The VMware HealthAnalyzer virtual appliance uses port 80 and 8080. It is not necessary to specify the port number with the URL. Port conflicts are unlikely because all processes that run are known in advance, but if you do not want to use default ports 80 or 8080, change the port numbers using the one of the procedures given in the following sections.
For the user interface, it is not necessary to specify the port number with the URL. Port conflicts are unlikely because all processes that run are known in advance. Follow this procedure if you need to change the port used by the VMware HealthAnalyzer application.
VMware HealthAnalyzer Installation and User Guide
© 2017 VMware, Inc. All rights reserved.
Page 14 of 54
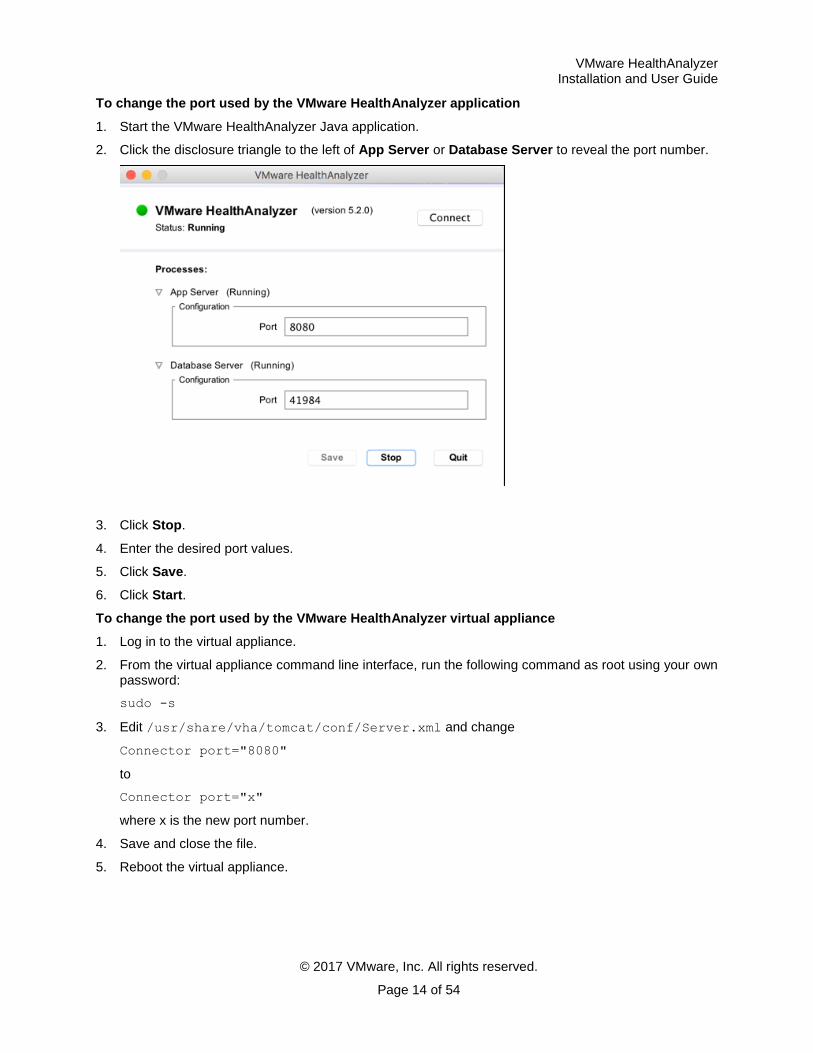
To change the port used by the VMware HealthAnalyzer application
1. Start the VMware HealthAnalyzer Java application.
2. Click the disclosure triangle to the left of App Server or Database Server to reveal the port number.
3. Click Stop.
4. Enter the desired port values.
5. Click Save.
6. Click Start.
To change the port used by the VMware HealthAnalyzer virtual appliance
1. Log in to the virtual appliance.
2. From the virtual appliance command line interface, run the following command as root using your own password:
sudo -s
3. Edit /usr/share/vha/tomcat/conf/Server.xml and change
Connector port="8080"
to
Connector port="x"
where x is the new port number.
4. Save and close the file.
5. Reboot the virtual appliance.
VMware HealthAnalyzer Installation and User Guide
© 2017 VMware, Inc. All rights reserved.
Page 15 of 54
2.2.7 Shutting Down VMware HealthAnalyzer
When you are finished working with VMware HealthAnalyzer, close the browser and perform a graceful shutdown. The procedure for shutting down depends on whether you are using the VMware HealthAnalyzer application or the virtual appliance.
2.2.7.1. Shutting Down the VMware HealthAnalyzer Application
To shut down VMware HealthAnalyzer, click Quit.
2.2.7.2. Shutting Down the VMware HealthAnalyzer Virtual Appliance
To shut down the VMware HealthAnalyzer virtual appliance from the web console
1. Open the VMware HealthAnalyzer virtual appliance web console.
2. Click the System tab (this is default).
3. Click Information (this is default).
4. Click Shutdown.
To shut down the VMware HealthAnalyzer virtual appliance from the command line
1. Log in to the virtual appliance.
2. From the virtual appliance command-line interface, if you are not already running as the root user, run the following command as root using your own password:
sudo -s
3. Type shutdown -h now and press Enter.
2.2.8 Uninstalling VMware HealthAnalyzer
If VMware HealthAnalyzer is installed on a customer machine, remove the installation folder and all associated files at the end of the engagement. Do not leave it behind at the customer site.
VMware HealthAnalyzer Installation and User Guide
© 2017 VMware, Inc. All rights reserved.
Page 16 of 54
3. Working with VMware HealthAnalyzer
VMware HealthAnalyzer provides consistent, scalable data collection from vSphere, Horizon, or NSX environments.
3.1 Setting Up Access to vCenter Server, View Connection Server, App Volumes Manager, NSX Manager and NSX Controller
Although you could use the customer’s administrator account to access the target systems and collect data, it is a best practice to restrict use of the administrator account. The preferred approach is to ask the customer’s administrator to set up user accounts on the target vCenter Server and View Connection Server with limited permissions sufficient to collect data.
Set up an account on vCenter Server
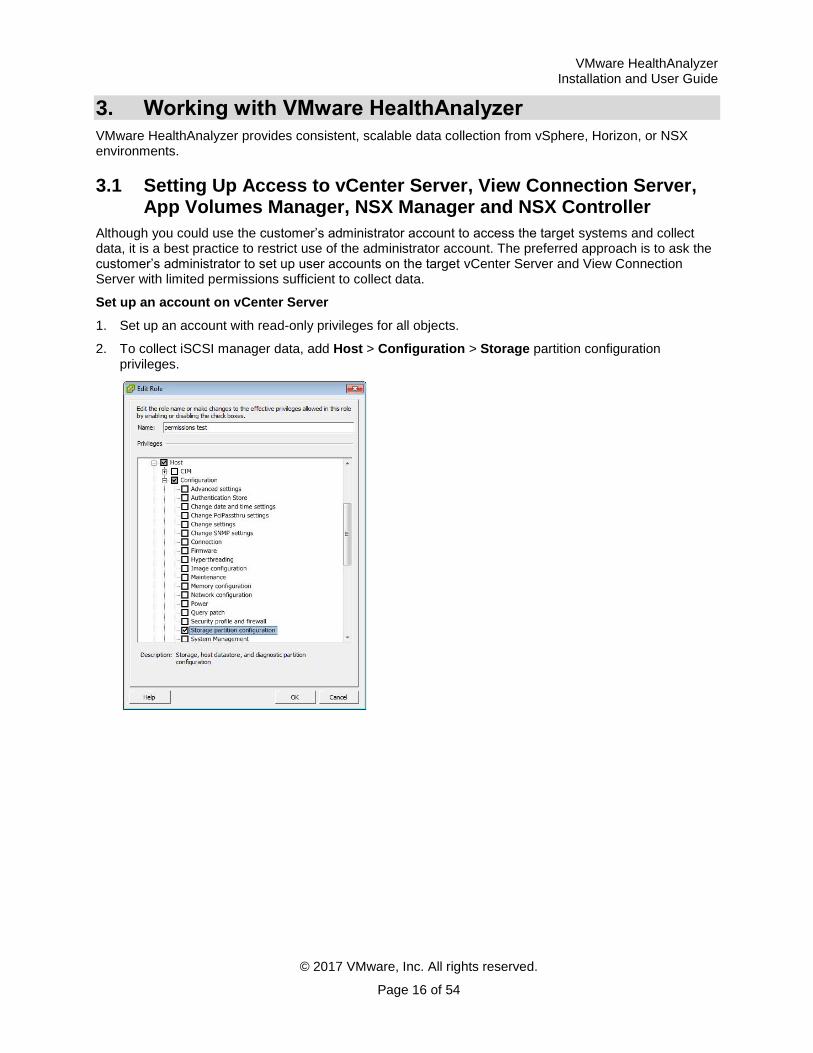
1. Set up an account with read-only privileges for all objects.
2. To collect iSCSI manager data, add Host > Configuration > Storage partition configuration privileges.
VMware HealthAnalyzer Installation and User Guide
© 2017 VMware, Inc. All rights reserved.
Page 17 of 54
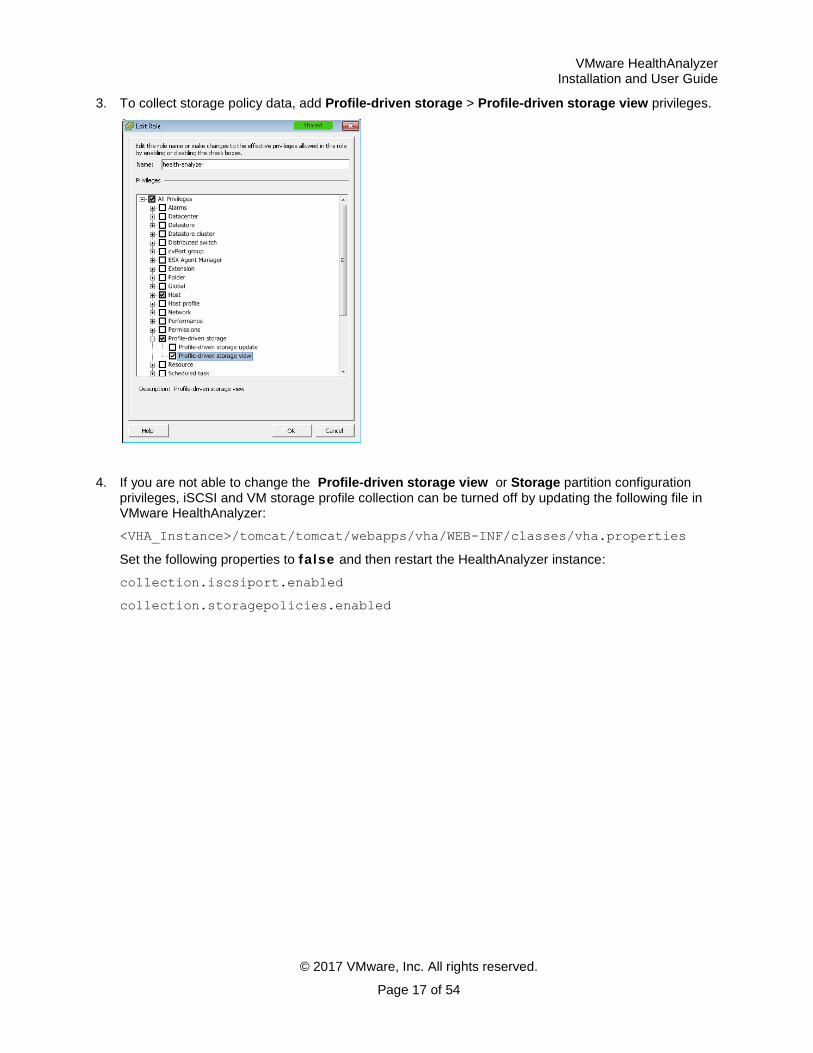
3. To collect storage policy data, add Profile-driven storage > Profile-driven storage view privileges.
4. If you are not able to change the Profile-driven storage view or Storage partition configuration privileges, iSCSI and VM storage profile collection can be turned off by updating the following file in VMware HealthAnalyzer:
<VHA_Instance>/tomcat/tomcat/webapps/vha/WEB-INF/classes/vha.properties
Set the following properties to false and then restart the HealthAnalyzer instance:
collection.iscsiport.enabled
collection.storagepolicies.enabled
VMware HealthAnalyzer Installation and User Guide
© 2017 VMware, Inc. All rights reserved.
Page 18 of 54
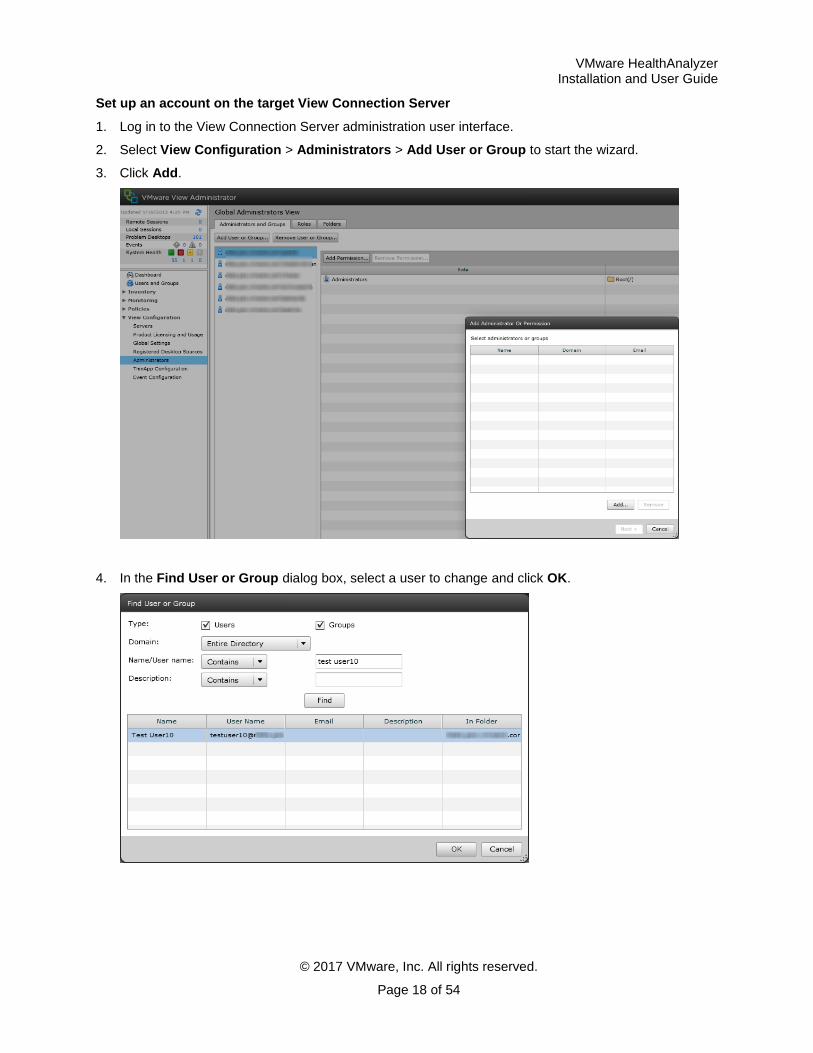
Set up an account on the target View Connection Server
1. Log in to the View Connection Server administration user interface.
2. Select View Configuration > Administrators > Add User or Group to start the wizard.
3. Click Add.
4. In the Find User or Group dialog box, select a user to change and click OK.
VMware HealthAnalyzer Installation and User Guide
© 2017 VMware, Inc. All rights reserved.
Page 19 of 54
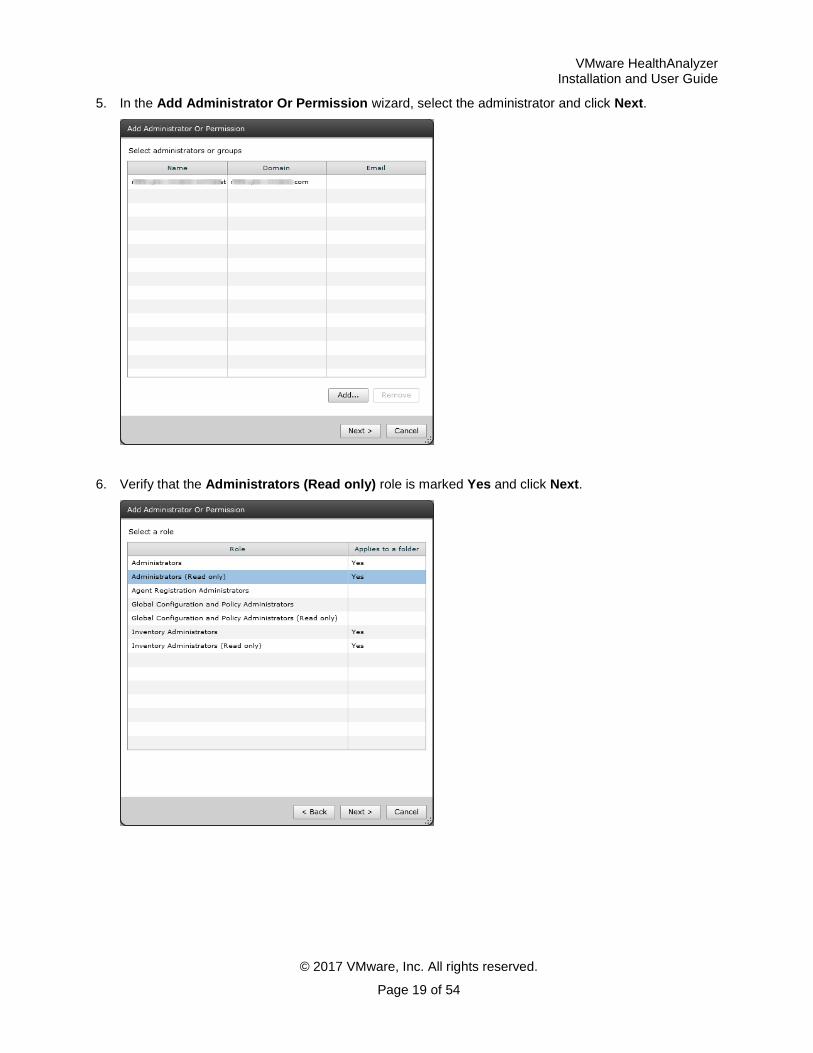
5. In the Add Administrator Or Permission wizard, select the administrator and click Next.
6. Verify that the Administrators (Read only) role is marked Yes and click Next.
VMware HealthAnalyzer Installation and User Guide
© 2017 VMware, Inc. All rights reserved.
Page 20 of 54
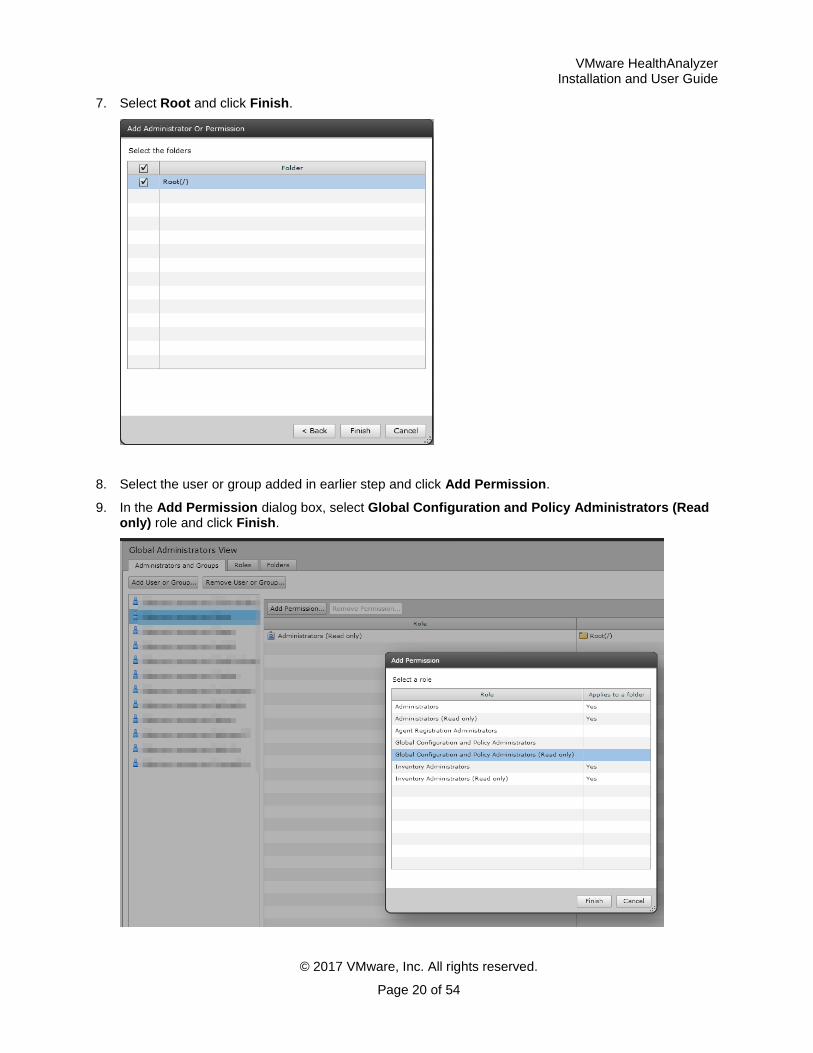
7. Select Root and click Finish.
8. Select the user or group added in earlier step and click Add Permission.
9. In the Add Permission dialog box, select Global Configuration and Policy Administrators (Read only) role and click Finish.
VMware HealthAnalyzer Installation and User Guide
© 2017 VMware, Inc. All rights reserved.
Page 21 of 54
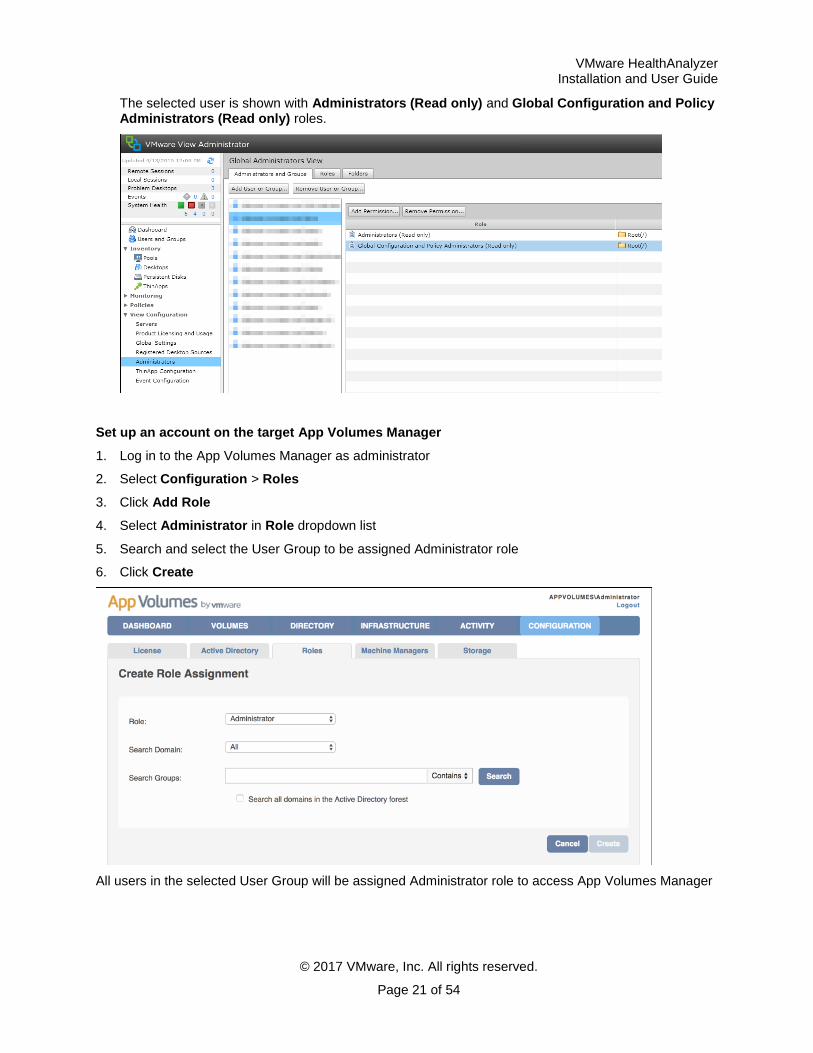
The selected user is shown with Administrators (Read only) and Global Configuration and Policy Administrators (Read only) roles.
Set up an account on the target App Volumes Manager
1. Log in to the App Volumes Manager as administrator
2. Select Configuration > Roles
3. Click Add Role
4. Select Administrator in Role dropdown list
5. Search and select the User Group to be assigned Administrator role
6. Click Create
All users in the selected User Group will be assigned Administrator role to access App Volumes Manager
VMware HealthAnalyzer Installation and User Guide
© 2017 VMware, Inc. All rights reserved.
Page 22 of 54
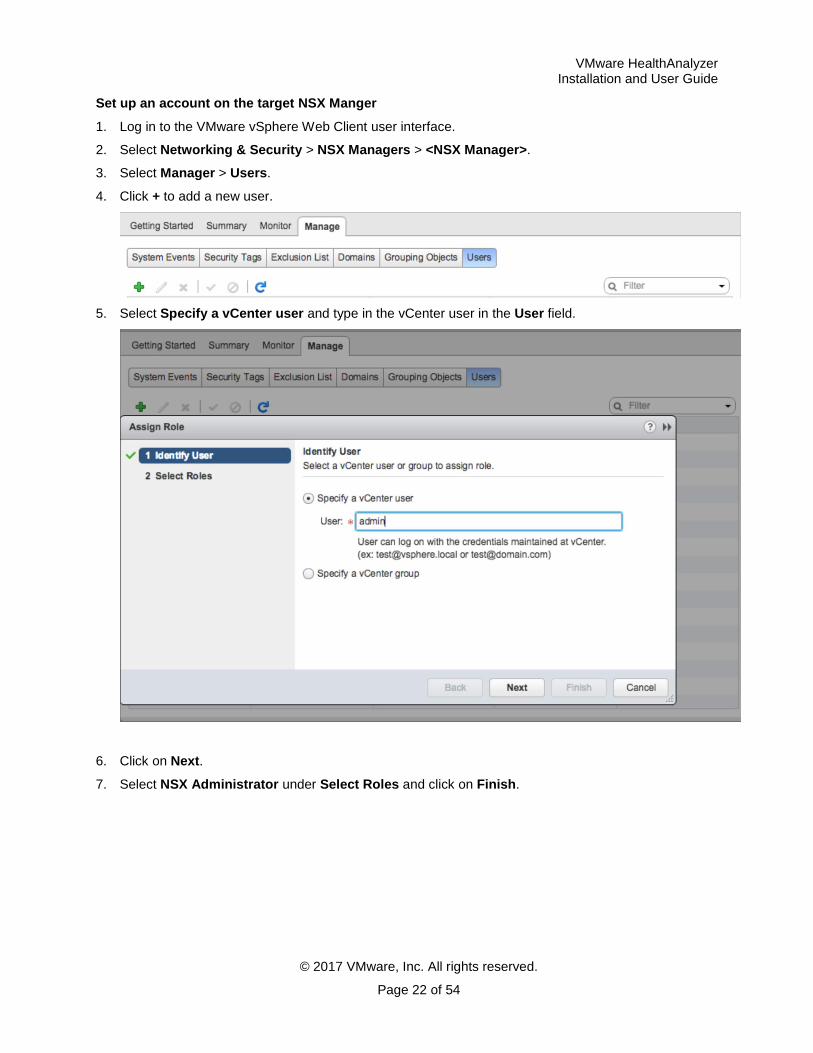
Set up an account on the target NSX Manger
1. Log in to the VMware vSphere Web Client user interface.
2. Select Networking & Security > NSX Managers > <NSX Manager>.
3. Select Manager > Users.
4. Click + to add a new user.
5. Select Specify a vCenter user and type in the vCenter user in the User field.
6. Click on Next.
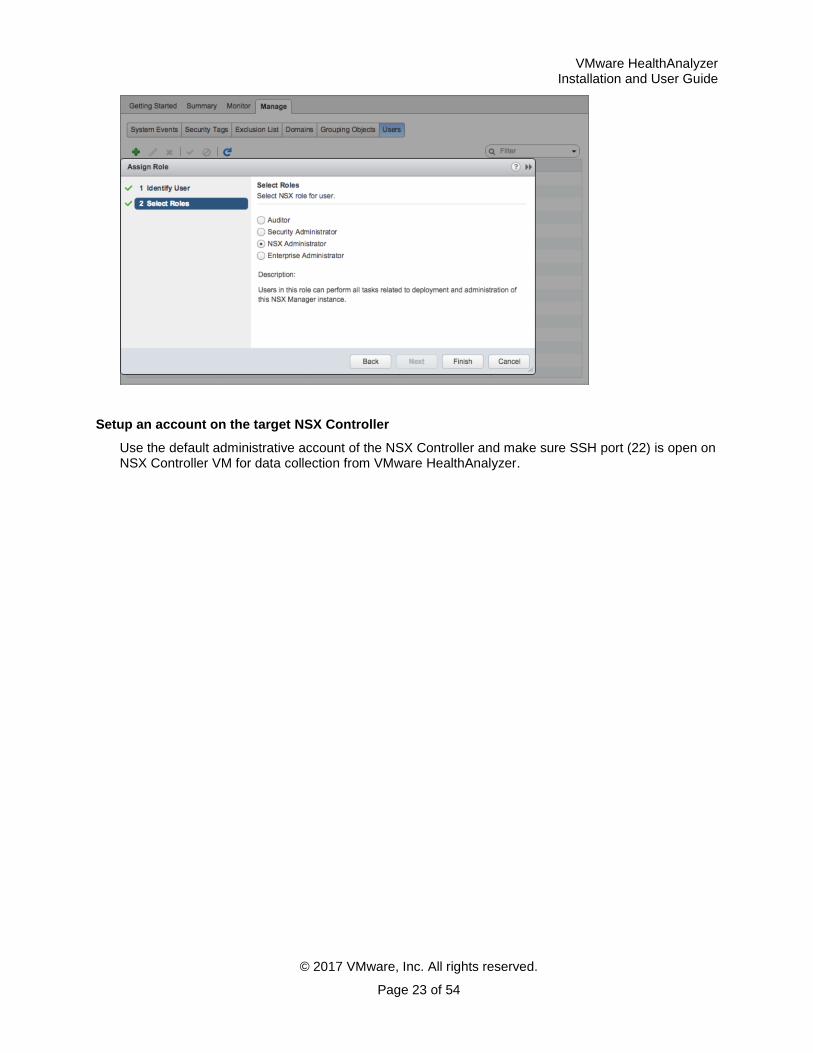
7. Select NSX Administrator under Select Roles and click on Finish.
VMware HealthAnalyzer Installation and User Guide
© 2017 VMware, Inc. All rights reserved.
Page 23 of 54
Setup an account on the target NSX Controller
Use the default administrative account of the NSX Controller and make sure SSH port (22) is open on NSX Controller VM for data collection from VMware HealthAnalyzer.
VMware HealthAnalyzer Installation and User Guide
© 2017 VMware, Inc. All rights reserved.
Page 24 of 54
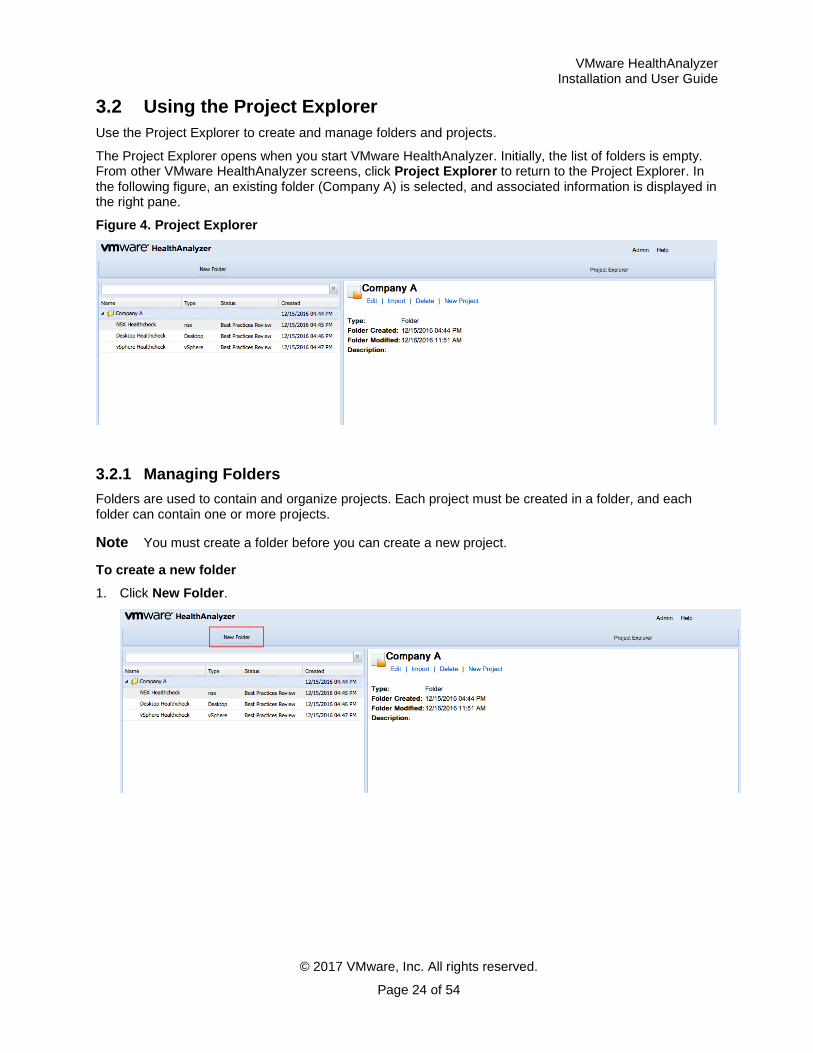
3.2 Using the Project Explorer
Use the Project Explorer to create and manage folders and projects.
The Project Explorer opens when you start VMware HealthAnalyzer. Initially, the list of folders is empty. From other VMware HealthAnalyzer screens, click Project Explorer to return to the Project Explorer. In the following figure, an existing folder (Company A) is selected, and associated information is displayed in the right pane.
Figure 4. Project Explorer
3.2.1 Managing Folders
Folders are used to contain and organize projects. Each project must be created in a folder, and each folder can contain one or more projects.
Note You must create a folder before you can create a new project.
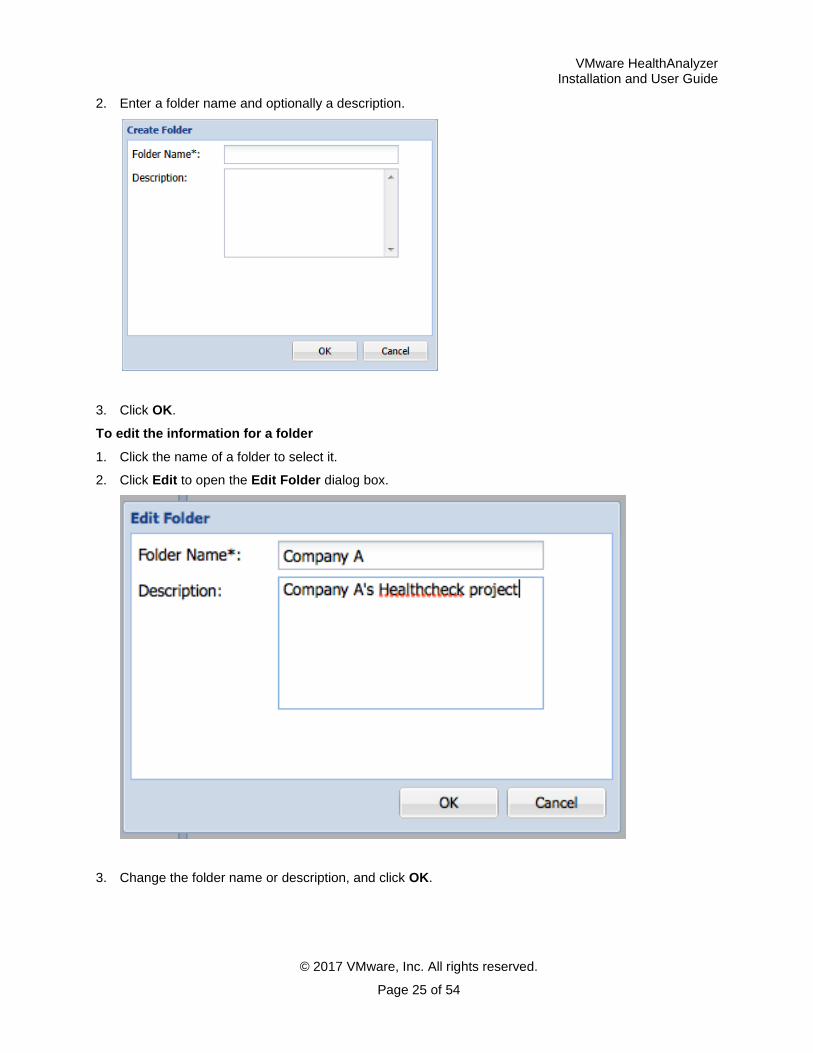
To create a new folder
1. Click New Folder.
VMware HealthAnalyzer Installation and User Guide
© 2017 VMware, Inc. All rights reserved.
Page 25 of 54
2. Enter a folder name and optionally a description.
3. Click OK.
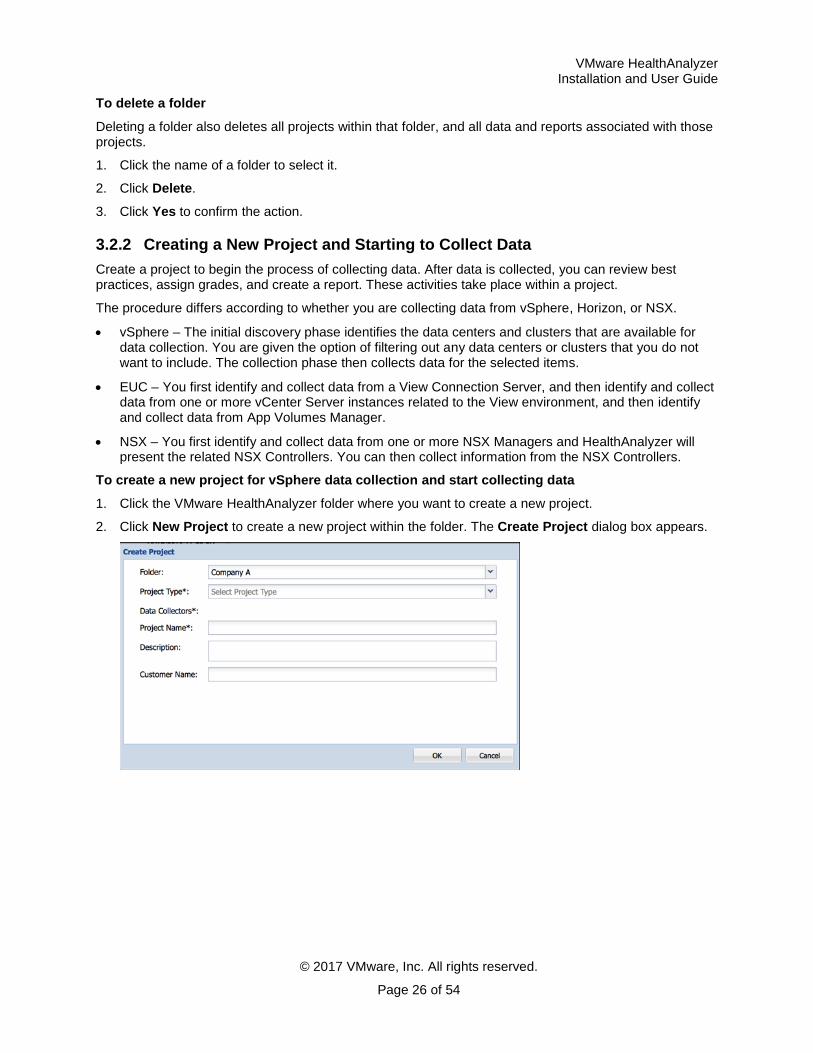
To edit the information for a folder
1. Click the name of a folder to select it.
2. Click Edit to open the Edit Folder dialog box.
3. Change the folder name or description, and click OK.
VMware HealthAnalyzer Installation and User Guide
© 2017 VMware, Inc. All rights reserved.
Page 26 of 54
To delete a folder
Deleting a folder also deletes all projects within that folder, and all data and reports associated with those projects.
1. Click the name of a folder to select it.
2. Click Delete.
3. Click Yes to confirm the action.
3.2.2 Creating a New Project and Starting to Collect Data
Create a project to begin the process of collecting data. After data is collected, you can review best practices, assign grades, and create a report. These activities take place within a project.
The procedure differs according to whether you are collecting data from vSphere, Horizon, or NSX.
vSphere – The initial discovery phase identifies the data centers and clusters that are available for data collection. You are given the option of filtering out any data centers or clusters that you do not want to include. The collection phase then collects data for the selected items.
EUC – You first identify and collect data from a View Connection Server, and then identify and collect data from one or more vCenter Server instances related to the View environment, and then identify and collect data from App Volumes Manager.
NSX – You first identify and collect data from one or more NSX Managers and HealthAnalyzer will present the related NSX Controllers. You can then collect information from the NSX Controllers.
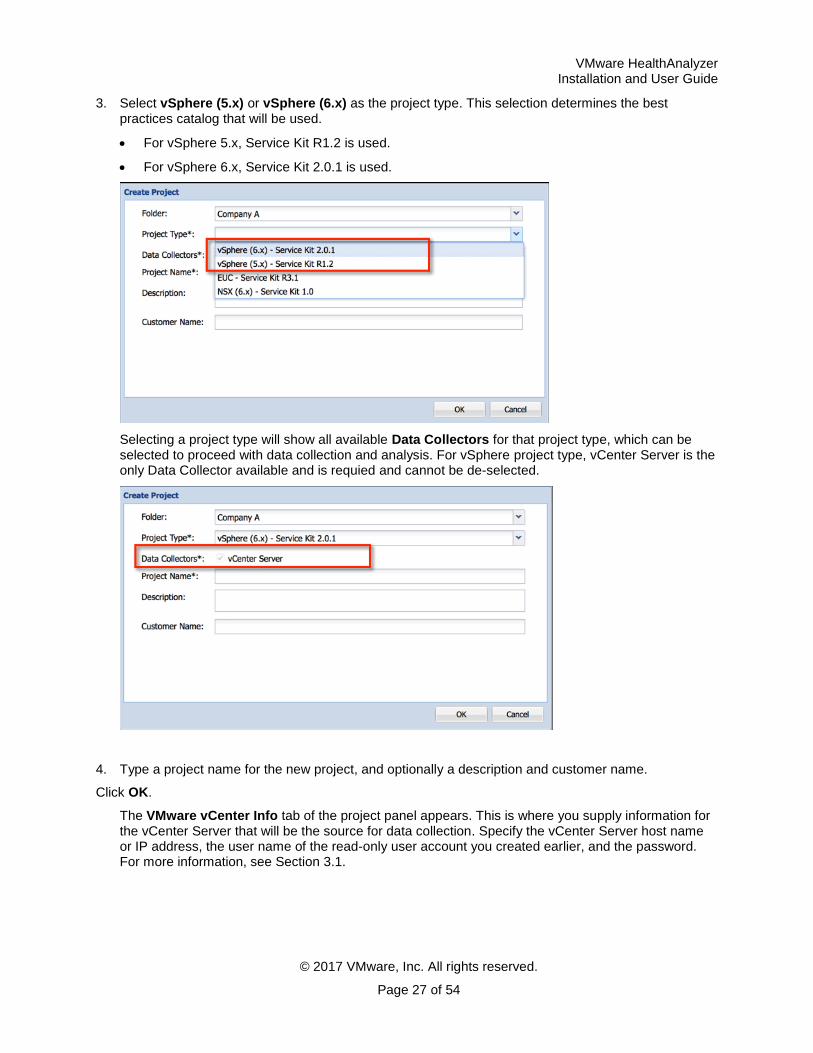
To create a new project for vSphere data collection and start collecting data
1. Click the VMware HealthAnalyzer folder where you want to create a new project.
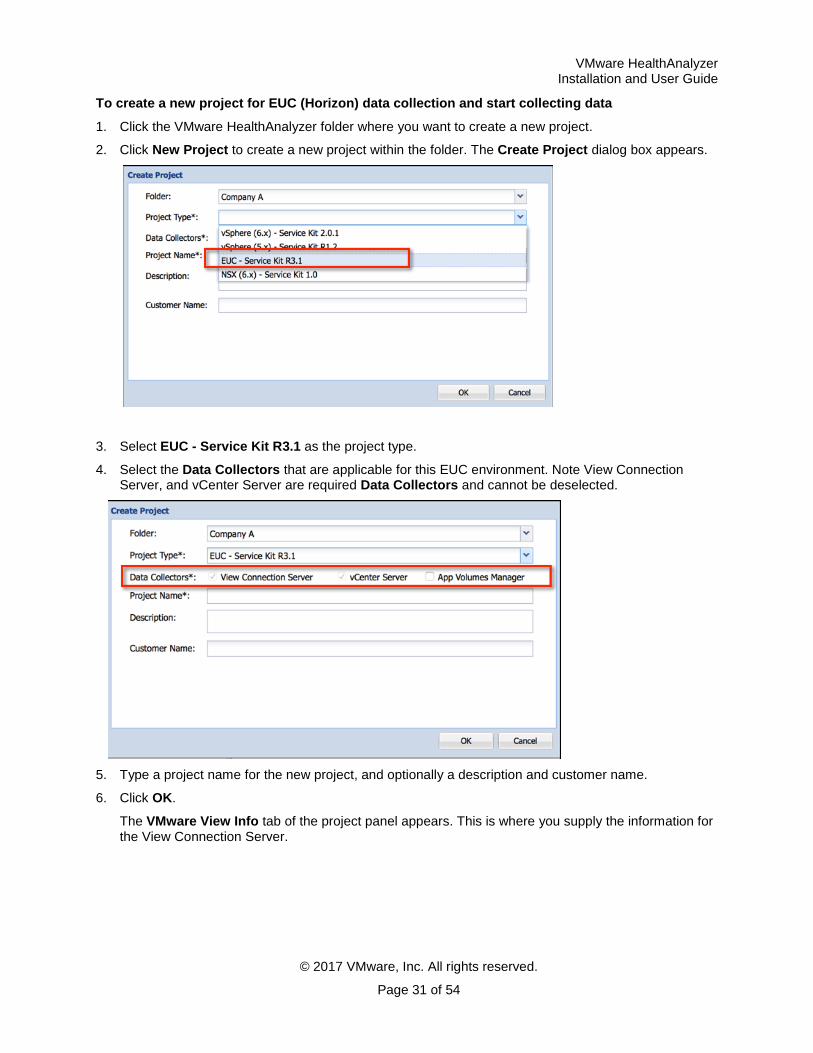
2. Click New Project to create a new project within the folder. The Create Project dialog box appears.
VMware HealthAnalyzer Installation and User Guide
© 2017 VMware, Inc. All rights reserved.
Page 27 of 54
3. Select vSphere (5.x) or vSphere (6.x) as the project type. This selection determines the best practices catalog that will be used.
For vSphere 5.x, Service Kit R1.2 is used.
For vSphere 6.x, Service Kit 2.0.1 is used.
Selecting a project type will show all available Data Collectors for that project type, which can be selected to proceed with data collection and analysis. For vSphere project type, vCenter Server is the only Data Collector available and is requied and cannot be de-selected.
4. Type a project name for the new project, and optionally a description and customer name.
Click OK.
The VMware vCenter Info tab of the project panel appears. This is where you supply information for the vCenter Server that will be the source for data collection. Specify the vCenter Server host name or IP address, the user name of the read-only user account you created earlier, and the password. For more information, see Section 3.1.

VMware HealthAnalyzer Installation and User Guide
© 2017 VMware, Inc. All rights reserved.
Page 28 of 54
For vSphere 5.x and above, also specify the single sign-on (SSO) server.
5. Type the host name or IP address of the vCenter Server.
Note If you use a host name, first confirm that it can be pinged from the network. If you cannot access the server using a DNS name, use an IP address. If the target server is configured to use HTTP, you must explicitly add an HTTP prefix (for example, http://10.12.20.143).
6. Type the login credentials for the vCenter Server in the User and Password fields. You can include a domain name in the User field by using the domain\user format.
7. Click Next.
VMware HealthAnalyzer now collects data from the specified vCenter Server. During data collection, VMware HealthAnalyzer reports its progress with messages such as the following:
Initiating connection
Collecting VM inventory
Collecting vCenter references
Collecting connection server references
Collecting datastore inventory
Collecting pool inventory
Collecting desktop inventory
VMware HealthAnalyzer Installation and User Guide
© 2017 VMware, Inc. All rights reserved.
Page 29 of 54
8. If the data collection process takes a long time without updating the progress information, and you believe there is a problem, try to cancel the collection from the UI. Look for any collection-related
errors in the logs/vha.log file in the unzipped installation folder.
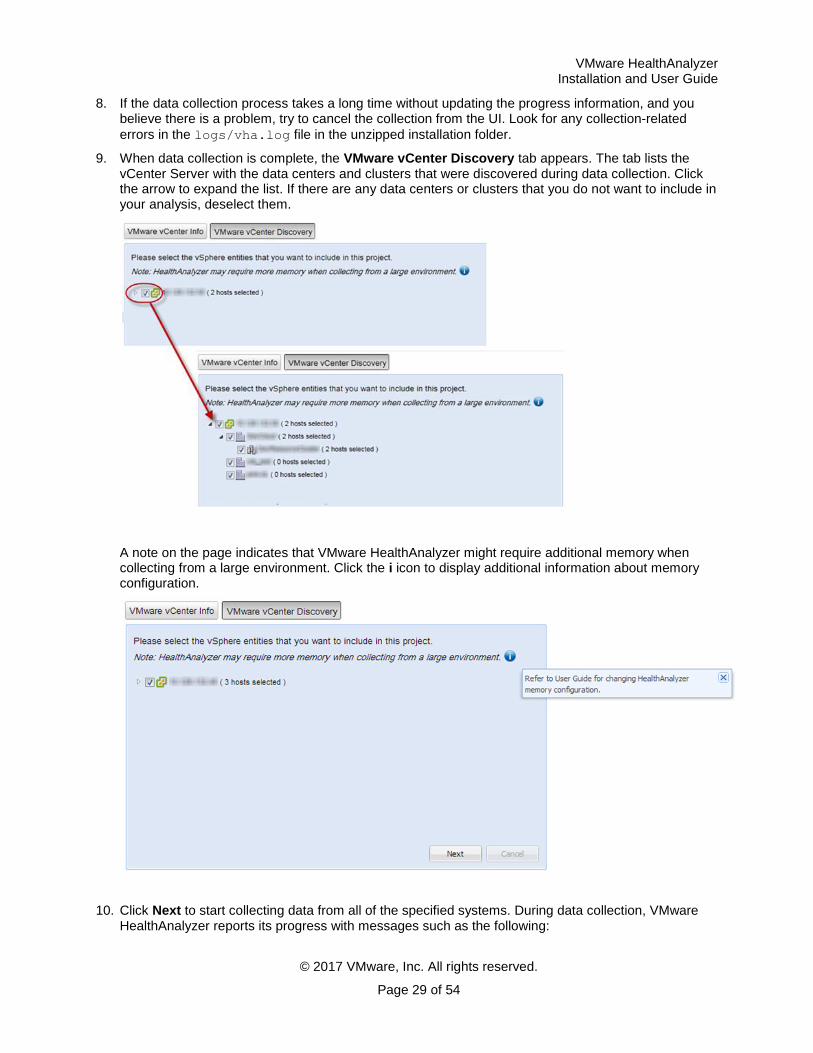
9. When data collection is complete, the VMware vCenter Discovery tab appears. The tab lists the vCenter Server with the data centers and clusters that were discovered during data collection. Click the arrow to expand the list. If there are any data centers or clusters that you do not want to include in your analysis, deselect them.
A note on the page indicates that VMware HealthAnalyzer might require additional memory when collecting from a large environment. Click the i icon to display additional information about memory configuration.
10. Click Next to start collecting data from all of the specified systems. During data collection, VMware HealthAnalyzer reports its progress with messages such as the following:
VMware HealthAnalyzer Installation and User Guide
© 2017 VMware, Inc. All rights reserved.
Page 30 of 54
Initiating connection
Collecting inventory for Datacenter[…]
Collecting HostSystem[…]
Collecting VirtualMachine[…]
Collecting Folder[…]
Collecting ResourcePool[…]
Collecting Datastore[…]
Collecting DistributedVirtualPortGroup[…]
Processing collected data
Dataset processed successfully
11. If the data collection process takes a long time without updating the progress information, and you believe there is a problem, try to cancel the collection from the UI. Look for any collection related
errors in the logs/vha.log file in the unzipped installation folder.
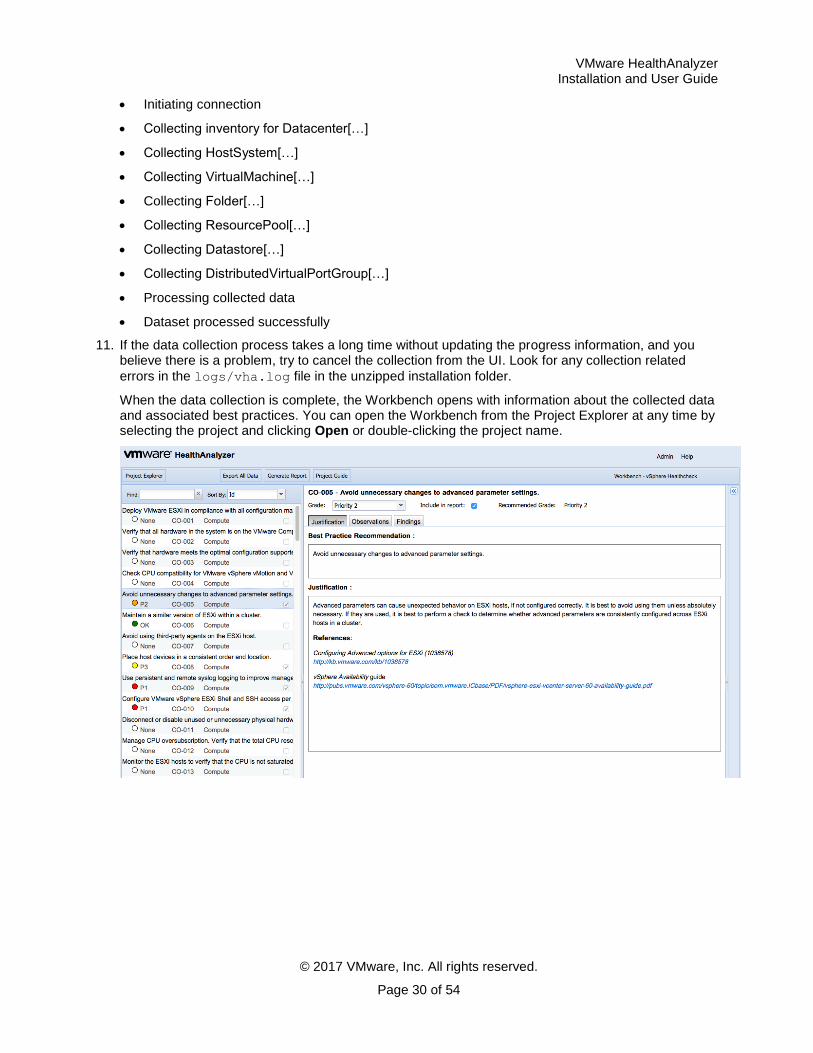
When the data collection is complete, the Workbench opens with information about the collected data and associated best practices. You can open the Workbench from the Project Explorer at any time by selecting the project and clicking Open or double-clicking the project name.
VMware HealthAnalyzer Installation and User Guide
© 2017 VMware, Inc. All rights reserved.
Page 31 of 54
To create a new project for EUC (Horizon) data collection and start collecting data
1. Click the VMware HealthAnalyzer folder where you want to create a new project.
2. Click New Project to create a new project within the folder. The Create Project dialog box appears.
3. Select EUC - Service Kit R3.1 as the project type.
4. Select the Data Collectors that are applicable for this EUC environment. Note View Connection Server, and vCenter Server are required Data Collectors and cannot be deselected.
5. Type a project name for the new project, and optionally a description and customer name.
6. Click OK.
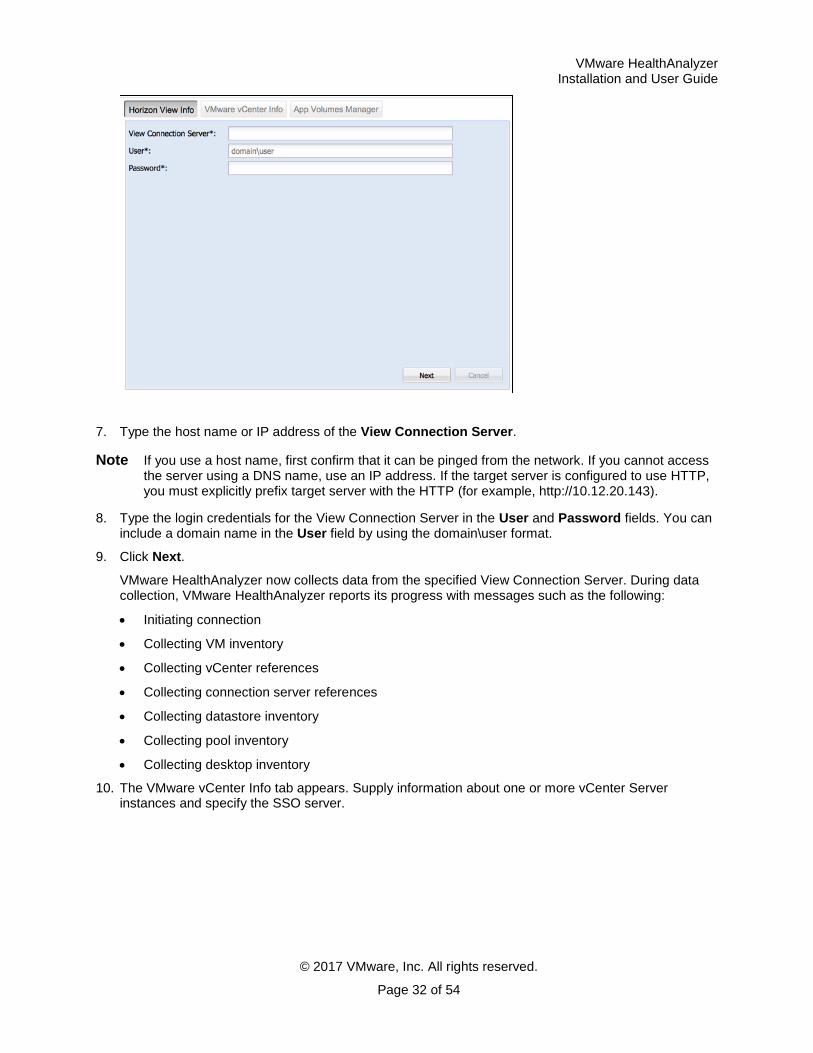
The VMware View Info tab of the project panel appears. This is where you supply the information for the View Connection Server.
VMware HealthAnalyzer Installation and User Guide
© 2017 VMware, Inc. All rights reserved.
Page 32 of 54
7. Type the host name or IP address of the View Connection Server.
Note If you use a host name, first confirm that it can be pinged from the network. If you cannot access the server using a DNS name, use an IP address. If the target server is configured to use HTTP, you must explicitly prefix target server with the HTTP (for example, http://10.12.20.143).
8. Type the login credentials for the View Connection Server in the User and Password fields. You can include a domain name in the User field by using the domain\user format.
9. Click Next.
VMware HealthAnalyzer now collects data from the specified View Connection Server. During data collection, VMware HealthAnalyzer reports its progress with messages such as the following:
Initiating connection
Collecting VM inventory
Collecting vCenter references
Collecting connection server references
Collecting datastore inventory
Collecting pool inventory
Collecting desktop inventory
10. The VMware vCenter Info tab appears. Supply information about one or more vCenter Server instances and specify the SSO server.
VMware HealthAnalyzer Installation and User Guide
© 2017 VMware, Inc. All rights reserved.
Page 33 of 54
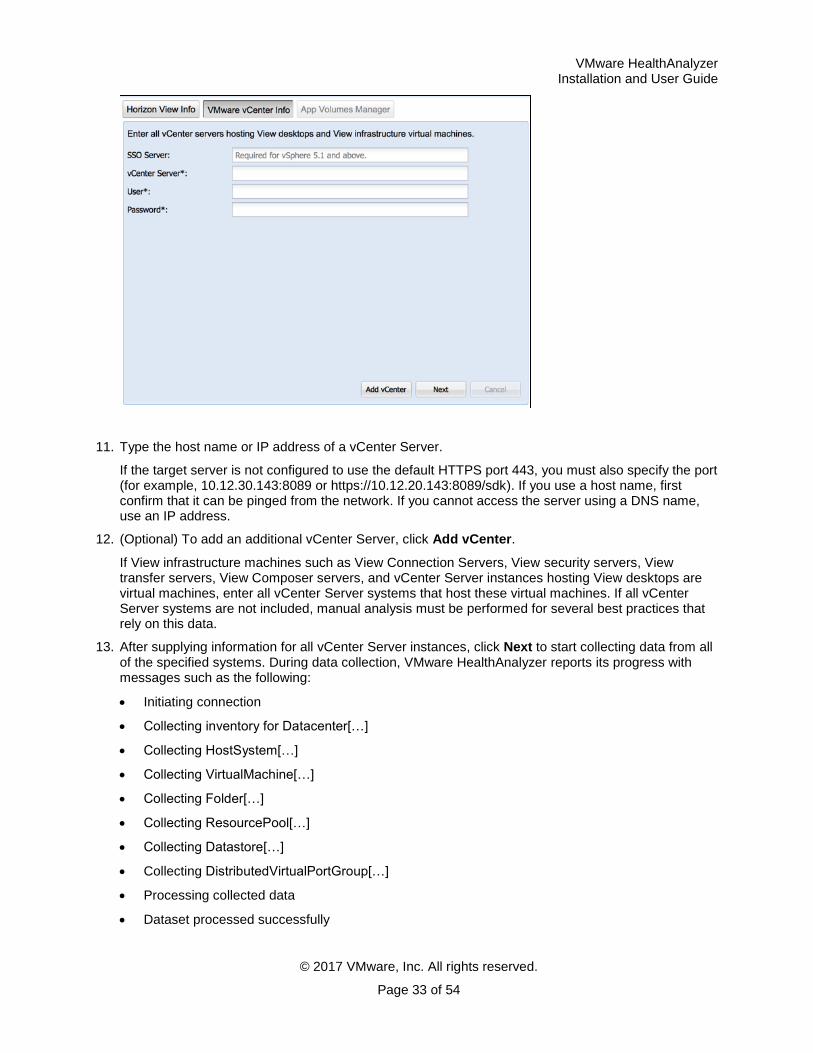
11. Type the host name or IP address of a vCenter Server.
If the target server is not configured to use the default HTTPS port 443, you must also specify the port (for example, 10.12.30.143:8089 or https://10.12.20.143:8089/sdk). If you use a host name, first confirm that it can be pinged from the network. If you cannot access the server using a DNS name, use an IP address.
12. (Optional) To add an additional vCenter Server, click Add vCenter.
If View infrastructure machines such as View Connection Servers, View security servers, View transfer servers, View Composer servers, and vCenter Server instances hosting View desktops are virtual machines, enter all vCenter Server systems that host these virtual machines. If all vCenter Server systems are not included, manual analysis must be performed for several best practices that rely on this data.
13. After supplying information for all vCenter Server instances, click Next to start collecting data from all of the specified systems. During data collection, VMware HealthAnalyzer reports its progress with messages such as the following:
Initiating connection
Collecting inventory for Datacenter[…]
Collecting HostSystem[…]
Collecting VirtualMachine[…]
Collecting Folder[…]
Collecting ResourcePool[…]
Collecting Datastore[…]
Collecting DistributedVirtualPortGroup[…]
Processing collected data
Dataset processed successfully
VMware HealthAnalyzer Installation and User Guide
© 2017 VMware, Inc. All rights reserved.
Page 34 of 54
14. The App Volumes Manager tab appears. Supply information about the App Volumes Manager. If the App Volumes Manager servers are behind a load balancer, enter the load balancer information instead. Note: If App Volumes Manager Data Collector was not selected in the Create Project step, HealthAnalyzer will not prompt for App Volumes Manager information.
15. If the data collection process takes a long time without updating the progress information, and you believe there is a problem, try to cancel the collection from the UI. Look for any collection-related
errors in the logs/vha.log file in the unzipped installation folder.
When the data collection is complete, the Workbench appears with information about the best practices associated with View, and the project’s data collected from the View Connection Server instances and related vCenter Server installations. You can open the Workbench from the Project Explorer at any time by selecting the project and clicking Open or double-clicking the project name.
VMware HealthAnalyzer Installation and User Guide
© 2017 VMware, Inc. All rights reserved.
Page 35 of 54
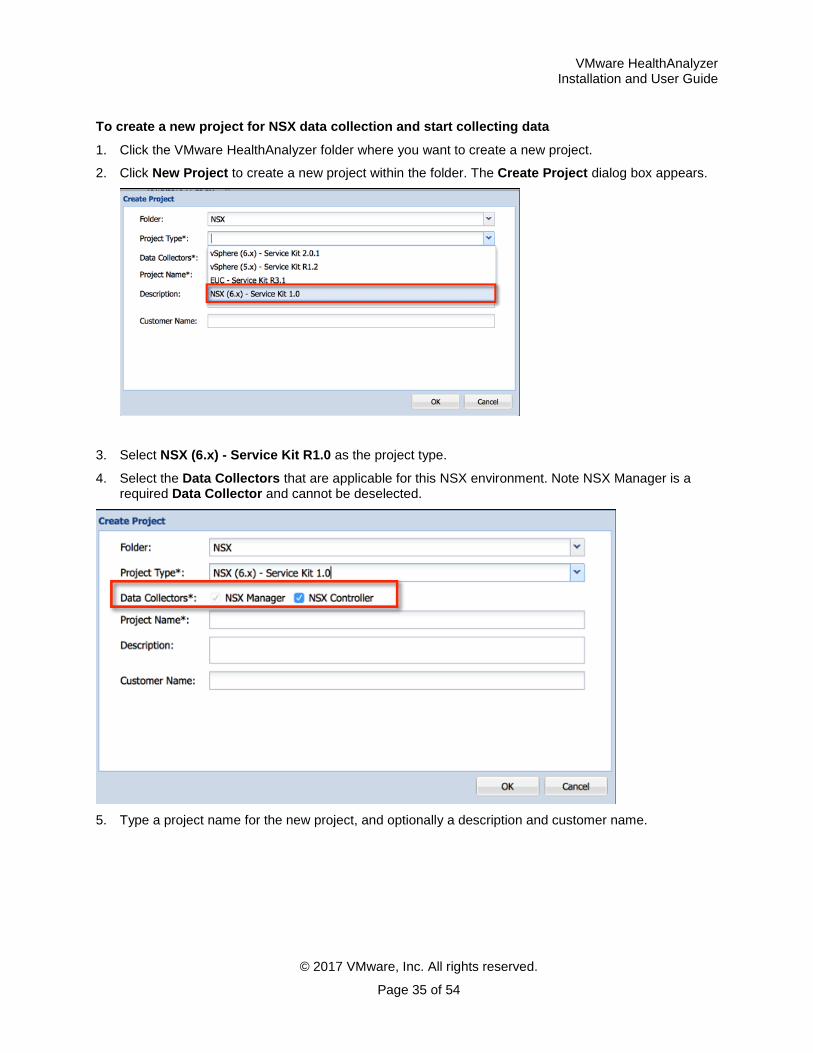
To create a new project for NSX data collection and start collecting data
1. Click the VMware HealthAnalyzer folder where you want to create a new project.
2. Click New Project to create a new project within the folder. The Create Project dialog box appears.
3. Select NSX (6.x) - Service Kit R1.0 as the project type.
4. Select the Data Collectors that are applicable for this NSX environment. Note NSX Manager is a required Data Collector and cannot be deselected.
5. Type a project name for the new project, and optionally a description and customer name.
VMware HealthAnalyzer Installation and User Guide
© 2017 VMware, Inc. All rights reserved.
Page 36 of 54
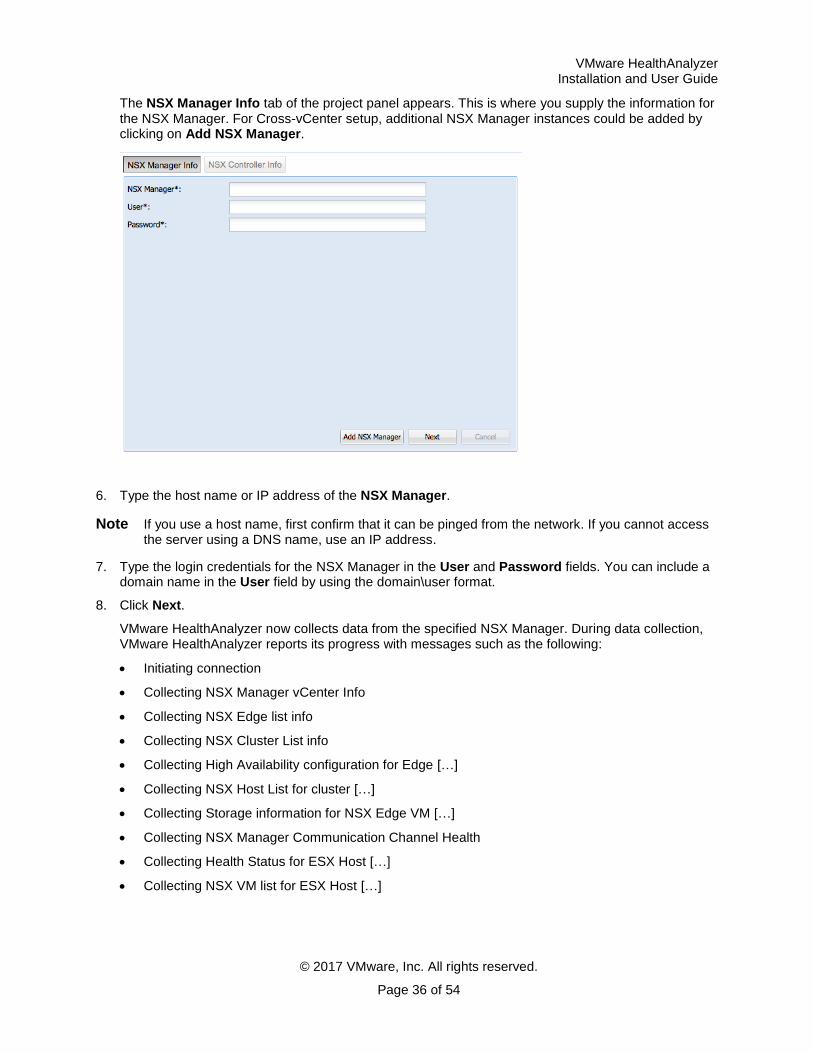
The NSX Manager Info tab of the project panel appears. This is where you supply the information for the NSX Manager. For Cross-vCenter setup, additional NSX Manager instances could be added by clicking on Add NSX Manager.
6. Type the host name or IP address of the NSX Manager.
Note If you use a host name, first confirm that it can be pinged from the network. If you cannot access the server using a DNS name, use an IP address.
7. Type the login credentials for the NSX Manager in the User and Password fields. You can include a domain name in the User field by using the domain\user format.
8. Click Next.
VMware HealthAnalyzer now collects data from the specified NSX Manager. During data collection, VMware HealthAnalyzer reports its progress with messages such as the following:
Initiating connection
Collecting NSX Manager vCenter Info
Collecting NSX Edge list info
Collecting NSX Cluster List info
Collecting High Availability configuration for Edge […]
Collecting NSX Host List for cluster […]
Collecting Storage information for NSX Edge VM […]
Collecting NSX Manager Communication Channel Health
Collecting Health Status for ESX Host […]
Collecting NSX VM list for ESX Host […]
VMware HealthAnalyzer Installation and User Guide
© 2017 VMware, Inc. All rights reserved.
Page 37 of 54
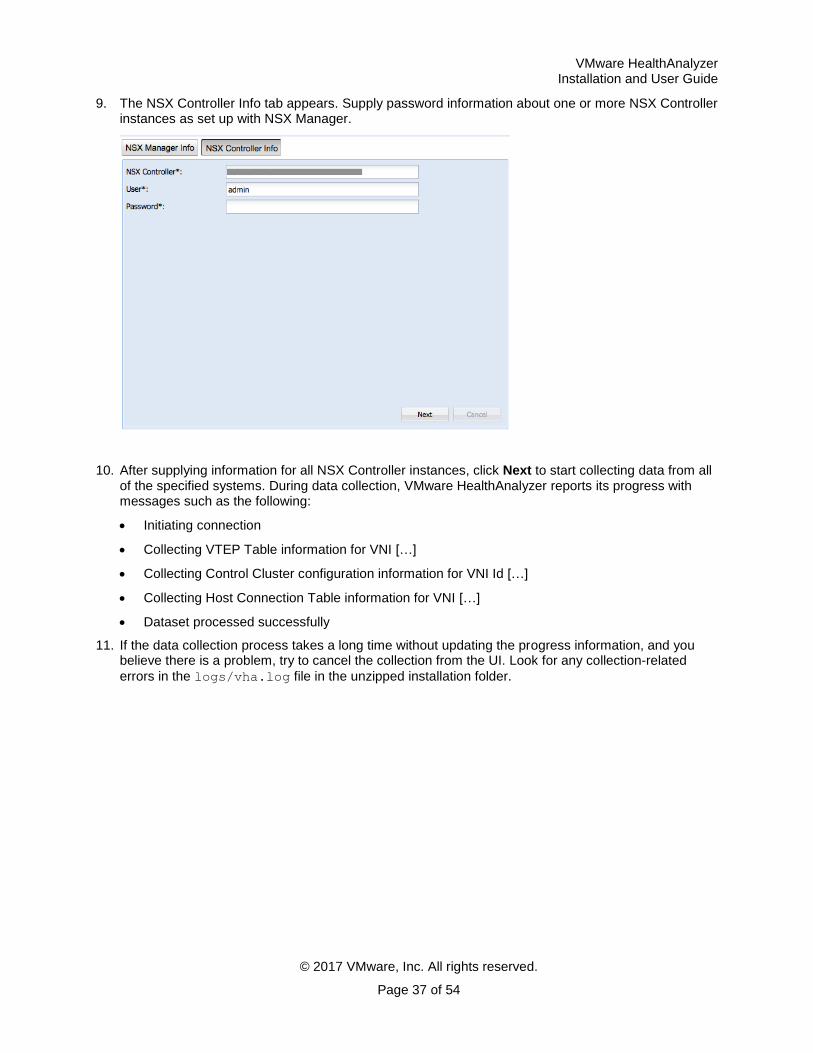
9. The NSX Controller Info tab appears. Supply password information about one or more NSX Controller instances as set up with NSX Manager.
10. After supplying information for all NSX Controller instances, click Next to start collecting data from all of the specified systems. During data collection, VMware HealthAnalyzer reports its progress with messages such as the following:
Initiating connection
Collecting VTEP Table information for VNI […]
Collecting Control Cluster configuration information for VNI Id […]
Collecting Host Connection Table information for VNI […]
Dataset processed successfully
11. If the data collection process takes a long time without updating the progress information, and you believe there is a problem, try to cancel the collection from the UI. Look for any collection-related
errors in the logs/vha.log file in the unzipped installation folder.
VMware HealthAnalyzer Installation and User Guide
© 2017 VMware, Inc. All rights reserved.
Page 38 of 54
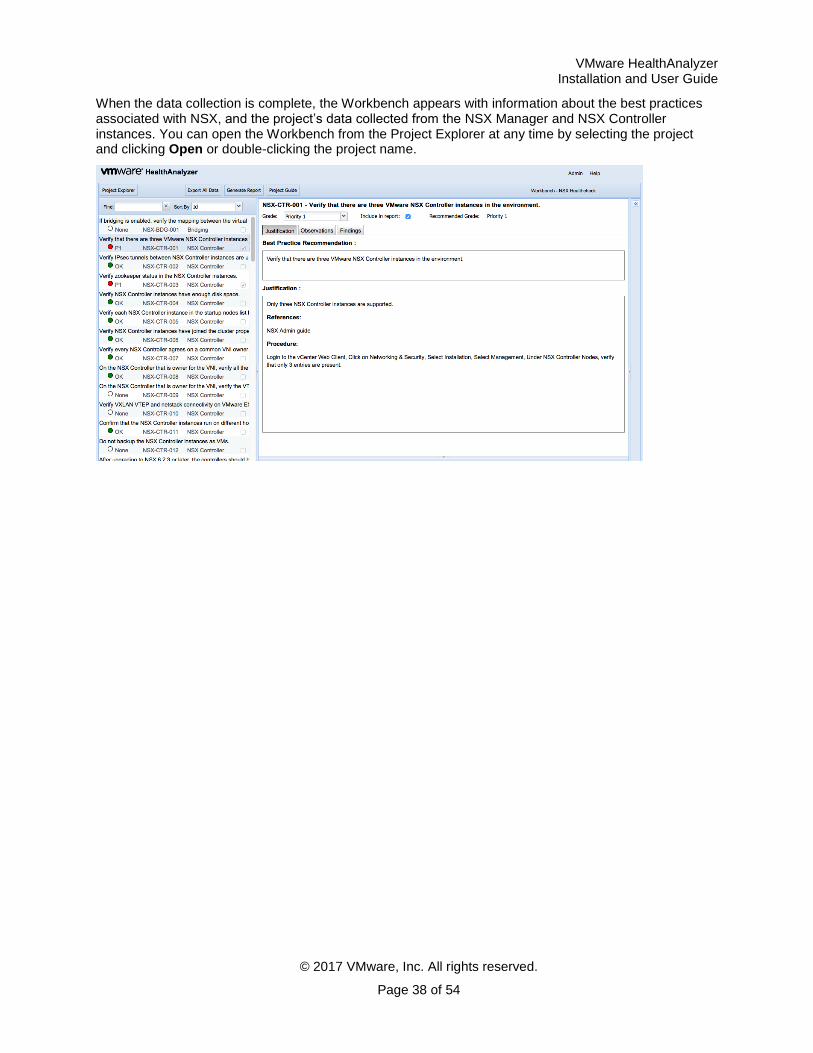
When the data collection is complete, the Workbench appears with information about the best practices associated with NSX, and the project’s data collected from the NSX Manager and NSX Controller instances. You can open the Workbench from the Project Explorer at any time by selecting the project and clicking Open or double-clicking the project name.
VMware HealthAnalyzer Installation and User Guide
© 2017 VMware, Inc. All rights reserved.
Page 39 of 54
3.2.3 Managing Projects
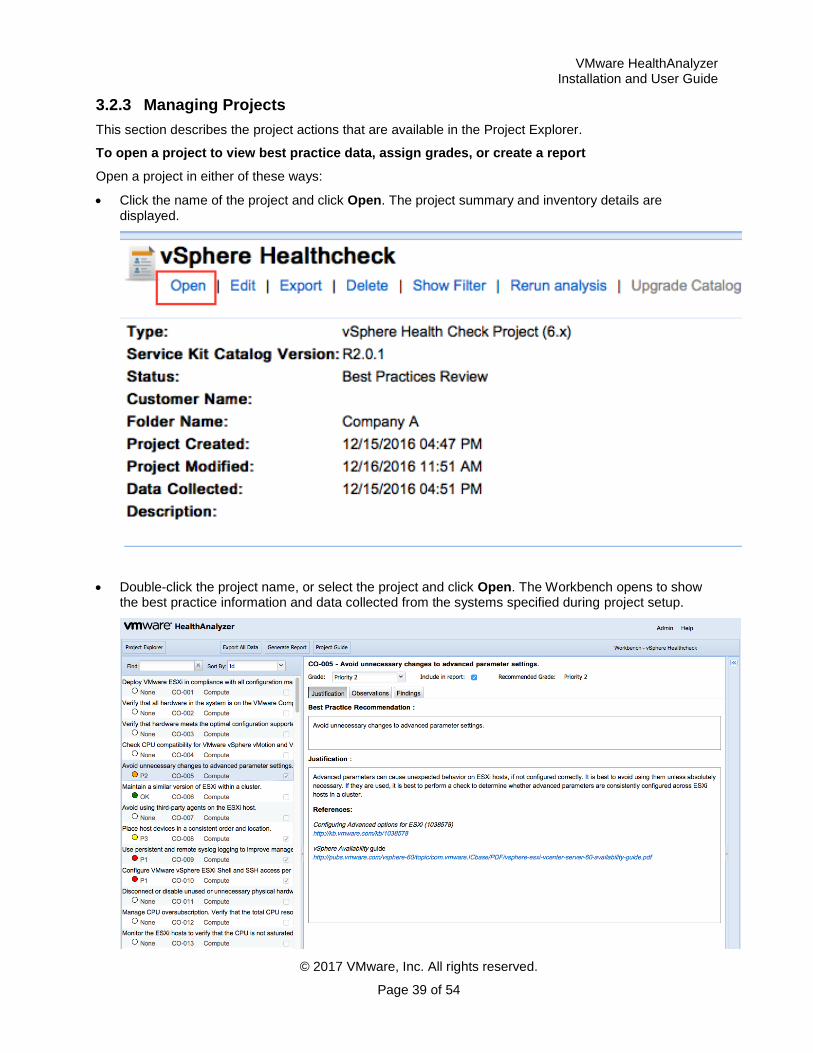
This section describes the project actions that are available in the Project Explorer.
To open a project to view best practice data, assign grades, or create a report
Open a project in either of these ways:
Click the name of the project and click Open. The project summary and inventory details are displayed.
Double-click the project name, or select the project and click Open. The Workbench opens to show the best practice information and data collected from the systems specified during project setup.
VMware HealthAnalyzer Installation and User Guide
© 2017 VMware, Inc. All rights reserved.
Page 40 of 54
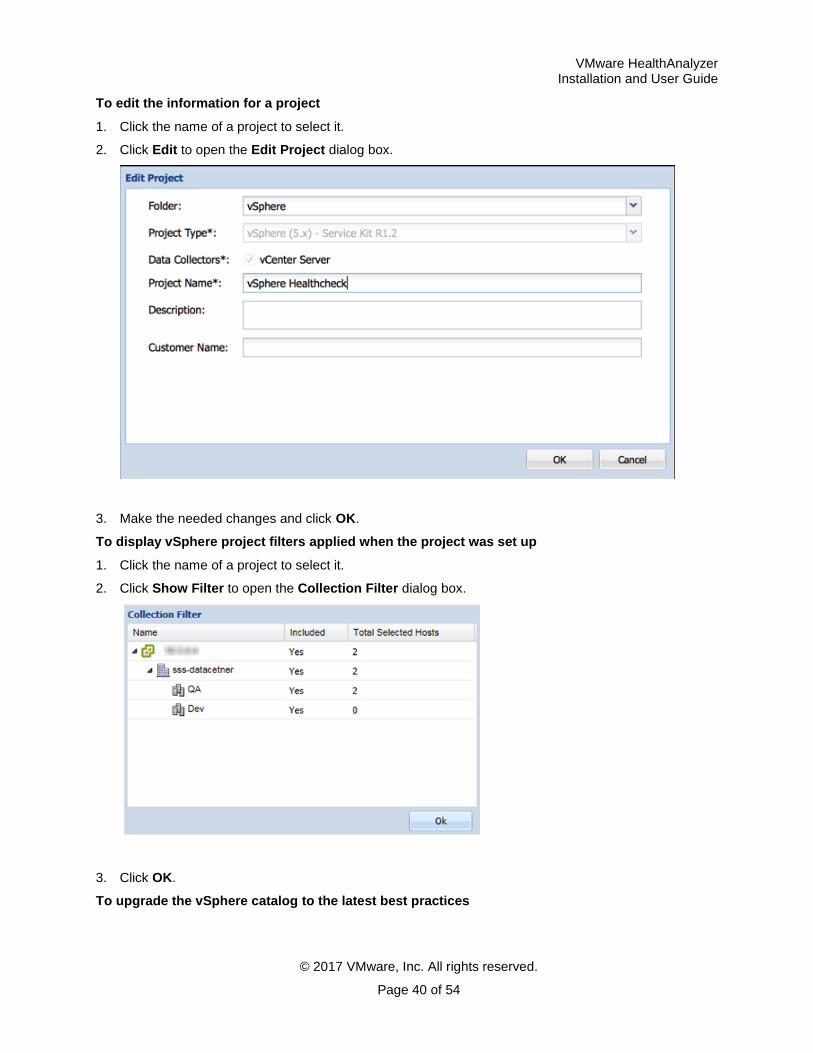
To edit the information for a project
1. Click the name of a project to select it.
2. Click Edit to open the Edit Project dialog box.
3. Make the needed changes and click OK.
To display vSphere project filters applied when the project was set up
1. Click the name of a project to select it.
2. Click Show Filter to open the Collection Filter dialog box.
3. Click OK.
To upgrade the vSphere catalog to the latest best practices
VMware HealthAnalyzer Installation and User Guide
© 2017 VMware, Inc. All rights reserved.
Page 41 of 54
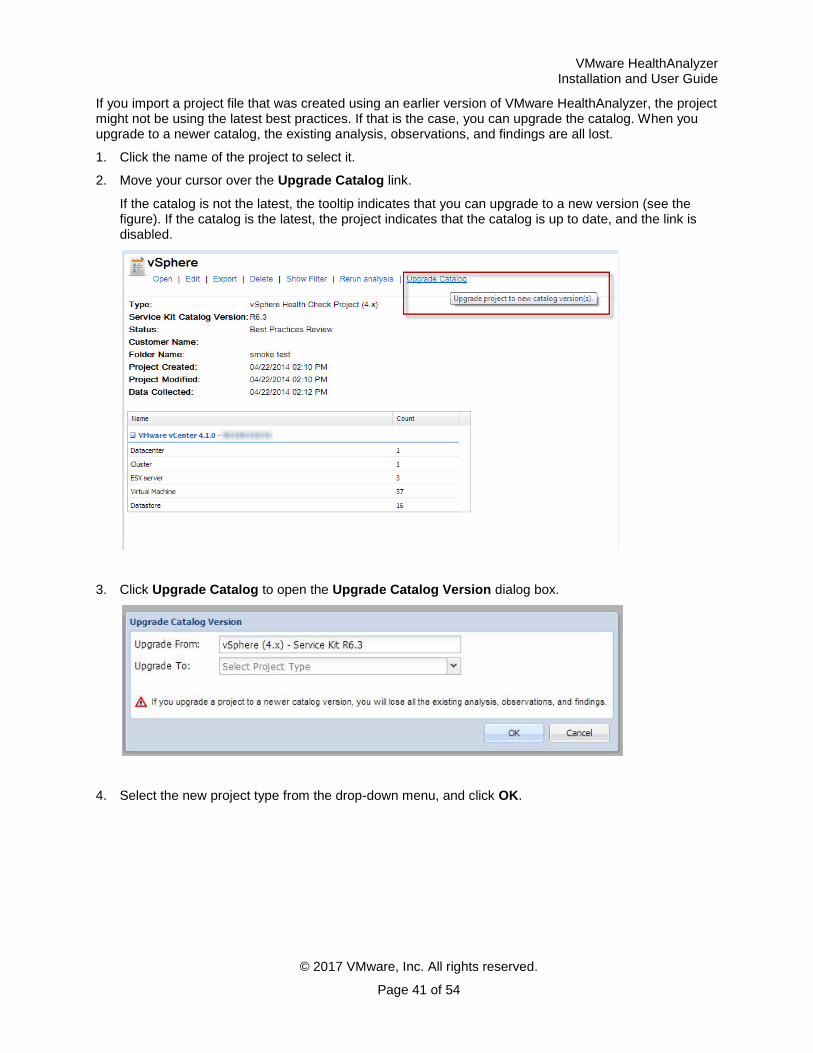
If you import a project file that was created using an earlier version of VMware HealthAnalyzer, the project might not be using the latest best practices. If that is the case, you can upgrade the catalog. When you upgrade to a newer catalog, the existing analysis, observations, and findings are all lost.
1. Click the name of the project to select it.
2. Move your cursor over the Upgrade Catalog link.
If the catalog is not the latest, the tooltip indicates that you can upgrade to a new version (see the figure). If the catalog is the latest, the project indicates that the catalog is up to date, and the link is disabled.
3. Click Upgrade Catalog to open the Upgrade Catalog Version dialog box.
4. Select the new project type from the drop-down menu, and click OK.
VMware HealthAnalyzer Installation and User Guide
© 2017 VMware, Inc. All rights reserved.
Page 42 of 54
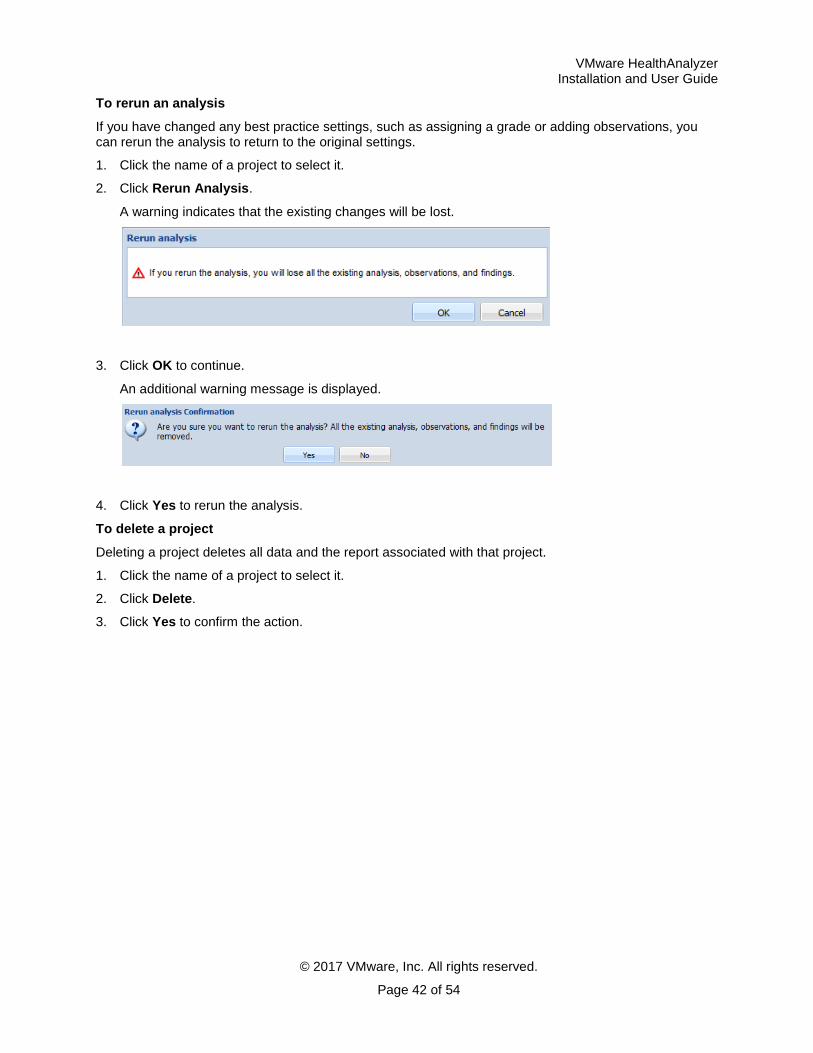
To rerun an analysis
If you have changed any best practice settings, such as assigning a grade or adding observations, you can rerun the analysis to return to the original settings.
1. Click the name of a project to select it.
2. Click Rerun Analysis.
A warning indicates that the existing changes will be lost.
3. Click OK to continue.
An additional warning message is displayed.
4. Click Yes to rerun the analysis.
To delete a project
Deleting a project deletes all data and the report associated with that project.
1. Click the name of a project to select it.
2. Click Delete.
3. Click Yes to confirm the action.
VMware HealthAnalyzer Installation and User Guide
© 2017 VMware, Inc. All rights reserved.
Page 43 of 54
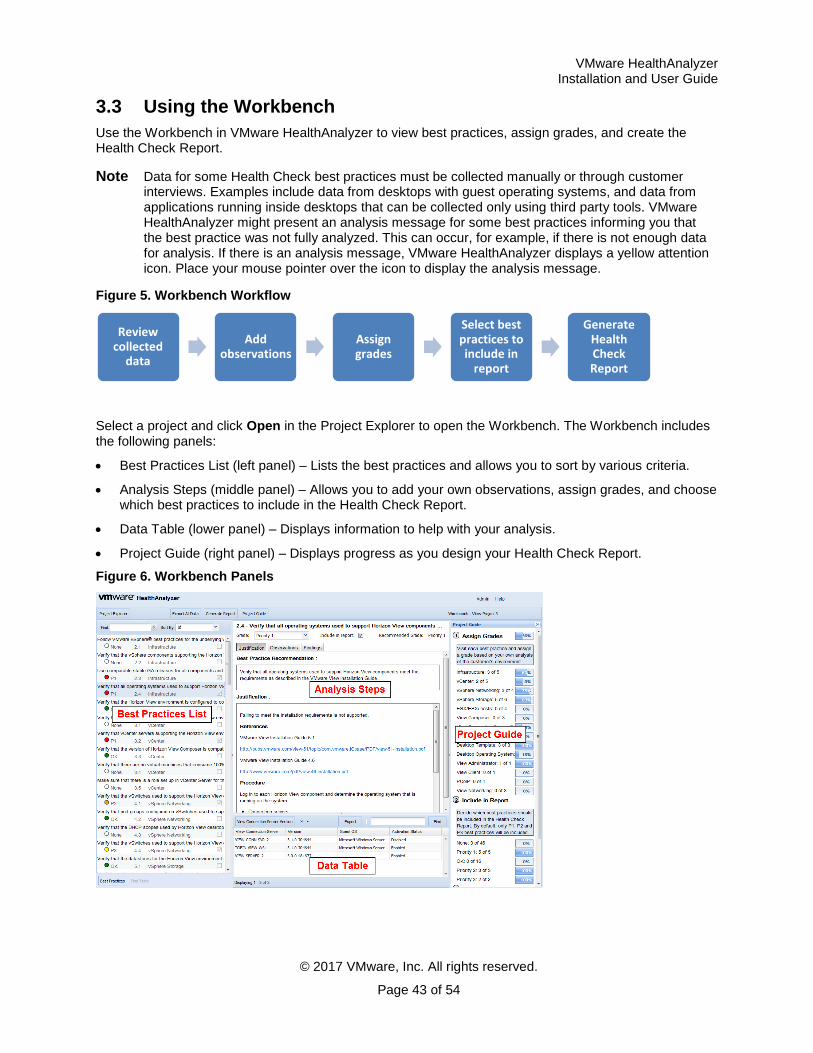
3.3 Using the Workbench
Use the Workbench in VMware HealthAnalyzer to view best practices, assign grades, and create the Health Check Report.
Note Data for some Health Check best practices must be collected manually or through customer interviews. Examples include data from desktops with guest operating systems, and data from applications running inside desktops that can be collected only using third party tools. VMware HealthAnalyzer might present an analysis message for some best practices informing you that the best practice was not fully analyzed. This can occur, for example, if there is not enough data for analysis. If there is an analysis message, VMware HealthAnalyzer displays a yellow attention icon. Place your mouse pointer over the icon to display the analysis message.
Figure 5. Workbench Workflow
Select a project and click Open in the Project Explorer to open the Workbench. The Workbench includes the following panels:
Best Practices List (left panel) – Lists the best practices and allows you to sort by various criteria.
Analysis Steps (middle panel) – Allows you to add your own observations, assign grades, and choose which best practices to include in the Health Check Report.
Data Table (lower panel) – Displays information to help with your analysis.
Project Guide (right panel) – Displays progress as you design your Health Check Report.
Figure 6. Workbench Panels
Review collected
data
Add observations
Assign grades
Select best practices to include in
report
Generate Health Check Report
VMware HealthAnalyzer Installation and User Guide
© 2017 VMware, Inc. All rights reserved.
Page 44 of 54
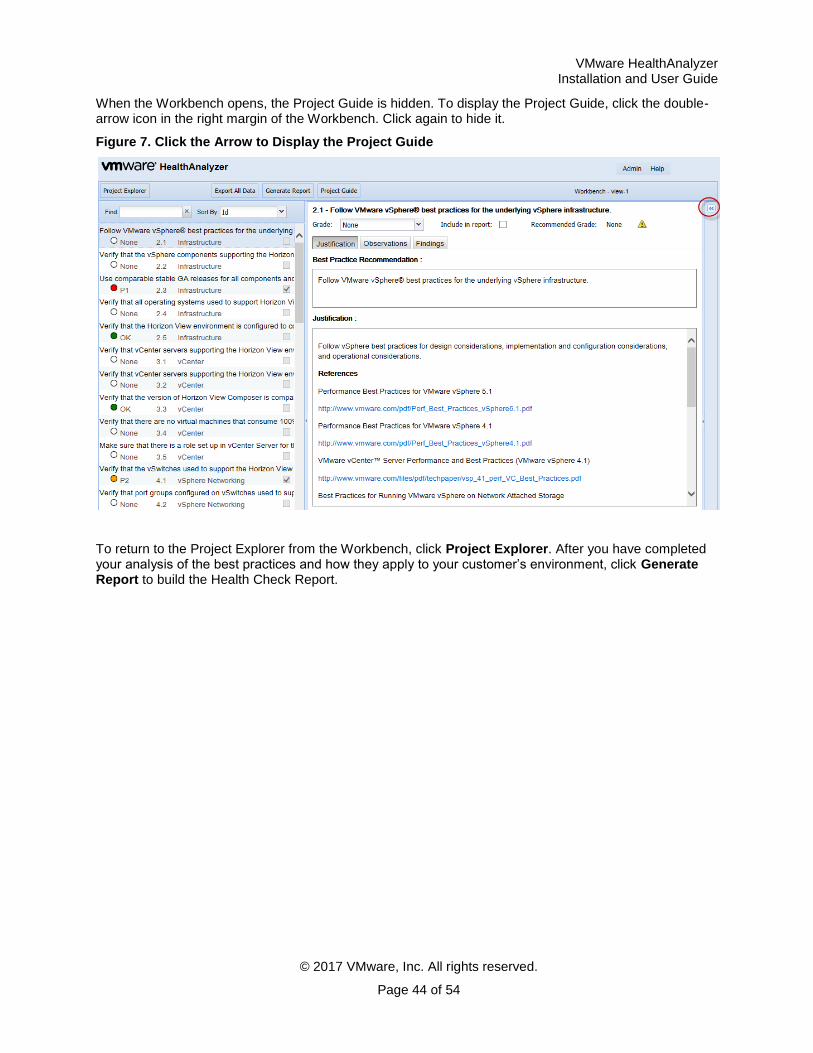
When the Workbench opens, the Project Guide is hidden. To display the Project Guide, click the double-arrow icon in the right margin of the Workbench. Click again to hide it.
Figure 7. Click the Arrow to Display the Project Guide
To return to the Project Explorer from the Workbench, click Project Explorer. After you have completed your analysis of the best practices and how they apply to your customer’s environment, click Generate Report to build the Health Check Report.
VMware HealthAnalyzer Installation and User Guide
© 2017 VMware, Inc. All rights reserved.
Page 45 of 54
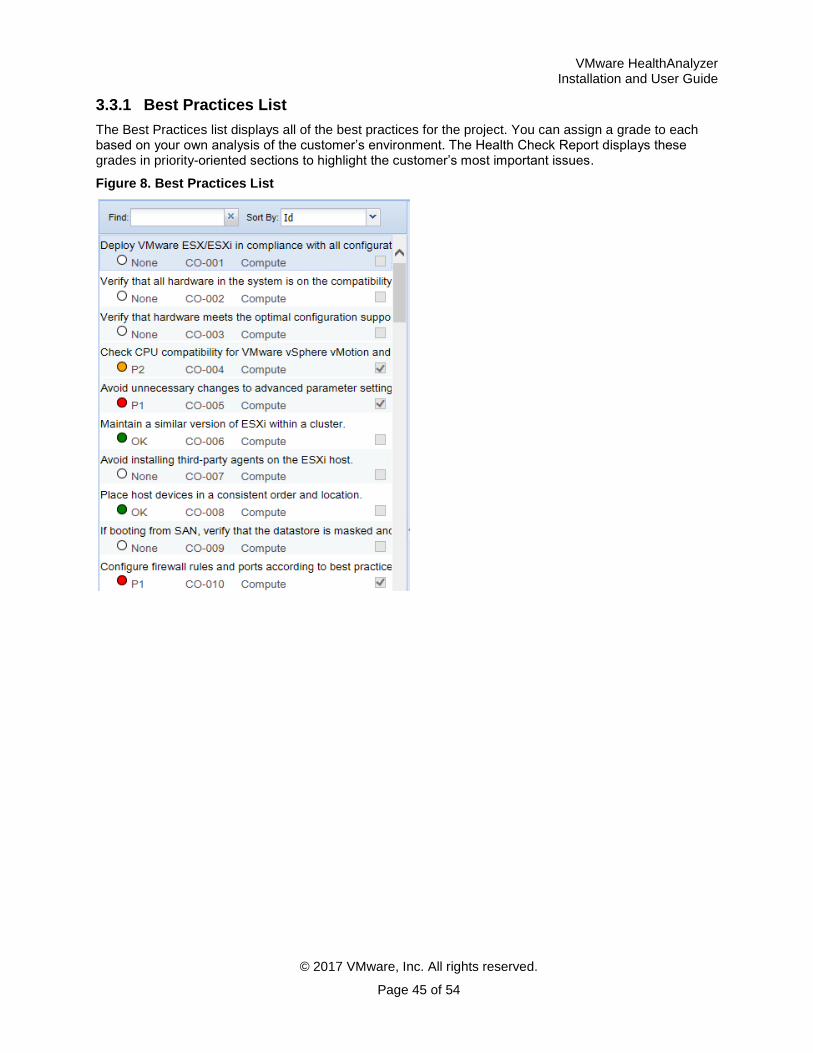
3.3.1 Best Practices List
The Best Practices list displays all of the best practices for the project. You can assign a grade to each based on your own analysis of the customer’s environment. The Health Check Report displays these grades in priority-oriented sections to highlight the customer’s most important issues.
Figure 8. Best Practices List
VMware HealthAnalyzer Installation and User Guide
© 2017 VMware, Inc. All rights reserved.
Page 46 of 54
3.3.1.1. Searching for Best Practice Data
The Find box in the Best Practices list filters the display of best practices according to keywords that you type.
You can sort by the following using the Sort By drop-down menu:
ID – The identifier of the best practice.
Grade – The assigned grade as it applies to the customer’s environment.
In Report – The best practices that you have included in the report
Component – The component grouping of best practices, such as View Client and View Composer for View or Compute and Datacenter for vSphere.
Note Changes to the Best Practices list that you make with the Find box and the Sort By drop-down menu affect only the display in the Best Practices List, not the format of the Health Check Report.
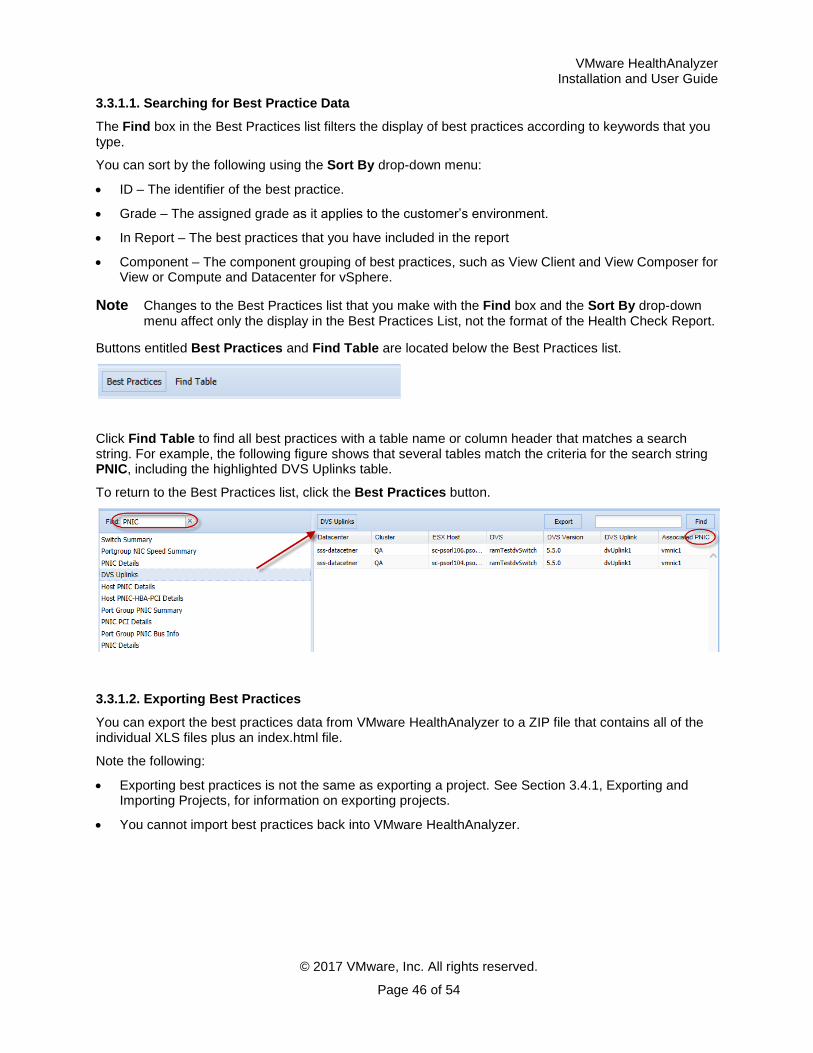
Buttons entitled Best Practices and Find Table are located below the Best Practices list.
Click Find Table to find all best practices with a table name or column header that matches a search string. For example, the following figure shows that several tables match the criteria for the search string PNIC, including the highlighted DVS Uplinks table.
To return to the Best Practices list, click the Best Practices button.
3.3.1.2. Exporting Best Practices
You can export the best practices data from VMware HealthAnalyzer to a ZIP file that contains all of the individual XLS files plus an index.html file.
Note the following:
Exporting best practices is not the same as exporting a project. See Section 3.4.1, Exporting and Importing Projects, for information on exporting projects.
You cannot import best practices back into VMware HealthAnalyzer.
VMware HealthAnalyzer Installation and User Guide
© 2017 VMware, Inc. All rights reserved.
Page 47 of 54
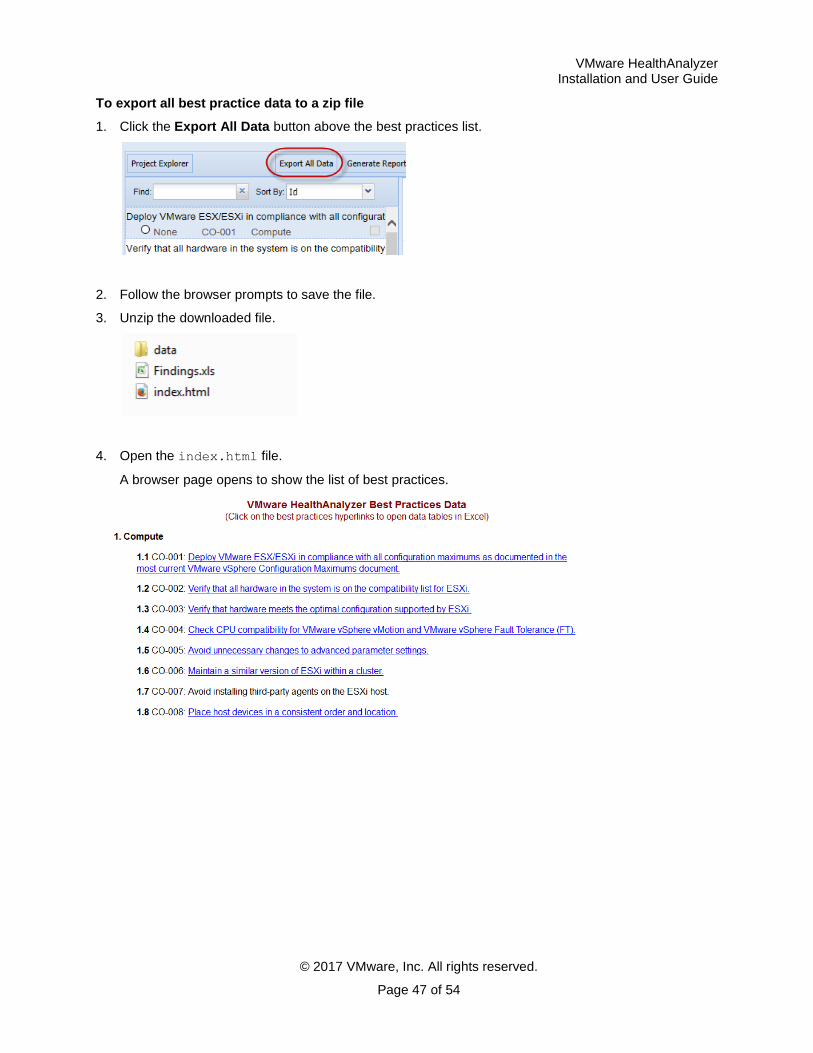
To export all best practice data to a zip file
1. Click the Export All Data button above the best practices list.
2. Follow the browser prompts to save the file.
3. Unzip the downloaded file.
4. Open the index.html file.
A browser page opens to show the list of best practices.
VMware HealthAnalyzer Installation and User Guide
© 2017 VMware, Inc. All rights reserved.
Page 48 of 54
5. Click a link to open the XLS file (Microsoft Excel format) for that best practice. The spreadsheet contains a worksheet for each of the tables associated with that best practice, plus a worksheet for the best practice findings.
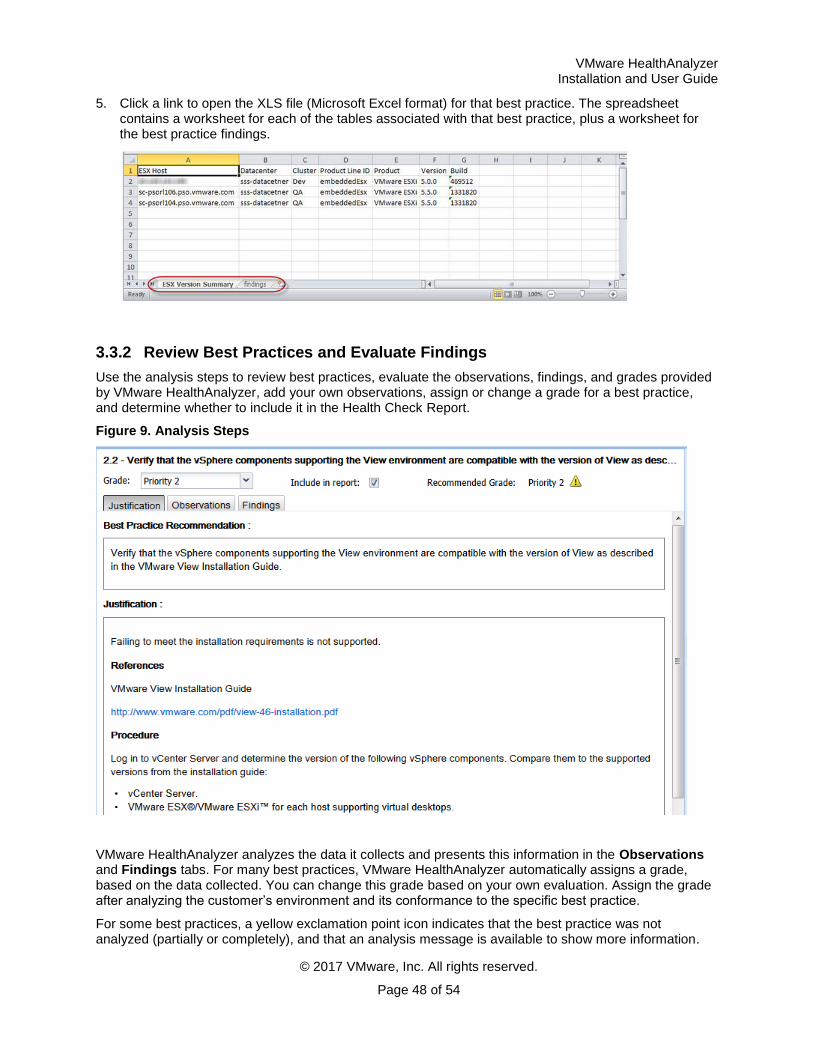
3.3.2 Review Best Practices and Evaluate Findings
Use the analysis steps to review best practices, evaluate the observations, findings, and grades provided by VMware HealthAnalyzer, add your own observations, assign or change a grade for a best practice, and determine whether to include it in the Health Check Report.
Figure 9. Analysis Steps
VMware HealthAnalyzer analyzes the data it collects and presents this information in the Observations and Findings tabs. For many best practices, VMware HealthAnalyzer automatically assigns a grade, based on the data collected. You can change this grade based on your own evaluation. Assign the grade after analyzing the customer’s environment and its conformance to the specific best practice.
For some best practices, a yellow exclamation point icon indicates that the best practice was not analyzed (partially or completely), and that an analysis message is available to show more information.
VMware HealthAnalyzer Installation and User Guide
© 2017 VMware, Inc. All rights reserved.
Page 49 of 54
Hover your mouse pointer over the icon or click it to display the analysis message. This icon is visible in the following situations:
The best practice was not analyzed because associated data could not be collected completely.
The best practice was partially analyzed because associated data could not be collected for the other non-analyzed part.
VMware HealthAnalyzer uses the following grades for each best practice.
Table 1. Grade Priority Categories
Priority Definition
None Does not have a grade assigned.
Priority 1 (P1) Requires immediate attention (includes actions to address it).
Priority 2 (P2) Is of potential concern (non-critical, or requires further investigation).
Priority 3 (P3) Deviates from best practices, but is not high priority.
OK Conforms to best practices. No concerns were noted.
No data Unable to gather data to evaluate.
Not applicable Is not applicable.
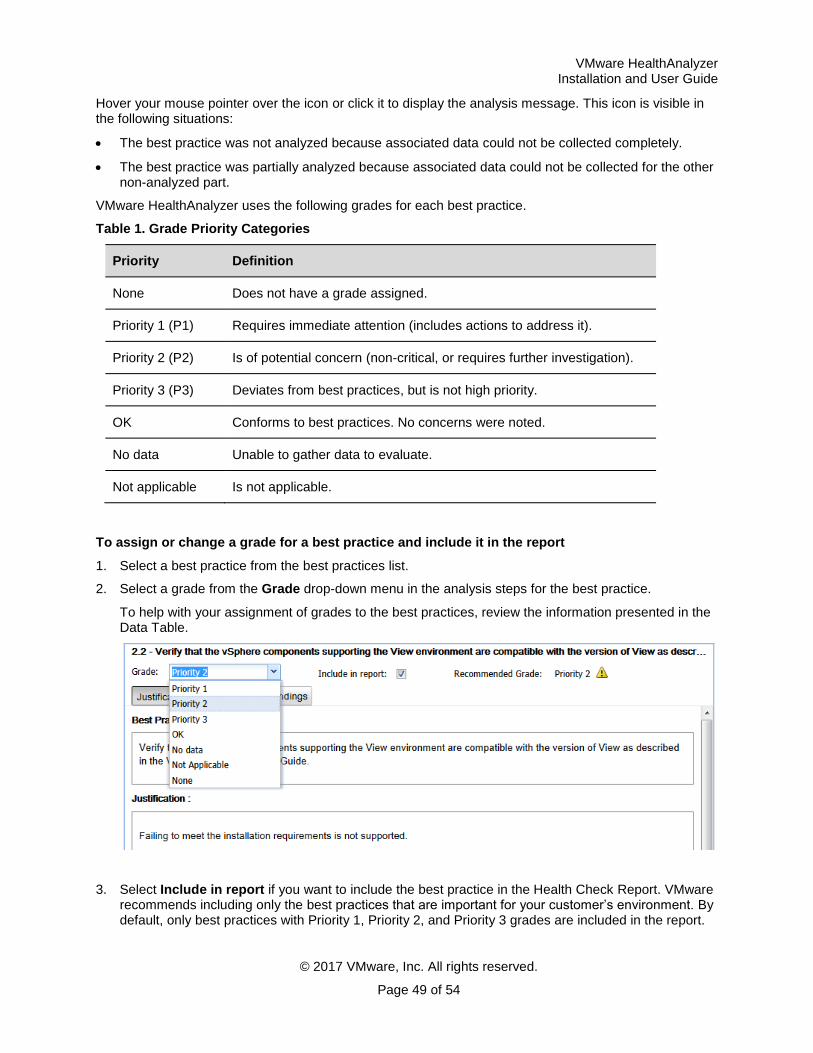
To assign or change a grade for a best practice and include it in the report
1. Select a best practice from the best practices list.
2. Select a grade from the Grade drop-down menu in the analysis steps for the best practice.
To help with your assignment of grades to the best practices, review the information presented in the Data Table.
3. Select Include in report if you want to include the best practice in the Health Check Report. VMware recommends including only the best practices that are important for your customer’s environment. By default, only best practices with Priority 1, Priority 2, and Priority 3 grades are included in the report.
VMware HealthAnalyzer Installation and User Guide
© 2017 VMware, Inc. All rights reserved.
Page 50 of 54
The Justification tab displays the rationale behind the best practice. For some best practices, it provides information that further qualifies an issue, or tells you how to verify or resolve an issue. Active links to references are given, if applicable. The justification cannot be edited.
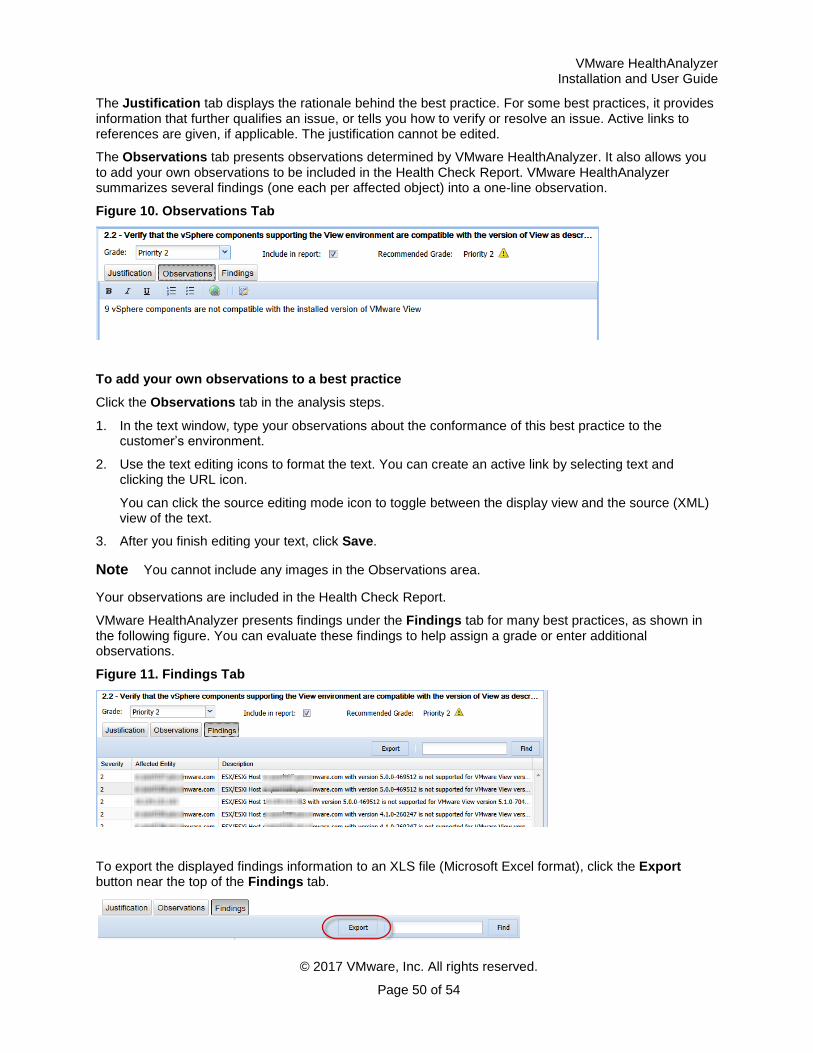
The Observations tab presents observations determined by VMware HealthAnalyzer. It also allows you to add your own observations to be included in the Health Check Report. VMware HealthAnalyzer summarizes several findings (one each per affected object) into a one-line observation.
Figure 10. Observations Tab
To add your own observations to a best practice
Click the Observations tab in the analysis steps.
1. In the text window, type your observations about the conformance of this best practice to the customer’s environment.
2. Use the text editing icons to format the text. You can create an active link by selecting text and clicking the URL icon.
You can click the source editing mode icon to toggle between the display view and the source (XML) view of the text.
3. After you finish editing your text, click Save.
Note You cannot include any images in the Observations area.
Your observations are included in the Health Check Report.
VMware HealthAnalyzer presents findings under the Findings tab for many best practices, as shown in the following figure. You can evaluate these findings to help assign a grade or enter additional observations.
Figure 11. Findings Tab
To export the displayed findings information to an XLS file (Microsoft Excel format), click the Export button near the top of the Findings tab.
VMware HealthAnalyzer Installation and User Guide
© 2017 VMware, Inc. All rights reserved.
Page 51 of 54
3.3.3 Use the Data Table
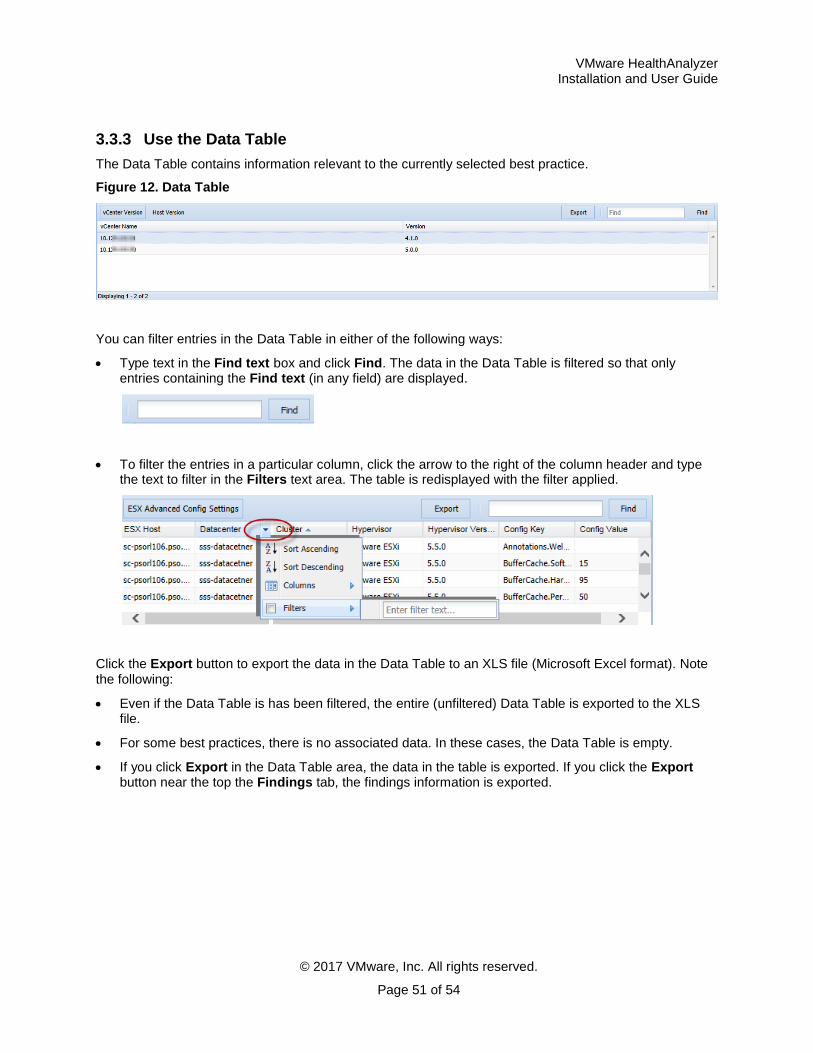
The Data Table contains information relevant to the currently selected best practice.
Figure 12. Data Table
You can filter entries in the Data Table in either of the following ways:
Type text in the Find text box and click Find. The data in the Data Table is filtered so that only entries containing the Find text (in any field) are displayed.
To filter the entries in a particular column, click the arrow to the right of the column header and type the text to filter in the Filters text area. The table is redisplayed with the filter applied.
Click the Export button to export the data in the Data Table to an XLS file (Microsoft Excel format). Note the following:
Even if the Data Table is has been filtered, the entire (unfiltered) Data Table is exported to the XLS file.
For some best practices, there is no associated data. In these cases, the Data Table is empty.
If you click Export in the Data Table area, the data in the table is exported. If you click the Export button near the top the Findings tab, the findings information is exported.

VMware HealthAnalyzer Installation and User Guide
© 2017 VMware, Inc. All rights reserved.
Page 52 of 54
3.3.4 Use the Project Guide to View Progress
The Project Guide displays your progress in constructing the Health Check Report. To display the Project Guide, click the double-arrow icon in the right margin of the Workbench. Click again to hide the guide.
Figure 13. Project Guide
The Assign Grades section shows the progress of each group of best practices. The Include in Report section shows the overall structure of the report, based on which best practices are selected to appear in the report.
The Generate Report section alerts you to review the Health Check Report before giving it to the customer. Review each best practice listed in the report, and the grade you have assigned, to determine whether it accurately reflects the customer’s environment.
3.3.5 Generate the Health Check Report
After you have reviewed each best practice, assigned grades, entered your own observations, and determined which best practices to include in the report, generate the Health Check Report.
The Health Check Report is a Microsoft Word document. Before presenting it to your customer, review and edit it using Microsoft Word or another compatible application.
VMware HealthAnalyzer Installation and User Guide
© 2017 VMware, Inc. All rights reserved.
Page 53 of 54
To generate the Health Check Report
1. In the Workbench, click Generate Report.
2. VMware HealthAnalyzer displays an open/save dialog box that differs depending on which browser you use. Save the report to your disk. Depending on which browser you use, the Health Check
Report might be saved in your Downloads folder, or another dialog box might be displayed where
you can type your name for the saved file.
3. Locate the Health Check Report file. Double-click it to open it in Microsoft Word.
4. Review and edit the Health Check Report as necessary before presenting it to your customer.
VMware Solution Providers delivering the report on their own paper should replace the VMware cover with a cover that has their company’s branding, and replace or delete the VMware copyright and trademark statements in the report footers.
3.4 Importing and Exporting Projects and Log Files
3.4.1 Exporting and Importing Projects
You can export a project from VMware HealthAnalyzer for later import. You can import a project to an existing project, or you can create a new project prior to import.
For example, you might export a project created at a customer site so that you can import it and continue working with it on your own machine. If you have a project from a previous engagement with the same customer, you can import and compare it with current data to see how the customer environment changed. You can also export a project to provide to Support for assistance in troubleshooting.
To export a project
When you export a project, the project is stored in a binary file. This file can be copied to another computer, for example, to review after you leave a customer site.
1. In the Project Explorer, click the name of the project you want to export.
2. Click Export and follow the prompts to save the project to your disk.
Note The exact procedure for saving a file differs depending on which browser you use to access VMware HealthAnalyzer.
VMware HealthAnalyzer Installation and User Guide
© 2017 VMware, Inc. All rights reserved.
Page 54 of 54
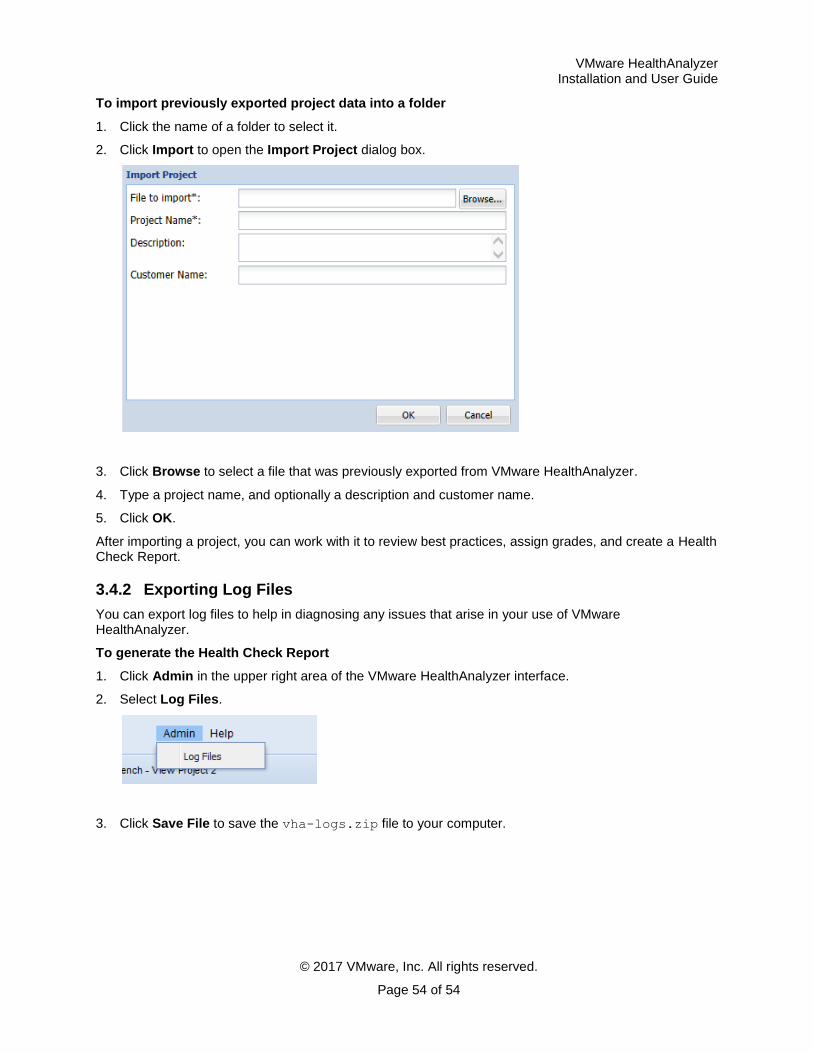
To import previously exported project data into a folder
1. Click the name of a folder to select it.
2. Click Import to open the Import Project dialog box.
3. Click Browse to select a file that was previously exported from VMware HealthAnalyzer.
4. Type a project name, and optionally a description and customer name.
5. Click OK.
After importing a project, you can work with it to review best practices, assign grades, and create a Health Check Report.
3.4.2 Exporting Log Files
You can export log files to help in diagnosing any issues that arise in your use of VMware HealthAnalyzer.
To generate the Health Check Report
1. Click Admin in the upper right area of the VMware HealthAnalyzer interface.
2. Select Log Files.
3. Click Save File to save the vha-logs.zip file to your computer.