Embed Size (px)
Citation preview

[Poicy, Planning, or d Research
WORKING PAPERS
Education and Employment
Population and Human ResourcesDepartment
The World BankOctober 1988
WPS 87
Vocational and TechnicalEducation in Peru
Peter Moockand
Rosemary Bellew
Peruvian vocational and technical students often end up workingin the same jobs for the same earnings as academic students -probably because teaching in both streams is largely "chalk andtaLk" and vocational and technical education students get little"hands-on" technical experience in school.
The Policy. Planning. and Research Cornplex distributes PPR Woking Papers to disseninate the findings of weok in pgrss and toenoourage the exchange of ideas among Bank staff and al others interested in development issues. These papes carry the nan ofthe authors, reflect only their views, and should be used and cited accordingly. The findings, interpretations, and conclusiors are theauthors'own. They should not beattributed totheWorld Bank, its Board of Directors, itsmanagement, or any of its membcrcountries.
Pub
lic D
iscl
osur
e A
utho
rized
Pub
lic D
iscl
osur
e A
utho
rized
Pub
lic D
iscl
osur
e A
utho
rized
Pub
lic D
iscl
osur
e A
utho
rized
Pub
lic D
iscl
osur
e A
utho
rized
Pub
lic D
iscl
osur
e A
utho
rized
Pub
lic D
iscl
osur
e A
utho
rized
Pub
lic D
iscl
osur
e A
utho
rized

Plc,Planning, and Resea,ch
Education and Employment
The costs of the academic and the vocational than the quality of education for academicand technical education (VTE) streams in Peru students in the same areas.are very close. What's more, the monetaryreturns to, and occupational profiles of, gradu- Why, for other groups, do the two educa-ates of the two streams are almost identical- tional streamis produce almost identical retumswith one exception. and graduates with similar occupational pro-
files? VTE institutions, funded at the same levelFor the self-employed who live in urban as academic institutions, can't afford the inputs
areas outside Lima, the retums to secondary that make VTE genuinely technical, so thetechnical education are significantly lower than students get little "hands-on" technical experi-the retums to secondary general education. This ence in school. Despite declared differences inmay be because the quality of VTE programs for emphases and goals, programs and curricula inurban students outside Lima is generally lower the two streams are substantially alike - largely
"chalk and talk."
This paper is a product of the Education and Employment Division, Population andHuman Resources Department. Copies are available free from the World Bank, 1818H Street NW, Washington DC 20433. Please contact C. Cristobal, room S6-001,extension 33648.
The PPR Workino Paper Series disseminates the findings of work under way in the Bank's Policy, Planning, and ResearchComplex. An objective of the series is to get these findings out quickly, even if presentations are less than fully polished.The findings, interpretations, and conclusions in these papers do not necessarily represent official policy of the Bank.
Copyright ©D 1988 by the Intemational Bank for Reconstruction and Developmentlhe World Bank

CONTNTS
1. Introduction . . . . . . . . . . . . . . l 1
2* VTE in Peru . .. . .. . . . . . . . . . . 1
3. Previous Studies . . . .. .. . . . . . . . . . ... 5
4. The Peruvian VTE Data Set . . . . . ... .. . . . . . . 7
5. The Hourly Earnings Function . . . . . . . . . . . . . . 11
Model I . . . . . . . . . . 11Model II . .... .... *. . o 14Model III . . . . . . . . . . . . . . . . . . . . 14Selectivity Bias ......... .. ... 15
6. Estimation of the Hourly Earnings Function . . . . . . . 16
Wage Employees...... . . . .... . . . 16Self-Employed Workers . . . . . . . .. . 20Relative Returns to VTE and General Education . . 24Education and Manual Work . . . . . . . . . . . . 24
7. Unit Costs . . . . . . # . . .. . . . . . . . . . . . . 26
8. Investment in Vocational and Technical Education . . . . 28
REFERENCES . . . . . . . . . . . . . . . . . . . . . . . . . 31

VOLATIONAL AND TECHNICAL EDUCATION IN PERU
Peter R. Moock ard Rosemary T. Bellewl
1. Introduction
The purpose of this study is to assess the economic returns tovocational and technical education (VTE) in Peru. Studies in otherdeveloping countries have concluded tilat TE is more costly to provide than'general' (i.e., academic) education, yet it yields returns that are notsignificantly different. This has led to the policy recommendation thatcountries should promote general education at the expense of VTE. For thecreation of occupation- and job-specific skills, countries should,according to this view, rely not on school-based instruction, but rather oatraining to be given to individuals after they have left school and enteredthe labor market. Such training can be provided either on the job or inindustry-based training centers including proprietary institutions.
The relative costs of and returns to VTE and general educationare investigated here for Peru. The paper proceeds as follows. Section 2describes the system of education in Peru and changes that have occurred inthis system over time. Section 3 surveya the (relatively sparse)literature on comparative rates of return to VTE and general education.Sections 4 and 5 describe, respectively, the data used for this study andthe model used to estimate the returns to different levels and types ofeducation. Section 6 reports the results of the empirical analysis.Section 7 introduces data obtained from Peru's Ministry of Education on therelative costs of VTE and general education. The concluding section 8considers the implications, if any, of the findings for educational policy.
2. VTE in Peru
The recent history of education in Peru, as it relates to theprovision of VTE, can be divided into three distinct phases. Prior to1972, and again after 1982, official policy split the system of educationinto two separate sub-systems, or educational "streams." The focus of thegeneral stream was on the development of broad cognitive skills assumed tobe useful in a wide variety of occupations and necessary also for studentswho wanted to continue their studies at higher levels of the educationsystem. The VTE stream, in addition to teaching these basic skills, wasintended to orient students generally to the world of work and provide themwith training specific to a future occupation of their choice. Between1972 and 1982, there was an attempt to merge the two scholastic streamsand, for most students up through secondary education, to increase thevocational content of the curriculum. This attempt to "vocationalize" or'diversify' primary and secondary education is one with many historical
1 Education and Employment Division, Population and Human ResourcesDepartment, The World Bank, Washington, D.C. 20433. The authorsacknowledge the useful comments of Ana Maria Arriagada, Elizabeth King, andPhilip Musgrove and the assistance, early in the preparation of this study,of Roxana Carvalho.
parallels in other parts of the world (Psacharopoulos and Loxley 1985, pp.11-16).
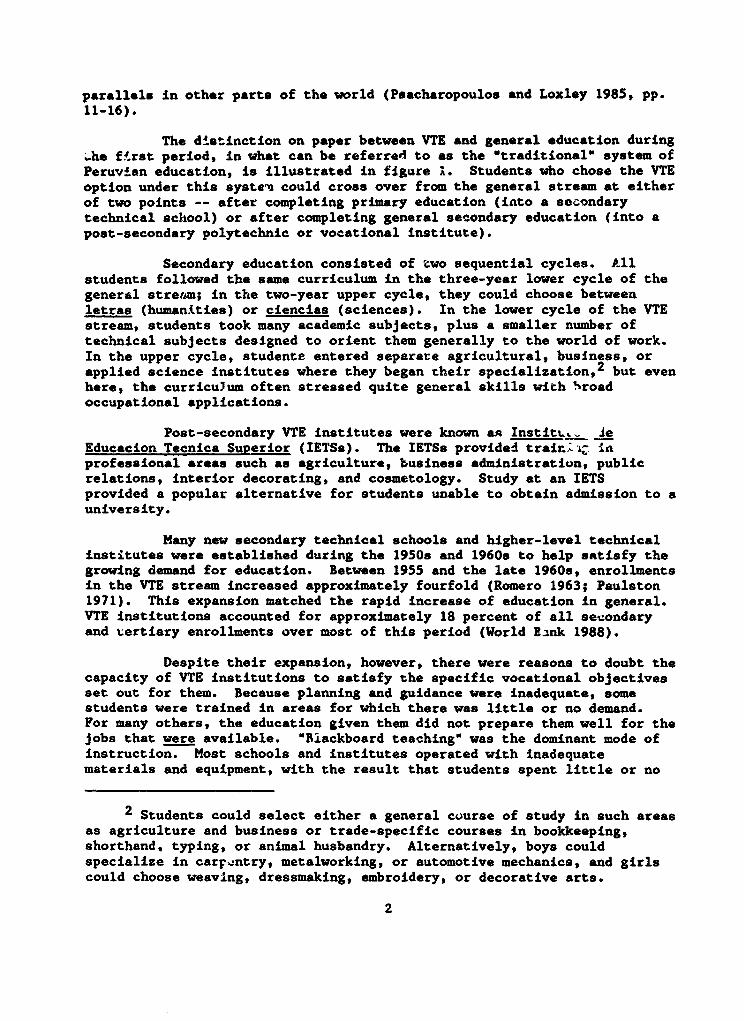
The distinction on paper between VTE and general education duringhe fl.rat period, in what can be referred to as the 'traditional" system ofPeruvion education, is illustrated in figure 1. Students who chose the VTEoption under this system could cross over from the general stream at eitherof two points -- after completing primary education (into a seoondarytechnical school) or after completing general seeondary education (into apost-secondary polytechnic or vocational institute).
Secondary education consisted of two sequential cycles. Allstudents followed the same curriculum in the three-year lower cycle of thegeneral stream; in the two-year upper cycle, they could choose betweenletras (humanities) or ciencias (sciences). In the lower cycle of the VTEstream, students took many academic subjects, plus a smaller number oftechnical subjects designed to orient them generally to the world of work.In the upper cycle, studente entered separate agricultural, business, orapplied science institutes where they began their specialization,2 but evenhere, the curricu)um often stressed quite general skills with Sroadoccupational applications.
Post-secondary VTE institutes were known as Institu._ leEducacion Tecnica Superior (IETSs). The IETSs provided trainLiZ inprofessional areas such as agriculture, business administration, publicrelations, interior decorating, and cosmetology. Study at an IETSprovided a popular alternative for students unable to obtain admission to auniversity.
Many new secondary technical schools and higher-level technicalinstitutes were established during the 1950s and 1960s to help satisfy thegrowing demand for education. Between 1955 and the late 1960s, enrollmentsin the VTE stream increased approximately fourfold (Romero 1963; Paulston1971). This expansion matched the rapid increase of education in general.VTE institutions accounted for approximately 18 percent of all secondaryand tertiary enrollments over most of this period (World Bank 1988).
Despite their expansion, however, there were reasons to doubt thecapacity of VTE institutions to satisfy the specific vocational objectivesset out for them. Because planning and guidance were inadequate, somestudents were trained in areas for which there was little or no demand.For many others, the education given them did not prepare them well for thejobs that were available. 'Blackboard teaching" was the dominant mode ofinstruction. Most schools and institutes operated with inadequatematerials and equipment, with the result that students spent little or no
2 Students could select either a general course of study in such areasas agriculture and business or trade-specific courses in bookkeeping,shorthand, typing, or animal husbandry. Alternatively, boys couldspecialize in carr4ntry, metalworking, or automotive mechanics, and girlscould choose weaving, dressmaking, embroidery, or decorative arts.
2

Figure 1
THE STRUCTURE OF EDUCATION IN PERU
PR 3 a 4 6 3 a 4 PostgraduateE . econdar Undergraduate
SiTX I I I 2 | 3 Genra University(C*Ttram.ltlon year) r_____ ___
C
H [: 3econdar VTE0 Secondary Post-secondary0 Technical nonuniversity
L
Lower UpperPrimary Secondary Tertiary

time doing practical work. About 80 percent of the teachers in VTEinstitutions were Hunderqualified" to teach technical subjects (Paulston1971, World Bank 1973). Moreover, many students never intended to betechnicians when they enrolled in VTE programs in the first place but,instead, did so in the (usually futile) hope of continuing their studylater at a university.
Given tho deficiencies in facilities and personnel and theprevailing preferences of those enrolled, many VTE institutions had littlereal choice but to offer programs that resembled those given in the generaleducational streams, with weight given to the liberal arts and relativelylittle to those technical subjects linked to specific occupationaloutcomes. Only a small proportion of VTE graduates obtained employment inareas directly related to their areas of VTE concentration.
In response to the perceived problems surrounding VTE, teru'smilitary government announced a program of educational reform in 1972. Thereforw was designed to enhance student employment prospects by raising thequality of instruction and increasing education's relevance to the labormarket.3 The crux of the program was its 'diversified' curriculum, i.e., amerging of the academic and technical streams.
More specifically, the reform mandated nine years of 'basic"education, which was supposed to replace the primary and lower secondarycycles of the traditional system. Toward the end of this basic education,all pupils were to be introduced to practical work, after which allcontinuing students would attend new three-year schools known as EscuelasSuperiores de Educacion Profesional (ESEPs). The curriculum of the ESEPswas to be highly practical, with some academic courses included but farfewer than in the traditional system of general education. Only aftersecondary education would students under the new system be split intoseparate streams. Some of the continuing students would go to university,and the rest would enter Second-Cycle (Ciclo II) ESEPs.4
The reform program was implemented slowly, and it was relativelyshort-lived. Nonetheless, it did have an impact on Peruvian education.First-Cycle ESEPs increased in number, from just nine schools and about9,000 students in 1975 to 72 schools and 30,000 students in 1981 (Gray1983; World Bank 1982). At the post-secondary level, three Second-Cycle
3 Earlier, in 1961, private employers in the manufacturing sector hadorganized their own non-formal system to provide training for those leavingthe formal education system. This system, known as the Servicio Nacionalde Aprendizaie y Trabaio Industrial (SENATI), continues to this day.SENATI centers offer training programs in a variety of technical areas.During the first decade of its operation, over 100,000 industrial workersparticipated in SENATI courses (World Bank 1973).
4 Not part of the or.ginal reform of 1972, the Second-Cycle ESEPs wereintroduced in the late 1970s by the succeeding military administration.They were designed to replace the old IETSs.
4

ESEPs were constructed, and approximately 20 of the older IETSs wereconverted to Second-Cycle ESEPs. There was, however, considerableuncertsinty about the value of ESEP courses to universities and employers.As a consequence, many ESEPs were under-enrolled, and most studentscontinued to attend traditional secondary schools and tertiary institutes(World Bank 1982).
In 1982, soon after , .'s return to civilian rule, PresidentBelaunde Terry announced a "new" -eform which, with only m`nor differences,amounted to a return to the tradt'ional system of educatior. The programto exFand the number of First-Cycle ESEPs was halted; students alreadyenrolled were permitted to complete their studies, but no new entrants wereaccepted. Second-Cycle ESEPs were placed under review, and their futureremains uncertain.
3. Previous Studies
Skill formation through vocational and technical education hasbeen an important part of Peru's human capital investment strategy. Inthis regard, the situation in Peru does not differ from what is found inmany other parts of the world. Table 1 shows the proportion of centralgovernment recurrent secondary education expenditures allocated to VTE inPeru and, at an aggregate level, in several of the world's principalregions. Peru's proportionate allocation to VTE appears somewhat aboveaverat' for developing countries, and below that found in theindustrialized European countries.
VTE programs are intended to enhance worker productivity andincrease earnings by reducing skill shortages and promoting positiveattitudes towards work, especially manual work. There is, however, agrowing research literature suggesting that VTE programs, as presentlyconstituted in many developing countries, fail to offer returnscommensurate with their costs (Blaug 1973; Fong 1976; Psacharapoulos 1986;Metcalf 1985). A number of studies have found returns to VTE and togeneral education that are comparable, but higher costs in the case of VTE.To the extent that these findings are corroborated in the same countriesand elsewhere, VTE is shown to be an inferior investment alternative.
Although the available evidence on the relative costs of VTE andgeneral education nearly always shows VTE to be the more expensive option,the size of the cost differential varies considerably across studies. InColombia and Tanzania, secondary VTE has been shown to cost 15 to 20percent more then secondary general education (Psacharopoulos and Loxley1984), in Venezuela twice as much (Psacharopoulos and Steier 1987), anid inJordan ten times as much (Bukhari 1968). Such differences in the relativecosts of VTE from country to country are an indication of the enormousrange in curricular content of programs that are all labeled "technical andvocational."
5
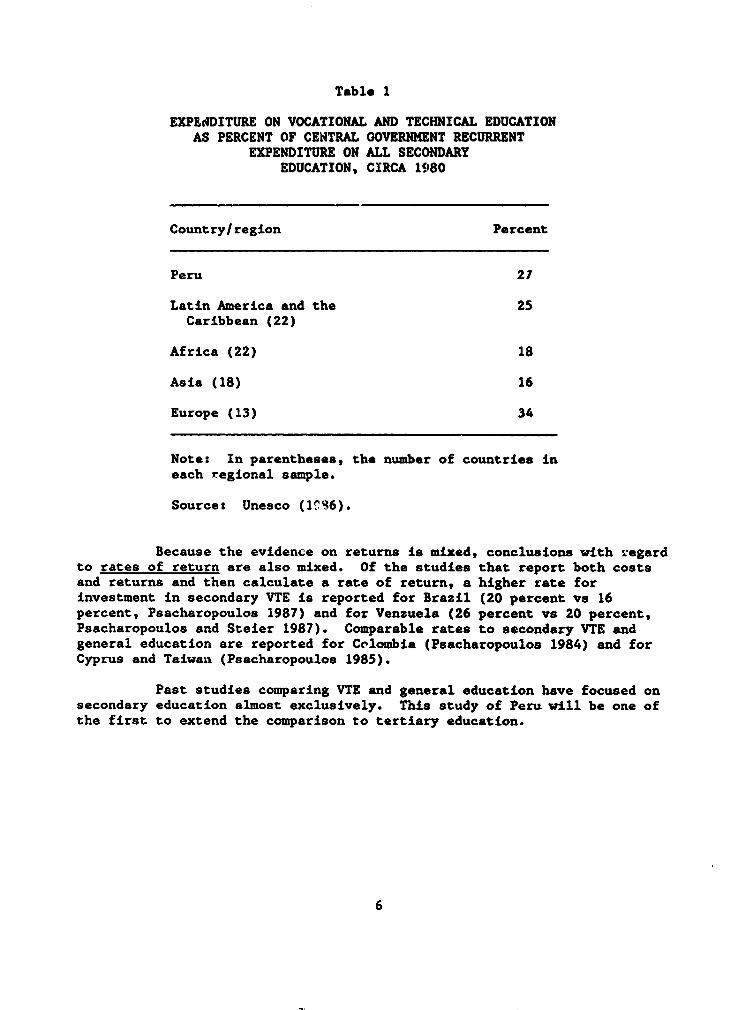
Table 1
EXP tDITURE ON VOCATIONAL AND TECHNICAL EDUCATIONAS PERCENT OF CENTRAL GOVERNMENT RECURRENT
EXPENDITURE ON ALL SECONDARYEDUCATION, CIRCA 1980
Country/region Percent
Peru 27
Latin America and the 25Caribbean (22)
Africa (22) 18
Asia (18) 16
Europe (13) 34
Note: In parentheses, the number of countries ineach regional sample.
Source: Unesco (1e6).
Because the evidence on returns is mixed, conclusions with regardto rates of return are also mixed. Of the studies that report both costsand returns and then calculate a rate of return, a higher rate forinvestment in secondary VTE is reported for Brazil (20 percent vs 16percent, Psacharopoulos 1987) and for Venzuela (26 percent vs 20 percent,Psacharopoulos and Steier 1987). Comparable rates to secondary VTE andgeneral education are reported for Colombia (Psacharopoulos 1984) and forCyprus and Taiwan (Psacharopoulos 1985).
Past studies comparing VTE and general education have focused onsecondary education almost exclusively. This study of Peru will be one ofthe first to extend the comparison to tertiary education.
6

4. The Peruvian VTS Data Set
To assess the relative returns to VTE and general education inPeru, we make use of the Peruvian Living Standards Survey (rLSS) nationalprobability sample of hiuseholds and individuals surveyed in 198511986.5From the full PLSS sample we drew a subsample (n - 2,210) of all urbanmales between the ages of 15 and 69 who were either employ,ed in the privatewage sector or were "self-employed," that is, working for pay in a familyenterprise. Rural workers were excluded from the present study because ofthe small number of such individuals with VTE.6
The breakdown of the sample between those who are self-employedand those who are wage-employed, and between those living in MetropolitanLima and those living in all other urban areas (OUAs) is presented in table2. The distribution across the four cells is nearly equal, the largestgroup being the wage-employed in Lima (756), and the smallest theself-employed in Lima (427).
S The PLSS was implemented between June 1985 and July 1986 by Peru'sInstituto Nacional de Estadistica (INE). The survey questionnaire wasdeveloped by the World Bank in collaboration with INE and the Central Bankof Peru and adapted from a prototype questionnaire used earlier in Coted'Ivoire. A parallel study to this one comparing the returns to VTE andgeneral education in Cote d'Ivoire is available (Grootaert 1988). Fordetails about the PLSS survey and sample, see Grootaert and Arriagada (1986).
6 Analyses of the earnings of similar categories of Peruvian workers,without the focus on VTE, are described elsewhere -- see Stelener,Arriagada, and Moock (1987), which look at the returns to education ingeneral, and Arriagada (1988), which focuses on the returns to training.These two studies are confined also to males, but they they use an upperage cut-off of 65 rather than 69 and they include workers in rural as wellas urban areas and in public as well as private employment. Femaleworkers, for whom the specification of an appropriate earnings functionwill tend to differ, are treated in King (forthcoming) and Arriagada(forthcoming).
7

I Table 2
DISTRIBUTION OF SAMPLE BY LOCATION AND SECTOR
Metropolitan Lima Other urban areas Sector totals
Number Column Z Number Column Z Number Column %
Wage employees
Number 756 63.9 527 51.3 1,283 58.1Row Z 58.9 (34.2) 41.1 (23.9) 100.0 (58. "!
Self-employed
Nuaber 427 36.1 500 48.7 927 41.9Row ! 46.1 (19.3) 53.9 (22.6) 100.0 (41.9)
Location totals
Number 1,183 100.0 1,027 100.0 2,210 100.0Row % 53.5 (53.5) 46.5 (46.5) 100.0 (100.0)
Note: Percentages of the grand total (2,210) are in parentheses.
8

TSle 3 shows that, compared to those in wage employment, theself-employed re on average *.z years older, they have completed about aneyear less of 40hool, and they earn about the same amount per hour but workeight hours more pec week. Workers in OUAs are about one year older andhave completed a year and a half less schooling; they earn 1.25 Intis lessper hour and work three hours more per week than workers in Lima.
Table 3
AGE, S(HXLDM, EARNflM, AND H1AS W)REI BY T=A.&ON AND SIP,
Years of schol Hourly earnin8s In Hours workedAge in years completed June 1985 Intis per week
Ietropolitan LIM
1Wge ezployees 33.6 (12.3) 9.2 (3.4) 6.71 (7.8) 48.43 (14.8)
Self-etloyed 39.8 (13.3) 8.4 (3.9) 6.37 (6.5) 50.70 (21.4)
AUl Lim wrkers 35.9 (13.0) 8.9 (3.6) 6.59 (7.4) 49.25 (17.5)
Other urban areas
Wage efployees 33.7 (12.6) 7.5 (3.5) 4.95 (5.4) 49.51 (16.4)
Self-eaployed 40.1 (13.3) 7.2 (3.8) 5.75 (7.3) 50.58 (20.4)
AU.OU (oUwkers 36.8 (13.3) 7.4 (3.7) 5.34 (6.4) 49.98 (18.5)
All urban areas of Peru
VWa eaployees 33.6 (12.4) 8.5 (3.6) 5.98 (7.0) 48.87 (15.5)
Self-eiployed 40.0 (13.3) 7.8 (3.9) 6.04 (7.0) 50.58 (20.8)
All urbar workers 36.3 (13.2) 8.2 (3.7) 6.01 (7.0) 49.59 (17.9)
Note: Means (standard deviaticns in parentheses).
Table 4 shows the number and percentage of workers in each of thesamples who finished their education at any particular level and type ofschool. ;-nly 1.5 percent of urban male workers (13 and 21 individuals,respectively, in the Lima and OUA samples) never went to school at all.About two-thirds (1,477 individuals) and nearly one-fifth (413 individuals)continued their education past the primary and secondary levels,
9
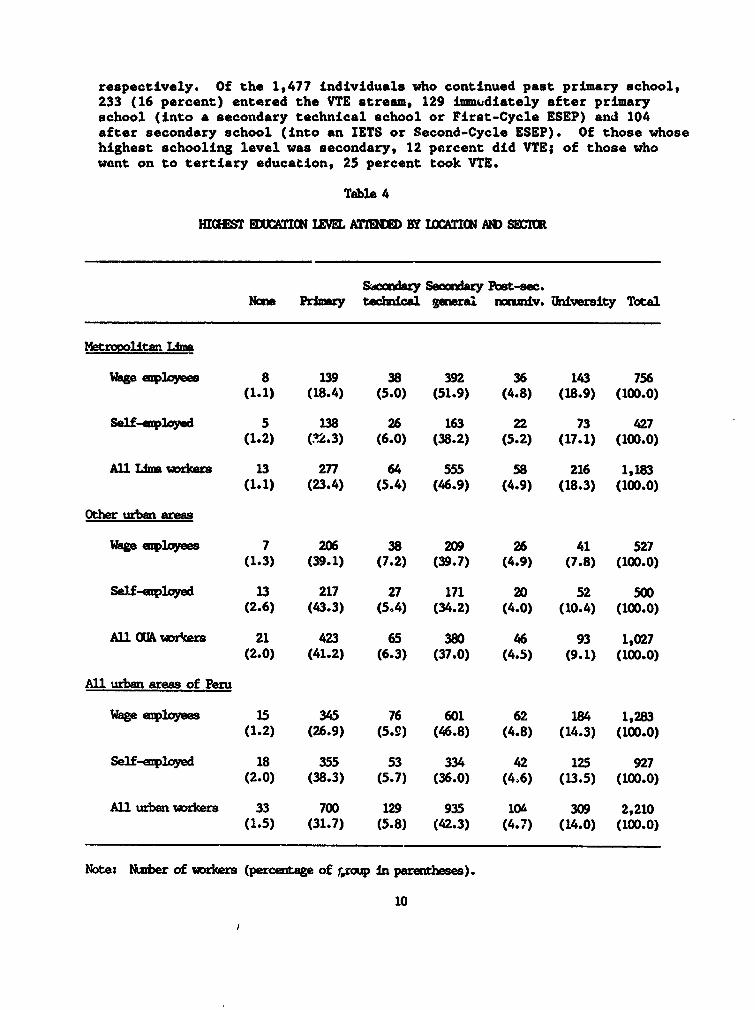
respectively. Of the 1,477 individuals who continued past primary school,233 (16 percent) entered the VTE stream, 129 immudiately after primaryschool (into a secondary technical school or First-Cycle ESEP) and 104after secondary school (into an IETS or Second-Cycle ESEP). Of those whosehighest schooling level was secondary, 12 percent did VTE; of those whowent on to tertiary education, 25 percent took VTE.
Table 4
HIQ EDUATINCR IE\ ATIhE BY IDCATICN AID SECIR
SySecondary Post-seecNcme Primaty tecldcal general aixmv. University Total
Metropolitan IM
VWgeaeployem 8 L39 38 392 36 143 756(1.1) (18.4) (5.0) (51.9) (4.8) (18.9) (100.0)
Self -eqWlyed 5 138 26 163 22 73 427(1.2) (k2.3) (6.0) (38.2) (5.2) (17.1) (100.0)
Al1l morkwors 13 277 64 555 58 216 1,183(1.1) (23.4) (5.4) (46.9) (4.9) (18.3) (100.0)
Other urban areas
Wage epwlyeee 7 206 38 209 26 41 527(1.3) (39.1) (7.2) (39.7) (4.9) (7.8) (100.0)
Self-oplyed 13 217 27 171 20 52 500(2.6) (43.3) (5.4) (34.2) (4.0) (10.4) (100.0)
All GA woPsers 21 423 65 380 46 93 1,027(2.0) (41.2) (6.3) (37.0) (4.5) (9.1) (100.0)
All urban areas of Peru
Wage employees 15 345 76 601 62 184 1,283(1.2) (26.9) (5.9) (46.8) (4.8) (14.3) (100.0)
Self-employed 18 355 53 334 42 125 927(2.0) (38.3) (5.7) (36.0) (406) (13.5) (100.0)
All urban wrkers 33 700 129 935 10& 309 2,210(1.5) (31.7) (5.8) (42.3) (4.7) (14.0) (100.0)
Note: Number of orkers (percentage of ,rcup in parentieses).
10

Since we do not have direct information on the calendar yearsduring which individuals in the sample attended school, we do not know theexact proportion of the sample still in school subsequent to 1972, when thecountry's education reform was announced. However, if we assume that everyindividual in the sample began primary school at the age of six andremained in school without interruption until reaching the highest levelcompleted, then we can say that 73 percent of those in the sample whocontinued beyond the first three years of secondary school finished schoolbefore 1972 and, necessarily therefore, received a traditional education asdepicted in Figure 1. No more than 27 percent (290 individuals) finishedschool later than 1972 and could have, for this reason alone, attended aFirst- or Second-Cycle ESEP. Since the reform was never fully implemented,the actual percentage, though not known, was certainly smaller than this.
5. The Hourly Earnings Function
The model used to compare the returns to general education and tovocational/technical education (VTE) in Peru is derived from the standardhuman capital earnings function (see Mincer 1974). The means and standarddeviations of all of the variables used in the analysis are given in table5.
Model I. We have standardized the basic human capital earningsfunction by hours worked and extended it to include, in addition toschooling and experience, other socio-economic and institutional factors(Vm, m-l,...,n) that may be correlated with earnings. Moreover, educationis here specified as a set of spline variables (Sj, J-1,...,5) so as toallow the return to an additional year of educati5n to differ by both leveland type of education. Finally, each individual's work experience is splitinto two parts (Xk, k-1,2) so as to distinguish experience in the presentjob from experience prior to that. The resulting hourly earnings functionis as follows:
lnYi a + EjPjSji + Ek7kXki + Ek5kXki2 + Emqmvmi + ei,
where Yi is the hourly earnings of the i-th worker, ' P-i' 7k' 6k' and Imare the slopes to be estimated, and ei is a stochastic disturbance term.
The dependent variable is the natural logarithm of self-reportedhourly earnings. For those in the -age sector, included in "earnings" inaddition to base salary are all bonuses plus the monetary value of benefitsprovided by the employer such as food, housing, and clothing (see Stelener,Arriagada, and Moock 1987). For the self-employed, 'earnings' are taken tobe net of all production costs.
Since the data set includes information only on the last level ofeducation attended, we do not know what kind of secondary school those whocontinued to the tertiary level actually attended. We have assumed herethat all who continued to a university or to a post-secondary VTEinstitution followed a general secondary curriculum and that no one whowent to a secondary technical school continued beyond that level.
11

I Table 5
DISCRIPTIVE STATISTICS *
Metropolitao Lima Otber urban areas All urban areas
Variable name Wage eoployees Self-employed Wage employees Self-employed both sectors
Dependent variable (Y)
HOURLY EIRNINGS (June 1985 Inti) 6.71 (7.8) 6.37 (6.5) 4.95 (5.4) 5.15 (7.3) 6.01 (7.0)Li HOURLY EARNINGS 1.53 (0.8) 1.48 (0.9) 1.18 (0.9) 1.29 (1.0) 1.38 (0.9)
Scnoolinf (Si)
YRS PRIMAIR 4.85 (0.7) 4.67 (0.9) 4.59 (1.0) 4.47 (1.2) 4.67 (1.0)YRS SICOIDARY TICHNICAL 0.22 (1.0) 0.26 (1.0) 0.29 (1.1) 0.24 (1.0) 0.25 (1.0)YRS SICONDIAR 6NIEIRL 3.25 (2.1) 2.62 (2.3) 2.16 (2.3) 2.00 (2.3) 2.59 (2.3)YiS POSt-SICONDAIR NONUNI1. 0.14 (0.7) 0.12 (0.6) 0.12 (0.6) 0.12 (0.6) 0.12 (0.6)YRS UNIVIRSITY 0.74 (1.7) 0.71 (1.8) 0.32 (1.2) 0.39 (1.3) 0.55 (1.5)
1I Rrience (X4)
POTENTIAL JOB EIPIRIINCI b 18.09 (13.4) 25.07 (14.8) 19.86 (13.9) 26.61 (15.2) 21.80 (14.6)POTIENTIL JOB EIPIR. SQUIRID x 10-2 5.06 (6.5) 8.48 (8.5) 5.86 (7.1) 9.38 (9.0) 6.89 (7.9)TEARS IN PRESINT JOB 6.35 (8.1) 8.70 (9.4) 7.71 (8.8) 11.51 (11.2) 8.30 (9.5)YEARS IN PRESINT JOB SQUIRED x 10-2 1.06 (2.3) 1.65 (3.2) 1.36 (2.6) 2.58 (4.3) 1.59 (3.1)
Other variables (V.)
PRIVATI SCHOOL c 0.176 0.171 0.108 0.086 0.138TRAINING ' 0.368 0.340 0.271 0.226 0.307MARRIED 0.546 0.719 0.641 0.788 0.657hIGRANT * 0.652 0.752 0.736 0.760 0.716
MOTEIR'S YRS SCHOOLING f 4.09 (3.6) 3.41 (3.5) 2.62 (3.2) 2.42 (3.0) 3.23 (3.4)FIAITE'S 7PS SCSOOLING £ 5.80 (3.8) 5.10 (3.7) 4.28 (3.5i 4.07 (3.1) 4.91 (3.7)
LIBOR UNION MEMBER 0.312 --- 0.256 --- 0.289JOB CONTRACT 0.224 --- 0.228 --- 0.225
DIPLOMA SICONDARY TICINICAL 0.024 0.035 0.027 0.016 0.025DIPLOMA POST-SECONDIAR NOIUNII. 0.022 0.023 0.015 0.020 0.020UNIVIRSITY DIGRII 0.083 o.oeo 0.032 0.034 0.059
Notes: * Means (standard deviations i: i:arentheses).b Age - schooling - years repeated - 6.t Last school attended private.£ Attended post-school training course.* Migrated to present location.
f,I If missing, years measured at sample sean and Individual assuigoed value of I on separate missing valueindicator variable.

Potential experience is imputed in the usual way, with experienceset equal to age minus years of schooling attended (years completed plusyears repeated) minus six. In this study, however, explicit information oneach worker's experience in his present job was obtained during thehousehold interview, and this measure is also included in the estimatingequations.7
Mother's and father's education are included in the earningsfunctions as measures of family background. Included alsu are variables(1 if yes, 0 if no) to capture the effects of each o2 the following onhourly earnings: (a) having attended a private schoc . at the highest levelof education attended; (b) being married; (c) having received post-schooltraining (cf. Arriagada 1988); and (d) having migrated to the present cityof residence from somewhere else.
We estimated this earnings function (referred to as Model I inthe tables below) for the entire sample of male workers and thenseparately: (a) by region -- that is, for the residents of Lima (LIMA) andfor those in other urban areas (OUAs); (b) by sector -- for those workingin the wage sector (WAGE) and for those who are self-employed (SELF); andfinally, (c) by the intersection of region and sector -- for each of thefour groups (LIMAIWAGE, LIMA/SELF, OUAsIWAGE, OUAs/SELF). We conductedtests of sample homogeneity across the various groups and concluded thatcountry-wide or region-wide estimates would be biased -- see table 6.Accordingly, no regression results are presented here except for the fourgroups separately.
Table 6
TFSTS OF SAMPLE HOMOGENEITY
Degrees of SignificanceF-value freedom level
Lima vs OUAs 3.26 16 and 2,178 .01
Wage- vs self-employed 1.92 16 and 2,178 .05
Lima/wage vs Lima/self vs 2.08 48 and 2,146 .01OUAs/wage vs OUAs/self
Note: For the test statistic, see Chow (1960) or Johnston (1972,pp. 197-207).
7 We also tested for interactive effects between experience andschooling. None of the multiplicative terms was statistically significant,and the results are not reported here.
13

Model II. For the wage employed only, we present a second set ofequations controlling for 'institutional' factors 'factors other than theindividual's own human capital) that are likely to affect earnings. Binaryvariables are added indicating: (a) that the individual belongs to a laborunion, which can be expected to increase wages by restricting the supply ofworkers, and (b) that he holds a contract, which may either raise earnings(if, say, a contract is an indicator of the worker's all-around strongbargaining position vis-a-vis the employer) or lower them (if rates of payare traded off against job security in the labor market).
Model III. Neither Model I nor Model II, however, makes adistinction between the effect of spending one more year in school and theeffect of obtaining an educational credential or certificate at the end ofa full course of study consisting usually of several years in school. Toseparate ;hese two statistical effects, we experimented with a third set ofequatio - in which dummy variables were added indicating certificatesreceived by individuals in the last level of education attended. In ModelIII, we tried to control for certification effects in order that theregression coefficient on each corresponding education spline variablecould be said to measure the pure effect of just one mo.e year of theparticular level and type of schooling.8
A statistically significant effect associated with the holding ofan educational certificate may indicate one (or more) of the followingthree things: (a) that there is economic rent included in the wages paidthe certificate holders; (b) that those who earn the certificate are simplysmarter on average than those who do not; or (c) that certificate holdersactually learn more per time spent in school than those who drop out.9 Theregression coefficient on the certificate variable may, in other words, beinterpreted as a market segmentation effect, an innate ability effect, oran educational effect (or, most probably, a combination of all three).
Only in the case of Lima wage employees do we find anystatistically significant effect associated with the holding of educationcertificates, and there only in the case of university degree holders. Forthe other three groups, there are either too few individuals in the samplewith secondary or post-secondary credentials to obtain trustworthyestimates, or where there are sufficient numbers, the estimated effects arenot statistically different from zero. Accordingly, Model III estimates
8 Three certificate variables were added. The first indicatespossession of a secondary technical diploma, the second a post-secondarynonuniversity diploma, and the third a university degree. (No diploma isgiven at the end of a secondary general course, which is not to say thatthere could not still be a ufinishing-the-coursel effect, additional to thevalue of one more year of school.)
9 The last effect might occur in a situation where all parts of acourse of study, like pieces in a jig-saw puzzle, are needed before anindividual can fully understand and make use of any one part.
14

are presented here only for the group of Lima wage employees. And forthem, because the inclusion of lower-level certificate variables results innonsignificant regression coefficients and also renders the coefficientsfor the corresponding years-of-education variables nonsignificant owing tothe collinearity between years of education and certification, the ModelIII equation includes only the university degree certificate variable.
Selectivity Bias. We do not have a sufficient number oftheoretically relevant background variables to test for self-selectivity inan individual's choice between VTE and general education, given that thisdecision could have been made far in the past and the PLSS data set iscross-sectional rather than longitudinal. We do, however, test forselectivity in the present-day choice between wage employment and self-employment. Economic theory says that an individual will choose whicheversector of employment promises the highest net marginal returns. OLS(ordinary least squares) estimates of the earnings equations specifiedabove will be biased to the extent that there are variables omitted from anearnings equation that determine the probability of being in either thewage or self-employed sector. Their omission implies that the error termsof the earnings and labor supply equations will be correlated.
To take into account the choice between wage employment and self-employment, i.e., to adjust for selectivity bias, we use the standardeconometric procedure introduced by Heckman (1976; 1979). We firstestimated a set of probit equations to determine, separately, for all malesin Lima, and then for all males in OUAs: (a) the probability of beingemployed in the private wage sector versus all other options (including,but not restricted to, 3elf-employment), and (b) the probability of beingself-employed versus all else (including, but not restricted to, wageemployment). The following right-hand variables were used in estimatingthe probit functions: age, age squared, the five splines representing eachlevel and type of schooling, the three educational certificate variables,the training and marriage vEriables, years in the current place ofresidence, annual unearned income, father's occupation, the number ofchildren in the household, and hectares of land owned by the household.From each probit an estimate of the inverse Mills-tatio, or "lambda" (),was derived.
In the second step of the adjustment procedure, we re-estimatedthe wage equations with lambda included on the right-hand side to controlfor the probability of being in the particular sector. With the exceptionof the self-employed in Lima, we found no evidence of selectivity bias inthe original OLS equations, in which one assumes that wage workers and theself-employed are random subsets of the active population of workers. Theaddition of lambda did not affect the regression coefficients, and thecoefficients on lambda itself were not significantly different from zero.
For the self-employed in Lima, however, the coefficient on lambdawas positive and significant, and its inclusion lowered the estimatedeffects of some variables including those of both general and technicalsecondary schooling. This points to the existence of unobserved factors inLima that may increase both the probability of becoming self-employed and
15

also the likelihood of above-average hourly earnings. Quite possibly,those with greater innate entrepreneurial ability are more likely thanothers to select self-employment. By failing to correct for the self-selection of this group, the returns to education are biased upwards toinclude the effect of this unmeasured entrepreneurial ability. For thisgroup, the selectivity-corrected estimates will be displayed alongside theOLS estimates.
6. Estimation of the Hourly Earnings Function
This section presents the regression results. The findings aredescribed and discussed, first for the group of private-sector wageemployees, and then for the self-employed.
Wage Employees. The estimates for the wage-employed are given intable The hourly earnings of this group are quite well explained by thehuman c Aital earnings function. The R2s of the final regression are 0.446for Metropolitan Lima and 0.369 for Peru's OUAs.
In the case of Lima, all three models could be estimatedreliably. For other urban areas, estimates of the first two models onlyare reported because relatively few individuals in the OUA sample possessedthe educational certificates needed to distinguish Model III from Model II.For Lima, the inclusion of the university degree variable does not add tothe explanatory power of the regression equation, but it reduces theestimated effect of one more year of university education by about fourpercentAge points, which amounts to roughly a third.
The two institutional factors (union membership and job contract)are strongly related to ecrnings in both regions, with t-values rangingfrom 1.7 to 6.0. Together the two factors uniquely explain about onepercent of the observed variation in earnings in Lima, and eight percent inOUAs. Their addition to the regression equations, in Model II, neitherlowers nor raises the schooling coefficients to any great extent (never byas much as two percentage points) nor in any systematic fashion (sometimesin one direction, sometimes the other).
For both Lima and OUAs, the effect of an additional year ofeducation -- be it general or technical, primary, secondary, or tertiary --diminishes as we move from lower- to higher-order models and there..bycontrol for additional nonhuman capital variables.10 In Lima the highestmarginal returns (8-9 percent in Model III, which controls for thepossession of a university degree, and 13-14 percent in Model II, whichdoes not) and in OUAs the lowest marginal returns (4-6 percent) accrue toterti:kry education. This supports the casual observation that high-level
10 The results obtained for a simpler model, not shown here, analogousto the original human capital earnings function introduced by Mincer (1974)and including just the schooling splines and experience variables, had thelargest coefficients and largest t-values.
16

Table 7
RIGRISSIOI RISULTS -- WAIG IEPLOJIES
Llua Other Urban Areas
Model I lodel 11 Model III Nodel I Lodel 1I
INTIRCIPT -0.027 (-0.14) -0.042 (-0.22) -0.024 (-0.12) -0.740 (-3.34).. -0.528 (-2.50)..
YRS PRIMART (pi) 0.052 (1.37) 0.052 (1.36) 0.053 (1.40) 0.098 (2.27)+. 0.080 (1.95)+IRS SICONDIIR TICINICIL (02) 0.056 (2.18)++ 0.057 (2.23).t 0.057 (2.25)++ 0.085 (2.52)+. 0.069 (2.15)..IRS SICONDIAR GNIIRAL (Ps) 0.061 (4.03)4+ 0.058 (3.84).4 0.058 (3.86)4+ 0.086 (4.07)#. 0.076 (3.81)+.IRS POST-SECONDAIR IONWNII. (04) 0.134 (3.72).+ 0.117 (3.24).. 0.114 (3.19)++ 0.035 (0.60) 0.041 (0.74)IRS UNIVIRSITY (As) 0.147 (9.24).+ 0.134 (8.32)+4 0.090 (3.91)4+ 0.056 (1.74)+ 0.048 (1.58)
POTINTIAL JOB EIPRIIIICI 0.037 (4.73)++ 0.036 (4.57)44 0.035 (4.4)+. 0.064 (5.60)#. 0.054 (4.96)..POTENTIAL JOB IIPRIDIICE SQUARED 2 10-' -0.044 (-2.95)4t -0.042 (-2.82)4. -0.040 (-2.70)++ -0.095 (-4.67)+4 -0.078 (-4.04)+4YIEAS IN PRESEIt JOB 0.023 (2.65)+. 0.021 (2.39).* 0.020 (2.30)++ 0.039 (3.14)++ 0.031 (2.54)4+YEARS II PRISIII JOB SQUIRID i 10-2 -0.049 (-1.68)+ -0.050 (-1.72)i -0.047 (-1.63)i -0.077 -1.95) -0.063 (-1.66).PRIVATI SCHOOL 0.100 (1.49) 0.111 (1.68)i 0.129 (1.95)44 0.143 (1.22) 0.114 (1.03)TRAIIING 0.181 (3.59)#4 0.170 (3.38).4 0.177 (3.55),. -0.031 (-0.38) -0.069 (-0.89)MARRIID 0.270 (4.32)44 0.262 (4.23)++ 0.246 (3.97)++ 0.038 (0.41) -0.057 (-0.64)MIGRANT -0.061 (1.17) -0.049 (-0.94) -0.050 (-0.96) 0.089 (1.23) 0.049 (0.65)MOTIER'S YIS SCHOOLING 0.017 (1.92)+ 0.017 (2.00)++ 0.016 11.89i 0.037 (2.56)4. 0.037 (2.69)+.FIAITR'S YRS SCHOOLING 0.029 (3.C9).4 0.028 (3.65)++ 0.028 (3.67)++ 0.030 (2.27)4+ 0.022 (1.81)+
LIBOR UNION MEMBIR 0.148 (2.74)++ 0.148 (2.76)++ 0.505 (6.02)+4JOB COTRIACT 0.114 (1.97)*+ 0.100 (1.71)4 0.263 (3.12)+4
UNIVERSITY DEGREE 0.357 (2.71)+"
IDJUSTED P2 0.433 0.442 0.447 0.288 0.369F VALUE [DEGREES Of FIRIDOM] 34.86 [17,7381t4 32.50 [19,7361++ 31.51 [22,7331++ 13.54 [17,5091+4 17.17 [19,5071+
Relatie Ifecti
VTS Ts GIEIRILSecondary (P: - 3) -0.005 (-0.23) -0.001 (-0.06) -0.001 (-0.06) -0.001 (-0.04) -0.007 (-0.25)Tertiary (O4 - Psi) -0.013 (-0.34) -0.017 (-0.48) -0.025 (-0.64) -0.021 (-0.33) -0.007 (-0.10)
SICONDARY is PRIMARYTechnical (pi - 0i) 0.004 (0.07) 0.005 (0.10) 0.004 (0.0t) -0.013 (-0.22) -0.011 (-0.19)General (Os - P0) 0.009 (0.20) 0.006 (0.14) 0.005 (0.12) -0.012 (-0.22) -0.004 (-0.06)
TIRTIIRY is SICONDARYPSMg (04 - 03) 0.073 (1.82)+ 0.059 (1.49) 0.056 (1.39) -0.051 (-0.77) -0.035 (-0.55)University (Ds - Ps) 0.086 (3.54).. 0.076 (3.12)"+ 0.031 (1.07) -0.030 (-0.71) -0.028 (-0.72)
Note: t-statistics in parentheses; two pluses (one plus): coefficient statistically significant at 5S (10%) level i. a two-tailedtest.

private-sector jobs in Peru are concentrated in Lima. Even the high ratesof migration into Lima have not, to date, brought pay rates between the tworegions into equilibrium. The marginal returns to lower levels ofeducation, though not always reliably estimated (for the Lima sample, Pihas a standard error nearly three-fourths its own size), are in the five-to-ten percent annual range both in Lima and in OUAs.
In both regions, general education appears to yield highermarginal returns than VTE. The difference is never large, however, lessthan one percentage point in the case of secondary education and less thanthree in the case of tertiary education. To see whether any of thesedifferences are statistically significant, t-tests were conducted. In nocase can the null hypothesis be rejected, even at the 10 percent level (seet-tests for "relative effects" in bottom half of table). Neither are theresignificant differences in the marginal returns to different levels ofeducation. For statistical purposes, the hourly earnings functions intable 7 could have been specified as having just one years-of-educationvariable.
The regression results with respect to the schooling variables(for the highest of the three models estimated, i.e., Model III in the caseof Lima and Model II in the case of OUAs) are summarized graphically infigure 2. The slope of any graph indicates the marginal effect of anadditional year of education of a particular level and type.11
A two-headed arrow between a graph and the horizontal lineindicates that the slope of the graph is significantly different from zero(cf the t-values for the Pi coefficients near the top of table 5). Anarrow between two graphs indicates (or would indicate -- there is no sucharrow in figure 2) that the difference between the regression coefficientsfor two different types or adjacent levels of education is significantlydifferent from zero (cf the t-values for the Pi - Pi* differences at thebottom of table 5). Fat and thin arrows indicate statistical significanceat the 5 and 10 percent levels, respectively.
11 The slope, which shows the percentage change in earnings associatedwith an additioral year of school, is calculated from the regressioncoefficient, p, as follows:
[(exp)P - 1] X 100%
The marginal effects are shown here in linear form, with adjustment of thevertical scale to reflect the fact that percentage increments in earningsincrease more than liiiearly.
18

Figure 2
MARGINAL EFECTS OF EDUCATION -- WGE ENPLOYEES
Lima
Earnings relative to no educatlon4.1
3.3 | <Signiflcant at 6% In 2-tallod toest
University2.7
2.2 PN
1.8
1.5 - coooiday Webbiesl
o_ _....... ... ... ^,--- -- -
1.2
1.0 a a a a . I I
o Pl P2 P3 P4 Pb S1 S2 83 84 86 Ti T2 T3 T4 T6Highest education completed
Other Urban Areas
Earnings relative to no education
2.7 Signitloant at 5% In 2-taled teat
Significant at 10% In 2-tailed teatP2.2 _2_
1.8 scondry tchnlcl
1.5 ... ...
1.0
O Pl P2 P3 P4 P6 S1 S2 83 S4 S6 Ti T2 T3 T4 T6Highest education completed
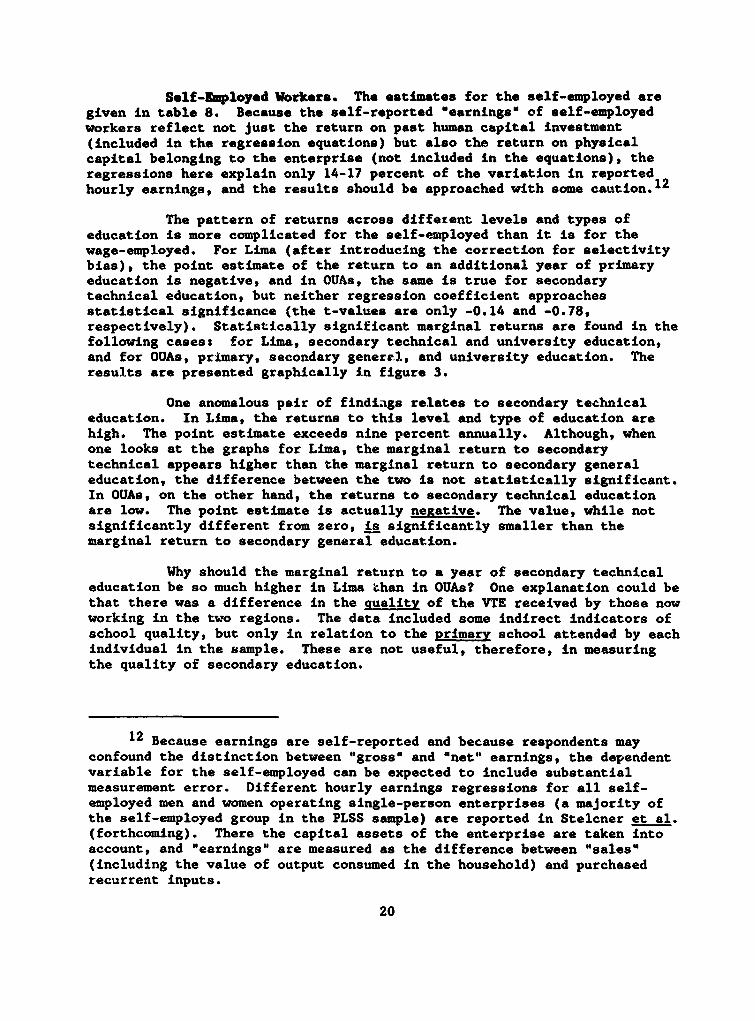
Self-Employed Workers. The estimates for the self-employed aregiven in table 8. Because the self-reported 'earnings" of self-employedworkers reflect not just the return on past human capital investment(included in the regression equations) but also the return on physicalcapital belonging to the enterprise (not included in the equations), theregressions here explain only 14-17 percent of the variation in reportedhourly earnings, and the results should be approached with some caution.12
The pattern of returns across diffetent levels and types ofeducation is more complicated for the self-employed than it is for thewage-employed. For Lima (after introducing the correction for selectivitybias), the point estimate of the return to an additional year of primaryeducation is negative, and in OUAs, the same is true for secondarytechnical education, but neither regression coefficient approachesstatistical significance (the t-values are only -0.14 and -0.78,respectively). Statistically significant marginal returns are found in thefollowing cases: for Lima, secondary technical and university education,and for OUAs, primary, secondary genere.l, and university education. Theresults are presented graphically in figure 3.
One anomalous pair of findiags relates to secondary technicaleducation. In Lima, the returns to this level and type of education arehigh. The point estimate exceeds nine percent annually. Although, whenone looks at the graphs for Lima, the marginal return to secondarytechnical appears higher than the marginal return to secondary generaleducation, the difference between the two is not statistically significant.In OUAs, on the other hand, the returns to secondary technical educationare low. The point estimate is actually negative. The value, while notsignificantly different from zero, is significantly smaller than themarginal return to secondary general education.
Why should the marginal return to a year of secondary technicaleducation be so much higher in Lima than in OUAs? One explanation could bethat there was a difference in the auality of the VTE received by those nowworking in the two regions. The data included some indirect indicators ofschool quality, but only in relation to the primary school attended by eachindividual in the sample. These are not useful, therefore, in measuringthe quality of secondary education.
12 Because earnings are self-reported and because respondents mayconfound the distinction between 'gross" and 'net' earnings, the dependentvariable for the self-employed can be expected to include substantialmeasurement error. Different hourly earnings regressions for all self-employed men and women operating single-person enterprises (a majority ofthe self-employed group in the PLSS sample) are reported in Stelcner et al.(forthcoming). There the capital assets of the enterprise are taken intoaccount, and "earnings" are measured as the difference between 'sales'(including the value of output consumed in the household) and purchasedrecurrent inputs.
20

Table 8
RtESSION RELTS - SEIF-EM0LHED
IMu Odther Urban Areas
Selectivitykidel I Corrected MKdel I
INIERCEPT 0.431 (1.48) -0.716 (-0.94) -0.192 (-0.77)
M PRIMARY) 0.019 (0.36) -0.008 (-0.14) 0.070 (1.65)+MM StU 1 ICAL (g) 0.118 (2.84)++ 0.097 (2.28)++ -0.033 (-0.78)YRS SE(XMlYN (2i|L ( ) 0.066 (2.68)++ 0.029 (0.87) 0.045 (1.74)+MG 4POST-SS[lMR Nl) 0.084 (1.14) 0.088 (1.27) 0.072 (1.08)WS RNEIV1ERST Z 5) 0.083 (3.08)++ 0.082 (3.19)++ 0.083 (2.38)++
POlIrfML JO EXERIEINCE 0.011 (0.81) 0.022 (1.46) 0.046 (3.68)++WO1DNIL JKB MlIEXNZE SQARED x 10-2 -0.016 (-0.72) -0.023 (-1.01) -0.082 (-4.17)++YEA1R IN fRESET KB 0.027 (1.96)++ 0.031 (2.28)++ 0.030 (2.65)++YEARS IN PRE5T XB SWMAR!D x 10-2 -0.044 (-1.11) -0.053 (-1.33) -0.052 (-1.82)+
PRIVAIE SCHOCL -0.014 (-0.13) 0.007 (-0.07) 0.143 (0.93)TRAINDNG 0.020 (0.22) -0.006 (-0.06) -0.111 (-1.11)NARRIED 0.265 (2.50)++ 0.363 (3.08)4+ 0.309 (2.80)++MIRANr 0.033 (0.34) 0.002 (0.02) 0.082 (0.83)MCTHE'S YMM SOCL 0.035 (2.23)++ 0.032 (2.08)++ 0.018 (1.06)
IWHER.S YR S(CH3XLflG 0.010 (0.62) 0.008 (0.60) 0.013 (0.82)
lAMHDU 0.987 (1.64)+
ADJUED) R2 0.166 0.170 0.142F VALUE OF EREED04] 5.98 (17,4093++ 5.86 [18,4081++ 5.88 (17,4823++
Relative Effects
V1E vs GLERMLSeoondsry * - p3) 0.052 (1.34) 0.068 (1.48) -0.078 (-1.91)+Tertiary %p4 - P5) 0.001 (0.01) 0.006 (0.09) -0.011 (-0.16)
SEXONQR vs PRlWiRYTecnkical 02 - A) 0.099 (1.38) 0.105 (1.42) -0.103 (-1.63)General (3 - A) 0.047 (0.74) 0.037 (0.54) -0.025 (-0.47)
UIS vs S1OWP5U (4 - P3) 0.018 (0.23) 0.059 (0.74) 0.027 (0.36)University (p5 - p3) 0.017 (0.42) 0.053 (1.15) 0.038 (0.78)
Note: t-statiStics in parentheses; two pluses (one p1ls) coefficient statistically significantat 51 (102) lemel In a wo-tailed test.
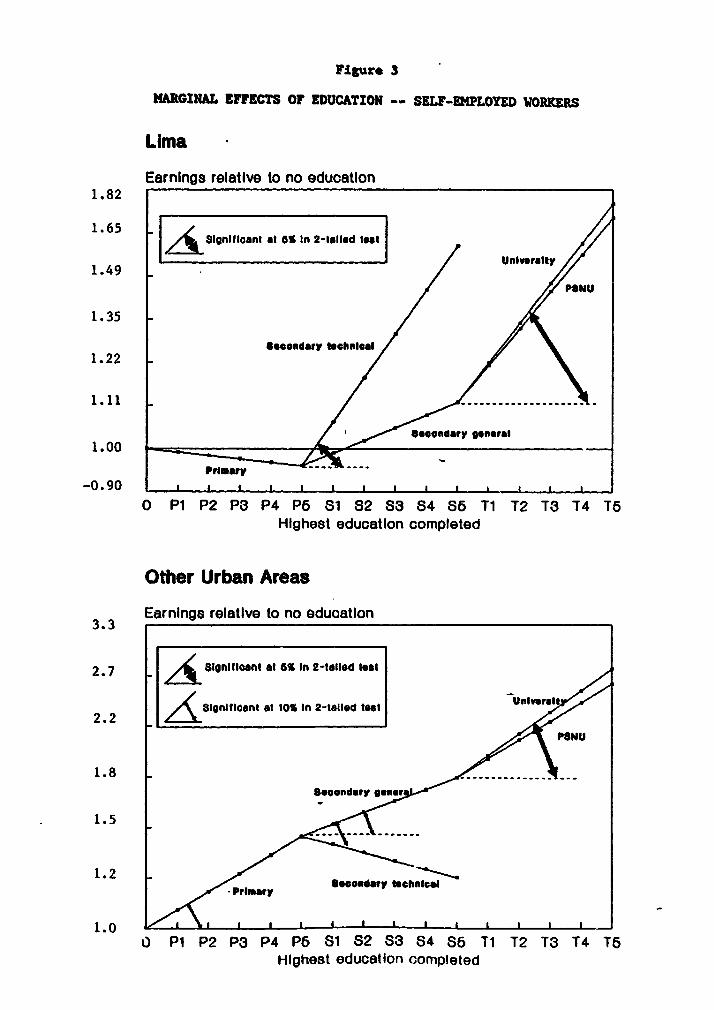
Figure 3
MARGINAL "FFECTS OF EDUCATION -- SELF-EMPLOYED WORKERS
Lima
Earnings relative to no education1.82
1.65 r[ Slgnificant at 0% In 2-talled toat
1.49 UnierItmsu
1.35
Seseoidary Welinleal1.22
1.11 -----
Sooondary goneral1.00
primary-0.90 i a I I a I I I a I I a
o Pl P2 P3 P4 P6 81 S2 S3 S4 S6 Tl T2 T3 T4 T6Highest education completed
Other Urban Areas
3.3 Earnings relative to no education
2.7 Significant at 6% In 2-talled test
2.2 |.Siniltlcant at 10% in 2-talled test Univer|l
1.8
1.5
1.2Primary Se.ondary technical
1.0O PI P2 P3 P4 Pb Si S2 S3 S4 S6 Ti 12 13 14 15
Highest education completed

Inotead, we have estimated the location of the secondary schoolattended, on the assumption that schools that were located in cities mighthave been of hi_'er quality on average than those located in towns orvillages. Since respondents were not asked about the location of schoolsattended, we use as a proxy the place of residence of the individual whenhe was of school attendance age -- whether he then lived in a city or not.Table 9 shows where workers lived when they were attending secondaryschool.
Table 9
OF WORKERS WHO ATTENDED SECONDARY SCHOOL,PERCENTAGE WHO THEN LIVED IN A CITY
Type of secondary school attended
Individuals nowliving in: Technical General Both
Self-employed workers
Metropolitan Lima 69.2% 68.22 68.3%(18126) (176/258) (194/286)
Other urban areas 29.62 44.9Z 43.31(8127) (109/243) (117/270)
All urban areas of Peru 49.12 56.9X 56.1Z(26/53) (285/501) (311/554)
Wage employees
Metropolitan Lima 63.2Z 70.9Z 70.4Z(24/38) (4051571) (429/609)
Other urban areas 42.12 46.7Z 46.22(16/38) (129/276) (145/314)
All urban areas of Peru 52.62 63.01 62.21(40/76) (534/847) (574/923)
Fifty-six percent of all self-employed workers who attendedsecondary school lived in a city as youngsters and, we shall assumetherefore, attended uhigher quality" schools than those who lived in townsor villages. Of the four groups of self-employed workers, the one with thehighest percentage (69.22) of individuals who then lived in a city is thegroup who attended secondary tachnical schools and now live in Metropolitan
23

Lima. The group with the smallesi. percentage (29.6X) -- nuch smaller thanfor any other group, including all of the wage employee groups -- is thegroup of technical school attendees now living in OUAs. Although theevidence is not conclusive, the pattern of where individuals lived asyoungsters does support the hypothesis that the quality of educationreceived by the self-employed now living in Lima was higher than thatreceived by the self-employed now living in other urban areas. This may,in part, explain the anomaly pointed out in figure 3.
Relative Returns to VTE and General Education. The mostpertinent conclusion here with regard to the returns to education in Peruis es6entially a null conclusion: With the one exception of education atthe secondary level for self-employed workers in other urban areas, thereare no significant differences in the marginal returns to education in thetwo scholastic streams. In all other cases, a year of VTE is thestatistical equivalent of a year of general education, at least in terms oftheir impact on earnings. Why, in light of the officially stated intentthat VTE should provide students wiith specific skills oriented to themanifest requirements of the labor market, should this be so?
One likely explanation is the lack of curricular differenLesbetween the two streams. As discussed in Section 2, it is reasonable tosuspect that, because of shortages of appropriately trained teachers andsuitable equipment, and also because of the difficulty of actuallyspecifying the technical requirements of the labor market, VTE institutionsin Peru do not offer education that is substantially different from thatwhich is offered in institutions designated as general institutions.Moreover, and as a consequence of the similarity in the curricula, otudentsfrom the two streams may end up, once employed, filling jobs that ate alsosubstantially the same.
Education and Manual Work. In the data set, workers' jobs can beclassified into seven major categories: professional, managerial,services, sales, clerical, farming, and manual. These categories do notrelate noatly to the career objectives of the two educational streams, butit does seem reasonable to predict that graduates of VTE would be somewhatmore likely than graduates of general education to be employed as manualworkers. To test this hypothesis, we postulated a logistic probabilitymodel to predict the likelihood of being thus employed. The observeddependent variable assumes the values 1 if an individual worked in a manualjob and 0 if he worked in any of the other job categories. On the right-hand side of the equation, in addition to the variable indicating type ofeducation received (1 if VTE, 0 if general) we included three othervariables that could be expected to affect the likelihood of being employedin a manual job: POTENTIAL JOB EXPERIENCE, YEARS IN PRESENT JOB, andMIGRANT (see table 5 above).
The logit regression was estimated separately, using a maximumlikelihood procedure, for each of eight worker groups: within each of thefour regionallsectoral groups, separately for those whose highest level ofeducation was secondary and again for those whose highest level wastertiary. The results are summarized in table 10. Only for the tertiery
24
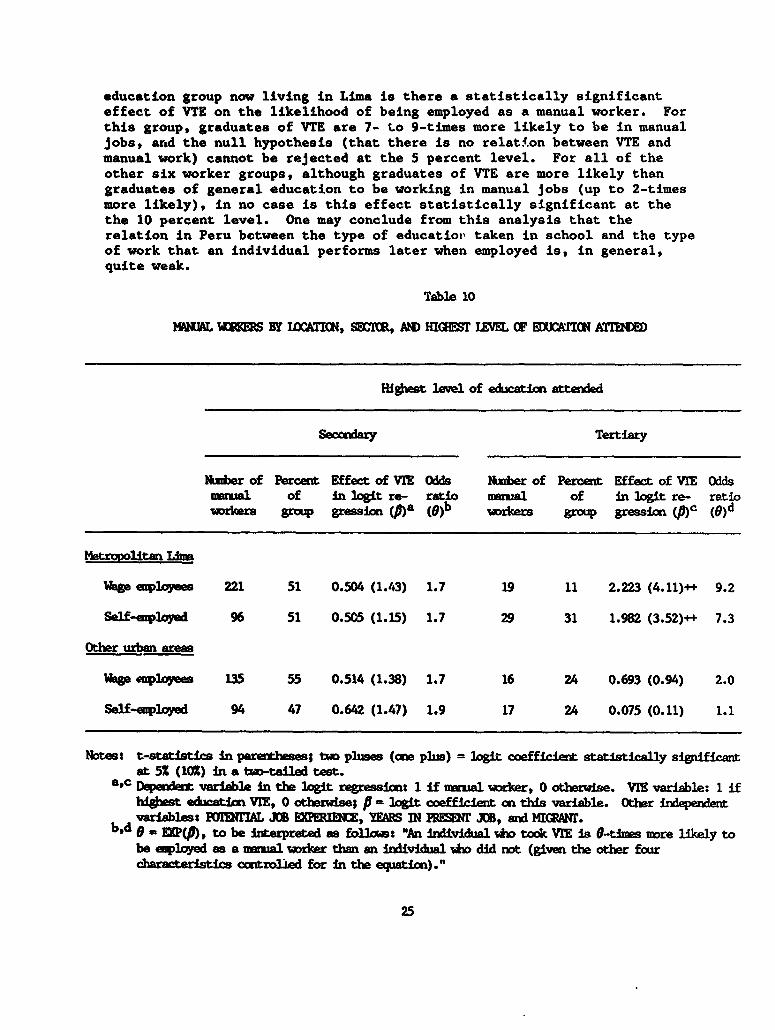
education group now living in Lima is there a statistically significanteffect of VTE on the likelihood of being employed as a manual worker. Forthis group, graduates of VTE are 7- to 9-times more likely to be in manualjobs, arnd the null hypothesis (that there is no relat.4on between VTE andmanual work) cannot be rejected at the 5 percent level. For all of theother six worker groups, although graduates of VTE are more likely thangraduates of general education to be working in manual jobs (up to 2-timesmore likely), in no case is this effect statistically significant at thethe 10 percent level. One may conclude from this analysis that therelation in Peru between the type of educatioi, taken in school and the typeof work that an individual performs later when employed is, in general,quite weak.
Table 10
MWNAL WM= BY WUATh1N, MEMR, AND HIGESr I OF EO WlCATIONATTK
Hi&est level of education attened
Secadary Tertiary
Nnber of Percent Effect of VIE odds Umber of Percent Effect of VIE Oddsmunral of in logit re- ratio mmwal of in logit re- ratioworkers grow gressicn 0a (9)b workers group gression (pfc (G)d
Netrpolitan Lima
Wagse eployees 221 51 0.504 (1.43) 1.7 19 11 2.223 (4.11)++ 9.2
Self-employed 96 51 0.505 (1.15) 1.7 29 31 1.982 (3.52)++ 7.3
Other urban m
Wage emlnplys 135 55 0.514 (1.38) 1.7 16 24 0.693 (0.94) 2.0
Self-eployed 94 47 0.642 (1.47) 1.9 17 24 0.075 (0.11) 1.1
Notes: t-staistis in parethess; two pluse (cm plus) = logit coefficient statistically sigfintat 5% (101) in a two-tailed test.
a,c Depaxit variable in the loot regressicns 1 if mral worker, 0 odtxeise. VIE variable: 1 ifhi*wst education VIE, 0 otherise; p - lgit coefficient on this variable. Other independentvaribles: PENffAL JO EXPERDI , YFRS IN PREENT JOB, and MIGMQr.
b,d 9 - EXP(P), to be interpreted as follosJ: "An Individual hii took VIE is 0-thmes nore likely tobe eployed as a nurual wrker than an individual who did not (given the other foarcharmcteristics controlled for in the equation)."
25

7. Unit Costs
Our results on the determinants of earnings in Peru havecorroborated a finding reported for some other countries, that the returnsto investment in VTE are comparable to the returns to investment in generaleducation. In most of the studies done elsewhere, however, the costs ofVTE have been shown to exceed the costs of general education. In Peru, nosuch cost differential is clearly evident. Table 11 presents the averagecentral government recurrent expenditure per stulent per year in secondaryand post-secondary education in all years between 1960 and 1981 for whichdata were available.13
For post-secondary education, although some year-to-yearvariation exists, the Ministry of Education (MoE) data show quiteconsistently that less was spent per year of study in nondegree grantinginstitutions than Ln universities. The average ratio of VTE costs togeneral education costs was 0.8 at the tertiary level between 1970 and1981. Since most of the individuals in our 1985/86 sample would haveattended post-secondary education before 1982, the period covered by thedata series is qut-de relevant for the purpose at hand.
The situation with regard to unit costs at the secondary level ismuch less clear. According to the MoE figures, VTE costs were between twoand three times more than general education costs in the period prior to1970. For 1978 and 1979, the last two years in the available series, VTEagain outstripped general education in terms of unit costs. For theintervening years, howeveo., the costs of the two educational streams appearto have been nearly equivalent. VTE's costs exceeded general education's onaverage by about 10 percent only.
Thers is little in the history of Peruvian education and thereforms announced in 1972 and 1982 that helps to explain the wild swings inthe relative costs of secondary VTE and general education. Nearly all ofthe shifts in the relative positi ns of the two are accounted for by shiftsin the former rather than the latter. Although there was an overalldownward trend over the period, the fluctuations in expenditure per generaleducation student between 1960 and 1979 were comparatively small, thereported figure in the highest year (1965) being just about double that inthe lowest (1979). In the case of VTE on the other hand, reportedexpenditure per student in real terms was nearly four times larger in 1965than in 1977. Some possible explanations for these puzzling figures willbe considered in the following section.
13 Owing to the absence of data on unsubsidized educational costsincurred by individuals, on expenditure by lower levels of government, andon capital costs whatever the source of financing, the discussion of costsin this study will refer only to recurrent, central government expenditures.
26

Tab2l 11
RCMMNr ECFIInr1R PER STUDEWN, 1960-1981
VTE/general epamediture ratio
Expnditure per student (constant 1985 Insis) SocxcIdary Post-secondary
Secondary Secondary Pbst-sec. AmIal Average Amnal AveragePrilmry teimcLAal general nruni-mv. University (b)/(c) 1970-77 (d)/(e) 1970-81
Year (a) (b) (c) (d) (e) (f) (g) (h) (i)
1960 587 3,941 1,412 . . 2.8
1965 989 5,075 1,941 . 2.6
1970 923 1,866 1,634 4,933 8,754 1.1 0.6
1971 922 1,513 1,621 6,150 9,336 0.9 0.7
1972 1,184 1,645 1,919 4,294 7,673 0.9 0.6
1973 1,021 1,903 1,765 7,333 8,008 1.1 0.9
1974 994 1,705 1,643 6,820 6,318 1.0 1.1
1975 983 1,463 1,424 6,008 8,472 1.0 0.7
1976 956 1,426 1,287 6,973 6,008 1.1 1.2
1977 861 1,303 1,008 5,029 5,916 1.3 0.9
1978 638 2,681 1,098 4,604 4,676 2.4 1.0
1979 550 2,163 932 4,206 4,851 2.3 0.9
1980 915 . . 3,828 5,574 . 0.7
1981 835 . . 3,443 5,421 . 0.6
Sources: Per student enditures were suppLUed by the Mbiostry of FAdcation and reportedin Arregui (1988). C)P deflators ire provided by the Instituto Nacional deEstadistica asd reDorted in Webb (1987).
27

S. Investuent in Vocational and Technical Education
To see the implications of the above findings for educationalpolicy in Peru requires that the data on marginal costs and marginalreturns be placed in juxtaposition. That the returns to a year of VTE anda year of general education are found to be essentially the same impliesone thing if VTE is more expensive to provide than general education andquite another if the unit costs of the two are much the same. Table 12summarizes the findings from earlier sections on the costs and returns toVTE and general education in Peru.
The comparison between costs and returns is clear-cut in the caseof post-secondary education. Here, in the four locational/sectoral samplesthe return to a year of post-secondary nonuniversity education variesbetween 901 and 1101 of the return to a year of university education.Averaging across the four samples, one may conclude that the return to VTEin the country as a whole is just slightly below the return to universityeducation. This is quite consistent with the information on costs, takenfrom table 11 in the previous section. On a year by year basis, unit costsin post-secondary nonuniversity education have varied as a percentage ofunit costs in university education from a low of 601 to a high of 1201 andaveraged about 80x. In comparing costs and benefits, one can say that thecompetition' between VTE and general education at the post-secondary levelamounts to a virtual draw.
The situation with regard to secondary education is morecomplicated. In terms of averages, once again the picture suggests a highdegree of equilibrium between the additional costs and additional returnsof VTE relative to general education. Both costs and returns areapproximately 10 higher on average. For secondary education, however, thedata points are very dispersed. For the self-employed in Lima, though thedifference is not statistically significant, each year of VTE is associatedwith a proportionate increase in earnings three and a half times greaterthan a corresponding year of general education. On the other hand, for theself-employed in OUAs, VTE is negatively related to earnings (though notsignificantly so) whereas general education yields a moderately highreturn. In between, for both groups of wage workers, the marginal returnto VTE is just slightly below the return to general education.
The pzttern of unit costs in secondary education, as the readerwill recall, is even less stable. Although the figures show considerableuniformity for the years between 1970 and 1977 (the period for which th¶e1.1:1 ratio -- expenditure on secondary technical education to expenditureon secondary general -- has been derived), the data for the years before1970 and years since 1977 show VTE to be much more expensive than this, atleast twice as much relative to general education. Disregarding theearliest period -- which, even if the figures are accurate, is now "ancienthistory' -- one must consider the implications of the very latest figures.
28

Table 12
COWARZSG4 OF RELATIVE BENES AND RELATIVE COSTS OF YTE AWND GENERL EDUCATION
Secondary education Post-secondary education
Ratio of Expenditure Ratio of Expenditure
Return to year of marginal returns ratio Return to year of: mrginal returns ratio
By group Average all Avrage Non- By group Average all Avera g
Technicail General (a)/(b) four groups 1971-77 university University (g)/(h) four groups 1970-82
(a) (b) (c) (d) (1) (g) (h) (1) U) (k)
Wage am I oyeee
Lim. 4.43 5.9% .07 84% 90.3x 9.9
OUAs 7.1X 7.9% 0.9 4.2% 4.9 9.91.1 1.1c 0.9 0.6
Self-euiloyed
Line 10.2% 2.9% 3.6 9.2% 6.53 1.1
OUAs -3.2a 4.6x -0.7 7.5X 8.7% 0e9
a,b From table 10.
c Twice as high in 1978 and 1979 (the It two years for which data available).

There are at least two possible explanations for the rapidescalation in the unit costs of secondary technical education in the late1970s. One would be a decline in the number of students enrolled in suchschools. UNESCO figures do, indeed, show a dramatic decline in VTEenrollments between 1977 and 1978 (UNESCO 1986), but whether this was, infact, real or represents some sort of statistical artifact (perhaps theresult of a student reclassification) is not known. In either case, adecline in the denominator (number of students) without a commensuratedecline in the numerator (total expenditure) will result in an increase inexpenditure per student. Unless there is reason to believe that thedecline in the number of students is only a temporary phenomenon, thenthere can be no justification for constructing additional schools of thistype. Until the costs of technical education can be brought down again(presumably by closing some of the existing VTE schools and consolidatingthe rest), VTE will remain a poor investment option relative to generaleducation.
An increase in unit costs could have occurred also within thecontext of educational reform. As discussed in Section 2, under the reformprogram introduced in 1972, a number of new technical schools (ESEPs) wereconstructed. Given that many of these schools did not open their doorsuntil the late 1970s, it is likely that they were not yet fully enrolledand that the high unit costs noted above do not represent the full-capacity costs of providing this kind of education.
Moreover, to address some of the shortcomings posited above withrespect to staffing, equipment, and curriculum of VTE institutions wouldhave required (to the extent that they were, in fact, addressed) inevitablythe mobilization of additional resources. The resulting increase inexpenditure per student might be justified if it led to graduates of theVTE system who were truly better prepared for the world of work and whocould sustain a higher level of productivity over the period of theirworking lives.
We do not know to what extent the higher expenditures per VTEstudent after 1977 represents an anomaly in the statistical series orwhether more recent information will corroborate the apparent trend. If itis determined that the unit costs of secondary VTE are, indeed, on the risein Peru, then addit'onal research will be needed that can track theoccupational attainment and productivity of new output from the VTE system.All that can be said at this stage is that any significantly higher costsof producing new VTE graduates could not be justified in light of theearnings performance of existing graduates in the Peruvian work force.
30

REFERENCES
Arregui, P. 1988. "Unit Costs of of Education in Peru." Mimeo. LimatGrupo de analisis para el desarrollo.
Arriagada, A-M. 1988. "Occupational Training Among Urban Peruvian Men:Does It Make a Difference?" Mimeo. Washington, D.C.: The World Bank.
. Forthcoming. "Occupational Training, Employment and Wagesof Peruvian Women."
Blaug, M. 1973. Education and the Employment Problem in DevelopingCountries. Geneva: International Labour Organization.
Bukhari, N. 1968. 'Issues in Occupational Education: A Case Study inJordan." Studies on Content and Methods of Education forDevelopment. Stanford, Ca.: Stanford International DevelopmentEducation Center, Stanford University.
Chow, G. C. 1960. "Tests of Equality between Sets of Coefficients in TwoLinear Regressions." Econometrics. Vol. 28: 591-605.
Fong, P. E. 1976. "Education and Employment Research Project: Education,Earnings and Occupational Mobility in Singapore." Geneva:International Labour Organization.
Gray, C. 1983. Peru: A Study of the Educational System of Peru and aGuide. Washington, D.C.: American Association of CollegiateRegistrars and Admissions Officers.
Grootaert, C. 1988. "Vocational and Technical Education in Cote d'Ivoire:An Economic Assessment." Population and Human Resources DiscussionPaper. Washington, D.C.: The World Bank.
and A-M. Arriagada. 1986. The Peruvian Living StandardsSurvey: An Annotated Questionnaire. Development Re*search Department,Living Standards Measurement Study. Washington, D.C.: The World Bank.
Heckman, J. 1976. "The Common Structure of Statistical Models ofTruncation, Sample Selection and Limited Dependent Variables and aSimple Estimator for Such Models," Annals of Economic and SocialMeasurement, Vol. 5 (4).
_. 1979. "Sample Selection Bias as a Specification Error,"Econometrica, Vol. 47(1).
Johnston, J. 1972. Econometric Methods. 2nd Edition. New York: McGrawHill.
King, E. 1988. "Education, Labor Force Participation, and WEges ofPeruvian Women." Forthcoming.
31

McGinn, N. and E. Balart. 1980. 'Una Evaluacion de 1l Educacion MediaTecnica en El Salvador.' Revista Latinoamericana de EstudiosEducativos, Vol. 10 (2).
Metcalf, D.H. 1985. The Economics oa. Vocational Trainins: Past Evidenceand Future Considerations. Washington, D.C.: The World Bank.
Mincer, J. 1974. Schooling. Experience, and EarninRs. New York: NationalBureau of Economic Research.
Paulston, R. 1971. Society. Schools and Progress in Peru. New York:Pergamon Press.
Psacharopoulos, G. 1984. 'The Effects of Diversified Schools onEmployment Status and Earnings in Colombia.' Economics of EducationReview, Vol. 3 (4): 315-331.
. 1985. 'Returns to Education: A Further InternationalUpdate and Implications.' The Journal of Human Resources. Vol. XX(4): 584-604.
1986. To Vocationalize or Not to Vocationalize? Thatis the Curriculum Question. Education and Training DepartmentDiscussion Paper No. 31. Washington, D.C.: Ihe World Bank.
________________ 1987. Earnings and Education in Brazil: Evidence fromthe 1980 Census. Education and Training Department Discussion PaperNo. 90. Washington, D.C.: The World Bank.
a and W. Loxley. 1985. Diversified Secondary Educationand Develo ment: A Report on the Diversified Secondary CurriculumStudy (DISCUS). Washington, D.C.: The World Bank.
_ and F. Steier. 1987. Education and the Labor Market inVenezuela. Education and Training Department Discussion Paper No. 93.Washington, D.C.: The World Bank.
Romero, F. 1963. Educacion y Desarrollo Economico. Lima.
Schiefelbein, E. 1979. Education and Employment in Latin America. ReportStudies. Paris: UNESCO.
Stelener, M., A. Arriagada and P. Moock. 1987. Wage Determinants andSchool Attainment Among Men in Peru. Living Standards MeasurementStudy, No. 38. Washington, D.C.s The World Bank.
et al. Forthcoming. Earnings of Self-Employed Men and Womenin Peru. Living Standards Measurement Study. Washington, D.C.: TheWorld Bank.
u~SCOw. ;98u. un'ooCO Yeaixuvv.
32

World Bank. 1973. Atpraisal of First Education ProAect.
______.___ 1982. Perut First Education Proiect Completion Report.
_ 1988. World Bank BESD Data Base.
Webb, R. 1987. -The Political Economy of Poverty, Equity andGrowth." Paper presented at the Workshop on the PoliticalEconomy of Poverty, Equity and Growth. Oxford, England,September 26-29.
33

PPR Working Paper Series
Title Author Date Contact
WPS66 Slowing the Stork: Better Health forWomen through Family Planning Anthony R. Measham July 1988 A. Manciano
Roger W. Rochat 33226
WPS67 Price and Tax Policy for Semi-Subsistence Agriculture in Ethiopia Robert D. Weaver August 1988 D. Gustafson
Saad All Shire 33714
WPS68 A Comparison of Lamps for Domestic
Lighting in Developing Countries Robert van der Plas
WPS69 Does Local Financing Make Public
Primary Schools More Efficient?The Philippine Case Emmanual Jimenez August 1988 T. Hawkins
Vicente Paqueo 33678
Ma. Lourdes de Vera
WPS70 Vocational Education and EconomicEnvironments: Conflict orConvergence? Arvil V. Adams August 1988 T. Hawkins
Antoine Schwartz 33678
WPS71 School Effects on Student Achievementin Nigeria and Swaziland Marlaine Lockheed August 1988 T. Hawkins
Andre Komenan 33678
WPS72 The Relative Efficiency of Public
Schools in Developing Countries Emmanuel Jimenez August 1988 T. HawkinsMarlaine Lockheed 33678Vicente Paqueo
WPS73 Taxation and Output Growth in Africa Jonathan Skinner August 1988 A. Bhalla60359
WPS74 Fiscal Stabilization and Exchange Rate
Instability: A Theoretical Approach
and Some Policy Conclusions UsingMexican Data Andrew Feltenstein August 1988 A. Bhalla
Stephen Morris 60359
WPS75 Welfare Dominance and the Design ofExcise Taxation In the Cote d'lvoire Shlomo Yitzhaki August 1988 A. Bhalla
Wayne Thirsk 60359
WPS76 On the Shadow Price of a TaxInspector Shlomo Yitzhaki September 1988 A. Bhalla
Yitzhak Vakneen 60359
PPR Working Paper Series
Title Author Date Contact
WPS77 Incentive Policies and Agricultural
Performance in Sub-Saharan Africa Bela Balassa August 1988 N. Campbell33769
WPS78 Economists, Institutions and Trade
Restrictions: A Review Article J. Michael Finger September 1988 N. Artis33731
WPS79 Quantitative Appraisal ofAdjustment Lending Bela Balassa August 1988 N. Campbell
33769
WPS80 Emerging Issues of Privatization
and the Public Sector Samuel Paul September 1988 E. Madrona61711
WPS81 Reaching People at the Periphery:
Can the World Bank's Population,
Health, and Nutrition Operations
Do Better? Richard Heaver September 1988 S. Ainsworth31091
WPS82 Microeconomic Theory of the House-hold and Nutrition Programs Dov Chernichovsky September 1988 S. Ainsworth
Linda Zangwill 31091
WPS83 Welfare Costs of U.S. Quol-as in
Textiles, Steel, and Autos Jaime de Melo September 1988 C. Cabana
David Tarr 61539
WPS84 Black Markets for Foreign Exchange,
Real Exchange Rates and Inflation:
Overnight vs. Gradual Reform In
Sub-Saharan Africa Brian Pinto September 1988 S. Fallon61680
WPS85 Wage Responsiveness and Labor Market
Disequilibrium Ramon E. Lopez September 1988 L. Riveros
Luis A. Riveros 61762
WPS86 External Balance, Fiscal Policy and
Growth in Turkey Ritu Anand September 1988 A. Chhibber
Ajay Chhibber 60102
Sweder van Wijnbergen
WPS87 Vocational and Technical Education
in Peru Peter Moock October 1988 C. Cristobal
Rosemary Bellew 33648