Embed Size (px)
Citation preview
Vodafone Group Plc Interim Management Statement
For the 3 months ended 31 December 2011
9 February 2012
1
DRAFT 3 FEBRUARY 18.30
Disclaimer
Information in the following presentation relating to the price
at which relevant investments have been bought or sold in the
past or the yield on such investments cannot be relied upon as
a guide to the future performance of such investments. This
presentation does not constitute an offering of securities or
otherwise constitute an invitation or inducement to any person
to underwrite, subscribe for or otherwise acquire or dispose of
securities in any company within the Group.
The presentation contains forward-looking statements within
the meaning of the US Private Securities Litigation Reform Act
of 1995 which are subject to risks and uncertainties because
they relate to future events. Some of the factors which may
cause actual results to differ from these forward-looking
statements are discussed on the final slide of the presentation.
The presentation also contains certain non-GAAP financial
information. The Group’s management believes these measures
provide valuable additional information in understanding the
performance of the Group or the Group’s businesses because
they provide measures used by the Group to assess performance.
However, this additional information presented is not uniformly
defined by all companies, including those in the Group’s industry.
Accordingly, it may not be comparable with similarly titled
measures and disclosures by other companies. Additionally,
although these measures are important in the management of
the business, they should not be viewed in isolation or as
replacements for or alternatives to, but rather as complementary
to, the comparable GAAP measures.
Vodafone, the Vodafone logo, Vodafone One Net, Vodacom, M-
Pesa and the M-Pesa logo are trade marks of the Vodafone Group.
Other product and company names mentioned herein may be
the trade marks of their respective owners.
2

Q3 Highlights
• Group organic service revenue +0.9%, +3.1% ex MTRs
• Data +21.8%, enterprise +0.8%, AMAP +7.6%
• Strong cash generation, £1.5bn free cash flow
• 70%1 of share buybacks completed, £0.8bn spend during quarter
• Net debt £25.5bn
• FY 11/12 guidance for adjusted operating profit and free cash flow confirmed
3
All growth rates shown are organic unless otherwise stated
1. At 31 December 2011, £2.0bn spend on £4.0bn SFR programme, plus £2.8bn China Mobile programme completed in June 2011
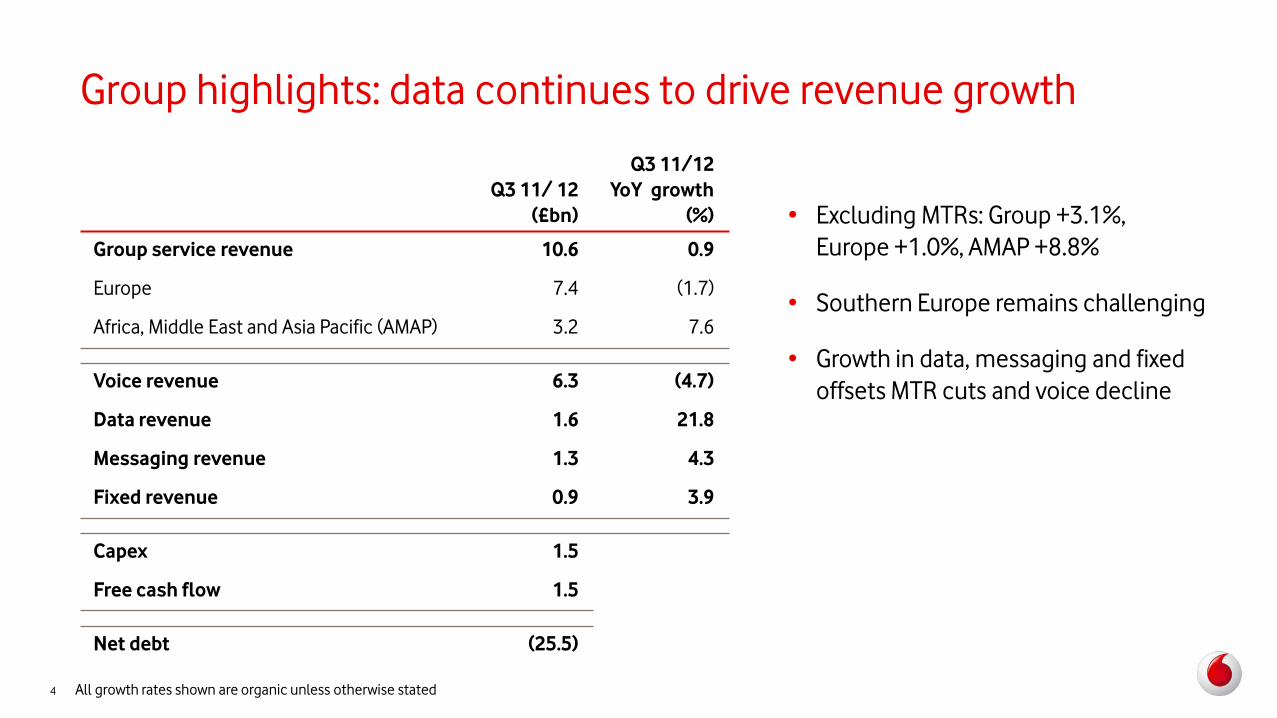
Q3 11/ 12
(£bn)
Q3 11/12
YoY growth
(%)
Group service revenue 10.6 0.9
Europe 7.4 (1.7)
Africa, Middle East and Asia Pacific (AMAP) 3.2 7.6
Voice revenue 6.3 (4.7)
Data revenue 1.6 21.8
Messaging revenue 1.3 4.3
Fixed revenue 0.9 3.9
Capex 1.5
Free cash flow 1.5
Net debt (25.5)
Group highlights: data continues to drive revenue growth
• Excluding MTRs: Group +3.1%,
Europe +1.0%, AMAP +8.8%
• Southern Europe remains challenging
• Growth in data, messaging and fixed
offsets MTR cuts and voice decline
4 All growth rates shown are organic unless otherwise stated
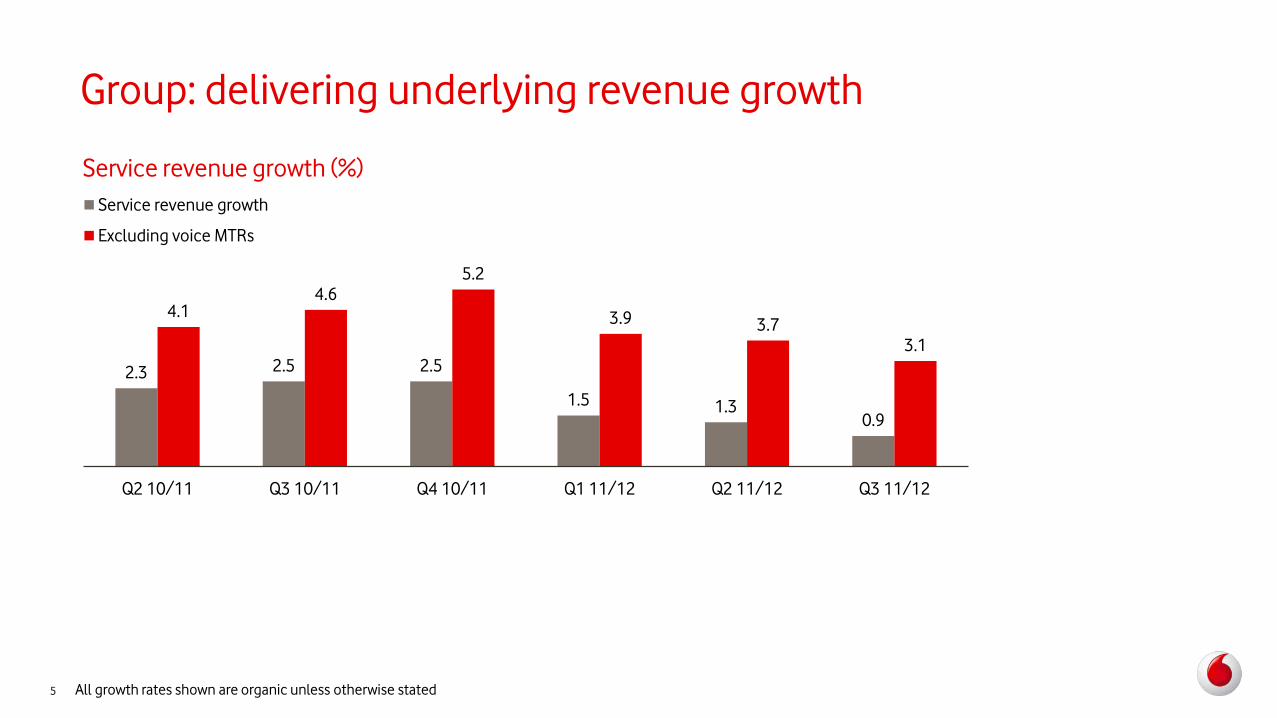
Group: delivering underlying revenue growth
2.3 2.5 2.5
1.5 1.3 0.9
4.1 4.6
5.2
3.9 3.7
3.1
Q2 10/11 Q3 10/11 Q4 10/11 Q1 11/12 Q2 11/12 Q3 11/12
Service revenue growth
Excluding voice MTRs
5 All growth rates shown are organic unless otherwise stated
Service revenue growth (%)
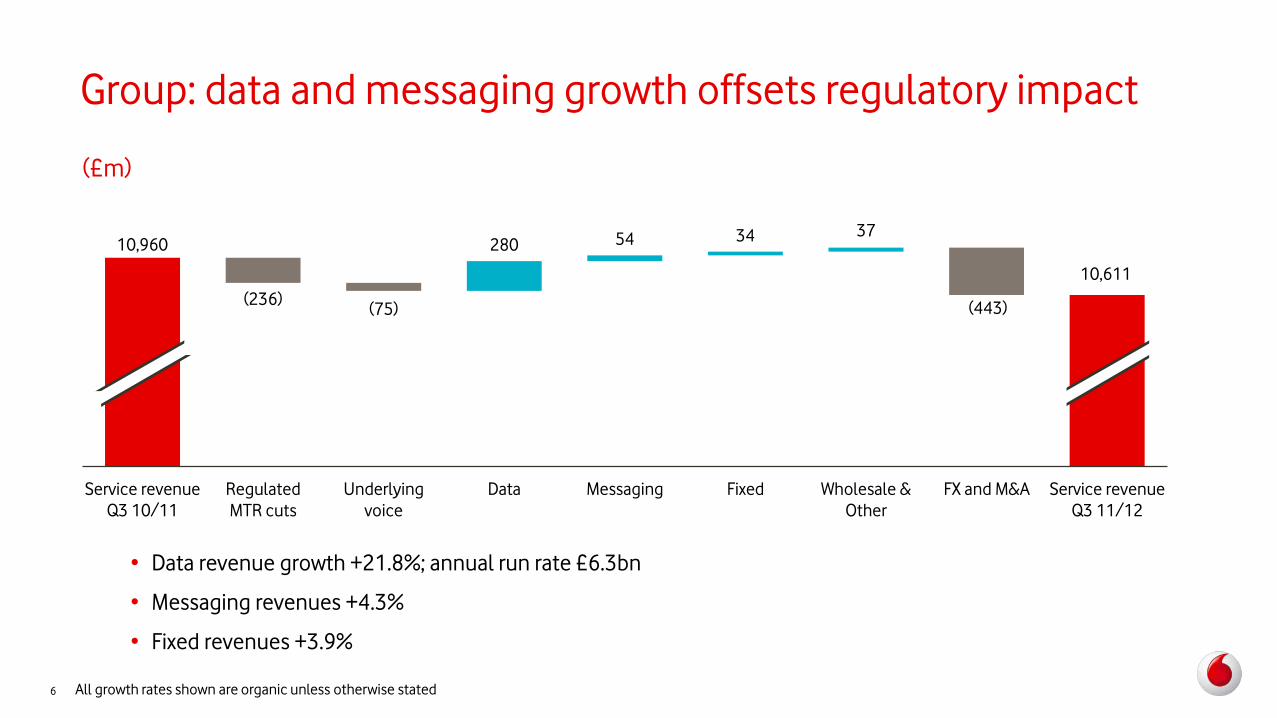
Group: data and messaging growth offsets regulatory impact
(£m)
10,960
(236) (75)
280 54 34 37
(443)
10,611
Service revenue
Q3 10/11
Regulated
MTR cuts
Underlying
voice
Data Messaging Fixed Wholesale &
Other
FX and M&A Service revenue
Q3 11/12
• Data revenue growth +21.8%; annual run rate £6.3bn
• Messaging revenues +4.3%
• Fixed revenues +3.9%
6 All growth rates shown are organic unless otherwise stated

1.0
0.2 0.2 0.1
(0.2) (0.2)
(0.9)
(1.3)
(0.6)
(1.7)
Turkey UK Germany Netherlands Greece Portugal Italy Spain Other
Europe: southern Europe remains challenging
Contribution to Q3 11/12 organic service revenue growth (ppt)
• Europe service revenue growth +1.0% excluding MTR impact
Q3 11/12
growth (%)
Europe
7 All growth rates shown are organic unless otherwise stated
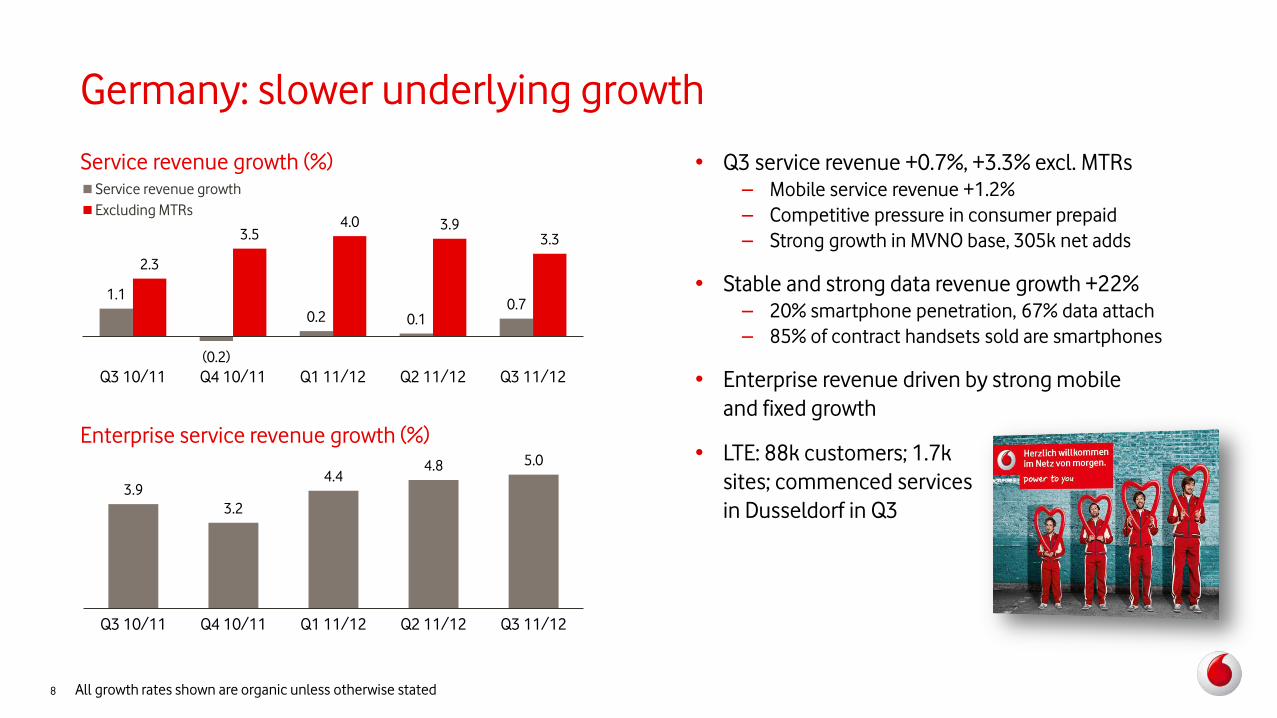
Germany: slower underlying growth
• Q3 service revenue +0.7%, +3.3% excl. MTRs
– Mobile service revenue +1.2%
– Competitive pressure in consumer prepaid
– Strong growth in MVNO base, 305k net adds
• Stable and strong data revenue growth +22%
– 20% smartphone penetration, 67% data attach
– 85% of contract handsets sold are smartphones
• Enterprise revenue driven by strong mobile
and fixed growth
• LTE: 88k customers; 1.7k
sites; commenced services
in Dusseldorf in Q3
Service revenue growth (%)
1.1
(0.2)
0.2 0.1 0.7
2.3
3.5 4.0 3.9
3.3
Q3 10/11 Q4 10/11 Q1 11/12 Q2 11/12 Q3 11/12
Service revenue growth
Excluding MTRs
Enterprise service revenue growth (%)
3.9
3.2
4.4 4.8 5.0
Q3 10/11 Q4 10/11 Q1 11/12 Q2 11/12 Q3 11/12
8 All growth rates shown are organic unless otherwise stated
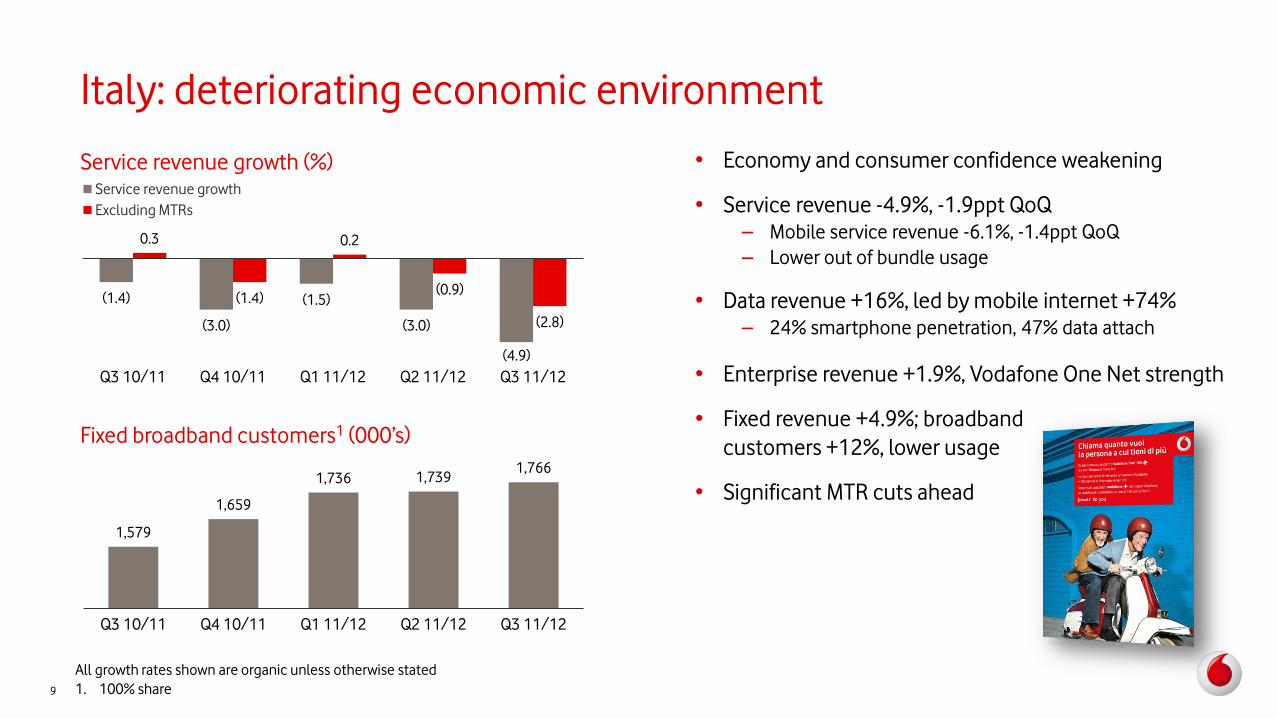
Italy: deteriorating economic environment
Service revenue growth (%)
Fixed broadband customers1 (000’s)
• Economy and consumer confidence weakening
• Service revenue -4.9%, -1.9ppt QoQ
– Mobile service revenue -6.1%, -1.4ppt QoQ
– Lower out of bundle usage
• Data revenue +16%, led by mobile internet +74%
– 24% smartphone penetration, 47% data attach
• Enterprise revenue +1.9%, Vodafone One Net strength
• Fixed revenue +4.9%; broadband
customers +12%, lower usage
• Significant MTR cuts ahead
(1.4)
(3.0)
(1.5)
(3.0)
(4.9)
0.3
(1.4)
0.2
(0.9)
(2.8)
Q3 10/11 Q4 10/11 Q1 11/12 Q2 11/12 Q3 11/12
Service revenue growth
Excluding MTRs
1,579
1,659
1,736 1,739 1,766
Q3 10/11 Q4 10/11 Q1 11/12 Q2 11/12 Q3 11/12
9
All growth rates shown are organic unless otherwise stated
1. 100% share
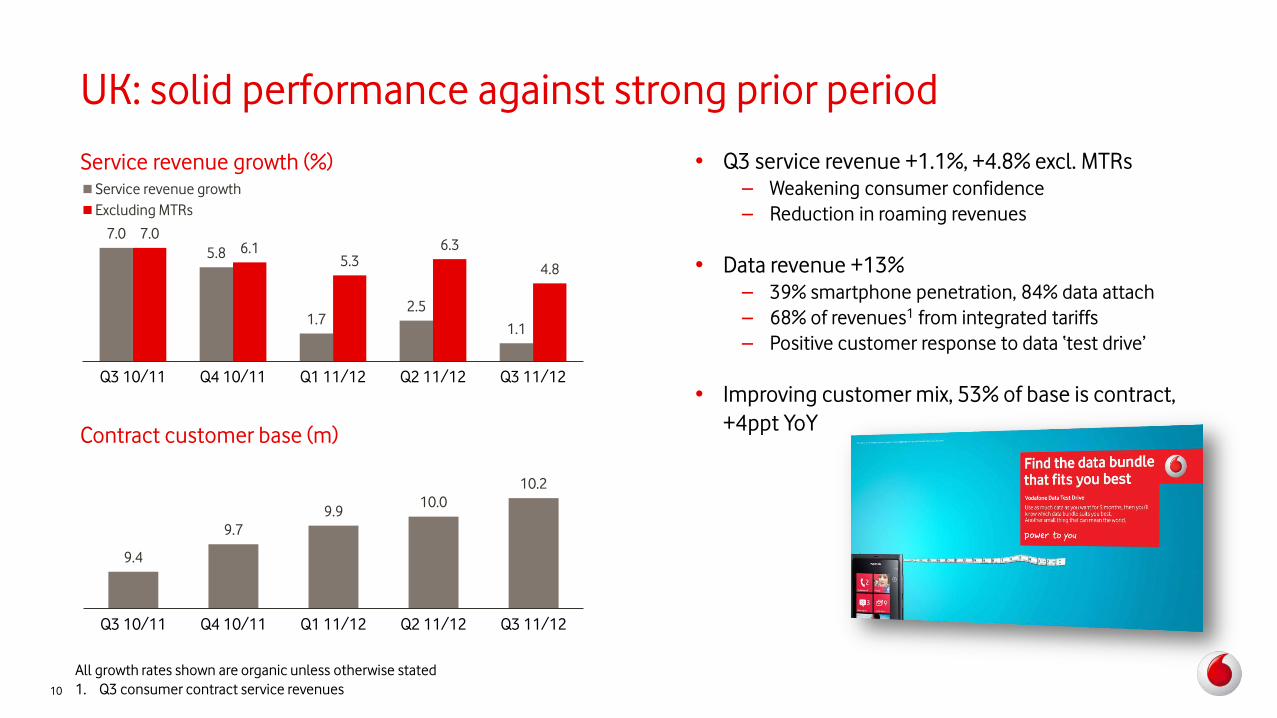
UK: solid performance against strong prior period
Contract customer base (m)
• Q3 service revenue +1.1%, +4.8% excl. MTRs
– Weakening consumer confidence
– Reduction in roaming revenues
• Data revenue +13%
– 39% smartphone penetration, 84% data attach
– 68% of revenues1 from integrated tariffs
– Positive customer response to data ‘test drive’
• Improving customer mix, 53% of base is contract,
+4ppt YoY
7.0
5.8
1.7 2.5
1.1
7.0 6.1
5.3 6.3
4.8
Q3 10/11 Q4 10/11 Q1 11/12 Q2 11/12 Q3 11/12
Service revenue growth
Excluding MTRs
9.4
9.7
9.9 10.0
10.2
Q3 10/11 Q4 10/11 Q1 11/12 Q2 11/12 Q3 11/12
Service revenue growth (%)
10
All growth rates shown are organic unless otherwise stated
1. Q3 consumer contract service revenues
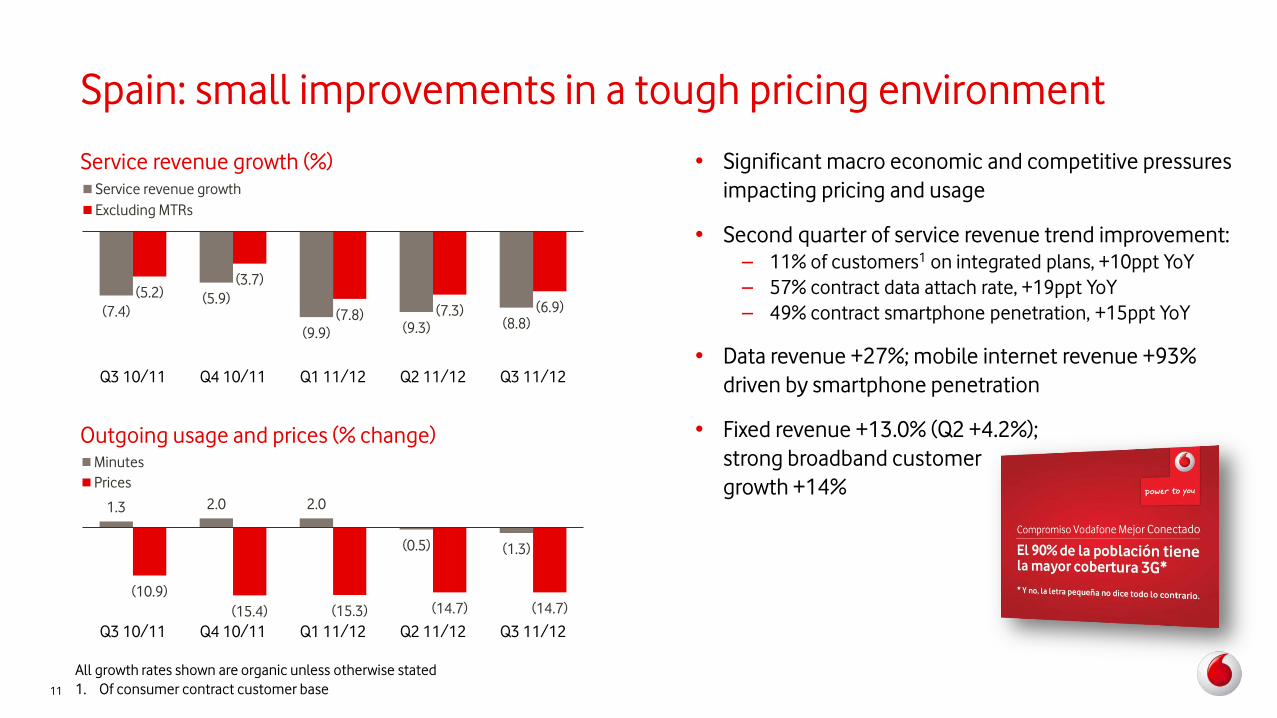
Spain: small improvements in a tough pricing environment
• Significant macro economic and competitive pressures
impacting pricing and usage
• Second quarter of service revenue trend improvement:
– 11% of customers1 on integrated plans, +10ppt YoY
– 57% contract data attach rate, +19ppt YoY
– 49% contract smartphone penetration, +15ppt YoY
• Data revenue +27%; mobile internet revenue +93%
driven by smartphone penetration
• Fixed revenue +13.0% (Q2 +4.2%);
strong broadband customer
growth +14%
Service revenue growth (%)
(7.4) (5.9)
(9.9) (9.3) (8.8)
(5.2) (3.7)
(7.8) (7.3) (6.9)
Q3 10/11 Q4 10/11 Q1 11/12 Q2 11/12 Q3 11/12
Service revenue growth
Excluding MTRs
Outgoing usage and prices (% change)
1.3 2.0 2.0
(0.5) (1.3)
(10.9)
(15.4) (15.3) (14.7) (14.7)
Q3 10/11 Q4 10/11 Q1 11/12 Q2 11/12 Q3 11/12
Minutes
Prices
11
All growth rates shown are organic unless otherwise stated
1. Of consumer contract customer base
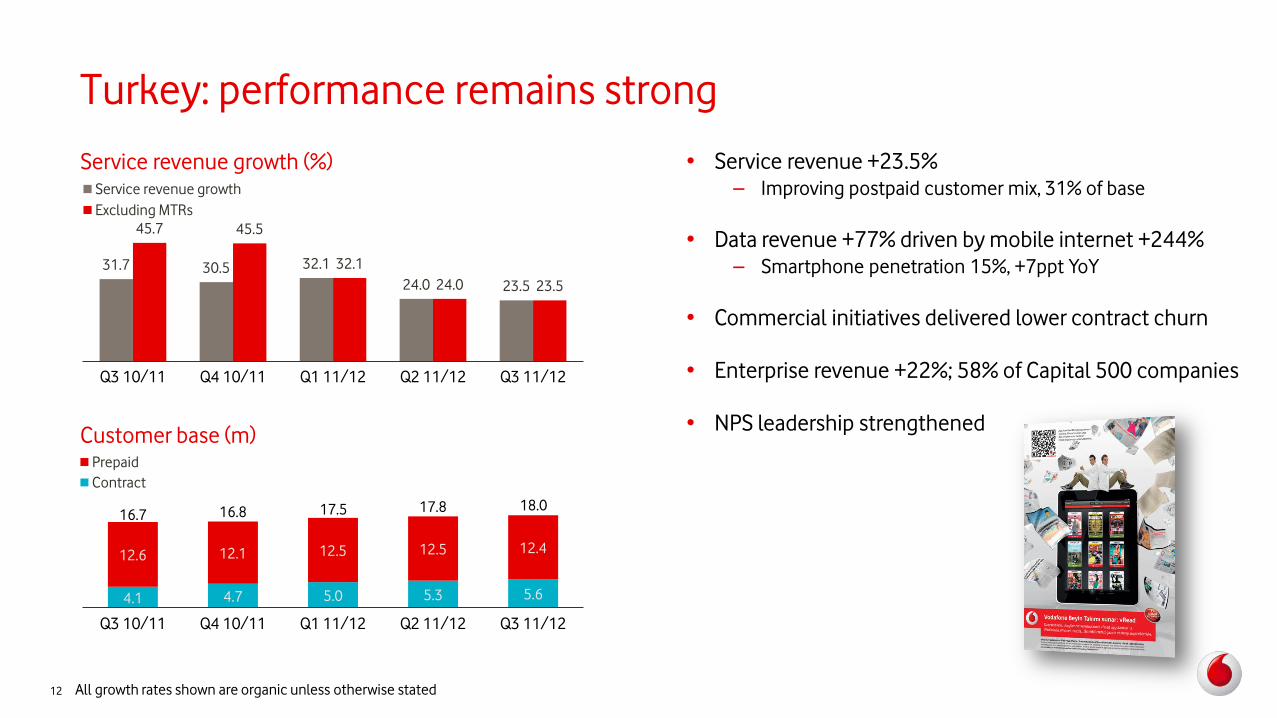
4.1 4.7 5.0 5.3 5.6
12.6 12.1 12.5 12.5 12.4
Q3 10/11 Q4 10/11 Q1 11/12 Q2 11/12 Q3 11/12
Prepaid
Contract
Turkey: performance remains strong
• Service revenue +23.5%
– Improving postpaid customer mix, 31% of base
• Data revenue +77% driven by mobile internet +244%
– Smartphone penetration 15%, +7ppt YoY
• Commercial initiatives delivered lower contract churn
• Enterprise revenue +22%; 58% of Capital 500 companies
• NPS leadership strengthened
16.7 16.8 17.5 17.8 18.0
Service revenue growth (%)
31.7 30.5 32.1
24.0 23.5
45.7 45.5
32.1
24.0 23.5
Q3 10/11 Q4 10/11 Q1 11/12 Q2 11/12 Q3 11/12
Service revenue growth
Excluding MTRs
Customer base (m)
12 All growth rates shown are organic unless otherwise stated
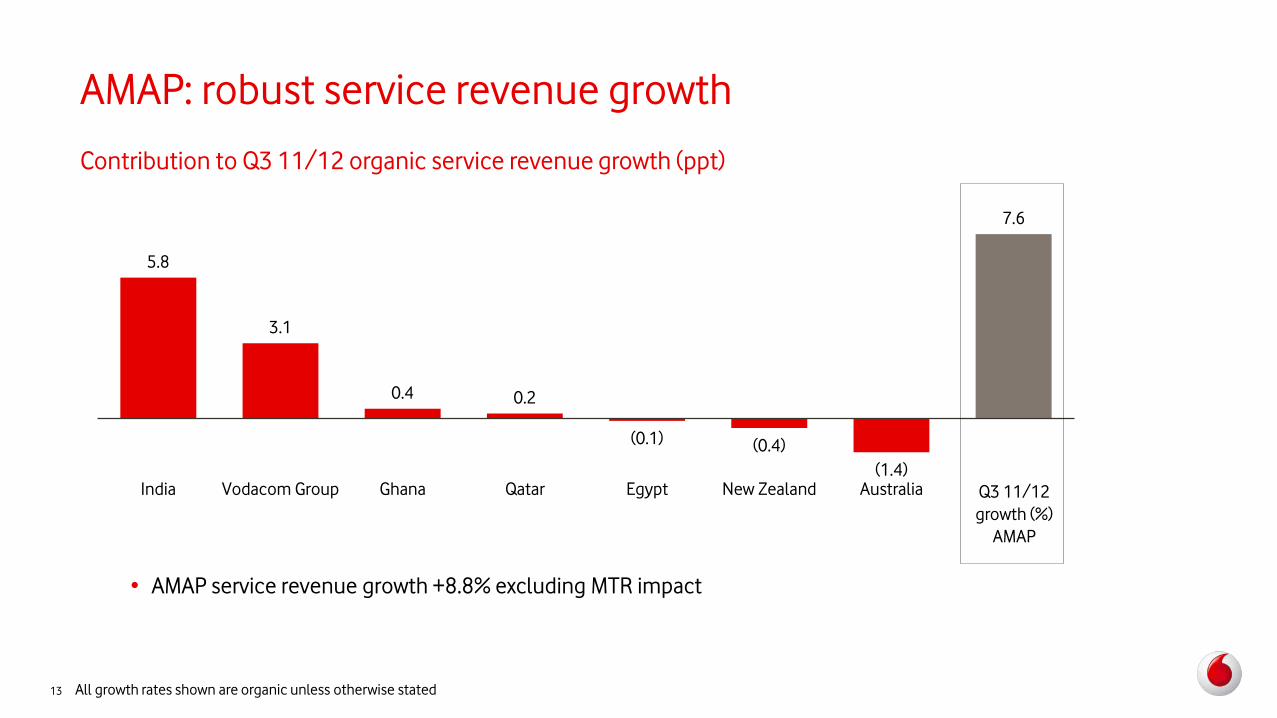
5.8
3.1
0.4 0.2
(0.1) (0.4)
(1.4)
7.6
India Vodacom Group Ghana Qatar Egypt New Zealand Australia
AMAP: robust service revenue growth
Q3 11/12
growth (%)
AMAP
• AMAP service revenue growth +8.8% excluding MTR impact
Contribution to Q3 11/12 organic service revenue growth (ppt)
13 All growth rates shown are organic unless otherwise stated

India: strong momentum
1.1
• Robust service revenue growth +20.0%
– Customer growth +19%; focus on quality
• Stable market prices; 56% of customer base on new
higher price plans
• Data revenue growth remains strong, +46%
– Led by mobile internet
– 31.2m data users, +2.3x YoY
• Regulatory environment
remains uncertain
Service revenue growth (%)
16.7 18.7
16.8 20.1 20.0
15.6 17.4 16.4
20.9 20.5
Q3 10/11 Q4 10/11 Q1 11/12 Q2 11/12 Q3 11/12
Consolidated including Indus
Excluding Indus
Outgoing prices (Rs per minute)
0.77 0.69 0.67 0.65 0.63 0.61 0.59 0.59 0.61
Q3
09/10
Q4
09/10
Q1
10/11
Q2
10/11
Q3
10/11
Q4
10/11
Q1
11/12
Q2
11/12
Q3
11/12
14 All growth rates shown are organic unless otherwise stated
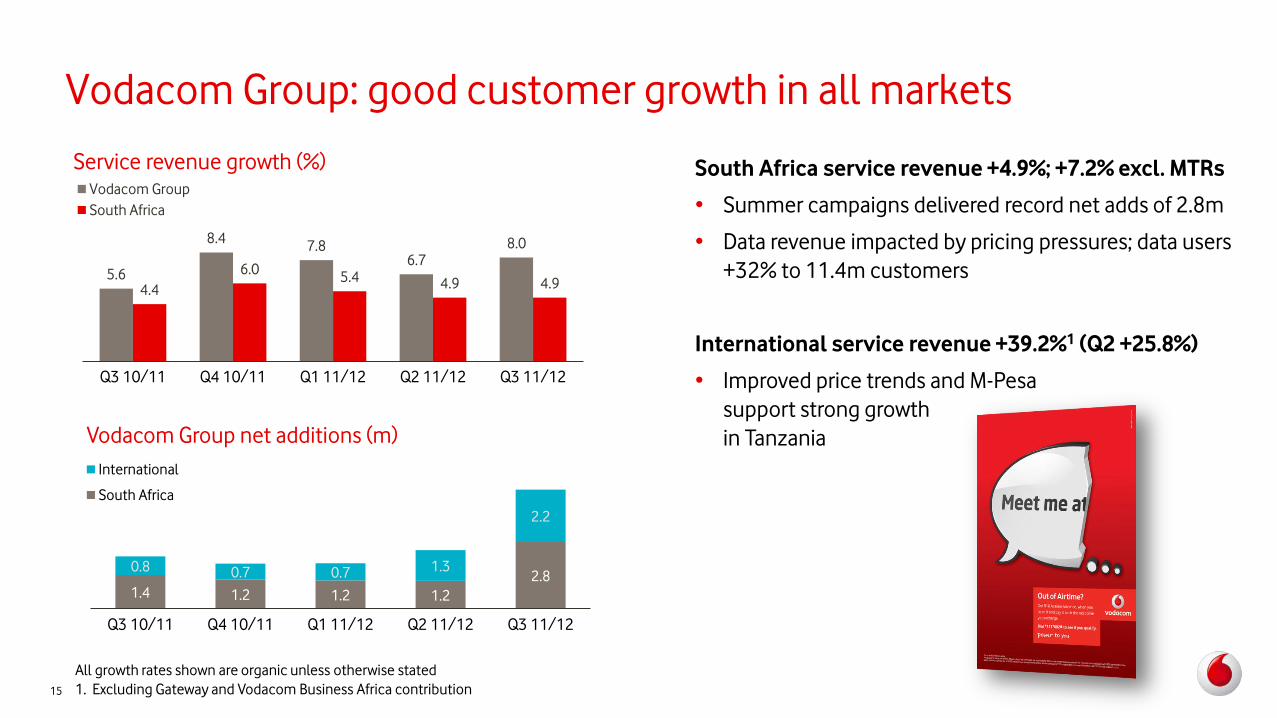
Vodacom Group: good customer growth in all markets
Service revenue growth (%)
5.6
8.4 7.8
6.7 8.0
4.4
6.0 5.4 4.9 4.9
Q3 10/11 Q4 10/11 Q1 11/12 Q2 11/12 Q3 11/12
Vodacom Group
South Africa
Vodacom Group net additions (m)
1.4 1.2 1.2 1.2
2.8 0.8 0.7 0.7 1.3
2.2
Q3 10/11 Q4 10/11 Q1 11/12 Q2 11/12 Q3 11/12
International
South Africa
South Africa service revenue +4.9%; +7.2% excl. MTRs
• Summer campaigns delivered record net adds of 2.8m
• Data revenue impacted by pricing pressures; data users
+32% to 11.4m customers
International service revenue +39.2%1 (Q2 +25.8%)
• Improved price trends and M-Pesa
support strong growth
in Tanzania
15
All growth rates shown are organic unless otherwise stated
1. Excluding Gateway and Vodacom Business Africa contribution
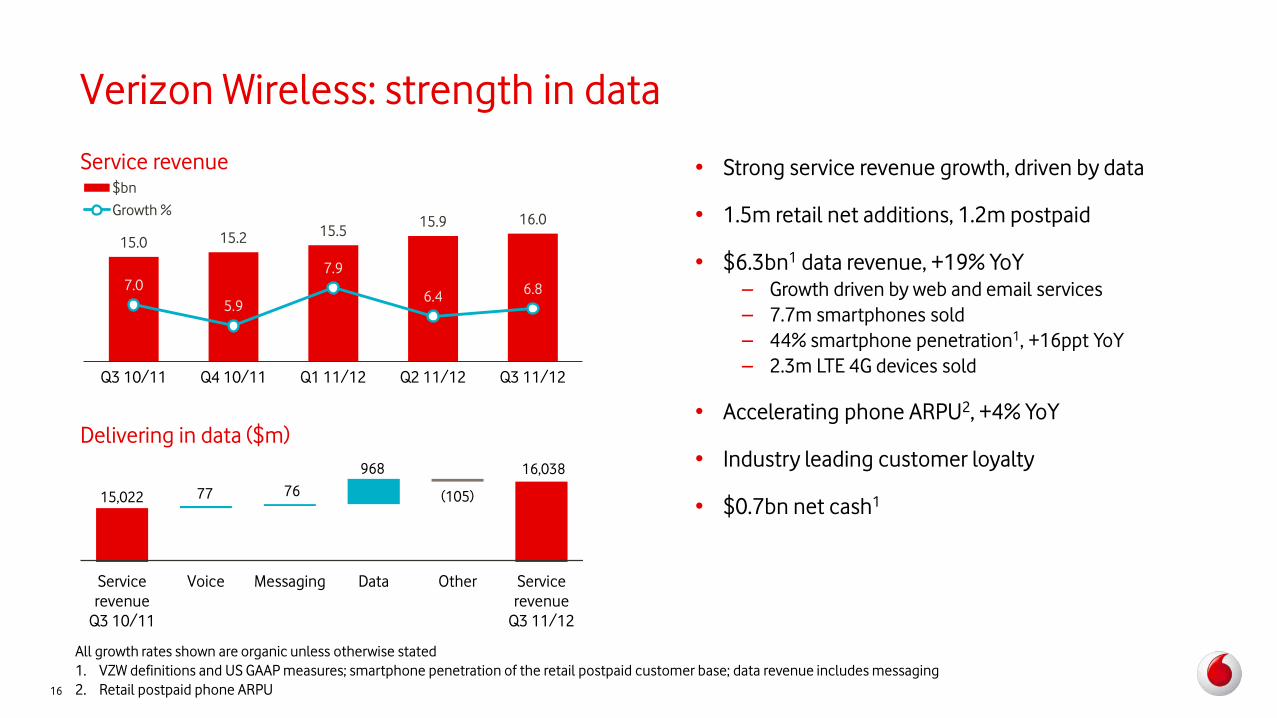
Verizon Wireless: strength in data
15.0 15.2 15.5
15.9 16.0
7.0
5.9
7.9
6.4 6.8
Q3 10/11 Q4 10/11 Q1 11/12 Q2 11/12 Q3 11/12
$bn
Growth %
Service revenue • Strong service revenue growth, driven by data
• 1.5m retail net additions, 1.2m postpaid
• $6.3bn1 data revenue, +19% YoY
– Growth driven by web and email services
– 7.7m smartphones sold
– 44% smartphone penetration1, +16ppt YoY
– 2.3m LTE 4G devices sold
• Accelerating phone ARPU2, +4% YoY
• Industry leading customer loyalty
• $0.7bn net cash1
Delivering in data ($m)
16
All growth rates shown are organic unless otherwise stated
1. VZW definitions and US GAAP measures; smartphone penetration of the retail postpaid customer base; data revenue includes messaging
2. Retail postpaid phone ARPU
15,022 77 76
968
(105)
16,038
Service
revenue
Q3 10/11
Voice Messaging Data Other Service
revenue
Q3 11/12
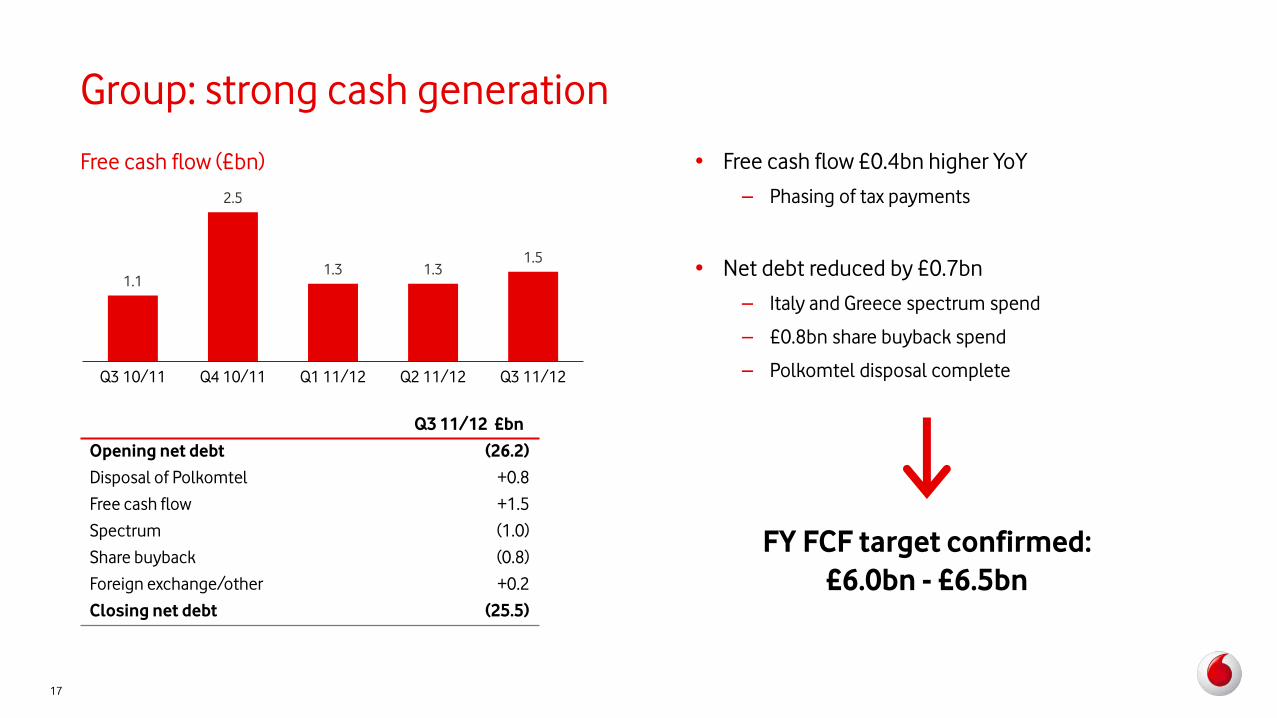
Q3 11/12 £bn
Opening net debt (26.2)
Disposal of Polkomtel +0.8
Free cash flow +1.5
Spectrum (1.0)
Share buyback (0.8)
Foreign exchange/other +0.2
Closing net debt (25.5)
Group: strong cash generation
FY FCF target confirmed:
£6.0bn - £6.5bn
Free cash flow (£bn)
1.1
2.5
1.3 1.3 1.5
Q3 10/11 Q4 10/11 Q1 11/12 Q2 11/12 Q3 11/12
• Free cash flow £0.4bn higher YoY
– Phasing of tax payments
• Net debt reduced by £0.7bn
– Italy and Greece spectrum spend
– £0.8bn share buyback spend
– Polkomtel disposal complete
17
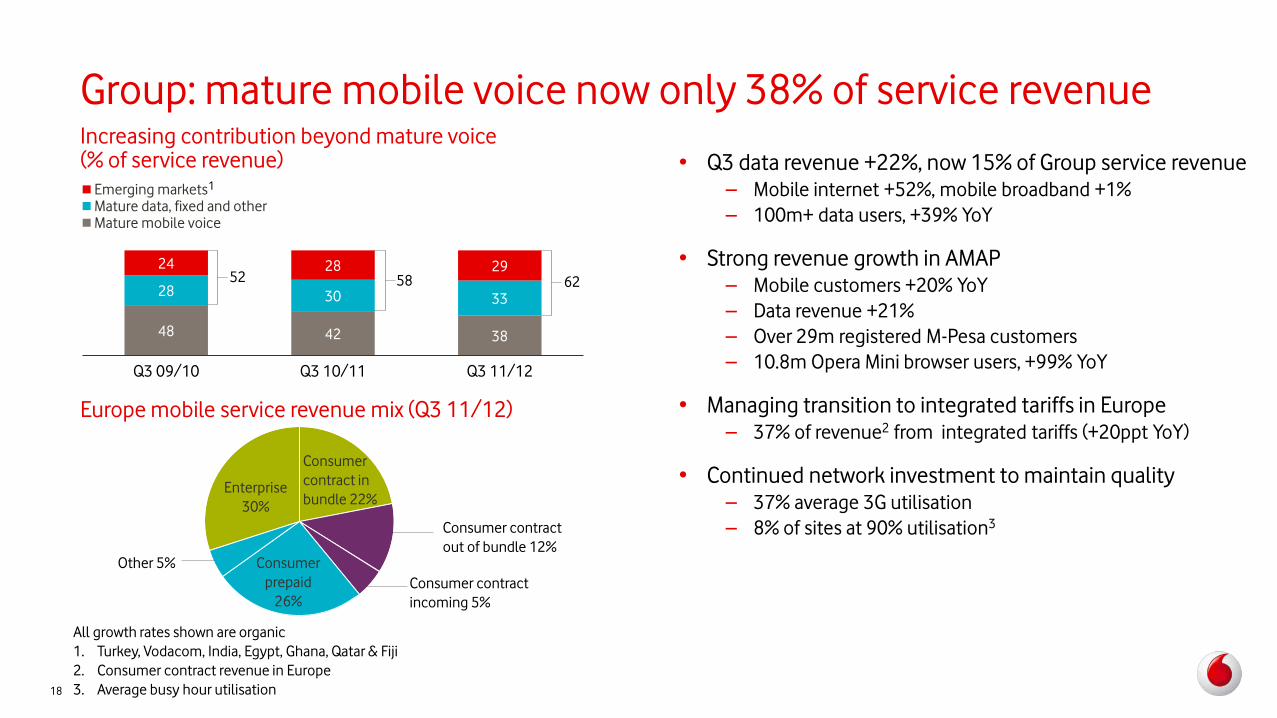
Group: mature mobile voice now only 38% of service revenue
• Q3 data revenue +22%, now 15% of Group service revenue
– Mobile internet +52%, mobile broadband +1%
– 100m+ data users, +39% YoY
• Strong revenue growth in AMAP
– Mobile customers +20% YoY
– Data revenue +21%
– Over 29m registered M-Pesa customers
– 10.8m Opera Mini browser users, +99% YoY
• Managing transition to integrated tariffs in Europe
– 37% of revenue2 from integrated tariffs (+20ppt YoY)
• Continued network investment to maintain quality
– 37% average 3G utilisation
– 8% of sites at 90% utilisation3
Increasing contribution beyond mature voice (% of service revenue)
48 42 38
28 30 33
24 28 29
Q3 09/10 Q3 10/11 Q3 11/12
Emerging marketsMature data, fixed and otherMature mobile voice
62 58 52
Europe mobile service revenue mix (Q3 11/12)
All growth rates shown are organic
1. Turkey, Vodacom, India, Egypt, Ghana, Qatar & Fiji
2. Consumer contract revenue in Europe
3. Average busy hour utilisation 18
1
Enterprise
30%
Consumer
contract in
bundle 22%
Consumer
prepaid
26%
Other 5%
Consumer contract
incoming 5%
Consumer contract
out of bundle 12%
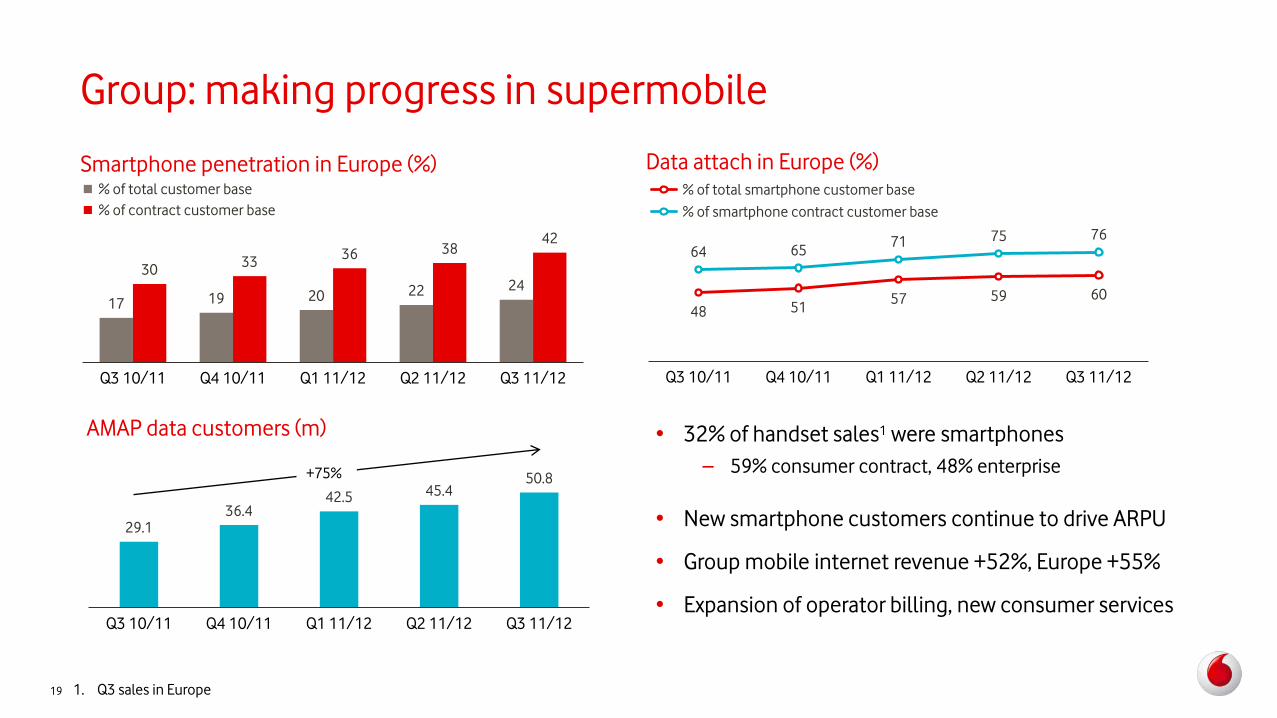
Group: making progress in supermobile
• 32% of handset sales1 were smartphones
– 59% consumer contract, 48% enterprise
• New smartphone customers continue to drive ARPU
• Group mobile internet revenue +52%, Europe +55%
• Expansion of operator billing, new consumer services
Smartphone penetration in Europe (%)
17 19 20 22 24 30
33 36 38
42
Q3 10/11 Q4 10/11 Q1 11/12 Q2 11/12 Q3 11/12
% of total customer base
% of contract customer base
Data attach in Europe (%)
48 51 57 59 60
64 65 71 75 76
Q3 10/11 Q4 10/11 Q1 11/12 Q2 11/12 Q3 11/12
% of total smartphone customer base
% of smartphone contract customer base
29.1 36.4
42.5 45.4 50.8
Q3 10/11 Q4 10/11 Q1 11/12 Q2 11/12 Q3 11/12
AMAP data customers (m)
+75%
1. Q3 sales in Europe 19

We are delivering a more valuable Vodafone
20
• Revenue growth; data +21.8%, AMAP +7.6%
• Pushing smartphone penetration and integrated tariffs
• Continuing to invest in network quality
• Rigorous capital discipline; £6.8bn share buy back commitment, 70%1 complete
• Verizon Wireless dividend received; India tax case resolved
• Strong underlying free cash flow
All growth rates shown are organic unless otherwise stated
1. At 31 December 2011, £2.0bn spend on £4.0bn SFR programme, plus £2.8bn China Mobile programme completed in June 2011
Forward-looking statements This presentation contains “forward-looking statements” within the meaning of the US Private Securities Litigation Reform Act of 1995 with respect to the Group’s financial condition,
results of operations and businesses and certain of the Group’s plans and objectives. In particular, such forward-looking statements include: the financial guidance confirmation
contained in slide 17 in relation to free cash flow and guidance relating to adjusted operating profit; statements relating to the Group’s future performance generally; statements
relating to the development and launch of certain products, services and technologies, including the LTE network and 3G and 4G service; expectations regarding the regulatory
environment in which the Group operates; expectations regarding mobile data growth; statements relating to movements in foreign exchange rates; expectations regarding adjusted
operating profit, free cash flows, costs, tax rates, tax settlements, mobile termination rates, ARPU and capital expenditures; expectations regarding cost efficiency programmes;
expectations regarding the Group’s share buyback programmes; and expectations regarding the integration or performance of current and future investments, associates, joint
ventures and newly acquired businesses, as well as expectations concerning recent disposals.
Forward-looking statements are sometimes, but not always, identified by their use of a date in the future or such words as “will”, “anticipates”, “aims”, “could”, “may”, “should”,
“expects”, “believes”, “intends”, “plans” or “targets”. By their nature, forward-looking statements are inherently predictive, speculative and involve risk and uncertainty because they
relate to events and depend on circumstances that will occur in the future. There are a number of factors that could cause actual results and developments to differ materially from
those expressed or implied by these forward-looking statements. These factors include, but are not limited to, the following: changes in macroeconomic or political conditions in
markets served by operations of the Group that would adversely affect the level of demand for mobile services, and changes to the associated legal, regulatory and tax environments;
greater than anticipated competitive activity, from both existing competitors and new market entrants (including MVNOs), which could require changes to the Group’s pricing models,
lead to customer churn or make it more difficult to acquire new customers; levels of investment in network capacity and the Group’s ability to deploy new technologies, products and
services in a timely manner, particularly data content and services, or the rapid obsolescence of existing technology; higher than expected costs, mobile termination rates or capital
expenditures; and rapid changes to existing products and services and the inability of new products and services to perform in accordance with expectations, including as a result of
third party or vendor marketing efforts.
Furthermore, a review of the reasons why actual results and developments may differ materially from the expectations disclosed or implied within forward-looking statements can be
found by referring to the information contained under the heading “Forward-looking statements“ in the Group’s half-year financial report for the six months ended 30 September 2011
and “Principal risk factors and uncertainties” in the Group’s annual report for the year ended 31 March 2011, both of which can be found on the Group’s website (www.vodafone.com).
All subsequent written or oral forward-looking statements attributable to the Company or any member of the Group or any persons acting on their behalf are expressly qualified in
their entirety by the factors referred to above. No assurances can be given that the forward-looking statements in this presentation will be realised. Except as otherwise stated herein
and as may be required to comply with applicable law and regulations, Vodafone does not intend to update these forward-looking statements and does not undertake any obligation
to do so.
21