Embed Size (px)
Citation preview

BanAsset/LiabilitY.;fIManagemen:~~byMaryB~khM
'-../
A Primer on Core DepositDuration (Part 3)
'-'"
A simplified framework for understanding the sensitivityof duration estimates to assumptions, and assessing theirreasonableness, will ease the complicated issues facing theasset/liability management (ALM) professional. This guidewill assist in the estimation and reporting of duration of vari-0us core deposit products, many of which are numerous andcomplicated. This three-part series of articles contains threesections. Part I discussed Section I, the textbook definitionof effective duration applicable to core deposits (see BALMJune 2006, p. 7). Part 2 (see BALM August 2006, p. 3)discussed a simplified rate model to capture several keyaspects of bank pricing behavior. One of the four stan-dard rate parameters was shown to dominate the others.
This final part in this series of articles will discuss Sec-tion III, balance sensitivity assumptions and core depositduration.
""-./
Section III - Balance Sensitivity Assumptions andCore Deposit Duration. In the prior section, we demon-strated that duration effects of the interaction between
balance maturity and rate assumptions depend upon howthe rate is modeled. Even a simple balance sensitivity modelcan significantly complicate the calculation of duration.The balance sensitivity model displayed in Exhibit I onpage 2 has four parameters that determine its location in thetwo-q1mensionalspace defined in the exhibit. These are:. Maximum monthly balance growth rate (maxgrowth). Zero growth spread (ZGS). Balance sensitivity to spread (a.k.a. the slope of the
line in Exhibit 1)(elasticity). Maximum monthly balance outflow rate(maxoutflow).
The equation governing the figure is
(6)MAX{MIN[elasticity(productspread- ZGS),maxgrowth],maxoutflow}
Vol.22, No.9September 2006
In This Issue:
. A Primer on Core Deposit Duration (Part 3) 1
. Interest Rat!; Swaps 4
. Outsourcing the ALM Process-A 2006Update ... 5
Editorial Board:
Thomas E. Bowers, CFA, IPS-Sendero
George K. Darling, Darling Consulting Group
Gregory W. Doner, Financial Institutions Management Associates
David Easton, Bank of America
Mark Evans, Vining-Sparks IBG
Ira G. Kawaller, Kawaller and Co., LLC
Alan Kolosna, Net.8@nk
Jon Kozlowski, SunTrust Banks, Inc.
William McGuire, McGuire Performance Solutions, Inc.
Deedee Myers, DDJ Myers Ltd.
Fred Poorman, Jr., CFA, The ALM Network
Joel L. Rosenberg, U.S. Banking Alliance
Thomas Day, SunGard
Equation (6) captures key characteristics incorporatedinto models of deposit balances: When deposit rates arenear, or above, market rates (for example, banks raisingdeposits on the Internet frequently pay above LIBOR),bank balances tend to increase. When deposit rates aresignificantly below market rates, balances tend to declineor grow below trend. Trend factors can be added to themodel, by placing a constantterm in front of equation (6).(Equations I through 5 are shown in Parts 1 and 2 of thisarticle series.)
An Example (see Exhibit 2). Suppose we set the follow-ing parameters for the above model:. Maxgrowth = 1%. Maxoutflow = - 1%

Bank Asset/Liability Mana~ement
EXHIBIT1.STYLIZEDMODELOFBALANCESENSITIVITY
~
t+.eO!a:.t:a:0
(;>-:E'E0:;
II Max OutflowI
Market. Deposit !:late (Prici~g Spread in 'Yo),I'
. ZGS= 3%
. Elasticity= -.5Basedon theseparameters, balances grow when the pricingspread is less than 3 percent and decline when spreads arewider than 3 percent. There is some sensitivity modeled sothat even wider spreads lead to some balance outflows cappedat 1 percent per month. Narrower spreads lead to balancegrowth and these too are capped at 1 percent per month.
Estimating balance sensitivity parameters from bankdata often is very difficult, and we make no claim thatequation (6) is a perfect representation of balance behav-ior. The purpose of the model is conceptual: to capture themajor components of how balances might react and tostudy how these behaviors impact core deposit durationestimates. As we show next, even with this simple model,incorporating rate sensitive balances into a model of coredeposit duration complicates the model significantly. Weshow that the results are dependent upon how much bal-ance sensitivity is built into the model and whether bal-ance growth is allowed.
Under What Circumstances Should Balance Growth
be Incorporated into a Dnration Model? This questionplagues the estimation of core deposit duration, as well asother measures of interest rate risk. The answer dependsentirely on the purpose of the calculation. Exhibit 3 on page 3categorizes some of the issues relevant to the question.
As indicated in Exhibit 3, a significant range ofapproaches exists for modeling core deposit balances.Regulators typically prefer more conservative assump-tions, particularly when applied to liquidity analyses. Bycontrast, risk managers may be interested in more liberalassumptions.However, if the purpose is to measure eco-nomic value sensitivity, the right answer is to make ex-plicit decisions about what is to be included in a measureof equity at risk.
2
EXHIBIT2.EXAMPLEOFSTYLIZEDBALANCEMODEL " /
~
~~cD1aa:.t:
~0
&~.t:E0:;
8
Max Outflow
6 70 2
Market -Deposit~Rate (Pricing Spread in o/~
If the bank pedges the exposures of its economic eq-uity (including the core deposit intangible) to changes ininterest rates, then some measure of trend balance growthmay need to be included in the measure. Alternatively, ifbank management only wants to hedge existing balances,it may need to employ more conservative assumptions inits deposit balance models. In either case, these assump-tions can be nested in the model described in Exhibit 1.
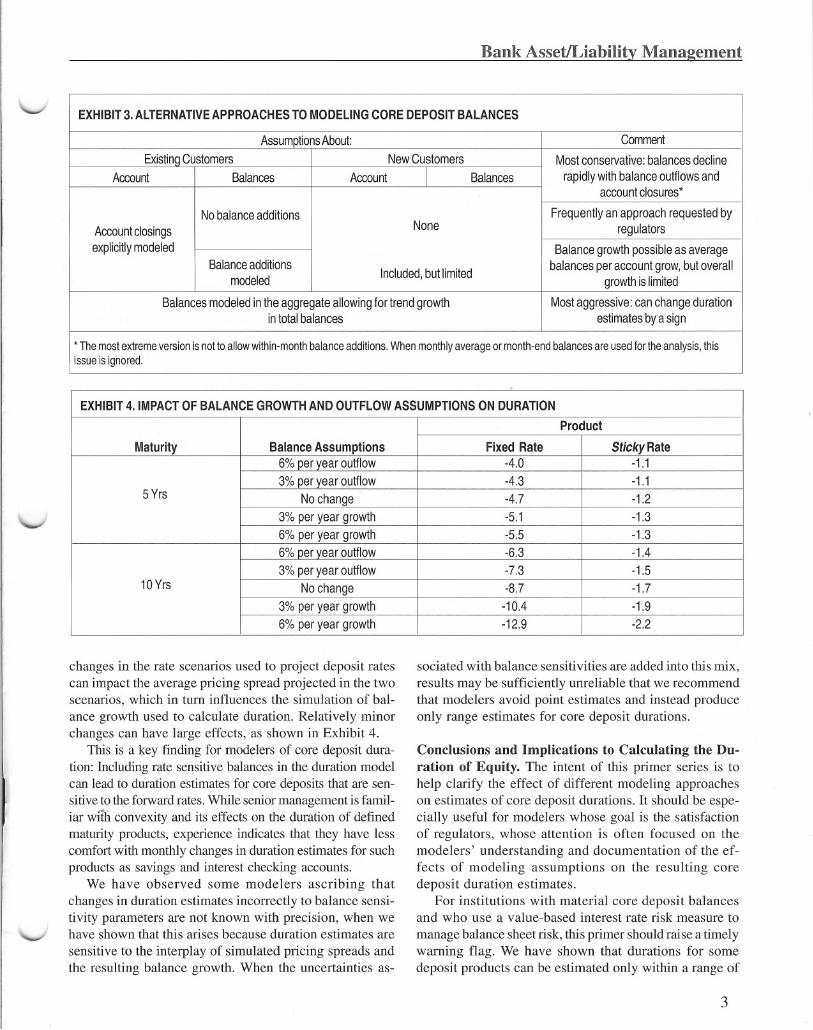
Next we consider two pricing examples and how thebalance modeling assumptions may impact duration. Inthis case, we need to consider both balance sensitivity tointerest rates and maturity. We use two maturity profilesto demonstrate the effects.. Product 1: Fixed-rate deposit paying 1.5 percent. Product 2: Sticky floating rate deposit with a propor- .
tionality factor of .75 and pricing lags of 0.25In Exhibit 4, the impact of variations in the rate of balancegrowth on effective duration is reported. As indicated, al-ternative balance growth assumptions impact the value ina way consistent with the view that growing balances ex-tend duration and declining balances shorten duration. Theimpact varies with the stickiness of the rate.
v
Including Balance Sensitivities in Models of CoreDeposit Duration. Incorporating rate sensitive balancegrowth assumption complicates the interpretation of theresults, which are responsive to both the balance sensitiv-ity parameters and the rate scenarios used to calculateduration. When rate sensitive balance models are excluded,the rate scenario used to calculate duration has little im-
pact. This is because the second rate scenario used in thecalculation is a shock ofthe first. Including balance sensi-tivities can change this result because, in one rate sce-nario, balances may grow; in the second, balances maydecline, depending on exactly how the balance sensitivityparameters are set. In other words, relatively minor
\--1
'-..I
'-"
\..-I
BankAssetILiabilityManagement
changes in the rate scenarios used to project deposit ratescan impact the average pricing spread projected in the twoscenarios, which in turn influences the simulation of bal-ance growth used to calculate duration. Relatively minorchanges can have large effects, as shown in Exhibit 4.
This is a key finding for modelers of core deposit dura-tion: Including rate sensitive balances in the duration modelcan lead to duration estimates for core deposits that are sen-sitive to the forward rates. While senior management is famil-iar wltli convexity and its effects on the duration of definedmaturity products, experience indicates that they have lesscomfort with monthly changes in duration estimates for suchproducts as savings and interest checking accounts.
We have observed some modelers ascribing thatchanges in duration estimates incorrectly to balance sensi-tivity parameters are not known with precision, when wehave shown that this arises because duration estimates are
sensitive to the interplay of simulated pricing spreads andthe resulting balance growth. When the uncertainties as-
sociated with balance sensitivities are added into this mix,results may be sufficiently unreliable that we recommendthat modelers avoid point estimates and instead produceonly range estimates for core deposit durations.
Conclusions and Implications to Calculating the Du-ration of Equity. The intent of this primer series is tohelp clarify the effect of different modeling approacheson estimates of core deposit durations. It should be espe-cially useful for modelers whose goal is the satisfactionof regulators, whose attention is often focused on themodelers' understanding and documentation of the ef-fects of modeling assumptions on the resulting coredeposit duration estimates.
For institutions with material core deposit balancesand who use a value-based interest rate risk measure to
manage balance sheet risk, this primer should raise a timelywarning flag. We have shown that durations for somedeposit products can be estimated only within a range of
3
EXHIBIT3.ALTERNATIVEAPPROACHESTOMODELINGCOREDEPOSITBALANCES
AssumptionsAbout: Comment
ExistinqCustomers NewCustomers Mostconservative:balancesdeclineAccount Balances Account I Balances rapidlywithbalanceoutflowsand
accountclosures*
Nobalanceadditions FrequentlyanapproachrequestedbyAccountclosings
None regulatorsexplicitlymodeled Balancegrowthpossibleasaverage
BalanceadditionsIncluded,butlimited balancesperaccountgrow,butoverall
modeled growthislimited
Balancesmodeledintheaggregateallowingfortrendgrowth Mostaggressive:canchangedurationintotalbalances estimatesbyasign
*Themostextremeversionisnottoallowwithin-monthbalanceadditions.Whenmonthlyaverageormonth-endbalancesareusedfortheanalysis,thisissueisignored.
EXHIBIT4.IMPACTOFBALANCEGROWTHANDOUTFLOWASSUMPTIONSONDURATION
Product
Maturity BalanceAssumptions FixedRate StickyRate6%peryearoutflow -4.0 -1.1
3%peryearoutflow -4.3 -1.15Yrs Nochange -4.7 -1.2
3%peryeargrowth -5.1 -1.3
6%peryeargrowth -5.5 -1.36%Dervearoutflow -6.3 -1.4
3%peryearoutflow -7.3 -1.510Yrs Nochange -8.7 -1.7
3%peryeargrowth -10.4 -1.9
6%peryeargrowth -12.9 -2.2

Bank Asset/Liability Management
values because of uncertainties associated with balance
responses to interest rates. Asset/liability (A/L) managersand their AIL management committees (ALCOs) shouldrecognize the resulting uncertainty regarding the estimatedduration of equity and factor it into the evaluation of both risklimits and balance sheet hedge design. Risk measurementand risk limit processes relying on these measures shouldincorporate this uncertainty into their decision making.
MICHAEL R. ARNOLD, PRINCIPAL,
ALCO Partners, LLC
Interest Rate SwapsAs derivatives have grown in popularity over the past de-cade in the private sector, it makes sense that govern-ments have found derivatives useful as well. Recently, theGovernmental Accounting Standards Board (GASB) hasproposed that "the fair value of derivatives be reported asassets or liabilities in the financial statements (dependingupon whether they represent resources or claims on re-sources, respectively)." This change, if approved, will ex-pose derivatives to readers of financial statements, so gov-ernments that currently use or plan to use these instrumentsshould become well-founded in the basics of derivative in-
struments. This article discusses interest rate swaps.This two-part series will discuss the benefits of de-
rivatives, and focus on swaps-their transaction struc-ture and terms, typical swap transactions, alternatives toplain vanillas, participants, market structure-primary andsecondary markets and swap documentation. The serieswill conclude with a brief discussion of the potential prob-lems of swaps.
Benefits of Derivatives. Both Standard and Poor's and
Moody's (Standard and Poor's Rating Group February2002 and Moody's Investors Service October 2002) bondrating services view the prudent use of variable rate debtand interest rate swaps as part of a municipal bond issuer'srisk management program. Interest rate swaps can be aneffective tool in meeting funding needs and managing thebala.tlce sheet while limiting risk. Swaps also increase fi-nancial flexibility and reduce interest costs. The GFOAalso believes that derivative products can be an importantinterest rate management tool (GFOA Recommended Prac-tice, Use of Debt-Related Derivatives and the Develop-ment of a Derivative Policy (2003 and 2005)).
For instance, a swap product such as a synthetic float-ing rate swap with basis swap could be established withthe goal to introduce a limited amount of floating rate ex-posure to lower debt interest costs. This derivative strat-egy would require the following action steps:
4
. Execute a fixed-to-floating interest rate swap, wherethe government receives fix interest and pays interestbased on the Bond Market Association (BMA) Index;. Arrange for a seven-year term to limit risk; and. Add a basis swap to hedge the floating rate risk whileproducing incremental cash flow savings.
The expected result of this hedge would be to lower debtinterest costs by a defined percentage.
J
Interest Rate Swap Definition. An interest rate swap issimply an agreement between two parties to exchange in-terest cash flows. It is a common misconception that theexchanged cash flows are always a fixed rate and a float-ing rate. However, fixed/floating swaps are typical but hardlythe only type of swaps.
In a swap, one party agrees with a counterparty toexchange cash flows at periodic intervals. The parties ex-change cash flows that are based upon different interestrate amounts for a given period, which is called the tenor.Of course, this does not work well unless both parties arepaying interest on the same amount of principal. The amountof principal involved in a swap contract is called the notionalamount. It is called the notional amount because no principalever changes hands. Only interest amounts are exchangedbetween the parties. Swap market participants refer to no-tional principal because, unlike bonds or other conventionalcredit instruments, swaps do not involve an exchange ofprincipal. Rather, the swap parties state the principal amountonly as a basis for determining the sizes of the coupon pay-ments. In this application, principal is only a referencepoint or idea, hence the term.
In fact, only the net amount of interest due to one ofthe two parties is exchanged. When rates are high, thefloating-rate recipient gets the net difference between theinterest due based on the floating-rate and the interest dueto the counterparty based on the fixed-rate. When ratesare low, the fixed-rate recipient receives the net differencefrom the counterparty.
v
Swap Transaction Structure and Terms. Most often,one cash flow derives from a fixed interest rate, the otherfrom a floating interest rate, although both could be float-ing, and the market has developed innumerable variationson the theme. The most common example is where oneparty pays the counterparty a fixed rate of interest. At thesame time, the counterparty pays a floating rate of interestto the first party. Thus, you might hear of someone agree-ing to pay fixed and receive floating on $50 million no-tional for five years. That obligates the parties to 10 semi-annual cash flow exchanges. Only the net amount of in-terest due to one of the two parties is exchanged. Whenrates are high, the floating-rate recipient gets the net dif-ference between the interest due based on the floating rate
v