Embed Size (px)
Citation preview
AMERICAN JOURNAL OF PHYSIOL~CY
Vol. 231, No. 3, September 1976. Printed in U.S.A.
Thermoregulation in fasting emperor penguins
under natural conditions
YVON LE MAHO, PHILIPPE DELCLITTE, AND JOSEPH CHATONNET Laboratoire de Thermoregulation du Centre National de la Recherche Scientifique, Universite Claude Bernard, 8 Avenue Rockefeller, 69373 Lyon cedex 2; and Equipe de Recherche de Biologie Animale Antarctique, Museum National d’Histoire Naturelle, Paris, France
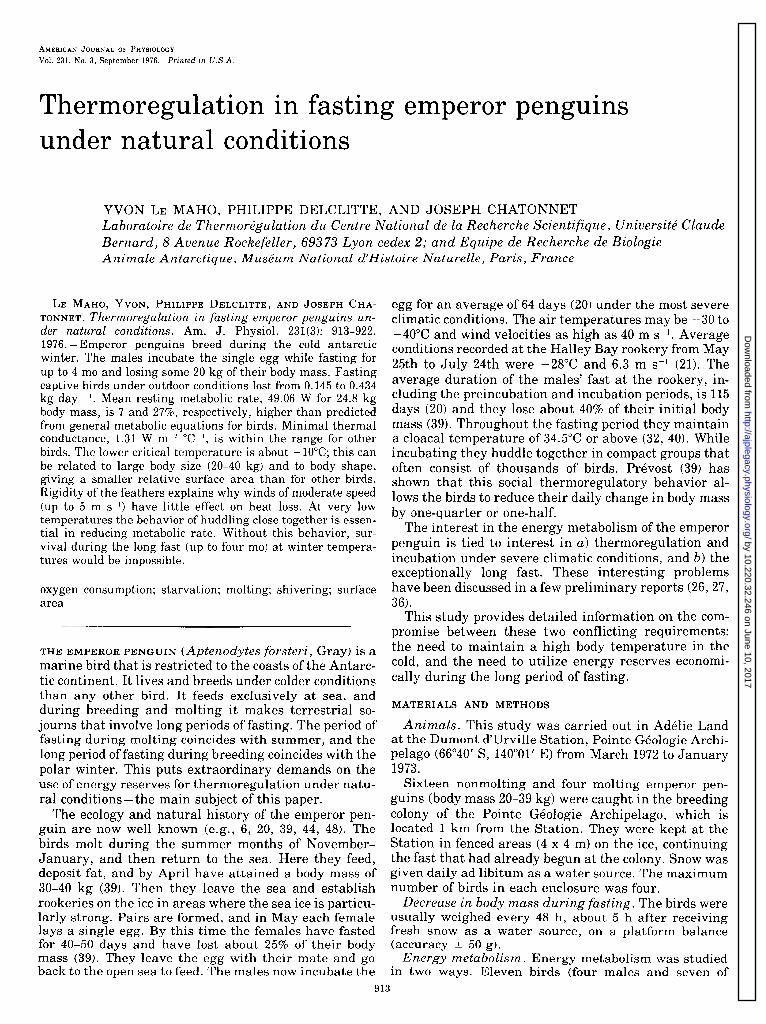
LE MAHO, YVON, PHILIPPE DELCLITTE, AND JOSEPH CHA- TONNET. Thermoregulation in fasting emperor penguins un- der naturaL conditions. Am. J. Physiol. 231(3): 913-922. 1976. -Emperor penguins breed during the cold antarctic winter. The males incubate the single egg while fasting for up to 4 mo and losing some 20 kg of their body mass. Fasting captive birds under outdoor conditions lost from 0.145 to 0.434 kg day -I. Mean resting metabolic rate, 49.06 W for 24.8 kg body mass, is 7 and 27%, respectively, higher than predicted from general metabolic equations for birds. Minimal thermal conductance, 1.31 W m-” OCY, is within the range for other birds. The lower critical temperature is about - 10°C; this can be related to large body size (20-40 kg) and to body shape, giving a smaller relative surface area than for other birds. Rigidity of the feathers explains why winds of moderate speed (up to 5 m s-l) have little effect on heat loss. At very low temperatures the behavior of huddling close together is essen- tial in reducing metabolic rate. Without this behavior, sur- vival during the long fast (up to four mo) at winter tempera- tures would be impossible.
oxygen consumption; starvation; molting; shivering; surface area
THE EMPEROR PENGUIN (Aptenodytes forsteri, Gray) is a marine bird that is restricted to the coasts of the Antarc- tic continent. It lives and breeds under colder conditions than any other bird. It feeds exclusively at sea, and during breeding and molting it makes terrestrial so- journs that involve long periods of fasting. The period of fasting during molting coincides with summer, and the long period of fasting during breeding coincides with the polar winter. This puts extraordinary demands on the use of energy reserves for thermoregulation under natu- ral conditions- the main subject of this paper.
The ecology and natural history of the emperor pen- guin are now well known (e.g., 6, 20, 39, 44, 48). The birds molt during the summer months of November- January, and then return to the sea. Here they feed, deposit fat, and by April have attained a body mass of 30-40 kg (39). Then they leave the sea and establish rookeries on the ice in areas where the sea ice is particu- larly strong. Pairs are formed, and in May each female lays a single egg. By this time the females have fasted for 40-50 days and have lost about 25% of their body mass (39). They leave the egg with their mate and go back to the open sea to feed. The males now incubate the
egg for an average of 64 days (20) under the most severe climatic conditions. The air temperatures may be -30 to -40°C and wind velocities as high as 40 m s-l. Average conditions recorded at the Halley Bay rookery from May 25th to July 24th were -28°C and 6.3 m s-l (21). The average duration of the males’ fast at the rookery, in- cluding the preincubation and incubation periods, is 115 days (20) and they lose about 40% of their initial body mass (39). Throughout the fasting period they maintain a cloaca1 temperature of 34.5”C or above (32, 40). While incubating they huddle together in compact groups that often consist of thousands of birds. Prevost (39) has shown that this social thermoregulatory behavior al- lows the birds to reduce their daily change in body mass by one-quarter or one-half.
The interest in the energy metabolism of the emperor penguin is tied to interest in a) thermoregulation and incubation under severe climatic conditions, and b) the exceptionally long fast. These interesting problems have been discussed in a few preliminary reports (262’7, 36)
This study provides detailed information on the com- promise between these two conflicting requirements: the need to maintain a high body temperature in the cold, and the need to utilize energy reserves economi- cally during the long period of fasting.
MATERIALS AND METHODS
Animals. This study was carried out in Adelie Land at the Dumont d’urville Station, Pointe Geologie Archi- pelago (66”40’ S, 14O”Ol’ E) from March 1972 to January 1973.
Sixteen nonmolting and four molting emperor pen- guins (body mass 20-39 kg) were caught in the breeding colony of the Pointe Geologie Archipelago, which is located 1 km from the Station. They were kept at the Station in fenced areas (4 x 4 m) on the ice, continuing the fast that had already begun at the colony. Snow was given daily ad libitum as a water source. The maximum number of birds in each enclosure was four.
Decrease in body mass during fasting. The birds were usually weighed every 48 h, about 5 h after receiving fresh snow as a water source, on a platform balance (accuracy t 50 g).
Energy metabolism. Energy metabolism was studied in two ways. Eleven birds (four males and seven of
913
by 10.220.32.246 on June 10, 2017http://ajplegacy.physiology.org/
Dow
nloaded from
914
unknown sex) were used for measurements of rate of oxygen consumption (Vo,) and carbon dioxide produc- tion (vco,), from which their metabolic rate was calcu- lated. An estimate of total metabolic rate was also ob- tained from daily change in body mass.
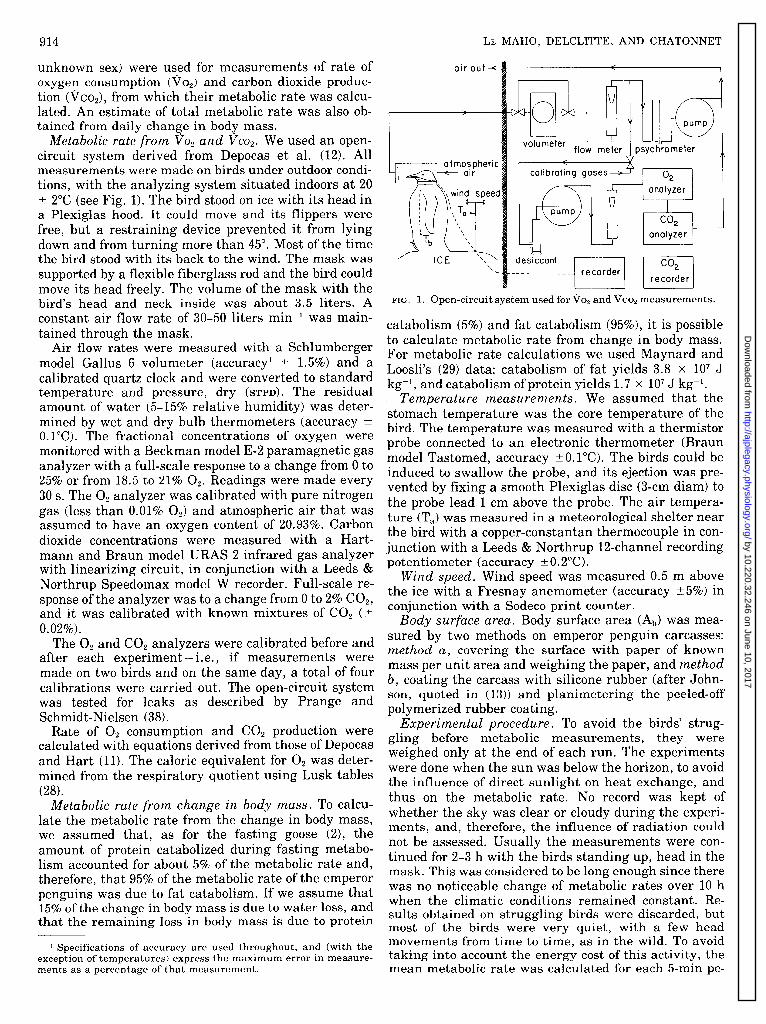
Metabolic rate from PO, and Vco2. We used an open- circuit system derived from Depocas et al. (12). All measurements were made on birds under outdoor condi- tions, with the analyzing system situated indoors at 20 t 2°C (see Fig. 1). The bird stood on ice with its head in a Plexiglas hood. It could move and its flippers were free, but a restraining device prevented it from lying down and from turning more than 45”. Most of the time the bird stood with its back to the wind. The mask was supported by a flexible fiberglass rod and the bird could move its head freely. The volume of the mask with the bird’s head and neck inside was about 3.5 liters. A constant air flow rate of 30-50 liters min-’ was main- tained through the mask.
Air flow rates were measured with a Schlumberger model Gallus 6 volumeter (accuracy’ t 1.5%) and a calibrated quartz clock and were converted to standard temperature and pressure, dry (STPD). The residual amount of water (545% relative humidity) was deter- mined by wet and dry bulb thermometers (accuracy t O.l”C). The fractional concentrations of oxygen were monitored with a Beckman model E-2 paramagnetic gas analyzer with a full-scale response to a change from 0 to 25% or from 18.5 to 21% 0,. Readings were made every 30 s. The 0, analyzer was calibrated with pure nitrogen gas (less than 0.01% 02) and atmospheric air that was assumed to have an oxygen content of 20.93%. Carbon dioxide concentrations were measured with a Hart- mann and Braun model URAS 2 infrared gas analyzer with linearizing circuit, in conjunction with a Leeds & Northrup Speedomax model W recorder. Full-scale re- sponse of the analyzer was to a change from 0 to 2% C02, and it was calibrated with known mixtures of CO, (+ 0.02%).
The 0, and CO, analyzers were calibrated before and after each experiment - i.e., if measurements were made on two birds and on the same day, a total of four calibrations were carried out. The open-circuit system was tested for leaks as described by Prange and Schmidt-Nielsen (38).
Rate of 0, consumption and CO, production were calculated with equations derived from those of Depocas and Hart (11). The caloric equivalent for 0, was deter- mined from the respiratory quotient using Lusk tables
(28) . Metabolic rate from change in body mass. To calcu-
late the metabolic rate from the change in body mass, we assumed that, as for the fasting goose (2>, the amount of protein catabolized during fasting metabo- lism accounted for about 5% of the metabolic rate and, therefore, that 95% of the metabolic rate of the emperor penguins was due to fat catabolism. If we assume that 15% of the change in body mass is due to water loss, and that the remaining loss in body mass is due to protein
* Specifications of accuracy are used throughout, and (with the exception of temperatures) express the maximum error in measure- ments as a percentage of that measurement.
LE MAHO, DELCLITTE, AND CHATONNET
oir out f-
/-- ICE ‘\, \
volumeter _
1 . calibrating gases :
FIG. 1. Open-circuit system used for Tjo2 and T]Tco2 measurements.
catabolism (5%) and fat catabolism (95%), it is possible to calculate metabolic rate from change in body mass. For metabolic rate calculations we used Maynard and Loosli’s (29) data: catabolism of fat yields 3.8 x lo7 J
kg -l, and catabolism of protein yields 1.7 x lo7 J kg-l. Temperature measurements. We assumed that the
stomach temperature was the core temperature of the bird. The temperature was measured with a thermistor probe connected to an electronic thermometer (Braun model Tastomed, accuracy +O.l”C). The birds could be induced to swallow the probe, and its ejection was pre- vented by fixing a smooth Plexiglas disc (3-cm diam) to the probe lead 1 cm above the probe. The air tempera- ture (T,) was measured in a meteorological shelter near the bird with a copper-constantan thermocouple in con- junction with a Leeds & Northrup 12-channel recording potentiometer (accuracy 2 0.2OC).
Wind speed. Wind speed was measured 0.5 m above the ice with a Fresnay anemometer (accuracy +5%) in conjunction with a Sodeco print counter.
Body surface area. Body surface area (A,,) was mea- sured by two methods on emperor penguin carcasses: method a, covering the surface with paper of known mass per unit area and weighing the paper, and method b, coating the carcass with silicone rubber (after John- son, quoted in (13)) and planimetering the peeled-off polymerized rubber coating.
Experimental procedure. To avoid the birds’ strug- gling before metabolic measurements, they were weighed only at the end of each run. The experiments were done when the sun was below the horizon, to avoid the influence of direct sunlight on heat exchange, and thus on the metabolic rate. No record was kept of whether the sky was clear or cloudy during the experi- ments, and, therefore, the influence of radiation could not be assessed. Usually the measurements were con- tinued for 2-3 h with the birds standing up, head in the mask. This was considered to be long enough since there was no noticeable change of metabolic rates over 10 h when the climatic conditions remained constant. Re- sults obtained on struggling birds were discarded, but most of the birds were very quiet, with a few head movements from time to time, as in the wild. To avoid taking into account the energy cost of this activity, the mean metabolic rate was calculated for each 5-min pe-
by 10.220.32.246 on June 10, 2017http://ajplegacy.physiology.org/
Dow
nloaded from
THERMOREGULATION IN EMPEROR PENGUINS
riod during a 30-min period of minimum activity, during which the climatic conditions could be considered con- stant (less than 1°C variation for ambient temperature and less than 20% variation for wind speed). The lowest observed metabolic rate for a 5-min period was consid- ered to be the metabolic rate of the bird at rest.
Units and conversion factors. The International Sys- tem of Units (30) has been used throughout this paper. Data and equations from the literature have been ap- propriately converted to this system when necessary for calculations or comparisons. Statistical methods follow those of Sokal and Rohlf (43).
RESULTS
Decrease in Body Mass During Fasting
1) Nonmolting birds. The decrease in body mass dur- ing fasting was studied in 16 nonmolting birds (four males and 12 birds of unknown sex). Two other birds (two females) were released because they would not settle down in captivity. The initial body mass of the 16 birds was between 20.35 and 38.60 kg and their final body mass was between 15.00 and 22.85 kg (Table 1). Their length of fasting in captivity was from 10 to 74 days and their decrease in body mass ranged from 2.40 to 15.75 kg.
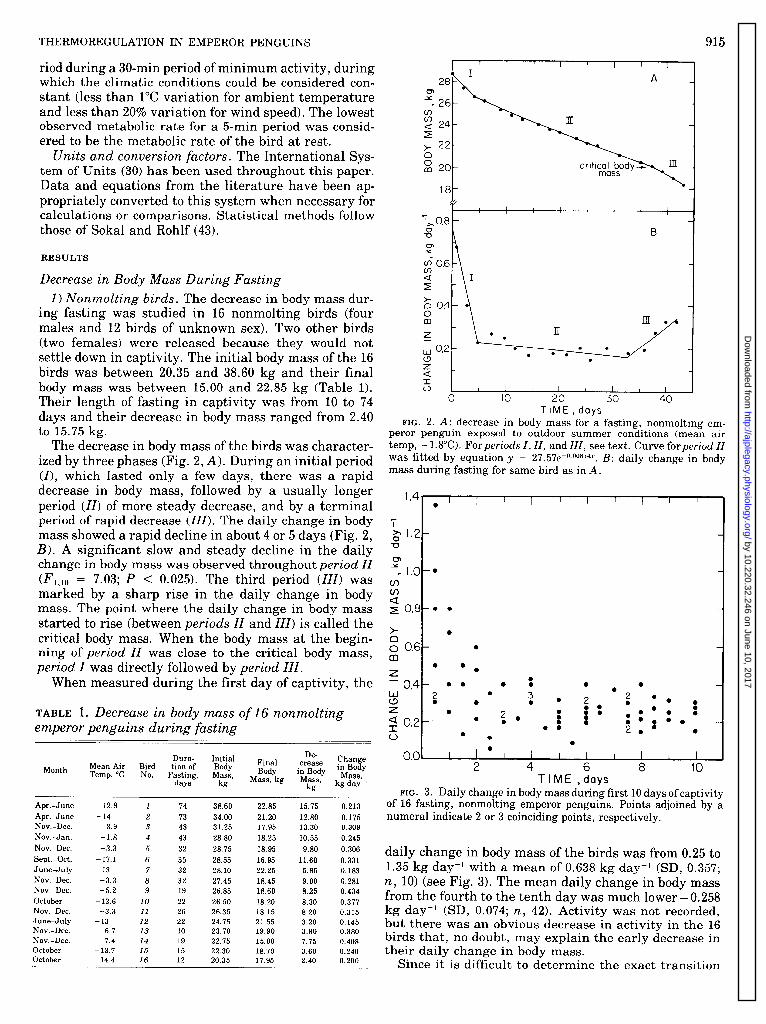
The decrease in body mass of the birds was character- ized by three phases (Fig. 2, A). During an initial period (I), which lasted only a few days, there was a rapid decrease in body mass, followed by a usually longer period (II) of more steady decrease, and by a terminal period of rapid decrease (ZZZ). The daily change in body mass showed a rapid decline in about 4 or 5 days (Fig. 2, B). A significant slow and steady decline in the daily change in body mass was observed throughout period ZZ (F 1,lO = 7.03; P < 0.025). The third period (ZZZ) was marked by a sharp rise in the daily change in body mass. The point where the daily change in body mass started to rise (between periods ZZ and ZZZ) is called the critical body mass. When the body mass at the begin- ning of period ZZ was close to the critical body mass, period Z was directly followed by period ZZZ.
When measured during the first day of captivity, the
TABLE 1. Decrease in body mass of 16 nonmolting emperor penguins during fasting
Month
Dura- Initial De- Chan e
Mean Air Bird tion of Body Final crease Body in Body in Bo %
Temp, “C No. y
Fasting, Mass, Mass, days kg
Mass, kg Mass, kg
kg day-’
Apr. -June Apr. -June
Nov.-Dec.
Nov.-Jan.
Nov. -Dec.
Sept.-Oct.
June-July
Nov. -Dec.
Nov. -Dec.
October
Nov.-Dec.
June-July
Nov. -Dec.
Nov.-Dec.
October
October -
- 12.9 1
-14 2 -3.9 3
-1.8 4
-3.3 5
-17.1 6
-13 7
-3.3 8
-5.2 9
- 13.6 10
-3.3 11
-13 12
-6.7 13
-7.4 14
- 13.7 15 - 14.4 16
74 38.60 22.85 15.75
73 34.00 21.20 12.80
43 31.25 17.95 13.30
43 28.80 18.25 10.55
32 28.75 18.95 9.80
35 28.55 16.95 11.60
32 28.10 22.25 5.85 32 27.45 18.45 9.00 19 26.85 18.60 8.25
22 26.50 18.20 8.30
26 26.35 18.15 8.20
22 24.75 21.55 3.20
10 23.70 19.90 3.80
19 22.75 15.00 7.75
15 22.30 18.70 3.60
12 20.35 17.95 2.40
0.213
0.175
0.309
0.245
0.306
0.331
0.183
0.281 0.434
0.377
0.315
0.145 0.380
0.408
0.240
0.200
0.01 0 I I I I I I I I I 1
2 4 6 8 10 TIME ,days
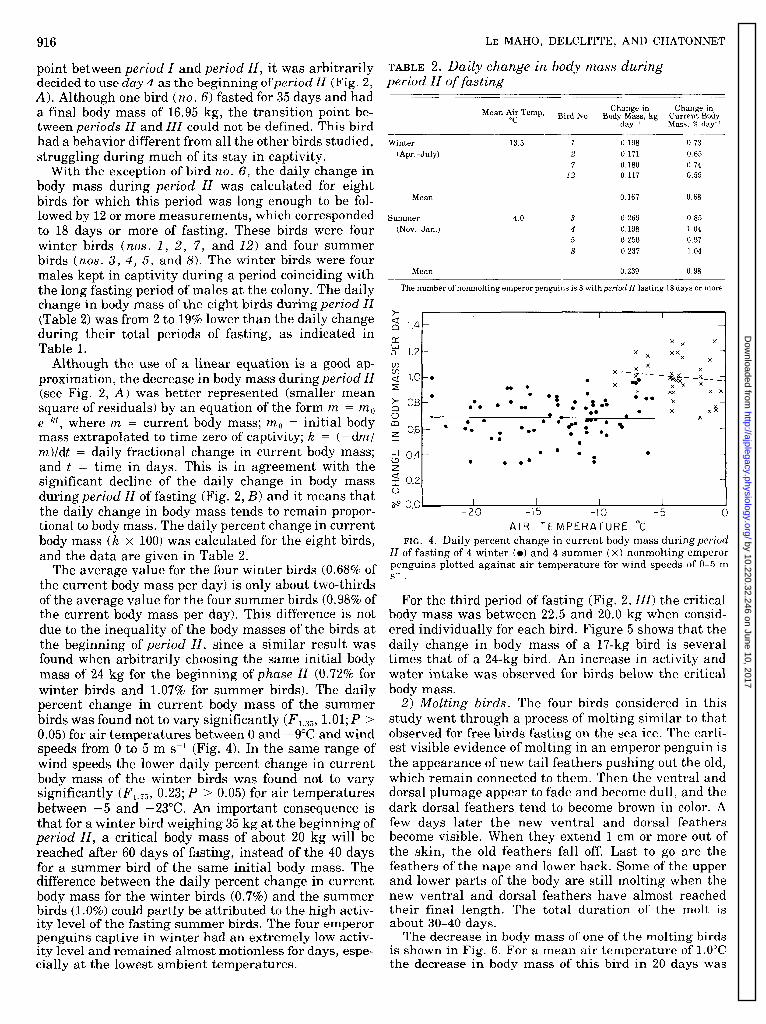
FIG. 3. Daily change in body mass during first 10 days of captivity of 16 fasting, nonmolting emperor penguins. Points adjoined by a numeral indicate 2 or 3 coinciding points, respectively.
daily change in body mass of the birds was from 0.25 to 1.35 kg day-l with a mean of 0.638 kg day-’ (SD, 0.357; n, 10) (see Fig. 3). The mean daily change in body mass from the fourth to the tenth day was much lower - 0.258 kg day-l (SD, 0.074; n, 42). Activity was not recorded, but there was an obvious decrease in activity in the 16 birds that, no doubt, may explain the early decrease in their daily change in body mass.
Since it is difficult to determine the exact transition
TIME, days
FIG. 2. A: decrease in body mass for a fasting, nonmolting em- peror penguin exposed to outdoor summer conditions (mean air
temp, - l.S”C). For periods I, II, and III, see text. Curve for period II was fitted by equation y = 27. 57e-0*008S4.r. B: daily change in body mass during fasting for same bird as in A.
1.4- 0 ’ I I I I I I I I I .
u
” 1.0-o cn
z 2 0.8-a l
> 0
8 0.6- 0 m
0 0 7 0 - 0,4- . . 0 ii 2 0 0 0
by 10.220.32.246 on June 10, 2017http://ajplegacy.physiology.org/
Dow
nloaded from
916 LE MAHO, DELCLITTE, AND CHATONNET
point between period I and period II, it was arbitrarily decided to use day 4 as the beginning ofperiod 1. (Fig. 2, A). Although one bird (no. 6) fasted for 35 days and had a final body mass of 16.95 kg, the transition point be- tween periods II and III could not be defined. This bird had a behavior different from all the other birds studied, struggling during much of its stay in captivity.
TABLE 2. Daily change in body mass during period II of fasting
Mean 4: Temp, Change in Change in Bird No. Body Mass, kg Current Body
day ’ Mass, % day ’
With the exception of bird no. 6, the daily change in body mass during period II was calculated for eight birds for which this period was long enough to be fol- lowed by 12 or more measurements, which corresponded to 18 days or more of fasting. These birds were four winter birds (nos. 1, 2, 7, and 12) and four summer birds (nos. 3, 4, 5, and 8). The winter birds were four males kept in captivity during a period coinciding with the long fasting period of males at the colony. The daily change in body mass of the eight birds during period 11 (Table 2) wa s f rom 2 to 19% lower than the daily change during their total periods of fasting, as indicated in Table 1.
Winter
(Apr. -July)
-13.5 1 0.198 0.73 2 0.171 0.65
7 0.180 0.74 12 0.117 0.59
Mean 0.167 0.68
Summer -4.0 3 0.269 0.85
(Nov.-Jan.) 4 0.198 1.04 5 0.250 0.97
8 0.237 1.04
Mean 0.239 0.98
The number of nonmolting emperor penguins is 8 with period ZZ lasting 18 days or more.
, I I 1 1
1.4 -
Although the use of a linear equation is a good ap- proximation, the decrease in body mass during period II (see Fig. 2, A) was better represented (smaller mean square of residuals) by an equation of the form ry2 = rrzo e+, where m = current body mass; m,, = initial body mass extrapolated to time zero of captivity; k = (-dml m)ldt = daily fractional change in current body mass; and t = time in days. This is in agreement with the significant decline of the daily change in body mass during period II of fasting (Fig. 2, B) and it means that the daily change in body mass tends to remain propor- tional to body mass. The daily percent change in current body mass (k x 100) was calculated for the eight birds, and the data are given in Table 2.
x x X
1.2 - x x xx X X
1,o -. 0 x--
00 l X
gX--$g&-~
X x x
0.8 -’ 0 xx l 0 0 00
00 l .a
9 . : :* .s X
X 0 a 0. 0 X5
X
0.6- l =: . l . . . l l m-
00 r: .I’ 0
0.4- 0 . 0 0 0 0 0 0. 0
0.2-
00 I 1 I I 4 -20 -15 -10 -5 0
AIR TEMPERATURE “C
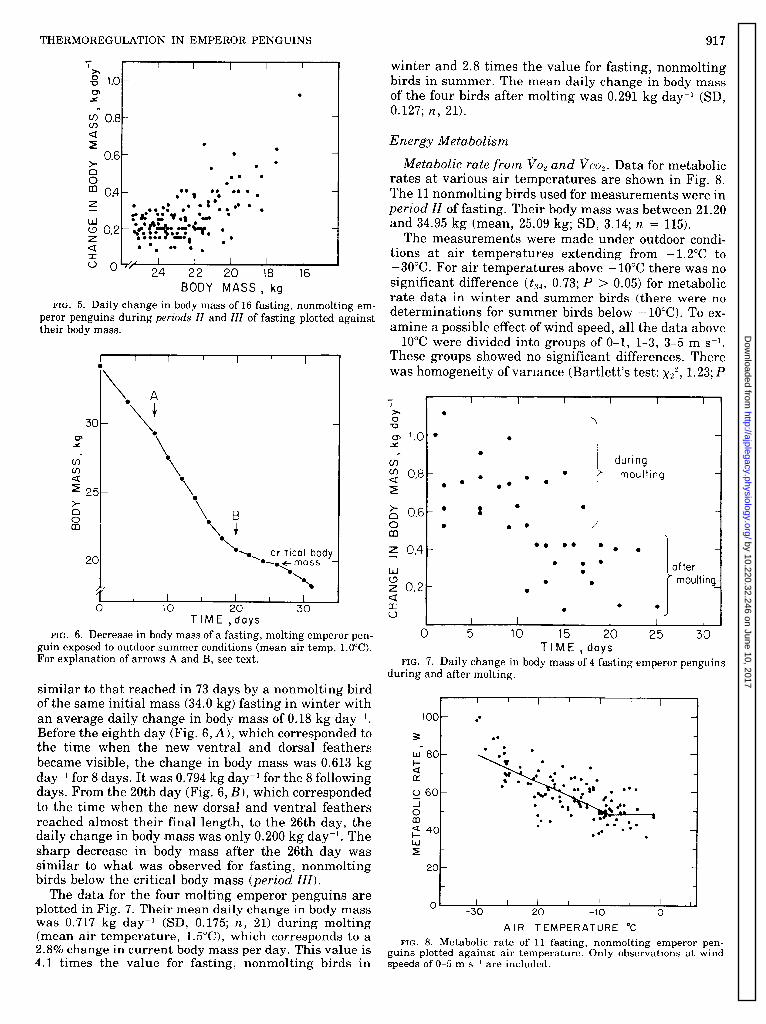
FIG. 4. Daily percent change in current body mass during period
The average value for the four winter birds (0.68% of the current body mass per day) is only about two-thirds of the average value for the four summer birds (0.98% of the current body mass per day). This difference is not due to the inequality of the body masses of the birds at the beginning of period II, since a similar result was found when arbitrarily choosing the same initial body mass of 24 kg for the beginning of phase 11 (0.72% for winter birds and 1.0’7% for summer birds). The daily percent change in current body mass of the summer birds was found not to vary significantly (F, 3;5, 1.01.; P > 0.05) for air temperatures between 0 and - 9&C and wind speeds from 0 to 5 m s-l (Fig. 4). In the same range of wind speeds the lower daily percent change in current body mass of the winter birds was found not to vary significantly (F1.75, 0.23; P > 0.05) for air temperatures between -5 and -23°C. An important consequence is that for a winter bird weighing 35 kg at the beginning of period II, a critical body mass of about 20 kg will be reached after 60 days of fasting, instead of the 40 days for a summer bird of the same initial body mass. The difference between the daily percent change in current body mass for the winter birds (0.7%) and the summer birds (1 .O%) could partly be attributed to the high activ- ity level of the fasting summer birds. The four emperor penguins captive in winter had an extremely low activ- ity level and remained almost motionless for days, espe- cially at the lowest ambient temperatures.
II of fasting of 4 winter (0) and 4 summer ( X) nonmolting emperor penguins plotted against air temperature for wind speeds of O-5 m S?
For the third period of fasting (Fig. 2,111) the critical body mass was between 22.5 and 20.0 kg when consid- ered individually for each bird. Figure 5 shows that the daily change in body mass of a 17-kg bird is several times that of a 24-kg bird. An increase in activity and water intake was observed for birds below the critical body mass.
2) Molting birds. The four birds considered in this study went through a process of molting similar to that observed for free birds fasting on the sea ice. The earli- est visible evidence of molting in an emperor penguin is the appearance of new tail feathers pushing out the old, which remain connected to them. Then the ventral and dorsal plumage appear to fade and become dull, and the dark dorsal feathers tend to become brown in color. A few days later the new ventral and dorsal feathers become visible. When they extend 1 cm or more out of the skin, the old feathers fall off. Last to go are the feathers of the nape and lower back. Some of the upper and lower parts of the body are still molting when the new ventral and dorsal feathers have almost reached their final length. The total duration of the molt is about 30-40 days.
The decrease in body mass of one of the molting birds is shown in Fig. 6. For a mean air temperature of l.O”C the decrease in body mass of this bird in 20 days was
by 10.220.32.246 on June 10, 2017http://ajplegacy.physiology.org/
Dow
nloaded from
THERMOREGULATION IN EMPEROR PENGUINS 917
z 0.6
>
s
al 0.4 7 -
w (3 0.2
5
= 0 24 22 20 18 16 BODY MASS, kg
FIG. 5. Daily change in body mass of 16 fasting, nonmolting em-
peror penguins during periods II and III of fasting plotted against their body mass.
r 1 I I I I I 0
\ a 0 . 1
4
\ 0
\ 0
\ 0
\
\ B ‘\ J-
‘\ l k
‘0 critical body
~.~mass -
.\ \
. I I I I 1 1 J 0 10 20 30
TIME ,days
FIG. 6. Decrease in body mass of a fasting, molting emperor pen- guin exposed to outdoor summer conditions (mean air temp, l.OOC). For explanation of arrows A and B, see text.
similar to that reached in 73 days by a nonmolting bird of the same initial mass (34.0 kg) fasting in winter with an average daily change in body mass of 0.18 kg day? Before the eighth day (Fig. 6, A), which corresponded to the time when the new ventral and dorsal feathers became visible, the change in body mass was 0.613 kg day-l for 8 days. It was 0.794 kg day-l for the 8 following days. From the 20th day (Fig. 6, B), which corresponded to the time when the new dorsal and ventral feathers reached almost their final length, to the 26th day, the daily change in body -mass was only 0.200 kg day? The sharp decrease in body mass after the 26th day was similar to what was observed for fasting, nonmolting birds below the critical body mass (period III).
The data for the four molting emperor penguins are plotted in Fig. 7. Their mean daily change in body mass was 0.717 kg day-l (SD, 0.175; n, 21) during molting (mean air temperature, 1.5”C), which corresponds to a 2.8% change in current body mass per day. This value is 4.1 times the value for fasting, nonmolting birds in
winter and 2.8 times the value for fasting, nonmolting birds in summer. The mean daily change in body mass of the four birds after molting was 0.291 kg day-l (SD, 0.127; n, 21).
Energy Metabolism
Metabolic rate from 30, and &JO,. Data for metabolic rates at various air temperatures are shown in Fig. 8. The 11 nonmolting birds used for measurements were in period 11 of fasting. Their body mass was between 21.20 and 34.95 kg (mean, 25.09 kg; SD, 3.14; n = 115).
The measurements were made under outdoor condi- tions at air temperatures extending from - L2”C to -30°C. For air temperatures above -10°C there was no significant difference ( ts4, 0.73; P > 0.05) for metabolic rate data in winter and summer birds (there were no determinations for summer birds below - 1OOC). To ex- amine a possible effect of wind speed, all the data above - 10°C were divided into groups of O-l, 1-3, 3-5 m s-l. These groups showed no significant differences. There was homogeneity of variance (Bartlett’s test: x2$ 1.23; P
$j 0.8 t 0 0 0 moulting 2 0
. 0.
0
z 0.4 0. 0. .
l 0 - 1 of ter 1 i moulting
0 5 10 15 20 25 30 TIME, days
FIG. 7. Daily change in body mass of 4 fasting emperor penguins during and after molting.
I 1 I I I I 1 I
I
I 1 I 1 I I I 1 -30 -20 -10 0
AIR TEMPERATURE “C
FIG. 8. Metabolic rate of 11 fasting, nonmolting emperor pen- guins plotted against air temperature. Only observations at wind speeds of O-5 m ss’ are included.
by 10.220.32.246 on June 10, 2017http://ajplegacy.physiology.org/
Dow
nloaded from
918 LE MAHO, DELCLITTE, AND CHATONNET
> 0.05), the slopes did not differ significantly @&, 1.27; P > 0.05), nor did the elevations (F2,35, 0.77; P > 0.05). Comparison of metabolic data below -10°C for the same wind-speed ranges also showed no significant differ- ence. There was homogeneity of variance (Bartlett’s test: xZ2, 1.16; P > 0.05), the slopes did not differ signifi- cantly (F2,80, 0.59; P > 0.05), nor did the elevations (F 2,80> 2.91; P > 0.05). Since only 10 measurements were made at wind speeds above 5 m s-l , these data were insufficient for determ ining whether there was any ef- fect from higher wind speed and were not used. All the metabolic rate data for wind speeds of 5 m s-l or below were therefore pooled.
The data in Fig. 8 were analyzed by the Scholander et al. (41) model, which is useful for comparative studies in temperature regulation. The metabolic rate of an ani- mal at rest 1s fairly constant in a range of air tempera- tures that is called the thermoneutral zone (in this study this constant metabolic rate is called resting met- abolic rate) neutral zon .e
The lowest air temperature in the thermo- is called the lower critical temperature. At
air temperatures below the lower critical temperature the animal must i ncrease its metabolic rate to maintain its body temperature constant. The relation between metabolic rate and air temperature is usually expressed by two lin .ear regression lines that intersect at t the lower critical temperature. There exist extensive data that indicate close conformity to this model, although there are exceptions (e.g., 8, 19). Considering our data, there is no significant increase in metabolic rate from - 1.2 to - 10°C tFl,w 0.02; P > 0.05) and the mean is 49.06 W (SD, 6.54; n, 36) for a mean body mass of 24.8 kg (SD, 0.46; n, 36). This overall mean for metabolic rate is, therefore, considered to be the resting metabolic rate for the fasting emperor penguin. The lower critical temper- ature was chosen by calculating the pool mean square (PMS) for various combinations of data (see ref. 37). The PMS was found to be a minimum when considering the two linear regression lines relating metabolic rate to air temperature above and below about - 10°C. This is also the value found by Pinshow et al. (37) for emperor penguins in standard conditions.
Between - 10 and -3OOC the metabolic rate increased with decreasing air temperature . At -30°C it was about 63% above the resting metabolic rate. The equations for
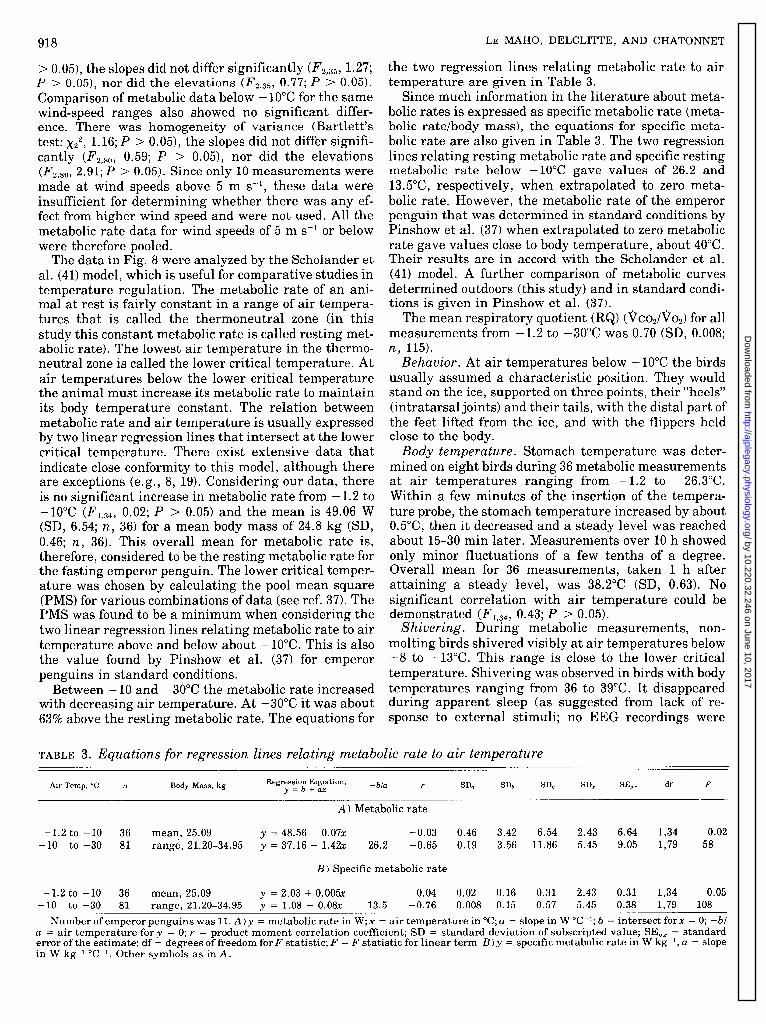
the two regression lines relating metabolic rate to air temperature are given in Table 3.
Since much information in the literature about meta- bolic rates is expressed as specific metabolic rate (meta- bolic rate/body mass), the equations for specific meta- bolic rate are also given in Table 3. The two regression lines relating resting metabolic rate and specific resting metabolic rate below - 10°C gave values of 26.2 and l3.5”C, respectively, when extrapolated to zero meta- bolic rate. However, the metabolic rate of the emperor penguin that was determined in standard conditions by Pinshow et al. (37) when extrapolated to zero metabolic rate gave values close to body temperature, about 40°C. Their results are in accord with the Scholander et al. (41) model. A further comparison of metabolic curves determined outdoors (this study) and in standard condi- tions is given in Pinshow et al. (37).
The mean respiratory quotient (RQ) (~co,/~o,) for all measurements from -1.2 to -30°C was 0.70 (SD, 0.008; n, 115).
Behavior. At air temperatures below -10°C the birds usually assumed a characteristic position. They would stand on the ice, supported on three points, their “heels” (intratarsal joints) and their tails, with the distal part of the feet lifted from the ice, and with the flippers held close to the body.
Body temperature. Stomach temperature was deter- mined on eight birds during 36 metabolic measurements at air temperatures ranging from - 1.2 to - 26.3”C. Within a few minutes of the insertion of the tempera- ture probe, the stomach temperature increased by about 0.5”C, then it decreased and a steady level was reached about 15-30 min later. Measurements over 10 h showed only minor fluctuations of a few tenths of a degree. Overall mean for 36 measurements, taken 1 h after attaining a steady level, was 38.2”C (SD, 0.63). No significant correlation with air temperature could be demonstrated (F, 34, 0.43; P > 0.05).
Shivering. During metabolic measurements, non- molting birds shivered visibly at air temperatures below -8 to - 13°C. This range is close to the lower critical temperature. Shivering was observed in birds with body temperatures ranging from 36 to 39°C. It disappeared during apparent sleep (as suggested from lack of re- sponse to external stimuli; no EEG recordings were
TABLE 3. Equations for regression lines relating metabolic rate to air temperature
Air Temp, “C n Body Mass, kg Regression Equation,
y=b+ax - bla r SD,, Sb SD, SD, SE,, df F
k) Metabolic rate
-1.2 to -10 36 mean, 25.09 Y = 48.56 - 0.07x -0.03 0.46 3.42 6.54 2.43 6.64 1,34 0.02 -10 to -30 81 range, 21.20-34.95 y = 37.16 - 1.4% 26.2 -0.65 0.19 3.56 11.86 5.45 9.05 1,79 58
B) Specific metabolic rate
-1.2 to -10 36 mean, 25.09 y = 2.03 + 0.005x 0.04 0.02 0.16 0.31 2.43 0.31 1,34 0.05 -10 to -30 81 range, 21.20-34.95 y = 1.08 - 0.0&c 13.5 -0.76 0.008 0.15 0.57 5.45 0.38 1,79 108
Number of emperor penguins was 11. A) y = metabolic rate in W; x = air temperature in “C; a = slope in W “C-l; b = intersect forx = 0; -bl a = air temperature for y = 0; r = product moment correlation coefficient; SD = standard deviation of subscripted value; SE,, = standard error of the estimate; df = degrees of freedom for+’ statistic; F = F statistic for linear term. B) y = specific metabolic rate in W kg-‘, a = slope in W kg-’ oC-l. Other symbols as in A.
by 10.220.32.246 on June 10, 2017http://ajplegacy.physiology.org/
Dow
nloaded from
THERMOREGULATION IN EMPEROR PENGUINS 919
made). Molting birds were found to shiver at an am- bient temperature of 0°C.
down of glycogen. A high rate of gluconeogenesis from protei n could also be a source of water loss, since tissues
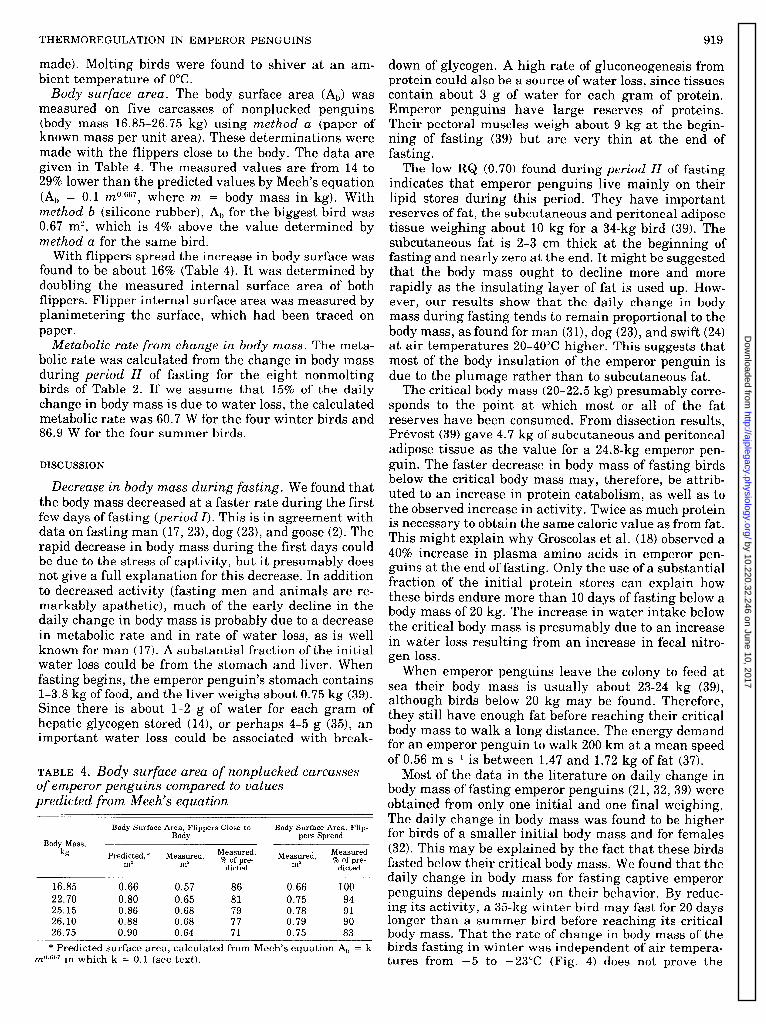
Body surface area. The body surface area (Ab) was contain about 3 g of water for each gram of protein. measured on five carcasses of nonplucked penguins Emperor penguins have large reserves of proteins. (body mass 16.85-26.75 kg) using method a (paper of Their pectoral muscles weigh about 9 kg at the begin- known mass per unit area). These determinations were ning of fasting (39) but are very thin at the end of made with the flippers close to the body. The data are fasting. given in Table 4. The measured values are from 14 to 29% lower than the predicted values by Meeh’s equation
The low RQ (0.70) found during period II of fasting
(A = 0.1 mO-efj7, where m = indicates that emperor penguins live mainly on their
b body mass in kg). With lipid stores during this period. They have important method b (silicone rubber), Ab for the biggest bird was 0.67 m2, which is 4% above the value determined by
reserves of fat, the subcutaneous and peritoneal adipose tissue weighing about 10 kg for a 34-kg bird (39). The
method a for the same bird. With flippers spread the increase in body surface was
found to be about 16% (Table 4). It was determined by doubling the measured internal surface area of both flippers. Flipper internal surface area was measured by planimetering the surface, which had been traced on
rapidly as the insulating layer of fat is used up. How- ever, our results show that the daily change in body
subcutaneous fat is 2-3 cm thick at the beginning of fasting and nearly zero at the end. It might be suggested that the body mass ought to decline more and more
mass during fasting tends to remain proportional to the paper.
bolic rate was calculated from the change in body mass during period 11 of fasting for the eight nonmolting birds of Table 2. If we assume that 15% of the daily
Metabolic rate from change in body mass. The meta- body mass, as found for man (31), dog (23), and swift (24) at air temperatures 20-40°C higher. This suggests that
change in body mass is due to water loss, the calculated metabolic rate was 60.7 W for the four winter birds and 86.9 W for the four summer birds.
DISCUSSION
Decrease in body mass during fasting. We found that the body mass decreased at a faster rate during the first few days of fasting (period 1). This is in agreement with data on fasting man (17, 23), dog (23), and goose (2). The rapid decrease in body mass during the first days could be due to the stress of captivity, but it presumably does not give a full explanation for this decrease. In addition to decreased activity (fasting men and animals are re- markably apathetic), much of the early decline in the daily change in body mass is probably due to a decrease in metabolic rate and in rate of water loss, as is well known for man (17). A substantial fraction of the initial water loss could be from the stomach and liver. When fasting begins, the emperor penguin’s stomach contains l-3.8 kg of food, and the liver weighs about 0.75 kg (39). Since there is about l-2 g of water for each gram of hepatic glycogen stored (14), or perhaps 4-5 g (35), an important water loss could be associated with break-
sponds to the point at which most-or all of the fat reserves have been consumed. From dissection results,
most of the body insulation of the emperor penguin is
Prevost (39) gave 4.7 kg of subcutaneous and peritoneal adipose tissue as the value for a 24.8kg emperor pen-
due to the plumage rather than to subcutaneous fat.
guin. The faster decrease in body mass of fasting birds below the critical body mass may, therefore, beittrib-
The critical body mass (20-22.5 kg) presumably corre-
uted to an increase in protein catabolism, as well as to the observed increase in activity. Twice as much protein is necessary to obtain the same caloric value as from fat. This might explain why Groscolas et al. (18) observed a 40% increase in plasma amino acids in emperor pen- guins at the end of fasting. Only the use of a substantial fraction of the initial protein stores can explain how these birds endure more than 10 days of fasting below a body mass of 20 kg. The increase in water intake below the critical body mass is presumably due to an increase in water loss resulting from an increase in fecal nitro- gen loss.
When emperor penguins leave the colony to feed at sea their body mass is usually about 23-24 kg (39), although birds below 20 kg may be found. Therefore, they still have enough fat before reaching their critical body mass to walk a long distance. The energy demand for an emperor penguin to walk 200 km at a mean speed of 0.56 m s-l is between 1.47 and 1.72 kg of fat (37).
Most of the data in the literature on daily change in body mass of fasting emperor penguins (21, 32, 39) were obtained from only one initial and one final weighing.
TABLE 4. Body surface area of nonplucked carcasses of emperor penguins compared to values predicted from Meeh’s equation
Body Mass, kg
Body Surface-Area, Flippers Close to Body Surface Area, Flip- The daily change in body mass was found to be higher
Body pers Spread for birds of a smaller initial body mass and for females
Predicted,* Measured, Measured, Measured, Measured (32). This may be explained by the fact that these birds m2 m” % of pre-
dieted m2 % of pre- dieted fasted below their critical body mass. We found that the
- 16.85 0.66 0.57 86 0.66 100
daily change in body mass for fasting captive emperor
22.70 0.80 0.65 81 0.75 94 penguins depends mainly on their behavior. By reduc-
25.15 0.86 0.68 79 0.78 91 ing its activity, a 35-kg winter bird may fast for 20 days 26.10 0.88 0.68 77 0.79 90 longer than a summer bird before reaching its critical 26.75 0.90 0.64 71 0.75 83 body mass. That the rate of change in body mass of the * Predicted surface area, calculated from Meeh’s equation Ab = k birds fasting in winter was independent of air tempera-
mo*667 in which k = 0.1 (see text). tures from -5 to - 23°C (Fig. 4) does not prove the
by 10.220.32.246 on June 10, 2017http://ajplegacy.physiology.org/
Dow
nloaded from
920
absence of an increase in metabolic rate when air tem- peratures decrease, because the birds also decreased their activity. That the level of activity was the lowest for birds fasting in winter could be related to the rela- tive length of day and night. The period of light on the coasts of the Antarctic Continent is only a few hours in winter and more than 20 h in summer.
Energy metaboLism. Adaptive adjustments to changes in the thermal environment may affect 1) metabolic rate, 2) thermal conductance, and 3) body temperature. These three aspects will be discussed in relation to the Scholander et al. (41) model.
A high resting metabolic rate is usually considered to be a criterion of acclimatization or adaptation to cold (see ref. 7). The resting metabolic rate for fasting em- peror penguins in outdoor conditions (49.06 W for 24.8 kg) is 7% above the value predicted from Aschoff and Pohl (1) and 27% above that predicted from Lasiewski and Dawson (25). These differences are not very great considering that we did not measure the standard meta- bolic rate. Our resting metabolic rate (fasting and out- door conditions) is 15% above the resting metabolic rate determined in standard laboratory conditions by Pin- show et al. (37), whose value is close to that predicted from body mass.
Thermal conductance is generally considered to be a revealing parameter in the study of adaptation to cold (42). In this study it was calculated by the equation of Dawson and Schmidt-Nielsen (10)
C MR - h,,. = --~
CT k) - T,)&
where C is thermal conductance in W rn+ ‘C-l, MR is metabolic rate in W, h,,. is evaporative heat transfer rate in W, T, is body temperature in “C, T, is air temperature in “C, Ai, is body surface area in m2. The evaporative heat transfer rate was calculated from the equation of Crawford and Lasiewski (9), assuming that the vaporization of one gram of water requires 2.43 kJ
h,,. = 0.68 m0.fX3
where m is the body mass in kg. The evaporative heat transfer rate is 4.87 W for a 24.8-kg bird. When we assume a body surface area of 0.7 m2 for a 25kg bird (Table 4), the thermal conductance is 1.31 W rn+ ‘C-l at a lower critical temperature of -10°C. This value is in accord with the value of 1.57 W m-’ ‘C-l calculated by Pinshow et al. (37) for emperor penguins below their lower critical temperature, and is not exceptionally low in comparison to the range of 0.9-3.5 W rn+ ‘C-l for birds (13). The conductance value for the 3.8-kg Peruvian penguin (0.94. W m-” OC+) is one of the lowest reported for birds. It may be explained by the use of Meeh’s formula for estimating the body surface area. Our measurements on emperor penguins show that their surface area is lower than that predicted from Meeh’s equation (Table 4) and correspond to a k value of 0.078 rather than 0.1. If the same k value applies to Peruvian penguins, their conductance would be about 1 2 W rn-” OC? penguin.
9 i.e., about the same as for the emperor
LE MAHO, DELCLITTE, AND CHATONNET
The temperature gradient between the core and the skin surface can be used to estimate that percentage of the insulation due to the plumage (47). The range of the skin surface temperature of the emperor penguin is between 32 and 37°C (3, 4). If we use the lowest value, 32°C and the lower critical temperature of -10°C the percentage of insulation due to the plumage would be 87% for a body temperature of 38.2”C. From measure- ments of stomach, skin, and feather temperatures, Jarman (21) gave a value of 86%. As suggested by Stonehouse (45) the rigid structure of the emperor penguin’s feathers explains why there was no signifi- cant effect of moderate wind speed (O-5 m s-l) on the metabolic rate. Jarman (21) gave a wind speed of 2.5 m s-l for the first visible indication of movement of the feather tips. In addition to plumage insulation, pen- guins have a vascular countercurrent system in the extremities, as indicated by a gradient of temperatures between 38 and 0°C (3,4) and by the vascular organiza- tion (46). This corroborates Stonehouse’s (45) state- ment that the equations for the “cooling power” of antarctic winds, calculated from the rate of cooling of uninsulated metal cylinders and often used in environ- mental studies of penguins (4, 32, 33, 34, 40), should be considered as largely inapplicable. In contrast, wind of moderate speed (4.5 m s-l) has been shown to increase the resting metabolic rate of the well-insulated snowy owl (15), which does not have rigid feathers as do penguins.
It is remarkable that the daily change in body mass of the emperor penguin is highest in summer when the birds are molting. This can be explained by the energy requirements for synthesis of new feathers as well as the decrease in insulation. The observation that molt- ing emperor penguins shiver at an air temperature of 0°C suggests that the lower critical temperature is about 10°C higher than for nonmolting birds. This is again in agreement with the fact that most of the insulation is due to the feathers. The exact proportion of the increase in metabolic rate associated with the synthesis of new feathers and with the decrease in insulation during molting remains to be determined.
The feather insulation of the emperor penguin could be a disadvantage during high solar radiation or an increase in heat production resulting from locomotion. The possibility of a 16% increase in surface area when the flippers open (Table 4) and high flipper and foot temperatures, up to 38°C (3, 4), permit a considerable increase of conductance.
Body temperature is not commonly considered as being involved in the adaptation to cold (7, 42). Never- theless, the reduction of energy expenditure that could result from a lowering of the body temperature must be considered for the long-fasting emperor penguin. Our mean value of stomach temperature, 38.2”C for iso- lated fasting birds, is close to the stomach temperature given by Jarman, 38.1”C (Zl), Bougaeff, 38.5”C (4), and to the abdominal telemetrically recorded temperature of 38.4-38.7”C of Boyd and Sladen (5). Our measured stomach temperatures are significantly higher than the cloaca1 temperatures (mean 37.8”C) recorded by Pinshow et al. (37) (t.,<,. 3.77: P < 0.001). Cloaca1 tem-
by 10.220.32.246 on June 10, 2017http://ajplegacy.physiology.org/
Dow
nloaded from
THERMOREGULATION IN EMPEROR PENGUINS 921
peratures of isolated birds in their breeding colony are reported to be 37.8-37.9”C (40) and 36.9-37.4”C (32). These results indicate that stomach temperatures may be higher than cloaca1 temperatures. In other species of penguins simultaneous measurements of stomach and cloaca1 temperatures showed the former to be from 0.6 to 1.6”C higher than the latter (13, 16, 33, 34).
A core temperature of 38.2-38.7”C for the emperor penguin is low compared to that of most other birds (see ref. 22) and lower than in the other species of penguins so far studied (34). Compared to this core temperature, recorded on isolated individuals, the ex- tremely low cloaca1 temperature (34.536.4”C) of hud- dling emperor penguins (32, 40) are of particular inter- est. It remains unknown whether these low cloaca1 temperatures correspond to a decrease of the core tem- perature or of the size of the “core”.
No measurements have been made of metabolic rates of huddling penguins, but the rate of change in body mass observed for huddling birds in winter, 0.105-0.123 kg day- * (40) can be used for an estimate. If we assume that 15% of the daily loss in body mass is due to water loss, the calculated metabolic rate for huddling emperor penguins is from 38.4 to 52.6 W. This is 37-13% below the calculated metabolic rate for iso-
REFERENCES
1. ASCHOFF, J., AND H. POHL. Der Ruheumsatz von Vogeln als Funktion der Tageszeit und der Korpergrosse. J. Ornithol. 111: 38-47, 1970.
2. BENEDICT, F., AND R. C. LEE. Lipogenesis in the AnimaZ Body, with Special Reference to the Physiology of the Goose. Washing- ton, D.C.: Carnegie Inst. of Washington, Publ. 489, 1937. 232 p.
3. BOUGAEFF, S. Note preliminaire sur quelques donnees physiolo- giques enregistrees chez le Manchot empereur (Aptenodytes for-
steri). L’Oiseau et Rev. Franc. Ornithol. 42, no. spec.: 131-145, 1972.
4. BOUGAEFF, S. Etude comparative de quelques parametres phy-
siologiques chez deux especes de Manchots antarctiques le Man- chat empereur Aptenodytes forsteri et le Manchot Adelie Pygos- celis adeliae. Cornit National Francais Recherches Antarctiques 33: 99-110, 1974.
5. BOYD, J. C., AND J. L. SLADEN. Telemetry studies of the internal body temperature of Adelie and emperor penguins at Cape Cro- zier, Ross Island, Antarctica. Auk 88: 366-380, 1971.
6. BUDD, G. M. The biotopes of emperor penguin rookeries. Emu 61: 171-189, 1961.
7. CALDER, W. A., AND J. R. KING. Thermal and caloric relations of birds. In: Avian BioZogy, edited by D. S. Farner and J. R. King. New York: Academic, 1974, vol. 4, p. 259-413.
8. CALDER, W. A., AND K. SCHMIDT-NIELSEN. Temperature regula- tion and evaporation in the pigeon and the roadrunner. Am. J. Physiol. 213: 883-889, 1967.
9. CRAWFORD, E. C., AND R. C. LASIEWSKI. Oxygen consumption and respiratory evaporation of the emu and rhea. Condor 70: 333-339, 1968.
10. DAWSON, T., AND K. SCHMIDT-NIELSEN. Effect of thermal con- ductance on water economy in the antelope jack rabbit, Lepus alleni. J. Cellular Comp. Physiol. 67: 463-471, 1966.
11. DEPOCAS, F., AND J. S. HART. Use of the Pauling oxygen analyzer for measurement of oxygen consumption of animals in open- circuit systems and in a short-lag, closed-circuit apparatus. J. Appl. Physiol. 10: 388-392, 1957.
12. DEPOCAS, F., Y. MINAIRE, AND J. CHATONNET. Rates of formation
and oxidation of lactic acid in dogs at rest and during moderate exercise. Can. J. PhysioZ. Pharmacol. 47: 603-610, 1969.
13. DRENT, R. H., AND B. STONEHOUSE. Thermoregulatory responses of the Peruvian penguin, Spheniscus humboldti. Comp. Bio- them. Physiol. 40A: 689-710, 1971.
lated winter birds (60.7 W). It indicates that when huddling emperor penguins may metabolize at or pos- sibly below their resting metabolic rate (49.1 W), even at very low air temperatures. Therefore, it seems that the social th to avoid an
ermoregu increase
latory behavior all tabolic rate
ows the when th
birds e air in me
temperature is below their lower critical temperature. This is in agreement with the observations that the birds shiver when they are out of the huddles (39, 44), and (this study) that visible shivering is associated with increase in metabolic rate. The inevitable conclu- sion of these observations is that, in addition to the large amount of stored fat, the thermoregulatory be- havior of huddling is essential for the survival of the male emperor penguin while fasting during the long period of incubation at winter temperatures.
This study was undertaken at the initiative of Dr. J. Prevost, to whom we express our sincere gratitude.
We gratefully acknowledge access to the original data of Pinshow et al. (37) and thank them for helpful discussions.
This study was supported by grants from Terres Australes et Antarctiques Francaises and Centre National de la Recherche Scien- tifique and received logistic support from Expeditions Polaires Fran- caises.
Received for publication 2 February 1976.
14. FENN, W. O., AND L. F. HAEGE. The deposition of glycogen with water in the livers of cats. J. BioZ. Chem. 136: 87-101, 1940.
15. GESSAMAN, J. A. Bioenergetics of the snowy owl (Nyctea scandi- aca). Arct. Alp. Res. 4: 223-238, 1972.
16. GOLDSMITH, R., AND W. J. L. SLADEN. Temperature regulation of some antarctic penguins. J. PhysioZ., London 157: 251-262, 1961.
17. GRANDE, F. Man under caloric deficiency. In: Handbook ofPhysi- ology. Adaptation to the Environment. Washington, D.C.: Am. Physiol. Sot., 1964, p. 911-937.
18. GROSCOLAS, R., C. CHARPENTIER, AND F. LEMONNIER. Variation de la concentration des acides amines libres du plasma au tours du cycle reproducteur chez le Manchot empereur Aptenodytes
forsteri. Comp. Biochem. Physiol. 51B: 57-67, 1975. 19. HART, J. S. Seasonal acclimatization in four species of small wild
birds. PhysioZ. ZooZ. 35: 224-236, 1962. 20. ISENMANN, P. Contribution a l’ethologie et a l’ecologie du Man-
chat empereur (Aptenodytes forsteri, Gray) a la colonie de Pointe Geologic (Terre Adelie). L’Oiseau et Rev. Franc. OrnithoZ. 41, no. spec.: 9-64, 1971.
21. JARMAN, M. Experiments on the emperor penguin, Aptenodytes forsteri in various thermal environments. Brit. Antarct. Survey BUZZ. 33, 34: 57-63, 1973.
22. KING, J. R., AND D. S. FARNER. Energy metabolism, thermoreg- ulation and body temperature. In: Biology and Comparative Physiology of Birds, edited by A. J. Marshall. New York: Perga- mon, 1961, vol. 2, p. 215-288.
23. KLEIBER, M. The Fire of Life. An Introduction to Animal Ener- getics. New York: Wiley, 1961, 454 p.
24. KOSKIMIES, J. The life of the swift in relation to the weather. Ann. Acad. Sci. Fennicae Ser. A IV 15: 1-151, 1950.
25. LASIEWSKI, R. C., AND W. R. DAWSON. A re-examination of the relation between standard metabolic rate and body weight in birds. Condor 69: 13-23, 1967.
26. LE MAHO, Y., AND P. DELCLITTE. Evaluation de la depense energetique chez le Manchot empereur (Aptenodytes forsteri G.) d’apres la decroissance ponderale au tours du jeune. Compt. Rend., 278: 2189-2192, 1974.
27. LE MAHO, Y., AND P. DELCLITTE. Etude de la regulation ther- mique du Manchot empereur (Aptenodytes forsteri G.) dans les conditions ambiantes naturelles. Compt. Rend., 278: 2553-2556, 1974.
28. LUSK, G. Animal calorimetry. Analysis of the oxidation of mix-
by 10.220.32.246 on June 10, 2017http://ajplegacy.physiology.org/
Dow
nloaded from
922
tures of carbohydrate and fat. A correction. J. Biol. Chem. 59: 41-42, 1924.
29. MAYNARD, L. A., AND J. K. LOOSLI. AnimaZ Nutrition. New York: McGraw-Hill, 1962, 533 p.
30. MECHTLY, E. A. The International System of Units. Physical Constants and Conversion Factors (2nd rev.). Washington, D.C.: NASA SP-7012, 1973. 21 p.
31. MORGULIS, S. Fasting and Undernutrition. New York: Dutton, 1923. 407 p.
32. MOUGIN, J. L. Observations ecologiques a la colonie de Manchots empereurs de pointe Geologic (Terre Adelie) en 1964. L’Oiseau et Rev. Franc. Ornithol. 36: 167-226, 1966.
33. MOUGIN, J. L. Enregistrements continus de temperatures in- ternes chez quelques Spheniscidae. I. Le Manchot papou Pygos- cezispapua de 1’Ile de la Possession (Archipel Crozet). L’Oiseau et Rev. Franc. Orin~hol. 42, no. spec.: 84-110, 1972.
34. MOUGIN, J. L. Enregistrements continus de temperatures in- ternes chez quelques Spheniscidae. II. Le Manchot royal Apten- odytes patagonica de 1’Ile de la Possession (Archipel Crozet). Comite’ National Francais Recherches Antarctiques 33: 29-56,
1974. 35. OLSSON, K. E., AND B. SALTIN. Variation in total body water
with muscle glycogen change in man. In: Biochemistry of Exer- cise (Medicine and Sport Series, vol. 3). Basel: S. Karger, 1968, p. 159-162.
36. PINSHOW, B., D. R. BATTLES, H. PINSHOW, AND K. SCHMIDT- NIELSEN. Emperor penguins: thermoregulation and locomotion. Antarct. J. US 10: 127-129, 1975.
37. PINSHOW, B., M. A. FEDAK, D. R. BATTLES, AND K. SCHMIDT- NIELSEN. Energy expenditure for thermoregulation and locomo- tion in emperor penguins. Am. J. PhysioZ. 231: 903-912, 1976.
LE MAHO, DELCLITTE, AND CHATONNET
38. PRANGE, H. D., AND K. SCHMIDT-NIELSEN. The metabolic cost of swimming in ducks. J. Exptl. Biol. 53: 763-777, 1970.
39. PROVOST, J. Ecologic du Manchot empereur. Paris: Herman, 1961. 204 p.
40. PROVOST, J., AND J. SAPIN-JALOUSTRE. A propos des premieres mesures de topographie thermique chez les Spheniscides de la Terre Adelie. L’Oiseau et Rev. Franc. Ornithol. 34, no. spec.: 52- 90, 1964.
41. SCHOLANDER, P. F., R. HOCK, V. WALTERS, F. JOHNSON, AND L. IRVING. Heat regulation in some arctic and tropical mammals and birds. BioZ. BUZZ. 99: 237-258, 1950.
42. SCHOLANDER, P. F., R. HOCK, V. WALTERS, AND L. IRVING. Adap- tation to cold in arctic and tropical mammals and birds in relation to body temperature, insulation and basal metabolic rate. BioZ. BUZZ. 99: 259-271, 1950.
43. SOKAL, R. R., AND J. ROHLF. Biometry. San Francisco: W. H. Freeman, 1969. 776 p.
44. STONEHOUSE, B. The emperor penguin Aptenodytes forsteri. I. Breeding behaviour and development. Sci. Rept. FaZkZand Is- land Dependencies Surv. 6: l-33, 1953.
45. STONEHOUSE, B. The general biology and thermal balances of penguins. In: Advances in Ecological .Research, edited by J. B. Cragg. London: Academic, 1967, vol. 4, p. 131-196.
46. TRAWA, G. Note preliminaire sur la vascularisation des membres des Spheniscides de Terre Adelie. L’Oiseau et Rev. Franc. OrnithoZ. 40, no. spec.: 142-156, 1970.
47. VEGHTE, J. H. Thermal and metabolic responses of the gray jay to cold stress. PhysioZ. 2001. 37: 316-328, 1964.
48. WILSON, E. A. Aves. British National Antarctic Expedition 1901- 1904. London: Brit. Mus. Nat. Hist., 1907, vol. 2, Zoology. 121 p.
by 10.220.32.246 on June 10, 2017http://ajplegacy.physiology.org/
Dow
nloaded from