Embed Size (px)
Citation preview

7/28/2019 Vol 4-1-90-98 Manoj Kulshreshitha
http://slidepdf.com/reader/full/vol-4-1-90-98-manoj-kulshreshitha 1/9
Journal of Engineering Science and TechnologyVol. 4, No. 1 (2009) 90 - 98© School of Engineering, Taylor’s University College
90
EFFECT OF DRYING CONDITIONS ON MUSHROOM QUALITY
MANOJ KULSHRESHTHA*, ANUPAMA SINGH, DEEPTI AND VIPUL
Department of Post Harvest Process and Food Engineering,G. B. Pant University of Agriculture & Technology, Pantnagar – 263 145, India
*Corresponding Author: [email protected]
Abstract
Fluidized bed drying of mushroom was undertaken to study the drying
characteristics and quality of the dried mushrooms. Drying was done at drying air
temperatures of 50, 70, and 90oC and air velocities of 1.71 and 2.13 m/s. Two
batch sizes, namely, 0.5 kg and 1 kg of sliced milky mushrooms were dried.Drying characteristics and the quality of dried mushrooms were analyzed. The
results indicated that the drying time decreased only marginally with increase inair velocity. Drying air temperature of 50oC was better as it resulted in a dried
product having better rehydration characteristics, lesser shrinkage and lighter color. Highest energy efficiency (79.74%) was observed while drying a batch size
of 1 kg at a drying air temperature of 50oC, using an air velocity of 1.7 m/s.
Keywords: Mushroom, Fluidized bed drying, Drying behaviour,
Quality characteristics.
1. Introduction
Mushrooms are non-green, edible fungi. They are a large heterogeneous group
having various shapes, sizes, appearance and edibility. Mushrooms are a good
source of non-starchy carbohydrates, dietary fiber, protein, mineral andvitamins[1]. Mushrooms are a seasonal and highly perishable crop and contain
about 90%(w.b.) moisture.
After harvesting, moisture loss, shrinkage and rapid spoilage in terms of color
and texture takes place. The shelf life of mushroom is only about 2 to 5 days
depending upon the variety. There are many methods for preservation and
enhancement of shelf life of mushrooms. The most common processes includecanning, freezing and drying. Although canning is widely used on a commercial scale,
it is quite expensive. In case of large scale freezing and cold chain transportation, high
7/28/2019 Vol 4-1-90-98 Manoj Kulshreshitha
http://slidepdf.com/reader/full/vol-4-1-90-98-manoj-kulshreshitha 2/9
Effect of Drying Conditions on Mushroom Quality 91
Journal of Engineering Science and Technology MARCH 2009, Vol. 4(1)
Nomenclatures
A Constant, dimesionless
k Drying rate constant, s-1
M Moisture content at any time, % d.b. Me Equilibrium moisture content, % d.b.
Mo Initial moisture content, % d.b.
MR Moisture Ratio= ( M - Me)/ ( Mo- Me), dimesionlesst Time of drying, s
Abbreviationsw.b. Wet weight basis
d.b. Dry weight basis
cost and intermittent/irregular electric power supply in many developingcountries, become the main constraints.
Dehydration, therefore, remains a promising technique of preservation.
Fluidized bed drying is an advanced drying method that is faster and produces better quality product than that obtained by conventional hot air drying [2,3]. This study
was undertaken to examine the effect of the operating parameters of a fluidized bed
dryer, namely, drying temperature, air velocity and batch size on the drying
behavior, quality of dried mushrooms and energy consumption of the dryer.
2. Materials and Methods
Experiments were conducted to study the effect of three variables, namely, drying
temperature, air velocity and batch size, on the drying of mushrooms.
Experiments were conducted at three drying temperatures, (50oC, 70
oC and 90
oC),
two air velocities (1.7 m/s and 2.1 m/s) and two batch sizes (1 kg and 0.5 kg).
Fully matured milky mushrooms of commercial grade variety were procured
from the Mushroom Research Center of the University. The mushrooms were cutinto 5-8 mm thick slices. No pre-treatment/blanching was done and the mushroom
slices were dried from an initial moisture content of approximately 90%(w.b.) to
the final moisture content of about 10%(d.b.) in a fluidized bed dryer.
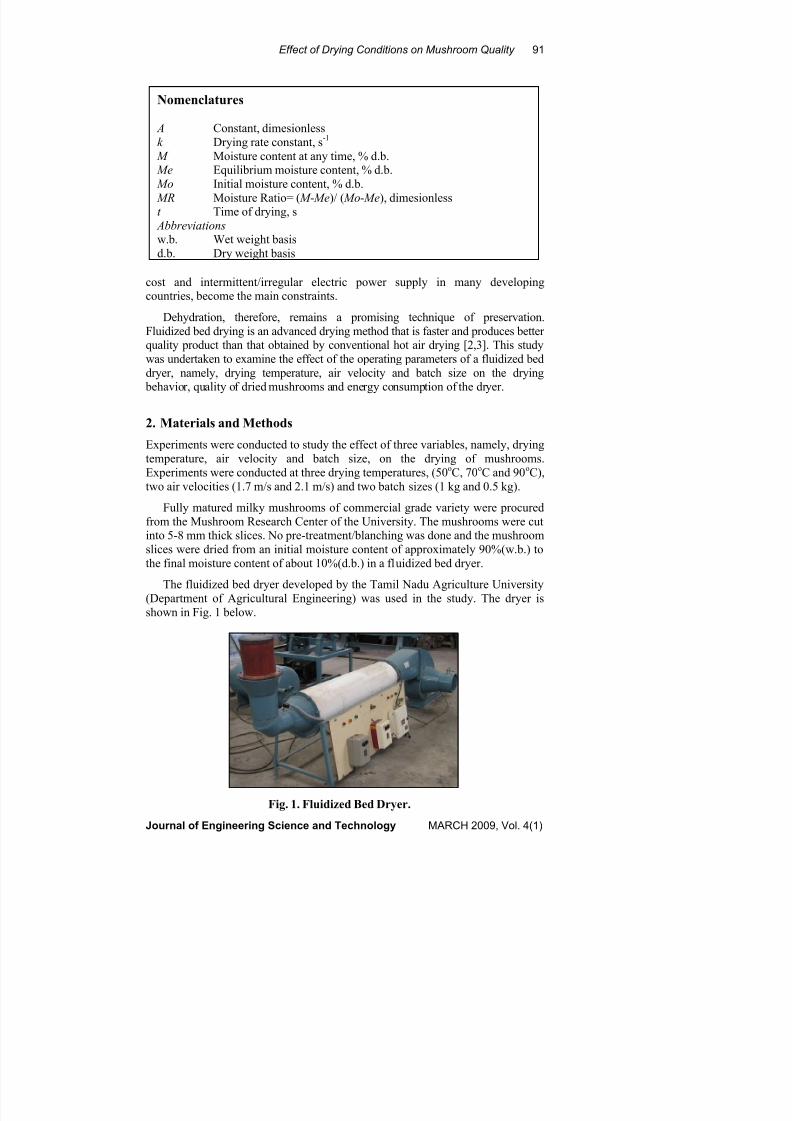
The fluidized bed dryer developed by the Tamil Nadu Agriculture University(Department of Agricultural Engineering) was used in the study. The dryer is
shown in Fig. 1 below.
Fig. 1. Fluidized Bed Dryer.

7/28/2019 Vol 4-1-90-98 Manoj Kulshreshitha
http://slidepdf.com/reader/full/vol-4-1-90-98-manoj-kulshreshitha 3/9
92 M. Kulshreshtha et al
Journal of Engineering Science and Technology MARCH 2009, Vol. 4(1)
3. Results and Discussion
The drying behaviour and the product quality characteristics were studied in termsof product moisture content, rehydration ratio, rehydration fraction, bulk density,
true density, porosity, bulk shrinkage, slice shrinkage and color.
3.1. Drying behaviour
The drying characteristic of the mushroom slices varied according to the dryingconditions. The drying rates were analyzed as total drying time, drying kinetics
and the influence of operating conditions upon them.
Total drying time
The total drying time to reduce the moisture content of mushroom from
approximately 868%(d.b.) to about 10%(d.b.) is summarized in Table 1.
Depending upon the operating conditions, the drying time varied from 1 h 11 minto 5 h 45 min.
Table 1. Total Drying Time (min.) to Dry Mushrooms to Approximately
10% (d.b.) under Different Drying Conditions.
Temperature (oC)
Velocity (m/s) Batch size (kg)
50 70 901 325 210 124
2.130.5 213 112 71
1 345 230 1541.71
0.5 254 114 70
It was observed that the total drying time decreased upon increasing the
temperature for a given drying air velocity and batch size. The drying time also
decreased upon increasing the drying air velocity for a given temperature and
batch size. For a given drying air velocity and temperature, the total drying time
was more for larger batch size, which is expected.
Drying kinetics
The drying kinetics behavior of mushrooms was examined in terms of an
exponential model having the form:
kt Ae MR −
= (1)
Since, in all cases, the mushroom slices were dried to a final moisture content
of about 10%(d.b.), the value of Me would be even less, and therefore very smallcompared to the initial moisture content of about 868%(d.b.). Therefore, Me was
neglected and MR was represented as M/Mo. Further, since M = Mo at t = 0, the
value of A comes out to be unity. The drying kinetics is then represented as:
kt e Mo M −
=/ (2)
The values of drying rate constant, k , for temperatures 50, 70 and 90oC were
estimated using least square regression and are tabulated in Table 2. The model
was then used to predict the drying behavior under the experimental conditions.

7/28/2019 Vol 4-1-90-98 Manoj Kulshreshitha
http://slidepdf.com/reader/full/vol-4-1-90-98-manoj-kulshreshitha 4/9
Effect of Drying Conditions on Mushroom Quality 93
Journal of Engineering Science and Technology MARCH 2009, Vol. 4(1)
Typical observed and predicted drying behaviors of the 0.5 kg batch at different
temperatures at an air velocity of 2.13 m/s are compared in Fig. 2.
Table 2. Drying Rate Constant (min-1) at Different Drying Conditions.
Temperature (oC)
Velocity (m/s) Batch size (kg)50 70 90
1 0.0140 0.0211 0.0363
2.13 0.5 0.0195 0.0402 0.06401 0.0135 0.0203 0.0302
1.710.5 0.0180 0.0401 0.0642
It may be noted from Fig. 2 and the Table 1 that, other conditions beingconstant, the drying rate constant increased with drying temperature as well as
with air velocity. The drying rate constant decreased for larger batch size.
Effect of temperature
The effect of temperature is also illustrated in the drying curves of Fig. 2. Thedrying rate increased with the temperature of the drying air as the curve of
successively higher temperatures fall below the curve of lower temperature.
Effect of velocity
Only two levels of velocity were taken in this study. These were obtained byvarying the flap at the angle of 45
oand 90
oat the inlet of the blower. The average
velocities at these settings were 1.71 m/s and 2.13 m/s.
It was observed that even within a drying run, the air velocity increased withtime, possibly due to shrinkage of material. For 1.71 m/s the value of velocities
increased from 1.16 m/s to 1.91 m/s in case of 1 kg batch size and from 1.3 m/s to2.07 m/s in case of 0.5 kg batch size. Similarly for 2.13 m/s the value of velocities
varied from 1.16 m/s to 2.6 m/s in case of 1 kg batch size and from 1.56 m/s to
2.4 m/s in case of 0.5 kg batch size. However this rise of velocity is within an
Fig. 2. Drying Behavior of 0.5kg Batch of Mushroom
at an Air Velocity of 2.13 m/s.

7/28/2019 Vol 4-1-90-98 Manoj Kulshreshitha
http://slidepdf.com/reader/full/vol-4-1-90-98-manoj-kulshreshitha 5/9
94 M. Kulshreshtha et al
Journal of Engineering Science and Technology MARCH 2009, Vol. 4(1)
Fig. 4. Drying Behavior of Mushroom
at an Air Velocity of 2.13 m/s and Drying Temperature of 50oC.
experimental run was ignored and the data was analyzed on the basis of mean
velocities that are 1.71 m/s and 2.13 m/s. The effect of air velocity in a typicalcase (air temperature at 50
oC and batch size of 1 kg) is shown in Fig. 3. It may be
noted that although at higher air velocities, the drying rate is generally higher; the
effect of the air velocity is not very significant.
Effect of batch size
The typical effect of batch size (air velocity of 2.13 m/s and air temperature of 50ºC) is shown in Fig. 4. It is clearly evident from the figure that the drying rate
increases very significantly with the decrease in batch size. It can be noticed that
by reducing the batch size from 1 kg to 0.5 kg, the drying time is reduced byabout 48%.
Fig. 3. Drying Behavior of 1 kg Batch of Mushroomat Drying Temperature of 50oC.
7/28/2019 Vol 4-1-90-98 Manoj Kulshreshitha
http://slidepdf.com/reader/full/vol-4-1-90-98-manoj-kulshreshitha 6/9
Effect of Drying Conditions on Mushroom Quality 95
Journal of Engineering Science and Technology MARCH 2009, Vol. 4(1)
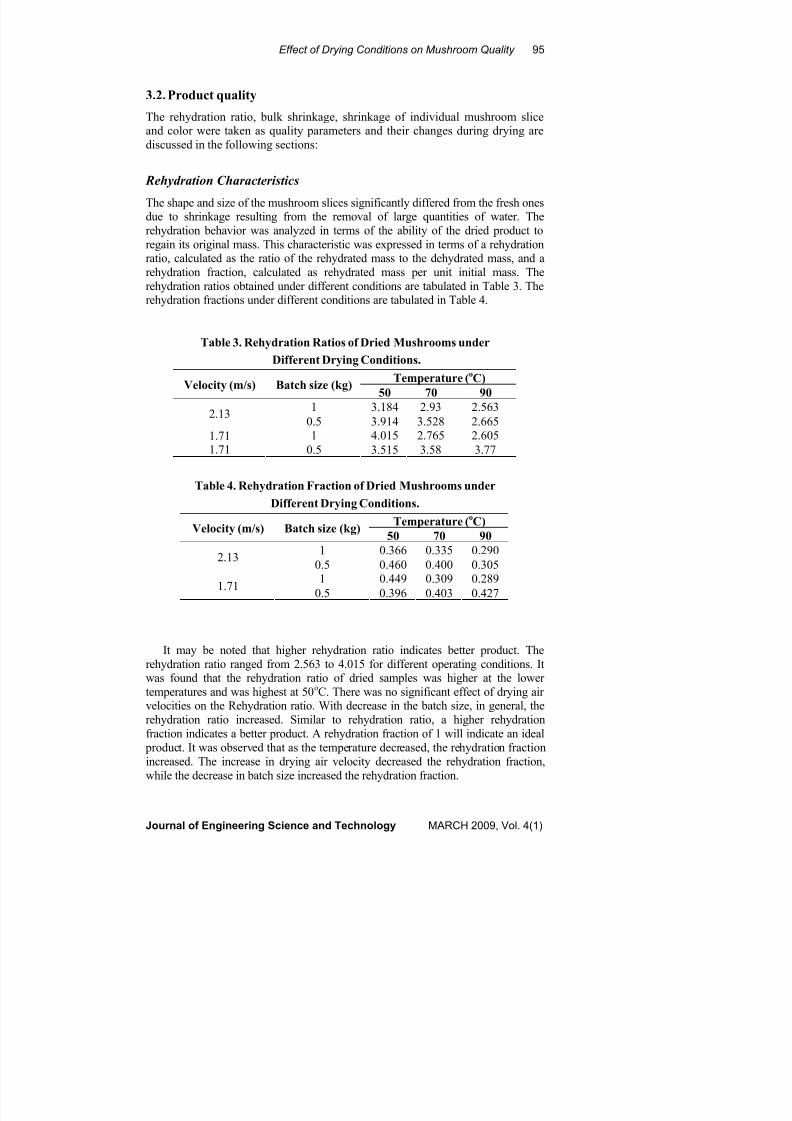
3.2. Product quality
The rehydration ratio, bulk shrinkage, shrinkage of individual mushroom sliceand color were taken as quality parameters and their changes during drying are
discussed in the following sections:
Rehydration Characteristics
The shape and size of the mushroom slices significantly differed from the fresh onesdue to shrinkage resulting from the removal of large quantities of water. The
rehydration behavior was analyzed in terms of the ability of the dried product to
regain its original mass. This characteristic was expressed in terms of a rehydrationratio, calculated as the ratio of the rehydrated mass to the dehydrated mass, and a
rehydration fraction, calculated as rehydrated mass per unit initial mass. The
rehydration ratios obtained under different conditions are tabulated in Table 3. Therehydration fractions under different conditions are tabulated in Table 4.
Table 3. Rehydration Ratios of Dried Mushrooms under
Different Drying Conditions.
Temperature (oC)
Velocity (m/s) Batch size (kg)50 70 90
1 3.184 2.93 2.5632.13
0.5 3.914 3.528 2.665
1 4.015 2.765 2.6051.711.71 0.5 3.515 3.58 3.77
Table 4. Rehydration Fraction of Dried Mushrooms under
Different Drying Conditions.
Temperature (oC)
Velocity (m/s) Batch size (kg)50 70 90
1 0.366 0.335 0.2902.13
0.5 0.460 0.400 0.305
1 0.449 0.309 0.289
1.71 0.5 0.396 0.403 0.427
It may be noted that higher rehydration ratio indicates better product. The
rehydration ratio ranged from 2.563 to 4.015 for different operating conditions. Itwas found that the rehydration ratio of dried samples was higher at the lower
temperatures and was highest at 50oC. There was no significant effect of drying air
velocities on the Rehydration ratio. With decrease in the batch size, in general, the
rehydration ratio increased. Similar to rehydration ratio, a higher rehydration
fraction indicates a better product. A rehydration fraction of 1 will indicate an ideal
product. It was observed that as the temperature decreased, the rehydration fraction
increased. The increase in drying air velocity decreased the rehydration fraction,
while the decrease in batch size increased the rehydration fraction.

7/28/2019 Vol 4-1-90-98 Manoj Kulshreshitha
http://slidepdf.com/reader/full/vol-4-1-90-98-manoj-kulshreshitha 7/9
96 M. Kulshreshtha et al
Journal of Engineering Science and Technology MARCH 2009, Vol. 4(1)
Bulk shrinkage
The bulk shrinkage was calculated for different conditions to find out the
reduction in space required for storage purposes. Higher value of bulk shrinkage
is favorable for storage purposes as higher the value of bulk shrinkage, lesser isthe volume required for storage. However, with reference to the product quality,
bulk shrinkage should be less. This is because for lower bulk shrinkage,
mushroom slices will have greater tendency to regain their original shape. Bulk
shrinkage for different conditions is tabulated in Table 5. There was no systematictrend of bulk shrinkage with the temperature and drying air velocity, but itgenerally increased with the batch size.
Table 5. Bulk Shrinkage (%) of Dried Mushrooms under
Different Drying Conditions.
Temperature (oC)
Velocity (m/s) Batch size (kg)50 70 90
1 75.59 73.57 82.112.13
0.5 68.47 73.27 78.34
1 78.26 82.1 82.791.71
0.5 78.7 71.46 71.29
Slice shrinkage
The slice shrinkage was analyzed to measure the reduction in the size of individual mushroom slice after losing the moisture content from 868%(d.b.) to
approx. 10%(d.b.). The shrinkage of individual pieces of sliced mushrooms was
calculated and is tabulated in Table 6. Like bulk shrinkage, in slice shrinkage alsono systematic trend was observed. However the majority of the data indicate that
shrinkage decreases with increase in drying air velocity and also shrinkage is
lower at lower temperatures as compared to the higher temperatures.
Table 6. Slice Shrinkage (%) of Dried Mushrooms under
Different Drying Conditions.
Temperature (
o
C)Velocity (m/s) Batch size (kg)50 70 90
1 73.84 73.9 82.752.13
0.5 68.47 79.42 83.52
1 79.75 85.5 83.981.71
0.5 80.27 74.8 75.08
Color
Color is an important quality parameter for the dried mushroom and wasdetermined by comparison with a standard color chart. The color index of the
dried mushrooms slices was noted in five replications. The average color index in
different drying experiments is presented in the Table 7. Generally the browning
of the dried product is more pronounced at higher temperatures. In this study on
fluidized bed drying, the color of the dried mushroom slices was not significantly

7/28/2019 Vol 4-1-90-98 Manoj Kulshreshitha
http://slidepdf.com/reader/full/vol-4-1-90-98-manoj-kulshreshitha 8/9
Effect of Drying Conditions on Mushroom Quality 97
Journal of Engineering Science and Technology MARCH 2009, Vol. 4(1)
affected with the temperature and batch size, although generally, the color is
better at lower velocity (1.71 m/s) and lower temperature (50oC).
Table 7. Color Index of Dried Mushrooms under
Different Drying Conditions.
Temperature (oC)
Velocity (m/s) Batch size (kg)
50 70 901 8 7.4 8.8
2.130.5 7.8 8.2 9.6
1 7.4 7.8 7.81.71
0.5 7.4 7.2 7
3.3. Energy analysis
The energy consumption varied with the operating conditions of the dryer. Totalenergy consumption, total power consumption, blower power consumption,
thermal power consumption, specific energy consumption per unit mass of
moisture evaporated and efficiency of the dryer were calculated. To calculate theefficiency of the dryer the reference point is taken as the latent heat of free water,
which is 2257 kJ/kg (540 kcal/kg). The analysis is summarized in Table 8.
Table 8. Energy and Power Requirement under
Different Drying Conditions.
Drying
Temperature
Total energy
consumption
Power
consumption
Blower
power
Thermal
power
consumed
Specific
energy
consumption
Efficiency
oC kJ kW kW kW kJ/kg
moisture
evaporated %
Air velocity = 1.71 m/s Batch size = 0.5 kg
50 2952 0.193 0.060 0.134 6626.26 34.11
70 2160 0.316 0.060 0.256 4967.80 45.50
90 2196 0.523 0.060 0.448 4875.67 46.36
Air velocity = 2.13 m/s Batch size = 0.5 kg
50 2232 0.174 0.075 0.099 5038.37 44.86
70 2404 0.358 0.075 0.283 5390.13 41.9390 2340 0.550 0.075 0.475 5254.88 43.01
Air velocity = 1.71 m/s Batch size = 1.0 kg
50 2520 0.120 0.060 0.060 2834.65 79.7470 3744 0.270 0.060 0.210 4206.74 53.73
90 3384 0.370 0.060 0.310 3768.37 59.98
Air velocity = 2.13 m/s Batch size =1.0 kg
50 3672 0.200 0.075 0.125 3903.70 57.90
70 5976 0.470 0.075 0.395 6744.92 33.51
90 3420 0.460 0.075 0.385 3834.08 58.95
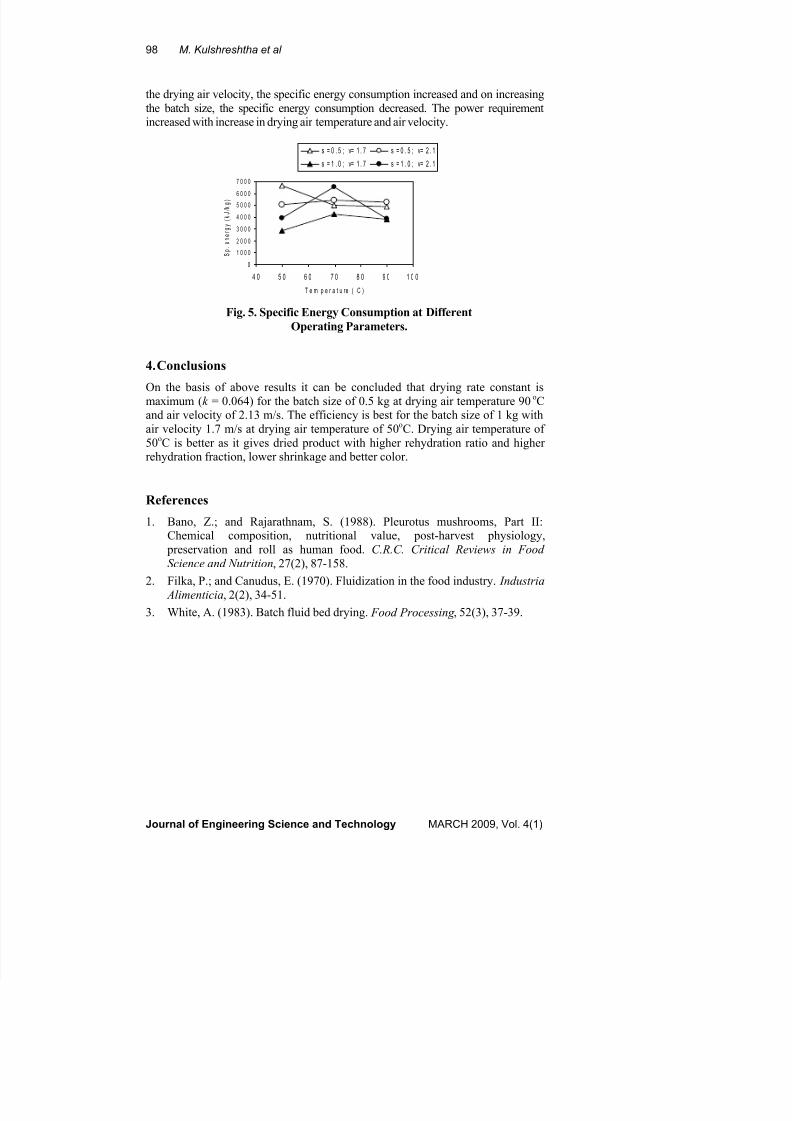
The variation of the specific energy and average power consumption is shown in
Fig. 5. On the basis of the energy consumption data, it is concluded that on increasing
7/28/2019 Vol 4-1-90-98 Manoj Kulshreshitha
http://slidepdf.com/reader/full/vol-4-1-90-98-manoj-kulshreshitha 9/9
98 M. Kulshreshtha et al
Journal of Engineering Science and Technology MARCH 2009, Vol. 4(1)
Fig. 5. Specific Energy Consumption at Different
Operating Parameters.
0
1 0 0 0
2 0 0 0
3 0 0 0
4 0 0 0
5 0 0 06 0 0 0
7 0 0 0
4 0 5 0 6 0 7 0 8 0 9 0 1 0 0
T e m p e r a t u re ( C )
S
p
.
e
n
e
r g
y
( k
J
/ k
g
)
s = 0 . 5 ; v= 1 . 7 s = 0 . 5 ; v= 2 . 1
s = 1 . 0 ; v= 1 . 7 s = 1 . 0 ; v= 2 . 1
the drying air velocity, the specific energy consumption increased and on increasing
the batch size, the specific energy consumption decreased. The power requirementincreased with increase in drying air temperature and air velocity.
4. Conclusions
On the basis of above results it can be concluded that drying rate constant ismaximum (k = 0.064) for the batch size of 0.5 kg at drying air temperature 90oC
and air velocity of 2.13 m/s. The efficiency is best for the batch size of 1 kg with
air velocity 1.7 m/s at drying air temperature of 50oC. Drying air temperature of
50oC is better as it gives dried product with higher rehydration ratio and higher
rehydration fraction, lower shrinkage and better color.
References
1. Bano, Z.; and Rajarathnam, S. (1988). Pleurotus mushrooms, Part II:Chemical composition, nutritional value, post-harvest physiology,
preservation and roll as human food. C.R.C. Critical Reviews in Food
Science and Nutrition, 27(2), 87-158.
2. Filka, P.; and Canudus, E. (1970). Fluidization in the food industry. Industria
Alimenticia, 2(2), 34-51.
3. White, A. (1983). Batch fluid bed drying. Food Processing , 52(3), 37-39.