Embed Size (px)
Citation preview
1
Dedicated to Sharing Information About Water Management and the Florida LAKEWATCH Program Volume 63 (2013)
Florida LAKEWATCH
Groundwater: An Introduction Forward by Rick Copeland, P.G., Ph.D.
AquiferWatch Inc.
Forward In September 2012, the Florida LAKEWATCH newsletter volume 58, mentioned that AquiferWatch, a volunteer groundwater monitoring program, was coming to LAKEWATCH. AquiferWatch is now over one year old. As of October 1, of this year, AquiferWatch volun-‐teers monitor groundwater levels in 24 wells throughout north Florida. These include one residential well in Bay, four in Leon, eight in Hamilton, two in Bradford, and five in Alachua Counties. In a related issue, because of funding shortfalls, the Alachua County government was recently forced to reduce the number of monitoring wells that were tradi-‐tionally monitored by the county. When AquiferWatch found this out, it agreed to “pick up the slack”. It now obtains groundwater levels in four Alachua County monitoring wells. In order for AquiferWatch to ex-‐pand, it needs the following: • Volunteers, • Regional Coordinators, and • Funding
Volunteers include anyone who is interested in learning about Florida’s groundwater resources. Because of the cooperative nature of the two organizations, by being a member of LAKEWATCH, you are also an Aq-‐uiferWatch volunteer. However, a special class of volunteer is a citizen who either owns a well, or has ac-‐cess to a well or spring, and is willing to participate in a long-‐term moni-‐toring effort. We are looking for these types of volunteers. An Aq-‐uiferWatch Regional Coordinator is not only a volunteer, but is also someone who has a background in groundwater, geology, or engineer-‐ing. A Regional Coordinator’s job is to assist in educating the public and to train them in obtaining ground-‐water data. AquiferWatch is a non-‐profit organization. No one receives a salary. One hundred percent of our funds are used: (1) to purchase or construct monitoring equipment to be used by volunteers, (2) for travel associated with the training, and (3) for the production of groundwater educational material. If you believe you are interested in monitoring groundwater, if you are
interested in becoming a Regional Coordinator, or if you would be will-‐ing to donate funds to assist Aqif-‐erWatch, please contact me at: Dr. Rick Copeland Director – AquiferWatch P.O. Box 11185 Tallahassee, FL 32310 (850) 559-‐7199 The major goal of AquiferWatch is to educate the public about groundwater-‐related issues. In the LAKEWATCH newsletter, volume 60 (2013), AquiferWatch introduced readers to the major aquifers and aquifer systems of Florida. It men-‐tioned that an aquifer is a rock for-‐mation that yields water in sufficient quantity to a well and that an aqui-‐fer system contains one or more aq-‐uifers. However, in order to fully understand groundwater-‐related issues in Florida, a few more funda-‐mental concepts need to be pre-‐sented. What is groundwater? How does it move? For these reasons,
2
the following article presents the basic concepts of groundwater. As it turns out, Roger Waller (1988) of the U.S. Geological Survey previously wrote about these topics. A link to the booklet is found at the end of the article. With modifications, a portion of his work is reproduced below. Waller’s booklet was written for the northeastern United States. Because of the difference in geology, Waller’s material has been modified in order to be better understood by those living in Florida. Note that in Waller’s figures, the term groundwa-‐ter is spelled as two words (ground water). Unfortunately, the inconsis-‐tent spelling is common in the hy-‐drogeology community. Groundwater: What is it and how
does it move?
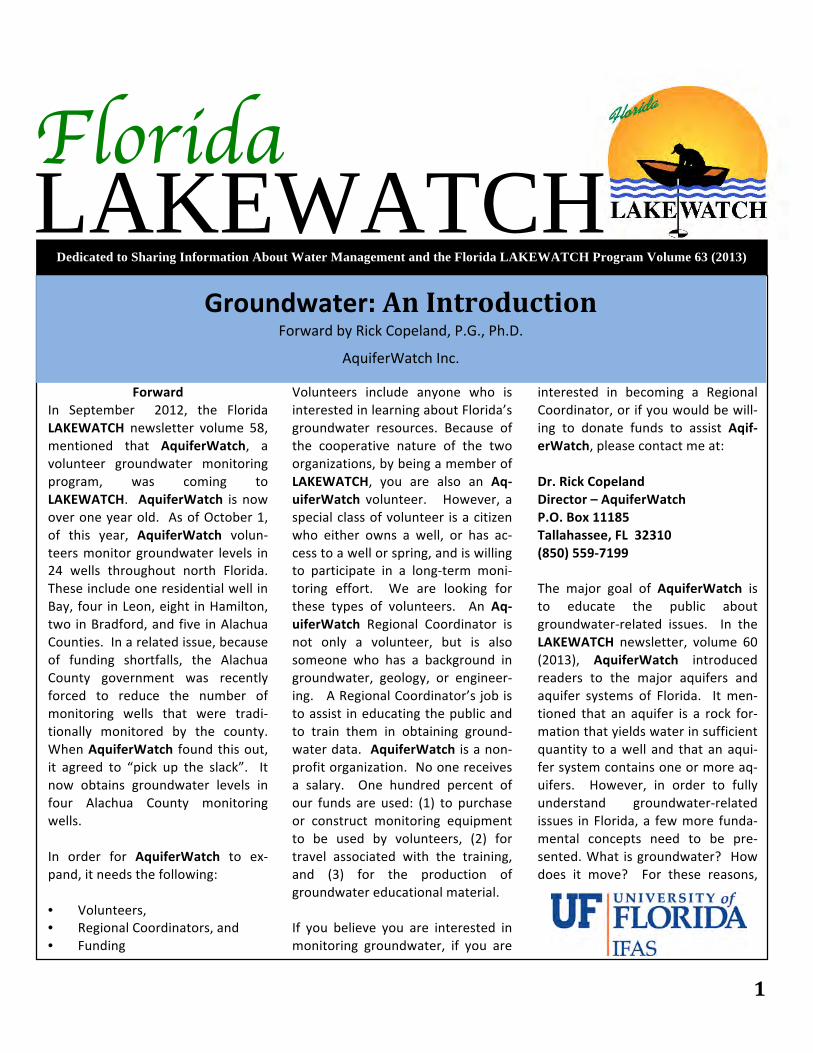
Groundwater is that part of precipi-‐tation that infiltrates through the soil and finds its way to the water table (Figure 1). Located above the water table is unsaturated zone ma-‐terial. It contains both air and water in the pore spaces between the rock
particles and supports vegetation. In the saturated zone below the wa-‐ter table, groundwater fills in essen-‐tially all of the pore spaces between rock particles. Rock materials are classified as being either consolidated (often called bedrock) or unconsolidated. In Flor-‐ida, the most common bedrock is represented by carbonate rocks such as limestones and dolostones. Unconsolidated rock consists of granular material such as sand, gravel, and clay. Two characteristics of all rocks that affect the presence and movement of groundwater are porosity (size and amount of void spaces) and permeability (the rela-‐tive ease with which water can move through spaces in the rock). Consolidated rock may contain frac-‐tures, small cracks, pore spaces, spaces between layers, and solution openings, all of which are usually connected and can hold water. Bed-‐ded sedimentary rock contains spaces between layers that can transmit water great distances. Most
bedrock contains vertical fractures that may intersect other fractures, enabling water to move from one layer to another. Water can dissolve carbonate rocks, forming solution channels through which water can move both vertically and horizon-‐tally. Limestone caves are a good example of solution channels. In Florida, consolidated rock may be buried below many tens of feet of unconsolidated rock or may crop out at the land surface. Depending upon the size and number of connected openings, this bedrock may yield plentiful water to individual wells or be a poor water-‐bearing system. Unconsolidated material overlies bedrock and may consist of rock de-‐bris and sand particles deposited by streams or in lakes. It also may con-‐sist of weathered bedrock particles that form a loose granular or clay soil. Well-‐sorted unconsolidated ma-‐terial can often store large quanti-‐ties of groundwater; the coarser ma-‐terials—sand and gravel—readily yield water to wells. Essentially all of the void spaces in
Figure 1. How ground water occurs in rocks (Modified from Waller, 1988).

3
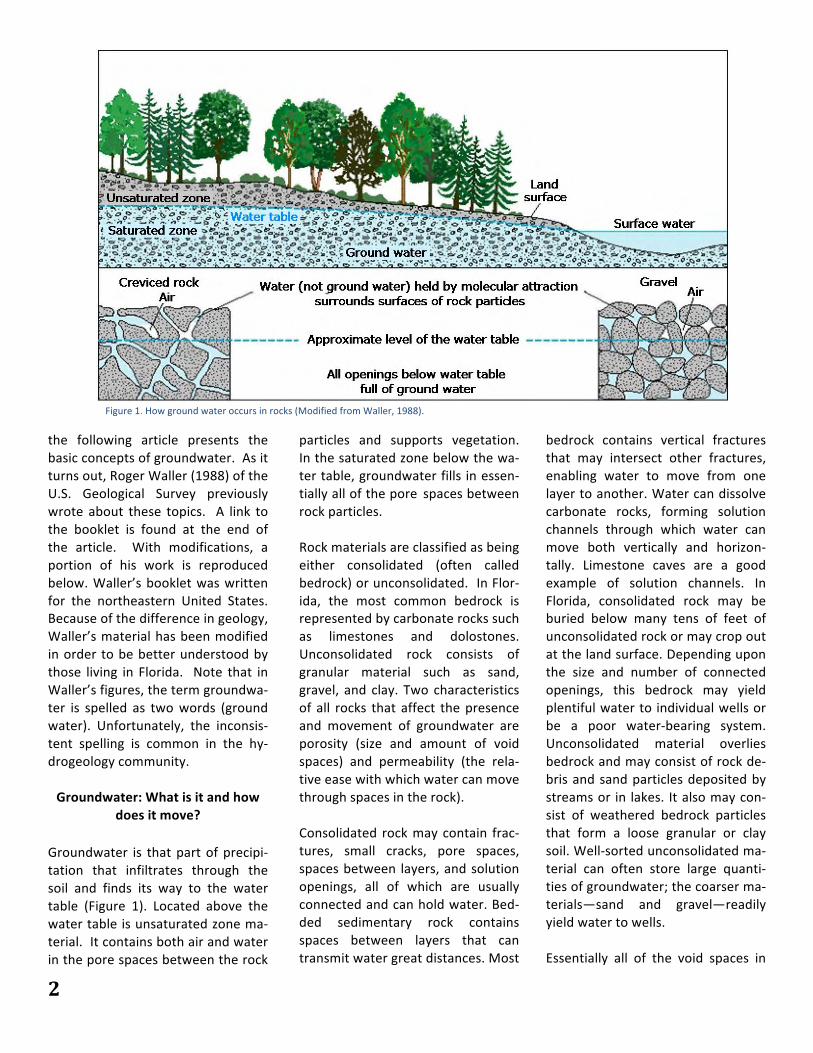
the rocks below the water table are filled with water. Whenever these water-‐bearing rocks readily transmit water to wells or springs, they are called aquifers. Groundwater is al-‐ways moving by the force of gravity from recharge areas to discharge areas. Although groundwater can move from one aquifer into another, it generally follows the more perme-‐able pathways within the individual aquifers from the point of recharge (areas where materials above the aquifer are permeable enough to permit infiltration of precipitation to the aquifer) to the point of dis-‐charge (areas at which the water table intersects the land surface and water leaves an aquifer by way of springs, streams, or lakes and wet-‐lands). In Figure 2, the recharge area for the shallow, surficial aquifer is the land surface (green). Some rain water percolates downward to the water table through the unsaturated zone (brown). At that point it flows down gradient and discharges into the sur-‐face-‐water body to the right. The water level in the well to the left represents the water table. The clay layer beneath the surficial, water table aquifer is relatively imperme-‐
able and confines the deeper aquifer from the shallow one. Groundwater in the confined (or artesian) aquifer is often under pressure. The pres-‐sure causes the water level in the well to the right to rise above the top of the artesian aquifer. The well is referred to as an artesian well. If the pressure is sufficient, the water may flow from a well onto land sur-‐face. If this occurs, the well is said to be a flowing artesian well. Groundwater movement in most areas is slow -‐ a few feet per year. But, in more permeable zones, such as solution channels in limestone,
movement can be measured in hun-‐dreds of feet per day. Evidence of the movement of ground-‐water through rock is all around us but is often overlooked. One example is found in road cuts. In some bedrock exposures, the water emerges along partings between rock layers; in others, along vertical fractures. Inspection of the darker horizontal bedding plane within the light bedrock in Figure 3 re-‐veals a dense growth of vegetation. Groundwater is seeping out of the shal-‐low aquifer and is the source of water for the vegetation.
Figure 2. Water table and confined (artesian) aquifers (Modified from Waller, 1988).
Figure 3. Road cut showing a horizontal plain of groundwater discharge (Modified from Waller, 1988).
Reference Cited
Waller, R, M., 1988, Ground water and the rural homeowner, U.S. Geological Survey Un-‐numbered Series, General Interest Publication, 37 p.
Available on line at: http://pubs.usgs.gov/gip/gw_ruralhomeowner/

4
Saltwater intrusion threatens the water supplies of many coastal communities. Management of these water supplies requires well-‐designed and properly maintained and operated salinity moni-‐toring networks. Long-‐standing deficien-‐cies identified in a salinity monitoring network in southwest Florida during a 2013 study (Prinos, 2013) help to illus-‐trate the types of problems that can occur in aging and poorly maintained networks. This cooperative U.S. Geo-‐logical Survey (USGS) and South Florida Water Management District (SFWMD) study also describes improvements that can be implemented to overcome these deficiencies. Introduction Saltwater intrusion of primary water-‐use aquifers in southwest Florida resulted from installation of drainage canals, leakage through poorly cased wells, and withdrawals from water-‐supply wells. Saltwater intruded through various pathways (fig. 1) to create the current distribution of saltwater in southwest Florida’s aquifers. Saltwater intrusion led to abandonment of the City of
Naples first well field in 1945, and to the replace-‐ment of its second well field in 1954. Samples from groundwater moni-‐toring wells indicate that saltwater intrusion con-‐tinues; however, existing deficiencies lead to uncer-‐tainty in the extent and distribution of saltwater within the aquifer. The majority of salinity monitoring in southwest Florida is conducted to fulfill water-‐use permit requirements. This moni-‐toring is managed by the SFWMD. Monitoring in-‐cludes data from 519 wells in the water table and lower Tamiami aqui-‐fers near the following well fields: the City of Naples Coastal Ridge, Bonita Springs, Collier County Public Water Sup-‐ply Golden Gate, Golden
Gate Water Treatment, and the City of Naples East Golden Gate (fig. 2). Deficiencies Prinos (2013) identified deficiencies in this monitoring, including the following: • The existing network does not provide sufficient
information to differentiate between the multiple sources of saltwater intrusion or to map the dis-‐tribution of saltwater in the aquifer.
• Many of the existing monitoring wells do not fully penetrate the aquifers of interest (fig. 3). It is un-‐certain, therefore, whether saltwater occurs be-‐low these wells.
• Monitoring is densely clustered around well fields, but sparse near the saltwater front. This distribu-‐tion of monitoring may detect saltwater near the well fields but may not provide sufficient warning.
• Some damaged or destroyed wells have not been repaired or replaced.
• Many wells used for salinity monitoring have open intervals longer than 20 ft, and can yield samples that are not representative of maximum salinity in the aquifer.
Is a Salinity Monitoring Network “Worth Its Salt”?
Prepared by the US Geological Survey in cooperation with the South Florida Water Management District
Figure 1. The saltwater that intruded the aquifers of southwest Florida emanates from multiple sources. Figure modified from Prinos (2013).

5
• Some of the sampling protocols being used do not consider the greater density of saltwater relative to freshwater. These protocols can result in saltwater samples that have been diluted with freshwater.
• Some wells are open to multiple aquifers.
An example of these deficiencies is de-‐picted in figure 3. A recent map of salt-‐water intrusion indicated that the 250 mg/L isochlor was inland of this well field, yet previous studies had indicated freshwater beneath this well field (Pri-‐nos, 2013). If saltwater exists below the well field, it can potentially upcone and contaminate it. For this reason, it is cru-‐cial to have wells that monitor the full thickness of the aquifer. Many of the same deficiencies described by Prinos (2013) were described by Klein (1980), and by Burns and Shih (1984). Improvements Deficiencies in the existing network can be addressed through the installation of new polyvinyl chloride-‐cased, multi-‐depth, short-‐screened (5-‐ft) monitoring wells (fig. 4) that are designed to sample water from the base of the aquifer, near
the leading edge of the saltwater front. These wells could be de-‐signed for electromagnetic in-‐duction logging, which can de-‐tect changes in resistivity caused by saltwater intrusion through-‐out the full thickness of the aqui-‐fer. Geochemical analysis of samples can differentiate be-‐tween sources of saltwater. Sampling protocols can be im-‐proved by considering water density. Surface or airborne geophysical examinations aid in mapping this front. Network operation, management, and quality assurance can be im-‐proved. By avoiding the deficiencies and implementing the improvements described for the salinity moni-‐toring network in southwest Florida, coastal communities can ensure that the data needed to evaluate saltwater intrusion is reliable. They can evaluate whether their own salinity net-‐works are worth their salt.
Figure 3. Section through southern part of the City of Naples Coastal Ridge well field. Location of section is shown in figure 2. Figure modified from Prinos (2013).
References Cited
Burns, W.S., and Shih, George, 1984, Preliminary evaluation of the groundwater monitoring net-‐work in Collier County, Florida: Big Cypress Basin Board of the South Florida Water Manage-‐ment District, DRE 181, 46 p., 2 apps.
Klein, Howard, 1980, Water-‐resources investigations, Collier County, Florida: U.S. Geological Survey Open-‐File Report 80–1270, 29 p.
Prinos, S.T., 2013, Saltwater intrusion in the surficial aquifer system of the Big Cypress Basin, southwest Florida, and a proposed plan for improved salinity monitoring: U.S. Geological Survey Open-‐File Report 2013–1088, 58 p., http://pubs.usgs.gov/of/2013/1088/
By Scott T. Prinos [email protected] For more information, contact: Director, USGS Florida Water Science Center 4446 Pet Lane, Suite 108 Lutz, FL 33559 http://fl.water.usgs.gov
Figure 4. Schematic of a well designed for electromag-‐netic induction logging; well casing is made of polyvinyl chloride (PVC).

6
Saltwater Bacteria infects 31 Floridians So far this year, 31 people across Florida have been infected by a saltwater bacteria, and 10 have died. This bacteria can cause infection through consumption of raw sea-‐food or through contact with open wounds. Because of these infections, the Florida Department of Health has issued a PSA warning about this virus. The following article contains general information on this bacteria from the Center for Disease Control and prevention.
What is Vibrio vulnificus? Vibrio vulnificus is a bacterium in the same family as those that cause cholera. It normally lives in warm seawater and is part of a group of vibrios that are called "halophilic" because they require salt. What type of illness does V. vulnifi-‐cus cause? V. vulnificus can cause disease in those who eat contaminated sea-‐
food or have an open wound that is exposed to seawater. Among healthy people, ingestion of V. vulni-‐ficus can cause vomiting, diarrhea, and abdominal pain. In immuno-‐compromised persons, particularly those with chronic liver disease, V. vulnificus can infect the blood-‐stream, causing a severe and life-‐threatening illness characterized by fever and chills, decreased blood pressure (septic shock), and blister-‐ing skin lesions. V. vulnificus blood-‐stream infections are fatal about 50% of the time. V. vulnificus can cause an infection of the skin when open wounds are exposed to warm seawater; these infections may lead to skin break-‐down and ulceration. Persons who are immunocompromised are at higher risk for invasion of the organ-‐ism into the bloodstream and poten-‐tially fatal complications.
How common is V. vulnificus infec-‐tion? V. vulnificus is a rare cause of dis-‐ease, but it is also underreported. Between 1988 and 2006, CDC re-‐ceived reports of more than 900 V. vulnificus infections from the Gulf Coast states, where most cases oc-‐cur. Before 2007, there was no na-‐tional surveillance system for V. vul-‐nificus, but CDC collaborated with the states of Alabama, Florida, Lou-‐isiana, Texas, and Mississippi to monitor the number of cases of V. vulnificus infection in the Gulf Coast region. In 2007, infections caused by V. vulnificus and other Vibrio species became nationally notifiable.
How do persons get infected with V. vulnificus? Persons who are immunocom-‐promised, especially those with chronic liver disease, are at risk for V. vulnificus when they eat raw sea-‐food, particularly oysters. A recent
False color scanning electron micrograph of w:en:Vibrio vulnificus bacteria.
CDC/James Gatha
ny

7
This information was provided by Centers for Disease Control and Prevention, 1600 Clifton Rd. Atlanta, GA 30333, USA 800-‐CDC-‐INFO (800-‐232-‐4636) TTY: (888) 232-‐6348 -‐ Contact CDC–INFO. Information is also available on the world wide web at http://vm.cfsan.fda.gov (http://vm.cfsan.fda.gov)
(http://www.cdc.gov/Other/disclaimer.html).
study showed that people with these pre-‐existing medical condi-‐tions were 80 times more likely to develop V. vulnificus bloodstream infections than were healthy people. The bacterium is frequently isolated from oysters and other shellfish in warm coastal waters during the summer months. Since it is naturally found in warm marine waters, peo-‐ple with open wounds can be ex-‐posed to V. vulnificus through direct contact with seawater. There is no evidence for person-‐to-‐person transmission of V. vulnificus. How can V. vulnificus infection be diagnosed? V. vulnificus infection Is diagnosed by stool, wound, or blood cultures. Notifying the laboratory when this infection is suspected helps because a special growth medium should be used to increase the diagnostic yield. Doctors should have a high suspicion for this organism when patients pre-‐sent with gastrointestinal illness, fever, or shock following the inges-‐tion of raw seafood, especially oys-‐ters, or with a wound infection after exposure to seawater. How is V. vulnificus infection treated? If V. vulnificus is suspected, treat-‐ment with antibiotics should be ini-‐tiated immediately because antibiot-‐ics improve survival. Aggressive at-‐tention should be given to the wound site; amputation of the in-‐fected limb is sometimes necessary. Are there long-‐term consequences of V. vulnificus infection? V. vulnificus infection is an acute llness, and those who recover should not expect any long-‐term conse-‐quences.
How can I learn more about V. vul-‐nificus? You can discuss your medical con-‐cerns with your doctor or other health care provider. Your local city or county health department can provide information about this and other public health problems that are occurring in your area. Informa-‐tion about the potential dangers of raw oyster consumption is available 24 hours a day from the FDA's Sea-‐food Hotline (telephone 1-‐800-‐332-‐4010); FDA public affairs specialists are available at this number be-‐tween 12 and 4 p.m. Monday through Friday. Some tips for preventing V. vulnifi-‐cus infections, particularly among immunocompromised patients, in-‐cluding those with underlying liver disease: • Do not eat raw oysters or other
raw shellfish.
• Cook shellfish (oysters, clams,
mussels) thoroughly.
• For shellfish in the shell, either a) boil until the shells open and continue boiling for 5 more minutes, or b) steam until the shells open and then continue cooking for 9 more minutes. Do not eat those shellfish that do not open during cooking. Boil shucked oysters at least 3 min-‐utes, or fry them in oil at least 10 minutes at 375°F.
• Avoid cross-‐contamination of cooked seafood and other foods with raw seafood and juices from raw seafood.
• Eat shellfish promptly after cooking and refrigerate lefto-‐vers.
• Avoid exposure of open wounds or broken skin to warm salt or brackish water, or to raw shellfish harvested from such waters.
• Wear protective clothing (e.g., gloves) when handling raw shellfish.
Boil shucked oysters at least 3 minutes, or fry them in oil at least 10 minutes at 375°F.
http://w
ww.fo
odsafetynews.com

8
Green Sea Turtles Nest at Unprecedented Pace in Florida this Year
By the Florida Fish and Wildlife Conservation Commission
The number of green sea turtle nests in Florida this year was more than double the count of the previous highest year. Biologists with the Flor-‐ida Fish and Wildlife Conservation Commission (FWC) have docu-‐mented more than 25,000 green turtle nests on 26 index beaches in the state in 2013. “We are astounded and pleased by the high number of green turtle nests documented in 2013,” said Dr. Blair Witherington, FWC research scientist. “It looks like the years of
conservation efforts for this endan-‐gered species are paying off.” FWC-‐trained and authorized survey-‐ors across the state monitor nests on a set of index beaches that span nearly 250 miles and are the focus of the Index Beach Nesting Survey. These surveys began in 1989. Index surveyors follow firm counting guidelines, making it possible for FWC researchers to use the data from these beaches to identify trends.
The trend for green turtles shows an exponential increase in nesting over the past 25 years. In 1989, biologists documented only 464 green turtle nests on index beaches. In 2013, this index nest count was 25,553. The index count represents about 70 percent of green turtle nesting statewide. Leatherback sea turtle nest counts have also risen dramatically over the past quarter century. However, the 2013 count of 322 leatherback nests
Photograph showing how Florida State Parks mark, record and protect sea turtle nests.

9
on index beaches was 193 lower than last year. Loggerhead sea turtles, the most prevalent sea turtle species on Flor-‐ida’s shores, accounted for 44,810 nests on index beaches this year, down from 2012’s near-‐record count of 58,172 nests. Although this feder-‐ally threatened species nests on the same beaches as green turtles and leatherbacks, loggerheads have not shown the recovery in numbers seen in nesting by the other two species. The high level of loggerhead nesting last year followed a pronounced drop in the species’ nest counts be-‐
tween 1998 and 2007. Hundreds of surveyors from conser-‐vation organizations, universities and federal, state and local govern-‐ments – along with other volunteers – make possible the extensive data collection on Florida’s nesting sea turtles. In conjunction with the Index Nesting Beach Survey, the Statewide
Nesting Beach Survey documents sea turtle nesting on nearly all sandy beaches in Florida. Data from the statewide surveys will be available in early 2014. The FWC's role in coordinating Flor-‐ida’s sea turtle nest counts, training surveyors and compiling data is funded by the U.S. Fish and Wildlife Service and sales of the state's sea turtle license plate. Florida residents can purchase the plate to support these efforts at BuyaPlate.com.
Leatherback sea turtle hatchling. (Credit: US Fish and Wildlife Service/South Florida Ecological Services)
http://life
-‐sea.blogspo
t.com
A Kemps Ridley sea turtle nests on the beach. (Credit: National Park Service)
For more information about trends in sea turtle
nest counts, visit MyFWC.com/Research, click on "Wildlife," then click on "Nesting" under the "Sea Turtle" heading. Report sick or injured sea turtles to the FWC’s Wild-‐life Alert Hotline at 888-‐
404-‐FWCC (3922).
A Green sea turtle trying to nest on the beach.

10
Notice to all Florida LAKEWATCH active Samplers Keep those samples flowing! Please be sure to deliver all frozen water and chlorophyll samples to your collection center as soon as possible. This will allow us to collect and process them in a timely manner. Thanks for you help!
From the Water Lab Before finishing your lake monitoring duties, please check your data sheets and water bottles for accuracy. Be sure to double-‐check the stations locations and their numbers and remember that sampling stations should be consistent for each sampling event. In other words: Sta-‐tions 1, 2 and 3 do not sim-‐ply refer to the order in which you happen to collect water on a given day, but should instead refer to fixed
GPS locations. Also, remem-‐ber to write clearly the name of your lake and the County your lake is in. There are many lakes with the same name in Florida and it is im-‐portant that we know the county to keep them sepa-‐rate. Thank you and keep up the good work!
No longer sampling? If you are no longer able to monitor your lake, please let us know as soon as possible so that we can find a new volunteer to train and con-‐tinue the work that you have started! It will also enable us to maintain consistent data if we can train someone be-‐fore the next sampling date arrives.
Kit Roundup If you are no longer able to sample and you have sam-‐pling materials that are in your way, collecting dust, let us help! Please give us a call and we’ll make arrange-‐
ments to pick up the materi-‐als so that we can revamp them and re-‐use them. Like everything else these days, the kits have become more expensive, so we need to be more diligent in collecting and re-‐circulating the un-‐used materials. Thanks for your help!
Finally but not least of all, we want to wish all of our volun-‐teers and supporters a very Happy Holiday Season!
Thank you, The LAKEWATCH Crew
Volunteer Bulletin Board
Sara Kan
e
11
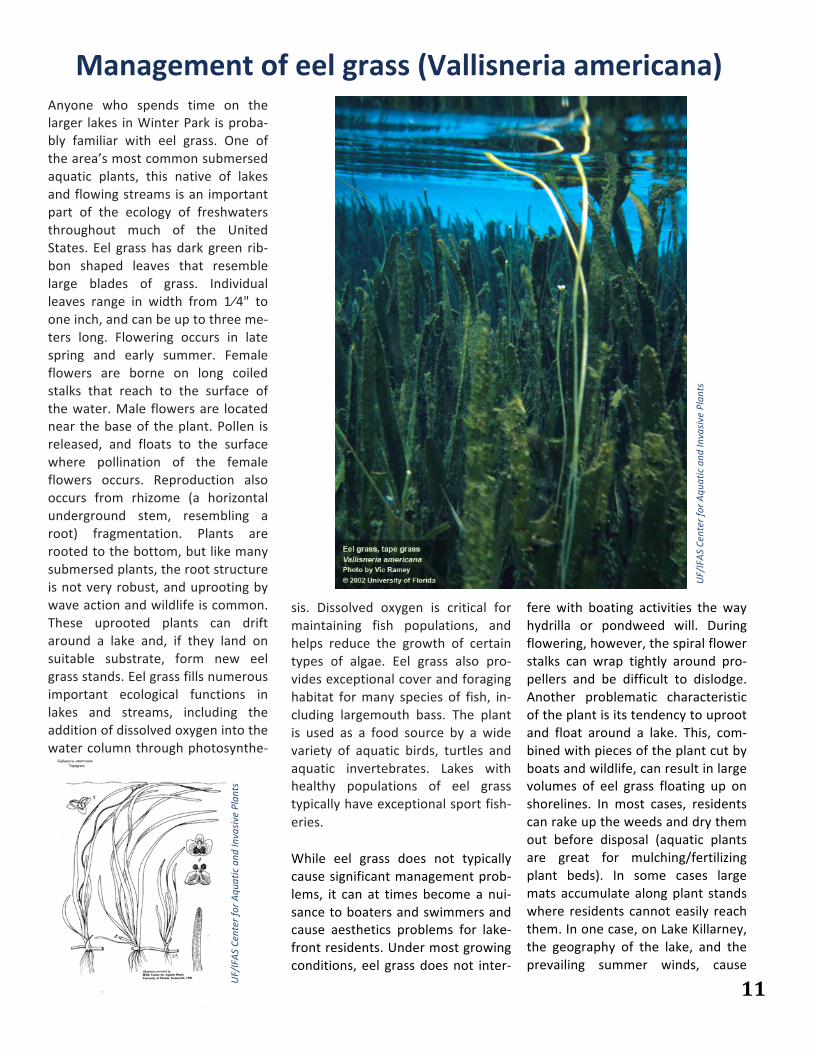
Anyone who spends time on the larger lakes in Winter Park is proba-‐bly familiar with eel grass. One of the area’s most common submersed aquatic plants, this native of lakes and flowing streams is an important part of the ecology of freshwaters throughout much of the United States. Eel grass has dark green rib-‐bon shaped leaves that resemble large blades of grass. Individual leaves range in width from 1⁄4" to one inch, and can be up to three me-‐ters long. Flowering occurs in late spring and early summer. Female flowers are borne on long coiled stalks that reach to the surface of the water. Male flowers are located near the base of the plant. Pollen is released, and floats to the surface where pollination of the female flowers occurs. Reproduction also occurs from rhizome (a horizontal underground stem, resembling a root) fragmentation. Plants are rooted to the bottom, but like many submersed plants, the root structure is not very robust, and uprooting by wave action and wildlife is common. These uprooted plants can drift around a lake and, if they land on suitable substrate, form new eel grass stands. Eel grass fills numerous important ecological functions in lakes and streams, including the addition of dissolved oxygen into the water column through photosynthe-‐
sis. Dissolved oxygen is critical for maintaining fish populations, and helps reduce the growth of certain types of algae. Eel grass also pro-‐vides exceptional cover and foraging habitat for many species of fish, in-‐cluding largemouth bass. The plant is used as a food source by a wide variety of aquatic birds, turtles and aquatic invertebrates. Lakes with healthy populations of eel grass typically have exceptional sport fish-‐eries.
While eel grass does not typically cause significant management prob-‐lems, it can at times become a nui-‐sance to boaters and swimmers and cause aesthetics problems for lake-‐front residents. Under most growing conditions, eel grass does not inter-‐
fere with boating activities the way hydrilla or pondweed will. During flowering, however, the spiral flower stalks can wrap tightly around pro-‐pellers and be difficult to dislodge. Another problematic characteristic of the plant is its tendency to uproot and float around a lake. This, com-‐bined with pieces of the plant cut by boats and wildlife, can result in large volumes of eel grass floating up on shorelines. In most cases, residents can rake up the weeds and dry them out before disposal (aquatic plants are great for mulching/fertilizing plant beds). In some cases large mats accumulate along plant stands where residents cannot easily reach them. In one case, on Lake Killarney, the geography of the lake, and the prevailing summer winds, cause
UF/IFAS Center fo
r Aqu
atic and
Invasive Plants
Management of eel grass (Vallisneria americana)
UF/IFAS Center fo
r Aqu
atic and
Invasive Plants

12
This newsletter is generated by the Florida LAKEWATCH program, within UF/IFAS. Support for the LAKEWATCH program is provided by the Florida Legislature, grants and donations. For more information about LAKEWATCH, to inquire about volunteer training sessions, or to submit materials for inclusion in this publication, write to:
Florida LAKEWATCH Fisheries and Aquatic Sciences
School of Forest Resources and Conservation 7922 NW 71st Street Gainesville, FL 32653
or call 1-800-LAKEWATCH (800-525-3928)
(352) 392-4817 E-mail: [email protected] http://lakewatch.ifas.ufl.edu/
All unsolicited articles, photographs, artwork or other
written material must include contributor’s name,
address and phone number. Opinions expressed are
solely those of the individual contributor and do not
necessarily reflect the opinion or policy of the Florida
LAKEWATCH program.
Florida LAKEWATCH Fisheries and Aquatic Sciences School of Forest Resources and Conservation 7922 NW 71st Street Gainesville, FL 32653
Florida LAKEWATCH
huge mats (up to 4 acres in area) to form, blocking access for numerous residents. One aspect of eel grass ecology to note is the plant’s ten-‐dency to expand or contract in cov-‐erage area and density in two to four year cycles. In some lakes, like Lake Virginia, this variation is rela-‐tively slight and the amount of eel grass does not exhibit noticeable changes. In others, such as Lake Kil-‐larney, these swings in plant bio-‐mass can be drastic, with eel grass coverage ranging from over 60 per-‐cent of the lake area to less than 15 percent and back again all in the course of three or four years.
Because of the ecological impor-‐tance of eel grass, the city is limited by our state permits as to the Airboat with rake removing floating eel grass mats.
amount that we are allowed to con-‐trol. Small areas may be treated oc-‐casionally to facilitate boat traffic, particularly in or near canals, but large scale treatment is not permit-‐ted, nor recommended. To assist in managing this plant the city has built a rake attachment for our large air-‐boat. Using this equipment, and a shore based crew for offloading, op-‐erators can move up to 30 cubic yards of floating grass in a day.
This article was reprinted with permission from the Lakes News for Winter Park Waterways Newsletter, November 2013.