Embed Size (px)
Citation preview
�������������� �����
������������������������
��������������������������
��������������� ����������������������������������
���������������� ��!�"###
�������� ���� ��� �������� ������ ����
�������� ������� ������� ����� ���������� ����� �� ���������� �������
DISCLAIMER
This document was furnished to the Emission Inventory Improvement Program and the U.S.Environmental Protection Agency by Eastern Research Group, Inc., Morrisville, North Carolina. This report is a revised final document and has been reviewed and approved for publication. Theopinions, findings, and conclusions expressed represent a consensus of the members of theEmission Inventory Improvement Program.
iii���� ���� ��
ACKNOWLEDGEMENT
This document was prepared by Eastern Research Group, Inc. for the Point Sources Committeeof the Emission Inventory Improvement Program and for Roy Huntley of the Emission Factorand Inventory Group, U.S. Environmental Protection Agency. Members of the Point SourcesCommittee contributing to the preparation of this document are:
Denise Alston, ENSR CorporationLynn Barnes, South Carolina Department of Health and Environmental ControlDennis Beauregard, Emission Factor and Inventory Group, U.S. Environmental Protection AgencyGary Beckstead, Illinois Environmental Protection AgencyBob Betterton, Co-Chair, South Carolina Department of Health and Environmental ControlPaul Brochi, Texas Natural Resource Conservation CommissionRichard Forbes, Illinois Environmental Protection AgencyAlice Fredlund, Louisiana Department of Environmental QualityMarty Hochhauser, Allegheny County Health DepartmentRoy Huntley, Co-Chair, Emission Factor and Inventory Group, U.S. Environmental Protection AgencyPaul Kim, Minnesota Pollution Control AgencySonya Lewis-Cheatham, Virginia Department of Environmental QualityToch Mangat, Bay Area Air Quality Management DistrictRalph Patterson, Wisconsin Department of Natural ResourcesJim Southerland, North Carolina Department of Environment and Natural ResourcesEitan Tsabari, Omaha Air Quality Control DivisionBob Wooten, North Carolina Department of Environment and Natural Resources
������� ����� �� ��� ������������� ������
iv ���� ���� ��
This page is intentionally left blank.
v���� ���� ��
���������$!�%� � �
1 Introduction . . . . . . . . . . . . . . . . . . . . . . . . . . . . . . . . . . . . . . . . . . . . . . . . . . . . . . . .8.1-1
2 Source Category Description . . . . . . . . . . . . . . . . . . . . . . . . . . . . . . . . . . . . . . . . . . .8.2-1
2.1 Process Description . . . . . . . . . . . . . . . . . . . . . . . . . . . . . . . . . . . . . . . . . . . .8.2-12.1.1 Preassembly and Premix. . . . . . . . . . . . . . . . . . . . . . . . . . . . . . . . . .8.2-12.1.2 Pigment Grinding or Milling. . . . . . . . . . . . . . . . . . . . . . . . . . . . . . .8.2-22.1.3 Product Finishing. . . . . . . . . . . . . . . . . . . . . . . . . . . . . . . . . . . . . . . .8.2-32.1.4 Product Filling. . . . . . . . . . . . . . . . . . . . . . . . . . . . . . . . . . . . . . . . . .8.2-3
2.2 Emission Sources . . . . . . . . . . . . . . . . . . . . . . . . . . . . . . . . . . . . . . . . . . . . . .8.2-32.2.1 Process Operations. . . . . . . . . . . . . . . . . . . . . . . . . . . . . . . . . . . . . . .8.2-62.2.2 Miscellaneous Operations. . . . . . . . . . . . . . . . . . . . . . . . . . . . . . . . .8.2-72.2.3 Material Storage. . . . . . . . . . . . . . . . . . . . . . . . . . . . . . . . . . . . . . . . .8.2-82.2.4 Equipment Leaks. . . . . . . . . . . . . . . . . . . . . . . . . . . . . . . . . . . . . . . .8.2-82.2.5 Spills . . . . . . . . . . . . . . . . . . . . . . . . . . . . . . . . . . . . . . . . . . . . . . . . .8.2-9
2.3 Process Design and Operating Factors Influencing Emissions . . . . . . . . . . .8.2-92.3.1 VOC Control Systems. . . . . . . . . . . . . . . . . . . . . . . . . . . . . . . . . . . .8.2-92.3.2 PM/PM10 Control Systems . . . . . . . . . . . . . . . . . . . . . . . . . . . . . . . .8.2-112.3.3 Equipment or Process Modifications. . . . . . . . . . . . . . . . . . . . . . . .8.2-11
3 Overview of Available Methods. . . . . . . . . . . . . . . . . . . . . . . . . . . . . . . . . . . . . . . .8.3-1
3.1 Emission Estimation Methods. . . . . . . . . . . . . . . . . . . . . . . . . . . . . . . . . . . .8.3-13.1.1 Emission Factors. . . . . . . . . . . . . . . . . . . . . . . . . . . . . . . . . . . . . . . .8.3-13.1.2 Source-specific Models. . . . . . . . . . . . . . . . . . . . . . . . . . . . . . . . . . .8.3-23.1.3 Material (Mass) Balance Calculations. . . . . . . . . . . . . . . . . . . . . . . .8.3-23.1.4 Test Data. . . . . . . . . . . . . . . . . . . . . . . . . . . . . . . . . . . . . . . . . . . . . .8.3-2
3.2 Comparison of Available Emission Estimation Methodologies. . . . . . . . . . 8.3-33.2.1 Emission Factors. . . . . . . . . . . . . . . . . . . . . . . . . . . . . . . . . . . . . . . .8.3-33.2.2 Emission Models. . . . . . . . . . . . . . . . . . . . . . . . . . . . . . . . . . . . . . . .8.3-33.2.3 Material Balance Calculations. . . . . . . . . . . . . . . . . . . . . . . . . . . . .8.3-103.2.4 Test Data. . . . . . . . . . . . . . . . . . . . . . . . . . . . . . . . . . . . . . . . . . . . .8.3-10
��������&��������'��$!�%� � �
vi ���� ���� ��
4 Preferred Methods for Estimating Emissions. . . . . . . . . . . . . . . . . . . . . . . . . . . . . .8.4-1
4.1 Emission Calculations Using Source-specific Emission Models/Equations . 8.4-14.1.1 Emission Model for Material Loading. . . . . . . . . . . . . . . . . . . . . . . .8.4-44.1.2 Heat-up Losses. . . . . . . . . . . . . . . . . . . . . . . . . . . . . . . . . . . . . . . . .8.4-114.1.3 Emission Model for Spills. . . . . . . . . . . . . . . . . . . . . . . . . . . . . . . .8.4-174.1.4 Emission Model for Surface Evaporation. . . . . . . . . . . . . . . . . . . .8.4-204.1.5 Emission Model for Liquid Material Storage. . . . . . . . . . . . . . . . . 8.4-224.1.6 Emission Model for Wastewater Treatment . . . . . . . . . . . . . . . . . . 8.4-22
4.2 Emission Calculations Using Emission Factors . . . . . . . . . . . . . . . . . . . . .8.4-234.2.1 Total and Speciated VOC Emissions from Solvent
Reclamation . . . . . . . . . . . . . . . . . . . . . . . . . . . . . . . . . . . . . . . . . . .8.4-234.2.2 VOC Emissions from Parts Cleaning. . . . . . . . . . . . . . . . . . . . . . .8.4-264.2.3 VOC Emissions from Equipment Leaks . . . . . . . . . . . . . . . . . . . . .8.4-284.2.4 PM/PM10 Emissions from a Paint or Ink Manufacturing Facility . . 8.4-28
5 Alternative Methods for Estimating Emissions. . . . . . . . . . . . . . . . . . . . . . . . . . . . .8.5-1
5.1 Emission Calculations Using Emission Factors . . . . . . . . . . . . . . . . . . . . . .8.5-15.1.1 Total VOC Emissions from Paint Manufacturing Facilities. . . . . . 8.5-15.1.2 VOC Emissions from Paint Mixing Operations. . . . . . . . . . . . . . . . 8.5-65.1.3 VOC Emissions from Ink Manufacturing Facilities . . . . . . . . . . . . 8.5-8
5.2 Emissions from Miscellaneous Process Equipment with Exhaust Systems 8.5-10
5.3 VOC and PM Emission Calculations Using Material Balance . . . . . . . . .8.5-11
5.4 Emission Calculations Using Test Data . . . . . . . . . . . . . . . . . . . . . . . . . . .8.5-12
6 Quality Assurance/Quality Control. . . . . . . . . . . . . . . . . . . . . . . . . . . . . . . . . . . . . .8.6-1
6.1 General QA/QC Considerations Involved in Emission EstimationTechniques . . . . . . . . . . . . . . . . . . . . . . . . . . . . . . . . . . . . . . . . . . . . . . . . . . .8.6-16.1.1 Emission Factors. . . . . . . . . . . . . . . . . . . . . . . . . . . . . . . . . . . . . . . .8.6-16.1.2 Emission Models. . . . . . . . . . . . . . . . . . . . . . . . . . . . . . . . . . . . . . . .8.6-36.1.3 Material Balance. . . . . . . . . . . . . . . . . . . . . . . . . . . . . . . . . . . . . . . .8.6-36.1.4 Testing. . . . . . . . . . . . . . . . . . . . . . . . . . . . . . . . . . . . . . . . . . . . . . . .8.6-3
��������&��������'��$!�%� � �
vii���� ���� ��
6.2 Data Attribute Rating System (DARS) Scores . . . . . . . . . . . . . . . . . . . . . . .8.6-4
7 Data Coding Procedures . . . . . . . . . . . . . . . . . . . . . . . . . . . . . . . . . . . . . . . . . . . . . .8.7-1
7.1 Source Classification Codes . . . . . . . . . . . . . . . . . . . . . . . . . . . . . . . . . . . . .8.7-17.1.1 Paint and Ink Manufacturing Emissions. . . . . . . . . . . . . . . . . . . . . .8.7-17.1.2 Solvent Reclamation. . . . . . . . . . . . . . . . . . . . . . . . . . . . . . . . . . . . .8.7-17.1.3 Material Storage. . . . . . . . . . . . . . . . . . . . . . . . . . . . . . . . . . . . . . . . .8.7-2
7.2 AIRS Control Device Codes . . . . . . . . . . . . . . . . . . . . . . . . . . . . . . . . . . . . .8.7-2
8 References . . . . . . . . . . . . . . . . . . . . . . . . . . . . . . . . . . . . . . . . . . . . . . . . . . . . . . . . .8.8-1
Appendix A: Example Data Collection Forms and Instructions
viii ���� ���� ��
��������������(���
�� �)� � �
8.6-1 Example Emission Inventory Checklist for Paint and Ink ManufacturingFacilities . . . . . . . . . . . . . . . . . . . . . . . . . . . . . . . . . . . . . . . . . . . . . . . . . . . . . . . . . . .8.6-2
��*��� � �
8.2-1 Air Pollutants Associated with Manufacturing of Paints and Inks. . . . . . . . . . . . . 8.2-4
8.2-2 Typical Paint and Ink Manufacturing Emission Control Techniques. . . . . . . . . . 8.2-10
8.3-1 Summary of Preferred and Alternative Emission Estimation Methods for Paint and Ink Manufacturing Operations . . . . . . . . . . . . . . . . . . . . . . . . . . . . . . . . .8.3-4
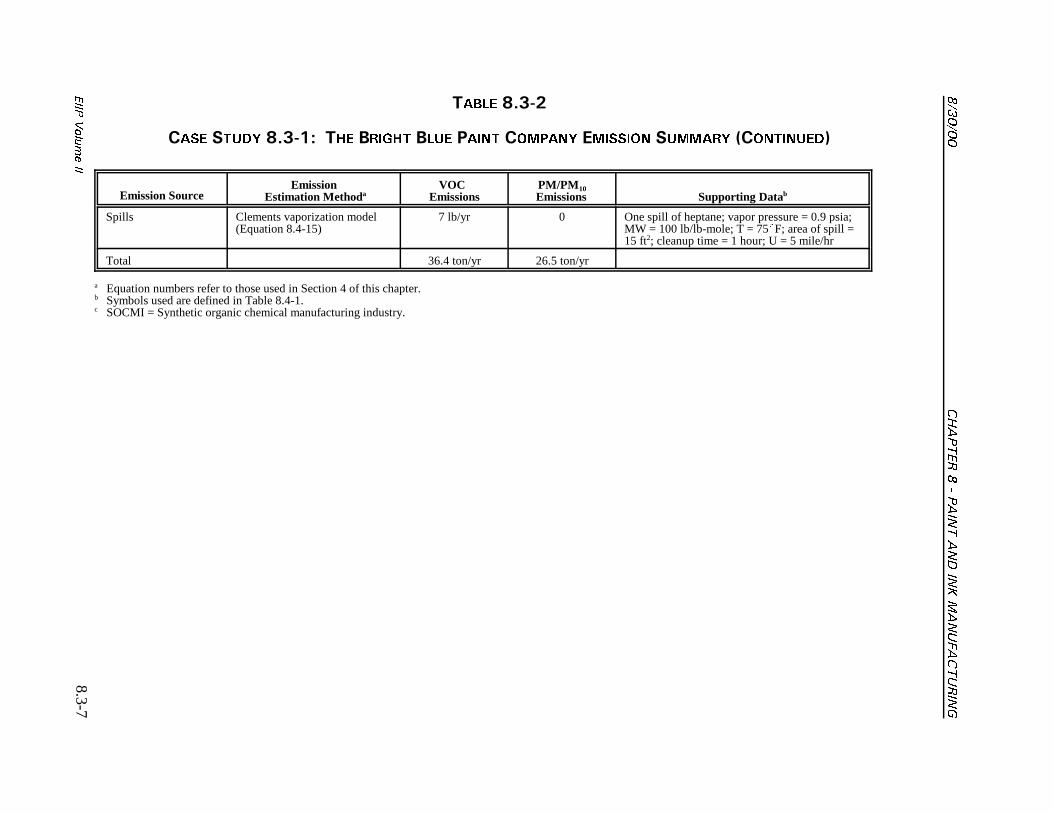
8.3-2 Case Study 8.3-1: The Bright Blue Paint Company Emissions Summary. . . . . . 8.3-6
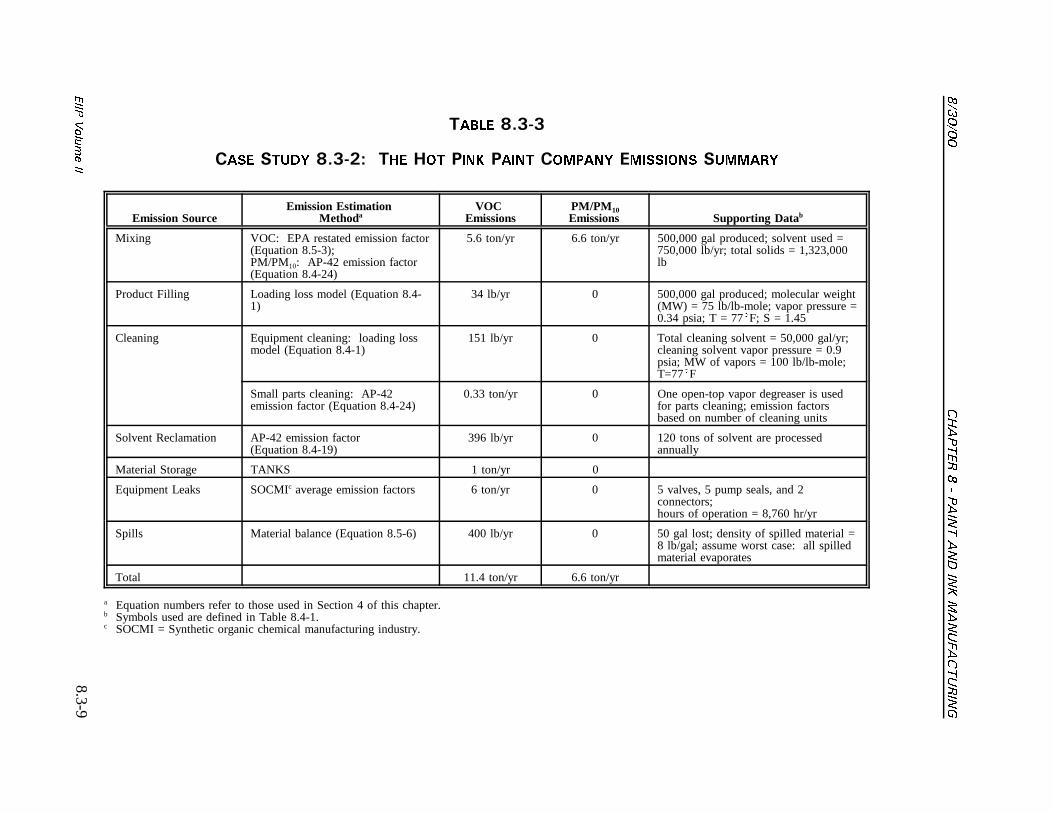
8.3-3 Case Study 8.3-2: The Hot Pink Paint Company Emissions Summary. . . . . . . . . 8.3-9
8.4-1 List of Variables and Symbols. . . . . . . . . . . . . . . . . . . . . . . . . . . . . . . . . . . . . . . . .8.4-2
8.5-1 List of Variables and Symbols. . . . . . . . . . . . . . . . . . . . . . . . . . . . . . . . . . . . . . . . .8.5-2
8.6-1 DARS Scores: AP-42 Emission Factors . . . . . . . . . . . . . . . . . . . . . . . . . . . . . . . . .8.6-5
8.6-2 DARS Scores: Emission Models. . . . . . . . . . . . . . . . . . . . . . . . . . . . . . . . . . . . . . .8.6-6
8.6-3 DARS Scores: Material Balance. . . . . . . . . . . . . . . . . . . . . . . . . . . . . . . . . . . . . . .8.6-7
8.6-4 DARS Scores: Testing Data. . . . . . . . . . . . . . . . . . . . . . . . . . . . . . . . . . . . . . . . . .8.6-8
8.7-1 Source Classification Codes for Paint and Ink Manufacturing Operations(SIC Code 2851). . . . . . . . . . . . . . . . . . . . . . . . . . . . . . . . . . . . . . . . . . . . . . . . . . . .8.7-3
8.7-2 AIRS Control Device Codes. . . . . . . . . . . . . . . . . . . . . . . . . . . . . . . . . . . . . . . . . .8.7-22
8.1-1���� ���� ��
+
�����������
The purposes of the preferred methods guidelines are to describe emission estimationtechniques for point sources in a clear and unambiguous manner and to provide conciseexample calculations to aid in the preparation of emission inventories. While emissionsestimates are not provided, the information presented in this document may be used to selectan emission estimation technique best suited to a particular application. This chapter describesthe procedures and recommended approaches for estimating emissions from paint and inkmanufacturing operations and is intended to assist industry as well as regulatory agencypersonnel. Thus, some parts of the document may be more relevant to one group than to theother.
Section 2 of this chapter contains a general description of the paint and ink manufacturingsource category, common emission sources, and an overview of available control technologies. Section 3 of this chapter provides an overview of available emission estimation methods. Itshould be noted that the use of site-specific emissions data is always preferred over the use ofdefault values developed through use of industry-averaged data. However, depending uponavailable resources, obtaining site-specific data may not be cost effective.
Section 4 presents the preferred methods for estimating emissions from paint and inkmanufacturing operations, while Section 5 presents the alternative emission estimationtechniques. Quality assurance (QA) and quality control (QC) procedures are described inSection 6. Coding procedures used for data input and storage are discussed in Section 7. Some states use their own unique identification codes, so individual state agencies should becontacted to determine the appropriate coding scheme to use. References are cited inSection 8. Appendix A provides example data collection forms to assist in informationgathering prior to emissions calculations.

������� ����� �� ��� ������������� ������
8.1-2 ���� ���� ��
This page is intentionally left blank.
8.2-1���� ���� ��
"
������������,������ ����
"-+ ����������� ����
This section provides a brief overview of paint and ink manufacturing operations. The readeris referred to Control of VOC Emissions from Ink and Paint Manufacturing Processes,April 1992, for more detail (EPA, 1992a).
Paint and ink are suspensions of finely separated pigment particles in a liquid that whenspread over a surface in a thin layer will form a solid, cohesive, and adherent film. Types ofpaints that are currently manufactured include architectural coatings, product finishes (e.g.,finishes for automobiles, machinery, metal and wood furniture, and appliances), and special-purpose coatings (e.g., industrial new construction and maintenance paints, traffic markingpaints, and marine paints) (EPA, 1992a). Approximately 80 percent of architectural coatingsare water-based (Census Bureau, 1997). However, solvent-based paint is still predominantlyused for product finishes and special-purpose coatings (Noyes, 1993).
Inks that are currently manufactured include letterpress, lithographic and offset, gravure, andflexographic inks (EPA, 1992a). Letterpress and lithographic inks are typically classified aspaste inks. Gravure and flexographic inks are typically water- or solvent-based and areclassified as liquid inks (NAPIM, 1996). Specialty ink products include textile and silk screenink, invisible inks, powder inks, carbon paper, typewriter, and duplicating inks (EPA, 1992a).
Paint and ink manufacturing can be classified as a batch process and generally involves theblending/mixing of resins, pigments, solvents, and additives. Traditional paint and inkmanufacturing consists of four major steps:
� Preassembly and premix;
� Pigment grinding/milling/dispersing;
� Product finishing/blending; and
� Product filling/packaging (Fisher et al., 1993).
These steps are described in more detail in the sections below.
"-+-+ ��������� �� ����
In the preassembly and premix step, liquid raw materials are assembled and then mixed incontainers to form a viscous material to which pigments are added (EPA, 1992a). For
������� ����� �� ��� ������������� ������
8.2-2 ���� ���� ��
solvent-based paints, the raw ingredients include resins, organic solvents, plasticizers, drypigment, and pigment extenders. Raw materials used in the preassembly and premix step forwater-based paints include water, ammonia, dispersant, pigment, and pigment extenders(Noyes, 1993). Raw materials for ink manufacturing include pigments, oils, resins, solvents,and driers (EPA, 1992a). The premix stage results in the formation of an intermediate productthat is referred to as the base or mill base (EPA, 1992a).
The type of equipment used in the premix step depends on the batch size and the type of paintand ink being produced. Drums equipped with a portable mixer may be used for drum-sizedbatches. These mixers normally have an impeller with three or four blades. Other materialsmade in portable mix tanks may be blended using larger, permanent high-speed dispersers orvariable-speed mixers fitted with paddle, propeller, turbine, or disc-type agitators(EPA, 1992a).
Paint and ink manufacturing facilities may use typical grinding equipment to accomplish thepremix operations (EPA, 1992a). This approach, common with water-based paints and inks,eliminates the need to transfer the material to another type of equipment for thegrinding/milling step described below.
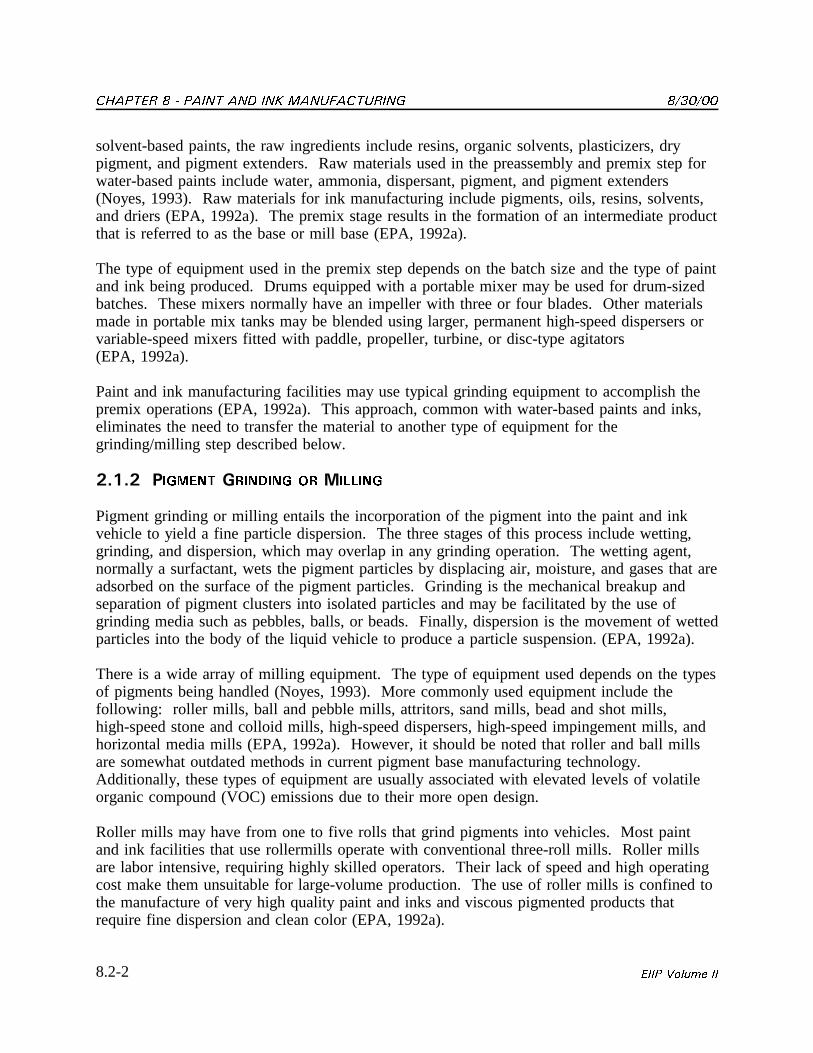
"-+-" ����� ������ �� ������
Pigment grinding or milling entails the incorporation of the pigment into the paint and inkvehicle to yield a fine particle dispersion. The three stages of this process include wetting,grinding, and dispersion, which may overlap in any grinding operation. The wetting agent,normally a surfactant, wets the pigment particles by displacing air, moisture, and gases that areadsorbed on the surface of the pigment particles. Grinding is the mechanical breakup andseparation of pigment clusters into isolated particles and may be facilitated by the use ofgrinding media such as pebbles, balls, or beads. Finally, dispersion is the movement of wettedparticles into the body of the liquid vehicle to produce a particle suspension. (EPA, 1992a).
There is a wide array of milling equipment. The type of equipment used depends on the typesof pigments being handled (Noyes, 1993). More commonly used equipment include thefollowing: roller mills, ball and pebble mills, attritors, sand mills, bead and shot mills,high-speed stone and colloid mills, high-speed dispersers, high-speed impingement mills, andhorizontal media mills (EPA, 1992a). However, it should be noted that roller and ball millsare somewhat outdated methods in current pigment base manufacturing technology. Additionally, these types of equipment are usually associated with elevated levels of volatileorganic compound (VOC) emissions due to their more open design.
Roller mills may have from one to five rolls that grind pigments into vehicles. Most paintand ink facilities that use rollermills operate with conventional three-roll mills. Roller millsare labor intensive, requiring highly skilled operators. Their lack of speed and high operatingcost make them unsuitable for large-volume production. The use of roller mills is confined tothe manufacture of very high quality paint and inks and viscous pigmented products thatrequire fine dispersion and clean color (EPA, 1992a).
������ ������� ����� �� ��� �������������
8.2-3���� ���� ��
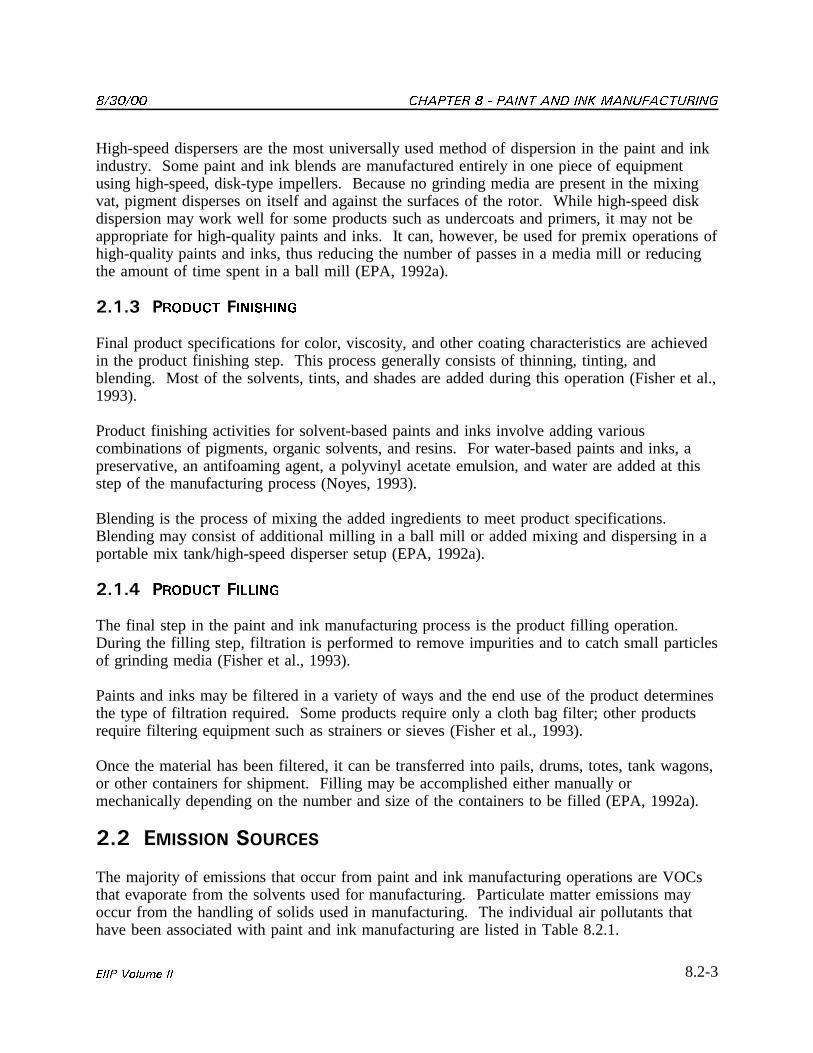
High-speed dispersers are the most universally used method of dispersion in the paint and inkindustry. Some paint and ink blends are manufactured entirely in one piece of equipmentusing high-speed, disk-type impellers. Because no grinding media are present in the mixingvat, pigment disperses on itself and against the surfaces of the rotor. While high-speed diskdispersion may work well for some products such as undercoats and primers, it may not beappropriate for high-quality paints and inks. It can, however, be used for premix operations ofhigh-quality paints and inks, thus reducing the number of passes in a media mill or reducingthe amount of time spent in a ball mill (EPA, 1992a).
"-+-. ������ �������
Final product specifications for color, viscosity, and other coating characteristics are achievedin the product finishing step. This process generally consists of thinning, tinting, andblending. Most of the solvents, tints, and shades are added during this operation (Fisher et al.,1993).
Product finishing activities for solvent-based paints and inks involve adding variouscombinations of pigments, organic solvents, and resins. For water-based paints and inks, apreservative, an antifoaming agent, a polyvinyl acetate emulsion, and water are added at thisstep of the manufacturing process (Noyes, 1993).
Blending is the process of mixing the added ingredients to meet product specifications. Blending may consist of additional milling in a ball mill or added mixing and dispersing in aportable mix tank/high-speed disperser setup (EPA, 1992a).
"-+-/ ������ ������
The final step in the paint and ink manufacturing process is the product filling operation. During the filling step, filtration is performed to remove impurities and to catch small particlesof grinding media (Fisher et al., 1993).
Paints and inks may be filtered in a variety of ways and the end use of the product determinesthe type of filtration required. Some products require only a cloth bag filter; other productsrequire filtering equipment such as strainers or sieves (Fisher et al., 1993).
Once the material has been filtered, it can be transferred into pails, drums, totes, tank wagons,or other containers for shipment. Filling may be accomplished either manually ormechanically depending on the number and size of the containers to be filled (EPA, 1992a).
"-" ���������������
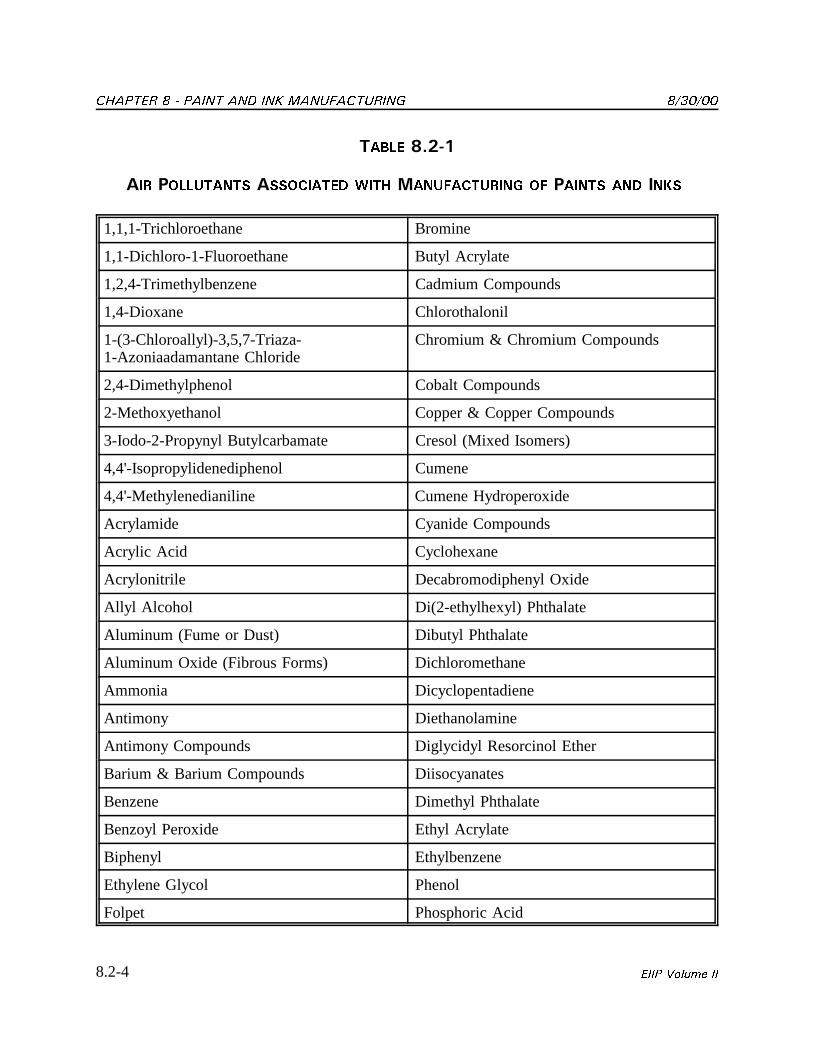
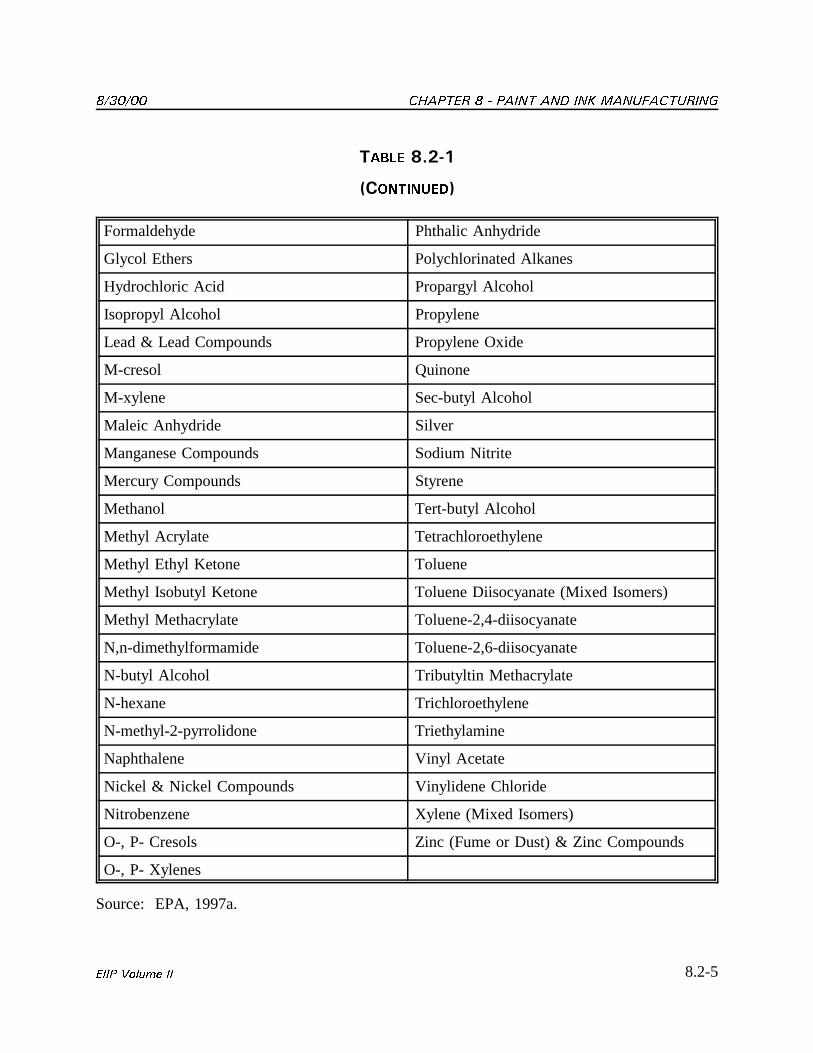
The majority of emissions that occur from paint and ink manufacturing operations are VOCsthat evaporate from the solvents used for manufacturing. Particulate matter emissions mayoccur from the handling of solids used in manufacturing. The individual air pollutants thathave been associated with paint and ink manufacturing are listed in Table 8.2.1.
������� ����� �� ��� ������������� ������
8.2-4 ���� ���� ��
����� �-"0+
��� �������� ���������� ���� ����������� �� ���� �� ���
1,1,1-Trichloroethane Bromine
1,1-Dichloro-1-Fluoroethane Butyl Acrylate
1,2,4-Trimethylbenzene Cadmium Compounds
1,4-Dioxane Chlorothalonil
1-(3-Chloroallyl)-3,5,7-Triaza-1-Azoniaadamantane Chloride
Chromium & Chromium Compounds
2,4-Dimethylphenol Cobalt Compounds
2-Methoxyethanol Copper & Copper Compounds
3-Iodo-2-Propynyl Butylcarbamate Cresol (Mixed Isomers)
4,4'-Isopropylidenediphenol Cumene
4,4'-Methylenedianiline Cumene Hydroperoxide
Acrylamide Cyanide Compounds
Acrylic Acid Cyclohexane
Acrylonitrile Decabromodiphenyl Oxide
Allyl Alcohol Di(2-ethylhexyl) Phthalate
Aluminum (Fume or Dust) Dibutyl Phthalate
Aluminum Oxide (Fibrous Forms) Dichloromethane
Ammonia Dicyclopentadiene
Antimony Diethanolamine
Antimony Compounds Diglycidyl Resorcinol Ether
Barium & Barium Compounds Diisocyanates
Benzene Dimethyl Phthalate
Benzoyl Peroxide Ethyl Acrylate
Biphenyl Ethylbenzene
Ethylene Glycol Phenol
Folpet Phosphoric Acid
������ ������� ����� �� ��� �������������
8.2-5���� ���� ��
����� �-"0+
&������'
Formaldehyde Phthalic Anhydride
Glycol Ethers Polychlorinated Alkanes
Hydrochloric Acid Propargyl Alcohol
Isopropyl Alcohol Propylene
Lead & Lead Compounds Propylene Oxide
M-cresol Quinone
M-xylene Sec-butyl Alcohol
Maleic Anhydride Silver
Manganese Compounds Sodium Nitrite
Mercury Compounds Styrene
Methanol Tert-butyl Alcohol
Methyl Acrylate Tetrachloroethylene
Methyl Ethyl Ketone Toluene
Methyl Isobutyl Ketone Toluene Diisocyanate (Mixed Isomers)
Methyl Methacrylate Toluene-2,4-diisocyanate
N,n-dimethylformamide Toluene-2,6-diisocyanate
N-butyl Alcohol Tributyltin Methacrylate
N-hexane Trichloroethylene
N-methyl-2-pyrrolidone Triethylamine
Naphthalene Vinyl Acetate
Nickel & Nickel Compounds Vinylidene Chloride
Nitrobenzene Xylene (Mixed Isomers)
O-, P- Cresols Zinc (Fume or Dust) & Zinc Compounds
O-, P- Xylenes
Source: EPA, 1997a.
������� ����� �� ��� ������������� ������
8.2-6 ���� ���� ��
Several air emission sources have been identified for paint and ink manufacturing operations;they are as follows:
� Process operations;
� Miscellaneous operations;
� Material storage;
� Equipment leaks; and
� Spills.
Each of the above emission sources is described in more detail in the following sections.
"-"-+ ������ ���������
Process operations cover emissions from mixing, grinding, blending, and filling activities.Emissions from these operations can generally be classified in one of the following fourcategories.
������������� ���������
VOC emissions may occur during material loading of mixing and grinding equipment due todisplacement of organic vapors. VOCs may be emitted from a mixing tank when the device isuncovered or when a lid is open. For certain grinding equipment, VOCs may be releasedfrom the chute through which ingredients are added.
Particulate matter (PM) and PM less than or equal to 10 �m in diameter (PM10) emissionsmay also occur during the material loading process from handling of pigments and othersolids. VOC and PM emissions during material loading emissions may occur as point sourceor fugitive, depending on whether a PM emissions collection system is in place.
������������
Heat-up losses occur during operation of high-speed dispersers, ball and pebble mills, and similar types of dispersing equipment. During the grinding/dispersing process, there is arise in temperature as some of the kinetic energy of mixing is converted to thermal energy. This rise in temperature is controlled through the use of cold water jackets. As the VOCs inthe mixers heat up, the vapor in the headspace expands, forcing emissions from theequipment. Heat-up losses are classified as fugitive (Fisher et al., 1993).
������ ������� ����� �� ��� �������������
8.2-7���� ���� ��
�����������������
Surface evaporation may occur during mixing, dispersing, and blending operations if thevessel contents are exposed to the atmosphere. For certain types of mixing and grindingequipment, VOCs may be emitted through agitator shaft openings or around the edges of a vessel lid. VOC emissions from older vertical media mills (i.e., sand mills, bead mills, andshot mills) may occur from the exposed filtering screen. Surface evaporation emissions aregenerally fugitive in nature (EPA, 1992a).
������ �����
Emissions during product filling occur during transfer and free-fall into the receivingcontainer. Resultant losses during the filling operations are classified as fugitive.
"-"-" ������������ ���������
In addition to typical process operations associated with paint and ink manufacturing,miscellaneous operations can generate emissions (primarily in the form of VOCs). These operations are discussed below:
�����������������
Solvent reclamation refers to the purification of dirty or spent solvent through use of adistillation device. VOC emissions occur from loading solvent into the distillation equipment,operation of the distillation equipment, and spillage. Emissions from loading and spilling areclassified as fugitive, while emissions from operation of the equipment are generallydischarged through a condenser vent and are thus classified as point source.
�������
Cleaning is an important ancillary part of the paint and ink manufacturing process. Process equipment may be cleaned with solvent as often as after each batch. VOC emissionsresult from charging the mixer or disperser with solvent and can be characterized as fugitive. In addition to this type of cleaning, small items used in the paint and ink manufacturingprocess may be cleaned by washing with solvents in a cold cleaner or open-top vapordegreaser (Fisher et al., 1993). Of the two technologies, the use of a cold cleaner is morecommon. VOC emissions from this type of cleaning are classified as fugitive. ��������������������
A paint and ink manufacturing facility may use a wastewater treatment system to treatcontaminated water generated during the paint and ink manufacturing process (e.g., water thathas been used to clean equipment used in the production of water-based paint and ink). Wastewater treatment systems generally consist of a series of surface impoundments that areused for equalization, neutralization, aeration, and clarification of the waste stream. FugitiveVOC emissions may occur from each type of basin. Procedures used to estimate emissions
������� ����� �� ��� ������������� ������
8.2-8 ���� ���� ��
from wastewater treatment facilities are described in detail in Volume II, Chapter 5, Preferredand Alternative Methods for Estimating Air Emissions from Wastewater Collection andTreatment.
"-"-. �������� �������
Various types and sizes of storage tanks are used to store solvents and resins used in the paintand ink manufacturing process. Most of these tanks have a fixed-roof design (Fisher et al.,1993).
The two significant types of emissions from fixed-roof tanks are breathing and working losses. Breathing loss is the expulsion of vapor from a tank through vapor expansion and contractionthat result from changes in ambient temperature and barometric pressure. This loss occurswithout any liquid level change in the tank (EPA, 1995a).
The combined loss from filling and emptying tanks is called working loss. Evaporation duringfilling operations results from an increase in the liquid level in the tank. As the liquid levelincreases, the pressure inside the tank exceeds the relief pressure and vapors are expelled fromthe tank. Evaporative emissions during emptying occur when air drawn into the tank duringliquid removal becomes saturated with organic vapor and expands, expelling vapor through thevapor relief valve (EPA, 1995a).
Emissions from tanks are characterized as a point source because VOCs are released through avent.
"-"-/ �������� �����
In order to transport stored materials (i.e., organic solvents and resins) from storage tanks tothe paint and ink manufacturing operation, a network of pipes, pumps, valves, and flanges isemployed. As liquid material is pumped from the storage tanks to the particular process area,the pipes and supporting hardware (process line components) may develop leaks over time. When leaks occur, volatile components in the transported material are released to theatmosphere. This generally occurs from the following process line components:
� Pump seals;
� Valves;
� Compressor seals;
� Safety relief valves;
� Flanges;
� Open-ended lines; and
������ ������� ����� �� ��� �������������
8.2-9���� ���� ��
� Sampling connections (Fisher et al., 1993).
Emissions from equipment leaks can be characterized as fugitive and are described in detail inVolume II, Chapter 4, Preferred and Alternative Methods for Estimating Fugitive Emissionsfrom Equipment Leaks.
"-"-1 ������
Solvents, resins, or product may be accidentally spilled during manufacturing or cleaningactivities. Materials that are spilled onto the ground may spread over an area, vaporize, andthus result in an air emission (EPA, 1987). Such an emission would be characterized asfugitive.
"-. ������������������ ����������������������������������
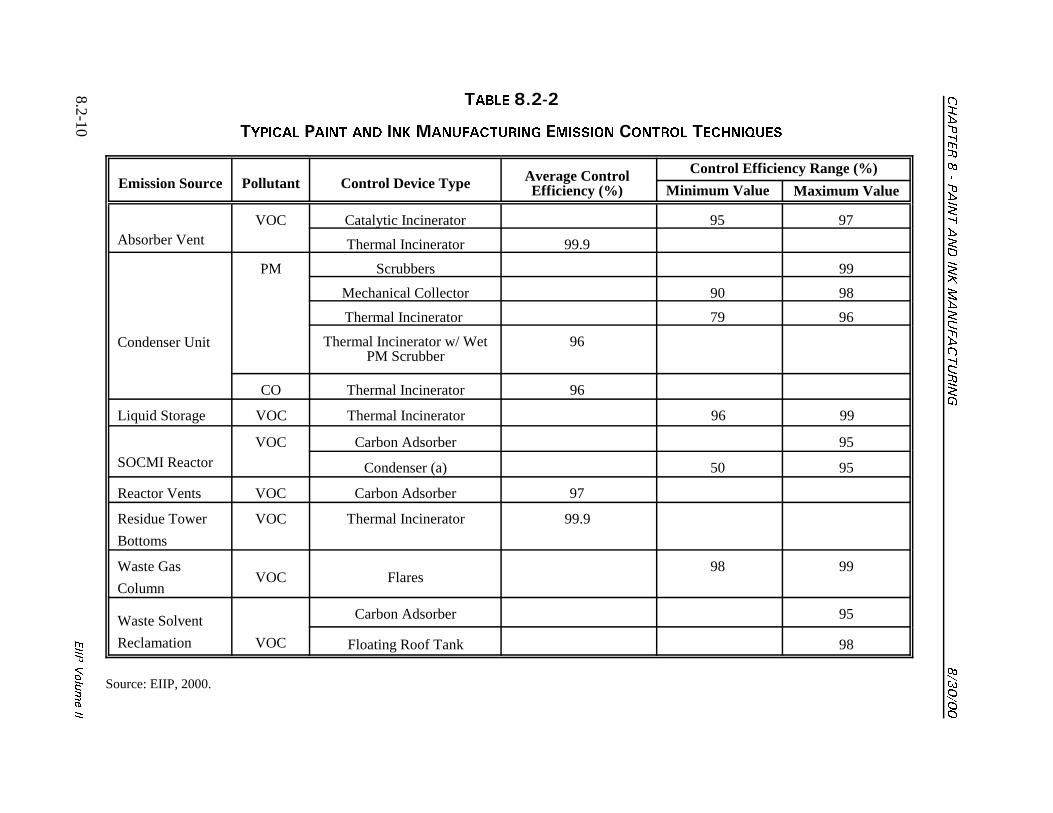
VOC and PM emissions from paint and ink manufacturing may be reduced through use ofadd-on control systems or through equipment and process modifications. Control devices andtechniques commonly used at paint and ink manufacturing facilities are presented inTable 8.2-2.
"-.-+ �� ����� ������
A VOC control system consists of a capture device and a removal device. The capture device(such as a hood or enclosure) captures the VOC-laden air from the emission area and ductsthe emission stream to removal equipment such as a recovery device (e.g., an adsorber) or acombustion device (e.g., an incinerator) that removes the VOCs from the air. The overallefficiency of a control system is calculated by multiplying the capture system efficiency by theremoval device efficiency (EPA, 1992a).
Removal equipment available for treating VOC-containing air streams includes recoverydevices (i.e., carbon adsorption, absorption, and condensation) and combustion devices (i.e.,thermal incinerators, catalytic incinerators, and industrial boilers and process heaters). Controlefficiencies for this equipment can range from 50 to 99 percent, but are most typically greaterthan 95 percent (EIIP, 2000). Carbon adsorbers, absorbers (scrubbers), condensers, andcatalytic incinerators are generally not appropriate for paint and ink manufacturing facilitiesbecause these devices are not designed to treat low VOC inlet concentrations that are typicalfor the paint and ink industry. In addition, the wide mixture of organics that may be emittedat a paint and ink facility will tend to reduce the efficiency of these types of control devices. Industrial and process heaters are capable of effectively treating the types and levels of VOCsgenerated by the paint and ink industry but are found in few, if any, paint and inkmanufacturing facilities (EPA, 1992a).
�������������� ����������������
������
8.2-10����
������
����� �-"0"
������ ��� �� � ���������� ������� ����� ��������
Emission Source Pollutant Control Device Type Average ControlEfficiency (%)
Control Efficiency Range (%)
Minimum Value Maximum Value
Absorber VentVOC Catalytic Incinerator 95 97
Thermal Incinerator 99.9
Condenser Unit
PM Scrubbers 99
Mechanical Collector 90 98
Thermal Incinerator 79 96
Thermal Incinerator w/ WetPM Scrubber
96
CO Thermal Incinerator 96
Liquid Storage VOC Thermal Incinerator 96 99
SOCMI ReactorVOC Carbon Adsorber 95
Condenser (a) 50 95
Reactor Vents VOC Carbon Adsorber 97
Residue Tower
Bottoms
VOC Thermal Incinerator 99.9
Waste Gas
ColumnVOC Flares
98 99
Waste Solvent
Reclamation VOC
Carbon Adsorber 95
Floating Roof Tank 98
Source: EIIP, 2000.
������ ������� ����� �� ��� �������������
8.2-11���� ���� ��
Thermal incineration is an applicable control technique for the paint and ink industry but isused by a limited number of facilities. Thermal incinerators pass the emission stream througha combustion chamber where the VOCs are burned at temperatures ranging from 700 to1,300�C. VOC removal efficiencies of 98 percent or greater may be achieved depending onthe design of the equipment.
A fluidized-bed carbon adsorption system evaluated for removing toluene, MEK, andisopropyl alcohol emissions at an ink manufacturing establishment had a control efficiency of98.2% (EPA, 1995h).
The principle of operation relies on the same adsorption/desorption process common to alladsorption systems. The difference is that the process is carried out continuously in onevessel as the carbon itself moves from the top (adsorption) section to the bottom (desorptionor “stripping”) section. The “stripping agent” in this case is an inert hot gas which removesthe organic vapors (OV) from the carbon after which the OV is condensed and recovered. The stripping agent can be steam, hot nitrogen, or even hot ambient air in some cases.
The majority of paint and ink facilities use equipment and process modifications to reduce VOC emissions. These are discussed in more detail later in Section 2.3.3.
"-.-" �2 ��� ����� ������
PM/PM10 control systems for the paint and ink industry consist of a capture device paired witha control device that is typically a fabric filter (baghouse). These systems are typicallyemployed to reduce PM emissions from charging pigments and other solids into mixing andgrinding devices.
With fabric filter systems, particles are caught on the surface of the bags while thecleaned gaseous stream passes through. To minimize pressure drop, the bags must be cleanedperiodically as the dust layer builds up (EIIP, 1996). The captured dust may be recycled orsent for off-site disposal or treatment.
Fabric filters are least efficient with particles 0.1 to 0.3 �m in diameter and with emissionstreams of high moisture content. When operated under optimum conditions, they cangenerally achieve control efficiencies of up to 99+ percent (EIIP, 2000). However, typicalcontrol efficiencies range from 95 to 99 percent.
"-.-. �������� �� ������ ������������
Most paint and ink manufacturing facilities reduce VOC emissions through equipment orprocess modifications. Some of these techniques will also reduce PM emissions. Modifications include those discussed below.
������� ����� �� ��� ������������� ������
8.2-12 ���� ���� ��
��������
Tank lids are the most common equipment modification used during paint and inkmanufacturing activities to control VOC emissions. Lids reduce the amount of VOCs emittedduring mixing operations and range in control efficiency from 40 to 96 percent (EPA, 1992a).
�������������� �� �������
VOC and PM emissions may be reduced by converting older milling equipment to newer,more efficient closed systems such as horizontal media mills. Typically, horizontal mediamills are charged by pumping material from containers or premix equipment through anenclosed piping system. Material discharge is also through enclosed pipes or hoses. VOClosses during operation of the horizontal media mill are controlled because the filtering screenis enclosed by a sheet metal cover (EPA, 1992a).
� ��������������� �!������
Several types of equipment can be used to reduce amounts of solvents used during vesselcleaning and thus decrease VOC emissions. These include the following:
� Rubber wipers (used to scrape the clinging paint and ink from the sides of thetank);
� High-pressure spray heads (used to clean process tanks);
� Tanks lined with Teflon™ (Teflon™ reduces the ability of paint and ink tocling to the sides of the tank);
� Plastic (or foam) "pigs" (a "pig" is moved through the pipes and pushes leftoverpaint and ink [from previous batches] through the pipe from the pipe walls); and
� Automatic tub washers.
The degree to which VOC emissions from cleaning activities are reduced will depend on thefrequency of using one or more of the alternative cleaning techniques listed above. It hasbeen reported that high-pressure spray heads can reduce cleaning material use by 80 to90 percent (EPA, 1992a).
"�����#� ������ ���#��������
PM emissions may be reduced by using pigments that have been wetted or mixed with resins. Since these pigments are wet, less or no dust is generated when the package is openedand as pigment is dumped into mixing vessels (Noyes, 1993).
������ ������� ����� �� ��� �������������
8.2-13���� ���� ��
#�����������������
Production of paints and inks that contain reduced or no VOCs will reduce VOC emissions from paint and ink manufacturing facilities. High-solids and water-based paints and inks contain less VOCs than traditional solvent-based paints and inks. Powder coatings and the majority of radiation-curable paints and inks contain no VOCs(EPA, 1992a).

������� ����� �� ��� ������������� ������
8.2-14 ���� ���� ��
This page is intentionally left blank.
8.3-1���� ���� ��
.
�������3����������(����������
.-+ ���������������������������
Several methods are available for calculating emissions from paint and ink manufacturingoperations. The best method to use depends upon the emission source being evaluated,available data, available resources, and the degree of accuracy required in the estimate. Although preferred methods are identified, this document does not mandate any emissionestimation method. Industry personnel using this manual should contact the appropriate stateor local air pollution control agency regarding suggested methods prior to their use.
This section discusses the methods available for calculating emissions from paint and inkmanufacturing operations and identifies the preferred method of calculation. A discussion ofthe sampling and analytical methods available for monitoring each pollutant is provided inChapter 1 of this volume, Introduction to Point Source Emission Inventory Development.
Estimation techniques for storage tank emissions are discussed in Chapter 1 of this volume. Equations and factors for calculating emissions from equipment leaks are discussed in Chapter4, and procedures for estimating emissions from wastewater are described in Chapter 5. Thus,this chapter will address only process operations, miscellaneous operations, and spills.
.-+-+ ������� �������
An emission factor can be defined as a pollutant emission rate relative to a level of sourceactivity. Emission factors are typically based on the results of source tests performed at anindividual plant or at one or more facilities within an industry. Chapter 1 of this volumecontains a detailed discussion of the reliability/quality of available emission factors.
Emission factors may be used to calculate total VOC and PM emissions from a paint and inkmanufacturing facility, as well as emissions from specific types of equipment typically foundat such a facility. These types of equipment include the following:
� Process equipment;
� Solvent reclamation systems;
� Parts washing equipment; and
� Process piping.
������� ����� �� ��� ������������� ������
8.3-2 ���� ���� ��
EPA-approved emission factors for these sources may be found in AP-42, the Locating andEstimating series of documents, the Factor Information and Retrieval (FIRE) System, and/orProtocol for Equipment Leak Emission Estimates (EPA, 1995g). Emission factors may alsobe available through trade associations such as the National Association of Printing InkManufacturers, Inc. (NAPIM).
.-+-" ������0�������� ������
Theoretical, more complex "models" or equations can be used for estimating emissions. Emission estimating models/equations are available for the following types of emissions foundat a paint or ink manufacturing facility:
� Material loading;
� Heat-up losses from dispersion/grinding activities;
� Surface evaporation during mixing/blending operations;
� Filling;
� Cleaning solvent loading;
� Material storage;
� Spills; and
� Wastewater treatment.
Inputs for theoretical models/equations generally fall into the following categories: chemical/physical properties of the material(s) involved (e.g., vapor pressure, vapor molecularweight), operating data (e.g., amount of material processed, operating hours) and physicalcharacteristics/properties of the source (e.g., tank color, tank diameter).
.-+-. �������� &����' (����� ����������
The material balance approach to emissions estimation considers the given facility as a sort of"black box," where one compares the total quantity of raw materials consumed versus amountsof materials leaving the facility as product or waste. Waste can consist of used filter bags orcartridges, spent solvent or still bottoms, dust collector material, pigment bags and/or drumresidue, and wastewater (NPCA, 1995).
.-+-/ ���� ����
Testing can be performed to quantify point source or fugitive emissions. In point sourcetesting, effluent gas samples are usually collected from a stack using probes inserted through aport in the stack wall. Pollutants in the gas sample are collected in or on various media that
������ ������� ����� �� ��� �������������
8.3-3���� ���� ��
are subsequently sent to a laboratory for analysis. Pollutant concentrations are obtained bydividing the amount of pollutant collected during the test by the volume of gas sampled. Emission rates are then determined by multiplying the pollutant concentration by thevolumetric stack gas flow rate. Because there are many steps in the stack sampling procedureswhere errors can occur, only experienced stack testers should perform such tests.
Industrial hygiene data (concentrations) can be used in conjunction with exhaust system flowrates to calculate fugitive emissions from a room, floor, or building. Direct-readinginstruments that may be used to obtain an instantaneous reading of vapor concentrationsinclude photoionization detectors, portable infrared spectrophotometers, and portable gaschromatographs (NPCA, 1995).
VOC losses from certain operations (e.g., filling of containers) may also be measured byperforming a study using a gravimetric analysis such as American Society for Testing andMaterials (ASTM) Standard D2369: Test Method for Volatile Content of Coatings.
Section 6 of this document, Quality Assurance/Quality Control, and Chapter 1 of Volume IIin this series provide information regarding test data quality.
.-" �� ����������������(����������������������
�������������
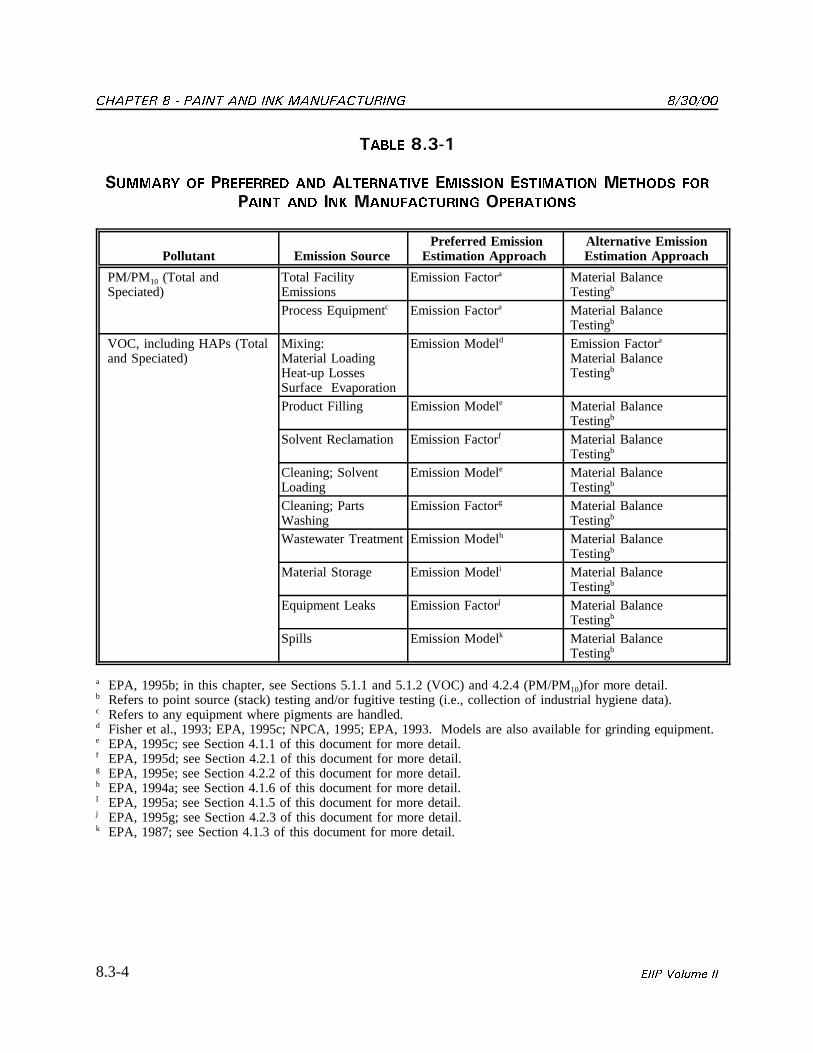
Table 8.3-1 identifies the preferred and alternative emission estimation approaches for selectedpollutants and sources of emissions. The best method to use depends upon the emissionsource being evaluated, available data, available resources, and the degree of accuracy requiredin the estimate. In general, a more accurate method will require greater resources than a lessaccurate method. Case studies 8.3-1 and 8.3-2 present examples of two facilities with varyinglevels of resources. The emission estimation methods selected for each are driven by availableresources and need for accuracy.
.-"-+ ������� �������
Use of paint manufacturing emission factors from Section 6.4 of AP-42 and ink manufacturingemission factors from Section 6.7 of AP-42 is generally accepted by regulatory agencies, andtheir use in calculating total facility or process-specific emissions is more cost-effective thancollection and analysis of air samples or use of emission models. Additionally, there arepotentially significant limitations with the material balance approach.
.-"-" ������� ������
Use of emission models/equations to estimate emissions from paint and ink manufacturingfacilities is a more complex and time-consuming process than the use of emission factors. Emission models/equations require more detailed inputs than use of emission factors; however,they provide an emission estimate based on site-specific conditions.
������� ����� �� ��� ������������� ������
8.3-4 ���� ���� ��
����� �-.0+
������ �� �������� �� ���������� ������� ��������� ������� ���
��� �� �� ����������� ���������
Pollutant Emission Source Preferred Emission
Estimation ApproachAlternative EmissionEstimation Approach
PM/PM10 (Total andSpeciated)
Total FacilityEmissions
Emission Factora Material BalanceTestingb
Process Equipmentc Emission Factora Material BalanceTestingb
VOC, including HAPs (Totaland Speciated)
Mixing:Material LoadingHeat-up LossesSurface Evaporation
Emission Modeld Emission Factora
Material BalanceTestingb
Product Filling Emission Modele Material BalanceTestingb
Solvent Reclamation Emission Factorf Material BalanceTestingb
Cleaning; SolventLoading
Emission Modele Material BalanceTestingb
Cleaning; PartsWashing
Emission Factorg Material BalanceTestingb
Wastewater Treatment Emission Modelh Material BalanceTestingb
Material Storage Emission Modeli Material BalanceTestingb
Equipment Leaks Emission Factorj Material BalanceTestingb
Spills Emission Modelk Material BalanceTestingb
a EPA, 1995b; in this chapter, see Sections 5.1.1 and 5.1.2 (VOC) and 4.2.4 (PM/PM10)for more detail.b Refers to point source (stack) testing and/or fugitive testing (i.e., collection of industrial hygiene data).c Refers to any equipment where pigments are handled.d Fisher et al., 1993; EPA, 1995c; NPCA, 1995; EPA, 1993. Models are also available for grinding equipment.e EPA, 1995c; see Section 4.1.1 of this document for more detail.f EPA, 1995d; see Section 4.2.1 of this document for more detail.g EPA, 1995e; see Section 4.2.2 of this document for more detail.h EPA, 1994a; see Section 4.1.6 of this document for more detail.I EPA, 1995a; see Section 4.1.5 of this document for more detail.j EPA, 1995g; see Section 4.2.3 of this document for more detail.k EPA, 1987; see Section 4.1.3 of this document for more detail.
������ ������� ����� �� ��� �������������
8.3-5���� ���� ��
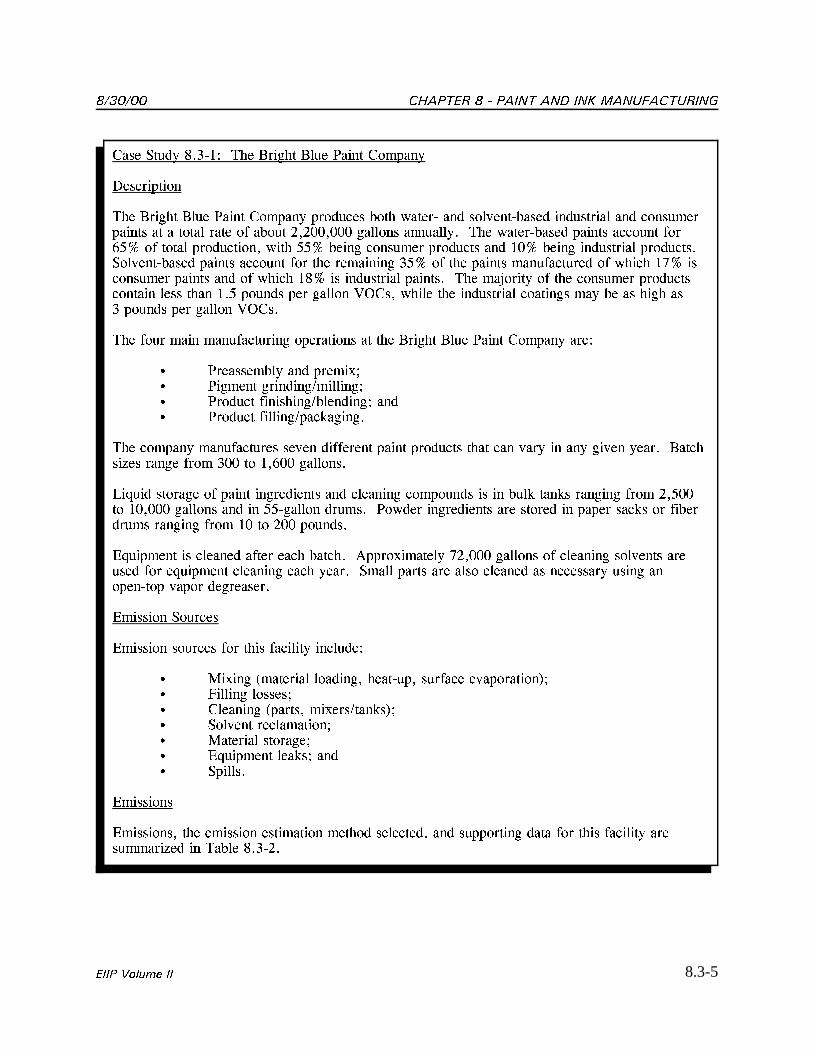
���� ��� �� ��� ��� ������ ���� ����� ������
�����������
��� ������ ���� ����� ������ ������� ���� ����� �� ���!�������� ��������� �� �������������� �� � ����� ���� �" ����� #$#%%$%%% ������� �������� ��� ��������� ������ ������� "��&'( �" ����� ���������$ ��� ''( ����� �������� ������� �� �%( ����� ��������� �����������!�������� ������ ������� "�� ��� ��������� '( �" ��� ������ ����"������ �" ���� �)( ���������� ������ �� �" ���� ��( �� ��������� ������� ��� ��*���� �" ��� �������� �������������� ���� ���� ��' ����� ��� ������ +,��$ ���� ��� ��������� �������� �� �� �� ���� �� ����� ��� ������ +,���
��� "��� ���� ����"�������� ���������� �� ��� ������ ���� ����� ������ ����
� ���������� �� �����-.� ������� �������/�������.� ������ "��������/�������. ��� ������ "������/���0������
��� ������ ����"������� ��!�� �""����� ����� ������� ���� ��� !�� �� �� ��!�� ���� �������1�� ����� "��� %% �� �$&%% ��������
2�3�� ������� �" ����� ���������� �� �������� �������� �� �� ���0 ���0� ������� "��� #$'%%�� �%$%%% ������� �� �� ''������� ����� �� �� ���������� ��� ����� �� ����� ���0� �� "�������� ������� "��� �% �� #%% ������
43������� �� ������ �"��� ���� ������ 5����-������ )#$%%% ������� �" �������� ���!���� ������ "�� �3������� �������� ���� ���� ����� ����� ��� ���� ������ �� �������� ����� ���������� !���� ���������
4������� �������
4������� ������� "�� ���� "������ �������
� 6�-��� 7�������� ������$ �������$ ���"��� �!���������8.� 9������ ������.� �������� 7�����$ ��-���/���0�8.� ���!��� �����������.� 6������� �������.� 43������� ���0�. ��� �������
4��������
4��������$ ��� �������� ���������� ����� �������$ �� ���������� ��� "�� ���� "������ ����������1� �� ����� �� �#�
�������������� ����������������
������
8.3-6����
������
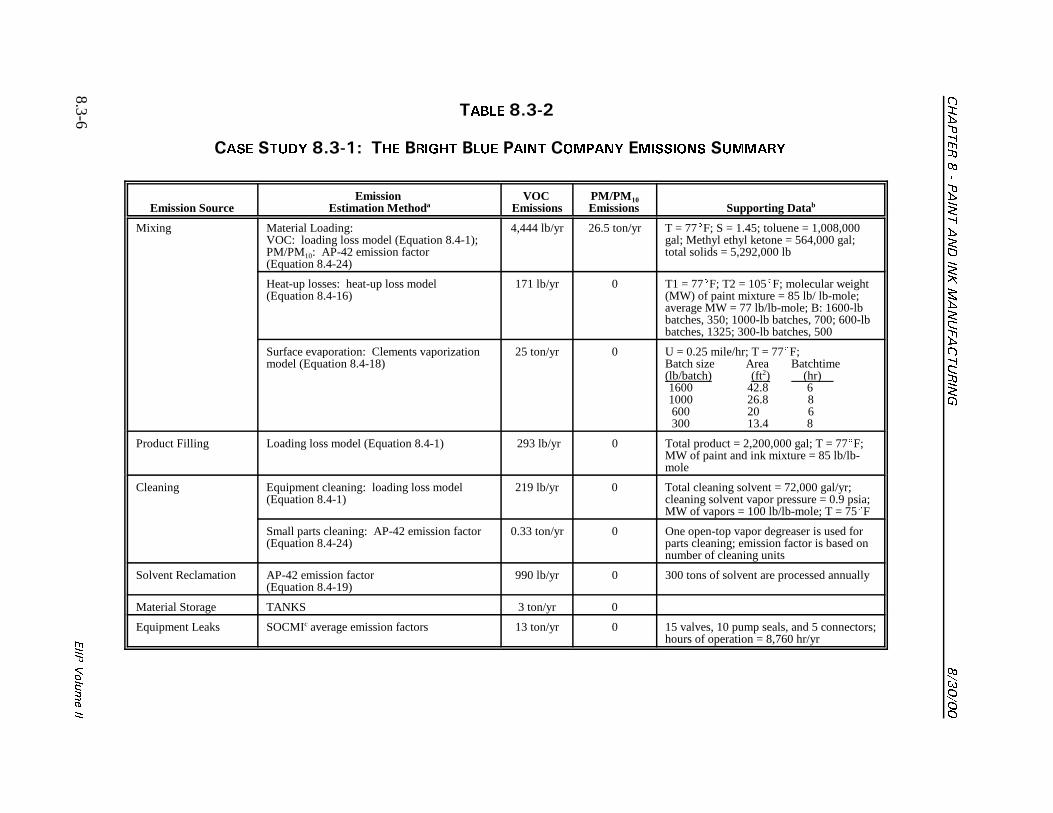
����� �-.0"
��� ����� �-.0+ ��� (����� (��� ��� ����� �������� ���������
Emission Source Emission
Estimation MethodaVOC
EmissionsPM/PM 10Emissions Supporting Datab
Mixing
Material Loading: VOC: loading loss model (Equation 8.4-1);PM/PM10: AP-42 emission factor (Equation 8.4-24)
4,444 lb/yr 26.5 ton/yr T = 77�F; S = 1.45; toluene = 1,008,000gal; Methyl ethyl ketone = 564,000 gal;total solids = 5,292,000 lb
Heat-up losses: heat-up loss model(Equation 8.4-16)
171 lb/yr 0 T1 = 77�F; T2 = 105�F; molecular weight(MW) of paint mixture = 85 lb/ lb-mole;average MW = 77 lb/lb-mole; B: 1600-lbbatches, 350; 1000-lb batches, 700; 600-lbbatches, 1325; 300-lb batches, 500
Surface evaporation: Clements vaporizationmodel (Equation 8.4-18)
25 ton/yr 0
U = 0.25 mile/hr; T = 77�F;Batch size Area Batchtime(lb/batch) (ft2) (hr) 1600 42.8 61000 26.8 8 600 20 6 300 13.4 8
Product Filling Loading loss model (Equation 8.4-1) 293 lb/yr 0 Total product = 2,200,000 gal; T = 77�F;MW of paint and ink mixture = 85 lb/lb-mole
Cleaning Equipment cleaning: loading loss model(Equation 8.4-1)
219 lb/yr 0 Total cleaning solvent = 72,000 gal/yr; cleaning solvent vapor pressure = 0.9 psia; MW of vapors = 100 lb/lb-mole; T = 75�F
Small parts cleaning: AP-42 emission factor(Equation 8.4-24)
0.33 ton/yr 0 One open-top vapor degreaser is used forparts cleaning; emission factor is based onnumber of cleaning units
Solvent Reclamation AP-42 emission factor (Equation 8.4-19)
990 lb/yr 0 300 tons of solvent are processed annually
Material Storage TANKS 3 ton/yr 0
Equipment Leaks SOCMIc average emission factors 13 ton/yr 0 15 valves, 10 pump seals, and 5 connectors;hours of operation = 8,760 hr/yr
������
�������������� ����������������
8.3-7����
������
����� �-.0"
��� ����� �-.0+ ��� (����� (��� ��� ����� ������� ������� &������'
Emission Source Emission
Estimation MethodaVOC
EmissionsPM/PM 10Emissions Supporting Datab
Spills Clements vaporization model (Equation 8.4-15)
7 lb/yr 0 One spill of heptane; vapor pressure = 0.9 psia; MW = 100 lb/lb-mole; T = 75�F; area of spill =15 ft2; cleanup time = 1 hour; U = 5 mile/hr
Total 36.4 ton/yr 26.5 ton/yr
a Equation numbers refer to those used in Section 4 of this chapter.b Symbols used are defined in Table 8.4-1.c SOCMI = Synthetic organic chemical manufacturing industry.
������� ����� �� ��� ������������� ������
8.3-8 ���� ���� ��
���� ��� �� �#� ��� :�� ���0 ����� ������
�����������
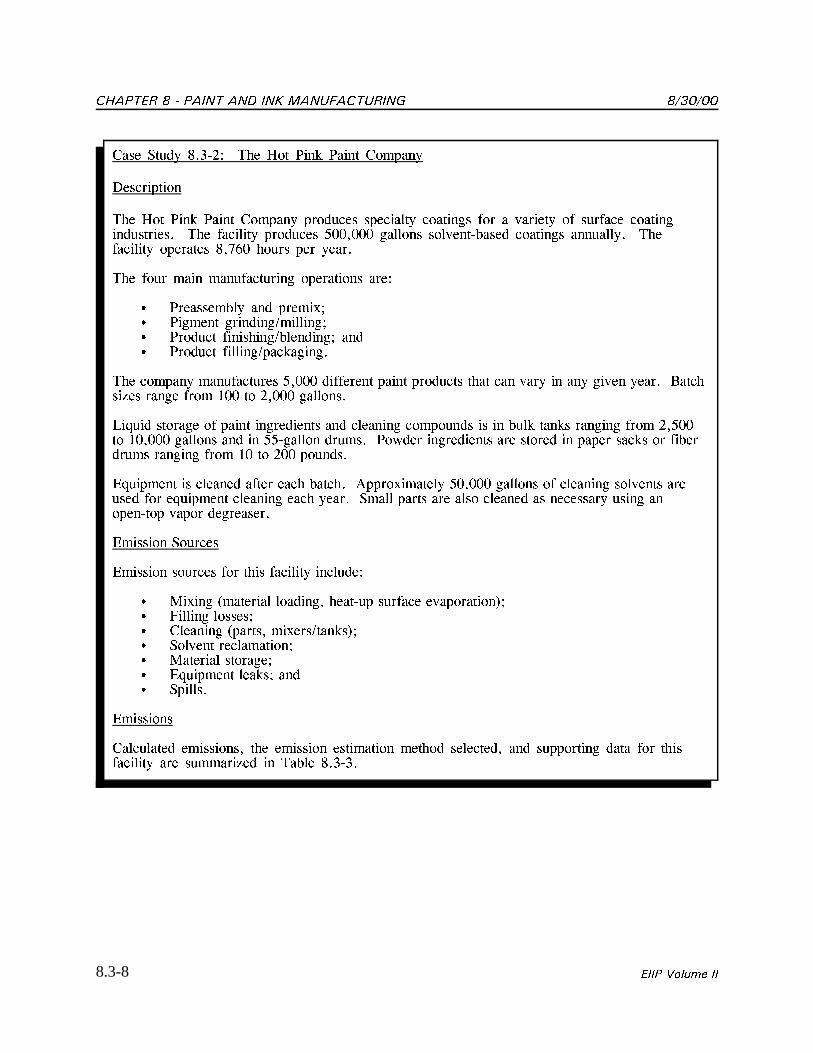
��� :�� ���0 ����� ������ ������� �������� �������� "�� � !����� �" ���"��� ����������������� ��� "������ ������� '%%$%%% ������� ���!�������� �������� �������� ���"������ �������� �$)&% ����� ��� ����
��� "��� ���� ����"�������� ���������� ����
� ���������� �� �����-.� ������� �������/�������.� ������ "��������/�������. ��� ������ "������/���0������
��� ������ ����"������� '$%%% �""����� ����� ������� ���� ��� !�� �� �� ��!�� ���� �������1�� ����� "��� �%% �� #$%%% ��������
2�3�� ������� �" ����� ���������� �� �������� �������� �� �� ���0 ���0� ������� "��� #$'%%�� �%$%%% ������� �� �� ''������� ����� �� �� ���������� ��� ����� �� ����� ���0� �� "�������� ������� "��� �% �� #%% ������
43������� �� ������ �"��� ���� ������ 5����-������ '%$%%% ������� �" �������� ���!���� ������ "�� �3������� �������� ���� ���� ����� ����� ��� ���� ������ �� �������� ����� ���������� !���� ���������
4������� �������
4������� ������� "�� ���� "������ �������
� 6�-��� 7�������� ������$ ������� ���"��� �!���������8.� 9������ ������.� �������� 7�����$ ��-���/���0�8.� ���!��� �����������.� 6������� �������.� 43������� ���0�. ��� �������
4��������
��������� ���������$ ��� �������� ���������� ����� �������$ �� ���������� ��� "�� ����"������ ��� �������1� �� ����� �� � �
������
�������������� ����������������
8.3-9����
������
����� �-.0.
��� ����� �-.0" ��� ��� � ��� ����� �������� �������
Emission SourceEmission Estimation
MethodaVOC
EmissionsPM/PM 10Emissions Supporting Datab
Mixing VOC: EPA restated emission factor(Equation 8.5-3);PM/PM10: AP-42 emission factor(Equation 8.4-24)
5.6 ton/yr 6.6 ton/yr 500,000 gal produced; solvent used =750,000 lb/yr; total solids = 1,323,000lb
Product Filling Loading loss model (Equation 8.4-1)
34 lb/yr 0 500,000 gal produced; molecular weight(MW) = 75 lb/lb-mole; vapor pressure =0.34 psia; T = 77�F; S = 1.45
Cleaning Equipment cleaning: loading lossmodel (Equation 8.4-1)
151 lb/yr 0 Total cleaning solvent = 50,000 gal/yr;cleaning solvent vapor pressure = 0.9psia; MW of vapors = 100 lb/lb-mole;T=77�F
Small parts cleaning: AP-42emission factor (Equation 8.4-24)
0.33 ton/yr 0 One open-top vapor degreaser is usedfor parts cleaning; emission factorsbased on number of cleaning units
Solvent Reclamation AP-42 emission factor (Equation 8.4-19)
396 lb/yr 0 120 tons of solvent are processedannually
Material Storage TANKS 1 ton/yr 0
Equipment Leaks SOCMIc average emission factors 6 ton/yr 0 5 valves, 5 pump seals, and 2connectors;hours of operation = 8,760 hr/yr
Spills Material balance (Equation 8.5-6) 400 lb/yr 0 50 gal lost; density of spilled material =8 lb/gal; assume worst case: all spilledmaterial evaporates
Total 11.4 ton/yr 6.6 ton/yr
a Equation numbers refer to those used in Section 4 of this chapter.b Symbols used are defined in Table 8.4-1.c SOCMI = Synthetic organic chemical manufacturing industry.
������� ����� �� ��� ������������� ������
8.3-10 ���� ���� ��
.-"-. �������� (����� ����������
Calculating emissions from a paint or ink manufacturing facility using material balanceappears to represent a straightforward approach to emissions estimations. However, fewfacilities track material usage and waste generation with the overall accuracy needed forapplication of this method, and inaccuracies associated with individual material tracking orother activities inherent to each material handling step often accumulate into large deviations. Because emissions from specific materials are typically below 1.5 percent of grossconsumption, an error of only ± 5.0 percent in any one step of the operation can significantlyskew emissions calculations. Potential sources of error in the material balance calculationmethod include the following:
� The delivery of bulk raw materials at a paint or ink manufacturing facility isoften tracked by volume, not by weight. Since density will vary withtemperatures, the actual mass per unit volume of materials delivered in thesummer may be less than that received in the winter.
� Raw materials received by paint or ink manufacturing facilities may potentially beused in hundreds or thousands of finished products. In order to complete thematerial balance, it is crucial that the exact quantity and speciation of eachmaterial shipped off-site in the product be known. For many facilities, it isextremely difficult, or currently impossible, to accurately track the distribution ofspecific raw materials across their entire product line.
� The amount of raw material contained in waste must also be considered. Thismay involve precise analysis of the concentration of the material of interest ineach waste stream.
� Batch production of paint or ink often requires the manual addition of rawmaterials. Sometimes these additions are not accurately measured or recorded(NPCA, 1995).
.-"-/ ���� ����
Use of stack and/or industrial hygiene test data is likely to be the most accurate method ofquantifying air emissions from paint and ink manufacturing operations. However, collection andanalysis of air samples from manufacturing facilities can be very expensive and especiallycomplicated for paint and ink manufacturing facilities where a variety of VOCs are emitted andwhere most of the emissions may be fugitive in nature. Test data from one specific process maynot be representative of the entire manufacturing operation and may provide only one example (asnapshot) of the facility's emissions.
To be representative, test data would need to be collected over a period of time that coversproduction of multiple paint and ink formulations. It may be necessary to sample multipleproduction areas. In addition, these methods do not address fugitive emissions that occur outsideof a building. If testing is performed, care should be taken to ensure that a representative
������ ������� ����� �� ��� �������������
8.3-11���� ���� ��
operational cycle has been selected. If possible, full cycles should be monitored as opposed toportions of cycles.

������� ����� �� ��� ������������� ������
8.3-12 ���� ���� ��
This page is intentionally left blank.
8.4-1���� ���� ��
/
���������������������
��������������������
The preferred methods for estimating VOC, including HAPs and PM emissions from paint andink manufacturing operations are presented in this section. This section describes thesemethodologies and provides examples to illustrate the use of each calculation technique. Although the methods identified in this section are the preferred methods and the methods inSection 5 are alternative methods, the inventory preparer should determine which method is themost appropriate for each situation. For certain source types (e.g., material storage or storagetank emissions), the reader is referred to other chapters in Volume II for details on using thesuggested methodology.
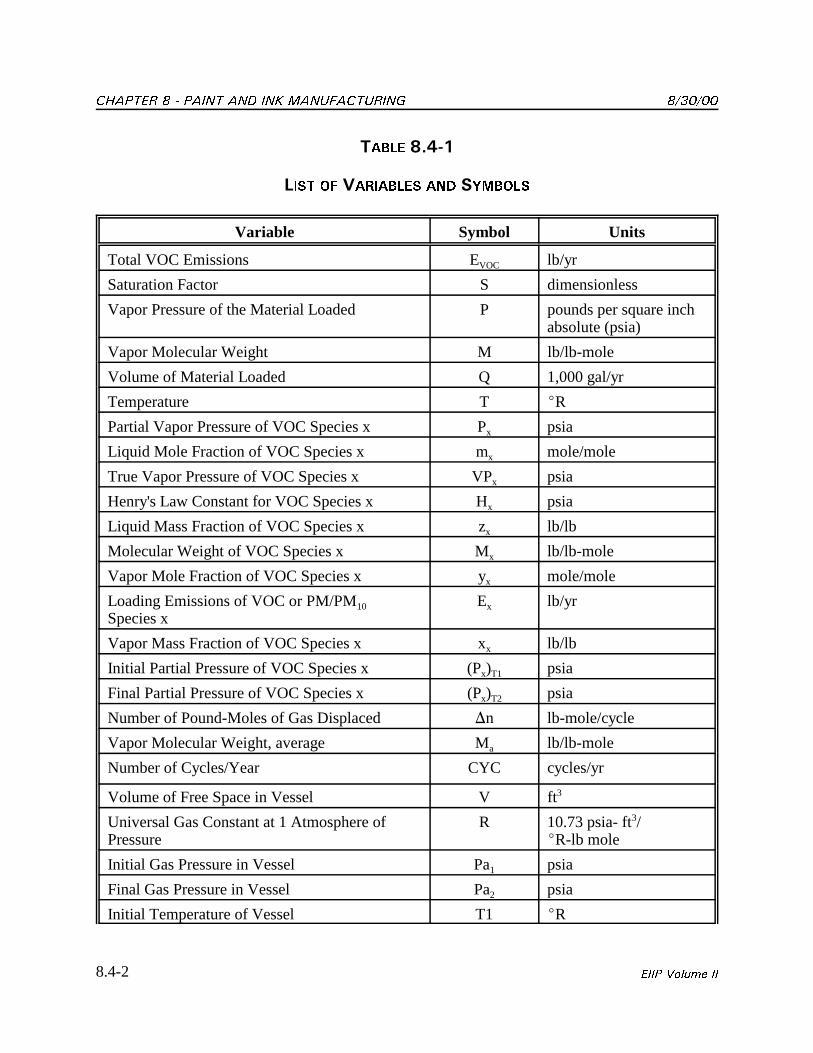
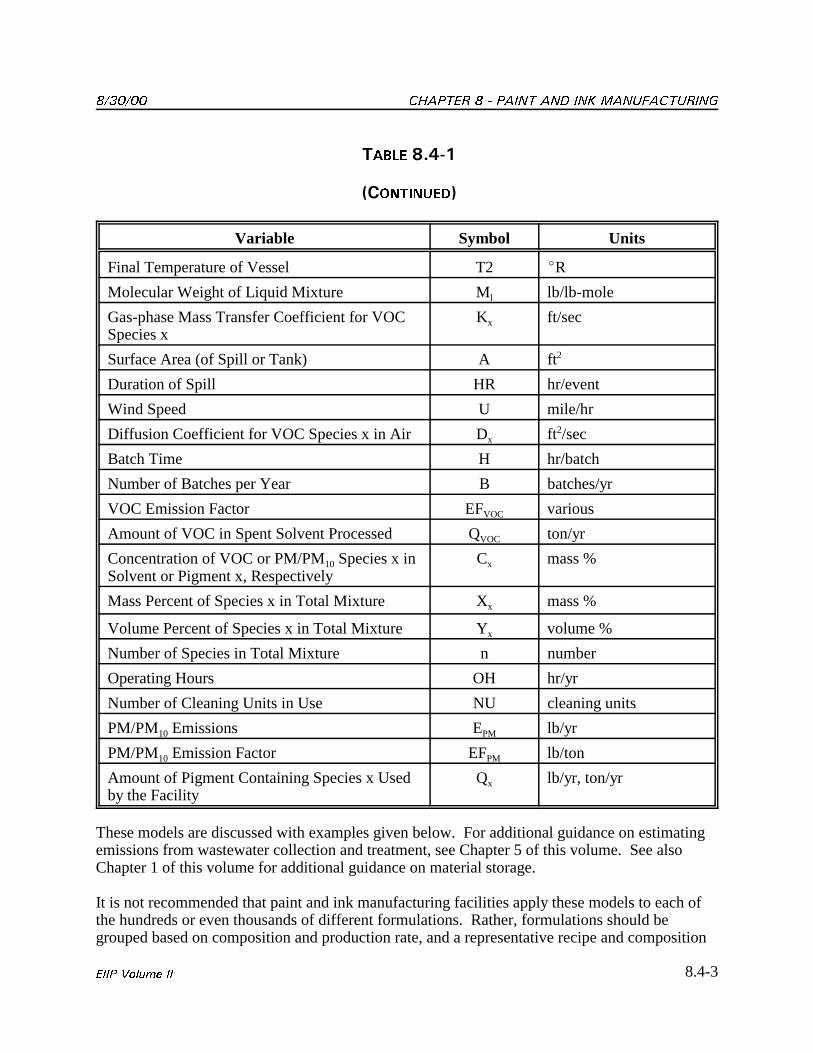
Table 8.4-1 lists the variables used in Equations 8.4-1 through 8.4-27.
/-+ �������������������������������0� �������������
������2�4�������
Use of source-specific emission models/equations is the preferred technique for estimating VOCemissions from:
� Mixing operations (material loading, heat-up losses, and surface evaporation);
� Product filling;
� Vessel cleaning operations;
� Wastewater treatment processes;
� Material storage; and
� Spills.
������� ����� �� ��� ������������� ������
8.4-2 ���� ���� ��
����� �-/0+
���� �� ��������� �� ������
Variable Symbol Units
Total VOC Emissions EVOC lb/yr
Saturation Factor S dimensionless
Vapor Pressure of the Material Loaded P pounds per square inchabsolute (psia)
Vapor Molecular Weight M lb/lb-mole
Volume of Material Loaded Q 1,000 gal/yr
Temperature T �R
Partial Vapor Pressure of VOC Species x Px psia
Liquid Mole Fraction of VOC Species x mx mole/mole
True Vapor Pressure of VOC Species x VPx psia
Henry's Law Constant for VOC Species x Hx psia
Liquid Mass Fraction of VOC Species x zx lb/lb
Molecular Weight of VOC Species x Mx lb/lb-mole
Vapor Mole Fraction of VOC Species x yx mole/mole
Loading Emissions of VOC or PM/PM10
Species xEx lb/yr
Vapor Mass Fraction of VOC Species x xx lb/lb
Initial Partial Pressure of VOC Species x (Px)T1 psia
Final Partial Pressure of VOC Species x (Px)T2 psia
Number of Pound-Moles of Gas Displaced �n lb-mole/cycle
Vapor Molecular Weight, average Ma lb/lb-mole
Number of Cycles/Year CYC cycles/yr
Volume of Free Space in Vessel V ft3
Universal Gas Constant at 1 Atmosphere ofPressure
R 10.73 psia- ft3/�R-lb mole
Initial Gas Pressure in Vessel Pa1 psia
Final Gas Pressure in Vessel Pa2 psia
Initial Temperature of Vessel T1 �R
������ ������� ����� �� ��� �������������
8.4-3���� ���� ��
����� �-/0+
&������'
Variable Symbol Units
Final Temperature of Vessel T2 �R
Molecular Weight of Liquid Mixture Ml lb/lb-mole
Gas-phase Mass Transfer Coefficient for VOCSpecies x
Kx ft/sec
Surface Area (of Spill or Tank) A ft2
Duration of Spill HR hr/event
Wind Speed U mile/hr
Diffusion Coefficient for VOC Species x in Air Dx ft2/sec
Batch Time H hr/batch
Number of Batches per Year B batches/yr
VOC Emission Factor EFVOC various
Amount of VOC in Spent Solvent Processed QVOC ton/yr
Concentration of VOC or PM/PM10 Species x inSolvent or Pigment x, Respectively
Cx mass %
Mass Percent of Species x in Total Mixture Xx mass %
Volume Percent of Species x in Total Mixture Yx volume %
Number of Species in Total Mixture n number
Operating Hours OH hr/yr
Number of Cleaning Units in Use NU cleaning units
PM/PM10 Emissions EPM lb/yr
PM/PM10 Emission Factor EFPM lb/ton
Amount of Pigment Containing Species x Usedby the Facility
Qx lb/yr, ton/yr
These models are discussed with examples given below. For additional guidance on estimatingemissions from wastewater collection and treatment, see Chapter 5 of this volume. See alsoChapter 1 of this volume for additional guidance on material storage.
It is not recommended that paint and ink manufacturing facilities apply these models to each ofthe hundreds or even thousands of different formulations. Rather, formulations should begrouped based on composition and production rate, and a representative recipe and composition
������� ����� �� ��� ������������� ������
8.4-4 ���� ���� ��
EVOC � 12.46 �
S � P � M � Q
T(8.4-1)
P � �Px (8.4-2)
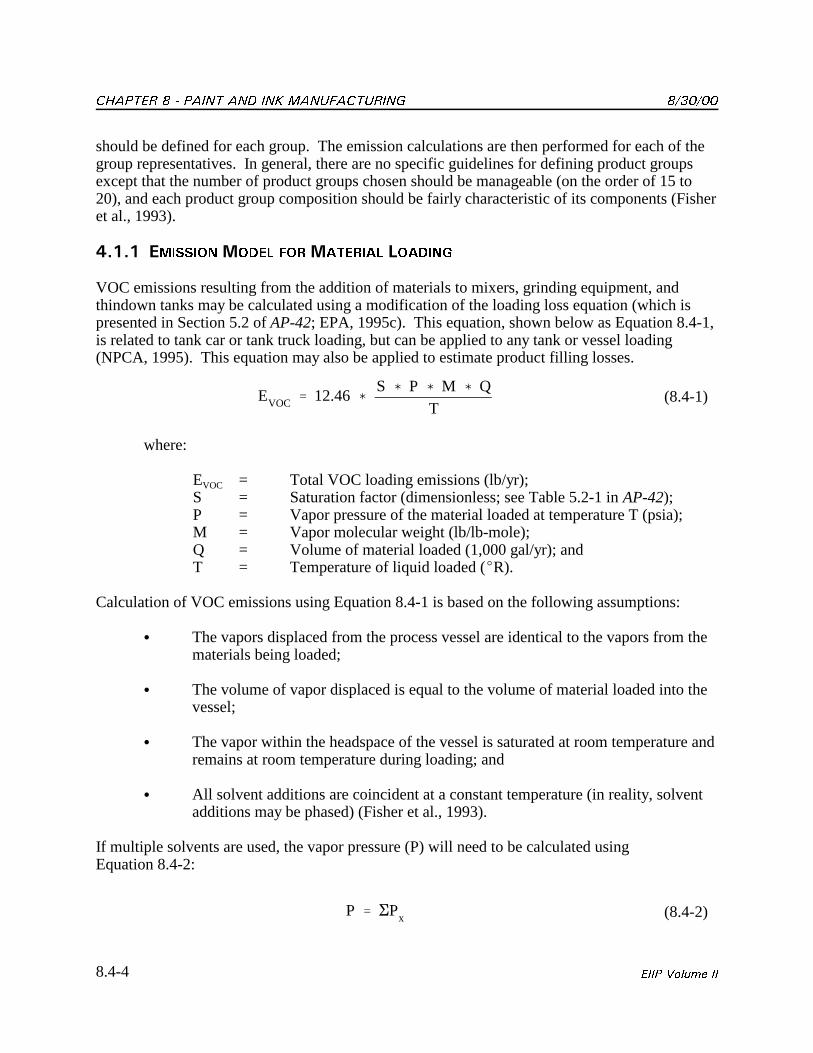
should be defined for each group. The emission calculations are then performed for each of thegroup representatives. In general, there are no specific guidelines for defining product groupsexcept that the number of product groups chosen should be manageable (on the order of 15 to20), and each product group composition should be fairly characteristic of its components (Fisheret al., 1993).
/-+-+ ������������ ����������� ������
VOC emissions resulting from the addition of materials to mixers, grinding equipment, andthindown tanks may be calculated using a modification of the loading loss equation (which ispresented in Section 5.2 of AP-42; EPA, 1995c). This equation, shown below as Equation 8.4-1,is related to tank car or tank truck loading, but can be applied to any tank or vessel loading(NPCA, 1995). This equation may also be applied to estimate product filling losses.
where:
EVOC = Total VOC loading emissions (lb/yr);S = Saturation factor (dimensionless; see Table 5.2-1 in AP-42);P = Vapor pressure of the material loaded at temperature T (psia);M = Vapor molecular weight (lb/lb-mole);Q = Volume of material loaded (1,000 gal/yr); andT = Temperature of liquid loaded (�R).
Calculation of VOC emissions using Equation 8.4-1 is based on the following assumptions:
� The vapors displaced from the process vessel are identical to the vapors from thematerials being loaded;
� The volume of vapor displaced is equal to the volume of material loaded into thevessel;
� The vapor within the headspace of the vessel is saturated at room temperature andremains at room temperature during loading; and
� All solvent additions are coincident at a constant temperature (in reality, solventadditions may be phased) (Fisher et al., 1993).
If multiple solvents are used, the vapor pressure (P) will need to be calculated usingEquation 8.4-2:
������ ������� ����� �� ��� �������������
8.4-5���� ���� ��
Px � m
x � VPx (8.4-3)
Px � m
x � Hx (8.4-4)
mx �
zx/M
x
�(zx/M
x)
(8.4-5)
where:
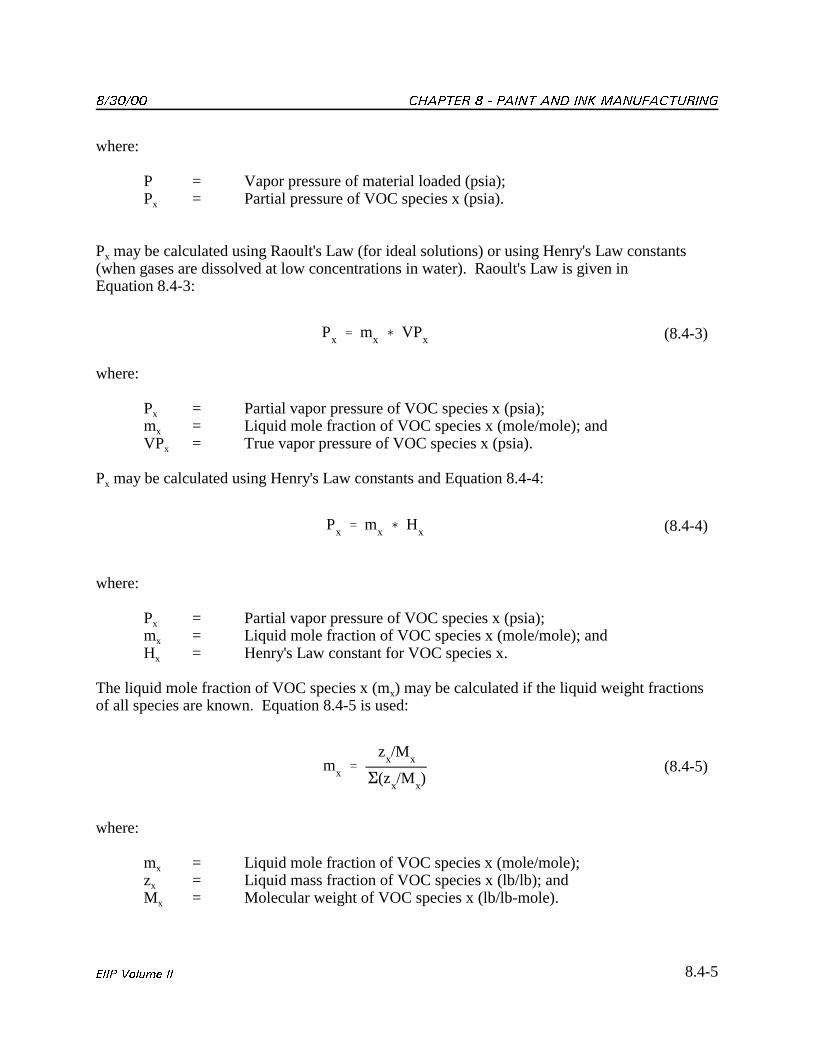
P = Vapor pressure of material loaded (psia);Px = Partial pressure of VOC species x (psia).
Px may be calculated using Raoult's Law (for ideal solutions) or using Henry's Law constants(when gases are dissolved at low concentrations in water). Raoult's Law is given inEquation 8.4-3:
where:
Px = Partial vapor pressure of VOC species x (psia);mx = Liquid mole fraction of VOC species x (mole/mole); andVPx = True vapor pressure of VOC species x (psia).
Px may be calculated using Henry's Law constants and Equation 8.4-4:
where:
Px = Partial vapor pressure of VOC species x (psia);mx = Liquid mole fraction of VOC species x (mole/mole); andHx = Henry's Law constant for VOC species x.
The liquid mole fraction of VOC species x (mx) may be calculated if the liquid weight fractionsof all species are known. Equation 8.4-5 is used:
where:
mx = Liquid mole fraction of VOC species x (mole/mole);zx = Liquid mass fraction of VOC species x (lb/lb); andMx = Molecular weight of VOC species x (lb/lb-mole).
������� ����� �� ��� ������������� ������
8.4-6 ���� ���� ��
M � �(yx � M
x) (8.4-6)
yx �
Px
P(8.4-7)
Ex � E
VOC � xx (8.4-8)
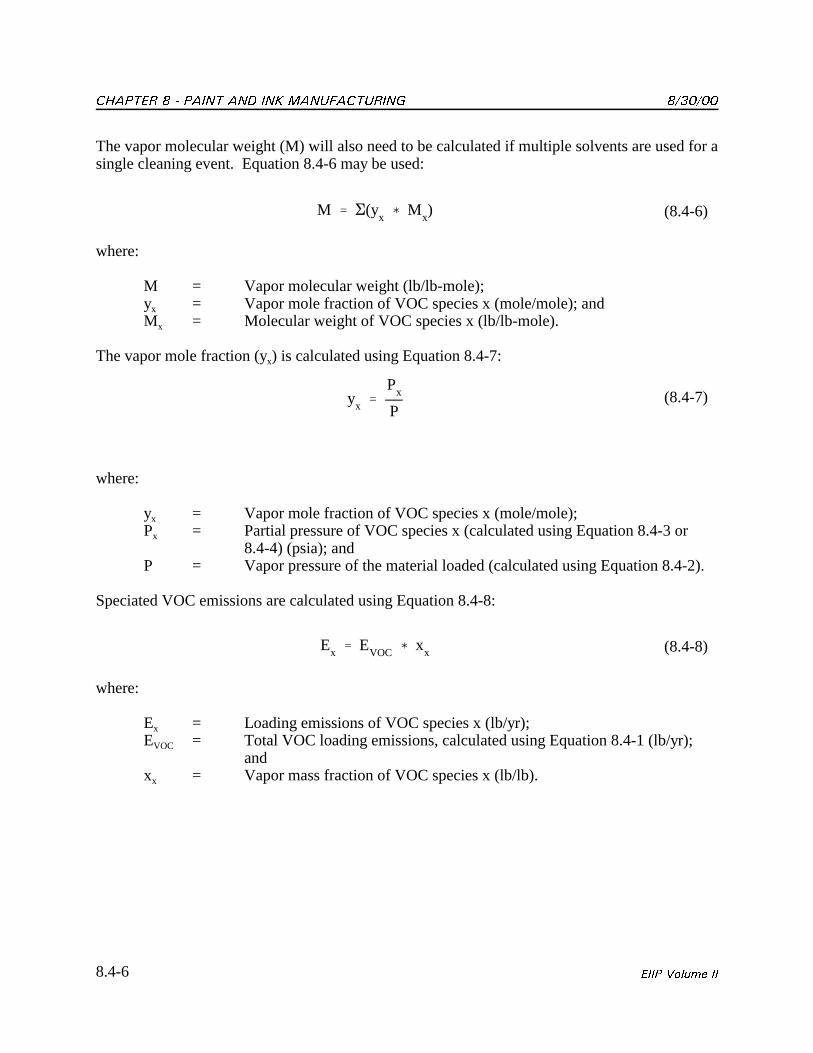
The vapor molecular weight (M) will also need to be calculated if multiple solvents are used for asingle cleaning event. Equation 8.4-6 may be used:
where:
M = Vapor molecular weight (lb/lb-mole);yx = Vapor mole fraction of VOC species x (mole/mole); andMx = Molecular weight of VOC species x (lb/lb-mole).
The vapor mole fraction (yx) is calculated using Equation 8.4-7:
where:
yx = Vapor mole fraction of VOC species x (mole/mole); Px = Partial pressure of VOC species x (calculated using Equation 8.4-3 or
8.4-4) (psia); andP = Vapor pressure of the material loaded (calculated using Equation 8.4-2).
Speciated VOC emissions are calculated using Equation 8.4-8:
where:
Ex = Loading emissions of VOC species x (lb/yr);EVOC = Total VOC loading emissions, calculated using Equation 8.4-1 (lb/yr);
andxx = Vapor mass fraction of VOC species x (lb/lb).
������ ������� ����� �� ��� �������������
8.4-7���� ���� ��
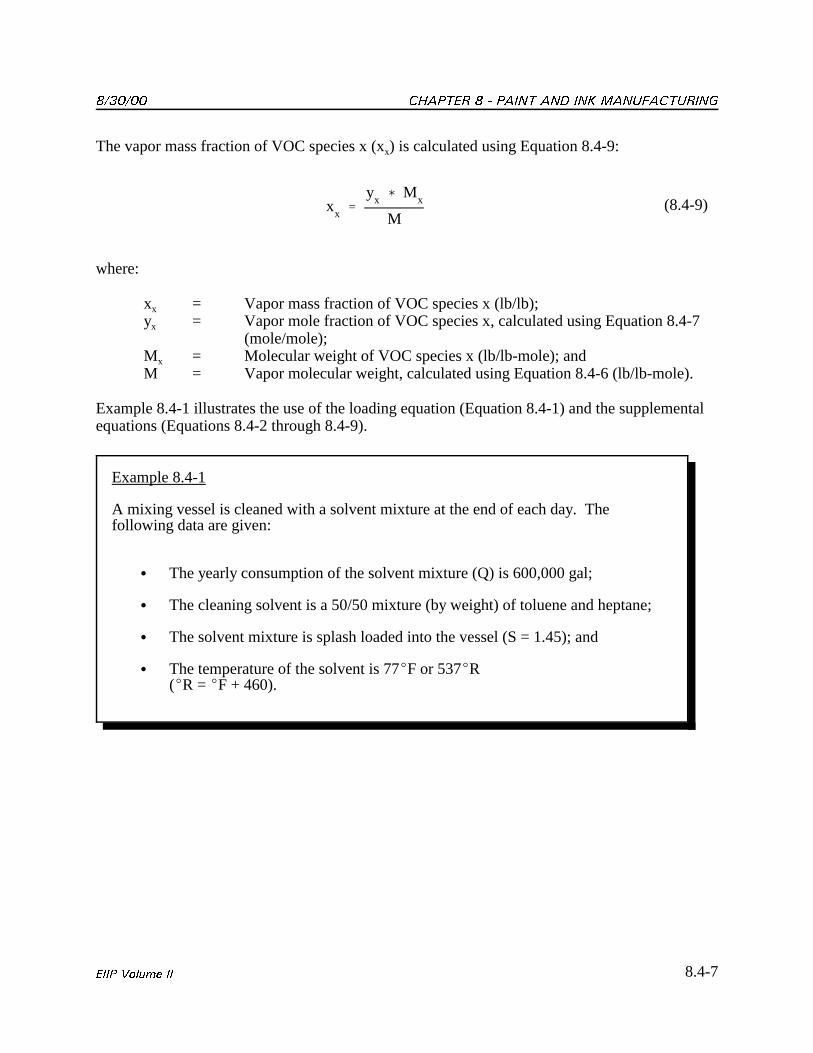
xx �
yx � M
x
M(8.4-9)
Example 8.4-1
A mixing vessel is cleaned with a solvent mixture at the end of each day. Thefollowing data are given:
� The yearly consumption of the solvent mixture (Q) is 600,000 gal;
� The cleaning solvent is a 50/50 mixture (by weight) of toluene and heptane;
� The solvent mixture is splash loaded into the vessel (S = 1.45); and
� The temperature of the solvent is 77�F or 537�R (�R = �F + 460).
The vapor mass fraction of VOC species x (xx) is calculated using Equation 8.4-9:
where:
xx = Vapor mass fraction of VOC species x (lb/lb);yx = Vapor mole fraction of VOC species x, calculated using Equation 8.4-7
(mole/mole);Mx = Molecular weight of VOC species x (lb/lb-mole); andM = Vapor molecular weight, calculated using Equation 8.4-6 (lb/lb-mole).
Example 8.4-1 illustrates the use of the loading equation (Equation 8.4-1) and the supplementalequations (Equations 8.4-2 through 8.4-9).
������� ����� �� ��� ������������� ������
8.4-8 ���� ���� ��
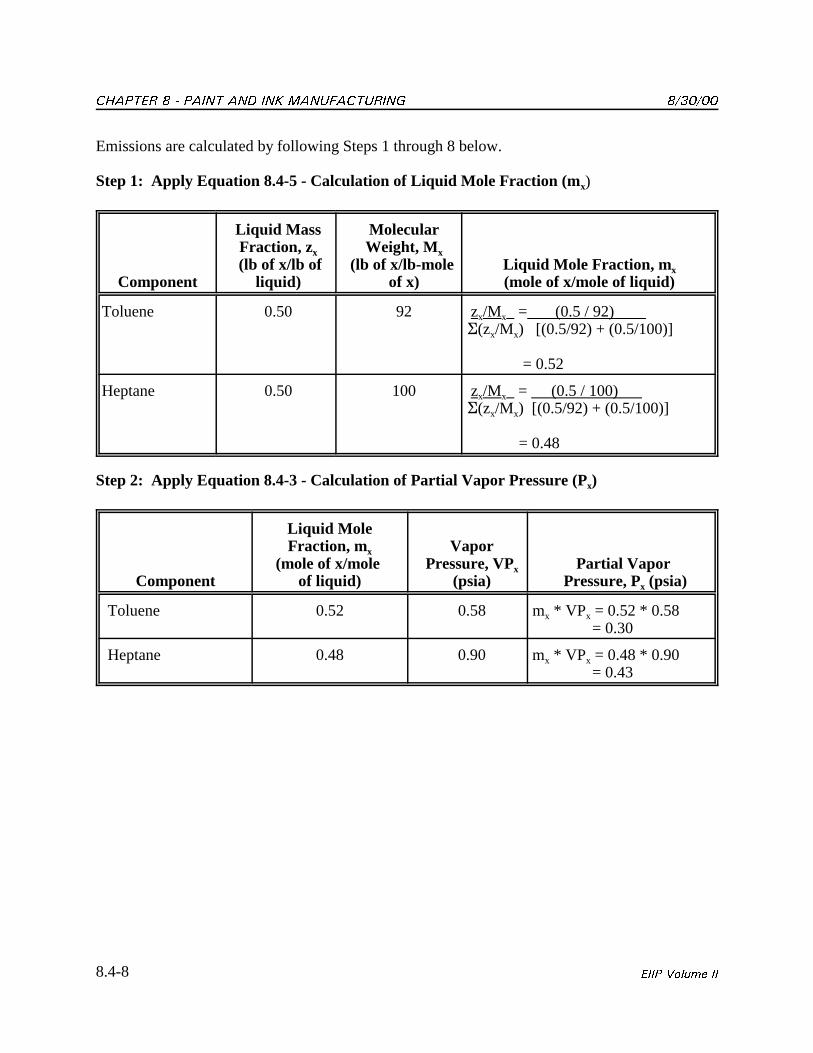
Emissions are calculated by following Steps 1 through 8 below.
Step 1: Apply Equation 8.4-5 - Calculation of Liquid Mole Fraction (mx)
Component
Liquid MassFraction, zx
(lb of x/lb ofliquid)
MolecularWeight, Mx
(lb of x/lb-mole of x)
Liquid Mole Fraction, m x
(mole of x/mole of liquid)
Toluene 0.50 92 zx/Mx = (0.5 / 92) �(zx/Mx) [(0.5/92) + (0.5/100)]
= 0.52
Heptane 0.50 100 zx/Mx = (0.5 / 100) �(zx/Mx) [(0.5/92) + (0.5/100)]
= 0.48
Step 2: Apply Equation 8.4-3 - Calculation of Partial Vapor Pressure (Px)
Component
Liquid MoleFraction, mx
(mole of x/mole of liquid)
VaporPressure, VPx
(psia)Partial Vapor
Pressure, Px (psia)
Toluene 0.52 0.58 mx * VPx = 0.52 * 0.58 = 0.30
Heptane 0.48 0.90 mx * VPx = 0.48 * 0.90 = 0.43
������ ������� ����� �� ��� �������������
8.4-9���� ���� ��
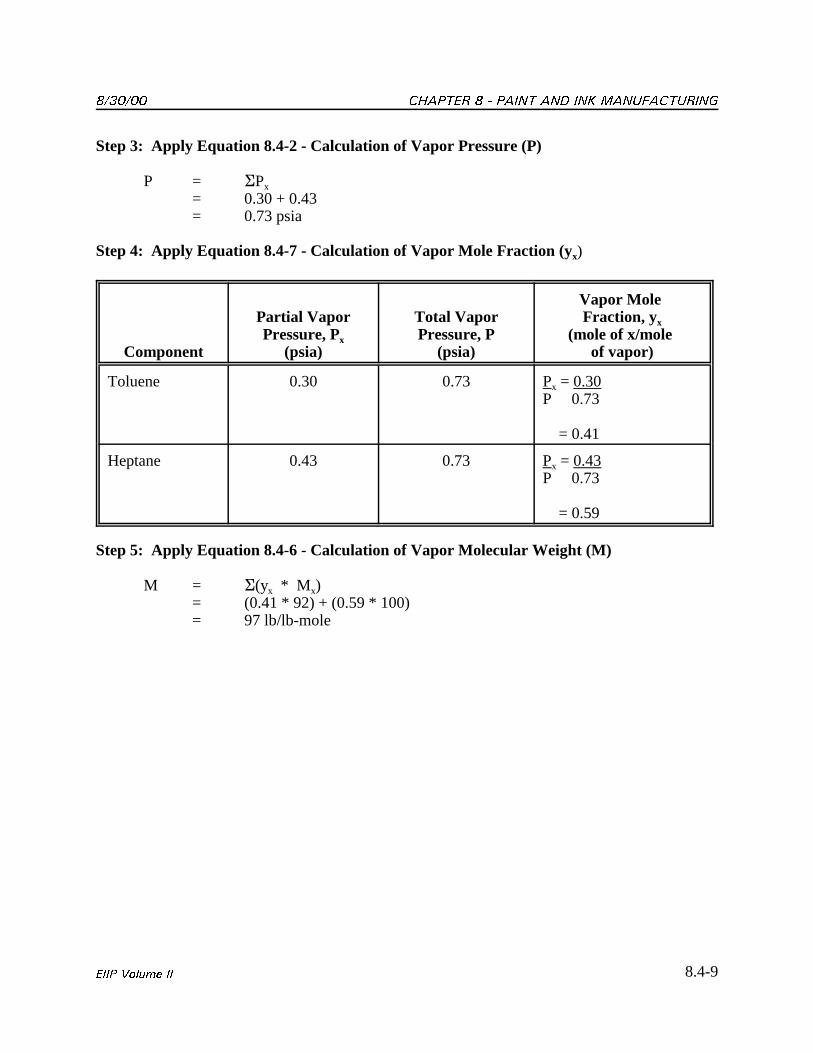
Step 3: Apply Equation 8.4-2 - Calculation of Vapor Pressure (P)
P = �Px
= 0.30 + 0.43= 0.73 psia
Step 4: Apply Equation 8.4-7 - Calculation of Vapor Mole Fraction (yx)
Component
Partial VaporPressure, Px
(psia)
Total VaporPressure, P
(psia)
Vapor Mole Fraction, yx
(mole of x/mole of vapor)
Toluene 0.30 0.73 Px = 0.30P 0.73
= 0.41
Heptane 0.43 0.73 Px = 0.43P 0.73
= 0.59
Step 5: Apply Equation 8.4-6 - Calculation of Vapor Molecular Weight (M)
M = �(yx * Mx)= (0.41 * 92) + (0.59 * 100)= 97 lb/lb-mole
������� ����� �� ��� ������������� ������
8.4-10 ���� ���� ��
EVOC = 12.46�
S � P � M � Q
T
= 12.46�
1.45 � 0.73 � 97 � 600537
= 1,429 lb VOCs/yr
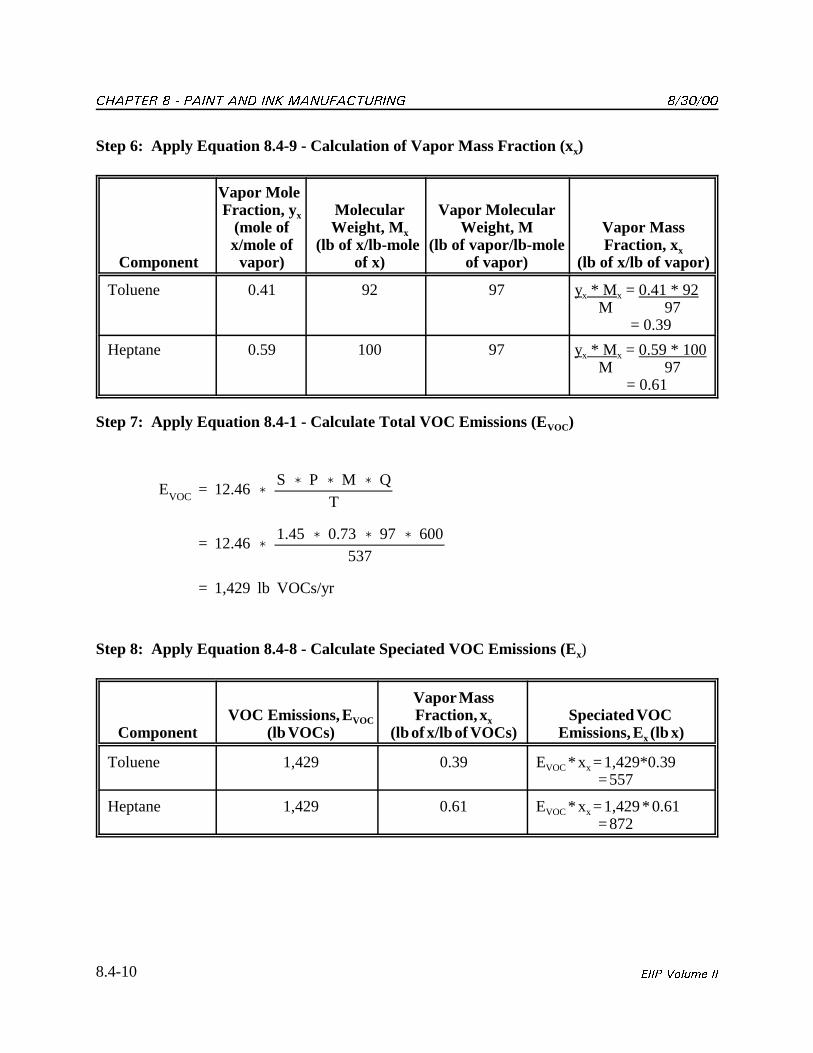
Step 6: Apply Equation 8.4-9 - Calculation of Vapor Mass Fraction (xx)
Component
Vapor MoleFraction, yx
(mole ofx/mole ofvapor)
MolecularWeight, Mx
(lb of x/lb-mole of x)
Vapor MolecularWeight, M
(lb of vapor/lb-moleof vapor)
Vapor MassFraction, xx
(lb of x/lb of vapor)
Toluene 0.41 92 97 yx * M x = 0.41 * 92 M 97 = 0.39
Heptane 0.59 100 97 yx * M x = 0.59 * 100 M 97 = 0.61
Step 7: Apply Equation 8.4-1 - Calculate Total VOC Emissions (EVOC)
Step 8: Apply Equation 8.4-8 - Calculate Speciated VOC Emissions (Ex)
ComponentVOC Emissions, EVOC
(lb VOCs)
Vapor MassFraction, xx
(lb of x/lb of VOCs)Speciated VOC
Emissions, Ex (lb x)
Toluene 1,429 0.39 EVOC * xx = 1,429*0.39 = 557
Heptane 1,429 0.61 EVOC * xx = 1,429 * 0.61 = 872
������ ������� ����� �� ��� �������������
8.4-11���� ���� ��
EVOC �
� (Px)T1
14.7� � (Px)T1
�
� (Px)T2
14.7� � (Px)T2
2� � n� M
a�CYC
(8.4-10)
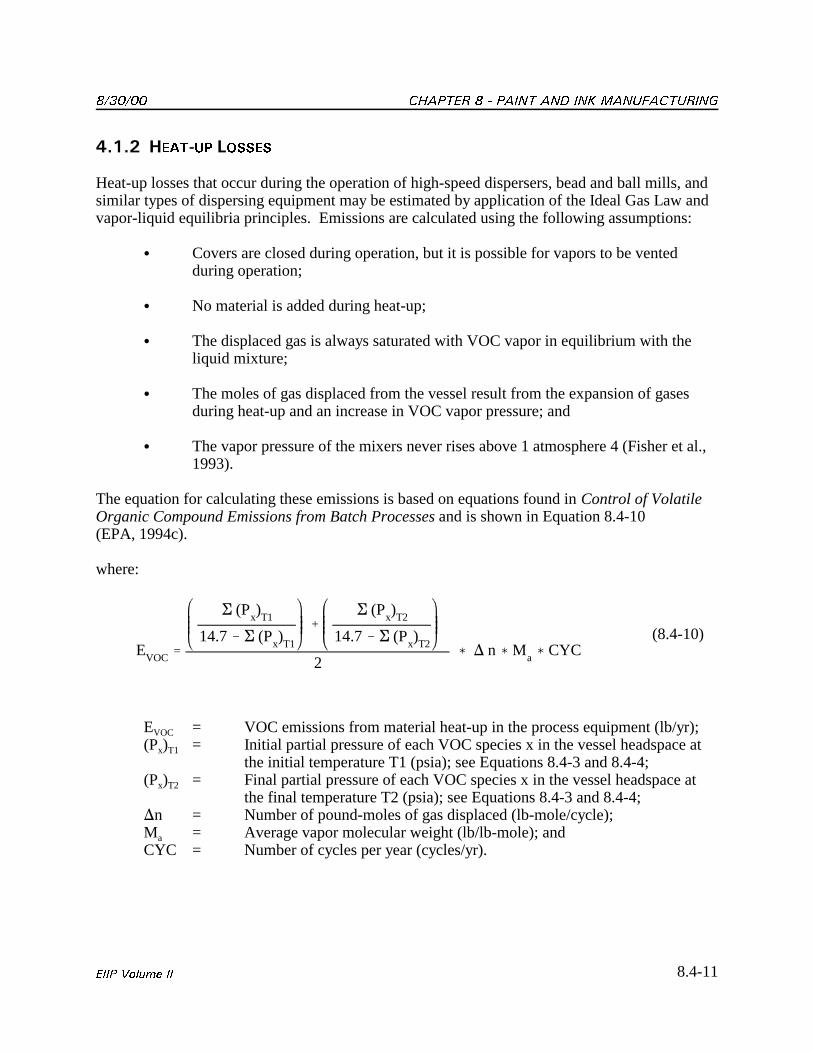
/-+-" ����0�� ������
Heat-up losses that occur during the operation of high-speed dispersers, bead and ball mills, andsimilar types of dispersing equipment may be estimated by application of the Ideal Gas Law andvapor-liquid equilibria principles. Emissions are calculated using the following assumptions:
� Covers are closed during operation, but it is possible for vapors to be ventedduring operation;
� No material is added during heat-up;
� The displaced gas is always saturated with VOC vapor in equilibrium with theliquid mixture;
� The moles of gas displaced from the vessel result from the expansion of gasesduring heat-up and an increase in VOC vapor pressure; and
� The vapor pressure of the mixers never rises above 1 atmosphere 4 (Fisher et al.,1993).
The equation for calculating these emissions is based on equations found in Control of VolatileOrganic Compound Emissions from Batch Processes and is shown in Equation 8.4-10(EPA, 1994c).
where:
EVOC = VOC emissions from material heat-up in the process equipment (lb/yr);(Px)T1 = Initial partial pressure of each VOC species x in the vessel headspace at
the initial temperature T1 (psia); see Equations 8.4-3 and 8.4-4;(Px)T2 = Final partial pressure of each VOC species x in the vessel headspace at
the final temperature T2 (psia); see Equations 8.4-3 and 8.4-4;�n = Number of pound-moles of gas displaced (lb-mole/cycle);Ma = Average vapor molecular weight (lb/lb-mole); andCYC = Number of cycles per year (cycles/yr).
������� ����� �� ��� ������������� ������
8.4-12 ���� ���� ��
�n �
VR
�
Pa1
T1�
Pa2
T2(8.4-11)
Pa1 � 14.7 � �(P
x)T1 (8.4-12)
Pa2 � 14.7 � �(P
x)T2 (8.4-13)
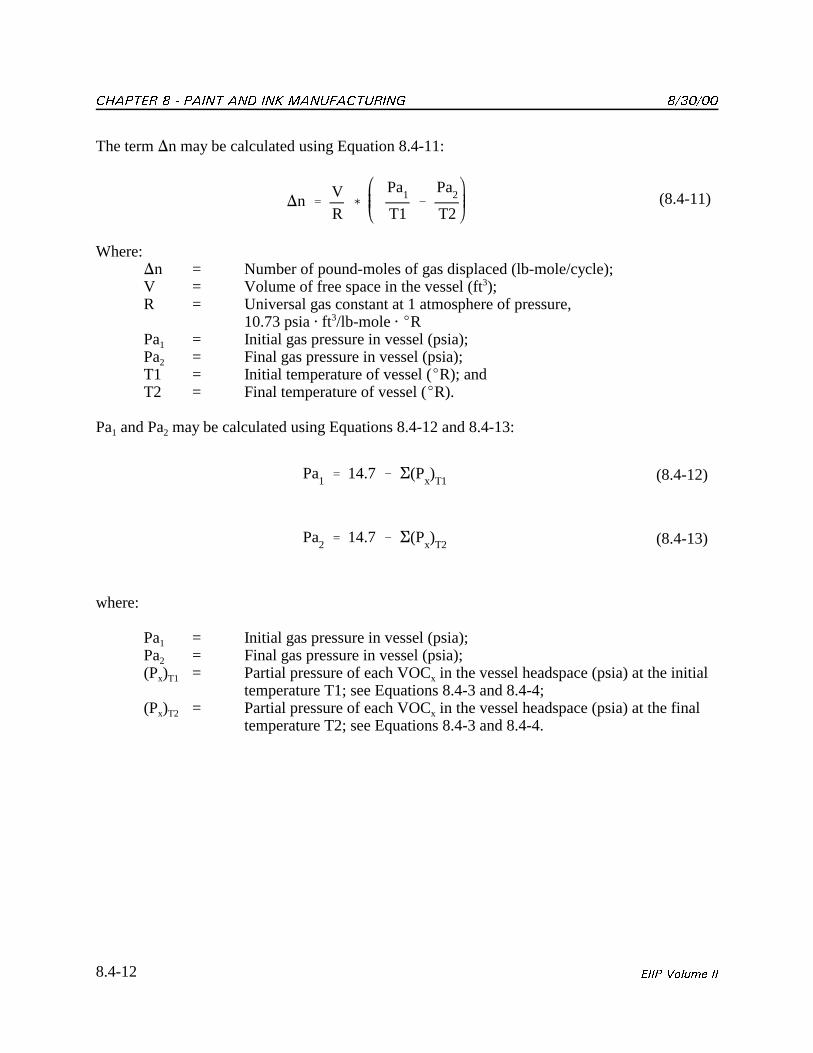
The term �n may be calculated using Equation 8.4-11:
Where:�n = Number of pound-moles of gas displaced (lb-mole/cycle);V = Volume of free space in the vessel (ft3);R = Universal gas constant at 1 atmosphere of pressure,
10.73 psia � ft3/lb-mole � �RPa1 = Initial gas pressure in vessel (psia);Pa2 = Final gas pressure in vessel (psia);T1 = Initial temperature of vessel (�R); andT2 = Final temperature of vessel (�R).
Pa1 and Pa2 may be calculated using Equations 8.4-12 and 8.4-13:
where:
Pa1 = Initial gas pressure in vessel (psia);Pa2 = Final gas pressure in vessel (psia);(Px)T1 = Partial pressure of each VOCx in the vessel headspace (psia) at the initial
temperature T1; see Equations 8.4-3 and 8.4-4;(Px)T2 = Partial pressure of each VOCx in the vessel headspace (psia) at the final
temperature T2; see Equations 8.4-3 and 8.4-4.
������ ������� ����� �� ��� �������������
8.4-13���� ���� ��
Ex �
(Px)T1
14.7� (Px)T1
�
(Px)T2
14.7� (Px)T2
2� � n� M
a�CYC
(8.4-14)
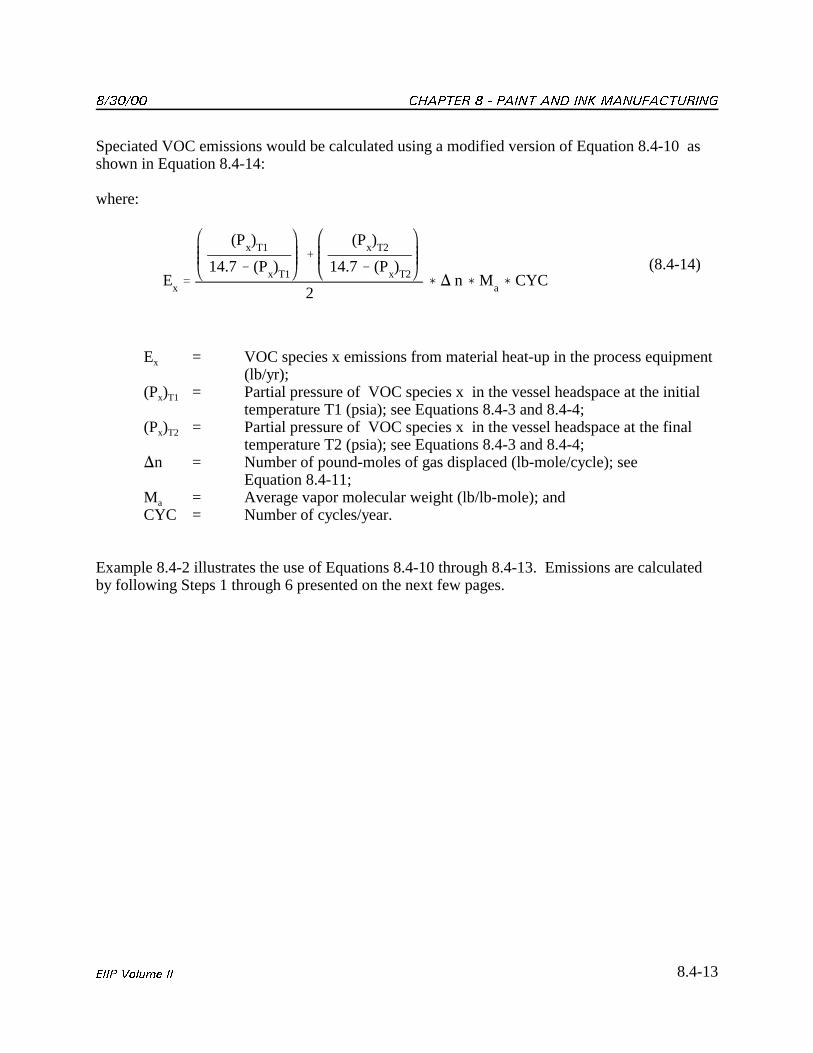
Speciated VOC emissions would be calculated using a modified version of Equation 8.4-10 asshown in Equation 8.4-14:
where:
Ex = VOC species x emissions from material heat-up in the process equipment(lb/yr);
(Px)T1 = Partial pressure of VOC species x in the vessel headspace at the initialtemperature T1 (psia); see Equations 8.4-3 and 8.4-4;
(Px)T2 = Partial pressure of VOC species x in the vessel headspace at the finaltemperature T2 (psia); see Equations 8.4-3 and 8.4-4;
�n = Number of pound-moles of gas displaced (lb-mole/cycle); seeEquation 8.4-11;
Ma = Average vapor molecular weight (lb/lb-mole); andCYC = Number of cycles/year.
Example 8.4-2 illustrates the use of Equations 8.4-10 through 8.4-13. Emissions are calculatedby following Steps 1 through 6 presented on the next few pages.
������� ����� �� ��� ������������� ������
8.4-14 ���� ���� ��
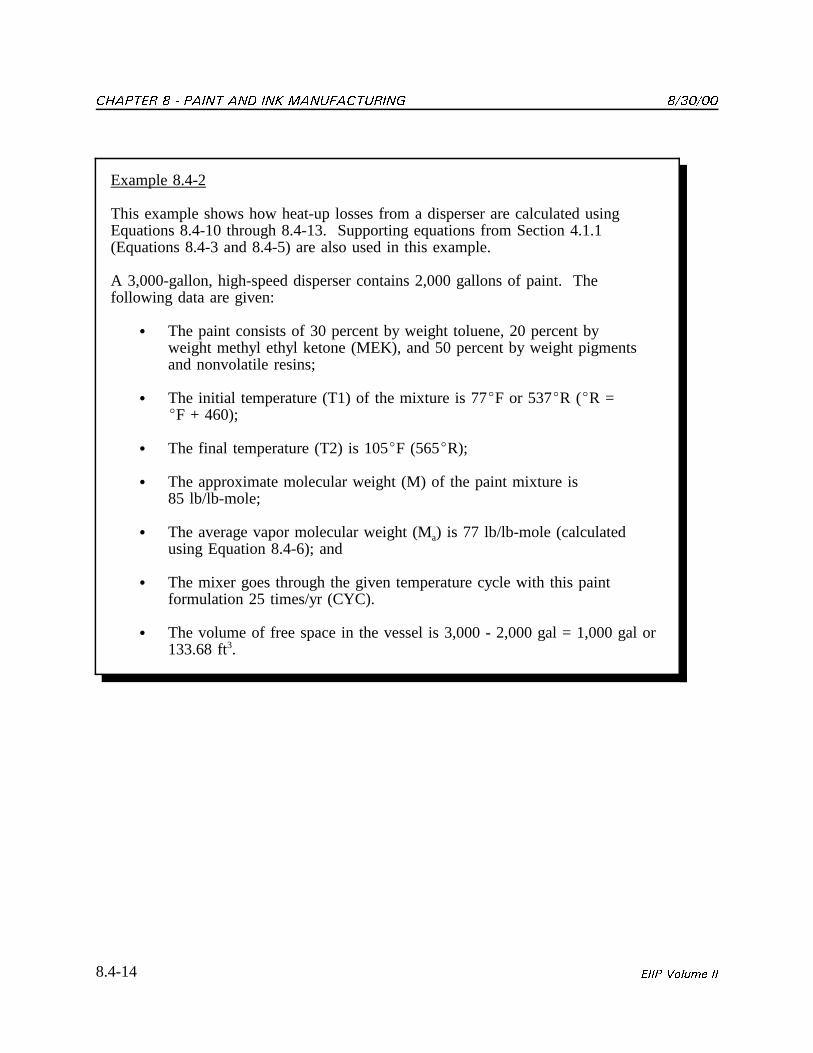
Example 8.4-2
This example shows how heat-up losses from a disperser are calculated usingEquations 8.4-10 through 8.4-13. Supporting equations from Section 4.1.1(Equations 8.4-3 and 8.4-5) are also used in this example.
A 3,000-gallon, high-speed disperser contains 2,000 gallons of paint. Thefollowing data are given:
� The paint consists of 30 percent by weight toluene, 20 percent by weight methyl ethyl ketone (MEK), and 50 percent by weight pigmentsand nonvolatile resins;
� The initial temperature (T1) of the mixture is 77�F or 537�R (�R = �F + 460);
� The final temperature (T2) is 105�F (565�R);
� The approximate molecular weight (M) of the paint mixture is 85 lb/lb-mole;
� The average vapor molecular weight (Ma) is 77 lb/lb-mole (calculatedusing Equation 8.4-6); and
� The mixer goes through the given temperature cycle with this paintformulation 25 times/yr (CYC).
� The volume of free space in the vessel is 3,000 - 2,000 gal = 1,000 gal or133.68 ft3.
������ ������� ����� �� ��� �������������
8.4-15���� ���� ��
mx �
zx/M
x
� (zx/M
x)�
zx/M
x
1/Ml
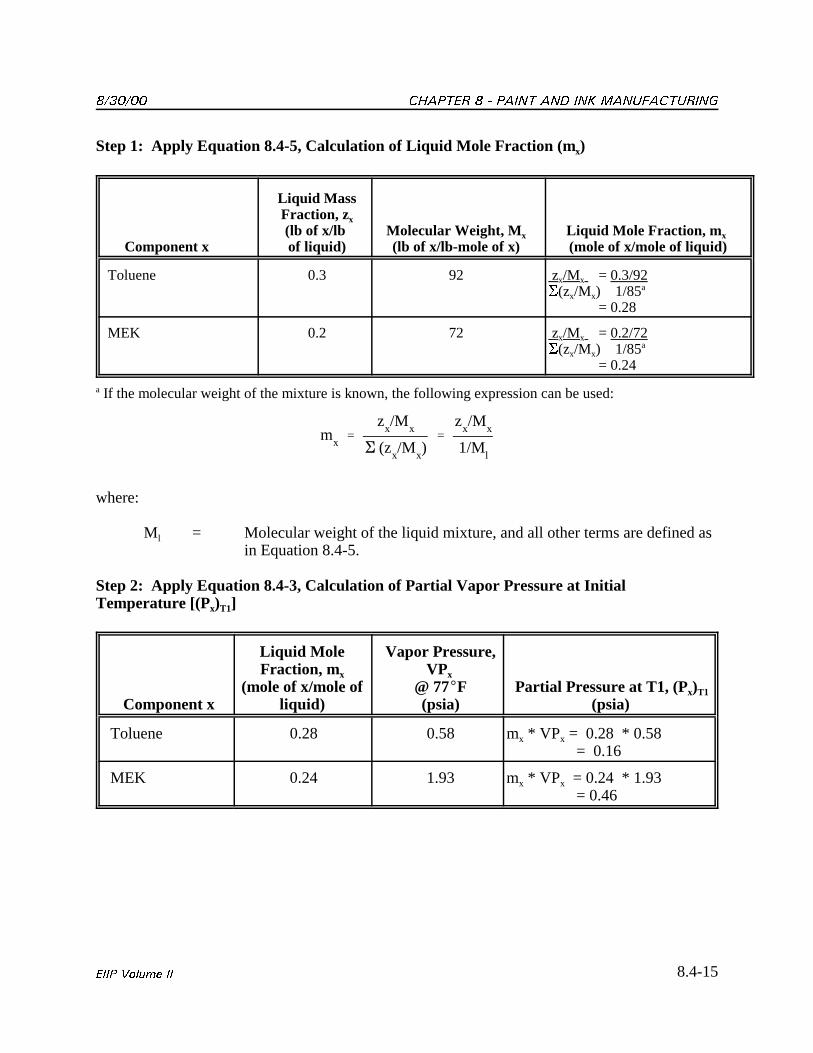
Step 1: Apply Equation 8.4-5, Calculation of Liquid Mole Fraction (mx)
Component x
Liquid MassFraction, zx
(lb of x/lb of liquid)
Molecular Weight, Mx
(lb of x/lb-mole of x)Liquid Mole Fraction, m x
(mole of x/mole of liquid)
Toluene 0.3 92 zx/Mx = 0.3/92 �(zx/Mx) 1/85a
= 0.28
MEK 0.2 72 zx/Mx = 0.2/72 �(zx/Mx) 1/85a
= 0.24
a If the molecular weight of the mixture is known, the following expression can be used:
where:
Ml = Molecular weight of the liquid mixture, and all other terms are defined asin Equation 8.4-5.
Step 2: Apply Equation 8.4-3, Calculation of Partial Vapor Pressure at InitialTemperature [(Px)T1]
Component x
Liquid MoleFraction, mx
(mole of x/mole ofliquid)
Vapor Pressure,VPx
@ 77�F(psia)
Partial Pressure at T1, (Px)T1
(psia)
Toluene 0.28 0.58 mx * VPx = 0.28 * 0.58 = 0.16
MEK 0.24 1.93 mx * VPx = 0.24 * 1.93 = 0.46
������� ����� �� ��� ������������� ������
8.4-16 ���� ���� ��
� n �
VR
�
Pa1
T1
-Pa
2
T2
�
133.6810.73
�
14.1537
-13.5565
� 0.03 lb-moles/CYC
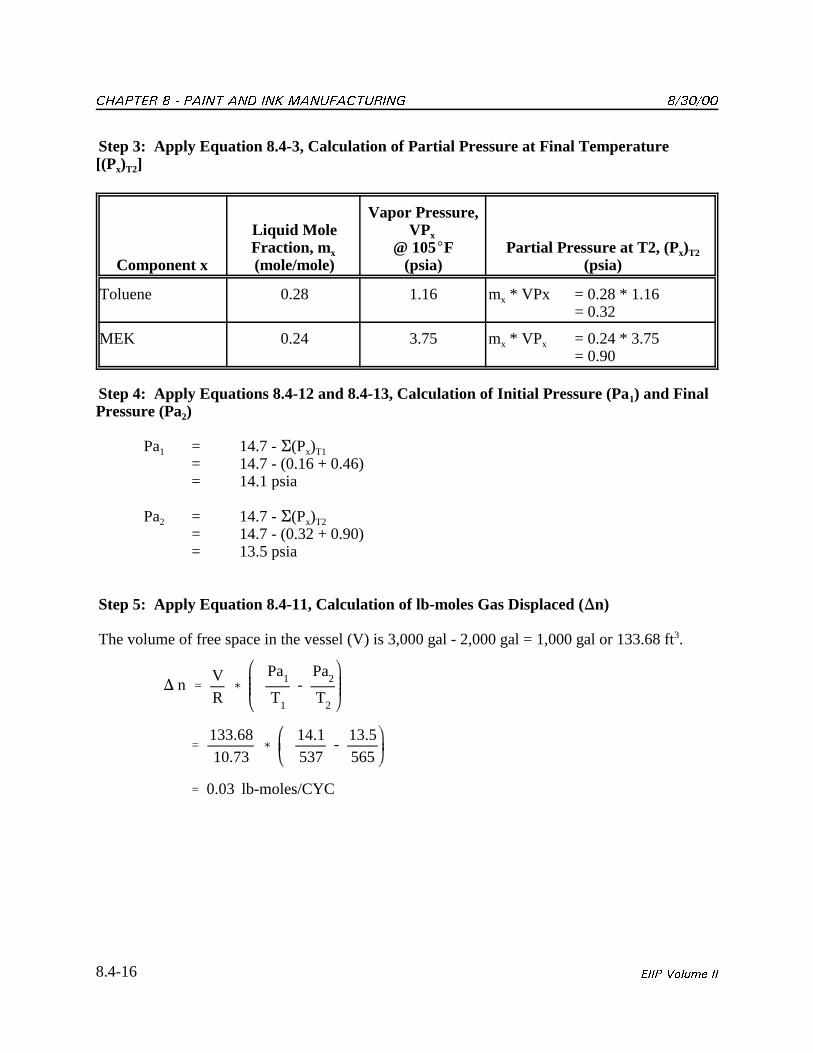
Step 3: Apply Equation 8.4-3, Calculation of Partial Pressure at Final Temperature[(Px)T2]
Component x
Liquid MoleFraction, mx
(mole/mole)
Vapor Pressure,VPx
@ 105�F(psia)
Partial Pressure at T2, (Px)T2
(psia)
Toluene 0.28 1.16 mx * VPx = 0.28 * 1.16= 0.32
MEK 0.24 3.75 mx * VPx = 0.24 * 3.75= 0.90
Step 4: Apply Equations 8.4-12 and 8.4-13, Calculation of Initial Pressure (Pa1) and FinalPressure (Pa2)
Pa1 = 14.7 - �(Px)T1
= 14.7 - (0.16 + 0.46)= 14.1 psia
Pa2 = 14.7 - �(Px)T2
= 14.7 - (0.32 + 0.90)= 13.5 psia
Step 5: Apply Equation 8.4-11, Calculation of lb-moles Gas Displaced (�n)
The volume of free space in the vessel (V) is 3,000 gal - 2,000 gal = 1,000 gal or 133.68 ft3.
������ ������� ����� �� ��� �������������
8.4-17���� ���� ��
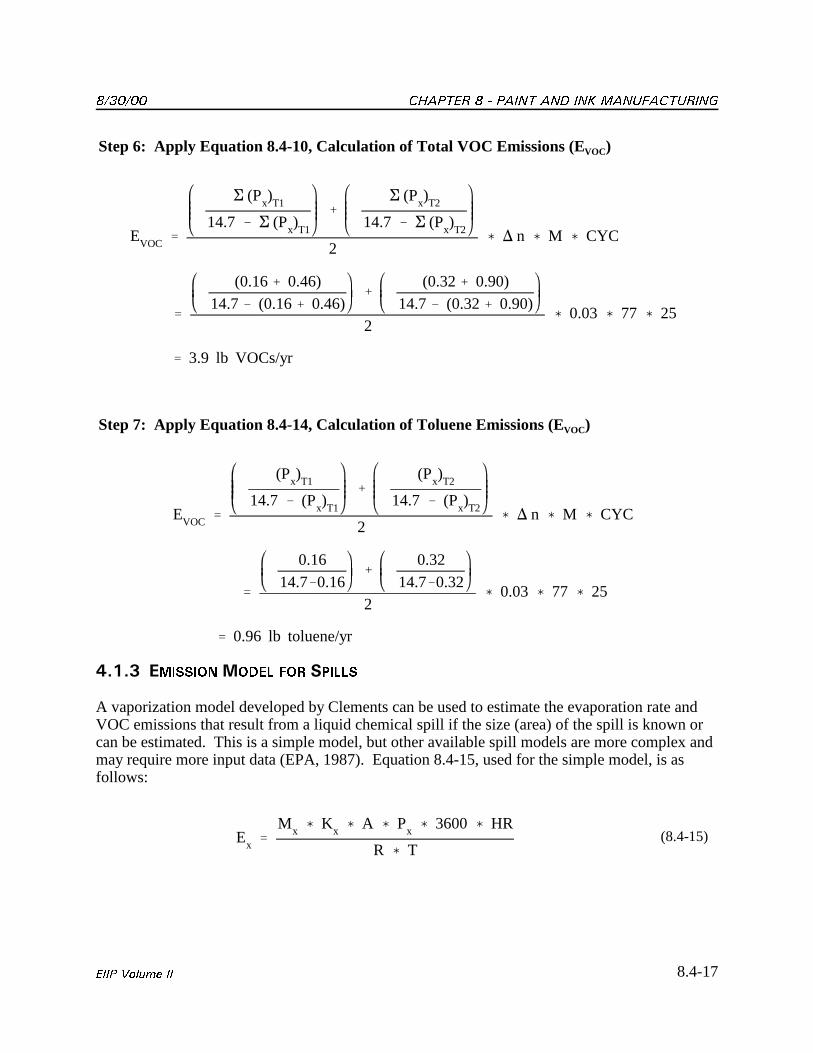
EVOC �
� (Px)T1
14.7 � � (Px)T1
�
� (Px)T2
14.7 � � (Px)T2
2� � n � M � CYC
�
(0.16� 0.46)
14.7� (0.16� 0.46)�
(0.32� 0.90)
14.7� (0.32� 0.90)2
� 0.03 � 77 � 25
� 3.9 lb VOCs/yr
EVOC �
(Px)T1
14.7 � (Px)T1
�
(Px)T2
14.7 � (Px)T2
2� � n � M � CYC
�
0.16
14.7�0.16�
0.32
14.7�0.322
� 0.03 � 77 � 25
� 0.96 lb toluene/yr
Ex �
Mx � K
x � A � Px � 3600 � HR
R � T(8.4-15)
Step 6: Apply Equation 8.4-10, Calculation of Total VOC Emissions (EVOC)
Step 7: Apply Equation 8.4-14, Calculation of Toluene Emissions (EVOC)
/-+-. ������������ ��� ������
A vaporization model developed by Clements can be used to estimate the evaporation rate andVOC emissions that result from a liquid chemical spill if the size (area) of the spill is known orcan be estimated. This is a simple model, but other available spill models are more complex andmay require more input data (EPA, 1987). Equation 8.4-15, used for the simple model, is asfollows:
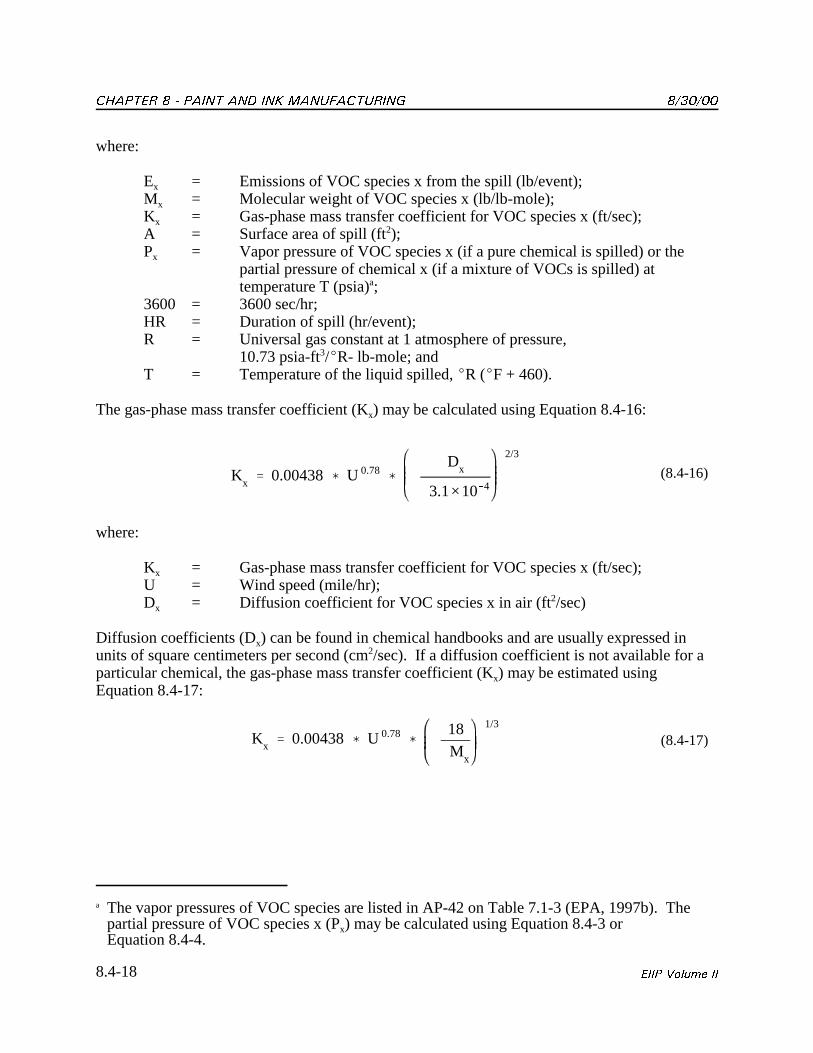
������� ����� �� ��� ������������� ������
a The vapor pressures of VOC species are listed in AP-42 on Table 7.1-3 (EPA, 1997b). Thepartial pressure of VOC species x (Px) may be calculated using Equation 8.4-3 orEquation 8.4-4.
8.4-18 ���� ���� ��
Kx � 0.00438� U 0.78
�
Dx
3.1×10�4
2/3
(8.4-16)
Kx � 0.00438� U 0.78
�
18M
x
1/3
(8.4-17)
where:
Ex = Emissions of VOC species x from the spill (lb/event);Mx = Molecular weight of VOC species x (lb/lb-mole);Kx = Gas-phase mass transfer coefficient for VOC species x (ft/sec);A = Surface area of spill (ft2);Px = Vapor pressure of VOC species x (if a pure chemical is spilled) or the
partial pressure of chemical x (if a mixture of VOCs is spilled) attemperature T (psia)a;
3600 = 3600 sec/hr;HR = Duration of spill (hr/event); R = Universal gas constant at 1 atmosphere of pressure,
10.73 psia-ft3/�R- lb-mole; andT = Temperature of the liquid spilled, �R (�F + 460).
The gas-phase mass transfer coefficient (Kx) may be calculated using Equation 8.4-16:
where:
Kx = Gas-phase mass transfer coefficient for VOC species x (ft/sec);U = Wind speed (mile/hr);Dx = Diffusion coefficient for VOC species x in air (ft2/sec)
Diffusion coefficients (Dx) can be found in chemical handbooks and are usually expressed inunits of square centimeters per second (cm2/sec). If a diffusion coefficient is not available for aparticular chemical, the gas-phase mass transfer coefficient (Kx) may be estimated usingEquation 8.4-17:
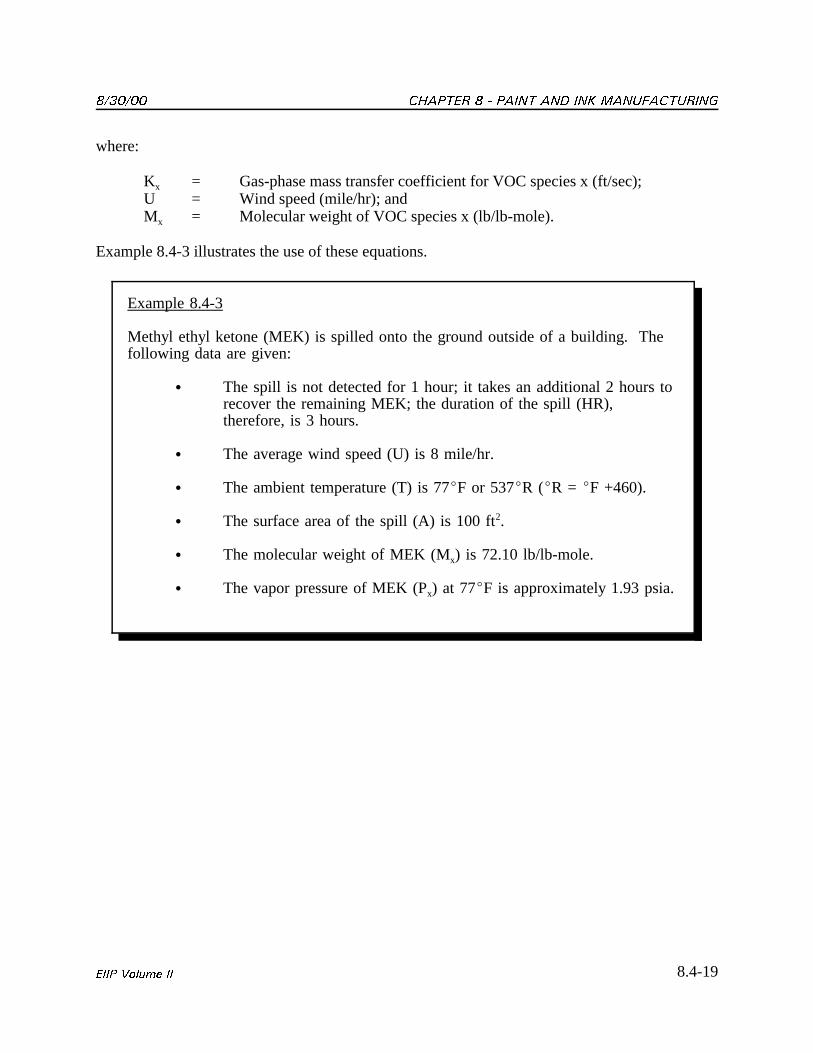
������ ������� ����� �� ��� �������������
8.4-19���� ���� ��
Example 8.4-3
Methyl ethyl ketone (MEK) is spilled onto the ground outside of a building. Thefollowing data are given:
� The spill is not detected for 1 hour; it takes an additional 2 hours torecover the remaining MEK; the duration of the spill (HR),therefore, is 3 hours.
� The average wind speed (U) is 8 mile/hr.
� The ambient temperature (T) is 77�F or 537�R (�R = �F +460).
� The surface area of the spill (A) is 100 ft2.
� The molecular weight of MEK (Mx) is 72.10 lb/lb-mole.
� The vapor pressure of MEK (Px) at 77�F is approximately 1.93 psia.
where:
Kx = Gas-phase mass transfer coefficient for VOC species x (ft/sec);U = Wind speed (mile/hr); andMx = Molecular weight of VOC species x (lb/lb-mole).
Example 8.4-3 illustrates the use of these equations.
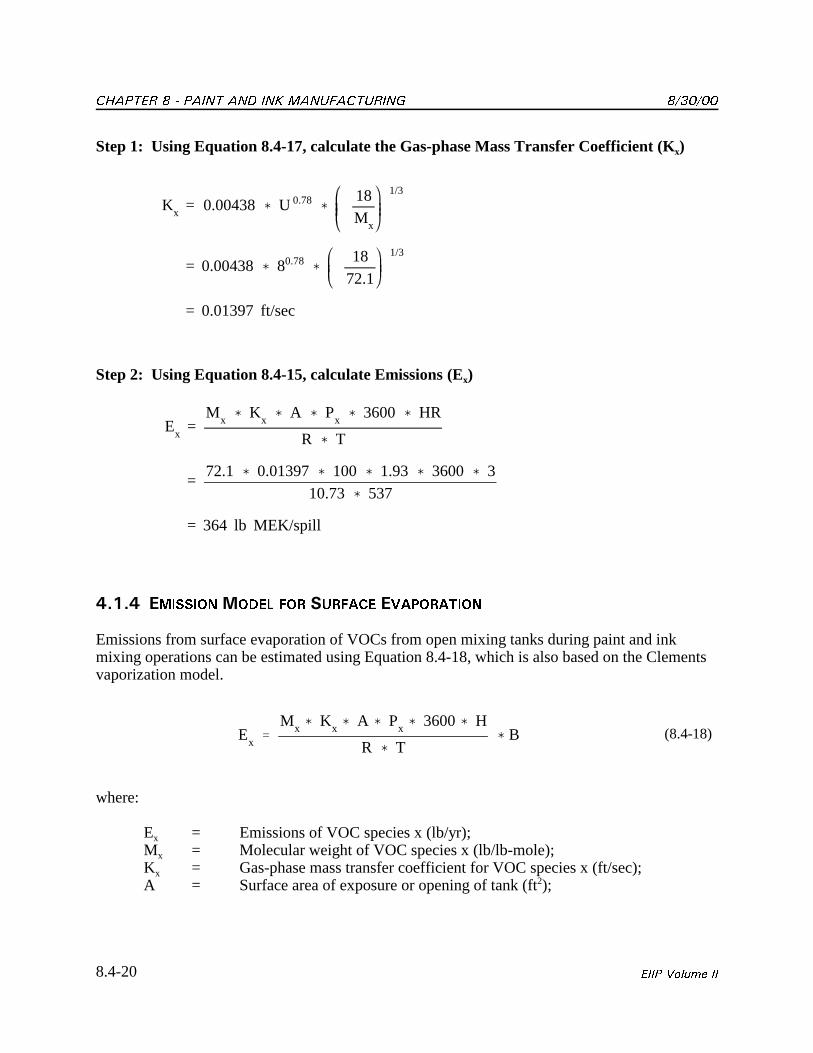
������� ����� �� ��� ������������� ������
8.4-20 ���� ���� ��
Kx
= 0.00438� U 0.78�
18M
x
1/3
= 0.00438� 80.78�
18
72.1
1/3
= 0.01397 ft/sec
Ex
=M
x � Kx � A � P
x � 3600 � HR
R � T
=72.1 � 0.01397� 100 � 1.93 � 3600 � 3
10.73 � 537
= 364 lb MEK/spill
Ex �
Mx �
Kx �
A � Px �
3600� H
R � T� B (8.4-18)
Step 1: Using Equation 8.4-17, calculate the Gas-phase Mass Transfer Coefficient (Kx)
Step 2: Using Equation 8.4-15, calculate Emissions (Ex)
/-+-/ ������������ ��� ������� ����������
Emissions from surface evaporation of VOCs from open mixing tanks during paint and inkmixing operations can be estimated using Equation 8.4-18, which is also based on the Clementsvaporization model.
where:
Ex = Emissions of VOC species x (lb/yr);Mx = Molecular weight of VOC species x (lb/lb-mole);Kx = Gas-phase mass transfer coefficient for VOC species x (ft/sec);A = Surface area of exposure or opening of tank (ft2);
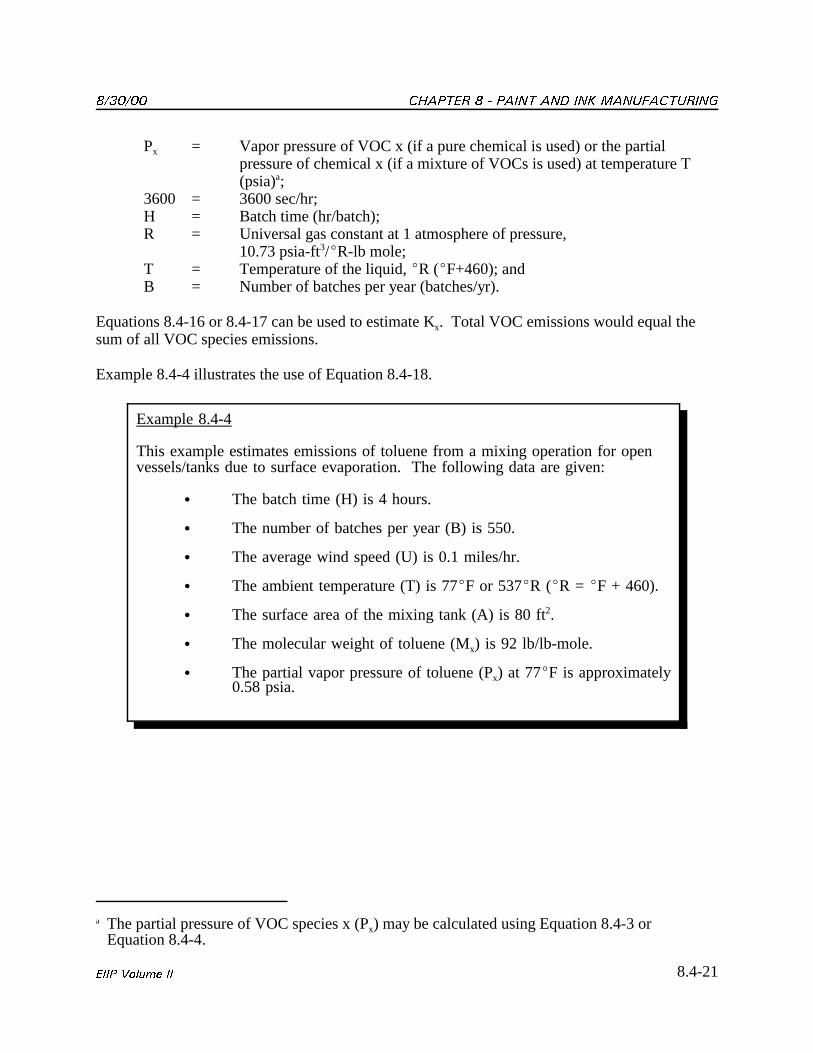
������ ������� ����� �� ��� �������������
a The partial pressure of VOC species x (Px) may be calculated using Equation 8.4-3 orEquation 8.4-4.
8.4-21���� ���� ��
Example 8.4-4
This example estimates emissions of toluene from a mixing operation for openvessels/tanks due to surface evaporation. The following data are given:
� The batch time (H) is 4 hours.
� The number of batches per year (B) is 550.
� The average wind speed (U) is 0.1 miles/hr.
� The ambient temperature (T) is 77�F or 537�R (�R = �F + 460).
� The surface area of the mixing tank (A) is 80 ft2.
� The molecular weight of toluene (Mx) is 92 lb/lb-mole.
� The partial vapor pressure of toluene (Px) at 77�F is approximately0.58 psia.
Px = Vapor pressure of VOC x (if a pure chemical is used) or the partialpressure of chemical x (if a mixture of VOCs is used) at temperature T(psia)a;
3600 = 3600 sec/hr;H = Batch time (hr/batch);R = Universal gas constant at 1 atmosphere of pressure,
10.73 psia-ft3/�R-lb mole; T = Temperature of the liquid, �R (�F+460); andB = Number of batches per year (batches/yr).
Equations 8.4-16 or 8.4-17 can be used to estimate Kx. Total VOC emissions would equal thesum of all VOC species emissions.
Example 8.4-4 illustrates the use of Equation 8.4-18.
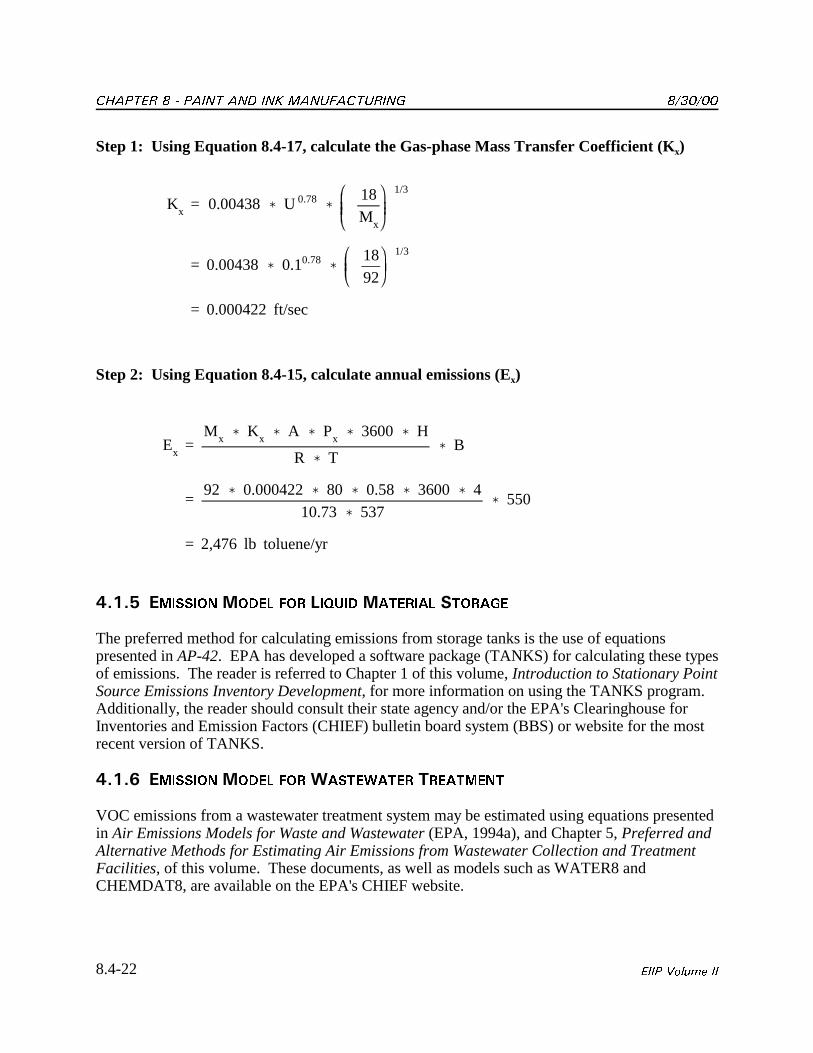
������� ����� �� ��� ������������� ������
8.4-22 ���� ���� ��
Kx
= 0.00438� U 0.78�
18M
x
1/3
= 0.00438� 0.10.78�
18
92
1/3
= 0.000422 ft/sec
Ex
=M
x � Kx � A � P
x � 3600 � H
R � T� B
=92 � 0.000422� 80 � 0.58 � 3600 � 4
10.73 � 537� 550
= 2,476 lb toluene/yr
Step 1: Using Equation 8.4-17, calculate the Gas-phase Mass Transfer Coefficient (Kx)
Step 2: Using Equation 8.4-15, calculate annual emissions (Ex)
/-+-1 ������������ ��� �������������� �������
The preferred method for calculating emissions from storage tanks is the use of equationspresented in AP-42. EPA has developed a software package (TANKS) for calculating these typesof emissions. The reader is referred to Chapter 1 of this volume, Introduction to Stationary PointSource Emissions Inventory Development, for more information on using the TANKS program. Additionally, the reader should consult their state agency and/or the EPA's Clearinghouse forInventories and Emission Factors (CHIEF) bulletin board system (BBS) or website for the mostrecent version of TANKS.
/-+-5 ������������ ���3��������� ��������
VOC emissions from a wastewater treatment system may be estimated using equations presentedin Air Emissions Models for Waste and Wastewater (EPA, 1994a), and Chapter 5, Preferred andAlternative Methods for Estimating Air Emissions from Wastewater Collection and TreatmentFacilities, of this volume. These documents, as well as models such as WATER8 andCHEMDAT8, are available on the EPA's CHIEF website.
������ ������� ����� �� ��� �������������
8.4-23���� ���� ��
EVOC � EF
VOC � QVOC (8.4-19)
/-" �����������������������������������������
Emission factors are commonly used to calculate emissions from paint and ink manufacturingfacilities. EPA maintains a compilation of approved emission factors in AP-42 for criteriapollutants and hazardous air pollutants (HAPs). Emission factors for equipment leaks may befound in Protocol for Equipment Leak Emission Estimates (EPA, 1995g). Chapter 4 of thisvolume discusses emission estimates from equipment leaks.
The most comprehensive source for toxic air pollutant emission factors is the Factor Informationand Retrieval (FIRE) data system, which also contains criteria pollutant emission factors(EPA, 1995h).
Currently, emission factors are the preferred method for estimating VOC emissions from thefollowing types of sources found in a paint and ink manufacturing facility:
� Solvent reclamation systems;
� Parts washing equipment; and
� Process piping.
Emission factors are also the preferred method for estimating PM/PM10 emissions from paint andink manufacturing facilities.
VOC emission factors are also available in AP-42 for calculating total plant emissions andmixing operation emissions from a paint manufacturing facility and for vehicle cooking andpigment mixing emissions from an ink manufacturing facility. These emission factors arediscussed further in Sections 5.1.1 through 5.1.3.
/-"-+ ����� �� ��������� �� �������� ���� ������ ����������
VOC emissions from the loading and operation of a distillation device may be calculated usingemission factors (EPA, 1995d). AP-42 also presents factors for spills and the storage ofmaterials associated with the solvent reclamation process; however, the preferred emissionestimation technique for these sources is the use of models discussed previously in this section.
To calculate total VOCs from loading or operation of the distillation device, use Equation 8.4-19:
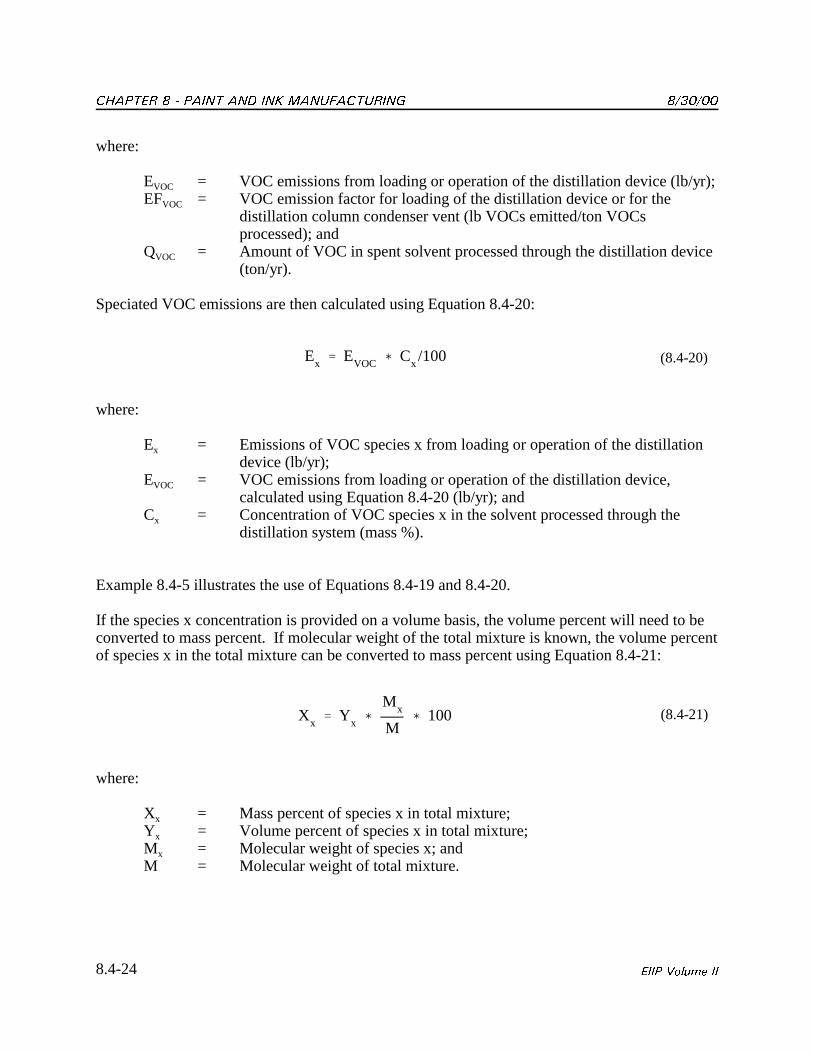
������� ����� �� ��� ������������� ������
8.4-24 ���� ���� ��
Ex � E
VOC � Cx/100 (8.4-20)
Xx � Y
x �
Mx
M� 100 (8.4-21)
where:
EVOC = VOC emissions from loading or operation of the distillation device (lb/yr);EFVOC = VOC emission factor for loading of the distillation device or for the
distillation column condenser vent (lb VOCs emitted/ton VOCsprocessed); and
QVOC = Amount of VOC in spent solvent processed through the distillation device(ton/yr).
Speciated VOC emissions are then calculated using Equation 8.4-20:
where:
Ex = Emissions of VOC species x from loading or operation of the distillationdevice (lb/yr);
EVOC = VOC emissions from loading or operation of the distillation device,calculated using Equation 8.4-20 (lb/yr); and
Cx = Concentration of VOC species x in the solvent processed through thedistillation system (mass %).
Example 8.4-5 illustrates the use of Equations 8.4-19 and 8.4-20.
If the species x concentration is provided on a volume basis, the volume percent will need to beconverted to mass percent. If molecular weight of the total mixture is known, the volume percentof species x in the total mixture can be converted to mass percent using Equation 8.4-21:
where:
Xx = Mass percent of species x in total mixture;Yx = Volume percent of species x in total mixture;Mx = Molecular weight of species x; andM = Molecular weight of total mixture.
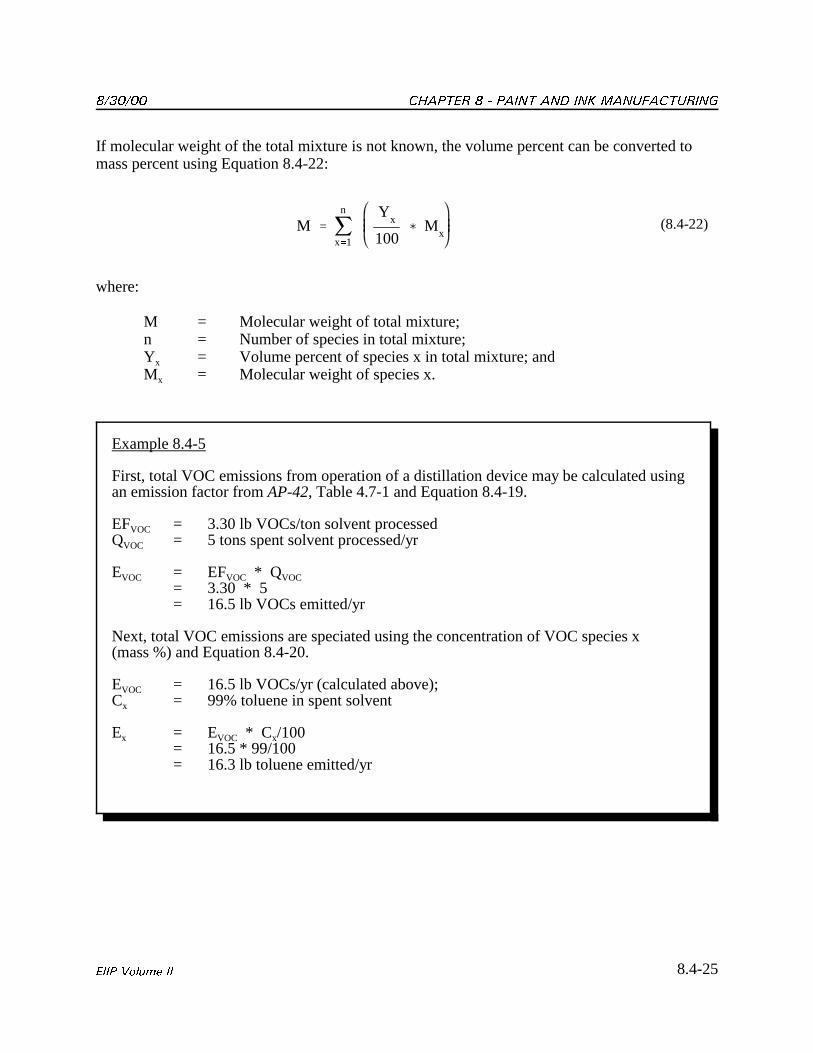
������ ������� ����� �� ��� �������������
8.4-25���� ���� ��
M � �n
x�1
Yx
100� M
x(8.4-22)
Example 8.4-5
First, total VOC emissions from operation of a distillation device may be calculated usingan emission factor from AP-42, Table 4.7-1 and Equation 8.4-19.
EFVOC = 3.30 lb VOCs/ton solvent processedQVOC = 5 tons spent solvent processed/yr
EVOC = EFVOC * QVOC = 3.30 * 5= 16.5 lb VOCs emitted/yr
Next, total VOC emissions are speciated using the concentration of VOC species x(mass %) and Equation 8.4-20.
EVOC = 16.5 lb VOCs/yr (calculated above);Cx = 99% toluene in spent solvent
Ex = EVOC * Cx/100= 16.5 * 99/100= 16.3 lb toluene emitted/yr
If molecular weight of the total mixture is not known, the volume percent can be converted tomass percent using Equation 8.4-22:
where:
M = Molecular weight of total mixture;n = Number of species in total mixture;Yx = Volume percent of species x in total mixture; andMx = Molecular weight of species x.
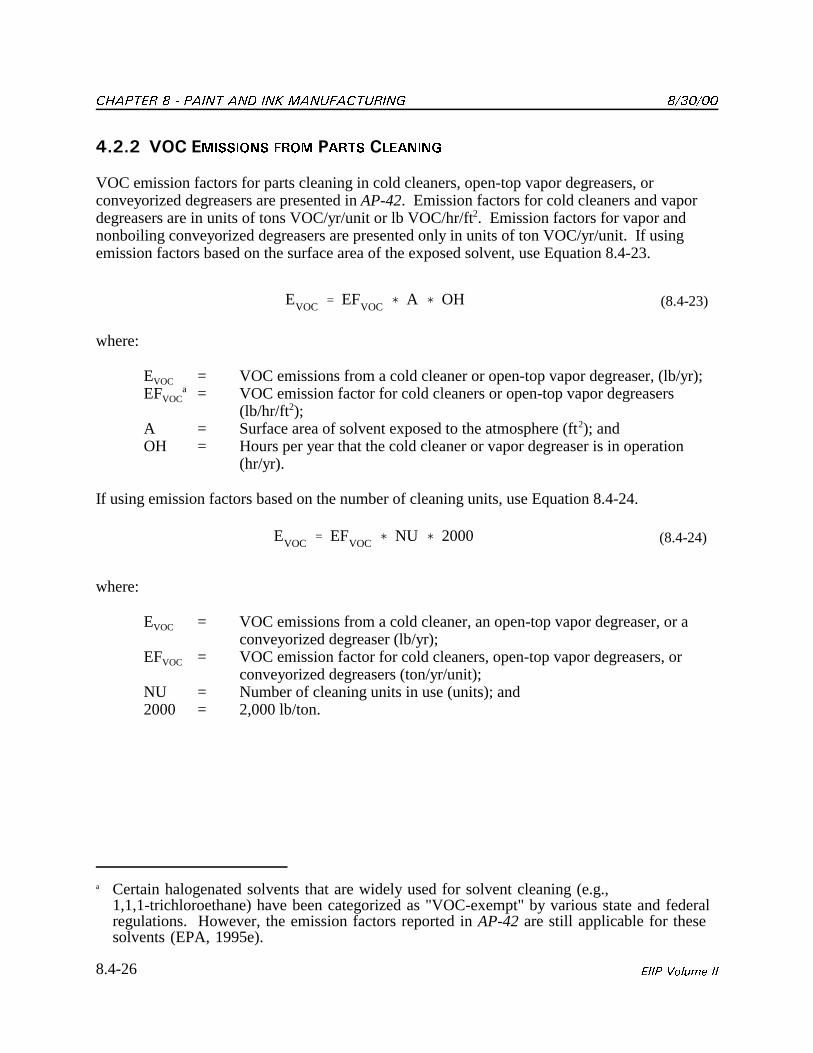
������� ����� �� ��� ������������� ������
a Certain halogenated solvents that are widely used for solvent cleaning (e.g.,1,1,1-trichloroethane) have been categorized as "VOC-exempt" by various state and federalregulations. However, the emission factors reported in AP-42 are still applicable for thesesolvents (EPA, 1995e).
8.4-26 ���� ���� ��
EVOC � EF
VOC � A � OH (8.4-23)
EVOC � EF
VOC � NU � 2000 (8.4-24)
/-"-" �� �������� ���� ���� �����
VOC emission factors for parts cleaning in cold cleaners, open-top vapor degreasers, orconveyorized degreasers are presented in AP-42. Emission factors for cold cleaners and vapordegreasers are in units of tons VOC/yr/unit or lb VOC/hr/ft2. Emission factors for vapor andnonboiling conveyorized degreasers are presented only in units of ton VOC/yr/unit. If usingemission factors based on the surface area of the exposed solvent, use Equation 8.4-23.
where:
EVOC = VOC emissions from a cold cleaner or open-top vapor degreaser, (lb/yr);EFVOC
a = VOC emission factor for cold cleaners or open-top vapor degreasers(lb/hr/ft2);
A = Surface area of solvent exposed to the atmosphere (ft2); andOH = Hours per year that the cold cleaner or vapor degreaser is in operation
(hr/yr).
If using emission factors based on the number of cleaning units, use Equation 8.4-24.
where:
EVOC = VOC emissions from a cold cleaner, an open-top vapor degreaser, or aconveyorized degreaser (lb/yr);
EFVOC = VOC emission factor for cold cleaners, open-top vapor degreasers, orconveyorized degreasers (ton/yr/unit);
NU = Number of cleaning units in use (units); and2000 = 2,000 lb/ton.
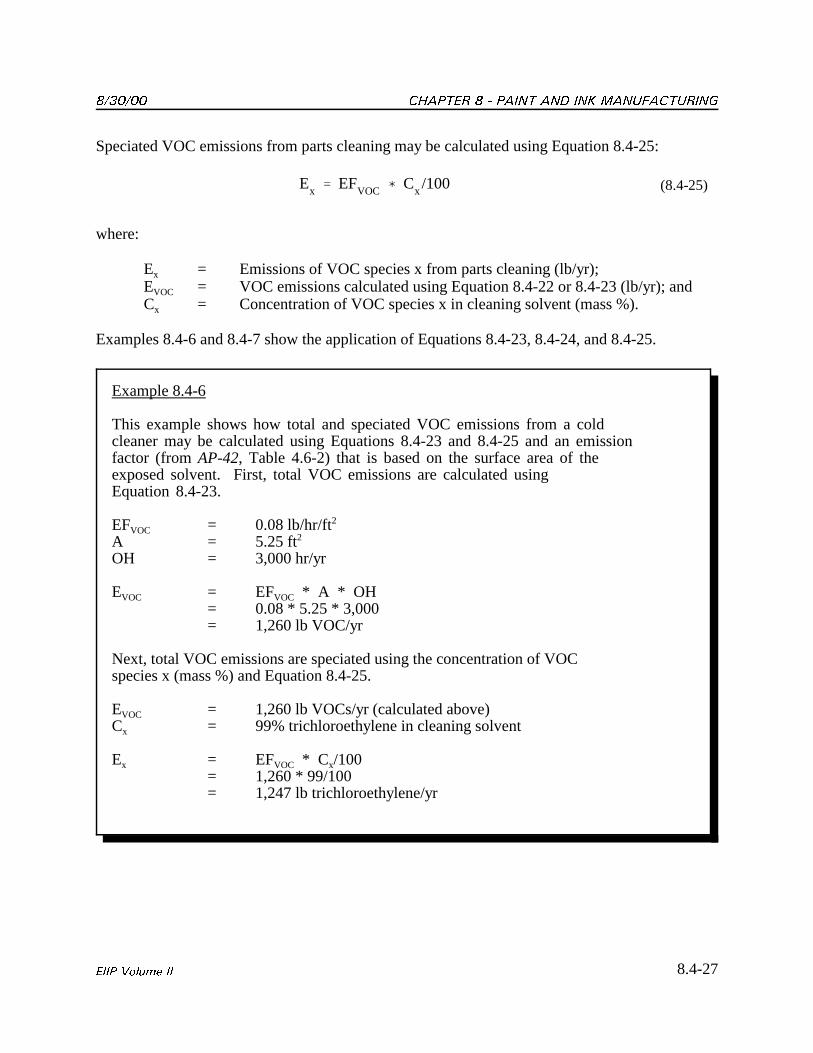
������ ������� ����� �� ��� �������������
8.4-27���� ���� ��
Ex � EF
VOC � Cx/100 (8.4-25)
Example 8.4-6
This example shows how total and speciated VOC emissions from a cold cleaner may be calculated using Equations 8.4-23 and 8.4-25 and an emission factor (from AP-42, Table 4.6-2) that is based on the surface area of the exposed solvent. First, total VOC emissions are calculated using Equation 8.4-23.
EFVOC = 0.08 lb/hr/ft2
A = 5.25 ft2
OH = 3,000 hr/yr
EVOC = EFVOC * A * OH= 0.08 * 5.25 * 3,000= 1,260 lb VOC/yr
Next, total VOC emissions are speciated using the concentration of VOC species x (mass %) and Equation 8.4-25.
EVOC = 1,260 lb VOCs/yr (calculated above)Cx = 99% trichloroethylene in cleaning solvent
Ex = EFVOC * Cx/100= 1,260 * 99/100= 1,247 lb trichloroethylene/yr
Speciated VOC emissions from parts cleaning may be calculated using Equation 8.4-25:
where:
Ex = Emissions of VOC species x from parts cleaning (lb/yr);EVOC = VOC emissions calculated using Equation 8.4-22 or 8.4-23 (lb/yr); andCx = Concentration of VOC species x in cleaning solvent (mass %).
Examples 8.4-6 and 8.4-7 show the application of Equations 8.4-23, 8.4-24, and 8.4-25.
������� ����� �� ��� ������������� ������
8.4-28 ���� ���� ��
Example 8.4-7
This example shows how total VOC emissions are calculated from several coldcleaners using Equation 8.4-24 and an emission factor from Table 4-6.2 of AP-42.
EFVOC = 0.33 ton/yr/unitNU = 5 units
EVOC = EFVOC * NU * 2,000= 0.33 * 5 * 2,000= 3,300 lb VOC/yr
EPM � EF
PM � � Qx (8.4-26)
/-"-. �� �������� ���� �������� �����
Emissions from equipment leaks may be calculated using emission factors established byEPA for the synthetic organic chemical manufacturing industry (SOCMI). SOCMI averageand screening value range emission factors are available for various types of components(e.g., valves, pump seals, connectors, open-ended lines). Additionally, EPA has developedSOCMI correlation equations that can be used if test data are available. Calculation ofemissions from equipment leaks is explained in more detail in Chapter 4 of this volume.
/-"-/ �2 ��� �������� ���� � ��� �� �� ����������� �������
AP-42 also presents PM emission factors from paint and ink manufacturing, which are basedon the amount of pigment used by a facility. The AP-42 factor for paint manufacturing is20 lb PM/ton pigment. The AP-42 factor for pigment mixing at an ink manufacturing facilityis 2 lb PM/ton pigment. To calculate PM emissions using these emission factors, useEquation 8.4-26.
where:
EPM = Total PM emissions (lb/yr);EFPM = PM emission factor (lb PM/ton pigment); and�Qx = Total pigment (ton/yr).
������ ������� ����� �� ��� �������������
8.4-29���� ���� ��
Ex � EF
PM � Qx � C
x/100 (8.4-27)
Example 8.4-8
This example demonstrates how speciated PM emissions from pigment mixing atan ink manufacturing facility may be calculated using the consumption-based PMemission factor from Table 6.7-1 of AP-42 and Equation 8.4-27:
EFPM = 2 lb PM/ton pigmentQx = 5 tons ZnO/yrCx = 80% Zn in ZnO
Ex = EFPM * Qx * Cx/100= 2 * 5 * 80/100= 8 lb Zn/yr
PM10 can conservatively be estimated by assuming that all of the PM emitted is PM10.
Speciated PM emissions are calculated using Equation 8.4-27:
where:
Ex = Total emissions of PM species x (lb/yr);EFPM = PM emission factor from AP-42, Table 6.4-1 or Table 6.7-1 (lb PM/ton
pigment);Qx = Amount of pigment containing species x used by the facility (ton/yr);
andCx = Concentration of PM species x in pigment x (mass %).
Use of Equation 8.4-27 is demonstrated in Example 8.4-8.
������� ����� �� ��� ������������� ������
8.4-30 ���� ���� ��
This page is intentionally left blank
8.5-1���� ���� ��
EVOC � EF
VOC � Qp (8.5-1)
1
�����������������������
��������������������
Alternative methods for calculating emissions from paint and ink manufacturing facilities arepresented in this section. A list of variables used in Equations 8.5-1 through 8.5-10 is given inTable 8.5-1.
1-+ �����������������������������������������
Emission factors are commonly used to calculate emissions from paint and ink manufacturingfacilities. EPA maintains a compilation of approved emission factors in AP-42 for criteriapollutants and hazardous air pollutants (HAPs). Available emission factors for paintmanufacturing can be found in Section 6.4 of AP-42 and in a technical memorandum from EPAto the National Paint and Coatings Association (EPA, 1995f). Emission factors for inkmanufacturing can be found in Section 6.7 of AP-42. The National Association of Printing InkManufacturers, Inc. (NAPIM), has also developed ink manufacturing emission factors (NAPIM,1996). The most comprehensive source for toxic air pollutant emission factors is the FactorInformation and Retrieval (FIRE) data system, which also contains criteria pollutant emissionfactors (EPA, 1999).
1-+-+ ����� �� �������� ���� �������������� ����������
A VOC emission factor can be used for calculating total VOC emissions from paintmanufacturing facilities. The emission factor presented in AP-42 is essentially a loss factor thatrepresents an emission rate to be applied to a production rate (NPCA, 1995). The VOC emissionfactor presented in AP-42 for paint manufacturing is 30 lb total VOCs/ton product (EPA, 1995b). To calculate total VOCs using this emission factor, see Equation 8.5-1:
where:
EVOC = Total emissions of VOCs from the facility (lb/yr);EFVOC = VOC emission factor (lb VOCs/ton product); andQp = Amount of product produced (ton/yr).
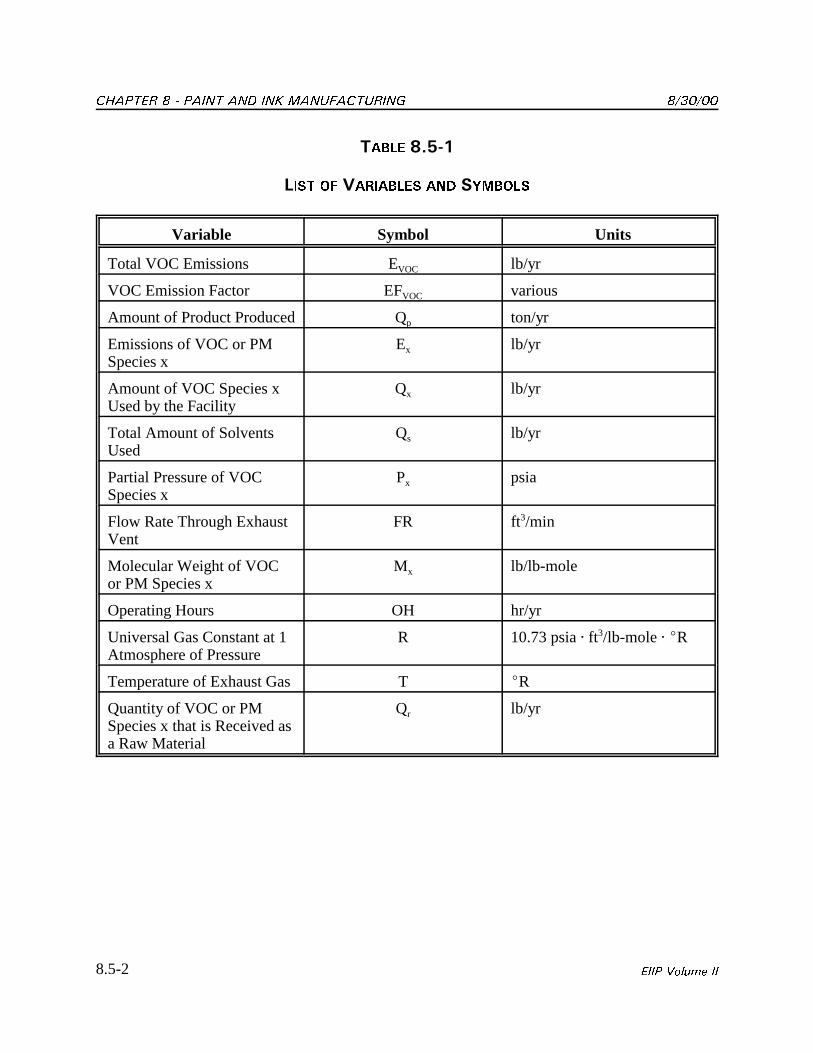
������� ����� �� ��� ������������� ������
8.5-2 ���� ���� ��
����� �-10+
���� �� ��������� �� ������
Variable Symbol Units
Total VOC Emissions EVOC lb/yr
VOC Emission Factor EFVOC various
Amount of Product Produced Qp ton/yr
Emissions of VOC or PMSpecies x
Ex lb/yr
Amount of VOC Species xUsed by the Facility
Qx lb/yr
Total Amount of SolventsUsed
Qs lb/yr
Partial Pressure of VOCSpecies x
Px psia
Flow Rate Through ExhaustVent
FR ft3/min
Molecular Weight of VOCor PM Species x
Mx lb/lb-mole
Operating Hours OH hr/yr
Universal Gas Constant at 1Atmosphere of Pressure
R 10.73 psia � ft3/lb-mole � �R
Temperature of Exhaust Gas T �R
Quantity of VOC or PMSpecies x that is Received asa Raw Material
Qr lb/yr
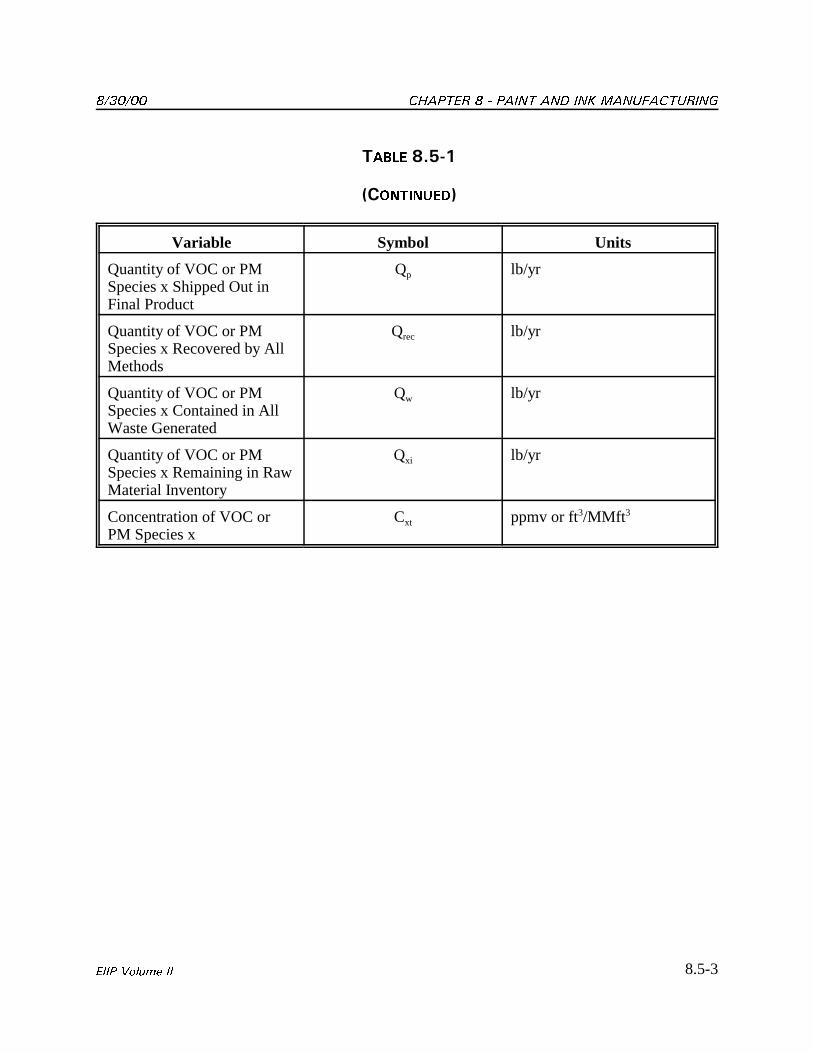
������ ������� ����� �� ��� �������������
8.5-3���� ���� ��
����� �-10+
&������'
Variable Symbol Units
Quantity of VOC or PMSpecies x Shipped Out inFinal Product
Qp lb/yr
Quantity of VOC or PMSpecies x Recovered by AllMethods
Qrec lb/yr
Quantity of VOC or PMSpecies x Contained in AllWaste Generated
Qw lb/yr
Quantity of VOC or PMSpecies x Remaining in RawMaterial Inventory
Qxi lb/yr
Concentration of VOC orPM Species x
Cxt ppmv or ft3/MMft 3
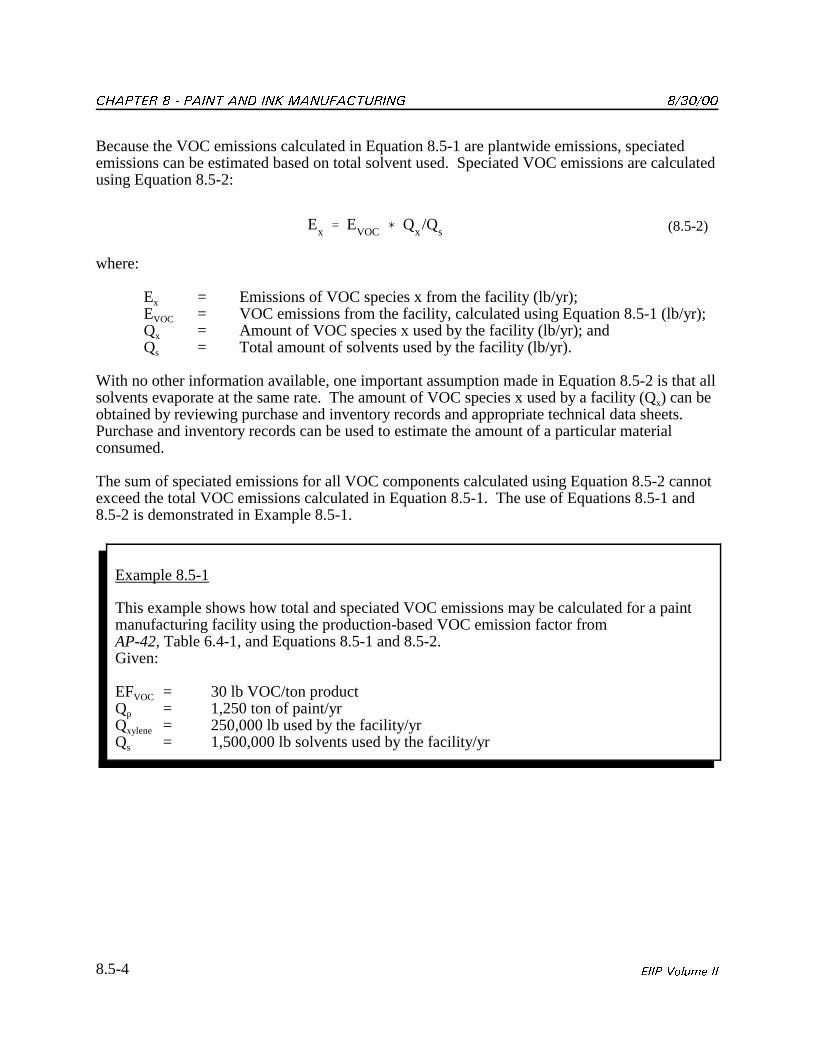
������� ����� �� ��� ������������� ������
8.5-4 ���� ���� ��
Ex � E
VOC � Qx/Q
s (8.5-2)
Example 8.5-1
This example shows how total and speciated VOC emissions may be calculated for a paintmanufacturing facility using the production-based VOC emission factor from AP-42, Table 6.4-1, and Equations 8.5-1 and 8.5-2.Given:
EFVOC = 30 lb VOC/ton productQp = 1,250 ton of paint/yrQxylene = 250,000 lb used by the facility/yrQs = 1,500,000 lb solvents used by the facility/yr
Because the VOC emissions calculated in Equation 8.5-1 are plantwide emissions, speciatedemissions can be estimated based on total solvent used. Speciated VOC emissions are calculatedusing Equation 8.5-2:
where:
Ex = Emissions of VOC species x from the facility (lb/yr);EVOC = VOC emissions from the facility, calculated using Equation 8.5-1 (lb/yr);Qx = Amount of VOC species x used by the facility (lb/yr); andQs = Total amount of solvents used by the facility (lb/yr).
With no other information available, one important assumption made in Equation 8.5-2 is that allsolvents evaporate at the same rate. The amount of VOC species x used by a facility (Qx) can beobtained by reviewing purchase and inventory records and appropriate technical data sheets. Purchase and inventory records can be used to estimate the amount of a particular materialconsumed.
The sum of speciated emissions for all VOC components calculated using Equation 8.5-2 cannotexceed the total VOC emissions calculated in Equation 8.5-1. The use of Equations 8.5-1 and8.5-2 is demonstrated in Example 8.5-1.
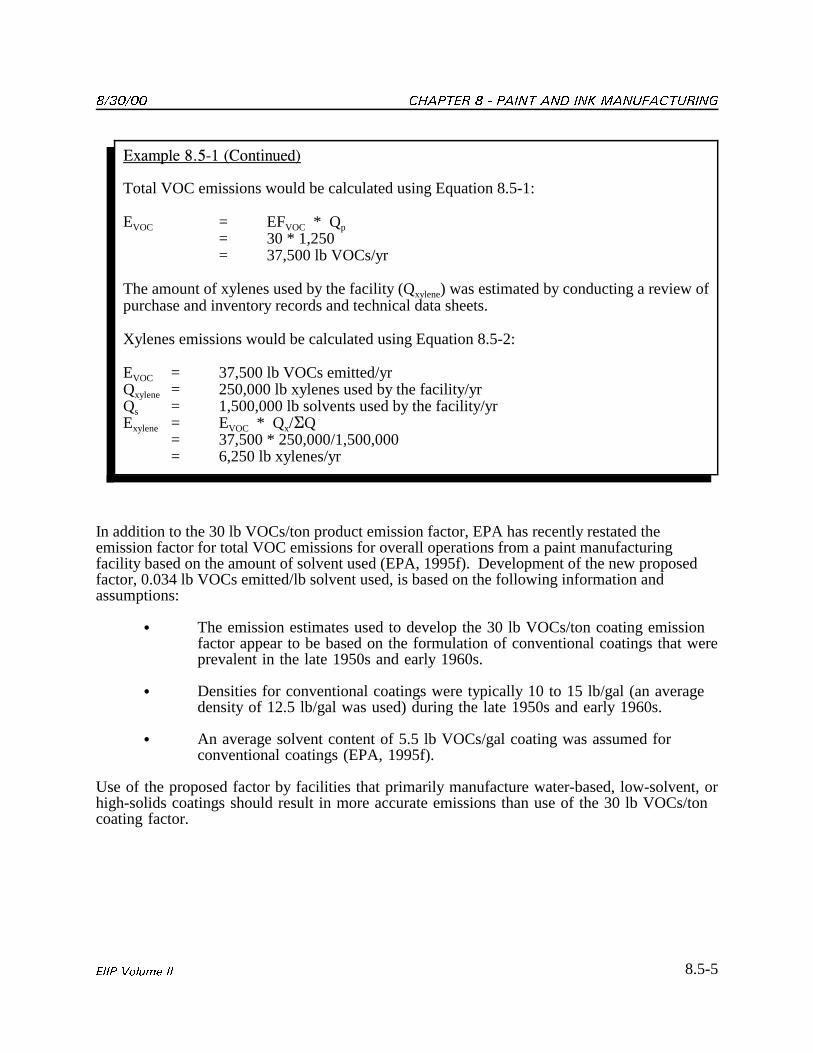
������ ������� ����� �� ��� �������������
8.5-5���� ���� ��
���������� ������������
Total VOC emissions would be calculated using Equation 8.5-1:
EVOC = EFVOC * Qp= 30 * 1,250= 37,500 lb VOCs/yr
The amount of xylenes used by the facility (Qxylene) was estimated by conducting a review ofpurchase and inventory records and technical data sheets.
Xylenes emissions would be calculated using Equation 8.5-2:
EVOC = 37,500 lb VOCs emitted/yrQxylene = 250,000 lb xylenes used by the facility/yrQs = 1,500,000 lb solvents used by the facility/yrExylene = EVOC * Qx/�Q
= 37,500 * 250,000/1,500,000= 6,250 lb xylenes/yr
In addition to the 30 lb VOCs/ton product emission factor, EPA has recently restated theemission factor for total VOC emissions for overall operations from a paint manufacturingfacility based on the amount of solvent used (EPA, 1995f). Development of the new proposedfactor, 0.034 lb VOCs emitted/lb solvent used, is based on the following information andassumptions:
� The emission estimates used to develop the 30 lb VOCs/ton coating emissionfactor appear to be based on the formulation of conventional coatings that wereprevalent in the late 1950s and early 1960s.
� Densities for conventional coatings were typically 10 to 15 lb/gal (an averagedensity of 12.5 lb/gal was used) during the late 1950s and early 1960s.
� An average solvent content of 5.5 lb VOCs/gal coating was assumed forconventional coatings (EPA, 1995f).
Use of the proposed factor by facilities that primarily manufacture water-based, low-solvent, orhigh-solids coatings should result in more accurate emissions than use of the 30 lb VOCs/toncoating factor.
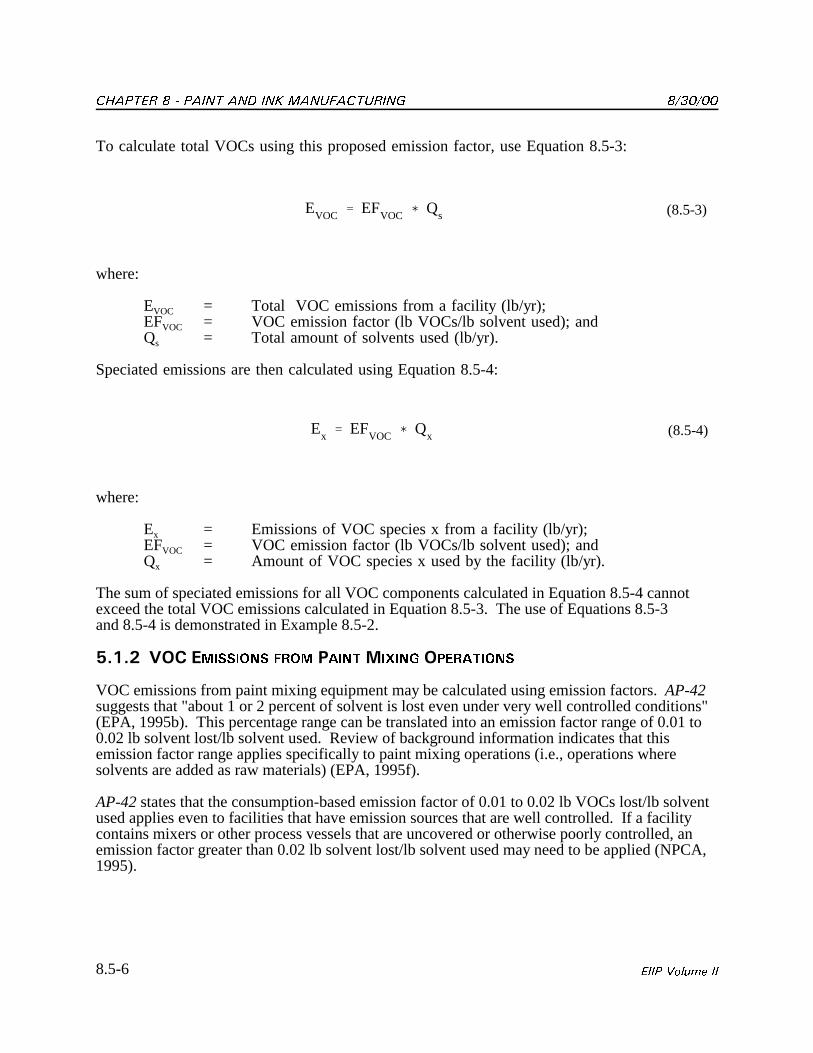
������� ����� �� ��� ������������� ������
8.5-6 ���� ���� ��
EVOC � EF
VOC � Qs (8.5-3)
Ex � EF
VOC � Qx (8.5-4)
To calculate total VOCs using this proposed emission factor, use Equation 8.5-3:
where:
EVOC = Total VOC emissions from a facility (lb/yr);EFVOC = VOC emission factor (lb VOCs/lb solvent used); andQs = Total amount of solvents used (lb/yr).
Speciated emissions are then calculated using Equation 8.5-4:
where:
Ex = Emissions of VOC species x from a facility (lb/yr);EFVOC = VOC emission factor (lb VOCs/lb solvent used); andQx = Amount of VOC species x used by the facility (lb/yr).
The sum of speciated emissions for all VOC components calculated in Equation 8.5-4 cannotexceed the total VOC emissions calculated in Equation 8.5-3. The use of Equations 8.5-3 and 8.5-4 is demonstrated in Example 8.5-2.
1-+-" �� �������� ���� ����� �� ���������
VOC emissions from paint mixing equipment may be calculated using emission factors. AP-42suggests that "about 1 or 2 percent of solvent is lost even under very well controlled conditions"(EPA, 1995b). This percentage range can be translated into an emission factor range of 0.01 to0.02 lb solvent lost/lb solvent used. Review of background information indicates that thisemission factor range applies specifically to paint mixing operations (i.e., operations wheresolvents are added as raw materials) (EPA, 1995f).
AP-42 states that the consumption-based emission factor of 0.01 to 0.02 lb VOCs lost/lb solventused applies even to facilities that have emission sources that are well controlled. If a facilitycontains mixers or other process vessels that are uncovered or otherwise poorly controlled, anemission factor greater than 0.02 lb solvent lost/lb solvent used may need to be applied (NPCA,1995).
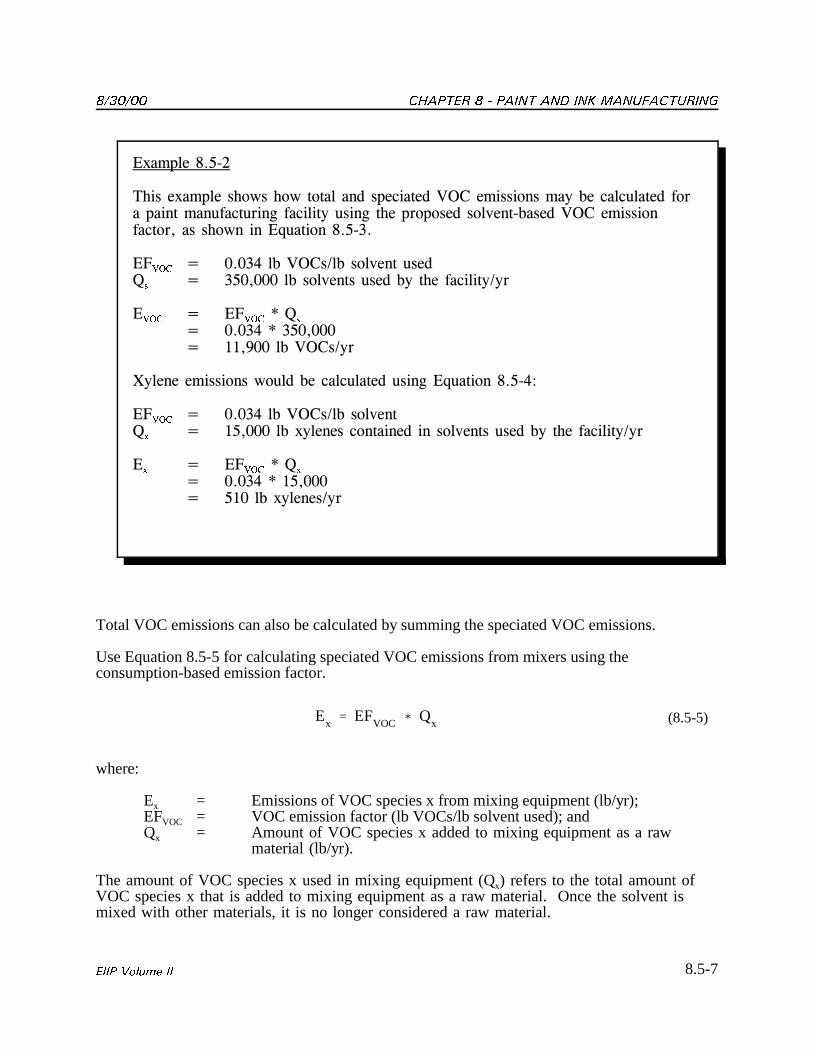
������ ������� ����� �� ��� �������������
8.5-7���� ���� ��
�����������
������������������������������������������������������������� �������������!�"������������!����"��#�!������������#������"����������$���� �����������������!����"%��������������&���������'
�(��� ) **'+�� �����,� ����$��������-� ) '�*%***�� ����$���������� ������!�������,�"
���� ) �(����.�-�
) **'+�.�'�*%***) %/**�� �����,�"
0���������������������� �����������������#��&���������+1
�(��� ) **'+�� �����,� ����$���-� ) �%***�� �������������������������$���������� ������!�������,�"
�� ) �(����.�-��) **'+�.� �%***) � *�� ��������,�"
Ex � EF
VOC � Qx (8.5-5)
Total VOC emissions can also be calculated by summing the speciated VOC emissions.
Use Equation 8.5-5 for calculating speciated VOC emissions from mixers using theconsumption-based emission factor.
where:
Ex = Emissions of VOC species x from mixing equipment (lb/yr);EFVOC = VOC emission factor (lb VOCs/lb solvent used); andQx = Amount of VOC species x added to mixing equipment as a raw
material (lb/yr).
The amount of VOC species x used in mixing equipment (Qx) refers to the total amount ofVOC species x that is added to mixing equipment as a raw material. Once the solvent ismixed with other materials, it is no longer considered a raw material.
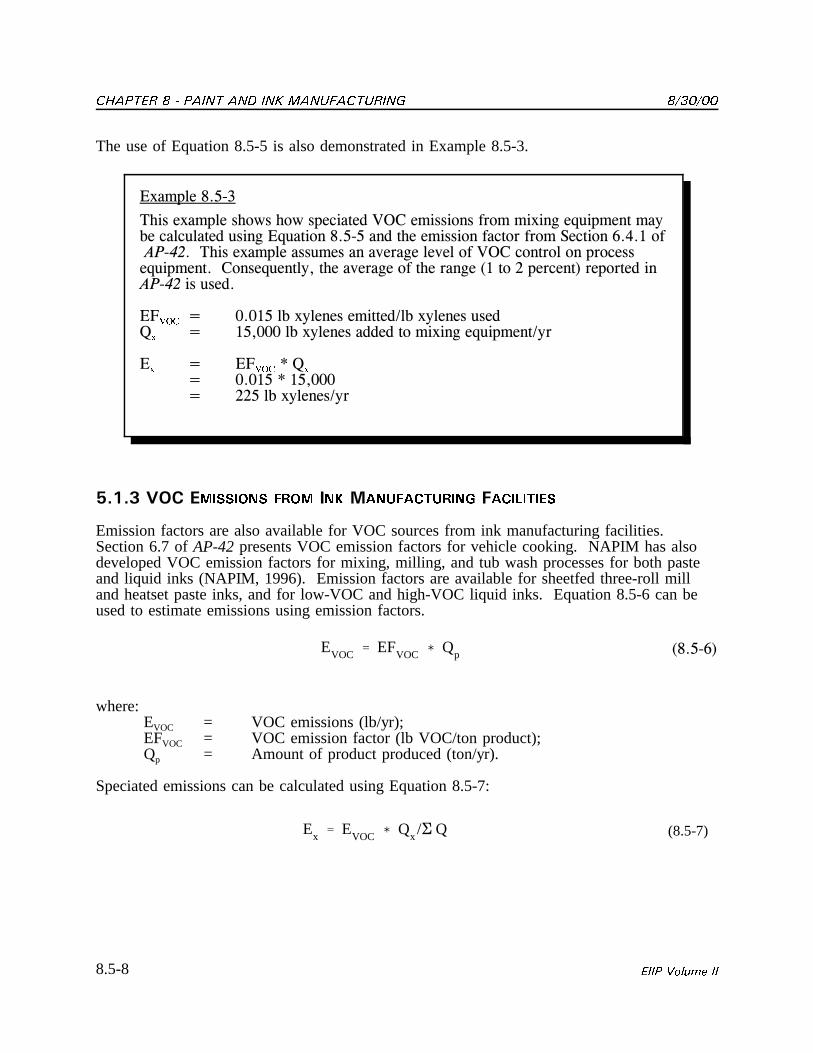
������� ����� �� ��� ������������� ������
8.5-8 ���� ���� ��
����������'
�����������������������������������������������!"��������#��&������������ �����������������#��&����������������������������!����"�!"���2�������3+ ��!���������������������������������$�"�#����$����!���������"�������"�������&��������������&������%������$�"�#���!�����"��#��� ��������"������"���"��������������������
�(��� ) ** ��� ����������������,� �������������-� ) �%***�� �����������������������#��&�������,�"
�� ) �(����.�-��) ** ��.� �%***�) ����� ��������,�"
EVOC � EF
VOC � Qp ���3�
Ex � E
VOC � Qx/� Q (8.5-7)
The use of Equation 8.5-5 is also demonstrated in Example 8.5-3.
1-+-. �� �������� ���� �� ����������� ����������
Emission factors are also available for VOC sources from ink manufacturing facilities. Section 6.7 of AP-42 presents VOC emission factors for vehicle cooking. NAPIM has alsodeveloped VOC emission factors for mixing, milling, and tub wash processes for both pasteand liquid inks (NAPIM, 1996). Emission factors are available for sheetfed three-roll milland heatset paste inks, and for low-VOC and high-VOC liquid inks. Equation 8.5-6 can beused to estimate emissions using emission factors.
where:EVOC = VOC emissions (lb/yr);EFVOC = VOC emission factor (lb VOC/ton product);Qp = Amount of product produced (ton/yr).
Speciated emissions can be calculated using Equation 8.5-7:
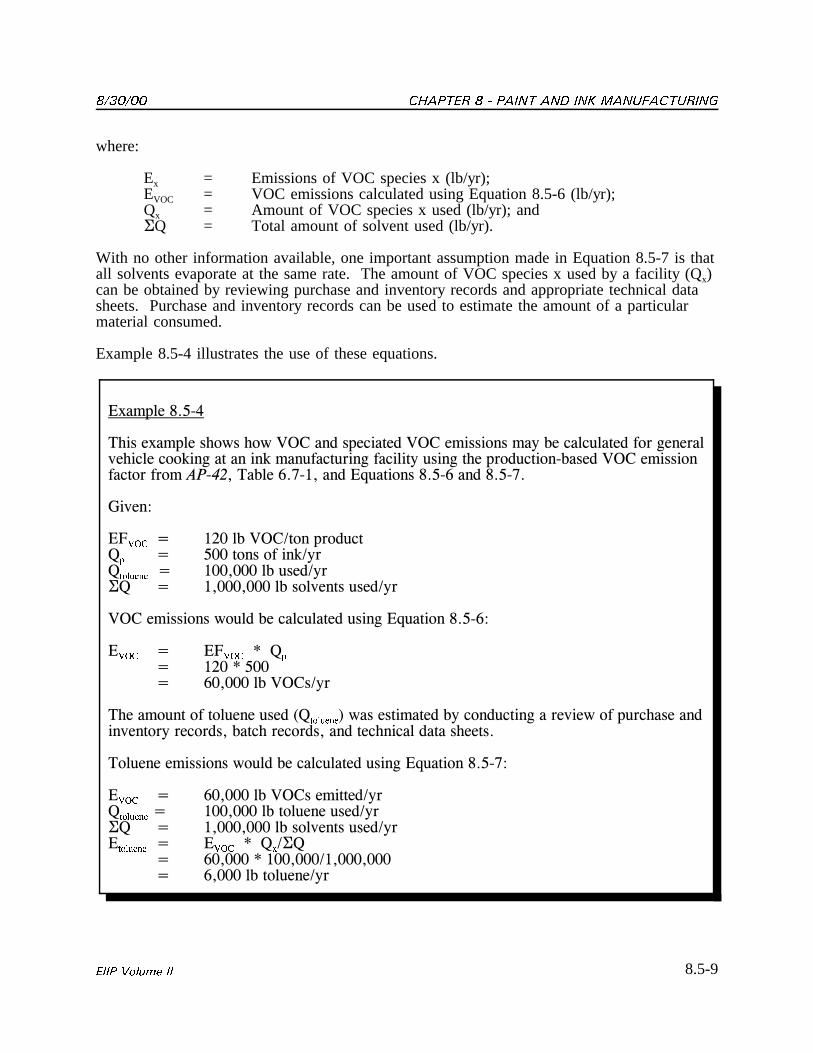
������ ������� ����� �� ��� �������������
8.5-9���� ���� ��
����������+
����������������������������������������������������������� �������������!�"�#���"��$����������4��#���������4�����!����"��#�!������������#������"��������� �����������������!����"�!"��������%��� ���35� %������&����������3�������5
6�$��1
�(��� ) �*�� ����,�����"�����-� ) �**�������!���4,�"-�������) **%***�� �����,�"�- ) %***%***�� ����$���������,�"
�������������������� �����������������#��&���������31
���� ) �(�����.��-�
) �*�.��**) 3*%***�� �����,�"
������������!���������������-��������������������� �����������#���"�$�����!���"�����������$����"��"���"��%� �����"���"��%��������������������������
������������������������ �����������������#��&���������51
���� ) 3*%***�� �������������,�"-������) **%***�� �������������,�"�- ) %***%***�� ����$���������,�"������ ) ������.��-�,�-
) 3*%***�.� **%***, %***%***) 3%***�� ��������,�"
where:
Ex = Emissions of VOC species x (lb/yr);EVOC = VOC emissions calculated using Equation 8.5-6 (lb/yr);Qx = Amount of VOC species x used (lb/yr); and�Q = Total amount of solvent used (lb/yr).
With no other information available, one important assumption made in Equation 8.5-7 is thatall solvents evaporate at the same rate. The amount of VOC species x used by a facility (Qx)can be obtained by reviewing purchase and inventory records and appropriate technical datasheets. Purchase and inventory records can be used to estimate the amount of a particularmaterial consumed.
Example 8.5-4 illustrates the use of these equations.
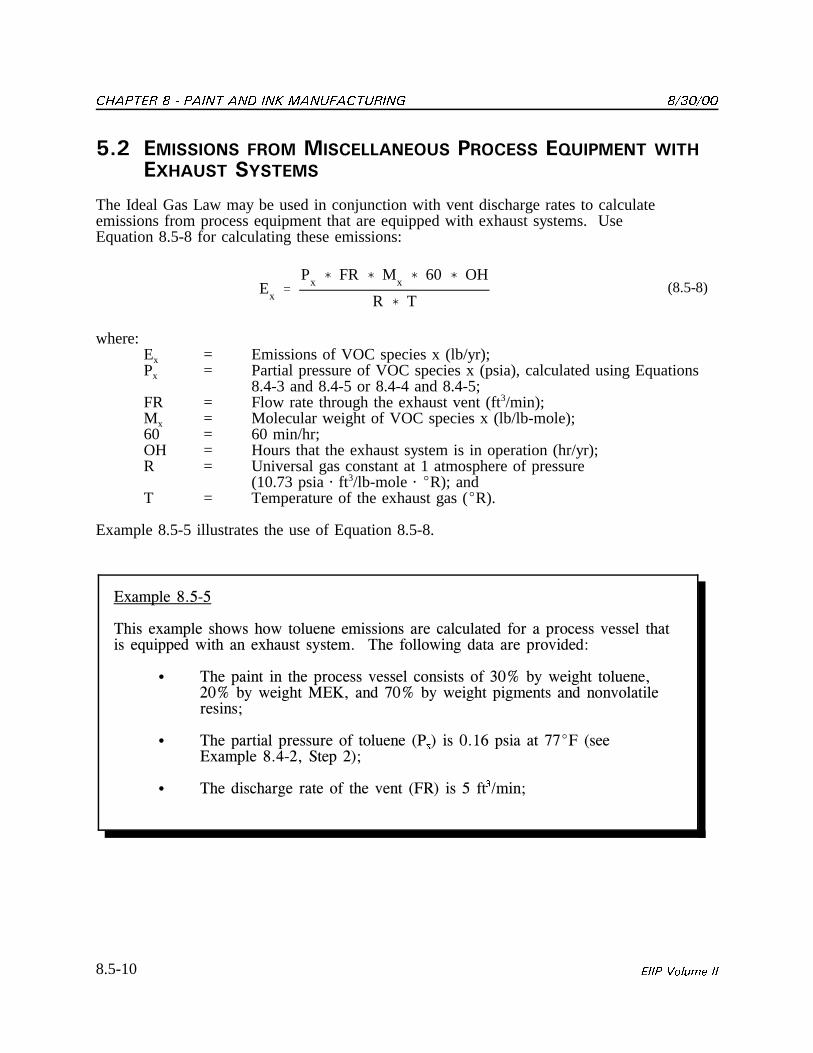
������� ����� �� ��� ������������� ������
8.5-10 ���� ���� ��
Ex �
Px � FR � M
x � 60 � OH
R � T(8.5-8)
�����������
������������������������������������������"�������������!�"����"������$������ ��������&�����������������������������������!�������#�������"���"�$����1
� ���������� ��� �����"������$����������������!�'*7� �����#��� �������%�*7� �����#���8�9%�����5*7� �����#�����#�������������$�������"�����:
� ������"������"����"���!� ���������;��� ���* 3���������55�(�������������+��%�2������:
� ����������"#��"�����!� ����$�����(<�������!� ,���:
1-" ���������������������������� �������4�� �����3���
�6�������,�����
The Ideal Gas Law may be used in conjunction with vent discharge rates to calculateemissions from process equipment that are equipped with exhaust systems. UseEquation 8.5-8 for calculating these emissions:
where:Ex = Emissions of VOC species x (lb/yr);Px = Partial pressure of VOC species x (psia), calculated using Equations
8.4-3 and 8.4-5 or 8.4-4 and 8.4-5;FR = Flow rate through the exhaust vent (ft3/min);Mx = Molecular weight of VOC species x (lb/lb-mole);60 = 60 min/hr;OH = Hours that the exhaust system is in operation (hr/yr); R = Universal gas constant at 1 atmosphere of pressure
(10.73 psia � ft3/lb-mole � �R); andT = Temperature of the exhaust gas (�R).
Example 8.5-5 illustrates the use of Equation 8.5-8.
������ ������� ����� �� ��� �������������
8.5-11���� ���� ��
�����������������������
� ������������"����#����!� ���������8��� ���/��� ,� �����:
� ������������������������"������$�������"�����"�����!�"� %***��",�"��=�:����
� ���������"���"���!� ��������������������������#������55�(��"��'5�<���
�������������������"�������������������&�������������!������1
�� ) ;��.�(<�.�8��.�3*�.��=
<�.��
) * 3�.���.�/��.�3*�.� %***
*5'�.��'5
) 533�� ��������,�"
1-. ������� ������������������������������������
(�����
The material balance method requires the totaling of all materials received at the plant and thensubtracting out all of the known losses or transfers of the material off-site (including finishedproduct and waste material). The difference is assumed to have been emitted to theatmosphere. The quantity received and the quantity lost or used should be for the same timeperiod, typically January 1 to December 31 for the year of the inventory (NPCA, 1995).Use Equation 8.5-9 for calculating emissions using the material balance approach.
Ex = Qr - Qp - Qrec - Qw - Qxi (8.5-9)
where:
Ex = Emissions of VOC or PM species x (lb/yr);Qr = Quantity of VOC or PM species x that is received as a raw material (lb/yr);Qp = Quantity of VOC or PM species x that is shipped out in the final product
(lb/yr);Qrec = Quantity of VOC or PM species x that is recovered by all methods (e.g.,
solvent recovery) (lb/yr);
������� ����� �� ��� ������������� ������
8.5-12 ���� ���� ��
����������3
��������������������������������������#����������������!�"�������������!����"��#!������������ �����������������#��&���������/��>�����"�����!������1��
� ?����#�$������"%���������!��������"����$��� **%***�� ��!����������#������-����
� @��������������������������!��"���������������!!����������"���"����!�"�����������������%�����!�����������������������������������!���������#���������������������!������"�������-������3/%***�� :
� The amount of ethylene glycol that was recovered by the facility’sdistillation system (Qrec) is 10,000 lb;
� Based on waste composition analyses, the amount of waste sentoff-site, and wastewater discharge rates, the facility estimates that theamount of ethylene glycol that was found in all wastes generatedduring the year (Qw) is 5,000 lb; and
� The amount of ethylene glycol that was found to be in the facility’sinventory at the end of the evaluation period (Qxi)���� �%***��
Qw = Quantity of VOC or PM species x that is contained in all waste generatedduring the evaluation period (e.g., wastewater, sludge, drum residue) (lb/yr);and
Qxi = Quantity of VOC or PM species x that remains in the raw material inventory(lb/yr).
The use of Equation 8.5-9 is demonstrated in Example 8.5-6.
1-/ �����������������������������������
Because vent or stack testing is relatively uncommon for paint and ink manufacturingfacilities, emissions test data for these plants are typically in the form of exposure monitoringresults. Industrial hygiene data may be used in conjunction with exhaust system flow rates tocalculate fugitive emissions from a room, floor, or building (NPCA, 1995). UseEquation 8.5-10 for calculating these emissions.
������ ������� ����� �� ��� �������������
8.5-13���� ���� ��
����������3������������
����������!����������#�������"����������������!������1
�� ) -����-����-������-��
) **%***���3/%***��� *%***����%***��� �%***
) %***�� ����������#�����,�"
Ex �
FR � 60 � OH � Cxt �
0.0026� Mx
1 � 106(8.5-10)
where:
Ex = Emissions of VOC or PM species x (lb/yr);FR = Flow rate through exhaust ventilation system (ft3/min);60 = 60 min/hr;OH = Hours per year that the exhaust system is operational (hr/yr);Cxt = Concentration of VOC or PM species x (ppmv or ft3/MMft 3);0.0026 = Molar volume of gas at 68�F (mole/ft3);Mx = Molecular weight of VOC or PM species x (lb/lb-mole); and1 * 106 = 1 * 106 ft3/MMft 3.
Example 8.5-7 illustrates the use of Equation 8.5-10.
VOC losses from certain operations (e.g., filling of containers) may also be measured byperforming a study using a gravimetric analysis such as American Society For Testing andMaterials (ASTM) Standard D2369, Test Method for Volatile Content of Coatings. Theoperation under evaluation could be simulated on a small scale, and VOC analysis would beconducted on samples taken before and after the simulated activity (EPA, 1992b).
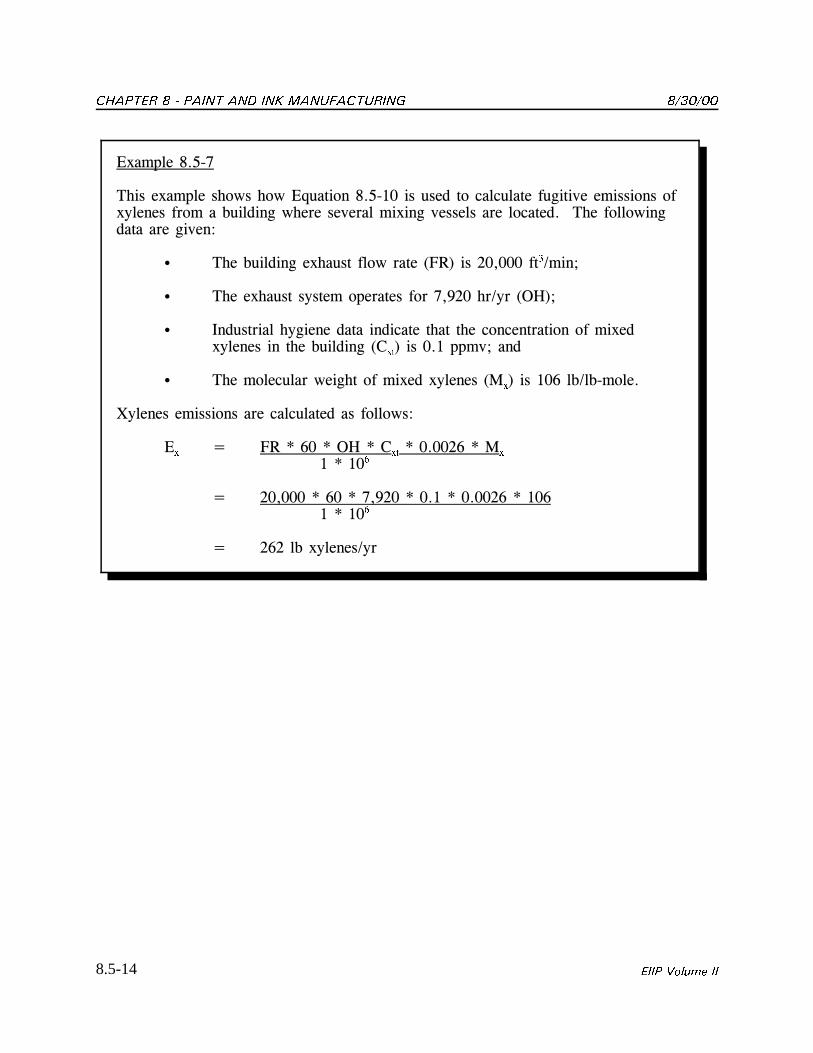
������� ����� �� ��� ������������� ������
8.5-14 ���� ���� ��
����������5
������������������������&��������� *����������������������!�#���$�������������!��������!"����� ������#����"����$�"��������#�$��������"���������������!�������#������"��#�$��1
� ���� ������#���������!����"�����(<������*%***�!� ,���:
� ����������������������"�����!�"�5%/�*��",�"���=�:
� ?�����"������#���������� ��������� ����� �����������"�������!��������������������� ������#������� ���* ����$:����
� ������������"����#����!����������������8��� ��� *3�� ,� �����
0������������������"����������������!������1
�� ) (<�.�3*�.��=�.�����.�***�3�.�8�
�.� *�
) �*%***�.�3*�.�5%/�*�.�* �.�***�3�.� *3 �.� *�
) �3��� ��������,�"
8.6-1���� ���� ��
5
4�����,���������24�����,�
������
The consistent use of standardized methods and procedures is essential in the compilation ofreliable emission inventories. QA and QC of an inventory is accomplished through a set ofprocedures that ensure the quality and reliability of data collection and analysis. Theseprocedures include the use of appropriate emission estimation techniques, applicable andreasonable assumptions, accuracy/logic checks of computer models, checks of calculations, anddata reliability checks. Figure 8.6-1 provides an example completeness checklist that could aidthe inventory preparer at a paint and ink manufacturing plant. Volume VI, QA Procedures, of theEIIP series of documents describes additional QA/QC methods and tools for performing theseprocedures.
Volume II, Chapter 1, Introduction to Stationary Point Source Emission Inventory Development,also presents recommended standard procedures to follow to ensure that the reported inventorydata are complete and accurate. This section discusses the use of QC checklists, QA/QCprocedures for specific emission estimation methods (e.g., emission factors), and the applicationof the Data Attribute Rating System (DARS).
5-+ ��������4�24�����������������������������������
����������������4���
5-+-+ ������� �������
The use of emission factors is straightforward when the relationship between process data andemissions is direct and relatively uncomplicated. When using emission factors, the user shouldbe aware of the quality indicator associated with the value. Emission factors published withinEPA documents and electronic tools have a quality rating applied to them. The lower the qualityindicator, the more likely that a given emission factor may not be representative of the sourcetype. When an emission factor for a specific source or category may not provide a reasonablyadequate emission estimate, it is always better to rely on actual stack test data, where available. The reliability and uncertainty of using emission factors as an emission estimation technique arediscussed in detail in the QA/QC section of Chapter 1 of this volume and Chapter 4 ofVolume VI.
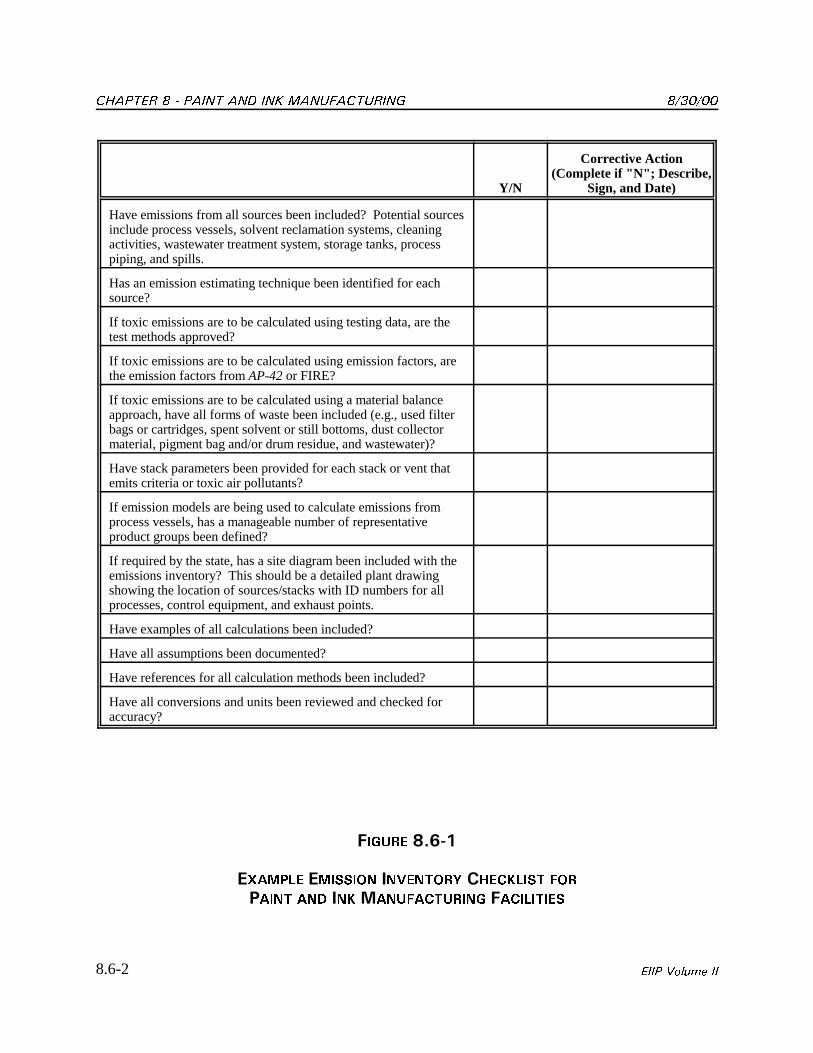
������� ����� �� ��� ������������� ������
8.6-2 ���� ���� ��
Y/N
Corrective Action(Complete if "N"; Describe,
Sign, and Date)
Have emissions from all sources been included? Potential sourcesinclude process vessels, solvent reclamation systems, cleaningactivities, wastewater treatment system, storage tanks, processpiping, and spills.
Has an emission estimating technique been identified for eachsource?
If toxic emissions are to be calculated using testing data, are thetest methods approved?
If toxic emissions are to be calculated using emission factors, arethe emission factors from AP-42 or FIRE?
If toxic emissions are to be calculated using a material balanceapproach, have all forms of waste been included (e.g., used filterbags or cartridges, spent solvent or still bottoms, dust collectormaterial, pigment bag and/or drum residue, and wastewater)?
Have stack parameters been provided for each stack or vent thatemits criteria or toxic air pollutants?
If emission models are being used to calculate emissions fromprocess vessels, has a manageable number of representativeproduct groups been defined?
If required by the state, has a site diagram been included with theemissions inventory? This should be a detailed plant drawingshowing the location of sources/stacks with ID numbers for allprocesses, control equipment, and exhaust points.
Have examples of all calculations been included?
Have all assumptions been documented?
Have references for all calculation methods been included?
Have all conversions and units been reviewed and checked foraccuracy?
������ �-50+
� ����� ������� ������ �������� ��� ��� �� ������������� ����������
������ ������� ����� �� ��� �������������
8.6-3���� ���� ��
5-+-" �������������
The level of effort for using models other than emission factors is related to the complexity of theequation, the types of data that must be collected, and the diversity of products manufactured at afacility. Typically, the use of emission models involves making one or more conservativeassumptions. As a result, their use may result in an overestimation of emissions. However, theaccuracy and reliability of models can be improved by ensuring that data collected for emissioncalculations (e.g., material speciation data) are of the highest possible quality.
5-+-. �������� (�����
Calculating emissions from a paint and ink manufacturing facility via a material (mass) balanceapproach appears to represent a straightforward approach to emissions estimations. However,few facilities track material usage and waste generation with the overall accuracy needed to makethe method work, and inaccuracies inherent to each material handling step often accumulate intolarge deviations. As emissions of specific materials are typically below 1.5 percent of grossconsumption, an error of only ±5.0 percent in any one step of the operation can significantlyskew emissions. Potential sources of error in the material balance calculation method include thefollowing:
� The delivery of raw materials at a paint and ink manufacturing facility is oftentracked by volume, not by weight. Since density will vary with temperature, theactual mass per unit volume of material delivered in the summer may be less thanthat delivered in the winter;
� Raw materials received by paint and ink facilities may potentially be used inhundreds or thousands of finished products. In order to complete the materialbalance, it is crucial that the exact quantity and speciation of each materialshipped off-site in product be known. For many facilities, it is extremelydifficult, or currently impossible, to accurately track the distribution of specificraw materials across their entire product line;
� The amount of raw material contained in waste must also be considered. Thismay involve precise analysis of the concentration of the material in question ineach waste stream; and
� Batch production of paint and ink often requires the manual addition of rawmaterials. Sometimes these additions are not accurately measured or recorded(NPCA, 1995).
5-+-/ ������
Stack or industrial hygiene tests must meet quality objectives. Test data must be reviewed toensure that the test was conducted under normal operating conditions, or under maximumoperating conditions in some states, and that it was generated according to an acceptablemethod for each pollutant of interest. Calculation and interpretation of accuracy for stacktesting methods are described in detail in Quality Assurance Handbook for Air Pollution
������� ����� �� ��� ������������� ������
8.6-4 ���� ���� ��
Measurements Systems: Volume III, Stationary Source Specific Methods (Interim Edition)(EPA, 1994b).
The acceptable criteria, limits, and values for each control parameter associated with manualsampling methods, such as dry gas meter calibration and leak rates, are summarized in tabularformat in the QA/QC section of Chapter 1 of this volume. QC procedures for all instrumentsused to continuously collect emissions data are similar. The primary control check forprecision of the continuous monitors is daily analysis of control standards.
5-" ����������(������������,�����&����'������
One measure of emission inventory data quality is the DARS score. Four examples are givenhere to illustrate DARS scoring using the preferred and alternative methods. DARS providesa numerical ranking on a scale of 0 to 1.0 for individual attributes of the emission factor andthe activity data. Each score is based on what is known about the factor and activity data,such as the specificity to the source category and the measurement technique employed. Thecomposite attribute score for the emissions estimate can be viewed as a statement of theconfidence that can be placed in the data. For a complete discussion of DARS and otherrating systems, see the QA Procedures (Volume VI, Chapter 4), and the QA/QC section ofVolume II, Chapter 1, Introduction to Stationary Point Source Emission InventoryDevelopment.
Each of the examples below is hypothetical. A range is given where appropriate to coverdifferent situations. Table 8.6-1 gives a set of scores for an estimate made with an AP-42emission factor. The activity data are assumed to be measured directly. Table 8.6-2 showsscores developed for the use of emission models. Tables 8.6-3 and 8.6-4 demonstrate scoresdetermined for material balance and testing data, respectively. The reader should note thatalthough the composite score for the material balance method is good, this technique will notpractically be applied or used by many paint and ink manufacturing facilities. Because fewfacilities track material usage and waste generation with the overall accuracy needed to makethe material balance approach work, use of emission factors and other emission models mayprovide the best choice when selecting an appropriate method for estimating emissions.
These examples are given as an illustration of the relative quality of each method. If thesame analysis were done for an actual site, the scores could be different but the relativeranking of methods should stay the same. Note, however, that if the source is not truly amember of the population used to develop the EPA correlation equations or the emissionfactors, these approaches are less appropriate and the DARS scores will drop.
If sufficient data are available, the uncertainty in the estimate should be evaluated. Qualitative and quantitative methods for conducting uncertainty analyses are described in theQA Procedures (Volume VI, Chapter 4).
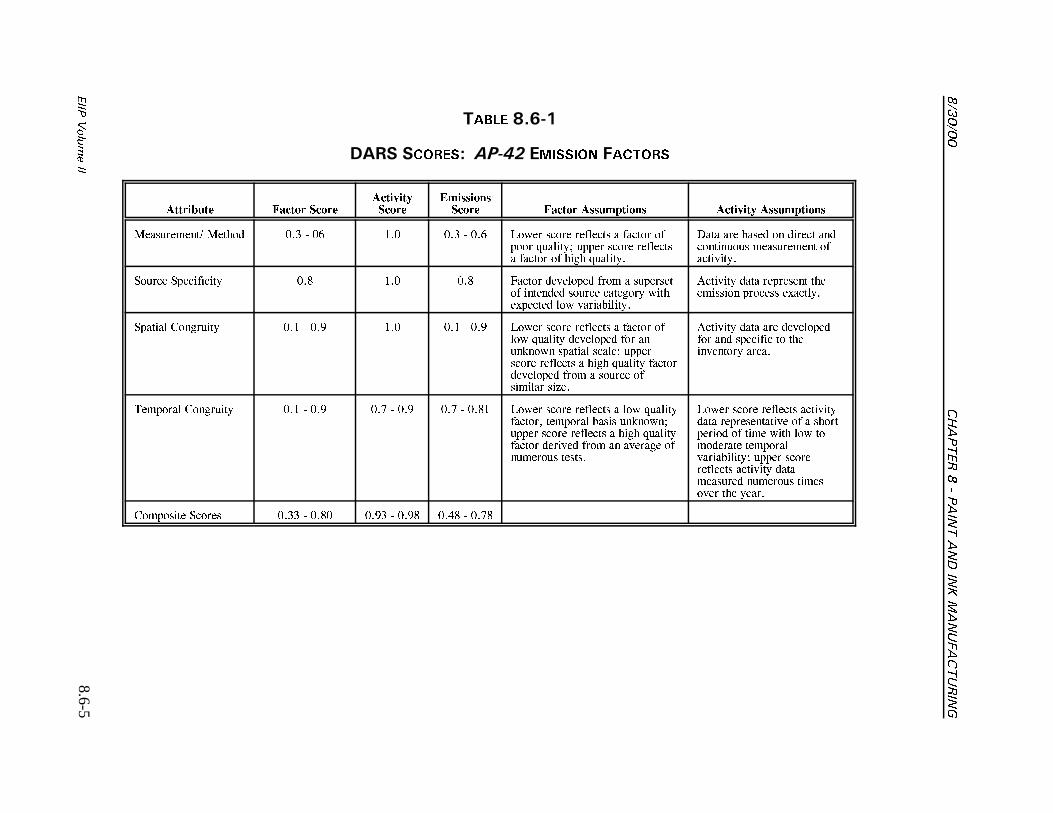
������
�������������� ����������������
8.6-5����
������
����� �-50+
���� ����� $#�%& ������� ������
��������� ���� ���������� ���
��������� ��� ���� ����������� ������� �����������
���������� ��� � ��� � �� ��� ��� � ��� � ��� �� �� ������� � ��� � �� � ������� ����� �� �� �������� ��� � � ���� �������
�� ��� !���� � ����� ���� ���� �� ���������� ����"���
# ���� #��������� ��$ ��� ��$ %�� � ��"�� ��� �� � � ������� � ������� � ���� ���� �� ����&����� � � "����!�����
'��"�� ��� �������� �������� � �� ���� �&�����
#����� ( ������ ��� � ��) ��� ��� � ��) � ��� �� �� ������� � ��� � �� � ������ ��"�� ��� � � ����*� �� ������ ������ ������� �� ������� � ���� ������ ��� ���"�� ��� �� � � � ���� �������� ��+��
'��"�� ��� ��� ��"�� ���� � ��� �������� ����"�� �� �����
,��� ��� ( ������ ��� � ��) ��- � ��) ��- � ��$� � ��� �� �� ������� � � � ��������� �. ��� ��� !���� ��*� �������� �� �� ������� � ���� ��������� � ����"�� �� � �� �"����� ������ �� ����
� ��� �� �� ������� ���"����� ����������"� � � �� ����� � � ��� ��� � � � ����� ��� ���"����!����� ����� �� ��������� ���"�� ����������� ����� �� ���� "�� �� �����
( �� ��� #� ��� ���� � ��$� ��)� � ��)$ ��/$ � ��-$
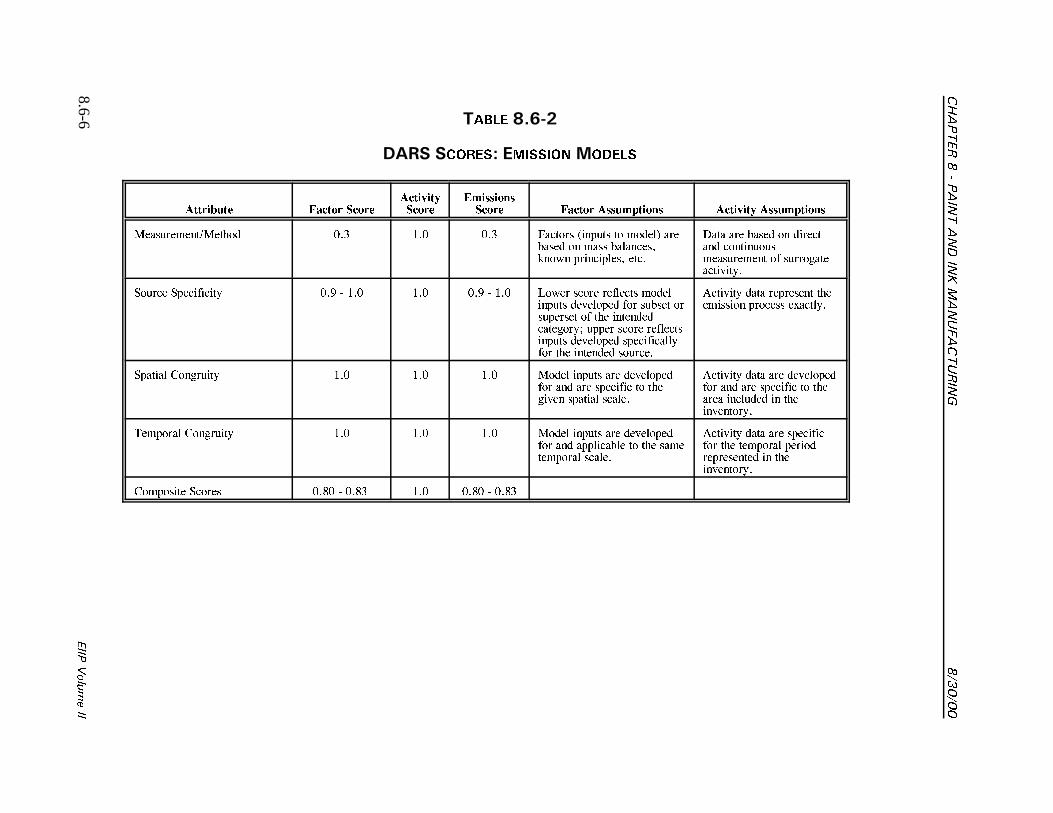
�������������� ����������������
������
8.6-6����
������
����� �-50"
���� ����� �������������
��������� ���� ���������� ���
��������� ��� ���� ����������� ������� �����������
������������� � ��� ��� ��� %�� �� 0����� � ���1 ���!���� � ���� !�������.*� �� ����������. ���
�� ��� !���� � �������� � ���� ������������ � ���� ������"���
# ���� #��������� ��) � ��� ��� ��) � ��� � ��� �� �� ������� � �������� ��"�� ��� � � ��!�� �������� � �� ����������� ��� ����� �� �� ������������ ��"�� ��� ������������� � �� ������� � �����
'��"�� ��� �������� �������� � �� ���� �&�����
#����� ( ������ ��� ��� ��� � ��� ����� ��� ��"�� ���� � ��� ��� �������� ����"�� ������ ������
'��"�� ��� ��� ��"�� ���� � ��� ��� �������� ������ �������� �� ����"�� ���
,��� ��� ( ������ ��� ��� ��� � ��� ����� ��� ��"�� ���� � ��� �������!�� �� ������� ��� ������
'��"�� ��� ��� ��������� � �� ��� ��� ���� ����������� �� ����"�� ���
( �� ��� #� ��� ��$� � ��$� ��� ��$� � ��$�
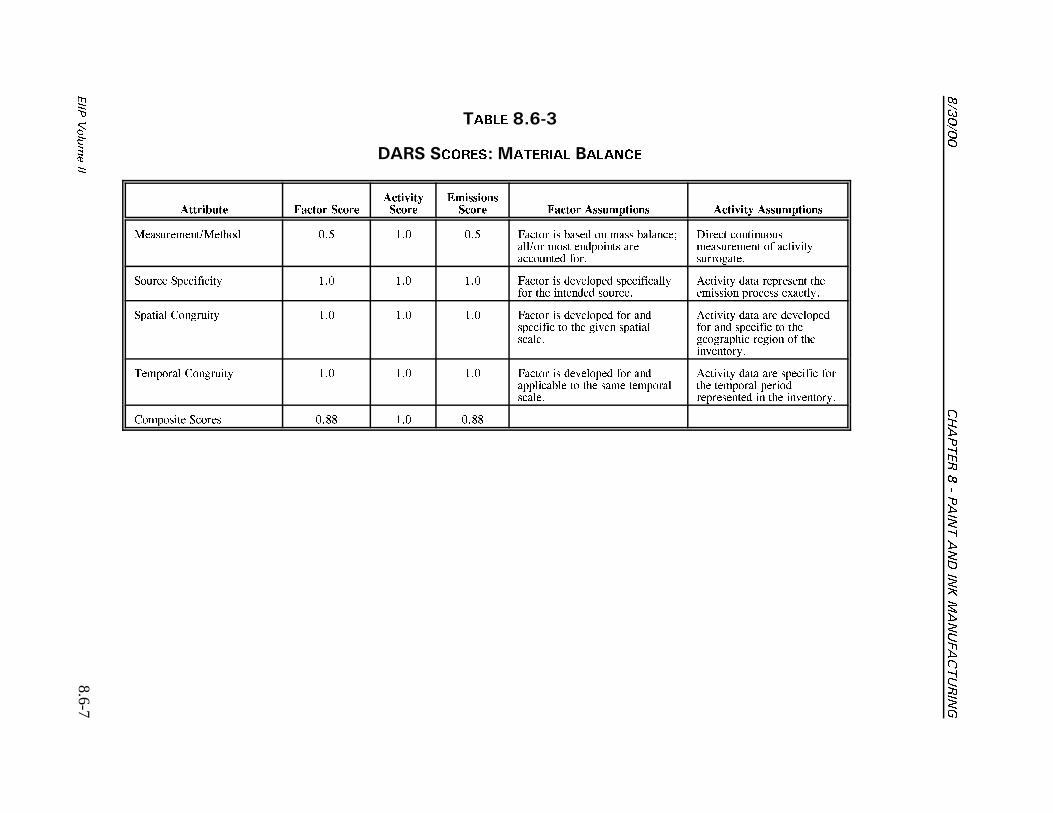
������
�������������� ����������������
8.6-7����
������
����� �-50.
���� ����� �������� (����
��������� ���� ���������� ���
��������� ��� ���� ����������� ������� �����������
������������� � ��2 ��� ��2 %�� � �� !���� � ���� !���������� � � � ���� ��� ������ ���� � ��
���� � ���� ������������ � ���"������ ����
# ���� #��������� ��� ��� ��� %�� � �� ��"�� ��� ������������� � �� ������� � �����
'��"�� ��� �������� �������� � �� ���� �&�����
#����� ( ������ ��� ��� ��� %�� � �� ��"�� ��� � � ����������� �� ��"�� ������������
'��"�� ��� ��� ��"�� ���� � ��� �������� ���� ������� ���� � � ����"�� ���
,��� ��� ( ������ ��� ��� ��� %�� � �� ��"�� ��� � � ����������!�� �� ���� ��� ���������
'��"�� ��� ��� �������� � ��� ��� ��� ���� ����������� �� �� ��"�� ���
( �� ��� #� ��� ��$$ ��� ��$$
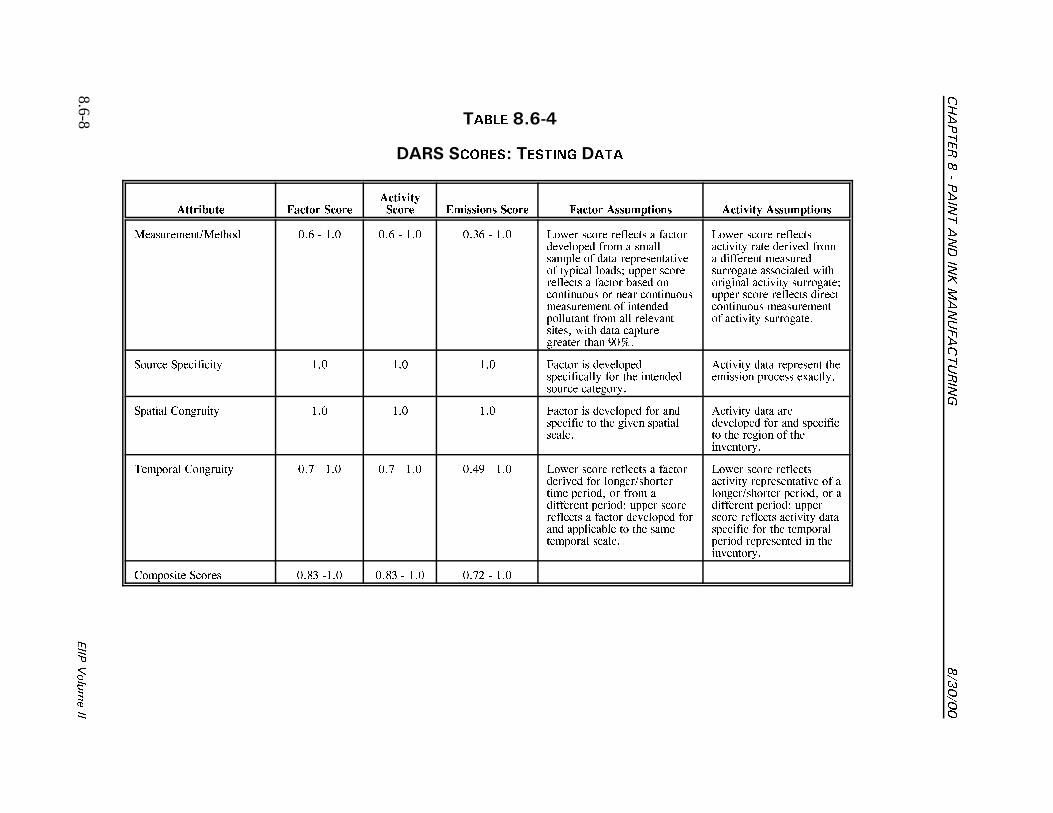
�������������� ����������������
������
8.6-8����
������
����� �-50/
���� ����� ������ ����
��������� ���� ���������� ��� ��������� ��� ���� ����������� ������� �����������
������������� � ��� � ��� ��� � ��� ���� � ��� � ��� �� �� ������� � ��� ���"�� ��� �� � � ����������� � ��� ����������"� � ������ � ���� ����� �� ��������� � ��� � !���� �� ���� �� � ���� � ���� ������������ � �������� ����� �� � ��� ����"������. ��� ��� ������������ ��� )�3�
� ��� �� �� ����������"�� ��� ����"�� �� �� �������� ������������ ��� ��� ����� ��� ������� ���"�� ���� ��������� �� �� ������� ������ ���� �� ���������� � ���"�� ���� ����
# ���� #��������� ��� ��� ��� %�� � �� ��"�� ��������������� � � �� �������� ���� ���� ���
'��"�� ��� �������� �������� � �� ���� �&�����
#����� ( ������ ��� ��� ��� %�� � �� ��"�� ��� � � ����������� �� ��"�� ������������
'��"�� ��� �����"�� ��� � � ��� �������� �� ���� � � ����"�� ���
,��� ��� ( ������ ��- � ��� ��- � ��� ��/) � ��� � ��� �� �� ������� � ��� �����"�� � � � ������ ������ ���� �. � �� � ��������� ���� �� ����� �� ��������� � ��� � ��"�� ��� � ���� �������!�� �� ������� ��� ������
� ��� �� �� ����������"�� ����������"� � �� ������ ��� ���� �. � ��������� ���� �� ������� �� ������� ���"�� ����������� � � �� ��� ������� � ���������� �� ����"�� ���
( �� ��� #� ��� ��$� ���� ��$� � ��� ��-4 � ���
8.7-1���� ���� ��
7
����������� ��������This section describes the methods and codes available for characterizing emissions frompaint and ink manufacturing facilities. Using the EPA’s Source Classification Codes (SCCs)and the Aerometric Information Retrieval System (AIRS) control device codes will assureconsistent categorization and coding will result in greater uniformity among inventories. TheSCCs are the building blocks on which point source emissions are structured. Each SCCrepresents a unique process or function within a source category that is logically associatedwith an emission point.
The procedures described here will assist the reader when preparing data for input to theAerometric Information Retrieval System (AIRS) or a similar database management system. For example, the use of the SCCs provided in Table 8.7-1 is recommended for describingpaint and ink manufacturing operations. The codes presented here are currently in use, butmay change based on further refinement of the codes. Refer to the EPA’s TechnologyTransfer Network (TTN) internet site for the most recent list of SCCs for paint and inkmanufacturing operations. This data is accessible athttp://www.epa.gov/ttn/chief/scccodes.html.
7-+ �����������������������
SCCs for paint and ink manufacturing operations are presented in Table 8.7-1. A briefdescription of each source description listed in the table is given below.
7-+-+ ��� �� �� ����������� ��������
Traditional paint and ink manufacturing consists of preassembly and premix, pigmentgrinding/dispersing, product finishing/blending, and product filling/packaging. The SCCs thatcorrespond to these activities appear in Table 8.7-1 under the "Paint Manufacture" and "InkManufacture" source descriptions. This source category also includes SCCs for cleaning ofequipment.
7-+-" ������ ����������
Emissions from the solvent reclamation process occur from loading solvent into distillationequipment, operation of the distillation equipment, and spillage. The codes in Table 8.7-1under the "Waste Solvent Recovery Operations" process description are recommended todescribe these emissions.
������� ����� �� ��� ������������� ������
8.7-2 ���� ���� ��
7-+-. �������� �������
In paint and ink manufacturing facilities, solvents are typically stored in fixed roof storagetanks. The SCCs that correspond to emissions of various types of organic solvents arepresented in Table 8.7-1 under the "Fixed Roof Tank" process description.
7-" ����������������������
Control device codes applicable to the paint and ink manufacturing industry are presented inTable 8.7-2. These should be used to enter the type of applicable emission control device intothe AIRS Facility Subsystem (AFS). The "099" control code may be used for miscellaneouscontrol devices that do not have a unique identification code.
Note: At the time of publication, these control device codes were under review by the EPA. The reader should consult the EPA for the most current list of codes.
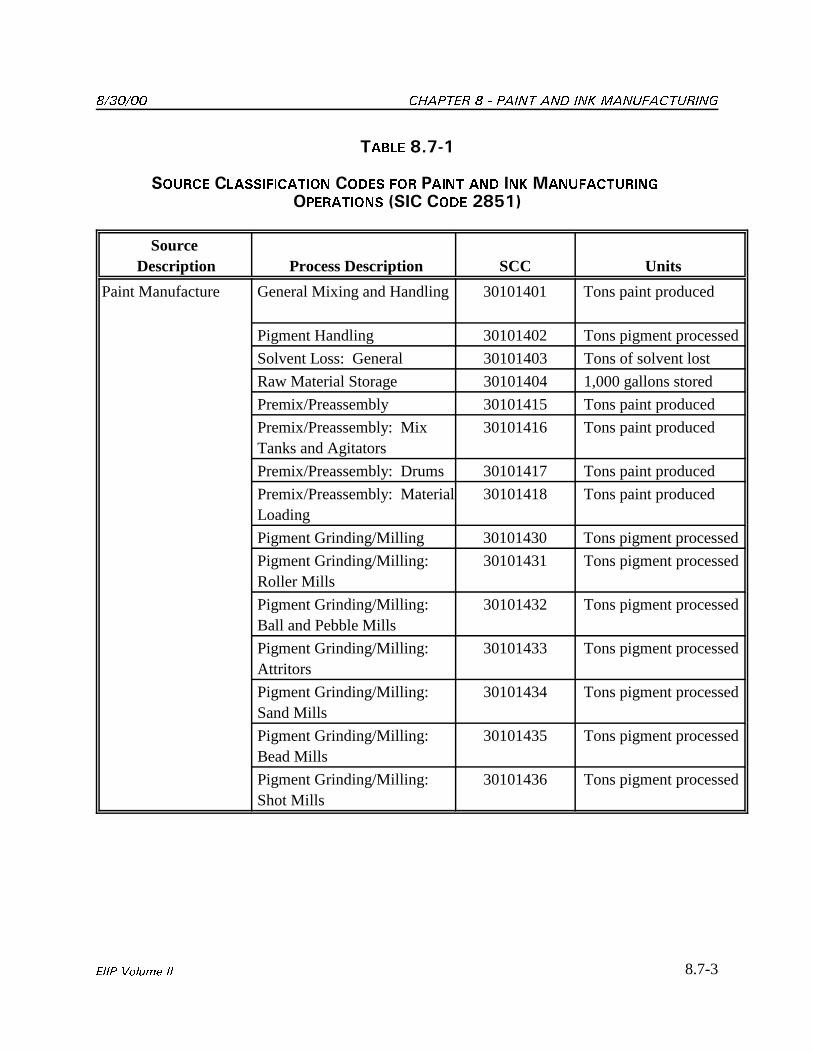
������ ������� ����� �� ��� �������������
8.7-3���� ���� ��
����� �-70+
������ ������������ ���� ��� ��� �� �������������
��������� &�� ��� "�1+'
Source Description Process Description SCC Units
Paint Manufacture General Mixing and Handling 30101401 Tons paint produced
Pigment Handling 30101402 Tons pigment processed
Solvent Loss: General 30101403 Tons of solvent lost
Raw Material Storage 30101404 1,000 gallons stored
Premix/Preassembly 30101415 Tons paint produced
Premix/Preassembly: MixTanks and Agitators
30101416 Tons paint produced
Premix/Preassembly: Drums 30101417 Tons paint produced
Premix/Preassembly: MaterialLoading
30101418 Tons paint produced
Pigment Grinding/Milling 30101430 Tons pigment processed
Pigment Grinding/Milling: Roller Mills
30101431 Tons pigment processed
Pigment Grinding/Milling: Ball and Pebble Mills
30101432 Tons pigment processed
Pigment Grinding/Milling: Attritors
30101433 Tons pigment processed
Pigment Grinding/Milling: Sand Mills
30101434 Tons pigment processed
Pigment Grinding/Milling: Bead Mills
30101435 Tons pigment processed
Pigment Grinding/Milling: Shot Mills
30101436 Tons pigment processed
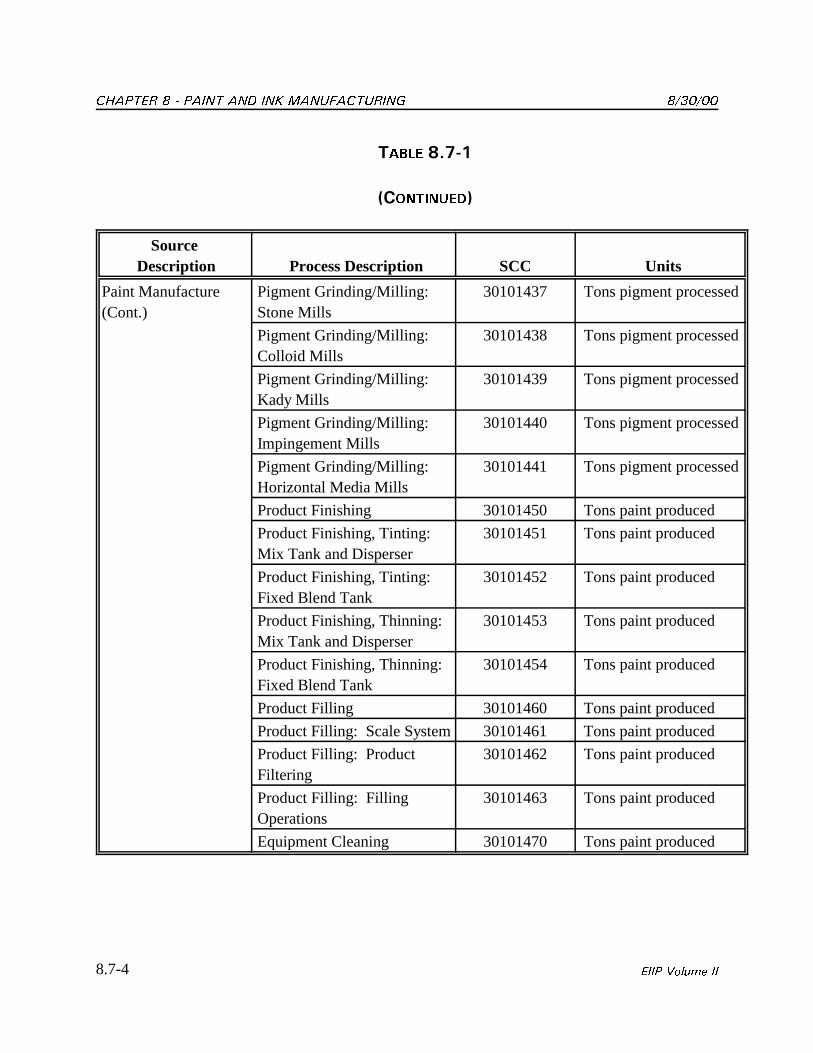
������� ����� �� ��� ������������� ������
8.7-4 ���� ���� ��
����� �-70+
&������'
Source Description Process Description SCC Units
Paint Manufacture(Cont.)
Pigment Grinding/Milling: Stone Mills
30101437 Tons pigment processed
Pigment Grinding/Milling: Colloid Mills
30101438 Tons pigment processed
Pigment Grinding/Milling: Kady Mills
30101439 Tons pigment processed
Pigment Grinding/Milling: Impingement Mills
30101440 Tons pigment processed
Pigment Grinding/Milling: Horizontal Media Mills
30101441 Tons pigment processed
Product Finishing 30101450 Tons paint produced
Product Finishing, Tinting: Mix Tank and Disperser
30101451 Tons paint produced
Product Finishing, Tinting: Fixed Blend Tank
30101452 Tons paint produced
Product Finishing, Thinning: Mix Tank and Disperser
30101453 Tons paint produced
Product Finishing, Thinning: Fixed Blend Tank
30101454 Tons paint produced
Product Filling 30101460 Tons paint produced
Product Filling: Scale System 30101461 Tons paint produced
Product Filling: ProductFiltering
30101462 Tons paint produced
Product Filling: FillingOperations
30101463 Tons paint produced
Equipment Cleaning 30101470 Tons paint produced
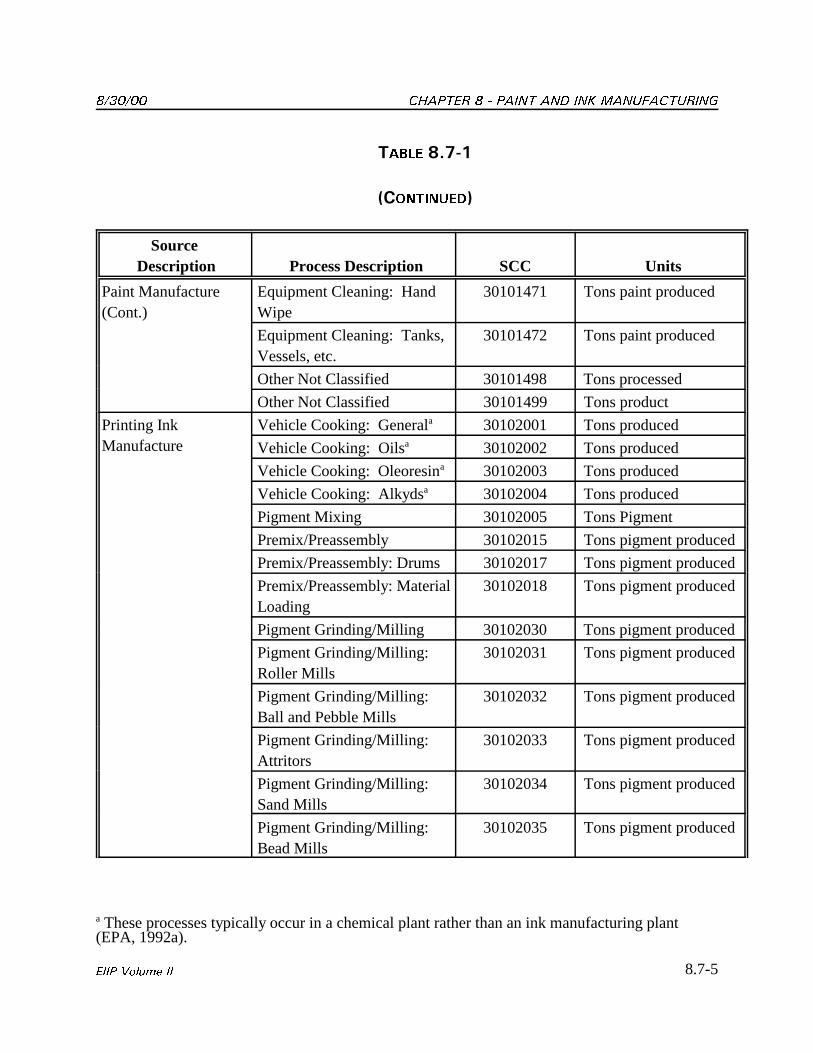
������ ������� ����� �� ��� �������������
a These processes typically occur in a chemical plant rather than an ink manufacturing plant(EPA, 1992a).
8.7-5���� ���� ��
����� �-70+
&������'
Source Description Process Description SCC Units
Paint Manufacture(Cont.)
Equipment Cleaning: HandWipe
30101471 Tons paint produced
Equipment Cleaning: Tanks,Vessels, etc.
30101472 Tons paint produced
Other Not Classified 30101498 Tons processed
Other Not Classified 30101499 Tons product
Printing InkManufacture
Vehicle Cooking: Generala 30102001 Tons produced
Vehicle Cooking: Oilsa 30102002 Tons produced
Vehicle Cooking: Oleoresina 30102003 Tons produced
Vehicle Cooking: Alkydsa 30102004 Tons produced
Pigment Mixing 30102005 Tons Pigment
Premix/Preassembly 30102015 Tons pigment produced
Premix/Preassembly: Drums 30102017 Tons pigment produced
Premix/Preassembly: MaterialLoading
30102018 Tons pigment produced
Pigment Grinding/Milling 30102030 Tons pigment produced
Pigment Grinding/Milling:Roller Mills
30102031 Tons pigment produced
Pigment Grinding/Milling:Ball and Pebble Mills
30102032 Tons pigment produced
Pigment Grinding/Milling:Attritors
30102033 Tons pigment produced
Pigment Grinding/Milling:Sand Mills
30102034 Tons pigment produced
Pigment Grinding/Milling:Bead Mills
30102035 Tons pigment produced
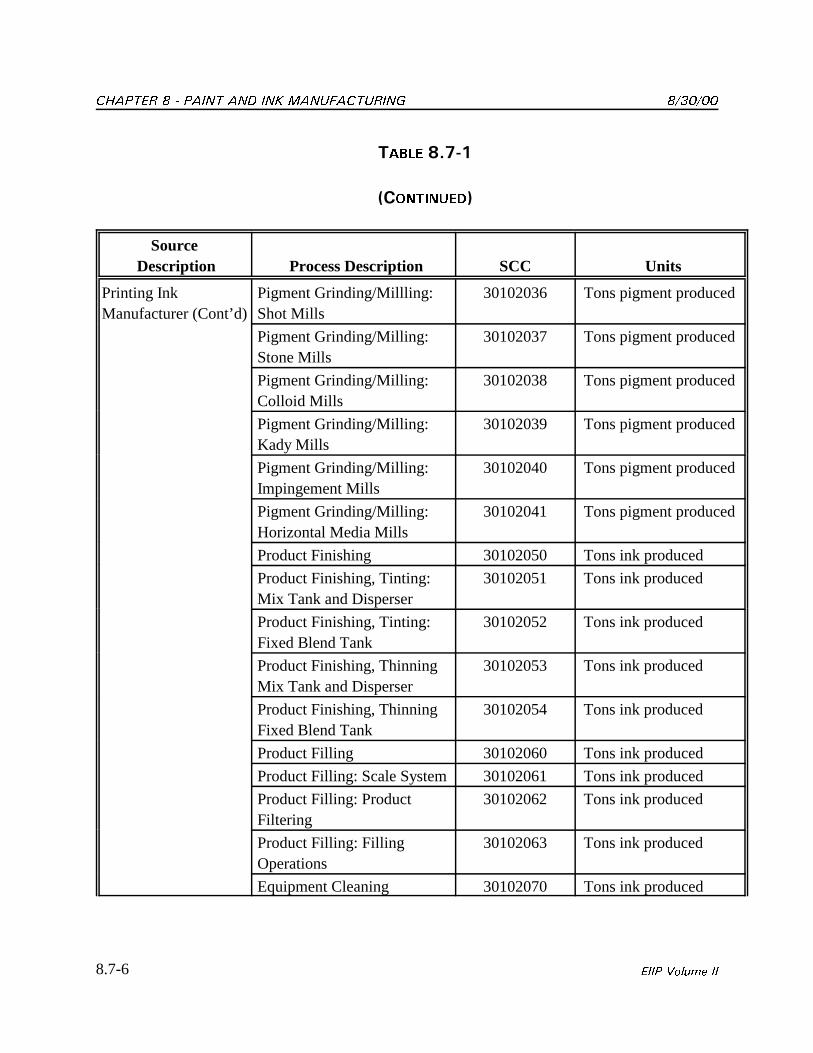
������� ����� �� ��� ������������� ������
8.7-6 ���� ���� ��
����� �-70+
&������'
Source Description Process Description SCC Units
Printing InkManufacturer (Cont’d)
Pigment Grinding/Millling:Shot Mills
30102036 Tons pigment produced
Pigment Grinding/Milling:Stone Mills
30102037 Tons pigment produced
Pigment Grinding/Milling:Colloid Mills
30102038 Tons pigment produced
Pigment Grinding/Milling:Kady Mills
30102039 Tons pigment produced
Pigment Grinding/Milling:Impingement Mills
30102040 Tons pigment produced
Pigment Grinding/Milling:Horizontal Media Mills
30102041 Tons pigment produced
Product Finishing 30102050 Tons ink produced
Product Finishing, Tinting:Mix Tank and Disperser
30102051 Tons ink produced
Product Finishing, Tinting:Fixed Blend Tank
30102052 Tons ink produced
Product Finishing, ThinningMix Tank and Disperser
30102053 Tons ink produced
Product Finishing, ThinningFixed Blend Tank
30102054 Tons ink produced
Product Filling 30102060 Tons ink produced
Product Filling: Scale System 30102061 Tons ink produced
Product Filling: ProductFiltering
30102062 Tons ink produced
Product Filling: FillingOperations
30102063 Tons ink produced
Equipment Cleaning 30102070 Tons ink produced
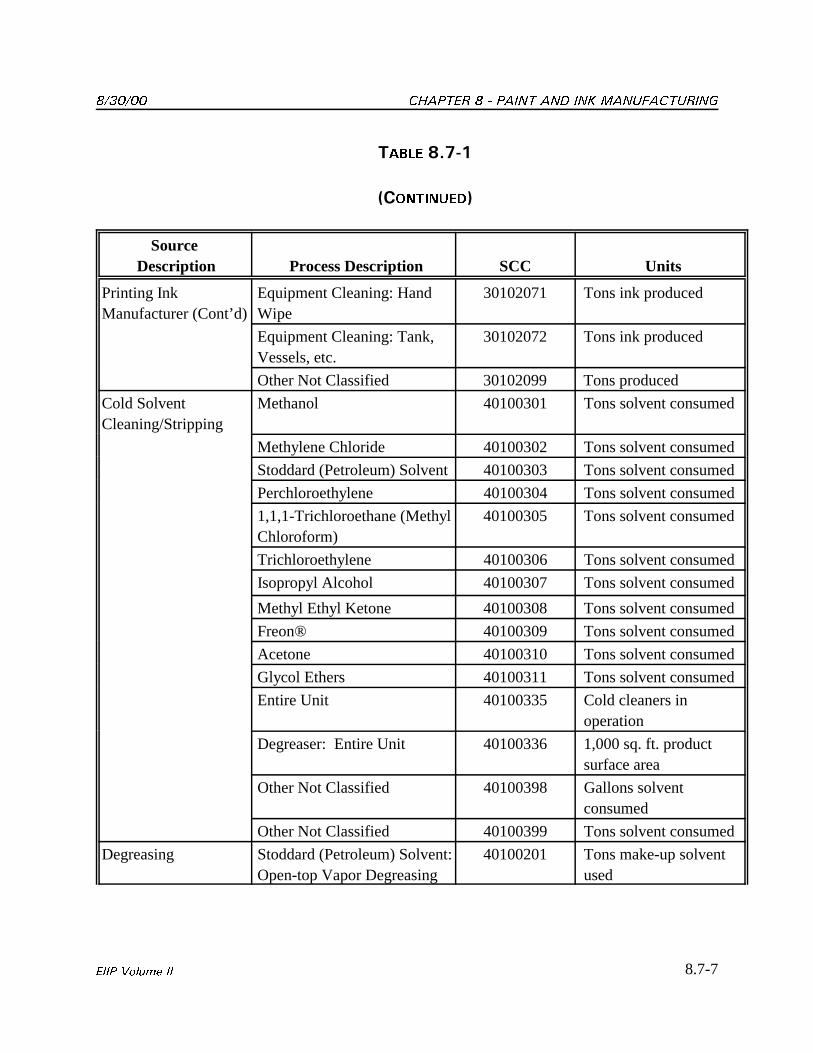
������ ������� ����� �� ��� �������������
8.7-7���� ���� ��
����� �-70+
&������'
Source Description Process Description SCC Units
Printing InkManufacturer (Cont’d)
Equipment Cleaning: HandWipe
30102071 Tons ink produced
Equipment Cleaning: Tank,Vessels, etc.
30102072 Tons ink produced
Other Not Classified 30102099 Tons produced
Cold SolventCleaning/Stripping
Methanol 40100301 Tons solvent consumed
Methylene Chloride 40100302 Tons solvent consumed
Stoddard (Petroleum) Solvent 40100303 Tons solvent consumed
Perchloroethylene 40100304 Tons solvent consumed
1,1,1-Trichloroethane (MethylChloroform)
40100305 Tons solvent consumed
Trichloroethylene 40100306 Tons solvent consumed
Isopropyl Alcohol 40100307 Tons solvent consumed
Methyl Ethyl Ketone 40100308 Tons solvent consumed
Freon® 40100309 Tons solvent consumed
Acetone 40100310 Tons solvent consumed
Glycol Ethers 40100311 Tons solvent consumed
Entire Unit 40100335 Cold cleaners inoperation
Degreaser: Entire Unit 40100336 1,000 sq. ft. productsurface area
Other Not Classified 40100398 Gallons solventconsumed
Other Not Classified 40100399 Tons solvent consumed
Degreasing Stoddard (Petroleum) Solvent: Open-top Vapor Degreasing
40100201 Tons make-up solventused
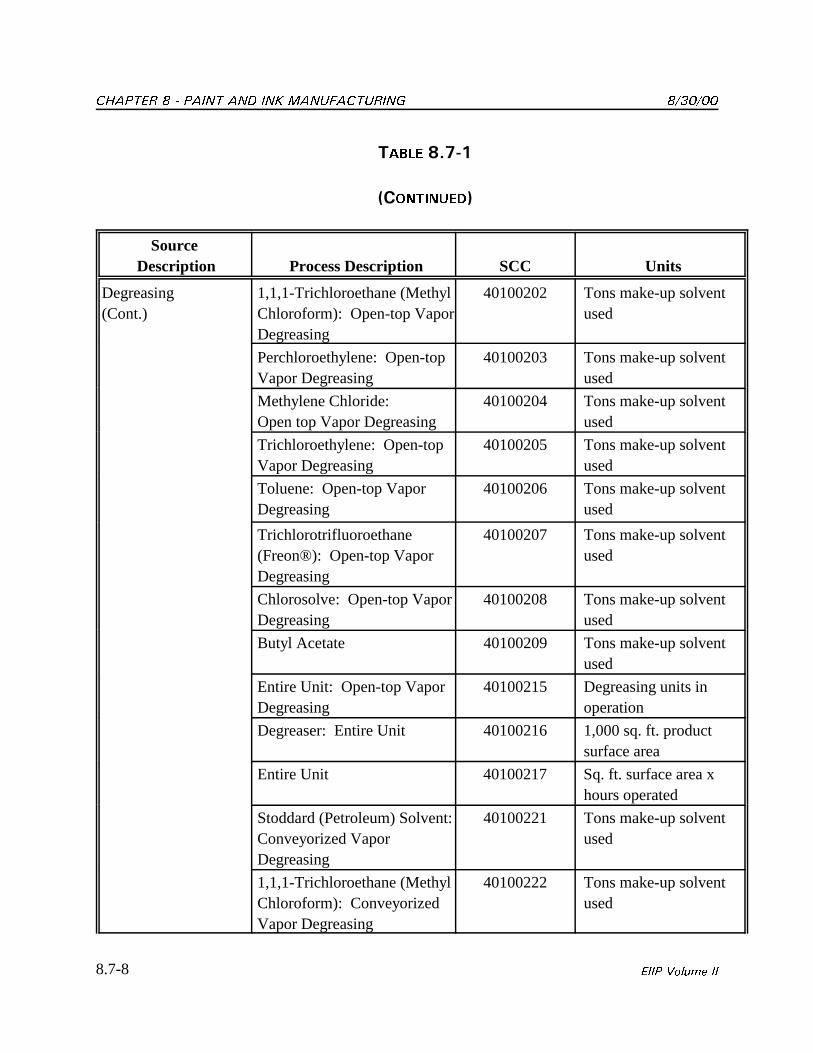
������� ����� �� ��� ������������� ������
8.7-8 ���� ���� ��
����� �-70+
&������'
Source Description Process Description SCC Units
Degreasing(Cont.)
1,1,1-Trichloroethane (MethylChloroform): Open-top VaporDegreasing
40100202 Tons make-up solventused
Perchloroethylene: Open-topVapor Degreasing
40100203 Tons make-up solventused
Methylene Chloride: Open top Vapor Degreasing
40100204 Tons make-up solventused
Trichloroethylene: Open-topVapor Degreasing
40100205 Tons make-up solventused
Toluene: Open-top VaporDegreasing
40100206 Tons make-up solventused
Trichlorotrifluoroethane(Freon®): Open-top VaporDegreasing
40100207 Tons make-up solventused
Chlorosolve: Open-top VaporDegreasing
40100208 Tons make-up solventused
Butyl Acetate 40100209 Tons make-up solventused
Entire Unit: Open-top VaporDegreasing
40100215 Degreasing units inoperation
Degreaser: Entire Unit 40100216 1,000 sq. ft. productsurface area
Entire Unit 40100217 Sq. ft. surface area xhours operated
Stoddard (Petroleum) Solvent: Conveyorized VaporDegreasing
40100221 Tons make-up solventused
1,1,1-Trichloroethane (MethylChloroform): ConveyorizedVapor Degreasing
40100222 Tons make-up solventused
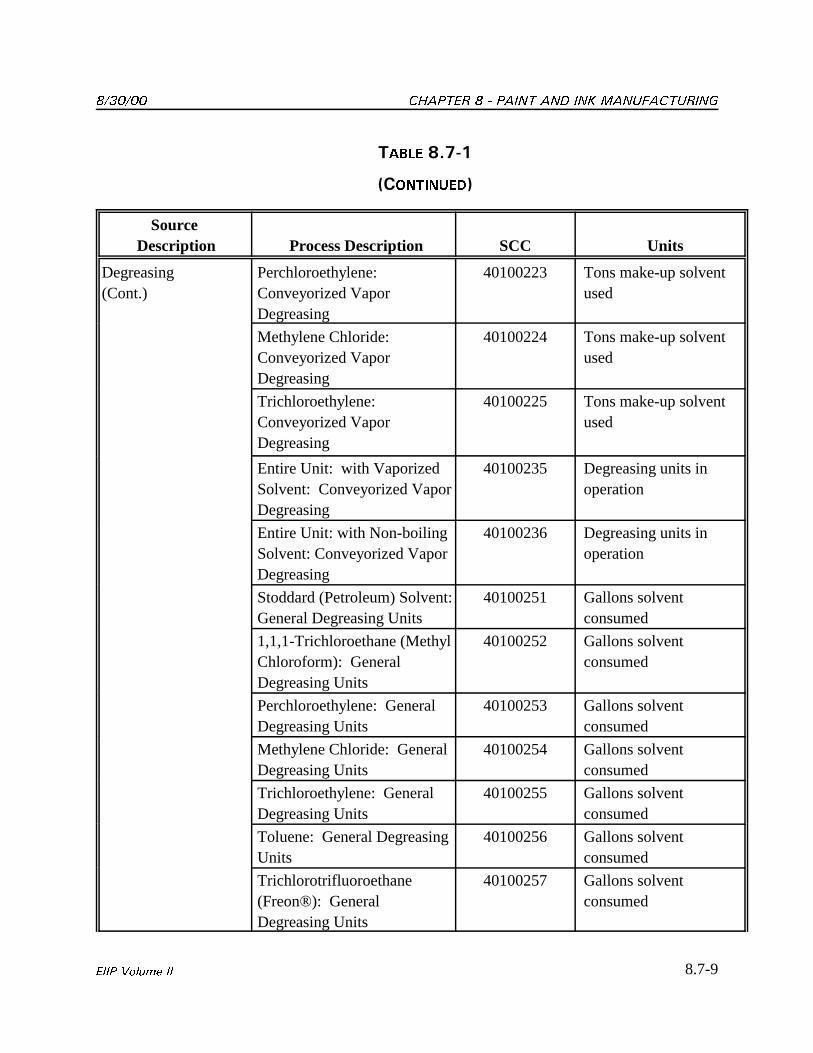
������ ������� ����� �� ��� �������������
8.7-9���� ���� ��
����� �-70+
&������'
Source Description Process Description SCC Units
Degreasing(Cont.)
Perchloroethylene: Conveyorized VaporDegreasing
40100223 Tons make-up solventused
Methylene Chloride: Conveyorized VaporDegreasing
40100224 Tons make-up solventused
Trichloroethylene: Conveyorized VaporDegreasing
40100225 Tons make-up solventused
Entire Unit: with VaporizedSolvent: Conveyorized VaporDegreasing
40100235 Degreasing units inoperation
Entire Unit: with Non-boilingSolvent: Conveyorized VaporDegreasing
40100236 Degreasing units inoperation
Stoddard (Petroleum) Solvent: General Degreasing Units
40100251 Gallons solventconsumed
1,1,1-Trichloroethane (MethylChloroform): GeneralDegreasing Units
40100252 Gallons solventconsumed
Perchloroethylene: GeneralDegreasing Units
40100253 Gallons solventconsumed
Methylene Chloride: GeneralDegreasing Units
40100254 Gallons solventconsumed
Trichloroethylene: GeneralDegreasing Units
40100255 Gallons solventconsumed
Toluene: General DegreasingUnits
40100256 Gallons solventconsumed
Trichlorotrifluoroethane(Freon®): GeneralDegreasing Units
40100257 Gallons solventconsumed
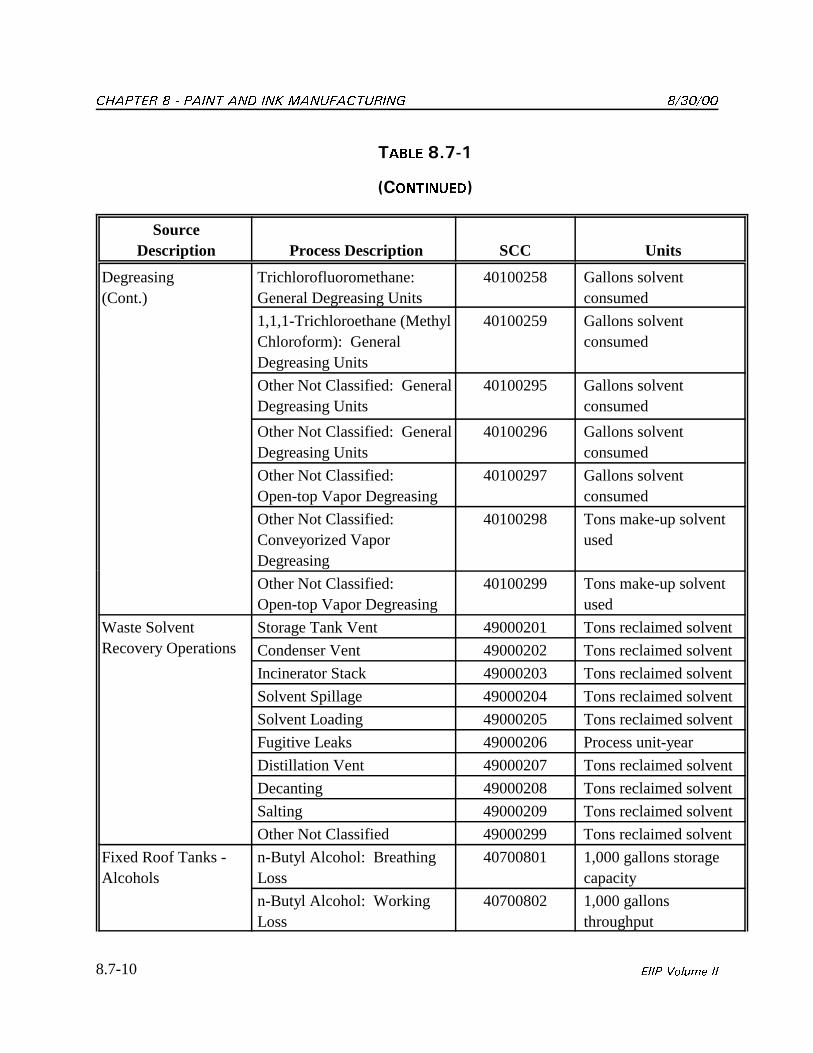
������� ����� �� ��� ������������� ������
8.7-10 ���� ���� ��
����� �-70+
&������'
SourceDescription Process Description SCC Units
Degreasing(Cont.)
Trichlorofluoromethane: General Degreasing Units
40100258 Gallons solventconsumed
1,1,1-Trichloroethane (MethylChloroform): GeneralDegreasing Units
40100259 Gallons solventconsumed
Other Not Classified: GeneralDegreasing Units
40100295 Gallons solventconsumed
Other Not Classified: GeneralDegreasing Units
40100296 Gallons solventconsumed
Other Not Classified: Open-top Vapor Degreasing
40100297 Gallons solventconsumed
Other Not Classified: Conveyorized VaporDegreasing
40100298 Tons make-up solventused
Other Not Classified: Open-top Vapor Degreasing
40100299 Tons make-up solventused
Waste SolventRecovery Operations
Storage Tank Vent 49000201 Tons reclaimed solvent
Condenser Vent 49000202 Tons reclaimed solvent
Incinerator Stack 49000203 Tons reclaimed solvent
Solvent Spillage 49000204 Tons reclaimed solvent
Solvent Loading 49000205 Tons reclaimed solvent
Fugitive Leaks 49000206 Process unit-year
Distillation Vent 49000207 Tons reclaimed solvent
Decanting 49000208 Tons reclaimed solvent
Salting 49000209 Tons reclaimed solvent
Other Not Classified 49000299 Tons reclaimed solvent
Fixed Roof Tanks -Alcohols
n-Butyl Alcohol: BreathingLoss
40700801 1,000 gallons storagecapacity
n-Butyl Alcohol: WorkingLoss
40700802 1,000 gallonsthroughput
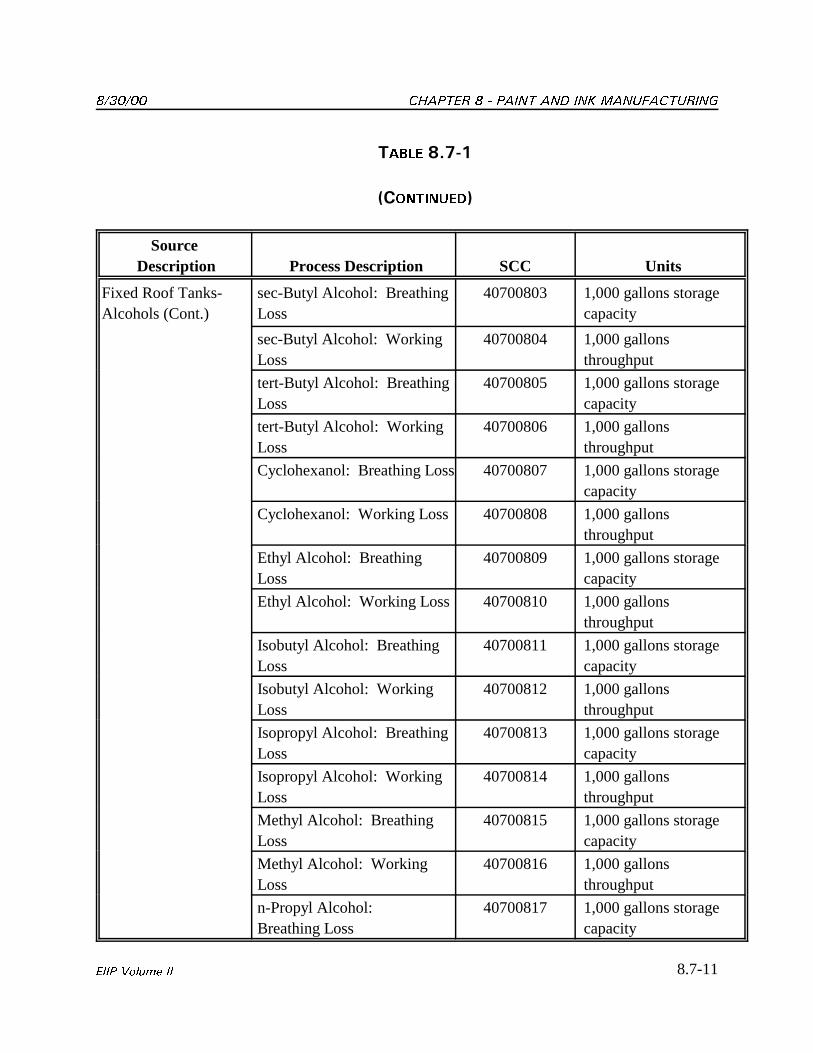
������ ������� ����� �� ��� �������������
8.7-11���� ���� ��
����� �-70+
&������'
Source Description Process Description SCC Units
Fixed Roof Tanks-Alcohols (Cont.)
sec-Butyl Alcohol: BreathingLoss
40700803 1,000 gallons storagecapacity
sec-Butyl Alcohol: WorkingLoss
40700804 1,000 gallonsthroughput
tert-Butyl Alcohol: BreathingLoss
40700805 1,000 gallons storagecapacity
tert-Butyl Alcohol: WorkingLoss
40700806 1,000 gallonsthroughput
Cyclohexanol: Breathing Loss 40700807 1,000 gallons storagecapacity
Cyclohexanol: Working Loss 40700808 1,000 gallonsthroughput
Ethyl Alcohol: BreathingLoss
40700809 1,000 gallons storagecapacity
Ethyl Alcohol: Working Loss 40700810 1,000 gallonsthroughput
Isobutyl Alcohol: BreathingLoss
40700811 1,000 gallons storagecapacity
Isobutyl Alcohol: WorkingLoss
40700812 1,000 gallonsthroughput
Isopropyl Alcohol: BreathingLoss
40700813 1,000 gallons storagecapacity
Isopropyl Alcohol: WorkingLoss
40700814 1,000 gallonsthroughput
Methyl Alcohol: BreathingLoss
40700815 1,000 gallons storagecapacity
Methyl Alcohol: WorkingLoss
40700816 1,000 gallonsthroughput
n-Propyl Alcohol:Breathing Loss
40700817 1,000 gallons storagecapacity
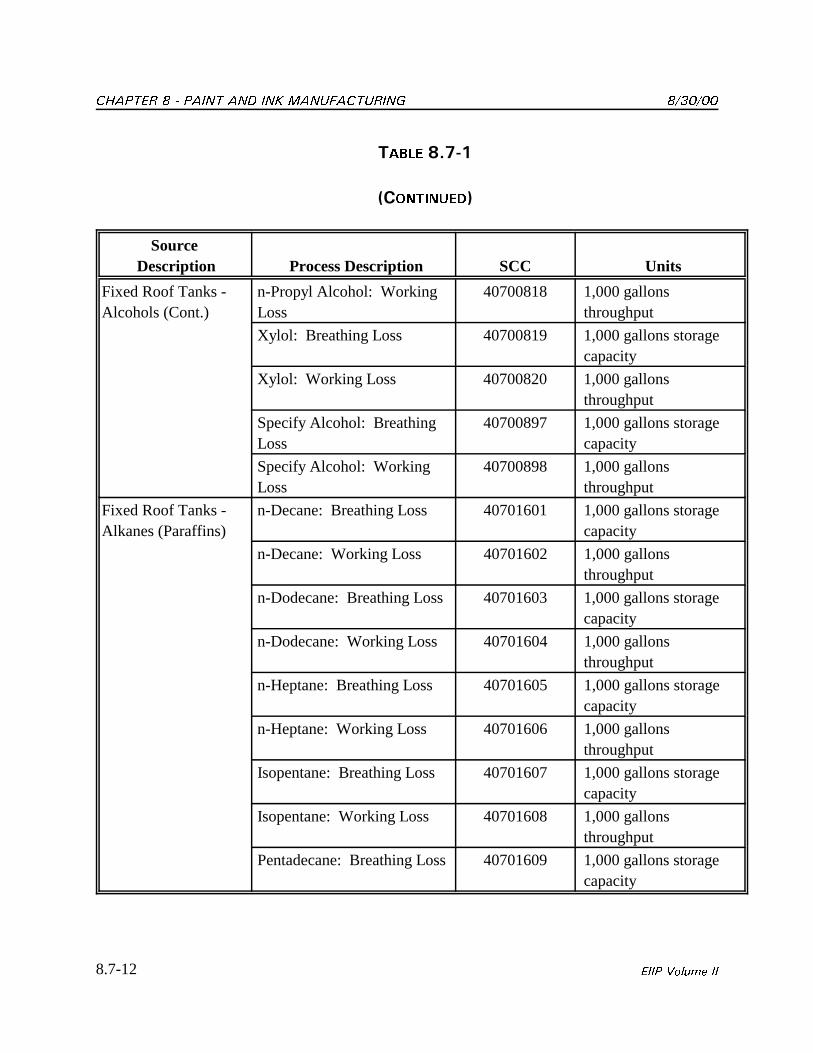
������� ����� �� ��� ������������� ������
8.7-12 ���� ���� ��
����� �-70+
&������'
Source Description Process Description SCC Units
Fixed Roof Tanks -Alcohols (Cont.)
n-Propyl Alcohol: WorkingLoss
40700818 1,000 gallonsthroughput
Xylol: Breathing Loss 40700819 1,000 gallons storagecapacity
Xylol: Working Loss 40700820 1,000 gallonsthroughput
Specify Alcohol: BreathingLoss
40700897 1,000 gallons storagecapacity
Specify Alcohol: WorkingLoss
40700898 1,000 gallonsthroughput
Fixed Roof Tanks -Alkanes (Paraffins)
n-Decane: Breathing Loss 40701601 1,000 gallons storagecapacity
n-Decane: Working Loss 40701602 1,000 gallonsthroughput
n-Dodecane: Breathing Loss 40701603 1,000 gallons storagecapacity
n-Dodecane: Working Loss 40701604 1,000 gallonsthroughput
n-Heptane: Breathing Loss 40701605 1,000 gallons storagecapacity
n-Heptane: Working Loss 40701606 1,000 gallonsthroughput
Isopentane: Breathing Loss 40701607 1,000 gallons storagecapacity
Isopentane: Working Loss 40701608 1,000 gallonsthroughput
Pentadecane: Breathing Loss 40701609 1,000 gallons storagecapacity
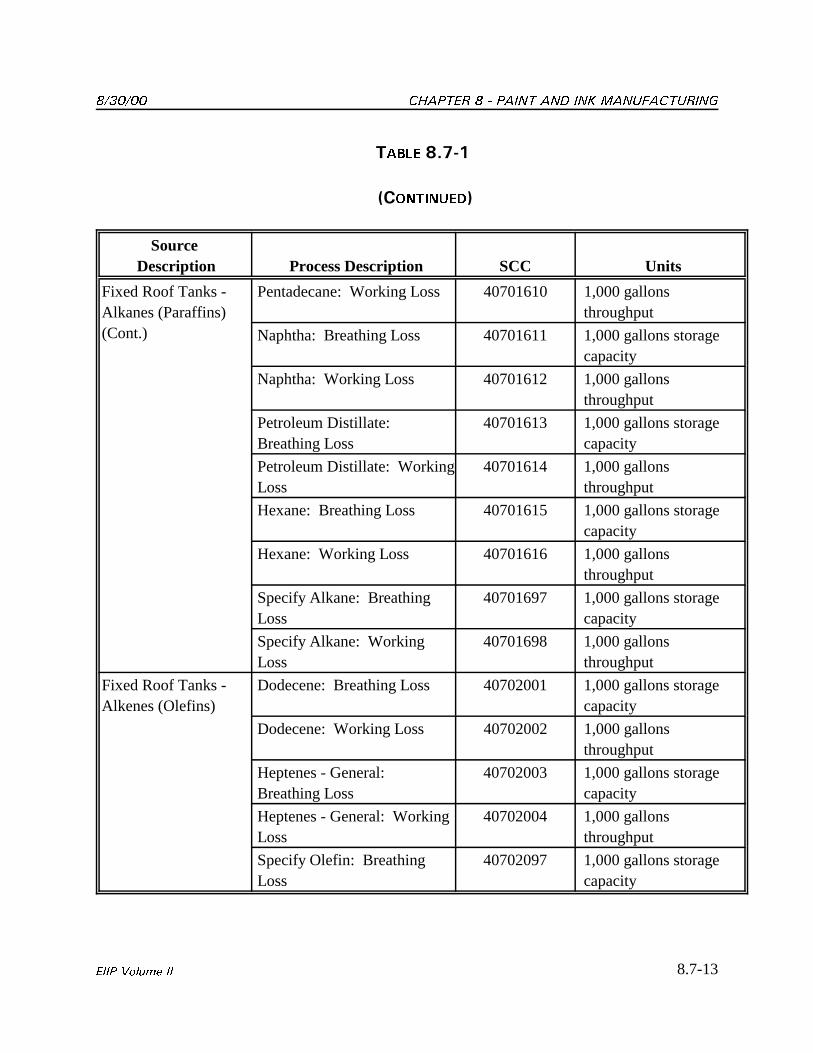
������ ������� ����� �� ��� �������������
8.7-13���� ���� ��
����� �-70+
&������'
Source Description Process Description SCC Units
Fixed Roof Tanks -Alkanes (Paraffins)(Cont.)
Pentadecane: Working Loss 40701610 1,000 gallonsthroughput
Naphtha: Breathing Loss 40701611 1,000 gallons storagecapacity
Naphtha: Working Loss 40701612 1,000 gallonsthroughput
Petroleum Distillate: Breathing Loss
40701613 1,000 gallons storagecapacity
Petroleum Distillate: WorkingLoss
40701614 1,000 gallonsthroughput
Hexane: Breathing Loss 40701615 1,000 gallons storagecapacity
Hexane: Working Loss 40701616 1,000 gallonsthroughput
Specify Alkane: BreathingLoss
40701697 1,000 gallons storagecapacity
Specify Alkane: WorkingLoss
40701698 1,000 gallonsthroughput
Fixed Roof Tanks -Alkenes (Olefins)
Dodecene: Breathing Loss 40702001 1,000 gallons storagecapacity
Dodecene: Working Loss 40702002 1,000 gallonsthroughput
Heptenes - General: Breathing Loss
40702003 1,000 gallons storagecapacity
Heptenes - General: WorkingLoss
40702004 1,000 gallonsthroughput
Specify Olefin: BreathingLoss
40702097 1,000 gallons storagecapacity
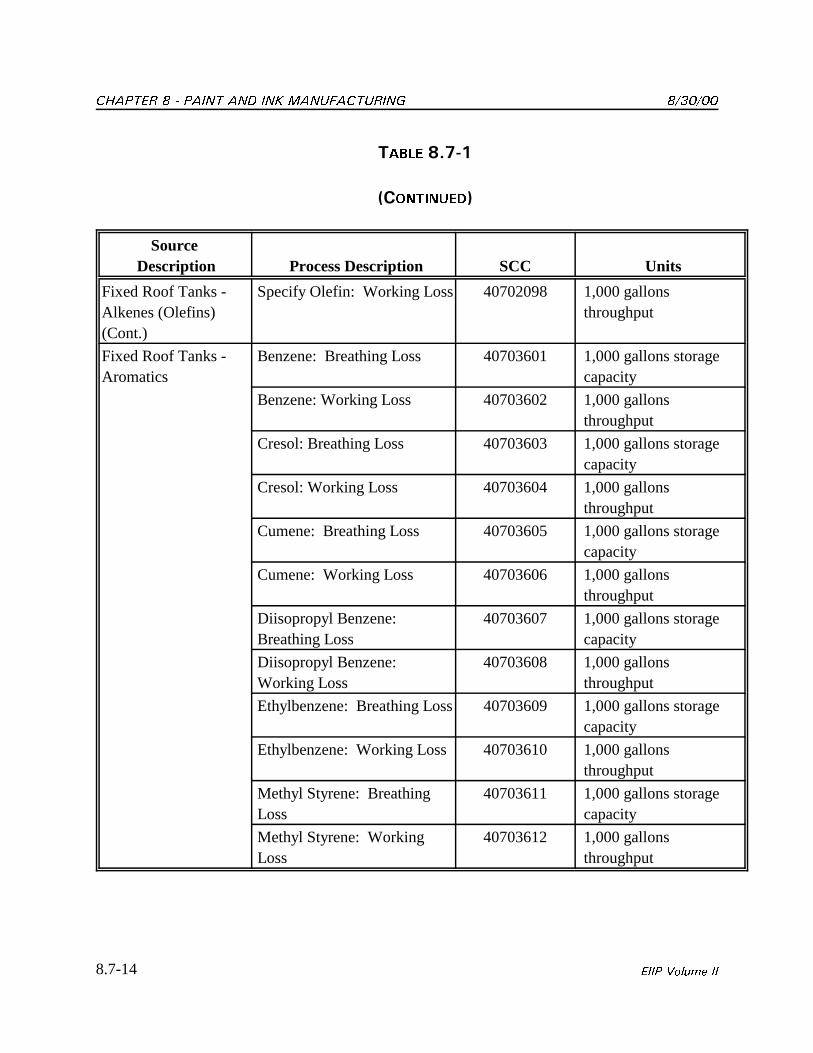
������� ����� �� ��� ������������� ������
8.7-14 ���� ���� ��
����� �-70+
&������'
Source Description Process Description SCC Units
Fixed Roof Tanks -Alkenes (Olefins)(Cont.)
Specify Olefin: Working Loss 40702098 1,000 gallonsthroughput
Fixed Roof Tanks -Aromatics
Benzene: Breathing Loss 40703601 1,000 gallons storagecapacity
Benzene: Working Loss 40703602 1,000 gallonsthroughput
Cresol: Breathing Loss 40703603 1,000 gallons storagecapacity
Cresol: Working Loss 40703604 1,000 gallonsthroughput
Cumene: Breathing Loss 40703605 1,000 gallons storagecapacity
Cumene: Working Loss 40703606 1,000 gallonsthroughput
Diisopropyl Benzene: Breathing Loss
40703607 1,000 gallons storagecapacity
Diisopropyl Benzene: Working Loss
40703608 1,000 gallonsthroughput
Ethylbenzene: Breathing Loss 40703609 1,000 gallons storagecapacity
Ethylbenzene: Working Loss 40703610 1,000 gallonsthroughput
Methyl Styrene: BreathingLoss
40703611 1,000 gallons storagecapacity
Methyl Styrene: WorkingLoss
40703612 1,000 gallonsthroughput
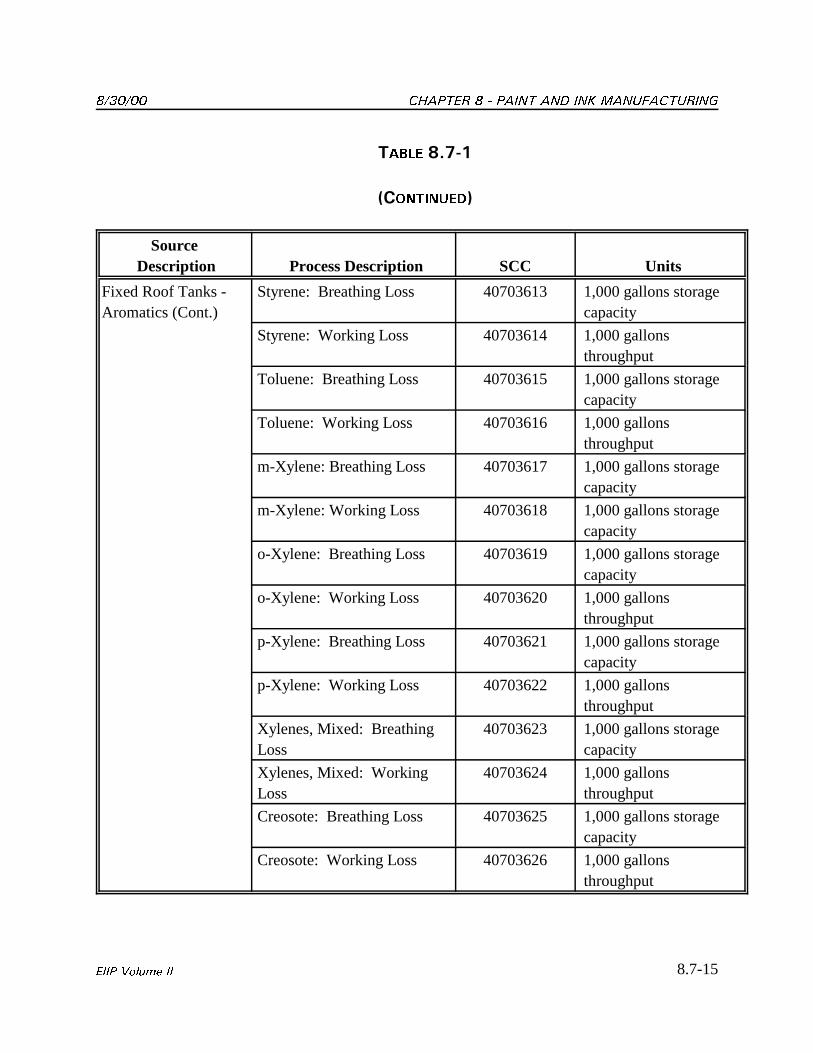
������ ������� ����� �� ��� �������������
8.7-15���� ���� ��
����� �-70+
&������'
Source Description Process Description SCC Units
Fixed Roof Tanks -Aromatics (Cont.)
Styrene: Breathing Loss 40703613 1,000 gallons storagecapacity
Styrene: Working Loss 40703614 1,000 gallonsthroughput
Toluene: Breathing Loss 40703615 1,000 gallons storagecapacity
Toluene: Working Loss 40703616 1,000 gallonsthroughput
m-Xylene: Breathing Loss 40703617 1,000 gallons storagecapacity
m-Xylene: Working Loss 40703618 1,000 gallons storagecapacity
o-Xylene: Breathing Loss 40703619 1,000 gallons storagecapacity
o-Xylene: Working Loss 40703620 1,000 gallonsthroughput
p-Xylene: Breathing Loss 40703621 1,000 gallons storagecapacity
p-Xylene: Working Loss 40703622 1,000 gallonsthroughput
Xylenes, Mixed: BreathingLoss
40703623 1,000 gallons storagecapacity
Xylenes, Mixed: WorkingLoss
40703624 1,000 gallonsthroughput
Creosote: Breathing Loss 40703625 1,000 gallons storagecapacity
Creosote: Working Loss 40703626 1,000 gallonsthroughput
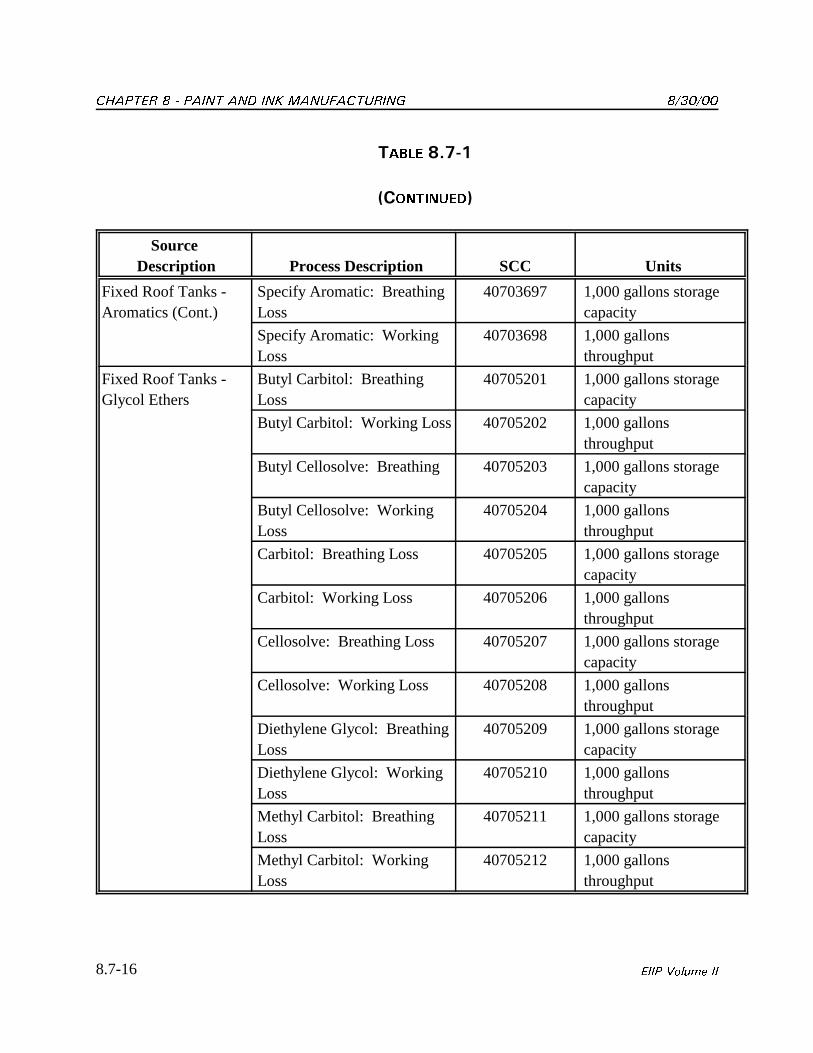
������� ����� �� ��� ������������� ������
8.7-16 ���� ���� ��
����� �-70+
&������'
Source Description Process Description SCC Units
Fixed Roof Tanks -Aromatics (Cont.)
Specify Aromatic: BreathingLoss
40703697 1,000 gallons storagecapacity
Specify Aromatic: WorkingLoss
40703698 1,000 gallonsthroughput
Fixed Roof Tanks -Glycol Ethers
Butyl Carbitol: BreathingLoss
40705201 1,000 gallons storagecapacity
Butyl Carbitol: Working Loss 40705202 1,000 gallonsthroughput
Butyl Cellosolve: Breathing 40705203 1,000 gallons storagecapacity
Butyl Cellosolve: WorkingLoss
40705204 1,000 gallonsthroughput
Carbitol: Breathing Loss 40705205 1,000 gallons storagecapacity
Carbitol: Working Loss 40705206 1,000 gallonsthroughput
Cellosolve: Breathing Loss 40705207 1,000 gallons storagecapacity
Cellosolve: Working Loss 40705208 1,000 gallonsthroughput
Diethylene Glycol: BreathingLoss
40705209 1,000 gallons storagecapacity
Diethylene Glycol: WorkingLoss
40705210 1,000 gallonsthroughput
Methyl Carbitol: BreathingLoss
40705211 1,000 gallons storagecapacity
Methyl Carbitol: WorkingLoss
40705212 1,000 gallonsthroughput
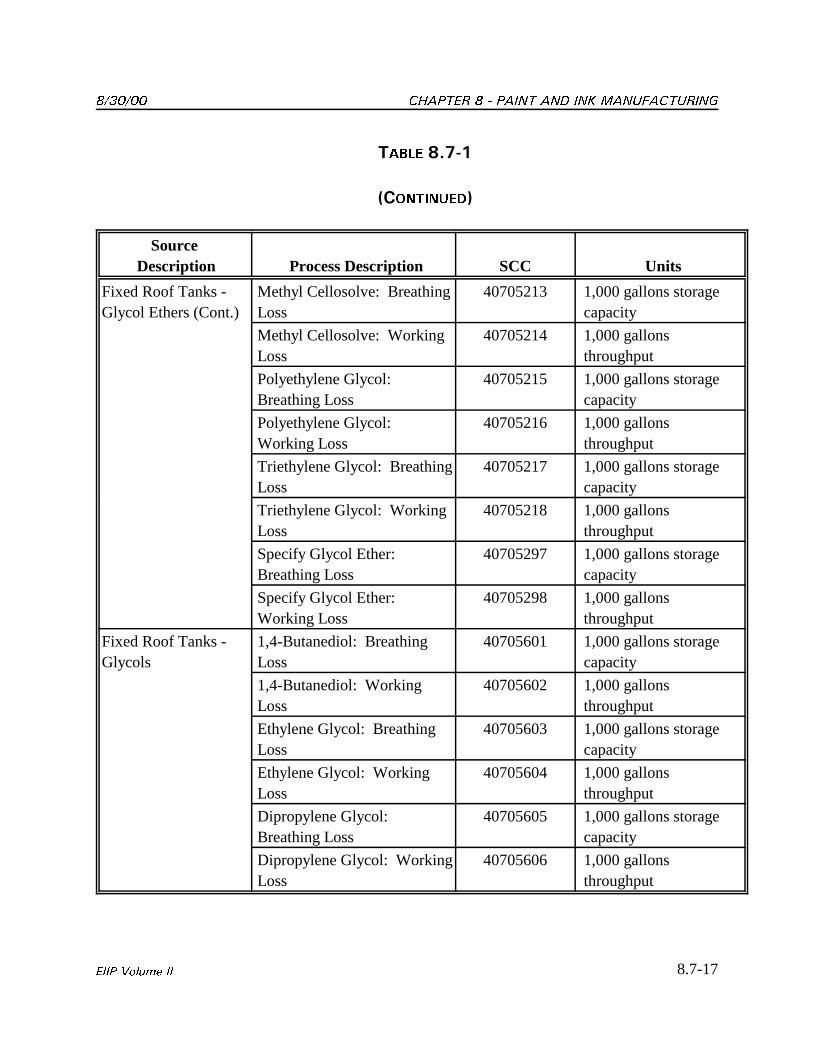
������ ������� ����� �� ��� �������������
8.7-17���� ���� ��
����� �-70+
&������'
Source Description Process Description SCC Units
Fixed Roof Tanks -Glycol Ethers (Cont.)
Methyl Cellosolve: BreathingLoss
40705213 1,000 gallons storagecapacity
Methyl Cellosolve: WorkingLoss
40705214 1,000 gallonsthroughput
Polyethylene Glycol: Breathing Loss
40705215 1,000 gallons storagecapacity
Polyethylene Glycol: Working Loss
40705216 1,000 gallonsthroughput
Triethylene Glycol: BreathingLoss
40705217 1,000 gallons storagecapacity
Triethylene Glycol: WorkingLoss
40705218 1,000 gallonsthroughput
Specify Glycol Ether: Breathing Loss
40705297 1,000 gallons storagecapacity
Specify Glycol Ether: Working Loss
40705298 1,000 gallonsthroughput
Fixed Roof Tanks -Glycols
1,4-Butanediol: BreathingLoss
40705601 1,000 gallons storagecapacity
1,4-Butanediol: WorkingLoss
40705602 1,000 gallonsthroughput
Ethylene Glycol: BreathingLoss
40705603 1,000 gallons storagecapacity
Ethylene Glycol: WorkingLoss
40705604 1,000 gallonsthroughput
Dipropylene Glycol: Breathing Loss
40705605 1,000 gallons storagecapacity
Dipropylene Glycol: WorkingLoss
40705606 1,000 gallonsthroughput
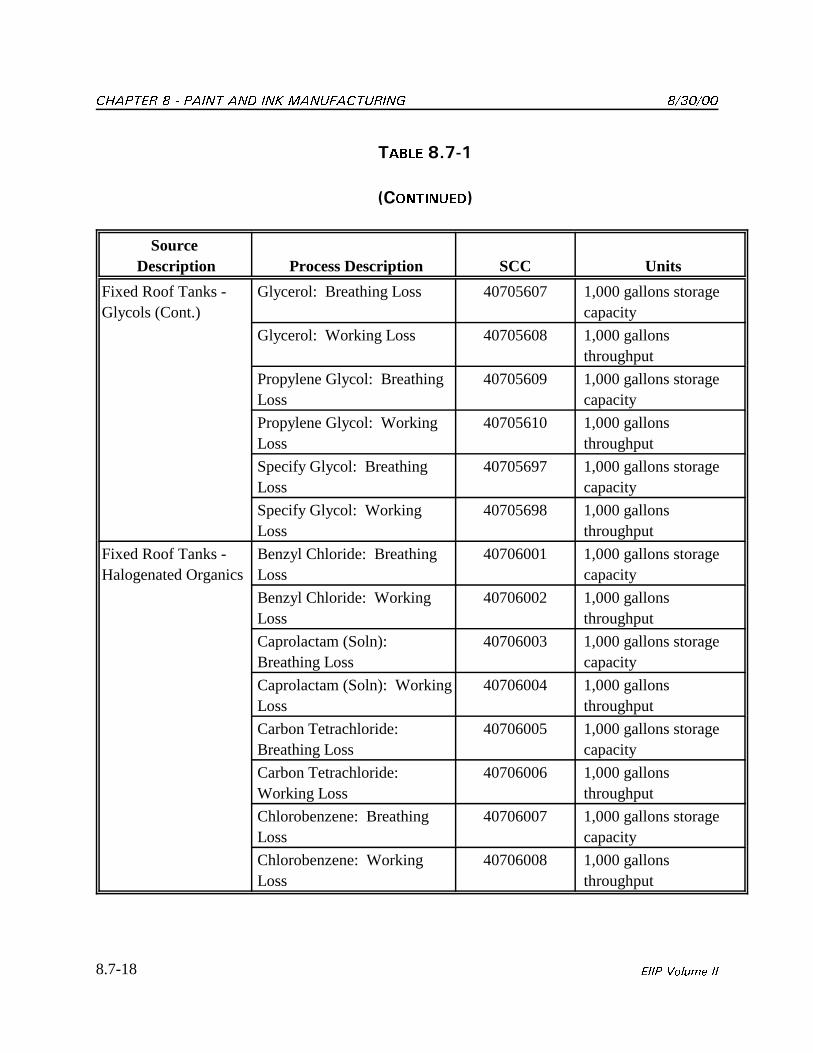
������� ����� �� ��� ������������� ������
8.7-18 ���� ���� ��
����� �-70+
&������'
Source Description Process Description SCC Units
Fixed Roof Tanks -Glycols (Cont.)
Glycerol: Breathing Loss 40705607 1,000 gallons storagecapacity
Glycerol: Working Loss 40705608 1,000 gallonsthroughput
Propylene Glycol: BreathingLoss
40705609 1,000 gallons storagecapacity
Propylene Glycol: WorkingLoss
40705610 1,000 gallonsthroughput
Specify Glycol: BreathingLoss
40705697 1,000 gallons storagecapacity
Specify Glycol: WorkingLoss
40705698 1,000 gallonsthroughput
Fixed Roof Tanks -Halogenated Organics
Benzyl Chloride: BreathingLoss
40706001 1,000 gallons storagecapacity
Benzyl Chloride: WorkingLoss
40706002 1,000 gallonsthroughput
Caprolactam (Soln): Breathing Loss
40706003 1,000 gallons storagecapacity
Caprolactam (Soln): WorkingLoss
40706004 1,000 gallonsthroughput
Carbon Tetrachloride: Breathing Loss
40706005 1,000 gallons storagecapacity
Carbon Tetrachloride: Working Loss
40706006 1,000 gallonsthroughput
Chlorobenzene: BreathingLoss
40706007 1,000 gallons storagecapacity
Chlorobenzene: WorkingLoss
40706008 1,000 gallonsthroughput
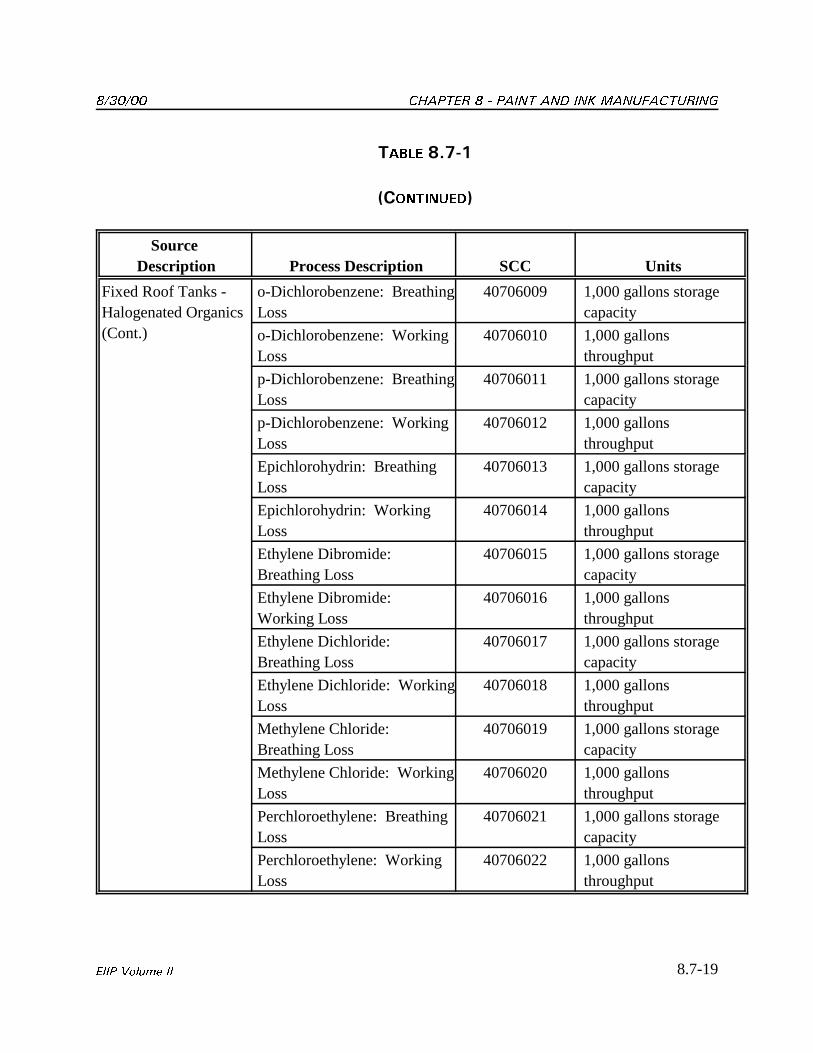
������ ������� ����� �� ��� �������������
8.7-19���� ���� ��
����� �-70+
&������'
Source Description Process Description SCC Units
Fixed Roof Tanks -Halogenated Organics(Cont.)
o-Dichlorobenzene: BreathingLoss
40706009 1,000 gallons storagecapacity
o-Dichlorobenzene: WorkingLoss
40706010 1,000 gallonsthroughput
p-Dichlorobenzene: BreathingLoss
40706011 1,000 gallons storagecapacity
p-Dichlorobenzene: WorkingLoss
40706012 1,000 gallonsthroughput
Epichlorohydrin: BreathingLoss
40706013 1,000 gallons storagecapacity
Epichlorohydrin: WorkingLoss
40706014 1,000 gallonsthroughput
Ethylene Dibromide: Breathing Loss
40706015 1,000 gallons storagecapacity
Ethylene Dibromide: Working Loss
40706016 1,000 gallonsthroughput
Ethylene Dichloride: Breathing Loss
40706017 1,000 gallons storagecapacity
Ethylene Dichloride: WorkingLoss
40706018 1,000 gallonsthroughput
Methylene Chloride: Breathing Loss
40706019 1,000 gallons storagecapacity
Methylene Chloride: WorkingLoss
40706020 1,000 gallonsthroughput
Perchloroethylene: BreathingLoss
40706021 1,000 gallons storagecapacity
Perchloroethylene: WorkingLoss
40706022 1,000 gallonsthroughput
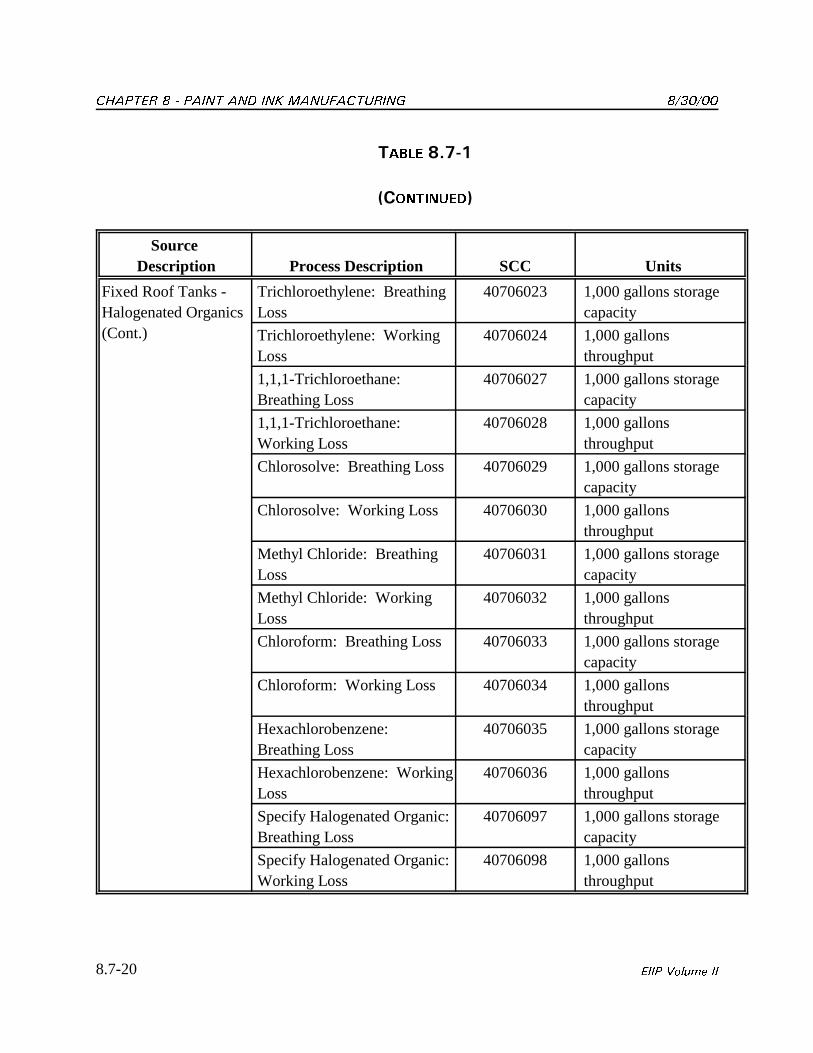
������� ����� �� ��� ������������� ������
8.7-20 ���� ���� ��
����� �-70+
&������'
Source Description Process Description SCC Units
Fixed Roof Tanks -Halogenated Organics(Cont.)
Trichloroethylene: BreathingLoss
40706023 1,000 gallons storagecapacity
Trichloroethylene: WorkingLoss
40706024 1,000 gallonsthroughput
1,1,1-Trichloroethane: Breathing Loss
40706027 1,000 gallons storagecapacity
1,1,1-Trichloroethane: Working Loss
40706028 1,000 gallonsthroughput
Chlorosolve: Breathing Loss 40706029 1,000 gallons storagecapacity
Chlorosolve: Working Loss 40706030 1,000 gallonsthroughput
Methyl Chloride: BreathingLoss
40706031 1,000 gallons storagecapacity
Methyl Chloride: WorkingLoss
40706032 1,000 gallonsthroughput
Chloroform: Breathing Loss 40706033 1,000 gallons storagecapacity
Chloroform: Working Loss 40706034 1,000 gallonsthroughput
Hexachlorobenzene: Breathing Loss
40706035 1,000 gallons storagecapacity
Hexachlorobenzene: WorkingLoss
40706036 1,000 gallonsthroughput
Specify Halogenated Organic: Breathing Loss
40706097 1,000 gallons storagecapacity
Specify Halogenated Organic: Working Loss
40706098 1,000 gallonsthroughput
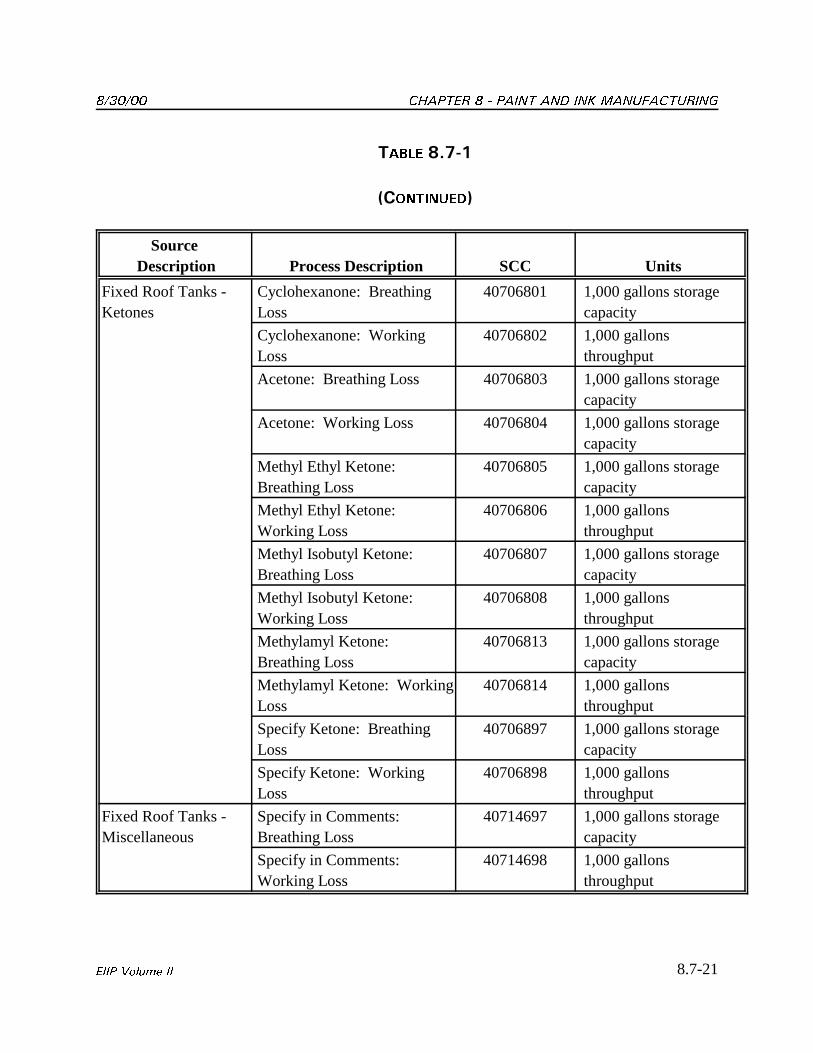
������ ������� ����� �� ��� �������������
8.7-21���� ���� ��
����� �-70+
&������'
Source Description Process Description SCC Units
Fixed Roof Tanks -Ketones
Cyclohexanone: BreathingLoss
40706801 1,000 gallons storagecapacity
Cyclohexanone: WorkingLoss
40706802 1,000 gallonsthroughput
Acetone: Breathing Loss 40706803 1,000 gallons storagecapacity
Acetone: Working Loss 40706804 1,000 gallons storagecapacity
Methyl Ethyl Ketone:Breathing Loss
40706805 1,000 gallons storagecapacity
Methyl Ethyl Ketone: Working Loss
40706806 1,000 gallonsthroughput
Methyl Isobutyl Ketone: Breathing Loss
40706807 1,000 gallons storagecapacity
Methyl Isobutyl Ketone: Working Loss
40706808 1,000 gallonsthroughput
Methylamyl Ketone: Breathing Loss
40706813 1,000 gallons storagecapacity
Methylamyl Ketone: WorkingLoss
40706814 1,000 gallonsthroughput
Specify Ketone: BreathingLoss
40706897 1,000 gallons storagecapacity
Specify Ketone: WorkingLoss
40706898 1,000 gallonsthroughput
Fixed Roof Tanks -Miscellaneous
Specify in Comments: Breathing Loss
40714697 1,000 gallons storagecapacity
Specify in Comments: Working Loss
40714698 1,000 gallonsthroughput
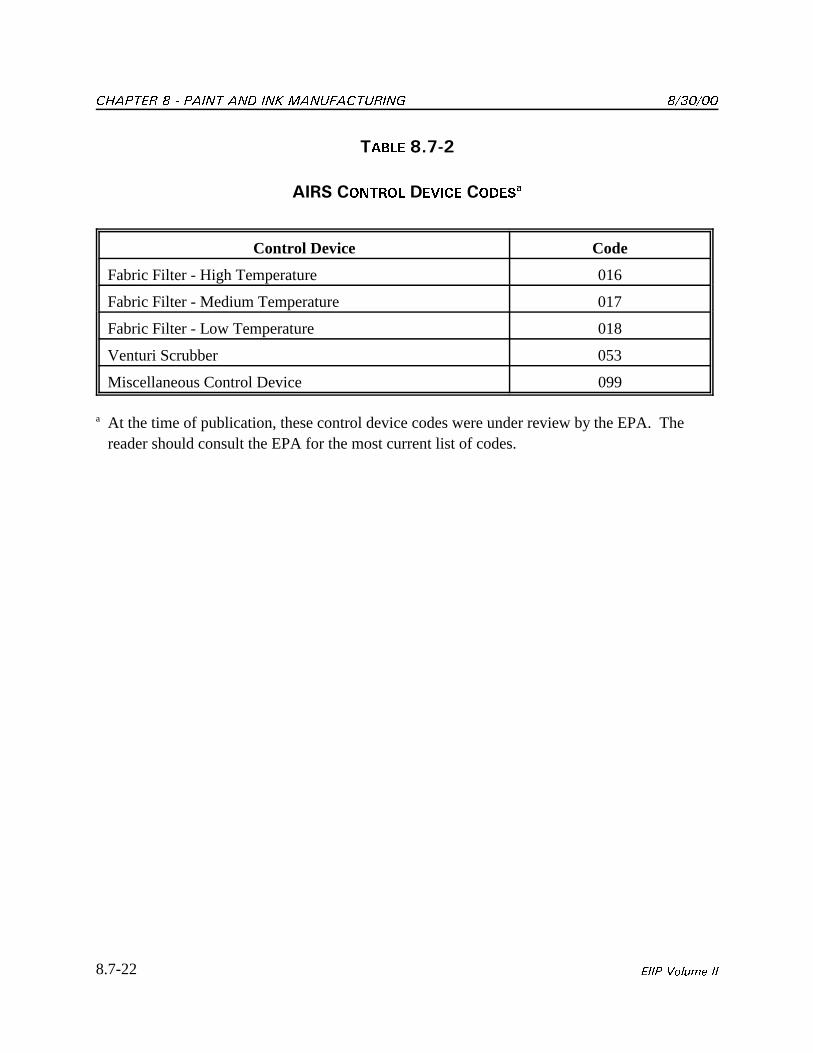
������� ����� �� ��� ������������� ������
8.7-22 ���� ���� ��
����� �-70"
���� ����� ������ �����
Control Device Code
Fabric Filter - High Temperature 016
Fabric Filter - Medium Temperature 017
Fabric Filter - Low Temperature 018
Venturi Scrubber 053
Miscellaneous Control Device 099
a At the time of publication, these control device codes were under review by the EPA. Thereader should consult the EPA for the most current list of codes.
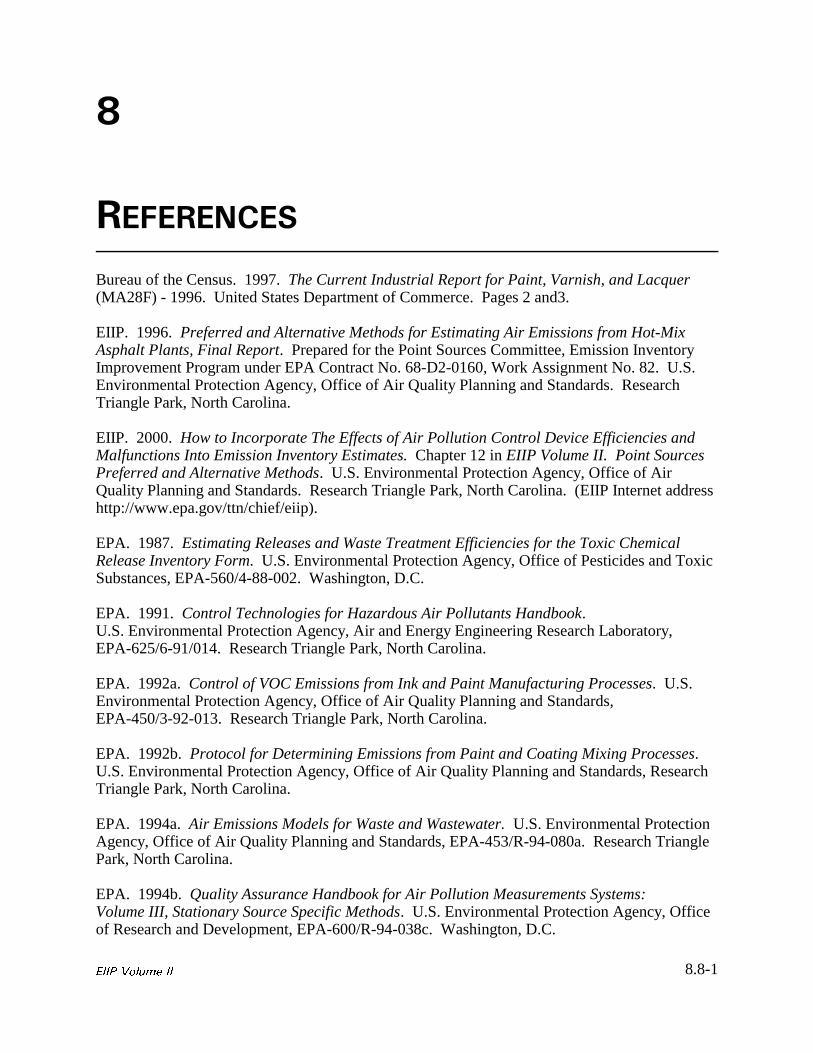
8.8-1���� ���� ��
�
���������
Bureau of the Census. 1997. The Current Industrial Report for Paint, Varnish, and Lacquer(MA28F) - 1996. United States Department of Commerce. Pages 2 and3.
EIIP. 1996. Preferred and Alternative Methods for Estimating Air Emissions from Hot-MixAsphalt Plants, Final Report. Prepared for the Point Sources Committee, Emission InventoryImprovement Program under EPA Contract No. 68-D2-0160, Work Assignment No. 82. U.S.Environmental Protection Agency, Office of Air Quality Planning and Standards. ResearchTriangle Park, North Carolina.
EIIP. 2000. How to Incorporate The Effects of Air Pollution Control Device Efficiencies andMalfunctions Into Emission Inventory Estimates. Chapter 12 in EIIP Volume II. Point SourcesPreferred and Alternative Methods. U.S. Environmental Protection Agency, Office of AirQuality Planning and Standards. Research Triangle Park, North Carolina. (EIIP Internet addresshttp://www.epa.gov/ttn/chief/eiip).
EPA. 1987. Estimating Releases and Waste Treatment Efficiencies for the Toxic ChemicalRelease Inventory Form. U.S. Environmental Protection Agency, Office of Pesticides and ToxicSubstances, EPA-560/4-88-002. Washington, D.C.
EPA. 1991. Control Technologies for Hazardous Air Pollutants Handbook. U.S. Environmental Protection Agency, Air and Energy Engineering Research Laboratory,EPA-625/6-91/014. Research Triangle Park, North Carolina.
EPA. 1992a. Control of VOC Emissions from Ink and Paint Manufacturing Processes. U.S.Environmental Protection Agency, Office of Air Quality Planning and Standards,EPA-450/3-92-013. Research Triangle Park, North Carolina.
EPA. 1992b. Protocol for Determining Emissions from Paint and Coating Mixing Processes. U.S. Environmental Protection Agency, Office of Air Quality Planning and Standards, ResearchTriangle Park, North Carolina.
EPA. 1994a. Air Emissions Models for Waste and Wastewater. U.S. Environmental ProtectionAgency, Office of Air Quality Planning and Standards, EPA-453/R-94-080a. Research TrianglePark, North Carolina.
EPA. 1994b. Quality Assurance Handbook for Air Pollution Measurements Systems: Volume III, Stationary Source Specific Methods. U.S. Environmental Protection Agency, Officeof Research and Development, EPA-600/R-94-038c. Washington, D.C.
������� ����� �� ��� ������������� ������
8.8-2 ���� ���� ��
EPA. 1994c. Control of Volatile Organic Compound Emissions from Batch Processes -Alternate Control Techniques. U.S. Environmental Protection Agency, Office of Air QualityPlanning and Standards, EPA-453/R-93-017. Research Triangle Park, North Carolina.
EPA. 1995a. Compilation of Air Pollutant Emission Factors. Volume I: Stationary Point andArea Sources, Fifth Edition, AP-42. Section 7.1, Organic Liquid Storage Tanks. U.S.Environmental Protection Agency, Office of Air Quality Planning and Standards. ResearchTriangle Park, North Carolina.
EPA. 1995b. Compilation of Air Pollutant Emission Factors. Volume I: Stationary Point andArea Sources, Fifth Edition, AP-42. Section 6.4, Paint and Varnish. U.S. EnvironmentalProtection Agency, Office of Air Quality Planning and Standards. Research Triangle Park, NorthCarolina.
EPA. 1995c. Compilation of Air Pollutant Emission Factors. Volume I: Stationary Point andArea Sources, Fifth Edition, AP-42. Section 5.2, Transportation and Marketing of PetroleumLiquids. U.S. Environmental Protection Agency, Office of Air Quality Planning and Standards. Research Triangle Park, North Carolina.
EPA. 1995d. Compilation of Air Pollutant Emission Factors. Volume I: Stationary Point andArea Sources, Fifth Edition, AP-42. Section 4.7, Waste Solvent Reclamation. U.S.Environmental Protection Agency, Office of Air Quality Planning and Standards. ResearchTriangle Park, North Carolina.
EPA. 1995e. Compilation of Air Pollutant Emission Factors. Volume I: Stationary Point andArea Sources, Fifth Edition, AP-42. Section 4.6, Solvent Degreasing. U.S. EnvironmentalProtection Agency, Office of Air Quality Planning and Standards. Research Triangle Park, NorthCarolina.
EPA. 1995f. Memorandum on AP-42 Emission Factors for the Paint and Varnish Industry fromDennis Beauregard, U.S. Environmental Protection Agency, Office of Air Quality Planning andStandards, Research Triangle Park, North Carolina, to Robert J. Nelson, National Paint andCoatings Association. Washington, D.C.
EPA. 1995g. Protocol for Equipment Leak Emission Estimates. U.S. Environmental ProtectionAgency, Office of Air Quality Planning and Standards, EPA-453/R-95-017. Research TrianglePark, North Carolina.
EPA. 1995h. Survey of Control Technologies for Low Concentration Organic Vapor GasStreams. U.S. Environmental Protection Agency, Office of Research and Development,EPA-456/R-95-003. Research Triangle Park, North Carolina. (Internet address,http://www.epa.gov/ttn/catc/dir1/low_vo.pdf)
EPA. 1997a. Toxic Release Inventory System.
������ ������� ����� �� ��� �������������
8.8-3���� ���� ��
EPA. 1997b. Compilation of Air Pollutant Emission Factors. Volume I: Stationary Point andArea Sources, Fifth Edition, AP-42. Section 7.1, Organic Liquid Storage Tanks. U.S.Environmental Protection Agency, Office of Air Quality Planning and Standards. ResearchTriangle Park, North Carolina.
EPA. 1999. Factor Information and Retrieval (FIRE) Database System, Version 6.22. Updatedannually. U.S. Environmental Protection Agency, Office of Air Quality Planning and Standards,Research Triangle Park, North Carolina. (Internet address,http://www.epa.gov/ttn/chief/fire.html)
EPA. 2000. Source Classification Codes for Point and Area Sources. Updated April 6, 2000. USEPA Technology Transfer Network. http://www.epa.gov/ttn/chief/scccodes.html
Fisher, Perry W., Steven A. Frey, and Kaushik Deb. 1993. Emission Estimation Methodologies- Paint Manufacturing Industry, Paper 93-TP-57.07, Air and Waste Management Association,presented at the 86th Annual Meeting and Exhibition, Denver, Colorado, June 13-18, 1993.
NAPIM. 1996. National Association of Printing Ink Manufacturers Guide to Estimating VOCEmissions from Printing Ink Manufacturing. National Association of Printing InkManufacturers, Inc. Hasbrouk Heights, New Jersey.
NPCA. 1995. Emission Estimation Guidance Manual for the Paint and Coatings Industry(Second Edition). National Paint and Coatings Association, Inc., Washington, D.C.
Noyes, Robert, Editor. 1993. Pollution Prevention Technology Handbook. Noyes Publications,Park Ridge, New Jersey.
������� ����� �� ��� ������������� ������
8.8-4 ���� ���� ��
This page is intentionally left blank.
������ ������� ����� �� ��� �������������
���� ���� ��
� ����6��
�6�� ����������������������
����������������0� �������������������������

������� ����� �� ��� ������������� ������
���� ���� ��
This page is intentionally left blank.
������ ������� ����� �� ��� �������������
8.A-1���� ���� ��
� ����� ���� �������� ����� ���������� 0 ��� �� ������������� ����������
1. These forms may be used as a work sheet to aid the plant engineer in collecting theinformation necessary to calculate emissions from paint and ink manufacturing facilities. The information requested on the forms relate to the methods (described in Sections 3, 4,and 5) for quantifying emissions. These forms may also be used by the regulatory agencyto assist in area-wide inventory preparation.
2. The completed forms should be maintained in a reference file by the plant engineer withother supporting documentation.
3. If the information requested is unknown, write “unknown” in the blank. If the informationrequested does not apply to a particular unit or process, write “NA” in the blank.
4. If you want to modify the form to better serve your needs, an electronic copy of the formmay be obtained through the EIIP on the Clearinghouse for Inventories and EmissionFactors (CHIEF) website (www.epa.gov/ttn/chief).
5. Collect all Manufacturer’s Technical Data Sheets (TDSs) for all materials containingpotential air contaminants that are used at the facility.
6. The plant engineer should maintain all material usage information and TDSs in a referencefile.
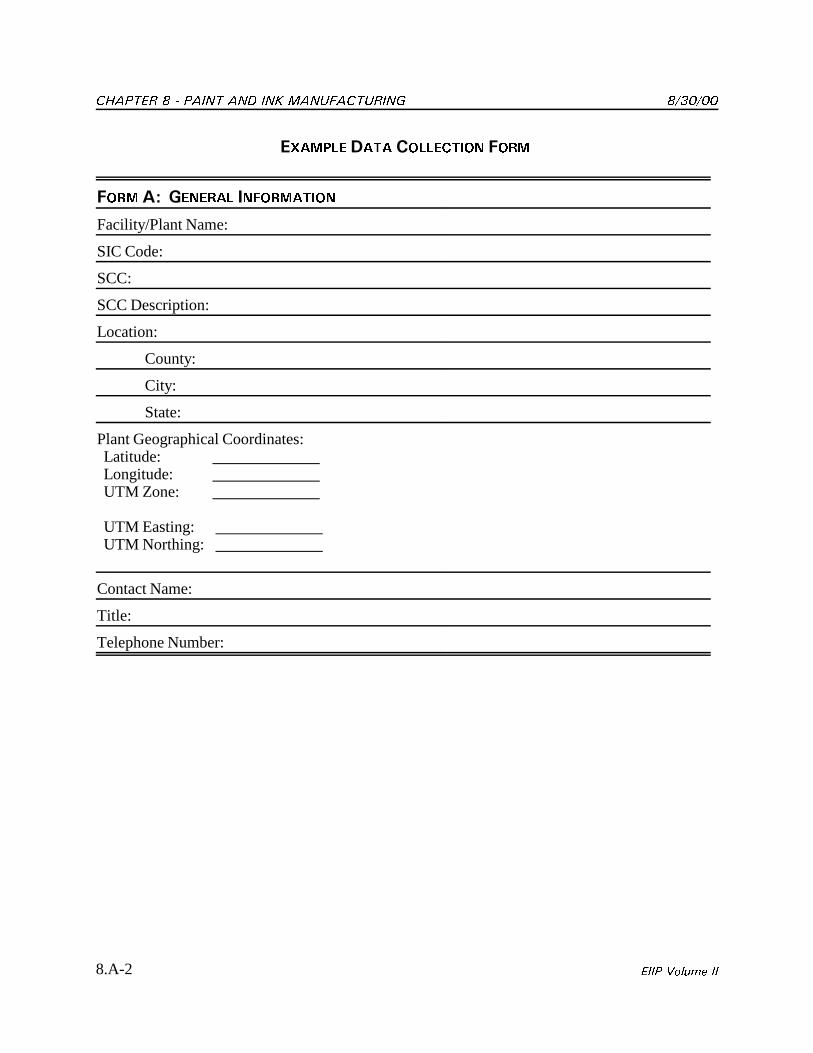
������� ����� �� ��� ������������� ������
8.A-2 ���� ���� ��
� ����� ���� �������� ����
����� ������ ���������
Facility/Plant Name:
SIC Code:
SCC:
SCC Description:
Location:
County:
City:
State:
Plant Geographical Coordinates: Latitude: Longitude: UTM Zone: UTM Easting: UTM Northing:
Contact Name:
Title:
Telephone Number:
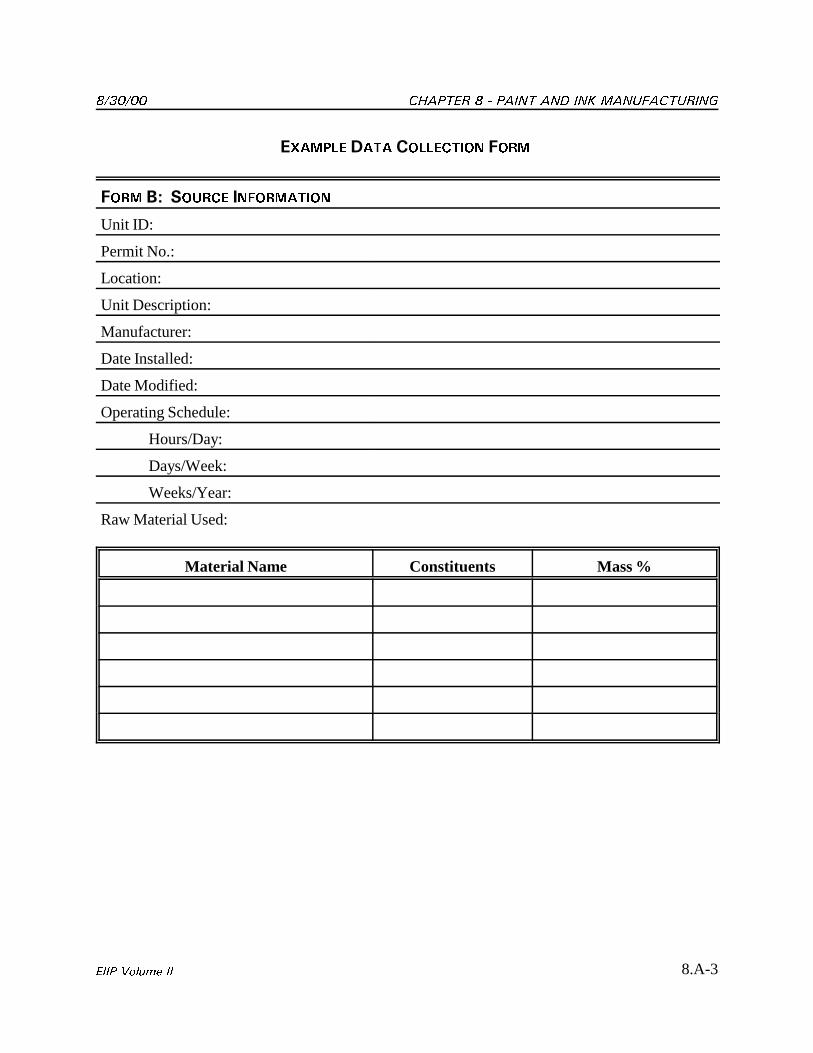
������ ������� ����� �� ��� �������������
8.A-3���� ���� ��
� ����� ���� �������� ����
���� ( ������ ���������
Unit ID:
Permit No.:
Location:
Unit Description:
Manufacturer:
Date Installed:
Date Modified:
Operating Schedule:
Hours/Day:
Days/Week:
Weeks/Year:
Raw Material Used:
Material Name Constituents Mass %
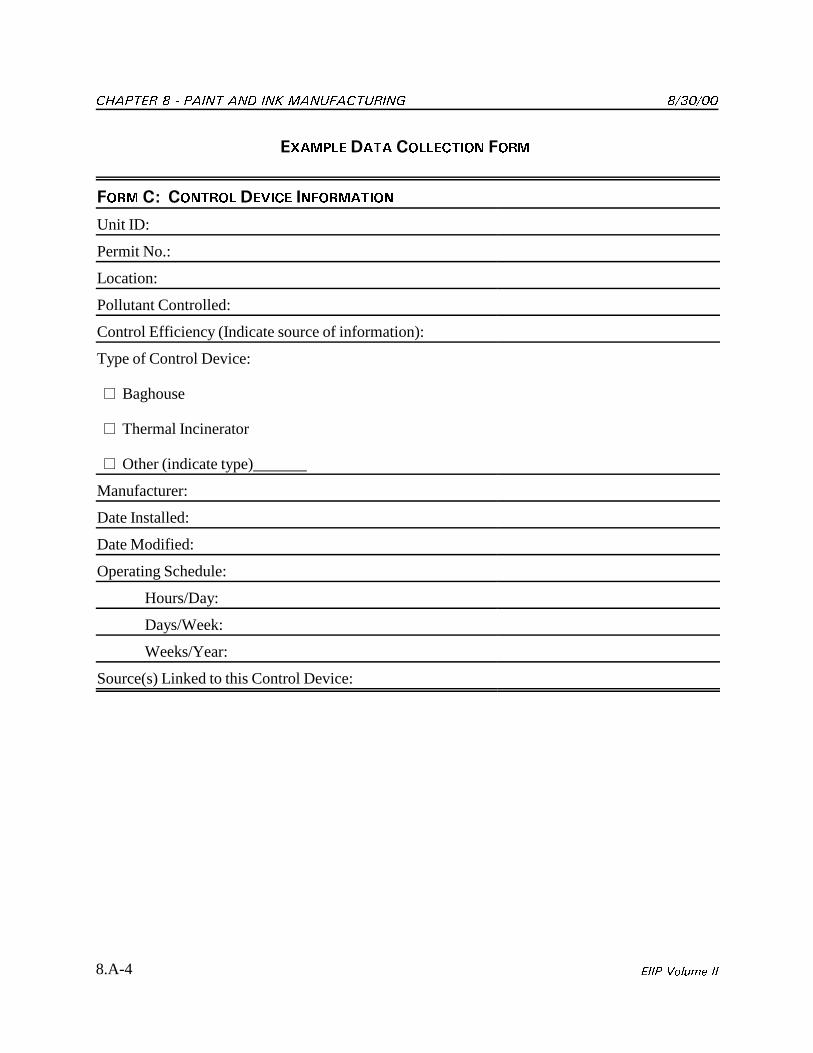
������� ����� �� ��� ������������� ������
8.A-4 ���� ���� ��
� ����� ���� �������� ����
���� ����� ������ ���������
Unit ID:
Permit No.:
Location:
Pollutant Controlled:
Control Efficiency (Indicate source of information):
Type of Control Device:
� Baghouse
� Thermal Incinerator
� Other (indicate type)
Manufacturer:
Date Installed:
Date Modified:
Operating Schedule:
Hours/Day:
Days/Week:
Weeks/Year:
Source(s) Linked to this Control Device:
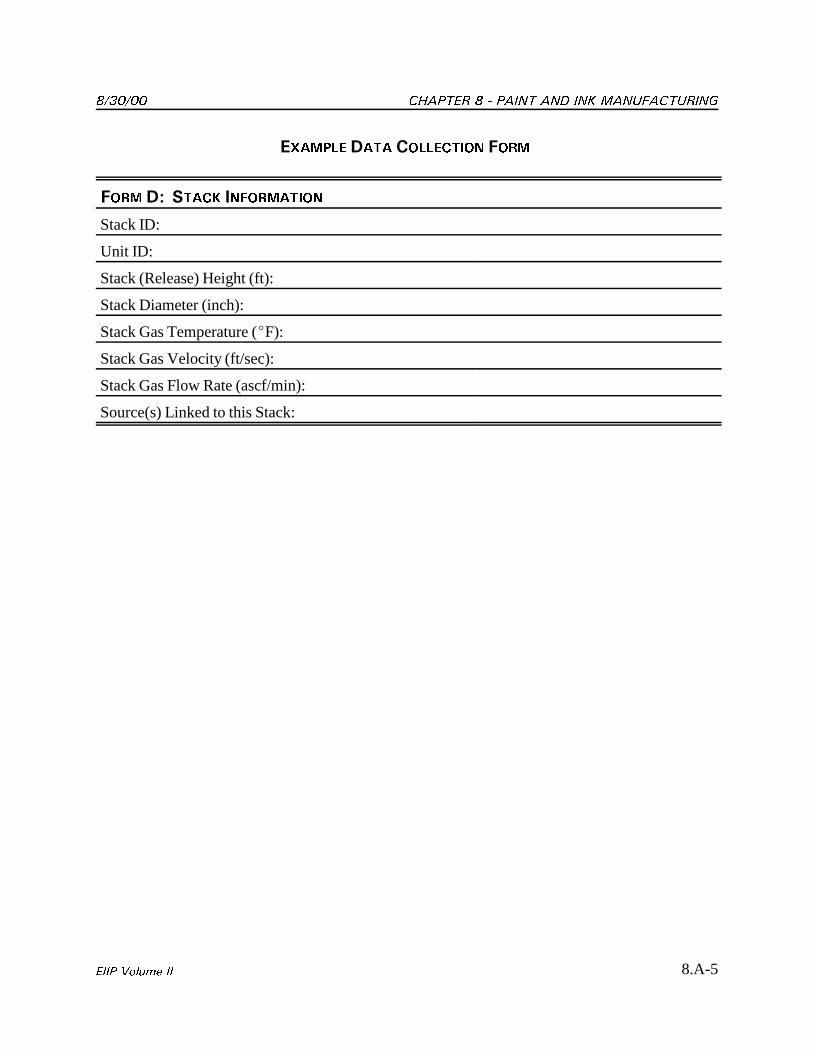
������ ������� ����� �� ��� �������������
8.A-5���� ���� ��
� ����� ���� �������� ����
���� � ����� ���������
Stack ID:
Unit ID:
Stack (Release) Height (ft):
Stack Diameter (inch):
Stack Gas Temperature (�F):
Stack Gas Velocity (ft/sec):
Stack Gas Flow Rate (ascf/min):
Source(s) Linked to this Stack:
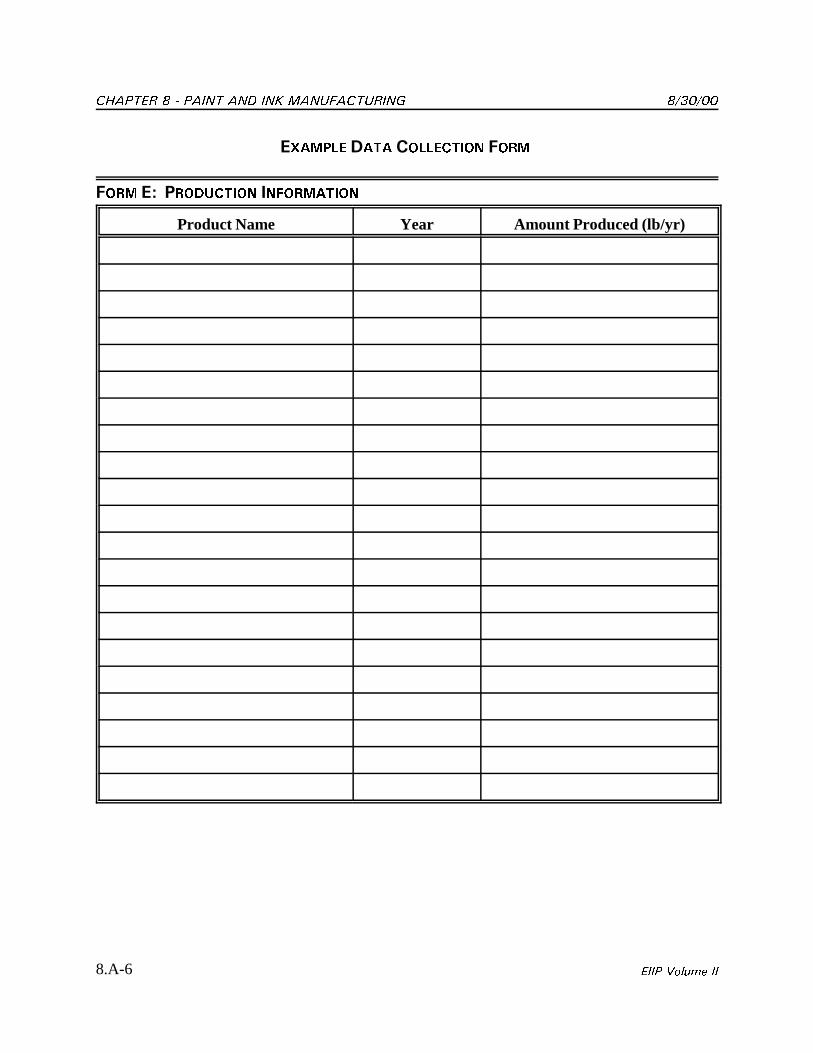
������� ����� �� ��� ������������� ������
8.A-6 ���� ���� ��
� ����� ���� �������� ����
���� � �������� ���������
Product Name Year Amount Produced (lb/yr)
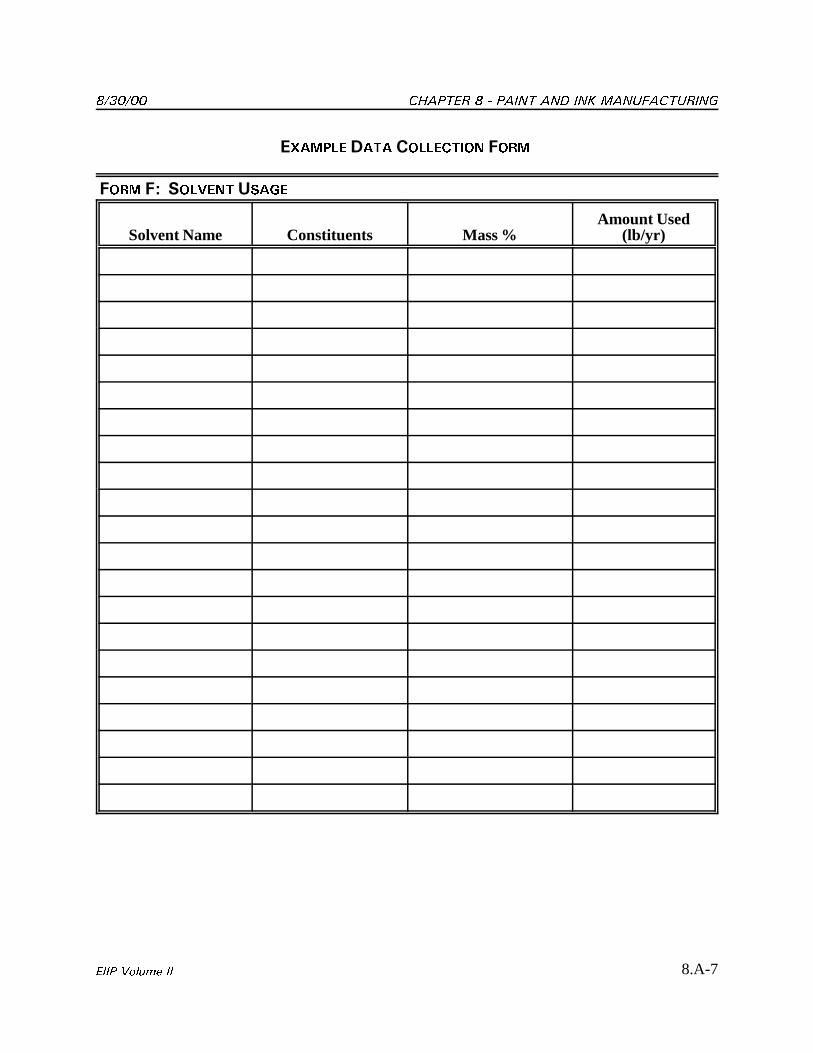
������ ������� ����� �� ��� �������������
8.A-7���� ���� ��
� ����� ���� �������� ����
���� � ������ �����
Solvent Name Constituents Mass %Amount Used
(lb/yr)
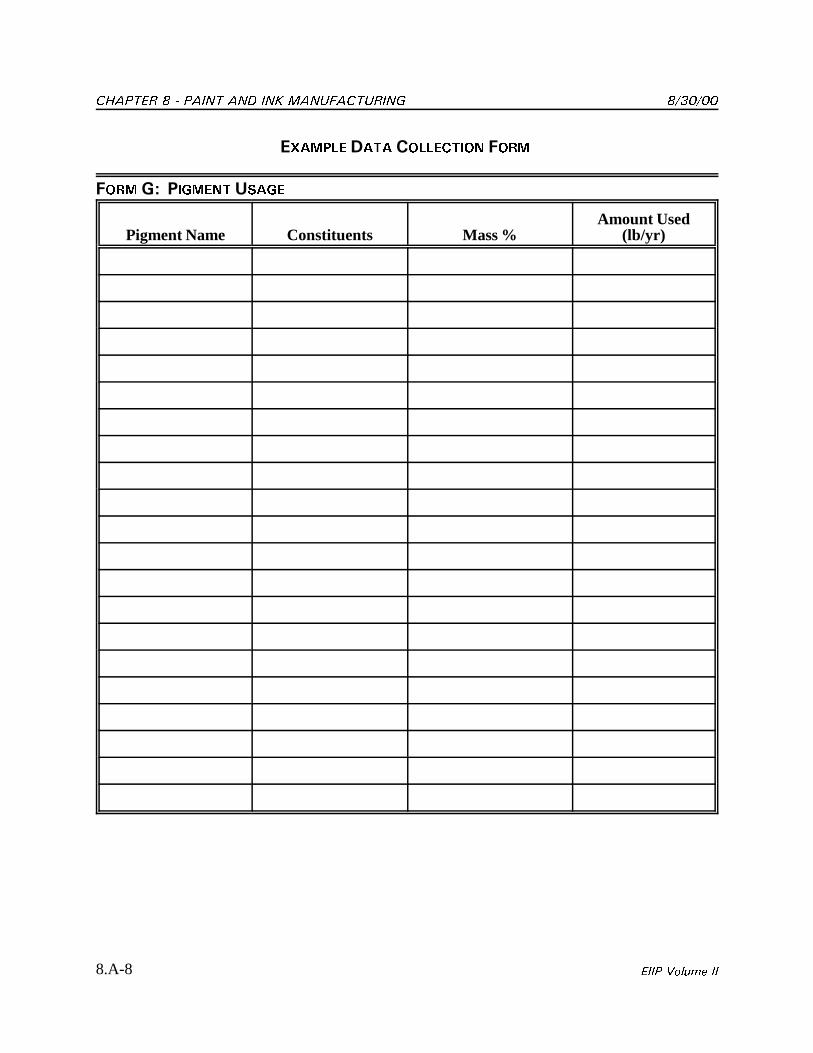
������� ����� �� ��� ������������� ������
8.A-8 ���� ���� ��
� ����� ���� �������� ����
����� ����� �����
Pigment Name Constituents Mass %Amount Used
(lb/yr)
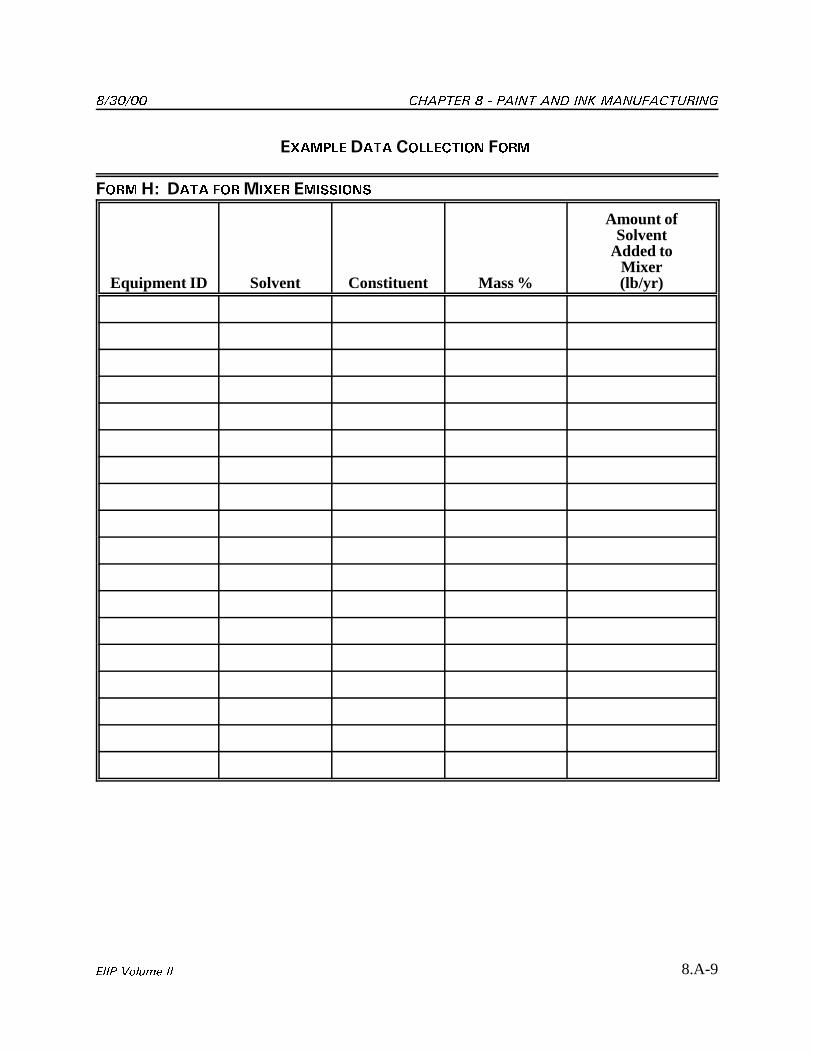
������ ������� ����� �� ��� �������������
8.A-9���� ���� ��
� ����� ���� �������� ����
���� � ���� ����� �� ��������
Equipment ID Solvent Constituent Mass %
Amount ofSolvent
Added toMixer(lb/yr)
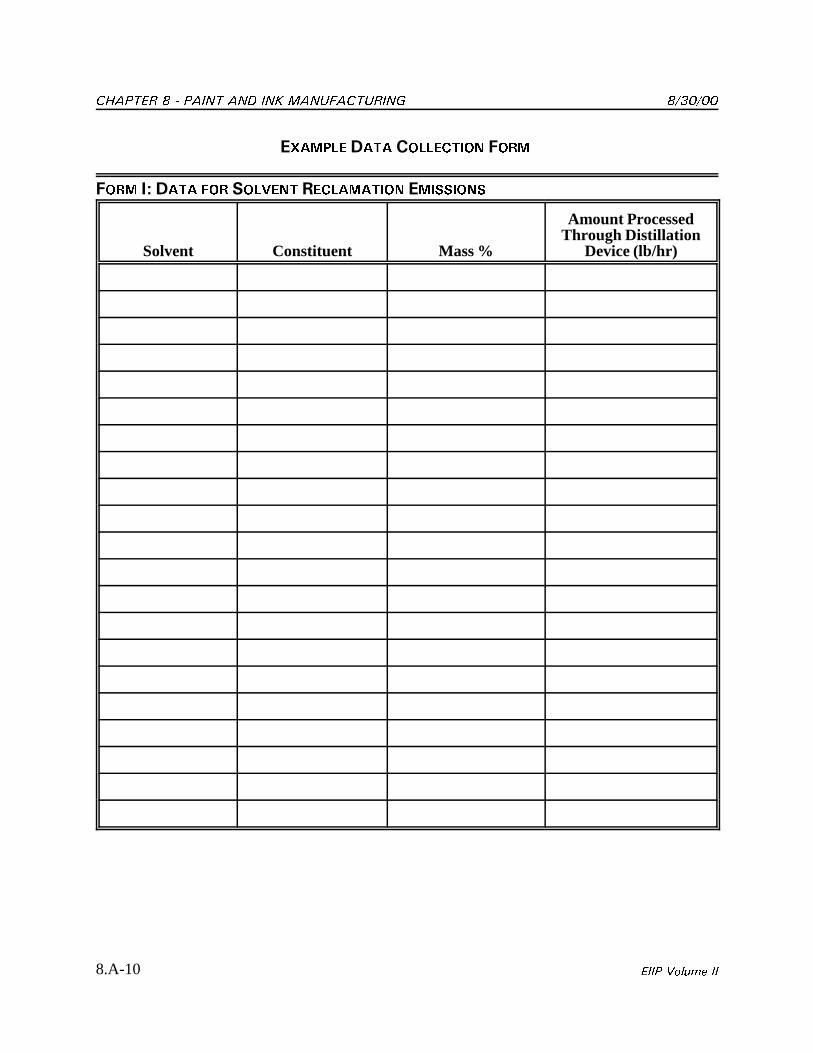
������� ����� �� ��� ������������� ������
8.A-10 ���� ���� ��
� ����� ���� �������� ����
���� � ���� ��� ������ ���������� ��������
Solvent Constituent Mass %
Amount ProcessedThrough Distillation
Device (lb/hr)
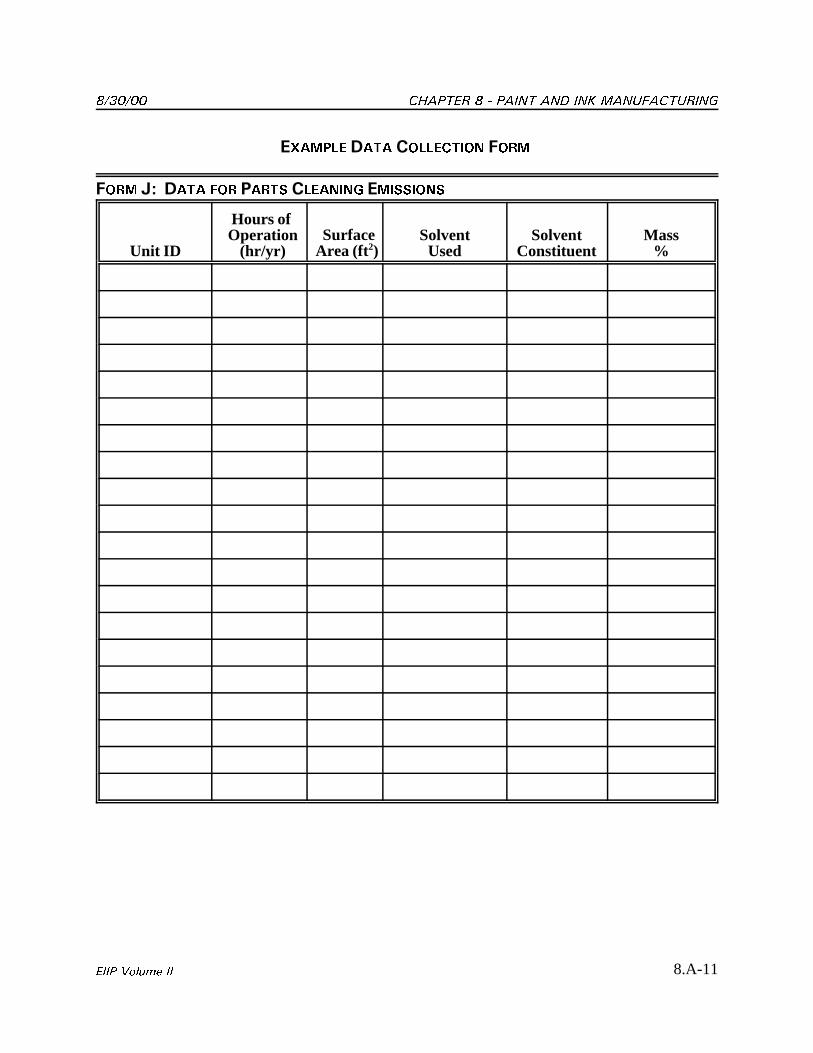
������ ������� ����� �� ��� �������������
8.A-11���� ���� ��
� ����� ���� �������� ����
���� 8 ���� ��� ���� ����� ��������
Unit ID
Hours of Operation
(hr/yr)Surface
Area (ft2) SolventUsed
SolventConstituent
Mass%
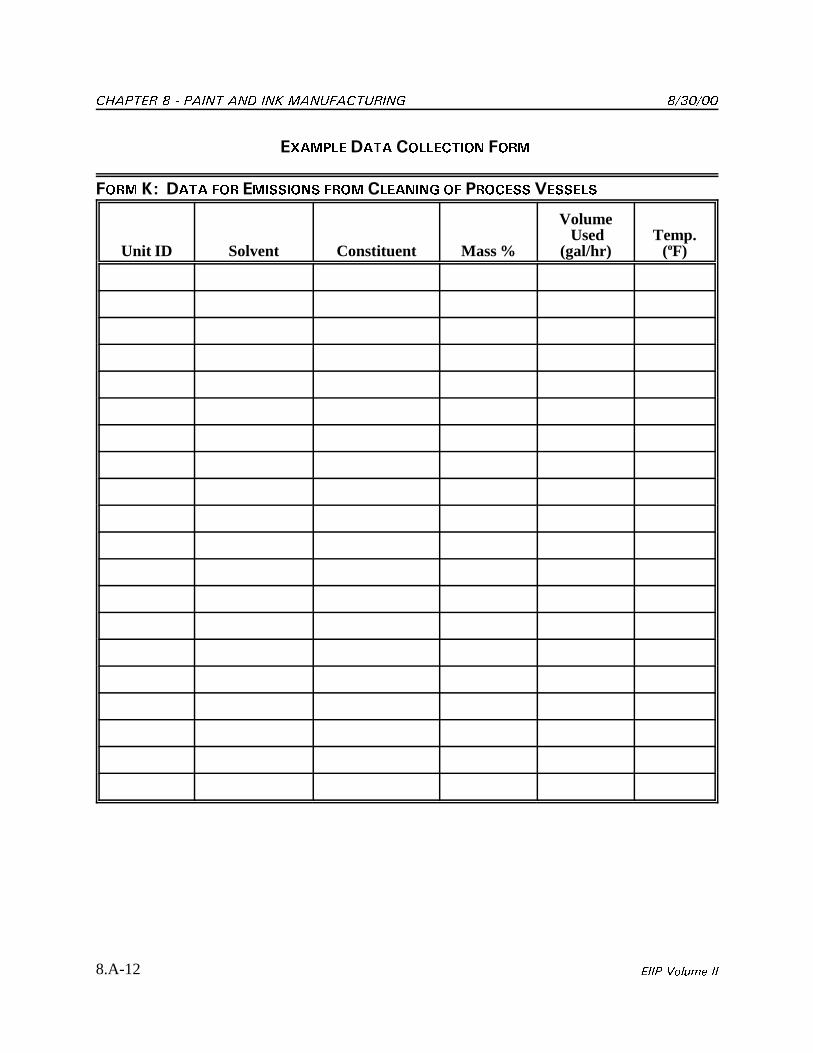
������� ����� �� ��� ������������� ������
8.A-12 ���� ���� ��
� ����� ���� �������� ����
���� � ���� ��� �������� ���� ����� �� ������ �������
Unit ID Solvent Constituent Mass %
Volume Used
(gal/hr)Temp.
(oF)
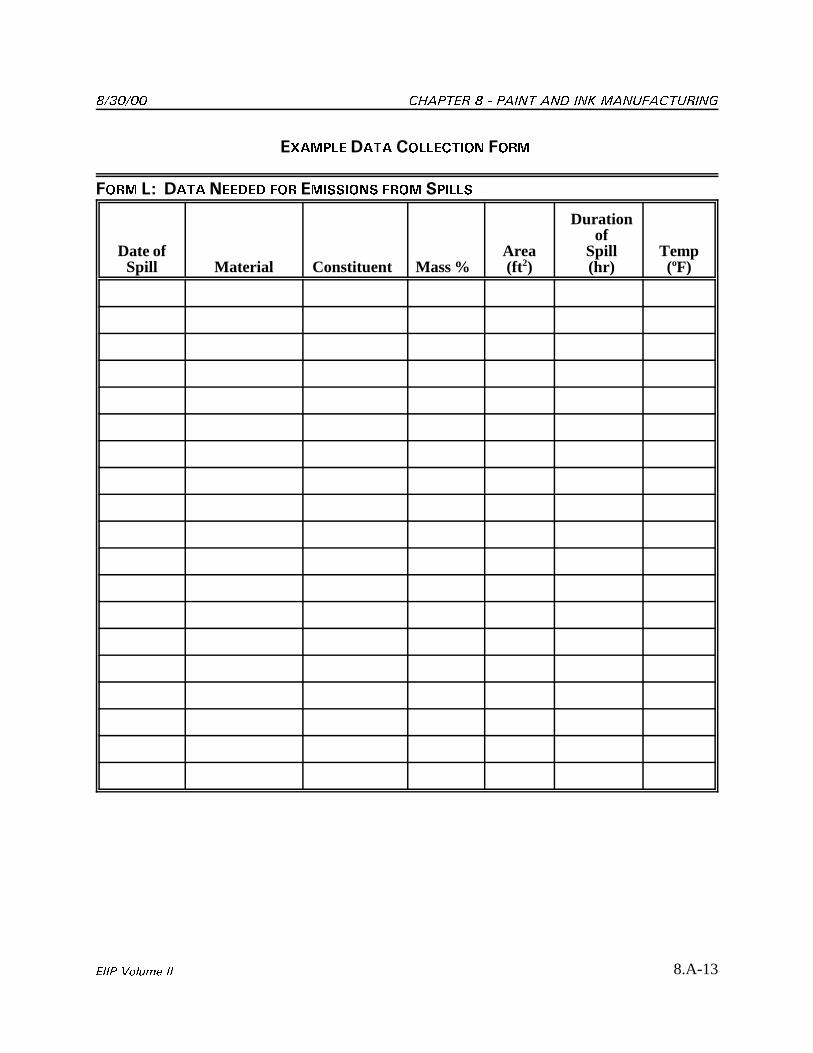
������ ������� ����� �� ��� �������������
8.A-13���� ���� ��
� ����� ���� �������� ����
���� � ���� ������ ��� �������� ���� ������
Date ofSpill Material Constituent Mass %
Area(ft 2)
Durationof
Spill(hr)
Temp(oF)
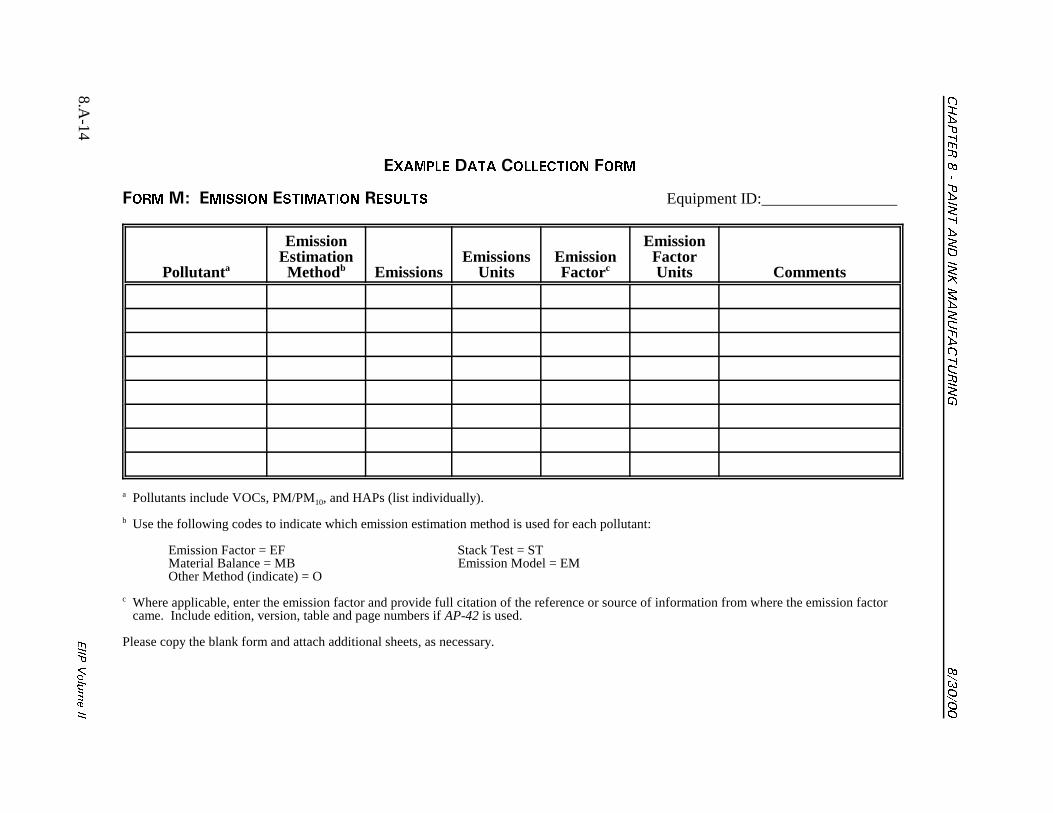
�������������� ����������������
������
8.A-14
����
������
������� ���� ������� ����
����� ������� ��������� ������� Equipment ID:_________________
Pollutanta
EmissionEstimationMethodb Emissions
EmissionsUnits
EmissionFactorc
EmissionFactorUnits Comments
a Pollutants include VOCs, PM/PM10, and HAPs (list individually).
b Use the following codes to indicate which emission estimation method is used for each pollutant:
Emission Factor = EF Stack Test = STMaterial Balance = MB Emission Model = EMOther Method (indicate) = O
c Where applicable, enter the emission factor and provide full citation of the reference or source of information from where the emission factorcame. Include edition, version, table and page numbers if AP-42 is used.
Please copy the blank form and attach additional sheets, as necessary.
������ ������� ����� �� ��� �������������
8.A-15���� ���� ��