Embed Size (px)
Citation preview
Volatile Organic Compoundemissions from dairy cowsand their excreta
Frank Mitloehner, PhDAir Quality CE SpecialistAnimal Science, UC Davis
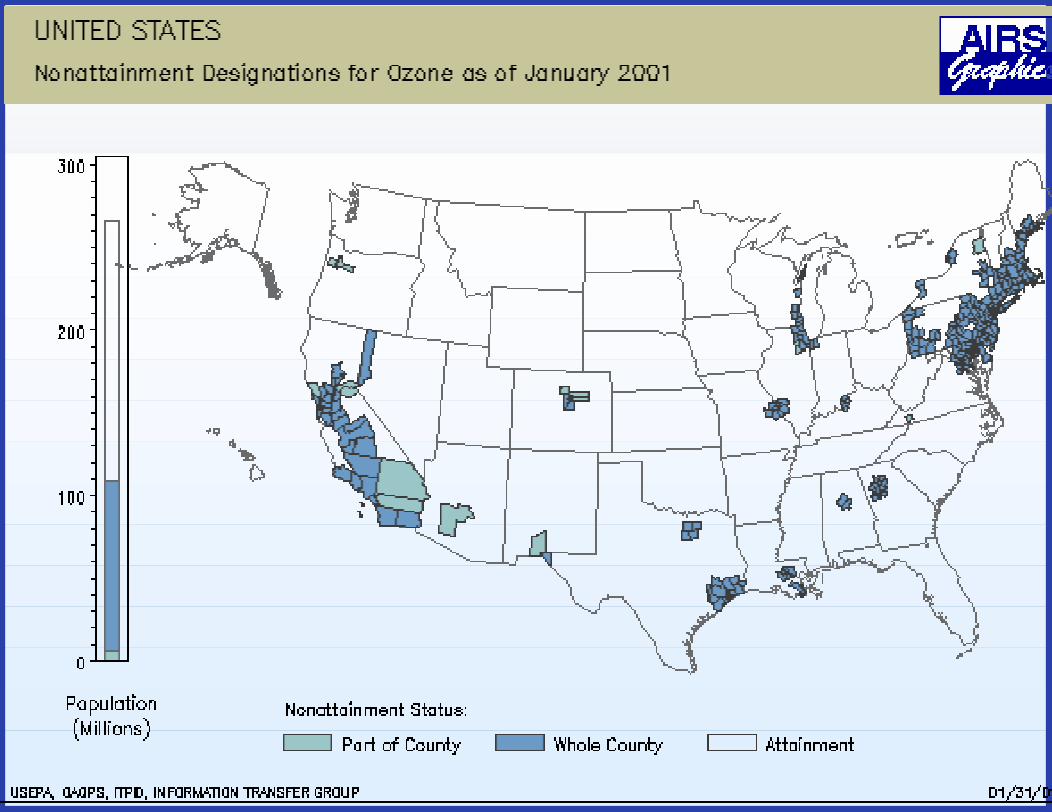
Estimating Emissions from AnimalFeeding Operations
National Research Council (NRC)Recommendations
Bill Schrock; US EPA
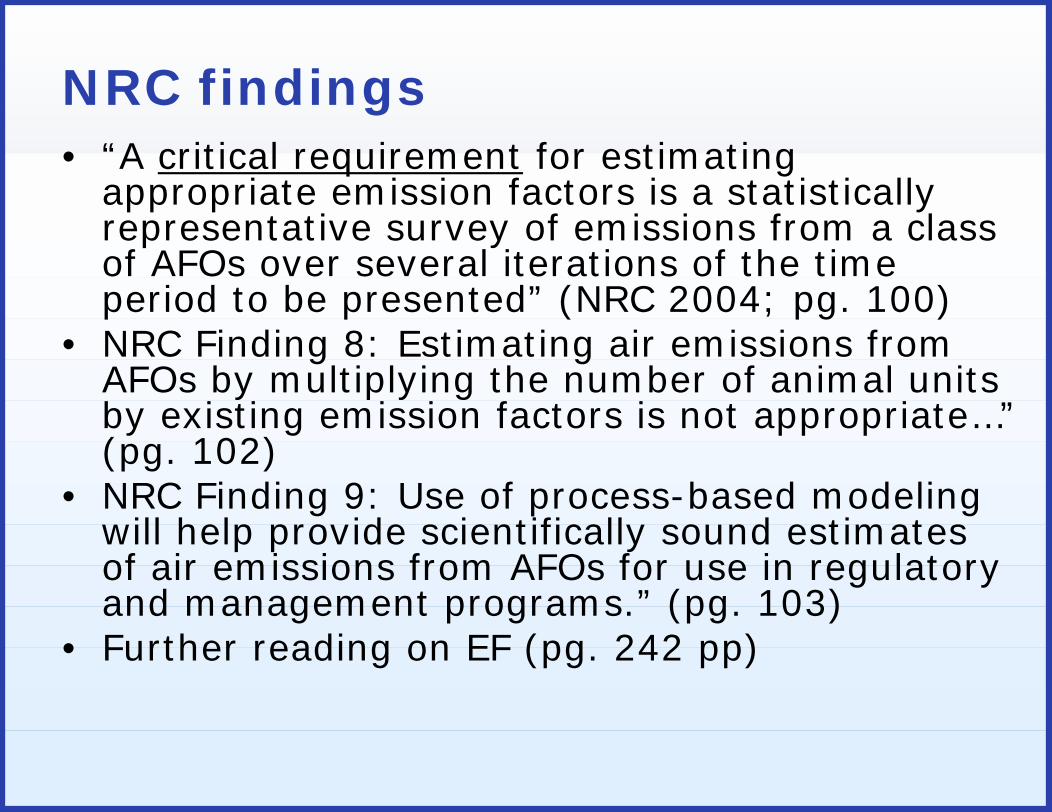
NRC findings• “A critical requirement for estimating
appropriate emission factors is a statisticallyrepresentative survey of emissions from a classof AFOs over several iterations of the timeperiod to be presented” (NRC 2004; pg. 100)
• NRC Finding 8: Estimating air emissions fromAFOs by multiplying the number of animal unitsby existing emission factors is not appropriate…”(pg. 102)
• NRC Finding 9: Use of process-based modelingwill help provide scientifically sound estimatesof air emissions from AFOs for use in regulatoryand management programs.” (pg. 103)
• Further reading on EF (pg. 242 pp)
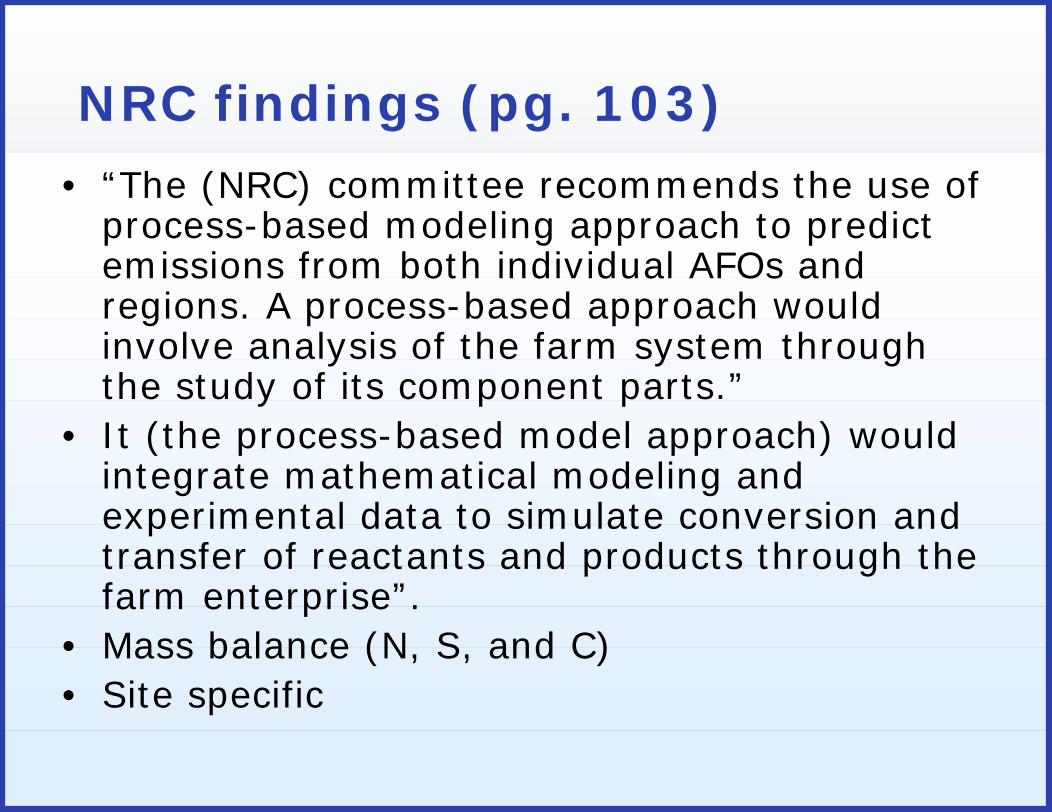
• “The (NRC) committee recommends the use ofprocess-based modeling approach to predictemissions from both individual AFOs andregions. A process-based approach wouldinvolve analysis of the farm system throughthe study of its component parts.”
• It (the process-based model approach) wouldintegrate mathematical modeling andexperimental data to simulate conversion andtransfer of reactants and products through thefarm enterprise”.
• Mass balance (N, S, and C)• Site specific
NRC findings (pg. 103)
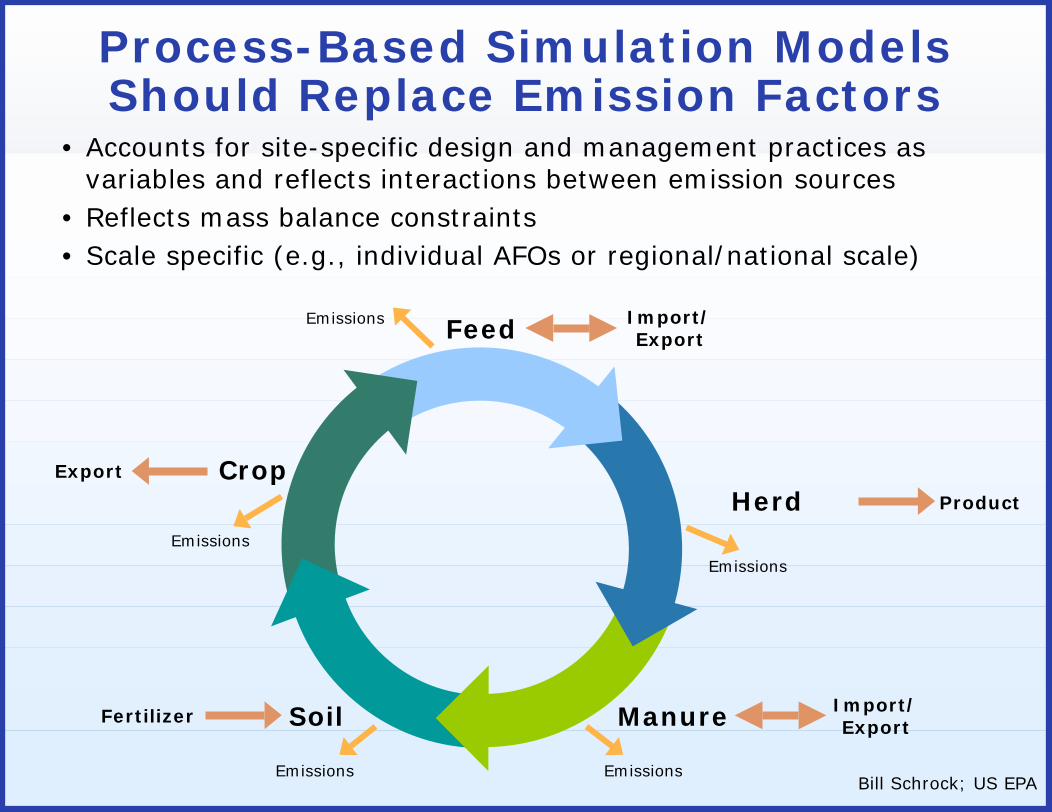
Process-Based Simulation ModelsShould Replace Emission Factors
• Accounts for site-specific design and management practices asvariables and reflects interactions between emission sources
• Reflects mass balance constraints• Scale specific (e.g., individual AFOs or regional/national scale)
ManureSoil
Crop
Feed
HerdEmissions
Emissions
Emissions
Product
Import/Export
Fertilizer
Export
Import/Export
Emissions EmissionsBill Schrock; US EPA
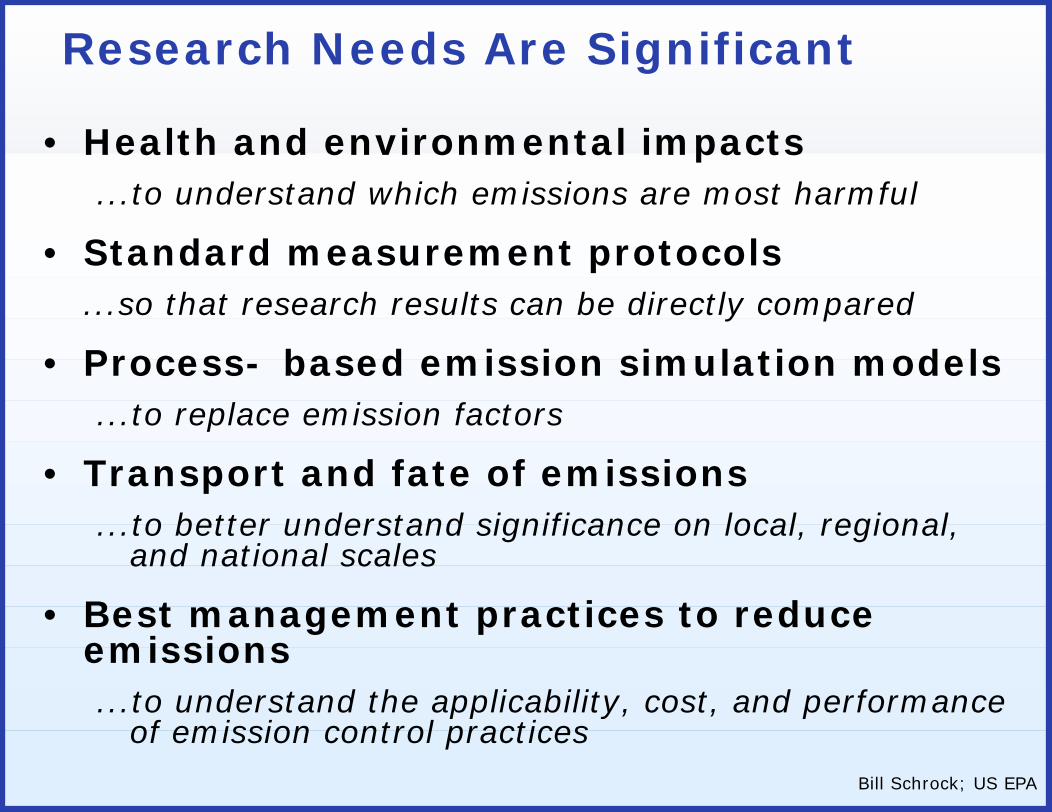
Research Needs Are Significant
• Health and environmental impacts...to understand which emissions are most harmful
• Standard measurement protocols...so that research results can be directly compared
• Process- based emission simulation models...to replace emission factors
• Transport and fate of emissions...to better understand significance on local, regional,
and national scales
• Best management practices to reduceemissions...to understand the applicability, cost, and performance
of emission control practicesBill Schrock; US EPA
NRC findings and recommendationsvs. specific regulatory needs in
California?
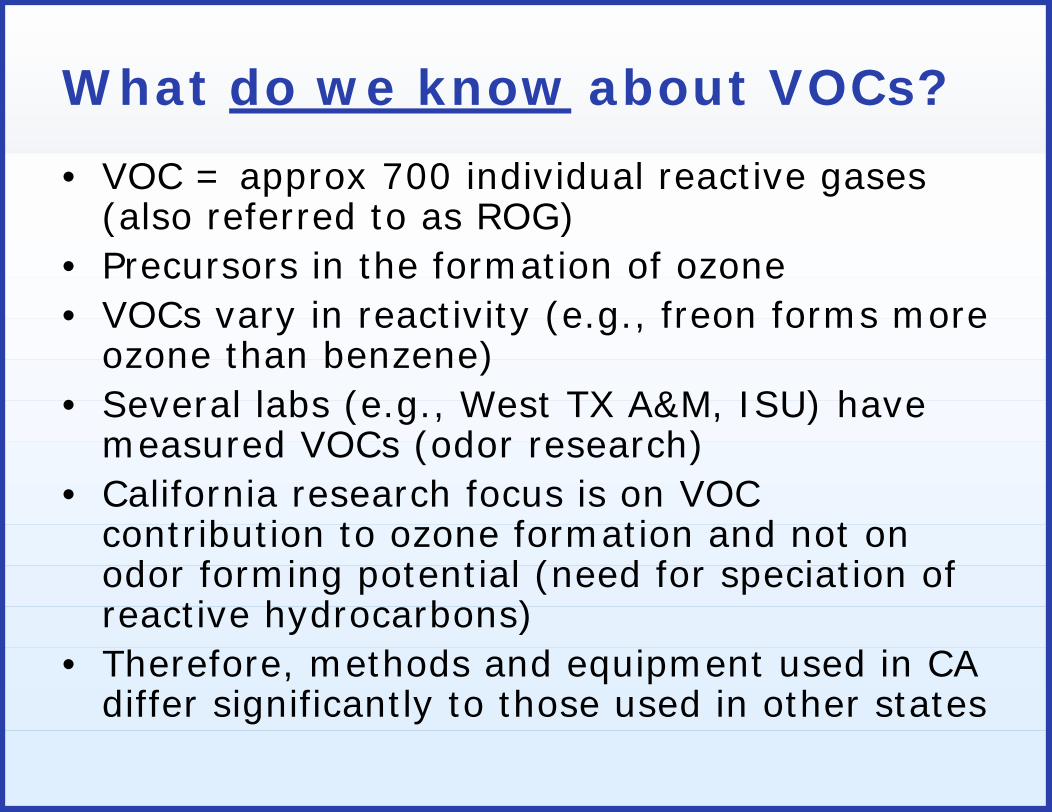
• VOC = approx 700 individual reactive gases(also referred to as ROG)
• Precursors in the formation of ozone• VOCs vary in reactivity (e.g., freon forms more
ozone than benzene)• Several labs (e.g., West TX A&M, ISU) have
measured VOCs (odor research)• California research focus is on VOC
contribution to ozone formation and not onodor forming potential (need for speciation ofreactive hydrocarbons)
• Therefore, methods and equipment used in CAdiffer significantly to those used in other states
What do we know about VOCs?
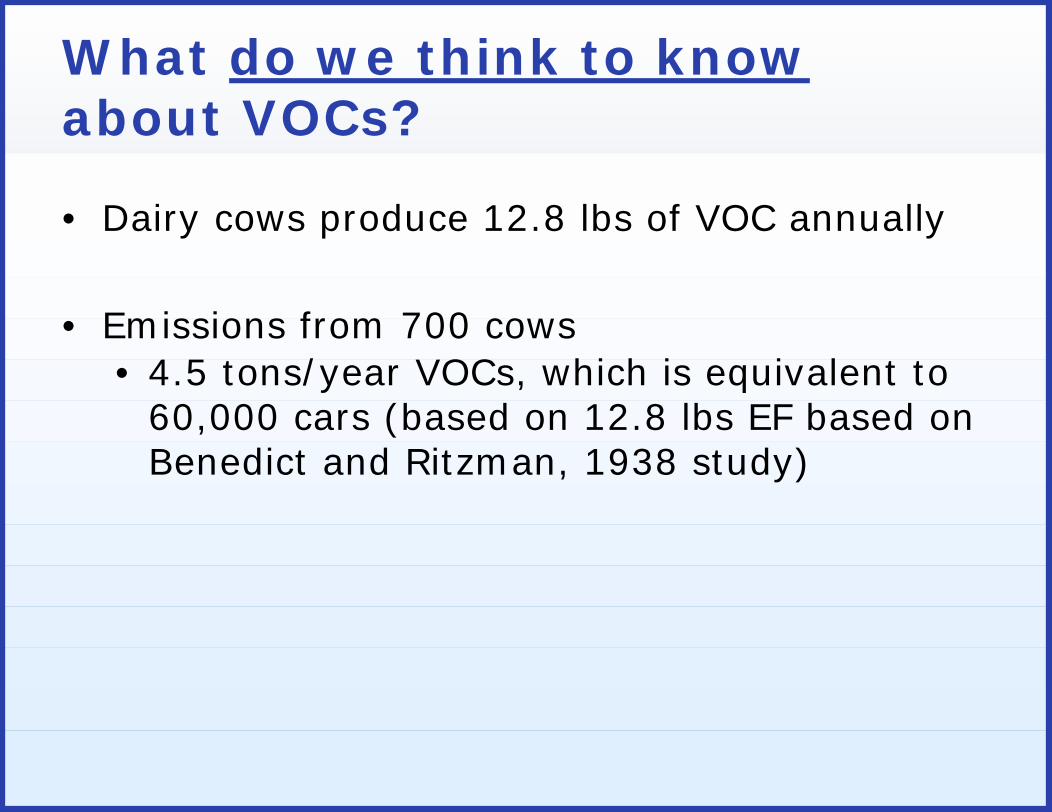
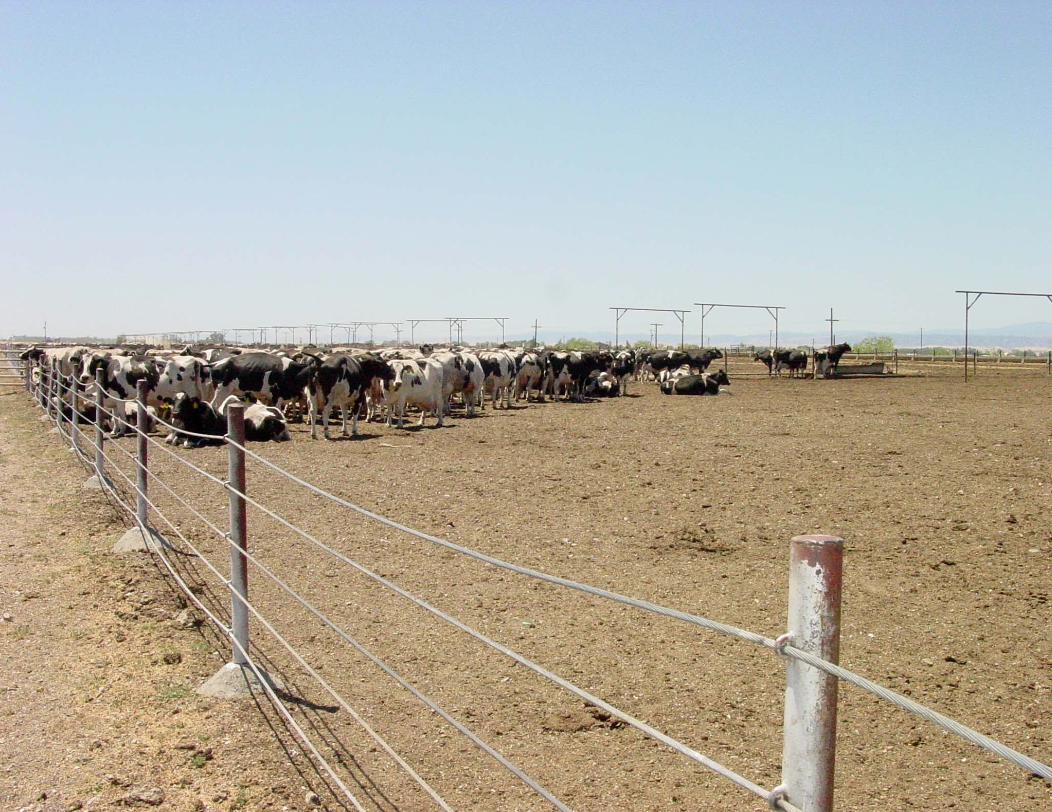
• Dairy cows produce 12.8 lbs of VOC annually
• Emissions from 700 cows• 4.5 tons/year VOCs, which is equivalent to
60,000 cars (based on 12.8 lbs EF based onBenedict and Ritzman, 1938 study)
What do we think to knowabout VOCs?
What do we need to know aboutVOCs?
• Methods to measure speciated VOCs• Dairy processes that lead to VOC
production• Speciated VOC compound lists from
dairy processes• Computations of identified VOCs with
their specific reactivity to assess ozoneforming potential
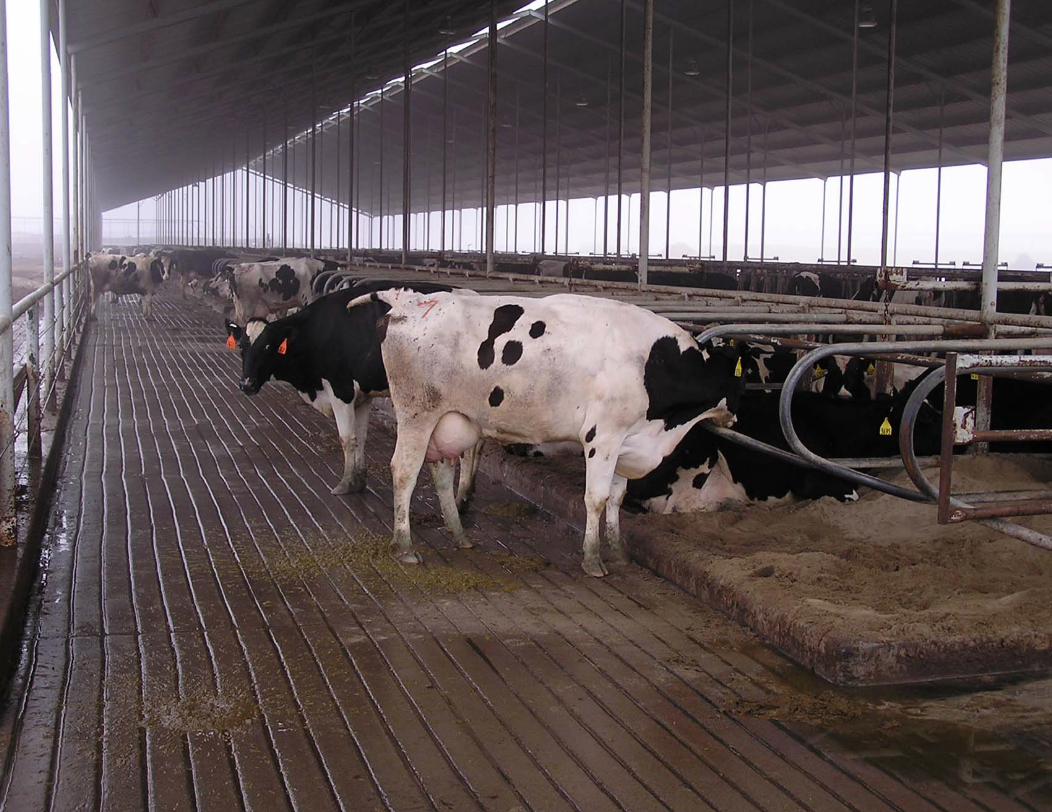
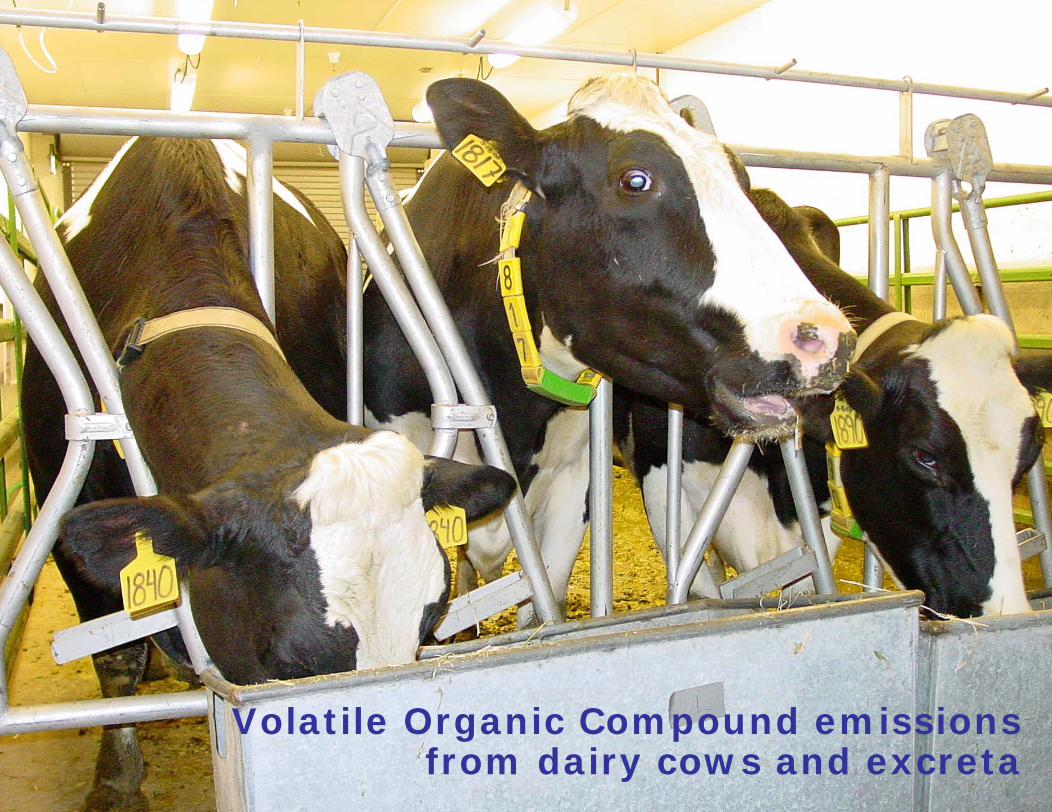
Volatile Organic Compound emissionsfrom dairy cows and excreta
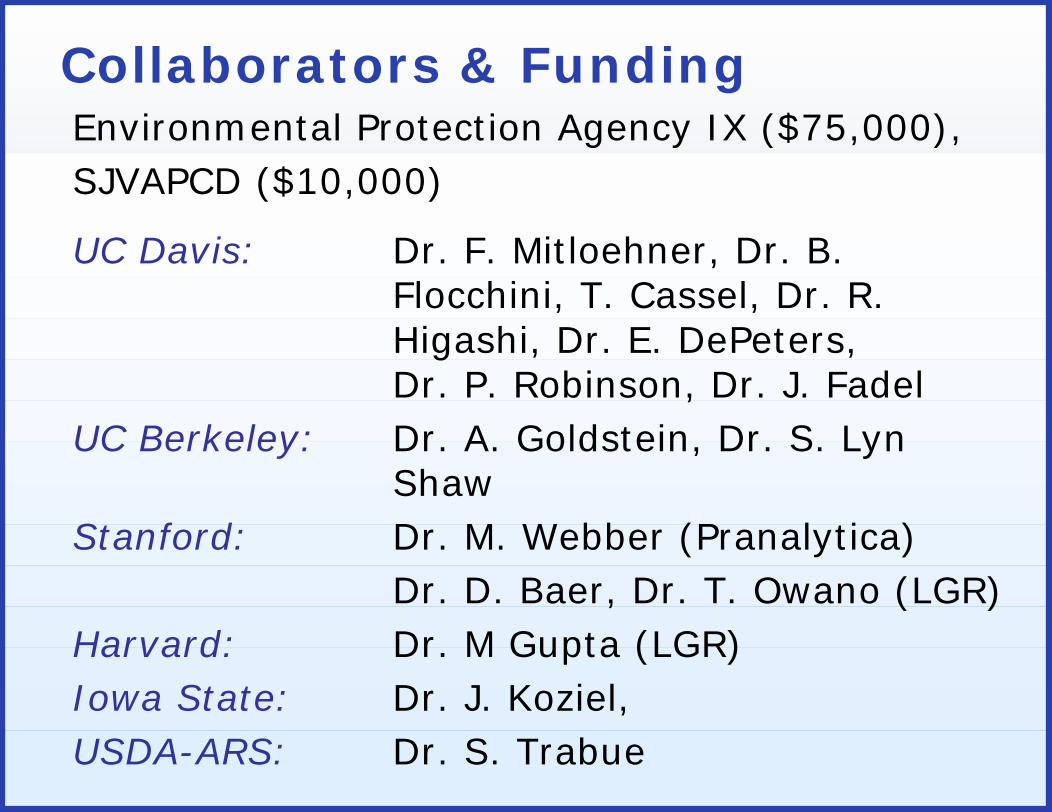
Collaborators & FundingEnvironmental Protection Agency IX ($75,000),SJVAPCD ($10,000)
UC Davis: Dr. F. Mitloehner, Dr. B. Flocchini, T. Cassel, Dr. R. Higashi, Dr. E. DePeters, Dr. P. Robinson, Dr. J. Fadel
UC Berkeley: Dr. A. Goldstein, Dr. S. Lyn Shaw
Stanford: Dr. M. Webber (Pranalytica)Dr. D. Baer, Dr. T. Owano (LGR)
Harvard: Dr. M Gupta (LGR)Iowa State: Dr. J. Koziel,USDA-ARS: Dr. S. Trabue

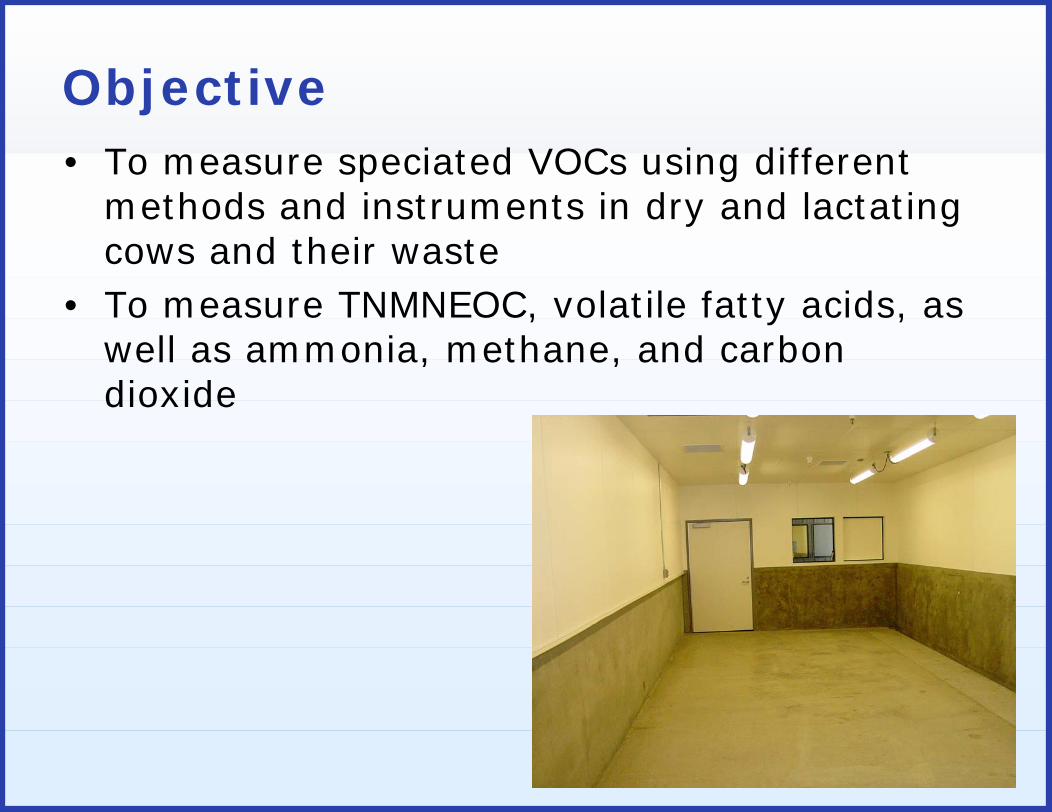
Objective• To measure speciated VOCs using different
methods and instruments in dry and lactatingcows and their waste
• To measure TNMNEOC, volatile fatty acids, aswell as ammonia, methane, and carbondioxide
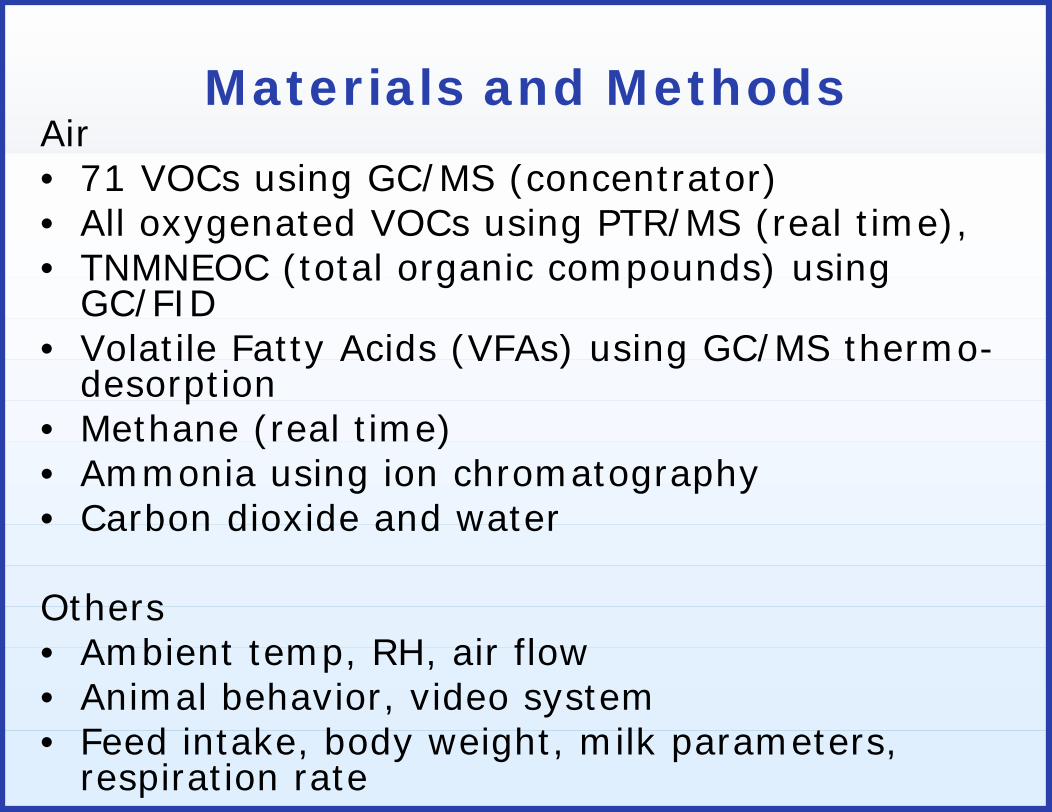
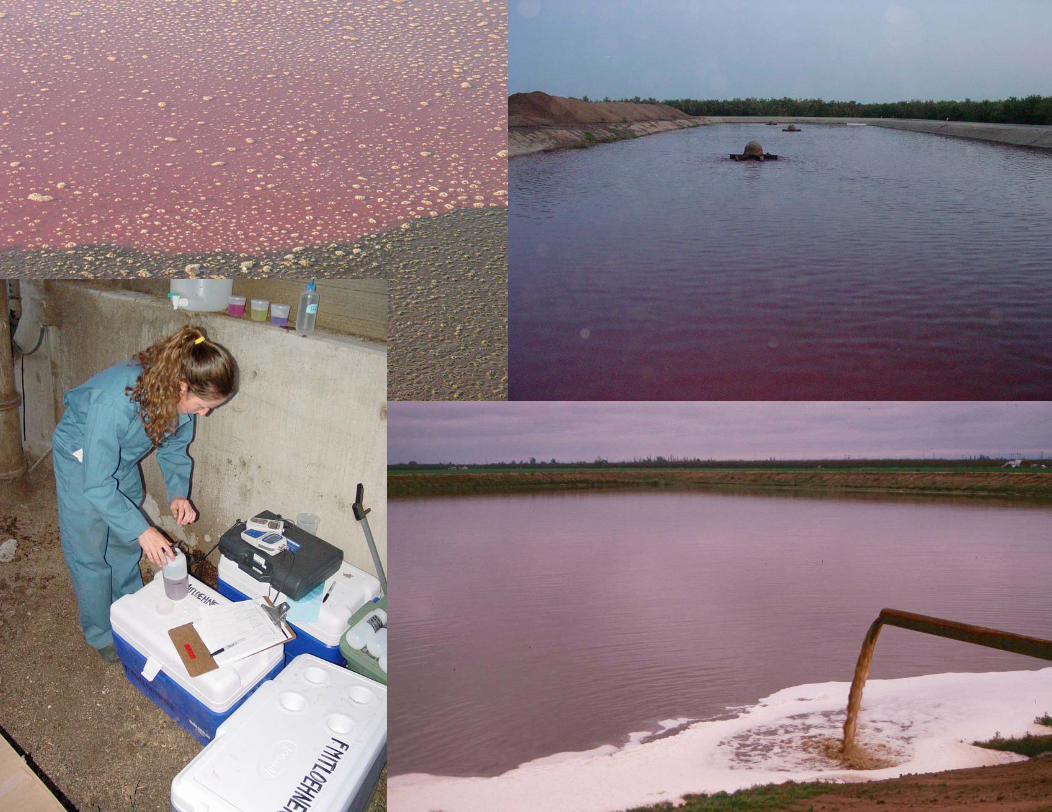
Materials and MethodsAir• 71 VOCs using GC/MS (concentrator)• All oxygenated VOCs using PTR/MS (real time),• TNMNEOC (total organic compounds) using
GC/FID• Volatile Fatty Acids (VFAs) using GC/MS thermo-
desorption• Methane (real time)• Ammonia using ion chromatography• Carbon dioxide and water
Others• Ambient temp, RH, air flow• Animal behavior, video system• Feed intake, body weight, milk parameters,
respiration rate
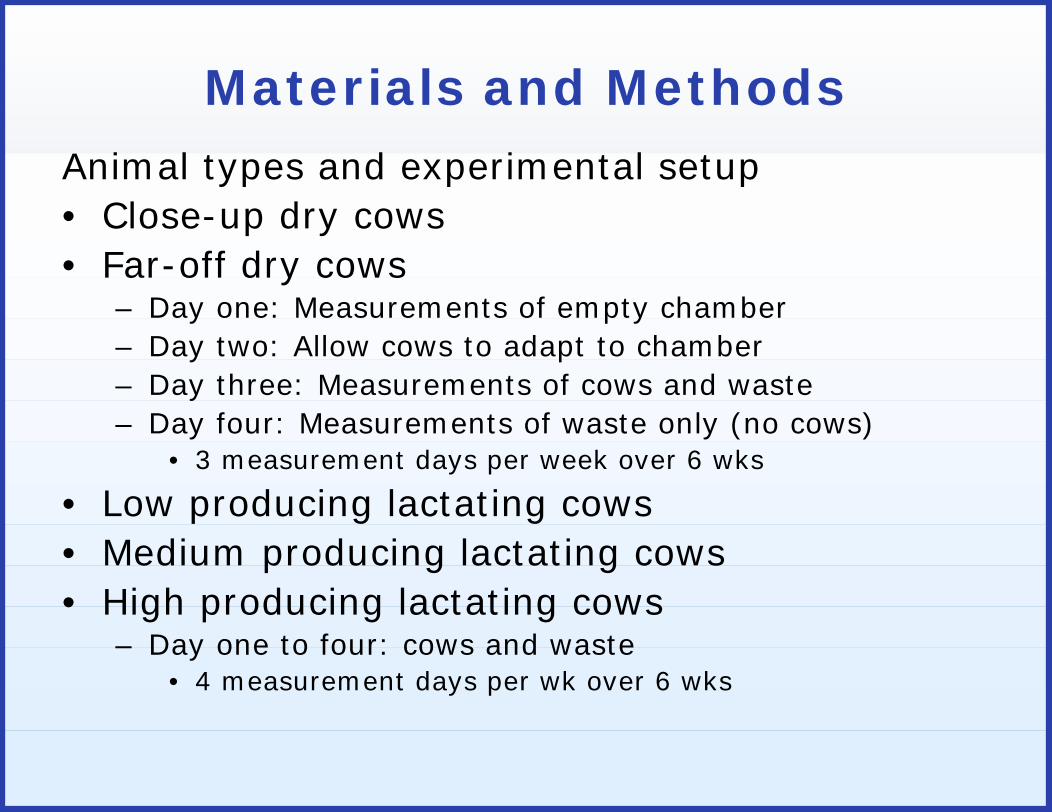
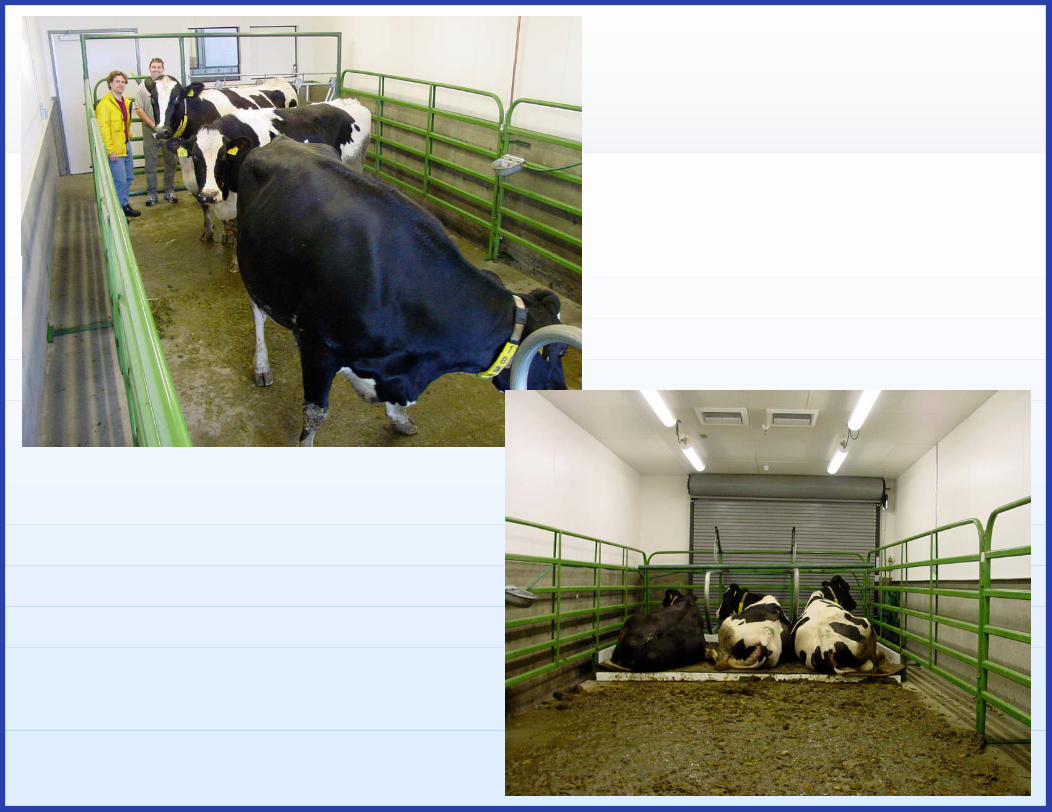
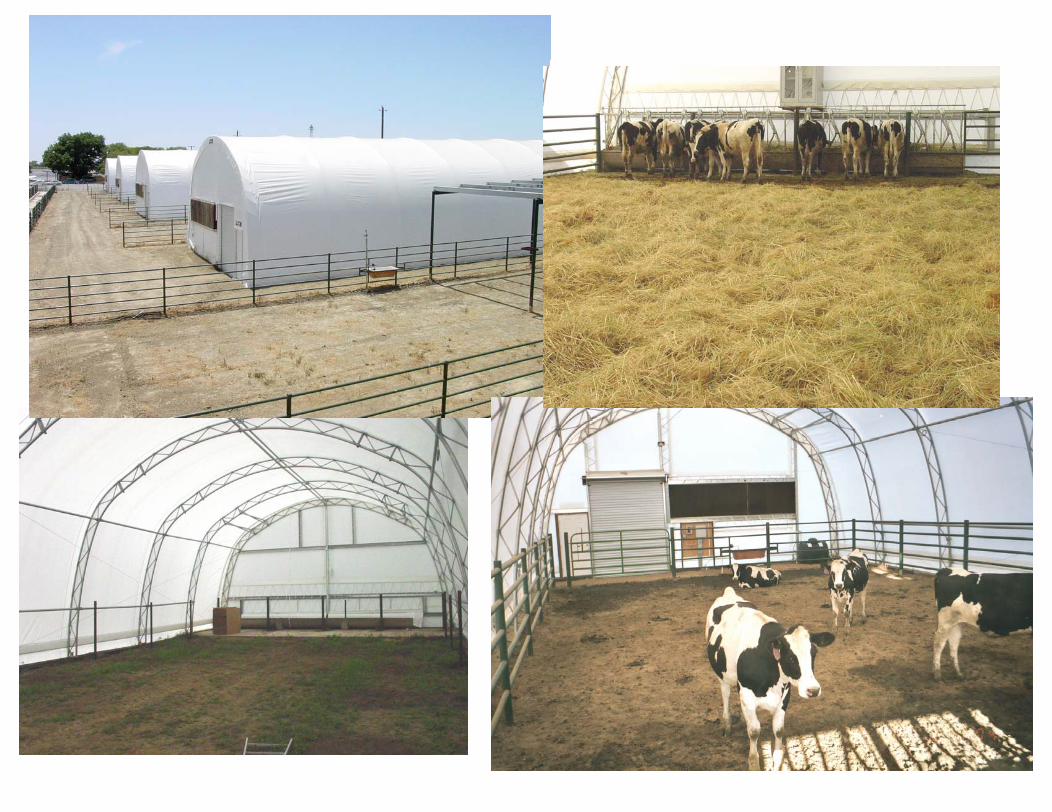
Materials and MethodsAnimal types and experimental setup• Close-up dry cows• Far-off dry cows
– Day one: Measurements of empty chamber– Day two: Allow cows to adapt to chamber– Day three: Measurements of cows and waste– Day four: Measurements of waste only (no cows)
• 3 measurement days per week over 6 wks
• Low producing lactating cows• Medium producing lactating cows• High producing lactating cows
– Day one to four: cows and waste• 4 measurement days per wk over 6 wks
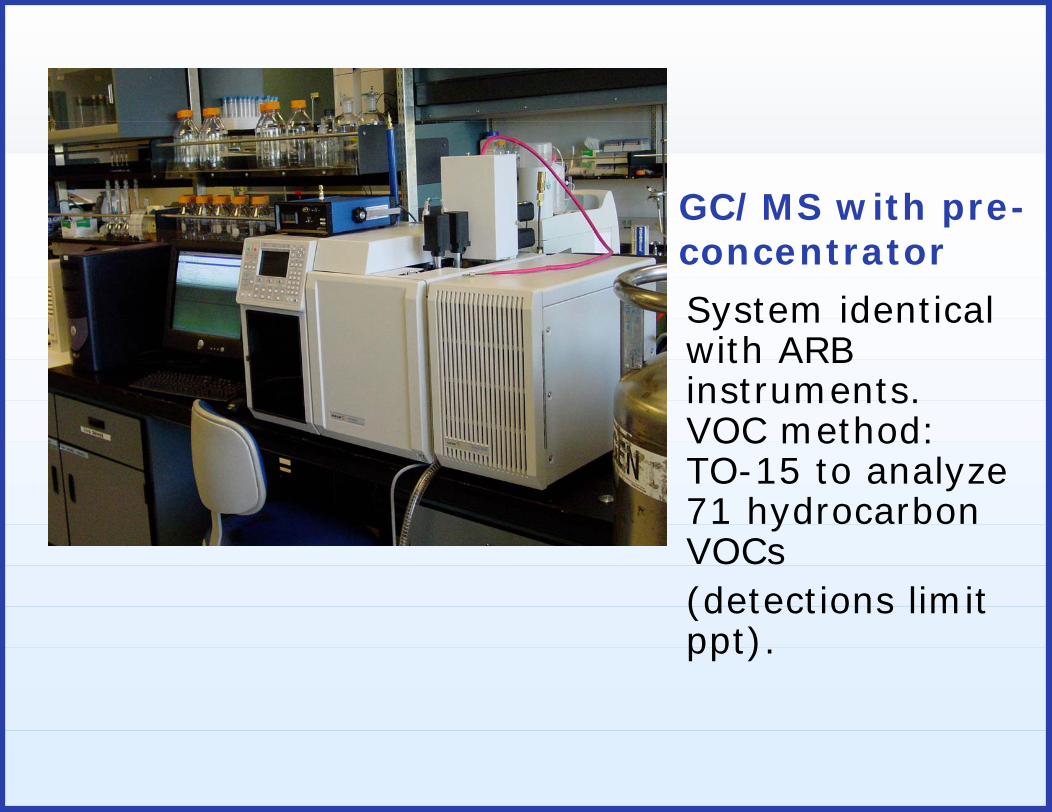
GC/MS with pre-concentrator
System identicalwith ARBinstruments.VOC method:TO-15 to analyze71 hydrocarbonVOCs(detections limitppt).
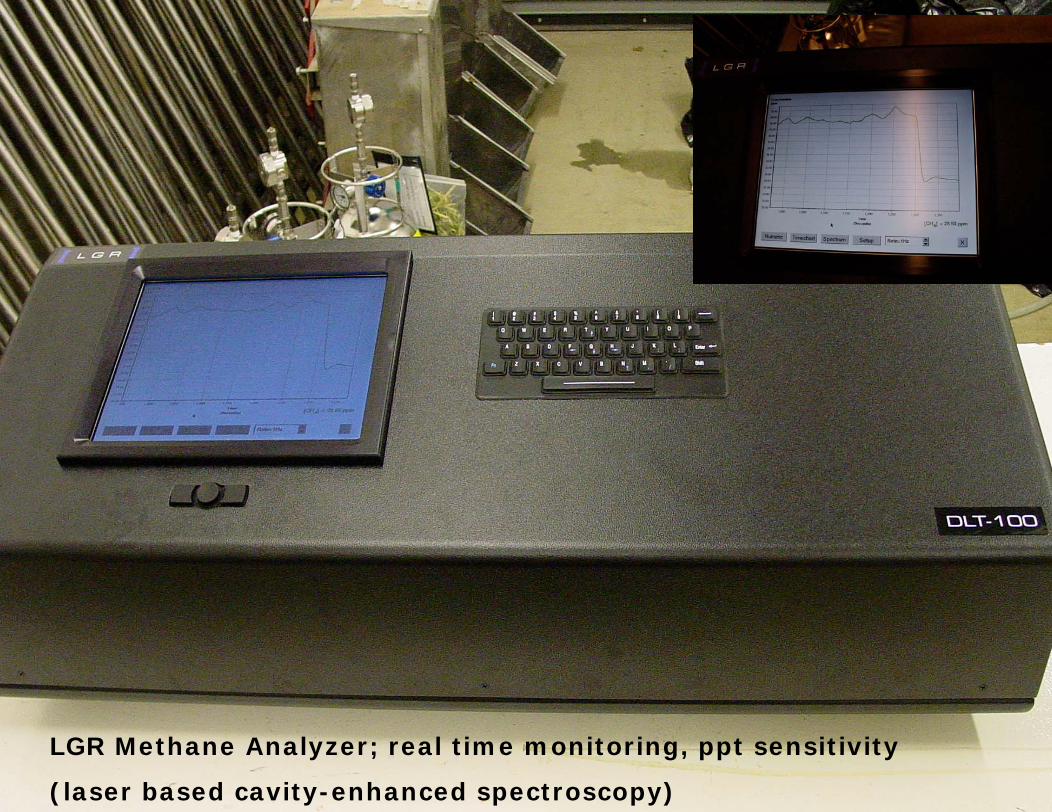
LGR Methane Analyzer; real time monitoring, ppt sensitivity
(laser based cavity-enhanced spectroscopy)
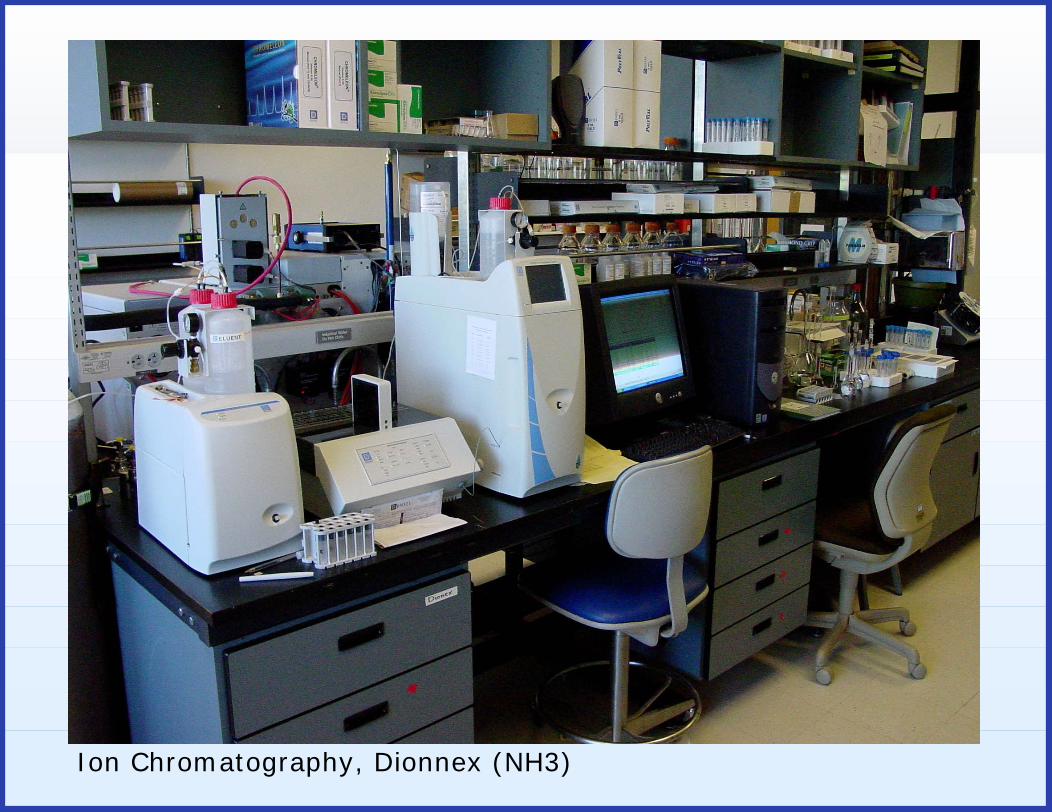
Ion Chromatography, Dionnex (NH3)
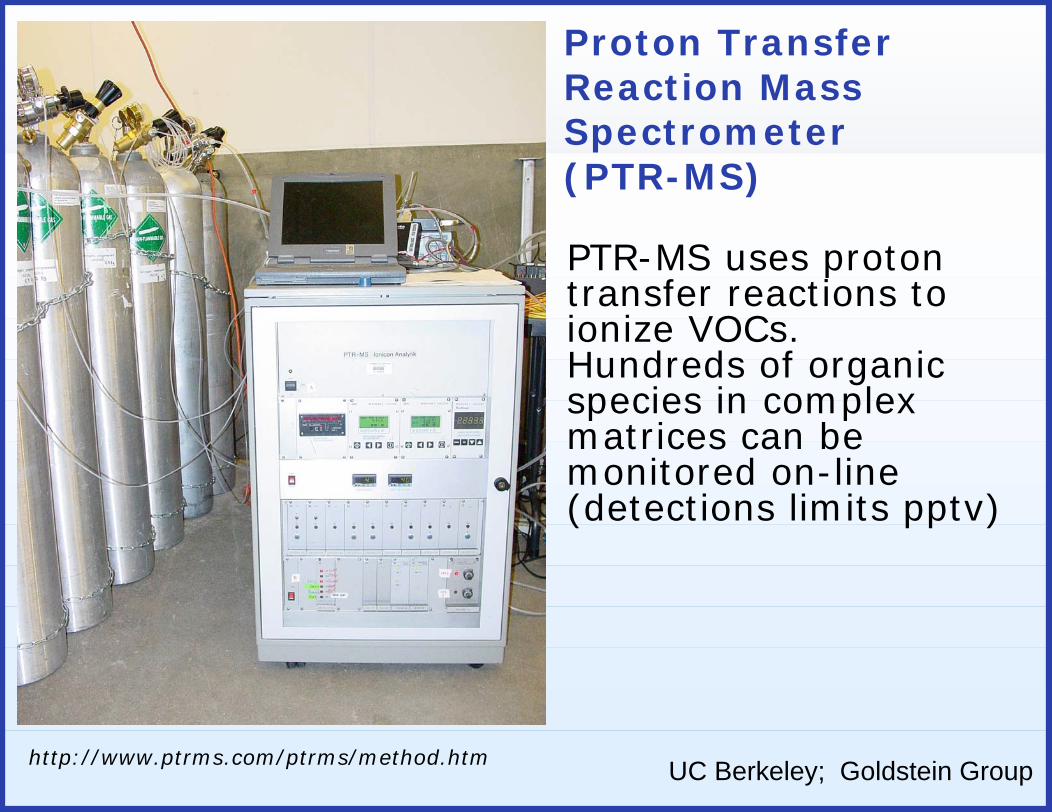
Proton TransferReaction MassSpectrometer(PTR-MS)
PTR-MS uses protontransfer reactions toionize VOCs.Hundreds of organicspecies in complexmatrices can bemonitored on-line(detections limits pptv)
http://www.ptrms.com/ptrms/method.htm UC Berkeley; Goldstein Group
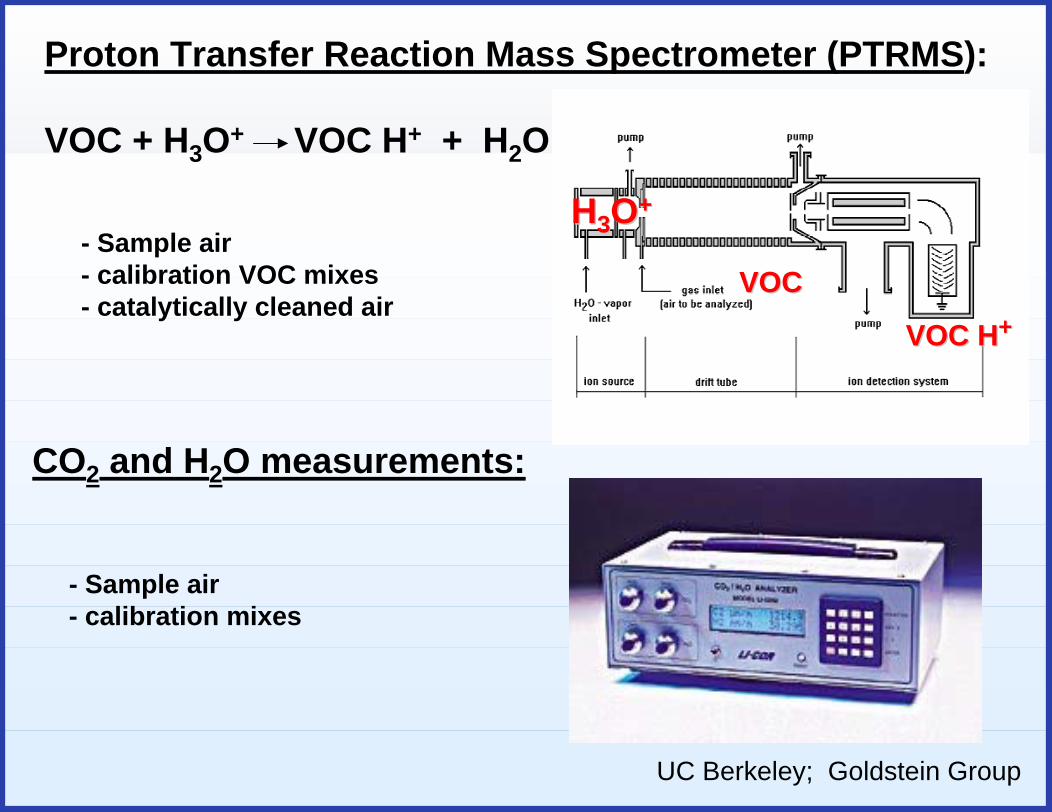
Proton Transfer Reaction Mass Spectrometer (PTRMS):
VOC + H3O+ VOC H+ + H2O
- Sample air - calibration VOC mixes - catalytically cleaned air
CO2 and H2O measurements:
- Sample air - calibration mixes
HH33OO++
VOC HVOC H++VOCVOC
UC Berkeley; Goldstein Group
GC/MS results
See Excel file…
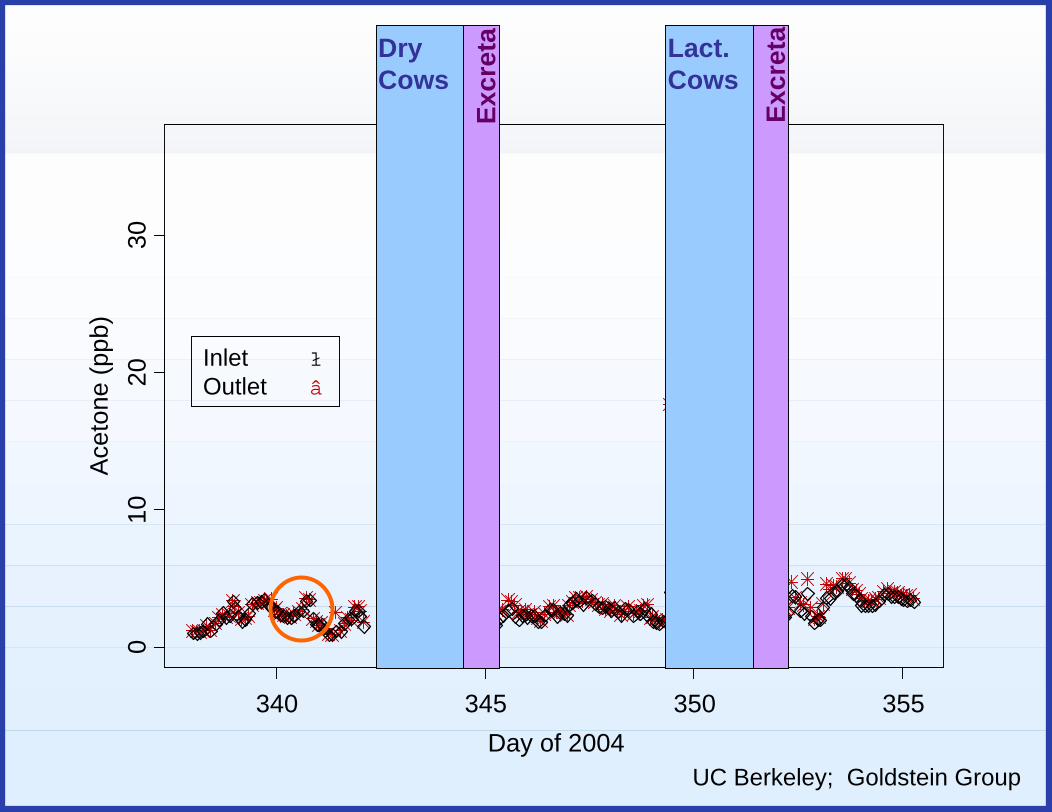
Day of 2004
Ace
tone
(ppb
)
340 345 350 355
010
2030
Excr
eta
Excr
etaDry
CowsLact.Cows
Inlet �
Outlet �
UC Berkeley; Goldstein Group
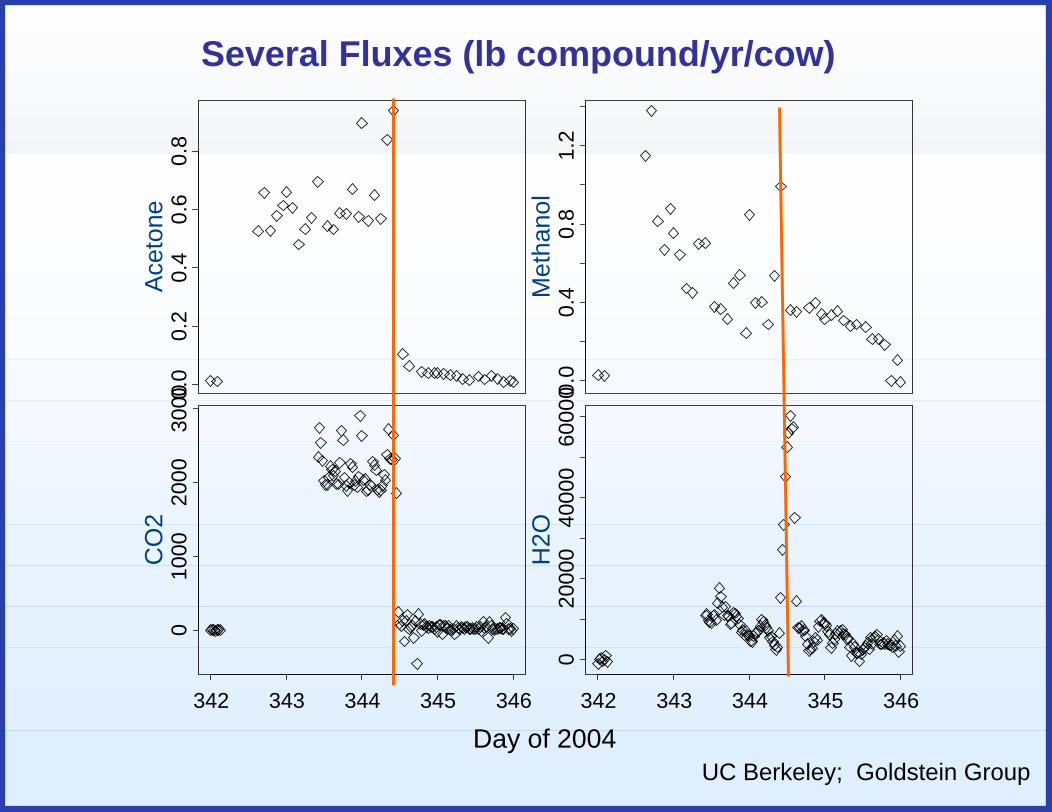
Several Fluxes (lb compound/yr/cow)
Day of 2004
0.0
0.2
0.4
0.6
0.8
Ace
tone
0.0
0.4
0.8
1.2
Met
hano
l
342 343 344 345 346
010
0020
0030
00C
O2
342 343 344 345 346
020
000
4000
060
000
H2O
UC Berkeley; Goldstein Group
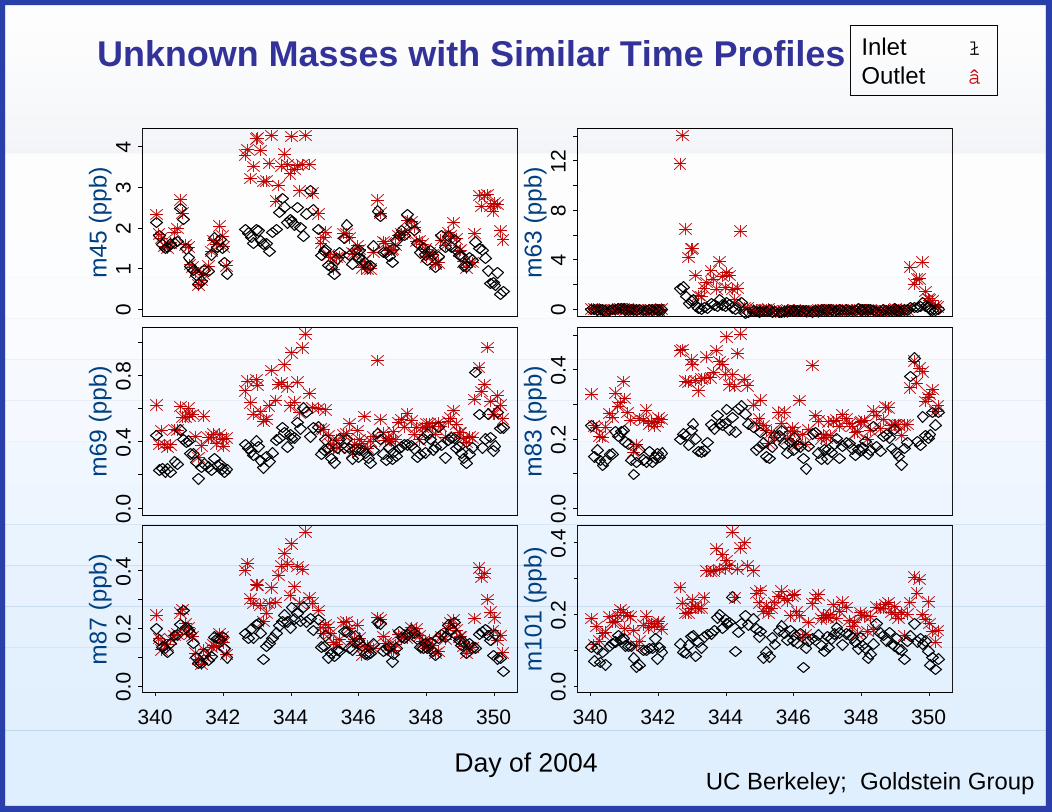
Unknown Masses with Similar Time Profiles Inlet �
Outlet �
01
23
4m
45 (p
pb)
04
812
m63
(ppb
)
0.0
0.4
0.8
m69
(ppb
)
0.0
0.2
0.4
m83
(ppb
)
340 342 344 346 348 350
0.0
0.2
0.4
m87
(ppb
)
340 342 344 346 348 350
0.0
0.2
0.4
m10
1 (p
pb)
Day of 2004UC Berkeley; Goldstein Group
Result summary
• Data is preliminary and studies are ongoing• Methodology is largely developed• Measured VOC (TO-15) emissions are
considerably lower than current ARB estimates• Summing up emission factors of individual
VOCs to one emission factor does not takedifferences in reactivity into consideration
• Cows themselves seem to emit more VOCsthan their excreta (for most measuredsubstances)
• Significant methane and ammonia emissions• TNMNEOC and VFA results are currently being
processed
Air Emissions MitigationTechniques and Technologies forCalifornian Dairies
PI: F. MitloehnerCo-PIs: R. Zhang, P. Robinson, J. Fadel, T. Harter SWRCB
Mitigation Research Objectives• Environmental management (e.g.,
water sprinkling of drylot pens,shade, frequent manure harvestfrom corrals, stocking rates)
• Nutritional management• Manure management (e.g.,
manure storage covers, anaerobicdigesters, aerators, pH control)
Measures: VOC, PM10, PM2.5, andNH3
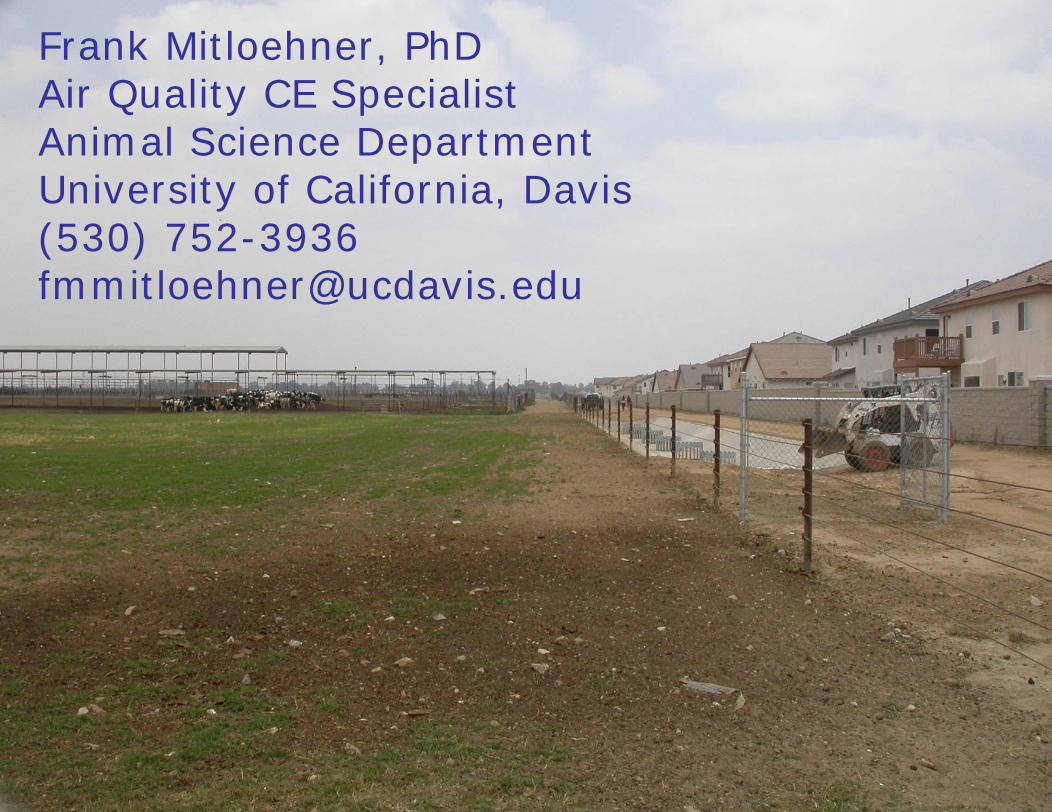
Frank Mitloehner, PhDAir Quality CE SpecialistAnimal Science DepartmentUniversity of California, Davis(530) [email protected]