Embed Size (px)
Citation preview
CF Vol. 18 (1&2), 2020
80
Volatility and Persistence in the Automobile Industry: Persistence as a Signal of Brand Loyalty Anthony Paul Andrews, International Business and Global Trade Research Institute, Governors State University
EXECUTIVE SUMMARY
During a product recall in the automobile industry, the manufacturer is uncertain of the extent to which the recall will affect sales and the manufacturer’s market share. This study examines the effect and persistence of automobile recalls on the manufacturers’ market share in the U.S. building on the signaling theory. Hypotheses were developed regarding the manner in which consumers view automobile recalls and the persistence it has on their consumption of recalled products. In particular, this study focuses on the 2010 Toyota recall. The results of this study demonstrate that recalls show little persistence in the long run. Keywords: 2010 Toyota recall, signaling, automobile manufacturer, vector autoregression, consumer behavior
INTRODUCTION
In recent years, there have been several product recalls by automobile firms that previously had stellar reputations in terms of quality control. For example, Toyota, which was known for its production quality control, was viewed by consumers and industry watchers alike as having been able to contest the U.S. automobile market with its attention to quality, design, and customer service. The quality of a particular automobile brand can most easily be determined by the customer’s experience. If product recalls tend to signal customers regarding product quality, then are recall shocks persistent or are they short lived? In other words, does a recall impact the sales and/or the market share in the months following a major recall and, if so, for what duration? Prior research has provided several salient approaches to view the impact of product recalls with respect to consumer behavior. Some approach the impact of recalls on the seller’s financial value (Ni et al., 2013), while others consider a behavioral approach based on the misconceptions of consumers for the probability of failure of particular products prior to purchasing the product (Spence, 1977). Nevertheless, others have examined the product recall process with respect to the impact on the firm’s financial viability, consumer misperceptions, and brand loyalty (Souiden & Pons, 2009; Mannering et al., 1991). Few studies, however, have examined the impact of product recalls in the automobile industry with respect to market structure and, in particular, the intertemporal impact of product recalls on the market share of the firm. This study addresses the latter point while shedding light on each of the other approaches. In particular, all the research streams that are addressed in prior studies can be unified in the theoretical lens of the signaling theory, which is useful for describing the behavior between the two parties and for reducing information asymmetry between them (Connelly et al., 2011; Spence, 2002). As the signaling theory has been used to generate positive and negative signals between the parties, the concept of signaling was utilized to investigate consumer responses to automobile recalls and to determine if the signal elicits a positive or negative response to recalls. In addition, this study attempts to measure the recall responses as signals with respect to the degree of persistence in a time series context. In other words, this investigation focuses on how a major recall affects, in particular, the market share of an automobile manufacturer over time.[7] By linking signal theory with the market share in a time series
7 Persistence is defined as the impact of a particular shock on a system that does not easily die out (Patterson, 2000, p. 210).
CF Vol. 18 (1&2), 2020
81
context as a model specification, this paper introduces a new approach in the study of product recalls pertaining to the U.S. automobile market. For the context of this analysis, the 2010 Toyota recall was studied because a sufficient period of time has elapsed to examine the intertemporal impact over a time horizon. In this paper, the signaling theory is linked with consumer preference responses to a recall on the basis of their information content for the product quality and brand loyalty. Thus, the firm’s signal of product quality and the consumer’s information content of brand loyalty should determine the attenuation in sales over time, as demonstrated in the massive recall that was experienced by Toyota in 2010.
A BRIEF HISTORY OF THE 2010 TOYOTA RECALL
The 2010 Toyota crisis began with a fatal car crash in Southern California in 2009 due to a ‘sticky gas pedal problem’, which caused the car to accelerate. It is believed that Toyota’s drive to increase its market share through continuous quality improvement, lean manufacturing, and long-term supplier relations as the ‘Toyota Way’ led to the company’s fast expansion. This forced Toyota to buy more parts from suppliers outside of its supplier association (Andrews et al., 2011). It is believed that this caused several issues, which resulted in the deterioration of product quality. This started to appear in 1999 with additional reported automobile accelerations in the 2002-2004 models. Further quality issues were exposed in October 2007, which resulted in Toyota losing its automatic recommendation from the Consumer Report’s magazine and its number one position in the J. D. Power Customer Retention Survey (Train & Winston, 2007). The fatal crash of an off-duty police officer in 2009 ultimately led to Toyota’s massive recall. During that period, there were more than 5,000,000 automobiles in the U.S. market alone (Andrews et al., 2011). Toyota’s competitors have also experienced recent and significant recalls. For example, Ford had recalls in 2009 and again in 2014, where the company recalled 1,390,000 of its SUVs in the U.S. market. In February 2014, General Motors recalled over 20 million vehicles with faulty ignition switches. Moreover, due to the penalties paid by Toyota, more auto companies may be addressing recall issues more promptly, as several major automobile companies have since registered recalls with the National Highway Traffic Safety Association (NHTSA). Although these later recalls, especially the recent General Motors recall, may be larger and more significant than the 2010 Toyota recall, sufficient time has not elapsed to examine consumers’ response with respect to declining and/or later recovery of sales. However, the time lapse for the 2010 recall has been sufficient to generate consumer responses to the recall and allow for a test of their response to a significant automobile recall. In addition, the adjustment can be examined in the context of intertemporal persistence of a major automobile recall in terms of Toyota’s and its major competitors’ market share. Thus, this study attempts to measure the impact and persistence of a recall on consumer and firm behavior in the U.S. automobile market in an intertemporal context.
THEORY AND HYPOTHESES DEVELOPMENT
Several studies have investigated consumer response behavior to recalls from many viewpoints. Hoffer et al. (1992) assessed the impact of recall-specific variables in terms of the automobile recall response rates. They determined that U.S. owners of Japanese and European automobiles were significantly less likely to respond to a recall than owners of American vehicles, which is consistent with previous studies. Spence (1977) examined recalls in markets in which the products are sold with regulatory intervention. Spence noted that when insurance is involved, the problem of a moral hazard arises. In another investigation, Souiden and Pons (2009) noted that some researchers (Wynn & Hoffer, 1976; Harrison et al., 1982) determined that recalls did not negatively affect the purchase responses of consumers from the same automobile dealers. However, other researchers (Pletzman, 1985; Weinberger et al., 1981) presented evidence that indicates adverse effects on the sales and market share. Their review also identified several factors that may influence customer responses to recalls. For example, they cite the strength of the brand (or reputation), the structure of a firm’s crisis management of a recall, and the media’s and/or government’s influence on the recall response. Their research also supports the results that indicate that voluntary recalls by particular types of firms may have a positive impact on future sales. Meanwhile, firms that refuse to acknowledge recalls suffer a significant negative impact on future sales.
CF Vol. 18 (1&2), 2020
82
In a more empirically based context, Mannering et al. (1991) developed an econometric model of brand loyalty on the decline in the market share of American automobiles. They found that the decline in brand loyalty explained 35% of the 3.74% decline in the market share during the period between 1979 and 1989. The remaining loss is attributable to vehicle attributes and socioeconomic changes. Rupp and Taylor (2002) found that the government automobile recall regulatory agency, NHTSA, was more likely to initiate larger, less hazardous recalls that involves older models, financially weak firms, and reported injuries. In addition, they concluded that firms conduct recalls when the benefits (reduced expected liability) exceed the expected cost of the repairs.[8] Barber and Darrough (1996) documented significant and negative market reaction to automobile recall announcements and ‘long term direct and indirect costs, with respect to the value of the firm.’ More recently, Gokhale (2014) estimated that the 2010 Toyota recall would have resulted in a 19% decline in the company’s cumulative abnormal returns.[9] Further, Hartman (1987) used a hedonic pricing model for 1980 automobile sales. Hartman determined that the post-oil embargo period that reflected the introduction of GM’s high-quality X-cars had a diminished resale for these cars, but it did not affect the value of other automobiles (cross-product effect).
According to the theory of perceived risk, consumers in non-reversible purchase decisions (e.g. automobile purchases) search for consonant versus dissonant information (Frey, 1986), which points to the fact that consumers are more likely to trust brand strength and/or loyalty as a way to search for information on a particular automobile. Train and Winston (2007) suggested that consumer preferences and, more importantly, brand loyalty is intricately linked to a firm’s development, maintenance, and protection of its market share. In addition, they found that GM’s loss in the market share during the 1980s could be explained by the ‘… [increasing] intensity of Americans loyalty for Japanese [automobiles].’ They further infer a significant positive relationship between brand loyalty, market share, and market structure. Andrews et al. (2011) determined that Toyota’s recent efforts to become the top selling automaker in the global market place might have led to some unfavourable changes in its supply chain management practices. This also resulted in Toyota tarnishing some of its core values with respect to the ‘Toyota Way,’ which was partially responsible for the massive recall. As brand loyalty is based on the consumer’s intertemporal experience of product quality, the manufacturer’s image, and the consumer’s repurchase intention, it has an effect on the product attributes, which can affect consumer demand. This can have an influence on the firm’s incentives to invest in product quality (Freedman et al., 2012). The literature seems to support several research streams that can influence positive and negative factors of product recall. All of these can be associated with some form of positive and/or negative asymmetric information. Thus, the signaling theory is fundamentally concerned with reducing information asymmetry between two parties.
SIGNALING AS A MECHANISM FOR REDUCING ASYMMETRIC INFORMATION
Spence (1977) examined how product guarantees can act as signals of reliability in regulated markets. The concept of signaling was developed by Spence (1973, 2002) in which elements with a perceived set of attributes cannot be observed; however, they can have a positive or negative effect on the firm. Signaling reduces the information asymmetry between the two parties so that a recall signal can provide information to automobile customers. For example, this would result in information that the product quality was inferior, which would have a deleterious impact on product sales. Connelly et al. (2011) provided an extensive review of the signaling theory and noted its extensive use in corporate governance, entrepreneurship, and other management concepts. The basic structure of the signaling model is one of a signaler to a receiver, an interpretation of the signal, and a feedback mechanism with the signaler having, ‘a privileged perspective regarding the underlying quality of some aspect of the product’ (p. 44). In this study, the signaler represents the firms in the U.S. automobile market and the receivers are the consumers in the product market with asymmetric information on the quality of the product through recall information (see Figure 1). This study does not focus on recall signals to stakeholders such as shareholders or investors; instead, this study is focused on the consumers of the product. As indicated above, the signal carries information from the firm to the consumer regarding product quality, while the consumer’s response signal is in terms of brand loyalty, which is based on positive signals. Negative signals, such as a significant recall, can result in a negative impact on brand loyalty, thereby attenuating
8 They also note that firms tend to miscalculate the benefits and costs of a recall (p. 143). 9 An abnormal rate of return, which can be positive or negative, is defined as the difference between either the rate of return minus is market rate of return or the difference between the rate of return minus its expected rate of return with the latter adjusted for volatility (Reilly & Brown, 2000, p. 220).
CF Vol. 18 (1&2), 2020
83
sales of the firm. These negative signals can lead to sharp sales reductions, which can result in a declining market share. The degree of persistence of the reduction in sales is a feedback signal to the firm in regard to the consumer’s brand loyalty and/or confidence in the firm’s ability to solve the recall problem. As Spence stated, “a product should be thought of as a bundle of characteristics: a price, a distribution over the space of possible product failures, and an insurance policy … or guarantee against product failure” (1977, p. 561).
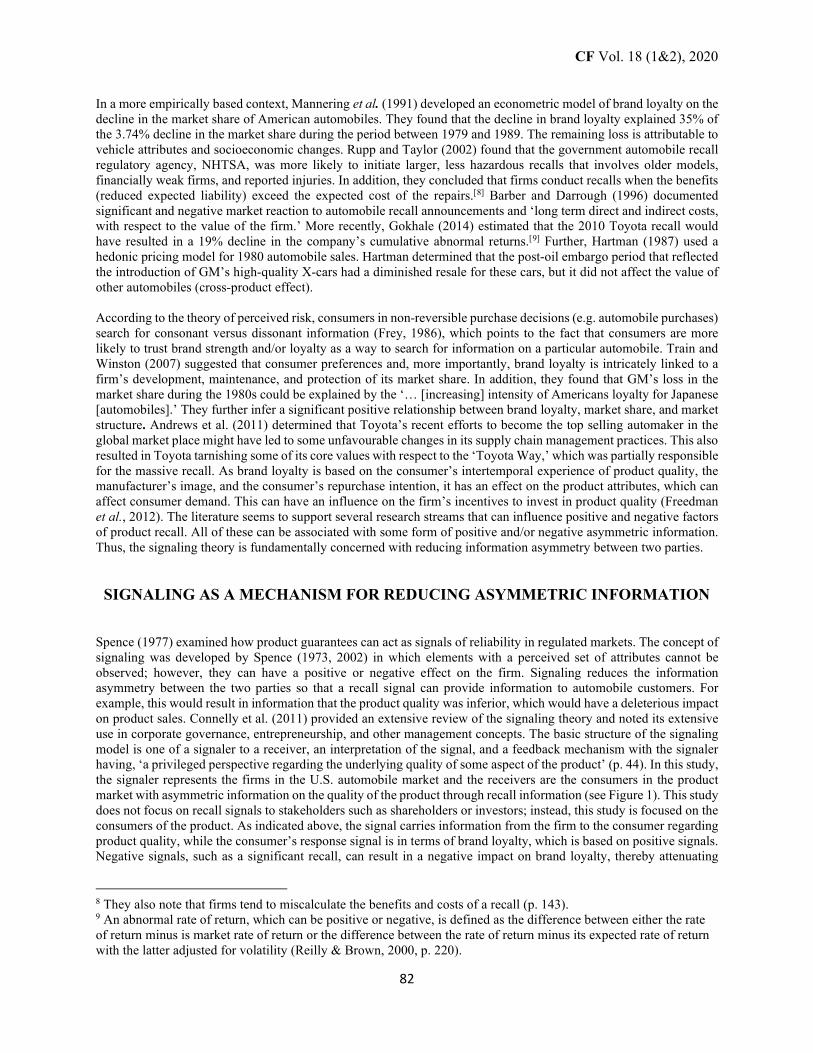
FIGURE 1 Toyota organization architecture.
Start Firm, Organizational, & Production Process: Production Output The Toyota Way Quality Sales Impact (+, -) Reputation Signal Recall Shocks Customer Preferences & Perceptions After reviewing signaling theory research in major management publications between 2000 and 2009, Connelly et al. (2011) found only two sources that focus on reputation and/or reliability: signals to avoid hazards and adverse selection (Coff, 2002) and signal honesty (Busenitz et al., 2005; Sanders & Boivie, 2004). Ni et al. (2013) surveyed the literature in terms of the impact product recall announcements have on retailers and their role as supply chain members while citing studies that focus on the automobile industry (Rupp, 2004; Barber & Darrough, 1996; Bromiley & Marcus, 1989; Hoffer et al., 1987; Jarrell & Peltzman, 1985). After focusing on automobile recall studies, it was determined that two of the five recalls had a significant financial impact and one’s impact was not available. This investigation was unable to find any article that significantly deals with the signaling theory and automobile recalls.
From an analytical perspective, we would expect that the signaling theory represents the theoretical lens, which transmits information in an asymmetric environment between the signaler (automobile firms) and receivers (automobile customers) at the retail level. The signal can transmit information on firm reputation with respect to market reactions to product defects. On the one hand, a firm’s recall history could be disadvantageous to the firm’s reputation as it can result in reduced sales; thus, resulting in a loss in the market share. On the other hand, a firm’s good reputation can provide a signal to consumers with respect to product quality. The question of interest is what is the reaction to a firm’s market share in light of a significant recall, such as the 2010 Toyota recall?
H1: The larger the number of firm recalls (severity), the shorter the response to customer sales.
The usefulness of a signal to the receiver depends on the extent to which the receiver responds to their signal’s reliability (Connelly et al., 2011, p. 52). It is believed that the reliability of the signal may also be in response to longer-term response signals on the product quality and reliability. In other words, if there is a history of product reliability, the magnitude of the receiver’s response may be obfuscated. On the one hand, if the product has strong product reliability, the receiver’s response may be small. On the other hand, if the magnitude of the recall is large or if there has been an increasing history of recalls, the response may be significant. One way to distinguish between these situations is to have some empirical specification and/or test for the deepness and duration (persistence) of a recall shock.
V
V
CF Vol. 18 (1&2), 2020
84
H2: The larger the number of firm recalls (severity), the more persistent the shock.
The 2010 recall, as discussed above, was Toyota’s most significant recall since its existence. The steepness of the decline in its market share due to a recall shock can be based on several factors, such as brand loyalty. Mannering et al. (1991) pointed to the deterioration in the loyalty of consumers to the products of U.S. manufacturers, which can be attributed to brand loyalty. In addition, the decline in the overall market share is due to the successful entry of Japanese automobiles in the U.S. market (p. 69). Thus, Train and Winston contend that gaining and keeping customers is a significant factor in preserving the market share; thus, long-term profitability in the U.S. automobile market is, ‘inextricably related to developing, maintaining, and protecting the market share … which consists of consecutive purchases of the same brand’ (2007, p. 1472; Jacoby &Chestnut, 1978 cf). An automobile, as a product, can be thought of as a bundle of characteristics such as a price, a distribution over the space of possible product failures, and an insurance policy; a consumer who is misinformed about the possibilities of product failure (e.g., a recall) is misinformed about the product (Spence, 1977). Thus, product quality, brand loyalty, and organization reputation are seen as attributes for signal information in cases of market failure due to asymmetric information. These intertwined concepts provide consumers of automobiles with information in terms of the quality of the product in a market characterized by information gaps, which includes consumer durables such as automobiles (Spence, 2002). In addition, how does the reputation affect 1) the consumer’s response to a recall and 2) what is the extent of the duration of a significant recall on a firm’s market share? The informational link between the firm’s quality of its product and the perception of quality by the consumer can be considered as a signal of the product’s reputation. The signaling theory is fundamentally concerned with reducing information asymmetry between the two parties. In the case of the automobile industry as the signal, it uses product quality or the reputation of the firms as the signal to reduce the asymmetric information. In addition, the strength of the signal is directly proportional to the quality or reputation of the product and, in the context of a recall situation, it has the ability to impact sales and, ultimately, the market share in the auto industry.
MARKET STRUCTURE ANALYSIS OF THE U.S. AUTOMOBILE INDUSTRY
The automobile industry, which has historically been defined as oligopolistic in nature, is characterized by strategic interactions, where the actions of one firm can change the internal and external market dynamics of the industry. An important feature of many oligopolistic settings, including the automobile industry, is that firms may make pre-commitment strategies to alter the conditions of future competition in a manner favorable to them (Mas-Collell et al., 1995, p. 414). In the early days of automobile production, the Sloan Strategy for General Motors in competition with Ford created multiple offerings and a periodic entry of new models. By the early 1970s, General Motors was clearly the dominant firm in the industry. In other words, the strategy used Bertrand Oligopoly pricing behavior to, ‘establish the magnitude of [prices changes, while] … other companies announced [or revised] their price changes,’ accordingly (Kwoka, 2002, pp. 8-9; Varian, 2006, p. 494).[10] However, the end result of the Bertrand strategy was inefficient as non-cooperative players could choose irrational strategies, which yielded inefficient outcomes (Romp, 1997, p. 264). This may be the case during the latter 1970s when the U.S. automobile industry was considered to be ‘asleep at the wheel’ when Japanese automobile producers were able to use somewhat ‘foot loose’ strategies to contest the U.S. market. While foreign companies have contested in the U.S. market previously as well, the timing of two oil shocks, in 1973 and 1979, were instrumental in assisting the entry of Asian automobile companies, along with their strategies of producing smaller and more gas efficient automobiles. The entrance of foreign competitors, especially the Japanese, introduced new strategic concepts for competitions, in which the elements were different from domestic automobile produces. This increased the contestability of the American automobile market. For example, in 1970, American automotive companies accounted for 87% of all vehicles sold in the domestic market. However, by 2005, the share of the domestic production had fallen to 57%. Most of this can be attributed to what Train and Winston (2007, p. 1472) empirically verified as the cost advantages and a clear focus on the high production quality or the relative value of their technology. This can be captured by using basic vehicle attributes such as prices, fuel economy, power, and over time, brand loyalty. The U.S. automobile sector can be described as a differentiated oligopoly with competing product lines based on price and preference-oriented
10 This is the well-known Bertrand Model of Oligopoly, in which firms independently set prices.
CF Vol. 18 (1&2), 2020
85
attributes. The U.S. automobile sector has also been characterized by openness based on increasing imports and having more competition due the superiority of the production from foreign companies and their managerial strategies. The result has been a decline in the domestic market share but also an increase in the overall quality and benefit to consumers in terms of a variety of highly substitutable products.
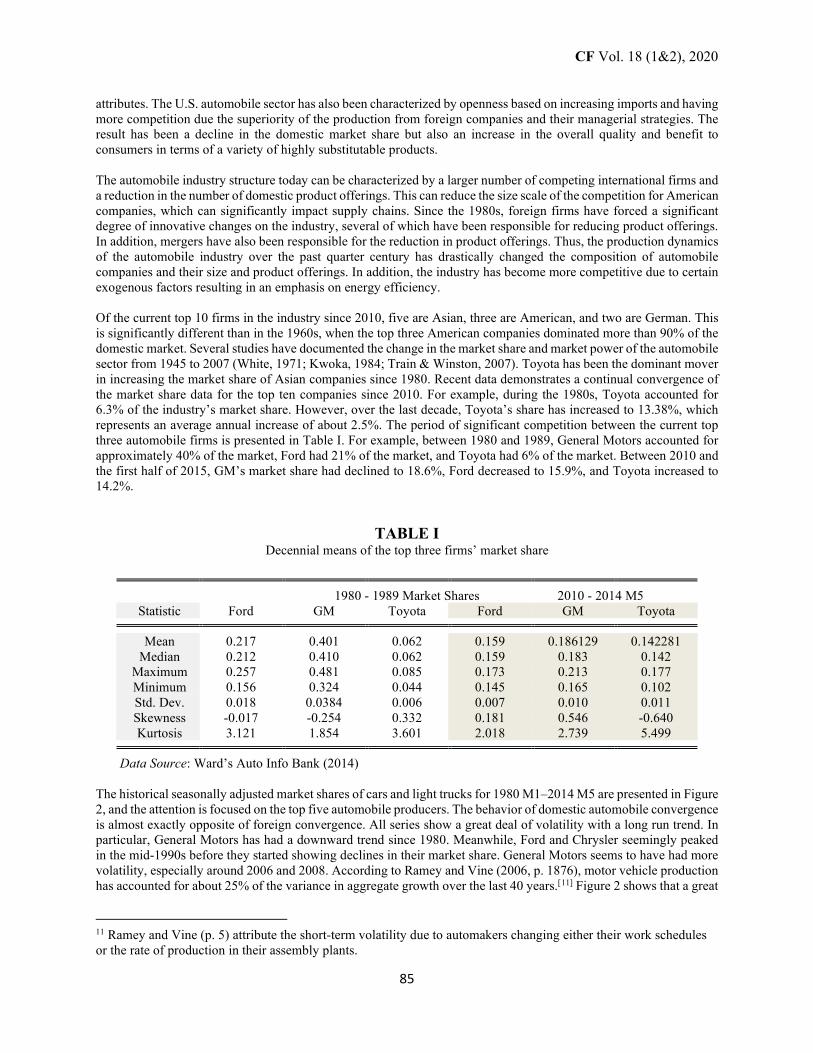
The automobile industry structure today can be characterized by a larger number of competing international firms and a reduction in the number of domestic product offerings. This can reduce the size scale of the competition for American companies, which can significantly impact supply chains. Since the 1980s, foreign firms have forced a significant degree of innovative changes on the industry, several of which have been responsible for reducing product offerings. In addition, mergers have also been responsible for the reduction in product offerings. Thus, the production dynamics of the automobile industry over the past quarter century has drastically changed the composition of automobile companies and their size and product offerings. In addition, the industry has become more competitive due to certain exogenous factors resulting in an emphasis on energy efficiency. Of the current top 10 firms in the industry since 2010, five are Asian, three are American, and two are German. This is significantly different than in the 1960s, when the top three American companies dominated more than 90% of the domestic market. Several studies have documented the change in the market share and market power of the automobile sector from 1945 to 2007 (White, 1971; Kwoka, 1984; Train & Winston, 2007). Toyota has been the dominant mover in increasing the market share of Asian companies since 1980. Recent data demonstrates a continual convergence of the market share data for the top ten companies since 2010. For example, during the 1980s, Toyota accounted for 6.3% of the industry’s market share. However, over the last decade, Toyota’s share has increased to 13.38%, which represents an average annual increase of about 2.5%. The period of significant competition between the current top three automobile firms is presented in Table I. For example, between 1980 and 1989, General Motors accounted for approximately 40% of the market, Ford had 21% of the market, and Toyota had 6% of the market. Between 2010 and the first half of 2015, GM’s market share had declined to 18.6%, Ford decreased to 15.9%, and Toyota increased to 14.2%.
TABLE I Decennial means of the top three firms’ market share
1980 - 1989 Market Shares 2010 - 2014 M5
Statistic Ford GM Toyota Ford GM Toyota Mean 0.217 0.401 0.062 0.159 0.186129 0.142281
Median 0.212 0.410 0.062 0.159 0.183 0.142 Maximum 0.257 0.481 0.085 0.173 0.213 0.177 Minimum 0.156 0.324 0.044 0.145 0.165 0.102 Std. Dev. 0.018 0.0384 0.006 0.007 0.010 0.011 Skewness -0.017 -0.254 0.332 0.181 0.546 -0.640 Kurtosis 3.121 1.854 3.601 2.018 2.739 5.499
Data Source: Ward’s Auto Info Bank (2014)
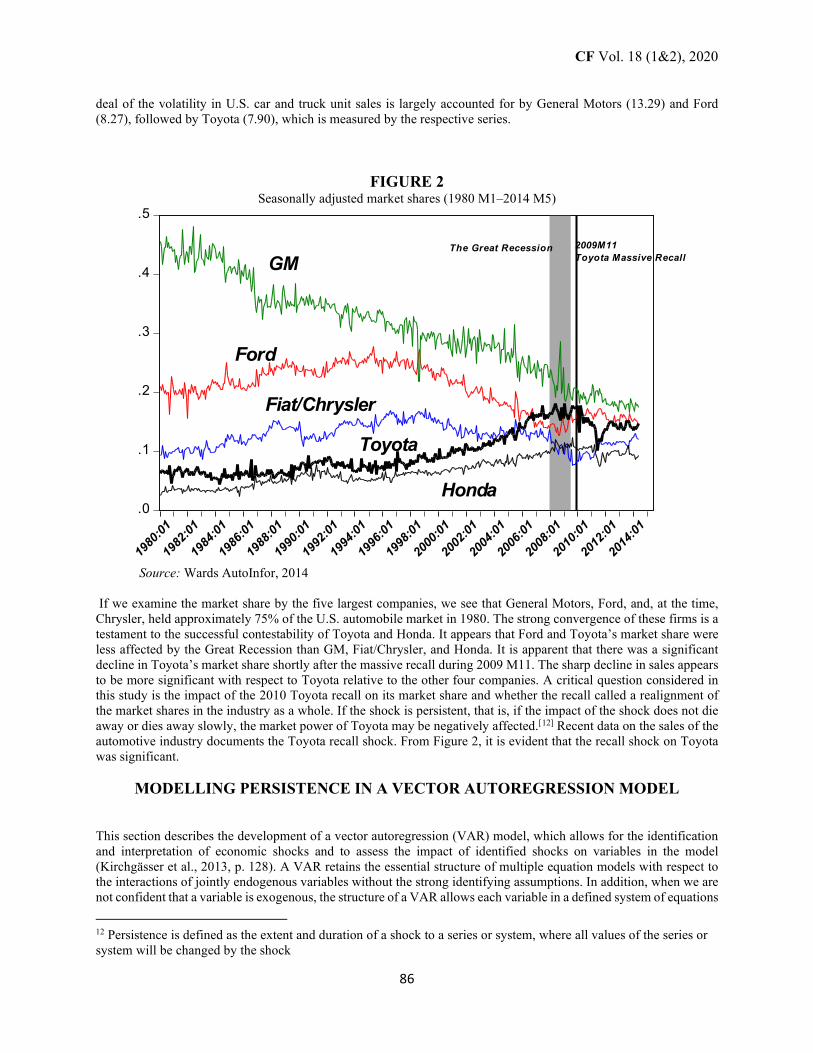
The historical seasonally adjusted market shares of cars and light trucks for 1980 M1–2014 M5 are presented in Figure 2, and the attention is focused on the top five automobile producers. The behavior of domestic automobile convergence is almost exactly opposite of foreign convergence. All series show a great deal of volatility with a long run trend. In particular, General Motors has had a downward trend since 1980. Meanwhile, Ford and Chrysler seemingly peaked in the mid-1990s before they started showing declines in their market share. General Motors seems to have had more volatility, especially around 2006 and 2008. According to Ramey and Vine (2006, p. 1876), motor vehicle production has accounted for about 25% of the variance in aggregate growth over the last 40 years.[11] Figure 2 shows that a great
11 Ramey and Vine (p. 5) attribute the short-term volatility due to automakers changing either their work schedules or the rate of production in their assembly plants.
CF Vol. 18 (1&2), 2020
86
deal of the volatility in U.S. car and truck unit sales is largely accounted for by General Motors (13.29) and Ford (8.27), followed by Toyota (7.90), which is measured by the respective series.
FIGURE 2 Seasonally adjusted market shares (1980 M1–2014 M5)
Source: Wards AutoInfor, 2014 If we examine the market share by the five largest companies, we see that General Motors, Ford, and, at the time, Chrysler, held approximately 75% of the U.S. automobile market in 1980. The strong convergence of these firms is a testament to the successful contestability of Toyota and Honda. It appears that Ford and Toyota’s market share were less affected by the Great Recession than GM, Fiat/Chrysler, and Honda. It is apparent that there was a significant decline in Toyota’s market share shortly after the massive recall during 2009 M11. The sharp decline in sales appears to be more significant with respect to Toyota relative to the other four companies. A critical question considered in this study is the impact of the 2010 Toyota recall on its market share and whether the recall called a realignment of the market shares in the industry as a whole. If the shock is persistent, that is, if the impact of the shock does not die away or dies away slowly, the market power of Toyota may be negatively affected.[12] Recent data on the sales of the automotive industry documents the Toyota recall shock. From Figure 2, it is evident that the recall shock on Toyota was significant.
MODELLING PERSISTENCE IN A VECTOR AUTOREGRESSION MODEL
This section describes the development of a vector autoregression (VAR) model, which allows for the identification and interpretation of economic shocks and to assess the impact of identified shocks on variables in the model (Kirchgässer et al., 2013, p. 128). A VAR retains the essential structure of multiple equation models with respect to the interactions of jointly endogenous variables without the strong identifying assumptions. In addition, when we are not confident that a variable is exogenous, the structure of a VAR allows each variable in a defined system of equations
12 Persistence is defined as the extent and duration of a shock to a series or system, where all values of the series or system will be changed by the shock
.0
.1
.2
.3
.4
.5
1980
:01
1982
:01
1984
:01
1986
:01
1988
:01
1990
:01
1992
:01
1994
:01
1996
:01
1998
:01
2000
:01
2002
:01
2004
:01
2006
:01
2008
:01
2010
:01
2012
:01
2014
:01
GM
Ford
Fiat/Chrysler
Toyota
Honda
2009M11Toyota Massive Recall
The Great Recession
CF Vol. 18 (1&2), 2020
87
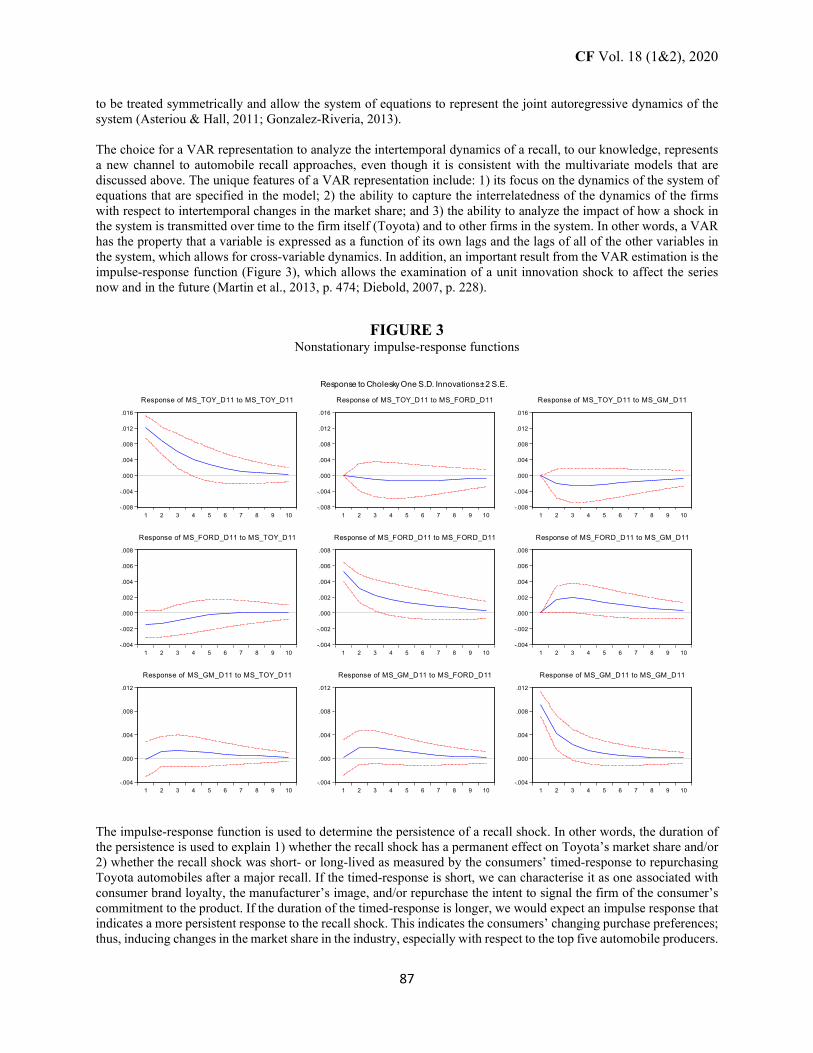
to be treated symmetrically and allow the system of equations to represent the joint autoregressive dynamics of the system (Asteriou & Hall, 2011; Gonzalez-Riveria, 2013). The choice for a VAR representation to analyze the intertemporal dynamics of a recall, to our knowledge, represents a new channel to automobile recall approaches, even though it is consistent with the multivariate models that are discussed above. The unique features of a VAR representation include: 1) its focus on the dynamics of the system of equations that are specified in the model; 2) the ability to capture the interrelatedness of the dynamics of the firms with respect to intertemporal changes in the market share; and 3) the ability to analyze the impact of how a shock in the system is transmitted over time to the firm itself (Toyota) and to other firms in the system. In other words, a VAR has the property that a variable is expressed as a function of its own lags and the lags of all of the other variables in the system, which allows for cross-variable dynamics. In addition, an important result from the VAR estimation is the impulse-response function (Figure 3), which allows the examination of a unit innovation shock to affect the series now and in the future (Martin et al., 2013, p. 474; Diebold, 2007, p. 228).
FIGURE 3 Nonstationary impulse-response functions
-.008
-.004
.000
.004
.008
.012
.016
1 2 3 4 5 6 7 8 9 10
Response of MS_TOY_D11 to MS_TOY_D11
-.008
-.004
.000
.004
.008
.012
.016
1 2 3 4 5 6 7 8 9 10
Response of MS_TOY_D11 to MS_FORD_D11
-.008
-.004
.000
.004
.008
.012
.016
1 2 3 4 5 6 7 8 9 10
Response of MS_TOY_D11 to MS_GM_D11
-.004
-.002
.000
.002
.004
.006
.008
1 2 3 4 5 6 7 8 9 10
Response of MS_FORD_D11 to MS_TOY_D11
-.004
-.002
.000
.002
.004
.006
.008
1 2 3 4 5 6 7 8 9 10
Response of MS_FORD_D11 to MS_FORD_D11
-.004
-.002
.000
.002
.004
.006
.008
1 2 3 4 5 6 7 8 9 10
Response of MS_FORD_D11 to MS_GM_D11
-.004
.000
.004
.008
.012
1 2 3 4 5 6 7 8 9 10
Response of MS_GM_D11 to MS_TOY_D11
-.004
.000
.004
.008
.012
1 2 3 4 5 6 7 8 9 10
Response of MS_GM_D11 to MS_FORD_D11
-.004
.000
.004
.008
.012
1 2 3 4 5 6 7 8 9 10
Response of MS_GM_D11 to MS_GM_D11
Response to Cholesky One S.D. Innovations ± 2 S.E.
The impulse-response function is used to determine the persistence of a recall shock. In other words, the duration of the persistence is used to explain 1) whether the recall shock has a permanent effect on Toyota’s market share and/or 2) whether the recall shock was short- or long-lived as measured by the consumers’ timed-response to repurchasing Toyota automobiles after a major recall. If the timed-response is short, we can characterise it as one associated with consumer brand loyalty, the manufacturer’s image, and/or repurchase the intent to signal the firm of the consumer’s commitment to the product. If the duration of the timed-response is longer, we would expect an impulse response that indicates a more persistent response to the recall shock. This indicates the consumers’ changing purchase preferences; thus, inducing changes in the market share in the industry, especially with respect to the top five automobile producers.
CF Vol. 18 (1&2), 2020
88
This study fit a three-equation model of the market shares for GM, Ford, and Toyota to investigate the intertemporal impact of recalls in the U.S. automobile market. Although this study only selected three of the total series, they provide an approximation of the entire U.S. industry because they represent the three most competitive of the top ten companies. In addition, General Motors and Toyota have experienced shocks to their sales and, ultimately, market share. Thus, the model traces the dynamic interactions of the market share for the three automobile manufacturers, which accounted for 61.47% of the sales from 1980 M1 to 2014 M5 and 49.39% between 2009 and 2014. In addition, this allowed the analysis of the impact of the changes in the market share between the three most competitive firms. The data consists of seasonally adjusted monthly sales of automobile and light truck data for the U.S. automobile market from 1980 M1 to 2014 M5 provided by Wards AutoInfo. Each series has been transformed into monthly market shares, which maintains the structural relationships of the series. The entire data set contains episodes of extremely high volatility over the analysis period.
The VAR with the three times series is represented by the market shares of Ford, General Motors, and Toyota, which can be presented as
(1)
where Ft is the market share of Ford; Tt is the market share of Toyota; GMt is the market share of General Motors; and vt
i represents the respective disturbances that are associated with each firm. In matrix notation, the model becomes
(2)
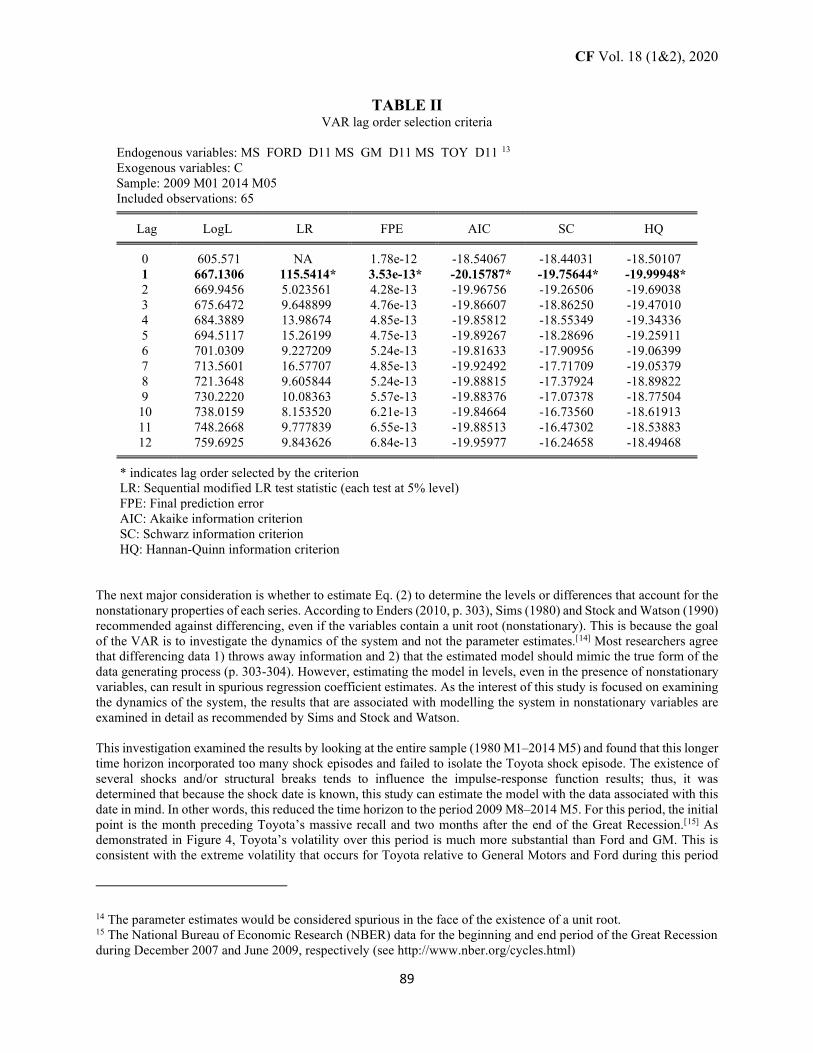
The model is specified as a VAR(3) with one lag, and the lag order is determined by five model selection criteria (see Table II). This criteria specifies a one period lag for the model, which is sufficient to summarise all of the dynamic correlations of the system (Hamilton, 1994, p. 261).
GMtttt
Ttttt
Ftttt
vFTGMvGMFTvGMTF
+++=
+++=
+++=
−−
−−
−−
11211130
11211120
11211110
βββββββββ
+
+
=
−
−
−
GMt
Tt
F
t
t
t
t
t
t
vvv
GMTF
GMTF
t
1
1
1
333231
232221
131211
30
20
10
βββββββββ
βββ
CF Vol. 18 (1&2), 2020
89
TABLE II VAR lag order selection criteria
Endogenous variables: MS_FORD_D11 MS_GM_D11 MS_TOY_D11 13 Exogenous variables: C Sample: 2009 M01 2014 M05 Included observations: 65
Lag LogL LR FPE AIC SC HQ 0 605.571 NA 1.78e-12 -18.54067 -18.44031 -18.50107
1 667.1306 115.5414* 3.53e-13* -20.15787* -19.75644* -19.99948* 2 669.9456 5.023561 4.28e-13 -19.96756 -19.26506 -19.69038 3 675.6472 9.648899 4.76e-13 -19.86607 -18.86250 -19.47010 4 684.3889 13.98674 4.85e-13 -19.85812 -18.55349 -19.34336 5 694.5117 15.26199 4.75e-13 -19.89267 -18.28696 -19.25911 6 701.0309 9.227209 5.24e-13 -19.81633 -17.90956 -19.06399 7 713.5601 16.57707 4.85e-13 -19.92492 -17.71709 -19.05379 8 721.3648 9.605844 5.24e-13 -19.88815 -17.37924 -18.89822 9 730.2220 10.08363 5.57e-13 -19.88376 -17.07378 -18.77504 10 738.0159 8.153520 6.21e-13 -19.84664 -16.73560 -18.61913 11 748.2668 9.777839 6.55e-13 -19.88513 -16.47302 -18.53883 12 759.6925 9.843626 6.84e-13 -19.95977 -16.24658 -18.49468 * indicates lag order selected by the criterion
LR: Sequential modified LR test statistic (each test at 5% level) FPE: Final prediction error AIC: Akaike information criterion SC: Schwarz information criterion HQ: Hannan-Quinn information criterion
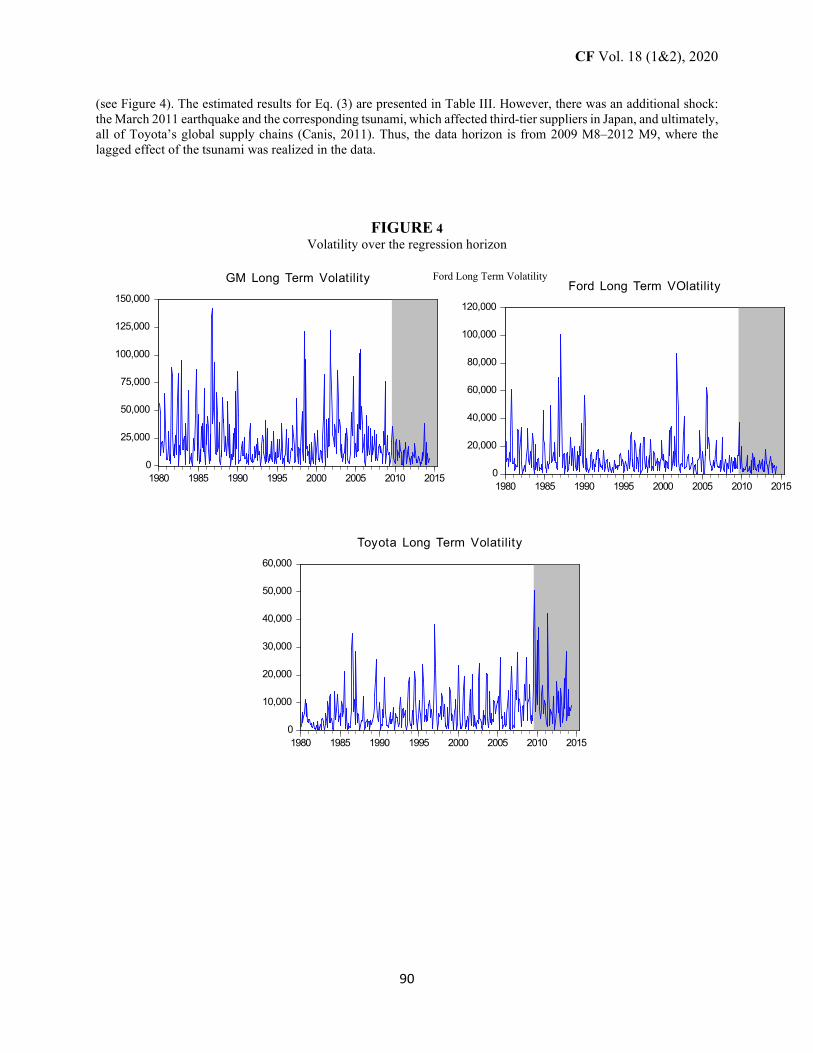
The next major consideration is whether to estimate Eq. (2) to determine the levels or differences that account for the nonstationary properties of each series. According to Enders (2010, p. 303), Sims (1980) and Stock and Watson (1990) recommended against differencing, even if the variables contain a unit root (nonstationary). This is because the goal of the VAR is to investigate the dynamics of the system and not the parameter estimates.[14] Most researchers agree that differencing data 1) throws away information and 2) that the estimated model should mimic the true form of the data generating process (p. 303-304). However, estimating the model in levels, even in the presence of nonstationary variables, can result in spurious regression coefficient estimates. As the interest of this study is focused on examining the dynamics of the system, the results that are associated with modelling the system in nonstationary variables are examined in detail as recommended by Sims and Stock and Watson. This investigation examined the results by looking at the entire sample (1980 M1–2014 M5) and found that this longer time horizon incorporated too many shock episodes and failed to isolate the Toyota shock episode. The existence of several shocks and/or structural breaks tends to influence the impulse-response function results; thus, it was determined that because the shock date is known, this study can estimate the model with the data associated with this date in mind. In other words, this reduced the time horizon to the period 2009 M8–2014 M5. For this period, the initial point is the month preceding Toyota’s massive recall and two months after the end of the Great Recession.[15] As demonstrated in Figure 4, Toyota’s volatility over this period is much more substantial than Ford and GM. This is consistent with the extreme volatility that occurs for Toyota relative to General Motors and Ford during this period
14 The parameter estimates would be considered spurious in the face of the existence of a unit root. 15 The National Bureau of Economic Research (NBER) data for the beginning and end period of the Great Recession during December 2007 and June 2009, respectively (see http://www.nber.org/cycles.html)
CF Vol. 18 (1&2), 2020
90
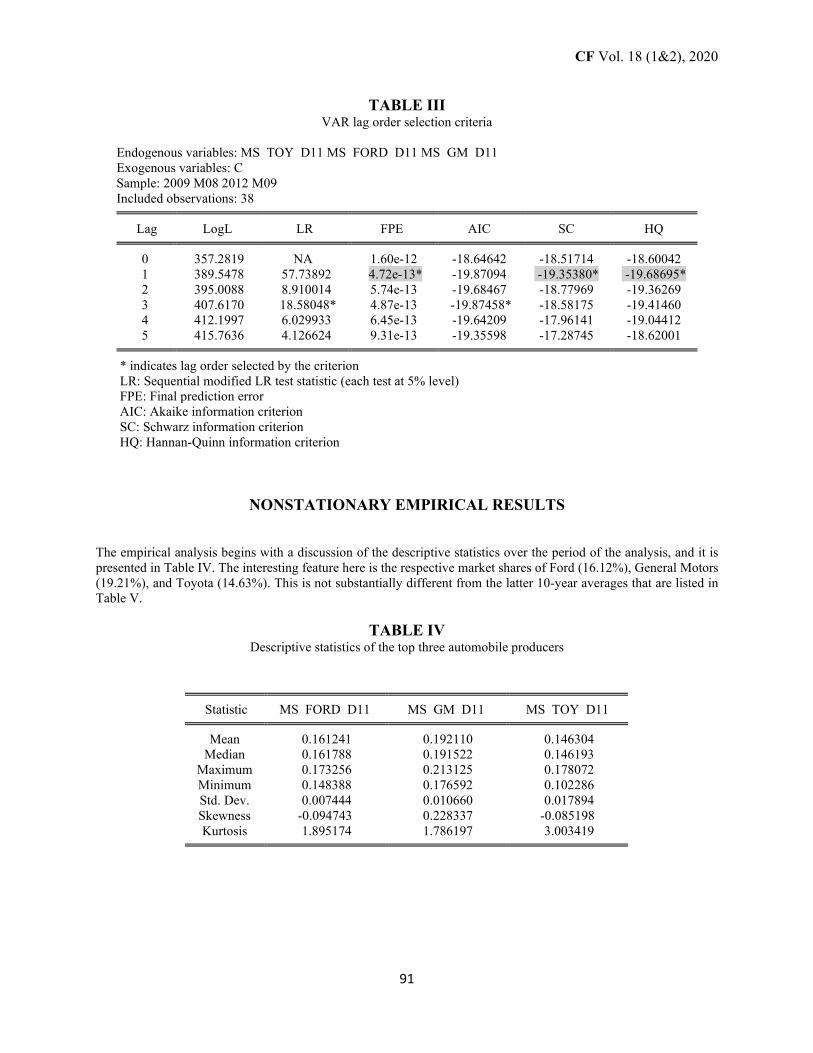
(see Figure 4). The estimated results for Eq. (3) are presented in Table III. However, there was an additional shock: the March 2011 earthquake and the corresponding tsunami, which affected third-tier suppliers in Japan, and ultimately, all of Toyota’s global supply chains (Canis, 2011). Thus, the data horizon is from 2009 M8–2012 M9, where the lagged effect of the tsunami was realized in the data.
FIGURE 4 Volatility over the regression horizon
0
20,000
40,000
60,000
80,000
100,000
120,000
1980 1985 1990 1995 2000 2005 2010 2015
Ford Long Term VOlatility
0
25,000
50,000
75,000
100,000
125,000
150,000
1980 1985 1990 1995 2000 2005 2010 2015
GM Long Term Volatility
0
10,000
20,000
30,000
40,000
50,000
60,000
1980 1985 1990 1995 2000 2005 2010 2015
Toyota Long Term Volatility
Ford Long Term Volatility
CF Vol. 18 (1&2), 2020
91
TABLE III VAR lag order selection criteria
Endogenous variables: MS_TOY_D11 MS_FORD_D11 MS_GM_D11 Exogenous variables: C Sample: 2009 M08 2012 M09 Included observations: 38
Lag LogL LR FPE AIC SC HQ 0 357.2819 NA 1.60e-12 -18.64642 -18.51714 -18.60042
1 389.5478 57.73892 4.72e-13* -19.87094 -19.35380* -19.68695* 2 395.0088 8.910014 5.74e-13 -19.68467 -18.77969 -19.36269 3 407.6170 18.58048* 4.87e-13 -19.87458* -18.58175 -19.41460 4 412.1997 6.029933 6.45e-13 -19.64209 -17.96141 -19.04412 5 415.7636 4.126624 9.31e-13 -19.35598 -17.28745 -18.62001 * indicates lag order selected by the criterion
LR: Sequential modified LR test statistic (each test at 5% level) FPE: Final prediction error AIC: Akaike information criterion SC: Schwarz information criterion HQ: Hannan-Quinn information criterion
NONSTATIONARY EMPIRICAL RESULTS
The empirical analysis begins with a discussion of the descriptive statistics over the period of the analysis, and it is presented in Table IV. The interesting feature here is the respective market shares of Ford (16.12%), General Motors (19.21%), and Toyota (14.63%). This is not substantially different from the latter 10-year averages that are listed in Table V.
TABLE IV Descriptive statistics of the top three automobile producers
Statistic MS_FORD_D11 MS_GM_D11 MS_TOY_D11 Mean 0.161241 0.192110 0.146304
Median 0.161788 0.191522 0.146193 Maximum 0.173256 0.213125 0.178072 Minimum 0.148388 0.176592 0.102286 Std. Dev. 0.007444 0.010660 0.017894 Skewness -0.094743 0.228337 -0.085198 Kurtosis 1.895174 1.786197 3.003419
CF Vol. 18 (1&2), 2020
92
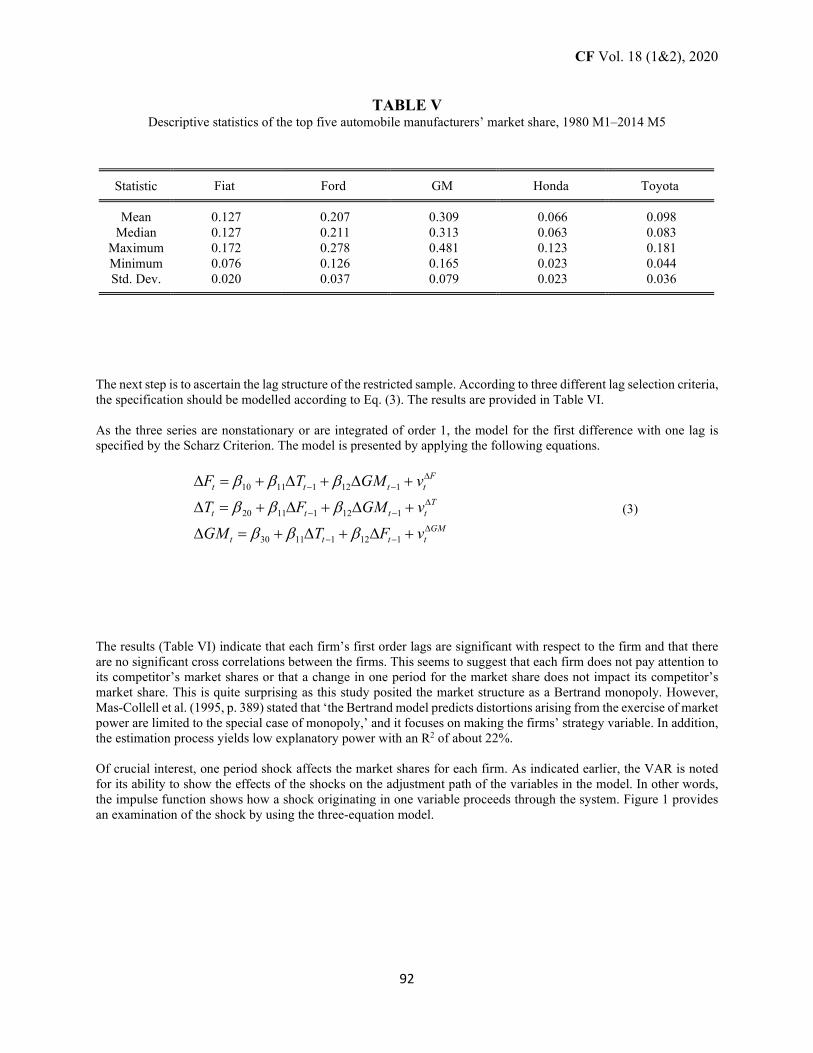
TABLE V Descriptive statistics of the top five automobile manufacturers’ market share, 1980 M1–2014 M5
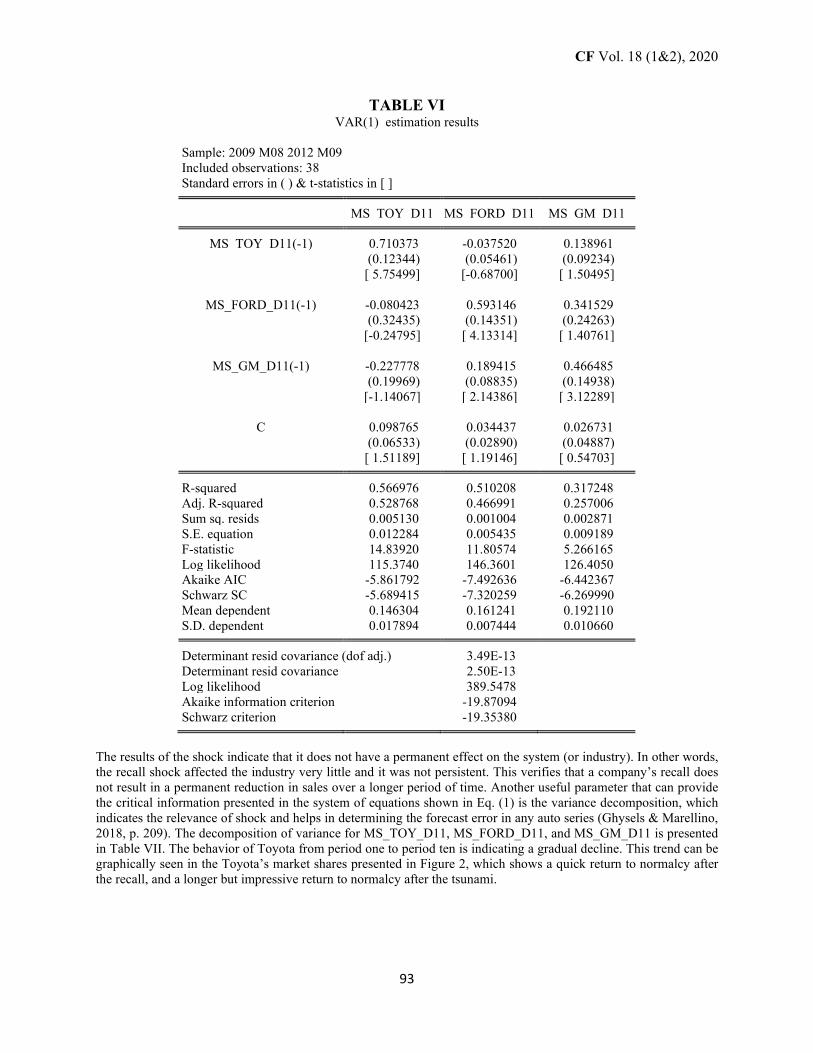
The next step is to ascertain the lag structure of the restricted sample. According to three different lag selection criteria, the specification should be modelled according to Eq. (3). The results are provided in Table VI. As the three series are nonstationary or are integrated of order 1, the model for the first difference with one lag is specified by the Scharz Criterion. The model is presented by applying the following equations.
(3)
The results (Table VI) indicate that each firm’s first order lags are significant with respect to the firm and that there are no significant cross correlations between the firms. This seems to suggest that each firm does not pay attention to its competitor’s market shares or that a change in one period for the market share does not impact its competitor’s market share. This is quite surprising as this study posited the market structure as a Bertrand monopoly. However, Mas-Collell et al. (1995, p. 389) stated that ‘the Bertrand model predicts distortions arising from the exercise of market power are limited to the special case of monopoly,’ and it focuses on making the firms’ strategy variable. In addition, the estimation process yields low explanatory power with an R2 of about 22%. Of crucial interest, one period shock affects the market shares for each firm. As indicated earlier, the VAR is noted for its ability to show the effects of the shocks on the adjustment path of the variables in the model. In other words, the impulse function shows how a shock originating in one variable proceeds through the system. Figure 1 provides an examination of the shock by using the three-equation model.
GMtttt
Ttttt
Ftttt
vFTGMvGMFTvGMTF
∆−−
∆−−
∆−−
+∆+∆+=∆
+∆+∆+=∆
+∆+∆+=∆
11211130
11211120
11211110
βββ
βββ
βββ
Statistic Fiat Ford GM Honda Toyota Mean 0.127 0.207 0.309 0.066 0.098
Median 0.127 0.211 0.313 0.063 0.083 Maximum 0.172 0.278 0.481 0.123 0.181 Minimum 0.076 0.126 0.165 0.023 0.044 Std. Dev. 0.020 0.037 0.079 0.023 0.036
CF Vol. 18 (1&2), 2020
93
TABLE VI VAR(1) estimation results
Sample: 2009 M08 2012 M09 Included observations: 38 Standard errors in ( ) & t-statistics in [ ]
MS_TOY_D11 MS_FORD_D11 MS_GM_D11 MS_TOY_D11(-1) 0.710373 -0.037520 0.138961 (0.12344) (0.05461) (0.09234) [ 5.75499] [-0.68700] [ 1.50495]
MS_FORD_D11(-1) -0.080423 0.593146 0.341529 (0.32435) (0.14351) (0.24263) [-0.24795] [ 4.13314] [ 1.40761]
MS_GM_D11(-1) -0.227778 0.189415 0.466485 (0.19969) (0.08835) (0.14938) [-1.14067] [ 2.14386] [ 3.12289]
C 0.098765 0.034437 0.026731 (0.06533) (0.02890) (0.04887) [ 1.51189] [ 1.19146] [ 0.54703] R-squared 0.566976 0.510208 0.317248
Adj. R-squared 0.528768 0.466991 0.257006 Sum sq. resids 0.005130 0.001004 0.002871 S.E. equation 0.012284 0.005435 0.009189 F-statistic 14.83920 11.80574 5.266165 Log likelihood 115.3740 146.3601 126.4050 Akaike AIC -5.861792 -7.492636 -6.442367 Schwarz SC -5.689415 -7.320259 -6.269990 Mean dependent 0.146304 0.161241 0.192110 S.D. dependent 0.017894 0.007444 0.010660
Determinant resid covariance (dof adj.) 3.49E-13
Determinant resid covariance 2.50E-13 Log likelihood 389.5478 Akaike information criterion -19.87094 Schwarz criterion -19.35380
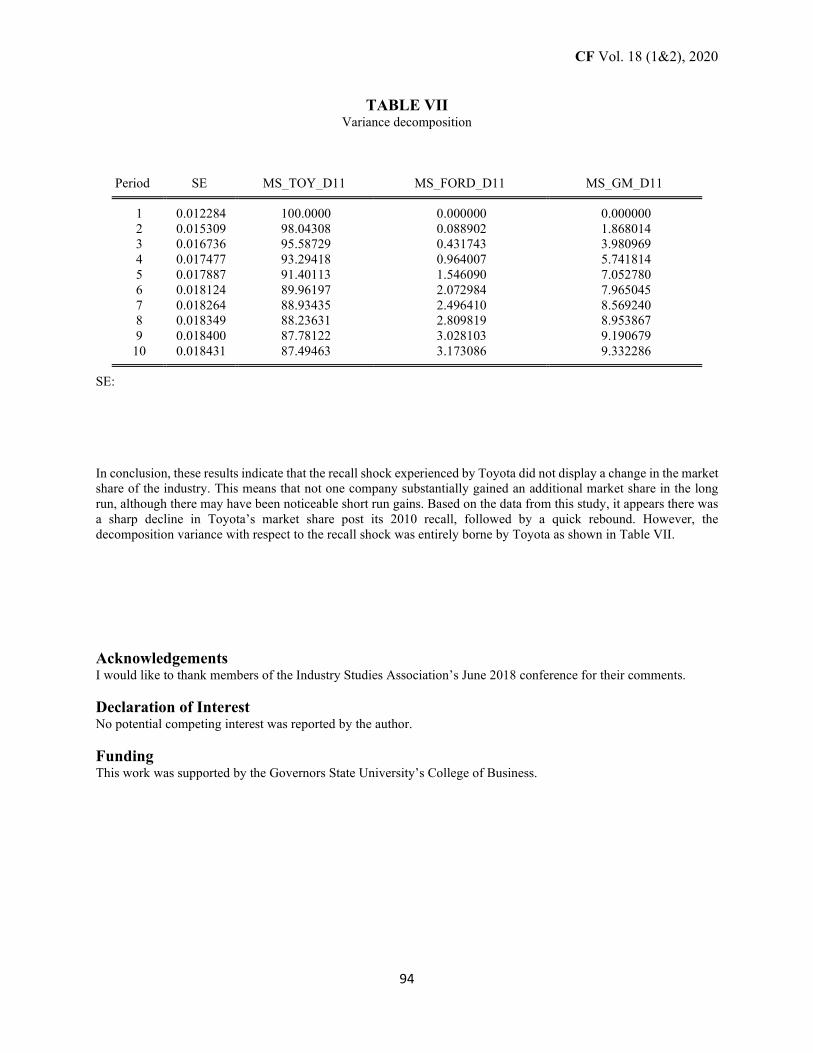
The results of the shock indicate that it does not have a permanent effect on the system (or industry). In other words, the recall shock affected the industry very little and it was not persistent. This verifies that a company’s recall does not result in a permanent reduction in sales over a longer period of time. Another useful parameter that can provide the critical information presented in the system of equations shown in Eq. (1) is the variance decomposition, which indicates the relevance of shock and helps in determining the forecast error in any auto series (Ghysels & Marellino, 2018, p. 209). The decomposition of variance for MS_TOY_D11, MS_FORD_D11, and MS_GM_D11 is presented in Table VII. The behavior of Toyota from period one to period ten is indicating a gradual decline. This trend can be graphically seen in the Toyota’s market shares presented in Figure 2, which shows a quick return to normalcy after the recall, and a longer but impressive return to normalcy after the tsunami.
CF Vol. 18 (1&2), 2020
94
TABLE VII Variance decomposition
Period SE MS_TOY_D11 MS_FORD_D11 MS_GM_D11
1 0.012284 100.0000 0.000000 0.000000
2 0.015309 98.04308 0.088902 1.868014 3 0.016736 95.58729 0.431743 3.980969 4 0.017477 93.29418 0.964007 5.741814 5 0.017887 91.40113 1.546090 7.052780 6 0.018124 89.96197 2.072984 7.965045 7 0.018264 88.93435 2.496410 8.569240 8 0.018349 88.23631 2.809819 8.953867 9 0.018400 87.78122 3.028103 9.190679
10 0.018431 87.49463 3.173086 9.332286 SE:
In conclusion, these results indicate that the recall shock experienced by Toyota did not display a change in the market share of the industry. This means that not one company substantially gained an additional market share in the long run, although there may have been noticeable short run gains. Based on the data from this study, it appears there was a sharp decline in Toyota’s market share post its 2010 recall, followed by a quick rebound. However, the decomposition variance with respect to the recall shock was entirely borne by Toyota as shown in Table VII. Acknowledgements I would like to thank members of the Industry Studies Association’s June 2018 conference for their comments.
Declaration of Interest No potential competing interest was reported by the author. Funding This work was supported by the Governors State University’s College of Business.
CF Vol. 18 (1&2), 2020
95
REFERENCES
Andrews, A., Simon, J., Tian, F., & Zhao, J. (2011). The Toyota crisis: An economic, operational, and strategic
analysis of the massive recall. Management Research Review, 34(10), 1064-1077. Asteriou, D., & Hall, S.G. (2011). Applied econometrics. New York: Palgrave Macmillan. Barber, B.M., & Darrough, M.N. (1996). Product reliability and firm value: The experience of American and
Japanese automakers, 1973-1992. Journal of Political Economy, 104(5), 1084-1099. Bromiley, P., & Marcus, A. (1989). The deterrent to dubious corporate behaviour: Profitability, probability and
safety recalls. Strategic Management Journal, 10(3), 233-250. Buenitz, L.W., Fiet, J.O., & Mosel, D.D. (2005). Signaling in venture capitalist-new venture team funding decisions:
Does it indicated long-term venture outcomes? Entrepreneurship Theory and Practice, 29, 1-12. Canis, B. (2011). The motor vehicle supply chain: Effects of the Japanese earthquake and tsunami. Congressional
report for Congress, Congressional Research Service, Washington, D.C., http://fas.org/sgp/crs/misc/R41831.pdf
Coff, R. (2002). Human capital, shared expertise, and the likelihood of impasse in corporate acquisitions. Journal of Management, 28(1), 115-137.
Connelly, B.L., Certo, S.T., Ireland, R.D., & Reutzel, C.R. (2011). Signaling theory: A review and assessment. Journal of Management, 37(1), 39-67.
Diebold, F.X. (2007). Elements of forecasting. Mason: Thompson Southwestern. Freedman, S., Kearney, M., & Lederman, M. (2012). Product recalls, imperfect information, and spillover effects;
lessons from the consumer response to the 2007 toy recalls. The Review of Economics and Statistics, 94(2), 499-516.
Frey, D. (1986). Recent research on selective exposure to information. In Berkowitz, L. (Ed.), Advances in experimental social psychology (Vol. 19) (pp. 41-80). New York: Academic Press.
Gonzalez-Riveria, G. (2013). Forecasting for economics and business. Boston: Pearson. Ghysels, E., & Marcellino, M. (2018). Applied economic forecasting using time series methods. Oxford: Oxford
University Press. Hamilton, J.D. (1994). Time series analysis. Princeton: Princeton University Press. Hartman, R.S. (1987). Product quality and market efficiency: The effect of product recalls on resale prices and firm
valuation. The Review of Economics and Statistics, 69(2), 367-372. Hoffer, G.E., Pruitt, S.W., & Reilly, R.J. (1992). When recalls matter: Factors affecting owner response to
automotive recalls. The Journal of Consumer Affairs, 28(1), 96-106. Jacoby, J., & Chestnut, R.W. (1978). Brand loyalty: Measurement and management. New York: John Wiley. Jarrell, G., & Peltzman, S. (1985). The impact of product recalls on the wealth of sellers. Journal of Political
Economy, 93(7), 512-536. Kwoka, J.E. (2002). Automobiles: Products, process, and the decline of U.S. dominance. In Deutsch, L.L. (Ed.),
Industry Studies, 3rd ed., New York: M. E. Sharpe Press. Kwoka, J.E. (1984). Market power and market change in the U.S. automobile industry. Journal of Industrial
Economics, 32(4), 509-22. Lange, D., Lee, P.M., & Dai, Y. (2011). Organizational reputation: A review. Journal of Management, 3(1), 153-
184. Mannering, F., Winston, C., Grilliches, Z., & Schmalalense, R. (1991). Brand loyalty and the decline of American
automobile firms. Brookings papers on economic activity, Microeconomics, 1991, 67-114. Martin, V., Hurn, S., & Harris, D. (2013). Econometric modelling with time series: Specification, estimation and
testing. Cambridge: Cambridge University Press. Mas-Collell, A., Whinston, D., & Green, J.R. (1995). Microeconomic theory. Oxford: Oxford University Press. Ni, J.Z., Flynn, B.B., & Jacobs, F.R. (2014). Impact of product recall announcements on retailers’ financial value.
International Journal of Production Economics, 153, 309-322. Ramey, V.A., & Vine, D.J. (2006). Declining volatility in the U.S. automobile industry. American Economic
Review, 96(5), 1876-1889. Reilly, F.K., & Brown, K.C. (2000). Investment analysis and portfolio management (6th ed.). Philadelphia: The
Dryden Press. Romp, G. (1997). Game theory: Theory and applications. Oxford: Oxford University Press.
CF Vol. 18 (1&2), 2020
96
Rupp, N.G., & Taylor, C.R. (2002). Who initiates recalls and who cares evidence from the automobile industry. The Journal of Industrial Economics, 50(2), 123-149.
Sanders, W.G., & Bovie, S. (2004). Sorting things out: Valuation of new firms in uncertain markets. Strategic Management Journal, 25, 167-186.
Souiden, N., & Pons, F. (2009). Product recall crisis management: The impact of manufacture image, consumer loyalty, and purchase intention. Journal of Product and Brand Management, 18(2), pp.106-114.
Spence, M. (2002). Signalling in retrospect and the informational structure of markets. The American Economic Review, 92(3), 434-459.
Spence, M. (1977). Consumer misperceptions: Product failure and producer liability. The Review of Economic Studies, 14(3), 561-572.
Train, K.E., & Winston, C. (2007). Vehicle choice behaviour and the declining market share of U.S. automakers. International Economic Review, 48(4), 1469-1496.
Varian, H.R. (2006). Intermediate microeconomics. New York: W.W. Norton. Weinberger, M.G., Allen, C.T., & Dillon, W.R. (1981). Negative information perspectives and research directions.
Monroe, K. (Ed.), Advances in consumer research (pp. 398-404). Ann Arbor: Association for Consumer Research.
White, L. (1971). The U.S. automobile industry since 1945. Cambridge: Harvard University Press. Anthony Paul Andrews, Governors State University, [email protected]


![EVERYTHING YOU WANTED TO KNOW ABOUT … Persistent Memory SNIA Defines Persistence as: [Computer System] A synonym for non-volatility, usually used to distinguish between data](https://img.pdfslide.net/doc/110x75/5aa802257f8b9ac0258b4896/everything-you-wanted-to-know-about-persistent-memory-snia-defines-persistence.jpg)