Embed Size (px)
Citation preview
2 November 2010
VOLEX GROUP plc
Half-yearly results for the 26 weeks ended 3 October 2010 Volex Group plc, the global electrical and electronic cable assemblies group, today announces its unaudited half-yearly results for the 26 weeks ended 3 October 2010. First half operating highlights:
• Continued strong year on year revenue growth across all end market sectors • Seventh consecutive quarter of improved profitability • Increased Volex designed content helping drive gross margin improvements • Ongoing supply chain projects and other initiatives such as LEAN
manufacturing yielding further efficiency savings
Financial summary: • Revenue up 43% at £157.0m (H1 FY2010: £110.2m) (36% up at constant
currency) and Q2 9% up on Q1 (13% at constant currency) • Gross margin stable at 19.6% (H1 FY2010: 20.1%) • Operating profit before share based payments of £8.4m (H1 FY2010 : £3.5m)
up 143% (113% at constant currency) • Profit before tax increased to £7.0m (H1 FY2010 : £1.7m) • Adjusted(i) earnings per share of 10.1p (H1 FY2010 : 6.3p). Basic earnings
per share of 9.7p (H1 FY2010 : 1.6p) • Net debt of £10.1m (H1 FY2010 : £11.2m)
(i) Adjusted earnings per share is earnings per share before non-recurring items and share based payments charges
The Chairman of Volex, Mike McTighe, commented: “The Board is delighted to report that the Group has successfully delivered significant revenue growth in the first half of FY2011, having spent most of FY2010 focussed on rebuilding the fundamentals of the business and laying the foundations for sustainable growth. The Board remains aware, however, that the turnaround is not yet complete. There remains significant work in driving forward the now unified organisational structure and business systems to consolidate the gains made in the first half and embed a platform for sustained profitable growth in the future”.
END

For further information please contact: Volex Group plc Ray Walsh, Group Chief Executive +44 20 3370 8833 Andrew Cherry, Group Finance Director +44 20 3370 8833 Buchanan Communications Charles Ryland / Jeremy Garcia / Helen Chan +44 20 7466 5000 Forward looking statements Certain statements made in this announcement are forward looking statements. Such statements are based on current expectations and are subject to a number of risks and uncertainties that could cause actual events to differ materially from any expected future events or results referred to in these forward looking statements.
- 1 -
HALF YEAR RESULTS 26 Weeks ended 3 October 2010
We are proud to deliver our half-year results for our financial year 2011 (“FY2011”) consistent with our mission statement made at the start of our Annual Report and Accounts 2010 of “Return to Growth”. Our global team which now numbers well over 8,000 people has worked hard this year to take on significant additional business across all four of our business sectors, and save for India, all of our geographical markets. These considerable efforts have seen Volex successfully grow revenue by 43% compared with the first half of the last financial year. Such rapid growth requires the entire organisation to adjust to a much higher tempo while maintaining our reputation for world-class quality and on-time delivery. Through this time of significant change in the company, we have now delivered seven successive quarters of improved profitability. The Telecommunications and Data-communications sector has benefited from growth in our share of business within key customer accounts added in the last year supporting the build-out of new mobile and telecommunications infrastructure. We have also introduced new products to enable meaningful penetration into the ultra-high speed switching environments that facilitate large-scale “cloud computing”. These focus areas have delivered 10% revenue growth and an improvement in gross margins. Our Healthcare sector has benefited from the recovery in capital spending in the medical sector in North America and Europe, but more importantly from our penetration of new accounts in these markets as well as in India and Asia. We have achieved a revenue improvement of 26%. We continue to invest in our strategy of deeper engineering involvement with our key clients whilst focusing on building our market in emerging economies. Our Consumer division continues as the world leader in power cords for a large range of consumer and computing products for the best global brands, and is expanding our product offering to include related data cable assemblies. The economic recovery is driving consumer and business spend, and along with new product offerings including environmentally friendly halogen free compounds, has driven revenues in this division up by 53% compared with last year. The Industrial sector, while the smallest of our market sectors, has delivered impressive revenue growth of 188% year-on-year. This has been driven by increased sales in the vehicle telematics, automation and agricultural markets and by emerging sales into the renewable energy market. Our Operations team is working hard to implement continuous improvement and LEAN manufacturing techniques across the group. Early success has been seen in our Consumer division where labour productivity has improved throughout the year. These programmes will continue running through this year and FY2012 and we are pleased with the success and positive change in the working environment and culture of our factories in all seven countries. Despite year on year growth in underlying sales of 36% we continue to operate at less than three quarter capacity within our existing factory footprint. Further increases in effective capacity will result from the ongoing
- 2 -
LEAN manufacturing improvements and would also be available by moving from 5 to 7 working days (albeit on an increased cost basis due to overtime). In addition to these programmes, our supply-chain team has continued to reduce our supplier base while simultaneously getting better competitive bidding practices implemented to drive down the purchase costs of raw materials. Our focus in the second half is to continue our sales strategy of delivering more value to our key strategic clients by collaborating more deeply in product design, while also investing in account penetration in the emerging markets. In particular we remain on target with our objective to have Volex content within 30% of non-power cords sales within 3 years. Operational efficiency will deliver a more competitive offering in the market while protecting and enhancing gross margins. The Volex team is working hard across the globe to deliver these improvements and we have much more to aim for in re-engineering the group for continued growth and performance improvement. Telecoms / Datacoms
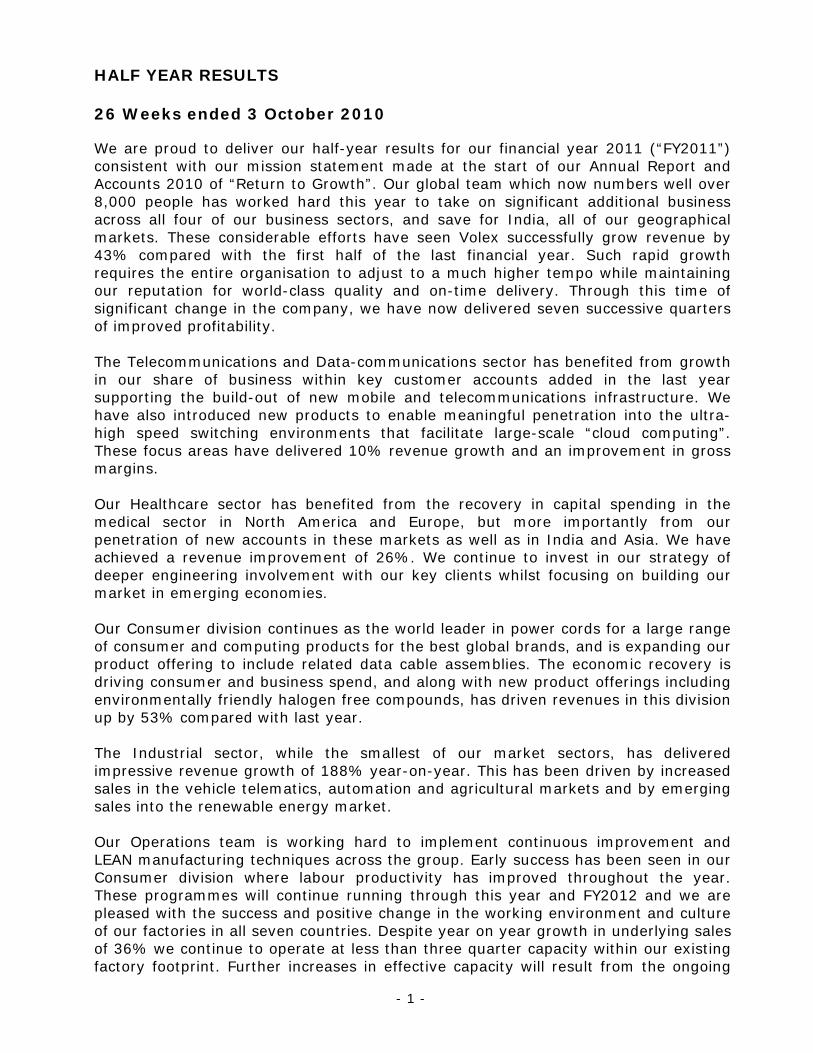
Volex is a global interconnect provider to the telecom and datacoms infrastructure market; the group services mobile telecoms networks, fixed-line broadband networks, and datacentres / high-performance computing centres. Telecoms / Datacoms revenue in the first half of FY2011 was 10% ahead of last year and 24% of the second half of
0.0
5.0
10.0
15.0
20.0
25.0
Q3 FY09 Q4 FY09 Q1 FY10 Q2 FY10 Q3 FY10 Q4 FY10 Q1 FY11 Q2 FY11
Telecoms/Datacoms quarterly revenue (£m)
Asia Americas Europe India FY2010, with strong growth coming from Europe and the Americas. In India, delays in the awarding of 3G licences and increased security clearance requirements imposed by the Indian Department of Telecommunication for specified telecommunications equipment continued to limit growth in the first half, although this security clearance requirement has now been lifted. Excluding India the year on year revenue growth would have been 64%. During the first half Volex has significantly increased the value of business conducted with a global telecom solutions provider, providing local market support to its mobile infrastructure projects across several markets outside of Asia. The Group’s global footprint has been a key strength in developing this strategically important account, with customers increasingly looking for global partners. Volex has brought to market a number of new products during the first half. We have launched SFP+ and QSFP high-speed copper cable assemblies, which offer a high-performance and cost-effective solution within a data-centre rack application, whilst maintaining signal integrity and industry standard compliance. We have also launched a 12X CXP cable assembly system enabling data transfers of 120 Gbps, one of the fastest and densest products currently used in server farms, datacentres, and High Performance Computer sites. In addition, Volex has launched an Optical Distribution Frame and a Robust Transceiver Connector (RTC), a multi-fibre optical connector specifically designed for next generation radio systems in harsh environment applications. Our ability to launch these products is enabled by an
- 3 -
expansion of our R&D capabilities to support the definition and execution of our product roadmap. Healthcare
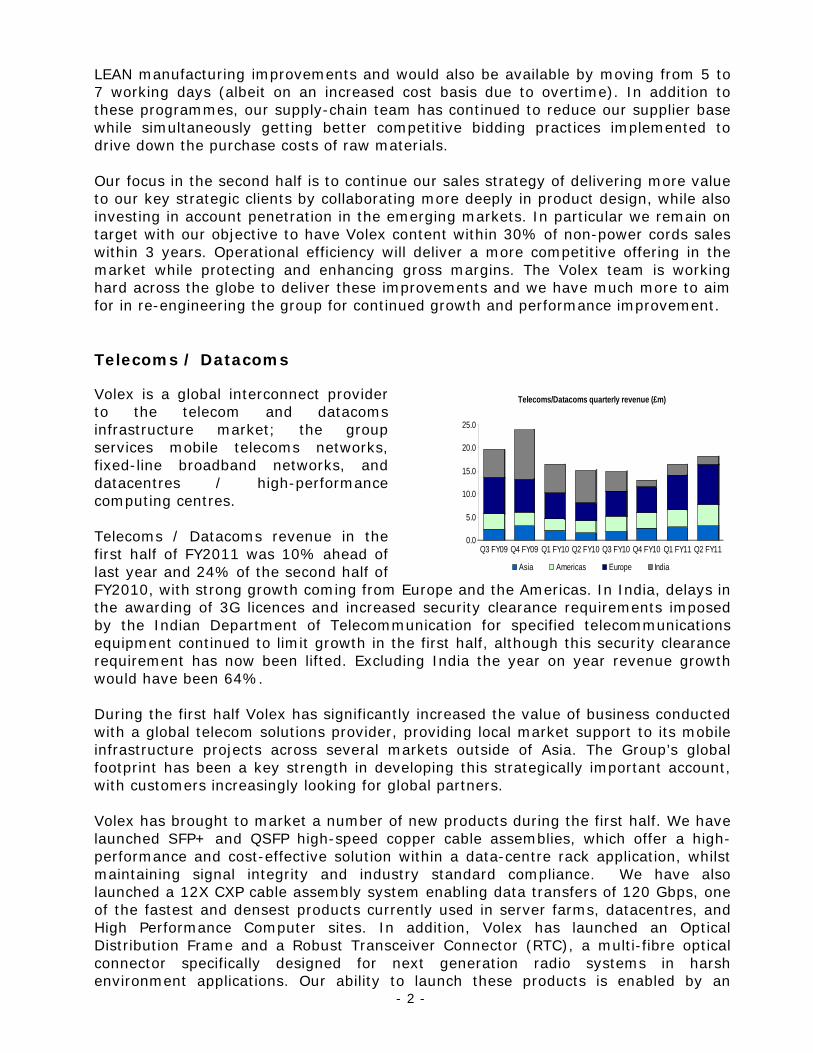
Volex has a long and successful history of servicing key customers in the medical equipment field including all forms of imaging technologies, where we supply cable assembly and connector technologies. The Healthcare equipment sector is generally more stable than other market sectors, with long product development cycles and long product lifecycles, underpinned by long-term relationships between equipment manufacturers and their suppliers.
0.0
1.0
2.0
3.0
4.0
5.0
6.0
7.0
Q3 FY09 Q4 FY09 Q1 FY10 Q2 FY10 Q3 FY10 Q4 FY10 Q1 FY11 Q2 FY11
Healthcare quarterly revenue (£m)
Asia Americas Europe India
Revenues for the Healthcare Sector in H1 FY2011 were up 26% compared with H1 FY2010, with growth primarily driven by the North America region. The most significant driver of increased Healthcare revenue in the first half of FY2011 was continued strong growth across all our imaging systems applications (MRI, X-Ray, CT, Nuclear Medicine and Ultrasound), although significant breakthrough successes in new market segments such as Home Healthcare, Medical Therapy and Patient Care Systems have also been substantial contributors. New programme start ups within emerging markets like China and India have also had a positive impact. Healthcare gross margins in the first half year increased to 27.6% (from 21.2% in H1 FY2010), principally as a result of successes in increasing Volex content in the customer bill of materials, although a favourable product mix also contributed. During the first half of FY2011 we have been successful in providing design and manufacturing support for cabling solutions to new healthcare customers for a range of products including a global platform hospital bed, a new generation of ventilator products, and a new infection control system. During the second half of the year a major sector focus will be on the launch of new cabling solutions for both patient-monitoring and electro-surgical equipment. These include cables and sensors for Pulse Oximetry (SpO2), and cables, lead wires and electrodes for ECG/EKG/Holter monitors.

- 4 -
Consumer
First half revenue for Consumer, the Group’s largest sector, of £99.6m was 53% higher than the prior year, reflecting rapid recovery from our major OEM customers, particularly in Asia. Indeed 17 of our top 20 customer accounts in the Consumer sector have grown year on year. The sector has now reported 5 quarters of quarter-on-quarter revenue growth and the first half of FY2011 was 34% ahead of the second half of last year. Key consumer products driving revenue in the first half were TVs and PCs / peripherals.
0.0
10.0
20.0
30.0
40.0
50.0
60.0
Q3 FY09 Q4 FY09 Q1 FY10 Q2 FY10 Q3 FY10 Q4 FY10 Q1 FY11 Q2 FY11
Consumer quarterly revenue (£m)
Asia Americas Europe India
During the first half we have started a project with a leading mobile phone manufacturer, providing a halogen-free (HF) cord for its universal mobile phone charger, and have won new business with a major PC manufacturer, who has accepted our HF US cord design for its desktop demonstration models, expected to be released in the USA in late 2010. Other positive customer initiatives include the development of a new magnetic power cord for hotpot and rice cookers and establishing ourselves as the primary supplier on new product development programmes to a well known floorcare brand. All these successes in the first half reinforce the Volex Consumer sector’s position as a leading power cord solution provider. Consumer gross margins have increased to £18.1m during the half year from £13.8m in the prior year. However, gross margin as a percentage of revenue has fallen from 21.1% to 18.2% over the same period. While new programmes and HF products have provided relatively higher margin, increased direct labour costs and increased costs of raw materials have had an adverse impact. We are taking necessary actions to address these issues, including amending our pricing policy and purchasing strategies. In addition, Sector gross margin will benefit as the Group further embeds LEAN manufacturing programmes and supply chain efficiencies.

- 5 -
Industrial
The Industrial sector for Volex comprises a diverse set of markets but offers some of the most exciting growth prospects. These markets include test and measurement equipment, manufacturing automation, refrigeration, trucking telematics, agricultural, and renewable energy. Demand in the Industrial sector returned to growth in FY2010, as companies invested once more in automation and increased capacity. We
0.0
1.0
2.0
3.0
4.0
5.0
6.0
Q3 FY09 Q4 FY09 Q1 FY10 Q2 FY10 Q3 FY10 Q4 FY10 Q1 FY11 Q2 FY11
Industrial quarterly revenue (£m)
Asia Americas Europe India
saw an increase in orders in the second half of FY2010 and this positive trend has continued through the first half of FY2011. The first half of FY2011 has seen a very strong performance in the Industrial sector with year over year revenue growth for H1 of 188%. This growth was primarily driven by the telematics, automation and agricultural markets. Despite being the smallest sector of the four Volex sectors in absolute terms, it is the fastest growing and has seen average quarter-on-quarter revenue growth of 33% over the last 4 quarters. We are seeing our customers, particularly in North America, re-investing in their business in the form of automation and tools, such as trucking telematics, to improve further the performance of their operations. This trading environment, together with anticipated new product introductions and further penetration of the renewable energies market, especially in our Indian market, augurs well for sector performance in the second half of FY2011 and beyond. Financial Review
Revenue Revenue in the six months ending 3 October 2010 was up 43% on the prior year, with all four sectors reporting double digit percentage growth rates year on year and trading in the Asia-centric Consumer sector especially strong. However, our three key geographic regions of Asia, Europe and the Americas have all grown more than 50% year on year. While the improved economic environment has contributed to this improved sales performance significant incremental revenue has been derived from new products and organic sales initiatives. Currency movements have also had a positive impact with first half revenue up 36% on a constant currency basis. Equally significantly, quarter-on-quarter revenue growth has been maintained with Q2 revenue up 13% (at constant currency) on Q1, which was itself 19% up on the fourth quarter of FY2010.
- 6 -
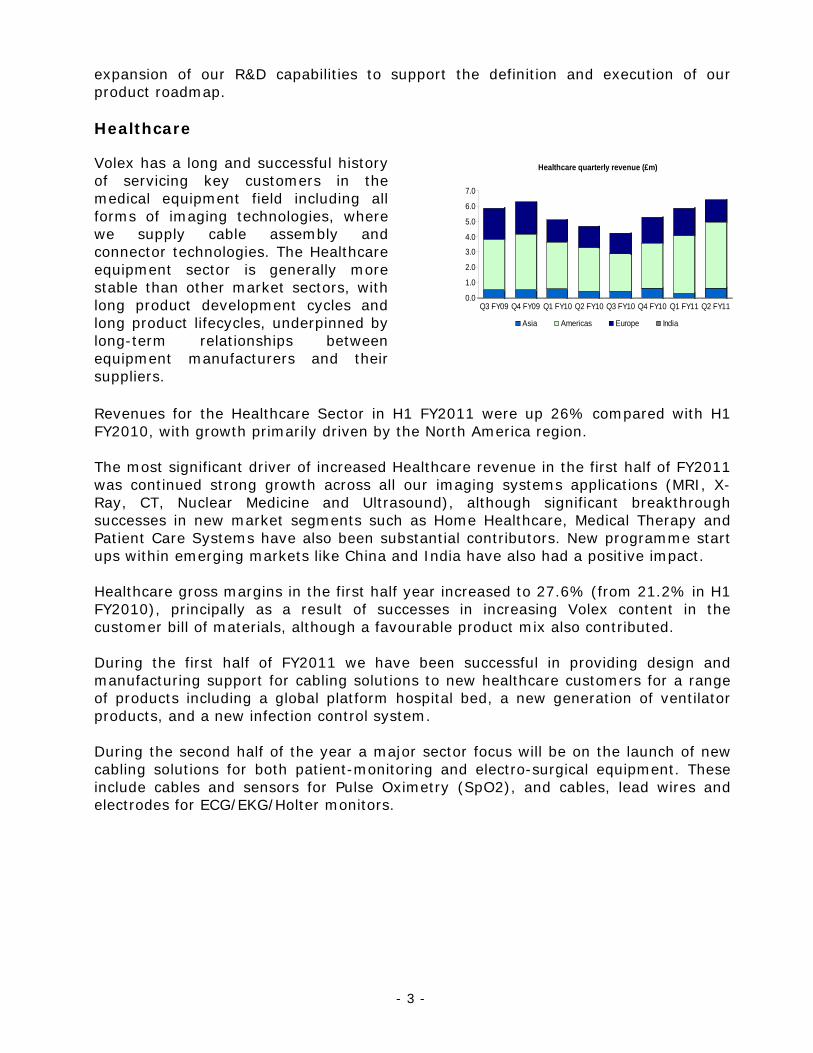
Profits Gross margin increased 39% from £22.2m to £30.9m, as a result of the revenue growth, with gross margin as a percentage of sales falling back slightly to 19.6% from 20.1% in the first half of last year. Average selling prices were maintained with price increases being achieved across several accounts. The continued focus on increasing the proportion of Volex designed content has also benefited margins. Operational improvements were also achieved including improved labour productivity, and operating leverage benefits accrued from the fixed production overheads and from variable production overheads rising proportionately less than revenues. However increased direct labour rates, particularly in South East China, increased overtime, adverse raw material costs and higher transportation costs more than offset these positive effects. To a lesser extent, the Group also had to cover reduced efficiencies associated with training the new production staff required to meet the significantly increased production volumes. The Telecoms / Datacoms, Healthcare and Industrial sectors are all demonstrating high and / or improving gross margins as a percentage of sales. However, as expected, margins in the Consumer sector reduced as a result of the increased labour and material costs. Gross margin % by sector
H1
FY2011 H1
FY2010 FY2010 Telecoms / Datacoms 19.8% 17.1% 14.8% Consumer 18.2% 21.1% 22.1% Healthcare 27.6% 21.2% 21.6% Industrial 23.5% 24.6% 22.7% Total Group 19.6% 20.1% 20.2%
Operating profit before share based expenses in the first half of the year was £8.4m, up 143% on £3.5m last year. This represents a return on sales of 5.4% up from 3.1% in FY2010. On a constant currency basis, operating profit before share based expenses in H1 was up 113% on last year. Consistent with the quarterly improvement in revenue trend, quarter-on-quarter growth in operating profit before share based expenses has been achieved, with Q2 adjusted operating profit up 17% (at constant currency) on Q1. Cash flow and net debt Operating cashflow before movements in working capital was £7.4m (H1 FY2010 : £4.2m). In line with the significant increase in trading activity, that has seen revenue increase 43% on the prior year, the Group’s requirement for working capital has increased. Although net trade working capital (inventory plus trade debtors minus trade creditors) increased by £1.9m (6%) compared with trade working capital held at 4 April 2010 and by £1.7m (5%) compared with 4 October 2009, trade working capital as a % of sales is on an improving trend. The Group continues to focus on cash generation, and in particular working capital management through supply chain efficiencies and working more closely with key customers and suppliers.
- 7 -
After aggregate outflows for tax and interest of £3.3m (H1FY2010: £1.6m), net cash used from operating activities was £0.9m (H1 FY2010: inflow of £6.3m). Capital expenditures have increased in absolute terms to £1.7m (H1 FY2010: £0.8m) due to strategic investments in both manufacturing capabilities and the Group’s information technology systems. However, as a percentage of revenue, capital expenditures continue to represent just 1%. As a result, net debt at 3 October 2010 amounted to £10.1m (4 October 2009: £11.2m, 4 April 2010: £7.6m). Interest Total Interest costs in the first half of FY2011 decreased 31% to £1.2m from £1.8m in H1 FY2010, primarily driven by reduced interest on bank borrowings of £0.2m, as a result of lower average borrowings, and a mark-to-market gain of £0.3m on the Group’s floating to fixed USD and Euro interest rate swaps. Banking facilities The Group has a revolving credit facility (RCF) with Lloyds Banking Group plc repayable in March 2012. After amortisation, this facility had an available limit of US$48.9m (£31.0m) as at 3 October 2010, comprising both a US Dollar and a Euro component. At the end of September, amounts drawn under this facility were US$14.5m (£9.2m) and €13.5m (£11.7m) and average combined utilisation during the year was US$35.5m (£22.5m). In addition, the Group has a separate €6.8m (£5.9m) invoice discounting facility with Lloyds Banking Group plc, (a facility that had previously been established with HBOS plc, now a part of Lloyds) of which €0.8m (£0.7m) was drawn as at 3 October 2010. At 3 October 2010 the Group had undrawn committed borrowing facilities of £11.9m (4 April 2010: £14.0m). Tax The Group incurred a tax charge of £1.5m (H1 FY2010: £0.8m), representing an effective tax rate (ETR) of 21% (H1 FY2010: 46%), consistent with the ETR in the FY2010 financial year of 24%. The reduction in ETR compared with the first half of last year is primarily due to improved profitability enabling the Group to benefit from unused tax losses brought forward. Earnings per share Basic earnings per share for the six months to 3 October 2010 was 9.7p, significantly ahead of the 1.6p reported last year on account of the substantial improvement in profit after tax. Adjusted earnings per share in the first half of FY2011 increased to 10.1p from 6.3p last year. Dividends The Company has negative distributable reserves and will therefore require a capital restructuring to enable it to declare and pay a dividend. Progress has been made in this respect, with shareholder consent to such a re-organisation having been obtained at the EGM, held on 1 October 2010, and an appointment scheduled with the courts later this year, to obtain the necessary court approval.

- 8 -
Defined benefit pension schemes The Group’s net pension deficit under IAS 19 increased marginally from £2.4m at 4 April 2010 to £2.5m at 3 October 2010, with a small increase in the fair value of assets during the six months being offset by an increase in the present value of the defined benefit obligations, primarily due to a decrease in discount rate used to value the pension scheme’s obligations. As required by IAS 19, the discount rate used by the Group is determined with reference to yields on corporate bonds and these yields decreased slightly between 4 April 2010 and 3 October 2010. Current Trading and Prospects
The Board is pleased with the results that have been achieved in the first half of FY2011 and are happy to report that our strategy of driving sales growth via strong, sector based sales and account management is proving successful. We expect the trading environment will be similar in the second half of the year with our focus being on consolidating our increased revenue base to help drive improved profitability and cash generation. Despite this momentum, the Group recognises that it remains exposed to macro-economic factors such as raw material costs and exchange rates and is working hard to minimise the potentially adverse impacts these factors might have on our business. Although the Board continues to take a prudent view of short term trading prospects it expects revenues and operating profit before share based payments in the second half to continue at similar levels to those experienced in the first half. As a result the full year operating profit before share based expenses will be at or modestly above market expectations. Risks and uncertainties
Risks to Volex are anticipated and regularly assessed and internal controls are enhanced where necessary to ensure that such risks are appropriately mitigated. The principal risks and uncertainties facing the Group in the second half of the year remain those detailed in the annual report and audited financial statements for the year ended 4 April 2010, a copy of which is available on the website at www.volex.com. Ray Walsh Andrew Cherry Group Chief Executive Group Finance Director 2 November 2010 2 November 2010
- 9 -
Statement of Directors’ Responsibilities
The Directors confirm that to the best of their knowledge: a) the set of financial statements has been prepared in accordance with IAS 34; b) the interim management report includes a fair review of the information required
in DTR 4.2.7R (indication of important events that have occurred during the first six months of the financial year and description of the principal risks and uncertainties for the remaining six months of the year); and
c) the interim management report includes a fair review of the information required by DTR 4.2.8R (disclosure of related party transactions and changes therein).
By Order of the Board Ray Walsh Andrew Cherry Group Chief Executive Group Finance Director 2 November 2010 2 November 2010
- 10 -
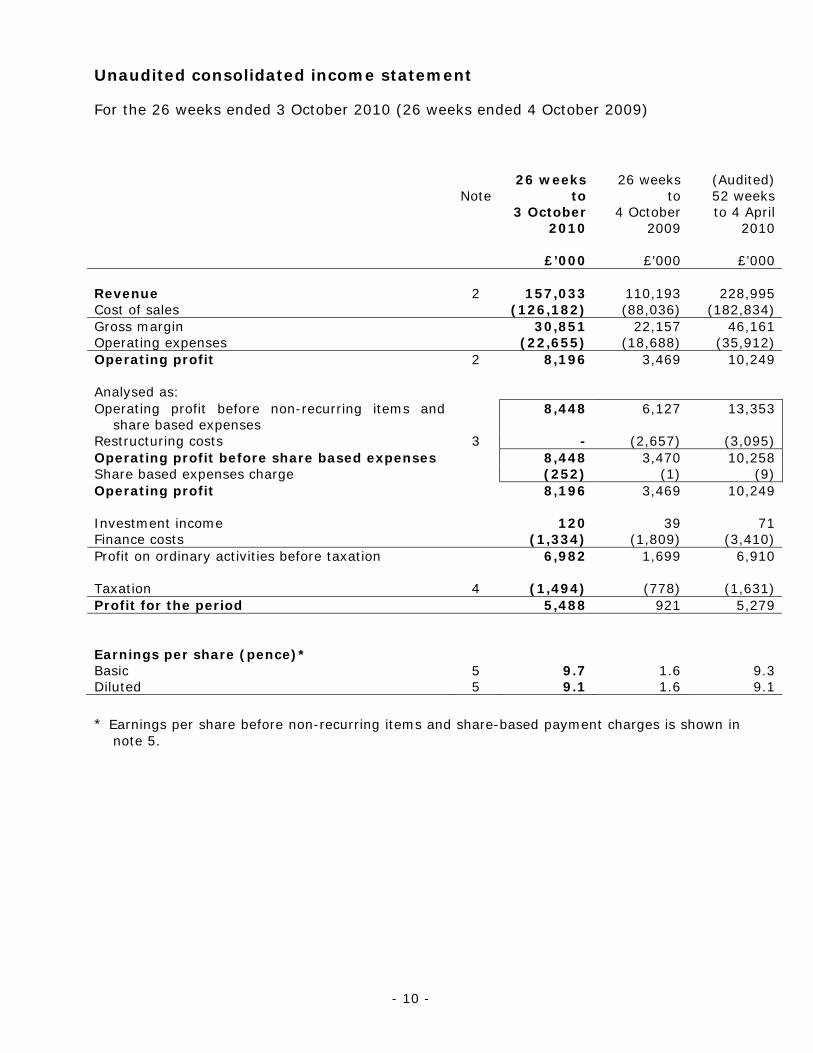
Unaudited consolidated income statement
For the 26 weeks ended 3 October 2010 (26 weeks ended 4 October 2009)
Note
26 weeks
to 3 October
2010
26 weeks
to 4 October
2009
(Audited) 52 weeks to 4 April
2010
£’000 £’000 £’000 Revenue 2 157,033 110,193 228,995 Cost of sales (126,182) (88,036) (182,834) Gross margin 30,851 22,157 46,161 Operating expenses (22,655) (18,688) (35,912) Operating profit 2 8,196 3,469 10,249 Analysed as: Operating profit before non-recurring items and
share based expenses 8,448 6,127 13,353
Restructuring costs 3 - (2,657) (3,095) Operating profit before share based expenses 8,448 3,470 10,258 Share based expenses charge (252) (1) (9) Operating profit 8,196 3,469 10,249 Investment income 120 39 71 Finance costs (1,334) (1,809) (3,410) Profit on ordinary activities before taxation 6,982 1,699 6,910 Taxation 4 (1,494) (778) (1,631) Profit for the period 5,488 921 5,279 Earnings per share (pence)* Basic 5 9.7 1.6 9.3 Diluted 5 9.1 1.6 9.1 * Earnings per share before non-recurring items and share-based payment charges is shown in
note 5.
- 11 -
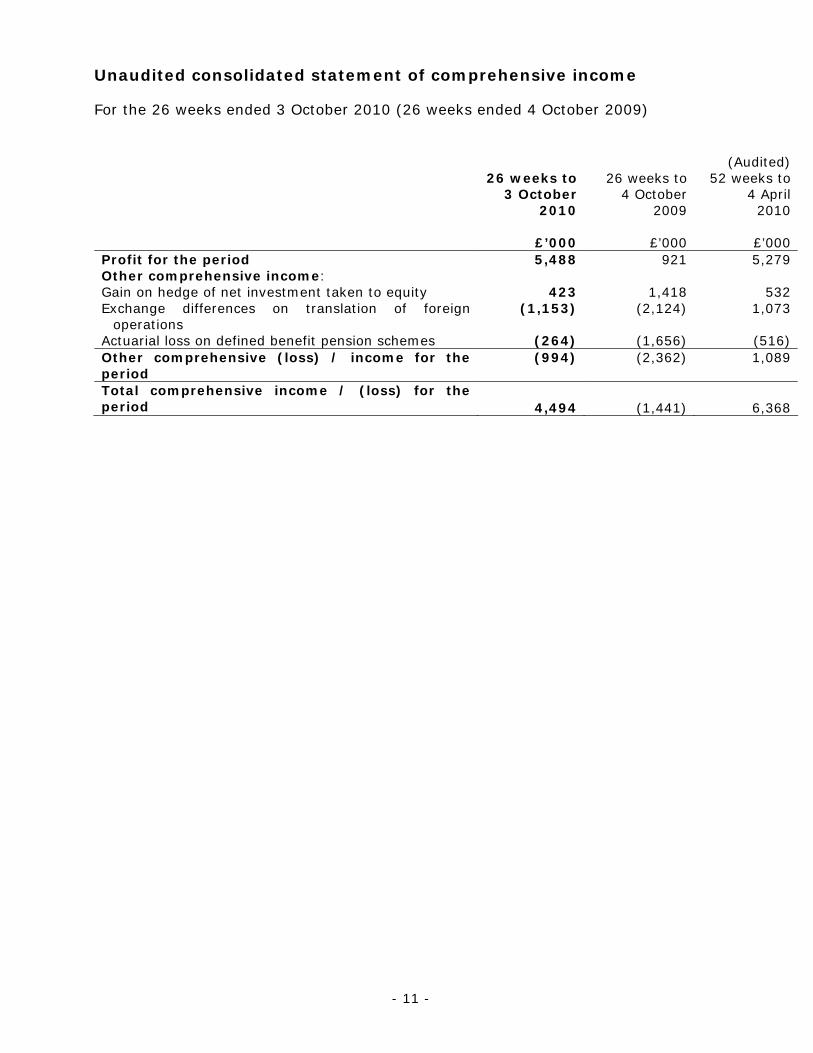
Unaudited consolidated statement of comprehensive income
For the 26 weeks ended 3 October 2010 (26 weeks ended 4 October 2009)
26 weeks to
3 October 2010
26 weeks to 4 October
2009
(Audited)
52 weeks to 4 April
2010
£’000 £’000 £’000 Profit for the period 5,488 921 5,279 Other comprehensive income: Gain on hedge of net investment taken to equity 423 1,418 532 Exchange differences on translation of foreign
operations (1,153) (2,124) 1,073
Actuarial loss on defined benefit pension schemes (264) (1,656) (516) Other comprehensive (loss) / income for the period
(994) (2,362) 1,089
Total comprehensive income / (loss) for the period 4,494 (1,441) 6,368
- 12 -
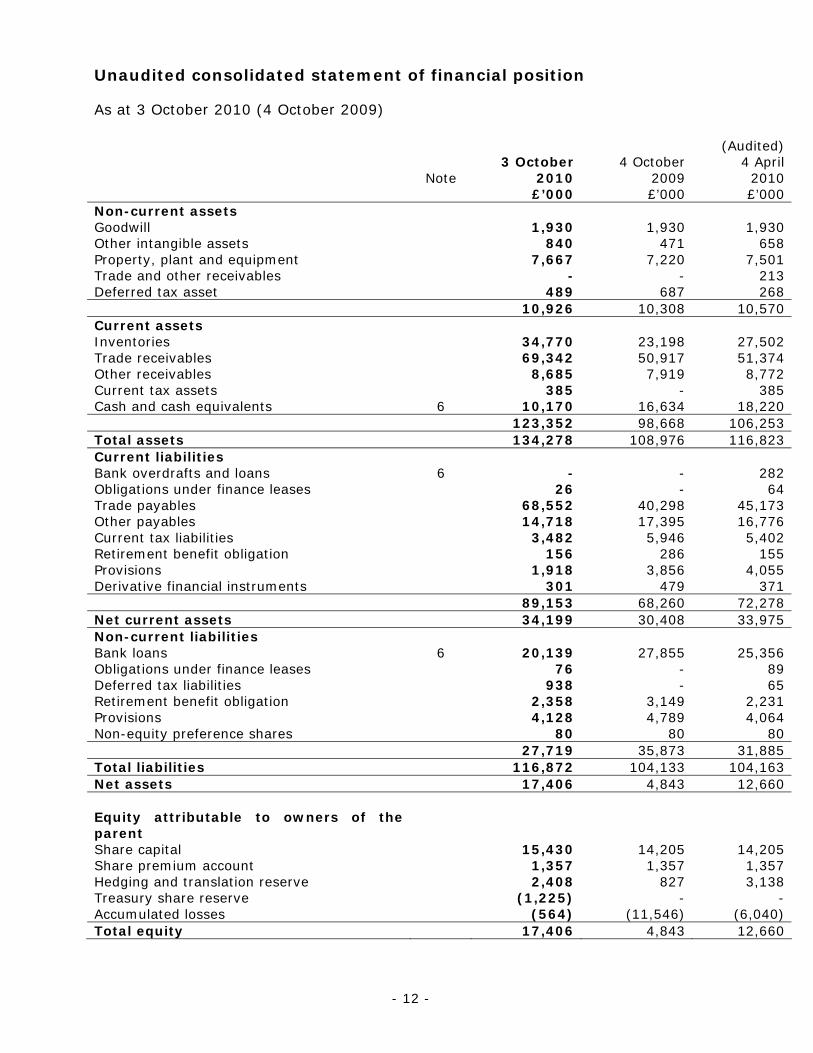
Unaudited consolidated statement of financial position
As at 3 October 2010 (4 October 2009)
Note
3 October
2010 £’000
4 October
2009 £’000
(Audited) 4 April
2010 £’000
Non-current assets Goodwill 1,930 1,930 1,930 Other intangible assets 840 471 658 Property, plant and equipment 7,667 7,220 7,501 Trade and other receivables - - 213 Deferred tax asset 489 687 268 10,926 10,308 10,570 Current assets Inventories 34,770 23,198 27,502 Trade receivables 69,342 50,917 51,374 Other receivables 8,685 7,919 8,772 Current tax assets 385 - 385 Cash and cash equivalents 6 10,170 16,634 18,220 123,352 98,668 106,253 Total assets 134,278 108,976 116,823 Current liabilities Bank overdrafts and loans 6 - - 282 Obligations under finance leases 26 - 64 Trade payables 68,552 40,298 45,173 Other payables 14,718 17,395 16,776 Current tax liabilities 3,482 5,946 5,402 Retirement benefit obligation 156 286 155 Provisions 1,918 3,856 4,055 Derivative financial instruments 301 479 371 89,153 68,260 72,278 Net current assets 34,199 30,408 33,975 Non-current liabilities Bank loans 6 20,139 27,855 25,356 Obligations under finance leases 76 - 89 Deferred tax liabilities 938 - 65 Retirement benefit obligation 2,358 3,149 2,231 Provisions 4,128 4,789 4,064 Non-equity preference shares 80 80 80 27,719 35,873 31,885 Total liabilities 116,872 104,133 104,163 Net assets 17,406 4,843 12,660 Equity attributable to owners of the parent
Share capital 15,430 14,205 14,205 Share premium account 1,357 1,357 1,357 Hedging and translation reserve 2,408 827 3,138 Treasury share reserve (1,225) - - Accumulated losses (564) (11,546) (6,040) Total equity 17,406 4,843 12,660
- 13 -
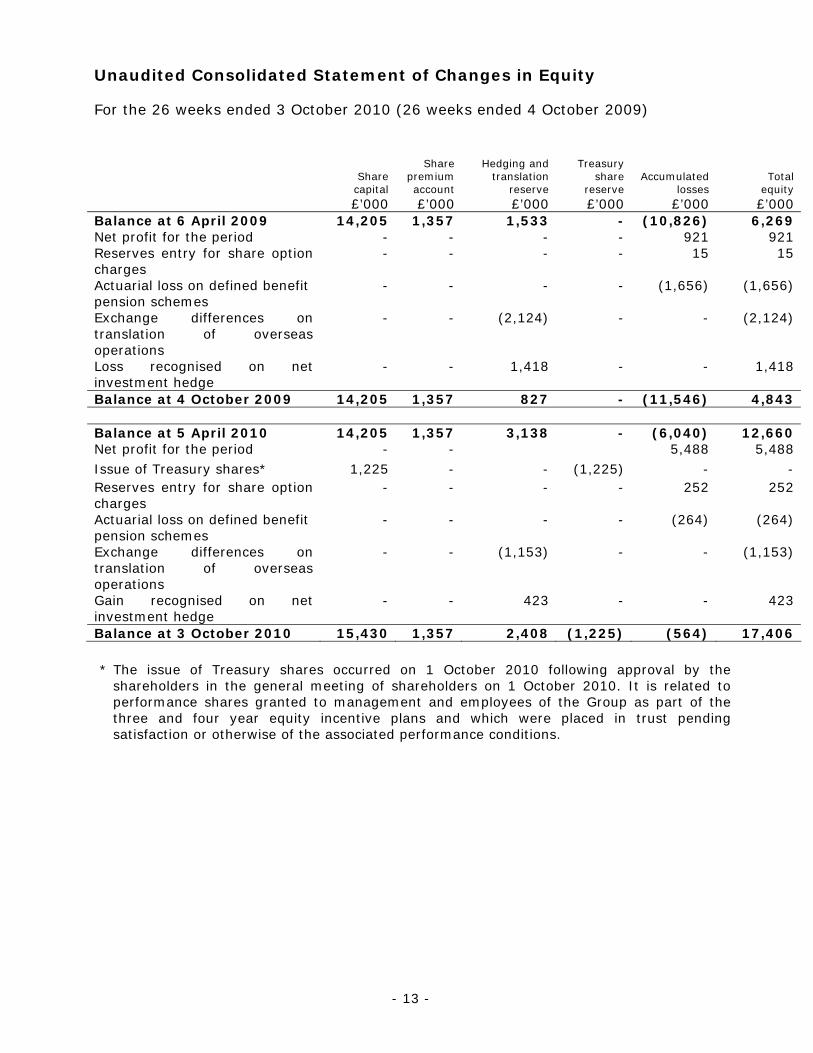
Unaudited Consolidated Statement of Changes in Equity
For the 26 weeks ended 3 October 2010 (26 weeks ended 4 October 2009)
Share capital
Share premium account
Hedging and translation
reserve
Treasury share
reserve Accumulated
losses Total
equity £’000 £’000 £’000 £’000 £’000 £’000 Balance at 6 April 2009 14,205 1,357 1,533 - (10,826) 6,269 Net profit for the period - - - - 921 921 Reserves entry for share option charges
- - - - 15 15
Actuarial loss on defined benefit pension schemes
- - - - (1,656) (1,656)
Exchange differences on translation of overseas operations
- - (2,124) - - (2,124)
Loss recognised on net investment hedge
- - 1,418 - - 1,418
Balance at 4 October 2009 14,205 1,357 827 - (11,546) 4,843 Balance at 5 April 2010 14,205 1,357 3,138 - (6,040) 12,660 Net profit for the period - - 5,488 5,488 Issue of Treasury shares* 1,225 - - (1,225) - - Reserves entry for share option charges
- - - - 252 252
Actuarial loss on defined benefit pension schemes
- - - - (264) (264)
Exchange differences on translation of overseas operations
- - (1,153) - - (1,153)
Gain recognised on net investment hedge
- - 423 - - 423
Balance at 3 October 2010 15,430 1,357 2,408 (1,225) (564) 17,406 * The issue of Treasury shares occurred on 1 October 2010 following approval by the
shareholders in the general meeting of shareholders on 1 October 2010. It is related to performance shares granted to management and employees of the Group as part of the three and four year equity incentive plans and which were placed in trust pending satisfaction or otherwise of the associated performance conditions.
- 14 -
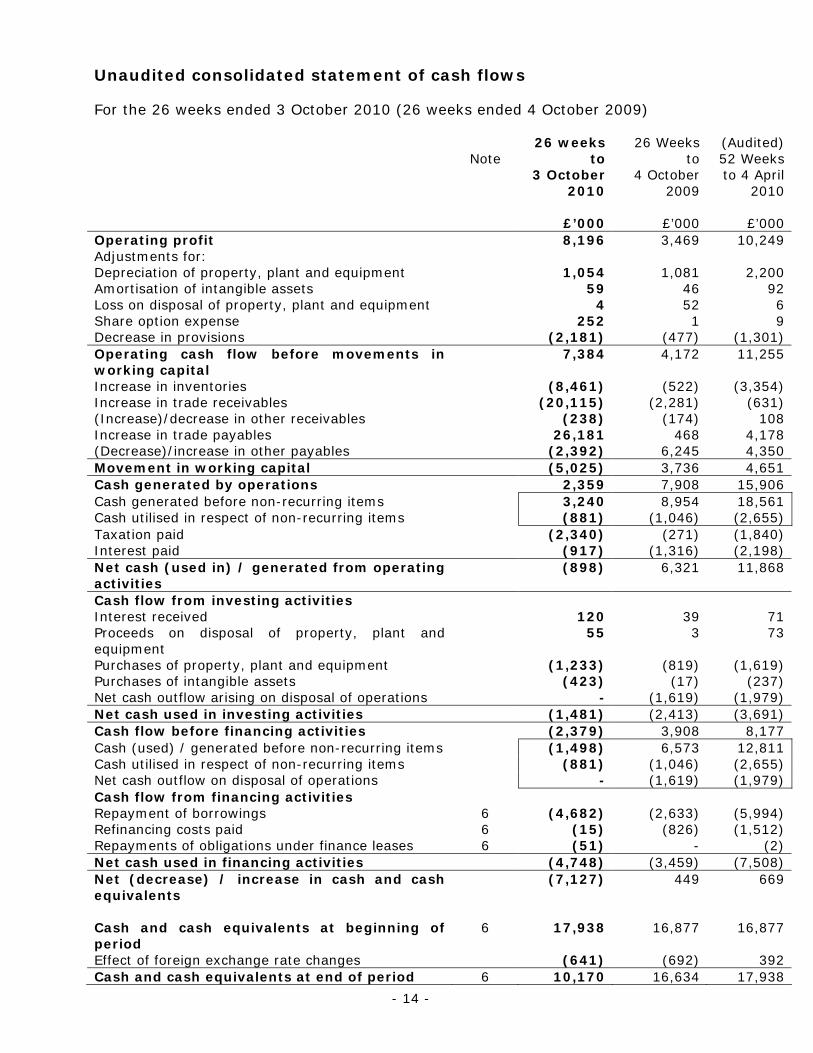
Unaudited consolidated statement of cash flows
For the 26 weeks ended 3 October 2010 (26 weeks ended 4 October 2009)
Note
26 weeks
to 3 October
2010
26 Weeks
to 4 October
2009
(Audited) 52 Weeks to 4 April
2010
£’000 £’000 £’000 Operating profit 8,196 3,469 10,249 Adjustments for: Depreciation of property, plant and equipment 1,054 1,081 2,200 Amortisation of intangible assets 59 46 92 Loss on disposal of property, plant and equipment 4 52 6 Share option expense 252 1 9 Decrease in provisions (2,181) (477) (1,301) Operating cash flow before movements in working capital
7,384 4,172 11,255
Increase in inventories (8,461) (522) (3,354) Increase in trade receivables (20,115) (2,281) (631) (Increase)/decrease in other receivables (238) (174) 108 Increase in trade payables 26,181 468 4,178 (Decrease)/increase in other payables (2,392) 6,245 4,350 Movement in working capital (5,025) 3,736 4,651 Cash generated by operations 2,359 7,908 15,906 Cash generated before non-recurring items 3,240 8,954 18,561 Cash utilised in respect of non-recurring items (881) (1,046) (2,655) Taxation paid (2,340) (271) (1,840) Interest paid (917) (1,316) (2,198) Net cash (used in) / generated from operating activities
(898) 6,321 11,868
Cash flow from investing activities Interest received 120 39 71 Proceeds on disposal of property, plant and equipment
55 3 73
Purchases of property, plant and equipment (1,233) (819) (1,619) Purchases of intangible assets (423) (17) (237) Net cash outflow arising on disposal of operations - (1,619) (1,979) Net cash used in investing activities (1,481) (2,413) (3,691) Cash flow before financing activities (2,379) 3,908 8,177 Cash (used) / generated before non-recurring items (1,498) 6,573 12,811 Cash utilised in respect of non-recurring items (881) (1,046) (2,655) Net cash outflow on disposal of operations - (1,619) (1,979) Cash flow from financing activities Repayment of borrowings 6 (4,682) (2,633) (5,994) Refinancing costs paid 6 (15) (826) (1,512) Repayments of obligations under finance leases 6 (51) - (2) Net cash used in financing activities (4,748) (3,459) (7,508) Net (decrease) / increase in cash and cash equivalents (7,127) 449 669
Cash and cash equivalents at beginning of period
6 17,938 16,877 16,877
Effect of foreign exchange rate changes (641) (692) 392 Cash and cash equivalents at end of period 6 10,170 16,634 17,938
- 15 -
Notes to the Interim Statements
1. Basis of preparation These interim financial statements have been prepared in accordance with IAS 34, ‘Interim Financial Reporting’ as adopted by the European Union. The condensed consolidated interim financial information should be read in conjunction with the annual financial statements for the year ended 4th April 2010, which have been prepared in accordance with IFRSs as adopted by the European Union. This condensed consolidated interim financial information does not comprise statutory accounts within the meaning of section 434 of the Companies Act 2006. The financial information presented for the 26 weeks ended 3 October 2010 and 26 weeks ended 4 October 2009 has not been reviewed by the auditors. The financial information for the 52 weeks ended 4 April 2010 is extracted and abridged from the Group’s full accounts for that year. The statutory accounts for the 52 weeks ended 4 April 2010 have been filed with the Registrar of Companies for England and Wales and have been reported on by the Group’s auditors. The Report of the Auditors was not qualified and did not contain a statement under Section 498 of the Companies Act 2006. The interim report was approved by the Board of Directors on 2 November 2010. This interim report can be downloaded or viewed via the Group’s website at www.volex.com. Copies of the annual report for the financial year ended 4 April 2010 are available at the Company’s registered office at 10 Eastbourne Terrace, London, W2 6LG, UK and can also be downloaded or viewed via the Group’s website. The financial statements have been prepared using accounting policies consistent with International Financial Reporting Standards as adopted for use in the European Union (‘IFRS’) and which are consistent with those disclosed in the annual report and accounts for the 52 weeks ended 4 April 2010, except as described below. Adoption of new and revised International Financial Reporting Standards (IFRSs) The following new and revised Standards and interpretations have been adopted in the current period and have affected the amounts reported in these financial statements. New and amended standards adopted by the Group
• Amendment to IFRS 2, ‘Share based payment - Group cash-settled and share-based payment transactions’ – effective from reporting period 1 January 2010
• IAS 27 (revised), ‘Consolidated and separate financial statements’ – effective from reporting period 1 July 2009
• Amendment to IAS 39, ‘Financial Instruments: Recognition and measurement’ on ‘Eligible hedged items’ – effective from reporting period 1 July 2009
• Amendment to IAS 32, ‘Financial instruments: Presentation on classification of rights issue’ – effective from reporting period 1 February 2010
- 16 -
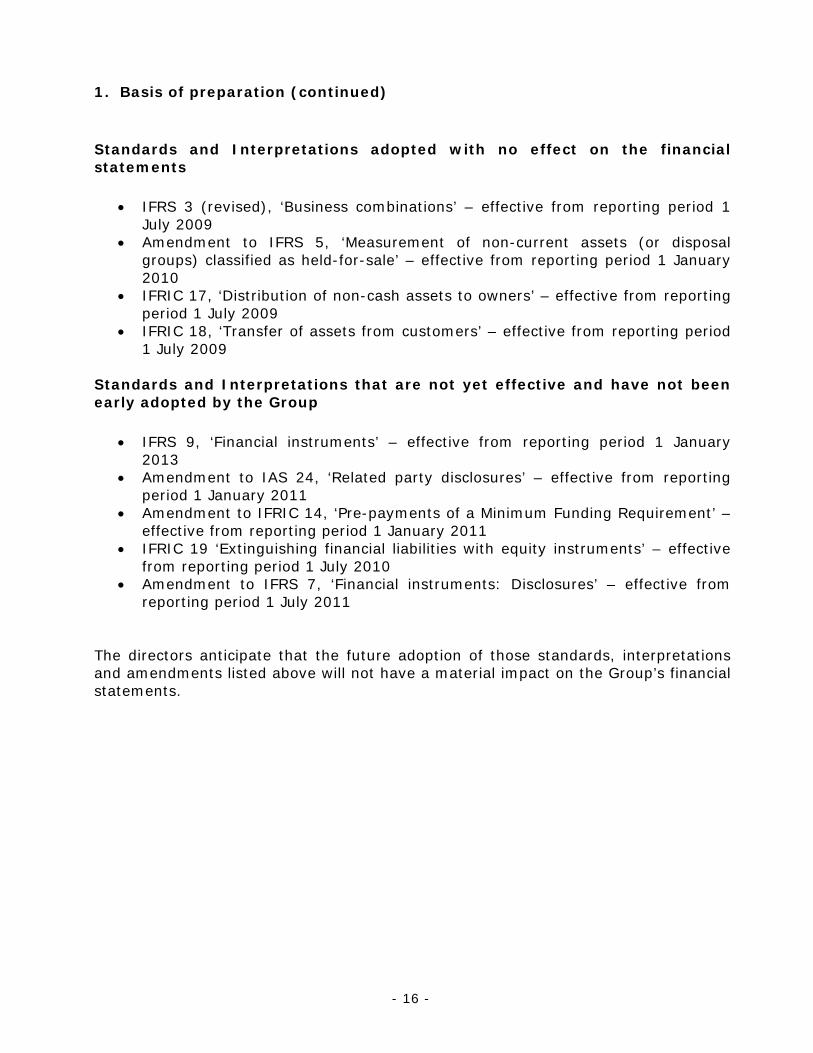
1. Basis of preparation (continued) Standards and Interpretations adopted with no effect on the financial statements
• IFRS 3 (revised), ‘Business combinations’ – effective from reporting period 1 July 2009
• Amendment to IFRS 5, ‘Measurement of non-current assets (or disposal groups) classified as held-for-sale’ – effective from reporting period 1 January 2010
• IFRIC 17, ‘Distribution of non-cash assets to owners’ – effective from reporting period 1 July 2009
• IFRIC 18, ‘Transfer of assets from customers’ – effective from reporting period 1 July 2009
Standards and Interpretations that are not yet effective and have not been early adopted by the Group
• IFRS 9, ‘Financial instruments’ – effective from reporting period 1 January 2013
• Amendment to IAS 24, ‘Related party disclosures’ – effective from reporting period 1 January 2011
• Amendment to IFRIC 14, ‘Pre-payments of a Minimum Funding Requirement’ – effective from reporting period 1 January 2011
• IFRIC 19 ‘Extinguishing financial liabilities with equity instruments’ – effective from reporting period 1 July 2010
• Amendment to IFRS 7, ‘Financial instruments: Disclosures’ – effective from reporting period 1 July 2011
The directors anticipate that the future adoption of those standards, interpretations and amendments listed above will not have a material impact on the Group’s financial statements.

- 17 -
2. Business and geographical segments Business segments As explained and fully reflected in the audited annual report and accounts for the 52 weeks ended 4 April 2010, Management have changed the organisation to a market sector focus, from the outgoing divisional Power Products and Interconnect basis that was disclosed in last year’s Interim Statement. Prior year comparatives have been restated to reflect this change. These market sectors are the basis on which the group reports its segment information and are based on the end markets that the group’s products are supplied into.
26 weeks to
3 October 2010 £’000
26 weeks
to 4 October
2009 £’000
(Audited)
52 weeks to 4 April
2010 £’000
Revenue Consumer 99,561 65,194 139,350 Telecoms/Datacoms 34,629 31,555 59,384 Healthcare 12,288 9,785 19,281 Industrial 10,555 3,659 10,980 157,033 110,193 228,995
26 weeks to
3 October 2010 £’000
26 weeks
to 4 October
2009 £’000
(Audited)
52 weeks to 4 April
2010 £’000
Gross profit Consumer 18,110 13,783 30,738 Telecoms/Datacoms 6,870 5,398 8,769 Healthcare 3,393 2,077 4,166 Industrial 2,478 899 2,488 30,851 22,157 46,161 Operating expenses excluding share based
expenses (22,403) (18,687) (35,903)
Share based expenses (252) (1) (9) Operating profit 8,196 3,469 10,249 Investment income 120 39 71 Finance costs (1,334) (1,809) (3,410) Profit before tax 6,982 1,699 6,910 Tax (1,494) (778) (1,631) Profit after tax 5,488 921 5,279

- 18 -
2. Business and geographical segments (continued) Other segmental information External revenue by source External revenue by destination
26 weeks to
3 October 2010 £’000
26 weeks
to 4 October
2009 £’000
(Audited) 52 weeks
to 4 April
2010 £’000
26 weeks
to 3 October
2010 £’000
26 weeks
to 4 October
2009 £’000
(Audited) 52 weeks
to 4 April
2010 £’000
Geographical segments Asia (excluding India) 111,257 65,854 133,351 80,850 52,665 113,003 India 6,660 13,160 22,209 6,660 14,768 22,222 Americas 19,616 20,162 49,170 39,257 22,858 51,286 Europe (including UK) 19,500 11,017 24,265 30,266 19,902 42,484 157,033 110,193 228,995 157,033 110,193 228,995 3. Non-recurring items
26 weeks to
3 October 2010 £’000
26 weeks
to 4 October
2009 £’000
(Audited)
52 weeks to 4 April
2010 £’000
Continuing operations Facilities rationalisation - 941 941 Corporate restructuring - 1,716 2,154 - 2,657 3,095 4. Tax charge The Group tax charge for the period is based on the forecast tax charge for the year as a whole and has been influenced by the differing tax rates in the UK and the various overseas countries in which the Group operates.
- 19 -
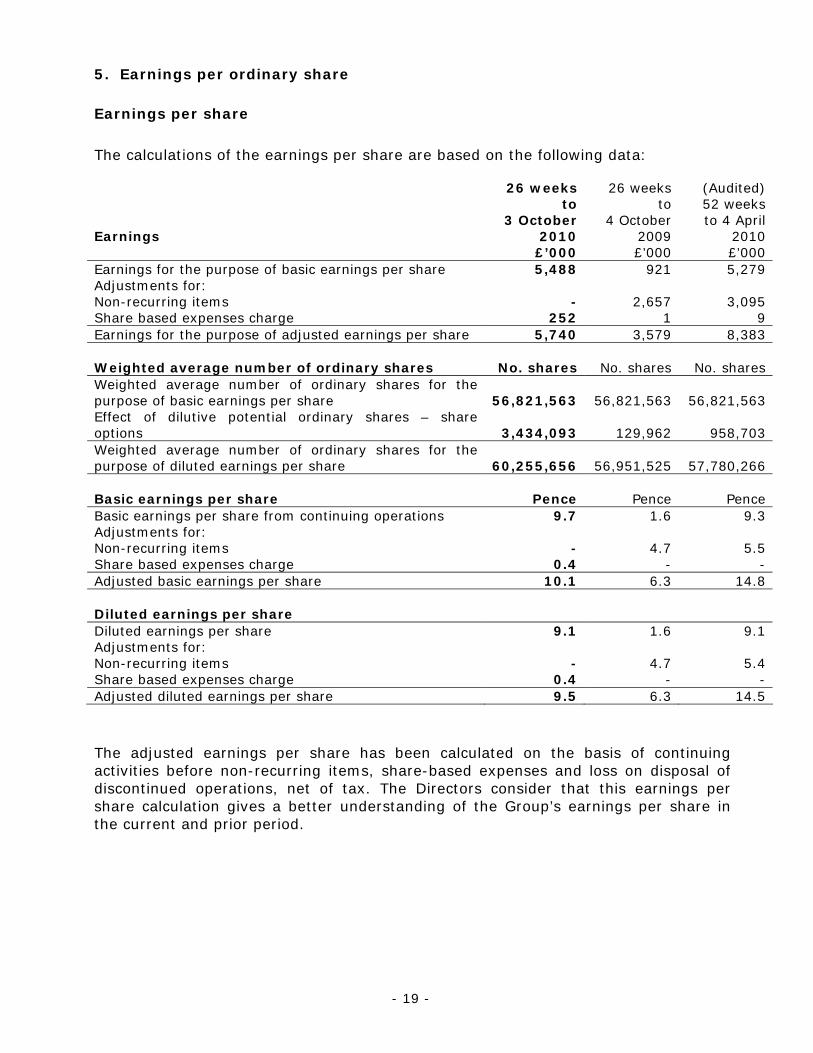
5. Earnings per ordinary share Earnings per share The calculations of the earnings per share are based on the following data: Earnings
26 weeks
to 3 October
2010 £’000
26 weeks
to 4 October
2009 £’000
(Audited) 52 weeks to 4 April
2010 £’000
Earnings for the purpose of basic earnings per share 5,488 921 5,279 Adjustments for: Non-recurring items - 2,657 3,095 Share based expenses charge 252 1 9 Earnings for the purpose of adjusted earnings per share 5,740 3,579 8,383 Weighted average number of ordinary shares No. shares No. shares No. shares Weighted average number of ordinary shares for the purpose of basic earnings per share 56,821,563
56,821,563 56,821,563
Effect of dilutive potential ordinary shares – share options 3,434,093 129,962 958,703 Weighted average number of ordinary shares for the purpose of diluted earnings per share 60,255,656
56,951,525 57,780,266
Basic earnings per share Pence Pence Pence Basic earnings per share from continuing operations 9.7 1.6 9.3 Adjustments for: Non-recurring items - 4.7 5.5 Share based expenses charge 0.4 - - Adjusted basic earnings per share 10.1 6.3 14.8 Diluted earnings per share Diluted earnings per share 9.1 1.6 9.1 Adjustments for: Non-recurring items - 4.7 5.4 Share based expenses charge 0.4 - - Adjusted diluted earnings per share 9.5 6.3 14.5 The adjusted earnings per share has been calculated on the basis of continuing activities before non-recurring items, share-based expenses and loss on disposal of discontinued operations, net of tax. The Directors consider that this earnings per share calculation gives a better understanding of the Group’s earnings per share in the current and prior period.
- 20 -
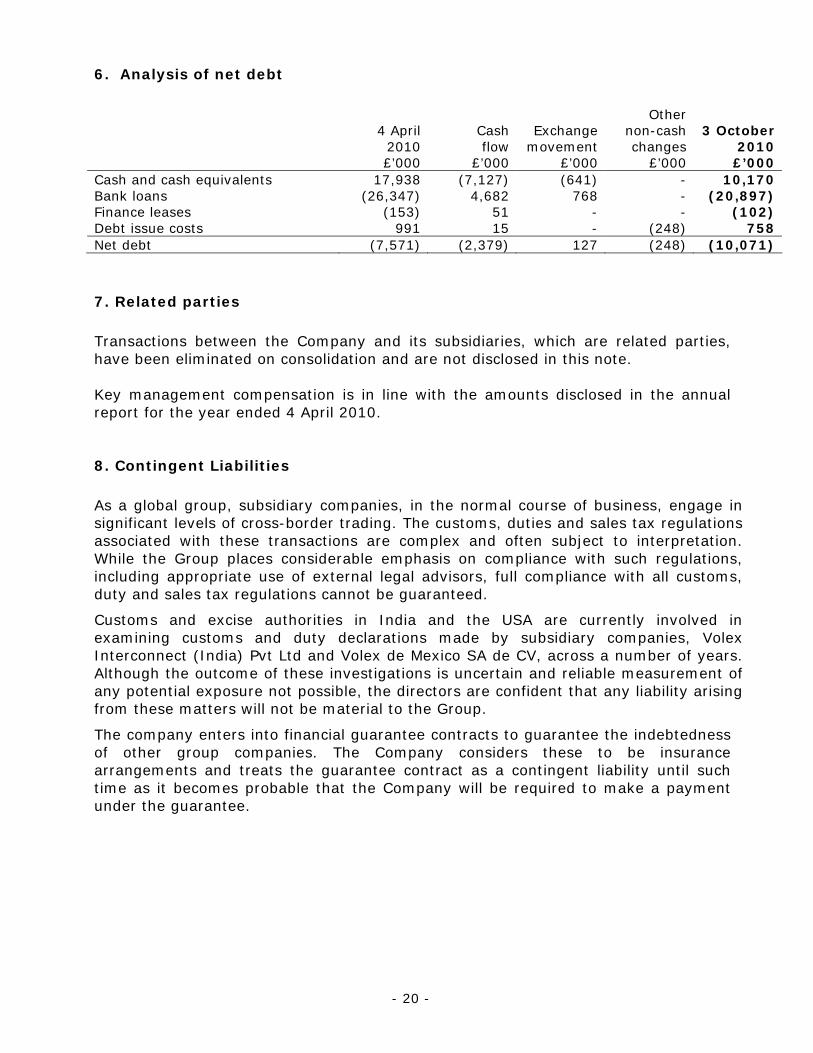
6. Analysis of net debt
4 April 2010 £’000
Cash flow
£’000
Exchange
movement £’000
Other non-cash changes
£’000
3 October
2010 £’000
Cash and cash equivalents 17,938 (7,127) (641) - 10,170 Bank loans (26,347) 4,682 768 - (20,897) Finance leases (153) 51 - - (102) Debt issue costs 991 15 - (248) 758 Net debt (7,571) (2,379) 127 (248) (10,071) 7. Related parties Transactions between the Company and its subsidiaries, which are related parties, have been eliminated on consolidation and are not disclosed in this note. Key management compensation is in line with the amounts disclosed in the annual report for the year ended 4 April 2010. 8. Contingent Liabilities As a global group, subsidiary companies, in the normal course of business, engage in significant levels of cross-border trading. The customs, duties and sales tax regulations associated with these transactions are complex and often subject to interpretation. While the Group places considerable emphasis on compliance with such regulations, including appropriate use of external legal advisors, full compliance with all customs, duty and sales tax regulations cannot be guaranteed.
Customs and excise authorities in India and the USA are currently involved in examining customs and duty declarations made by subsidiary companies, Volex Interconnect (India) Pvt Ltd and Volex de Mexico SA de CV, across a number of years. Although the outcome of these investigations is uncertain and reliable measurement of any potential exposure not possible, the directors are confident that any liability arising from these matters will not be material to the Group.
The company enters into financial guarantee contracts to guarantee the indebtedness of other group companies. The Company considers these to be insurance arrangements and treats the guarantee contract as a contingent liability until such time as it becomes probable that the Company will be required to make a payment under the guarantee.


![[ YEARLY LEADERS ] - National Football Leagueprod.static.jaguars.clubs.nfl.com/assets/PDFs/MediaGuide/Yearly... · 190 jaguars.com 2016 jacksonville jaguars media guide [ yearly leaders](https://img.pdfslide.net/doc/110x75/5b401d157f8b9a2f138ce381/-yearly-leaders-national-football-190-jaguarscom-2016-jacksonville-jaguars.jpg)