Embed Size (px)
Citation preview

VolexWee aree a leaadinng gglobbal suupplier of ppowwerr annd ddattaa cabblingg sooluttionns seervvicinng aa diiverrse ranngee of maarkeetss including connsuumeer eelecttroonicss, teeleccommmuuniicattionns, dattaceentrres,, meediccal equipppmeent aandd thhe aautoommotivve induustrry. VVoleex’ss prroduucttss aaand solutioonss aree innteggral to thhe iincrreassinggly sopphissticccateed ddigittal wworrld in wwhiich we livee, prrovvidinng ppowwerr annd cconnnecctivvity tto eeveryddayy itemms aas wwell ass coompplexx mmmachhineeryy.
Introduction
01 Who we are
Strategic report
02 Chairman’s statement
04 Strategy
08 Operational review
10 Divisional review
14 Financial review
19 Group risk management
23 Corporate and social responsibility
Governance
25 Chairman’s introduction
26 Board of Directors
28 Corporate governance report
33 Audit Committee report
36 Directors’ remuneration report
53 Directors’ report
57 Independent auditors’ report
Financial statements
62 Consolidated income statement
63 Consolidated statement of comprehensive income
64 Consolidated and Company statement of financial position
65 Consolidated and Company statement of changes in equity
66 Consolidated and Company statement of cash flows
67 Notes to the financial statements
Other financial information
102 Principal operating subsidiaries
103 Five year summary
105 Shareholder information
105 Registered office and advisors
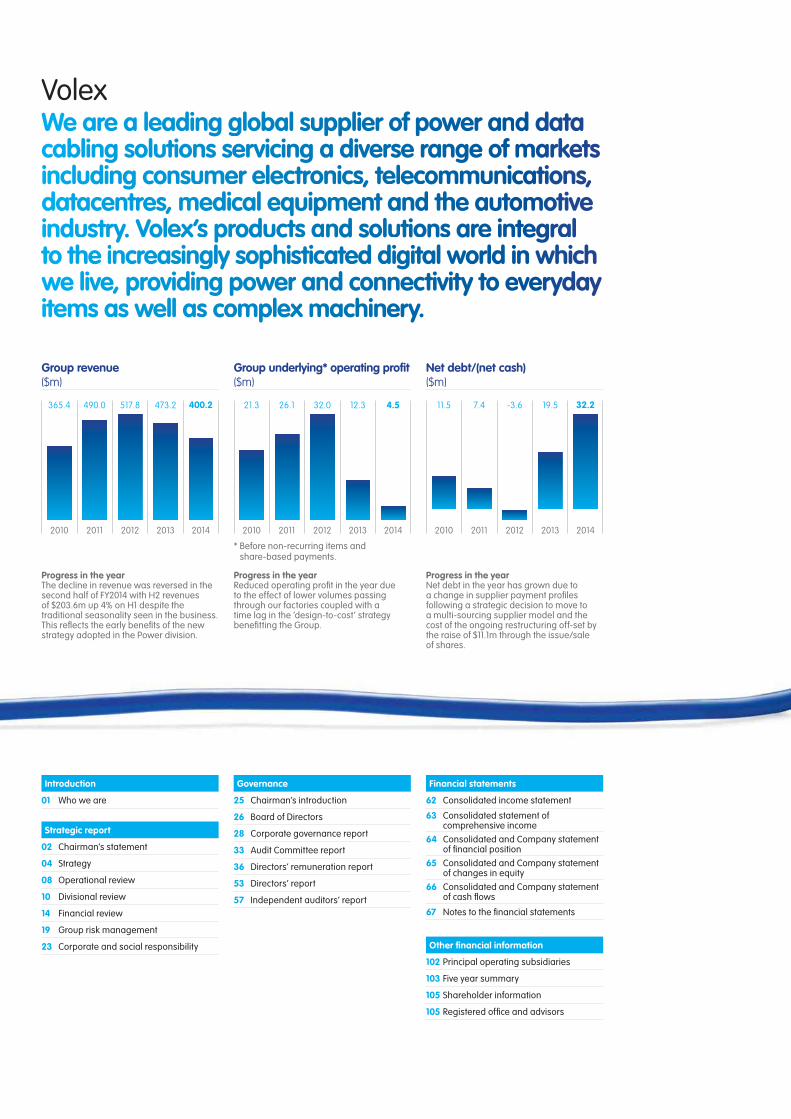
Group revenue ($m)
2010 20142011 2012 2013
400.2490.0 517.8 473.2365.4
Group underlying* operating profit ($m)
2010
21.3
2014
4.5
2011
26.1
2012
32.0
2013
12.3
Net debt/(net cash) ($m)
2010 20142011 2012 2013
11.5 32.27.4 -3.6 19.5
Progress in the yearThe decline in revenue was reversed in the second half of FY2014 with H2 revenues of $203.6m up 4% on H1 despite the traditional seasonality seen in the business. This reflects the early benefits of the new strategy adopted in the Power division.
Progress in the yearReduced operating profit in the year due to the effect of lower volumes passing through our factories coupled with a time lag in the ‘design-to-cost’ strategy benefitting the Group.
Progress in the yearNet debt in the year has grown due to a change in supplier payment profiles following a strategic decision to move to a multi-sourcing supplier model and the cost of the ongoing restructuring off-set by the raise of $11.1m through the issue/sale of shares.
* Before non-recurring items and share-based payments.
01Volex plcAnnual Report and Accounts 2014
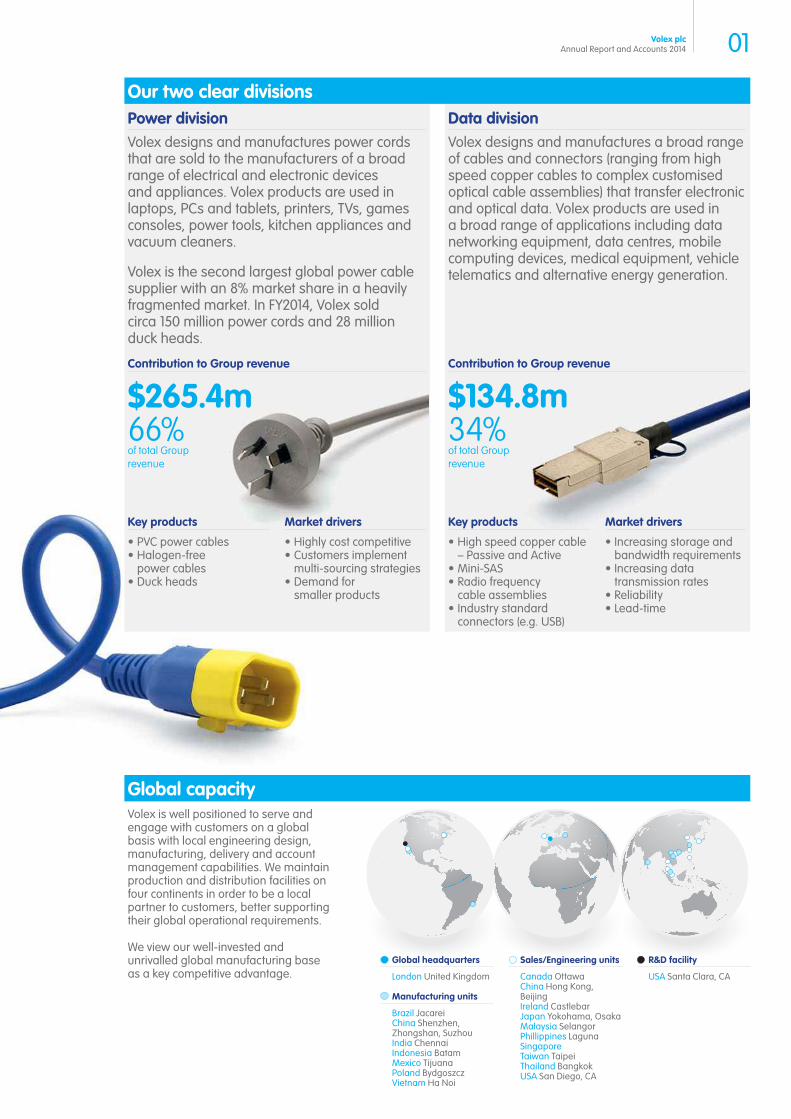
Our two clear divisions
Global capacity
Power divisionVolex designs and manufactures power cords that are sold to the manufacturers of a broad range of electrical and electronic devices and appliances. Volex products are used in laptops, PCs and tablets, printers, TVs, games consoles, power tools, kitchen appliances and vacuum cleaners.
Volex is the second largest global power cable supplier with an 8% market share in a heavily fragmented market. In FY2014, Volex sold circa 150 million power cords and 28 million duck heads.
Volex is well positioned to serve and engage with customers on a global basis with local engineering design, manufacturing, delivery and account management capabilities. We maintain production and distribution facilities on four continents in order to be a local partner to customers, better supporting their global operational requirements.
We view our well-invested and unrivalled global manufacturing base as a key competitive advantage.
Contribution to Group revenue
$265.4m66%of total Group revenue
Key products
PVC power cablesHalogen-free power cablesDuck heads
Market drivers
Highly cost competitiveCustomers implement multi-sourcing strategiesDemand for smaller products
Key products
High speed copper cable – Passive and ActiveMini-SAS Radio frequency cable assemblies Industry standard connectors (e.g. USB)
Market drivers
Increasing storage and bandwidth requirementsIncreasing data transmission ratesReliabilityLead-time
Global headquarters
London United Kingdom
Manufacturing units
Brazil Jacarei China Shenzhen,
Zhongshan, Suzhou India Chennai Indonesia Batam Mexico Tijuana Poland Bydgoszcz Vietnam Ha Noi
Sales/Engineering units
Canada Ottawa China Hong Kong,
Beijing Ireland Castlebar Japan Yokohama, Osaka Malaysia Selangor Phillippines Laguna Singapore Taiwan Taipei Thailand Bangkok USA San Diego, CA
R&D facility
USA Santa Clara, CA
Contribution to Group revenue
$134.8m34%of total Group revenue
Data divisionVolex designs and manufactures a broad range of cables and connectors (ranging from high speed copper cables to complex customised optical cable assemblies) that transfer electronic and optical data. Volex products are used in a broad range of applications including data networking equipment, data centres, mobile computing devices, medical equipment, vehicle telematics and alternative energy generation.
02 Volex plcAnnual Report and Accounts 2014
Chairman’s statementKaren SlatfordChairman
As anticipated, the results for the year to 30 March 2014 are disappointing as we undertook a process of fundamental renewal. We have rebuilt the senior management team and the Board. Christoph Eisenhardt, CEO of Volex, and his new executive team have developed a clear vision for the business and are firmly positioning the Group on a renewed growth trajectory.
Financial performanceFY2013
$mFY2014
$m
Revenue 473.2 400.2
Underlying operating profit 12.3 4.5
Non-recurring items (8.0) (11.6)
Share-based payment credit/charge (0.1) 2.3
Statutory operating profit 4.2 (4.8)
Revenue reduced by 15.4% from $473.2 million to $400.2 million while underlying operating profit fell to $4.5 million (FY2013: $12.3 million). This downturn is largely attributed to a failure to adapt our strategy to meet the requirements of our core customers within the power cord market. Whilst our customers were anticipating us continuously improving our supply chain to remain cost competitive, we were looking to achieve improved operating margins through higher customer pricing. As a result, we suffered from reduced business allocations.
The new executive team has realigned our strategy in accordance with the very specific expectations of our Power and Data customers whilst looking to leverage Volex’s market differentiating strengths such as its high quality and reliability standards, its global sales and manufacturing footprint and its strong brand recognition. Our sales, engineering, manufacturing and purchasing teams are working together to ensure that we better meet customer product specifications through implementation of a rigorous and increasingly localised ‘design-to-cost’ methodology. It is pleasing to report that the new strategy is having an immediate effect with revenues for the second half of FY2014 up 3.6% on the first half, contrary to the historic seasonality of the business.
The transformation of the business has necessitated a wider-ranging restructuring of the Group than envisaged which has resulted in higher exceptional costs than initially expected. In FY2014 we have incurred $8.6 million (FY2013: $7.2 million) of non-recurring restructuring spend. Included within the $8.6 million are the severance packages for the outgoing executive management, recruitment fees for the new senior management team, right-sizing costs of certain sites, other targeted redundancies and associated costs plus a retention bonus of $1.0 million payable to high performing operational staff necessary for the completion of the VTP. We expect further restructuring costs in FY2015, albeit at a greatly reduced level.
Additionally we have incurred $1.6 million (FY2013: $nil) of exceptional professional fees and banking costs in relation to financing. During the year, the Group has explored a number of alternate financing opportunities to ensure that sufficient funds are available to complete the transformation plan and return the Group to growth. Further exceptional provisions have been charged in the year in relation to sales tax disputes in our emerging markets and onerous lease charges. Off-setting these costs is a $0.6 million (FY2013: $nil) non-recurring refund of finance costs.
As a result of the disappointing trading performance in the year coupled with the high level of exceptional expenditure, the loss before tax for the year is $7.6 million (FY2013: profit of $1.9 million). Following a tax charge of $6.6 million (FY2013: $2.8 million), arising principally from the write-off of deferred tax assets, the loss after tax for the year is $14.2 million (FY2013: $0.9 million). This has resulted in a statutory loss per share of 23.7 cents (FY2013: 1.6 cents).
During the year, we raised $6.3 million from the sale of treasury shares and $4.8 million from a share placing. Off-setting this inflow was a $21.4 million free cash outflow (FY2013: $20.7 million) due not only to the exceptional, non-recurring spend of $7.5 million (FY2013: $6.9 million) but also due to a change in supplier payment profiles following a strategic decision to move to a multi-sourcing supplier model. As a result, net debt at the end of the year was $32.2 million (FY2013: $19.5 million).
Volex Transformation Plan (‘VTP’) now delivering growth and margins ahead of expectation;New two-divisional structure (Power and Data), ensuring accountability embedded throughout the organisation; Restructuring of the Board and senior management now complete;Early signs of VTP impact upon revenue with H2 FY2014 revenue 4% ahead of H1 despite historically observed seasonality;$11.1 million cash raised from a share issue and sale of treasury shares; and $30.3 million to be raised post year end through the issue of 24,067,171 shares.
03Volex plcAnnual Report and Accounts 2014
Thee VVoleex TTraanssforrmattiionn Plann is woorkkingg. Thee inncreeasedd foocuus onnn deelivverringg too oour cusstommeers’’ needds haas hhadd aa poosiitivee imppacct oon ouur oorder innttakke.
Due to the disappointing trading performance and the increased net debt, the Board has decided that it is prudent not to declare a full year dividend for the current year.
Post year end the Group will issue 24,067,171 new shares for a gross consideration of $30.3 million. The issuance of these shares will be subject to approval by a simple majority of those voting at a general meeting on 1 July 2014. The Company has irrevocable commitments to vote in favour of the resolution to issue the shares at that meeting from shareholders holding 26% of the Group’s share capital.
Board changesDuring the last year the Board has changed significantly. Full details of the new appointments and the involvement of each individual on the various Committees of the Board can be found in the Governance section of this Report.
The whole Board is very closely involved with developing the revised strategy for the Group and is actively supporting the executive management team to help to deliver the enhanced shareholder returns that will result.
I am pleased to announce that Chief Executives have now been appointed to both divisions with Allan Lam joining us in Singapore as the Power division CEO and Matthew Becker joining us in the USA as the Data division CEO. Both bring with them a wealth of experience and are actively engaged in implementing the new strategy.
Business transformationAs previously announced, the VTP has been initiated and is focused upon:
Increasing customer focus with a more customer and market-specific product offering;
Increasing operational efficiency with an emphasis upon design-to-cost manufacturing methodology; and
Improving supply chain management.
Volex has always worked with Tier 1 global customers and has built a reputation for delivering high specification, high quality products. As part of the VTP, the Group is forming relationships with major new customers and is winning an increasing share of allocations with existing
customers. As a result, we are seeing revenue growth as we start our new financial year.
PeopleI would like to take this opportunity to thank all the employees of the Group for their hard work and dedication during what has been a period of change. It is now gratifying to see that their focus upon delivering customer satisfaction is leading to tangible results.
Outlook statementEncouraging progress has been made with the VTP which is delivering revenue growth and is expected to deliver additional cost savings in FY2015. This has been evidenced by:
Revenue in the first two months of the new financial year is 13% higher than the same period in the previous year;
Factory loading for the first quarter indicates that revenue for the quarter will be 10% ahead of prior year and 4% ahead of the previous quarter; and
Gross margins in the first month of the new financial year are better than expected and the order intake in the higher margin product areas provides confidence that this will continue, especially as volumes increase and factory utilisation improves.
The Group expects to be cash generative in the current year after interest, tax and exceptional costs.
The combination of the proposed share issue and associated refinancing of the Group’s debt facility is expected to reduce leverage, secure longer term financial flexibility and enable the business to complete its transformation plan.
Whilst there remains much to do, we are confident that we have the right strategy to make good progress in the current financial year providing the Group with a firm foundation for future growth.
04 Volex plcAnnual Report and Accounts 2014
Strategic Report
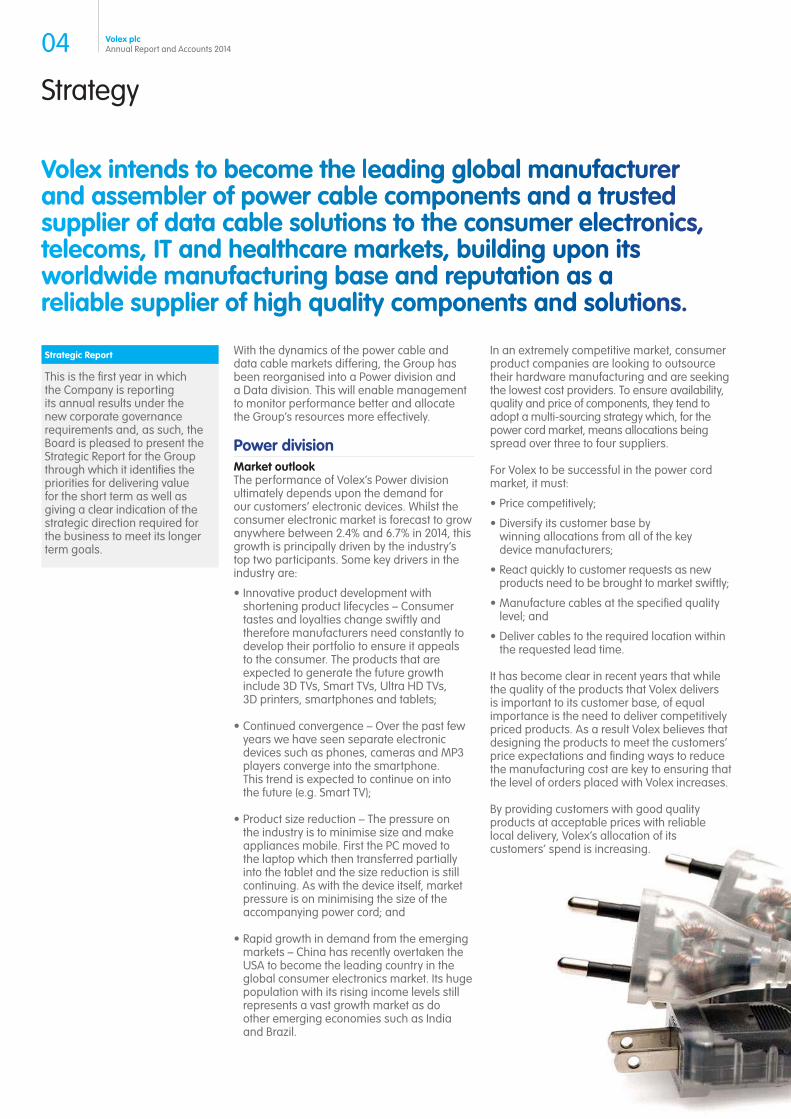
Voleex inntennds tto bbecoomee the leeadiing globbal maanuffacttureer andd asssemmbleer off poowerr caableee commpoonents andd a ttrusstedd suppplier of datta ccable sooluttionns to thee coonsuumeer electrronics,, telecomms, IIT annd heaalthccaree mmaarkeets, buiildinng uuponn itss worrldwwide maanuffactturinng bbassee annd rrepuutattion as a reliaablee supppliier oof hiigh quaalittyy coompponeentss and sooluttionns.
With the dynamics of the power cable and data cable markets differing, the Group has been reorganised into a Power division and a Data division. This will enable management to monitor performance better and allocate the Group’s resources more effectively.
Power divisionMarket outlookThe performance of Volex’s Power division ultimately depends upon the demand for our customers’ electronic devices. Whilst the consumer electronic market is forecast to grow anywhere between 2.4% and 6.7% in 2014, this growth is principally driven by the industry’s top two participants. Some key drivers in the industry are:
Innovative product development with shortening product lifecycles – Consumer tastes and loyalties change swiftly and therefore manufacturers need constantly to develop their portfolio to ensure it appeals to the consumer. The products that are expected to generate the future growth include 3D TVs, Smart TVs, Ultra HD TVs, 3D printers, smartphones and tablets;
Continued convergence – Over the past few years we have seen separate electronic devices such as phones, cameras and MP3 players converge into the smartphone. This trend is expected to continue on into the future (e.g. Smart TV);
Product size reduction – The pressure on the industry is to minimise size and make appliances mobile. First the PC moved to the laptop which then transferred partially into the tablet and the size reduction is still continuing. As with the device itself, market pressure is on minimising the size of the accompanying power cord; and
Rapid growth in demand from the emerging markets – China has recently overtaken the USA to become the leading country in the global consumer electronics market. Its huge population with its rising income levels still represents a vast growth market as do other emerging economies such as India and Brazil.
This is the first year in which the Company is reporting its annual results under the new corporate governance requirements and, as such, the Board is pleased to present the Strategic Report for the Group through which it identifies the priorities for delivering value for the short term as well as giving a clear indication of the strategic direction required for the business to meet its longer term goals.
Strategy
In an extremely competitive market, consumer product companies are looking to outsource their hardware manufacturing and are seeking the lowest cost providers. To ensure availability, quality and price of components, they tend to adopt a multi-sourcing strategy which, for the power cord market, means allocations being spread over three to four suppliers.
For Volex to be successful in the power cord market, it must:
Price competitively;
Diversify its customer base by winning allocations from all of the key device manufacturers;
React quickly to customer requests as new products need to be brought to market swiftly;
Manufacture cables at the specified quality level; and
Deliver cables to the required location within the requested lead time.
It has become clear in recent years that while the quality of the products that Volex delivers is important to its customer base, of equal importance is the need to deliver competitively priced products. As a result Volex believes that designing the products to meet the customers’ price expectations and finding ways to reduce the manufacturing cost are key to ensuring that the level of orders placed with Volex increases.
By providing customers with good quality products at acceptable prices with reliable local delivery, Volex’s allocation of its customers’ spend is increasing.
05Volex plcAnnual Report and Accounts 2014
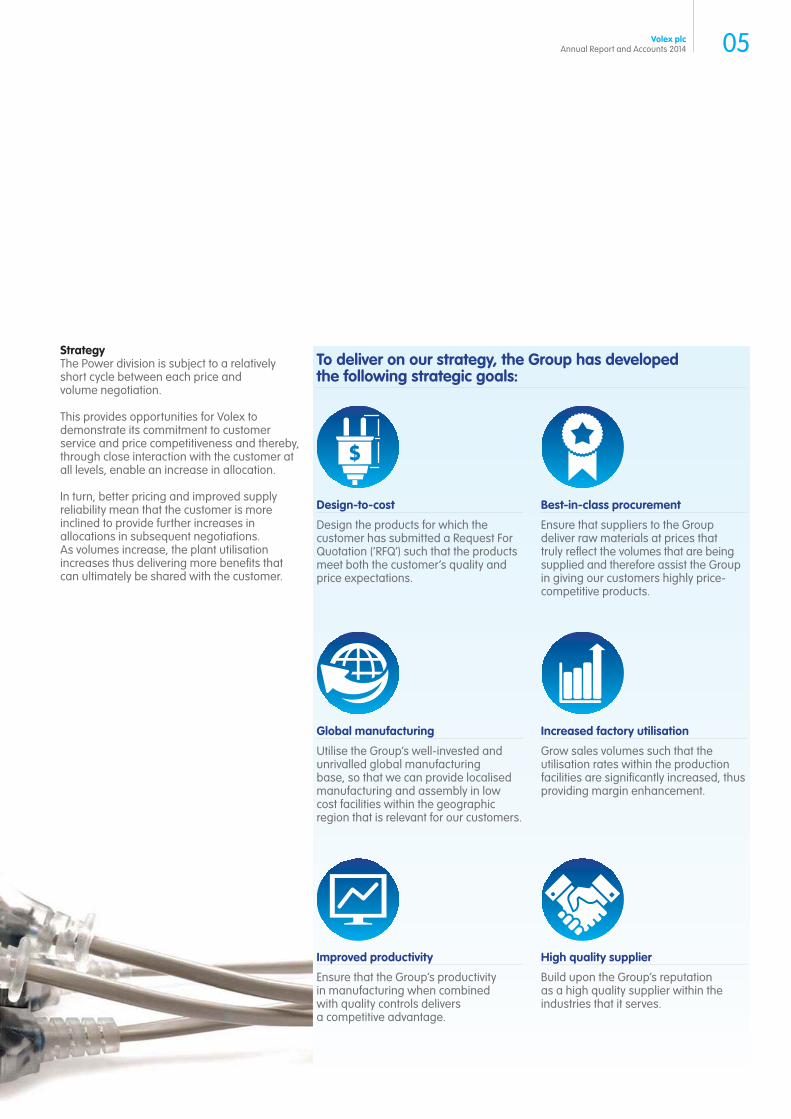
To deliver on our strategy, the Group has developed the following strategic goals:
StrategyThe Power division is subject to a relatively short cycle between each price and volume negotiation.
This provides opportunities for Volex to demonstrate its commitment to customer service and price competitiveness and thereby, through close interaction with the customer at all levels, enable an increase in allocation.
In turn, better pricing and improved supply reliability mean that the customer is more inclined to provide further increases in allocations in subsequent negotiations. As volumes increase, the plant utilisation increases thus delivering more benefits that can ultimately be shared with the customer.
High quality supplier
Build upon the Group’s reputation as a high quality supplier within the industries that it serves.
Best-in-class procurement
Ensure that suppliers to the Group deliver raw materials at prices that truly reflect the volumes that are being supplied and therefore assist the Group in giving our customers highly price-competitive products.
Design-to-cost
Design the products for which the customer has submitted a Request For Quotation (‘RFQ’) such that the products meet both the customer’s quality and price expectations.
Increased factory utilisation
Grow sales volumes such that the utilisation rates within the production facilities are significantly increased, thus providing margin enhancement.
Global manufacturing
Utilise the Group’s well-invested and unrivalled global manufacturing base, so that we can provide localised manufacturing and assembly in low cost facilities within the geographic region that is relevant for our customers.
Improved productivity
Ensure that the Group’s productivity in manufacturing when combined with quality controls delivers a competitive advantage.
06 Volex plcAnnual Report and Accounts 2014
Strategy continued
Data divisionMarket outlookVolex’s data cables serve a diverse range of industries, from the cables connecting medical monitoring devices through to cables transmitting data between servers in a datacentre and to cables in 4G mobile base stations. As a result, a diverse range of market drivers are encountered including:
Increasing data transmission speeds – The one constant across nearly all industries is the need for data to be transmitted at ever faster speeds;
Increasing storage and bandwidth requirements – The global demand and use of streaming information, such as audio and video, requires increased storage capacity and high speed retrieval capabilities. Increasing internet traffic is placing ever greater pressure upon existing network infrastructure, necessitating equipment upgrades and capacity additions;
Remote monitoring – Covering such fields as telematics and healthcare, the growth in remote monitoring is leading to demand for devices to convert data into a digital format, often requiring data cable connections; and
Consolidation of supply base – Generally, global OEMs are consolidating their supply chain by selecting global companies possessing broad expertise and scale for the majority of their data cabling requirements.
Unlike the Power division, the Data division’s sales are developed through a long term collaborative relationship with customers in which Volex can demonstrate its longer term technological capabilities.
StrategyThe Data division is involved with long term, project specific customer programmes, such as large medical devices or technological developments (e.g. 4G mobile telecoms roll out). These projects provide a greater degree of certainty in terms of longevity of the product but are also less predictable as to when they may arise. Volumes can therefore fluctuate to a greater extent. However, by once again focusing on customer service and by demonstrating a technologically advanced product portfolio, it is possible to ensure that Volex delivers a complete package of data cables enabling us to compete in this growing market.
To deliver on the above strategy, the Group has developed the following strategic goals:
Develop a market leading product range – Volex’s investment in product development is primarily focused on the Data division where the Group can better differentiate itself from the competition through its product portfolio.
Partner with key customers – Significant revenue wins within the Data division come from large scale customer project roll-outs. These projects can often take several years of collaborative development work. By aligning ourselves with these customers, Volex can have engineers on-site illustrating to the customer what we can offer;
High quality supplier – Build upon the Group’s reputation as the high quality supplier within the industries that it serves; and
Global manufacturing – Utilise the Group’s well-invested and unrivalled global manufacturing base, so that we can provide localised manufacturing and assembly in low cost facilities within the geographic region that is relevant for our customers.
Overview
Overall, the strategy for both divisions is designed to generate profitable sales growth with:
Additional sales from existing customers;
Winning sales from new customers in the same markets we already operate in; and
Winning sales from new customers in adjacent markets that are not yet being addressed.
Increased sales volumes will deliver better productivity, factory utilisation and operating margins.
Inccreaaseed ssalles voolummeees wwilll deelivverr bettterr prodducctivvityy, faaccttoryy uutiliisaation andd oopeerattinng mmaargiinsss.
07Volex plcAnnual Report and Accounts 2014
OutcomesVolex is committed to significant growth in shareholder value that will be driven by:
Top line growth as customer allocations grow and new customers are introduced to the Group;
Increased profitability as factory utilisation and productivity improve; and
Cash generation as profits and margins grow whilst capital expenditure is less than depreciation and amortisation.
To this end, management will now focus upon three specific Key Performance Indicators (‘KPIs’) which help to assess the implementation of the strategy:
Annual revenue growth;
Factory utilisation; and
Free cash flow.
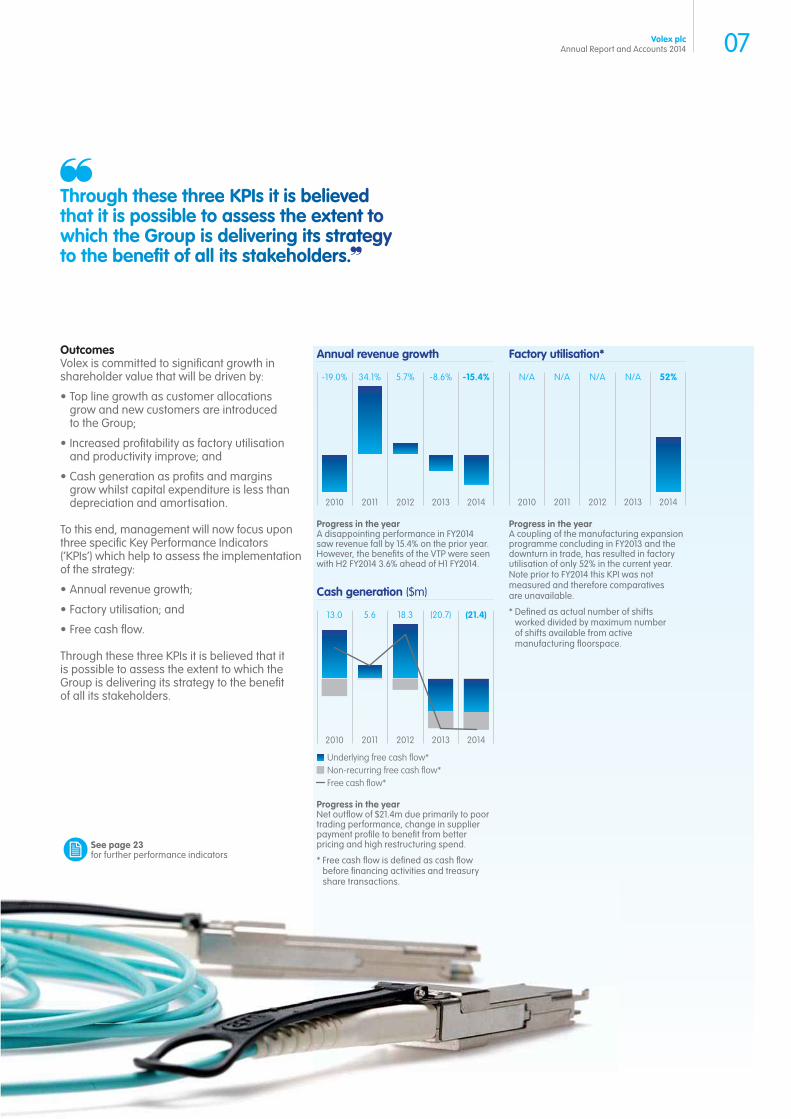
Through these three KPIs it is believed that it is possible to assess the extent to which the Group is delivering its strategy to the benefit of all its stakeholders.
Annual revenue growth
2010
-19.0%
2014
-15.4%
2011
34.1%
2012
5.7%
2013
-8.6%
Factory utilisation*
2010
N/A
2014
52%
2011
N/A
2012
N/A
2013
N/A
Cash generation ($m)
2010
13.0
2014
(21.4)
2011
5.6
2012
18.3
2013
(20.7)
Underlying free cash flow*
Free cash flow*Non-recurring free cash flow*
Progress in the yearA disappointing performance in FY2014 saw revenue fall by 15.4% on the prior year. However, the benefits of the VTP were seen with H2 FY2014 3.6% ahead of H1 FY2014.
Progress in the yearA coupling of the manufacturing expansion programme concluding in FY2013 and the downturn in trade, has resulted in factory utilisation of only 52% in the current year. Note prior to FY2014 this KPI was not measured and therefore comparatives are unavailable.
* Defined as actual number of shifts worked divided by maximum number of shifts available from active manufacturing floorspace.
Progress in the yearNet outflow of $21.4m due primarily to poor trading performance, change in supplier payment profile to benefit from better pricing and high restructuring spend.
* Free cash flow is defined as cash flow before financing activities and treasury share transactions.
Thrrouughh thheese thhreee KKPIIs iit iss bbeliievvedd thaat it iss pposssibble too aasseesss thhe exxtent to whhichh thhe GGrouup is deelivverringg itts sstraateegyy to tthee bbennefifit oof aall ittss sttakkehholldeers..
See page 23 for further performance indicators
08 Volex plcAnnual Report and Accounts 2014
Operational review
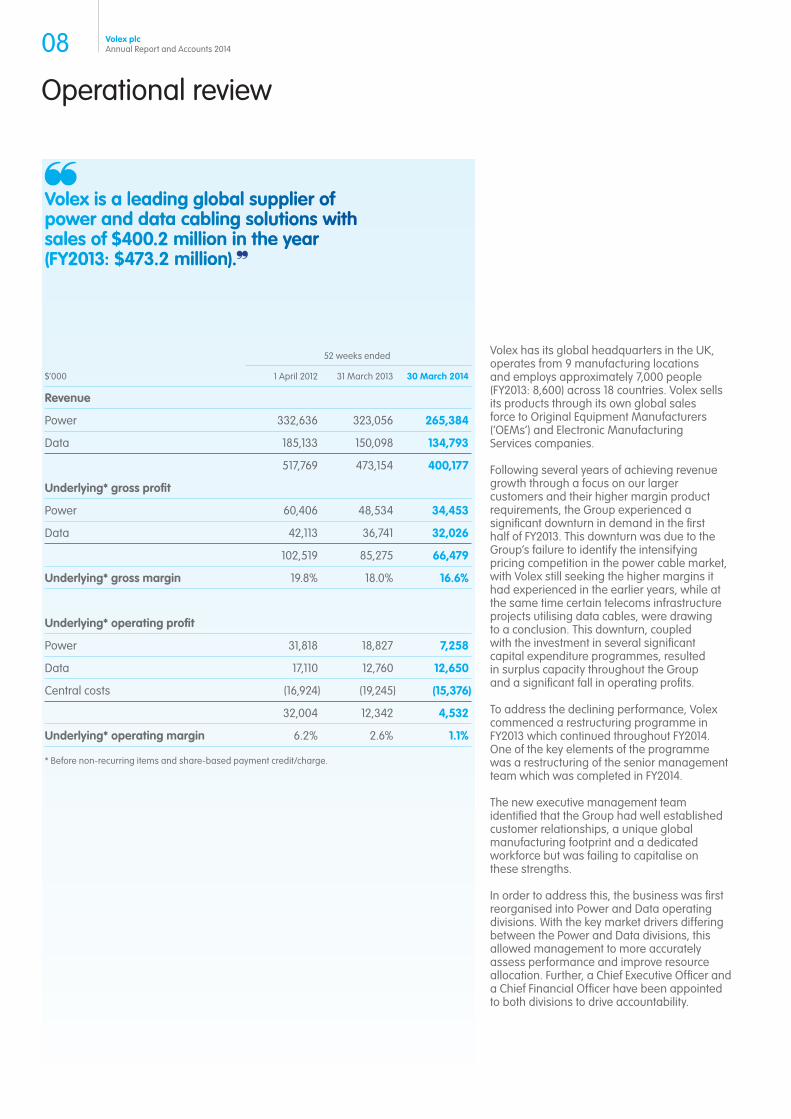
Volex has its global headquarters in the UK, operates from 9 manufacturing locations and employs approximately 7,000 people (FY2013: 8,600) across 18 countries. Volex sells its products through its own global sales force to Original Equipment Manufacturers (‘OEMs’) and Electronic Manufacturing Services companies.
Following several years of achieving revenue growth through a focus on our larger customers and their higher margin product requirements, the Group experienced a significant downturn in demand in the first half of FY2013. This downturn was due to the Group’s failure to identify the intensifying pricing competition in the power cable market, with Volex still seeking the higher margins it had experienced in the earlier years, while at the same time certain telecoms infrastructure projects utilising data cables, were drawing to a conclusion. This downturn, coupled with the investment in several significant capital expenditure programmes, resulted in surplus capacity throughout the Group and a significant fall in operating profits.
To address the declining performance, Volex commenced a restructuring programme in FY2013 which continued throughout FY2014. One of the key elements of the programme was a restructuring of the senior management team which was completed in FY2014.
The new executive management team identified that the Group had well established customer relationships, a unique global manufacturing footprint and a dedicated workforce but was failing to capitalise on these strengths.
In order to address this, the business was first reorganised into Power and Data operating divisions. With the key market drivers differing between the Power and Data divisions, this allowed management to more accurately assess performance and improve resource allocation. Further, a Chief Executive Officer and a Chief Financial Officer have been appointed to both divisions to drive accountability.
52 weeks ended
$’000 1 April 2012 31 March 2013 30 March 2014
Revenue
Power 332,636 323,056 265,384
Data 185,133 150,098 134,793
517,769 473,154 400,177
Underlying* gross profit
Power 60,406 48,534 34,453
Data 42,113 36,741 32,026
102,519 85,275 66,479
Underlying* gross margin 19.8% 18.0% 16.6%
Underlying* operating profit
Power 31,818 18,827 7,258
Data 17,110 12,760 12,650
Central costs (16,924) (19,245) (15,376)
32,004 12,342 4,532
Underlying* operating margin 6.2% 2.6% 1.1%
* Before non-recurring items and share-based payment credit/charge.
Vollexx is a lleaadinng gloobbbal supppplieer oof powweer aandd ddataa ccabblinnng ssolutionns wwithh sales of $44000.2 mmillioonn in thee yyeaar (FYY20113: $44733.22 mmillioonnn).
09Volex plcAnnual Report and Accounts 2014
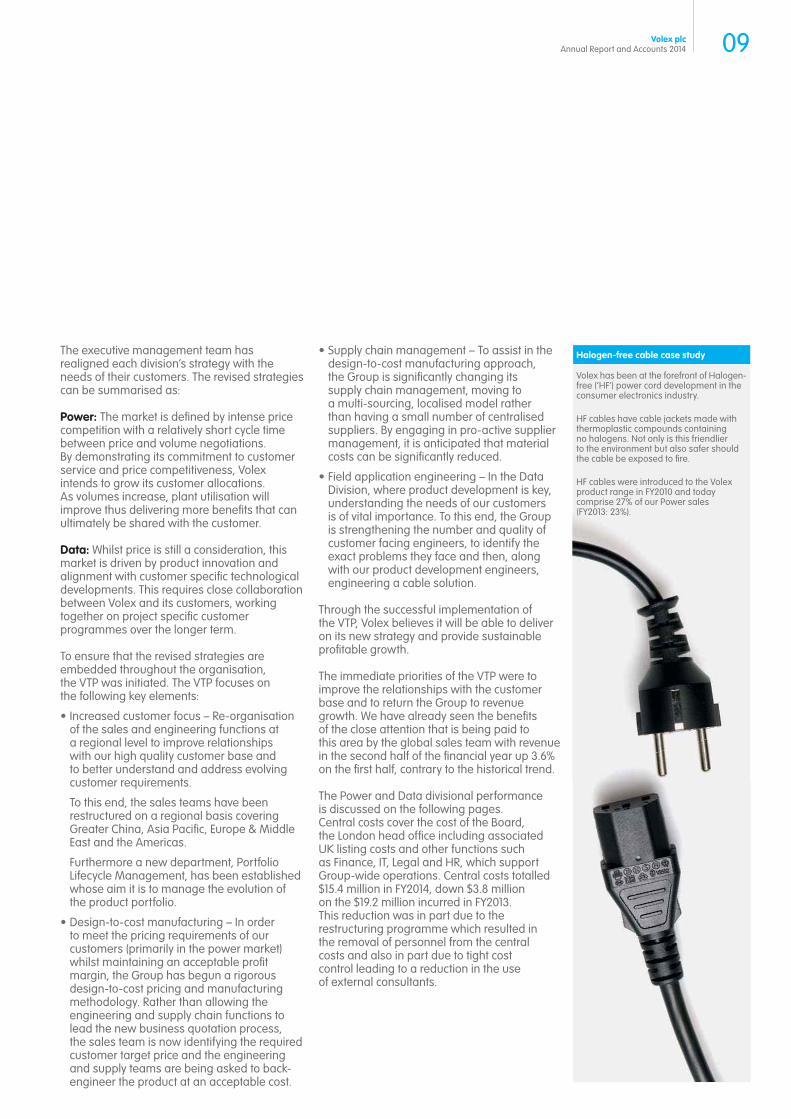
Halogen-free cable case study
Volex has been at the forefront of Halogen- free (‘HF’) power cord development in the consumer electronics industry.
HF cables have cable jackets made with thermoplastic compounds containing no halogens. Not only is this friendlier to the environment but also safer should the cable be exposed to fire.
HF cables were introduced to the Volex product range in FY2010 and today comprise 27% of our Power sales (FY2013: 23%).
The executive management team has realigned each division’s strategy with the needs of their customers. The revised strategies can be summarised as:
Power: The market is defined by intense price competition with a relatively short cycle time between price and volume negotiations. By demonstrating its commitment to customer service and price competitiveness, Volex intends to grow its customer allocations. As volumes increase, plant utilisation will improve thus delivering more benefits that can ultimately be shared with the customer.
Data: Whilst price is still a consideration, this market is driven by product innovation and alignment with customer specific technological developments. This requires close collaboration between Volex and its customers, working together on project specific customer programmes over the longer term.
To ensure that the revised strategies are embedded throughout the organisation, the VTP was initiated. The VTP focuses on the following key elements:
Increased customer focus – Re-organisation of the sales and engineering functions at a regional level to improve relationships with our high quality customer base and to better understand and address evolving customer requirements.
To this end, the sales teams have been restructured on a regional basis covering Greater China, Asia Pacific, Europe & Middle East and the Americas.
Furthermore a new department, Portfolio Lifecycle Management, has been established whose aim it is to manage the evolution of the product portfolio.
Design-to-cost manufacturing – In order to meet the pricing requirements of our customers (primarily in the power market) whilst maintaining an acceptable profit margin, the Group has begun a rigorous design-to-cost pricing and manufacturing methodology. Rather than allowing the engineering and supply chain functions to lead the new business quotation process, the sales team is now identifying the required customer target price and the engineering and supply teams are being asked to back-engineer the product at an acceptable cost.
Supply chain management – To assist in the design-to-cost manufacturing approach, the Group is significantly changing its supply chain management, moving to a multi-sourcing, localised model rather than having a small number of centralised suppliers. By engaging in pro-active supplier management, it is anticipated that material costs can be significantly reduced.
Field application engineering – In the Data Division, where product development is key, understanding the needs of our customers is of vital importance. To this end, the Group is strengthening the number and quality of customer facing engineers, to identify the exact problems they face and then, along with our product development engineers, engineering a cable solution.
Through the successful implementation of the VTP, Volex believes it will be able to deliver on its new strategy and provide sustainable profitable growth.
The immediate priorities of the VTP were to improve the relationships with the customer base and to return the Group to revenue growth. We have already seen the benefits of the close attention that is being paid to this area by the global sales team with revenue in the second half of the financial year up 3.6% on the first half, contrary to the historical trend.
The Power and Data divisional performance is discussed on the following pages. Central costs cover the cost of the Board, the London head office including associated UK listing costs and other functions such as Finance, IT, Legal and HR, which support Group-wide operations. Central costs totalled $15.4 million in FY2014, down $3.8 million on the $19.2 million incurred in FY2013. This reduction was in part due to the restructuring programme which resulted in the removal of personnel from the central costs and also in part due to tight cost control leading to a reduction in the use of external consultants.
10 Volex plcAnnual Report and Accounts 2014
Divisional review Power division
Divisional reviewDue to the differences between the power cable and data cable markets, the Group now operates and reports under a two-divisional structure: the Power division and the Data division. This will allow for a better focus on customer relationships as well as enhance the Group’s emphasis upon accountability and profitability.
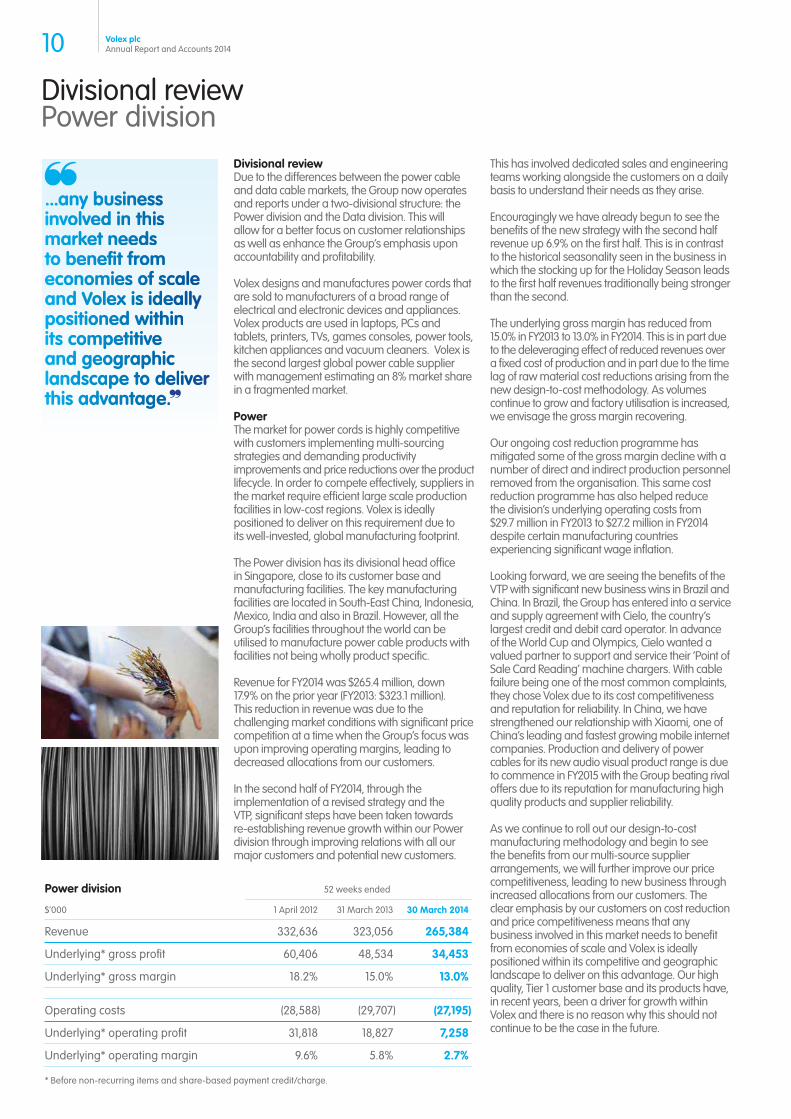
Volex designs and manufactures power cords that are sold to manufacturers of a broad range of electrical and electronic devices and appliances. Volex products are used in laptops, PCs and tablets, printers, TVs, games consoles, power tools, kitchen appliances and vacuum cleaners. Volex is the second largest global power cable supplier with management estimating an 8% market share in a fragmented market.
PowerThe market for power cords is highly competitive with customers implementing multi-sourcing strategies and demanding productivity improvements and price reductions over the product lifecycle. In order to compete effectively, suppliers in the market require efficient large scale production facilities in low-cost regions. Volex is ideally positioned to deliver on this requirement due to its well-invested, global manufacturing footprint.
The Power division has its divisional head office in Singapore, close to its customer base and manufacturing facilities. The key manufacturing facilities are located in South-East China, Indonesia, Mexico, India and also in Brazil. However, all the Group’s facilities throughout the world can be utilised to manufacture power cable products with facilities not being wholly product specific.
Revenue for FY2014 was $265.4 million, down 17.9% on the prior year (FY2013: $323.1 million). This reduction in revenue was due to the challenging market conditions with significant price competition at a time when the Group’s focus was upon improving operating margins, leading to decreased allocations from our customers.
In the second half of FY2014, through the implementation of a revised strategy and the VTP, significant steps have been taken towards re-establishing revenue growth within our Power division through improving relations with all our major customers and potential new customers.
....aannyy bbuusinnneessss innvvoolvveedd innn tthhiss mmaarrkkeett nneeeeddss too bbeenneefifitt fffroomm eccoonnooommiieesss ooff ssccaallee andd VVoolleexx iss iiddeeaallyy poosiitioonneeddd wwiithhinn itss ccoommppeettiitiivvee andd ggeeoooggrraapphhicc laannddssccaappeee too ddeellivveerr thhiss aaddvvaannnttaaggee..
This has involved dedicated sales and engineering teams working alongside the customers on a daily basis to understand their needs as they arise.
Encouragingly we have already begun to see the benefits of the new strategy with the second half revenue up 6.9% on the first half. This is in contrast to the historical seasonality seen in the business in which the stocking up for the Holiday Season leads to the first half revenues traditionally being stronger than the second.
The underlying gross margin has reduced from 15.0% in FY2013 to 13.0% in FY2014. This is in part due to the deleveraging effect of reduced revenues over a fixed cost of production and in part due to the time lag of raw material cost reductions arising from the new design-to-cost methodology. As volumes continue to grow and factory utilisation is increased, we envisage the gross margin recovering.
Our ongoing cost reduction programme has mitigated some of the gross margin decline with a number of direct and indirect production personnel removed from the organisation. This same cost reduction programme has also helped reduce the division’s underlying operating costs from $29.7 million in FY2013 to $27.2 million in FY2014 despite certain manufacturing countries experiencing significant wage inflation.
Looking forward, we are seeing the benefits of the VTP with significant new business wins in Brazil and China. In Brazil, the Group has entered into a service and supply agreement with Cielo, the country’s largest credit and debit card operator. In advance of the World Cup and Olympics, Cielo wanted a valued partner to support and service their ‘Point of Sale Card Reading’ machine chargers. With cable failure being one of the most common complaints, they chose Volex due to its cost competitiveness and reputation for reliability. In China, we have strengthened our relationship with Xiaomi, one of China’s leading and fastest growing mobile internet companies. Production and delivery of power cables for its new audio visual product range is due to commence in FY2015 with the Group beating rival offers due to its reputation for manufacturing high quality products and supplier reliability.
As we continue to roll out our design-to-cost manufacturing methodology and begin to see the benefits from our multi-source supplier arrangements, we will further improve our price competitiveness, leading to new business through increased allocations from our customers. The clear emphasis by our customers on cost reduction and price competitiveness means that any business involved in this market needs to benefit from economies of scale and Volex is ideally positioned within its competitive and geographic landscape to deliver on this advantage. Our high quality, Tier 1 customer base and its products have, in recent years, been a driver for growth within Volex and there is no reason why this should not continue to be the case in the future.
Power division 52 weeks ended
$’000 1 April 2012 31 March 2013 30 March 2014
Revenue 332,636 323,056 265,384
Underlying* gross profit 60,406 48,534 34,453
Underlying* gross margin 18.2% 15.0% 13.0%
Operating costs (28,588) (29,707) (27,195)
Underlying* operating profit 31,818 18,827 7,258
Underlying* operating margin 9.6% 5.8% 2.7%
* Before non-recurring items and share-based payment credit/charge.
11Volex plcAnnual Report and Accounts 2014
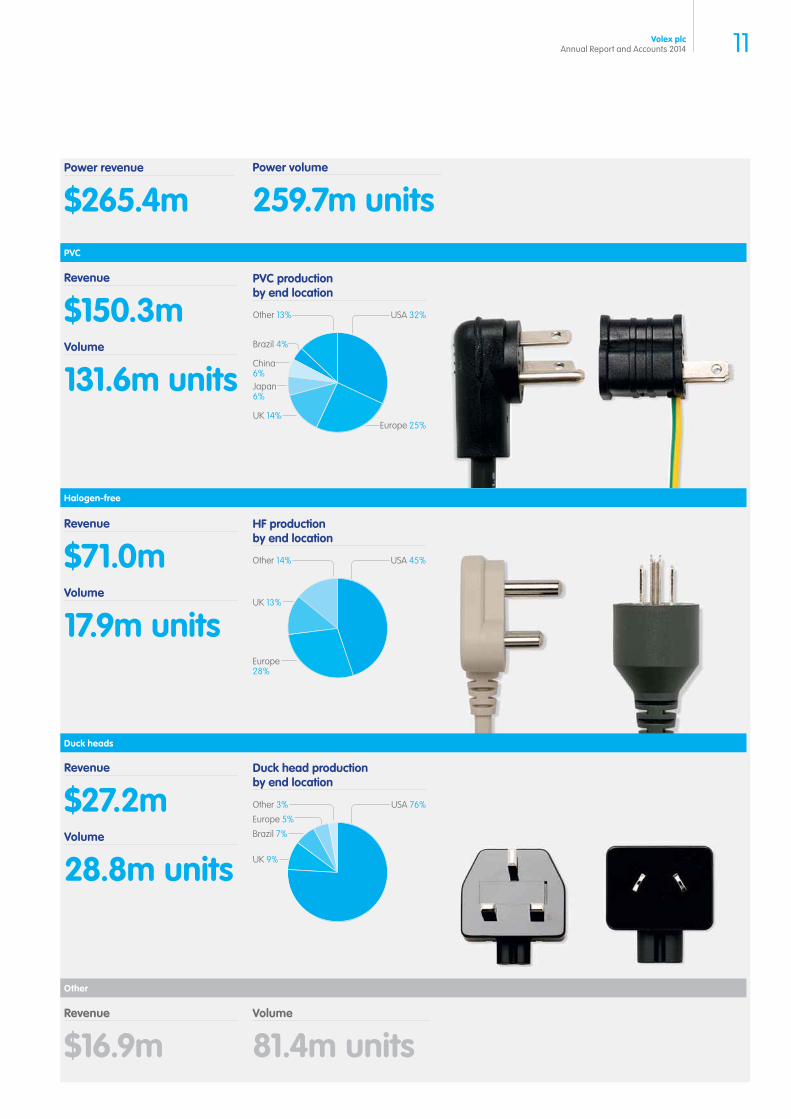
Revenue
$16.9m
HF production by end location
USA 45%Other 14%
Europe 28%
UK 13%
Revenue
$71.0mVolume
17.9m units
Volume
81.4m units
Duck heads
Other
Power revenue
$265.4m
Duck head production by end location
USA 76%Other 3%
UK 9%
Brazil 7%
Europe 5%
Revenue
$27.2mVolume
28.8m units
PVC production by end location
USA 32%Other 13%
UK 14%
Brazil 4%
Europe 25%
Japan 6%
China 6%
Revenue
$150.3mVolume
131.6m units
Power volume
259.7m unitsPVC
Halogen-free
12 Volex plcAnnual Report and Accounts 2014
Divisional review Data division
Volex designs and manufactures a broad range of cables and connectors (ranging from high-speed copper cables to complex customised optical cable assemblies) that transfer electronic, radio-frequency and optical data. Volex products are used in a broad range of applications including data networking equipment, data centres, wireless base stations and cell site installations, mobile computing devices, medical equipment, factory automation, vehicle telematics, agricultural equipment and alternative energy generation.
Volex competes by producing highly engineered, high performance, application specific data cables, in close collaboration with its customers. Focusing on this approach leads to products with longer lifecycles and less pricing pressure when compared to standard power products.
The Data division is headquartered in the USA with manufacturing facilities in Mexico, Brazil, Europe, India and China, all within close proximity to many existing and potential new customers. It operates in a fragmented market that is growing rapidly and Volex has several strong niche positions within data centres and the telecoms and healthcare sectors where customers utilise Volex expertise and manufacturing competencies.
Revenue for FY2014 was $134.8 million (FY2013: $150.1 million), down 10.2% on the prior year. This was primarily due to a decline in revenue from our key telecoms customers arising from completion of 4G infrastructure roll-out projects in the USA and Japan which had benefitted our FY2013 results, whilst new regional deployments (e.g. China) were delayed. Furthermore, we experienced significant pricing pressure from our European telecoms customers as they themselves suffered from intense market competition from their Asian counterparts. Off-setting the decline in telecoms revenue, we saw strong growth in revenue from our healthcare customers with our largest healthcare customer’s revenue up 21% year-on-year. This was due to strong MRI cable sales following a collaborative development project over the past two years.
VVooleexx haass ssseevveerraal sttroonngg nniicchhhee posiitiioonnss wwwwitthhinn dataa cceenntrreeess aaanndd thhee tteelleeccoommmss aanndd heeaaaltthhccaareee sseeccttoorss wwhheerree ccuusstttoommeeerss uttilissee VVooleeexx exxppeeerttissee aaanndd mmaannuuffaaccttuuuriinngg coommmppeetteenncccieess.
As outlined in the Strategic Report, the leading edge technologies that our customers employ mean that there are constant uncertainties involved with the speed at which new programmes are launched. Delivery timescales of new projects such as 4G and the above MRI project can have a significant impact upon call off schedules for our data cable products.
Despite the revenue reduction, the underlying gross profit margin within the division remained strong at 23.8% (FY2013: 24.5%).
In terms of operating costs, the benefit of the ongoing cost reduction programme can be evidenced from the reduction in operating costs from $24.0 million in FY2013 to $19.4 million in FY2014, a fall of 19.2%.
During FY2014, we have continued to develop our Active Optical Cable (‘AOC’) technology. As previously announced, we have encountered certain production delays. However, we continue to believe that the technology offers the potential for future profitable growth and as a consequence have capitalised $2.0 million (FY2013: $0.2 million) of development costs.
Looking forward we expect the rollout of 4G mobile phone technology in China to be a driver of growth. As noted above, in recent years the Group has established a strong presence as a supplier to the expanding 4G mobile market as the new standard was introduced in territories such as the USA. Volex supplies data cabling systems for the mobile phone base station masts, each of which requires up to 70 cables. Strong relationships with the leading OEM suppliers in China is resulting in an increased order book in preparation of the rollout.
The rapidly increasing demand for faster access to more data is driving new technologies with higher performance and increased scalability. The OEM customers that Volex serves recognise that a limiting factor for data throughput is the connectivity within data centres and other high technology environments. This is leading them towards the critical ‘design-to-spec’ capabilities that Volex can deliver. Our niche position within this market means that we can deliver advanced products in line with our customers’ price expectations. Data division financial highlights 52 weeks ended
$’000 1 April 2012 31 March 2013 30 March 2014
Revenue 185,133 150,098 134,793
Underlying* gross profit 42,113 36,741 32,026
Underlying* gross margin 22.7% 24.5% 23.8%
Operating costs (25,003) (23,981) (19,376)
Underlying* operating profit 17,110 12,760 12,650
Underlying* operating margin 9.2% 8.5% 9.4%
* Before non-recurring items and share-based payment credit/charge.
13Volex plcAnnual Report and Accounts 2014
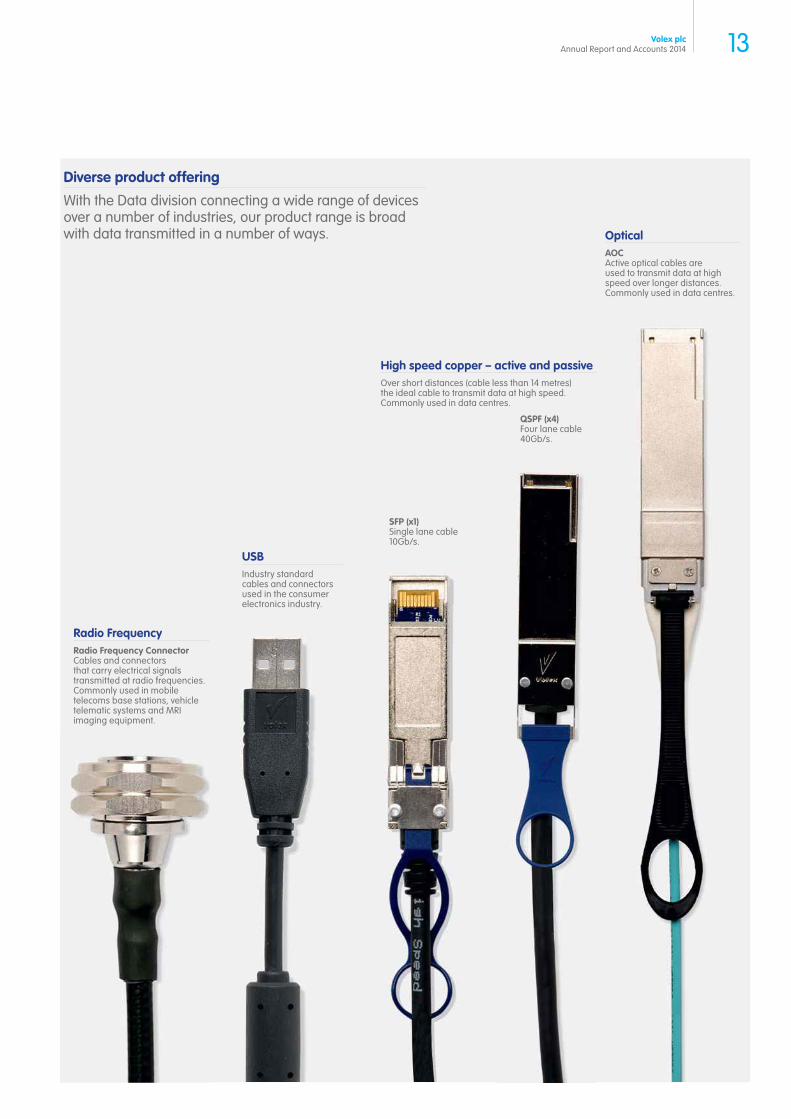
Diverse product offering
With the Data division connecting a wide range of devices over a number of industries, our product range is broad with data transmitted in a number of ways.
High speed copper – active and passiveOver short distances (cable less than 14 metres) the ideal cable to transmit data at high speed. Commonly used in data centres.
USBIndustry standard cables and connectors used in the consumer electronics industry.
SFP (x1)Single lane cable10Gb/s.
QSPF (x4)Four lane cable40Gb/s.
OpticalAOCActive optical cables are used to transmit data at high speed over longer distances. Commonly used in data centres.
Radio FrequencyRadio Frequency ConnectorCables and connectors that carry electrical signals transmitted at radio frequencies. Commonly used in mobile telecoms base stations, vehicle telematic systems and MRI imaging equipment.
14 Volex plcAnnual Report and Accounts 2014
Financial reviewNick ParkerChief Financial Officer
As outlined in the Strategic Report, the core operations of the business form a strong foundation for future growth. Despite the operational setbacks that have been experienced, the business continues to deliver underlying operating profits and is supported by a strong customer base which recognises the quality of its products in a demanding, cost driven environment.
Measuring financial performanceThe Group continues to use a number of specific measures to assess its performance and these are referred to throughout this Annual Report in the discussion of the performance of the business. These measures are not defined in IFRS, but are used by the Board to assess the underlying operational performance of the Group and as such the Board believes these performance measures are important and should be considered alongside the IFRS measures. These measures include:
Measure Definition
Underlying profit
Profit before non-recurring items and share-based payments
Underlying EPS
Earnings per share adjusted for the impacts of non-recurring items and share-based payments
Free cash flow
Net cash flow before financing activities and treasury share transactions
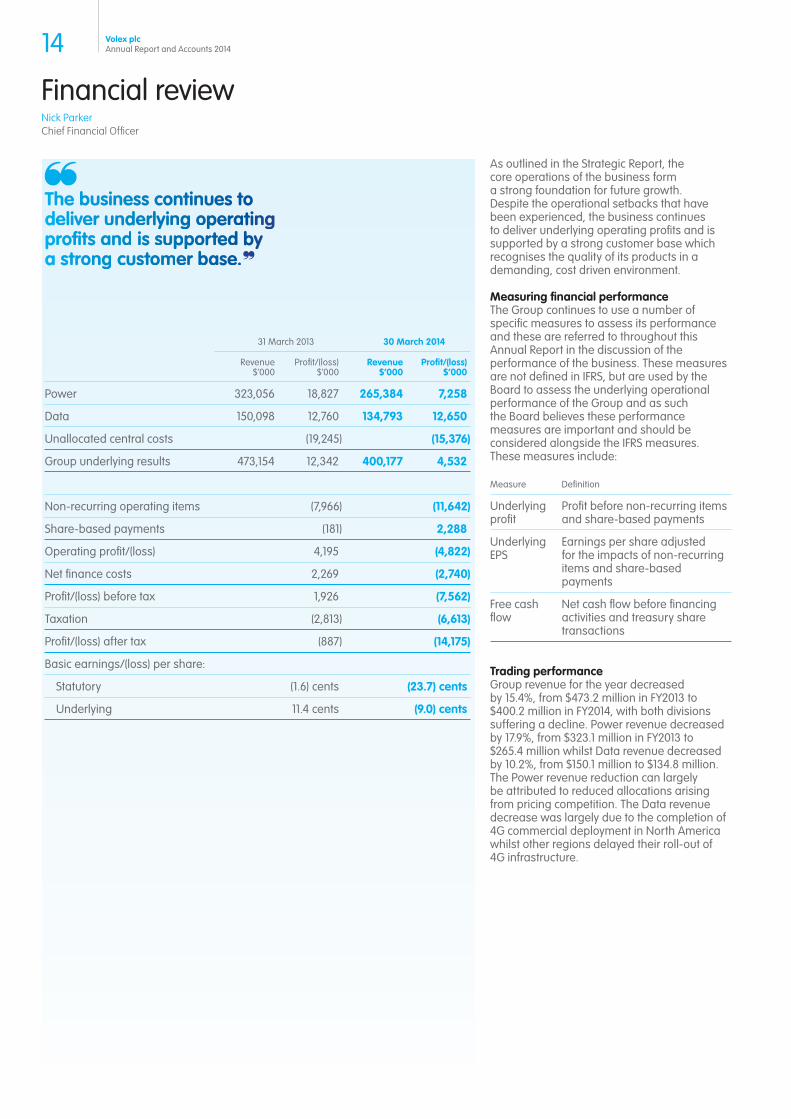
Trading performanceGroup revenue for the year decreased by 15.4%, from $473.2 million in FY2013 to $400.2 million in FY2014, with both divisions suffering a decline. Power revenue decreased by 17.9%, from $323.1 million in FY2013 to $265.4 million whilst Data revenue decreased by 10.2%, from $150.1 million to $134.8 million. The Power revenue reduction can largely be attributed to reduced allocations arising from pricing competition. The Data revenue decrease was largely due to the completion of 4G commercial deployment in North America whilst other regions delayed their roll-out of 4G infrastructure.
Thhee bbuusiineesss ccoonnttinnueess tto deeliiveerr uundeerrlyyyinngg oopperraatingg prrofifitts andd iis ssuppppoorttedd byy a sttroonngg ccusstooommeerr bbaasee.
31 March 2013 30 March 2014
Revenue $’000
Profit/(loss) $’000
Revenue $’000
Profit/(loss) $’000
Power 323,056 18,827 265,384 7,258
Data 150,098 12,760 134,793 12,650
Unallocated central costs (19,245) (15,376)
Group underlying results 473,154 12,342 400,177 4,532
Non-recurring operating items (7,966) (11,642)
Share-based payments (181) 2,288
Operating profit/(loss) 4,195 (4,822)
Net finance costs 2,269 (2,740)
Profit/(loss) before tax 1,926 (7,562)
Taxation (2,813) (6,613)
Profit/(loss) after tax (887) (14,175)
Basic earnings/(loss) per share:
Statutory (1.6) cents (23.7) cents
Underlying 11.4 cents (9.0) cents
15Volex plcAnnual Report and Accounts 2014
The Group’s underlying gross profit for FY2014 was $66.5 million, yielding an underlying gross margin of 16.6%. This compared to a FY2013 underlying gross profit of $85.3 million and an underlying gross margin of 18.0%. The primary cause of this reduced gross margin is the lower revenues and their ability to absorb the fixed factory overheads. In the prior year, significant investment was made in the Volex factory footprint. This investment was based upon a certain volume throughput which has yet to materialise and as a result the deleveraging has suppressed gross margin. In addition, whilst the impact of the new business strategy in the Power division is already having effect with improved revenues, the benefits of the design-to-cost and multi-supplier sourcing initiatives are only now beginning to pass through into our cost base.
The Group’s underlying operating profit for FY2014 was $4.5 million, down $7.8 million on the prior year. This was driven by the reduced gross profit of $18.8 million, with operating cost savings of $11.0 million limiting the impact at the operating profit level. These cost savings have arisen from the ongoing restructuring programme commenced in FY2013 which not only seeks to bring the cost base into line with the reduced revenue but also to ensure that Volex is staffed with a workforce with the appropriate skillset.
Non-recurring operating items and share-based paymentsThe Group has incurred non-recurring operating costs of $11.6 million in FY2014 (FY2013: $8.0 million). In addition a $0.6 million interest refund was received in FY2014 (FY2013: $nil) in relation to interest overpayments in earlier periods. This refund has been shown within net finance costs above.
The largest component of the non-recurring operating costs is in relation to the ongoing restructuring programme. This programme has yielded one-off costs in FY2014 of $8.6 million (FY2013: $7.2 million). The restructuring programme can be split into an executive and senior management change element and an operational element.
The executive and senior management change element includes the change of Chief Executive Officer, Chief Financial Officer, Company Secretary and certain Non-Executive Directors, the termination of the Chief Operating Officer position and the recruitment of the new divisional heads and the new HR Director. In total, this has generated a non-recurring charge of $4.9 million (FY2013: $1.2 million) which includes joining bonuses of $0.3 million.
The operational element includes the closure of our North America administrative centre, further reductions in our direct and indirect manufacturing headcount, the removal of certain middle management roles throughout the organisation and costs associated with
right-sizing certain operations. In total, this has generated a non-recurring charge of $3.7 million (FY2013: $6.0 million) which also includes a retention bonus for key operational staff of $1.0 million.
The restructuring programme is expected to continue into FY2015 as the new executive team seek to implement and further embed their new strategy, however, at a significantly reduced cost.
During FY2014 the Group has explored a number of alternate financing opportunities to ensure that sufficient funds are available for it to complete its transformation plan and return the Group to growth. This has cost the Group $1.6 million (FY2013: $nil) which includes $0.2 million for bonuses due to key finance personnel involved in the financing review.
The Group has in addition taken a $0.8 million charge in FY2014 in relation to penalty claims made against the Group for historic sales tax claims. In India, the local tax authorities have lodged penalty and interest claims totalling $0.8 million for alleged errors in the reporting of our sales tax position in periods to August 2011. Volex disputes these claims and will appeal against them. However, experience indicates the difficulty in reclaiming prepaid penalty sums.
The Group has increased its onerous lease provision held against two properties resulting in an exceptional charge of $0.6 million (FY2013: credit of $0.4 million). Assumptions made in the calculation of these two provisions have been updated by our property advisors resulting in the FY2014 charge.
The cash impact of the above non-recurring operating items is $7.5 million (FY2013: $6.9 million).
Off-setting the non-recurring charges above is a $2.3 million credit (FY2013: charge of $0.2 million) arising from share-based payments. With a number of executives, senior management and middle management leaving the Group during the year, share options held lapsed, resulting in a reversal of the share-based payment expense accrued in prior periods.
Acquired technology, research and developmentIn FY2013, Volex acquired a joint interest in 29 issued and pending patents for Active Optical Cable (‘AOC’) technology for $1.5 million. A further $0.3 million was also spent on acquiring associated lab equipment and plant and machinery.
During the year, the Group has incurred $2.0 million (FY2013: $0.2 million) in developing the technology into a commercial product. Having met the conditions of IAS 38 ‘Intangible assets’ these costs have been capitalised.
16 Volex plcAnnual Report and Accounts 2014
Financial review continued
The development has taken significantly longer than was first envisaged with significant problems encountered in producing optical cables incorporating the technology which pass the demanding test conditions. As at 30 March 2014, Volex has now overcome these problems and is preparing to scale up its production volumes. Amortisation of the $3.9 million intangible asset will commence with commercial sales.
Net finance costsTotal net finance costs in FY2014 increased by $0.4 million from $2.3 million in FY2013 to $2.7 million. The principal reason for this increase was the higher average net debt level held by the Group following the significant capital expenditure incurred in FY2013.
The current year net charge of $2.7 million benefits from a one-off refund of interest over-payments totalling $0.6 million.
Tax The Group incurred a tax charge of $6.6 million (FY2013: $2.8 million) representing an effective tax rate (‘ETR’) of -87%. The underlying tax charge of $6.6 million (FY2013: $3.6 million) represents an ETR of 533% (FY2013: 36%).
The principal reasons for the increase in ETR is as a result of a $3.7 million write-back of deferred tax assets plus Volex operations in certain territories being required to recognise a minimum level of profit regardless of overall Group performance, resulting in a $2.1 million current tax charge.
Due to the reduced level of taxable profits in certain territories there is less certainty over the future use of carried forward tax losses. This has resulted in a significant write-back of deferred tax assets in relation to losses. As at the reporting date, the Group has recognised a deferred tax asset in relation to tax losses of $0.4 million (FY2013: $4.3 million).
Management anticipates future improvements in ETR as the Group’s overall performance improves.
Earnings per shareBasic loss per share for FY2014 was 23.7 cents compared to a loss per share of 1.6 cents in FY2013. The underlying fully diluted loss per share was 9.0 cents compared to earnings per share of 11.2 cents in FY2013.
DividendsAt the Volex plc Annual General Meeting held on 22 July 2013, the shareholders approved the proposed final dividend for FY2013 of 3.0 cents per share. At the same meeting a Scrip Dividend Scheme was also approved which gave shareholders the right to elect to receive new Ordinary shares in the Company (credited as fully paid) instead of a cash dividend.
Payment of the final dividend in respect of the year ended 31 March 2013 was made on 17 October 2013. 59.1% of the shareholder base eligible for dividends had elected for the Scrip Dividend Scheme resulting in a cash payment of $0.7 million and 566,467 new shares being issued.
No final dividend is proposed in respect of the year ended 30 March 2014.
Cash flow and net debtOperating cash flow before movements in working capital in FY2014 was an inflow of $0.5 million (FY2013: $8.8 million) with the $8.3 million reduction primarily due to the reduced operating profit.
The impact of working capital movements on the cash flow on FY2014 was an outflow of $8.7 million (FY2013: inflow of $3.2 million). This was principally due to a change in supplier payment profiles following a strategic decision to move to a multi-sourcing supplier model that will enable the Group to become more cost competitive.
After aggregate outflows for tax and interest of $2.9 million (FY2013: $5.6 million), the net cash outflow from operating activities was $11.1 million (FY2013: net cash generated was $6.4 million). Of this $7.5 million (FY2013: $6.9 million) had been spent on operating non-recurring items.
Capital expenditure in FY2014 was $8.2 million (FY2013: $24.9 million). The significant reduction reflected the completion in FY2013 of two large facility improvement projects in Asia and a further factory upgrade in Brazil. The current period spend is largely in relation to machinery and tooling specifically required for new business wins and opportunities.
Expenditure in relation to intangible assets of $2.3 million has been incurred in FY2014 (FY2013: $2.6 million). Of this, $2.0m is in relation to AOC technologies (FY2013: $1.7 million). In the prior year $1.5 million was spent on the acquisition of the AOC patents, after which $0.2 million was spent on developing the technology into commercial products. During the current year, a further $2.0 million has been spent on development with samples now available for distribution to customers. The remaining $0.3 million (FY2013: $0.9 million) was in relation to computer software purchases with the prior year representing significant spend on engineering design software.
Transactions in treasury shares generated $6.3 million (FY2013: $0.4 million) in the year with 3,378,582 treasury shares sold in December 2013. As a result of the restructuring programme, a large number of share options lapsed during the year. As a consequence, 3,378,582 treasury shares held were surplus to requirement. In December 2013, this surplus was sold on the open market.
17Volex plcAnnual Report and Accounts 2014
The final dividend for FY2013 of 3.0 cents per share was paid in the year. A scrip dividend alternative had been offered with 59.1% of the shareholder base eligible for dividends electing for the Scrip Dividend Scheme. As a result a cash payment of $0.7 million (FY2013: $1.7 million) was made. No interim dividend for FY2014 was paid (FY2013: $1.1 million).
In December 2013, Volex issued 2,698,009 shares at £1.16 per share. After the deduction of issue costs, this generated $4.8 million for the Group.
During the year $7.0 million of US Dollar denominated loans were repaid by the Group under the senior credit facility and replaced with €6.0 million of Euro denominated loans.
As a result of the above cash flows, the Group incurred a $9.9 million (FY2013: $17.2 million) cash outflow for the year. As at 30 March 2014, the Group held net debt of $32.2 million compared with $19.5 million at 31 March 2013.
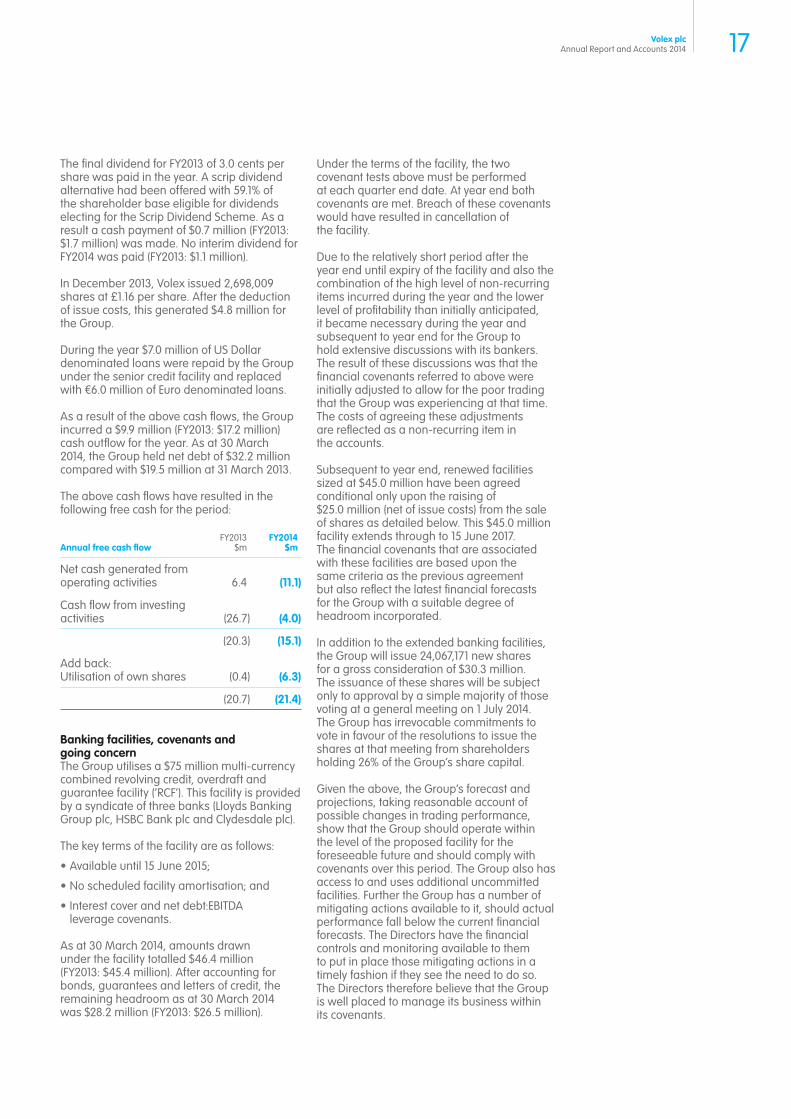
The above cash flows have resulted in the following free cash for the period:
Annual free cash flowFY2013
$mFY2014
$m
Net cash generated from operating activities 6.4 (11.1)
Cash flow from investing activities (26.7) (4.0)
(20.3) (15.1)
Add back: Utilisation of own shares (0.4) (6.3)
(20.7) (21.4)
Banking facilities, covenants and going concernThe Group utilises a $75 million multi-currency combined revolving credit, overdraft and guarantee facility (‘RCF’). This facility is provided by a syndicate of three banks (Lloyds Banking Group plc, HSBC Bank plc and Clydesdale plc).
The key terms of the facility are as follows:
Available until 15 June 2015;
No scheduled facility amortisation; and
Interest cover and net debt:EBITDA leverage covenants.
As at 30 March 2014, amounts drawn under the facility totalled $46.4 million (FY2013: $45.4 million). After accounting for bonds, guarantees and letters of credit, the remaining headroom as at 30 March 2014 was $28.2 million (FY2013: $26.5 million).
Under the terms of the facility, the two covenant tests above must be performed at each quarter end date. At year end both covenants are met. Breach of these covenants would have resulted in cancellation of the facility.
Due to the relatively short period after the year end until expiry of the facility and also the combination of the high level of non-recurring items incurred during the year and the lower level of profitability than initially anticipated, it became necessary during the year and subsequent to year end for the Group to hold extensive discussions with its bankers. The result of these discussions was that the financial covenants referred to above were initially adjusted to allow for the poor trading that the Group was experiencing at that time. The costs of agreeing these adjustments are reflected as a non-recurring item in the accounts.
Subsequent to year end, renewed facilities sized at $45.0 million have been agreed conditional only upon the raising of $25.0 million (net of issue costs) from the sale of shares as detailed below. This $45.0 million facility extends through to 15 June 2017. The financial covenants that are associated with these facilities are based upon the same criteria as the previous agreement but also reflect the latest financial forecasts for the Group with a suitable degree of headroom incorporated.
In addition to the extended banking facilities, the Group will issue 24,067,171 new shares for a gross consideration of $30.3 million. The issuance of these shares will be subject only to approval by a simple majority of those voting at a general meeting on 1 July 2014. The Group has irrevocable commitments to vote in favour of the resolutions to issue the shares at that meeting from shareholders holding 26% of the Group’s share capital.
Given the above, the Group’s forecast and projections, taking reasonable account of possible changes in trading performance, show that the Group should operate within the level of the proposed facility for the foreseeable future and should comply with covenants over this period. The Group also has access to and uses additional uncommitted facilities. Further the Group has a number of mitigating actions available to it, should actual performance fall below the current financial forecasts. The Directors have the financial controls and monitoring available to them to put in place those mitigating actions in a timely fashion if they see the need to do so. The Directors therefore believe that the Group is well placed to manage its business within its covenants.
18 Volex plcAnnual Report and Accounts 2014
Financial review continued
The Directors have, at the time of approving the financial statements, a reasonable expectation that the Company and the Group have adequate resources to continue in operational existence for at least 12 months from the date of these accounts. Accordingly, they continue to adopt the going concern basis in preparing the financial statements.
Financial instruments and cash flow hedge accountingThe Group enters into contracts with financial institutions which are linked to the average copper price as published by the London Metal Exchange (‘LME’). The purpose of these contracts is to mitigate the Group’s exposure to copper price volatility observed in the Group’s cost of sales (see page 21 where rising commodity prices has been identified as a key risk).
These contracts act as an economic hedge against the impact of copper price movements. They meet the technical requirements of IAS 39 and therefore are accounted for as cash flow hedges of forecast future purchases of copper. As at 30 March 2014, a financial liability of $1.0 million (2013: $0.4 million) has been recognised in respect of the fair value of open copper contracts with a corresponding $1.0 million debit recognised in reserves. This debit is retained in reserves until such time as the forecast copper consumption takes place at which point it will be recycled through the income statement.
A charge of $1.2 million has been recognised in cost of sales in FY2014 (FY2013: $0.3 million) in respect of closed out contracts. This charge has arisen since the average LME copper price in the period has been below the contracted price.
Defined benefit pension schemesThe Group’s net pension deficit under IAS 19R reduced by $0.4 million from $3.6 million at 31 March 2013 to $3.2 million at 30 March 2014. This reduction is broadly in line with payments made of $0.6 million in the year.
Share transactions and related party transactionsDuring FY2014, Mike McTighe (the former Chairman of Volex plc) exercised 426,667 options held under the Non-Executive Director Long Term Incentive Scheme. These options had a $nil exercise price. The exercise was met through the issue of new shares in Volex plc with the share capital account credited by the share nominal value of £0.25 per share and a corresponding debit taken to retained earnings.
In December 2013, Volex issued 2,698,009 new shares. These shares were issued at £1.16, which after share issue costs, generated cash income of $4.8 million.
Also in December 2013, the Swiss Employee Benefits Trust sold 3,378,582 shares after a number of options, which the shares were bought to cover, lapsed. This sale generated $6.3 million.
In January 2014, Chris Geoghegan (former Non-Executive Board member) exercised 53,333 of his options held under the Non-Executive Director Long Term Incentive Scheme. These options had a $nil exercise price. The exercise was met by a cash payment from the Group of £57,000.
19Volex plcAnnual Report and Accounts 2014
Group risk management
ApproachThe Board is ultimately responsible for managing the Group’s approach to risk and determining a strategy for managing identified risks within the business. The Board is supported by the Audit Committee who has delegated responsibility for reviewing the effectiveness of the Group’s system of internal controls and risk management. The Board recognises that any risk management process cannot eliminate all level of risk but rather manages the Group’s exposures, and sets the acceptable level of tolerance required to successfully deliver the Group’s strategy and growth.
The executive management team have an established risk management framework which is designed to identify the key risks. This framework also assists in developing risk mitigation activities and making assessments of their effectiveness.
In its maintenance of the Group’s Risk Register, each significant business unit, together with the executive management team identify the principal risks together with the mitigation strategies in place. Following this process the principal risks and mitigation actions are collated and reviewed by the Board. The output from this exercise forms the basis of the key principal risks set out below.
Other key features of our system of risk management include:
Detailed monthly business and financial reviews by the executive team and the Board;
Established and documented risk management policies including a schedule of matters reserved for the Board;
Systems and tools to monitor keys risks with the aim of providing regular and succinct information to the Board and Executive team; and
A comprehensive insurance programme.
Key changes to the risk profile of the Group in FY2014There have been a number of fundamental changes to the Group during FY2014 including a new strategy and significant changes in the Board and management team. The Board is acutely aware that any change in business and new appointments bring an inherent level of risk but consider that this restructuring also bring a number of positive changes to the Group’s approach to risk.
In developing a new strategic direction it has been necessary to make a fresh assessment of the risks and opportunities facing the Group. The VTP has been developed with this in mind and a number of the Group’s risk mitigation activities are embedded within the plan and regularly tracked against performance.
The Group has appointed a new Group Head of Internal Audit who from May 2014 will oversee the Group’s internal audit function.
Principal risksThe table below summarises the Group’s principal risks and how they are managed. The Board considers these to be the most significant risks that could materially affect the Group’s financial condition, performance, strategies and prospects. The risks listed do not comprise all risks faced by the Group and are not set out in any order of priority. Additional risks not presently known to management, or currently deemed to be less material, may also have an adverse effect on the business.
Risk Description and possible impact Mitigation activities
Revenue
Customer concentration
The Group’s profitability, financial condition and future prospects may suffer significantly if it were to lose a material allocation on a key account.
A significant proportion of the Group’s trading is with a relatively small number of large global accounts. The Group’s top ten customers accounted for over 68% of total revenue, mostly prestigious global OEMs.
Specifically, the Group’s largest customer individually accounted for 23% of total revenue.
The Group continues to develop strategic relationships with its customers and have dedicated account teams responsible for developing alliances. In structuring these account teams Volex attempts to replicate the customers internal organisational structure to ensure effective communication at each level. These account teams may include members of Volex senior management.
Key customers may operate within different markets and this diversifies Volex's market risk.
Whilst maintaining the current relationships the Group is actively taking steps to diversify its customer base.
Increased competition
The markets for the Group’s products are highly competitive. Pricing pressures and failure to invest in product development and secure cost reductions from suppliers could adversely affect the business.
An increase in the products which compete with Volex products could result in the Group suffering price reductions, reduced sales, increased requirements for investment and loss of contracts, which may reduce margins.
The Group recognises that it will need to continue to invest in product development, productivity improvement and customer service and support in order to compete in the markets in which it operates.
Whilst broadening the Volex product portfolio and attracting new customers, the Group continually works at reducing costs within its supply chain in order to enable it to compete on price in mature markets.
20 Volex plcAnnual Report and Accounts 2014
Risk Description and possible impact Mitigation activities
People
Staff retention The Group’s strategy is largely dependent on the skills, experience and knowledge of its employees. The inability to retain executive officers and other key employees, or a failure to adequately plan for succession, could negatively impact Group performance.
The Group’s future success depends on it continuing to attract, develop and retain highly qualified personnel, who are in great demand.
The Group appointed a new Chief Human Resources Officer during the year who is responsible for setting the policies and strategy for people development and retention.
The Group’s aim is to recruit and retain best-in-class employees and has implemented remuneration and bonus schemes to reflect this.
The Group has a formalised objective setting process in place.
Supply chain/manufacturing
Customer requirements
The Group is affected by customer design changes, customer forecasting, changes in customer manufacturing strategies and customer inventory management initiatives, all of which impact upon customer production schedules and demand for the Group’s products.
Flaws in designs or manufacturing processes could result in failure to produce products of the required specification, reliability or quality, and consequently cause delays in shipment and increased costs for product re-work or replacement.
The Group works closely with both its key customers and suppliers.
Working with key customers ensures that the Group understands their requirements and develops manufacturing capabilities to meet their needs.
Working with suppliers assists in minimising lead-times and maintaining flexibility in material supplies.
Manufacturing footprint
The Group operates nine production facilities around the globe. Inefficiencies in the production process could lead to increased cost of sales and decreased margins.
The majority of the Group’s manufacturing sites are located in China and other developing markets. Changes in labour markets, rapid economic growth and social progress may result in high labour turnover and increases in labour costs.
The Group’s operations are vulnerable to interruption by natural disasters or other catastrophic events, which could materially disrupt business.
The Group is frequently reviewing the global footprint to ensure that it is located in the most cost effective areas. The current global footprint provides an element of natural diversification against political or geographic disruptions.
The Group holds comprehensive insurance covering, amongst other areas, business interruption.
Supplier base The Group has a concentrated supplier base.
The Group’s ability to compete on price is reliant on reducing costs within its supply chain, failure to accomplish this may result in lost opportunities or reduced margins.
Interruptions of supplies from the Group’s key suppliers could disrupt production and impact the Group’s ability to maintain or increase production and sales. Identifying and accessing alternative sources may increase costs of sales.
The Group is working on implementing a strategy of localised multi-sourcing.
Part of the VTP includes investment in new roles focusing on procurement and product quality.
Group risk management continued
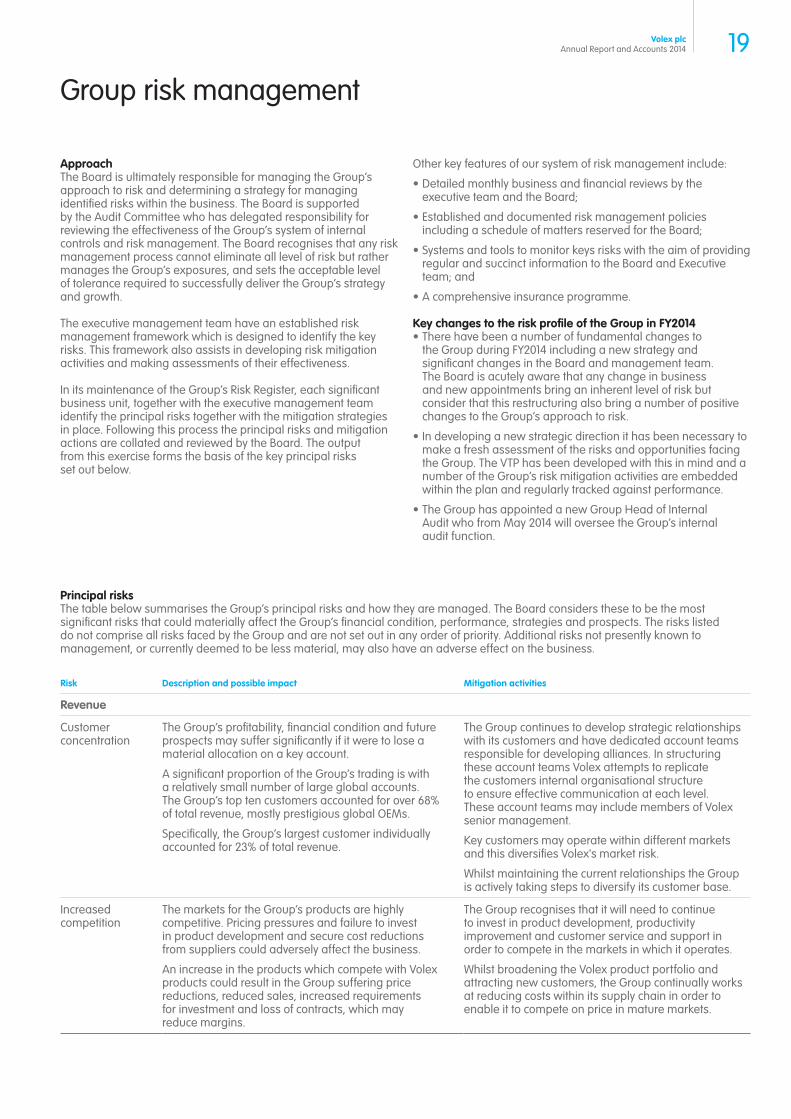
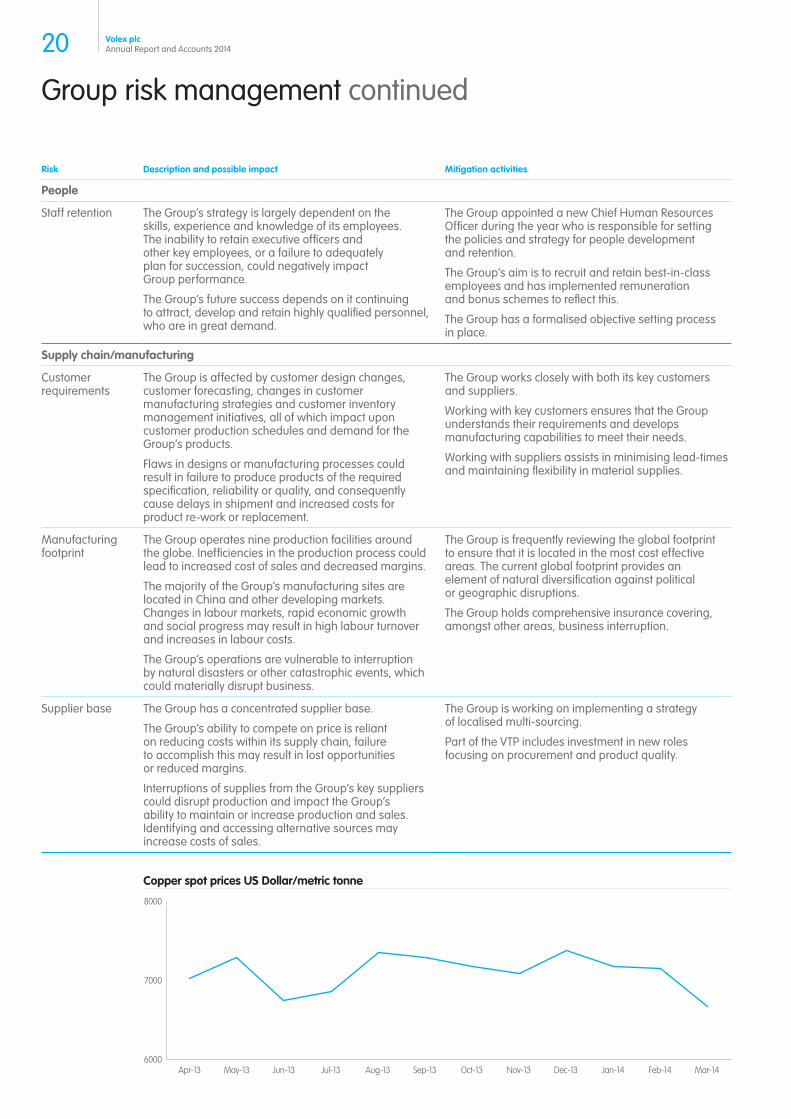
6000
7000
8000
Copper spot prices US Dollar/metric tonne
Apr-13 May-13 Jun-13 Jul-13 Aug-13 Sep-13 Oct-13 Nov-13 Jan-14Dec-13 Feb-14 Mar-14
21Volex plcAnnual Report and Accounts 2014
Risk Description and possible impact Mitigation activities
Finance
Commodity pricing
Copper price volatility is the single largest commodity price exposure facing the Group. Many of the Group’s products, particularly in the Power division, are manufactured from components that contain significant amounts of copper.
Where possible the Group will pass on copper price movements to its customer. However, not all customers accept these pricing changes leaving the Group exposed to the movements in the copper price.
The Group adopts a copper hedging policy which was agreed by the Board and documented in the Group Copper Hedging Policy. This document sets out the guidelines and parameters within which copper hedging contracts are placed. These forward copper purchase contracts extend out 12 months and are refreshed on a rolling monthly basis.
To minimise short term volatility, contracts with major suppliers include a clause that ensures that copper prices are fixed based on the average LME rate over the prior period.
Customer contracts covering approximately 20% of Power revenues include clauses which ensure that the prices are adjusted on a quarterly basis to align with the changes in supplier contracts.
Foreign exchange
The Group is subject to currency fluctuations arising on transactional foreign currency exposure in respect of suppliers and customers.
Its results are also exposed to the translation of overseas subsidiaries’ results, which could cause earnings and balance sheet volatility.
The Group’s financial results may be adversely affected by fluctuations in the value of the US Dollar against foreign currencies, exchange rate controls, or regulatory restrictions on the transfer of funds.
The Group Treasury Policy Statement sets out procedures on exchange rate risk management.
Billing currencies have been adjusted to achieve a higher level of natural hedging where possible.
In order to minimise foreign exchange fluctuations in the income statement of the Group, drawdowns on the facility in currencies other than the functional currency of the drawing entity will be treated where possible as a net investment hedge.
Financial covenants
The financial performance and condition of Volex may be adversely impacted if the Group was to not meet its financial covenants.
The Group’s $75 million multi-currency revolving credit facility requires a quarterly assessment of the following two covenants (defined in the financial review):
Leverage covenant
Interest covenant
Failure to meet these covenants would result in an ‘Event of Default’ which would allow the lender to cancel the facility and request immediate repayment.
The Group maintains an open and transparent dialogue with the facility providers to ensure they are aware of developments in the business.
The Group has negotiated with its lenders a revised facility extending to 15 June 2017. The Group’s forecasts indicate that it will meet the covenant tests under this facility.
If performance was not in line with forecast, the Group has a number of mitigating actions that could be implemented.
Principal exchange rates used in the year (against US Dollar)
Period end rate(Statement of financial
position)Average rate
(Income statement)
FY2013 FY2014 FY2013 FY2014
GBP 0.658 0.601 0.631 0.631
EUR 0.780 0.727 0.775 0.748
22 Volex plcAnnual Report and Accounts 2014
Group risk management continued
Risk Description and possible impact Mitigation activities
Technology
Technology advancement
The market for the Group’s products is affected by changing business conditions and customer requirements.
The Group’s ability to anticipate changes in technology and customer requirements and to successfully develop and introduce new and enhanced products on a timely basis and to the customer’s cost requirement will be significant factors in the Group’s ability to grow and to remain competitive.
Failure, for technological or other reasons, to develop in a timely manner products incorporating new technologies could have a material adverse effect on the Group’s revenues, results of operations and prospects.
The Group’s investment in VTP includes a number of key roles that will be responsible for broadening the product portfolio and developing capabilities to produce products that match our customers’ requirements for new technology.
The Group has processes in place to ensure appropriate scrutiny of proposed investments into R&D and new technology. This ensures that resources are allocated most effectively.
Regulation
Non-compliance with regulation and legislation
Failure to comply with applicable legal and regulatory requirements may result in financial loss, a restriction on our business’s ability to operate or reputational damage.
The Group operates in diverse global markets and therefore is exposed to a wide range of legal, fiscal and regulatory frameworks, including employment, tax, environmental and health and safety legislation, along with product liability and contractual risks. In particular, operating within the rapidly evolving developing nations can expose the Group’s businesses to significant local risks and challenges.
Whilst striving to recruit and retain people in specialist roles within the Group, where necessary the Group uses external consultants to provide local specialist advice.
The Group maintains a number of general compliance policies to ensure compliance with local laws, regulations and standards and any other laws with international reach such as the UK Bribery Act, where relevant.
The Volex Code of Business Conduct is communicated across the Group and to external third parties to ensure business is carried out in line with our policies and procedures.
23Volex plcAnnual Report and Accounts 2014
Corporate and social responsibility
Our new Board has a strong belief and commitment to conducting business in an open, honest and ethical manner. With this in mind, the Board resolved to form the Corporate and Social Responsibility Committee in February 2014 (the ‘Committee’).
The Committee is an integral part of the Company’s governance structure and is, pursuant to its terms of reference, required to meet at least twice a year to consider its overall strategy on matters including health and safety, human rights, diversity and compliance with ethical trading practices.
Our peopleOur steady progress is linked to the skill, talent and commitment of our employees.
We are committed to ensuring our employees (particularly our production workers) recognise and feel they are an integral part of the Group. Our Chief Executive Officer, Christoph Eisenhardt, writes a monthly blog which is posted on the Volex Intranet. In addition, Christoph regularly schedules town hall meetings (attended by all employees) when visiting overseas offices and factories. The blog and town hall meetings are an opportunity for Christoph to keep employees informed on the performance of the business and the ongoing global strategy of the Group.
We are in the process of implementing a global performance management tool which will enable all employees to receive constructive feedback on performance against clear corporate objectives. This programme will be invaluable to the retention and individual development of our employees.
DiversityOur success is reflected in our diverse global workforce. To maintain our competitive edge we believe it is important to maintain diversity in gender, ethnicity, age, thinking and background. Our gender breakdown demonstrates our commitment to encouraging women in the workplace. Approximately 3,841 (or 54%) of our employees are female and 3,155 (or 46%) are male. Our senior management team comprises 15 (or 45%) females and 18 (or 55%) males. Female representation on the Board is 14% with the Chairman being the only female Board member.
Health and safetyWe prioritise our people and maintain stringent safety practices across the Group. Each site conducts programme training, risk assessments and regular management reviews to ensure the monitoring and continuous improvement of safety. As risks continue to be analysed, the Group will be able to develop and implement highly targeted safety initiatives, producing more efficient and effective results.
Our impact on the environmentWe monitor the environmental impact of our business activities and encourage employee awareness of waste reduction, recycling and responsible disposal. All sites are ISO14001 certified and have specific, local waste reduction programmes.
Carbon reportingOur emissions have been calculated using the GHG Protocol Corporate Accounting and Reporting Standard (revised edition), together with the latest emission factors from recognised public sources including, but not limited to, DEFRA, the International Energy Agency, the United States Energy Information Administration, the United States Environmental Protection Agency and the Intergovernmental Panel on Climate Change. Emissions reported correspond to our financial year. Actual data has been supplied for 27.1% of the reported emissions and the remainder estimated using floor area data.
Global GHG emissions data
Emissions from: Tonnes of CO2e
Combustion of fuel and operation of facilities (GHG Protocol Scope 1) 577
Electricity, heat, steam and cooling purchased for own use (GHG Protocol Scope 2) 22,985
Total 23,562
Intensity metric 3.65 tCO2e per FTE
Relationship with the community We encourage our employees to be active participants in their local communities. Such participation includes volunteering with local fire brigades, donating mattresses to elderly care facilities, planting trees and donating blood.
Relationship with the stakeholders We believe our business is built on the confidence and commitment of our stakeholders.
Customers and suppliersSupply-chain integration continues to develop and is essential to the operation of our business. Through being proactive around corporate responsibility issues, Volex is able to meet the rigorous standards of its customers. In addition to complying with all relevant statutory and regulatory requirements (including EU RoHS and EU REACh) we support our customers’ specific requirements to eliminate the use of hazardous substances to protect the environment and reduce the risk of chemical exposure to humans. Our products are free from MCCP, Phthalate, Lead and DINP. Furthermore we offer a range of halogen-free cables.
Human rights Volex supports the United Nations Universal Declaration of Human Rights. Our commitment to uphold the declaration will be reflected in the policy we intend to develop and implement in this financial year.
24 Volex plcAnnual Report and Accounts 2014
Governance
Governance
25 Chairman’s introduction
26 Board of Directors
28 Corporate governance report
33 Audit Committee report
36 Directors’ remuneration report
53 Directors’ report
57 Independent auditors’ report
25Volex plcAnnual Report and Accounts 2014
Chairman’s introduction
I became Chairman of the Board in August 2013, following a period as Deputy Chairman working closely with my predecessor Mike McTighe to begin the transformation of the Company.
In July, we announced the appointment of Christoph Eisenhardt as Chief Executive Officer, replacing Ray Walsh who left the Company in September 2013. In the first few months of his new role Christoph visited most of our global manufacturing plants and many of our largest customers and as a result began the immediate implementation of the Volex Transformation Plan (‘VTP’). In September, we appointed Nick Parker to the role of Chief Financial Officer, replacing Daniel Abrams.
In parallel we refreshed the Board and welcomed four new Independent Non-Executive Directors, John Allkins, Martin Geh, Geraint Anderson and Daren Morris. Further details of their backgrounds and committee responsibilities are set out on pages 26 and 27. In February, as part of the induction process, the Board spent four days in Singapore and at our plant in Indonesia gaining a better understanding of the business and reviewing the strategic plan developed by our new executive team. As the Board is new, a significant proportion of our time together has been spent in understanding the business and supporting the executive team with the VTP. The Board has not conducted a formal review of performance during the year but are committed to doing so in the new financial year.
The effectiveness of the Board is vital to the success of the Company and I feel confident that our Board has the appropriate balance of skills, experience and independence to enable the Company to reach its full potential.
Our Corporate Governance Report is set out on pages 28 to 32. This section of the Annual Report and Accounts illustrates how we function and comply with the provisions of the UK Corporate Governance Code (the ‘Code’). The Code can be found at www.frc.org.uk. It also sets out further details about the activity of the Board and its various Committees during the year.
We as a Board of Directors are committed to maintaining the highest standards of corporate governance. We believe these principles are the foundation to the long term success and strategic growth of the Company. I am pleased to report that we have complied in full with the provisions of the Code. Our statement of compliance is set out on page 28.
The Company, as always, welcomes shareholder feedback and will continue improving its processes. We look forward to regular dialogue with our shareholders during the coming financial year.
Karen SlatfordChairman12 June 2014
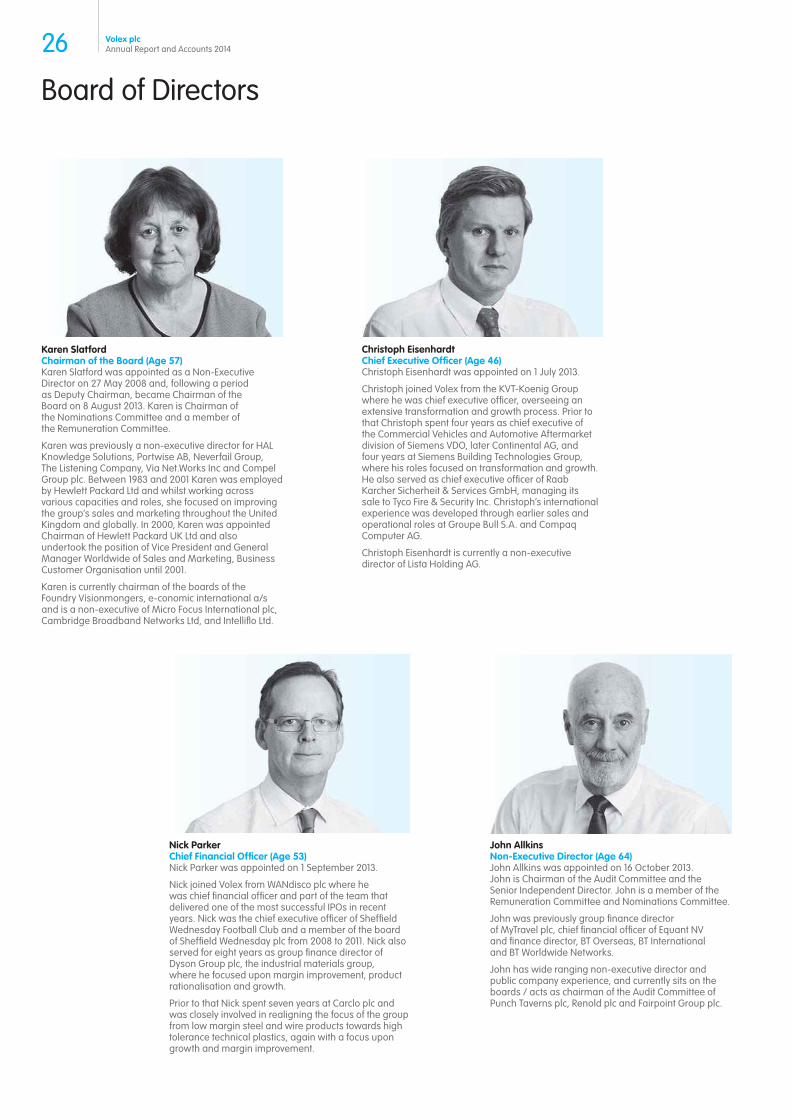
26 Volex plcAnnual Report and Accounts 2014
Board of Directors
Karen SlatfordChairman of the Board (Age 57)Karen Slatford was appointed as a Non-Executive Director on 27 May 2008 and, following a period as Deputy Chairman, became Chairman of the Board on 8 August 2013. Karen is Chairman of the Nominations Committee and a member of the Remuneration Committee.
Karen was previously a non-executive director for HAL Knowledge Solutions, Portwise AB, Neverfail Group, The Listening Company, Via Net.Works Inc and Compel Group plc. Between 1983 and 2001 Karen was employed by Hewlett Packard Ltd and whilst working across various capacities and roles, she focused on improving the group’s sales and marketing throughout the United Kingdom and globally. In 2000, Karen was appointed Chairman of Hewlett Packard UK Ltd and also undertook the position of Vice President and General Manager Worldwide of Sales and Marketing, Business Customer Organisation until 2001.
Karen is currently chairman of the boards of the Foundry Visionmongers, e-conomic international a/s and is a non-executive of Micro Focus International plc, Cambridge Broadband Networks Ltd, and Intelliflo Ltd.
Christoph EisenhardtChief Executive Officer (Age 46)Christoph Eisenhardt was appointed on 1 July 2013.
Christoph joined Volex from the KVT-Koenig Group where he was chief executive officer, overseeing an extensive transformation and growth process. Prior to that Christoph spent four years as chief executive of the Commercial Vehicles and Automotive Aftermarket division of Siemens VDO, later Continental AG, and four years at Siemens Building Technologies Group, where his roles focused on transformation and growth. He also served as chief executive officer of Raab Karcher Sicherheit & Services GmbH, managing its sale to Tyco Fire & Security Inc. Christoph’s international experience was developed through earlier sales and operational roles at Groupe Bull S.A. and Compaq Computer AG.
Christoph Eisenhardt is currently a non-executive director of Lista Holding AG.
Nick ParkerChief Financial Officer (Age 53)Nick Parker was appointed on 1 September 2013.
Nick joined Volex from WANdisco plc where he was chief financial officer and part of the team that delivered one of the most successful IPOs in recent years. Nick was the chief executive officer of Sheffield Wednesday Football Club and a member of the board of Sheffield Wednesday plc from 2008 to 2011. Nick also served for eight years as group finance director of Dyson Group plc, the industrial materials group, where he focused upon margin improvement, product rationalisation and growth.
Prior to that Nick spent seven years at Carclo plc and was closely involved in realigning the focus of the group from low margin steel and wire products towards high tolerance technical plastics, again with a focus upon growth and margin improvement.
John AllkinsNon-Executive Director (Age 64)John Allkins was appointed on 16 October 2013. John is Chairman of the Audit Committee and the Senior Independent Director. John is a member of the Remuneration Committee and Nominations Committee.
John was previously group finance director of MyTravel plc, chief financial officer of Equant NV and finance director, BT Overseas, BT International and BT Worldwide Networks.
John has wide ranging non-executive director and public company experience, and currently sits on the boards / acts as chairman of the Audit Committee of Punch Taverns plc, Renold plc and Fairpoint Group plc.

27Volex plcAnnual Report and Accounts 2014
Martin GehNon-Executive Director (Age 48)Martin Geh was appointed on 24 October 2013. Martin is the Chairman of the Corporate and Social Responsibility Committee and a member of the Audit Committee, Nominations Committee and Remuneration Committee.
Martin has a wide range of experience in the technology and telecoms sectors, having worked with global leaders in semiconductors, computer systems, telecom equipment and consumer devices. Martin was most recently managing director of Logitech’s Asia Pacific and Japan Region Business Unit. Prior to Logitech, Martin was president of Lucent Technologies Asia Pacific, managing director at Apple Computer responsible for the Asia Pacific region, and held several executive roles at Intel Corporation in the United States and Asia. Martin has served on the board of advisors of Malaysia’s Multimedia Super Corridor, a strategic IT infrastructure project initiated by then Prime Minister of Malaysia, Dr Mahathir Mohamad. He has also served as non-executive director, chairman of the remuneration committee, and member of the budget committee on the board of Zetex Semiconductors, which was acquired by Diodes Inc.
Daren MorrisNon-Executive Director (Age 44)Daren Morris was appointed on 17 January 2014. Daren is a member of the Remuneration Committee and the Audit Committee.
Until recently, Daren was group head of M&A at Asia Resource Minerals plc and had previously spent the majority of his career in the financial services industry where he was a managing director at UBS Investment Bank and Morgan Stanley, advising manufacturing and technology companies on their expansion and financing strategies. Daren is a qualified chartered accountant and holds a degree in Physics from Oxford University.
Nicole Pask General Counsel and Company SecretaryNicole Pask was appointed on 13 January 2014. Nicole is a member of the Corporate and Social Responsibility Committee and serves as the secretary to each of the Board Committees.
Nicole has a commercial law background having previously worked at Hutchison 3G UK Limited (part of the Hutchison Whampoa Group) and London Mining plc. Nicole spent several years working as a projects and infrastructure lawyer at CMS Cameron McKenna LLP in London. Nicole completed both her law degree and training contract in Australia.
Geraint AndersonNon-Executive Director (Age 54)Geraint Anderson was appointed on 14 November 2013. Geraint is Chairman of the Remuneration Committee and a member of the Nominations Committee and Corporate and Social Responsibility Committee.
Geraint is currently group chief executive of TT Electronics plc having joined them in August 2008. Prior to this, Geraint spent eight years at Cisco Systems in various international roles. Geraint led the sale of Pirelli’s Photonics business to Cisco Systems in 2000, having spent the previous ten years with Pirelli.
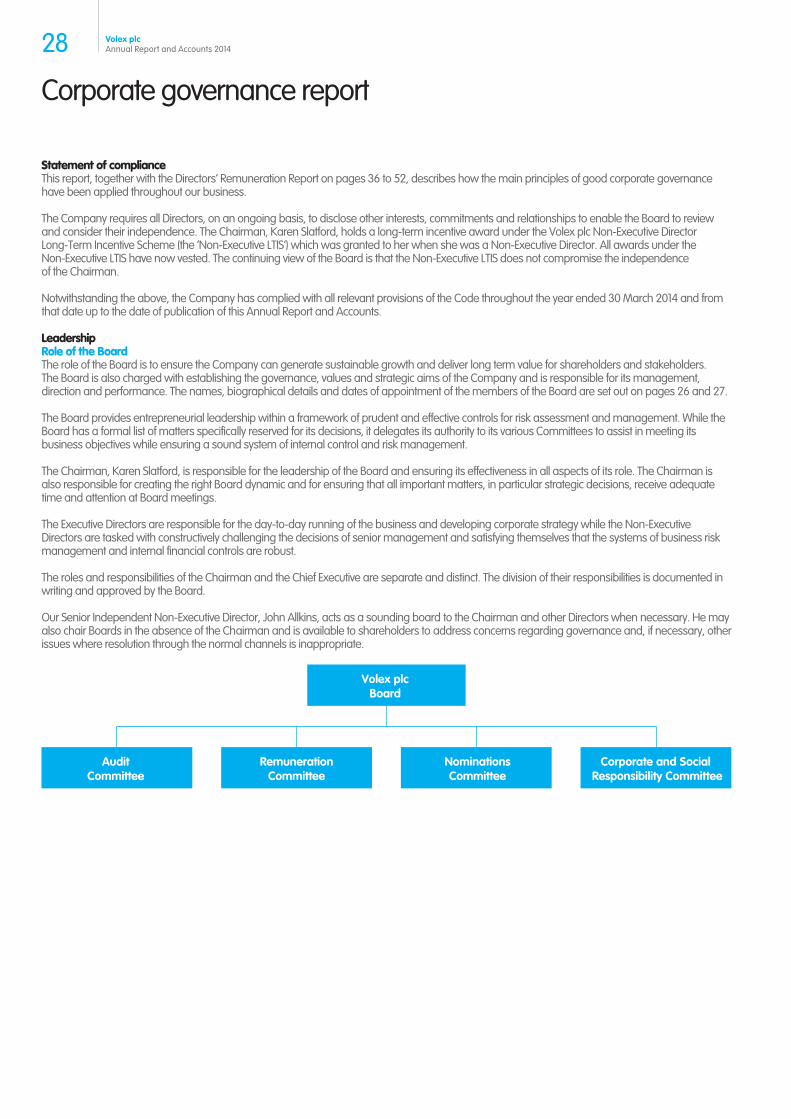
Corporate governance report
Statement of compliance This report, together with the Directors’ Remuneration Report on pages 36 to 52, describes how the main principles of good corporate governance have been applied throughout our business.
The Company requires all Directors, on an ongoing basis, to disclose other interests, commitments and relationships to enable the Board to review and consider their independence. The Chairman, Karen Slatford, holds a long-term incentive award under the Volex plc Non-Executive Director Long-Term Incentive Scheme (the ‘Non-Executive LTIS’) which was granted to her when she was a Non-Executive Director. All awards under the Non-Executive LTIS have now vested. The continuing view of the Board is that the Non-Executive LTIS does not compromise the independence of the Chairman.
Notwithstanding the above, the Company has complied with all relevant provisions of the Code throughout the year ended 30 March 2014 and from that date up to the date of publication of this Annual Report and Accounts.
Leadership Role of the Board The role of the Board is to ensure the Company can generate sustainable growth and deliver long term value for shareholders and stakeholders. The Board is also charged with establishing the governance, values and strategic aims of the Company and is responsible for its management, direction and performance. The names, biographical details and dates of appointment of the members of the Board are set out on pages 26 and 27.
The Board provides entrepreneurial leadership within a framework of prudent and effective controls for risk assessment and management. While the Board has a formal list of matters specifically reserved for its decisions, it delegates its authority to its various Committees to assist in meeting its business objectives while ensuring a sound system of internal control and risk management.
The Chairman, Karen Slatford, is responsible for the leadership of the Board and ensuring its effectiveness in all aspects of its role. The Chairman is also responsible for creating the right Board dynamic and for ensuring that all important matters, in particular strategic decisions, receive adequate time and attention at Board meetings.
The Executive Directors are responsible for the day-to-day running of the business and developing corporate strategy while the Non-Executive Directors are tasked with constructively challenging the decisions of senior management and satisfying themselves that the systems of business risk management and internal financial controls are robust.
The roles and responsibilities of the Chairman and the Chief Executive are separate and distinct. The division of their responsibilities is documented in writing and approved by the Board.
Our Senior Independent Non-Executive Director, John Allkins, acts as a sounding board to the Chairman and other Directors when necessary. He may also chair Boards in the absence of the Chairman and is available to shareholders to address concerns regarding governance and, if necessary, other issues where resolution through the normal channels is inappropriate.
28 Volex plcAnnual Report and Accounts 2014
RemunerationCommittee
NominationsCommittee
Volex plcBoard
AuditCommittee
Corporate and Social Responsibility Committee
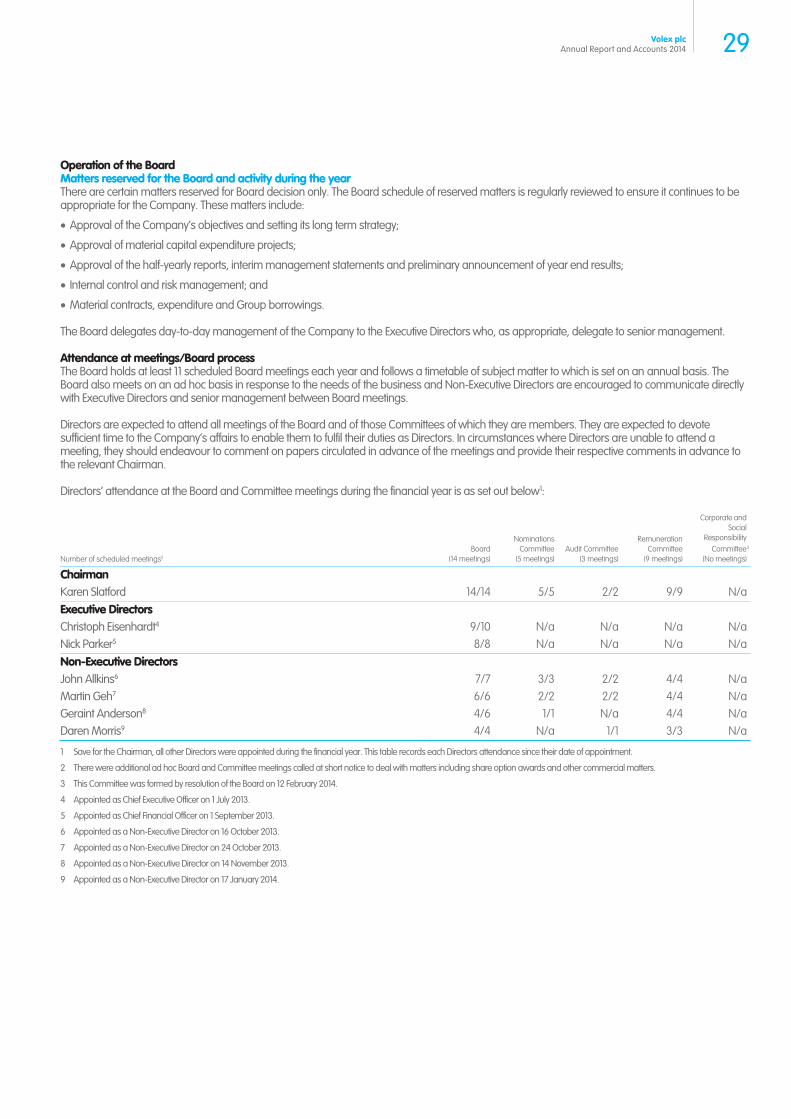
Operation of the Board Matters reserved for the Board and activity during the year There are certain matters reserved for Board decision only. The Board schedule of reserved matters is regularly reviewed to ensure it continues to be appropriate for the Company. These matters include:
Approval of the Company’s objectives and setting its long term strategy;
Approval of material capital expenditure projects;
Approval of the half-yearly reports, interim management statements and preliminary announcement of year end results;
Internal control and risk management; and
Material contracts, expenditure and Group borrowings.
The Board delegates day-to-day management of the Company to the Executive Directors who, as appropriate, delegate to senior management.
Attendance at meetings/Board process The Board holds at least 11 scheduled Board meetings each year and follows a timetable of subject matter to which is set on an annual basis. The Board also meets on an ad hoc basis in response to the needs of the business and Non-Executive Directors are encouraged to communicate directly with Executive Directors and senior management between Board meetings.
Directors are expected to attend all meetings of the Board and of those Committees of which they are members. They are expected to devote sufficient time to the Company’s affairs to enable them to fulfil their duties as Directors. In circumstances where Directors are unable to attend a meeting, they should endeavour to comment on papers circulated in advance of the meetings and provide their respective comments in advance to the relevant Chairman.
Directors’ attendance at the Board and Committee meetings during the financial year is as set out below1:
Number of scheduled meetings2 Board
(14 meetings)
Nominations Committee
(5 meetings)Audit Committee
(3 meetings)
Remuneration Committee
(9 meetings)
Corporate and Social
ResponsibilityCommittee3
(No meetings)
Chairman Karen Slatford 14/14 5/5 2/2 9/9 N/aExecutive Directors Christoph Eisenhardt4 9/10 N/a N/a N/a N/aNick Parker5 8/8 N/a N/a N/a N/aNon-Executive Directors John Allkins6 7/7 3/3 2/2 4/4 N/aMartin Geh7 6/6 2/2 2/2 4/4 N/aGeraint Anderson8 4/6 1/1 N/a 4/4 N/aDaren Morris9 4/4 N/a 1/1 3/3 N/a
1 Save for the Chairman, all other Directors were appointed during the financial year. This table records each Directors attendance since their date of appointment.
2 There were additional ad hoc Board and Committee meetings called at short notice to deal with matters including share option awards and other commercial matters.
3 This Committee was formed by resolution of the Board on 12 February 2014.
4 Appointed as Chief Executive Officer on 1 July 2013.
5 Appointed as Chief Financial Officer on 1 September 2013.
6 Appointed as a Non-Executive Director on 16 October 2013.
7 Appointed as a Non-Executive Director on 24 October 2013.
8 Appointed as a Non-Executive Director on 14 November 2013.
9 Appointed as a Non-Executive Director on 17 January 2014.
29Volex plcAnnual Report and Accounts 2014
Corporate governance report continued
Board focus In February, the Board visited the manufacturing plant in Batam, Indonesia and met in Singapore for a full day strategy meeting. During the session, the Board reviewed current strategy, its implementation and set strategy for the coming financial year. Further details of the Board visit are set out on page 31.
Other matters the Board considered during the financial year include:
VTP progress to improve revenue growth and operational efficiency;
Board structure and balance;
Shareholder communication;
Anti-bribery and other regulatory compliance programmes;
Group risk and internal controls; and
Cost reduction.
Information and support Directors receive comprehensive briefing papers in advance of Board and Committee meetings. The Company’s senior management regularly present to the Board on strategic and operational matters.
Directors have access to independent professional advice at the Company’s expense and have access to the services of the Company Secretary who is responsible for advising the Board on corporate governance matters and ensuring that the Board operates within applicable legislation, rules and regulations.
Board committees The Board has delegated certain responsibilities to the committees set out below:
The Nominations Committee;
The Audit Committee;
The Remuneration Committee; and
The Corporate and Social Responsibility Committee.
Each of the above committees operates pursuant to individual, defined terms of reference and the chair of each committee reports to the Board at each Board meeting. The terms of reference for each committee are reviewed on an annual basis and updated to include changes to the Code. Copies of the main committee terms of reference are available on the Company’s website. Each of these Committees is comprised of independent Non-Executive Directors of the Company who are appointed by the Board on the recommendation of the Nominations Committee. The Company Secretary serves as secretary to each of the Board committees.
Nominations Committee The members of the Nominations Committee are Karen Slatford (Chairman), John Allkins, Martin Geh and Geraint Anderson.
The Committee is responsible for reviewing the size and composition of the Board (including whether the balance of Executive Directors and Non-Executive Directors continues to be appropriate), succession planning and recommending suitable candidates for membership of the Board when such posts arise.
In appointing a new Board member, the Committee considers the balance of skills, knowledge and experience of the Board and prepares a summary of the capabilities and strengths required to fulfil his/her appointment. At times, external search consultants are engaged to identify appropriate candidates. In the current year, the Committee worked with The Zygos Partnership to find suitable candidates for its Executive and Non-Executive Board appointments. The Zygos Partnership has no other relationship with the Company.
As part of its review, the Committee considers the time each Non-Executive Director would have to commit to fulfil his/her responsibilities. Positions held by Non-Executive Directors are set out on pages 26 and 27 and the Committee is satisfied that each of the Non-Executive Directors is able to devote sufficient time to the Company’s business. Non-Executive Directors are advised on appointment, of the time required to perform the role and are also asked to confirm that they are able to carry out the required commitment.
The Committee is also responsible for senior management succession planning.
Audit Committee The members of the Audit Committee are John Allkins (Chairman), Martin Geh and Daren Morris.
Details of the Committee’s activities are contained in the Audit Committee Report set out on pages 33 to 35.
Remuneration Committee The members of the Remuneration Committee are Geraint Anderson (Chairman), Karen Slatford, John Allkins, Martin Geh and Daren Morris.
Details of the Committee’s activities are contained in the Directors’ Remuneration Report set out on pages 36 and 52.
30 Volex plcAnnual Report and Accounts 2014
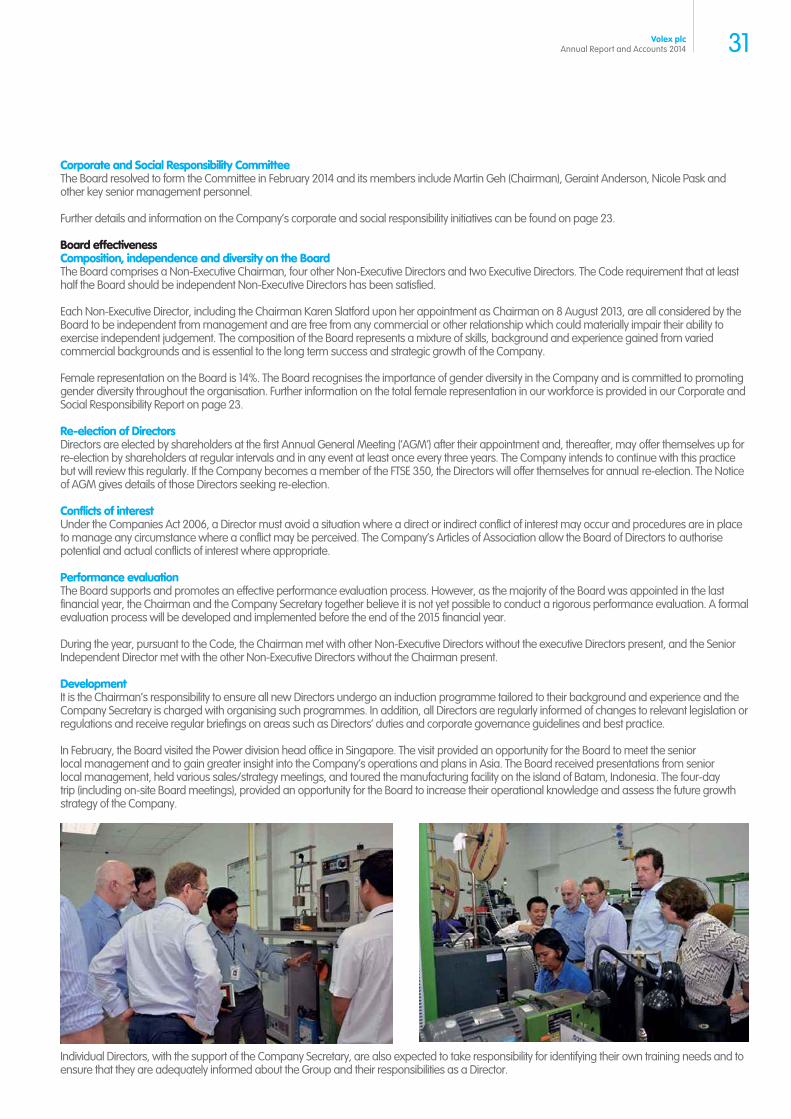
Corporate and Social Responsibility Committee The Board resolved to form the Committee in February 2014 and its members include Martin Geh (Chairman), Geraint Anderson, Nicole Pask and other key senior management personnel.
Further details and information on the Company’s corporate and social responsibility initiatives can be found on page 23.
Board effectiveness Composition, independence and diversity on the Board The Board comprises a Non-Executive Chairman, four other Non-Executive Directors and two Executive Directors. The Code requirement that at least half the Board should be independent Non-Executive Directors has been satisfied.
Each Non-Executive Director, including the Chairman Karen Slatford upon her appointment as Chairman on 8 August 2013, are all considered by the Board to be independent from management and are free from any commercial or other relationship which could materially impair their ability to exercise independent judgement. The composition of the Board represents a mixture of skills, background and experience gained from varied commercial backgrounds and is essential to the long term success and strategic growth of the Company.
Female representation on the Board is 14%. The Board recognises the importance of gender diversity in the Company and is committed to promoting gender diversity throughout the organisation. Further information on the total female representation in our workforce is provided in our Corporate and Social Responsibility Report on page 23.
Re-election of Directors Directors are elected by shareholders at the first Annual General Meeting (‘AGM’) after their appointment and, thereafter, may offer themselves up for re-election by shareholders at regular intervals and in any event at least once every three years. The Company intends to continue with this practice but will review this regularly. If the Company becomes a member of the FTSE 350, the Directors will offer themselves for annual re-election. The Notice of AGM gives details of those Directors seeking re-election.
Conflicts of interest Under the Companies Act 2006, a Director must avoid a situation where a direct or indirect conflict of interest may occur and procedures are in place to manage any circumstance where a conflict may be perceived. The Company’s Articles of Association allow the Board of Directors to authorise potential and actual conflicts of interest where appropriate.
Performance evaluation The Board supports and promotes an effective performance evaluation process. However, as the majority of the Board was appointed in the last financial year, the Chairman and the Company Secretary together believe it is not yet possible to conduct a rigorous performance evaluation. A formal evaluation process will be developed and implemented before the end of the 2015 financial year.
During the year, pursuant to the Code, the Chairman met with other Non-Executive Directors without the executive Directors present, and the Senior Independent Director met with the other Non-Executive Directors without the Chairman present.
Development It is the Chairman’s responsibility to ensure all new Directors undergo an induction programme tailored to their background and experience and the Company Secretary is charged with organising such programmes. In addition, all Directors are regularly informed of changes to relevant legislation or regulations and receive regular briefings on areas such as Directors’ duties and corporate governance guidelines and best practice.
In February, the Board visited the Power division head office in Singapore. The visit provided an opportunity for the Board to meet the senior local management and to gain greater insight into the Company’s operations and plans in Asia. The Board received presentations from senior local management, held various sales/strategy meetings, and toured the manufacturing facility on the island of Batam, Indonesia. The four-day trip (including on-site Board meetings), provided an opportunity for the Board to increase their operational knowledge and assess the future growth strategy of the Company.
Individual Directors, with the support of the Company Secretary, are also expected to take responsibility for identifying their own training needs and to ensure that they are adequately informed about the Group and their responsibilities as a Director.
31Volex plcAnnual Report and Accounts 2014
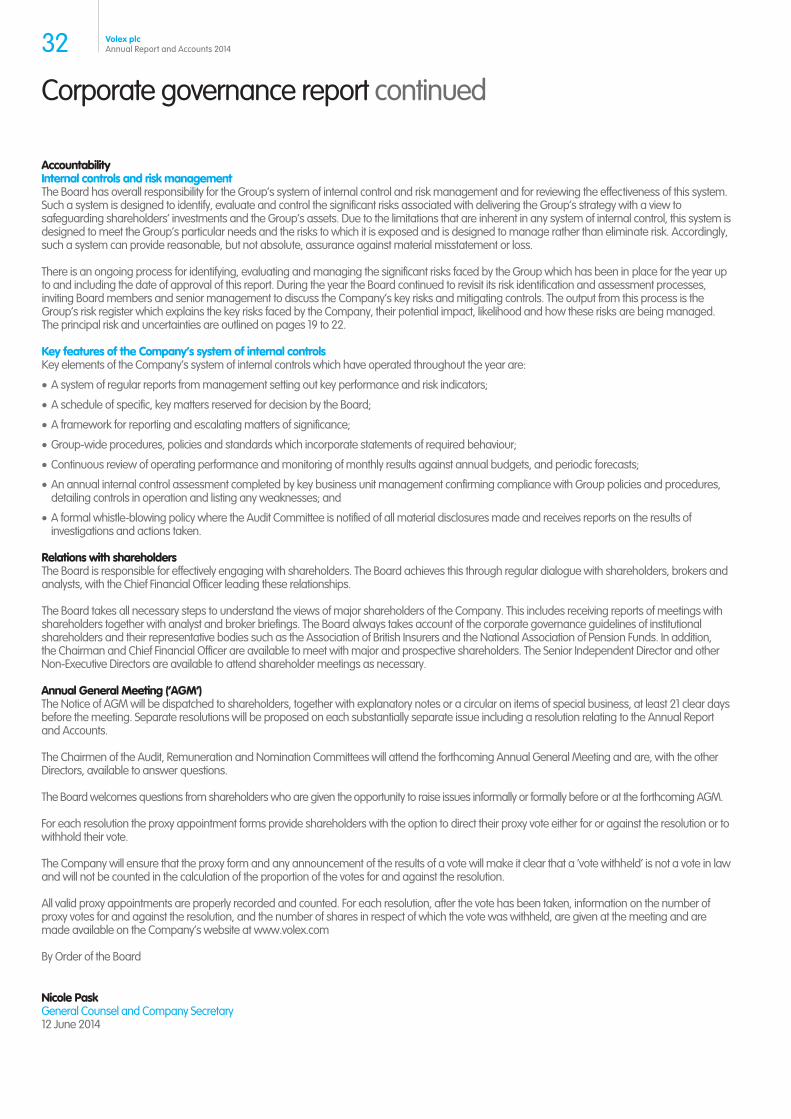
Corporate governance report continued
Accountability Internal controls and risk management The Board has overall responsibility for the Group’s system of internal control and risk management and for reviewing the effectiveness of this system. Such a system is designed to identify, evaluate and control the significant risks associated with delivering the Group’s strategy with a view to safeguarding shareholders’ investments and the Group’s assets. Due to the limitations that are inherent in any system of internal control, this system is designed to meet the Group’s particular needs and the risks to which it is exposed and is designed to manage rather than eliminate risk. Accordingly, such a system can provide reasonable, but not absolute, assurance against material misstatement or loss.
There is an ongoing process for identifying, evaluating and managing the significant risks faced by the Group which has been in place for the year up to and including the date of approval of this report. During the year the Board continued to revisit its risk identification and assessment processes, inviting Board members and senior management to discuss the Company’s key risks and mitigating controls. The output from this process is the Group’s risk register which explains the key risks faced by the Company, their potential impact, likelihood and how these risks are being managed. The principal risk and uncertainties are outlined on pages 19 to 22.
Key features of the Company’s system of internal controls Key elements of the Company’s system of internal controls which have operated throughout the year are:
A system of regular reports from management setting out key performance and risk indicators;
A schedule of specific, key matters reserved for decision by the Board;
A framework for reporting and escalating matters of significance;
Group-wide procedures, policies and standards which incorporate statements of required behaviour;
Continuous review of operating performance and monitoring of monthly results against annual budgets, and periodic forecasts;
An annual internal control assessment completed by key business unit management confirming compliance with Group policies and procedures, detailing controls in operation and listing any weaknesses; and
A formal whistle-blowing policy where the Audit Committee is notified of all material disclosures made and receives reports on the results of investigations and actions taken.
Relations with shareholders The Board is responsible for effectively engaging with shareholders. The Board achieves this through regular dialogue with shareholders, brokers and analysts, with the Chief Financial Officer leading these relationships.
The Board takes all necessary steps to understand the views of major shareholders of the Company. This includes receiving reports of meetings with shareholders together with analyst and broker briefings. The Board always takes account of the corporate governance guidelines of institutional shareholders and their representative bodies such as the Association of British Insurers and the National Association of Pension Funds. In addition, the Chairman and Chief Financial Officer are available to meet with major and prospective shareholders. The Senior Independent Director and other Non-Executive Directors are available to attend shareholder meetings as necessary.
Annual General Meeting (‘AGM’) The Notice of AGM will be dispatched to shareholders, together with explanatory notes or a circular on items of special business, at least 21 clear days before the meeting. Separate resolutions will be proposed on each substantially separate issue including a resolution relating to the Annual Report and Accounts.
The Chairmen of the Audit, Remuneration and Nomination Committees will attend the forthcoming Annual General Meeting and are, with the other Directors, available to answer questions.
The Board welcomes questions from shareholders who are given the opportunity to raise issues informally or formally before or at the forthcoming AGM.
For each resolution the proxy appointment forms provide shareholders with the option to direct their proxy vote either for or against the resolution or to withhold their vote.
The Company will ensure that the proxy form and any announcement of the results of a vote will make it clear that a ‘vote withheld’ is not a vote in law and will not be counted in the calculation of the proportion of the votes for and against the resolution.
All valid proxy appointments are properly recorded and counted. For each resolution, after the vote has been taken, information on the number of proxy votes for and against the resolution, and the number of shares in respect of which the vote was withheld, are given at the meeting and are made available on the Company’s website at www.volex.com
By Order of the Board
Nicole Pask General Counsel and Company Secretary 12 June 2014
32 Volex plcAnnual Report and Accounts 2014
Audit committee report
Key objective To support the Board’s duty of stewardship, the Committee aims to ensure appropriate corporate governance is applied to the Group’s systems of internal control, risk management and other compliance matters. The Committee also monitors the integrity of financial information published externally for use by shareholders. We ensure that the integrity of the financial statements is supported by an effective external audit.
Governance The role of the Audit Committee is defined by its terms of reference which can be found on the Volex website.
The Audit Committee is responsible for:
Monitoring the integrity of the financial statements of the Group and any formal announcements relating to the Group’s financial performance and reviewing significant financial reporting judgements contained therein;
Reporting to the Board as to whether the processes in place to confirm that the Annual Report and Accounts, when taken as a whole, is fair, balanced and understandable and contains the information necessary to allow shareholders to assess the Group’s performance, business model and strategy;
Reporting to the Board on the appropriateness of existing accounting policies and the manner in which they are applied across the Group;
Advising the Board on the application of any new or modified accounting and reporting standards;
Reviewing the Group’s internal financial controls and the Group’s internal control and risk management systems;
Oversight of the Internal Audit function, including the decision as to whether to have an internal audit function;
Reviewing the Group’s procedures for detecting and responding to fraud, bribery and the handling of allegations made by employees with respect to financial malpractice or other forms of whistle-blowing and oversight of any and all reports on such incidents; and
Oversight of the relationship with the external auditor including where appropriate the appointment or reappointment of the external auditor.
The Audit Committee reports its findings to the Board, identifying any matters on which it considers that action or improvement is needed, and makes recommendations on the steps to be taken.
Composition of the Audit Committee The members of the Audit Committee are:
Name Date of appointment
John Allkins (Chairman) 16 October 2013 Martin Geh 24 October 2013 Daren Morris 17 January 2014
Members who also served on the Committee are Richard Arkle (previous Chairman), Chris Geoghegan and Karen Slatford (who ceased to be a member on her appointment as Chairman).
The Committee members have the appropriate range of financial, commercial and risk management experience to fulfil its duties.
Appointments are for a period of three years and are extendable by no more than two additional three-year terms. The Committee must consist of independent Non-Executives and requires a minimum of two independent Non-Executive members at any time.
The Audit Committee is required to include one financially qualified member. Currently Daren Morris and I fulfil this requirement. All Audit Committee members are expected to be financially literate. Biographical details are set out on pages 26 and 27.
Meetings The Audit Committee is required to meet a minimum of three times per year and has an agenda linked to events in the Group’s financial calendar. The agenda is predominantly cyclical and is therefore approved by the Audit Committee Chairman on behalf of his fellow members. Each Audit Committee member has the right to request reports on matters of interest in addition to the cyclical items.
The Audit Committee invites the Group Finance Director, the Group Financial Controller and senior representatives of the external auditor to attend all of its meetings in full, although it reserves the right to request any of these individuals to withdraw. Other Directors can be invited to attend.
33Volex plcAnnual Report and Accounts 2014
Audit committee report continued
Main activities of the Committee during the year Financial reporting The primary role of the Audit Committee in relation to financial reporting is to review with both management and the external auditors (PricewaterhouseCoopers LLP, ‘PwC’), and report to the Board where required, the appropriateness of the half-year and annual financial statements concentrating on, amongst other matters:
The quality and acceptability of accounting policies and practices;
The clarity of the disclosures and compliance with financial reporting standards and relevant financial and governance reporting requirements;
Material areas in which significant judgements have been applied or there has been discussion with PwC;
The processes to ensure that the Annual Report and Accounts, taken as a whole, is fair, balanced and understandable and provides the information necessary for shareholders to assess the Company’s performance, business model and strategy; and
Any correspondence from regulators in relation to our financial reporting.
To aid our review the Committee considers reports from the Group Financial Controller and reports from the external auditor. In addition, the Committee following their review of the Annual Report and Accounts, has challenged management on its content to ensure that the Report as a whole is fair, balanced and understandable.
The primary areas of judgement considered by the Committee in relation to the FY2014 financial statements and how these have been addressed are listed below.
Going concern – During the year, as detailed in note 2 on page 68, the Committee reviewed the Group’s compliance with its Bank Facility covenants. It has reviewed the covenant adjustments and facility extension documents, details of which are shown in note 19 on page 87. The Committee also has an understanding of the documents relating to the Group’s placement of shares as reported in note 33 on page 101. The Committee has reviewed the Group’s forecasts and projections taking reasonable account of possible changes in trading performance and reflecting the increase in share capital and extension of the bank facilities. It has reviewed covenant compliance under these conditions as well as the mitigations available to the Group, and the effect of those mitigations on covenant performance, in the event of a shortfall in financial performance against its forecasts and projections. The Committee concluded that the Accounts should be prepared on a going concern basis and the Directors have made such a statement in the Directors’ report;
Development cost capitalisation – Details are shown in note 14 on page 83. During the year $2.0 million of costs associated with the development of AOC technology has been capitalised. The Committee has reviewed the development plan to date, the required development spend to completion and the forecast project profitability. The Committee agrees on the basis of the forecast project profitability that costs are properly capitalised;
Non-recurring expenditure – Management has presented a breakdown of the non-recurring expenditure and explanations as to why the expense should be treated as such. The Audit Committee has reviewed and discussed this analysis with management. Details are shown in note 4 on page 77. Non-recurring expenditure during the year was $11.1 million. The Committee agreed that these costs were properly recognised as exceptional; and
Deferred tax asset recognition – The Committee has reviewed management’s analysis of the deferred tax assets available to the Group and their assessment of the future taxable profits against which these assets may be utilised. Management only recognise deferred tax assets to the extent that future relevant taxable profits are probable. Details are shown in note 21 on page 89. The Committee concurs with the view that current and projected taxable profits in those jurisdictions with tax losses which can be carried forward means that there should be a write-back of deferred tax assets.
Internal control, risk and compliance The Audit Committee is required to assist the Board in its annual assessment of the effectiveness of the Volex risk management and internal control systems. To fulfil these duties, the Committee reviewed:
The results from Volex’s Internal Control Assessment questionnaires, a self-assessment to verify compliance with Volex’s internal control standards completed by general managers and senior finance personnel at all material locations;
The results, by exception, of the Annual Certificate of Compliance completed by all senior personnel in the organisation;
The updated risk matrix prepared by Board members and senior management;
Investigations performed on all whistle-blowing, control breakdowns and fraudulent issues; and
The Management Letter presented by PwC outlining control weaknesses identified through their annual audit and management’s response to these.
Details of our internal controls and risk management systems including controls over the financial reporting process can be found on page 32 in the Corporate Governance Report with our risk factors in full in the Strategic report on pages 19 to 22.
Internal audit During the year there was no internal audit function. A new Group Head of Internal Audit started in May 2014. An internal audit plan for the remainder of FY2015 will be developed in the first half of the year.
34 Volex plcAnnual Report and Accounts 2014
External audit The Audit Committee is responsible for the monitoring of the independence, objectivity and compliance with ethical and regulatory requirements of the external auditors. Details of the total remuneration for the auditors for the year can be found in note 8 on page 79 of the consolidated financial statements.
Auditor independence and objectivity is safeguarded by limiting the value and nature of external services provided by the auditor. The Group also has a policy of not recruiting employees of the external auditor who have worked on the audit in the last two years to senior positions in the Group. There is a rotation policy for the lead engagement partner.
Non-audit services provided by the auditor The Audit Committee maintains a non-audit services policy which sets out the categories of non-audit services that the external auditor will and will not be allowed to provide to the Group, including those that are pre-approved by the Audit Committee and those that require specific approval before they are contracted for, subject to de-minimis levels. This policy is available on request.
Non-audit fees for the year were $95,000 (FY2013: $101,000) primarily in relation to taxation services and other assurance activity.
Taxation services are provided in countries where it is not cost effective for the Group to employ full-time tax managers. The Committee considers it most efficient to use the external auditors since much of the information used in preparing computations and returns is derived from the audited financial information. In order to maintain the external auditor’s independence and objectivity, Group and local management review and consider the findings and the external auditors do not make any decisions on behalf of management.
Audit tender The Audit Committee considers the reappointment of the external auditor each year. ‘PwC’ has been our auditor since 4 April 2010 following a tender process. There are no contractual obligations that restrict the Committee’s choice of external auditor.
To fulfil its responsibility regarding the independence and effectiveness of the external auditor, the Audit Committee:
Reviewed the external auditor’s plan for the current year (noting the role of the senior statutory audit partner and any changes in key audit staff) and agreeing the scope of the audit work to be performed;
Agreed the fees to be paid to PwC for their audit of the 30 March 2014 financial statements and other non-audit fees;
Reviewed a report from PwC describing their arrangements to identify, report and manage any conflicts of interest;
Reviewed the output from an Audit Effectiveness Questionnaire completed by senior members of the finance team who regularly interact with the external auditors (note the members of the Audit Committee were not requested to complete the questionnaire as they were not incumbent at the time of the FY2013 audit);
Assessed PwC’s fulfilment of the agreed audit plan and any variations from that plan; and
Assessed the robustness and perceptiveness of PwC in their handling of the key accounting and audit judgements.
The Audit Committee, having considered the length of PwC’s audit tenure and the results of the above, continue to consider PwC to be independent and therefore have provided the Board with its recommendation that PwC be reappointed as external auditor for the 53 weeks ending 5 April 2015. This will continue to be assessed on an annual basis considering the provisions outlined in the revised UK Corporate Governance code in respect of external audit tendering and the likely changes resulting from the European Commission’s Competition Review.
Summary As a result of its work during the year, the Audit Committee has concluded that it has acted in accordance with its terms of reference and has ensured the independence and objectivity of the external auditor.
The Chairman of the Audit Committee will be available at the Annual General Meeting to answer any questions about the work of the Committee. We would welcome feedback from shareholders on this report.
On behalf of the Audit Committee
John Allkins Chairman of the Audit Committee 12 June 2014
35Volex plcAnnual Report and Accounts 2014
Directors’ remuneration report Annual Statement Overview from Chairman of the Remuneration Committee On behalf of the Board, I am pleased to present the 2014 Directors’ Remuneration Report, for which we are seeking approval at our Annual General Meeting.
Following the implementation of the new directors’ reporting regulations, the Directors’ Remuneration Report is presented in two parts. First, a report setting out the Directors’ Remuneration Policy and second, the Annual Remuneration Report which sets out how the Policy will be implemented in FY2015 as well as the arrangements implemented in FY2014.
The last 12 months have been a period of fundamental renewal at Volex. We have substantially changed the senior management team and Board with Christoph Eisenhardt, CEO and Nick Parker, CFO joining in the year. The new executive team have developed a clear vision for the business and begun to drive customer focus and strong accountability across the Group. To ensure attraction and retention of an appropriate calibre of senior leader to drive the change required under the Volex Transformation Programme (VTP), the Company reviewed its remuneration and incentive plans. The Committee determined to maintain a simple remuneration structure consisting of base salary, annual bonus and a long term incentive in the form of a Performance Share Plan.
For FY2014 the Remuneration Committee determined that Executive Directors’ annual bonuses should be based in part on qualitative performance measures set by the Chairman and in part on operating profit achievement. Given the importance of the VTP in returning the Group to profitable growth, the Committee determined that the bonuses earned by the Executive Directors would be deferred until FY2015 and paid dependent on achievement of the first quarter revenue performances agreed in the budget, this being a clear indicator of the VTP being on track to deliver. Annual bonuses for FY2015 will be entirely measured on operating profit performance.
The Committee agreed that a PSP grant was necessary in FY2014 to incentivise the Executive Directors to drive long term growth and determined that the performance criteria would remain aligned with shareholders’ interests through the use of a relative TSR measure. In addition a cumulative operating profit measure was introduced. These performance criteria will continue to be used for the PSP grant proposed for FY2015. Further, a one-off grant of shares under the Restricted Share Plan (‘RSP’) was awarded to the CEO to compensate for incentives forfeited on leaving his previous employer to take up the role with Volex.
The Remuneration Committee consulted with the Company’s major shareholders on the current and proposed remuneration strategy during May 2014.
We believe that Volex’s policies on Directors’ remuneration and the way it has been implemented in FY2014 to attract and incentivise the Directors to deliver the significant change programme outlined in the VTP, continue to be closely aligned with shareholders’ interests. As required under the new reporting regulations the Remuneration Report will be put to a binding shareholder vote at the 2014 AGM. We hope to receive your support at the AGM.
On behalf of the Remuneration Committee
Geraint Anderson Chairman of the Remuneration Committee 12 June 2014
36 Volex plcAnnual Report and Accounts 2014
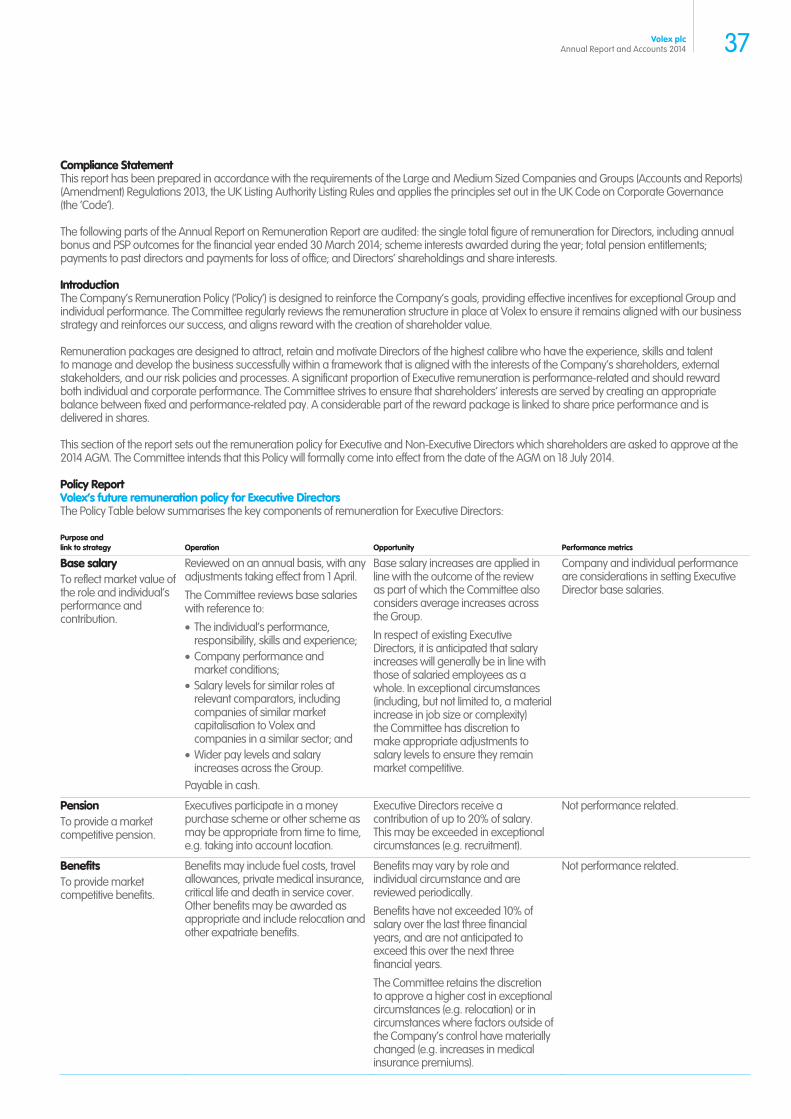
Compliance Statement This report has been prepared in accordance with the requirements of the Large and Medium Sized Companies and Groups (Accounts and Reports) (Amendment) Regulations 2013, the UK Listing Authority Listing Rules and applies the principles set out in the UK Code on Corporate Governance (the ‘Code’).
The following parts of the Annual Report on Remuneration Report are audited: the single total figure of remuneration for Directors, including annual bonus and PSP outcomes for the financial year ended 30 March 2014; scheme interests awarded during the year; total pension entitlements; payments to past directors and payments for loss of office; and Directors’ shareholdings and share interests.
Introduction The Company’s Remuneration Policy (‘Policy’) is designed to reinforce the Company’s goals, providing effective incentives for exceptional Group and individual performance. The Committee regularly reviews the remuneration structure in place at Volex to ensure it remains aligned with our business strategy and reinforces our success, and aligns reward with the creation of shareholder value.
Remuneration packages are designed to attract, retain and motivate Directors of the highest calibre who have the experience, skills and talent to manage and develop the business successfully within a framework that is aligned with the interests of the Company’s shareholders, external stakeholders, and our risk policies and processes. A significant proportion of Executive remuneration is performance-related and should reward both individual and corporate performance. The Committee strives to ensure that shareholders’ interests are served by creating an appropriate balance between fixed and performance-related pay. A considerable part of the reward package is linked to share price performance and is delivered in shares.
This section of the report sets out the remuneration policy for Executive and Non-Executive Directors which shareholders are asked to approve at the 2014 AGM. The Committee intends that this Policy will formally come into effect from the date of the AGM on 18 July 2014.
Policy Report Volex’s future remuneration policy for Executive Directors The Policy Table below summarises the key components of remuneration for Executive Directors:
Purpose and link to strategy Operation Opportunity Performance metrics
Base salary To reflect market value of the role and individual’s performance and contribution.
Reviewed on an annual basis, with any adjustments taking effect from 1 April.
The Committee reviews base salaries with reference to:
The individual’s performance, responsibility, skills and experience; Company performance and market conditions; Salary levels for similar roles at relevant comparators, including companies of similar market capitalisation to Volex and companies in a similar sector; and Wider pay levels and salary increases across the Group.
Payable in cash.
Base salary increases are applied in line with the outcome of the review as part of which the Committee also considers average increases across the Group.
In respect of existing Executive Directors, it is anticipated that salary increases will generally be in line with those of salaried employees as a whole. In exceptional circumstances (including, but not limited to, a material increase in job size or complexity) the Committee has discretion to make appropriate adjustments to salary levels to ensure they remain market competitive.
Company and individual performance are considerations in setting Executive Director base salaries.
Pension To provide a market competitive pension.
Executives participate in a money purchase scheme or other scheme as may be appropriate from time to time, e.g. taking into account location.
Executive Directors receive a contribution of up to 20% of salary. This may be exceeded in exceptional circumstances (e.g. recruitment).
Not performance related.
Benefits To provide market competitive benefits.
Benefits may include fuel costs, travel allowances, private medical insurance, critical life and death in service cover. Other benefits may be awarded as appropriate and include relocation and other expatriate benefits.
Benefits may vary by role and individual circumstance and are reviewed periodically.
Benefits have not exceeded 10% of salary over the last three financial years, and are not anticipated to exceed this over the next three financial years.
The Committee retains the discretion to approve a higher cost in exceptional circumstances (e.g. relocation) or in circumstances where factors outside of the Company’s control have materially changed (e.g. increases in medical insurance premiums).
Not performance related.
37Volex plcAnnual Report and Accounts 2014
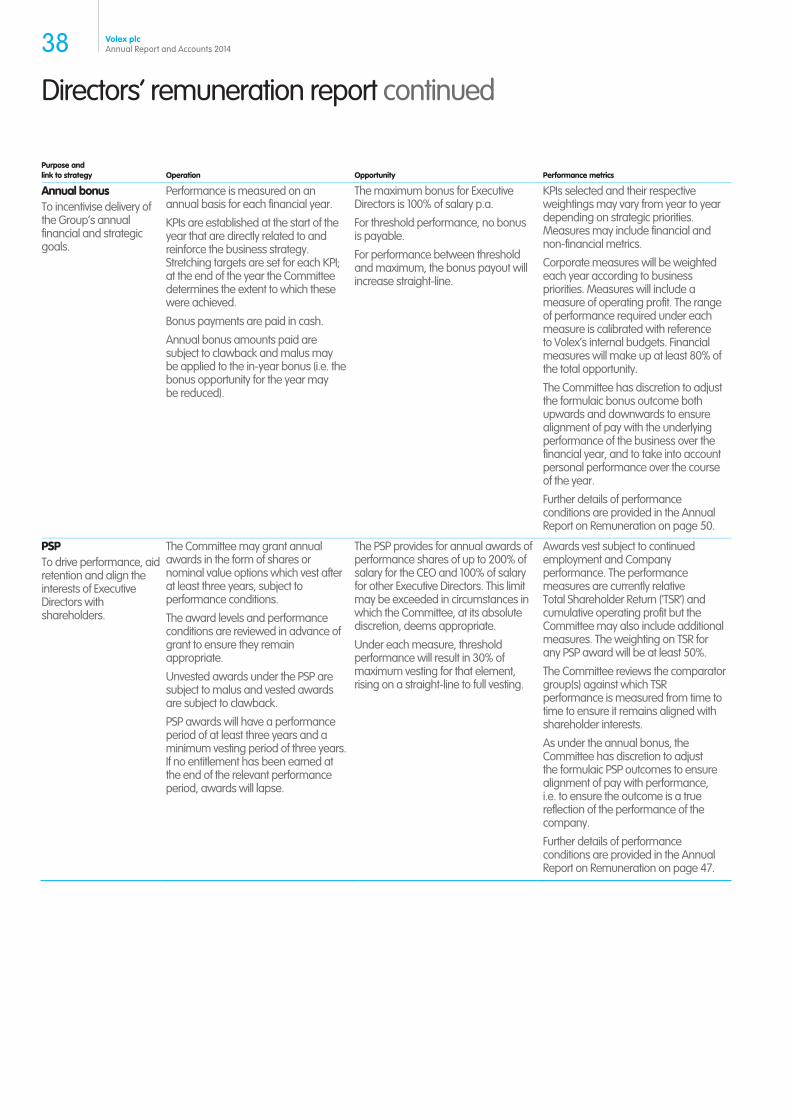
Directors’ remuneration report continued
Purpose and link to strategy Operation Opportunity Performance metrics
Annual bonus To incentivise delivery of the Group’s annual financial and strategic goals.
Performance is measured on an annual basis for each financial year.
KPIs are established at the start of the year that are directly related to and reinforce the business strategy. Stretching targets are set for each KPI; at the end of the year the Committee determines the extent to which these were achieved.
Bonus payments are paid in cash.
Annual bonus amounts paid are subject to clawback and malus may be applied to the in-year bonus (i.e. the bonus opportunity for the year may be reduced).
The maximum bonus for Executive Directors is 100% of salary p.a.
For threshold performance, no bonus is payable.
For performance between threshold and maximum, the bonus payout will increase straight-line.
KPIs selected and their respective weightings may vary from year to year depending on strategic priorities. Measures may include financial and non-financial metrics.
Corporate measures will be weighted each year according to business priorities. Measures will include a measure of operating profit. The range of performance required under each measure is calibrated with reference to Volex’s internal budgets. Financial measures will make up at least 80% of the total opportunity.
The Committee has discretion to adjust the formulaic bonus outcome both upwards and downwards to ensure alignment of pay with the underlying performance of the business over the financial year, and to take into account personal performance over the course of the year.
Further details of performance conditions are provided in the Annual Report on Remuneration on page 50.
PSP To drive performance, aid retention and align the interests of Executive Directors with shareholders.
The Committee may grant annual awards in the form of shares or nominal value options which vest after at least three years, subject to performance conditions.
The award levels and performance conditions are reviewed in advance of grant to ensure they remain appropriate.
Unvested awards under the PSP are subject to malus and vested awards are subject to clawback.
PSP awards will have a performance period of at least three years and a minimum vesting period of three years. If no entitlement has been earned at the end of the relevant performance period, awards will lapse.
The PSP provides for annual awards of performance shares of up to 200% of salary for the CEO and 100% of salary for other Executive Directors. This limit may be exceeded in circumstances in which the Committee, at its absolute discretion, deems appropriate.
Under each measure, threshold performance will result in 30% of maximum vesting for that element, rising on a straight-line to full vesting.
Awards vest subject to continued employment and Company performance. The performance measures are currently relative Total Shareholder Return (‘TSR’) and cumulative operating profit but the Committee may also include additional measures. The weighting on TSR for any PSP award will be at least 50%.
The Committee reviews the comparator group(s) against which TSR performance is measured from time to time to ensure it remains aligned with shareholder interests.
As under the annual bonus, the Committee has discretion to adjust the formulaic PSP outcomes to ensure alignment of pay with performance, i.e. to ensure the outcome is a true reflection of the performance of the company.
Further details of performance conditions are provided in the Annual Report on Remuneration on page 47.
38 Volex plcAnnual Report and Accounts 2014
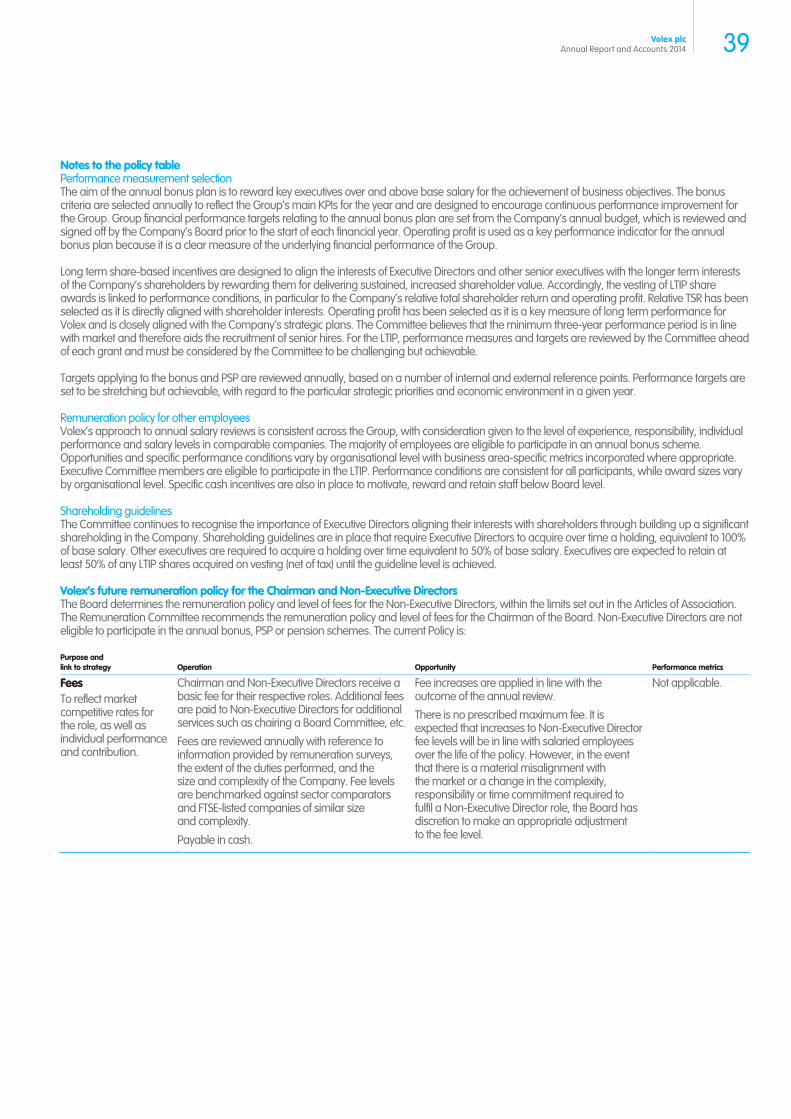
Notes to the policy table Performance measurement selection The aim of the annual bonus plan is to reward key executives over and above base salary for the achievement of business objectives. The bonus criteria are selected annually to reflect the Group’s main KPIs for the year and are designed to encourage continuous performance improvement for the Group. Group financial performance targets relating to the annual bonus plan are set from the Company’s annual budget, which is reviewed and signed off by the Company’s Board prior to the start of each financial year. Operating profit is used as a key performance indicator for the annual bonus plan because it is a clear measure of the underlying financial performance of the Group.
Long term share-based incentives are designed to align the interests of Executive Directors and other senior executives with the longer term interests of the Company’s shareholders by rewarding them for delivering sustained, increased shareholder value. Accordingly, the vesting of LTIP share awards is linked to performance conditions, in particular to the Company’s relative total shareholder return and operating profit. Relative TSR has been selected as it is directly aligned with shareholder interests. Operating profit has been selected as it is a key measure of long term performance for Volex and is closely aligned with the Company’s strategic plans. The Committee believes that the minimum three-year performance period is in line with market and therefore aids the recruitment of senior hires. For the LTIP, performance measures and targets are reviewed by the Committee ahead of each grant and must be considered by the Committee to be challenging but achievable.
Targets applying to the bonus and PSP are reviewed annually, based on a number of internal and external reference points. Performance targets are set to be stretching but achievable, with regard to the particular strategic priorities and economic environment in a given year.
Remuneration policy for other employees Volex’s approach to annual salary reviews is consistent across the Group, with consideration given to the level of experience, responsibility, individual performance and salary levels in comparable companies. The majority of employees are eligible to participate in an annual bonus scheme. Opportunities and specific performance conditions vary by organisational level with business area-specific metrics incorporated where appropriate. Executive Committee members are eligible to participate in the LTIP. Performance conditions are consistent for all participants, while award sizes vary by organisational level. Specific cash incentives are also in place to motivate, reward and retain staff below Board level.
Shareholding guidelines The Committee continues to recognise the importance of Executive Directors aligning their interests with shareholders through building up a significant shareholding in the Company. Shareholding guidelines are in place that require Executive Directors to acquire over time a holding, equivalent to 100% of base salary. Other executives are required to acquire a holding over time equivalent to 50% of base salary. Executives are expected to retain at least 50% of any LTIP shares acquired on vesting (net of tax) until the guideline level is achieved.
Volex’s future remuneration policy for the Chairman and Non-Executive Directors The Board determines the remuneration policy and level of fees for the Non-Executive Directors, within the limits set out in the Articles of Association. The Remuneration Committee recommends the remuneration policy and level of fees for the Chairman of the Board. Non-Executive Directors are not eligible to participate in the annual bonus, PSP or pension schemes. The current Policy is:
Purpose and link to strategy Operation Opportunity Performance metrics
Fees To reflect market competitive rates for the role, as well as individual performance and contribution.
Chairman and Non-Executive Directors receive a basic fee for their respective roles. Additional fees are paid to Non-Executive Directors for additional services such as chairing a Board Committee, etc.
Fees are reviewed annually with reference to information provided by remuneration surveys, the extent of the duties performed, and the size and complexity of the Company. Fee levels are benchmarked against sector comparators and FTSE-listed companies of similar size and complexity.
Payable in cash.
Fee increases are applied in line with the outcome of the annual review.
There is no prescribed maximum fee. It is expected that increases to Non-Executive Director fee levels will be in line with salaried employees over the life of the policy. However, in the event that there is a material misalignment with the market or a change in the complexity, responsibility or time commitment required to fulfil a Non-Executive Director role, the Board has discretion to make an appropriate adjustment to the fee level.
Not applicable.
39Volex plcAnnual Report and Accounts 2014
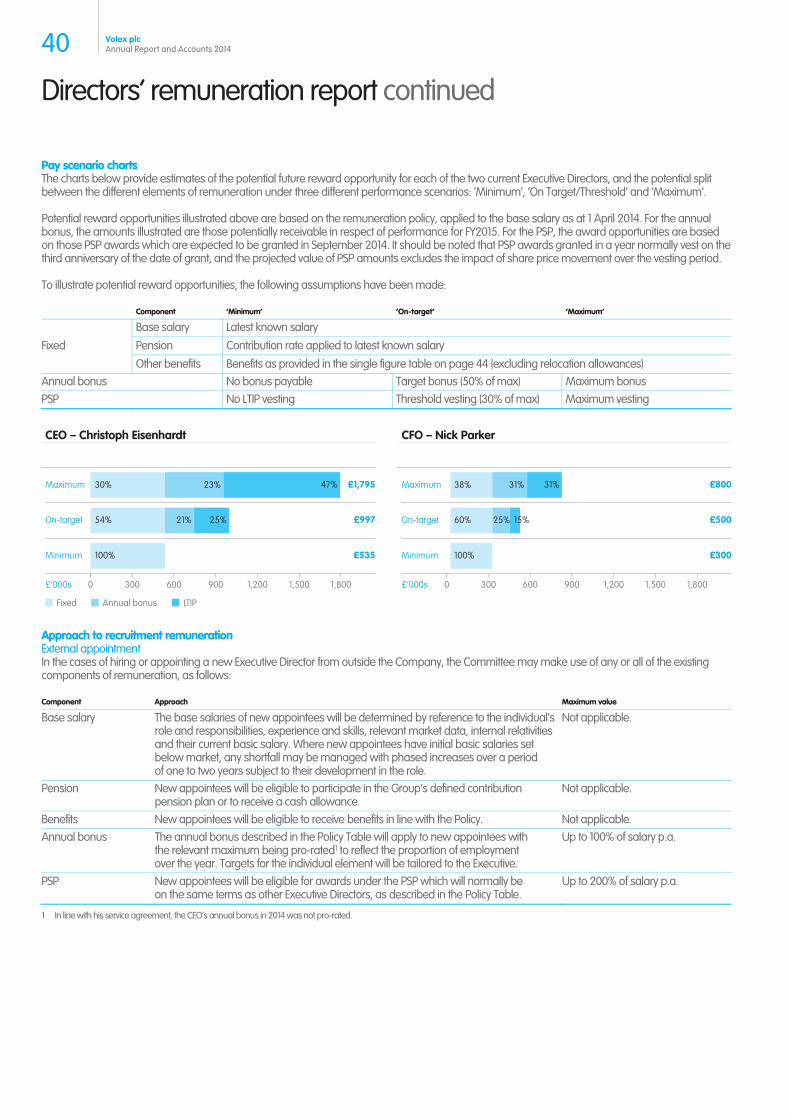
Directors’ remuneration report continued
Pay scenario charts The charts below provide estimates of the potential future reward opportunity for each of the two current Executive Directors, and the potential split between the different elements of remuneration under three different performance scenarios: ‘Minimum’, ‘On Target/Threshold’ and ‘Maximum’.
Potential reward opportunities illustrated above are based on the remuneration policy, applied to the base salary as at 1 April 2014. For the annual bonus, the amounts illustrated are those potentially receivable in respect of performance for FY2015. For the PSP, the award opportunities are based on those PSP awards which are expected to be granted in September 2014. It should be noted that PSP awards granted in a year normally vest on the third anniversary of the date of grant, and the projected value of PSP amounts excludes the impact of share price movement over the vesting period.
To illustrate potential reward opportunities, the following assumptions have been made:
Component ‘Minimum’ ‘On-target’ ‘Maximum’
Fixed
Base salary Latest known salary
Pension Contribution rate applied to latest known salary
Other benefits Benefits as provided in the single figure table on page 44 (excluding relocation allowances) Annual bonus No bonus payable Target bonus (50% of max) Maximum bonus PSP No LTIP vesting Threshold vesting (30% of max) Maximum vesting
Approach to recruitment remuneration External appointment In the cases of hiring or appointing a new Executive Director from outside the Company, the Committee may make use of any or all of the existing components of remuneration, as follows:
Component Approach Maximum value
Base salary The base salaries of new appointees will be determined by reference to the individual’s role and responsibilities, experience and skills, relevant market data, internal relativities and their current basic salary. Where new appointees have initial basic salaries set below market, any shortfall may be managed with phased increases over a period of one to two years subject to their development in the role.
Not applicable.
Pension New appointees will be eligible to participate in the Group’s defined contribution pension plan or to receive a cash allowance.
Not applicable.
Benefits New appointees will be eligible to receive benefits in line with the Policy. Not applicable. Annual bonus The annual bonus described in the Policy Table will apply to new appointees with
the relevant maximum being pro-rated1 to reflect the proportion of employment over the year. Targets for the individual element will be tailored to the Executive.
Up to 100% of salary p.a.
PSP New appointees will be eligible for awards under the PSP which will normally be on the same terms as other Executive Directors, as described in the Policy Table.
Up to 200% of salary p.a.
1 In line with his service agreement, the CEO’s annual bonus in 2014 was not pro-rated.
CEO – Christoph Eisenhardt
£997
£1,795
£535
47%30% 23%
25%54% 21%
100%
0 300 600 900 1,200 1,500 1,800
Minimum
On-target
Maximum
£’000s
CFO – Nick Parker
£500
£800
£300
31%38% 31%
15%60% 25%
100%
0 300 600 900 1,200 1,500 1,800
Minimum
On-target
Maximum
£’000s
Fixed LTIPAnnual bonus
40 Volex plcAnnual Report and Accounts 2014
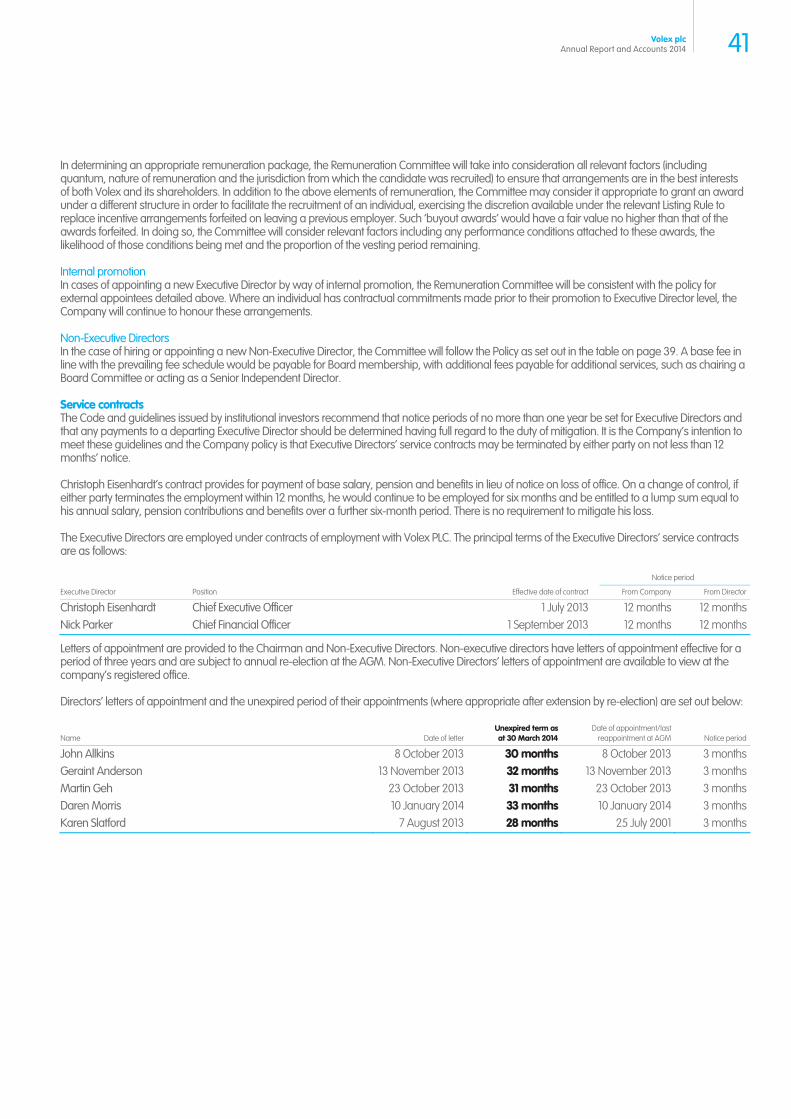
In determining an appropriate remuneration package, the Remuneration Committee will take into consideration all relevant factors (including quantum, nature of remuneration and the jurisdiction from which the candidate was recruited) to ensure that arrangements are in the best interests of both Volex and its shareholders. In addition to the above elements of remuneration, the Committee may consider it appropriate to grant an award under a different structure in order to facilitate the recruitment of an individual, exercising the discretion available under the relevant Listing Rule to replace incentive arrangements forfeited on leaving a previous employer. Such ‘buyout awards’ would have a fair value no higher than that of the awards forfeited. In doing so, the Committee will consider relevant factors including any performance conditions attached to these awards, the likelihood of those conditions being met and the proportion of the vesting period remaining.
Internal promotion In cases of appointing a new Executive Director by way of internal promotion, the Remuneration Committee will be consistent with the policy for external appointees detailed above. Where an individual has contractual commitments made prior to their promotion to Executive Director level, the Company will continue to honour these arrangements.
Non-Executive Directors In the case of hiring or appointing a new Non-Executive Director, the Committee will follow the Policy as set out in the table on page 39. A base fee in line with the prevailing fee schedule would be payable for Board membership, with additional fees payable for additional services, such as chairing a Board Committee or acting as a Senior Independent Director.
Service contracts The Code and guidelines issued by institutional investors recommend that notice periods of no more than one year be set for Executive Directors and that any payments to a departing Executive Director should be determined having full regard to the duty of mitigation. It is the Company’s intention to meet these guidelines and the Company policy is that Executive Directors’ service contracts may be terminated by either party on not less than 12 months’ notice.
Christoph Eisenhardt’s contract provides for payment of base salary, pension and benefits in lieu of notice on loss of office. On a change of control, if either party terminates the employment within 12 months, he would continue to be employed for six months and be entitled to a lump sum equal to his annual salary, pension contributions and benefits over a further six-month period. There is no requirement to mitigate his loss.
The Executive Directors are employed under contracts of employment with Volex PLC. The principal terms of the Executive Directors’ service contracts are as follows:
Notice period
Executive Director Position Effective date of contract From Company From Director
Christoph Eisenhardt Chief Executive Officer 1 July 2013 12 months 12 monthsNick Parker Chief Financial Officer 1 September 2013 12 months 12 months
Letters of appointment are provided to the Chairman and Non-Executive Directors. Non-executive directors have letters of appointment effective for a period of three years and are subject to annual re-election at the AGM. Non-Executive Directors’ letters of appointment are available to view at the company’s registered office.
Directors’ letters of appointment and the unexpired period of their appointments (where appropriate after extension by re-election) are set out below:
Name Date of letterUnexpired term as at 30 March 2014
Date of appointment/last reappointment at AGM Notice period
John Allkins 8 October 2013 30 months 8 October 2013 3 monthsGeraint Anderson 13 November 2013 32 months 13 November 2013 3 monthsMartin Geh 23 October 2013 31 months 23 October 2013 3 monthsDaren Morris 10 January 2014 33 months 10 January 2014 3 monthsKaren Slatford 7 August 2013 28 months 25 July 2001 3 months
41Volex plcAnnual Report and Accounts 2014
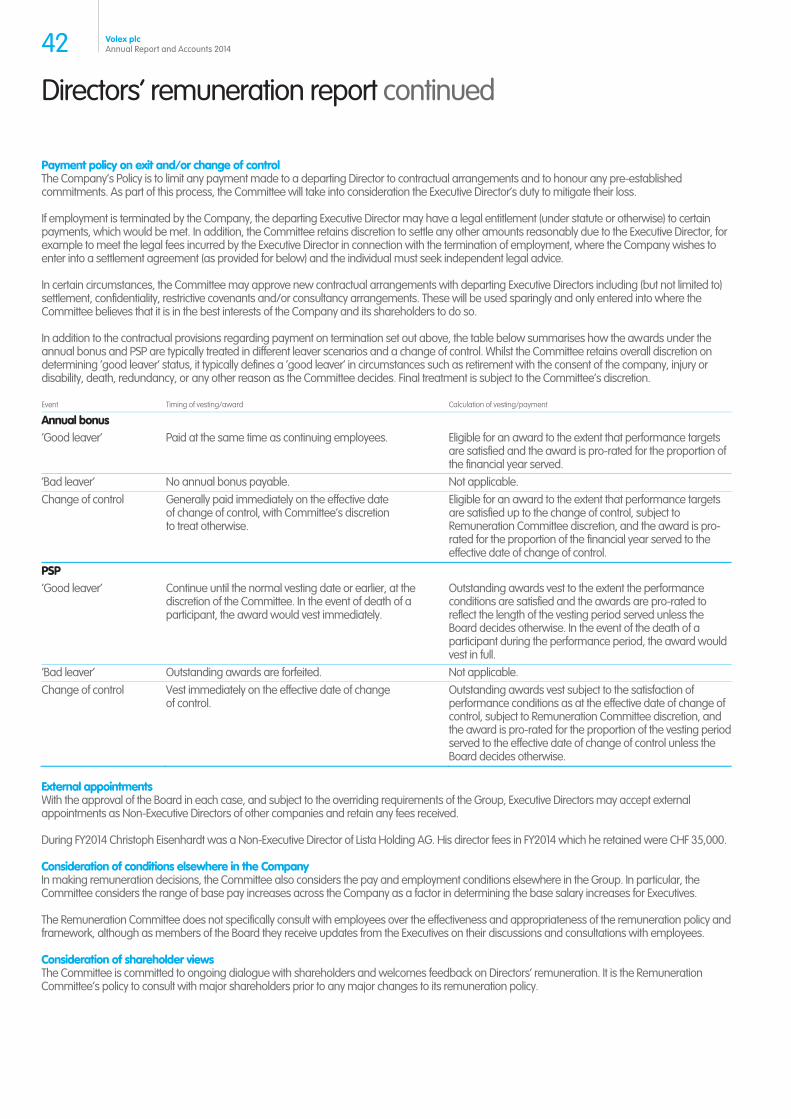
Directors’ remuneration report continued
Payment policy on exit and/or change of control The Company’s Policy is to limit any payment made to a departing Director to contractual arrangements and to honour any pre-established commitments. As part of this process, the Committee will take into consideration the Executive Director’s duty to mitigate their loss.
If employment is terminated by the Company, the departing Executive Director may have a legal entitlement (under statute or otherwise) to certain payments, which would be met. In addition, the Committee retains discretion to settle any other amounts reasonably due to the Executive Director, for example to meet the legal fees incurred by the Executive Director in connection with the termination of employment, where the Company wishes to enter into a settlement agreement (as provided for below) and the individual must seek independent legal advice.
In certain circumstances, the Committee may approve new contractual arrangements with departing Executive Directors including (but not limited to) settlement, confidentiality, restrictive covenants and/or consultancy arrangements. These will be used sparingly and only entered into where the Committee believes that it is in the best interests of the Company and its shareholders to do so.
In addition to the contractual provisions regarding payment on termination set out above, the table below summarises how the awards under the annual bonus and PSP are typically treated in different leaver scenarios and a change of control. Whilst the Committee retains overall discretion on determining ‘good leaver’ status, it typically defines a ‘good leaver’ in circumstances such as retirement with the consent of the company, injury or disability, death, redundancy, or any other reason as the Committee decides. Final treatment is subject to the Committee’s discretion.
Event Timing of vesting/award Calculation of vesting/payment
Annual bonus ‘Good leaver’ Paid at the same time as continuing employees. Eligible for an award to the extent that performance targets
are satisfied and the award is pro-rated for the proportion of the financial year served.
‘Bad leaver’ No annual bonus payable. Not applicable. Change of control Generally paid immediately on the effective date
of change of control, with Committee’s discretion to treat otherwise.
Eligible for an award to the extent that performance targets are satisfied up to the change of control, subject to Remuneration Committee discretion, and the award is pro-rated for the proportion of the financial year served to the effective date of change of control.
PSP ‘Good leaver’ Continue until the normal vesting date or earlier, at the
discretion of the Committee. In the event of death of a participant, the award would vest immediately.
Outstanding awards vest to the extent the performance conditions are satisfied and the awards are pro-rated to reflect the length of the vesting period served unless the Board decides otherwise. In the event of the death of a participant during the performance period, the award would vest in full.
‘Bad leaver’ Outstanding awards are forfeited. Not applicable. Change of control Vest immediately on the effective date of change
of control. Outstanding awards vest subject to the satisfaction of performance conditions as at the effective date of change of control, subject to Remuneration Committee discretion, and the award is pro-rated for the proportion of the vesting period served to the effective date of change of control unless the Board decides otherwise.
External appointments With the approval of the Board in each case, and subject to the overriding requirements of the Group, Executive Directors may accept external appointments as Non-Executive Directors of other companies and retain any fees received.
During FY2014 Christoph Eisenhardt was a Non-Executive Director of Lista Holding AG. His director fees in FY2014 which he retained were CHF 35,000.
Consideration of conditions elsewhere in the Company In making remuneration decisions, the Committee also considers the pay and employment conditions elsewhere in the Group. In particular, the Committee considers the range of base pay increases across the Company as a factor in determining the base salary increases for Executives.
The Remuneration Committee does not specifically consult with employees over the effectiveness and appropriateness of the remuneration policy and framework, although as members of the Board they receive updates from the Executives on their discussions and consultations with employees.
Consideration of shareholder views The Committee is committed to ongoing dialogue with shareholders and welcomes feedback on Directors’ remuneration. It is the Remuneration Committee’s policy to consult with major shareholders prior to any major changes to its remuneration policy.
42 Volex plcAnnual Report and Accounts 2014
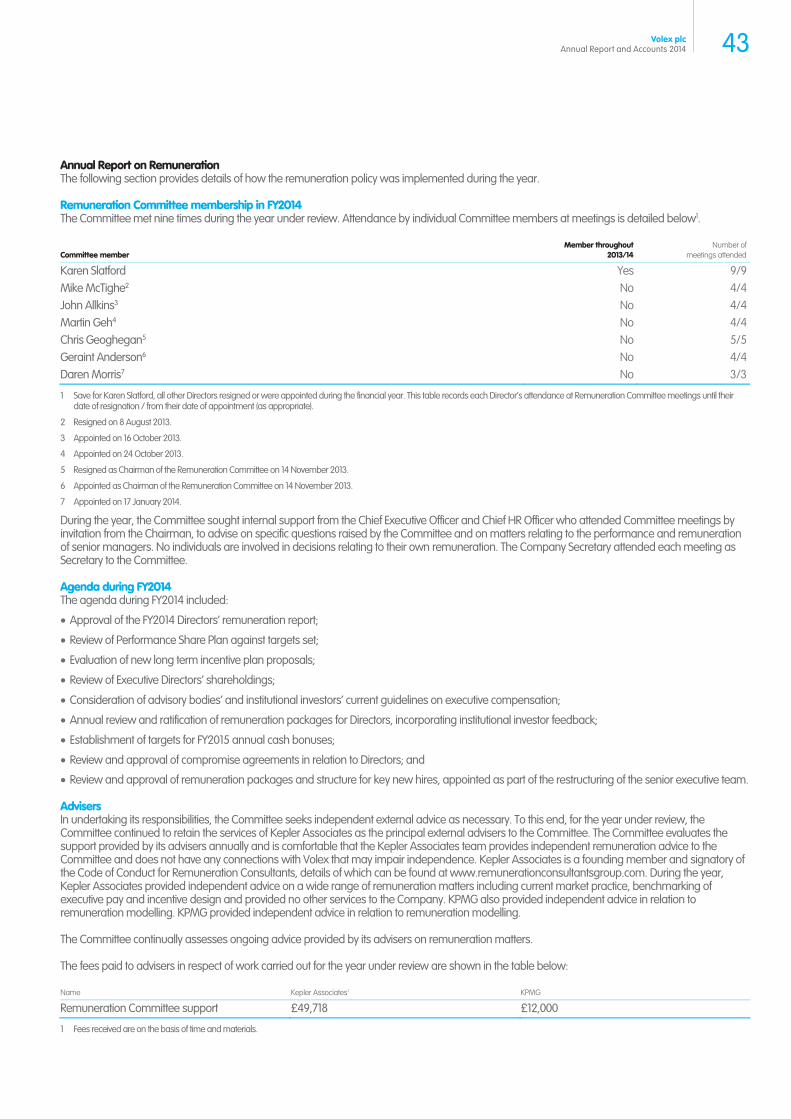
Annual Report on Remuneration The following section provides details of how the remuneration policy was implemented during the year.
Remuneration Committee membership in FY2014 The Committee met nine times during the year under review. Attendance by individual Committee members at meetings is detailed below1.
Committee member Member throughout
2013/14 Number of
meetings attended
Karen Slatford Yes 9/9Mike McTighe2 No 4/4John Allkins3 No 4/4Martin Geh4 No 4/4Chris Geoghegan5 No 5/5Geraint Anderson6 No 4/4Daren Morris7 No 3/3
1 Save for Karen Slatford, all other Directors resigned or were appointed during the financial year. This table records each Director’s attendance at Remuneration Committee meetings until their date of resignation / from their date of appointment (as appropriate).
2 Resigned on 8 August 2013.
3 Appointed on 16 October 2013.
4 Appointed on 24 October 2013.
5 Resigned as Chairman of the Remuneration Committee on 14 November 2013.
6 Appointed as Chairman of the Remuneration Committee on 14 November 2013.
7 Appointed on 17 January 2014.
During the year, the Committee sought internal support from the Chief Executive Officer and Chief HR Officer who attended Committee meetings by invitation from the Chairman, to advise on specific questions raised by the Committee and on matters relating to the performance and remuneration of senior managers. No individuals are involved in decisions relating to their own remuneration. The Company Secretary attended each meeting as Secretary to the Committee.
Agenda during FY2014 The agenda during FY2014 included:
Approval of the FY2014 Directors’ remuneration report;
Review of Performance Share Plan against targets set;
Evaluation of new long term incentive plan proposals;
Review of Executive Directors’ shareholdings;
Consideration of advisory bodies’ and institutional investors’ current guidelines on executive compensation;
Annual review and ratification of remuneration packages for Directors, incorporating institutional investor feedback;
Establishment of targets for FY2015 annual cash bonuses;
Review and approval of compromise agreements in relation to Directors; and
Review and approval of remuneration packages and structure for key new hires, appointed as part of the restructuring of the senior executive team.
Advisers In undertaking its responsibilities, the Committee seeks independent external advice as necessary. To this end, for the year under review, the Committee continued to retain the services of Kepler Associates as the principal external advisers to the Committee. The Committee evaluates the support provided by its advisers annually and is comfortable that the Kepler Associates team provides independent remuneration advice to the Committee and does not have any connections with Volex that may impair independence. Kepler Associates is a founding member and signatory of the Code of Conduct for Remuneration Consultants, details of which can be found at www.remunerationconsultantsgroup.com. During the year, Kepler Associates provided independent advice on a wide range of remuneration matters including current market practice, benchmarking of executive pay and incentive design and provided no other services to the Company. KPMG also provided independent advice in relation to remuneration modelling. KPMG provided independent advice in relation to remuneration modelling.
The Committee continually assesses ongoing advice provided by its advisers on remuneration matters.
The fees paid to advisers in respect of work carried out for the year under review are shown in the table below:
Name Kepler Associates1 KPMG
Remuneration Committee support £49,718 £12,000
1 Fees received are on the basis of time and materials.
43Volex plcAnnual Report and Accounts 2014
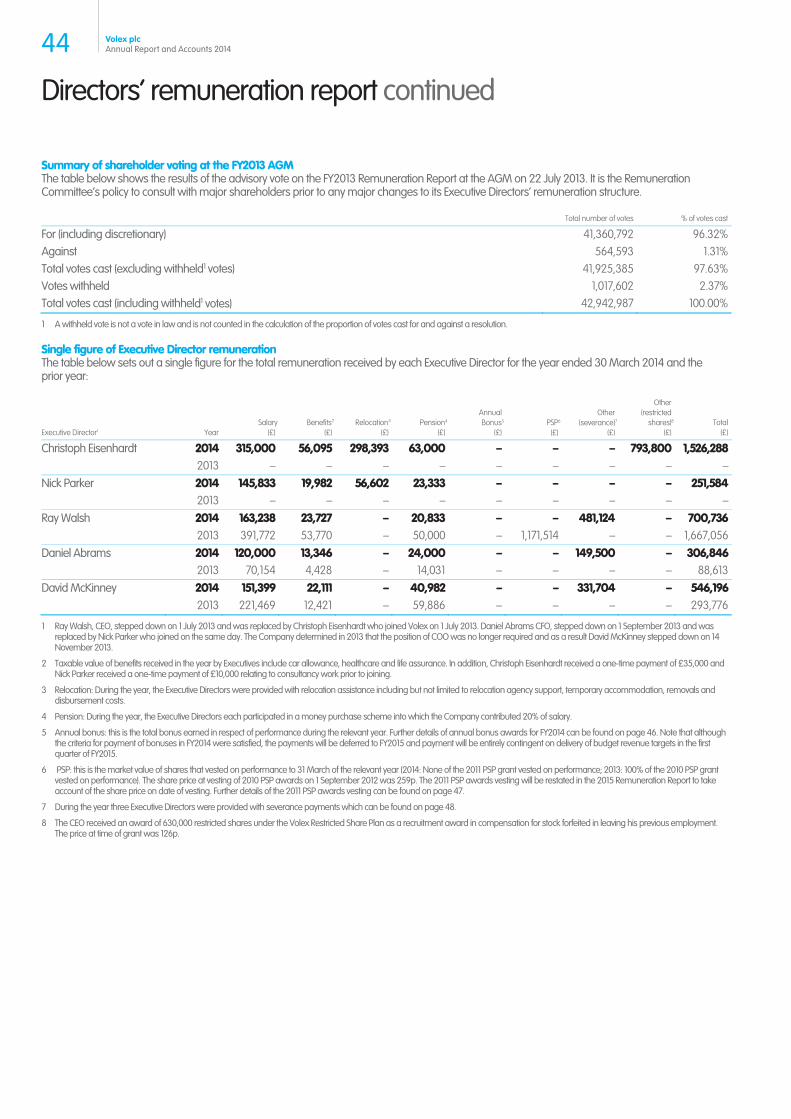
Directors’ remuneration report continued
Summary of shareholder voting at the FY2013 AGM The table below shows the results of the advisory vote on the FY2013 Remuneration Report at the AGM on 22 July 2013. It is the Remuneration Committee’s policy to consult with major shareholders prior to any major changes to its Executive Directors’ remuneration structure.
Total number of votes % of votes cast
For (including discretionary) 41,360,792 96.32%Against 564,593 1.31%Total votes cast (excluding withheld votes) 1 41,925,385 97.63%Votes withheld 1,017,602 2.37%Total votes cast (including withhel 42,942,987 100.00%
1 A withheld vote is not a vote in law and is not counted in the calculation of the proportion of votes cast for and against a resolution.
Single figure of Executive Director remuneration The table below sets out a single figure for the total remuneration received by each Executive Director for the year ended 30 March 2014 and the prior year:
Executive Director1 Year Salary
(£) Benefits
(£)Relocation
(£)Pension4
(£)
Annual Bonus5
(£)PSP6
(£)
Other (severance)7
(£)
Other (restricted
shares)8
(£)Total
(£)
Christoph Eisenhardt 2014 315,000 56,095 298,393 63,000 – – – 793,800 1,526,288 2013 – – – – – – – – –Nick Parker 2014 145,833 19,982 56,602 23,333 – – – – 251,584 2013 – – – – – – – – –Ray Walsh 2014 163,238 23,727 – 20,833 – – 481,124 – 700,736 2013 391,772 53,770 – 50,000 – 1,171,514 – – 1,667,056Daniel Abrams 2014 120,000 13,346 – 24,000 – – 149,500 – 306,846 2013 70,154 4,428 – 14,031 – – – – 88,613David McKinney 2014 151,399 22,111 – 40,982 – – 331,704 – 546,196 2013 221,469 12,421 – 59,886 – – – – 293,776
1 Ray Walsh, CEO, stepped down on 1 July 2013 and was replaced by Christoph Eisenhardt who joined Volex on 1 July 2013. Daniel Abrams CFO, stepped down on 1 September 2013 and was replaced by Nick Parker who joined on the same day. The Company determined in 2013 that the position of COO was no longer required and as a result David McKinney stepped down on 14 November 2013.
2 Taxable value of benefits received in the year by Executives include car allowance, healthcare and life assurance. In addition, Christoph Eisenhardt received a one-time payment of £35,000 and Nick Parker received a one-time payment of £10,000 relating to consultancy work prior to joining.
3 Relocation: During the year, the Executive Directors were provided with relocation assistance including but not limited to relocation agency support, temporary accommodation, removals and disbursement costs.
4 Pension: During the year, the Executive Directors each participated in a money purchase scheme into which the Company contributed 20% of salary.
5 Annual bonus: this is the total bonus earned in respect of performance during the relevant year. Further details of annual bonus awards for FY2014 can be found on page 46. Note that although the criteria for payment of bonuses in FY2014 were satisfied, the payments will be deferred to FY2015 and payment will be entirely contingent on delivery of budget revenue targets in the first quarter of FY2015.
6 PSP: this is the market value of shares that vested on performance to 31 March of the relevant year (2014: None of the 2011 PSP grant vested on performance; 2013: 100% of the 2010 PSP grant vested on performance). The share price at vesting of 2010 PSP awards on 1 September 2012 was 259p. The 2011 PSP awards vesting will be restated in the 2015 Remuneration Report to take account of the share price on date of vesting. Further details of the 2011 PSP awards vesting can be found on page 47.
7 During the year three Executive Directors were provided with severance payments which can be found on page 48.
8 The CEO received an award of 630,000 restricted shares under the Volex Restricted Share Plan as a recruitment award in compensation for stock forfeited in leaving his previous employment. The price at time of grant was 126p.
2 3
1d votes)
44 Volex plcAnnual Report and Accounts 2014
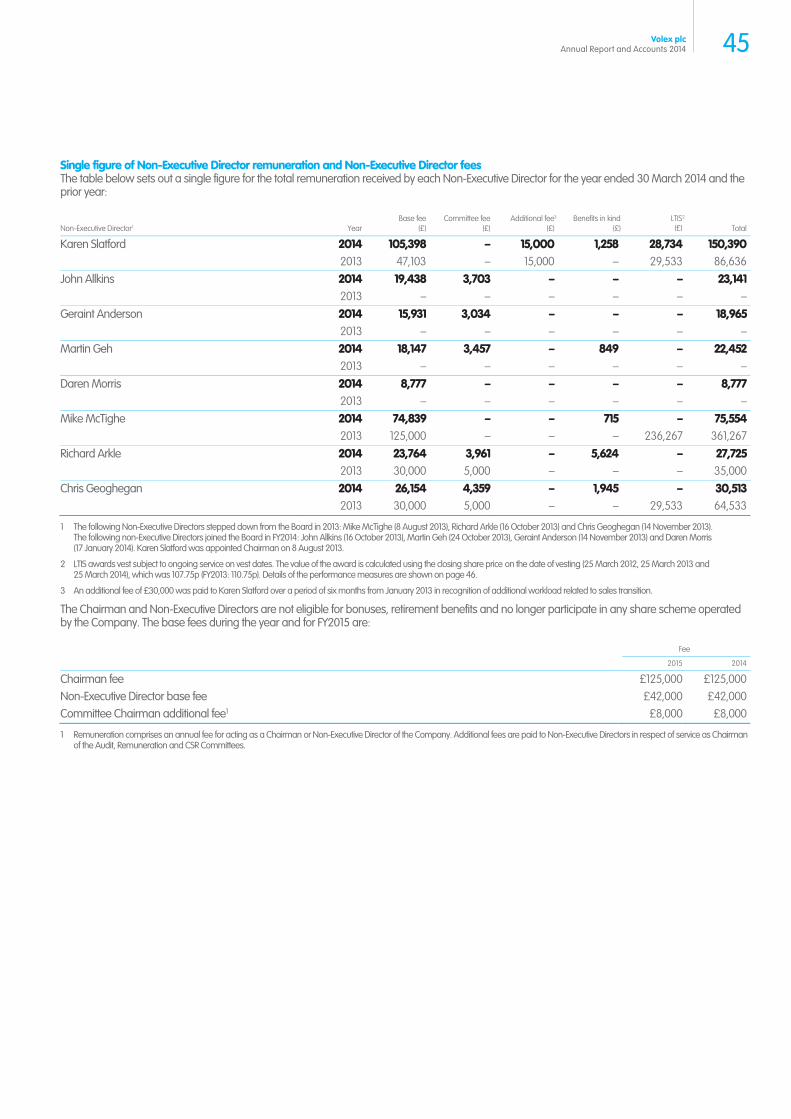
Single figure of Non-Executive Director remuneration and Non-Executive Director fees The table below sets out a single figure for the total remuneration received by each Non-Executive Director for the year ended 30 March 2014 and the prior year:
Non-Executive Director1 YearBase fee
(£)Committee fee
(£)Additional fee3
(£)Benefits in kind
(£) Total
Karen Slatford 2014 105,398 – 15,000 1,258 28,734 150,390 2013 47,103 – 15,000 – 29,533 86,636John Allkins 2014 19,438 3,703 – – – 23,141 2013 – – – – – –Geraint Anderson 2014 15,931 3,034 – – – 18,965 2013 – – – – – –Martin Geh 2014 18,147 3,457 – 849 – 22,452 2013 – – – – – –Daren Morris 2014 8,777 – – – – 8,777 2013 – – – – – –Mike McTighe 2014 74,839 – – 715 – 75,554 2013 125,000 – – – 236,267 361,267Richard Arkle 2014 23,764 3,961 – 5,624 – 27,725 2013 30,000 5,000 – – – 35,000Chris Geoghegan 2014 26,154 4,359 – 1,945 – 30,513 2013 30,000 5,000 – – 29,533 64,533
1 The following Non-Executive Directors stepped down from the Board in 2013: Mike McTighe (8 August 2013), Richard Arkle (16 October 2013) and Chris Geoghegan (14 November 2013). The following non-Executive Directors joined the Board in FY2014: John Allkins (16 October 2013), Martin Geh (24 October 2013), Geraint Anderson (14 November 2013) and Daren Morris (17 January 2014). Karen Slatford was appointed Chairman on 8 August 2013.
2 LTIS awards vest subject to ongoing service on vest dates. The value of the award is calculated using the closing share price on the date of vesting (25 March 2012, 25 March 2013 and 25 March 2014), which was 107.75p (FY2013: 110.75p). Details of the performance measures are shown on page 46.
3 An additional fee of £30,000 was paid to Karen Slatford over a period of six months from January 2013 in recognition of additional workload related to sales transition.
The Chairman and Non-Executive Directors are not eligible for bonuses, retirement benefits and no longer participate in any share scheme operated by the Company. The base fees during the year and for FY2015 are:
Fee
2015 2014
Chairman fee £125,000 £125,000Non-Executive Director base fee £42,000 £42,000Committee Chairman additional fee1 £8,000 £8,000
1 Remuneration comprises an annual fee for acting as a Chairman or Non-Executive Director of the Company. Additional fees are paid to Non-Executive Directors in respect of service as Chairman of the Audit, Remuneration and CSR Committees.
LTIS2
(£)
45Volex plcAnnual Report and Accounts 2014
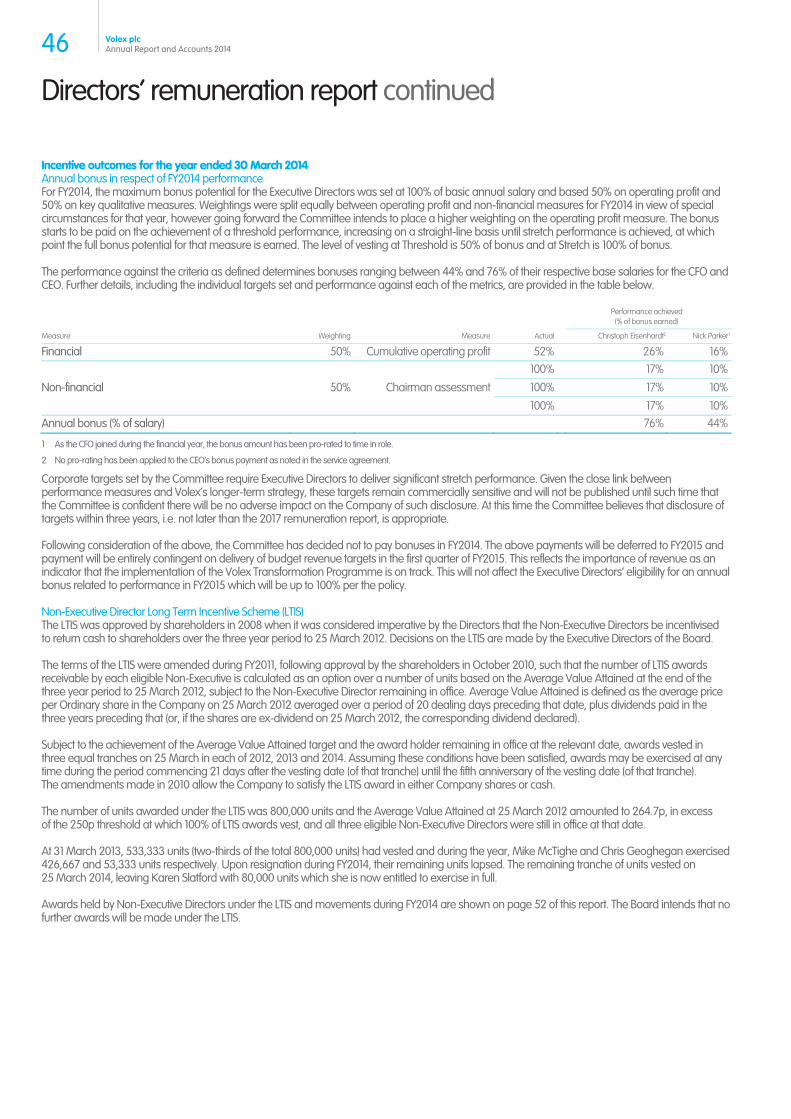
Directors’ remuneration report continued
Incentive outcomes for the year ended 30 March 2014 Annual bonus in respect of FY2014 performance For FY2014, the maximum bonus potential for the Executive Directors was set at 100% of basic annual salary and based 50% on operating profit and 50% on key qualitative measures. Weightings were split equally between operating profit and non-financial measures for FY2014 in view of special circumstances for that year, however going forward the Committee intends to place a higher weighting on the operating profit measure. The bonus starts to be paid on the achievement of a threshold performance, increasing on a straight-line basis until stretch performance is achieved, at which point the full bonus potential for that measure is earned. The level of vesting at Threshold is 50% of bonus and at Stretch is 100% of bonus.
The performance against the criteria as defined determines bonuses ranging between 44% and 76% of their respective base salaries for the CFO and CEO. Further details, including the individual targets set and performance against each of the metrics, are provided in the table below.
Performance achieved
(% of bonus earned)
Measure Weighting Measure Actual Christoph Eisenhardt2 Nick Parker1
Financial 50% Cumulative operating profit 52% 26% 16%
Non-financial 50% Chairman assessment
100% 17% 10%
100% 17% 10%
100% 17% 10%Annual bonus (% of salary) 76% 44%
1 As the CFO joined during the financial year, the bonus amount has been pro-rated to time in role.
2 No pro-rating has been applied to the CEO’s bonus payment as noted in the service agreement.
Corporate targets set by the Committee require Executive Directors to deliver significant stretch performance. Given the close link between performance measures and Volex’s longer-term strategy, these targets remain commercially sensitive and will not be published until such time that the Committee is confident there will be no adverse impact on the Company of such disclosure. At this time the Committee believes that disclosure of targets within three years, i.e. not later than the 2017 remuneration report, is appropriate.
Following consideration of the above, the Committee has decided not to pay bonuses in FY2014. The above payments will be deferred to FY2015 and payment will be entirely contingent on delivery of budget revenue targets in the first quarter of FY2015. This reflects the importance of revenue as an indicator that the implementation of the Volex Transformation Programme is on track. This will not affect the Executive Directors’ eligibility for an annual bonus related to performance in FY2015 which will be up to 100% per the policy.
Non-Executive Director Long Term Incentive Scheme (LTIS) The LTIS was approved by shareholders in 2008 when it was considered imperative by the Directors that the Non-Executive Directors be incentivised to return cash to shareholders over the three year period to 25 March 2012. Decisions on the LTIS are made by the Executive Directors of the Board.
The terms of the LTIS were amended during FY2011, following approval by the shareholders in October 2010, such that the number of LTIS awards receivable by each eligible Non-Executive is calculated as an option over a number of units based on the Average Value Attained at the end of the three year period to 25 March 2012, subject to the Non-Executive Director remaining in office. Average Value Attained is defined as the average price per Ordinary share in the Company on 25 March 2012 averaged over a period of 20 dealing days preceding that date, plus dividends paid in the three years preceding that (or, if the shares are ex-dividend on 25 March 2012, the corresponding dividend declared).
Subject to the achievement of the Average Value Attained target and the award holder remaining in office at the relevant date, awards vested in three equal tranches on 25 March in each of 2012, 2013 and 2014. Assuming these conditions have been satisfied, awards may be exercised at any time during the period commencing 21 days after the vesting date (of that tranche) until the fifth anniversary of the vesting date (of that tranche). The amendments made in 2010 allow the Company to satisfy the LTIS award in either Company shares or cash.
The number of units awarded under the LTIS was 800,000 units and the Average Value Attained at 25 March 2012 amounted to 264.7p, in excess of the 250p threshold at which 100% of LTIS awards vest, and all three eligible Non-Executive Directors were still in office at that date.
At 31 March 2013, 533,333 units (two-thirds of the total 800,000 units) had vested and during the year, Mike McTighe and Chris Geoghegan exercised 426,667 and 53,333 units respectively. Upon resignation during FY2014, their remaining units lapsed. The remaining tranche of units vested on 25 March 2014, leaving Karen Slatford with 80,000 units which she is now entitled to exercise in full.
Awards held by Non-Executive Directors under the LTIS and movements during FY2014 are shown on page 52 of this report. The Board intends that no further awards will be made under the LTIS.
46 Volex plcAnnual Report and Accounts 2014
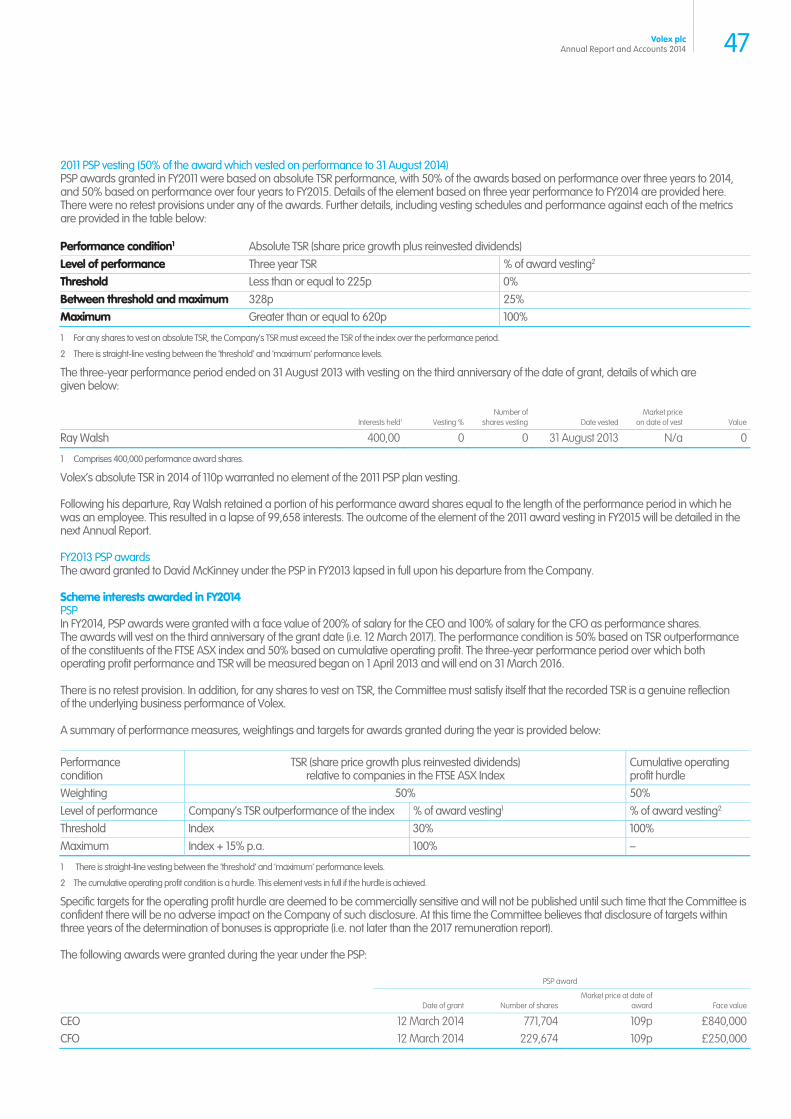
2011 PSP vesting (50% of the award which vested on performance to 31 August 2014) PSP awards granted in FY2011 were based on absolute TSR performance, with 50% of the awards based on performance over three years to 2014, and 50% based on performance over four years to FY2015. Details of the element based on three year performance to FY2014 are provided here. There were no retest provisions under any of the awards. Further details, including vesting schedules and performance against each of the metrics are provided in the table below:
Performance condition1 Absolute TSR (share price growth plus reinvested dividends) Level of performance Three year TSR % of award vesting2 Threshold Less than or equal to 225p 0% Between threshold and maximum 328p 25% Maximum Greater than or equal to 620p 100%
1 For any shares to vest on absolute TSR, the Company’s TSR must exceed the TSR of the index over the performance period.
2 There is straight-line vesting between the ‘threshold’ and ‘maximum’ performance levels.
The three-year performance period ended on 31 August 2013 with vesting on the third anniversary of the date of grant, details of which are given below:
Interests held1 Vesting %Number of
shares vesting Date vested Market price
on date of vest Value
Ray Walsh 400,00 0 0 31 August 2013 N/a 0
1 Comprises 400,000 performance award shares.
Volex’s absolute TSR in 2014 of 110p warranted no element of the 2011 PSP plan vesting.
Following his departure, Ray Walsh retained a portion of his performance award shares equal to the length of the performance period in which he was an employee. This resulted in a lapse of 99,658 interests. The outcome of the element of the 2011 award vesting in FY2015 will be detailed in the next Annual Report.
FY2013 PSP awards The award granted to David McKinney under the PSP in FY2013 lapsed in full upon his departure from the Company.
Scheme interests awarded in FY2014 PSP In FY2014, PSP awards were granted with a face value of 200% of salary for the CEO and 100% of salary for the CFO as performance shares. The awards will vest on the third anniversary of the grant date (i.e. 12 March 2017). The performance condition is 50% based on TSR outperformance of the constituents of the FTSE ASX index and 50% based on cumulative operating profit. The three-year performance period over which both operating profit performance and TSR will be measured began on 1 April 2013 and will end on 31 March 2016.
There is no retest provision. In addition, for any shares to vest on TSR, the Committee must satisfy itself that the recorded TSR is a genuine reflection of the underlying business performance of Volex.
A summary of performance measures, weightings and targets for awards granted during the year is provided below:
Performance condition
TSR (share price growth plus reinvested dividends) relative to companies in the FTSE ASX Index
Cumulative operating profit hurdle
Weighting 50% 50% Level of performance Company’s TSR outperformance of the index % of award vesting1 % of award vesting2 Threshold Index 30% 100% Maximum Index + 15% p.a. 100% –
1 There is straight-line vesting between the ‘threshold’ and ‘maximum’ performance levels.
2 The cumulative operating profit condition is a hurdle. This element vests in full if the hurdle is achieved.
Specific targets for the operating profit hurdle are deemed to be commercially sensitive and will not be published until such time that the Committee is confident there will be no adverse impact on the Company of such disclosure. At this time the Committee believes that disclosure of targets within three years of the determination of bonuses is appropriate (i.e. not later than the 2017 remuneration report).
The following awards were granted during the year under the PSP:
PSP award
Date of grant Number of sharesMarket price at date of
award Face value
CEO 12 March 2014 771,704 109p £840,000CFO 12 March 2014 229,674 109p £250,000
47Volex plcAnnual Report and Accounts 2014
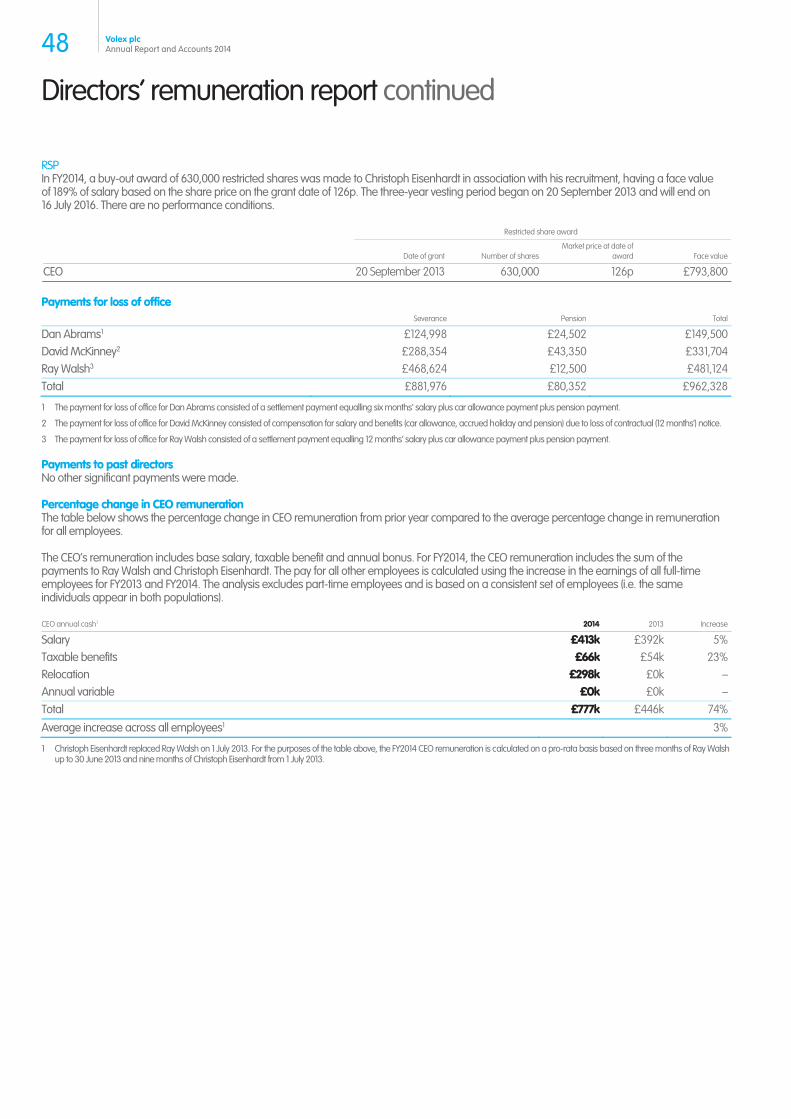
Directors’ remuneration report continued
RSP In FY2014, a buy-out award of 630,000 restricted shares was made to Christoph Eisenhardt in association with his recruitment, having a face value of 189% of salary based on the share price on the grant date of 126p. The three-year vesting period began on 20 September 2013 and will end on 16 July 2016. There are no performance conditions.
Restricted share award
Date of grant Number of sharesMarket price at date of
award Face value
CEO 20 September 2013 630,000 126p £793,800
Payments for loss of office Severance Pension Total
Dan Abrams1 £124,998 £24,502 £149,500David McKinney2 £288,354 £43,350 £331,704Ray Walsh3 £468,624 £12,500 £481,124Total £881,976 £80,352 £962,328
1 The payment for loss of office for Dan Abrams consisted of a settlement payment equalling six months’ salary plus car allowance payment plus pension payment.
2 The payment for loss of office for David McKinney consisted of compensation for salary and benefits (car allowance, accrued holiday and pension) due to loss of contractual (12 months’) notice.
3 The payment for loss of office for Ray Walsh consisted of a settlement payment equalling 12 months’ salary plus car allowance payment plus pension payment.
Payments to past directors No other significant payments were made.
Percentage change in CEO remuneration The table below shows the percentage change in CEO remuneration from prior year compared to the average percentage change in remuneration for all employees.
The CEO’s remuneration includes base salary, taxable benefit and annual bonus. For FY2014, the CEO remuneration includes the sum of the payments to Ray Walsh and Christoph Eisenhardt. The pay for all other employees is calculated using the increase in the earnings of all full-time employees for FY2013 and FY2014. The analysis excludes part-time employees and is based on a consistent set of employees (i.e. the same individuals appear in both populations).
CEO annual cash1 2014 2013 Increase
Salary £413k £392k 5%Taxable benefits £66k £54k 23%Relocation £298k £0k –Annual variable £0k £0k –Total £777k £446k 74%
Average increase across all employees1 3%
1 Christoph Eisenhardt replaced Ray Walsh on 1 July 2013. For the purposes of the table above, the FY2014 CEO remuneration is calculated on a pro-rata basis based on three months of Ray Walsh up to 30 June 2013 and nine months of Christoph Eisenhardt from 1 July 2013.
48 Volex plcAnnual Report and Accounts 2014
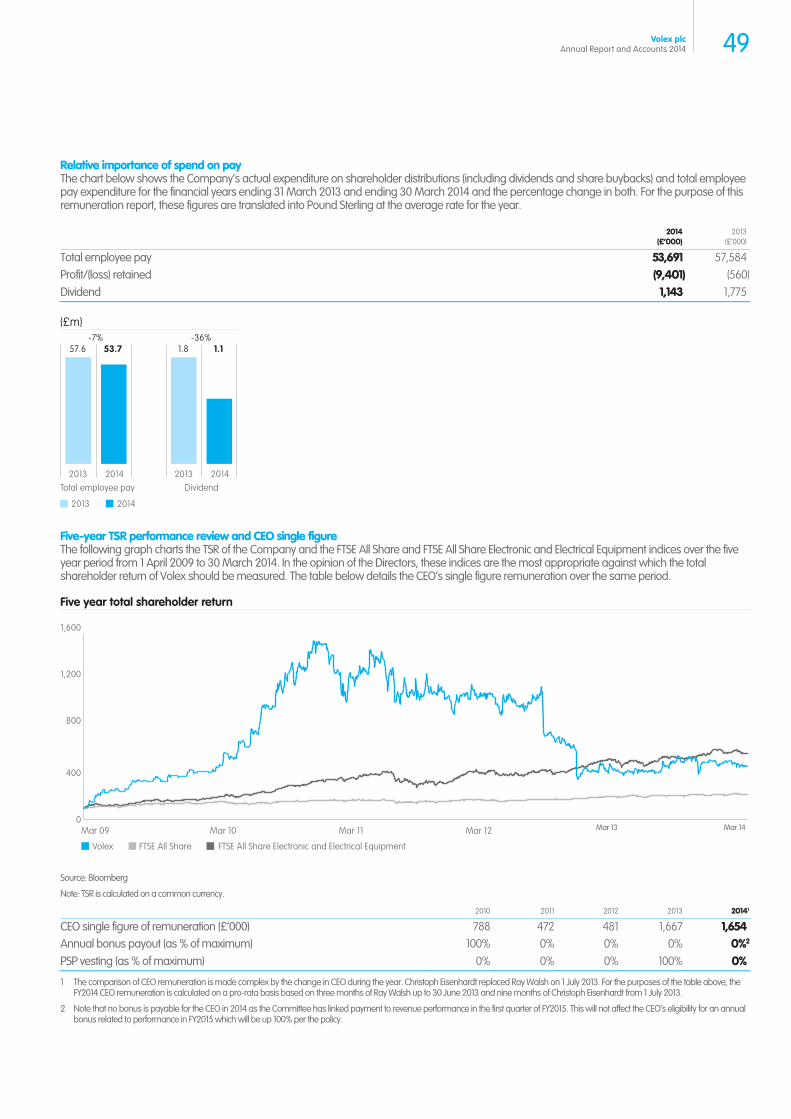
Relative importance of spend on pay The chart below shows the Company’s actual expenditure on shareholder distributions (including dividends and share buybacks) and total employee pay expenditure for the financial years ending 31 March 2013 and ending 30 March 2014 and the percentage change in both. For the purpose of this remuneration report, these figures are translated into Pound Sterling at the average rate for the year.
2014
(£’000)2013
(£’000)
Total employee pay 53,691 57,584Profit/(loss) retained (9,401) (560)Dividend 1,143 1,775
Five-year TSR performance review and CEO single figure The following graph charts the TSR of the Company and the FTSE All Share and FTSE All Share Electronic and Electrical Equipment indices over the five year period from 1 April 2009 to 30 March 2014. In the opinion of the Directors, these indices are the most appropriate against which the total shareholder return of Volex should be measured. The table below details the CEO’s single figure remuneration over the same period.
Source: Bloomberg
Note: TSR is calculated on a common currency.
2010 2011 2012 2013 20141
CEO single figure of remuneration (£’000) 788 472 481 1,667 1,654Annual bonus payout (as % of maximum) 100% 0% 0% 0% 0%2
PSP vesting (as % of maximum) 0% 0% 0% 100% 0%
1 The comparison of CEO remuneration is made complex by the change in CEO during the year. Christoph Eisenhardt replaced Ray Walsh on 1 July 2013. For the purposes of the table above, the FY2014 CEO remuneration is calculated on a pro-rata basis based on three months of Ray Walsh up to 30 June 2013 and nine months of Christoph Eisenhardt from 1 July 2013.
2 Note that no bonus is payable for the CEO in 2014 as the Committee has linked payment to revenue performance in the first quarter of FY2015. This will not affect the CEO’s eligibility for an annual bonus related to performance in FY2015 which will be up 100% per the policy.
0
400
800
1,200
1,600
Mar 09 Mar 10 Mar 11 Mar 12 Mar 14Mar 13
Five year total shareholder return
Volex FTSE All Share Electronic and Electrical EquipmentFTSE All Share
(£m)
2014
1.1
2013
1.8
20142013
2014
53.7
2013DividendTotal employee pay
57.6-36%-7%
49Volex plcAnnual Report and Accounts 2014
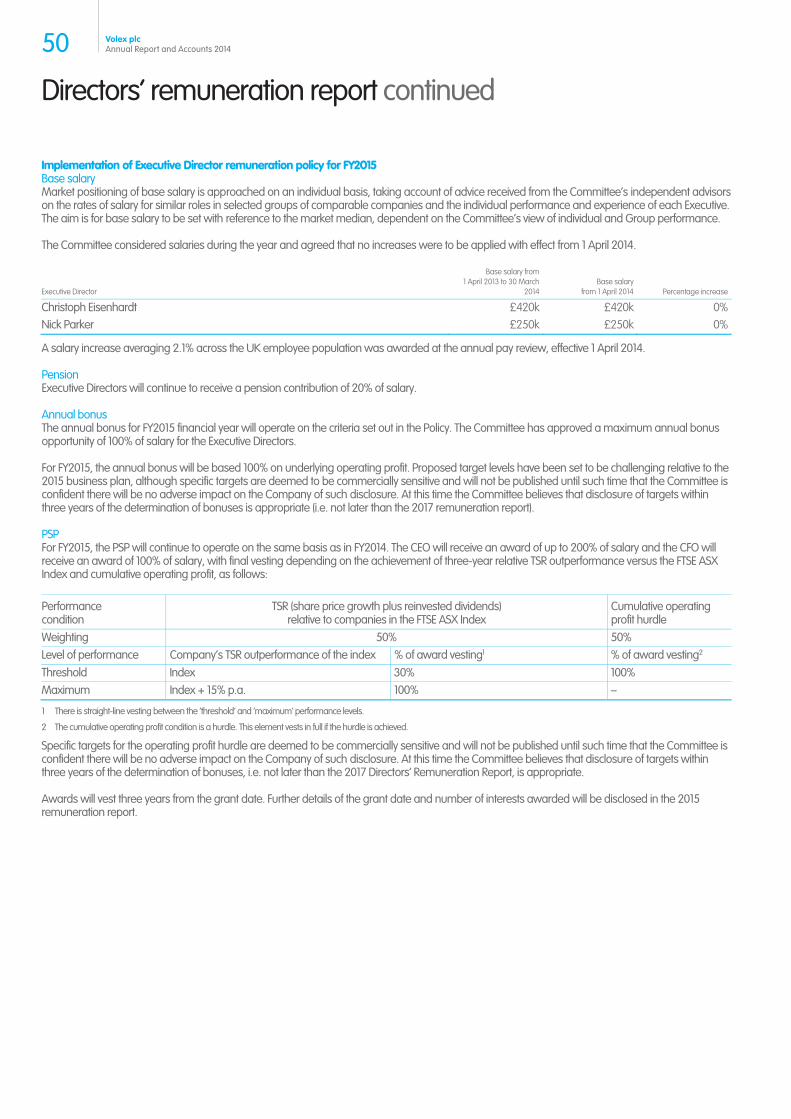
Directors’ remuneration report continued
Implementation of Executive Director remuneration policy for FY2015 Base salary Market positioning of base salary is approached on an individual basis, taking account of advice received from the Committee’s independent advisors on the rates of salary for similar roles in selected groups of comparable companies and the individual performance and experience of each Executive. The aim is for base salary to be set with reference to the market median, dependent on the Committee’s view of individual and Group performance.
The Committee considered salaries during the year and agreed that no increases were to be applied with effect from 1 April 2014.
Executive Director
Base salary from 1 April 2013 to 30 March
2014Base salary
from 1 April 2014 Percentage increase
Christoph Eisenhardt £420k £420k 0%Nick Parker £250k £250k 0%
A salary increase averaging 2.1% across the UK employee population was awarded at the annual pay review, effective 1 April 2014.
Pension Executive Directors will continue to receive a pension contribution of 20% of salary.
Annual bonus The annual bonus for FY2015 financial year will operate on the criteria set out in the Policy. The Committee has approved a maximum annual bonus opportunity of 100% of salary for the Executive Directors.
For FY2015, the annual bonus will be based 100% on underlying operating profit. Proposed target levels have been set to be challenging relative to the 2015 business plan, although specific targets are deemed to be commercially sensitive and will not be published until such time that the Committee is confident there will be no adverse impact on the Company of such disclosure. At this time the Committee believes that disclosure of targets within three years of the determination of bonuses is appropriate (i.e. not later than the 2017 remuneration report).
PSP For FY2015, the PSP will continue to operate on the same basis as in FY2014. The CEO will receive an award of up to 200% of salary and the CFO will receive an award of 100% of salary, with final vesting depending on the achievement of three-year relative TSR outperformance versus the FTSE ASX Index and cumulative operating profit, as follows:
Performance condition
TSR (share price growth plus reinvested dividends) relative to companies in the FTSE ASX Index
Cumulative operating profit hurdle
Weighting 50% 50% Level of performance Company’s TSR outperformance of the index % of award vesting1 % of award vesting2 Threshold Index 30% 100% Maximum Index + 15% p.a. 100% –
1 There is straight-line vesting between the ‘threshold’ and ‘maximum’ performance levels.
2 The cumulative operating profit condition is a hurdle. This element vests in full if the hurdle is achieved.
Specific targets for the operating profit hurdle are deemed to be commercially sensitive and will not be published until such time that the Committee is confident there will be no adverse impact on the Company of such disclosure. At this time the Committee believes that disclosure of targets within three years of the determination of bonuses, i.e. not later than the 2017 Directors’ Remuneration Report, is appropriate.
Awards will vest three years from the grant date. Further details of the grant date and number of interests awarded will be disclosed in the 2015 remuneration report.
50 Volex plcAnnual Report and Accounts 2014
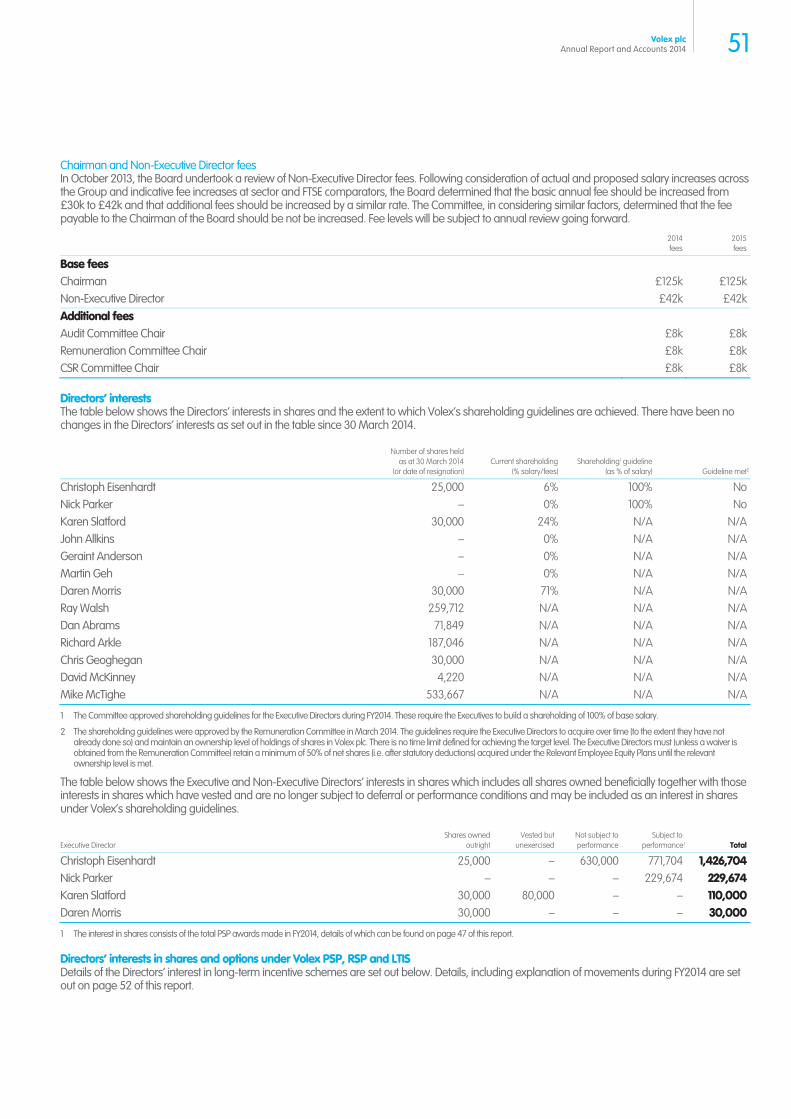
Chairman and Non-Executive Director fees In October 2013, the Board undertook a review of Non-Executive Director fees. Following consideration of actual and proposed salary increases across the Group and indicative fee increases at sector and FTSE comparators, the Board determined that the basic annual fee should be increased from £30k to £42k and that additional fees should be increased by a similar rate. The Committee, in considering similar factors, determined that the fee payable to the Chairman of the Board should be not be increased. Fee levels will be subject to annual review going forward.
2014fees
2015fees
Base fees Chairman £125k £125kNon-Executive Director £42k £42kAdditional fees Audit Committee Chair £8k £8kRemuneration Committee Chair £8k £8kCSR Committee Chair £8k £8k
Directors’ interests The table below shows the Directors’ interests in shares and the extent to which Volex’s shareholding guidelines are achieved. There have been no changes in the Directors’ interests as set out in the table since 30 March 2014.
Number of shares held as at 30 March 2014
(or date of resignation)Current shareholding
(% salary/fees)Shareholding1 guideline
(as % of salary) Guideline met2
Christoph Eisenhardt 25,000 6% 100% NoNick Parker – 0% 100% NoKaren Slatford 30,000 24% N/A N/AJohn Allkins – 0% N/A N/AGeraint Anderson – 0% N/A N/AMartin Geh – 0% N/A N/ADaren Morris 30,000 71% N/A N/ARay Walsh 259,712 N/A N/A N/ADan Abrams 71,849 N/A N/A N/ARichard Arkle 187,046 N/A N/A N/AChris Geoghegan 30,000 N/A N/A N/ADavid McKinney 4,220 N/A N/A N/AMike McTighe 533,667 N/A N/A N/A
1 The Committee approved shareholding guidelines for the Executive Directors during FY2014. These require the Executives to build a shareholding of 100% of base salary.
2 The shareholding guidelines were approved by the Remuneration Committee in March 2014. The guidelines require the Executive Directors to acquire over time (to the extent they have not already done so) and maintain an ownership level of holdings of shares in Volex plc. There is no time limit defined for achieving the target level. The Executive Directors must (unless a waiver is obtained from the Remuneration Committee) retain a minimum of 50% of net shares (i.e. after statutory deductions) acquired under the Relevant Employee Equity Plans until the relevant ownership level is met.
The table below shows the Executive and Non-Executive Directors’ interests in shares which includes all shares owned beneficially together with those interests in shares which have vested and are no longer subject to deferral or performance conditions and may be included as an interest in shares under Volex’s shareholding guidelines.
Executive Director Shares owned
outrightVested but
unexercisedNot subject to performance
Subject to performance1 Total
Christoph Eisenhardt 25,000 – 630,000 771,704 1,426,704Nick Parker – – – 229,674 229,674Karen Slatford 30,000 80,000 – – 110,000Daren Morris 30,000 – – – 30,000
1 The interest in shares consists of the total PSP awards made in FY2014, details of which can be found on page 47 of this report.
Directors’ interests in shares and options under Volex PSP, RSP and LTIS Details of the Directors’ interest in long-term incentive schemes are set out below. Details, including explanation of movements during FY2014 are set out on page 52 of this report.
51Volex plcAnnual Report and Accounts 2014
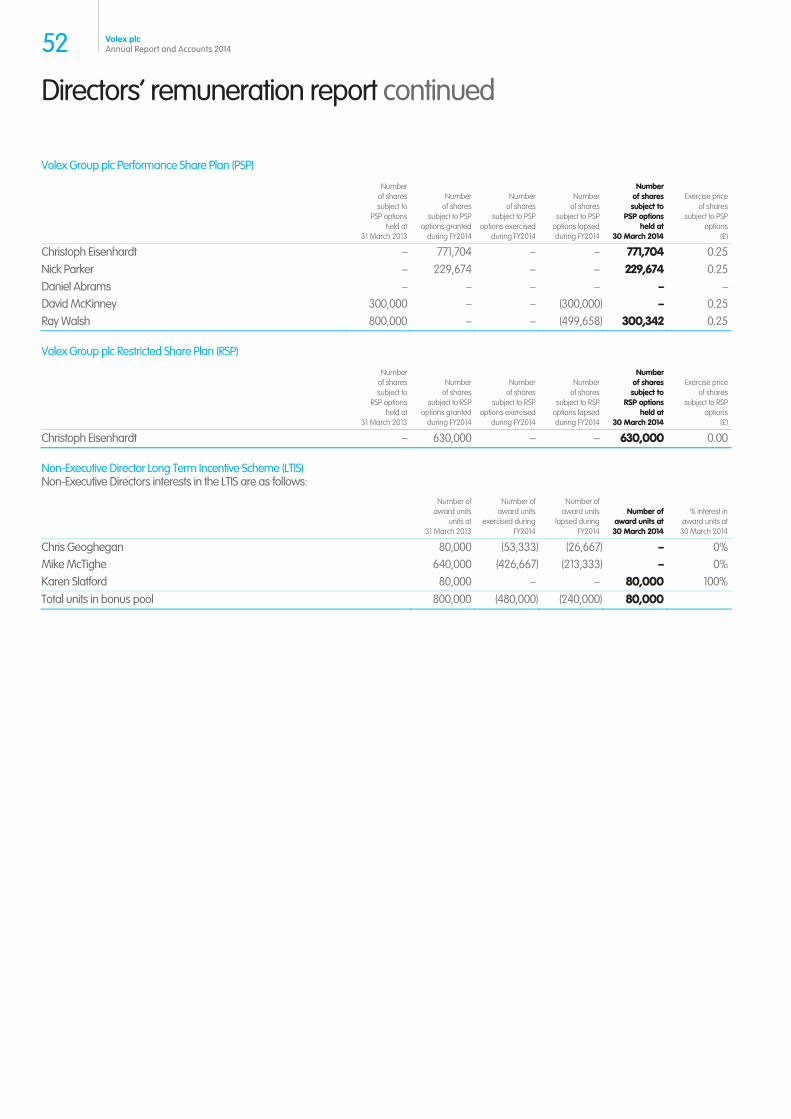
Directors’ remuneration report continued
Volex Group plc Performance Share Plan (PSP)
Numberof sharessubject to
PSP optionsheld at
31 March 2013
Numberof shares
subject to PSPoptions granted
during FY2014
Numberof shares
subject to PSPoptions exercised
during FY2014
Number of shares
subject to PSP options lapsed during FY2014
Number of sharessubject to
PSP optionsheld at
30 March 2014
Exercise priceof shares
subject to PSPoptions
(£)
Christoph Eisenhardt – 771,704 – – 771,704 0.25Nick Parker – 229,674 – – 229,674 0.25Daniel Abrams – – – – – –David McKinney 300,000 – – (300,000) – 0.25Ray Walsh 800,000 – – (499,658) 300,342 0.25
Volex Group plc Restricted Share Plan (RSP)
Numberof sharessubject to
RSP optionsheld at
31 March 2013
Numberof shares
subject to RSPoptions granted
during FY2014
Numberof shares
subject to RSPoptions exercised
during FY2014
Number of shares
subject to RSP options lapsed during FY2014
Number of sharessubject to
RSP optionsheld at
30 March 2014
Exercise priceof shares
subject to RSPoptions
(£)
Christoph Eisenhardt – 630,000 – – 630,000 0.00
Non-Executive Director Long Term Incentive Scheme (LTIS) Non-Executive Directors interests in the LTIS are as follows:
Number of award units
units at31 March 2013
Number of award units
exercised duringFY2014
Number of award units
lapsed during FY2014
Number ofaward units at30 March 2014
% interest inaward units at
30 March 2014
Chris Geoghegan 80,000 (53,333) (26,667) – 0%Mike McTighe 640,000 (426,667) (213,333) – 0%Karen Slatford 80,000 – – 80,000 100%Total units in bonus pool 800,000 (480,000) (240,000) 80,000
52 Volex plcAnnual Report and Accounts 2014
Directors’ report
Statement of the Directors’ responsibilities The Directors of Volex plc (the ‘Company’) are responsible for preparing the Annual Report, the Directors’ Remuneration Report and the financial statements in accordance with applicable law and regulations.
Company law requires the Directors to prepare financial statements for each financial year. Under that law the Directors have prepared the Group and parent Company financial statements in accordance with International Financial Reporting Standards (‘IFRSs’) as adopted by the European Union. In preparing these financial statements, the Directors have also elected to comply with IFRSs, issued by the International Accounting Standards Board (‘IASB’). Under company law the Directors must not approve the financial statements unless they are satisfied that they give a true and fair view of the state of affairs of the Group and the Company and of the profit or loss of the Group and Company for that period. In preparing these financial statements, the Directors are required to:
Select suitable accounting policies and then apply them consistently;
Make judgements and accounting estimates that are reasonable and prudent;
State whether applicable IFRSs as adopted by the European Union and IFRSs issued by IASB have been followed, subject to any material departures disclosed and explained in the financial statements; and
Prepare the financial statements on the going concern basis unless it is inappropriate to presume that the Company will continue in business.
The Directors are responsible for keeping adequate accounting records that are sufficient to show and explain the Company’s transactions and disclose with reasonable accuracy at any time the financial position of the Company and the Group and enable them to ensure that the financial statements and the Directors’ remuneration report comply with the Companies Act 2006 and, as regards the Group financial statements, Article 4 of the IAS Regulation. They are also responsible for safeguarding the assets of the Company and the Group and hence for taking reasonable steps for the prevention and detection of fraud and other irregularities.
The Directors are responsible for the maintenance and integrity of the Company’s website. Legislation in the United Kingdom governing the preparation and dissemination of financial statements may differ from legislation in other jurisdictions.
The Directors consider that the Annual Report and Accounts, taken as a whole, is fair, balanced and understandable and provides the information necessary for shareholders to assess the Company’s performance, business model and strategy.
Each of the Directors, whose names and functions are listed on pages 26 and 27, confirm that, to the best of their knowledge:
The Group financial statements, which have been prepared in accordance with IFRSs as adopted by the EU, give a true and fair view of the assets, liabilities, financial position and profit loss of the Group;
The Strategic Report includes a fair review of the development and performance of the business and the position of the Group, together with a description of the principal risks and uncertainties that it faces; and
The annual report and financial statements, taken as a whole, are fair, balanced and understandable and provide the information necessary for shareholders to assess the Group’s performance, business model and strategy.
By order of the Board
Christoph Eisenhardt Nick Parker Chief Executive Officer Chief Financial Officer
53Volex plcAnnual Report and Accounts 2014
Directors’ report continued
The Directors of the Company present their report for the year ended 30 March 2014. Certain information required for disclosure in this report is provided in other appropriate sections of the Annual Report and Accounts. These include the Corporate Governance report, the Directors’ remuneration report, the Strategic report and the Financial Statements and notes to those financial statements and accordingly these are incorporated into this report by reference.
Results and dividend Results for the year ended 30 March 2014 are set out in the consolidated income statement on page 62.
As approved at the 2013 Annual General Meeting, the Company operates a scrip dividend scheme which, at the Directors’ discretion, gives shareholders the right to elect to receive fully paid Ordinary shares in place of cash dividends. The scheme is effective until 21 July 2018. Details of the scheme are set out in note 11 to the financial statements on page 81. The Board is not recommending payment of a final dividend for the 52 weeks ended 30 March 2014.
Post balance sheet events The Group intends to issue 24,067,171 new shares for a gross consideration of $30.3 million post year end. The issuance of these shares will be subject only to approval by a simple majority of those voting at a general meeting on 1 July 2014.
The Group has irrevocable commitments to vote in favour of the resolution to issue the shares at that meeting from shareholders holding 26% of the Group’s share capital.
Directors The Directors who served throughout the year are as follows:
Executive Director Non-Executive Directors
Christoph Eisenhardt1 Karen Slatford Nick Parker2 John Allkins3 Daniel Abrams4 Geraint Anderson5 David McKinney6 Martin Geh7 Ray Walsh8 Daren Morris9 Richard Arkle10 Chris Geoghegan11 Mike McTighe12
1 Appointed to the Board on 1 July 2013.
2 Appointed to the Board on 1 September 2013.
3 Appointed to the Board on 16 October 2013.
4 Stepped down on 1 September 2013.
5 Appointed to the Board on 14 November 2013.
6 Stepped down on 14 November 2013.
7 Appointed to the Board on 24 October 2013.
8 Stepped down on 1 July 2013.
9 Appointed to the Board on 17 January 2014.
10 Stepped down on 16 October 2013.
11 Stepped down on 14 November 2013.
12 Stepped down on 8 August 2013.
Biographical details of the Directors currently serving on the Board and their dates of appointment are set out on pages 26 and 27.
Having been appointed as Directors since the 2013 Annual General Meeting, the Company’s Articles of Association require (i) Nick Parker, (ii) John Allkins, (iii) Martin Geh, (iv) Geraint Anderson and (v) Daren Morris to seek election at the 2014 Annual General Meeting. In accordance with the Company’s Articles of Association, Karen Slatford will retire by rotation and put herself forward for re-election at the forthcoming Annual General Meeting.
Powers of Directors The Directors may exercise all the powers of the Company, subject to any restrictions in the Company’s Articles of Association, any relevant legislation and any directions given by the Company by passing a special resolution at a general meeting.
In particular, the Directors may exercise all the powers of the Company to borrow money, subject to the limitation that the aggregate amount of all moneys borrowed by the Group and owing to persons outside the Group, shall not, without the sanction of an ordinary resolution of the Company, exceed an amount equal to three times the aggregate of the Group’s capital and reserves calculated in the manner prescribed by the Company’s Articles of Association.
Appointment and replacement of Directors The Company’s approach to the appointment and replacement of Directors is governed by its Articles of Association (together with relevant legislation).
Directors shall be no less than three and no more than fifteen in number. Directors may be appointed by the Company by ordinary resolution or by the Board of Directors.
At each Annual General Meeting, all Directors who (i) were appointed by the Board since the last Annual General Meeting, (ii) held office at the time of the two preceding Annual General Meetings and who did not retire at either of them, or (iii) have held office (other than employment or executive office) for a continuous period of nine years or more, shall automatically retire.
54 Volex plcAnnual Report and Accounts 2014
At the meeting at which the Director retires, the members may pass an ordinary resolution to fill the office being vacated by electing the retiring Director or some other person eligible for appointment to that office. In default, the retiring Director shall be deemed to have been elected or re-elected (as the case may be) unless (i) it is expressly resolved at the meeting not to fill the vacated office or the resolution of such election or re-election is put to the meeting and lost, or (ii) such Director has given notice that he or she is unwilling to be elected or re-elected, or (iii) the procedural requirements set out in the Company’s Articles of Association are contravened.
The Company may, by ordinary resolution, remove any Directors before the expiration of his or her term of office.
As set out in the Company’s Articles of Association, there are also circumstances where a Director will immediately cease to hold office. These circumstances include where he or she is prohibited by law from being or acting as a Director or where a Director has been made bankrupt.
Directors’ indemnities and insurance In accordance with the Companies Act 2006 and the Company’s Articles of Association, the Company has purchased Directors and Officers Liability Insurance which remains in place at the date of this report. The Company reviews its insurance policies on an annual basis in order to satisfy itself that its level of cover remains adequate.
Directors’ share interests The number of Ordinary shares of the Company in which the Directors are beneficially interested at 30 March 2014 is set out in the Directors’ Remuneration Report on page 51.
Three have been no changes in any of the Directors’ interests between the year end and 12 June 2014.
Articles of Association Any amendments to the Articles of Association of the Company may be made by special resolution of the shareholders.
Share capital Details of the Company’s share capital are set out in note 23 to the financial statements. The Company’s share capital consists of one class of Ordinary shares which do not carry rights to fixed income. As at 30 March 2014, there were 66,184,721 ordinary shares of 25p each in issue.
At the 2013 Annual General Meeting, the Directors were given the power to allot shares up to an amount of £5.2 million, being approximately one third of the issued share capital of the Company as at 18 June 2013, with an additional power to allot shares up to an amount of £5.2 million in connection with a rights issue.
During the year the Company issued new shares on three separate occasions:
14 August 2013: 426,667 ordinary shares of 25 pence each were issued to satisfy a vesting under the Volex Group plc Non-Executive Director Long-Term Incentive Scheme;
17 October 2013: 566,467 ordinary shares of 25 pence each were issued following the scrip dividend scheme where 125 shareholders (with a combined holding of 34,221,826 ordinary shares of 25 pence each) elected to receive a final dividend in ordinary shares rather than cash; and
13 December 2013: 2,698,009 ordinary shares of 25 pence each were issued following a placing to raise capital of approximately £3.1 million ($4.8 million).
A new authority to allot shares will be sought at the forthcoming Annual General Meeting.
Voting rights Ordinary shareholders are entitled to receive notice and to attend and speak at general meetings. Each shareholder present in person or by proxy (or by duly authorised corporate representative) shall, on a show of hands, have one vote. On a poll, each shareholder present in person or by proxy shall have one vote for each share held.
Restrictions on transfer of shares Other than the general provisions of the Articles of Association (and prevailing legislation) there are no specific restrictions on the size of a holding or on the transfer of the Ordinary shares.
The Directors are not aware of any agreements between the Company’s shareholders that may result in the restriction of the transfer of securities or on voting rights. No shareholder holds securities carrying any special rights or control over the Company’s share capital.
Significant shareholders As at 10 June 2014 the Company had been advised of the following notifiable direct and indirect interests in the share capital of the Company.
Notification received from: Number of ordinary shares of 25p each % of total voting rights
NR Holdings Limited 16,373,362 24.74%GoldenPeaks Capital 11,936,045 18.03%Ruffer LLP 4,832,500 7.30%M&G Investment Management 2,479,641 3.75%Artemis Intertrade (via Neue Helvetische Bank) 2,240,912 3.39%
55Volex plcAnnual Report and Accounts 2014
Directors’ report continued
Authority to purchase own shares The Company was authorised by shareholder resolution at the 2013 Annual General Meeting to purchase up to 10% of its issued share capital. No shares were purchased pursuant to this authority during the year. A resolution to renew this authority will be proposed at the forthcoming Annual General Meeting. Under this authority, any shares purchased will either be cancelled resulting in a reduction of the Company’s issued share capital or held in treasury.
Employee share schemes The Company does not have any employee share schemes with shares which have rights with regard to the control of the Company that are not exercisable directly by the employees.
Significant agreements/change of control The Company is a party to a revolving credit facility in which the counterparties can determine whether or not to cancel the agreement where there has been a change of control of the Company.
Details of the Directors’ service contracts can be found in the Directors’ Remuneration Report on page 41.
Future developments The development of the business is detailed in the Strategic Report on pages 2 to 23.
Research and development The Company’s research and development activities are focused on driving innovation throughout the product portfolio, to enable it to deliver new or enhanced customer-specific connection solutions. We have continued to recruit design and development expertise.
Employees The Company’s disclosures on employee policies and involvement can be found in the Strategic Report on page 23.
Political donations The Company made no political donations during the year.
Greenhouse gas emissions The Directors are required to provide details on greenhouse gas emissions in their report, such disclosures are made within the Corporate and Social Responsibility Report on page 23.
Financial risk management The Company’s objectives and policies on financial risk management including information on the exposure of the Company to customer concentration, commodity price fluctuations, foreign exchange rates, pricing, credit, liquidity and cash flow risks are set out in note 30 to the accounts and in the Managing Group Risk Management section on pages 19 to 22.
Going Concern statement The considerations made by the Directors with regards to going concern are set out in the Financial Review on pages 17 and 18.
Having taken these into account, the Directors have, at the time of approving the financial statements, a reasonable expectation that the Company and the Group have adequate resources to continue in operational existence for at least 12 months from the date of these accounts. Accordingly, they continue to adopt the going concern basis in preparing the financial statements.
Auditors and disclosure of information to auditors Each of the persons who is a Director at the date of approval of this Annual Report confirms that:
So far as the Director is aware, there is no relevant audit information of which the Company’s auditors are unaware; and
The Director has taken all the reasonable steps that he/she ought to have taken as a Director in order to make himself/herself aware of any relevant audit information and to establish that the Company’s auditors are aware of that information.
The above confirmation is given and should be interpreted in accordance with the provisions of Section 418 of the Companies Act 2006.
PricewaterhouseCoopers LLP has expressed their willingness to continue in office as auditors and a resolution seeking to reappoint them will be proposed at the forthcoming Annual General Meeting.
Annual General Meeting The Company’s Annual General Meeting will be held at 10 Eastbourne Terrace, Paddington on 18 July 2014 at 10am. Details of the venue and the resolutions to be proposed are set out in a separate Notice of Meeting which accompanies this Report.
This report was approved by the Board of Directors of Volex plc and signed on its behalf by:
Nicole Pask General Counsel and Company Secretary 12 June 2014
56 Volex plcAnnual Report and Accounts 2014
Independent auditors’ report to the members of Volex plc Report on the financial statements
Our opinion In our opinion:
The financial statements, defined below, give a true and fair view of the state of the Group’s and of the Parent Company’s affairs as at 30 March 2014 and of the Group’s loss and of the Group’s and Parent Company’s cash flows for the 52 week period then ended;
The Group financial statements have been properly prepared in accordance with International Financial Reporting Standards (IFRSs) as adopted by the European Union;
The Parent Company financial statements have been properly prepared in accordance with IFRSs as adopted by the European Union and as applied in accordance with the provisions of the Companies Act 2006; and
The financial statements have been prepared in accordance with the requirements of the Companies Act 2006 and, as regards the Group financial statements, Article 4 of the IAS Regulation.
This opinion is to be read in the context of what we say in the remainder of this report.
What we have audited The Group financial statements and the Parent Company financial statements (the ‘financial statements’), which are prepared by Volex plc, comprise:
The Consolidated Income Statement and Consolidated Statement of Comprehensive Income for the 52 week period ended 30 March 2014;
The Consolidated and Company Statements of Financial Position as at 30 March 2014;
The Consolidated and Company Statements of Changes in Equity and Statements of Cash Flows for the 52 week period then ended; and
The notes to the financial statements, which include a summary of significant accounting policies and other explanatory information.
The financial reporting framework that has been applied in their preparation comprises applicable law and IFRSs as adopted by the European Union and, as regards the Parent Company, as applied in accordance with the provisions of the Companies Act 2006.
Certain disclosures required by the financial reporting framework have been presented elsewhere in the Volex plc Annual Report and Accounts 2014 (‘Annual Report’), rather than in the notes to the financial statements. These are cross-referenced from the financial statements and identified as audited.
What an audit of financial statements involves We conducted our audit in accordance with International Standards on Auditing (UK and Ireland) (‘ISAs (UK & Ireland)’). An audit involves obtaining evidence about the amounts and disclosures in the financial statements sufficient to give reasonable assurance that the financial statements are free from material misstatement, whether caused by fraud or error. This includes an assessment of:
Whether the accounting policies are appropriate to the Group’s and Parent Company’s circumstances and have been consistently applied and adequately disclosed;
The reasonableness of significant accounting estimates made by the directors; and
The overall presentation of the financial statements.
In addition, we read all the financial and non-financial information in the Annual Report to identify material inconsistencies with the audited financial statements and to identify any information that is apparently materially incorrect based on, or materially inconsistent with, the knowledge acquired by us in the course of performing the audit. If we become aware of any apparent material misstatements or inconsistencies we consider the implications for our report.
Overview of our audit approach Materiality We set certain thresholds for materiality. These helped us to determine the nature, timing and extent of our audit procedures and to evaluate the effect of misstatements, both individually and on the financial statements as a whole.
Based on our professional judgement, we determined materiality for the Group financial statements as a whole to be $784,000. Our materiality represents approximately 5% of the average profit or loss before tax and exceptional items over the last three annual reporting periods. This basis has been used as averaged pre-exceptional results over a period of significant fluctuations more accurately reflects the materiality of the underlying business.
We set a specific materiality level of $400,000 for the audit of non-recurring items.
We agreed with the Audit Committee that we would report to them misstatements identified during our audit above $50,000 as well as misstatements below that amount that, in our view, warranted reporting for qualitative reasons.
57Volex plcAnnual Report and Accounts 2014
Independent auditors’ report continued
Overview of the scope of our audit The Group is multinational with production facilities and sales offices around the world. The Group consists of two main divisions, ‘Power’ and ‘Data’, and within each division there are a number of reporting units that are consolidated to produce the Group financial statements.
In establishing the overall approach to the Group audit, we determined the type of work that needed to be performed at the reporting units by us, as the Group engagement team, and component auditors from other PwC network firms operating under our instruction. Where the work was performed by component auditors, we determined the level of involvement we needed to have in the audit work at those reporting units to be able to conclude whether sufficient appropriate audit evidence had been obtained as a basis for our opinion on the Group financial statements as a whole. This included visits to the key facilities in countries such as China, Singapore and the USA where we attended key local meetings and performed a review of the component audit teams’ working papers where relevant. Where we did not visit in person, we discussed key issues with the component audit team and local management by telephone.
Taking into account the size and risks related to the reporting units, we determined that we would conduct an audit of the complete financial information of certain reporting units in China, Poland, Singapore and the USA which would give us appropriate coverage over both divisions. Further specific procedures were also performed with respect to the Indonesian and Mexican production facilities. This, together with procedures performed centrally over the consolidation process, gave us the evidence we needed for our opinion on the Group financial statements as a whole.
Areas of particular audit focus In preparing the financial statements, the Directors made a number of subjective judgements, for example in respect of significant accounting estimates that involved making assumptions and considering future events that are inherently uncertain. We primarily focused our work in these areas by assessing the Directors’ judgements against available evidence, forming our own judgements, and evaluating the disclosures in the financial statements.
In our audit, we tested and examined information, using sampling and other auditing techniques, to the extent we considered necessary to provide a reasonable basis for us to draw conclusions. We obtained audit evidence through testing the effectiveness of controls, substantive procedures or a combination of both.
We considered the following areas to be those that required particular focus in the current 52 week period. This is not a complete list of all risks or areas of focus identified by our audit. We discussed these areas of focus with the Audit Committee. Their report on those matters that they considered to be significant issues in relation to the financial statements is set out on page 34.
Area of focus How the scope of our audit addressed the area of focusGoing concern We focused heavily on matters relating to going concern arising from both pressure on the Group’s banking covenants given the trading performance in FY2014 and projected performance for FY2015, and the Group’s long term financing requirements, given that current committed facilities run only until June 2015.
Details of the going concern considerations made by management and the Audit Committee are given on pages 17 and 18 of the Annual Report.
We obtained the Directors’ financial forecast for the next 12 months and:
Challenged the assumptions used in building the forecast by considering historical accuracy of forecasts, latest information available in FY2015 and latest market trends. As part of this we discussed at length the budgets with the sales VPs;
Re-computed the Directors’ calculations of forecast compliance with financial covenants and assessed the sensitivity of the Directors’ calculations to changes in key inputs, in particular sales projections, funding plans and working capital management; and
Considered the feasibility of the Director’s plans to manage profits and working capital requirements, including potential mitigating actions in the event of under-performance against the forecast.
We also considered the feasibility of the Directors’ plans to raise further finance and renegotiate covenants. Our opinion on this is set out in a separate section below.
Non-recurring items The Directors have classified $11.1m of net expenses as non-recurring, the disclosure of which they believe more accurately reflects the underlying position of the business. We focused on this area because of the magnitude of these items, and the impact that they have on the presentation of the underlying profit in comparison to the statutory measure of loss before tax.
Our procedures over the non-recurring items included:
Testing that they met the Group’s accounting policy for non-recurring items, as given on page 73, and applying professional scepticism as to the appropriateness of the classification of these items as non-recurring;
Testing that the items were accurately recorded and whether they were amounts paid during the year or amounts estimated and accrued;
Where estimates were used, challenging the reasonableness of these estimates based on the available information; and
Testing that the reconciliation to statutory measures as shown on page 2 is accurate and clear.
58 Volex plcAnnual Report and Accounts 2014
Area of focus How the scope of our audit addressed the area of focusIntangible asset recognised with respect to active optical cable (‘AOC’). The Group has an intangible asset of $3.9m in respect of AOC. This is made up of $1.6m of purchased patents and $2.3m of capitalised development costs. $2.0m of these development costs were capitalised during the period.
We focused on this area because this intangible asset is material to the Group and, as yet, no related sales have been made. In particular, we focused on the risks of inappropriate amounts being capitalised and non-recovery of this asset.
We considered the appropriateness of the capitalised costs in accordance with the guidance laid out in IAS 38 – Intangible Assets, as well as the Group’s accounting policy as given on page 71.
We tested capitalised costs back to supporting documentation to check that amounts capitalised had been appropriately done so under Group policies and IAS 38. We also ensured that the amounts had been accurately recorded.
We assessed the recoverability of this intangible asset by evaluating the Directors’ plans to take the product to commercial production, and the resultant cash flows. This included discussing the detailed plans with the key financial and operational personnel connected with the project.
We applied sensitivity analysis to management’s own cash flow projections specific to the AOC product, considering the impact of changes in underlying assumptions would have on the recoverable amount of the intangible assets, both individually and in aggregate.
We considered whether disclosure of these matters by the Group was appropriate.
Risk of fraud in revenue recognition ISAs (UK & Ireland) presume there is a risk of fraud in revenue recognition. In particular, we focused on the timing of recognition given the number of locations where stock is held and the risks around revenue being recognised in the wrong period.
We understood and evaluated the Group’s control procedures around the recognition of revenue, and ensured these were consistent across the Group’s major territories. We carried out the following detailed procedures:
Testing of the timing of revenue recognition by agreeing the revenue recognition terms to a sample of customer contracts;
Analysing the journals posted to revenue accounts to identify unusual or irregular items; and
Performing additional procedures around the end of the period to test that revenue had been recognised in the appropriate period. These procedures included comparison of shipping documents and invoices.
Further procedures, particularly around the existence of debtors and subsequent collection of cash, support our work in assessing revenue recognition.
Risk of management override of internal controls ISAs (UK & Ireland) require that we consider this.
We assessed the overall control environment of the Group, including arrangements for staff to ‘whistle-blow’ inappropriate actions, and interviewed senior management.
We examined the significant accounting estimates and judgements relevant to the financial statements for evidence of potential bias by the Directors that might indicate a risk of material misstatement due to fraud. The key areas on which we challenged management are reflected in the other areas of focus above, as well as estimates of provisions for stock and debtors, as well as assumptions that feed into the valuation of pensions assets and liabilities.
We also tested significant one-off transactions, performed unpredictable procedures, and tested manual journal entries and key reconciliations.
Going concern Under the Listing Rules we are required to review the Directors’ statement, set out on page 56, in relation to going concern. As noted above, this was an area of focus for our audit, and we have nothing to report in addition to the above.
As noted in the Directors’ statement, the Directors have concluded that it is appropriate to prepare the Group’s and Parent Company’s financial statements using the going concern basis of accounting. The going concern basis presumes that the Group and Parent Company have adequate resources to remain in operation, and that the Directors intend them to do so, for at least one year from the date the financial statements were signed. As part of our audit we have concluded that the Directors’ use of the going concern basis is appropriate.
However, because not all future events or conditions can be predicted, these statements are not a guarantee as to the Group’s and the Parent Company’s ability to continue as a going concern.
Opinions on other matters prescribed by the Companies Act 2006 In our opinion:
The information given in the Strategic Report and the Directors’ Report for the 52 week period for which the financial statements are prepared is consistent with the financial statements; and
The part of the Directors’ Remuneration Report to be audited has been properly prepared in accordance with the Companies Act 2006.
59Volex plcAnnual Report and Accounts 2014
Independent auditors’ report continued
Other matters on which we are required to report by exception Adequacy of accounting records and information and explanations received Under the Companies Act 2006 we are required to report to you if, in our opinion:
We have not received all the information and explanations we require for our audit; or
Adequate accounting records have not been kept by the Parent Company, or returns adequate for our audit have not been received from branches not visited by us; or
The Parent Company financial statements and the part of the Directors’ Remuneration Report to be audited are not in agreement with the accounting records and returns.
We have no exceptions to report arising from this responsibility.
Directors’ remuneration Under the Companies Act 2006 we are required to report to you if, in our opinion, certain disclosures of Directors’ remuneration specified by law have not been made. We have no exceptions to report arising from this responsibility.
Corporate governance statement Under the Listing Rules we are required to review the part of the corporate governance statement relating to the Company’s compliance with nine provisions of the UK Corporate Governance Code (the ‘Code’). We have nothing to report having performed our review.
On page 53 of the Annual Report, as required by the Code Provision C.1.1, the Directors state that they consider the Annual Report taken as a whole to be fair, balanced and understandable and provides the information necessary for members to assess the Group’s performance, business model and strategy. On page 34, as required by C.3.8 of the Code, the Audit Committee has set out the significant issues that it considered in relation to the financial statements, and how they were addressed. Under ISAs (UK & Ireland) we are required to report to you if, in our opinion:
The statement given by the Directors is materially inconsistent with our knowledge of the Group acquired in the course of performing our audit; or
The section of the Annual Report describing the work of the Audit Committee does not appropriately address matters communicated by us to the Audit Committee.
We have no exceptions to report arising from this responsibility.
Other information in the annual report Under ISAs (UK & Ireland), we are required to report to you if, in our opinion, information in the Annual Report is:
Materially inconsistent with the information in the audited financial statements; or
Apparently materially incorrect based on, or materially inconsistent with, our knowledge of the Group and Parent Company acquired in the course of performing our audit; or
Is otherwise misleading.
We have no exceptions to report arising from this responsibility.
Responsibilities for the financial statements and the audit Our responsibilities and those of the Directors As explained more fully in the Directors’ Responsibilities Statement set out on page 53 the Directors are responsible for the preparation of the Group and Parent Company financial statements and for being satisfied that they give a true and fair view.
Our responsibility is to audit and express an opinion on the Group and Parent Company financial statements in accordance with applicable law and ISAs (UK & Ireland). Those standards require us to comply with the Auditing Practices Board’s Ethical Standards for Auditors.
This report, including the opinions, has been prepared for and only for the Company’s members as a body in accordance with Chapter 3 of Part 16 of the Companies Act 2006 and for no other purpose. We do not, in giving these opinions, accept or assume responsibility for any other purpose or to any other person to whom this report is shown or into whose hands it may come, save where expressly agreed by our prior consent in writing.
Darryl Phillips (Senior Statutory Auditor) for and on behalf of PricewaterhouseCoopers LLP Chartered Accountants and Statutory Auditors London 12 June 2014
60 Volex plcAnnual Report and Accounts 2014
61Volex plcAnnual Report and Accounts 2014
Financial statements
Financial statements
62 Consolidated income statement
63 Consolidated statement of comprehensive income
64 Consolidated and Company statement of financial position
65 Consolidated and Company statement of changes in equity
66 Consolidated and Company statement of cash flows
67 Notes to the financial statements
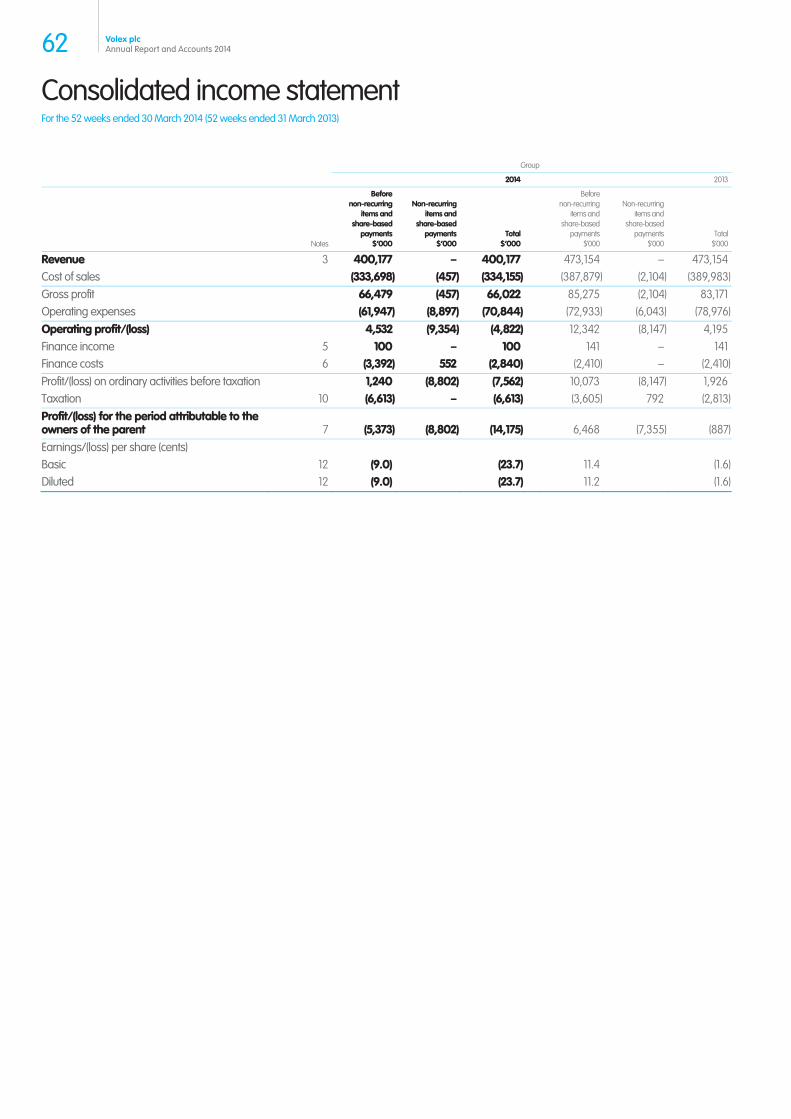
Consolidated income statement For the 52 weeks ended 30 March 2014 (52 weeks ended 31 March 2013)
Group
2014 2013
Notes
Before non-recurring
items and share-based
payments$’000
Non-recurringitems and
share-based payments
$’000Total
$’000
Before non-recurring
items and share-based
payments $’000
Non-recurring items and
share-based payments
$’000Total
$’000
Revenue 3 400,177 – 400,177 473,154 – 473,154Cost of sales (333,698) (457) (334,155) (387,879) (2,104) (389,983)Gross profit 66,479 (457) 66,022 85,275 (2,104) 83,171Operating expenses (61,947) (8,897) (70,844) (72,933) (6,043) (78,976)Operating profit/(loss) 4,532 (9,354) (4,822) 12,342 (8,147) 4,195Finance income 5 100 – 100 141 – 141Finance costs 6 (3,392) 552 (2,840) (2,410) – (2,410)Profit/(loss) on ordinary activities before taxation 1,240 (8,802) (7,562) 10,073 (8,147) 1,926Taxation 10 (6,613) – (6,613) (3,605) 792 (2,813)Profit/(loss) for the period attributable to the owners of the parent 7 (5,373) (8,802) (14,175) 6,468 (7,355) (887)Earnings/(loss) per share (cents) Basic 12 (9.0) (23.7) 11.4 (1.6)Diluted 12 (9.0) (23.7) 11.2 (1.6)
62 Volex plcAnnual Report and Accounts 2014
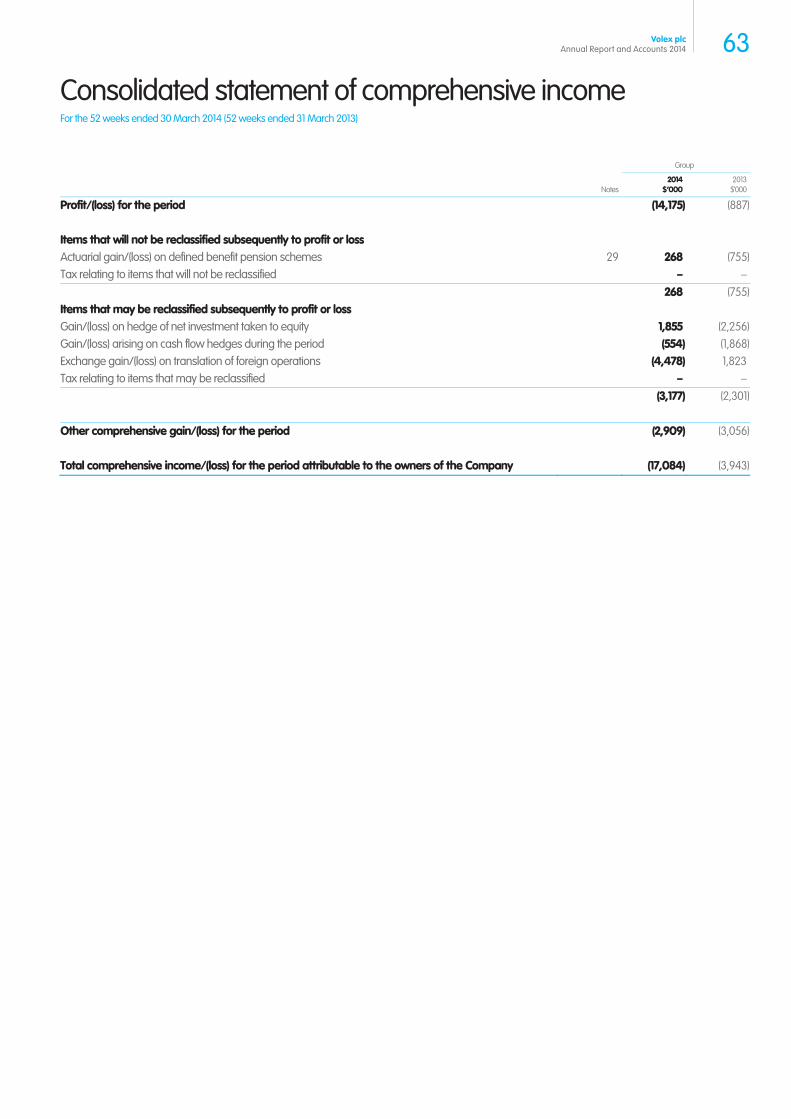
Consolidated statement of comprehensive income For the 52 weeks ended 30 March 2014 (52 weeks ended 31 March 2013)
Notes
Group
2014$’000
2013$’000
Profit/(loss) for the period (14,175) (887) Items that will not be reclassified subsequently to profit or loss Actuarial gain/(loss) on defined benefit pension schemes 29 268 (755)Tax relating to items that will not be reclassified – – 268 (755)Items that may be reclassified subsequently to profit or loss Gain/(loss) on hedge of net investment taken to equity 1,855 (2,256)Gain/(loss) arising on cash flow hedges during the period (554) (1,868)Exchange gain/(loss) on translation of foreign operations (4,478) 1,823Tax relating to items that may be reclassified – – (3,177) (2,301) Other comprehensive gain/(loss) for the period (2,909) (3,056) Total comprehensive income/(loss) for the period attributable to the owners of the Company (17,084) (3,943)
63Volex plcAnnual Report and Accounts 2014
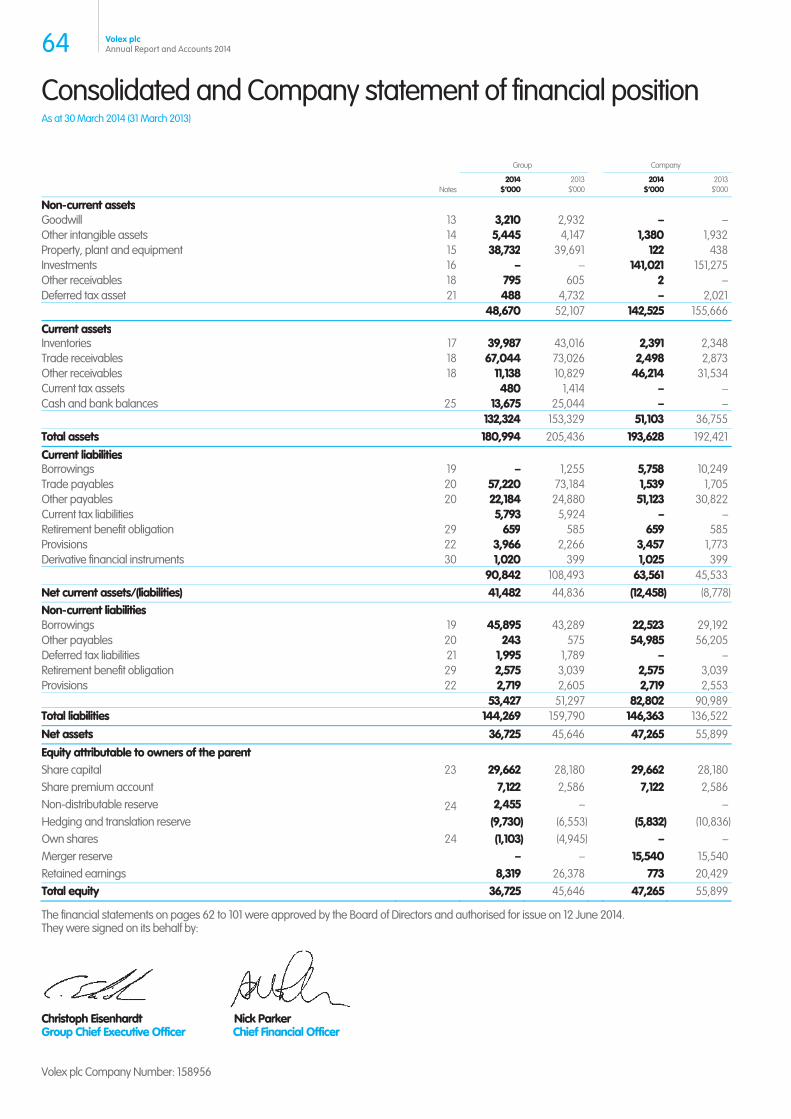
Consolidated and Company statement of financial position As at 30 March 2014 (31 March 2013)
Notes
Group Company
2014$’000
2013 $’000
2014$’000
2013$’000
Non-current assets Goodwill 13 3,210 2,932 – –Other intangible assets 14 5,445 4,147 1,380 1,932Property, plant and equipment 15 38,732 39,691 122 438Investments 16 – – 141,021 151,275Other receivables 18 795 605 2 –Deferred tax asset 21 488 4,732 – 2,021 48,670 52,107 142,525 155,666
Current assets Inventories 17 39,987 43,016 2,391 2,348Trade receivables 18 67,044 73,026 2,498 2,873Other receivables 18 11,138 10,829 46,214 31,534Current tax assets 480 1,414 – –Cash and bank balances 25 13,675 25,044 – – 132,324 153,329 51,103 36,755Total assets 180,994 205,436 193,628 192,421
Current liabilities Borrowings 19 – 1,255 5,758 10,249Trade payables 20 57,220 73,184 1,539 1,705Other payables 20 22,184 24,880 51,123 30,822Current tax liabilities 5,793 5,924 – –Retirement benefit obligation 29 659 585 659 585Provisions 22 3,966 2,266 3,457 1,773Derivative financial instruments 30 1,020 399 1,025 399 90,842 108,493 63,561 45,533Net current assets/(liabilities) 41,482 44,836 (12,458) (8,778)Non-current liabilities Borrowings 19 45,895 43,289 22,523 29,192Other payables 20 243 575 54,985 56,205Deferred tax liabilities 21 1,995 1,789 – –Retirement benefit obligation 29 2,575 3,039 2,575 3,039Provisions 22 2,719 2,605 2,719 2,553 53,427 51,297 82,802 90,989Total liabilities 144,269 159,790 146,363 136,522
Net assets 36,725 45,646 47,265 55,899
Equity attributable to owners of the parent Share capital 23 29,662 28,180 29,662 28,180Share premium account 7,122 2,586 7,122 2,586Non-distributable reserve 24 2,455 – –Hedging and translation reserve (9,730) (6,553) (5,832) (10,836)Own shares 24 (1,103) (4,945) – –Merger reserve – – 15,540 15,540Retained earnings 8,319 26,378 773 20,429Total equity 36,725 45,646 47,265 55,899
The financial statements on pages 62 to 101 were approved by the Board of Directors and authorised for issue on 12 June 2014. They were signed on its behalf by:
Christoph Eisenhardt Nick Parker Group Chief Executive Officer Chief Financial Officer
Volex plc Company Number: 158956
64 Volex plcAnnual Report and Accounts 2014
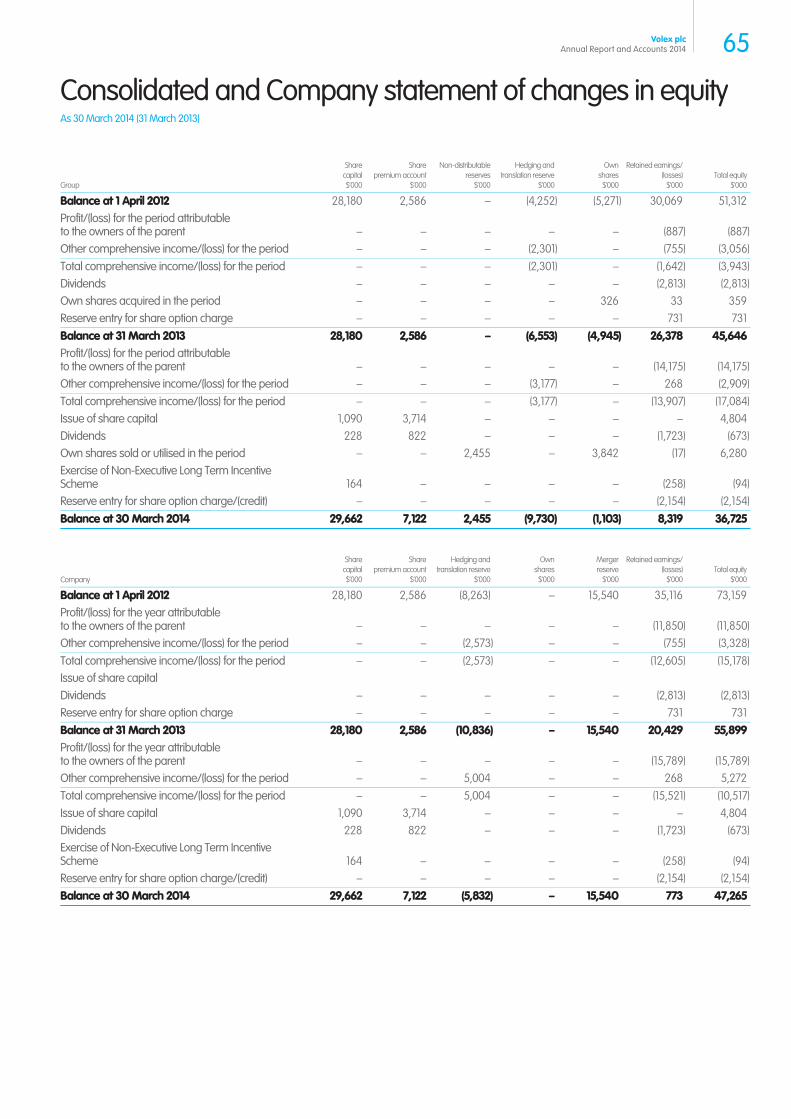
Consolidated and Company statement of changes in equity As 30 March 2014 (31 March 2013)
Group
Share capital $’000
Share premium account
$’000
Non-distributable reserves
$’000
Hedging and translation reserve
$’000
Own shares
$’000
Retained earnings/(losses)
$’000Total equity
$’000
Balance at 1 April 2012 28,180 2,586 – (4,252) (5,271) 30,069 51,312Profit/(loss) for the period attributable to the owners of the parent – – – – – (887) (887)Other comprehensive income/(loss) for the period – – – (2,301) – (755) (3,056)Total comprehensive income/(loss) for the period – – – (2,301) – (1,642) (3,943)Dividends – – – – – (2,813) (2,813)Own shares acquired in the period – – – – 326 33 359Reserve entry for share option charge – – – – – 731 731Balance at 31 March 2013 28,180 2,586 – (6,553) (4,945) 26,378 45,646Profit/(loss) for the period attributable to the owners of the parent – – – – – (14,175) (14,175)Other comprehensive income/(loss) for the period – – – (3,177) – 268 (2,909)Total comprehensive income/(loss) for the period – – – (3,177) – (13,907) (17,084)Issue of share capital 1,090 3,714 – – – – 4,804Dividends 228 822 – – – (1,723) (673)Own shares sold or utilised in the period – – 2,455 – 3,842 (17) 6,280Exercise of Non-Executive Long Term Incentive Scheme 164 – – – – (258) (94)Reserve entry for share option charge/(credit) – – – – – (2,154) (2,154)Balance at 30 March 2014 29,662 7,122 2,455 (9,730) (1,103) 8,319 36,725
Company
Share capital $’000
Share premium account
$’000
Hedging and translation reserve
$’000
Own shares
$’000
Merger reserve
$’000
Retained earnings/ (losses) $’000
Total equity $’000
Balance at 1 April 2012 28,180 2,586 (8,263) – 15,540 35,116 73,159Profit/(loss) for the year attributable to the owners of the parent – – – – – (11,850) (11,850)Other comprehensive income/(loss) for the period – – (2,573) – – (755) (3,328)Total comprehensive income/(loss) for the period – – (2,573) – – (12,605) (15,178)Issue of share capital Dividends – – – – – (2,813) (2,813)Reserve entry for share option charge – – – – – 731 731Balance at 31 March 2013 28,180 2,586 (10,836) – 15,540 20,429 55,899Profit/(loss) for the year attributable to the owners of the parent – – – – – (15,789) (15,789)Other comprehensive income/(loss) for the period – – 5,004 – – 268 5,272Total comprehensive income/(loss) for the period – – 5,004 – – (15,521) (10,517)Issue of share capital 1,090 3,714 – – – – 4,804Dividends 228 822 – – – (1,723) (673)Exercise of Non-Executive Long Term Incentive Scheme 164 – – – – (258) (94)Reserve entry for share option charge/(credit) – – – – – (2,154) (2,154)Balance at 30 March 2014 29,662 7,122 (5,832) – 15,540 773 47,265
65Volex plcAnnual Report and Accounts 2014
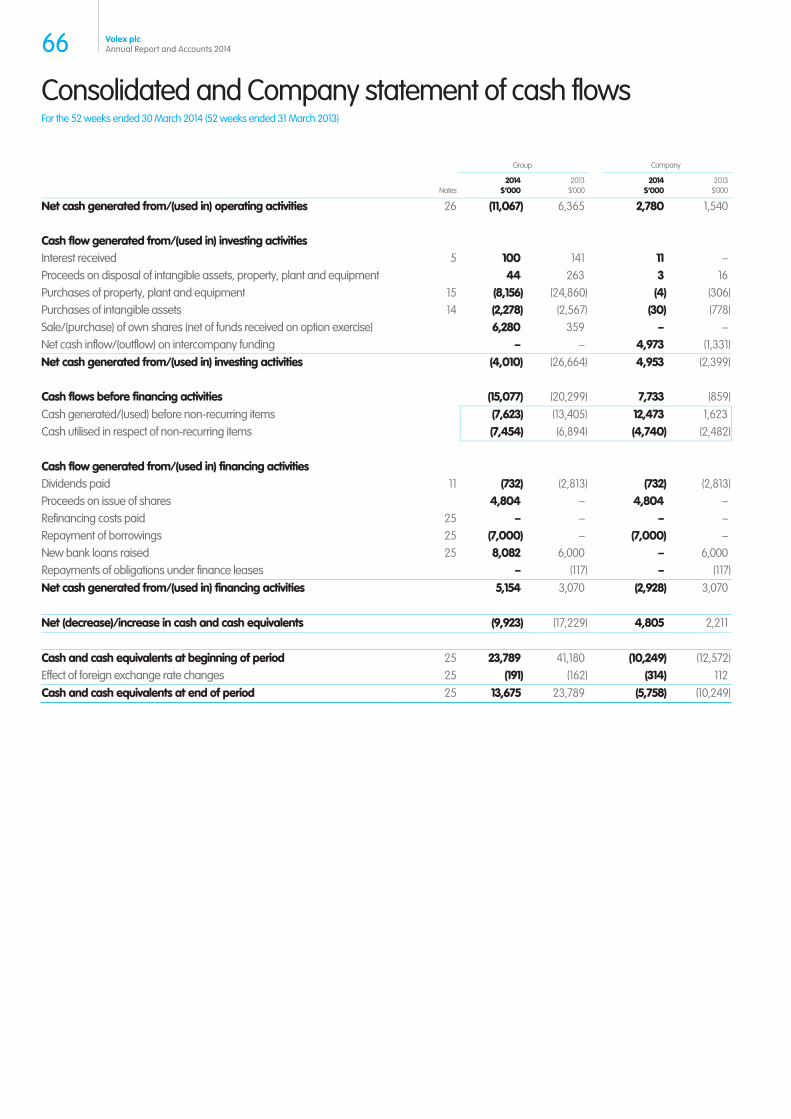
Consolidated and Company statement of cash flows For the 52 weeks ended 30 March 2014 (52 weeks ended 31 March 2013)
Notes
Group
Company
2014$’000
2013 $’000
2014$’000
2013$’000
Net cash generated from/(used in) operating activities 26 (11,067) 6,365 2,780 1,540 Cash flow generated from/(used in) investing activities Interest received 5 100 141 11 –Proceeds on disposal of intangible assets, property, plant and equipment 44 263 3 16Purchases of property, plant and equipment 15 (8,156) (24,860) (4) (306)Purchases of intangible assets 14 (2,278) (2,567) (30) (778)Sale/(purchase) of own shares (net of funds received on option exercise) 6,280 359 – –Net cash inflow/(outflow) on intercompany funding – – 4,973 (1,331)Net cash generated from/(used in) investing activities (4,010) (26,664) 4,953 (2,399) Cash flows before financing activities (15,077) (20,299) 7,733 (859)Cash generated/(used) before non-recurring items (7,623) (13,405) 12,473 1,623Cash utilised in respect of non-recurring items (7,454) (6,894) (4,740) (2,482) Cash flow generated from/(used in) financing activities Dividends paid 11 (732) (2,813) (732) (2,813)Proceeds on issue of shares 4,804 – 4,804 –Refinancing costs paid 25 – – – –Repayment of borrowings 25 (7,000) – (7,000) –New bank loans raised 25 8,082 6,000 – 6,000Repayments of obligations under finance leases – (117) – (117)Net cash generated from/(used in) financing activities 5,154 3,070 (2,928) 3,070 Net (decrease)/increase in cash and cash equivalents (9,923) (17,229) 4,805 2,211 Cash and cash equivalents at beginning of period 25 23,789 41,180 (10,249) (12,572)Effect of foreign exchange rate changes 25 (191) (162) (314) 112Cash and cash equivalents at end of period 25 13,675 23,789 (5,758) (10,249)
66 Volex plcAnnual Report and Accounts 2014
Notes to the financial statements For the 52 weeks ended 30 March 2014 (52 weeks ended 31 March 2013)
1. Presentation of financial statements Volex plc (‘the Company’ and together with its subsidiaries ‘the Group’) is a public limited company incorporated and domiciled in the United Kingdom under the Companies Act 2006 and listed on the London Stock Exchange. The address of the registered office is given on the inside back cover. The nature of the Group’s operations and its principal activities are set out in the Strategic Review on pages 2 to 23.
Financial statements are prepared for the period ending on the Sunday following the Friday that falls closest to the accounting reference date of 31 March each year.
These financial statements are presented in US Dollars (‘USD’) as it is the currency of the primary economic environment in which the Group operates.
The Company has elected to take the exemption under section 408 of the Companies Act 2006 to not present the parent company statement of comprehensive income (and separate income statement). The loss for the parent company for the period was $15,789,000 (2013: loss of $11,850,000).
2. Significant accounting policies The principal accounting policies applied in the preparation of these consolidated financial statements are set out below. These policies have been consistently applied to all the periods presented, unless otherwise stated.
Basis of accounting The financial statements have been prepared in accordance with International Financial Reporting Standards (IFRSs). The financial statements have also been prepared in accordance with IFRSs adopted by the European Union and therefore the Group financial statements comply with Article 4 of the EU IAS Regulation.
The financial statements have been prepared on the historical cost basis except for the revaluation of financial instruments that are measured at fair values at the end of each reporting period, as explained in the accounting policies below. Historical cost is generally based on the fair value of the consideration given in exchange for goods and services.
Adoption of new and revised International Financial Reporting Standards (‘IFRSs’) In the current period, the following new and revised Standards and Interpretations have been adopted. Their adoption has not had any significant impact on the amounts reported in these financial statements but may impact the accounting for future transactions and arrangements.
Standards affecting the financial statements IAS 19 (revised) ‘Employee Benefits’ – In the current year the Group has applied IAS 19 (revised). The main impact on the Group’s financial statements is to replace interest cost and
expected return on defined benefit plan assets with a net interest amount, calculated by applying the discount rate to the net defined benefit obligation. As the Group has always immediately recognised actuarial gains and losses, there is no effect on the prior year defined benefit obligation.
IFRS 13 ‘Fair Value Measurement’ – The Group has applied IFRS 13 for the first time in the current period. IFRS 13 establishes a single source of guidance for fair value measurements
and associated disclosures. The scope of IFRS 13 is broad, applying to both financial instruments and non-financial instruments. Other than additional disclosures, the application of IFRS 13 has not had any material impact on the amounts recognised in the consolidated financial statements.
Standards not affecting the reported results nor the financial position The following new and revised Standards and Interpretations have been adopted in the current period. Their adoption has not had any significant impact on the amounts reported in these financial statements.
IFRS 10 ‘Consolidated Financial Statements’ – IFRS 10 replaces the parts of IAS 27 ‘Consolidated Financial Statements’ that deal with consolidated financial statements and SIC-12 ‘Consolidation
– Special Purpose Entities’. IFRS 10 changes the definition of control. All operating subsidiaries in the Group are wholly-owned, so this change has no impact on the consolidated financial statements.
IFRS 12 ‘Disclosure of Interests in Other Entities’ – This standard is applicable to entities that have interests in subsidiaries, associates and joint arrangements and requires additional disclosure to
enable users of financial statements to evaluate the nature of, and risks associated with, interests in other entities. The Group comprises only wholly-owned subsidiaries, and further disclosure is provided in the principal operating subsidiaries note.
IAS 1 (amendment) ‘Financial Statement Presentation’ – These amendments specify that when an entity applies an accounting policy retrospectively leading to a material effect on the opening position,
a third statement of financial position (that at the beginning of the preceding period) should be disclosed. In the current period, the Group has applied a number of new and revised IFRSs. However, this has not resulted in any material effects on the information in the consolidated statement of financial position as at 1 April 2012. Accordingly, a third statement of financial position has not been disclosed.
IAS 27 (revised) ‘Separate Financial Statements’ – This standard deals only with separate financial statements and therefore has no impact on these consolidated financial statements.
67Volex plcAnnual Report and Accounts 2014
Notes to the financial statements continued For the 52 weeks ended 30 March 2014 (52 weeks ended 31 March 2013)
2. Significant accounting policies continued At the date of authorisation of these financial statements, the following Standards and Interpretations which have not been applied in these financial statements were in issue but not yet effective (and in some cases had not yet been adopted by the EU):
IFRS 9 ‘Financial Instruments’
IAS 36 (amendments) ‘Recoverable Amount Disclosures for Non-Financial Assets’
IAS 39 (amendments) ‘Novation of Derivatives and Continuation of Hedge Accounting’
The Directors do not expect that the adoption of the Standards and Interpretations listed above will have a material impact on the financial statements of the Group in future periods.
Basis of consolidation The consolidated financial statements of Volex plc incorporate the financial statements of the Company and entities which it controls (its subsidiaries), (together the ‘Group’), and are drawn up to the relevant period end date. Control is achieved where the Company has the power to govern the financial and operating policies so as to be able to obtain benefits from its activities.
Where necessary, adjustments are made to the financial statements of subsidiaries to bring the accounting policies used into line with those used by the Group.
All intra-group assets and liabilities, equity, income, expenses and cash flows relating to transactions between the members of the Group are eliminated in full on consolidation.
Going concern The Group’s business activities, together with the factors likely to affect its future developments, performance and position are set out in the Strategic Report on pages 2 to 23. The financial position of the Group, its cash flows, liquidity position and borrowing facilities are described in the Finance Review on pages 14 to 18. In addition note 30 to the financial statements includes the Group objectives, policies and processes for managing its capital; its financial risk management objectives; details of its financial instruments and hedging activities; and its exposures to credit risk, liquidity risk, interest rate risk, commodity price risk and foreign exchange risk.
As highlighted in note 19 to the financial statements, during the year under review the Group met its day-to-day working capital requirements through a $75 million multi-currency revolving credit facility (‘RCF’) with a syndicate of three banks. The principal terms of this financing facility are given in note 19. The facility required the Group to perform quarterly financial covenant calculations with respect to leverage (adjusted net debt to adjusted rolling-12 month EBITDA) and interest cover (adjusted rolling 12-month EBITDA to adjusted rolling 12-month interest). Breach of these covenants would have resulted in cancellation of the facility. This facility was due to expire on 15 June 2015 being one year and three days beyond the date of signature of these accounts.
As a consequence of (1) these facilities being due to expire in a relatively short period after the year end; and (2) the high level of non-recurring items incurred during the year when combined with the lower level of profitability than initially anticipated, it became necessary during the year and subsequent to year end for the Group to hold extensive discussions with its bankers. The result of these discussions was that the financial covenants referred to above were initially adjusted to allow for the poor trading that the Group was experiencing at that time. The costs of agreeing these adjustments are reflected as a non-recurring item in the accounts (see note 4 to the financial statements).
Subsequent to year end, renewed facilities sized at $45.0 million have been agreed conditional only upon the raising of $25.0 million (net of issue costs) from the sale of shares as detailed below. This $45.0 million facility extends through to 15 June 2017. The financial covenants that are associated with these facilities are based upon the same criteria as the previous agreement but also reflect the latest financial forecasts for the Group with a suitable degree of headroom incorporated.
In addition to the extended banking facilities, the Group, as announced on 12 June 2014 and detailed in note 33 to the financial statements, will issue 24,067,171 new shares for a gross consideration of $30.3 million. The issuance of these shares will be subject only to approval by a simple majority of those voting at a general meeting on 1 July 2014. The Group has irrevocable commitments to vote in favour of the resolution to issue the shares at that meeting from shareholders holding 26% of the Group’s share capital.
Given the above, the Group’s forecast and projections, taking reasonable account of possible changes in trading performance, show that the Group should operate within the level of the proposed facility for the foreseeable future and should comply with covenants over this period. The Group also has access to and uses additional uncommitted facilities. Further, the Group has a number of mitigating actions available to it, should actual performance fall below the current financial forecasts. The Directors have the financial controls and monitoring available to them to put in place those mitigating actions in a timely fashion if they see the need to do so. The Directors therefore believe that the Group is well placed to manage its business within its covenants.
The Directors have, at the time of approving the financial statements, a reasonable expectation that the Company and the Group have adequate resources to continue in operational existence for at least 12 months from the date of these accounts.. Accordingly, they continue to adopt the going concern basis in preparing the financial statements.
68 Volex plcAnnual Report and Accounts 2014
2. Significant accounting policies continued Business combinations Acquisitions of subsidiaries and businesses are accounted for using the acquisition method. The consideration transferred in a business combination is measured at fair value, which is calculated as the sum of acquisition-date fair values of assets transferred by the Group, liabilities incurred by the Group to the former owners of the acquiree and the equity interest issued by the Group in exchange for control of the acquiree. Acquisition-related costs are recognised in profit or loss as incurred.
Goodwill is measured as the excess of the sum of the consideration transferred and the amount of any non-controlling interests in the acquiree over the net of the acquisition-date amounts of the identifiable assets acquired and liabilities assumed.
Where the consideration for the acquisition includes any asset or liability resulting from a contingent consideration arrangement, it is measured at its acquisition date fair value and included as part of the consideration transferred. Subsequent changes in the fair value of contingent consideration that qualify as measurement period adjustments are adjusted retrospectively, with corresponding adjustments against goodwill. Measurement period adjustments are adjustments that arise from additional information obtained during the ‘measurement period’ (which cannot exceed one year from the acquisition date) about facts and circumstances that existed at the acquisition date.
Goodwill Goodwill is initially recognised and measured as set out above.
Goodwill is not amortised but is tested annually for impairment. For the purpose of impairment testing, goodwill is allocated to cash-generating units. The allocation is made to those cash-generating units or groups of cash-generating units that are expected to benefit from the business combination in which the goodwill arose. If the recoverable amount of the cash-generating unit is less than the carrying amount of the unit, the impairment loss is allocated first to reduce the carrying amount of any goodwill allocated to the unit and then to the other assets of the unit pro-rata on the basis of the carrying amount of each asset in the unit. The impairment loss is recognised immediately in profit and loss and is not reversed in subsequent periods.
On disposal of a subsidiary, the attributable amount of goodwill is included in the determination of the profit or loss on disposal.
Goodwill arising on acquisitions before the date of transition to IFRS has been retained at the previous UK GAAP amounts. Goodwill arising on acquisitions prior to 31 March 1998 has been written off to reserves and has not been reinstated in the statement of financial position and will not be included in determining any subsequent profit or loss on disposal.
Investment in subsidiary undertakings In the Company statement of financial position, investments in subsidiary undertakings are recorded at cost less provision for impairment.
The excess of fair value over the nominal value of shares issued in consideration for investments in which ownership exceeds 90% is recorded in the Company’s merger reserve.
Foreign currencies The individual financial statements of each Group company are prepared in the currency of the primary economic environment in which it operates (its functional currency). For the purpose of the consolidated financial statements, the results and financial position of each Group company are expressed in US Dollars, which is the presentation currency for the consolidated financial statements.
In preparing the financial statements of the individual companies, transactions in currencies other than the entity’s functional currency (foreign currencies) are recognised at the rates of exchange prevailing on the dates of the transactions. At each reporting date, monetary assets and liabilities that are denominated in foreign currencies are retranslated at the rates prevailing at that date. Non-monetary items carried at fair value that are denominated in foreign currencies are translated at the rates prevailing at the date when the fair value was determined. Non-monetary items that are measured in terms of historical cost in a foreign currency are not retranslated.
Exchange differences are recognised in profit or loss in the period in which they arise except for:
Exchange differences on transactions entered into to hedge certain foreign currency risks (see below under financial instruments/hedge accounting); and
Exchange differences on monetary items receivable from or payable to a foreign operation for which settlement is neither planned nor likely to occur in the foreseeable future (therefore forming part of the net investment in the foreign operation), which are recognised initially in other comprehensive income and reclassified from equity to profit or loss on disposal or partial disposal of the net investment.
For the purpose of presenting consolidated financial statements, the assets and liabilities of the Group’s foreign operations are translated at exchange rates prevailing on the reporting date. Income and expense items are translated at the average exchange rates for the period, unless exchange rates fluctuate significantly during that period, in which case the exchange rates at the date of transactions are used. Exchange differences arising, if any, are recognised in other comprehensive income and accumulated in equity.
69Volex plcAnnual Report and Accounts 2014
Notes to the financial statements continued For the 52 weeks ended 30 March 2014 (52 weeks ended 31 March 2013)
2. Significant accounting policies continued Revenue recognition Revenue is measured at the fair value of the consideration received or receivable for goods and services provided in the normal course of business, net of discounts, VAT and other sales related taxes.
Revenue from the sale of goods is recognised when all of the following conditions are satisfied:
Significant risks and rewards of ownership have been transferred to the buyer determined with reference to the specific contract in place;
The amount of revenue can be measured reliably;
It is probable that the economic benefits associated with the transaction will flow to the Group; and
The costs incurred or to be incurred in respect of the transaction can be measured reliably.
Revenue from the provision of engineering services is recognised by reference to the stage of completion of the contracted services.
Interest income is accrued on a timely basis by reference to the principal outstanding and the effective interest rate applicable.
Dividend income from investments is recognised when the shareholder’s right to receive payment has been established.
Taxation The tax expense for the period comprises current and deferred tax. Tax is recognised in the income statement, except to the extent that it relates to items recognised in other comprehensive income or directly in equity. In this case the tax is recognised in other comprehensive income or directly in equity, respectively.
The tax currently payable is based on taxable profit for the period. Taxable profit differs from profit as reported in the income statement because it excludes items of income or expense that are taxable or deductible in other periods and it further excludes items that are never taxable or deductible. The Group’s liability for current tax is calculated using tax rates and laws that have been enacted or substantively enacted by the reporting date.
Deferred tax is the tax expected to be payable or recoverable on differences between the carrying amounts of assets and liabilities in the financial statements and the corresponding tax bases used in the computation of taxable profit and is accounted for using the liability method. Deferred tax liabilities are generally recognised for all taxable temporary differences and deferred tax assets are recognised to the extent that it is probable that taxable profits will be available against which deductible temporary differences can be utilised. Such assets and liabilities are not recognised if the temporary differences arise from goodwill or from the initial recognition (other than in a business combination) of other assets and liabilities in a transaction that affects neither the taxable profit nor the accounting profit.
Deferred tax liabilities are recognised for taxable temporary differences arising on investments in subsidiaries and associates and interests in joint ventures, except where the Group is able to control the reversal of the temporary difference and it is probable that the temporary difference will not reverse in the foreseeable future.
The carrying amount of deferred tax assets is reviewed at each reporting date and reduced to the extent that it is no longer probable that sufficient taxable profits will be available to allow all or part of the asset to be recovered.
Deferred tax is calculated at the tax rates that are expected to apply in the period when the liability is settled or the asset is realised based on tax rates and laws that have been enacted or substantively enacted by the reporting date. Deferred tax is charged or credited in the income statement, except when it relates to items charged or credited in other comprehensive income, in which case the deferred tax is also dealt with in other comprehensive income.
Deferred tax assets and liabilities are offset when there is a legally enforceable right to set off current tax assets against current liabilities and when they relate to income taxes levied by the same taxation authority and the Group intends to settle its current tax assets and liabilities on a net basis.
Property, plant and equipment Property, plant and equipment are stated at cost less accumulated depreciation and any recognised impairment loss. Cost includes the original purchase price of the asset and any further costs attributable to bringing the asset to its working condition for its intended use.
Depreciation is recognised so as to write off the cost or valuation of assets (other than freehold land) less their residual values over their useful lives, using the straight-line method, on the following bases:
Long leasehold buildings up to 50 years or period of lease, if shorter Plant and machinery up to 15 years
Freehold land is not depreciated.
An item of property, plant and equipment is derecognised upon disposal or when no future economic benefits are expected to arise from the continued use of the asset. The gain or loss arising on the disposal of an asset is determined as the difference between the sales proceeds and the carrying amount of the asset and is recognised in income.
70 Volex plcAnnual Report and Accounts 2014
2. Significant accounting policies continued Intangible assets – computer software and licences Computer software is stated at cost less accumulated depreciation and any recognised impairment loss. Acquired computer software licences are capitalised on the basis of the costs incurred to acquire and use the specific software. These costs are included in the statement of financial position within intangible assets and are amortised straight-line over their estimated useful lives, not exceeding five years.
Costs associated with maintaining computer software are recognised as an expense as incurred.
Intangible assets – patents Patents are stated at cost less accumulated amortisation. Patents are amortised on a straight-line basis over their estimated useful lives.
Intangible assets – internally generated intangible assets – research and development expenditure Expenditure on research activities is recognised as an expense in the period in which it is incurred.
The Group is engaged in development activities which include both general product development and specific customer development projects. An internally generated intangible asset arising from these development activities is recognised only if all of the following conditions are met:
An asset is created that can be identified;
It is probable that the asset created will generate future economic benefits; and
The development cost of the asset can be measured reliably.
Internally generated intangible assets are amortised on a straight-line basis over their useful lives. Where no internally generated intangible asset can be recognised, development expenditure is recognised as an expense in the period in which it is incurred.
Impairment of property, plant and equipment and intangible assets excluding goodwill At each reporting date, the Group reviews the carrying amounts of its property, plant and equipment and intangible assets to determine whether there is any indication that those assets have suffered an impairment loss. If any such indication exists, the recoverable amount of the asset is estimated in order to determine the extent of the impairment loss (if any). Where the asset does not generate cash flows that are independent from other assets, the Group estimates the recoverable amount of the cash-generating unit to which the asset belongs.
Recoverable amount is the higher of fair value less costs to sell and value in use. In assessing value in use, the estimated future cash flows are discounted to their present value using a pre-tax discount rate that reflects current market assessments of the time value of money and the risks specific to the asset for which the estimates of future cash flows have not been adjusted.
If the recoverable amount of an asset (or cash-generating unit) is estimated to be less than its carrying amount, the carrying amount of the asset (or cash-generating unit) is reduced to its recoverable amount. An impairment loss is recognised as an expense immediately, unless the relevant asset is carried at a revalued amount, in which case the impairment loss is treated as a revaluation decrease.
Where an impairment loss subsequently reverses, the carrying amount of the asset (or cash-generating unit) is increased to the revised estimate of its recoverable amount, but so that the increased carrying amount does not exceed the carrying amount that would have been determined had no impairment loss been recognised for the asset (or cash-generating unit) in prior periods. A reversal of an impairment loss is recognised as income immediately, unless the relevant asset is carried at a revalued amount, in which case the reversal of the impairment loss is treated as a revaluation increase.
Leases Leases are classified as finance leases whenever the terms of the lease transfer substantially all the risks and rewards of ownership to the lessee. All other leases are classified as operating leases.
The Group as lessee Assets held under finance leases are recognised as assets of the Group at their fair value or, if lower, at the present value of the minimum lease payments, each determined at the inception of the lease. The corresponding liability to the lessor is included in the balance sheet as a finance lease obligation. Lease payments are apportioned between finance expenses and reduction of the lease obligation so as to achieve a constant rate of interest on the remaining balance of the liability.
Rentals payable under operating leases are charged to income on a straight-line basis over the term of the relevant lease except where another more systematic basis is more representative of the time pattern in which economic benefits from the lease asset are consumed. Lease incentives are recognised as a liability and are allocated on a straight-line basis as a reduction of rental expense over the lease term.
The Group as lessor Rental income from operating leases, which have arisen from the sublet of vacant premises, is recognised on a straight-line basis over the term of the relevant lease.
Inventories Inventories are stated at the lower of cost and net realisable value. Cost is measured at standard and adjusted for material variances such that the adjusted figure represents direct materials, direct labour and an attributable proportion of manufacturing overheads based on normal levels of activity. Net realisable value is based on estimated selling price, less all estimated costs of completion and costs to be incurred in marketing, selling and distribution. Provision is made for obsolete, slow moving or defective items where appropriate.
71Volex plcAnnual Report and Accounts 2014
Notes to the financial statements continued For the 52 weeks ended 30 March 2014 (52 weeks ended 31 March 2013)
2. Significant accounting policies continued Cash and cash equivalents Cash and cash equivalents comprise cash on hand and demand deposits and other short term highly liquid investments that are readily convertible to a known amount of cash and are subject to an insignificant risk of change in value less bank overdrafts.
Bank borrowings Interest bearing bank loans and overdrafts are recorded at the proceeds received, net of direct issue costs. Finance charges, including premiums on settlement or redemption and direct issue costs, are accounted for on an accruals basis in the consolidated income statement using the effective interest rate method and are added to the carrying amount of the instrument to the extent that they are not settled in the period in which they arise.
Provisions Provisions are recognised when the Group has a present obligation (legal or constructive) as a result of a past event, it is probable that the Group will be required to settle the obligation, and a reliable estimate can be made of the amount of the obligation.
The amount recognised as a provision is the best estimate of the consideration required to settle the present obligation at the reporting date, taking into account the risks and uncertainties surrounding the obligation. Where a provision is measured using the cash flows estimated to settle the present obligation, its carrying value is the present value of those cash flows (when the effect of the time value of money is material).
Present obligations arising under onerous lease contracts are recognised and measured as provisions. An onerous contract is considered to exist where the Group has a contract under which the unavoidable costs of meeting the obligations under the contract exceed the economic benefits expected to be received under it.
A restructuring provision is recognised when the Group has developed a detailed formal plan for restructuring and has raised a valid expectation in those affected that it will carry out the restructuring by starting to implement the plan or announcing its main features to those affected by it. The measurement of a restructuring provision includes only the direct expenditures arising from the restructuring, which are those amounts that are both necessarily entailed by the restructuring and not associated with ongoing activities of the entity.
Provisions for the expected cost of warranty obligations under local sales of goods legislation are recognised at the date of sale of the relevant products, at the Directors’ best estimate of the expenditure required to settle the Group’s obligation.
Retirement benefits The Group has both defined benefit and defined contribution retirement benefit schemes, the former of which is now closed to new entrants. The retirement benefit obligation recognised in the consolidated balance sheet represents the deficit or surplus in the Group’s defined benefit scheme.
For defined benefit schemes, the cost of providing benefits is determined using the Projected Unit Credit Method, with actuarial valuations carried out at the end of each reporting period.
Defined benefit costs are split into three categories:
Remeasurement;
Net interest expense or income; and
Past service cost and gains and losses on curtailments and settlements.
Remeasurement comprises actuarial gains and losses, the effect of the asset ceiling (where applicable) and the return on scheme assets (excluding interest). These costs are recognised immediately in the balance sheet with a charge or credit to the statement of comprehensive income in the period in which they occur. Remeasurement recorded in the statement of comprehensive income is not recycled.
Net interest is calculated by applying a discount rate to the net defined benefit liability or asset and is recognised within finance costs (see note 6). As the defined benefit scheme is now closed, no service cost is incurred.
Payments to defined contribution retirement benefit schemes are recognised as an expense when employees have rendered service entitling them to the contributions. Payments to state-managed schemes are treated as payments to defined contribution schemes where the Group’s obligations under the schemes are equivalent to those arising in a defined contribution scheme.
Share-based payments Equity-settled share-based payments are issued to certain employees and are measured at the fair value of the equity instruments at the date of grant. The fair value excludes the effect of non-market-based vesting conditions. Details regarding the determination of the fair value of equity-settled share-based transactions are set out in note 28.
The fair value determined at the date of grant of the equity-settled share-based payments is expensed to the income statement on a straight-line basis over the vesting period, based on the estimate of the number of options that will eventually vest. At each reporting date, the Group revises its estimate of the number of equity instruments expected to vest as a result of the effect of non-market-based vesting conditions. The impact of the revision of the original estimates, if any, is recognised in profit or loss such that the cumulative expense reflects the revised estimate, with a corresponding adjustment to reserves.
72 Volex plcAnnual Report and Accounts 2014
2. Significant accounting policies continued For cash-settled share-based payments, a liability is recognised, measured initially at fair value. At each reporting date until the liability is settled, and at the date of settlement, the fair value of the liability is remeasured, with any changes in fair value recognised in profit or loss for the period.
Non-recurring items Costs that are one-off in nature and significant, such as restructuring costs, are deemed to be non-recurring by virtue of their nature and size. They are included under the statutory classification appropriate to their nature but are separately disclosed on the face of the income statement to assist in understanding the financial performance of the Group and the Company.
Share capital Ordinary shares are classified as equity. Incremental costs directly attributable to the issue of new shares or options are shown in equity as a deduction from the proceeds, net of tax.
Financial instruments Financial assets and financial liabilities are recognised in the Group’s statement of financial position when the Group becomes a party to the contractual provisions of the instrument.
Financial assets All financial assets are recognised and derecognised on a trade date where the purchase or sale of a financial asset is under a contract whose terms require delivery of the financial asset within the time frame established by the market concerned, and are initially measured at fair value, plus transaction costs except for those financial assets classified as fair value through profit or loss which are initially measured at fair value.
Financial assets are classified into the following specified categories: financial assets ‘at fair value through profit or loss’, ‘held-to-maturity’ investments, ‘available-for-sale’ financial assets and ‘loans and receivables’. The classification depends on the nature and purpose of the financial assets and is determined at the time of initial recognition.
Effective interest method The effective interest method is a method of calculating the amortised cost of a financial asset or liability and of allocating interest income or expense over the relevant period. The effective interest rate is the rate that exactly discounts estimated future cash payments through the expected life of the financial asset/liability, or, where appropriate, a shorter period, to the net carrying amount on initial recognition.
Financial assets at ‘fair value through profit or loss’ (‘FVTPL’) Financial assets are classified as at FVTPL when the financial asset is either held for trading or it is designated as at FVTPL. Financial assets at FVTPL are stated at fair value, with any gains or losses arising on remeasurement recognised in profit or loss. The net gain or loss recognised in profit or loss incorporates any dividend or interest earned on the financial asset.
Held-to-maturity investments Held-to-maturity investments are non-derivative financial assets with fixed or determinable payments and fixed maturity dates that the Group has the positive intent and ability to hold to maturity. Subsequent to initial recognition, held-to-maturity investments are measured at amortised cost using the effective interest method less any impairment.
Available-for-sale financial assets (‘AFS’) AFS financial assets are non-derivatives that are either designated as AFS or are not classified as (a) loans and receivables, (b) held-to-maturity investments or (c) financial assets at fair value through profit or loss.
Changes in the carrying amount of AFS monetary financial assets relating to changes in foreign currency rates, interest income calculated using the effective interest method and dividends on AFS equity investments are recognised in profit or loss. Other changes in the carrying amount of available-for-sale financial assets are recognised in other comprehensive income and accumulated under the heading of investments revaluation reserve. Where the investment is disposed of or is determined to be impaired, the cumulative gain or loss previously accumulated in the investments revaluation reserve is reclassified to profit or loss.
Loans and receivables Trade receivables, loans and other receivables that have fixed or determinable payments that are not quoted in an active market are classified as ‘loans and receivables’. Loans and receivables are measured at amortised cost using the effective interest method less impairment. Interest is recognised by applying the effective interest rate, except for short term receivables when the recognition of interest would be immaterial.
Impairment of financial assets Financial assets are assessed for indicators of impairment at each reporting date. Financial assets are impaired where there is objective evidence that as a result of one or more events that occurred after the initial recognition of the financial asset, the estimated future cash flows of the investment have been impacted. For loans and receivables the amount of the impairment is the difference between the asset’s carrying amount and the present value of estimated future cash flows, discounted at the original effective interest rate.
The carrying amount of the financial asset is reduced by the impairment loss directly for all financial assets with the exception of trade receivables where the carrying amount is reduced through the use of an allowance account. A provision for impairment of trade receivables is recognised in the income statement within operating expenses. When a trade receivable is uncollectible, it is written off against the allowance account. Subsequent recoveries of amounts previously written off are credited against operating expenses in the income statement.
73Volex plcAnnual Report and Accounts 2014
Notes to the financial statements continued For the 52 weeks ended 30 March 2014 (52 weeks ended 31 March 2013)
2. Significant accounting policies continued Derecognition of financial assets The Group derecognises a financial asset only when the contractual rights to the cash flows from the asset expire, or when it transfers the financial asset and substantially all the risks and rewards of ownership of the asset to another entity. If the Group neither transfers nor retains substantially all the risks and rewards of ownership and continues to control the transferred asset, the Group recognises its retained interest in the asset and an associated liability for amounts it may have to pay. If the Group retains substantially all the risks and rewards of ownership of a transferred financial asset, the Group continues to recognise the financial asset and also recognises a collateralised borrowing for the proceeds received.
Financial liabilities and equity Debt and equity instruments are classified as either financial liabilities or as equity in accordance with the substance of the contractual arrangement.
Financial liabilities Financial liabilities are classified as either financial liabilities ‘at fair value through profit or loss’ or other financial liabilities.
Financial liabilities at fair value through profit or loss Financial liabilities at fair value through profit or loss are initially measured at fair value and subsequently stated at fair value, with any resultant gain or loss recognised in profit or loss. The net gain or loss recognised in profit or loss incorporates any interest paid on the financial liability.
Other financial liabilities Other financial liabilities are initially measured at fair value, net of transaction costs. Other financial liabilities are subsequently measured at amortised cost using the effective interest method, with interest expense recognised on an effective yield basis.
Derecognition of financial liabilities The Group derecognises financial liabilities when, and only when, the Group’s obligations are discharged, cancelled or they expire.
Derivative financial instruments The Group’s activities expose it to the financial risks of changes in foreign exchange rates, interest rates and commodity prices. The Group enters into a variety of derivative financial instruments to manage its exposure to these risks. The use of financial derivatives is governed by a Group policy approved by the Board of Directors which provides written principles on the use of financial derivatives to hedge certain risk exposures. The Group does not use derivative financial instruments for speculative purposes. Further details of derivative financial instruments are disclosed in note 30 to the financial statements.
Derivatives are initially recognised at fair value on the date a derivative contract is entered into and are subsequently remeasured to their fair value at each reporting date. The resulting gain or loss is recognised in profit or loss immediately unless the derivative is designated and effective as a hedging instrument, in which event, the timing of the recognition in profit or loss depends on the nature of the hedge relationship. The Group designates certain derivatives as either fair value hedges, cash flow hedges or hedges of net investments in foreign operations.
A derivative is classified as a non-current asset or a non-current liability if the remaining maturity of the instrument is more than 12 months and it is not expected to be realised or settled within 12 months. Other derivatives are presented as current assets or current liabilities.
Hedge accounting The Group designates certain hedging instruments, which include derivatives and non-derivatives in respect of foreign currency risk as either cash flow hedges or hedges of net investments in foreign operations.
At the inception of the hedge relationship the entity documents the relationship between the hedging instrument and hedged item, along with its risk management objectives and its strategy for undertaking various hedge transactions. Furthermore, at the inception of the hedge and on an ongoing basis, the Group documents whether the hedging instruments that are used in hedging transactions are highly effective in offsetting changes in fair values or cash flows of hedged items.
Cash flow hedge Hedges of foreign exchange risk on firm commitments are accounted for as cash flow hedges. Similarly, commodity derivative contracts which are entered into to mitigate commodity price fluctuations on firm purchasing commitments are accounted for as cash flow hedges.
The effective portion of changes in the fair value of derivatives that are designated and qualify as cash flow hedges is recognised in other comprehensive income. The gain or loss relating to the ineffective portion is recognised immediately in profit or loss.
Hedges of net investments in foreign operations Any gain or loss on the hedging instrument relating to the effective portion of the hedge is recognised in other comprehensive income and accumulated in the hedging and translation reserve. The gain or loss relating to the ineffective portion is recognised immediately in profit or loss.
Gains and losses deferred in the hedging and translation reserve are recognised immediately in profit or loss when the foreign operation is disposed of.
74 Volex plcAnnual Report and Accounts 2014
2. Significant accounting policies continued Critical judgements and estimates in applying the accounting policies The preparation of financial statements in conformity with IFRSs requires the use of certain critical accounting estimates. It also requires management to exercise its judgement in the process of applying the Group’s accounting policies. Management has made the following judgements and estimates that have the most significant effect on the amounts recognised in the financial statements.
Development cost capitalisation As at 30 March 2014, the Group had capitalised development costs of $2,303,000 (2013: $237,000) relating to Active Optical Cable (‘AOC’) technology. The Group believes that these costs meet the criteria of IAS 38 ‘Intangible Assets’. To assess whether ‘probable future economic benefit’ will be generated from the intangible asset, the Group has developed a financial forecast which includes a number of assumptions. Failure to perform in line with this forecast may lead to a material reduction in the asset.
Deferred tax The Group operates in a large number of different tax jurisdictions. Deferred tax assets and liabilities require management judgement in determining the amounts to be recognised. In particular, significant judgement is used when assessing the extent to which deferred tax assets should be recognised, with consideration given to the timing and level of future taxable income, time limits on the availability of taxable losses for carry forward and any future tax planning strategies.
Taxation Provisions for tax contingencies require management to make judgements and estimates in relation to tax issues and exposures. Amounts provided are based on management’s interpretation of country specific tax law. Tax benefits are not recognised unless the tax positions are capable of being sustained. In arriving at this position, management reviews each material tax benefit to assess whether a provision should be taken against full recognition of the benefit.
Property provisions As at 30 March 2014, the Group had property provisions of $3,849,000 (2013: $4,055,000) relating to onerous lease obligations arising from vacated leased premises and dilapidations. The provisions have been recorded taking into account management’s best estimate, following appropriate advice, of the anticipated net cost of the lease over the remaining lease term and the level of sublease rental income, if any, that can be obtained from subtenants. The net cost of the leases is then discounted using a 1.97% pre-tax risk free discount rate (2013: 2.25%). The provisions are regularly reviewed in light of the most current information available.
Pension benefits The present value of the pension obligations depends on a number of factors that are determined on an actuarial basis using a number of assumptions including the appropriate discount rate. Any changes in these assumptions will impact the carrying amount of the pension obligations. The Group determines the appropriate discount rate at the end of each period. This is the interest rate that should be used to determine the present value of estimated future cash outflows expected to be required to settle the pension obligations. In determining the appropriate discount rate, the Group considers the interest rates of high quality corporate bonds that are denominated in the currency in which the benefits will be paid, and that have terms to maturity approximating the terms of the related pension liability. Other key assumptions for pension obligations are based in part on current market conditions. Additional information is disclosed in note 29 to the financial statements.
Inventory provisions Inventories are carried at the lower of cost and net realisable value, which is calculated as the estimated sales proceeds less costs of sale. Factors considered in the determination of net realisable value are the ageing, category and condition of inventories, recent inventory utilisation and forecasts of projected inventory utilisation. Reviews of provisions held against damaged, obsolete and slow moving inventory are carried out at least quarterly by management and these reviews require the application of judgement and estimates. Changes to these estimates could result in changes to the net valuation of inventory.
3. Segment Information Subsequent to the change in executive management of the Group and a restructuring of the operations, the operating results presented to the Board have been revised. Replacing the four sectors of Consumer, Telecoms/Datacoms, Healthcare and Industrial are the two divisions of Power and Data. These divisions are based upon the nature of products that they supply. In addition, a Central division has been established to capture all of the corporate costs incurred in supporting the operations.
Power The sale and manufacture of electrical power products to manufacturers of electrical / electronic devices and appliances. These include laptop / desktop computers, printers, televisions, power tools and floor cleaning equipment.
Data The sale and manufacture of cables permitting the transfer of electronic and radio-frequency data. These cables can range from simple USB cables to complex high speed cable assemblies. Data cables are used in numerous devices including medical equipment, data centres, telecoms networks and the automotive industry.
Central Corporate costs that are not directly attributable to the manufacture and sale of the Group’s products but which support the Group in its operations. Included within this division are the costs incurred by the executive management team and the corporate head office.
The Board believes that the segmentation of the Group based upon product characteristics allows it to better understand the Group’s performance and profitability.
75Volex plcAnnual Report and Accounts 2014
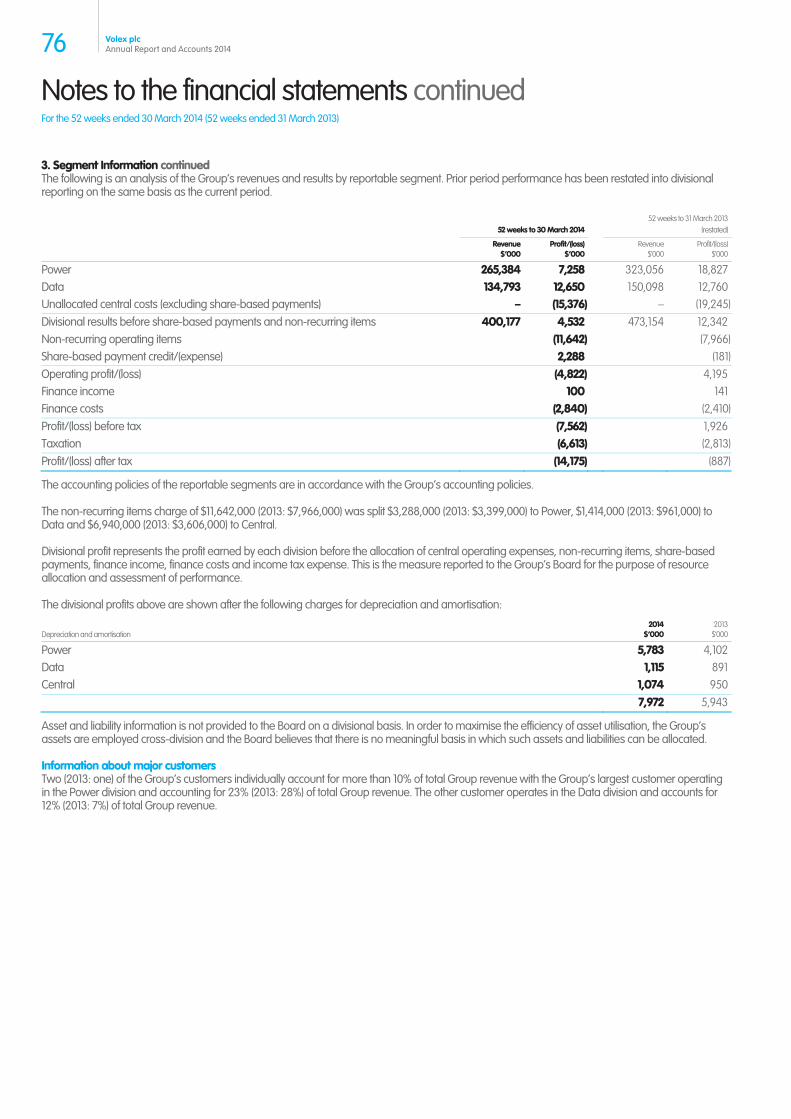
Notes to the financial statements continued For the 52 weeks ended 30 March 2014 (52 weeks ended 31 March 2013)
3. Segment Information continued The following is an analysis of the Group’s revenues and results by reportable segment. Prior period performance has been restated into divisional reporting on the same basis as the current period.
52 weeks to 30 March 2014 52 weeks to 31 March 2013
(restated)
Revenue
$’000Profit/(loss)
$’000 Revenue
$’000Profit/(loss)
$’000
Power 265,384 7,258 323,056 18,827Data 134,793 12,650 150,098 12,760Unallocated central costs (excluding share-based payments) – (15,376) – (19,245)Divisional results before share-based payments and non-recurring items 400,177 4,532 473,154 12,342Non-recurring operating items (11,642) (7,966)Share-based payment credit/(expense) 2,288 (181)Operating profit/(loss) (4,822) 4,195Finance income 100 141Finance costs (2,840) (2,410)Profit/(loss) before tax (7,562) 1,926Taxation (6,613) (2,813)Profit/(loss) after tax (14,175) (887)
The accounting policies of the reportable segments are in accordance with the Group’s accounting policies.
The non-recurring items charge of $11,642,000 (2013: $7,966,000) was split $3,288,000 (2013: $3,399,000) to Power, $1,414,000 (2013: $961,000) to Data and $6,940,000 (2013: $3,606,000) to Central.
Divisional profit represents the profit earned by each division before the allocation of central operating expenses, non-recurring items, share-based payments, finance income, finance costs and income tax expense. This is the measure reported to the Group’s Board for the purpose of resource allocation and assessment of performance.
The divisional profits above are shown after the following charges for depreciation and amortisation:
Depreciation and amortisation 2014
$’000 2013
$’000
Power 5,783 4,102Data 1,115 891Central 1,074 950 7,972 5,943
Asset and liability information is not provided to the Board on a divisional basis. In order to maximise the efficiency of asset utilisation, the Group’s assets are employed cross-division and the Board believes that there is no meaningful basis in which such assets and liabilities can be allocated.
Information about major customers Two (2013: one) of the Group’s customers individually account for more than 10% of total Group revenue with the Group’s largest customer operating in the Power division and accounting for 23% (2013: 28%) of total Group revenue. The other customer operates in the Data division and accounts for 12% (2013: 7%) of total Group revenue.
76 Volex plcAnnual Report and Accounts 2014
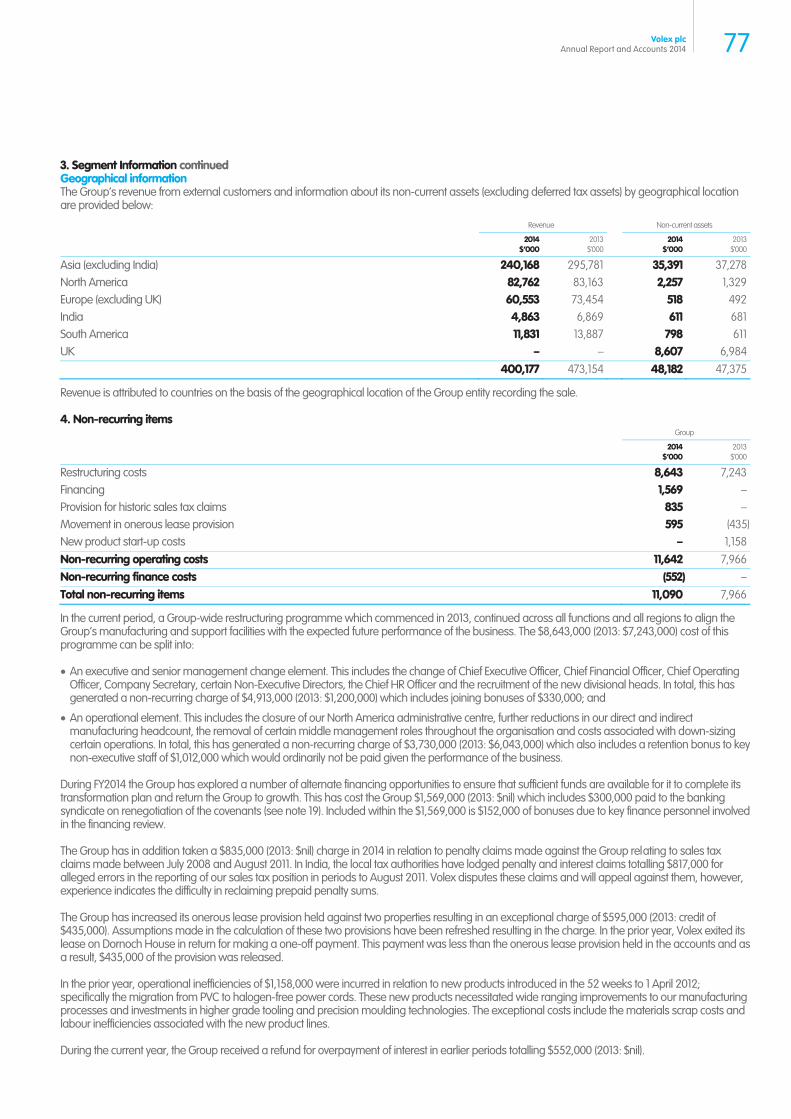
3. Segment Information continued Geographical information The Group’s revenue from external customers and information about its non-current assets (excluding deferred tax assets) by geographical location are provided below:
Revenue Non-current assets
2014
$’0002013
$’000 2014
$’0002013
$’000
Asia (excluding India) 240,168 295,781 35,391 37,278North America 82,762 83,163 2,257 1,329Europe (excluding UK) 60,553 73,454 518 492India 4,863 6,869 611 681South America 11,831 13,887 798 611UK – – 8,607 6,984 400,177 473,154 48,182 47,375
Revenue is attributed to countries on the basis of the geographical location of the Group entity recording the sale.
4. Non-recurring items Group
2014
$’000 2013
$’000
Restructuring costs 8,643 7,243Financing 1,569 –Provision for historic sales tax claims 835 –Movement in onerous lease provision 595 (435)New product start-up costs – 1,158Non-recurring operating costs 11,642 7,966Non-recurring finance costs (552) –Total non-recurring items 11,090 7,966
In the current period, a Group-wide restructuring programme which commenced in 2013, continued across all functions and all regions to align the Group’s manufacturing and support facilities with the expected future performance of the business. The $8,643,000 (2013: $7,243,000) cost of this programme can be split into:
An executive and senior management change element. This includes the change of Chief Executive Officer, Chief Financial Officer, Chief Operating Officer, Company Secretary, certain Non-Executive Directors, the Chief HR Officer and the recruitment of the new divisional heads. In total, this has generated a non-recurring charge of $4,913,000 (2013: $1,200,000) which includes joining bonuses of $330,000; and
An operational element. This includes the closure of our North America administrative centre, further reductions in our direct and indirect manufacturing headcount, the removal of certain middle management roles throughout the organisation and costs associated with down-sizing certain operations. In total, this has generated a non-recurring charge of $3,730,000 (2013: $6,043,000) which also includes a retention bonus to key non-executive staff of $1,012,000 which would ordinarily not be paid given the performance of the business.
During FY2014 the Group has explored a number of alternate financing opportunities to ensure that sufficient funds are available for it to complete its transformation plan and return the Group to growth. This has cost the Group $1,569,000 (2013: $nil) which includes $300,000 paid to the banking syndicate on renegotiation of the covenants (see note 19). Included within the $1,569,000 is $152,000 of bonuses due to key finance personnel involved in the financing review.
The Group has in addition taken a $835,000 (2013: $nil) charge in 2014 in relation to penalty claims made against the Group relating to sales tax claims made between July 2008 and August 2011. In India, the local tax authorities have lodged penalty and interest claims totalling $817,000 for alleged errors in the reporting of our sales tax position in periods to August 2011. Volex disputes these claims and will appeal against them, however, experience indicates the difficulty in reclaiming prepaid penalty sums.
The Group has increased its onerous lease provision held against two properties resulting in an exceptional charge of $595,000 (2013: credit of $435,000). Assumptions made in the calculation of these two provisions have been refreshed resulting in the charge. In the prior year, Volex exited its lease on Dornoch House in return for making a one-off payment. This payment was less than the onerous lease provision held in the accounts and as a result, $435,000 of the provision was released.
In the prior year, operational inefficiencies of $1,158,000 were incurred in relation to new products introduced in the 52 weeks to 1 April 2012; specifically the migration from PVC to halogen-free power cords. These new products necessitated wide ranging improvements to our manufacturing processes and investments in higher grade tooling and precision moulding technologies. The exceptional costs include the materials scrap costs and labour inefficiencies associated with the new product lines.
During the current year, the Group received a refund for overpayment of interest in earlier periods totalling $552,000 (2013: $nil).
77Volex plcAnnual Report and Accounts 2014
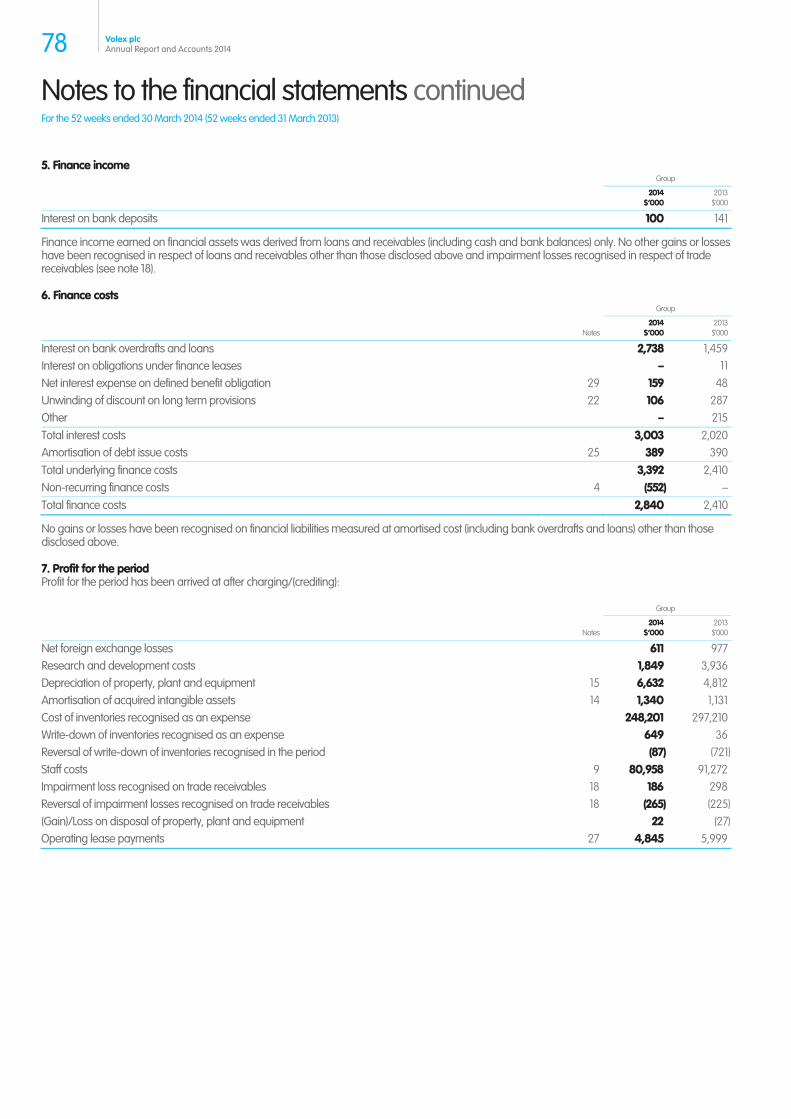
Notes to the financial statements continued For the 52 weeks ended 30 March 2014 (52 weeks ended 31 March 2013)
5. Finance income Group
2014
$’000 2013
$’000
Interest on bank deposits 100 141
Finance income earned on financial assets was derived from loans and receivables (including cash and bank balances) only. No other gains or losses have been recognised in respect of loans and receivables other than those disclosed above and impairment losses recognised in respect of trade receivables (see note 18).
6. Finance costs Group
Notes 2014
$’0002013
$’000
Interest on bank overdrafts and loans 2,738 1,459Interest on obligations under finance leases – 11Net interest expense on defined benefit obligation 29 159 48Unwinding of discount on long term provisions 22 106 287Other – 215Total interest costs 3,003 2,020Amortisation of debt issue costs 25 389 390Total underlying finance costs 3,392 2,410Non-recurring finance costs 4 (552) –Total finance costs 2,840 2,410
No gains or losses have been recognised on financial liabilities measured at amortised cost (including bank overdrafts and loans) other than those disclosed above.
7. Profit for the period Profit for the period has been arrived at after charging/(crediting):
Group
Notes 2014
$’000 2013
$’000
Net foreign exchange losses 611 977Research and development costs 1,849 3,936Depreciation of property, plant and equipment 15 6,632 4,812Amortisation of acquired intangible assets 14 1,340 1,131Cost of inventories recognised as an expense 248,201 297,210Write-down of inventories recognised as an expense 649 36Reversal of write-down of inventories recognised in the period (87) (721)Staff costs 9 80,958 91,272Impairment loss recognised on trade receivables 18 186 298Reversal of impairment losses recognised on trade receivables 18 (265) (225)(Gain)/Loss on disposal of property, plant and equipment 22 (27)Operating lease payments 27 4,845 5,999
78 Volex plcAnnual Report and Accounts 2014
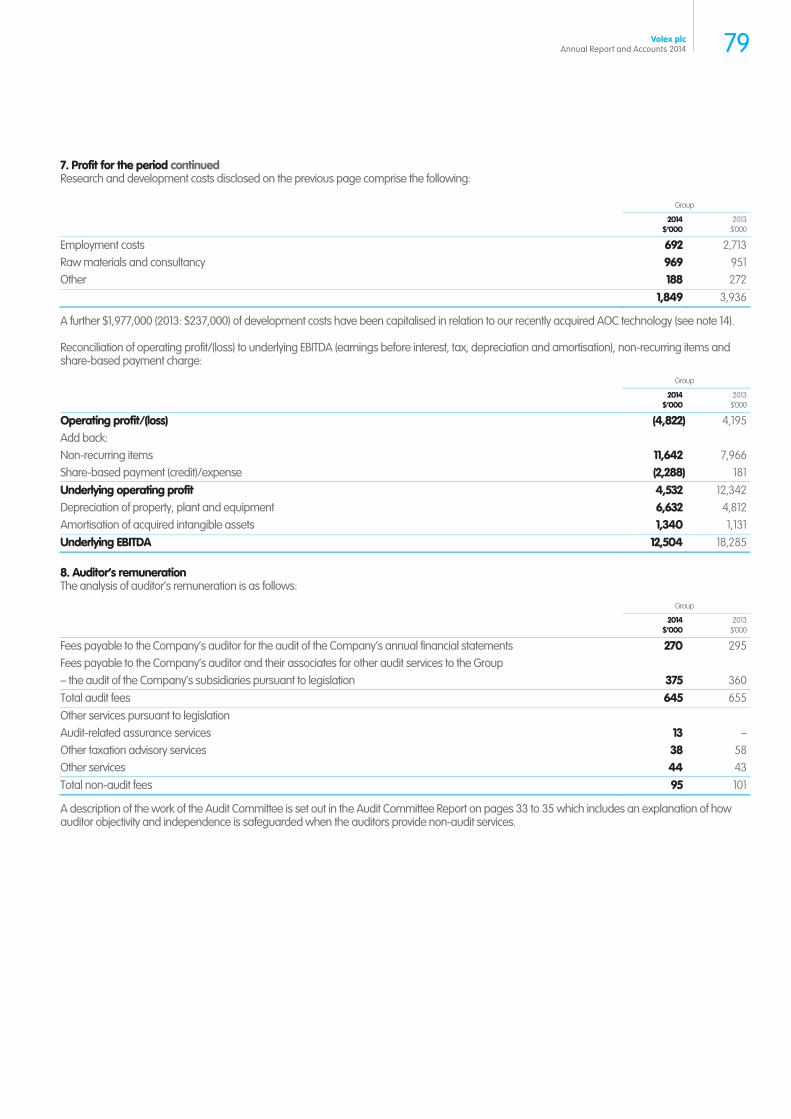
7. Profit for the period continued Research and development costs disclosed on the previous page comprise the following:
Group
2014
$’000 2013
$’000
Employment costs 692 2,713Raw materials and consultancy 969 951Other 188 272 1,849 3,936
A further $1,977,000 (2013: $237,000) of development costs have been capitalised in relation to our recently acquired AOC technology (see note 14).
Reconciliation of operating profit/(loss) to underlying EBITDA (earnings before interest, tax, depreciation and amortisation), non-recurring items and share-based payment charge:
Group
2014
$’0002013
$’000
Operating profit/(loss) (4,822) 4,195Add back: Non-recurring items 11,642 7,966Share-based payment (credit)/expense (2,288) 181Underlying operating profit 4,532 12,342Depreciation of property, plant and equipment 6,632 4,812Amortisation of acquired intangible assets 1,340 1,131Underlying EBITDA 12,504 18,285
8. Auditor’s remuneration The analysis of auditor’s remuneration is as follows:
Group
2014$’000
2013$’000
Fees payable to the Company’s auditor for the audit of the Company’s annual financial statements 270 295Fees payable to the Company’s auditor and their associates for other audit services to the Group – the audit of the Company’s subsidiaries pursuant to legislation 375 360Total audit fees 645 655Other services pursuant to legislation Audit-related assurance services 13 –Other taxation advisory services 38 58Other services 44 43Total non-audit fees 95 101
A description of the work of the Audit Committee is set out in the Audit Committee Report on pages 33 to 35 which includes an explanation of how auditor objectivity and independence is safeguarded when the auditors provide non-audit services.
79Volex plcAnnual Report and Accounts 2014
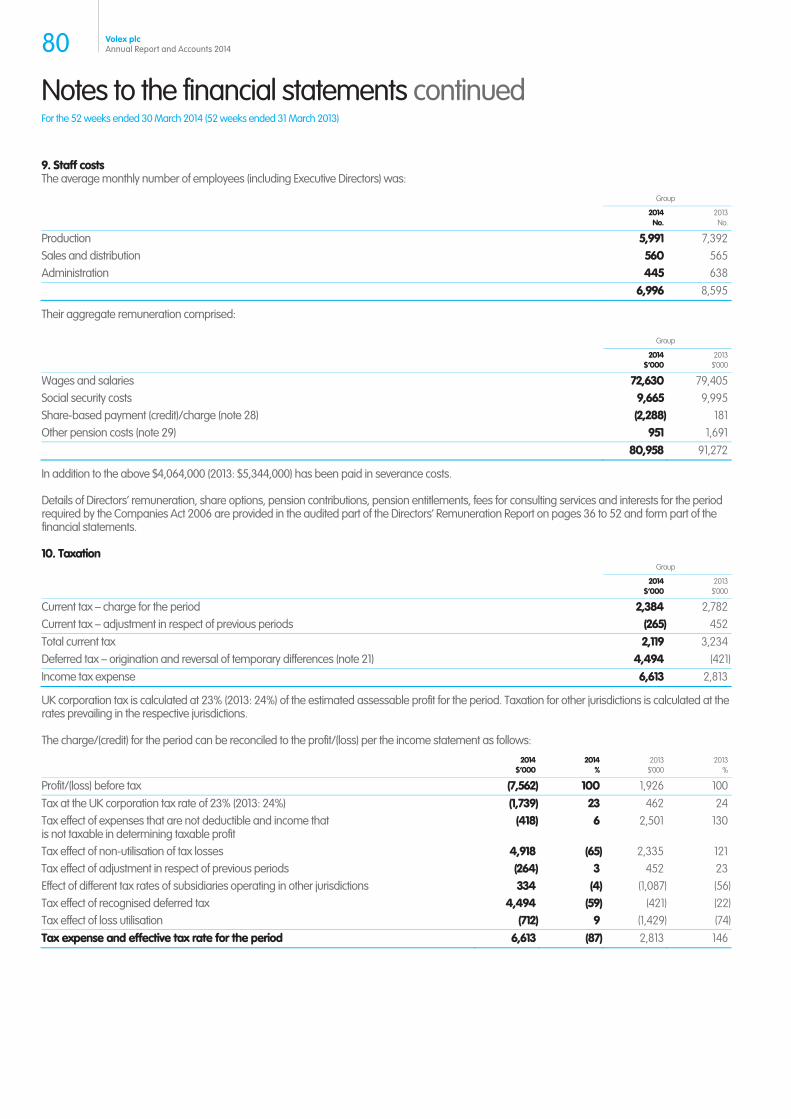
Notes to the financial statements continued For the 52 weeks ended 30 March 2014 (52 weeks ended 31 March 2013)
9. Staff costs The average monthly number of employees (including Executive Directors) was:
Group
2014No.
2013No.
Production 5,991 7,392Sales and distribution 560 565Administration 445 638 6,996 8,595
Their aggregate remuneration comprised:
Group
2014
$’000 2013
$’000
Wages and salaries 72,630 79,405Social security costs 9,665 9,995Share-based payment (credit)/charge (note 28) (2,288) 181Other pension costs (note 29) 951 1,691 80,958 91,272
In addition to the above $4,064,000 (2013: $5,344,000) has been paid in severance costs.
Details of Directors’ remuneration, share options, pension contributions, pension entitlements, fees for consulting services and interests for the period required by the Companies Act 2006 are provided in the audited part of the Directors’ Remuneration Report on pages 36 to 52 and form part of the financial statements.
10. Taxation Group
2014$’000
2013$’000
Current tax – charge for the period 2,384 2,782Current tax – adjustment in respect of previous periods (265) 452Total current tax 2,119 3,234Deferred tax – origination and reversal of temporary differences (note 21) 4,494 (421)Income tax expense 6,613 2,813
UK corporation tax is calculated at 23% (2013: 24%) of the estimated assessable profit for the period. Taxation for other jurisdictions is calculated at the rates prevailing in the respective jurisdictions.
The charge/(credit) for the period can be reconciled to the profit/(loss) per the income statement as follows:
2014
$’0002014
% 2013
$’0002013
%
Profit/(loss) before tax (7,562) 100 1,926 100Tax at the UK corporation tax rate of 23% (2013: 24%) (1,739) 23 462 24Tax effect of expenses that are not deductible and income that is not taxable in determining taxable profit
(418) 6 2,501 130
Tax effect of non-utilisation of tax losses 4,918 (65) 2,335 121Tax effect of adjustment in respect of previous periods (264) 3 452 23Effect of different tax rates of subsidiaries operating in other jurisdictions 334 (4) (1,087) (56)Tax effect of recognised deferred tax 4,494 (59) (421) (22)Tax effect of loss utilisation (712) 9 (1,429) (74)Tax expense and effective tax rate for the period 6,613 (87) 2,813 146
80 Volex plcAnnual Report and Accounts 2014
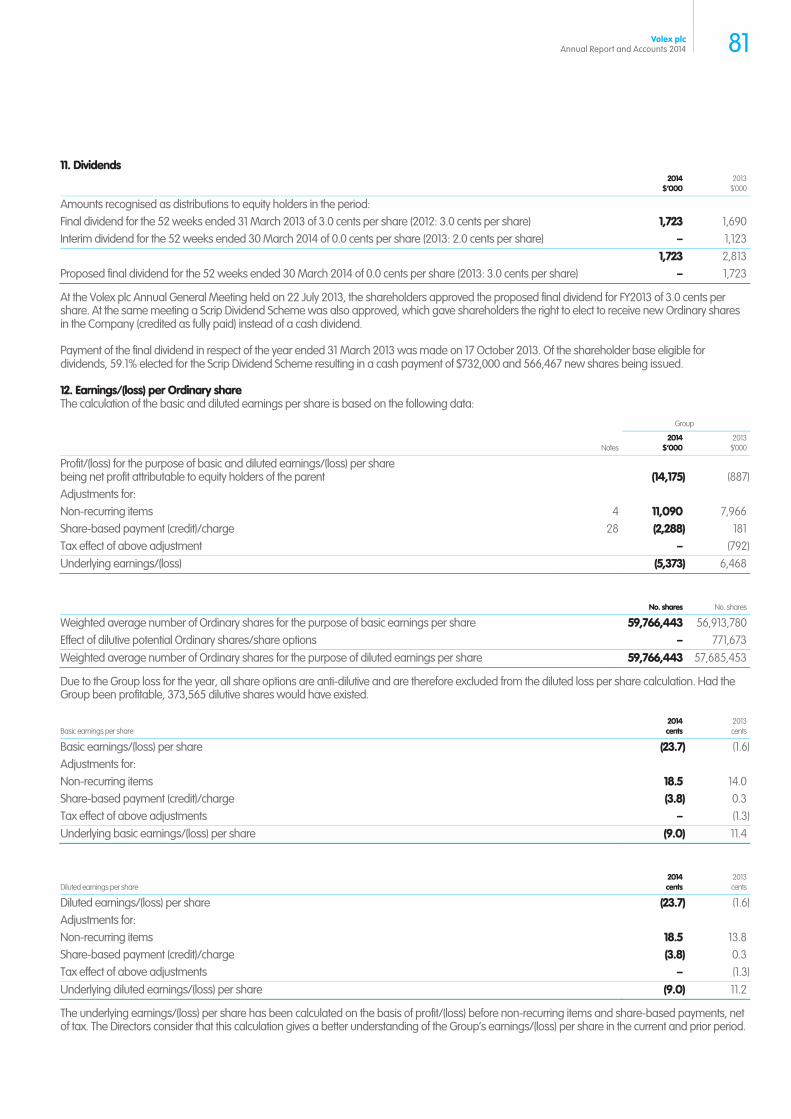
11. Dividends
2014
$’000 2013
$’000
Amounts recognised as distributions to equity holders in the period: Final dividend for the 52 weeks ended 31 March 2013 of 3.0 cents per share (2012: 3.0 cents per share) 1,723 1,690Interim dividend for the 52 weeks ended 30 March 2014 of 0.0 cents per share (2013: 2.0 cents per share) – 1,123 1,723 2,813Proposed final dividend for the 52 weeks ended 30 March 2014 of 0.0 cents per share (2013: 3.0 cents per share) – 1,723
At the Volex plc Annual General Meeting held on 22 July 2013, the shareholders approved the proposed final dividend for FY2013 of 3.0 cents per share. At the same meeting a Scrip Dividend Scheme was also approved, which gave shareholders the right to elect to receive new Ordinary shares in the Company (credited as fully paid) instead of a cash dividend.
Payment of the final dividend in respect of the year ended 31 March 2013 was made on 17 October 2013. Of the shareholder base eligible for dividends, 59.1% elected for the Scrip Dividend Scheme resulting in a cash payment of $732,000 and 566,467 new shares being issued.
12. Earnings/(loss) per Ordinary share The calculation of the basic and diluted earnings per share is based on the following data:
Group
Notes
2014$’000
2013$’000
Profit/(loss) for the purpose of basic and diluted earnings/(loss) per share being net profit attributable to equity holders of the parent
(14,175) (887)
Adjustments for: Non-recurring items 4 11,090 7,966Share-based payment (credit)/charge 28 (2,288) 181Tax effect of above adjustment – (792)Underlying earnings/(loss) (5,373) 6,468
No. shares No. shares
Weighted average number of Ordinary shares for the purpose of basic earnings per share 59,766,443 56,913,780Effect of dilutive potential Ordinary shares/share options – 771,673Weighted average number of Ordinary shares for the purpose of diluted earnings per share 59,766,443 57,685,453
Due to the Group loss for the year, all share options are anti-dilutive and are therefore excluded from the diluted loss per share calculation. Had the Group been profitable, 373,565 dilutive shares would have existed.
Basic earnings per share 2014cents
2013cents
Basic earnings/(loss) per share (23.7) (1.6)Adjustments for: Non-recurring items 18.5 14.0Share-based payment (credit)/charge (3.8) 0.3Tax effect of above adjustments – (1.3)Underlying basic earnings/(loss) per share (9.0) 11.4
Diluted earnings per share 2014cents
2013cents
Diluted earnings/(loss) per share (23.7) (1.6)Adjustments for: Non-recurring items 18.5 13.8Share-based payment (credit)/charge (3.8) 0.3Tax effect of above adjustments – (1.3)Underlying diluted earnings/(loss) per share (9.0) 11.2
The underlying earnings/(loss) per share has been calculated on the basis of profit/(loss) before non-recurring items and share-based payments, net of tax. The Directors consider that this calculation gives a better understanding of the Group’s earnings/(loss) per share in the current and prior period.
81Volex plcAnnual Report and Accounts 2014
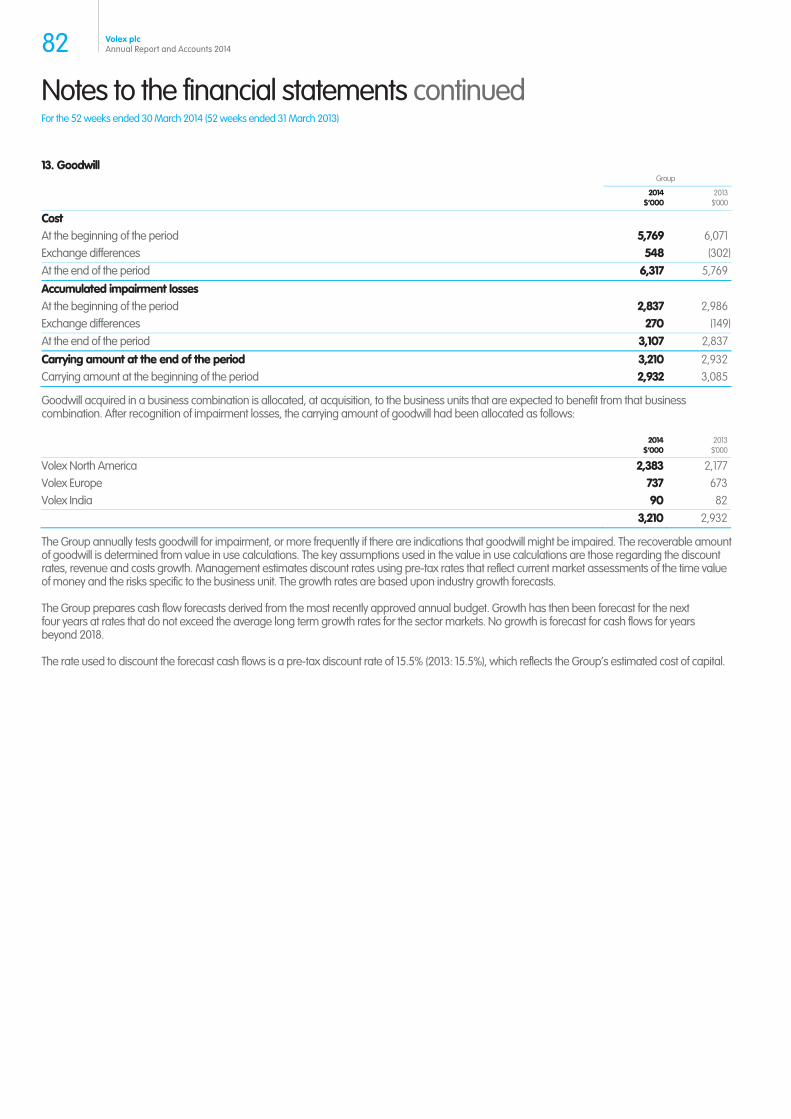
Notes to the financial statements continued For the 52 weeks ended 30 March 2014 (52 weeks ended 31 March 2013)
13. Goodwill Group
2014
$’000 2013
$’000
Cost At the beginning of the period 5,769 6,071Exchange differences 548 (302)At the end of the period 6,317 5,769
Accumulated impairment losses At the beginning of the period 2,837 2,986Exchange differences 270 (149)At the end of the period 3,107 2,837
Carrying amount at the end of the period 3,210 2,932Carrying amount at the beginning of the period 2,932 3,085
Goodwill acquired in a business combination is allocated, at acquisition, to the business units that are expected to benefit from that business combination. After recognition of impairment losses, the carrying amount of goodwill had been allocated as follows:
2014$’000
2013$’000
Volex North America 2,383 2,177Volex Europe 737 673Volex India 90 82 3,210 2,932
The Group annually tests goodwill for impairment, or more frequently if there are indications that goodwill might be impaired. The recoverable amount of goodwill is determined from value in use calculations. The key assumptions used in the value in use calculations are those regarding the discount rates, revenue and costs growth. Management estimates discount rates using pre-tax rates that reflect current market assessments of the time value of money and the risks specific to the business unit. The growth rates are based upon industry growth forecasts.
The Group prepares cash flow forecasts derived from the most recently approved annual budget. Growth has then been forecast for the next four years at rates that do not exceed the average long term growth rates for the sector markets. No growth is forecast for cash flows for years beyond 2018.
The rate used to discount the forecast cash flows is a pre-tax discount rate of 15.5% (2013: 15.5%), which reflects the Group’s estimated cost of capital.
82 Volex plcAnnual Report and Accounts 2014
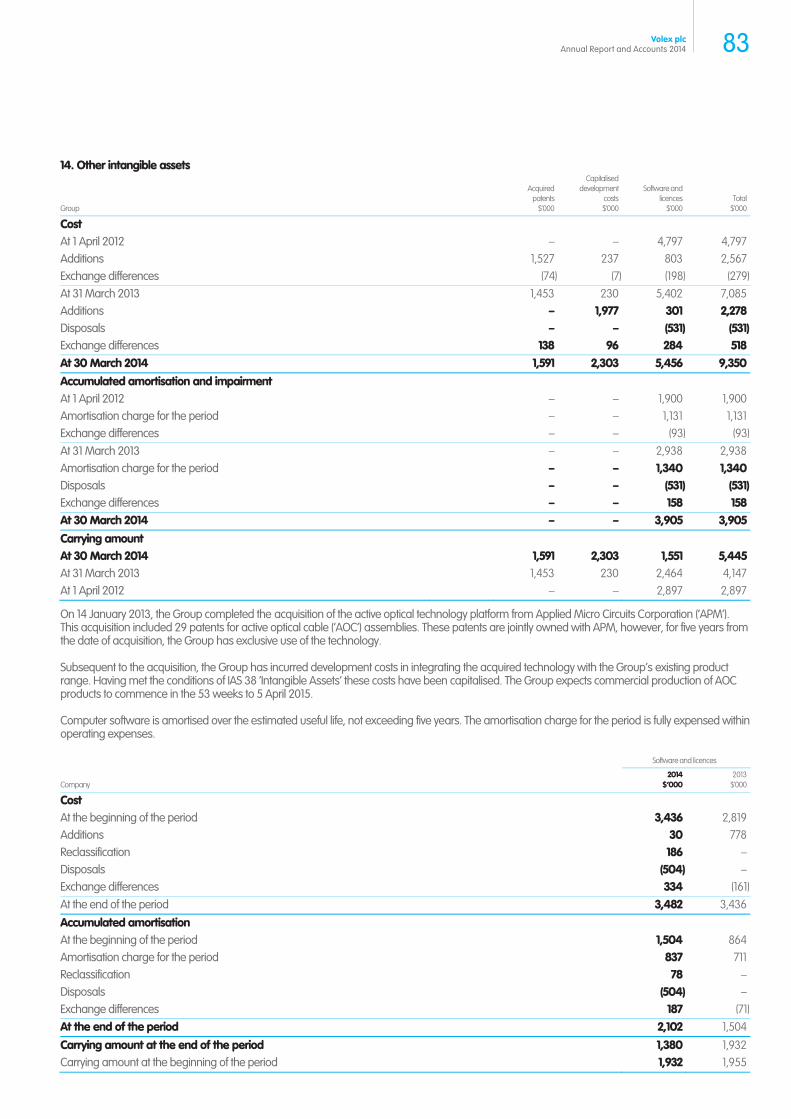
14. Other intangible assets
Group
Acquired patents
$’000
Capitalised development
costs $’000
Software and licences
$’000 Total
$’000
Cost At 1 April 2012 – – 4,797 4,797Additions 1,527 237 803 2,567Exchange differences (74) (7) (198) (279)At 31 March 2013 1,453 230 5,402 7,085Additions – 1,977 301 2,278Disposals – – (531) (531)Exchange differences 138 96 284 518At 30 March 2014 1,591 2,303 5,456 9,350Accumulated amortisation and impairment At 1 April 2012 – – 1,900 1,900Amortisation charge for the period – – 1,131 1,131Exchange differences – – (93) (93)At 31 March 2013 – – 2,938 2,938Amortisation charge for the period – – 1,340 1,340Disposals – – (531) (531)Exchange differences – – 158 158At 30 March 2014 – – 3,905 3,905Carrying amount At 30 March 2014 1,591 2,303 1,551 5,445At 31 March 2013 1,453 230 2,464 4,147At 1 April 2012 – – 2,897 2,897
On 14 January 2013, the Group completed the acquisition of the active optical technology platform from Applied Micro Circuits Corporation (‘APM’). This acquisition included 29 patents for active optical cable (‘AOC’) assemblies. These patents are jointly owned with APM, however, for five years from the date of acquisition, the Group has exclusive use of the technology.
Subsequent to the acquisition, the Group has incurred development costs in integrating the acquired technology with the Group’s existing product range. Having met the conditions of IAS 38 ‘Intangible Assets’ these costs have been capitalised. The Group expects commercial production of AOC products to commence in the 53 weeks to 5 April 2015.
Computer software is amortised over the estimated useful life, not exceeding five years. The amortisation charge for the period is fully expensed within operating expenses.
Company
Software and licences
2014$’000
2013$’000
Cost At the beginning of the period 3,436 2,819Additions 30 778Reclassification 186 –Disposals (504) –Exchange differences 334 (161)At the end of the period 3,482 3,436
Accumulated amortisation At the beginning of the period 1,504 864Amortisation charge for the period 837 711Reclassification 78 –Disposals (504) –Exchange differences 187 (71)At the end of the period 2,102 1,504
Carrying amount at the end of the period 1,380 1,932Carrying amount at the beginning of the period 1,932 1,955
83Volex plcAnnual Report and Accounts 2014
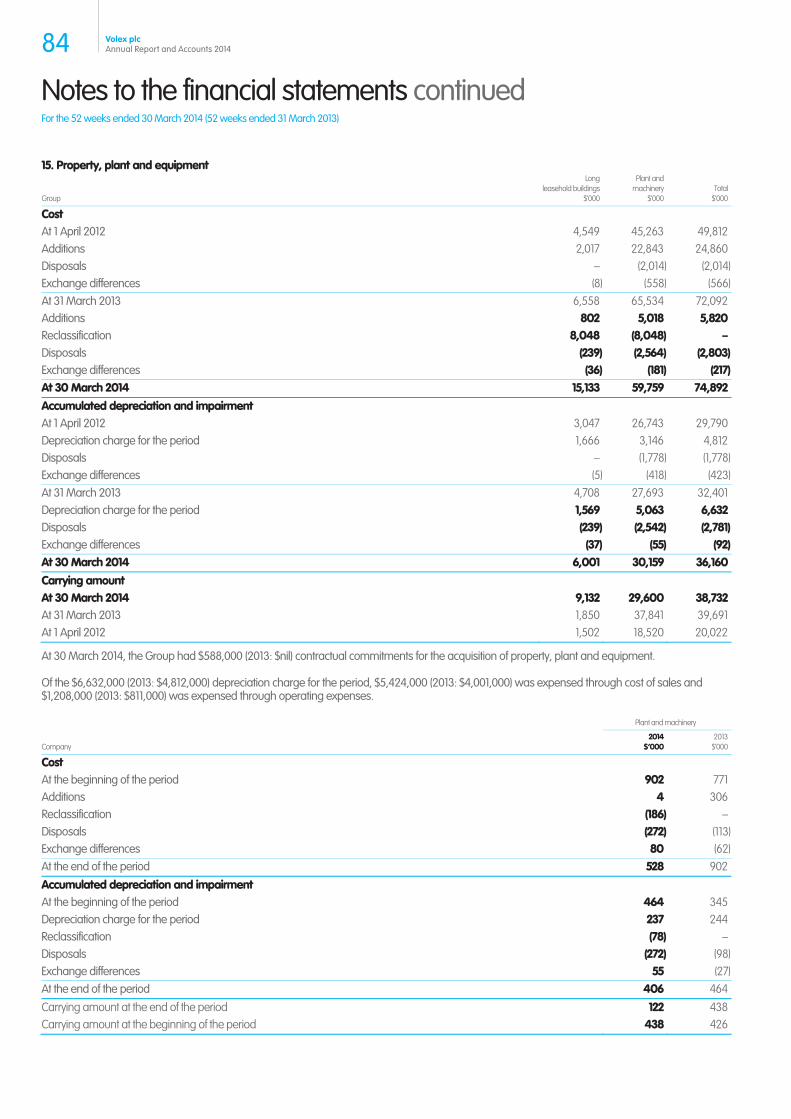
Notes to the financial statements continued For the 52 weeks ended 30 March 2014 (52 weeks ended 31 March 2013)
15. Property, plant and equipment
Group
Long leasehold buildings
$’000
Plant andmachinery
$’000 Total
$’000
Cost At 1 April 2012 4,549 45,263 49,812Additions 2,017 22,843 24,860Disposals – (2,014) (2,014)Exchange differences (8) (558) (566)At 31 March 2013 6,558 65,534 72,092Additions 802 5,018 5,820Reclassification 8,048 (8,048) –Disposals (239) (2,564) (2,803)Exchange differences (36) (181) (217)At 30 March 2014 15,133 59,759 74,892Accumulated depreciation and impairment At 1 April 2012 3,047 26,743 29,790Depreciation charge for the period 1,666 3,146 4,812Disposals – (1,778) (1,778)Exchange differences (5) (418) (423)At 31 March 2013 4,708 27,693 32,401Depreciation charge for the period 1,569 5,063 6,632Disposals (239) (2,542) (2,781)Exchange differences (37) (55) (92)At 30 March 2014 6,001 30,159 36,160Carrying amount At 30 March 2014 9,132 29,600 38,732At 31 March 2013 1,850 37,841 39,691At 1 April 2012 1,502 18,520 20,022
At 30 March 2014, the Group had $588,000 (2013: $nil) contractual commitments for the acquisition of property, plant and equipment.
Of the $6,632,000 (2013: $4,812,000) depreciation charge for the period, $5,424,000 (2013: $4,001,000) was expensed through cost of sales and $1,208,000 (2013: $811,000) was expensed through operating expenses.
Company
Plant and machinery
2014$’000
2013$’000
Cost At the beginning of the period 902 771Additions 4 306Reclassification (186) –Disposals (272) (113)Exchange differences 80 (62)At the end of the period 528 902
Accumulated depreciation and impairment At the beginning of the period 464 345Depreciation charge for the period 237 244Reclassification (78) –Disposals (272) (98)Exchange differences 55 (27)At the end of the period 406 464
Carrying amount at the end of the period 122 438Carrying amount at the beginning of the period 438 426
84 Volex plcAnnual Report and Accounts 2014
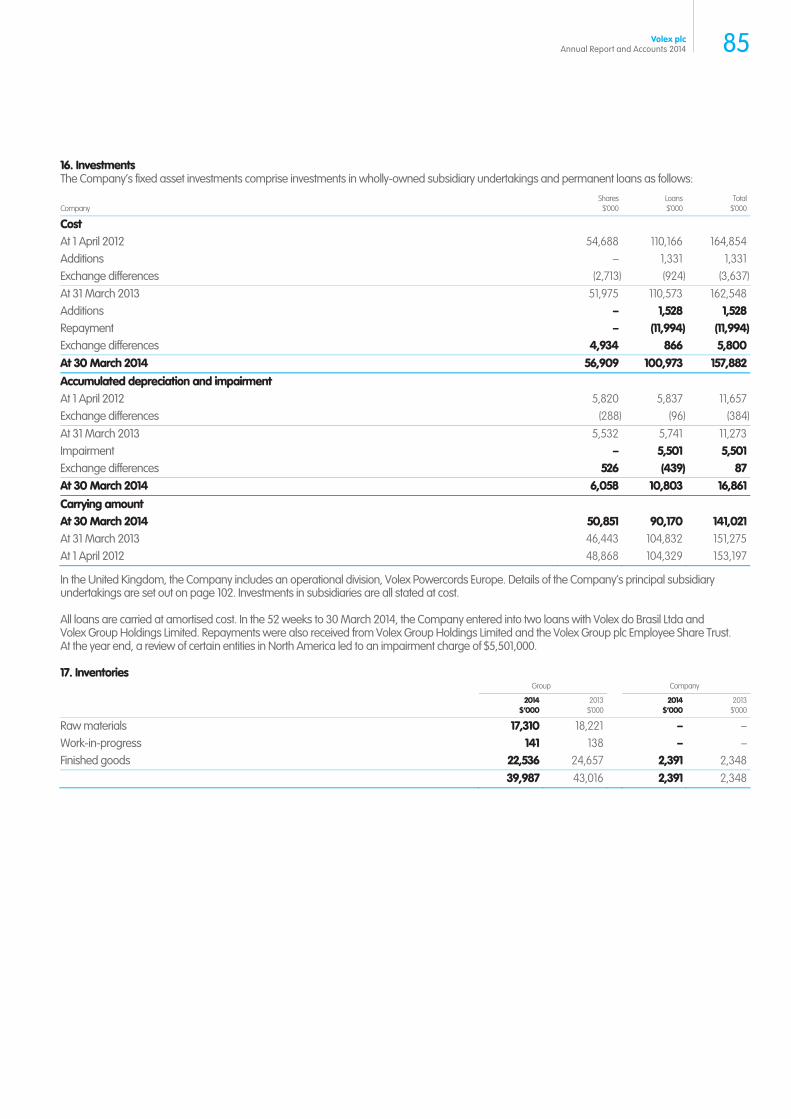
16. Investments The Company’s fixed asset investments comprise investments in wholly-owned subsidiary undertakings and permanent loans as follows:
Company Shares
$’000 Loans$’000
Total$’000
Cost At 1 April 2012 54,688 110,166 164,854Additions – 1,331 1,331Exchange differences (2,713) (924) (3,637)At 31 March 2013 51,975 110,573 162,548Additions – 1,528 1,528Repayment – (11,994) (11,994)Exchange differences 4,934 866 5,800At 30 March 2014 56,909 100,973 157,882Accumulated depreciation and impairment At 1 April 2012 5,820 5,837 11,657Exchange differences (288) (96) (384)At 31 March 2013 5,532 5,741 11,273Impairment – 5,501 5,501Exchange differences 526 (439) 87At 30 March 2014 6,058 10,803 16,861Carrying amount At 30 March 2014 50,851 90,170 141,021At 31 March 2013 46,443 104,832 151,275At 1 April 2012 48,868 104,329 153,197
In the United Kingdom, the Company includes an operational division, Volex Powercords Europe. Details of the Company’s principal subsidiary undertakings are set out on page 102. Investments in subsidiaries are all stated at cost.
All loans are carried at amortised cost. In the 52 weeks to 30 March 2014, the Company entered into two loans with Volex do Brasil Ltda and Volex Group Holdings Limited. Repayments were also received from Volex Group Holdings Limited and the Volex Group plc Employee Share Trust. At the year end, a review of certain entities in North America led to an impairment charge of $5,501,000.
17. Inventories Group Company
2014
$’0002013
$’000 2014
$’0002013
$’000
Raw materials 17,310 18,221 – –Work-in-progress 141 138 – –Finished goods 22,536 24,657 2,391 2,348 39,987 43,016 2,391 2,348
85Volex plcAnnual Report and Accounts 2014
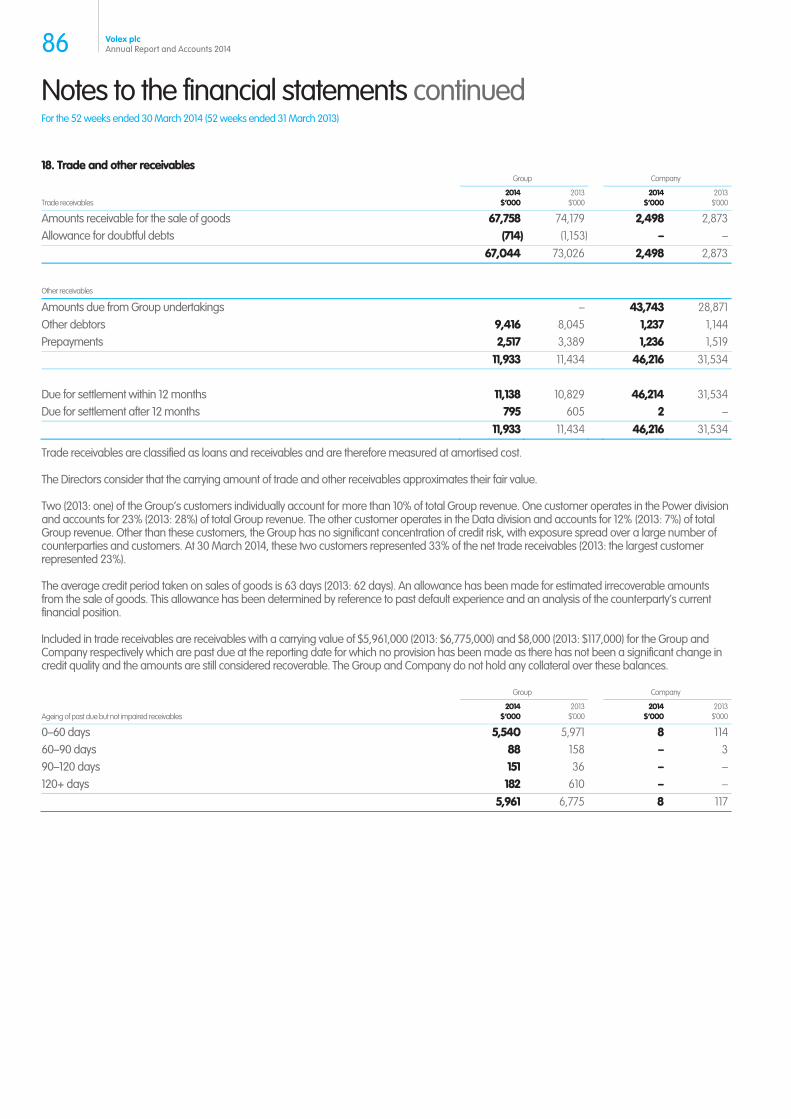
Notes to the financial statements continued For the 52 weeks ended 30 March 2014 (52 weeks ended 31 March 2013)
18. Trade and other receivables Group Company
Trade receivables 2014
$’0002013
$’000 2014
$’0002013
$’000
Amounts receivable for the sale of goods 67,758 74,179 2,498 2,873Allowance for doubtful debts (714) (1,153) – – 67,044 73,026 2,498 2,873
Other receivables
Amounts due from Group undertakings – 43,743 28,871Other debtors 9,416 8,045 1,237 1,144Prepayments 2,517 3,389 1,236 1,519 11,933 11,434 46,216 31,534 Due for settlement within 12 months 11,138 10,829 46,214 31,534Due for settlement after 12 months 795 605 2 – 11,933 11,434 46,216 31,534
Trade receivables are classified as loans and receivables and are therefore measured at amortised cost.
The Directors consider that the carrying amount of trade and other receivables approximates their fair value.
Two (2013: one) of the Group’s customers individually account for more than 10% of total Group revenue. One customer operates in the Power division and accounts for 23% (2013: 28%) of total Group revenue. The other customer operates in the Data division and accounts for 12% (2013: 7%) of total Group revenue. Other than these customers, the Group has no significant concentration of credit risk, with exposure spread over a large number of counterparties and customers. At 30 March 2014, these two customers represented 33% of the net trade receivables (2013: the largest customer represented 23%).
The average credit period taken on sales of goods is 63 days (2013: 62 days). An allowance has been made for estimated irrecoverable amounts from the sale of goods. This allowance has been determined by reference to past default experience and an analysis of the counterparty’s current financial position.
Included in trade receivables are receivables with a carrying value of $5,961,000 (2013: $6,775,000) and $8,000 (2013: $117,000) for the Group and Company respectively which are past due at the reporting date for which no provision has been made as there has not been a significant change in credit quality and the amounts are still considered recoverable. The Group and Company do not hold any collateral over these balances.
Group Company
Ageing of past due but not impaired receivables 2014
$’0002013
$’000 2014
$’0002013
$’000
0–60 days 5,540 5,971 8 11460–90 days 88 158 – 390–120 days 151 36 – –120+ days 182 610 – – 5,961 6,775 8 117
86 Volex plcAnnual Report and Accounts 2014
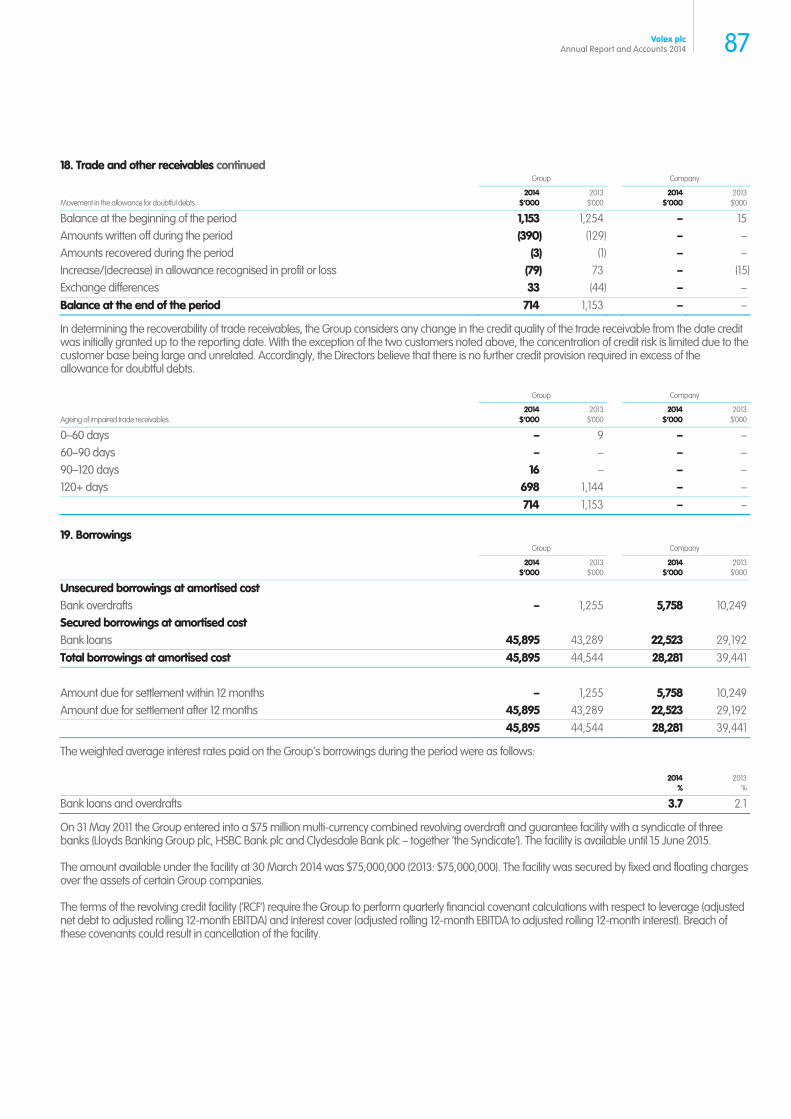
18. Trade and other receivables continued Group Company
Movement in the allowance for doubtful debts 2014
$’0002013
$’000 2014
$’000 2013
$’000
Balance at the beginning of the period 1,153 1,254 – 15Amounts written off during the period (390) (129) – –Amounts recovered during the period (3) (1) – –Increase/(decrease) in allowance recognised in profit or loss (79) 73 – (15)Exchange differences 33 (44) – –Balance at the end of the period 714 1,153 – –
In determining the recoverability of trade receivables, the Group considers any change in the credit quality of the trade receivable from the date credit was initially granted up to the reporting date. With the exception of the two customers noted above, the concentration of credit risk is limited due to the customer base being large and unrelated. Accordingly, the Directors believe that there is no further credit provision required in excess of the allowance for doubtful debts.
Group Company
Ageing of impaired trade receivables 2014
$’0002013
$’000 2014
$’0002013
$’000
0–60 days – 9 – –60–90 days – – – –90–120 days 16 – – –120+ days 698 1,144 – – 714 1,153 – –
19. Borrowings Group Company
2014
$’0002013
$’000 2014
$’0002013
$’000
Unsecured borrowings at amortised cost Bank overdrafts – 1,255 5,758 10,249Secured borrowings at amortised cost Bank loans 45,895 43,289 22,523 29,192Total borrowings at amortised cost 45,895 44,544 28,281 39,441 Amount due for settlement within 12 months – 1,255 5,758 10,249Amount due for settlement after 12 months 45,895 43,289 22,523 29,192 45,895 44,544 28,281 39,441
The weighted average interest rates paid on the Group’s borrowings during the period were as follows:
2014%
2013%
Bank loans and overdrafts 3.7 2.1
On 31 May 2011 the Group entered into a $75 million multi-currency combined revolving overdraft and guarantee facility with a syndicate of three banks (Lloyds Banking Group plc, HSBC Bank plc and Clydesdale Bank plc – together ‘the Syndicate’). The facility is available until 15 June 2015.
The amount available under the facility at 30 March 2014 was $75,000,000 (2013: $75,000,000). The facility was secured by fixed and floating charges over the assets of certain Group companies.
The terms of the revolving credit facility (‘RCF’) require the Group to perform quarterly financial covenant calculations with respect to leverage (adjusted net debt to adjusted rolling 12-month EBITDA) and interest cover (adjusted rolling 12-month EBITDA to adjusted rolling 12-month interest). Breach of these covenants could result in cancellation of the facility.
87Volex plcAnnual Report and Accounts 2014
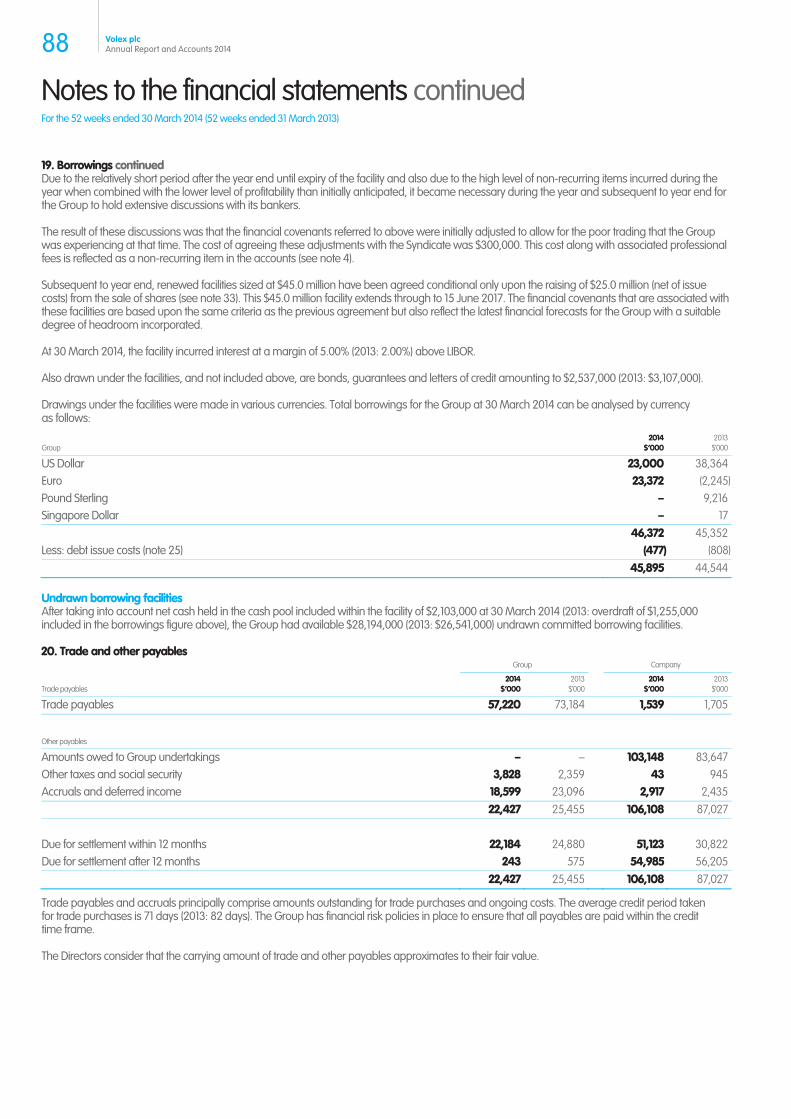
Notes to the financial statements continued For the 52 weeks ended 30 March 2014 (52 weeks ended 31 March 2013)
19. Borrowings continued Due to the relatively short period after the year end until expiry of the facility and also due to the high level of non-recurring items incurred during the year when combined with the lower level of profitability than initially anticipated, it became necessary during the year and subsequent to year end for the Group to hold extensive discussions with its bankers.
The result of these discussions was that the financial covenants referred to above were initially adjusted to allow for the poor trading that the Group was experiencing at that time. The cost of agreeing these adjustments with the Syndicate was $300,000. This cost along with associated professional fees is reflected as a non-recurring item in the accounts (see note 4).
Subsequent to year end, renewed facilities sized at $45.0 million have been agreed conditional only upon the raising of $25.0 million (net of issue costs) from the sale of shares (see note 33). This $45.0 million facility extends through to 15 June 2017. The financial covenants that are associated with these facilities are based upon the same criteria as the previous agreement but also reflect the latest financial forecasts for the Group with a suitable degree of headroom incorporated.
At 30 March 2014, the facility incurred interest at a margin of 5.00% (2013: 2.00%) above LIBOR.
Also drawn under the facilities, and not included above, are bonds, guarantees and letters of credit amounting to $2,537,000 (2013: $3,107,000).
Drawings under the facilities were made in various currencies. Total borrowings for the Group at 30 March 2014 can be analysed by currency as follows:
Group 2014
$’0002013
$’000
US Dollar 23,000 38,364Euro 23,372 (2,245)Pound Sterling – 9,216Singapore Dollar – 17 46,372 45,352Less: debt issue costs (note 25) (477) (808) 45,895 44,544
Undrawn borrowing facilities After taking into account net cash held in the cash pool included within the facility of $2,103,000 at 30 March 2014 (2013: overdraft of $1,255,000 included in the borrowings figure above), the Group had available $28,194,000 (2013: $26,541,000) undrawn committed borrowing facilities.
20. Trade and other payables Group Company
Trade payables 2014
$’0002013
$’000 2014
$’0002013
$’000
Trade payables 57,220 73,184 1,539 1,705 Other payables Amounts owed to Group undertakings – – 103,148 83,647Other taxes and social security 3,828 2,359 43 945Accruals and deferred income 18,599 23,096 2,917 2,435 22,427 25,455 106,108 87,027 Due for settlement within 12 months 22,184 24,880 51,123 30,822Due for settlement after 12 months 243 575 54,985 56,205 22,427 25,455 106,108 87,027
Trade payables and accruals principally comprise amounts outstanding for trade purchases and ongoing costs. The average credit period taken for trade purchases is 71 days (2013: 82 days). The Group has financial risk policies in place to ensure that all payables are paid within the credit time frame.
The Directors consider that the carrying amount of trade and other payables approximates to their fair value.
88 Volex plcAnnual Report and Accounts 2014
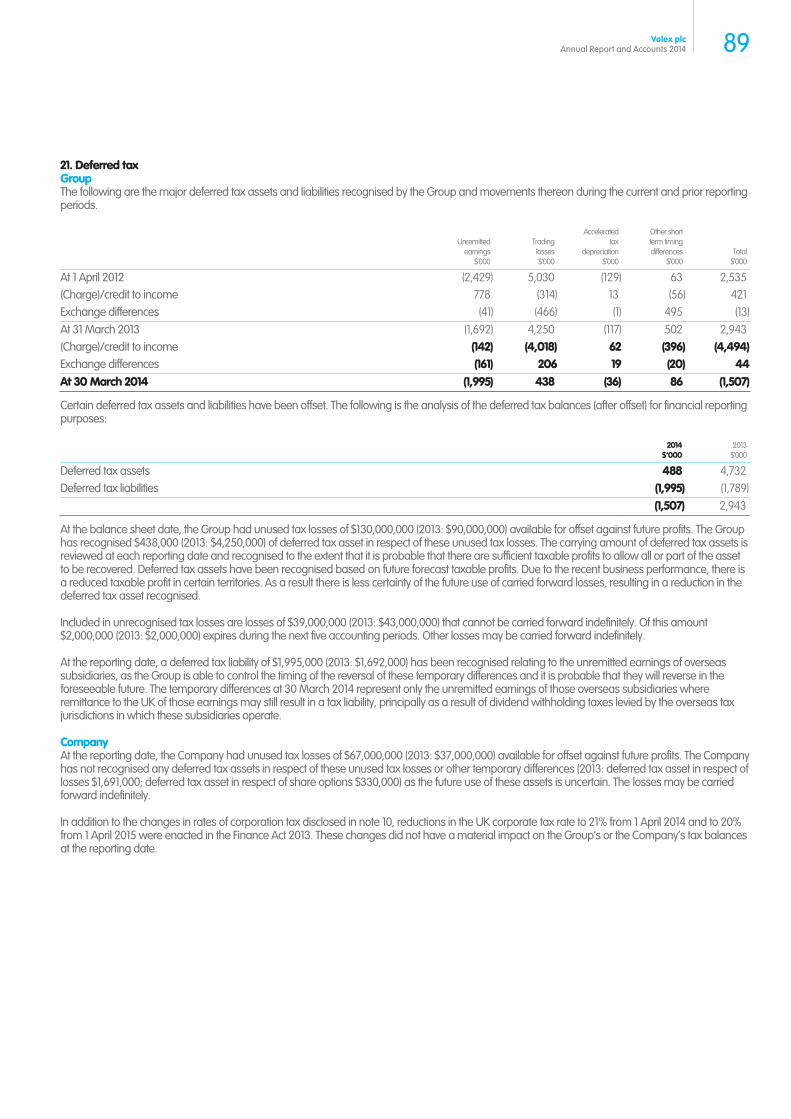
21. Deferred tax Group The following are the major deferred tax assets and liabilities recognised by the Group and movements thereon during the current and prior reporting periods.
Unremittedearnings
$’000
Tradinglosses$’000
Accelerated tax
depreciation $’000
Other short term timingdifferences
$’000 Total
$’000
At 1 April 2012 (2,429) 5,030 (129) 63 2,535(Charge)/credit to income 778 (314) 13 (56) 421Exchange differences (41) (466) (1) 495 (13)At 31 March 2013 (1,692) 4,250 (117) 502 2,943(Charge)/credit to income (142) (4,018) 62 (396) (4,494)Exchange differences (161) 206 19 (20) 44At 30 March 2014 (1,995) 438 (36) 86 (1,507)
Certain deferred tax assets and liabilities have been offset. The following is the analysis of the deferred tax balances (after offset) for financial reporting purposes:
2014$’000
2013$’000
Deferred tax assets 488 4,732Deferred tax liabilities (1,995) (1,789) (1,507) 2,943
At the balance sheet date, the Group had unused tax losses of $130,000,000 (2013: $90,000,000) available for offset against future profits. The Group has recognised $438,000 (2013: $4,250,000) of deferred tax asset in respect of these unused tax losses. The carrying amount of deferred tax assets is reviewed at each reporting date and recognised to the extent that it is probable that there are sufficient taxable profits to allow all or part of the asset to be recovered. Deferred tax assets have been recognised based on future forecast taxable profits. Due to the recent business performance, there is a reduced taxable profit in certain territories. As a result there is less certainty of the future use of carried forward losses, resulting in a reduction in the deferred tax asset recognised.
Included in unrecognised tax losses are losses of $39,000,000 (2013: $43,000,000) that cannot be carried forward indefinitely. Of this amount $2,000,000 (2013: $2,000,000) expires during the next five accounting periods. Other losses may be carried forward indefinitely.
At the reporting date, a deferred tax liability of $1,995,000 (2013: $1,692,000) has been recognised relating to the unremitted earnings of overseas subsidiaries, as the Group is able to control the timing of the reversal of these temporary differences and it is probable that they will reverse in the foreseeable future. The temporary differences at 30 March 2014 represent only the unremitted earnings of those overseas subsidiaries where remittance to the UK of those earnings may still result in a tax liability, principally as a result of dividend withholding taxes levied by the overseas tax jurisdictions in which these subsidiaries operate.
Company At the reporting date, the Company had unused tax losses of $67,000,000 (2013: $37,000,000) available for offset against future profits. The Company has not recognised any deferred tax assets in respect of these unused tax losses or other temporary differences (2013: deferred tax asset in respect of losses $1,691,000; deferred tax asset in respect of share options $330,000) as the future use of these assets is uncertain. The losses may be carried forward indefinitely.
In addition to the changes in rates of corporation tax disclosed in note 10, reductions in the UK corporate tax rate to 21% from 1 April 2014 and to 20% from 1 April 2015 were enacted in the Finance Act 2013. These changes did not have a material impact on the Group’s or the Company’s tax balances at the reporting date.
89Volex plcAnnual Report and Accounts 2014
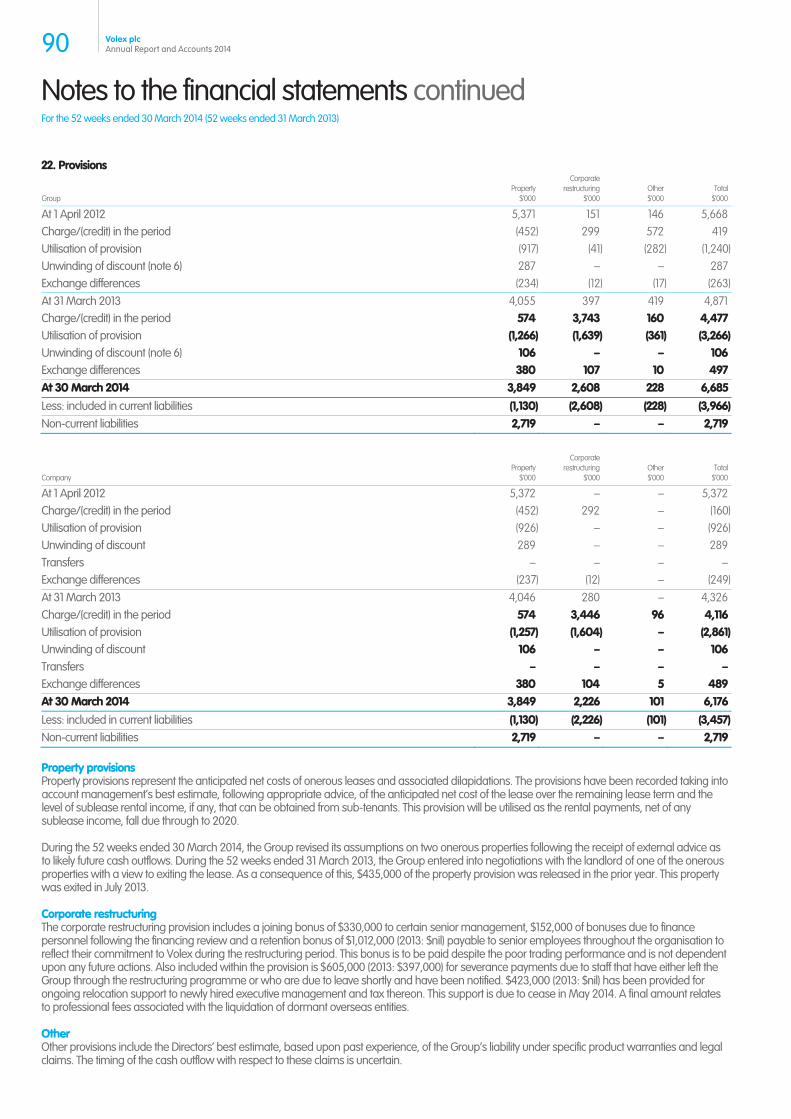
Notes to the financial statements continued For the 52 weeks ended 30 March 2014 (52 weeks ended 31 March 2013)
22. Provisions
Group Property
$’000
Corporate restructuring
$’000 Other$’000
Total$’000
At 1 April 2012 5,371 151 146 5,668Charge/(credit) in the period (452) 299 572 419Utilisation of provision (917) (41) (282) (1,240)Unwinding of discount (note 6) 287 – – 287Exchange differences (234) (12) (17) (263)At 31 March 2013 4,055 397 419 4,871Charge/(credit) in the period 574 3,743 160 4,477Utilisation of provision (1,266) (1,639) (361) (3,266)Unwinding of discount (note 6) 106 – – 106Exchange differences 380 107 10 497At 30 March 2014 3,849 2,608 228 6,685Less: included in current liabilities (1,130) (2,608) (228) (3,966)Non-current liabilities 2,719 – – 2,719
Company Property
$’000
Corporate restructuring
$’000 Other$’000
Total$’000
At 1 April 2012 5,372 – – 5,372Charge/(credit) in the period (452) 292 – (160)Utilisation of provision (926) – – (926)Unwinding of discount 289 – – 289Transfers – – – –Exchange differences (237) (12) – (249)At 31 March 2013 4,046 280 – 4,326Charge/(credit) in the period 574 3,446 96 4,116Utilisation of provision (1,257) (1,604) – (2,861)Unwinding of discount 106 – – 106Transfers – – – –Exchange differences 380 104 5 489At 30 March 2014 3,849 2,226 101 6,176Less: included in current liabilities (1,130) (2,226) (101) (3,457)Non-current liabilities 2,719 – – 2,719
Property provisions Property provisions represent the anticipated net costs of onerous leases and associated dilapidations. The provisions have been recorded taking into account management’s best estimate, following appropriate advice, of the anticipated net cost of the lease over the remaining lease term and the level of sublease rental income, if any, that can be obtained from sub-tenants. This provision will be utilised as the rental payments, net of any sublease income, fall due through to 2020.
During the 52 weeks ended 30 March 2014, the Group revised its assumptions on two onerous properties following the receipt of external advice as to likely future cash outflows. During the 52 weeks ended 31 March 2013, the Group entered into negotiations with the landlord of one of the onerous properties with a view to exiting the lease. As a consequence of this, $435,000 of the property provision was released in the prior year. This property was exited in July 2013.
Corporate restructuring The corporate restructuring provision includes a joining bonus of $330,000 to certain senior management, $152,000 of bonuses due to finance personnel following the financing review and a retention bonus of $1,012,000 (2013: $nil) payable to senior employees throughout the organisation to reflect their commitment to Volex during the restructuring period. This bonus is to be paid despite the poor trading performance and is not dependent upon any future actions. Also included within the provision is $605,000 (2013: $397,000) for severance payments due to staff that have either left the Group through the restructuring programme or who are due to leave shortly and have been notified. $423,000 (2013: $nil) has been provided for ongoing relocation support to newly hired executive management and tax thereon. This support is due to cease in May 2014. A final amount relates to professional fees associated with the liquidation of dormant overseas entities.
Other Other provisions include the Directors’ best estimate, based upon past experience, of the Group’s liability under specific product warranties and legal claims. The timing of the cash outflow with respect to these claims is uncertain.
90 Volex plcAnnual Report and Accounts 2014
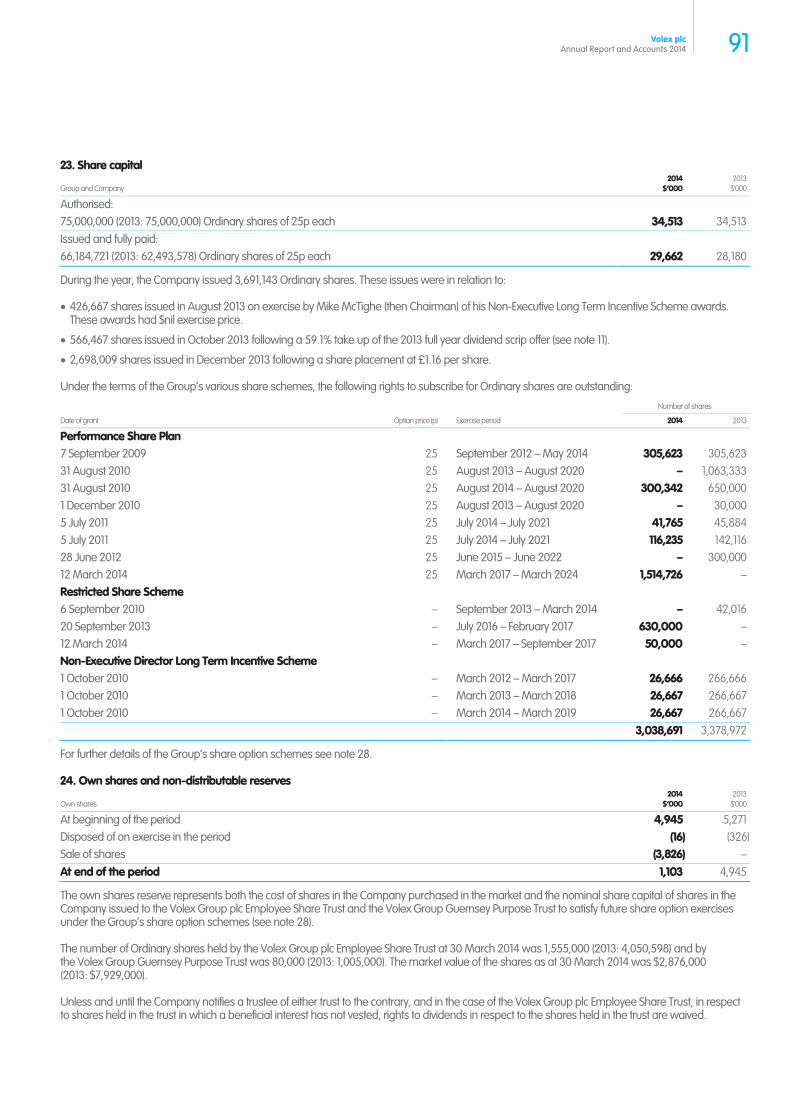
23. Share capital
Group and Company 2014
$’0002013
$’000
Authorised: 75,000,000 (2013: 75,000,000) Ordinary shares of 25p each 34,513 34,513Issued and fully paid: 66,184,721 (2013: 62,493,578) Ordinary shares of 25p each 29,662 28,180
During the year, the Company issued 3,691,143 Ordinary shares. These issues were in relation to:
426,667 shares issued in August 2013 on exercise by Mike McTighe (then Chairman) of his Non-Executive Long Term Incentive Scheme awards. These awards had $nil exercise price.
566,467 shares issued in October 2013 following a 59.1% take up of the 2013 full year dividend scrip offer (see note 11).
2,698,009 shares issued in December 2013 following a share placement at £1.16 per share.
Under the terms of the Group’s various share schemes, the following rights to subscribe for Ordinary shares are outstanding:
Number of shares
Date of grant Option price (p) Exercise period 2014 2013
Performance Share Plan 7 September 2009 25 September 2012 – May 2014 305,623 305,62331 August 2010 25 August 2013 – August 2020 – 1,063,33331 August 2010 25 August 2014 – August 2020 300,342 650,0001 December 2010 25 August 2013 – August 2020 – 30,0005 July 2011 25 July 2014 – July 2021 41,765 45,8845 July 2011 25 July 2014 – July 2021 116,235 142,11628 June 2012 25 June 2015 – June 2022 – 300,00012 March 2014 25 March 2017 – March 2024 1,514,726 –Restricted Share Scheme 6 September 2010 – September 2013 – March 2014 – 42,01620 September 2013 – July 2016 – February 2017 630,000 –12 March 2014 – March 2017 – September 2017 50,000 –Non-Executive Director Long Term Incentive Scheme 1 October 2010 – March 2012 – March 2017 26,666 266,6661 October 2010 – March 2013 – March 2018 26,667 266,6671 October 2010 – March 2014 – March 2019 26,667 266,667 3,038,691 3,378,972
For further details of the Group’s share option schemes see note 28.
24. Own shares and non-distributable reserves
Own shares 2014
$’0002013
$’000
At beginning of the period 4,945 5,271Disposed of on exercise in the period (16) (326)Sale of shares (3,826) –At end of the period 1,103 4,945
The own shares reserve represents both the cost of shares in the Company purchased in the market and the nominal share capital of shares in the Company issued to the Volex Group plc Employee Share Trust and the Volex Group Guernsey Purpose Trust to satisfy future share option exercises under the Group’s share option schemes (see note 28).
The number of Ordinary shares held by the Volex Group plc Employee Share Trust at 30 March 2014 was 1,555,000 (2013: 4,050,598) and by the Volex Group Guernsey Purpose Trust was 80,000 (2013: 1,005,000). The market value of the shares as at 30 March 2014 was $2,876,000 (2013: $7,929,000).
Unless and until the Company notifies a trustee of either trust to the contrary, and in the case of the Volex Group plc Employee Share Trust, in respect to shares held in the trust in which a beneficial interest has not vested, rights to dividends in respect to the shares held in the trust are waived.
91Volex plcAnnual Report and Accounts 2014
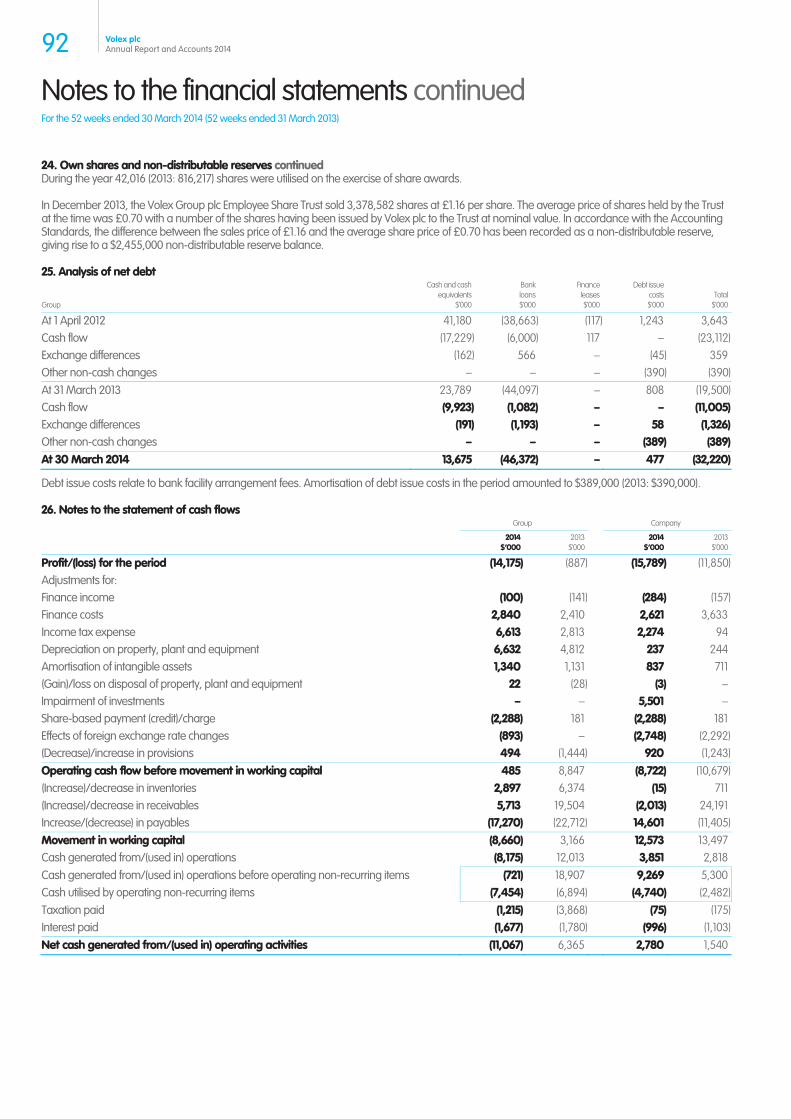
Notes to the financial statements continued For the 52 weeks ended 30 March 2014 (52 weeks ended 31 March 2013)
24. Own shares and non-distributable reserves continued During the year 42,016 (2013: 816,217) shares were utilised on the exercise of share awards.
In December 2013, the Volex Group plc Employee Share Trust sold 3,378,582 shares at £1.16 per share. The average price of shares held by the Trust at the time was £0.70 with a number of the shares having been issued by Volex plc to the Trust at nominal value. In accordance with the Accounting Standards, the difference between the sales price of £1.16 and the average share price of £0.70 has been recorded as a non-distributable reserve, giving rise to a $2,455,000 non-distributable reserve balance.
25. Analysis of net debt
Group
Cash and cash equivalents
$’000
Bank loans$’000
Finance leases $’000
Debt issue costs$’000
Total$’000
At 1 April 2012 41,180 (38,663) (117) 1,243 3,643Cash flow (17,229) (6,000) 117 – (23,112)Exchange differences (162) 566 – (45) 359Other non-cash changes – – – (390) (390)At 31 March 2013 23,789 (44,097) – 808 (19,500)Cash flow (9,923) (1,082) – – (11,005)Exchange differences (191) (1,193) – 58 (1,326)Other non-cash changes – – – (389) (389)At 30 March 2014 13,675 (46,372) – 477 (32,220)
Debt issue costs relate to bank facility arrangement fees. Amortisation of debt issue costs in the period amounted to $389,000 (2013: $390,000).
26. Notes to the statement of cash flows Group Company
2014$’000
2013 $’000
2014$’000
2013$’000
Profit/(loss) for the period (14,175) (887) (15,789) (11,850)Adjustments for: Finance income (100) (141) (284) (157)Finance costs 2,840 2,410 2,621 3,633Income tax expense 6,613 2,813 2,274 94Depreciation on property, plant and equipment 6,632 4,812 237 244Amortisation of intangible assets 1,340 1,131 837 711(Gain)/loss on disposal of property, plant and equipment 22 (28) (3) –Impairment of investments – – 5,501 –Share-based payment (credit)/charge (2,288) 181 (2,288) 181Effects of foreign exchange rate changes (893) – (2,748) (2,292)(Decrease)/increase in provisions 494 (1,444) 920 (1,243)Operating cash flow before movement in working capital 485 8,847 (8,722) (10,679)(Increase)/decrease in inventories 2,897 6,374 (15) 711(Increase)/decrease in receivables 5,713 19,504 (2,013) 24,191Increase/(decrease) in payables (17,270) (22,712) 14,601 (11,405)Movement in working capital (8,660) 3,166 12,573 13,497Cash generated from/(used in) operations (8,175) 12,013 3,851 2,818Cash generated from/(used in) operations before operating non-recurring items (721) 18,907 9,269 5,300Cash utilised by operating non-recurring items (7,454) (6,894) (4,740) (2,482)Taxation paid (1,215) (3,868) (75) (175)Interest paid (1,677) (1,780) (996) (1,103)Net cash generated from/(used in) operating activities (11,067) 6,365 2,780 1,540
92 Volex plcAnnual Report and Accounts 2014
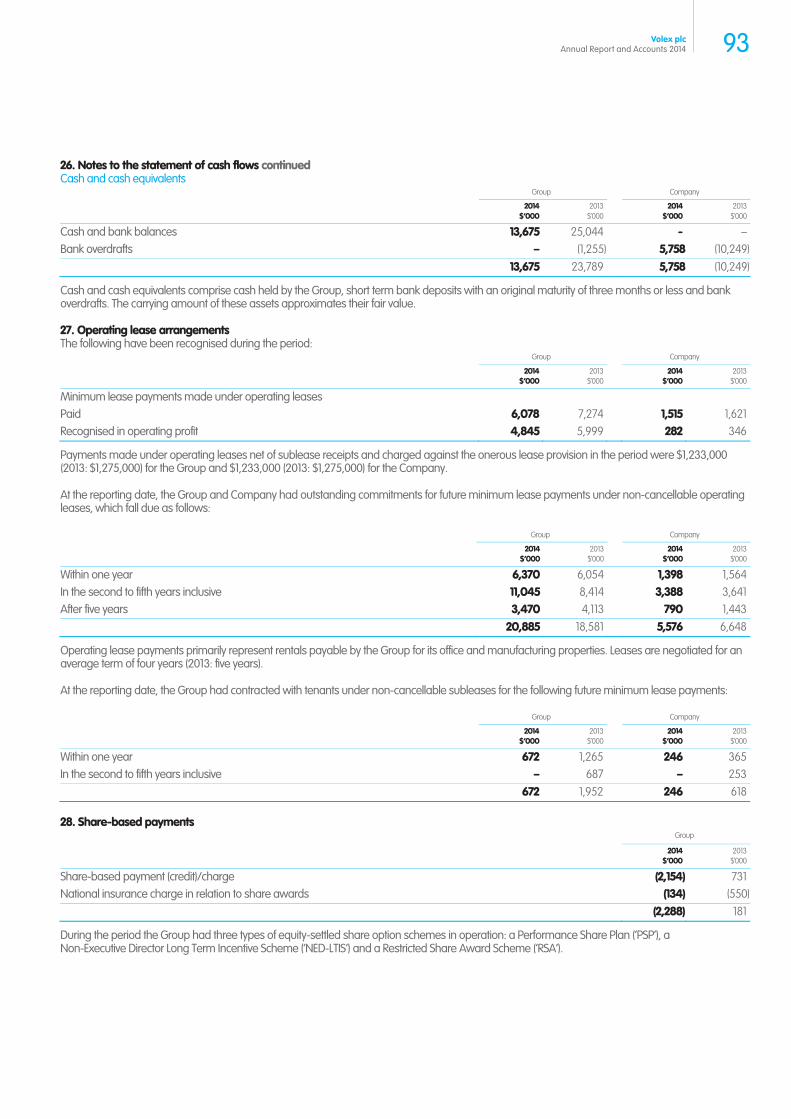
26. Notes to the statement of cash flows continued Cash and cash equivalents
Group Company
2014
$’0002013
$’000 2014
$’0002013
$’000
Cash and bank balances 13,675 25,044 - –Bank overdrafts – (1,255) 5,758 (10,249) 13,675 23,789 5,758 (10,249)
Cash and cash equivalents comprise cash held by the Group, short term bank deposits with an original maturity of three months or less and bank overdrafts. The carrying amount of these assets approximates their fair value.
27. Operating lease arrangements The following have been recognised during the period:
Group Company
2014
$’0002013
$’000 2014
$’0002013
$’000
Minimum lease payments made under operating leases Paid 6,078 7,274 1,515 1,621Recognised in operating profit 4,845 5,999 282 346
Payments made under operating leases net of sublease receipts and charged against the onerous lease provision in the period were $1,233,000 (2013: $1,275,000) for the Group and $1,233,000 (2013: $1,275,000) for the Company.
At the reporting date, the Group and Company had outstanding commitments for future minimum lease payments under non-cancellable operating leases, which fall due as follows:
Group Company
2014
$’0002013
$’000 2014
$’0002013
$’000
Within one year 6,370 6,054 1,398 1,564In the second to fifth years inclusive 11,045 8,414 3,388 3,641After five years 3,470 4,113 790 1,443 20,885 18,581 5,576 6,648
Operating lease payments primarily represent rentals payable by the Group for its office and manufacturing properties. Leases are negotiated for an average term of four years (2013: five years).
At the reporting date, the Group had contracted with tenants under non-cancellable subleases for the following future minimum lease payments:
Group Company
2014
$’0002013
$’000 2014
$’0002013
$’000
Within one year 672 1,265 246 365In the second to fifth years inclusive – 687 – 253 672 1,952 246 618
28. Share-based payments Group
2014
$’0002013
$’000
Share-based payment (credit)/charge (2,154) 731National insurance charge in relation to share awards (134) (550) (2,288) 181
During the period the Group had three types of equity-settled share option schemes in operation: a Performance Share Plan (‘PSP’), a Non-Executive Director Long Term Incentive Scheme (‘NED-LTIS’) and a Restricted Share Award Scheme (‘RSA’).
93Volex plcAnnual Report and Accounts 2014
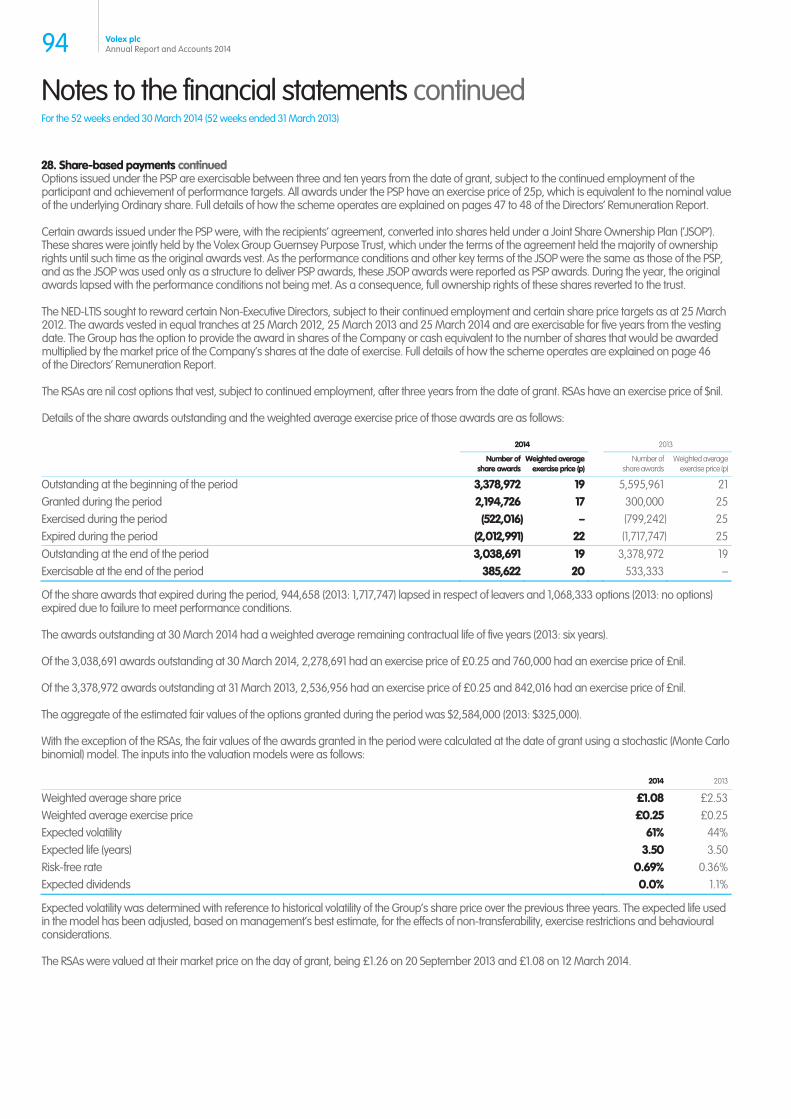
Notes to the financial statements continued For the 52 weeks ended 30 March 2014 (52 weeks ended 31 March 2013)
28. Share-based payments continued Options issued under the PSP are exercisable between three and ten years from the date of grant, subject to the continued employment of the participant and achievement of performance targets. All awards under the PSP have an exercise price of 25p, which is equivalent to the nominal value of the underlying Ordinary share. Full details of how the scheme operates are explained on pages 47 to 48 of the Directors’ Remuneration Report.
Certain awards issued under the PSP were, with the recipients’ agreement, converted into shares held under a Joint Share Ownership Plan (‘JSOP’). These shares were jointly held by the Volex Group Guernsey Purpose Trust, which under the terms of the agreement held the majority of ownership rights until such time as the original awards vest. As the performance conditions and other key terms of the JSOP were the same as those of the PSP, and as the JSOP was used only as a structure to deliver PSP awards, these JSOP awards were reported as PSP awards. During the year, the original awards lapsed with the performance conditions not being met. As a consequence, full ownership rights of these shares reverted to the trust.
The NED-LTIS sought to reward certain Non-Executive Directors, subject to their continued employment and certain share price targets as at 25 March 2012. The awards vested in equal tranches at 25 March 2012, 25 March 2013 and 25 March 2014 and are exercisable for five years from the vesting date. The Group has the option to provide the award in shares of the Company or cash equivalent to the number of shares that would be awarded multiplied by the market price of the Company’s shares at the date of exercise. Full details of how the scheme operates are explained on page 46 of the Directors’ Remuneration Report.
The RSAs are nil cost options that vest, subject to continued employment, after three years from the date of grant. RSAs have an exercise price of $nil.
Details of the share awards outstanding and the weighted average exercise price of those awards are as follows:
2014 2013
Number of
share awardsWeighted average
exercise price (p) Number of
share awardsWeighted average
exercise price (p)
Outstanding at the beginning of the period 3,378,972 19 5,595,961 21Granted during the period 2,194,726 17 300,000 25Exercised during the period (522,016) – (799,242) 25Expired during the period (2,012,991) 22 (1,717,747) 25Outstanding at the end of the period 3,038,691 19 3,378,972 19Exercisable at the end of the period 385,622 20 533,333 –
Of the share awards that expired during the period, 944,658 (2013: 1,717,747) lapsed in respect of leavers and 1,068,333 options (2013: no options) expired due to failure to meet performance conditions.
The awards outstanding at 30 March 2014 had a weighted average remaining contractual life of five years (2013: six years).
Of the 3,038,691 awards outstanding at 30 March 2014, 2,278,691 had an exercise price of £0.25 and 760,000 had an exercise price of £nil.
Of the 3,378,972 awards outstanding at 31 March 2013, 2,536,956 had an exercise price of £0.25 and 842,016 had an exercise price of £nil.
The aggregate of the estimated fair values of the options granted during the period was $2,584,000 (2013: $325,000).
With the exception of the RSAs, the fair values of the awards granted in the period were calculated at the date of grant using a stochastic (Monte Carlo binomial) model. The inputs into the valuation models were as follows:
2014 2013
Weighted average share price £1.08 £2.53Weighted average exercise price £0.25 £0.25Expected volatility 61% 44%Expected life (years) 3.50 3.50Risk-free rate 0.69% 0.36%Expected dividends 0.0% 1.1%
Expected volatility was determined with reference to historical volatility of the Group’s share price over the previous three years. The expected life used in the model has been adjusted, based on management’s best estimate, for the effects of non-transferability, exercise restrictions and behavioural considerations.
The RSAs were valued at their market price on the day of grant, being £1.26 on 20 September 2013 and £1.08 on 12 March 2014.
94 Volex plcAnnual Report and Accounts 2014
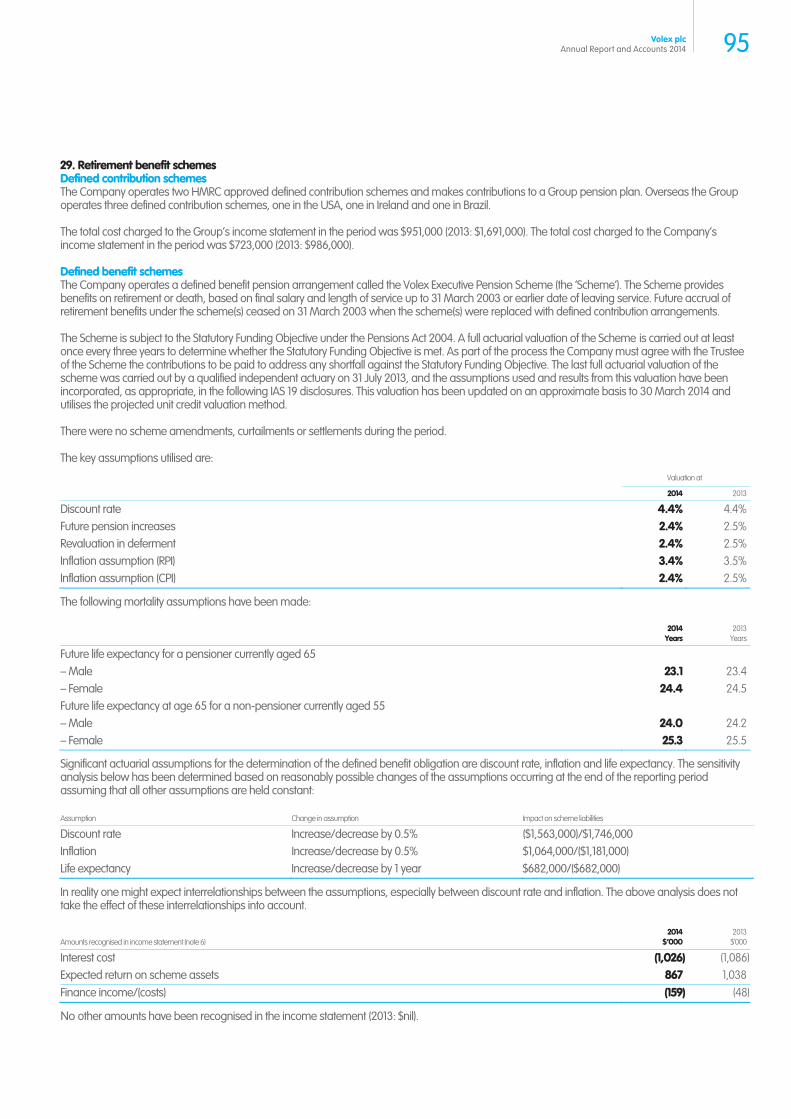
29. Retirement benefit schemes Defined contribution schemes The Company operates two HMRC approved defined contribution schemes and makes contributions to a Group pension plan. Overseas the Group operates three defined contribution schemes, one in the USA, one in Ireland and one in Brazil.
The total cost charged to the Group’s income statement in the period was $951,000 (2013: $1,691,000). The total cost charged to the Company’s income statement in the period was $723,000 (2013: $986,000).
Defined benefit schemes The Company operates a defined benefit pension arrangement called the Volex Executive Pension Scheme (the ‘Scheme’). The Scheme provides benefits on retirement or death, based on final salary and length of service up to 31 March 2003 or earlier date of leaving service. Future accrual of retirement benefits under the scheme(s) ceased on 31 March 2003 when the scheme(s) were replaced with defined contribution arrangements.
The Scheme is subject to the Statutory Funding Objective under the Pensions Act 2004. A full actuarial valuation of the Scheme is carried out at least once every three years to determine whether the Statutory Funding Objective is met. As part of the process the Company must agree with the Trustee of the Scheme the contributions to be paid to address any shortfall against the Statutory Funding Objective. The last full actuarial valuation of the scheme was carried out by a qualified independent actuary on 31 July 2013, and the assumptions used and results from this valuation have been incorporated, as appropriate, in the following IAS 19 disclosures. This valuation has been updated on an approximate basis to 30 March 2014 and utilises the projected unit credit valuation method.
There were no scheme amendments, curtailments or settlements during the period.
The key assumptions utilised are:
Valuation at
2014 2013
Discount rate 4.4% 4.4%Future pension increases 2.4% 2.5%Revaluation in deferment 2.4% 2.5%Inflation assumption (RPI) 3.4% 3.5%Inflation assumption (CPI) 2.4% 2.5%
The following mortality assumptions have been made:
2014
Years2013
Years
Future life expectancy for a pensioner currently aged 65 – Male 23.1 23.4– Female 24.4 24.5Future life expectancy at age 65 for a non-pensioner currently aged 55 – Male 24.0 24.2– Female 25.3 25.5
Significant actuarial assumptions for the determination of the defined benefit obligation are discount rate, inflation and life expectancy. The sensitivity analysis below has been determined based on reasonably possible changes of the assumptions occurring at the end of the reporting period assuming that all other assumptions are held constant:
Assumption Change in assumption Impact on scheme liabilities
Discount rate Increase/decrease by 0.5% ($1,563,000)/$1,746,000 Inflation Increase/decrease by 0.5% $1,064,000/($1,181,000) Life expectancy Increase/decrease by 1 year $682,000/($682,000)
In reality one might expect interrelationships between the assumptions, especially between discount rate and inflation. The above analysis does not take the effect of these interrelationships into account.
Amounts recognised in income statement (note 6) 2014
$’0002013
$’000
Interest cost (1,026) (1,086)Expected return on scheme assets 867 1,038Finance income/(costs) (159) (48)
other amounts have been recognised in the income statement (2013: $nil).
95Volex plcAnnual Report and Accounts 2014
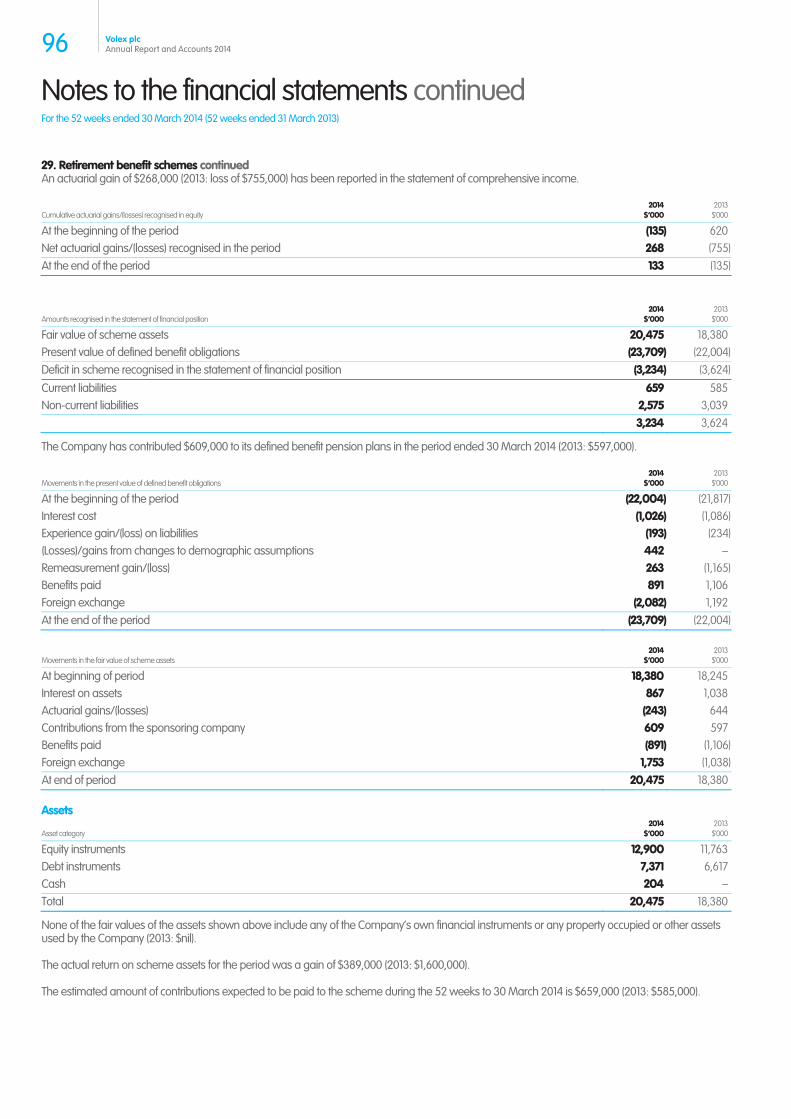
Notes to the financial statements continued For the 52 weeks ended 30 March 2014 (52 weeks ended 31 March 2013)
29. Retirement benefit schemes continued An actuarial gain of $268,000 (2013: loss of $755,000) has been reported in the statement of comprehensive income.
Cumulative actuarial gains/(losses) recognised in equity 2014
$’0002013
$’000
At the beginning of the period (135) 620Net actuarial gains/(losses) recognised in the period 268 (755)At the end of the period 133 (135)
Amounts recognised in the statement of financial position 2014
$’0002013
$’000
Fair value of scheme assets 20,475 18,380Present value of defined benefit obligations (23,709) (22,004)Deficit in scheme recognised in the statement of financial position (3,234) (3,624)
Current liabilities 659 585Non-current liabilities 2,575 3,039 3,234 3,624
The Company has contributed $609,000 to its defined benefit pension plans in the period ended 30 March 2014 (2013: $597,000).
Movements in the present value of defined benefit obligations 2014
$’0002013
$’000
At the beginning of the period (22,004) (21,817)Interest cost (1,026) (1,086)Experience gain/(loss) on liabilities (193) (234)(Losses)/gains from changes to demographic assumptions 442 –Remeasurement gain/(loss) 263 (1,165)Benefits paid 891 1,106Foreign exchange (2,082) 1,192At the end of the period (23,709) (22,004)
Movements in the fair value of scheme assets 2014
$’0002013
$’000
At beginning of period 18,380 18,245Interest on assets 867 1,038Actuarial gains/(losses) (243) 644Contributions from the sponsoring company 609 597Benefits paid (891) (1,106)Foreign exchange 1,753 (1,038)At end of period 20,475 18,380 Assets
Asset category 2014
$’0002013
$’000
Equity instruments 12,900 11,763Debt instruments 7,371 6,617Cash 204 –Total 20,475 18,380
None of the fair values of the assets shown above include any of the Company’s own financial instruments or any property occupied or other assets used by the Company (2013: $nil).
The actual return on scheme assets for the period was a gain of $389,000 (2013: $1,600,000).
The estimated amount of contributions expected to be paid to the scheme during the 52 weeks to 30 March 2014 is $659,000 (2013: $585,000).
96 Volex plcAnnual Report and Accounts 2014
30. Financial instruments Capital risk management The Group manages its capital to ensure that entities in the Group will be able to continue as going concerns while maximising the return to stakeholders through the optimisation of the debt and equity balance.
The capital structure of the Group consists of debt, which includes the borrowings disclosed in note 19, cash and cash equivalents and equity attributable to equity holders of the parent, comprising issued capital, reserves and retained earnings as contained in the statement of changes in equity.
The Board reviews the capital structure on a regular basis including facility headroom, forecast working capital and capital expenditure requirements.
The Group has a multi-currency revolving credit facility (‘RCF’), which had an available limit of $75,000,000 as at 30 March 2014 (2013: $75,000,000). At 30 March 2014 the amounts drawn under this facility included term loans of $23,000,000 and €17,000,000 (2013: $30,000,000 and €11,000,000). Under the RCF, a cash pool facility exists denominated in a variety of currencies. At 30 March 2014, net cash was held in the pool of $2,103,000 (2013: overdraft of $1,255,000). The average combined utilisation during the period was $47,633,000 (2013: $43,983,000).
At 30 March 2014 the Group had undrawn committed borrowing facilities of $28,194,000 (2013: $26,541,000).
The terms of the RCF require the Group to perform quarterly financial covenant calculations with respect to leverage (adjusted net debt to adjusted rolling 12-month EBITDA) and interest cover (adjusted rolling 12-month EBITDA to adjusted rolling 12-month interest). Breach of these covenants could result in cancellation of the facility. This facility is due to expire on 15 June 2015 being one year and three days beyond the date of signature of these accounts.
Due to the relatively short period after the year end until expiry of the facility and also due to the high level of non-recurring items incurred during the year when combined with the lower level of profitability than initially anticipated, it became necessary during the year and subsequent to year end for the Group to hold extensive discussions with its bankers.
The result of these discussions was that the financial covenants referred to above were initially adjusted to allow for the poor trading that the Group was experiencing at that time. Subsequent to year end, renewed facilities sized at $45.0 million have been agreed conditional only upon the raising of $25.0 million (net of issue costs) from the sale of shares (see note 33). This $45.0 million facility extends through to 15 June 2017. The financial covenants that are associated with these facilities are based upon the same criteria as the previous agreement but also reflect the latest financial forecasts for the Group with a suitable degree of headroom incorporated.
The Group’s forecast and projections, taking reasonable account of possible changes in trading performance, show that the Group should operate within the level of the contracted and committed facility for the foreseeable future and should comply with covenants over this period. The Group also has access to and uses additional uncommitted facilities. Further, the Group has a number of mitigating actions available to it, should actual performance fall below the current financial forecasts. The Directors have the financial controls and monitoring available to them to put in place those mitigating actions in a timely fashion if they see the need to do so. The Board are therefore confident that the combination of the above facilities provides adequate liquidity headroom for the successful execution of the Group’s operations and that the Group will be able to operate in agreement with the required covenant levels.
The Group is not subject to externally imposed capital requirements.
Financial instruments The Group’s principal financial instruments comprise bank borrowings and overdrafts, cash and short term deposits, trade and other receivables and trade and other payables. The Group also enters into derivative transactions, principally copper forward contracts to manage the commodity price risk arising from its operations, interest rate swaps to manage the interest rate risk arising from its borrowings and forward currency contracts to manage the currency risks arising from its operations.
Set out below is a comparison by category of carrying amounts and fair values of all the Group’s financial instruments that are carried in the financial statements. Except as detailed below, the Directors consider that the carrying amounts of the financial assets and financial liabilities recorded at amortised cost approximate their fair values.
97Volex plcAnnual Report and Accounts 2014
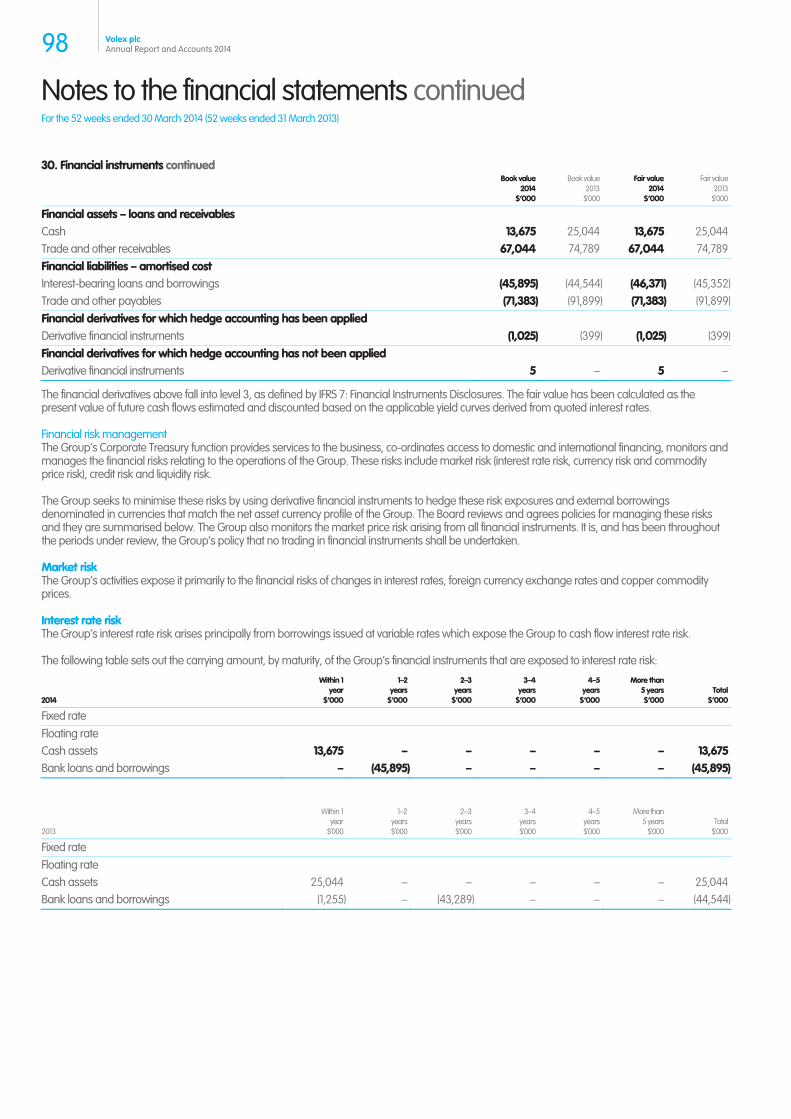
Notes to the financial statements continued For the 52 weeks ended 30 March 2014 (52 weeks ended 31 March 2013)
30. Financial instruments continued
Book value2014
$’000
Book value 2013
$’000
Fair value2014
$’000
Fair value2013
$’000
Financial assets – loans and receivables Cash 13,675 25,044 13,675 25,044Trade and other receivables 67,044 74,789 67,044 74,789Financial liabilities – amortised cost Interest-bearing loans and borrowings (45,895) (44,544) (46,371) (45,352)Trade and other payables (71,383) (91,899) (71,383) (91,899)Financial derivatives for which hedge accounting has been applied Derivative financial instruments (1,025) (399) (1,025) (399)Financial derivatives for which hedge accounting has not been applied Derivative financial instruments 5 – 5 –
The financial derivatives above fall into level 3, as defined by IFRS 7: Financial Instruments Disclosures. The fair value has been calculated as the present value of future cash flows estimated and discounted based on the applicable yield curves derived from quoted interest rates.
Financial risk management The Group’s Corporate Treasury function provides services to the business, co-ordinates access to domestic and international financing, monitors and manages the financial risks relating to the operations of the Group. These risks include market risk (interest rate risk, currency risk and commodity price risk), credit risk and liquidity risk.
The Group seeks to minimise these risks by using derivative financial instruments to hedge these risk exposures and external borrowings denominated in currencies that match the net asset currency profile of the Group. The Board reviews and agrees policies for managing these risks and they are summarised below. The Group also monitors the market price risk arising from all financial instruments. It is, and has been throughout the periods under review, the Group’s policy that no trading in financial instruments shall be undertaken.
Market risk The Group’s activities expose it primarily to the financial risks of changes in interest rates, foreign currency exchange rates and copper commodity prices.
Interest rate risk The Group’s interest rate risk arises principally from borrowings issued at variable rates which expose the Group to cash flow interest rate risk.
The following table sets out the carrying amount, by maturity, of the Group’s financial instruments that are exposed to interest rate risk:
2014
Within 1year
$’000
1–2years
$’000
2–3years
$’000
3–4years
$’000
4–5 years
$’000
More than5 years$’000
Total$’000
Fixed rate Floating rate Cash assets 13,675 – – – – – 13,675Bank loans and borrowings – (45,895) – – – – (45,895)
2013
Within 1year
$’000
1–2years$’000
2–3years$’000
3–4years$’000
4–5 years $’000
More than5 years
$’000Total
$’000
Fixed rate Floating rate Cash assets 25,044 – – – – – 25,044Bank loans and borrowings (1,255) – (43,289) – – – (44,544)
98 Volex plcAnnual Report and Accounts 2014
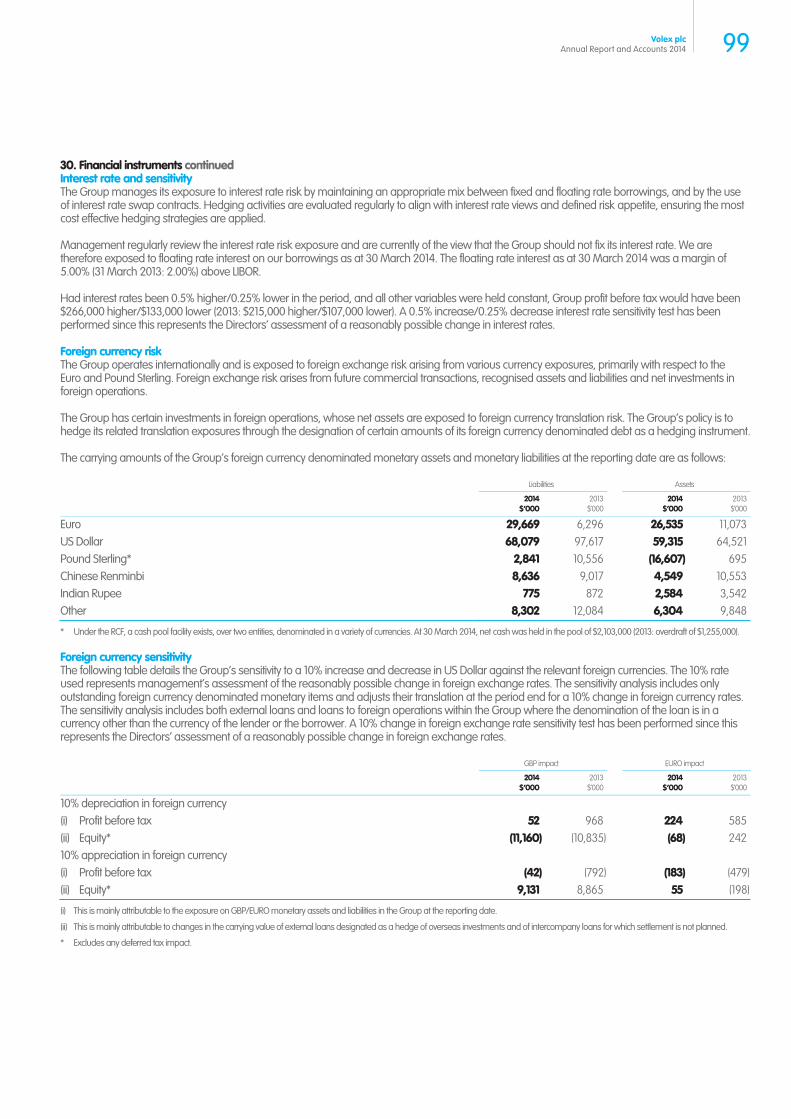
30. Financial instruments continued Interest rate and sensitivity The Group manages its exposure to interest rate risk by maintaining an appropriate mix between fixed and floating rate borrowings, and by the use of interest rate swap contracts. Hedging activities are evaluated regularly to align with interest rate views and defined risk appetite, ensuring the most cost effective hedging strategies are applied.
Management regularly review the interest rate risk exposure and are currently of the view that the Group should not fix its interest rate. We are therefore exposed to floating rate interest on our borrowings as at 30 March 2014. The floating rate interest as at 30 March 2014 was a margin of 5.00% (31 March 2013: 2.00%) above LIBOR.
Had interest rates been 0.5% higher/0.25% lower in the period, and all other variables were held constant, Group profit before tax would have been $266,000 higher/$133,000 lower (2013: $215,000 higher/$107,000 lower). A 0.5% increase/0.25% decrease interest rate sensitivity test has been performed since this represents the Directors’ assessment of a reasonably possible change in interest rates.
Foreign currency risk The Group operates internationally and is exposed to foreign exchange risk arising from various currency exposures, primarily with respect to the Euro and Pound Sterling. Foreign exchange risk arises from future commercial transactions, recognised assets and liabilities and net investments in foreign operations.
The Group has certain investments in foreign operations, whose net assets are exposed to foreign currency translation risk. The Group’s policy is to hedge its related translation exposures through the designation of certain amounts of its foreign currency denominated debt as a hedging instrument.
The carrying amounts of the Group’s foreign currency denominated monetary assets and monetary liabilities at the reporting date are as follows:
Liabilities Assets
2014
$’0002013
$’000 2014
$’0002013
$’000
Euro 29,669 6,296 26,535 11,073US Dollar 68,079 97,617 59,315 64,521Pound Sterling* 2,841 10,556 (16,607) 695Chinese Renminbi 8,636 9,017 4,549 10,553Indian Rupee 775 872 2,584 3,542Other 8,302 12,084 6,304 9,848
* Under the RCF, a cash pool facility exists, over two entities, denominated in a variety of currencies. At 30 March 2014, net cash was held in the pool of $2,103,000 (2013: overdraft of $1,255,000).
Foreign currency sensitivity The following table details the Group’s sensitivity to a 10% increase and decrease in US Dollar against the relevant foreign currencies. The 10% rate used represents management’s assessment of the reasonably possible change in foreign exchange rates. The sensitivity analysis includes only outstanding foreign currency denominated monetary items and adjusts their translation at the period end for a 10% change in foreign currency rates. The sensitivity analysis includes both external loans and loans to foreign operations within the Group where the denomination of the loan is in a currency other than the currency of the lender or the borrower. A 10% change in foreign exchange rate sensitivity test has been performed since this represents the Directors’ assessment of a reasonably possible change in foreign exchange rates.
GBP impact EURO impact
2014
$’0002013
$’000 2014
$’0002013
$’000
10% depreciation in foreign currency (i) Profit before tax 52 968 224 585(ii) Equity* (11,160) (10,835) (68) 24210% appreciation in foreign currency (i) Profit before tax (42) (792) (183) (479)(ii) Equity* 9,131 8,865 55 (198)
(i) This is mainly attributable to the exposure on GBP/EURO monetary assets and liabilities in the Group at the reporting date.
(ii) This is mainly attributable to changes in the carrying value of external loans designated as a hedge of overseas investments and of intercompany loans for which settlement is not planned.
* Excludes any deferred tax impact.
99Volex plcAnnual Report and Accounts 2014
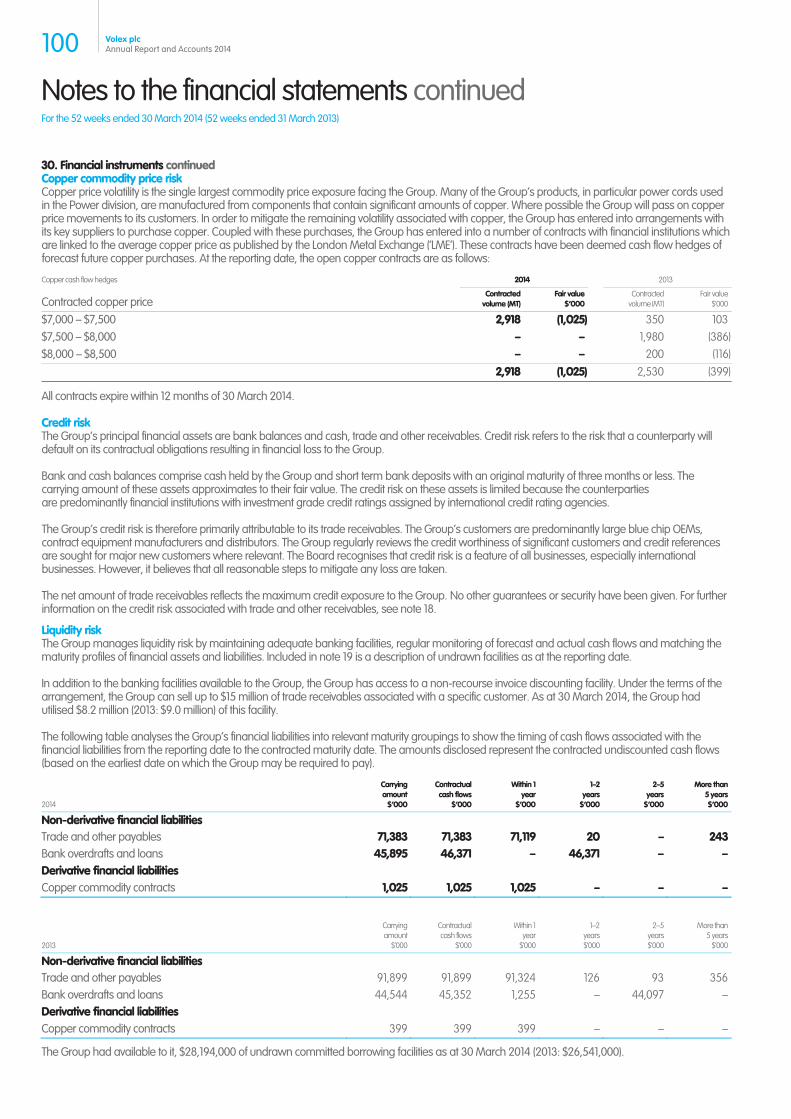
Notes to the financial statements continued For the 52 weeks ended 30 March 2014 (52 weeks ended 31 March 2013)
30. Financial instruments continued Copper commodity price risk Copper price volatility is the single largest commodity price exposure facing the Group. Many of the Group’s products, in particular power cords used in the Power division, are manufactured from components that contain significant amounts of copper. Where possible the Group will pass on copper price movements to its customers. In order to mitigate the remaining volatility associated with copper, the Group has entered into arrangements with its key suppliers to purchase copper. Coupled with these purchases, the Group has entered into a number of contracts with financial institutions which are linked to the average copper price as published by the London Metal Exchange (‘LME’). These contracts have been deemed cash flow hedges of forecast future copper purchases. At the reporting date, the open copper contracts are as follows:
Copper cash flow hedges 2014 2013
Contracted copper price Contracted
volume (MT)Fair value
$’000 Contracted
volume (MT)Fair value
$’000
$7,000 – $7,500 2,918 (1,025) 350 103$7,500 – $8,000 – – 1,980 (386)$8,000 – $8,500 – – 200 (116) 2,918 (1,025) 2,530 (399)
All contracts expire within 12 months of 30 March 2014.
Credit risk The Group’s principal financial assets are bank balances and cash, trade and other receivables. Credit risk refers to the risk that a counterparty will default on its contractual obligations resulting in financial loss to the Group.
Bank and cash balances comprise cash held by the Group and short term bank deposits with an original maturity of three months or less. The carrying amount of these assets approximates to their fair value. The credit risk on these assets is limited because the counterparties are predominantly financial institutions with investment grade credit ratings assigned by international credit rating agencies.
The Group’s credit risk is therefore primarily attributable to its trade receivables. The Group’s customers are predominantly large blue chip OEMs, contract equipment manufacturers and distributors. The Group regularly reviews the credit worthiness of significant customers and credit references are sought for major new customers where relevant. The Board recognises that credit risk is a feature of all businesses, especially international businesses. However, it believes that all reasonable steps to mitigate any loss are taken.
The net amount of trade receivables reflects the maximum credit exposure to the Group. No other guarantees or security have been given. For further information on the credit risk associated with trade and other receivables, see note 18.
Liquidity risk The Group manages liquidity risk by maintaining adequate banking facilities, regular monitoring of forecast and actual cash flows and matching the maturity profiles of financial assets and liabilities. Included in note 19 is a description of undrawn facilities as at the reporting date.
In addition to the banking facilities available to the Group, the Group has access to a non-recourse invoice discounting facility. Under the terms of the arrangement, the Group can sell up to $15 million of trade receivables associated with a specific customer. As at 30 March 2014, the Group had utilised $8.2 million (2013: $9.0 million) of this facility.
The following table analyses the Group’s financial liabilities into relevant maturity groupings to show the timing of cash flows associated with the financial liabilities from the reporting date to the contracted maturity date. The amounts disclosed represent the contracted undiscounted cash flows (based on the earliest date on which the Group may be required to pay).
2014
Carryingamount
$’000
Contractualcash flows
$’000
Within 1year
$’000
1–2 years
$’000
2–5years
$’000
More than5 years$’000
Non-derivative financial liabilities Trade and other payables 71,383 71,383 71,119 20 – 243Bank overdrafts and loans 45,895 46,371 – 46,371 – –Derivative financial liabilities Copper commodity contracts 1,025 1,025 1,025 – – –
2013
Carryingamount
$’000
Contractualcash flows
$’000
Within 1year
$’000
1–2 years $’000
2–5years$’000
More than5 years
$’000
Non-derivative financial liabilities Trade and other payables 91,899 91,899 91,324 126 93 356Bank overdrafts and loans 44,544 45,352 1,255 – 44,097 –Derivative financial liabilities Copper commodity contracts 399 399 399 – – –
The Group had available to it, $28,194,000 of undrawn committed borrowing facilities as at 30 March 2014 (2013: $26,541,000).
100 Volex plcAnnual Report and Accounts 2014
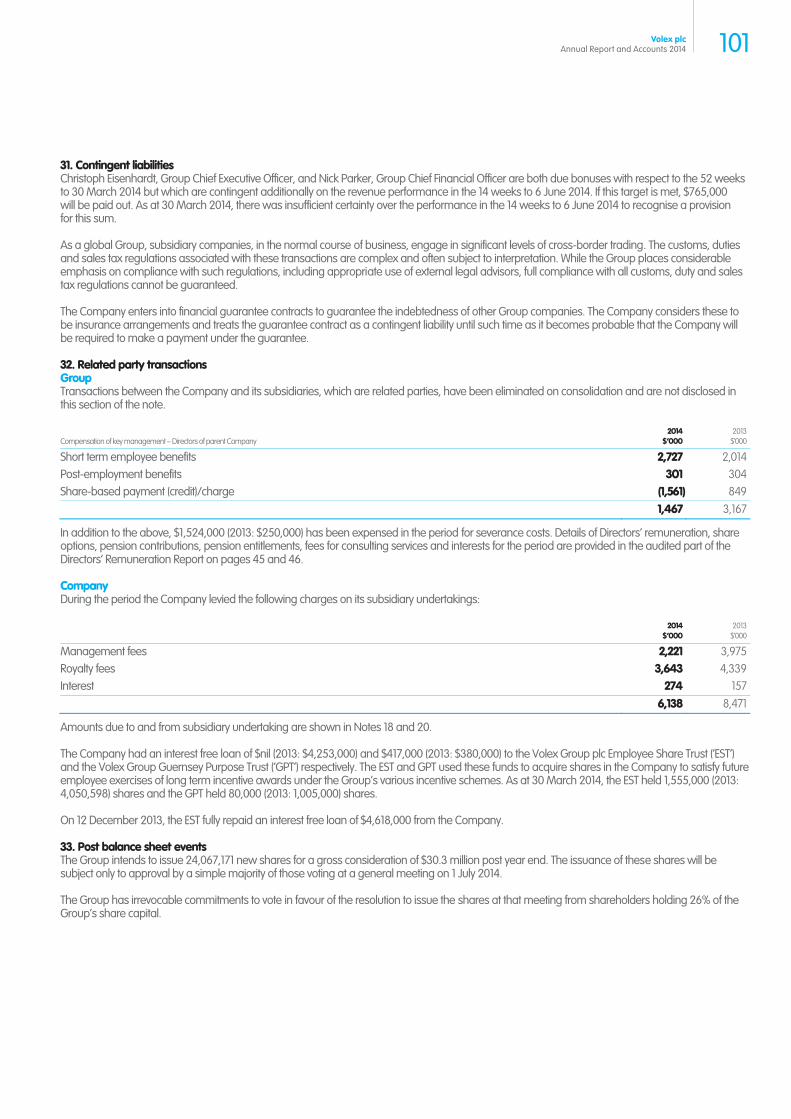
31. Contingent liabilities Christoph Eisenhardt, Group Chief Executive Officer, and Nick Parker, Group Chief Financial Officer are both due bonuses with respect to the 52 weeks to 30 March 2014 but which are contingent additionally on the revenue performance in the 14 weeks to 6 June 2014. If this target is met, $765,000 will be paid out. As at 30 March 2014, there was insufficient certainty over the performance in the 14 weeks to 6 June 2014 to recognise a provision for this sum.
As a global Group, subsidiary companies, in the normal course of business, engage in significant levels of cross-border trading. The customs, duties and sales tax regulations associated with these transactions are complex and often subject to interpretation. While the Group places considerable emphasis on compliance with such regulations, including appropriate use of external legal advisors, full compliance with all customs, duty and sales tax regulations cannot be guaranteed.
The Company enters into financial guarantee contracts to guarantee the indebtedness of other Group companies. The Company considers these to be insurance arrangements and treats the guarantee contract as a contingent liability until such time as it becomes probable that the Company will be required to make a payment under the guarantee.
32. Related party transactions Group Transactions between the Company and its subsidiaries, which are related parties, have been eliminated on consolidation and are not disclosed in this section of the note.
Compensation of key management – Directors of parent Company 2014
$’0002013
$’000
Short term employee benefits 2,727 2,014Post-employment benefits 301 304Share-based payment (credit)/charge (1,561) 849 1,467 3,167
In addition to the above, $1,524,000 (2013: $250,000) has been expensed in the period for severance costs. Details of Directors’ remuneration, share options, pension contributions, pension entitlements, fees for consulting services and interests for the period are provided in the audited part of the Directors’ Remuneration Report on pages 45 and 46.
Company During the period the Company levied the following charges on its subsidiary undertakings:
2014
$’0002013
$’000
Management fees 2,221 3,975Royalty fees 3,643 4,339Interest 274 157 6,138 8,471
Amounts due to and from subsidiary undertaking are shown in Notes 18 and 20.
The Company had an interest free loan of $nil (2013: $4,253,000) and $417,000 (2013: $380,000) to the Volex Group plc Employee Share Trust (‘EST’) and the Volex Group Guernsey Purpose Trust (‘GPT’) respectively. The EST and GPT used these funds to acquire shares in the Company to satisfy future employee exercises of long term incentive awards under the Group’s various incentive schemes. As at 30 March 2014, the EST held 1,555,000 (2013: 4,050,598) shares and the GPT held 80,000 (2013: 1,005,000) shares.
On 12 December 2013, the EST fully repaid an interest free loan of $4,618,000 from the Company.
33. Post balance sheet events The Group intends to issue 24,067,171 new shares for a gross consideration of $30.3 million post year end. The issuance of these shares will be subject only to approval by a simple majority of those voting at a general meeting on 1 July 2014.
The Group has irrevocable commitments to vote in favour of the resolution to issue the shares at that meeting from shareholders holding 26% of the Group’s share capital.
101Volex plcAnnual Report and Accounts 2014
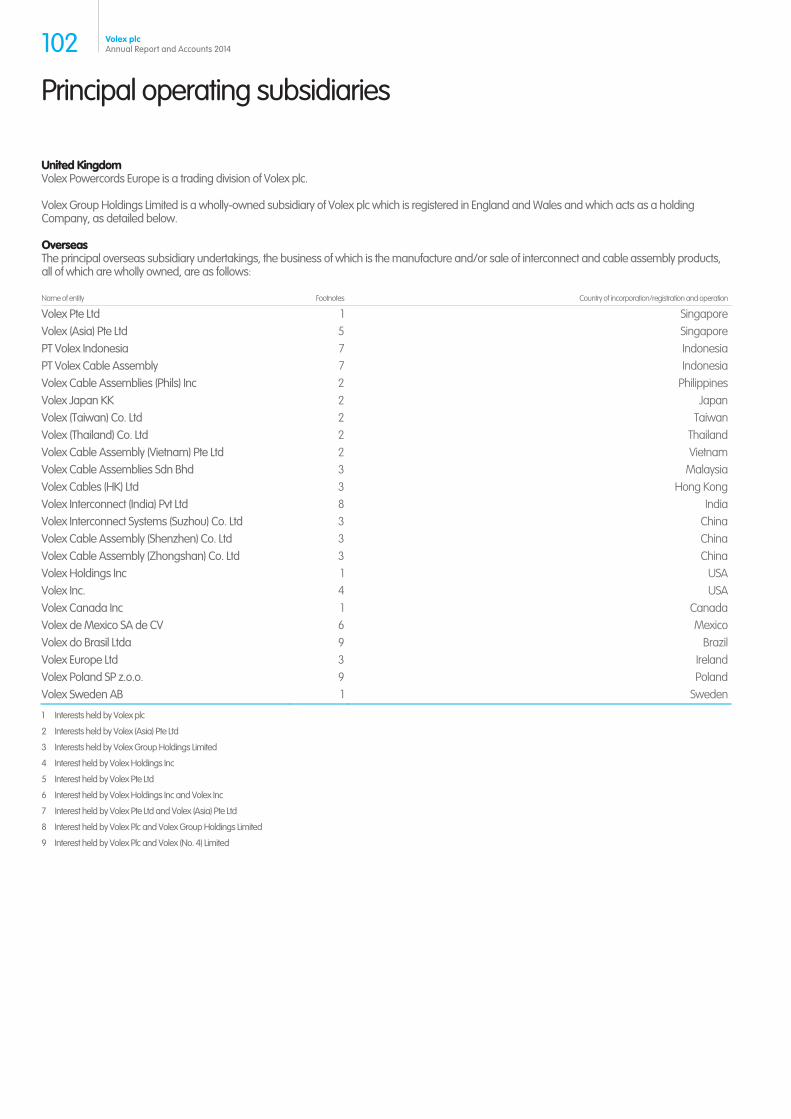
Principal operating subsidiaries
United Kingdom Volex Powercords Europe is a trading division of Volex plc.
Volex Group Holdings Limited is a wholly-owned subsidiary of Volex plc which is registered in England and Wales and which acts as a holding Company, as detailed below.
Overseas The principal overseas subsidiary undertakings, the business of which is the manufacture and/or sale of interconnect and cable assembly products, all of which are wholly owned, are as follows:
Name of entity Footnotes Country of incorporation/registration and operation
Volex Pte Ltd 1 SingaporeVolex (Asia) Pte Ltd 5 SingaporePT Volex Indonesia 7 IndonesiaPT Volex Cable Assembly 7 IndonesiaVolex Cable Assemblies (Phils) Inc 2 PhilippinesVolex Japan KK 2 JapanVolex (Taiwan) Co. Ltd 2 TaiwanVolex (Thailand) Co. Ltd 2 ThailandVolex Cable Assembly (Vietnam) Pte Ltd 2 VietnamVolex Cable Assemblies Sdn Bhd 3 MalaysiaVolex Cables (HK) Ltd 3 Hong KongVolex Interconnect (India) Pvt Ltd 8 IndiaVolex Interconnect Systems (Suzhou) Co. Ltd 3 ChinaVolex Cable Assembly (Shenzhen) Co. Ltd 3 ChinaVolex Cable Assembly (Zhongshan) Co. Ltd 3 ChinaVolex Holdings Inc 1 USAVolex Inc. 4 USAVolex Canada Inc 1 CanadaVolex de Mexico SA de CV 6 MexicoVolex do Brasil Ltda 9 BrazilVolex Europe Ltd 3 IrelandVolex Poland SP z.o.o. 9 PolandVolex Sweden AB 1 Sweden
1 Interests held by Volex plc
2 Interests held by Volex (Asia) Pte Ltd
3 Interests held by Volex Group Holdings Limited
4 Interest held by Volex Holdings Inc
5 Interest held by Volex Pte Ltd
6 Interest held by Volex Holdings Inc and Volex Inc
7 Interest held by Volex Pte Ltd and Volex (Asia) Pte Ltd
8 Interest held by Volex Plc and Volex Group Holdings Limited
9 Interest held by Volex Plc and Volex (No. 4) Limited
102 Volex plcAnnual Report and Accounts 2014
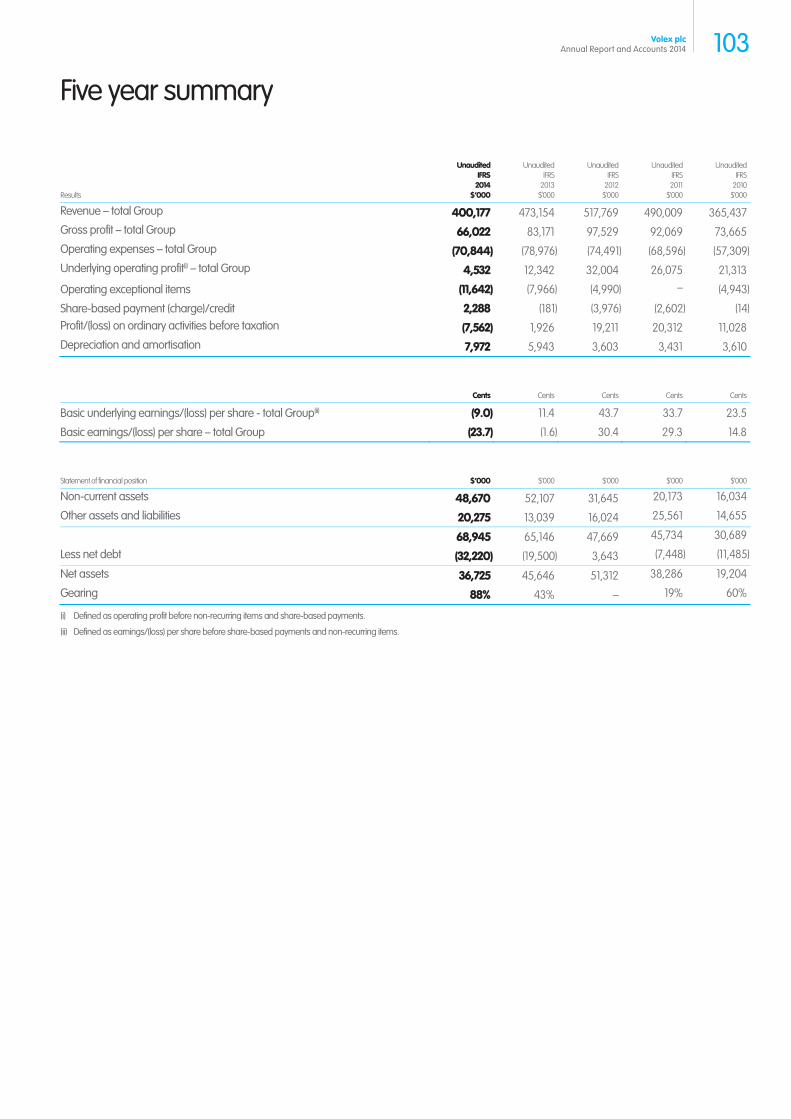
Five year summary
Results
UnauditedIFRS2014
$’000
UnauditedIFRS
2013$’000
Unaudited IFRS
2012 $’000
UnauditedIFRS2011
$’000
UnauditedIFRS
2010$’000
Revenue – total Group 400,177 473,154 517,769 490,009 365,437Gross profit – total Group 66,022 83,171 97,529 92,069 73,665Operating expenses – total Group (70,844) (78,976) (74,491) (68,596) (57,309)Underlying operating profit(i) – total Group 4,532 12,342 32,004 26,075 21,313
Operating exceptional items (11,642) (7,966) (4,990) – (4,943)
Share-based payment (charge)/credit 2,288 (181) (3,976) (2,602) (14)Profit/(loss) on ordinary activities before taxation (7,562) 1,926 19,211 20,312 11,028Depreciation and amortisation 7,972 5,943 3,603 3,431 3,610
Cents Cents Cents Cents Cents
Basic underlying earnings/(loss) per share - total Group(ii) (9.0) 11.4 43.7 33.7 23.5
Basic earnings/(loss) per share – total Group (23.7) (1.6) 30.4 29.3 14.8
Statement of financial position $’000 $’000 $’000 $’000 $’000
Non-current assets 48,670 52,107 31,645 20,173 16,034
Other assets and liabilities 20,275 13,039 16,024 25,561 14,655
68,945 65,146 47,669 45,734 30,689
Less net debt (32,220) (19,500) 3,643 (7,448) (11,485)
Net assets 36,725 45,646 51,312 38,286 19,204
Gearing 88% 43% – 19% 60%
(i) Defined as operating profit before non-recurring items and share-based payments.
(ii) Defined as earnings/(loss) per share before share-based payments and non-recurring items.
103Volex plcAnnual Report and Accounts 2014

Notes
104 Volex plcAnnual Report and Accounts 2014
105Volex plcAnnual Report and Accounts 2014
As part of our desire to reduce our environmental impact, you can view key information on our website at www.volex.com. Our Investor Relations section includes information such as the most recent news items, results presentations, annual and interim reports, share-price performance and contact information.
Paper information This report has been printed on Hello Silk a paper which is certified by the Forest Stewardship Council®. The paper is made at a mill with EMAS and ISO 14001 environmental management system accreditation. This report was printed by Pureprint Group using their pureprint environmental print technology which minimises the negative environmental impacts of the printing process. Printed using vegetable oil based inks by a CarbonNeutral® printer certified to ISO 14001 environmental management system and registered to EMAS the Eco Management Audit Scheme.Design and production Radley Yeldar
Registered office and advisorsRegistered office10 Eastbourne Terrace, London, W2 6LG, UK
www.volex.com
Registered number158956 (Registered in England and Wales)
RegistrarsCapita Registrars plc, The Registry, 34 Beckenham Road, Beckenham, Kent, BR3 4TU
www.capita-irg.com
Independent AuditorsPricewaterhouseCoopers LLP
BankersLloyds TSB Bank plc Clydesdale Bank plc HSBC Bank plc
StockbrokersInvestec Securities
SolicitorsTravers Smith LLP
Financial PR Tulchan Communications LLP
Financial calendarFY2015 Interim results announced w/c 10 November 2014 Year end 5 April 2015 Final results announced w/c 8 June 2015
FY2016Interim results announced w/c 9 November 2015 Year end 3 April 2016 Final results announced w/c 6 June 2016
Read more online www.volex.com
Shareholder information
Reducing our environmental impact

Volex plc 10 Eastbourne Terrace London W2 6LG United Kingdom
T +44 (0)20 3370 8830 F +44 (0)20 3370 8831
www.volex.com