Embed Size (px)
Citation preview
UNITED STATES OF AMERICA BEFORE THE
FEDERAL ENERGY REGULATORY COMMISSION
Southern California Edison Company Docket No. ER18-169-000
SOUTHERN CALIFORNIA EDISON COMPANY
TRANSMISSION OWNER TARIFF TRANSMISSION RATE FILING
(TO2018)
VOLUME 1
GENERAL INFORMATION
OCTOBER 2017
Table of Contents
Volume 1 General Information__________
Transmittal Letter
Cost of Service Statements
Attestation Clean TO Tariff Sheets
Red-lined TO Tariff Sheets
Contents of Supporting Volumes 2 – 3
Volume 2 − Prepared Direct Testimony (SCE-1 thru SCE-21)
Volume 3 − Workpapers Supporting All Witnesses (SCE-22)

TRANSMITTAL LETTER
Rebecca A. Furman Senior Attorney
October 27, 2017
Hon. Kimberly D. Bose, Secretary
Federal Energy Regulatory Commission
888 First Street, N.E.
Washington, DC 20426
RE: Southern California Edison Company
Docket No. ER18- ____- 000
Southern California Edison Company’s Transmission Owner Tariff Rate Filing
Dear Ms. Bose:
Pursuant to Section 205(d) of the Federal Power Act, 16 U.S.C. § 824d (2012),
and Section 35.13 of the Federal Energy Regulatory Commission’s (“FERC” or
“Commission”) regulations (18 C.F.R § 35.13) (2016), Southern California Edison
Company (“SCE”) tenders for filing revisions to its Transmission Owner Tariff (“TO
Tariff”), FERC Electric Tariff, Volume No. 6. The filing includes a formula rate for the
costs associated with SCE's transmission facilities (the “proposed Formula Rate” or
“TO2018”).
SCE is making this filing as required in the Section 2.5 of the Settlement of SCE’s
currently-effective Formula Rate (the “Original Formula Rate”),1 which specifies that the
1 SCE’s Original Formula Rate was filed on June 3, 2011 in Docket No. ER11-3697, and
became effective January 1, 2012 pursuant Southern California Edison Co, 136 FERC
61,074, issued August 2, 2011.
Hon. Kimberly D. Bose
October 27, 2017
Page 2 of 27
Original Formula Rate expires at the end of 2017 unless the rate proposed in this filing
had not yet been made effective by the Commission.
Additionally, the protocols to the Original Formula Rate require that SCE must file
a replacement rate mechanism to recover SCE’s Commission-jurisdictional transmission
costs no later than 60 days prior to January 1, 2018, and that SCE shall request an
effective date of January 1, 2018 in that filing:
“Except as set forth below, the Formula Rate shall terminate December 31,
2017. SCE shall submit a filing under Section 205 of the Federal Power
Act by no later than 60 days prior to December 31, 2017, proposing a
transmission rate schedule, which may include revised transmission rates.
The rates and other components of such filing shall be at SCE’s sole
discretion, and may be in the form of a formula rate or a traditional stated
rate. Parties retain all rights to oppose the filing. Such filing shall request
an effective date of January 1, 2018. In the event that the Commission does
not permit the proposed rate schedule and the associated rates to become
effective on January 1, 2018, this Formula Rate shall remain in effect until
the date that the rate filing is made effective by the Commission. (Original
Formula Rate Protocols, Section 2)”
SCE is meeting these requirements by filing a new proposed Formula Rate with a
requested effective date of January 1, 2018.
I. BACKGROUND
SCE herein presents its proposed TO2018 Transmission Formula Rate.
Transmission infrastructure plays a vital role in SCE’s commitment to provide its
customers with safe, reliable and environmentally responsible power. The backbone for
moving electricity to power our domestic economy, energize our workplaces, comfort our
homes and enhances the livelihoods of everyone in our communities is the transmission

Hon. Kimberly D. Bose
October 27, 2017
Page 3 of 27
system. Transmission infrastructure will play a growing and increasingly important role
in meeting environmental objectives, interconnecting advanced new generation
technologies, powering transportation and enabling an expanded electricity based
economy. In fact, SCE has been engaged in a multi-year period of exceptional growth in
its transmission investments, driven primarily by renewable goals set by the State of
California. However, California is now in the middle of an industry transformation. The
influx of Distributed Energy Resources and growth of renewable energy are causing a
profound shift from one-way to two-way power flow, changing the timing and nature of
load peaks on the system. Integrating distributed generation with SCE’s transmission
system is capital intensive and complicated, but it is necessary to achieve operational
flexibility. This energy revolution provides great opportunities, but also presents a
significant amount of uncertainty. The well designed, transparent and equitable rate
included in this proposed Formula Rate will help ensure customers realize the benefits of
a safe, reliable and environmentally responsible Transmission grid by enabling the
continued investment and maintenance necessary to deliver these essential services,
conveniences and betterments.
On April 1, 1998, SCE unbundled its retail transmission rates and transferred
Operational Control of its network transmission facilities to the California Independent
System Operator Corporation ("CAISO”). As the result of these events, the Commission
gained jurisdiction over SCE's retail transmission rates, complementing its existing
jurisdiction over SCE’s wholesale transmission rates. SCE filed its Transmission Owner
Hon. Kimberly D. Bose
October 27, 2017
Page 4 of 27
Tariff ("TO Tariff") and its first proposed Base Transmission Revenue Requirement
("Base TRR")2 on March 31, 1997 in Docket No. ER97-2355.
From April 1, 1997 through December 31, 2011, SCE’s Base TRR was established
through “Stated Rate” TRR filings.3 On June 3, 2011, SCE filed a TRR filing requesting
a formula rate in Docket No. ER11-3697. The filing was accepted and suspended, set for
hearing and settlement procedures, and given a January 1, 2012 effective date. The
parties to Docket No. ER11-3697 engaged in settlement negotiations and the Commission
approved the settlement on October 11, 2013. Beginning on January 1, 2012, SCE’s
Base TRR has been established pursuant to the Original Formula Rate, with Annual
Update filings being submitted each year covering a calendar year term.4 SCE’s Formula
Rate consists of two components: 1) the Formula Rate Protocols (“Formula Protocols,”
Attachment 1 to Appendix IX of SCE’s TO Tariff); and 2) the Formula Rate Spreadsheet
(“Formula Spreadsheet,” Attachment 2 to Appendix IX of SCE’s TO Tariff). The 2 The Base TRR reflects SCE's costs of owning and operating its transmission facilities that are
under the CAISO’s Operational Control. 3 SCE made five stated rate TRR filings to recover its Base TRR for the period April 1, 1997
through December 1, 2011 in Dockets No. ER97-2355, ER02-925, ER06-186, ER08-1343,
and ER09-1534. SCE refers to these filings as TO1 through TO5 (for “Transmission Owner
Base TRR filing No. 1”, etc.). Additionally, SCE also had a complementary formula
mechanism to recover Commission-approved Construction Work In Progress (“CWIP”) Base
TRR costs from the period March 1, 2008 through December 31, 2011 (see Docket Nos.
ER08-375 and EL07-62). The separate CWIP formula mechanism was terminated upon the
establishment of the Original Formula Rate, since CWIP costs are included in the Formula
Rate. 4 SCE’s initial Formula Rate filing is referred to as TO6, and the subsequent Annual Update
filings (each submitted in ER11-3697) are referred to as the TO7 through TO11 Annual
Updates. SCE’s current transmission rates for the 2017 year are as filed in the TO11 Annual
Update. SCE is proposing to call this proposed Formula Rate TO2018.
Hon. Kimberly D. Bose
October 27, 2017
Page 5 of 27
Formula Protocols set forth process-related items, such as the Annual Update filing
timeline, as well as various requirements that SCE must meet in Annual Update
informational filings or while the Formula Rate is in effect. The Formula Spreadsheet is
the set of calculations that SCE must follow in calculating its Base TRR.
II. PURPOSE OF FILING
As stated above, SCE is required to make a new rate filing pursuant to Section 2 of
the protocols of the Original Formula Rate. SCE is filing a successor proposed formula
rate for a number of reasons. First, the Commission has supported the use of formula
rates by transmission service providers. Second, SCE has gained experience with
formula rates throughout the term of the Original Formula Rate, and that experience has
been generally positive. SCE’s Annual Update process, which takes place each year
during the five and one-half month period from June 15 to December 1, has resolved
issues identified and raised by transmission customers to the apparent satisfaction of
those customers. As evidence, none of SCE’s Original Formula Rate Annual Update
filings, TO7-TO11, were protested. That is consistent with the reason the Commission
generally favors formula rates—they reduce litigation and conserve the parties’ and
Commission’s resources and administrative costs as compared to annual stated rate
filings. Finally, formula rates provide both SCE and its customers with greater
confidence that costs will be accurately recovered. Compared to a stated rate, the
Hon. Kimberly D. Bose
October 27, 2017
Page 6 of 27
formula reduces the risk of either over or under recovering cost due to the imprecise
nature of forecasts associated with stated rates.
In addition to the proposed Formula Rate, SCE is also including in this filing a
proposed TO2018 Base TRR and associated retail and wholesale transmission rates based
on the proposed Formula Rate, to be effective January 1, 2018. The proposed TO2018
Base TRR and associated retail and wholesale transmission rates are based on the
proposed Formula Rate Spreadsheet, populated with cost and forecast inputs (as shown
in Exhibit No. SCE-4).5
Under the proposed rates, SCE’s proposed Base TRR for calendar year 2018
(effective January 1, 2018) will be $1,169,306,623. This compares to the current Base
TRR of $1,188,757,628, which includes a positive $94.2 million True Up Adjustment
related to prior years, filed by SCE in its 2016 TO11 Annual Update and in effect for
calendar year 2017.6 SCE is proposing changes to the True Up Adjustment mechanism
that will prevent what would otherwise be a positive $59.6 million True Up Adjustment
5 As explained below, SCE will be filing a TO12 Annual Update contemporaneously with this
filing in Docket No. ER11-3697, as is required by the Original Formula Rate protocols.
The Original Formula Rate TO12 filing will only be used to calculate SCE’s actual TRR costs
for the 2016 year if the Commission accepts this proposed Formula Rate effective January 1,
2018. However, in the event that the Commission does not accept the proposed Formula Rate
effective January 1, 2018, then the Original Formula Rate will remain in effect until a new
formula rate is accepted by the Commission, and the Original Formula Rate TO12 filing
Annual Update will initially set the Base TRR for 2018 (see Section III below). 6 Even though SCE is proposing revisions to the Formula Rate that will increase SCE’s actual
costs, as defined by the True Up TRR, SCE’s proposed 2018 Base TRR is actually lower than
its 2017 Base TRR. In part, this decrease in Base TRR from 2017 to 2018 is related to the
operation of the Formula Rate True Up Adjustment mechanism.
Hon. Kimberly D. Bose
October 27, 2017
Page 7 of 27
(i.e., additional charge) in 2018 that is not necessary to ensure that SCE recovers its
cumulative undercollection. Instead, SCE’s proposed True Up Adjustment for 2018 is
negative $39.6 million. Mr. Hansen explains the revised True Up Adjustment mechanism
in Exhibit No. SCE-3 (pp. 23-24). The major revisions that SCE is proposing to make to
the proposed Formula Rate relative to the Original Formula Rate are explained fully
in Section V below.
SCE’s proposed Formula Rate maintains the same basic structure as the Original
Formula Rate (see Section IV. A below). However, SCE is proposing several revisions
relative to the Original Formula Rate that SCE feels will: 1) Improve the operation of the
Formula Rate, including moving SCE’s Formula Rate closer to industry standard practice
for Formula Rate recovery of certain costs; 2) Reflect what SCE believes is Commission
policy with respect to the recovery of certain costs; or 3) Reflect current market and
regulatory conditions with respect to certain stated values in the proposed Formula Rate
(such as Return on Equity or Depreciation Rates). These revisions incorporated in the
proposed Formula Rate are explained in Section V below and in the testimony of Mr. Jeff
Nelson, Exhibit No. SCE-1. A full list of all proposed revisions to the Formula Rate is
included in Exhibit Nos. SCE-5 (Formula Spreadsheet Revisions) and SCE-6 (Formula
Protocol Revisions).
Hon. Kimberly D. Bose
October 27, 2017
Page 8 of 27
III. EFFECTIVE DATE
SCE requests that that the Commission accept the proposed Formula Rate set forth
in this filing with an effective date of January 1, 2018 without suspension or hearing.
As explained in the testimony of Mr. Jeff Nelson, Section 2 of the protocols to SCE’s
Original Formula Rate requires that SCE request an effective date of January 1, 2018
in this filing.7 Section 2 of the Original Formula Rate protocols goes on to state that: In
the event that the Commission does not permit the proposed rate schedule and the
associated rates to become effective on January 1, 2018, this Formula Rate shall remain
in effect until the date that the rate filing is made effective by the Commission.
IV. DESCRIPTION OF FILING
A. Overview of the Proposed Formula Rate
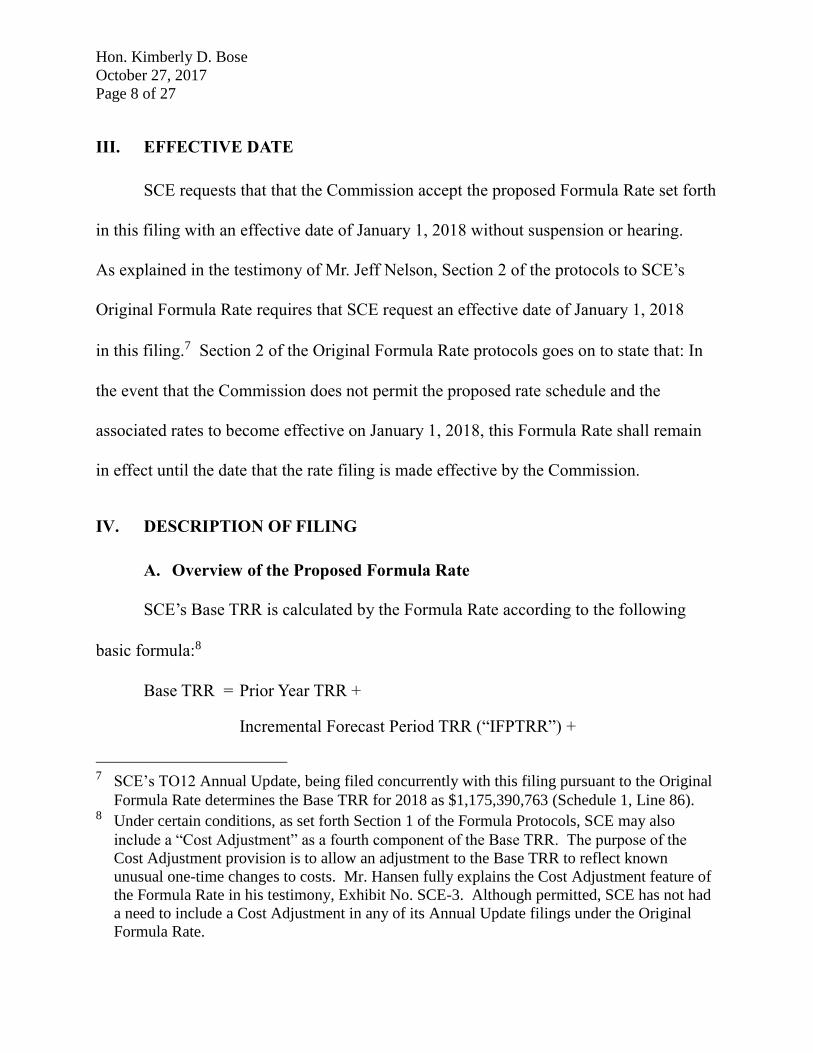
SCE’s Base TRR is calculated by the Formula Rate according to the following
basic formula:8
Base TRR = Prior Year TRR +
Incremental Forecast Period TRR (“IFPTRR”) +
7 SCE’s TO12 Annual Update, being filed concurrently with this filing pursuant to the Original
Formula Rate determines the Base TRR for 2018 as $1,175,390,763 (Schedule 1, Line 86). 8 Under certain conditions, as set forth Section 1 of the Formula Protocols, SCE may also
include a “Cost Adjustment” as a fourth component of the Base TRR. The purpose of the
Cost Adjustment provision is to allow an adjustment to the Base TRR to reflect known
unusual one-time changes to costs. Mr. Hansen fully explains the Cost Adjustment feature of
the Formula Rate in his testimony, Exhibit No. SCE-3. Although permitted, SCE has not had
a need to include a Cost Adjustment in any of its Annual Update filings under the Original
Formula Rate.
Hon. Kimberly D. Bose
October 27, 2017
Page 9 of 27
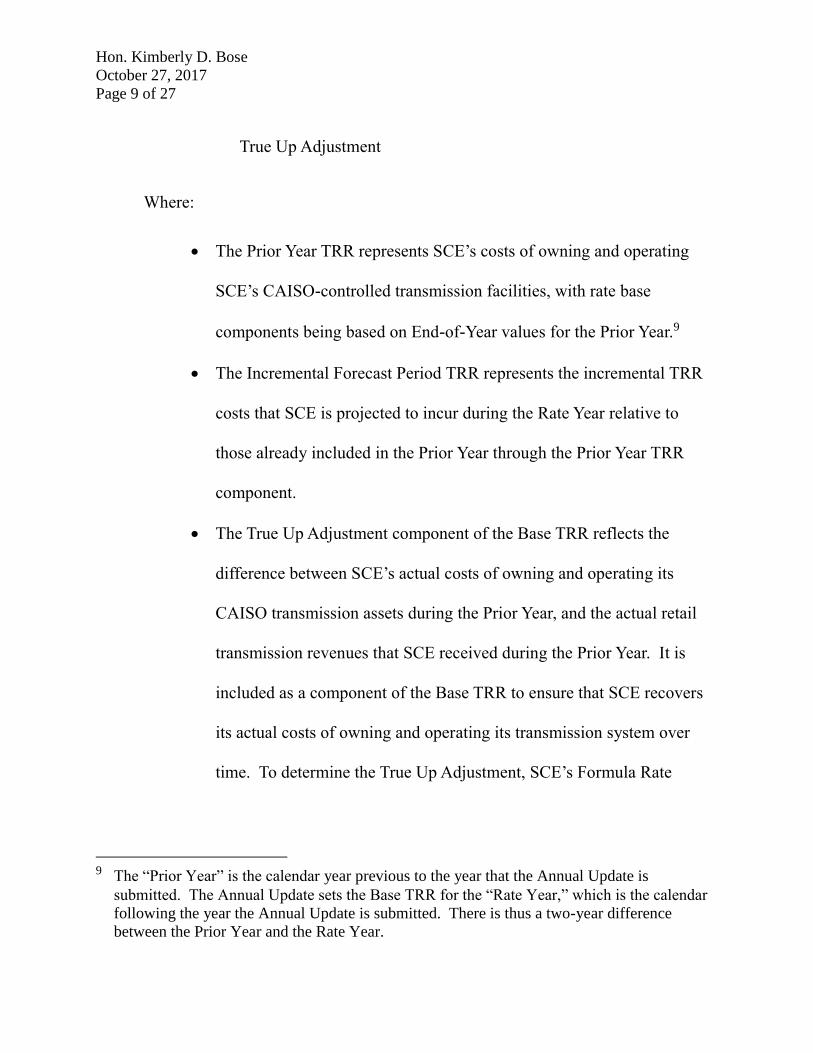
True Up Adjustment
Where:
The Prior Year TRR represents SCE’s costs of owning and operating
SCE’s CAISO-controlled transmission facilities, with rate base
components being based on End-of-Year values for the Prior Year.9
The Incremental Forecast Period TRR represents the incremental TRR
costs that SCE is projected to incur during the Rate Year relative to
those already included in the Prior Year through the Prior Year TRR
component.
The True Up Adjustment component of the Base TRR reflects the
difference between SCE’s actual costs of owning and operating its
CAISO transmission assets during the Prior Year, and the actual retail
transmission revenues that SCE received during the Prior Year. It is
included as a component of the Base TRR to ensure that SCE recovers
its actual costs of owning and operating its transmission system over
time. To determine the True Up Adjustment, SCE’s Formula Rate
9 The “Prior Year” is the calendar year previous to the year that the Annual Update is
submitted. The Annual Update sets the Base TRR for the “Rate Year,” which is the calendar
following the year the Annual Update is submitted. There is thus a two-year difference
between the Prior Year and the Rate Year.
Hon. Kimberly D. Bose
October 27, 2017
Page 10 of 27
calculates a “True Up TRR,” which is the measure of SCE’s actual
Base TRR costs incurred during the Prior Year.
B. The Annual Update Process
The proposed Annual Update process is set forth in the Section 3 of the Formula
Protocols, and includes the following aspects:
1) On or before June 15 of each year, SCE will post on its website a
“Draft Annual Update” which will include substantially all aspects of
the Annual Update informational filing (Section 3.a of the proposed
Formula Rate Protocols).
2) On or before July 15 of each year, a Draft Annual Update conference is
to be held, the purpose of which is for SCE to meet with customers to
discuss the Draft Annual Update (Section 3.b of proposed Formula Rate
Protocols).
3) Between the period from June 15 to November 1, customers may submit
data requests to SCE, and SCE shall make a good faith effort to respond
to information requests in writing within ten business days (Section 3.c
of proposed Formula Rate Protocols).
4) On or before December 1 of each year, SCE will submit the Annual
Update informational filing (Section 3.d of proposed Formula Rate
Protocols).
Hon. Kimberly D. Bose
October 27, 2017
Page 11 of 27
5) On January 1 of the following year, the Base TRR and associated retail
and wholesale transmission rates included in the Annual Update filing
will be placed into effect (Section 3.d of proposed Formula Rate
Protocols).
SCE is not proposing any revisions to the Annual Update process relative to the
process in the Original Formula Rate.
C. Allocation of Costs Between CAISO and Non-CAISO
Not all of the costs that SCE books as Transmission in its accounting system and
reports to the Commission in its annual FERC Form No. 1 filings are Commission-
jurisdictional. A significant portion of SCE’s plant booked as Transmission plant, or
costs booked as Transmission Operations and Maintenance (“O&M”) costs, represent
costs that are under the California Public Utilities Commission (“CPUC”) jurisdiction.
Accordingly, SCE must determine for ratemaking purposes the portion of Transmission
plant and Transmission O&M costs that are Commission jurisdictional.
To determine the portion of plant booked for accounting purposes as Transmission
Plant that is under the CAISO’s Operational Control and therefore is Commission-
jurisdictional (ISO Transmission Plant), SCE performs an annual Transmission Plant
Study. The Transmission Plant Study examines all facilities that are booked as
Transmission Plant and determines what portion of the facilities are ISO Transmission
Plant. Mr. Jacob Moon fully supports and explains the Transmission Plant Study in his
testimony, Exhibit No. SCE-9.
Hon. Kimberly D. Bose
October 27, 2017
Page 12 of 27
SCE’s proposed Formula Rate also includes a mechanism to determine the portion
of total Transmission O&M expense that is related to the ISO Transmission Plant and will
be recovered through the proposed Formula Rate. As explained below, SCE is proposing
revisions to the determination of ISO Transmission O&M expense in this proposed
Formula Rate relative to the Original Formula Rate in order to better align SCE’s
Formula Rate with industry practices for Formula Rate recovery of Commission-
jurisdictional O&M Expenses. Mr. Daniel Allstun explains how SCE’s proposed
revisions to O&M Expense recovery are consistent with cost causation, improve
transparency and replicability, and better align with industry practices for O&M Expense
recovery in his testimony, Exhibit No. SCE-10. Mr. Jacob Moon fully supports and
explains the overall Transmission O&M Expense determination in his testimony,
Exhibit No. SCE-9.
D. Transition from the Original Formula Rate to the Proposed
Formula Rate
The Original Formula Rate includes a provision for a “Final True Up Adjustment”
for the Original Formula Rate,10 which states that SCE is entitled and required to recover
any costs through the term of the Original Formula Rate. Accordingly, although SCE is
10 See Section 4 of the Original Formula Rate protocols: “If the Final True Up Adjustment
reflects an undercollection by SCE, then SCE shall be entitled and required to recover the
amount of this Final True Up Adjustment in SCE’s successor transmission rates to the
Formula Rate. If the Final True Up Adjustment reflects an overcollection by SCE, then SCE
shall be required to refund the amount of this Final True Up Adjustment to its customers.”
Hon. Kimberly D. Bose
October 27, 2017
Page 13 of 27
proposing an effective date of January 1, 2018 for this Formula Rate, the Original
Formula Rate will still be utilized for the purpose of calculating the True Up TRRs for
both the 2016 and 2017 years.11 The True Up TRR for the 2016 year calculated using the
Original Formula Rate is being submitted contemporaneously with this filing, in
accordance with Section 4 of the Formula Rate protocols:
“SCE shall file the Annual True Up Adjustment for calendar year 2016
with the Commission concurrently with the Section 205 filing addressed
in Section 2 above, which is to replace this Formula Rate, effective on
January 1, 2018.”
In this filing, SCE is proposing provisions that will ensure that the True Up TRRs
for the period of time the Original Formula Rate was in effect are calculated pursuant to
the Original Formula Rate. Specifically, revised Section 6 of the proposed Formula Rate
protocols (“Transition of the Original Formula Rate to the Formula Rate”) explains that
“The Formula Rate Base TRR and associated rates for the Rate Years 2018 and 2019 shall
reflect a True Up Adjustment that is based on a True Up TRR for the years 2016 and 2017
respectively calculated pursuant to the Original Formula Rate.” This requirement is
implemented in the calculation of the True Up Adjustment component of the proposed
2018 Base TRR for the proposed Formula Rate. The testimony of Mr. Hansen explains
the implementation of this transition provision testimony, Exhibit No. SCE-3.
11 Also, in the event that the Commission does not accept SCE’s proposed Formula Rate with an
effective date of January 1, 2018, the Original Formula Rate will remain in effect for some
period of time in 2018, as explained in Section III. In that event, the True Up TRR for the
portion of 2018 that the Original Formula Rate was in effect will also be calculated using the
Original Formula Rate.
Hon. Kimberly D. Bose
October 27, 2017
Page 14 of 27
E. Return on Equity
The Return on Equity (“ROE”) in the proposed Formula Rate reflects a base ROE
of 10.3% and a 50 basis point adder for ISO participation as approved by the
Commission.12 It also reflects the specific project incentive adders that SCE has received
for certain transmission projects.13 The base ROE requested by SCE is supported by the
analysis and testimony of Dr. Paul Hunt in Exhibit Nos. SCE-17-21. Dr. Hunt provides
an appraisal of the cost of equity to SCE and concludes that a base ROE of 10.3% is just
and reasonable and will allow SCE to attract capital on reasonable terms.
Dr. Hunt’s evaluation and recommendation is based on using SCE’s expanded
two-step Discounted Cash Flow (DCF) methodology. This methodology is based on the
Commission’s two-step DCE methodology from Opinion No. 53114 but uses enhanced
input assumptions which result in an expanded proxy group and additional sources of
short-term growth rates. Dr. Hunt also offers an enhanced approach to removing outlying
utilities from the proxy group. Dr. Hunt evaluates the Commission’s most recent
guidance and policy objectives, including the guidance provided in Opinion Nos. 531
12 Southern California Edison Co., 121 FERC ¶ 61,168 (2007) at P 158. 13 The Commission has authorized the following transmission project adders: the Rancho Vista,
0.75 percent; Tehachapi, 1.25 percent; and Devers-Colorado River, 1.00 percent. See,
Southern California Edison Co., 121 FERC ¶ 61,168 (2007) at P 129 and Southern California
Edison Co., 132 FERC ¶ 61,213 (2010). 14 Martha Coakley et al. v. Bangor Hydro-Electric Co. et al., Opinion No. 531, 147 FERC
61,234 (2014) (“Opinion No. 531”).
Hon. Kimberly D. Bose
October 27, 2017
Page 15 of 27
and 551,15 examines the recent D.C. Circuit court decision in Emera Maine16 and reviews
alternative methods to determine Return on Equity in addition to those applied by the
Commission in Opinion Nos. 531 and 551. To determine whether SCE’s requested
10.3% base ROE was just and reasonable, Dr. Hunt first assembled a proxy group of
comparable electric utilities using the proxy group screening criteria set forth in Opinion
Nos. 531 and 551. Those proxy group screening criteria, however, produced a proxy
group of just ten utilities. Dr. Hunt determined that the proxy group parameters set forth
in Opinion Nos. 531 and 551 were overly stringent in these circumstances and that many
companies that are comparable to SCE fell out of the proxy group. A sample size of only
10 utilities undermined the reliability of the estimated outcome. Therefore, Dr. Hunt
increases the proxy group size by including all electric companies that are within
investment grade. Further, Dr. Hunt incorporates more growth rate assumptions that are
representative of investors’ expectations. This includes Bloomberg, Morningstar, S&P
Capital IQ, Value Line and Zacks in addition to IBES short-term growth rates.
Dr. Hunt also considers the results of the alternative benchmark methods in
evaluating a just and reasonable ROE from within the upper end of the results produced
by the two-step DCF method. Dr. Hunt evaluated the cost of equity for SCE using the
risk premium approach, the Capital Asset Pricing Model (“CAPM”) and the empirical
Capital Asset Pricing Model (“eCAPM”) – which inform the placement of the base ROE
15 See Testimony of Dr. Paul T. Hunt, Exhibit No. SCE-17 (“Hunt Testimony”) at pp. 30-42. 16 Hunt Testimony at p. 27.
Hon. Kimberly D. Bose
October 27, 2017
Page 16 of 27
within the zone of reasonableness implied by Dr. Hunt’s expanded two-step DCF
analysis. He also evaluated the state-approved ROEs for integrated utilities as another
benchmark, and discusses that SCE’s state-approved ROE for 2018 and 2019 is 10.3%.
He further describes risks and uncertainties unique to California transmission investment
including an ever expanding role of distributed generation resources, and environmental
policy designed to dramatically reduce carbon emissions. Finally, Dr. Hunt discusses that
there continues to be anomalous market conditions that result in the DCF analysis
understating SCE’s cost of equity capital. Looking at all of the evidence, he concludes
that a 10.3% base ROE is just and reasonable and would satisfy Hope and Bluefield.17
Dr. Hunt’s testimony also explains that the 50 basis point adder for ISO/RTO
membership has been approved by the Commission, recognizing the benefits that flow
from membership in an ISO/RTO. Further, Dr. Hunt explains the specific transmission
project adders that SCE has received for three of its transmission projects. Dr. Hunt
testifies that the combined ROE, which consists of the base ROE, ISO adder and specific
project adders falls below the upper boundaries produced by his alternative application of
the two-step DCF method.
17 Federal Power Comm’n v. Hope Natural Gas Co., 320 U.S. 591 (1944) (Hope); Bluefield
Water Works and Improvement Co. v. Public Service Commission of the State of West
Virginia, 262 U.S. 679 (1923) (Bluefield).
Hon. Kimberly D. Bose
October 27, 2017
Page 17 of 27
F. Proposed Depreciation Rates
SCE is proposing to revise the depreciation rates used in the Original Formula
Rate associated with ISO Transmission plant to be in alignment with the rates that SCE
has proposed in its recent CPUC 2018 General Rate Case (“GRC”). The depreciation
rates requested by SCE are supported by the testimony of Mr. David Gunn in Exhibit
Nos. SCE-7 and SCE-8. Mr. Gunn explains that in SCE’s 2018 GRC filing, SCE
submitted a detailed depreciation study that ascertained that SCE’s currently-effective
transmission rates do not adequately recover depreciation expense. The detailed study
represents SCE’s current best estimate of the life and net salvage parameters necessary to
allocate the cost of Transmission plant over its useful life. Finally, Mr. Gunn explains
that the study results were moderated by SCE’s application of “gradualism.” Specifically,
SCE capped its depreciation rates by limiting increases in net salvage rates to no more
than 25% of the currently authorized values. As a result, SCE’s depreciation rate
proposal is both a conservative and a well-supported means of calculating Transmission
Plant – ISO depreciation expense. SCE’s proposal will result in an increase in its
transmission depreciation rates. Although the increase differs from account to account,
on a weighted average basis, SCE is proposing an increase from about 2.54% (which was
the result of settlement adopted in the Original Formula Rate) to 2.73%. Notably,
however, had SCE not voluntarily chosen to implement the gradualism approach, the
composite depreciation rate would be 3.87% – a result mandated by the strict application
of the methodology of SCE’s deprecation analysis.
Hon. Kimberly D. Bose
October 27, 2017
Page 18 of 27
V. PROPOSED REFINEMENTS TO THE FORMULA RATE
SCE has, over the last five years, gained significant experience in administering
a formula rate. Through regular and productive interactions with the stakeholders, SCE
and its customers have gained an opportunity to understand and identify changes which
have the potential to benefit all parties, provide for a more efficient process, ensure
compliance with evolving rules, and improve the treatment of certain costs. With that in
mind, below is a short discussion of the key changes to the Original Formula Rate that
are included in this filing. There are many less significant revisions that SCE is
proposing to make to the Formula Rate. Exhibit Nos. SCE-5 and SCE-6, supported by
Mr. Hansen, present a listing of all proposed revisions to the Formula Spreadsheet and
Formula Protocols, and the witness supporting each.
A. Refinements to the Proposed Formula Rate
1. Simplification of the Calculation of Operations and Maintenance
Expense (“O&M Expense”)
SCE’s proposed Formula Rate simplifies the calculation of the O&M Expense so
that the calculation of the ISO O&M expense recovered in the Formula will rely on fewer
allocation factors and be more readily understood by the stakeholders while continuing
to adhere to cost causation principles. SCE’s Original Formula Rate uses 23 different
allocation factors to apply to 58 Transmission and Distribution O&M accounts and
subaccounts to determine the portion of total recorded Transmission and Distribution
O&M expense that is associated with ISO transmission. In the proposed Formula Rate,

Hon. Kimberly D. Bose
October 27, 2017
Page 19 of 27
SCE has reduced the number of allocation factors to 6 and reduced the number of
accounts and sub accounts to 35. As described by Mr. Allstun in Exhibit No. SCE-10, the
reduction in the allocation factors and accounts will more closely align SCE’s Formula
Rate with industry standard practice, while still resulting in a just and reasonable
determination of ISO O&M expense.
2. Cost of Capital Changes
SCE’s proposed Formula Rate revises the calculation of the cost of debt and
preferred stock components of the cost of capital to consider the net proceeds of each
debt and preferred stock issuance. For each issuance, a percentage cost of debt or
preferred stock will be calculated based on a “Yield to Maturity” methodology.18 For
comparison, the Original Formula Rate cost of debt and preferred stock was based on an
aggregated calculation of total annual costs of all issuances divided by the gross proceeds
of all issuances. Additionally, SCE has excluded certain debt issuances that do not
finance Rate Base from the calculation of the cost of debt, such as debt that funds long
term fuel expenses and debt related to the San Onofre Nuclear Generation Station
regulatory asset. These modifications are supported by Dr. Hunt in Exhibit No. SCE-17.
18 The YTM methodology determines an interest rate that is the yield over the life of the
issuance considering the net proceeds of the issuance and the interest or dividend obligations
over the life of the issuance.
Hon. Kimberly D. Bose
October 27, 2017
Page 20 of 27
3. PBOPs Annual Filing
SCE’s proposed Formula Rate simplifies the mechanism to determine the amount
of Post Retirement Benefits Other than Pensions Expense (“PBOPs Expense”) to be
recovered. Under the proposed Formula Rate, SCE will make an annual filing to revise
the Authorized PBOPs Expense Amount. In the Original Formula Rate, there was a
threshold test performed every other year to determine whether SCE was required to file
a new Authorized PBOPs Expense Amount at the Commission.19 A mandatory annual
filing is less complicated and give customers greater assurance such costs are accurately
reflected in rates. This modification is supported by Mr. Hansen in Exhibit No. SCE-3.
4. ADIT Changes
SCE has revised the calculation of Accumulated Deferred Income Taxes (“ADIT”)
to be calculated using a “pro rata weighted average tax normalization calculation”
consistent with guidance provide for by the Internal Revenue Service normalization rules.
These proposed revisions to the calculation of ADIT (new Section 5 of Schedule 9, Lines
805 through 819 of Exhibit No. SCE-4) are supported by Mr. Alfred Lopez in Exhibit No.
SCE-11.
19 The Authorized PBOPs Expense Amount is a stated value in the Formula Rate which
specifies the amount of PBOPs expense recovery that SCE will recover through A&G
expenses. It may only be revised by SCE pursuant to a Section 205 filing and Commission
acceptance of the filing.
Hon. Kimberly D. Bose
October 27, 2017
Page 21 of 27
5. True-Up Adjustment Revisions
The proposed Formula Rate includes a simplification and revision of the True Up
Adjustment component of the Base TRR (Schedule 3 of the Formula Spreadsheet), which
should yield an easier to understand mechanism that will continue to accurately track
SCE’s cumulative over or under recovery of actual TRR costs, and also reduce the
magnitude of the True Up Adjustments in Annual Updates, either in the positive or
negative direction. The modifications to Schedule 3 of the Formula Spreadsheet (Exhibit
No. SCE-4) are supported by Mr. Hansen in Exhibit No. SCE-3.
6. Modification to Incentive Compensation
SCE’s proposed Formula Rate includes revisions to recover certain incentive
compensation costs that are not recovered in the Original Formula Rate. In the proposed
Formula Rate, SCE has eliminated any caps or limits upon its incentive compensation
recovery, so that it will be able to collect costs incurred in a manner consistent with
FERC policy. This change ensures that SCE is able to recover the correct amount of
incentive compensation expense amounts that are actually incurred.20 The modifications
to the proposed Formula Rate required to ensure that SCE correctly recovers incentive
compensation costs are supported by Mr. Mindess in Exhibit No. SCE-12.
20 Under the Original Formula Rate, SCE agreed in settlement to exclude from recovery certain
incentive compensation costs (which include items such as annual bonuses to employees and
long term incentive compensation to executives), consistent with SCE’s CPUC 2015 GRC
decision.
Hon. Kimberly D. Bose
October 27, 2017
Page 22 of 27
7. Modification to Cash Working Capital Determination
Consistent with Commission policy, the proposed Formula Rate calculates the
Cash Working Capital component of Rate Base to be based on 1/8 of O&M and A&G
expenses. In the Original Formula Rate, the number used was a result of the settlement
between the parties. However, it is Commission policy to use a 1/8 of O&M and A&G
expenses (45 days) in the absence of a lead-lag study for the applicable service. SCE
does not have a lead-lag study for its FERC jurisdictional services, nor does it have a
study that can be modified in this way. This modification is supported by Mr. David
Gunn in Exhibit No. SCE-7.
8. Intra-Year Balances of ISO Transmission Plant and ISO Accumulated
Depreciation
SCE has revised the calculations of monthly balances of ISO Transmission Plant
and ISO Accumulated Depreciation. The revisions to the calculation of these values,
performed on Schedules 6 and 8 of the Formula Spreadsheet (Exhibit No. SCE-4), will
improve the formula rate transparency and understandability, and align the calculation
methodologies used in each schedule to be more consistent with each other, while
resulting in no actual change in the calculated monthly amounts of ISO Transmission
Plant and minimal changes in Accumulated Depreciation. This change is supported by
Mr. Gunn in Exhibit No. SCE-7.
B. Revisions to the Formula Rate Protocols
1. Removal of Periodic Information Submittals
Hon. Kimberly D. Bose
October 27, 2017
Page 23 of 27
Section 12 of the Original Formula Rate Protocols detailed certain periodic
submissions to the CPUC. Section 12 also detailed an annual Transmission Capital
Review process pursuant to which the CPUC reviewed certain of SCE’s planned and
in-process capital projects. SCE is removing these obligations as the periodic
submissions and review were part of the negotiated settlement and are not required
pursuant to any FERC policy or practice. However, SCE understands that certain
stakeholders have expressed an increased interest in transparency of SCE’s planned
capital investments that are beyond the purview of the CAISO’s annual transmission
planning process. To that end, SCE anticipates proposing enhancements to its TO Tariff
to provide for additional transparency regarding the process SCE uses to identify such
planned capital additions. SCE anticipates making that filing in a separate docket from
this proposed Formula Rate in the near future.
2. Removal of O&M Protocols
The Original Formula Rate Protocols included the methodology for the
determination of ISO O&M expense. However, this methodology was also set forth in
the Original Formula Rate (Schedules 19 and 27). SCE is removing this information
from the proposed Formula Rate Protocols to reduce unnecessary duplication and the
likelihood of error that comes with the duplication.
Hon. Kimberly D. Bose
October 27, 2017
Page 24 of 27
3. Termination of Proposed Formula Rate
The proposed Formula Rate does not include a termination date.21 The Original
Formula Rate worked well and the Commission has recognized the benefits of formula
rates to consumers and transmission service providers alike.
VI. CONTENTS OF THIS FILING
The documents submitted with this filing consist of this letter of transmittal and
the following documents:
1. A revised clean version of SCE’s TO Tariff sheets reflecting the proposed
Formula Rate;
2. A red-lined version of the revised TO Tariff sheets reflecting the proposed
Formula Rate;
3. The relevant Cost of Service Statements;
4. Attestation by Constance J. Erickson, Vice President;
5. Prepared Direct Testimony, Exhibits, and Workpapers of the following
witnesses:
a. Exhibits SCE-1 through SCE-2: testimony of Mr. Jeffrey L. Nelson
and exhibits thereto;
b. Exhibits SCE-3 through SCE-6: testimony of Mr. Berton J. Hansen
and exhibits thereto;
c. Exhibits SCE-7 through SCE-8: testimony of Mr. David Gunn and
exhibits thereto;
d. Exhibit SCE-9: testimony of Mr. Jacob Moon;
e. Exhibit SCE-10: testimony of Mr. Daniel J. Allstun;
f. Exhibit SCE-11: testimony of Mr. Alfred Lopez;
g. Exhibit SCE-12: testimony of Mr. Robert G. Mindess;
21 The Original Formula Rate was in effect for six years as a result of settlement between the
parties at the time.
Hon. Kimberly D. Bose
October 27, 2017
Page 25 of 27
h. Exhibits SCE-13 through SCE-14: testimony of Ms. Jee Kim and
exhibits thereto;
i. Exhibit SCE-15: testimony of Mr. Antonio Ocegueda;
j. Exhibit SCE-16: testimony of Mr. Robert A. Thomas;
k. Exhibits SCE-17 through SCE-21: testimony of Dr. Paul T. Hunt and
exhibits thereto;
l. Exhibit SCE-22: Workpapers supporting all witnesses
VII. COMMUNICATIONS
SCE requests that all correspondence, pleadings and other communications
concerning this filing be served upon:
Rebecca Furman
Law Department
Southern California Edison Company
P.O. Box 800
2244 Walnut Grove Avenue
Rosemead, CA 91770
Tel. (626) 302-3475
Anna J. Valdberg
Law Department
Southern California Edison
Company
P.O. Box 800
2244 Walnut Grove Avenue
Rosemead, CA 91770
Tel. (626) 302-1058
Jeff Nelson22
Director, FERC Rates & Regulation
Southern California Edison Company
P.O. Box 800
2244 Walnut Grove Avenue
Rosemead, CA 91770
22 SCE requests waiver of Section 385.203(b)(3) of the Commission’s Regulations to allow
three people to be on this list.
Hon. Kimberly D. Bose
October 27, 2017
Page 26 of 27
VIII. REQUEST FOR WAIVERS
To the extent that waivers of the Commission’s cost support regulations, in
18 C.F.R. § 35.13 (2010), are necessary,23 SCE respectfully requests such waivers,
including waiver of the full Period I and Period II data requirements. Good cause exists
for such waiver. The statements, testimony and exhibits accompanying this filing,
together with SCE’s publicly-available FERC Form 1 information, provide ample support
for the reasonableness of the proposed formula rates. Detailed statements of the
applicant’s cost of service are not needed where the proposed rates are formulary and
will be based on actual costs as reflected in the applicant’s audited books and records.
Further, such waiver would be consistent with Commission precedent in SCE’s Original
Formula Rate and other formula rates of this nature.24
23 18 C.F.R. § 35.13.
24 Southern California Edison Co., 136 FERC ¶ 61,074 at P 29 (2011)( granting waiver of
request for waiver of the requirements under section 35.13 regarding the filing of a full
Period I and Period II study); Pub. Serv. Elec. and Gas Co., 124 FERC ¶ 61,303 at PP 23-24
(2008) (granting waiver of Sections 35.13(d)(1)-(2), 35.13(d)(5), and 35.13(h)); Okla. Gas &
Elec. Co., 122 FERC ¶ 61,071 at P 41 (2008) (same); Am. Elec. Power Serv. Corp., 120
FERC ¶ 61,205 at P 41 (2007) (granting waiver of Period I and II data); Commonwealth
Edison Co., 119 FERC ¶ 61,238 at PP 92-94 (2007) (granting waiver of Period I and II data
and cost-of-service statements); Trans-Allegheny Interstate Line Co., 119 FERC ¶ 61,219 at
P 57 (2007) (same); Duquesne Light Co., 118 FERC ¶ 61,087 at P 79 (2007) (granting waiver
of Sections 35.13(d)(1)-(2) and 35.13(h)); Idaho Power Co., 115 FERC ¶ 61,281 at P 20
(2006) (granting waiver of Period II data); Allegheny Power Sys. Operating Cos., 111 FERC
¶ 61,308 at PP 55-56 (2005) (granting waiver of Period I and II data).

Hon. Kimberly D. Bose
October 27, 2017
Page 27 of 27
IX. OTHER FILING REQUIREMENTS
No expenses or costs included in the cost of service statements tendered herein
have been alleged or judged in any administrative or judicial proceeding to be illegal,
duplicative or unnecessary costs that are demonstrably the product of discriminatory
employment practices.
SCE believes this filing conforms to any rule of general applicability and to any
Commission order specifically applicable to SCE, and has made copies of this letter and
all enclosures available for public inspection in SCE’s principal office located in
Rosemead, California. SCE has e-mailed a link to this filing to those persons who are on
the service lists for Docket No. ER11-3697.
Respectfully submitted,
/s/ Rebecca A. Furman___________
Rebecca A. Furman
Southern California Edison Company
P.O. Box 800
2244 Walnut Grove Avenue
Rosemead, CA 91770
Tel. (626) 302-3475
E-mail: [email protected]
Dated: October 27, 2017
COST OF SERVICE
STATEMENTS
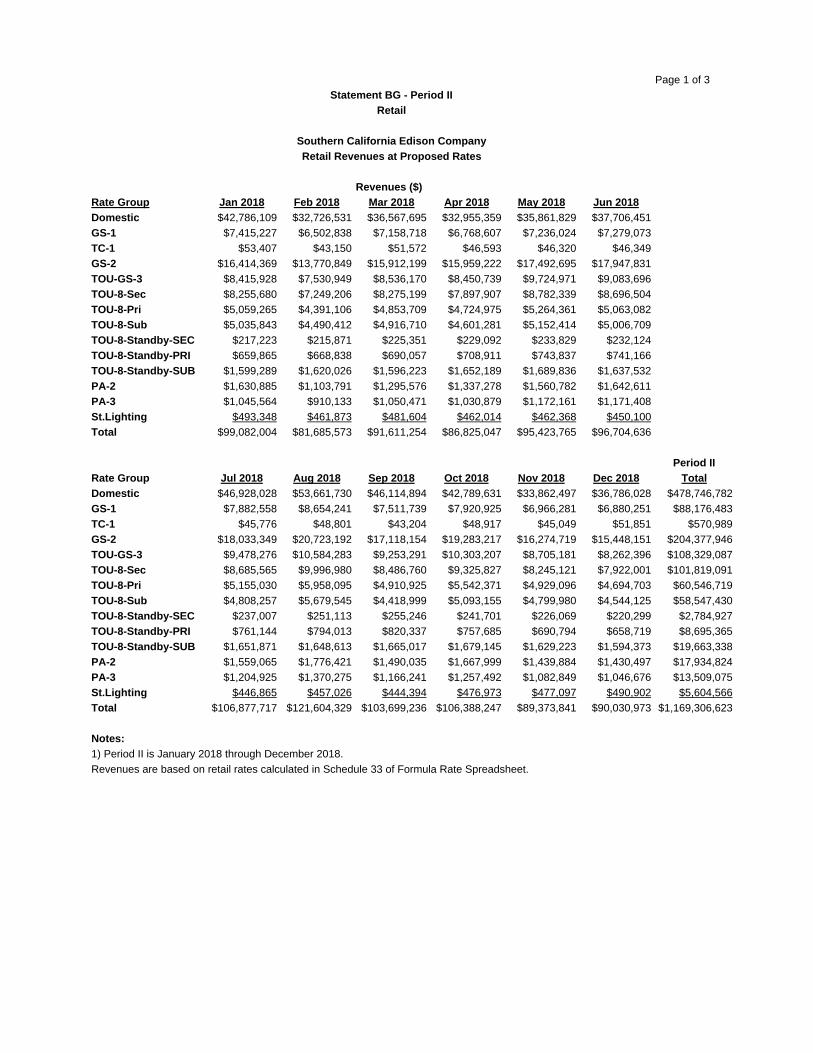
Page 1 of 3
Retail
Revenues ($)
Rate Group Jan 2018 Feb 2018 Mar 2018 Apr 2018 May 2018 Jun 2018
Domestic $42,786,109 $32,726,531 $36,567,695 $32,955,359 $35,861,829 $37,706,451
GS-1 $7,415,227 $6,502,838 $7,158,718 $6,768,607 $7,236,024 $7,279,073
TC-1 $53,407 $43,150 $51,572 $46,593 $46,320 $46,349
GS-2 $16,414,369 $13,770,849 $15,912,199 $15,959,222 $17,492,695 $17,947,831
TOU-GS-3 $8,415,928 $7,530,949 $8,536,170 $8,450,739 $9,724,971 $9,083,696
TOU-8-Sec $8,255,680 $7,249,206 $8,275,199 $7,897,907 $8,782,339 $8,696,504
TOU-8-Pri $5,059,265 $4,391,106 $4,853,709 $4,724,975 $5,264,361 $5,063,082
TOU-8-Sub $5,035,843 $4,490,412 $4,916,710 $4,601,281 $5,152,414 $5,006,709
TOU-8-Standby-SEC $217,223 $215,871 $225,351 $229,092 $233,829 $232,124
TOU-8-Standby-PRI $659,865 $668,838 $690,057 $708,911 $743,837 $741,166
TOU-8-Standby-SUB $1,599,289 $1,620,026 $1,596,223 $1,652,189 $1,689,836 $1,637,532
PA-2 $1,630,885 $1,103,791 $1,295,576 $1,337,278 $1,560,782 $1,642,611
PA-3 $1,045,564 $910,133 $1,050,471 $1,030,879 $1,172,161 $1,171,408
St.Lighting $493,348 $461,873 $481,604 $462,014 $462,368 $450,100
Total $99,082,004 $81,685,573 $91,611,254 $86,825,047 $95,423,765 $96,704,636
Period II
Rate Group Jul 2018 Aug 2018 Sep 2018 Oct 2018 Nov 2018 Dec 2018 Total
Domestic $46,928,028 $53,661,730 $46,114,894 $42,789,631 $33,862,497 $36,786,028 $478,746,782
GS-1 $7,882,558 $8,654,241 $7,511,739 $7,920,925 $6,966,281 $6,880,251 $88,176,483
TC-1 $45,776 $48,801 $43,204 $48,917 $45,049 $51,851 $570,989
GS-2 $18,033,349 $20,723,192 $17,118,154 $19,283,217 $16,274,719 $15,448,151 $204,377,946
TOU-GS-3 $9,478,276 $10,584,283 $9,253,291 $10,303,207 $8,705,181 $8,262,396 $108,329,087
TOU-8-Sec $8,685,565 $9,996,980 $8,486,760 $9,325,827 $8,245,121 $7,922,001 $101,819,091
TOU-8-Pri $5,155,030 $5,958,095 $4,910,925 $5,542,371 $4,929,096 $4,694,703 $60,546,719
TOU-8-Sub $4,808,257 $5,679,545 $4,418,999 $5,093,155 $4,799,980 $4,544,125 $58,547,430
TOU-8-Standby-SEC $237,007 $251,113 $255,246 $241,701 $226,069 $220,299 $2,784,927
TOU-8-Standby-PRI $761,144 $794,013 $820,337 $757,685 $690,794 $658,719 $8,695,365
TOU-8-Standby-SUB $1,651,871 $1,648,613 $1,665,017 $1,679,145 $1,629,223 $1,594,373 $19,663,338
PA-2 $1,559,065 $1,776,421 $1,490,035 $1,667,999 $1,439,884 $1,430,497 $17,934,824
PA-3 $1,204,925 $1,370,275 $1,166,241 $1,257,492 $1,082,849 $1,046,676 $13,509,075
St.Lighting $446,865 $457,026 $444,394 $476,973 $477,097 $490,902 $5,604,566
Total $106,877,717 $121,604,329 $103,699,236 $106,388,247 $89,373,841 $90,030,973 $1,169,306,623
Notes:
1) Period II is January 2018 through December 2018.
Revenues are based on retail rates calculated in Schedule 33 of Formula Rate Spreadsheet.
Statement BG - Period II
Southern California Edison Company
Retail Revenues at Proposed Rates
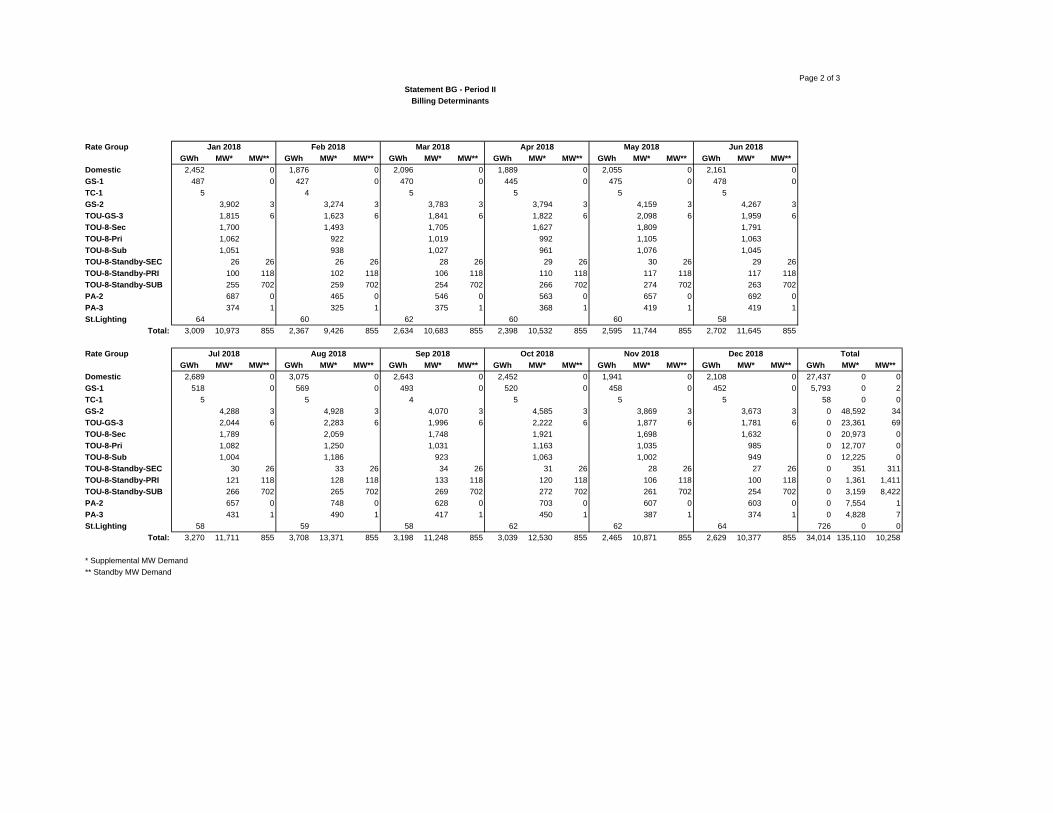
Page 2 of 3
Rate Group
GWh MW* MW** GWh MW* MW** GWh MW* MW** GWh MW* MW** GWh MW* MW** GWh MW* MW**
Domestic 2,452 0 1,876 0 2,096 0 1,889 0 2,055 0 2,161 0
GS-1 487 0 427 0 470 0 445 0 475 0 478 0
TC-1 5 4 5 5 5 5
GS-2 3,902 3 3,274 3 3,783 3 3,794 3 4,159 3 4,267 3
TOU-GS-3 1,815 6 1,623 6 1,841 6 1,822 6 2,098 6 1,959 6
TOU-8-Sec 1,700 1,493 1,705 1,627 1,809 1,791
TOU-8-Pri 1,062 922 1,019 992 1,105 1,063
TOU-8-Sub 1,051 938 1,027 961 1,076 1,045
TOU-8-Standby-SEC 26 26 26 26 28 26 29 26 30 26 29 26
TOU-8-Standby-PRI 100 118 102 118 106 118 110 118 117 118 117 118
TOU-8-Standby-SUB 255 702 259 702 254 702 266 702 274 702 263 702
PA-2 687 0 465 0 546 0 563 0 657 0 692 0
PA-3 374 1 325 1 375 1 368 1 419 1 419 1
St.Lighting 64 60 62 60 60 58
Total: 3,009 10,973 855 2,367 9,426 855 2,634 10,683 855 2,398 10,532 855 2,595 11,744 855 2,702 11,645 855
Rate Group
GWh MW* MW** GWh MW* MW** GWh MW* MW** GWh MW* MW** GWh MW* MW** GWh MW* MW** GWh MW* MW**
Domestic 2,689 0 3,075 0 2,643 0 2,452 0 1,941 0 2,108 0 27,437 0 0
GS-1 518 0 569 0 493 0 520 0 458 0 452 0 5,793 0 2
TC-1 5 5 4 5 5 5 58 0 0
GS-2 4,288 3 4,928 3 4,070 3 4,585 3 3,869 3 3,673 3 0 48,592 34
TOU-GS-3 2,044 6 2,283 6 1,996 6 2,222 6 1,877 6 1,781 6 0 23,361 69
TOU-8-Sec 1,789 2,059 1,748 1,921 1,698 1,632 0 20,973 0
TOU-8-Pri 1,082 1,250 1,031 1,163 1,035 985 0 12,707 0
TOU-8-Sub 1,004 1,186 923 1,063 1,002 949 0 12,225 0
TOU-8-Standby-SEC 30 26 33 26 34 26 31 26 28 26 27 26 0 351 311
TOU-8-Standby-PRI 121 118 128 118 133 118 120 118 106 118 100 118 0 1,361 1,411
TOU-8-Standby-SUB 266 702 265 702 269 702 272 702 261 702 254 702 0 3,159 8,422
PA-2 657 0 748 0 628 0 703 0 607 0 603 0 0 7,554 1
PA-3 431 1 490 1 417 1 450 1 387 1 374 1 0 4,828 7
St.Lighting 58 59 58 62 62 64 726 0 0
Total: 3,270 11,711 855 3,708 13,371 855 3,198 11,248 855 3,039 12,530 855 2,465 10,871 855 2,629 10,377 855 34,014 135,110 10,258
* Supplemental MW Demand
** Standby MW Demand
Total
Statement BG - Period II
Billing Determinants
Jul 2018 Aug 2018 Sep 2018 Oct 2018 Nov 2018 Dec 2018
Jan 2018 Feb 2018 Mar 2018 Apr 2018 May 2018 Jun 2018
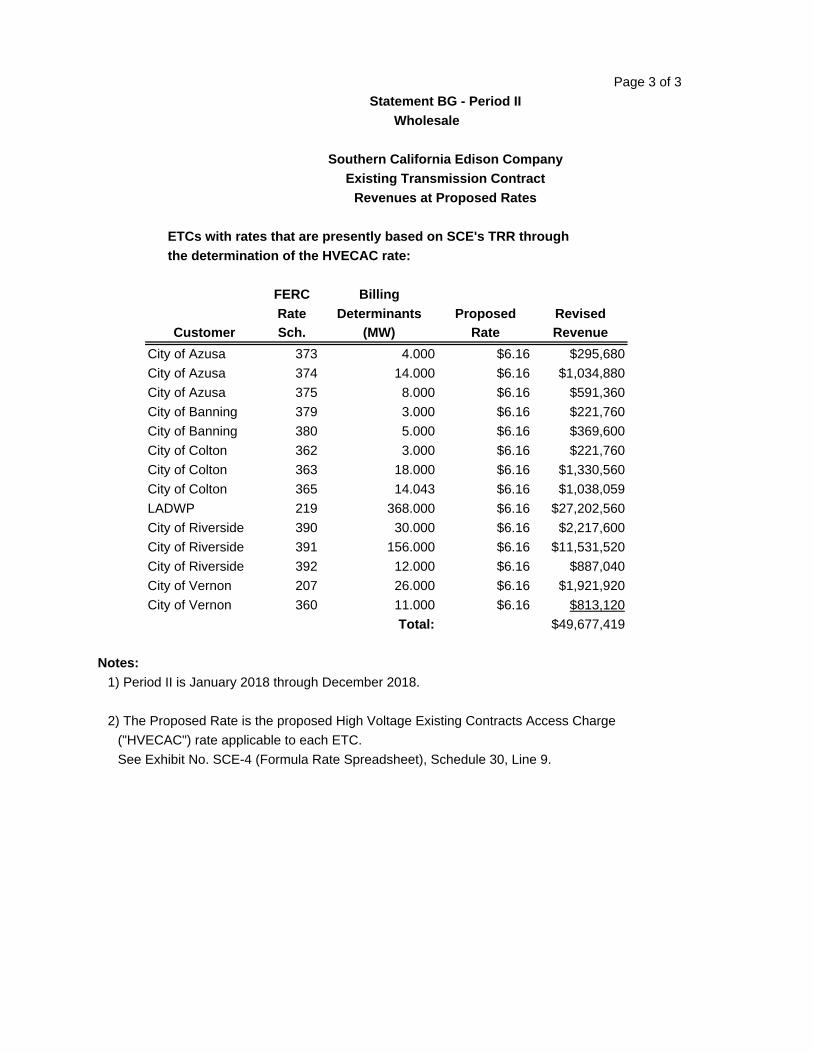
Page 3 of 3
ETCs with rates that are presently based on SCE's TRR through
the determination of the HVECAC rate:
FERC Billing
Rate Determinants Proposed Revised
Customer Sch. (MW) Rate Revenue
City of Azusa 373 4.000 $6.16 $295,680
City of Azusa 374 14.000 $6.16 $1,034,880
City of Azusa 375 8.000 $6.16 $591,360
City of Banning 379 3.000 $6.16 $221,760
City of Banning 380 5.000 $6.16 $369,600
City of Colton 362 3.000 $6.16 $221,760
City of Colton 363 18.000 $6.16 $1,330,560
City of Colton 365 14.043 $6.16 $1,038,059
LADWP 219 368.000 $6.16 $27,202,560
City of Riverside 390 30.000 $6.16 $2,217,600
City of Riverside 391 156.000 $6.16 $11,531,520
City of Riverside 392 12.000 $6.16 $887,040
City of Vernon 207 26.000 $6.16 $1,921,920
City of Vernon 360 11.000 $6.16 $813,120
Total: $49,677,419
Notes:
1) Period II is January 2018 through December 2018.
2) The Proposed Rate is the proposed High Voltage Existing Contracts Access Charge
("HVECAC") rate applicable to each ETC.
See Exhibit No. SCE-4 (Formula Rate Spreadsheet), Schedule 30, Line 9.
Statement BG - Period II
Wholesale
Southern California Edison Company
Existing Transmission Contract
Revenues at Proposed Rates
Page 1 of 2
Retail
Revenues ($)
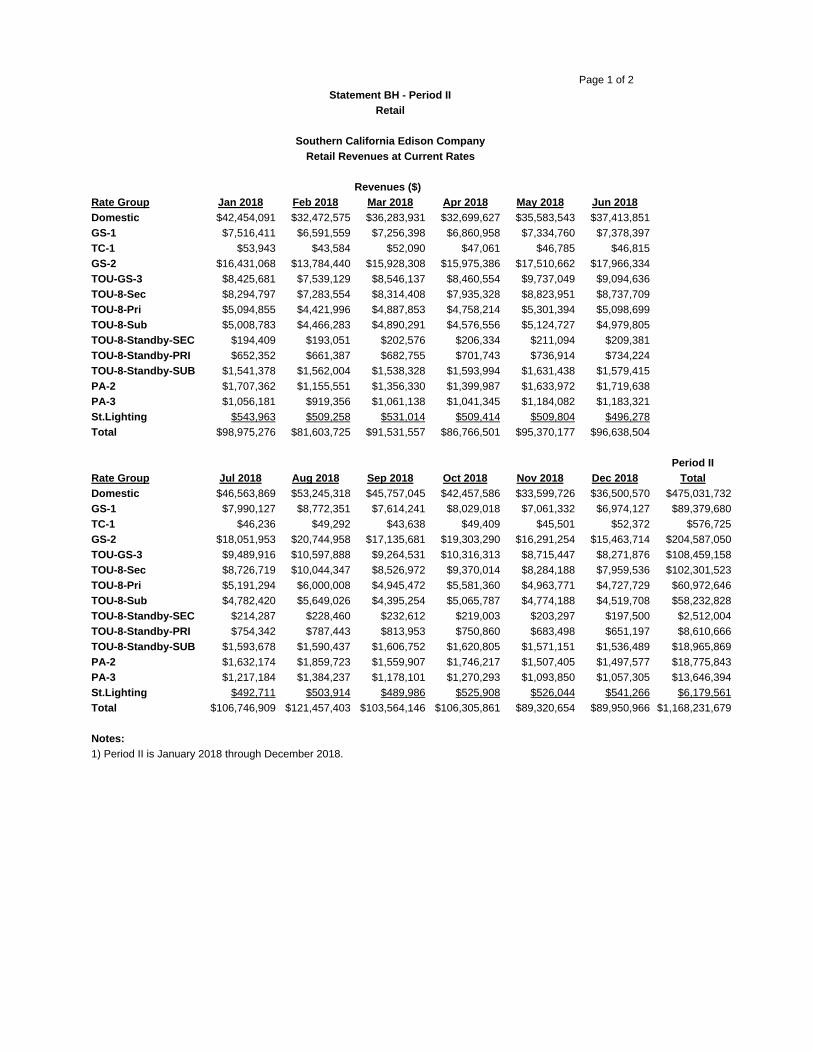
Rate Group Jan 2018 Feb 2018 Mar 2018 Apr 2018 May 2018 Jun 2018
Domestic $42,454,091 $32,472,575 $36,283,931 $32,699,627 $35,583,543 $37,413,851
GS-1 $7,516,411 $6,591,559 $7,256,398 $6,860,958 $7,334,760 $7,378,397
TC-1 $53,943 $43,584 $52,090 $47,061 $46,785 $46,815
GS-2 $16,431,068 $13,784,440 $15,928,308 $15,975,386 $17,510,662 $17,966,334
TOU-GS-3 $8,425,681 $7,539,129 $8,546,137 $8,460,554 $9,737,049 $9,094,636
TOU-8-Sec $8,294,797 $7,283,554 $8,314,408 $7,935,328 $8,823,951 $8,737,709
TOU-8-Pri $5,094,855 $4,421,996 $4,887,853 $4,758,214 $5,301,394 $5,098,699
TOU-8-Sub $5,008,783 $4,466,283 $4,890,291 $4,576,556 $5,124,727 $4,979,805
TOU-8-Standby-SEC $194,409 $193,051 $202,576 $206,334 $211,094 $209,381
TOU-8-Standby-PRI $652,352 $661,387 $682,755 $701,743 $736,914 $734,224
TOU-8-Standby-SUB $1,541,378 $1,562,004 $1,538,328 $1,593,994 $1,631,438 $1,579,415
PA-2 $1,707,362 $1,155,551 $1,356,330 $1,399,987 $1,633,972 $1,719,638
PA-3 $1,056,181 $919,356 $1,061,138 $1,041,345 $1,184,082 $1,183,321
St.Lighting $543,963 $509,258 $531,014 $509,414 $509,804 $496,278
Total $98,975,276 $81,603,725 $91,531,557 $86,766,501 $95,370,177 $96,638,504
Period II
Rate Group Jul 2018 Aug 2018 Sep 2018 Oct 2018 Nov 2018 Dec 2018 Total
Domestic $46,563,869 $53,245,318 $45,757,045 $42,457,586 $33,599,726 $36,500,570 $475,031,732
GS-1 $7,990,127 $8,772,351 $7,614,241 $8,029,018 $7,061,332 $6,974,127 $89,379,680
TC-1 $46,236 $49,292 $43,638 $49,409 $45,501 $52,372 $576,725
GS-2 $18,051,953 $20,744,958 $17,135,681 $19,303,290 $16,291,254 $15,463,714 $204,587,050
TOU-GS-3 $9,489,916 $10,597,888 $9,264,531 $10,316,313 $8,715,447 $8,271,876 $108,459,158
TOU-8-Sec $8,726,719 $10,044,347 $8,526,972 $9,370,014 $8,284,188 $7,959,536 $102,301,523
TOU-8-Pri $5,191,294 $6,000,008 $4,945,472 $5,581,360 $4,963,771 $4,727,729 $60,972,646
TOU-8-Sub $4,782,420 $5,649,026 $4,395,254 $5,065,787 $4,774,188 $4,519,708 $58,232,828
TOU-8-Standby-SEC $214,287 $228,460 $232,612 $219,003 $203,297 $197,500 $2,512,004
TOU-8-Standby-PRI $754,342 $787,443 $813,953 $750,860 $683,498 $651,197 $8,610,666
TOU-8-Standby-SUB $1,593,678 $1,590,437 $1,606,752 $1,620,805 $1,571,151 $1,536,489 $18,965,869
PA-2 $1,632,174 $1,859,723 $1,559,907 $1,746,217 $1,507,405 $1,497,577 $18,775,843
PA-3 $1,217,184 $1,384,237 $1,178,101 $1,270,293 $1,093,850 $1,057,305 $13,646,394
St.Lighting $492,711 $503,914 $489,986 $525,908 $526,044 $541,266 $6,179,561
Total $106,746,909 $121,457,403 $103,564,146 $106,305,861 $89,320,654 $89,950,966 $1,168,231,679
Notes:
1) Period II is January 2018 through December 2018.
Statement BH - Period II
Southern California Edison Company
Retail Revenues at Current Rates
Page 2 of 2
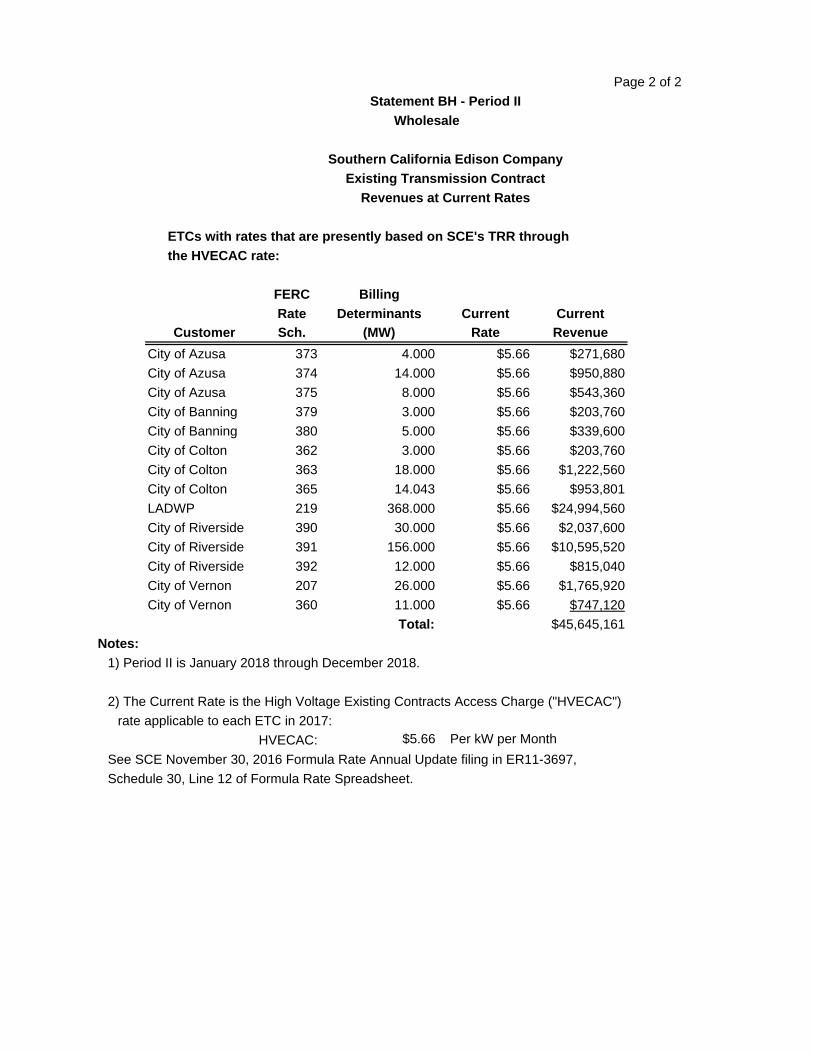
ETCs with rates that are presently based on SCE's TRR through
the HVECAC rate:
FERC Billing
Rate Determinants Current Current
Customer Sch. (MW) Rate Revenue
City of Azusa 373 4.000 $5.66 $271,680
City of Azusa 374 14.000 $5.66 $950,880
City of Azusa 375 8.000 $5.66 $543,360
City of Banning 379 3.000 $5.66 $203,760
City of Banning 380 5.000 $5.66 $339,600
City of Colton 362 3.000 $5.66 $203,760
City of Colton 363 18.000 $5.66 $1,222,560
City of Colton 365 14.043 $5.66 $953,801
LADWP 219 368.000 $5.66 $24,994,560
City of Riverside 390 30.000 $5.66 $2,037,600
City of Riverside 391 156.000 $5.66 $10,595,520
City of Riverside 392 12.000 $5.66 $815,040
City of Vernon 207 26.000 $5.66 $1,765,920
City of Vernon 360 11.000 $5.66 $747,120
Total: $45,645,161
Notes:
1) Period II is January 2018 through December 2018.
2) The Current Rate is the High Voltage Existing Contracts Access Charge ("HVECAC")
rate applicable to each ETC in 2017:
HVECAC: $5.66 Per kW per Month
See SCE November 30, 2016 Formula Rate Annual Update filing in ER11-3697,
Schedule 30, Line 12 of Formula Rate Spreadsheet.
Statement BH - Period II
Wholesale
Southern California Edison Company
Existing Transmission Contract
Revenues at Current Rates
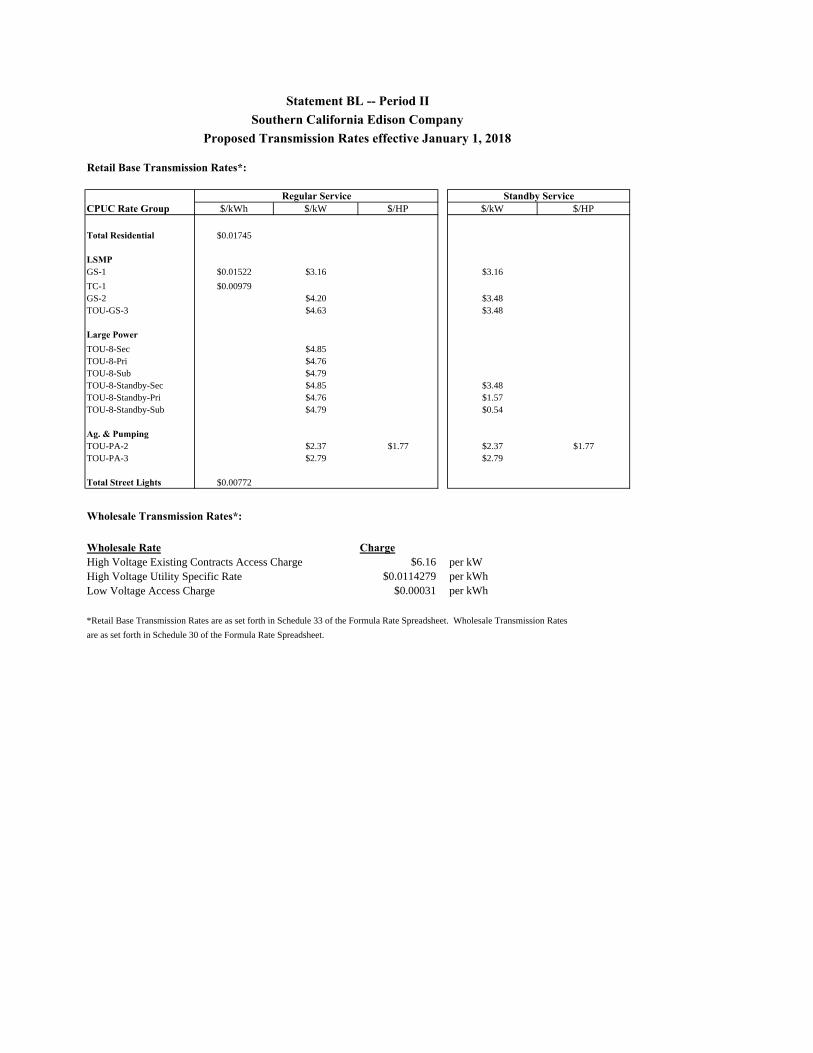
Retail Base Transmission Rates*:
CPUC Rate Group $/kWh $/kW $/HP $/kW $/HP
Total Residential $0.01745
LSMPGS-1 $0.01522 $3.16 $3.16
TC-1 $0.00979GS-2 $4.20 $3.48TOU-GS-3 $4.63 $3.48
Large PowerTOU-8-Sec $4.85TOU-8-Pri $4.76TOU-8-Sub $4.79TOU-8-Standby-Sec $4.85 $3.48TOU-8-Standby-Pri $4.76 $1.57TOU-8-Standby-Sub $4.79 $0.54
Ag. & PumpingTOU-PA-2 $2.37 $1.77 $2.37 $1.77TOU-PA-3 $2.79 $2.79
Total Street Lights $0.00772
Wholesale Transmission Rates*:
Wholesale Rate ChargeHigh Voltage Existing Contracts Access Charge $6.16 per kWHigh Voltage Utility Specific Rate $0.0114279 per kWhLow Voltage Access Charge $0.00031 per kWh
*Retail Base Transmission Rates are as set forth in Schedule 33 of the Formula Rate Spreadsheet. Wholesale Transmission Rates
are as set forth in Schedule 30 of the Formula Rate Spreadsheet.
Regular Service Standby Service
Southern California Edison CompanyStatement BL -- Period II
Proposed Transmission Rates effective January 1, 2018
Statement BM
Construction Program Statement
1
Statement BM
Southern California Edison Company
Construction Program Statement
Statement BM is a summary of data and supporting assumptions relating to the economics of any construction program to replace or expand the utility’s power supply that shall be filed if the utility is filing for construction work in progress in rate base under § 35.25(c)(3) of this chapter. The filing utility shall describe generally its program for providing reliable and economic power for the period beginning with the date of the filing and ending with the tenth year after the test period. The statement shall include an assessment of the relative costs of adopting alternative strategies including an analysis of alternative production plant, e.g., cogeneration, small power production, heightened load management and conservation efforts, additions to transmission plant or increased purchases of power, and an explanation of why the program adopted is prudent and consistent with a least-cost energy supply program.
Southern California Edison Company (“SCE”) is currently authorized to
recover through rates the Construction Work in Progress (“CWIP”) expenditures
related to seven transmission projects – the Devers-Colorado River Transmission
Project (formerly Devers-Palo Verde II Project (“DPV2”); only the California
portion of DPV2 and the unexpanded Colorado River Substation) (“DCR”), the
Tehachapi Renewable Transmission Project (“Tehachapi”), Red Bluff Substation
Project (“Red Bluff”), Calcite Substation Project (formerly Jasper; part of South of
Kramer Transmission Project) (“Calcite”), West of Devers Transmission Project
(“West of Devers”), Whirlwind Substation Expansion Project (“Whirlwind
Expansion”), and Colorado River Substation Expansion Project (“CRS
Expansion”) (collectively, “Projects”). Authorization to recover 100% of
prudently-incurred CWIP associated with the Projects was granted by the Federal
Energy Regulatory Commission (“FERC” or “Commission”) in Docket Nos.
EL07-62 in November 2007, EL10-81 in October 2010, and EL11-10 in March
2011.1
1 Southern California Edison Co., 121 FERC ¶ 61,168 (2007); Southern California
Edison Co., 133 FERC ¶ 61,108 (2010); Southern California Edison Co., 133 FERC ¶
61,107 (2010); and Southern California Edison Co., 134 FERC ¶ 61,181 (2011).
Statement BM
Construction Program Statement
2
Currently, and over the next several years, SCE is engaging in a
transmission infrastructure expansion in order to enlarge, improve, and reinforce
the California Independent System Operator Corporation’s (“CAISO”) grid to
maintain reliable service to customers and provide increased access to renewable
generation sources. These projects will significantly improve the reliability of the
CAISO bulk power transmission system and reduce the cost of power by reducing
transmission congestion on the CAISO-controlled transmission grid. The Projects
will also help SCE and other California utilities to meet the goals of the State of
California’s Renewable Portfolio Standards (“RPS”).
In order to develop the DCR, Tehachapi, and West of Devers projects, SCE
worked closely with the CAISO, the California Public Utilities Commission
(“CPUC”), and other stakeholders to determine whether these three projects would
provide reliable and economic power to California. Alternatives for each project
were considered and the projects were approved by both the CAISO and the
CPUC Certificates of Public Convenience and Necessity (“CPCN”) process. The
CPCN process is extremely thorough and requires both the applicant and the
CPUC to consider alternatives to each of the proposed Projects. The CPCN
process evaluates a number of factors including, but not limited to, impacts on the
transmission grid and other transmission users, cost-effectiveness, reasonable and
prudent costs, alternative routes and configurations, non-wires alternatives, and
impacts on the environment. The CPUC deemed that DCR, Tehachapi, and West
of Devers are preferable to all considered alternatives and approved the projects.
The Red Bluff, Calcite, West of Devers, Whirlwind Expansion, and CRS
Expansion projects (“Interconnection Projects”) were developed primarily to allow
for interconnection and delivery of renewable generation projects. The need for
the Interconnection Projects was identified in the interconnection studies
sponsored by the CAISO in connection with the CAISO’s interconnection
planning process and the development of the Large Generator Interconnection
Agreements (“LGIAs”), which are approved and executed by the CAISO.
All of the Projects will be placed under the CAISO’s Operational Control
once each Project is placed in-service. SCE has described below the process by
which each of the Projects was developed including the consideration of
alternatives. Additionally, a more detailed explanation of the Projects can be
found in SCE’s petitions in Docket Nos. EL07-62, EL10-81, and EL11-10.
DCR
The development of the DPV2 Project originated in a transmission group
process called the Southwest Transmission Expansion Plan (“STEP”), a group
Statement BM
Construction Program Statement
3
having approximately 300 general members. In developing a transmission plan to
further the development of a robust transmission system between the Arizona,
Nevada, Mexico, and southern California areas, STEP analyzed 26 different
combinations of facilities and proposed a series of projects. One of these projects
was DPV2.
On April 11, 2005, after review, analysis and approval by the CAISO, SCE
filed a CPCN application with the CPUC, which included an updated analysis that
demonstrated that DPV2 provides benefits in excess of $1.1 billion to California
consumers over the life of the Project and has a benefit-to-cost ratio of 1.7. The
CAISO was a party to the CPCN proceedings and it reported the results of its
evaluation process to the CPUC in recommending that the CPUC grant a CPCN.
On January 25, 2007, in Decision No. 07-01-040, the CPUC issued a CPCN
for DPV2. In its evaluation of DPV2, the CPUC found that additional
development of energy efficiency, demand response, and renewable generation
beyond the targets already set in SCE’s Long-Term Procurement Plan was not a
feasible or cost-effective alternative to DPV2:
The CAISO submits that California needs to add 5,000
MW or more in the next five years due to load growth
and generation retirement. In its opinion, both
additional generation in southern California and inter-
regional transmission upgrades including DPV2 should
be pursued. SCE concurs with the CAISO that both
generation and transmission options are needed, and
submits that non-transmission alternatives could not
meet all of the project objectives and/or could not be
counted on to develop fast enough or in enough
magnitude to avoid need for the DPV2 project.2
On May 1, 2006, SCE filed an application for a Certificate of
Environmental Compatibility (“CEC”) to construct the Arizona portion of DPV2.
The Arizona Power Plant and Transmission Line Siting Committee held extensive
public hearings in mid to late 2006 and early 2007. On March 21, 2007, the Siting
Committee found that the proposed project was environmentally compatible and
voted to grant SCE a CEC. Despite the Siting Committee approval, the Arizona
Corporation Commission (“ACC”) decided on June 6, 2007 to deny SCE’s
application. In a letter dated May 15, 2009 to the ACC, SCE indicated that SCE’s
updated economic analysis did not support a re-filing at this time for ACC
authorization to construct the Arizona portion of the Project.
2 See CPUC Decision 07-01-040, January 25, 2007 at pp. 51-54.
Statement BM
Construction Program Statement
4
On May 14, 2008, as the Arizona portion of DPV2 became delayed, SCE
filed with the CPUC a petition requesting modification of the original DPV2
decision to allow SCE to first proceed with construction of the California portion
of DPV2 otherwise known as Devers-Colorado River Transmission Project
(“DCR”). On November 20, 2009, the CPUC issued Decision 09-11-007, which
concluded that construction of DCR is required to meet future public convenience
and necessity and will allow access to significant potential renewable resources.
The decision allowed SCE to construct DCR contingent upon the CAISO
approval. On August 5, 2010, CAISO sent a letter to the CPUC stating that the
CAISO analysis demonstrated a need for DCR.3 On August 9, 2010, the CPUC
informed SCE via letter that the conditions set forth in Ordering Paragraph 4 of
Decision 09-11-007 had been met and that SCE could commence construction of
DCR.4
Pursuant to a settlement in Docket No. ER10-160, SCE agreed to exclude
from its CWIP balancing account mechanism the CWIP associated with Arizona
segment of DPV2, effective June 1, 2010.5
On October 28, 2011, SCE filed a request under section 205 of the Federal
Power Act (“FPA”) to recover in SCE’s Transmission Owner Tariff (“TO Tariff”)
formula rate the prudently-incurred abandoned plant costs associated with the
Arizona segment of the Devers-Palo Verde II transmission project.6
3 See Docket No. ER11-1952, Exhibit SCE-5: CAISO letter dated August 5, 2010 from
Keith E. Casey to Paul Clanon (CPUC), Re: Updated Information Regarding
Construction of Devers-Palo Verde No.2 Transmission Project (A.05-04-015). 4 See Docket No. ER11-1952, Exhibit SCE-6: CPUC letter dated August 9, 2010 from
Paul Clanon to James A. Kelly (SCE). 5 If, no later than September 30, 2011, SCE files either a new application for the Arizona
segment of DPV2 with the ACC, or files with the ACC an application to amend its prior
DPV2 order, and the ACC, no later than December 31, 2012, approves a Certificate of
Environmental Compatibility for the Arizona segment of DPV2, then SCE may include
in its CWIP rates all expenditures incurred by SCE on and after June 1, 2010, in
connection with the Arizona segment of DPV2. If SCE makes such filing and the ACC
fails to approve a Certificate of Environmental Compatibility for the Arizona segment of
DPV2 by December 31, 2012, then SCE shall submit a Section 205 filing for recovery of
its prudently-incurred costs associated with abandonment of the Arizona segment of
DPV2 by January 31, 2013 or lose the right to recover 100% abandoned plant granted
under Docket No. EL07-62. See Docket No. ER10-2053, SCE Offer of Settlement, filed
July 29, 2010. The Commission approved this Offer of Settlement in an order issued
Sept. 10, 2010. Southern California Edison Co., 132 FERC ¶ 61,213 (2010). 6 See Docket No. ER12-239.
Statement BM
Construction Program Statement
5
On July 2, 2012, SCE filed an offer of settlement with the Commission and
the settlement was subsequently approved by the FERC on August 30, 2012.7
Tehachapi
The CAISO studied the Tehachapi Transmission Project as part of its
CAISO South Regional Transmission Plan for 2006 (“CSRTP-2006”) and
developed a least-cost solution for the network component of the transmission
infrastructure that will interconnect planned transmission projects in the Tehachapi
Wind Resource Area (“TWRA”) to the CAISO Controlled Grid.
The CAISO found that in addition to interconnecting several projects in the
interconnection queue, the Tehachapi Project will provide system reliability and
efficiency benefits. On January 24, 2007, the CAISO Board of Governors
approved the entire Tehachapi Transmission Project and directed SCE, as the
project sponsor, to proceed with the permitting and construction of the project.8
The CAISO found, among other things, that the Tehachapi Project would lay the
groundwork to integrate large amounts of planned geothermal, solar, and wind
generation and would make possible in the future a low cost expansion of the
transfer capability of Path 26, a major north-south transmission corridor.
The CPUC issued its final approval of the CPCN for Tehachapi Segment 1
on March 1, 2007;9 the CPCN for Tehachapi Segments 2 and 3 on
March 15, 2007;10 and the CPCN for Tehachapi Segments 4-11 on
December 17, 2009.11 The CPUC found the proposed Project will: 1) support
compliance with the State’s RPS goals; 2) enable interconnection of wind
generation projects in the Tehachapi region to SCE’s transmission system; 3)
eliminate existing constraints to the transmission of renewable energy from the
Tehachapi region to southern California; and 4) eliminate potential system-wide
power flow and reliability problems due to overloading of the existing
transmission system.
In its evaluation of Tehachapi Segments 1-3, the CPUC also studied energy
efficiency and demand response alternatives. The CPUC concluded that, even
with an increasing emphasis on energy efficiency and demand response,
7 Southern California Edison Co., 140 FERC ¶ 61,157 (2012). 8 See CAISO Board of Governors Approval, SCE Application in Docket No. EL07-62,
filed May 18, 2007, at Exhibit I. 9 See CPUC Decision 07-03-012, March 1, 2007. 10 See CPUC Decision 07-03-045, March 15, 2007. 11 See CPUC Decision 09-12-044, December 17, 2009.
Statement BM
Construction Program Statement
6
investments in transmission projects such as the proposed Antelope-Pardee
Transmission Project (Segment 1) and the proposed Tehachapi-Vincent
Transmission Project (Segments 2 and 3) will be needed both to enable California
to meet RPS goals as well as to assure the continuing reliability and safety of the
transmission grid in southern California as renewable power generation and SCE
customer demands increase. They further concluded that there is no alternative
that can meet these needs better than the proposed Segments 1-3.12 Segments 1-
3A entered into service in 2009 and SCE is no longer collecting CWIP on these
segments of the Tehachapi Project.
In addition, the CPUC concurred that Segments 4-11 would: (a) provide the
electrical facilities necessary to reliably interconnect and integrate in excess of 700
megawatts (“MW”) and up to approximately 4,500 MW of new wind generation
in the TWRA currently being planned or expected in the future, thereby helping
SCE and other California utilities in meeting California RPS goals; (b) further
address the reliability needs of the CAISO-controlled grid due to projected load
growth in the Antelope Valley; and (c) address the South of Lugo transmission
constraints, an ongoing source of concern for the Los Angeles Basin.13
Red Bluff On October 7, 2010, the FERC conditionally accepted the “Standard Large
Generator Interconnection Agreement (LGIA) Among Desert Sunlight Holdings,
LLC and Southern California Edison Company and California Independent
System Operator Corporation”14 for interconnection of a 550 MW solar generating
facility SCE’s electrical system via a new substation, which was later named Red
Bluff substation. On February 17, 2011, the FERC conditionally accepted the
“Standard Large Generator Interconnection Agreement (LGIA) Among Palen
Solar II, LLC and Southern California Edison Company and California
Independent System Operator Corporation”15 for interconnection of a 500 MW
solar thermal generating facility to SCE’s planned Red Bluff substation.
12 See CPUC Segment 1 Approval, at p. 22, and CPUC Segments 2-3 Approval, at pp.
20-21. 13 See CPUC Decision 09-12-044, Finding of Fact #18, page 93. 14 Southern California Edison Co., 133 FERC ¶ 61,019 (2010). The LGIA was
conditionally accepted subject to the Commission decision regarding SCE’s requested
abandoned plant approval incentive in Docket No. EL10-81-000, which was approved on
October 29, 2010. Southern California Edison Co., 133 FERC ¶ 61,107 (2010). 15 Southern California Edison Co., 134 FERC ¶ 61,108 (2011). The LGIA was
conditionally accepted subject to the subject to the Commission decision regarding SCE’s
requested abandoned plant approval incentive in Docket No. EL11-10-000, which was
Statement BM
Construction Program Statement
7
SCE has proposed construction of Red Bluff in order to remedy the
reliability and congestion problems that would result from the development and
interconnection of an initial 1,050 MW of solar generation. Red Bluff will be
located near Desert Center in Riverside County of California. Two of the three
proposed generation projects seeking interconnection with Red Bluff are solar and
one is pumped hydro. The initial facilities at Red Bluff will accommodate two
solar projects consisting of 1,050 MW of generation and may be expanded later as
additional resources develop.
With the introduction of the proposed development of renewable generation
in the area, SCE’s existing transmission facilities are inadequate to ensure
reliability of the grid. Interconnection studies have been performed for the new
generation projects requesting interconnection to the CAISO-controlled grid. To
address system impacts, a recommendation was made that involved development
of a plan of service to reliably interconnect the project in a manner that: addresses
the generation needs in the area; avoids short-lived “piece-meal” solutions;
minimizes environmental impacts; minimizes overall cost exposure to ratepayers;
minimizes service interruptions to local area load; and provides the minimum set
of facilities. This plan of service called for the construction of a new collector
substation (Red Bluff Substation) that would be connected to the CAISO-
controlled grid by looping the existing Devers-Palo Verde 500 kV Transmission
Line. The System Impact Study concluded that the Red Bluff 500/220 kV
Substation and proposed method of service into the existing Devers-Palo Verde
500 kV Transmission Line would fully mitigate the identified system reliability
problems.
On November 17, 2010, SCE filed an application for a permit to construct
(“PTC”) the Red Bluff Substation project and in the following July, the CPUC
granted SCE a permit to construct the Red Bluff Substation project.16
Calcite On January 28, 2011, the FERC conditionally accepted the “Standard Large
Generator Interconnection Agreement (LGIA) Among Abengoa Solar Inc. and
Southern California Edison Company and California Independent System
approved on March 11, 2011. Southern California Edison Co., 134 FERC ¶ 61,181
(2011). 16 See CPUC Decision 11-07-020, July 14, 2011.
Statement BM
Construction Program Statement
8
Operator Corporation”17 for interconnection of a 250 MW solar thermal generating
facility to SCE’s existing Cool Water-Kramer No.1 220 kV line at a new SCE-
owned 220 kV substation. On January 20, 2011, the FERC conditionally accepted
the “Standard Large Generator Interconnection Agreement (LGIA) Among
Granite Wind, LLC. and Southern California Edison Company and California
Independent System Operator Corporation”18 for interconnection of a 60 MW
wind generating facility to SCE’s transmission system at the proposed Jasper 220
kV Substation. SCE proposed construction of South of Kramer in order to remedy the
reliability and congestion problems that would result from the development and
interconnection of at least 591 MW of renewable solar and wind generation. The
proposed facilities will be located in the Mojave Desert region of southern
California. Five projects had entered the CAISO interconnection process seeking
interconnection, which triggered the need for the South of Kramer transmission
facilities.
South of Kramer will also provide incremental transfer capability for other
generation projects in the greater Mojave Desert region located near the Cool
Water-Lugo and Lugo-Pisgah corridors. The South of Kramer project is
complementary to SCE’s Lugo-Pisgah project in a way that it provides additional
transfer capability and collector substations to allow interconnection of currently
proposed and future potential generation situated in the Barstow and Lucerne
Competitive Renewable Energy Zones, as identified in reports prepared by the
Renewable Energy Transmission Initiative (“RETI”).19 The Cool Water-Lugo
transmission corridor has been identified by RETI and by the California
17 Southern California Edison Co., 134 FERC ¶ 61,059 (2011). The LGIA was
conditionally accepted subject to the subject to the Commission decision regarding SCE’s
requested abandoned plant approval incentive in Docket No. EL11-10-000, which was
approved on March 11, 2011. Southern California Edison Co., 134 FERC ¶ 61,181
(2011). 18 Southern California Edison Co., 134 FERC ¶ 61,032 (2011). The LGIA was
conditionally accepted subject to the subject to the Commission decision regarding SCE’s
requested abandoned plant approval incentive in Docket No. EL11-10-000, which was
approved on March 11, 2011. Southern California Edison Co., 134 FERC ¶ 61,181
(2011). 19 RETI is a statewide initiative intended to help identify the transmission projects needed
to accommodate California’s renewable energy goals. Background information about the
purpose and formation of RETI, its mission statement, membership information, and all
RETI documents are available at www.energy.ca.gov/reti.
Statement BM
Construction Program Statement
9
Transmission Planning Group20 as an important path for the transfer of location
constrained renewable generation resources in the sparsely populated Mojave
Desert to population centers in southern California.
Through the CAISO’s Interconnection System Impact Studies, SCE’s
existing transmission facilities were found to be inadequate to handle the proposed
development of renewable generation in the area. In response to these studies,
SCE proposed South of Kramer, which is needed to ensure reliability and full
delivery of the renewable generation in the area as it is integrated into the grid.
Due to timing circumstances for the various elements of the South of
Kramer Project, SCE modified the project during preparation of the CPCN
application with the CPUC. The project was renamed the Coolwater-Lugo
Transmission Project (“CWLTP”) and a new substation, called Desert View, was
added to the CPCN application to address load growth in the Victorville area
along the path from Coolwater to Lugo Substation. Additionally, SCE did not
include the Jasper Substation as part of the CPCN application because withdrawals
from the CAISO’s generator interconnection queue had eliminated the immediate
need for SCE to move forward to license and develop that substation concurrently
with CWLTP. However, the remaining elements of the CWLTP were the same as
the originally proposed South of Kramer Project. SCE and generator signed LGIA
in February 2016. The Jasper Substation was renamed the Calcite Substation and
project development and licensing coordination are in progress.
On August 28, 2013, SCE filed with the CPUC a CPCN application and
Proponent’s Environmental Assessment for the CWLTP. While the CPCN
Application was pending before the CPUC, the CPUC and the CAISO received a
letter stating that the Coolwater Generating Station would be shut down effective
January 1, 2015. On March 17, 2015, the CAISO concluded that sufficient
capacity was available in the area such that the CWTLP was no longer needed.
On May 21, 2015, the CPUC dismissed SCE’s CPCN application without
prejudice.21 Subsequently, on February 26, 2016, SCE filed a request under
section 205 of the FPA to recover in its TO Tariff formula rate the prudently-
incurred abandoned plant costs associated with the CWTLP.22
On January 10, 2017, SCE submitted an uncontested offer of settlement in
the abandoned plant cost recovery proceeding between SCE and the intervening
20 CTPG is a forum for conducting joint transmission planning and coordination in
transmission activities in California. Background information on CTPG and all CTPG
documents are available at ctpg.us/public/index.php. 21 See CPUC Decision 15-05-040, May 21, 2015. 22 See Docket No. ER16-1025.
Statement BM
Construction Program Statement
10
parties. Subsequently, on February 28, 2017, the settlement judge certified the
settlement to the FERC as uncontested23 and the uncontested settlement was
approved by the Commission on April 10, 2017.24
West of Devers On February 4, 2011, the FERC conditionally accepted the “Standard Large
Generator Interconnection Agreement (LGIA) Among Palo Verde Solar II, LLC
and Southern California Edison Company and California Independent System
Operator Corporation”25 for interconnection of a 1,000 MW solar thermal
generating facility to SCE’s transmission system at the proposed Colorado River
220 kV Substation. In order to fully deliver this generating facility’s output,
additional network upgrades to SCE’s transmission system are needed in Eastern
Riverside County.
West of Devers will allow the delivery of at least 2200 MW of renewable
solar generation. The proposed facilities will be located in Eastern Riverside
County, California. Five projects have entered the CAISO interconnection process
seeking interconnection that trigger the need for West of Devers. Solar generation
projects account for all of the 2,200 MW of proposed generation triggering the
need for West of Devers. CAISO Phase II Studies have been performed for five
new generation projects that will utilize West of Devers via the CAISO’s cluster
interconnection process. Additionally, the CAISO performed deliverability
studies as part of Phase II, and determined that without West of Devers, the
generation projects in queue utilizing West of Devers would not be fully
deliverable.
The interconnection studies identified West of Devers as needed to enable
fully deliverable renewable generation. West of Devers does not directly
interconnect any new sources of generation; however, the upgrades are needed to
allow full delivery of multiple generation projects interconnecting at SCE’s new
Colorado River and Red Bluff Substations.
23 Southern California Edison Co., 158 FERC ¶ 63,006 (2017). 24 S. Cal. Edison Co., 159 FERC ¶ 62,038 (2017). 25 S. Cal. Edison Co., 134 FERC ¶ 61,087 (2011). The LGIA was conditionally accepted
subject to the subject to the Commission decision regarding SCE’s requested abandoned
plant approval incentive in Docket No. EL11-10-000, which was approved on March 11,
2011. Southern California Edison Co., 134 FERC ¶ 61,181 (2011).
Statement BM
Construction Program Statement
11
On October 25, 2013, SCE filed a CPCN application with the CPUC. The
proposed project has been reviewed under both the California Environmental
Quality Act (“CEQA”) and the National Environmental Policy Act (“NEPA”).
On August 18, 2016, the CPUC approved the project in Decision D.16-08-
017, including two alternatives.26 Subsequently, the Bureau of Land Management
(“BLM”) approved the project with its Record of Decision (“ROD”) on December
27, 2016.27 The ROD includes a right-of-way grant decision and it applies only to
BLM-administered lands.
Whirlwind Substation Expansion On February 17, 2011, the FERC conditionally accepted the “Standard
Large Generator Interconnection Agreement (LGIA) Among AV Solar Ranch I,
LLC and Southern California Edison Company and California Independent
System Operator Corporation”28 to interconnect a 250 MW solar photovoltaic
generating facility to SCE’s transmission system at the proposed Whirlwind
Substation.
The expansion at Whirlwind provides capacity for an additional 2,000
megawatts (MW) of new generation resources. Whirlwind was originally planned
as part of the Tehachapi project and was originally designed for eventual
expansion. At the time of SCE’s petition in Docket No. EL07-62-000, however,
the generators requesting interconnection at Whirlwind required a smaller subset
of facilities to be constructed.
As of the end of 2010, additional generation resources have requested
interconnection at Whirlwind, including four renewable generation projects, with a
total capacity of 1,550 MW in the transition cluster, and an additional eight wind
and solar generation projects, with a total capacity of 2,451 MW. The transition
cluster is comprised of interconnection requests that were submitted on or before
June 2, 2008, which are studied under a slightly modified version of the generation
interconnection process reform. These additional resources have triggered the
26 See CPUC Decision 16-08-017, August 18, 2016. 27 See BLM Decision DOI-BLM-CA-060-0015-0021, CACA-055285 28 Southern California Edison Co., 134 FERC ¶ 61,107 (2011). The LGIA was
conditionally accepted subject to the subject to the Commission decision regarding SCE’s
requested abandoned plant approval incentive in Docket No. EL11-10-000, which was
approved on March 11, 2011. Southern California Edison Co., 134 FERC ¶ 61,181
(2011).
Statement BM
Construction Program Statement
12
need for an expansion of Whirlwind. The Whirlwind expansion has already been
approved by the CAISO and the CPUC as part of the Tehachapi project.
Colorado River Substation Expansion
As indicated above, the FERC conditionally accepted on February 4, 2011,
the “Standard Large Generator Interconnection Agreement (LGIA) Among Palo
Verde Solar II, LLC and Southern California Edison Company and California
Independent System Operator Corporation” for interconnection of a 1,000 MW
solar thermal generating facility to SCE’s transmission system at the proposed
Colorado River 220 kV Substation.
Colorado River expansion will provide capacity for up to 2,000 MW of
new generation resources at Colorado River. The expansion will include both
reliability network upgrades and delivery network upgrades. Colorado River was
originally proposed to be configured as a 500 kV switchyard as a component of
DPV2 and designed to be expanded as additional resources requested
interconnection to the substation. Additional renewable generation projects have
requested interconnection to the Colorado River 500 kV switchyard, including
solar generation projects in the CAISO’s transition cluster and additional
interconnection requests for solar generation in subsequent queue clusters.
Consequently, Colorado River needs to be expanded to accommodate such
requests. The CPUC has previously approved Colorado River, however, the
proposed expansion will require enlargement of the previously-approved project’s
footprint.
On November 3, 2010, SCE sought a PTC from the CPUC to construct an
expansion to the Colorado River Substation in order to interconnect the 1,000 MW
Blythe Solar Power Project and the 250 MW Genesis Solar Energy Project to the
CAISO-controlled transmission grid. No protests were filed.
On July 14, 2011, the CPUC granted SCE a permit to construct the
Colorado River Substation expansion project with the mitigation measures
attached to this order.29
29 See CPUC Decision 11-07-011, July 14, 2011.
ATTESTATION BY
CONSTANCE J. ERICKSON
VICE PRESIDENT
REVISED CLEAN VERSION OF
SCE’S TO TARIFF SHEETS
REFLECTING THE PROPOSED
FORMULA RATE
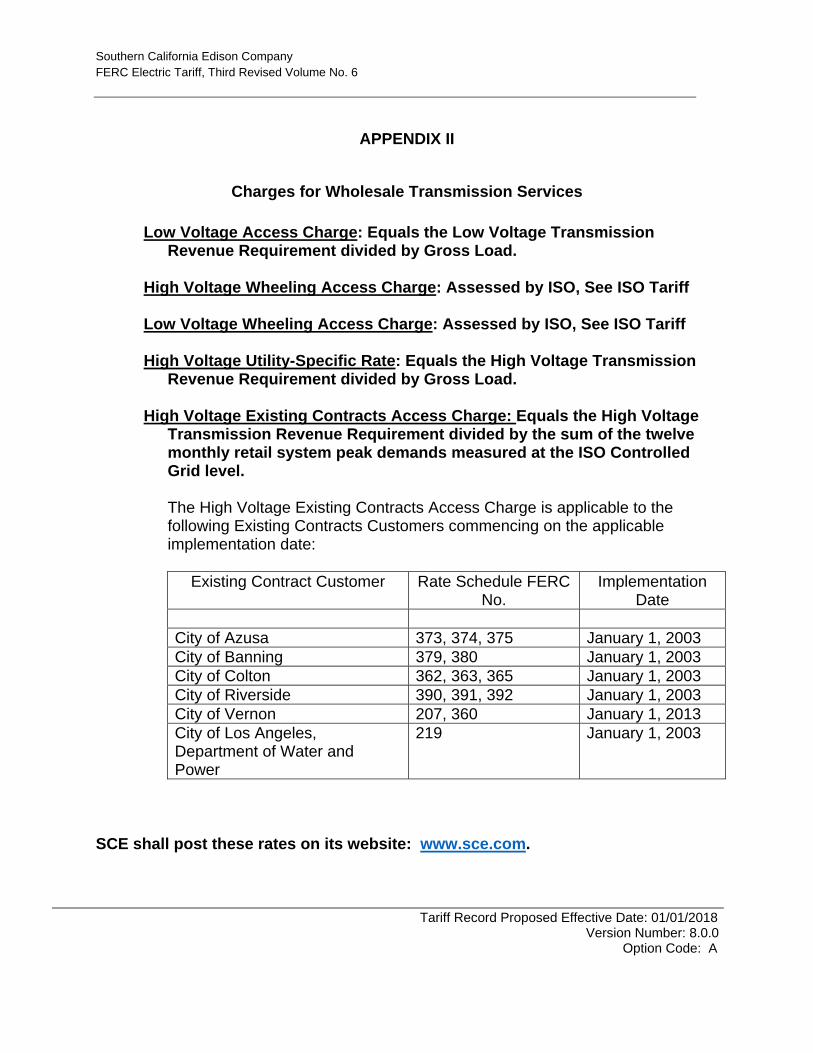
Southern California Edison Company
FERC Electric Tariff, Third Revised Volume No. 6
APPENDIX II
Charges for Wholesale Transmission Services
Low Voltage Access Charge: Equals the Low Voltage Transmission Revenue Requirement divided by Gross Load.
High Voltage Wheeling Access Charge: Assessed by ISO, See ISO Tariff Low Voltage Wheeling Access Charge: Assessed by ISO, See ISO Tariff High Voltage Utility-Specific Rate: Equals the High Voltage Transmission
Revenue Requirement divided by Gross Load. High Voltage Existing Contracts Access Charge: Equals the High Voltage
Transmission Revenue Requirement divided by the sum of the twelve monthly retail system peak demands measured at the ISO Controlled Grid level.
The High Voltage Existing Contracts Access Charge is applicable to the following Existing Contracts Customers commencing on the applicable implementation date:
Existing Contract Customer Rate Schedule FERC No.
Implementation Date
City of Azusa 373, 374, 375 January 1, 2003
City of Banning 379, 380 January 1, 2003
City of Colton 362, 363, 365 January 1, 2003
City of Riverside 390, 391, 392 January 1, 2003
City of Vernon 207, 360 January 1, 2013
City of Los Angeles, Department of Water and Power
219 January 1, 2003
SCE shall post these rates on its website: www.sce.com.
Tariff Record Proposed Effective Date: 01/01/2018 Version Number: 8.0.0
Option Code: A
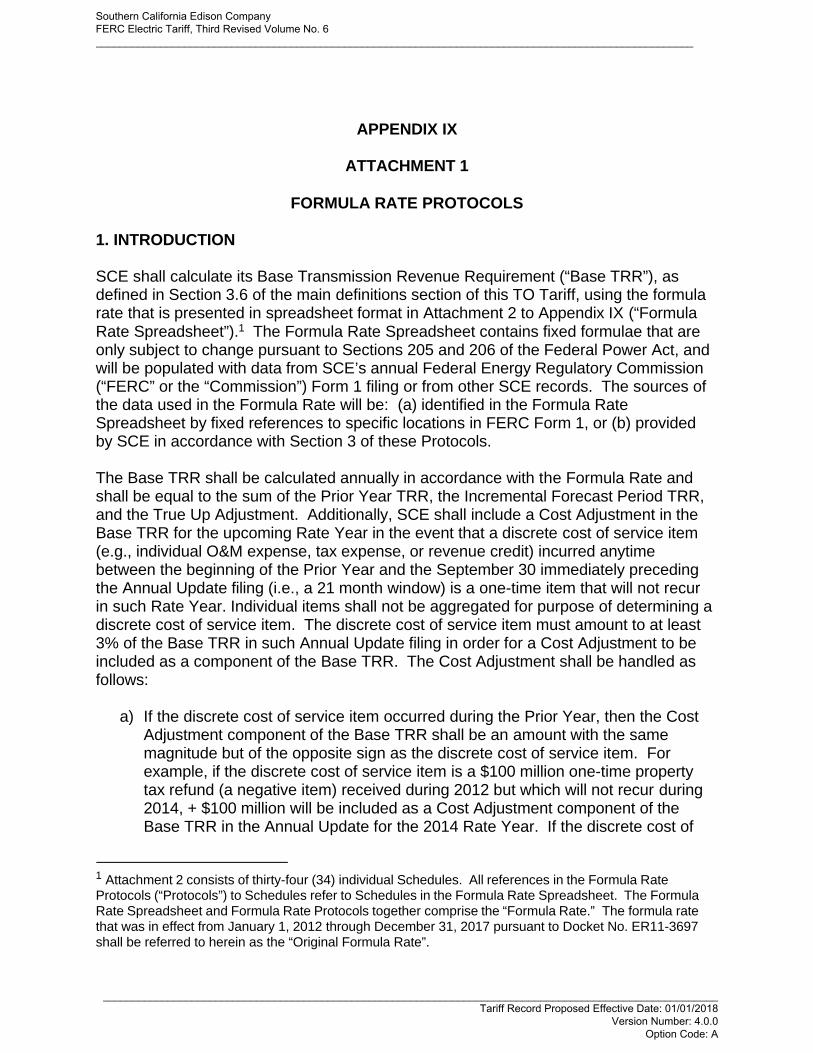
APPENDIX IX
ATTACHMENT 1
FORMULA RATE PROTOCOLS
1. INTRODUCTION SCE shall calculate its Base Transmission Revenue Requirement (“Base TRR”), as defined in Section 3.6 of the main definitions section of this TO Tariff, using the formula rate that is presented in spreadsheet format in Attachment 2 to Appendix IX (“Formula Rate Spreadsheet”).1 The Formula Rate Spreadsheet contains fixed formulae that are only subject to change pursuant to Sections 205 and 206 of the Federal Power Act, and will be populated with data from SCE’s annual Federal Energy Regulatory Commission (“FERC” or the “Commission”) Form 1 filing or from other SCE records. The sources of the data used in the Formula Rate will be: (a) identified in the Formula Rate Spreadsheet by fixed references to specific locations in FERC Form 1, or (b) provided by SCE in accordance with Section 3 of these Protocols.
The Base TRR shall be calculated annually in accordance with the Formula Rate and shall be equal to the sum of the Prior Year TRR, the Incremental Forecast Period TRR, and the True Up Adjustment. Additionally, SCE shall include a Cost Adjustment in the Base TRR for the upcoming Rate Year in the event that a discrete cost of service item (e.g., individual O&M expense, tax expense, or revenue credit) incurred anytime between the beginning of the Prior Year and the September 30 immediately preceding the Annual Update filing (i.e., a 21 month window) is a one-time item that will not recur in such Rate Year. Individual items shall not be aggregated for purpose of determining a discrete cost of service item. The discrete cost of service item must amount to at least 3% of the Base TRR in such Annual Update filing in order for a Cost Adjustment to be included as a component of the Base TRR. The Cost Adjustment shall be handled as follows:
a) If the discrete cost of service item occurred during the Prior Year, then the Cost
Adjustment component of the Base TRR shall be an amount with the same magnitude but of the opposite sign as the discrete cost of service item. For example, if the discrete cost of service item is a $100 million one-time property tax refund (a negative item) received during 2012 but which will not recur during 2014, + $100 million will be included as a Cost Adjustment component of the Base TRR in the Annual Update for the 2014 Rate Year. If the discrete cost of
1 Attachment 2 consists of thirty-four (34) individual Schedules. All references in the Formula Rate Protocols (“Protocols”) to Schedules refer to Schedules in the Formula Rate Spreadsheet. The Formula Rate Spreadsheet and Formula Rate Protocols together comprise the “Formula Rate.” The formula rate that was in effect from January 1, 2012 through December 31, 2017 pursuant to Docket No. ER11-3697 shall be referred to herein as the “Original Formula Rate”.
Southern California Edison Company FERC Electric Tariff, Third Revised Volume No. 6 _____________________________________________________________________________________________________
________________________________________________________________________________________________________ Tariff Record Proposed Effective Date: 01/01/2018
Version Number: 4.0.0 Option Code: A
service item is a $100 million one-time O&M cost (a positive item) incurred during 2012 that will not recur in 2014, - $100 million will be included as a Cost Adjustment component of the Base TRR in the Annual Update for the 2014 Rate Year. Both examples assume the 3% threshold is met.
b) If the discrete cost of service item occurred between January 1 and September
30 of the year in which the Annual Update filing is submitted to FERC (i.e., the year before the upcoming Rate Year), then the Cost Adjustment component of the Base TRR shall be an amount with the same magnitude and the same sign as the discrete cost of service item. For example, if the discrete cost of service item is a $100 million one-time property tax refund (a negative item) received during the first nine months of 2013 but which will not recur during 2014, - $100 million will be included as a Cost Adjustment component of the Base TRR in the Annual Update for the 2014 Rate Year. If the discrete cost of service item is a $100 million one-time O&M cost (a positive item) incurred during the first nine months of 2013 that will not recur in 2014, + $100 million will be included as a Cost Adjustment component of the Base TRR in the Annual Update for the 2014 Rate Year. Both examples assume the 3% threshold is met.
If SCE includes a Cost Adjustment in its Base TRR, SCE shall include with its Annual Update an explanation of its belief that the discrete cost of service item that is the subject of such Cost Adjustment will not recur in the upcoming Rate Year.
The Wholesale Base TRR is equal to the Base TRR adjusted as follows (as set forth in Schedule 25): (1) Uncollectibles Expense is not included in the Wholesale Base TRR; (2) the Wholesale Rate Base Adjustment and associated Wholesale Expense Difference is included in the Wholesale TRR; (3) EEI dues and EPRI dues are excluded from the Wholesale Base TRR; and (4) Franchise Fees Expense included in the Wholesale Base TRR is lower than that included in the Base TRR due to the Franchise Fee Factor being applied to a lower Base TRR.
2. TERM OF THE FORMULA RATE
The Formula Rate shall become effective on January 1, 2018, and SCE’s Base TRR shall be subject to true up beginning on that date in accordance with these Protocols. Retail and Wholesale transmission rates shall become effective on January 1, 2018, and shall be redetermined annually in accordance with these Protocols and the Formula Rate Spreadsheet. The Formula Rate will remain in effect without termination unless and until SCE files pursuant to Section 205 of the Federal Power Act to replace the Formula Rate with a successor transmission rate mechanism and the Commission accepts such successor transmission rate mechanism. This Formula Rate shall remain in effect until the date that the successor rate mechanism filing is made effective by the Commission.
Southern California Edison Company FERC Electric Tariff, Third Revised Volume No. 6 _____________________________________________________________________________________________________
________________________________________________________________________________________________________ Tariff Record Proposed Effective Date: 01/01/2018
Version Number: 4.0.0 Option Code: A
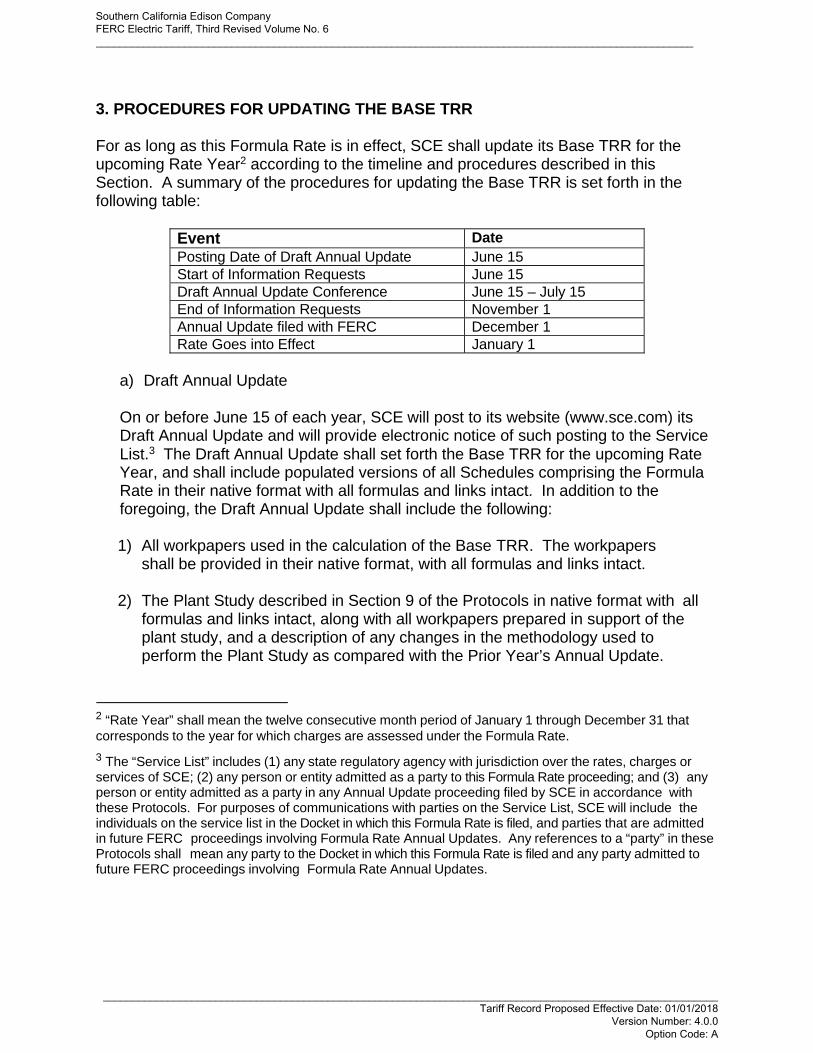
3. PROCEDURES FOR UPDATING THE BASE TRR For as long as this Formula Rate is in effect, SCE shall update its Base TRR for the upcoming Rate Year2 according to the timeline and procedures described in this Section. A summary of the procedures for updating the Base TRR is set forth in the following table:
Event Date
Posting Date of Draft Annual Update June 15
Start of Information Requests June 15
Draft Annual Update Conference June 15 – July 15
End of Information Requests November 1
Annual Update filed with FERC December 1
Rate Goes into Effect January 1
a) Draft Annual Update
On or before June 15 of each year, SCE will post to its website (www.sce.com) its Draft Annual Update and will provide electronic notice of such posting to the Service List.3 The Draft Annual Update shall set forth the Base TRR for the upcoming Rate Year, and shall include populated versions of all Schedules comprising the Formula Rate in their native format with all formulas and links intact. In addition to the foregoing, the Draft Annual Update shall include the following:
1) All workpapers used in the calculation of the Base TRR. The workpapers
shall be provided in their native format, with all formulas and links intact.
2) The Plant Study described in Section 9 of the Protocols in native format with all formulas and links intact, along with all workpapers prepared in support of the plant study, and a description of any changes in the methodology used to perform the Plant Study as compared with the Prior Year’s Annual Update.
2 “Rate Year” shall mean the twelve consecutive month period of January 1 through December 31 that
corresponds to the year for which charges are assessed under the Formula Rate.
3 The “Service List” includes (1) any state regulatory agency with jurisdiction over the rates, charges or services of SCE; (2) any person or entity admitted as a party to this Formula Rate proceeding; and (3) any person or entity admitted as a party in any Annual Update proceeding filed by SCE in accordance with these Protocols. For purposes of communications with parties on the Service List, SCE will include the individuals on the service list in the Docket in which this Formula Rate is filed, and parties that are admitted in future FERC proceedings involving Formula Rate Annual Updates. Any references to a “party” in these Protocols shall mean any party to the Docket in which this Formula Rate is filed and any party admitted to future FERC proceedings involving Formula Rate Annual Updates.
Southern California Edison Company FERC Electric Tariff, Third Revised Volume No. 6 _____________________________________________________________________________________________________
________________________________________________________________________________________________________ Tariff Record Proposed Effective Date: 01/01/2018
Version Number: 4.0.0 Option Code: A
3) Workpapers supporting the inputs that appear in Schedule 27 in equivalent form
to the workpapers provided in FERC Docket No. ER11-3697, Volume 4, Workpapers for Exhibit SCE-600, pages 1-268.
4) Workpapers that demonstrate the historical corporate overhead expenses
recorded for ISO projects by Project Identification Number (PIN) that closed in the prior year and have accumulated ISO project costs greater than $5 million.
5) Workpapers that demonstrate the derivation of the AFUDC rates applicable to all
projects in the prior year.
6) Workpapers supporting the forecasted gross plant expenditures shown on Schedule 16.
7) A statement that identifies each ISO project (PIN) with total direct expenditures
(recorded and forecast) greater than $5 million projected to go into rate base during the forecast period. The statement will also include the monthly budgeted direct expenditures, to the extent such currently projected costs are shown on the most recent applicable SCE budget documents, and the total project cost of each project.
8) Workpapers showing the beginning of year and end of year outstanding network
upgrade credits, as well as interest on network upgrade credits that is recorded in Account 252 listed by entity due those credits. The workpapers shall be provided in equivalent form to the workpapers entitled “Workpapers for Exhibit SCE-800” provided by SCE in FERC Docket No. ER11-3697.
9) Workpapers showing forecast period incentive Construction Work in Progress
(“CWIP”) projects by PIN and by month that support the values in Schedule 10 at lines 29-70 in equivalent form to the workpapers provided in FERC Docket No. ER11-3697, Volume 3, Workpapers for Exhibit SCE-500, pages 149-175.
10) A description of any Material Accounting Changes contained in the Draft
Annual Update.4
4 “Material Accounting Changes” shall mean any material change in SCE’s (i) accounting policies and practices from those in effect for the Prior Year upon which the immediately preceding Annual Update was based, or (ii) internal corporate cost allocation policies or practices from those policies and/or practices in effect for the Prior Year upon which the immediately preceding Annual Update was based.
Southern California Edison Company FERC Electric Tariff, Third Revised Volume No. 6 _____________________________________________________________________________________________________
________________________________________________________________________________________________________ Tariff Record Proposed Effective Date: 01/01/2018
Version Number: 4.0.0 Option Code: A
11) A workpaper describing the nature and amount of each project/activity, the costs of which are booked to Account 930.2 and which are recovered under the Formula Rate. The workpaper shall include, for each account 930.2 line item cost shown in FERC Form 1, the following information: 1) Total FERC Form 1 cost; 2) Amount Included; 3) Amount Excluded; and 4) Formula rate reference to the reason for the exclusion(s).
12) A workpaper identifying each discrete A&G cost item that has been
excluded from Schedule 20 of the Formula Rate (including both “positive exclusions” and “negative exclusions”), together with a summation of such items by account.
13) A description of any facilities SCE projects will change classification
between CPUC and CAISO jurisdictions through the Rate Year. This description should include an estimated date for when the project will change classification, the reason for the classification change, and the proposed future rate recovery (i.e., whether through FERC or CPUC rates).
b) Draft Annual Update Conference
SCE will provide notice to parties on the Service List of a one-day meeting, to take place on or before July 15 of each year, to discuss the Draft Annual Update. By mutual agreement of SCE and the parties on the Service List, such a meeting may take place in-person, via telephone, or video-conference. SCE shall make appropriate personnel available for such meeting. Additional meetings to discuss the Draft Annual Update shall be scheduled as SCE and the parties on the Service List may mutually agree.
c) Information Requests
1) At any time from June 15 until November 1, parties on the Service List may
submit reasonable information requests to SCE regarding the Draft Annual Update.
2) SCE shall make a good faith effort to respond to information requests in
writing within ten (10) business days of receipt. Alternatively, if SCE in good faith believes that the information request is unreasonable, SCE may object to the request. SCE shall contemporaneously provide copies of all responses to all parties on the Service List that have indicated to SCE that they wish to receive such copies. If SCE objects to an information request, then SCE shall make a good faith effort to provide its objections within ten (10) business days of receipt of the information requests to the party serving the request. SCE shall include in its objection the basis for the objection. SCE and the party serving the information request on SCE will work cooperatively and in good
Southern California Edison Company FERC Electric Tariff, Third Revised Volume No. 6 _____________________________________________________________________________________________________
________________________________________________________________________________________________________ Tariff Record Proposed Effective Date: 01/01/2018
Version Number: 4.0.0 Option Code: A
faith to resolve any questions, objections, or disputes relating to the information requests.
3) Responses to information requests shall not be designated as settlement
communications or produced under the Commission’s rules and regulations governing settlements, unless provided as a privileged settlement communication in a Commission proceeding being conducted under the Commission’s settlement rules. SCE may mark materials provided in response to an information request as Protected Materials in accordance with Exhibit A to the Protocols. To the extent an information request response calls for the production of Protected Materials, SCE will only provide such materials to the parties with whom it has entered into a non-disclosure agreement that is included in Exhibit A.
4) To the extent SCE and any interested party(ies) are unable to resolve
disputes related to information requests submitted in accordance with these Protocols, SCE or any interested party may petition the FERC to appoint an Administrative Law Judge as a discovery master. Neither SCE nor any interested party shall object to a request for a Discovery Master. The discovery master shall have the power to issue orders to resolve discovery disputes, as appropriate, in accordance with these Protocols and consistent with the FERC’s discovery rules. The discovery master’s orders shall be subject to appeal to the Commission and to the courts to the same extent and under the same rules as would be applicable to an Initial Decision issued under Rule 708 of the Commission’s Rules of Practice and Procedure. In the event the Commission establishes hearing procedures for an Annual Update, the discovery master’s responsibilities shall be transferred to the Presiding Judge for such hearing effective upon his or her appointment.
d) Annual Update
1) On or before December 1 of each year, SCE shall file with the Commission its
Annual Update setting forth the Base TRR and associated rates for the upcoming Rate Year. It is expressly intended by these Protocols that the Commission will issue public notice of the Annual Update inviting public comment, and SCE shall request in its Annual Update filing that the Commission issue public notice of the Annual Update inviting public comment.
2) SCE shall identify in the Annual Update any corrections or other changes to
the Draft Annual Update, and shall provide an explanation of the reason for the changes. SCE shall also include in the Annual Update any changes to the Draft Annual Update that it and any other party have agreed upon as of November 15.
Southern California Edison Company FERC Electric Tariff, Third Revised Volume No. 6 _____________________________________________________________________________________________________
________________________________________________________________________________________________________ Tariff Record Proposed Effective Date: 01/01/2018
Version Number: 4.0.0 Option Code: A
3) The Annual Update shall not modify the Formula Rate or subject the Formula Rate to modification, and shall not constitute a rate change filing under Section 205 of the Federal Power Act. Any party may challenge the justness and reasonableness of SCE’s implementation of its Formula Rate with respect to: (a) whether SCE has properly and reasonably applied the Formula Rate Spreadsheet and the procedures in these Protocols; (b) whether the costs to be recovered have been accurately stated, properly recorded and accounted for pursuant to applicable FERC accounting practices and procedures; (c) whether the costs to be recovered through the Base TRR and associated rates have been or will be prudently incurred; (d) whether SCE’s projections have been reasonably made; (e) whether its calculation methodologies are consistent with the Formula Rate; (f) whether SCE has made the required filings under Section 8(a) of these Protocols to reflect any intervening change(s) to the Uniform System of Accounts or FERC Form 1; and (g) whether any Material Accounting Changes are reasonable and consistent with the Uniform System of Accounts.
4) The Base TRR set forth in the Annual Update and associated rates shall be
effective on January 1 of the upcoming Rate Year. 5) Any party may comment on or protest the Annual Update. Any party may
request that FERC establish hearing and/or settlement procedures regarding an Annual Update, and all parties reserve their rights to oppose such requests on their merits, but may not object to such requests on the basis that hearing and/or settlement procedures are prohibited by these Protocols or the Formula Rate Spreadsheet. Nothing in these Protocols shall act as a bar to a party raising an issue in comments or in protests to the Annual Update that it has not raised in a prior Annual Update proceeding (including pre-filing phases of such proceeding) or with respect to which it has not previously exercised its rights under the Federal Power Act. It is expressly intended by these Protocols that FERC issue an order taking action, assuming any action is requested, on the Annual Update if protests and/or comments on the Annual Update are filed.
6) In any Annual Update proceeding, SCE shall bear the burden, consistent with Section 205 of the Federal Power Act, of showing the justness and reasonableness of the implementation of its Formula Rate by demonstrating that: (a) it has properly and reasonably applied the Formula Rate Spreadsheet and the procedures in these Protocols; (b) the costs to be recovered have been accurately stated, properly recorded and accounted for pursuant to applicable FERC accounting practices and procedures; (c) its projections have been reasonably made; (d) its calculation methodologies are consistent with the Formula Rate; and (e) any Material Accounting Changes are reasonable and consistent with the Uniform System of Accounts; Nothing herein is intended to alter the burden of proof applied by the Commission with respect to prudence.
Southern California Edison Company FERC Electric Tariff, Third Revised Volume No. 6 _____________________________________________________________________________________________________
________________________________________________________________________________________________________ Tariff Record Proposed Effective Date: 01/01/2018
Version Number: 4.0.0 Option Code: A
7) SCE will make any revisions to the Base TRR and associated rates that are
required by a final5 Commission order with respect to each Annual Update. Unless otherwise ordered by the Commission, such revisions shall be effective as of the first day of the applicable Rate Year and shall be reflected, with interest calculated pursuant to the interest rate in Section 35.19a of the Commission’s regulations, in the next subsequent Annual Update as a component of the True Up Adjustment. If the term of the Formula Rate is expiring so that there will be no future Annual Update, SCE shall include the TRR difference in the Final True Up Adjustment.
8) If SCE determines or concedes that a previously-filed Annual Update with a Prior
Year not more than two years previous to the Prior Year of the current Annual Update contained errors that affected the True Up TRR calculated in that Annual Update, including but not limited to filed corrections to its FERC Form 1 that affect inputs to the Formula Rate, or errors in other input data used in determining the True Up TRR, SCE shall promptly serve notice to the Commission in the docket of the affected Annual Update that SCE intends to file an Amended Annual Update, with a brief description of the errors to be corrected in such filing. SCE shall additionally notify the entities that have participated in SCE's Annual Update filings of the errors and the upcoming Amended Annual Update. The Amended Annual Update shall:
i recalculate the True Up TRR for all affected Prior Years;
ii compare, on a monthly basis, the difference between the initial
incorrect True Up TRR and the revised correct True Up TRR; and
iii determine the cumulative amount of the difference in (ii), including interest calculated pursuant to the interest rate in 18 C.F.R. § 35.19a.
The difference in (iii) shall be included as an additional component to SCE's True Up Adjustment in the subsequent Annual Update as a One Time True Up Adjustment in accordance with the Formula Rate.
If the difference in (iii) would not result in an increase to the True-Up TRR of more than $1 million, however, then SCE need not submit to the Commission an Amended Annual Update, as described above, but may include the difference in (iii) in its Draft Annual Update, or, if the error is discovered after the posting of a Draft Annual Update on June 15, in an amended Draft Annual Update posted on SCE’s website no later than October 31.
5 All references in these Protocols to Commission orders or actions refer to the final form of such orders or actions (in accordance with the Federal Power Act and applicable Commission regulations, including without limitation Commission regulations with respect to a stay of a Commission order upon rehearing and/or an appeal), including as they may be modified as a result of a request for rehearing or Court appeal.
Southern California Edison Company FERC Electric Tariff, Third Revised Volume No. 6 _____________________________________________________________________________________________________
________________________________________________________________________________________________________ Tariff Record Proposed Effective Date: 01/01/2018
Version Number: 4.0.0 Option Code: A
In the event that SCE has identified multiple input errors, SCE shall identify each such error and its correction individually. The amount proposed to be included in an Amended Annual Update, a Draft Annual Update, or an amended Draft Annual Update as a One Time True Up Adjustment shall be subject to scrutiny through the information exchange process and annual update procedures described in this Section 3.
4. THE ANNUAL TRUE UP ADJUSTMENT AND THE FINAL TRUE UP ADJUSTMENT
The Annual True Up Adjustment component of the Base TRR ensures that during the time the Formula Rate is in effect, SCE will recover its actual costs of owning and operating its ISO transmission facilities, as defined by the True Up TRR. The Annual True Up Adjustment is calculated for each Annual Update for the previous calendar year (the “Prior Year”), if the Formula Rate was in effect during some or all of that year, through the following steps:
a) Calculate SCE’s actual costs during the Prior Year, as measured by the “True Up
TRR.” The True Up TRR, as defined in the Formula Rate, is equal to the Prior Year TRR as defined in the Formula Rate, except that all of the Rate Base components used in the True Up TRR are based on 13-month average values or beginning-of-year and end-of-year average values.
b) Attribute the True Up TRR to each month of the Prior Year as specifically defined
in the Formula Rate.
c) Determine SCE’s actual retail base transmission revenues attributable to the Formula Rate on a monthly basis for each month of the Prior Year, in accordance with the Formula Rate.
d) Compare SCE’s monthly True Up TRR to SCE’s monthly actual retail base
transmission revenues. Each monthly difference shall be cumulated, including interest calculated on a monthly basis using the interest rate specified in the
regulations of the Commission at 18 C.F.R § 35.19a, through the end of the Prior Year, in accordance with the Formula Rate to determine a “Shortfall or Excess Revenue in the Prior Year”. The “Shortfall or Excess Revenue in the Prior Year” shall also include the “Shortfall or Excess Revenue in the Prior Year” from the previous Annual Update, as specifically included in Schedule 3 of the Formula Rate Spreadsheet, Schedule 3, Line 11, and any applicable One Time Adjustments.
e) As stated in Section 6 below, the True Up Adjustment included in the Base TRR effective January 1, 2018 shall include the Final True Up Adjustment for the 2016 year calculated pursuant to the Original Formula Rate. The Final True Up Adjustment for the 2017 year calculated pursuant to the Original Formula Rate shall be included in the True Up Adjustment for the Annual Update submitted by December 1, 2018.
Southern California Edison Company FERC Electric Tariff, Third Revised Volume No. 6 _____________________________________________________________________________________________________
________________________________________________________________________________________________________ Tariff Record Proposed Effective Date: 01/01/2018
Version Number: 4.0.0 Option Code: A
In the event that this Formula Rate terminates, SCE shall calculate a Final True Up Adjustment. The Final True Up Adjustment shall cover the period of time ending on the expiration of the Formula Rate and beginning on the day after the period covered by the most recent Annual True Up Adjustment that was included in the Base TRR. For example, if the Formula Rate terminates on December 31, 2030, SCE will determine a Final True Up Adjustment in 2031 for calendar year 2030. Except as otherwise stated in this paragraph, the Final True Up Adjustment shall be determined using the same calculation methodology as the Annual True Up Adjustment.
Interest included in the Final True Up Adjustment shall be calculated through the date of the termination of the Formula Rate (or, in the event of a partial determination of the Final True Up Adjustment, through the end of the period covered by that partial determination). The Final True Up Adjustment shall be subject to the procedures described in Section 3 of the Protocols. If the Final True Up Adjustment reflects an undercollection by SCE, then SCE shall be entitled and required to recover the amount of this Final True Up Adjustment in SCE’s successor transmission rates to this Formula Rate. If the Final True Up Adjustment reflects an overcollection by SCE, then SCE shall be required to refund the amount of this Final True Up Adjustment to its customers.
5. THE INCREMENTAL FORECAST PERIOD TRR
The Incremental Forecast Period TRR (“IFPTRR”), calculated in Schedule 2 (Incremental Forecast Period TRR) of the Formula Rate Spreadsheet, is a component of SCE’s Base TRR that represents the amount of transmission revenue requirement that SCE anticipates during the upcoming Rate Year that is incremental to that reflected in the Prior Year TRR as a result of additions of plant in service (identified in Schedule 16 (Plant Additions) of the Formula Rate) and/or CWIP expenditures (identified in Schedule 10 (CWIP) of the Formula Rate) to Rate Base. The IFPTRR shall be calculated in accordance with the Formula Rate.
6. TRANSITION OF THE ORIGINAL FORMULA RATE TO THE FORMULA RATE
Pursuant to Section 4 of the Formula Rate Protocols for the Original Formula Rate, SCE is entitled and required to reflect the amount of any Final True Up Adjustment from the Original Formula Rate for the 2016 and 2017 years in its successor transmission rates. This Section 6 ensures that this requirement from the Original Formula Rate is implemented accurately. The Formula Rate Base TRR and associated rates for the Rate Years 2018 and 2019 shall reflect a True Up Adjustment that is based on a True Up TRR for the years 2016 and 2017 respectively calculated pursuant to the Original Formula Rate. This shall be implemented in the rate filing for the 2018 Rate Year and the Annual Update for the 2019 Rate Year by including as a “One Time Adjustment” any difference in the True Up TRR for the Prior Years of 2016 and 2017 calculated under this Formula Rate and the True Up TRR amounts calculated pursuant to the Original Formula Rate in Column 4 of Schedule 3 of the Formula Rate Spreadsheet. The One Time Adjustment included in the 2018 Rate Year filing will reflect the difference between the 2016 year True Up TRR
Southern California Edison Company FERC Electric Tariff, Third Revised Volume No. 6 _____________________________________________________________________________________________________
________________________________________________________________________________________________________ Tariff Record Proposed Effective Date: 01/01/2018
Version Number: 4.0.0 Option Code: A
calculated pursuant to this Formula Rate and the Original Formula Rate. The Annual Update for the 2019 Rate Year will reflect the difference between the 2017 year True Up TRR calculated pursuant to this Formula Rate and the Original Formula Rate. In the event that this Formula Rate does not become effective until after January 1, 2018, so that the Original Formula Rate remained in effect throughout part or all of 2018, the calculation of the True Up TRR for 2018 shall be based on a weighted average of the True Up TRRs calculated pursuant to the Original Formula Rate and this Formula Rate, with the weighting being based on the number of days during the 2018 year each was in effect (and any years after 2018 will be treated similarly). The One Time Adjustment for any such years with two formula rates in effect shall be calculated based on the difference between the weighted average True Up TRRs and the True Up TRR calculated pursuant to this Formula Rate. Additionally, the True Up Adjustment submitted in the filing for Rate Year 2018 shall include as a One Time Adjustment any “Cumulative Excess or Shortfall in Revenue with Interest” through the end of 2015 calculated pursuant to the Original Formula Rate, as reflected in SCE’s Annual Update Filing submitted in ER11-3697 on November 30, 2016, Schedule 3, Line 34, Column 8. The 2018 Rate Year filing and the 2019 Annual Update shall include as a workpaper a calculation of these One Time Adjustments.
7. DEPRECIATION RATES
Depreciation rates for Transmission Plant, Distribution Plant, General Plant, and Intangible Plant shall be as stated in the Formula Rate Spreadsheet.
8. REVISIONS TO CERTAIN FORMULA RATE PROVISIONS
SCE will be required to make single-issue Section 205 filings to change the Formula Rate as provided in Section 8, parts (a) through (e). In addition to the single-issue filings provided for in this Section 8 and subject to the limitations set forth in Section 11, SCE may make Section 205 filings that present only a single issue or limited discrete issues for consideration by the Commission, i.e., proposing to change any one or more elements of its Formula Rate. Such filings shall not be governed by the provisions of this Section 8, and the parties and SCE reserve their rights with respect to any such filing.
In a proceeding commenced by such a single-issue Section 205 filing under Section 8, parts (a) and (b), the sole issues that can or shall be addressed are whether the changes proposed by SCE are consistent with these Protocols and are just and reasonable.
In a proceeding commenced by a single-issue filing under Section 8, part (c), the sole issues that can or shall be addressed are whether the changes proposed by SCE are just and reasonable and correctly implement the applicable California Public Utilities Commission (“CPUC”) order.
Southern California Edison Company FERC Electric Tariff, Third Revised Volume No. 6 _____________________________________________________________________________________________________
________________________________________________________________________________________________________ Tariff Record Proposed Effective Date: 01/01/2018
Version Number: 4.0.0 Option Code: A
In a proceeding commenced by a single-issue filing under Section 8, parts (d) and (e), the sole issue that can or shall be addressed is whether the changes proposed by SCE correctly implement the applicable CPUC order.
The proceedings commenced in response to the filings described in this Section shall not include or allow for consideration or examination of any other aspects of the Formula Rate or other issues associated with the Formula Rate, except to the extent that the proposed changes directly impact other Formula Rate components that are not the subject of the single-issue filing. All parties will have all applicable rights under the Federal Power Act and FERC’s regulations with respect to such single-issue Section 205 filings, except as limited by this Section 8.
a) SCE will make a single-issue Section 205 filing to update the references in the
Formula to reflect any changes to the format and/or content of the FERC Form 1 or the Uniform System of Accounts that affect the calculations set forth in the Formula in the event that a Commission order revises the format and/or content of the FERC Form 1 or the Uniform System of Accounts. This filing shall be submitted within sixty days of the implementation of any FERC decision to revise the FERC Form 1 or the Uniform System of Accounts, and shall be effective on the date of the revisions to the FERC Form 1 or Uniform System of Accounts, as applicable.
b) With respect to Post-Retirement Benefits Other than Pensions (“PBOPs”), the
Formula Rate identifies an Authorized PBOPs Expense Amount in Note 3 on Schedule 20 (Administrative and General Expenses), which is initially stated as $40,171,333. Beginning in 2019, SCE shall make a single-issue Section 205 filing by April 1 of each year to revise the Authorized PBOPs Expense Amount, seeking an effective date of January 1 of the year of the filing.
c) SCE will make a single-issue Section 205 filing seeking Commission approval to
put in effect conforming changes to Schedule 21 of the Formula Rate any time that the CPUC adopts revisions to the Gross Revenue Sharing Mechanism (“GRSM”). SCE will make its filing with the Commission, as set forth in this Section, between January 1 and March 1 of the year following the year that the CPUC order became effective.
d) SCE will make a single-issue Section 205 filing to revise Schedule 33 of the
Formula Rate determination of retail transmission rates to reflect any change in Rate Groups, Rate Schedules, or the design of retail rates applicable to each Rate Schedule subsequent to any final CPUC order that affects these aspects of retail transmission rates. SCE will make such a filing only if and when the change in Rate Groups, Rate Schedules, or the design of retail rates cannot otherwise be reflected through the normal operation of the Formula Rate. In the single-issue Section 205 filing to the Commission, SCE will propose revisions to Schedule 33 of the Formula Rate that conform to the CPUC order. SCE will make a filing under this Section 8(d) by the later of either the filing date for the next Annual Update following the CPUC ruling or sixty days after the CPUC ruling.
Southern California Edison Company FERC Electric Tariff, Third Revised Volume No. 6 _____________________________________________________________________________________________________
________________________________________________________________________________________________________ Tariff Record Proposed Effective Date: 01/01/2018
Version Number: 4.0.0 Option Code: A
e) SCE will make a single-issue Section 205 filing to change the depreciation rates for General, Intangible or Distribution plant in Schedule 18 upon approval by the CPUC of revised depreciation rates for these plant categories. SCE shall make a filing at the Commission, as set forth in this section, between January 1 and March 1 of the year following the year that the CPUC order became effective.
9. DETERMINATION OF AMOUNT OF TRANSMISSION PLANT - ISO AND DISTRIBUTION PLANT - ISO
SCE shall perform for the Prior Year a study (“Plant Study”) to determine:
The amount of plant classified as Transmission in SCE’s annual FERC Form 1 filing that is under the Operational Control of the ISO. Such amount shall be called Transmission Plant - ISO; and
The amount of plant classified as Distribution in SCE’s annual FERC Form 1 filing that is under the Operational Control of the ISO. Such amount shall be called Distribution Plant - ISO.
The Plant Study determination of Transmission Plant - ISO and Distribution Plant - ISO will correspond to the end-of-year plant values for transmission and distribution published in SCE’s FERC Form 1, and also shall be based on actual end-of-year ISO Operational Control of facilities. SCE will identify in the Plant Study major transmission facilities that have moved to or from ISO Operational Control in the Prior Year. Additionally, in submitting its future CPUC General Rate Case applications, SCE shall exclude from its CPUC-jurisdictional cost of service forecast, the cost of transmission and distribution facilities that SCE projects will be under the Operational Control of the ISO during the test year.
The methodology used in the Plant Study to determine Transmission Plant - ISO and Distribution Plant - ISO shall be as follows:
a) For each Transmission account 350-359 and Distribution account 360-362,
identify the year-end recorded gross plant amount.
b) For Transmission accounts 350-359 and Distribution accounts 360-362, classify the assets by each location into one of the following categories:
1) All ISO: All Transmission or Distribution assets at the location are under the
Operational Control of the ISO.
2) Non-ISO: No Transmission or Distribution assets at the location are under the Operational Control of the ISO.
3) Mixed ISO and Non-ISO Substation: The Transmission or Distribution
substation location has a mixture of assets under the Operational Control of the ISO and assets that are not under the Operational Control of the ISO.
Southern California Edison Company FERC Electric Tariff, Third Revised Volume No. 6 _____________________________________________________________________________________________________
________________________________________________________________________________________________________ Tariff Record Proposed Effective Date: 01/01/2018
Version Number: 4.0.0 Option Code: A
4) Mixed ISO and Non-ISO Line: Transmission line locations that have a mixture of assets under the Operational Control of the ISO and assets that are not under the Operational Control of the ISO that need to be analyzed using the Transmission Line methodology.
5) Other: Assets for which there is not sufficient data to categorize into one of
the above categories.
For all plant costs classified as (1) “All ISO”, classify all such plant costs as Transmission Plant - ISO or Distribution Plant - ISO, as appropriate. For all plant costs classified as (2) “Non-ISO”, classify none of such plant costs as “Transmission Plant - ISO” or “Distribution Plant - ISO.”
For all plant costs classified as (3) “Mixed ISO and Non-ISO Substation,” perform an analysis of plant costs based on individual components of the substation. Component plant costs that are under the Operational Control of the ISO shall be attributed to either Transmission Plant - ISO or Distribution Plant - ISO, as appropriate. Component plant costs that are not under the Operational Control of the ISO shall not be attributed to either Transmission Plant - ISO or Distribution Plant - ISO. Dual Use assets (supporting both ISO and non-ISO plant) shall be allocated to Transmission Plant - ISO or Distribution Plant - ISO based on the percentage of ISO assets for the location.
For all plant costs classified as (4) “Mixed ISO and Non-ISO Line,” apply the methodology set forth in Section 9(c) below to classify such costs.
For all plant costs classified as (5) “Other” in a location, classify such costs as Transmission Plant - ISO or Distribution Plant - ISO in proportion to the total percentage of Transmission Plant - ISO or Distribution Plant - ISO determined in parts (1) through (4) for that location.
c) Transmission line costs (including any amounts in accounts 350, 352, and 353)
required to be analyzed under the Transmission Line methodology pursuant to (b) (4) above shall be attributed to Transmission Plant - ISO according to the following methodology:
1) For each location, determine the total line miles and total line miles that are under the Operational Control of the ISO. Determine the percent of total line miles under the Operational Control of the ISO to total line miles at that location. This calculation shall be done separately for overhead and underground facilities in the location.
2) Determine the amount of Transmission Plant - ISO by applying the percent
determined in (1) to the appropriate plant costs by account at that location.
SCE shall present a summary of the Plant Study for the Prior Year in each annual Draft Annual Update, in accordance with the Formula Rate.
Southern California Edison Company FERC Electric Tariff, Third Revised Volume No. 6 _____________________________________________________________________________________________________
________________________________________________________________________________________________________ Tariff Record Proposed Effective Date: 01/01/2018
Version Number: 4.0.0 Option Code: A
10. DETERMINATION OF AMOUNT OF ISO OPERATION AND MAINTENANCE EXPENSE SCE shall annually determine the amount of recorded Transmission and Distribution Operation and Maintenance (“O&M”) expenses that is attributable to facilities under the Operational Control of the ISO (“ISO O&M Expense”). The method used to determine ISO O&M Expense shall be to allocate total recorded O&M Expenses as stated in FERC Form 1 based on specific allocation factors applied to the expenses recorded to the O&M accounts set forth in Schedule 19 of the Formula Rate Spreadsheet.
In the event that SCE experiences an extraordinary event, resulting in costs otherwise recoverable through the Formula Rate in a year to be recorded to Account 435 (Extraordinary Deductions) of the Uniform System of Accounts, SCE shall recover the full amount of such Account 435 costs, including any expenses or return on capital, in accordance with the Commission Order authorizing such recovery.
11. RESERVATION OF RIGHTS
a) Nothing in these Protocols shall be deemed to limit in any way the right of any
party admitted as an intervenor to this Formula Rate proceeding or admitted as an intervenor to any future proceeding involving an Annual Update to file a request for relief under any applicable provision of the FPA and/or the Commission’s regulations or participate in Annual Update proceedings.
b) Nothing in these Protocols shall be deemed to limit in any way SCE’s right to file
unilaterally, pursuant to Section 205 of the FPA and the regulations thereunder, to seek to change or cancel the Formula Rate, or to submit any other request for relief under any applicable provision of the FPA and/or the Commission’s regulations.
c) The party filing a proposed change to the Formula Rate Spreadsheet or Formula
Rate Protocols under Section 205 or 206 of the FPA bears the standard burdens associated with such a filing.
Southern California Edison Company FERC Electric Tariff, Third Revised Volume No. 6 _____________________________________________________________________________________________________
________________________________________________________________________________________________________ Tariff Record Proposed Effective Date: 01/01/2018
Version Number: 4.0.0 Option Code: A

12. USE OF INFORMATION Information produced pursuant to these Protocols may be used in any proceeding concerning the Formula Rate Spreadsheet, the Protocols, or the Annual Update; provided, however, that to the extent that any information provided pursuant to these Protocols has been designated and provided as Protected Materials, subject to the provisions of Exhibit A to these Protocols, the use of such information shall be governed by Exhibit A.
This section shall not apply to any information produced in the course of Commission- established settlement proceedings pursuant to the Commission’s rules and regulations governing settlement.
Southern California Edison Company FERC Electric Tariff, Third Revised Volume No. 6 _____________________________________________________________________________________________________
________________________________________________________________________________________________________ Tariff Record Proposed Effective Date: 01/01/2018
Version Number: 4.0.0 Option Code: A
EXHIBIT A
UNITED STATES OF AMERICA FEDERAL ENERGY REGULATORY COMMISSION
PROTECTIVE ORDER APPLICABLE TO INFORMATION PRODUCED BY SOUTHERN CALIFORNIA EDISON COMPANY PURSUANT TO THE FORMULA RATE PROTOCOLS
1. This Exhibit (hereinafter referred to as the “Protective Order”) shall govern the use of all Protected Materials produced by, or on behalf of, Southern California Edison Company (“SCE”) pursuant to the SCE Formula Rate Protocols.
2. This Protective Order applies to the following two categories of materials: (A) A Participant may designate as protected those materials which customarily are treated by that Participant as sensitive or proprietary, which are not available to the public, and which, if disclosed freely, would subject that Participant or its customers to risk of competitive disadvantage or other business injury; and (B) A Participant shall designate as protected those materials which contain critical energy infrastructure information, as defined in 18 CFR§ 388.113(c)(1) ("Critical Energy Infrastructure Information").
3. Definitions -- For purposes of this Order:
(a) The term "Participant" shall mean a Participant as defined in 18 CFR
§ 385.102(b).
(b) (1) The term "Protected Materials" means (A) materials (including depositions) provided by a Participant in response to discovery requests and designated by such Participant as protected; (B) any information contained in or obtained from such designated materials; (C) any other materials which are made subject to this Protective Order by the Presiding Administrative Law Judge appointed upon the Annual Update being set for hearing and/or settlement procedures or by the Discovery Master appointed pursuant to the Formula Rate Protocols (both referred to herein as the “Presiding Judge”), by the Commission, by any court or other body having appropriate authority, or by agreement of the Participants; (D) notes of Protected Materials; and (E) copies of Protected Materials. The Participant producing the Protected Materials shall physically
Southern California Edison Company FERC Electric Tariff, Third Revised Volume No. 6 _____________________________________________________________________________________________________
________________________________________________________________________________________________________ Tariff Record Proposed Effective Date: 01/01/2018
Version Number: 4.0.0 Option Code: A
mark them on each page as "PROTECTED MATERIALS" or with words of similar import as long as the term "Protected Materials" is included in that designation to indicate that they are Protected Materials. If the Protected Materials contain Critical Energy Infrastructure Information, the Participant producing such information shall additionally mark on each page containing such information the words "Contains Critical Energy Infrastructure Information B Do Not Release".
(2) The term "Notes of Protected Materials" means memoranda, handwritten
notes, or any other form of information (including electronic form) which copies or discloses materials described in Paragraph 3(b)(1). Notes of Protected Materials are subject to the same restrictions provided in this order for Protected Materials except as specifically provided in this order.
(3) Protected Materials shall not include (A) any information or document that has
been filed with and accepted into the public files of the Commission, or contained in the public files of any other federal or state agency, or any federal or state court, unless the information or document has been determined to be protected by such agency or court, or (B) information that is public knowledge, or which becomes public knowledge, other than through disclosure in violation of this Protective Order. Protected Materials do include any information or document contained in the files of the Commission that has been designated as Critical Energy Infrastructure Information.
(c) The term "Non-Disclosure Certificate" shall mean the certificate annexed
hereto by which Participants who have been granted access to Protected Materials shall certify their understanding that such access to Protected Materials is provided pursuant to the terms and restrictions of this Protective Order, and that such Participants have read the Protective Order and agree to be bound by it. All Non-Disclosure Certificates shall be served on all parties on the Service List, as defined in the SCE Formula Rate Protocols.
(d) The term "Reviewing Representative" shall mean a person who has signed a
Non-Disclosure Certificate and who is:
(1) Commission Trial Staff;
(2) an attorney who has made an appearance for a Participant;
(3) attorneys, paralegals, and other employees associated with an attorney described in Subparagraph (2);
Southern California Edison Company FERC Electric Tariff, Third Revised Volume No. 6 _____________________________________________________________________________________________________
________________________________________________________________________________________________________ Tariff Record Proposed Effective Date: 01/01/2018
Version Number: 4.0.0 Option Code: A

(4) an expert or an employee of an expert retained by a Participant for the purpose of advising, preparing for or testifying in connection with the Annual Update for which the information was requested;
(5) a person designated as a Reviewing Representative by order of the Presiding
Judge or the Commission; or
(6) employees or other representatives of Participants with significant responsibility for SCE’s Formula Rate.
4. Protected Materials shall be made available under the terms of this Protective Order only to Participants and only through their Reviewing Representatives as provided in Paragraphs 7-9.
5. Protected Materials shall remain available to Participants until the date that any Commission proceeding relating to the Protected Material is concluded and no longer subject to judicial review. If requested to do so in writing after that date, the Participants shall, within fifteen days of such request, return the Protected Materials (excluding Notes of Protected Materials) to the Participant that produced them, or shall destroy the materials, except that copies of filings, official transcripts and exhibits in this proceeding that contain Protected Materials, and Notes of Protected Material may be retained, if they are maintained in accordance with Paragraph 6, below. Within such time period each Participant, if requested to do so, shall also submit to the producing Participant an affidavit stating that, to the best of its knowledge, all Protected Materials and all Notes of Protected Materials have been returned or have been destroyed or will be maintained in accordance with Paragraph 6. To the extent Protected Materials are not returned or destroyed, they shall remain subject to the Protective Order.
6. All Protected Materials shall be maintained by the Participant in a secure place. Access to those materials shall be limited to those Reviewing Representatives specifically authorized pursuant to Paragraphs 8-9. The Secretary shall place any Protected Materials filed with the Commission in a non-public file. By placing such documents in a non- public file, the Commission is not making a determination of any claim of privilege. The Commission retains the right to make determinations regarding any claim of privilege and the discretion to release information necessary to carry out its jurisdictional responsibilities. For documents submitted to Commission Trial Staff ("Staff"), Staff shall follow the notification procedures of 18 CFR § 388.112 before making public any Protected Materials.
7. Protected Materials shall be treated as confidential by each Participant and by the Reviewing Representative in accordance with the certificate executed pursuant to
Southern California Edison Company FERC Electric Tariff, Third Revised Volume No. 6 _____________________________________________________________________________________________________
________________________________________________________________________________________________________ Tariff Record Proposed Effective Date: 01/01/2018
Version Number: 4.0.0 Option Code: A
Paragraph 9. Protected Materials shall not be used except as necessary under SCE’s Formula Rate Protocols, nor shall they be disclosed in any manner to any person except a Reviewing Representative who is engaged in working on SCE’s Annual Update for which the information was requested and who needs to know the information in order to carry out such responsibilities. Reviewing Representatives may make copies of Protected Materials, but such copies become Protected Materials. Reviewing Representatives may make notes of Protected Materials, which shall be treated as Notes of Protected Materials if they disclose the contents of Protected Materials.
8. (a) If a Reviewing Representative's scope of employment includes the marketing of energy, the direct supervision of any employee or employees whose duties include the marketing of energy, the provision of consulting services to any person whose duties include the marketing of energy, or the direct supervision of any employee or employees whose duties include the marketing of energy, such Reviewing Representative may not use information contained in any Protected Materials obtained under SCE’s Formula Rate Protocols to give any Participant or any competitor of any Participant a commercial advantage.
(b) In the event that a Participant wishes to designate as a Reviewing
Representative a person not described in Paragraph 3 (d) above, the Participant shall seek agreement from the Participant providing the Protected Materials. If an agreement is reached that person shall be a Reviewing Representative pursuant to Paragraphs 3(d) above with respect to those materials. If no agreement is reached, the Participant shall submit the disputed designation to the Presiding Judge for resolution.
9. (a) A Reviewing Representative shall not be permitted to inspect, participate in discussions regarding, or otherwise be permitted access to Protected Materials pursuant to this Protective Order unless that Reviewing Representative has first executed a Non- Disclosure Certificate; provided, that if an attorney qualified as a Reviewing Representative has executed such a certificate, the paralegals, secretarial and clerical personnel under the attorney’s instruction, supervision or control need not do so. A copy of each Non-Disclosure Certificate shall be provided to counsel for the Participant asserting confidentiality prior to disclosure of any Protected Material to that Reviewing Representative.
(b) Attorneys qualified as Reviewing Representatives are responsible for ensuring
that persons under their supervision or control comply with this order.
Southern California Edison Company FERC Electric Tariff, Third Revised Volume No. 6 _____________________________________________________________________________________________________
________________________________________________________________________________________________________ Tariff Record Proposed Effective Date: 01/01/2018
Version Number: 4.0.0 Option Code: A
10. Any Reviewing Representative may disclose Protected Materials to any other Reviewing Representative as long as the disclosing Reviewing Representative and the receiving Reviewing Representative both have executed a Non-Disclosure Certificate. In the event that any Reviewing Representative to whom the Protected Materials are disclosed ceases to be engaged in working on the Annual Update, as set forth above, or is employed or retained for a position whose occupant is not qualified to be a Reviewing Representative under Paragraph 3(d), access to Protected Materials by that person shall be terminated. Even if no longer engaged in this proceeding, every person who has executed a Non- Disclosure Certificate shall continue to be bound by the provisions of this Protective Order and the certification.
11. Subject to Paragraph 18, the Presiding Administrative Law Judge shall resolve any disputes arising under this Protective Order. Prior to presenting any dispute under this Protective Order to the Presiding Administrative Law Judge, the parties to the dispute shall use their best efforts to resolve it. Any participant that contests the designation of materials as protected shall notify the party that provided the protected materials by specifying in writing the materials the designation of which is contested. This Protective Order shall automatically cease to apply to such materials five (5) business days after the notification is made unless the designator, within said 5-day period, files a motion with the Presiding Administrative Law Judge, with supporting affidavits, demonstrating that the materials should continue to be protected. In any challenge to the designation of materials as protected, the burden of proof shall be on the participant seeking protection. If the Presiding Administrative Law Judge finds that the materials at issue are not entitled to protection, the procedures of Paragraph 18 shall apply. The procedures described above shall not apply to protected materials designated by a Participant as Critical Energy Infrastructure Information. Materials so designated shall remain protected and subject to the provisions of this Protective Order, unless a Participant requests and obtains a determination from the Commission's Critical Energy Infrastructure Information Coordinator that such materials need not remain protected.
12. All copies of all documents reflecting Protected Materials, including the portion of the hearing testimony, exhibits, transcripts, briefs and other documents which refer to Protected Materials, shall be filed and served in sealed envelopes or other appropriate containers endorsed to the effect that they are sealed pursuant to this Protective Order. Such documents shall be marked "PROTECTED MATERIALS" and shall be filed under seal and served under seal upon the Presiding Judge and all Reviewing Representatives who are on the service list. Such documents containing Critical Energy Infrastructure Information shall be additionally marked "Contains Critical Energy Infrastructure Information - Do Not Release". For anything filed under seal, redacted versions or, where an entire
Southern California Edison Company FERC Electric Tariff, Third Revised Volume No. 6 _____________________________________________________________________________________________________
________________________________________________________________________________________________________ Tariff Record Proposed Effective Date: 01/01/2018
Version Number: 4.0.0 Option Code: A
document is protected, a letter indicating such, will also be filed with the Commission and served on all parties on the service list and the Presiding Judge. Counsel for the producing Participant shall provide to all Participants who request the same, a list of Reviewing Representatives who are entitled to receive such material. Counsel shall take all reasonable precautions necessary to assure that Protected Materials are not distributed to unauthorized persons.
13. If any Participant desires to include, utilize or refer to any Protected Materials or information derived therefrom in testimony or exhibits during a hearing under the SCE Formula Rate Protocols in such a manner that might require disclosure of such material to persons other than reviewing representatives, such participant shall first notify both counsel for the disclosing participant and the Presiding Judge of such desire, identifying with particularity each of the Protected Materials. Thereafter, use of such Protected Material will be governed by procedures determined by the Presiding Judge.
14. Nothing in this Protective Order shall be construed as precluding any Participant from objecting to the use of Protected Materials on any legal grounds.
15. Nothing in this Protective Order shall preclude any Participant from requesting the Presiding Judge, the Commission, or any other body having appropriate authority, to find that this Protective Order should not apply to all or any materials previously designated as Protected Materials pursuant to this Protective Order. The Presiding Judge may alter or amend this Protective Order as circumstances warrant at any time during the course of this proceeding.
16. Each party governed by this Protective Order has the right to seek changes in it as appropriate from the Presiding Judge or the Commission.
17. All Protected Materials filed with the Commission, the Presiding Judge, or any other judicial or administrative body, in support of, or as a part of, a motion, other pleading, brief, or other document, shall be filed and served in sealed envelopes or other appropriate containers bearing prominent markings indicating that the contents include Protected Materials subject to this Protective Order. Such documents containing Critical Energy Infrastructure Information shall be additionally marked “Contains Critical Energy Infrastructure Information – Do Not Release.”
18. If the Presiding Judge finds at any time in the course of a proceeding that all or part of the Protected Materials need not be protected, those materials shall, nevertheless, be subject to the protection afforded by this Protective Order for three (3) business days from the date of issuance of the Presiding Judge's determination, and if the Participant seeking protection files an interlocutory
Southern California Edison Company FERC Electric Tariff, Third Revised Volume No. 6 _____________________________________________________________________________________________________
________________________________________________________________________________________________________ Tariff Record Proposed Effective Date: 01/01/2018
Version Number: 4.0.0 Option Code: A

appeal or requests that the issue be certified to the Commission, for an additional seven (7) business days. None of the Participants waives its rights to seek additional administrative or judicial remedies after the Presiding Judge's decision respecting Protected Materials or Reviewing Representatives, or the Commission's denial of any appeal thereof. The provisions of 18 CFR §§ 388.112 and 388.113 shall apply to any requests under the Freedom of Information Act. (5 U.S.C. § 552) for Protected Materials in the files of the Commission.
19. Nothing in this Protective Order shall be deemed to preclude any Participant from independently seeking through discovery in any other administrative or judicial proceeding information or materials produced under the SCE Formula Rate Protocols under this Protective Order.
20. None of the Participants waives the right to pursue any other legal or equitable remedies that may be available in the event of actual or anticipated disclosure of Protected Materials.
21. The contents of Protected Materials or any other form of information that copies or discloses Protected Materials shall not be disclosed to anyone other than in accordance with this Protective Order and shall be used only in connection with this (these) proceeding(s). Any violation of this Protective Order and of any Non- Disclosure Certificate executed hereunder shall constitute a violation of an order of the Commission.
Southern California Edison Company FERC Electric Tariff, Third Revised Volume No. 6 _____________________________________________________________________________________________________
________________________________________________________________________________________________________ Tariff Record Proposed Effective Date: 01/01/2018
Version Number: 4.0.0 Option Code: A
UNITEDSTATESOFAMERICAFEDERALENERGYREGULATORYCOMMISSIONNON‐DISCLOSURECERTIFICATEI hereby certify my understanding that access to Protected Materials is provided to me pursuant to the terms and restrictions of the Protective Order under the Southern California Edison Formula Rate Protocols, that I have been given a copy of and have read the Protective Order, and that I agree to be bound by it. I understand that the contents of the Protected Materials, any notes or other memoranda, or any other form of information that copies or discloses Protected Materials shall not be disclosed to anyone other than in accordance with that Protective Order. I acknowledge that a violation of this certificate constitutes a violation of an order of the Federal Energy Regulatory Commission.
By: Printed Name: Title: Representing: Date: ____________________________
Southern California Edison Company FERC Electric Tariff, Third Revised Volume No. 6 _____________________________________________________________________________________________________
________________________________________________________________________________________________________ Tariff Record Proposed Effective Date: 01/01/2018
Version Number: 4.0.0 Option Code: A

Attachment 2 to Appendix IX
Formula Rate Spreadsheet
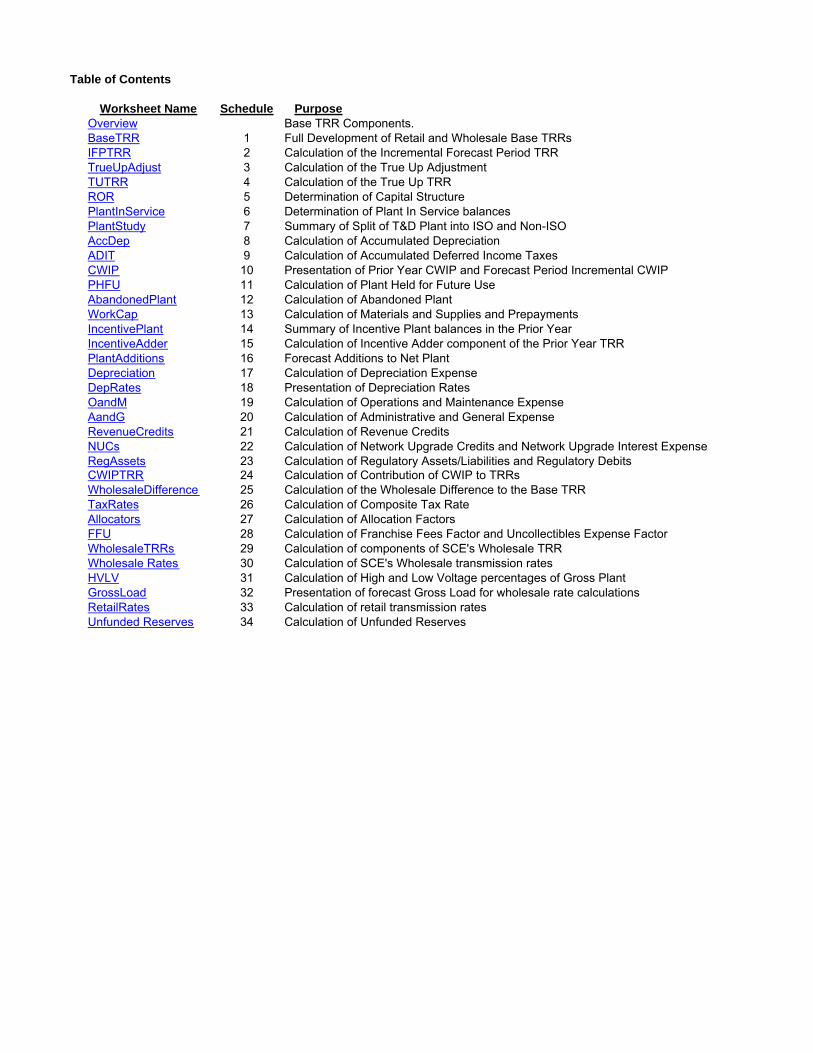
Table of Contents
Worksheet Name Schedule Purpose
Overview Base TRR Components.BaseTRR 1 Full Development of Retail and Wholesale Base TRRsIFPTRR 2 Calculation of the Incremental Forecast Period TRRTrueUpAdjust 3 Calculation of the True Up AdjustmentTUTRR 4 Calculation of the True Up TRRROR 5 Determination of Capital StructurePlantInService 6 Determination of Plant In Service balances PlantStudy 7 Summary of Split of T&D Plant into ISO and Non-ISOAccDep 8 Calculation of Accumulated DepreciationADIT 9 Calculation of Accumulated Deferred Income TaxesCWIP 10 Presentation of Prior Year CWIP and Forecast Period Incremental CWIPPHFU 11 Calculation of Plant Held for Future UseAbandonedPlant 12 Calculation of Abandoned PlantWorkCap 13 Calculation of Materials and Supplies and Prepayments IncentivePlant 14 Summary of Incentive Plant balances in the Prior YearIncentiveAdder 15 Calculation of Incentive Adder component of the Prior Year TRRPlantAdditions 16 Forecast Additions to Net PlantDepreciation 17 Calculation of Depreciation ExpenseDepRates 18 Presentation of Depreciation RatesOandM 19 Calculation of Operations and Maintenance ExpenseAandG 20 Calculation of Administrative and General ExpenseRevenueCredits 21 Calculation of Revenue CreditsNUCs 22 Calculation of Network Upgrade Credits and Network Upgrade Interest ExpenseRegAssets 23 Calculation of Regulatory Assets/Liabilities and Regulatory DebitsCWIPTRR 24 Calculation of Contribution of CWIP to TRRsWholesaleDifference 25 Calculation of the Wholesale Difference to the Base TRRTaxRates 26 Calculation of Composite Tax RateAllocators 27 Calculation of Allocation FactorsFFU 28 Calculation of Franchise Fees Factor and Uncollectibles Expense FactorWholesaleTRRs 29 Calculation of components of SCE's Wholesale TRRWholesale Rates 30 Calculation of SCE's Wholesale transmission ratesHVLV 31 Calculation of High and Low Voltage percentages of Gross PlantGrossLoad 32 Presentation of forecast Gross Load for wholesale rate calculationsRetailRates 33 Calculation of retail transmission ratesUnfunded Reserves 34 Calculation of Unfunded Reserves

Overview
Overview of SCE Retail Base TRR
SCE's retail Base Transmission Revenue Requirement is the sum of the following components:
TRR Component Amount
Prior Year TRR -$ Incremental Forecast Period TRR -$ True-Up Adjustment -$ Cost Adjustment -$
Base TRR (retail) -$
These components represent the following costs that SCE incurs:
1) The Prior Year TRR component is the TRR associated with the Prior Year (most recent calendar year). The Prior Year TRR is calculated using End-of-Year Rate Base values, as set forth in the "1-BaseTRR" Worksheet.
2) The Incremental Forecast Period TRR is the component of Base TRR associated with forecast additions to in-serviceplant or CWIP, as set forth in the "2-IFPTRR" Worksheet.
3) The True Up Adjustment is a component of the Base TRR that reflects the difference between projected andactual costs, as set forth in the "3-TrueUpAdjust" Worksheet.
4) The Cost Adjustment component may be included as provided in the Tariff protocols.
Overview
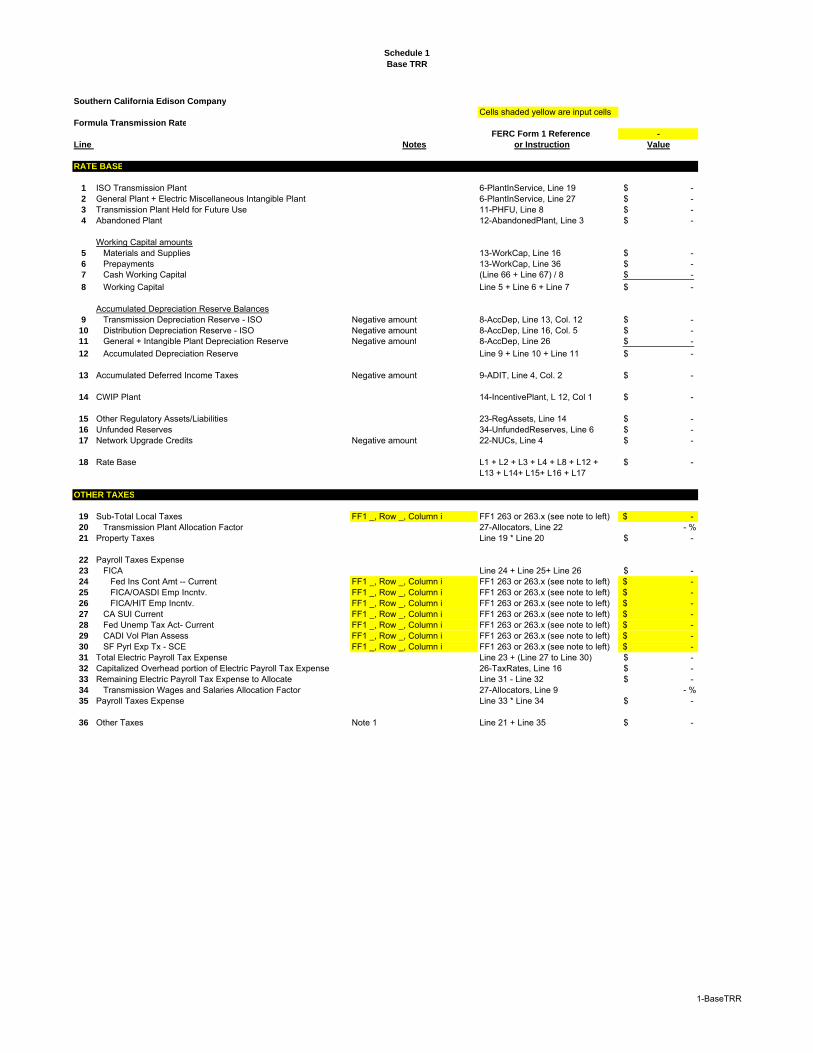
Schedule 1
Base TRR
Southern California Edison Company
Cells shaded yellow are input cellsFormula Transmission Rate
FERC Form 1 Reference -
Line Notes or Instruction Value
RATE BASE
1 ISO Transmission Plant 6-PlantInService, Line 19 -$ 2 General Plant + Electric Miscellaneous Intangible Plant 6-PlantInService, Line 27 -$ 3 Transmission Plant Held for Future Use 11-PHFU, Line 8 -$ 4 Abandoned Plant 12-AbandonedPlant, Line 3 -$
Working Capital amounts5 Materials and Supplies 13-WorkCap, Line 16 -$ 6 Prepayments 13-WorkCap, Line 36 -$ 7 Cash Working Capital (Line 66 + Line 67) / 8 -$
8 Working Capital Line 5 + Line 6 + Line 7 -$
Accumulated Depreciation Reserve Balances9 Transmission Depreciation Reserve - ISO Negative amount 8-AccDep, Line 13, Col. 12 -$ 10 Distribution Depreciation Reserve - ISO Negative amount 8-AccDep, Line 16, Col. 5 -$ 11 General + Intangible Plant Depreciation Reserve Negative amount 8-AccDep, Line 26 -$
12 Accumulated Depreciation Reserve Line 9 + Line 10 + Line 11 -$
13 Accumulated Deferred Income Taxes Negative amount 9-ADIT, Line 4, Col. 2 -$
14 CWIP Plant 14-IncentivePlant, L 12, Col 1 -$
15 Other Regulatory Assets/Liabilities 23-RegAssets, Line 14 -$ 16 Unfunded Reserves 34-UnfundedReserves, Line 6 -$ 17 Network Upgrade Credits Negative amount 22-NUCs, Line 4 -$
18 Rate Base L1 + L2 + L3 + L4 + L8 + L12 + -$ L13 + L14+ L15+ L16 + L17
OTHER TAXES
19 Sub-Total Local Taxes FF1 _, Row _, Column i FF1 263 or 263.x (see note to left) -$ 20 Transmission Plant Allocation Factor 27-Allocators, Line 22 - %21 Property Taxes Line 19 * Line 20 -$
22 Payroll Taxes Expense23 FICA Line 24 + Line 25+ Line 26 -$ 24 Fed Ins Cont Amt -- Current FF1 _, Row _, Column i FF1 263 or 263.x (see note to left) -$ 25 FICA/OASDI Emp Incntv. FF1 _, Row _, Column i FF1 263 or 263.x (see note to left) -$ 26 FICA/HIT Emp Incntv. FF1 _, Row _, Column i FF1 263 or 263.x (see note to left) -$ 27 CA SUI Current FF1 _, Row _, Column i FF1 263 or 263.x (see note to left) -$ 28 Fed Unemp Tax Act- Current FF1 _, Row _, Column i FF1 263 or 263.x (see note to left) -$ 29 CADI Vol Plan Assess FF1 _, Row _, Column i FF1 263 or 263.x (see note to left) -$ 30 SF Pyrl Exp Tx - SCE FF1 _, Row _, Column i FF1 263 or 263.x (see note to left) -$ 31 Total Electric Payroll Tax Expense Line 23 + (Line 27 to Line 30) -$ 32 Capitalized Overhead portion of Electric Payroll Tax Expense 26-TaxRates, Line 16 -$ 33 Remaining Electric Payroll Tax Expense to Allocate Line 31 - Line 32 -$ 34 Transmission Wages and Salaries Allocation Factor 27-Allocators, Line 9 - %35 Payroll Taxes Expense Line 33 * Line 34 -$
36 Other Taxes Note 1 Line 21 + Line 35 -$
1-BaseTRR
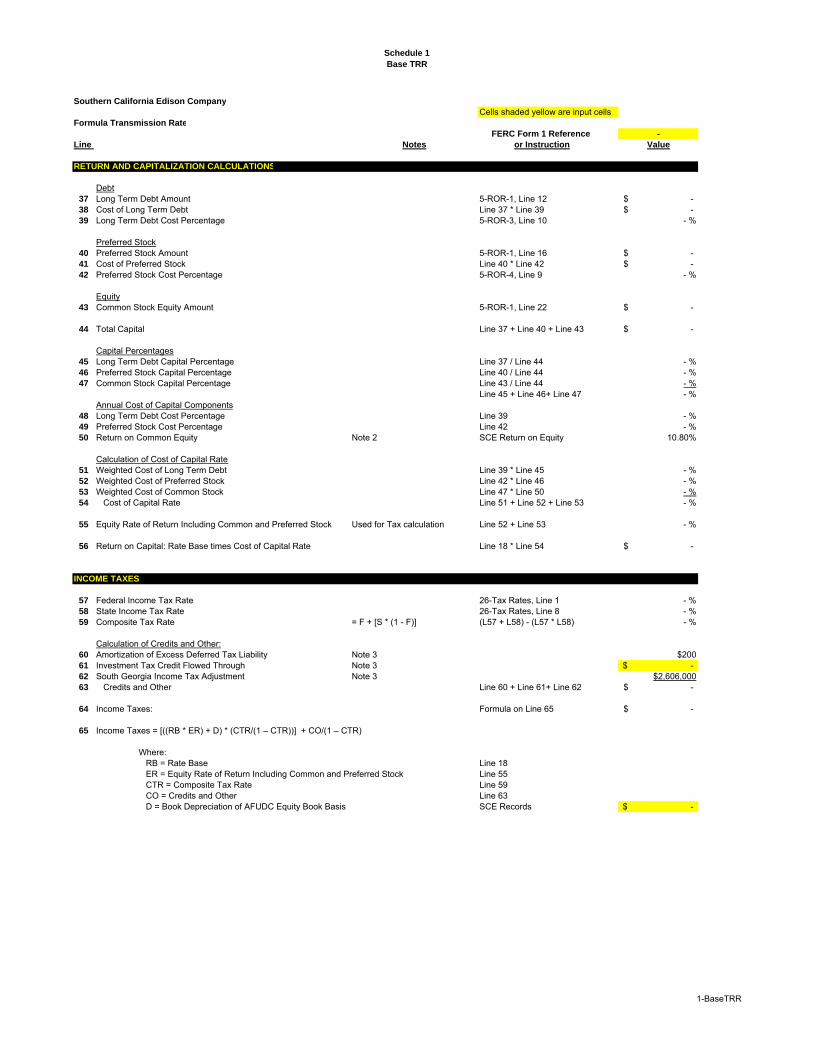
Schedule 1
Base TRR
Southern California Edison Company
Cells shaded yellow are input cellsFormula Transmission Rate
FERC Form 1 Reference -
Line Notes or Instruction Value
RETURN AND CAPITALIZATION CALCULATIONS
Debt37 Long Term Debt Amount 5-ROR-1, Line 12 -$ 38 Cost of Long Term Debt Line 37 * Line 39 -$ 39 Long Term Debt Cost Percentage 5-ROR-3, Line 10 - %
Preferred Stock40 Preferred Stock Amount 5-ROR-1, Line 16 -$ 41 Cost of Preferred Stock Line 40 * Line 42 -$ 42 Preferred Stock Cost Percentage 5-ROR-4, Line 9 - %
Equity43 Common Stock Equity Amount 5-ROR-1, Line 22 -$
44 Total Capital Line 37 + Line 40 + Line 43 -$
Capital Percentages45 Long Term Debt Capital Percentage Line 37 / Line 44 - %46 Preferred Stock Capital Percentage Line 40 / Line 44 - %47 Common Stock Capital Percentage Line 43 / Line 44 - %
Line 45 + Line 46+ Line 47 - %Annual Cost of Capital Components
48 Long Term Debt Cost Percentage Line 39 - %49 Preferred Stock Cost Percentage Line 42 - %50 Return on Common Equity Note 2 SCE Return on Equity 10.80%
Calculation of Cost of Capital Rate51 Weighted Cost of Long Term Debt Line 39 * Line 45 - %52 Weighted Cost of Preferred Stock Line 42 * Line 46 - %53 Weighted Cost of Common Stock Line 47 * Line 50 - %54 Cost of Capital Rate Line 51 + Line 52 + Line 53 - %
55 Equity Rate of Return Including Common and Preferred Stock Used for Tax calculation Line 52 + Line 53 - %
56 Return on Capital: Rate Base times Cost of Capital Rate Line 18 * Line 54 -$
INCOME TAXES
57 Federal Income Tax Rate 26-Tax Rates, Line 1 - %58 State Income Tax Rate 26-Tax Rates, Line 8 - %59 Composite Tax Rate = F + [S * (1 - F)] (L57 + L58) - (L57 * L58) - %
Calculation of Credits and Other:60 Amortization of Excess Deferred Tax Liability Note 3 $20061 Investment Tax Credit Flowed Through Note 3 -$ 62 South Georgia Income Tax Adjustment Note 3 $2,606,00063 Credits and Other Line 60 + Line 61+ Line 62 -$
64 Income Taxes: Formula on Line 65 -$
65 Income Taxes = [((RB * ER) + D) * (CTR/(1 – CTR))] + CO/(1 – CTR)
Where:RB = Rate Base Line 18ER = Equity Rate of Return Including Common and Preferred Stock Line 55CTR = Composite Tax Rate Line 59CO = Credits and Other Line 63D = Book Depreciation of AFUDC Equity Book Basis SCE Records -$
1-BaseTRR
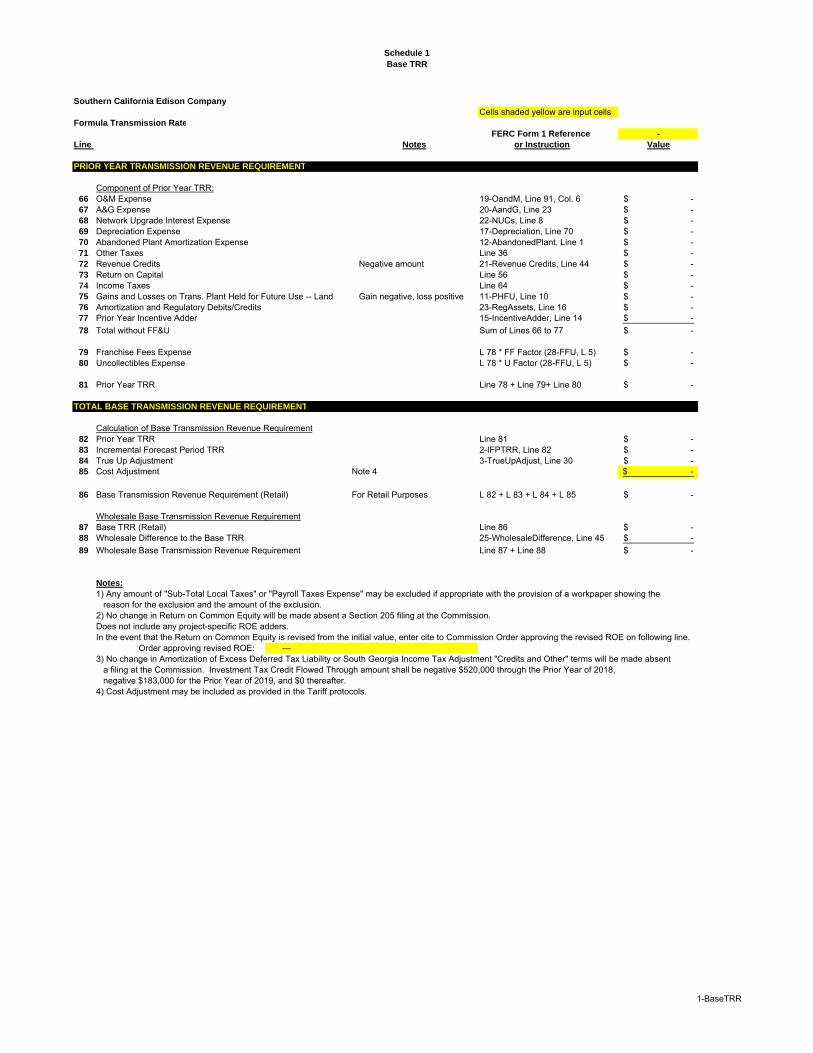
Schedule 1
Base TRR
Southern California Edison Company
Cells shaded yellow are input cellsFormula Transmission Rate
FERC Form 1 Reference -
Line Notes or Instruction Value
PRIOR YEAR TRANSMISSION REVENUE REQUIREMENT
Component of Prior Year TRR:66 O&M Expense 19-OandM, Line 91, Col. 6 -$ 67 A&G Expense 20-AandG, Line 23 -$ 68 Network Upgrade Interest Expense 22-NUCs, Line 8 -$ 69 Depreciation Expense 17-Depreciation, Line 70 -$ 70 Abandoned Plant Amortization Expense 12-AbandonedPlant, Line 1 -$ 71 Other Taxes Line 36 -$ 72 Revenue Credits Negative amount 21-Revenue Credits, Line 44 -$ 73 Return on Capital Line 56 -$ 74 Income Taxes Line 64 -$ 75 Gains and Losses on Trans. Plant Held for Future Use -- Land Gain negative, loss positive 11-PHFU, Line 10 -$ 76 Amortization and Regulatory Debits/Credits 23-RegAssets, Line 16 -$ 77 Prior Year Incentive Adder 15-IncentiveAdder, Line 14 -$
78 Total without FF&U Sum of Lines 66 to 77 -$
79 Franchise Fees Expense L 78 * FF Factor (28-FFU, L 5) -$ 80 Uncollectibles Expense L 78 * U Factor (28-FFU, L 5) -$
81 Prior Year TRR Line 78 + Line 79+ Line 80 -$
TOTAL BASE TRANSMISSION REVENUE REQUIREMENT
Calculation of Base Transmission Revenue Requirement82 Prior Year TRR Line 81 -$ 83 Incremental Forecast Period TRR 2-IFPTRR, Line 82 -$ 84 True Up Adjustment 3-TrueUpAdjust, Line 30 -$ 85 Cost Adjustment Note 4 -$
86 Base Transmission Revenue Requirement (Retail) For Retail Purposes L 82 + L 83 + L 84 + L 85 -$
Wholesale Base Transmission Revenue Requirement87 Base TRR (Retail) Line 86 -$ 88 Wholesale Difference to the Base TRR 25-WholesaleDifference, Line 45 -$
89 Wholesale Base Transmission Revenue Requirement Line 87 + Line 88 -$
Notes:
1) Any amount of "Sub-Total Local Taxes" or "Payroll Taxes Expense" may be excluded if appropriate with the provision of a workpaper showing the reason for the exclusion and the amount of the exclusion.
2) No change in Return on Common Equity will be made absent a Section 205 filing at the Commission. Does not include any project-specific ROE adders.In the event that the Return on Common Equity is revised from the initial value, enter cite to Commission Order approving the revised ROE on following line.
Order approving revised ROE: ---3) No change in Amortization of Excess Deferred Tax Liability or South Georgia Income Tax Adjustment "Credits and Other" terms will be made absent
a filing at the Commission. Investment Tax Credit Flowed Through amount shall be negative $520,000 through the Prior Year of 2018, negative $183,000 for the Prior Year of 2019, and $0 thereafter.
4) Cost Adjustment may be included as provided in the Tariff protocols.
1-BaseTRR
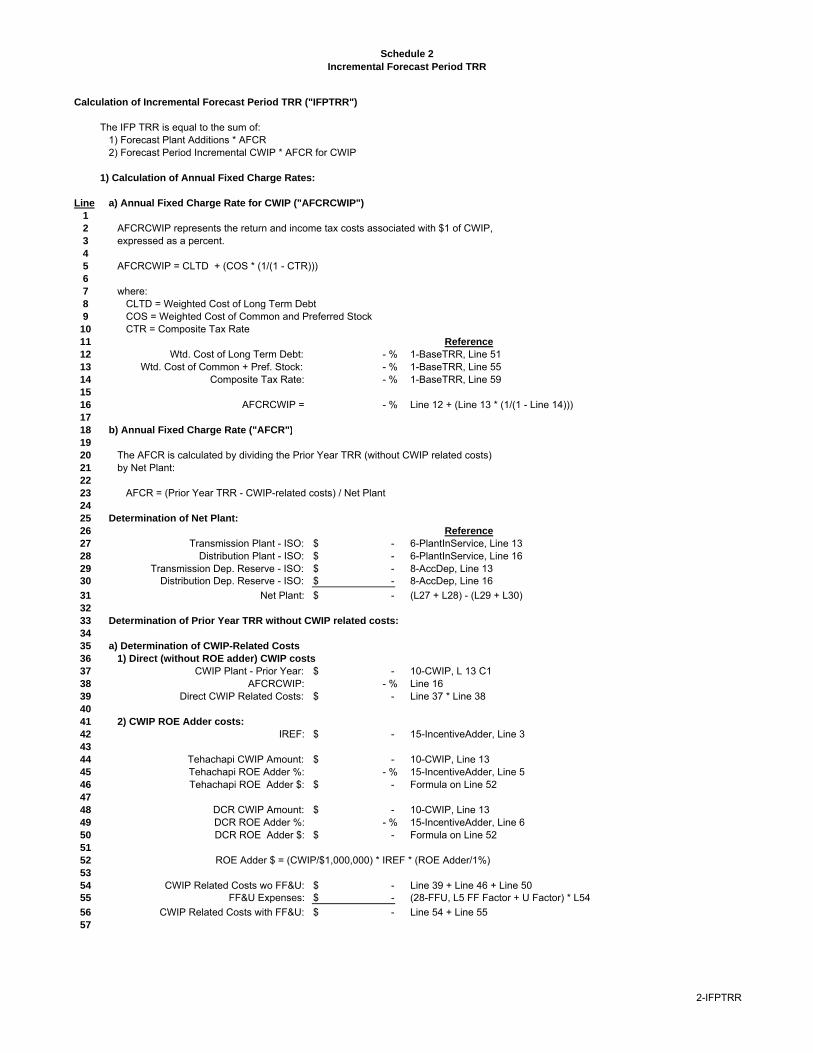
Schedule 2
Incremental Forecast Period TRR
Calculation of Incremental Forecast Period TRR ("IFPTRR")
The IFP TRR is equal to the sum of:1) Forecast Plant Additions * AFCR2) Forecast Period Incremental CWIP * AFCR for CWIP
1) Calculation of Annual Fixed Charge Rates:
Line a) Annual Fixed Charge Rate for CWIP ("AFCRCWIP")
1
2 AFCRCWIP represents the return and income tax costs associated with $1 of CWIP,3 expressed as a percent.4
5 AFCRCWIP = CLTD + (COS * (1/(1 - CTR)))6
7 where:8 CLTD = Weighted Cost of Long Term Debt9 COS = Weighted Cost of Common and Preferred Stock
10 CTR = Composite Tax Rate11 Reference
12 Wtd. Cost of Long Term Debt: - % 1-BaseTRR, Line 5113 Wtd. Cost of Common + Pref. Stock: - % 1-BaseTRR, Line 5514 Composite Tax Rate: - % 1-BaseTRR, Line 5915
16 AFCRCWIP = - % Line 12 + (Line 13 * (1/(1 - Line 14)))17
18 b) Annual Fixed Charge Rate ("AFCR")
19
20 The AFCR is calculated by dividing the Prior Year TRR (without CWIP related costs)21 by Net Plant:22
23 AFCR = (Prior Year TRR - CWIP-related costs) / Net Plant24
25 Determination of Net Plant:
26 Reference
27 Transmission Plant - ISO: -$ 6-PlantInService, Line 1328 Distribution Plant - ISO: -$ 6-PlantInService, Line 1629 Transmission Dep. Reserve - ISO: -$ 8-AccDep, Line 1330 Distribution Dep. Reserve - ISO: -$ 8-AccDep, Line 16
31 Net Plant: -$ (L27 + L28) - (L29 + L30)32
33 Determination of Prior Year TRR without CWIP related costs:
34
35 a) Determination of CWIP-Related Costs
36 1) Direct (without ROE adder) CWIP costs
37 CWIP Plant - Prior Year: -$ 10-CWIP, L 13 C138 AFCRCWIP: - % Line 1639 Direct CWIP Related Costs: -$ Line 37 * Line 3840
41 2) CWIP ROE Adder costs:
42 IREF: -$ 15-IncentiveAdder, Line 343
44 Tehachapi CWIP Amount: -$ 10-CWIP, Line 1345 Tehachapi ROE Adder %: - % 15-IncentiveAdder, Line 546 Tehachapi ROE Adder $: -$ Formula on Line 5247
48 DCR CWIP Amount: -$ 10-CWIP, Line 1349 DCR ROE Adder %: - % 15-IncentiveAdder, Line 650 DCR ROE Adder $: -$ Formula on Line 5251
52 ROE Adder $ = (CWIP/$1,000,000) * IREF * (ROE Adder/1%)53
54 CWIP Related Costs wo FF&U: -$ Line 39 + Line 46 + Line 5055 FF&U Expenses: -$ (28-FFU, L5 FF Factor + U Factor) * L54
56 CWIP Related Costs with FF&U: -$ Line 54 + Line 5557
2-IFPTRR
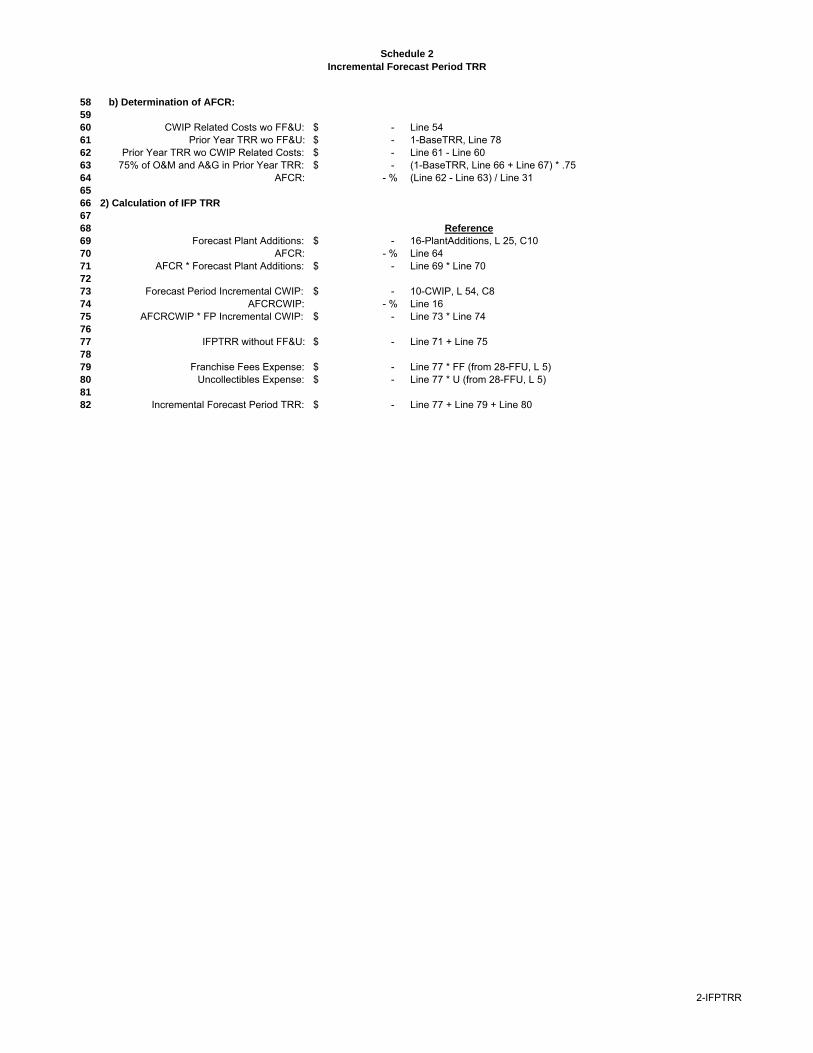
Schedule 2
Incremental Forecast Period TRR
58 b) Determination of AFCR:
59
60 CWIP Related Costs wo FF&U: -$ Line 5461 Prior Year TRR wo FF&U: -$ 1-BaseTRR, Line 7862 Prior Year TRR wo CWIP Related Costs: -$ Line 61 - Line 6063 75% of O&M and A&G in Prior Year TRR: -$ (1-BaseTRR, Line 66 + Line 67) * .7564 AFCR: - % (Line 62 - Line 63) / Line 3165
66 2) Calculation of IFP TRR
67
68 Reference
69 Forecast Plant Additions: -$ 16-PlantAdditions, L 25, C1070 AFCR: - % Line 6471 AFCR * Forecast Plant Additions: -$ Line 69 * Line 7072
73 Forecast Period Incremental CWIP: -$ 10-CWIP, L 54, C874 AFCRCWIP: - % Line 1675 AFCRCWIP * FP Incremental CWIP: -$ Line 73 * Line 7476
77 IFPTRR without FF&U: -$ Line 71 + Line 7578
79 Franchise Fees Expense: -$ Line 77 * FF (from 28-FFU, L 5)80 Uncollectibles Expense: -$ Line 77 * U (from 28-FFU, L 5)81
82 Incremental Forecast Period TRR: -$ Line 77 + Line 79 + Line 80
2-IFPTRR
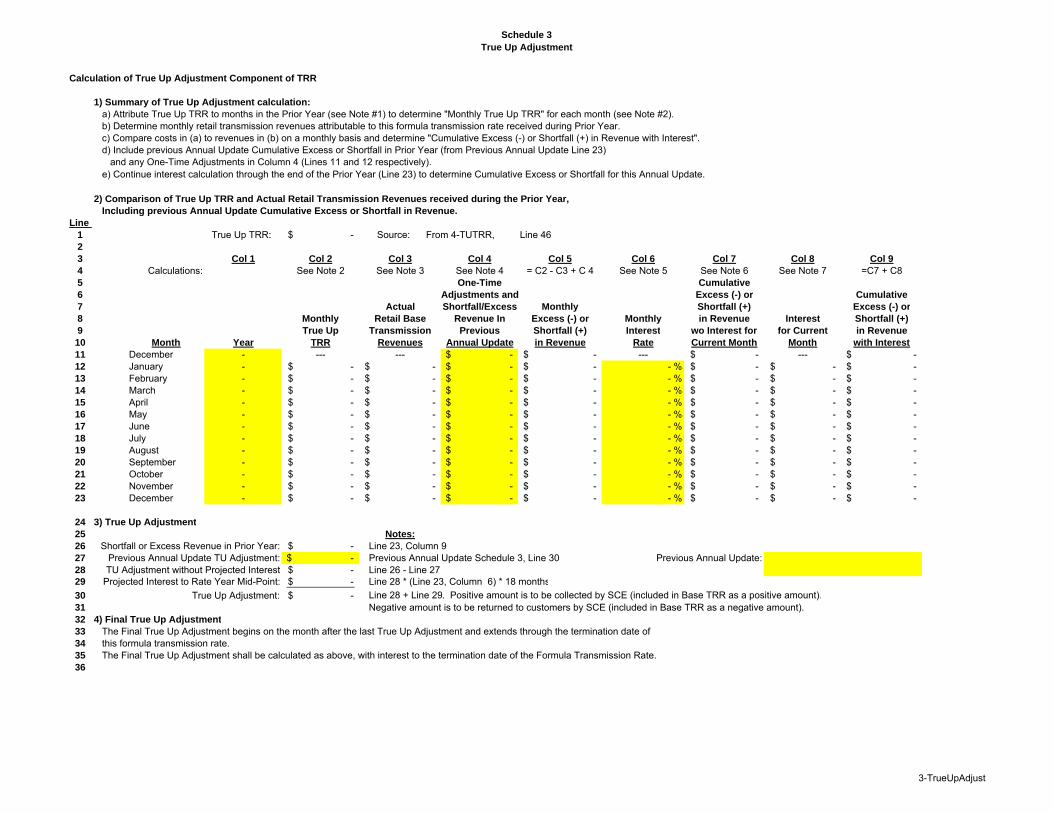
Schedule 3
True Up Adjustment
Calculation of True Up Adjustment Component of TRR
1) Summary of True Up Adjustment calculation:
a) Attribute True Up TRR to months in the Prior Year (see Note #1) to determine "Monthly True Up TRR" for each month (see Note #2). b) Determine monthly retail transmission revenues attributable to this formula transmission rate received during Prior Year.c) Compare costs in (a) to revenues in (b) on a monthly basis and determine "Cumulative Excess (-) or Shortfall (+) in Revenue with Interest".d) Include previous Annual Update Cumulative Excess or Shortfall in Prior Year (from Previous Annual Update Line 23)
and any One-Time Adjustments in Column 4 (Lines 11 and 12 respectively).e) Continue interest calculation through the end of the Prior Year (Line 23) to determine Cumulative Excess or Shortfall for this Annual Update.
2) Comparison of True Up TRR and Actual Retail Transmission Revenues received during the Prior Year,
Including previous Annual Update Cumulative Excess or Shortfall in Revenue.
Line
1 True Up TRR: -$ Source: From 4-TUTRR, Line 462
3 Col 1 Col 2 Col 3 Col 4 Col 5 Col 6 Col 7 Col 8 Col 9
4 Calculations: See Note 2 See Note 3 See Note 4 = C2 - C3 + C 4 See Note 5 See Note 6 See Note 7 =C7 + C85 One-Time Cumulative
6 Adjustments and Excess (-) or Cumulative
7 Actual Shortfall/Excess Monthly Shortfall (+) Excess (-) or
8 Monthly Retail Base Revenue In Excess (-) or Monthly in Revenue Interest Shortfall (+)
9 True Up Transmission Previous Shortfall (+) Interest wo Interest for for Current in Revenue
10 Month Year TRR Revenues Annual Update in Revenue Rate Current Month Month with Interest
11 December - --- --- -$ -$ --- -$ --- -$ 12 January - -$ -$ -$ -$ - % -$ -$ -$ 13 February - -$ -$ -$ -$ - % -$ -$ -$ 14 March - -$ -$ -$ -$ - % -$ -$ -$ 15 April - -$ -$ -$ -$ - % -$ -$ -$ 16 May - -$ -$ -$ -$ - % -$ -$ -$ 17 June - -$ -$ -$ -$ - % -$ -$ -$ 18 July - -$ -$ -$ -$ - % -$ -$ -$ 19 August - -$ -$ -$ -$ - % -$ -$ -$ 20 September - -$ -$ -$ -$ - % -$ -$ -$ 21 October - -$ -$ -$ -$ - % -$ -$ -$ 22 November - -$ -$ -$ -$ - % -$ -$ -$ 23 December - -$ -$ -$ -$ - % -$ -$ -$
24 3) True Up Adjustment
25 Notes:
26 Shortfall or Excess Revenue in Prior Year: -$ Line 23, Column 927 Previous Annual Update TU Adjustment: -$ Previous Annual Update Schedule 3, Line 30 Previous Annual Update:28 TU Adjustment without Projected Interest -$ Line 26 - Line 2729 Projected Interest to Rate Year Mid-Point: -$ Line 28 * (Line 23, Column 6) * 18 months
30 True Up Adjustment: -$ Line 28 + Line 29. Positive amount is to be collected by SCE (included in Base TRR as a positive amount).31 Negative amount is to be returned to customers by SCE (included in Base TRR as a negative amount).32 4) Final True Up Adjustment
33 The Final True Up Adjustment begins on the month after the last True Up Adjustment and extends through the termination date of 34 this formula transmission rate.35 The Final True Up Adjustment shall be calculated as above, with interest to the termination date of the Formula Transmission Rate.36
3-TrueUpAdjust
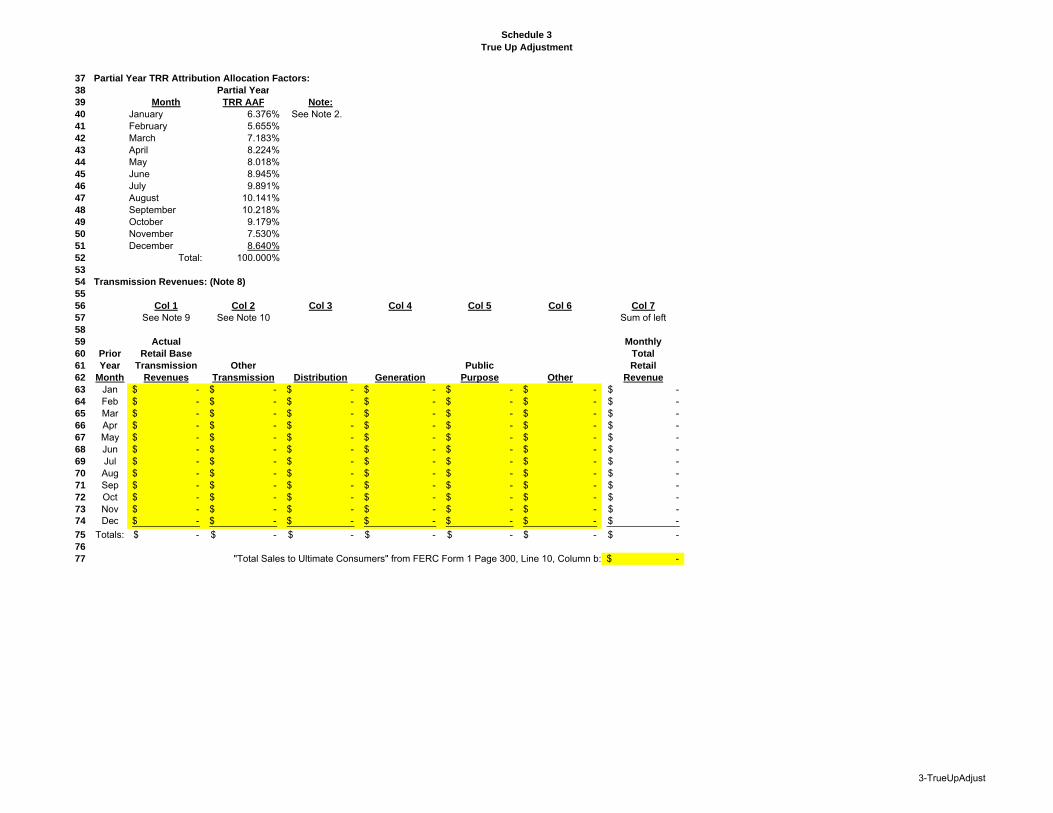
Schedule 3
True Up Adjustment
37 Partial Year TRR Attribution Allocation Factors:
38 Partial Year
39 Month TRR AAF Note:
40 January 6.376% See Note 2.41 February 5.655%42 March 7.183%43 April 8.224%44 May 8.018%45 June 8.945%46 July 9.891%47 August 10.141%48 September 10.218%49 October 9.179%50 November 7.530%51 December 8.640%52 Total: 100.000%53
54 Transmission Revenues: (Note 8)
55
56 Col 1 Col 2 Col 3 Col 4 Col 5 Col 6 Col 7
57 See Note 9 See Note 10 Sum of left58
59 Actual Monthly
60 Prior Retail Base Total
61 Year Transmission Other Public Retail
62 Month Revenues Transmission Distribution Generation Purpose Other Revenue
63 Jan -$ -$ -$ -$ -$ -$ -$ 64 Feb -$ -$ -$ -$ -$ -$ -$ 65 Mar -$ -$ -$ -$ -$ -$ -$ 66 Apr -$ -$ -$ -$ -$ -$ -$ 67 May -$ -$ -$ -$ -$ -$ -$ 68 Jun -$ -$ -$ -$ -$ -$ -$ 69 Jul -$ -$ -$ -$ -$ -$ -$ 70 Aug -$ -$ -$ -$ -$ -$ -$ 71 Sep -$ -$ -$ -$ -$ -$ -$ 72 Oct -$ -$ -$ -$ -$ -$ -$ 73 Nov -$ -$ -$ -$ -$ -$ -$ 74 Dec -$ -$ -$ -$ -$ -$ -$
75 Totals: -$ -$ -$ -$ -$ -$ -$ 76
77 "Total Sales to Ultimate Consumers" from FERC Form 1 Page 300, Line 10, Column b: -$
3-TrueUpAdjust
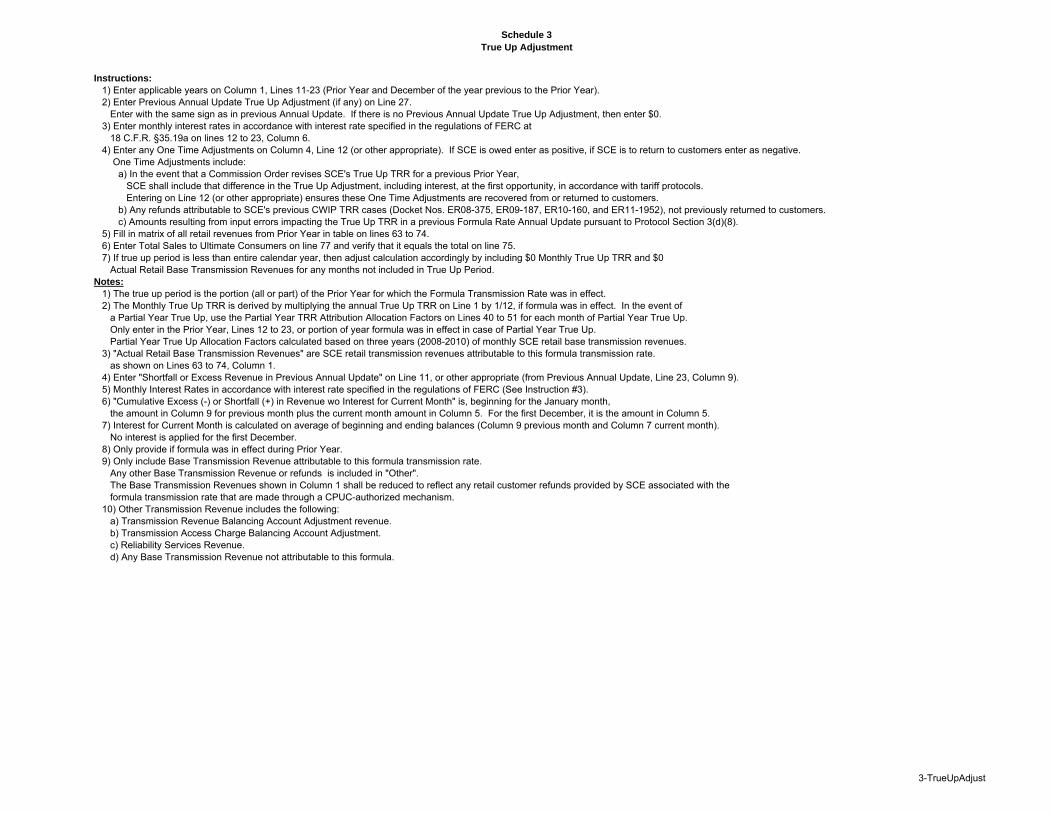
Schedule 3
True Up Adjustment
Instructions:
1) Enter applicable years on Column 1, Lines 11-23 (Prior Year and December of the year previous to the Prior Year).2) Enter Previous Annual Update True Up Adjustment (if any) on Line 27.
Enter with the same sign as in previous Annual Update. If there is no Previous Annual Update True Up Adjustment, then enter $0.3) Enter monthly interest rates in accordance with interest rate specified in the regulations of FERC at
18 C.F.R. §35.19a on lines 12 to 23, Column 6. 4) Enter any One Time Adjustments on Column 4, Line 12 (or other appropriate). If SCE is owed enter as positive, if SCE is to return to customers enter as negative.
One Time Adjustments include:a) In the event that a Commission Order revises SCE's True Up TRR for a previous Prior Year,
SCE shall include that difference in the True Up Adjustment, including interest, at the first opportunity, in accordance with tariff protocols.Entering on Line 12 (or other appropriate) ensures these One Time Adjustments are recovered from or returned to customers.
b) Any refunds attributable to SCE's previous CWIP TRR cases (Docket Nos. ER08-375, ER09-187, ER10-160, and ER11-1952), not previously returned to customers.c) Amounts resulting from input errors impacting the True Up TRR in a previous Formula Rate Annual Update pursuant to Protocol Section 3(d)(8).
5) Fill in matrix of all retail revenues from Prior Year in table on lines 63 to 74.6) Enter Total Sales to Ultimate Consumers on line 77 and verify that it equals the total on line 75.7) If true up period is less than entire calendar year, then adjust calculation accordingly by including $0 Monthly True Up TRR and $0
Actual Retail Base Transmission Revenues for any months not included in True Up Period.Notes:
1) The true up period is the portion (all or part) of the Prior Year for which the Formula Transmission Rate was in effect.2) The Monthly True Up TRR is derived by multiplying the annual True Up TRR on Line 1 by 1/12, if formula was in effect. In the event of
a Partial Year True Up, use the Partial Year TRR Attribution Allocation Factors on Lines 40 to 51 for each month of Partial Year True Up.Only enter in the Prior Year, Lines 12 to 23, or portion of year formula was in effect in case of Partial Year True Up.Partial Year True Up Allocation Factors calculated based on three years (2008-2010) of monthly SCE retail base transmission revenues.
3) "Actual Retail Base Transmission Revenues" are SCE retail transmission revenues attributable to this formula transmission rate.as shown on Lines 63 to 74, Column 1.
4) Enter "Shortfall or Excess Revenue in Previous Annual Update" on Line 11, or other appropriate (from Previous Annual Update, Line 23, Column 9).5) Monthly Interest Rates in accordance with interest rate specified in the regulations of FERC (See Instruction #3).6) "Cumulative Excess (-) or Shortfall (+) in Revenue wo Interest for Current Month" is, beginning for the January month,
the amount in Column 9 for previous month plus the current month amount in Column 5. For the first December, it is the amount in Column 5.7) Interest for Current Month is calculated on average of beginning and ending balances (Column 9 previous month and Column 7 current month).
No interest is applied for the first December.8) Only provide if formula was in effect during Prior Year.9) Only include Base Transmission Revenue attributable to this formula transmission rate.
Any other Base Transmission Revenue or refunds is included in "Other".The Base Transmission Revenues shown in Column 1 shall be reduced to reflect any retail customer refunds provided by SCE associated with theformula transmission rate that are made through a CPUC-authorized mechanism.
10) Other Transmission Revenue includes the following:a) Transmission Revenue Balancing Account Adjustment revenue. b) Transmission Access Charge Balancing Account Adjustment.c) Reliability Services Revenue.d) Any Base Transmission Revenue not attributable to this formula.
3-TrueUpAdjust
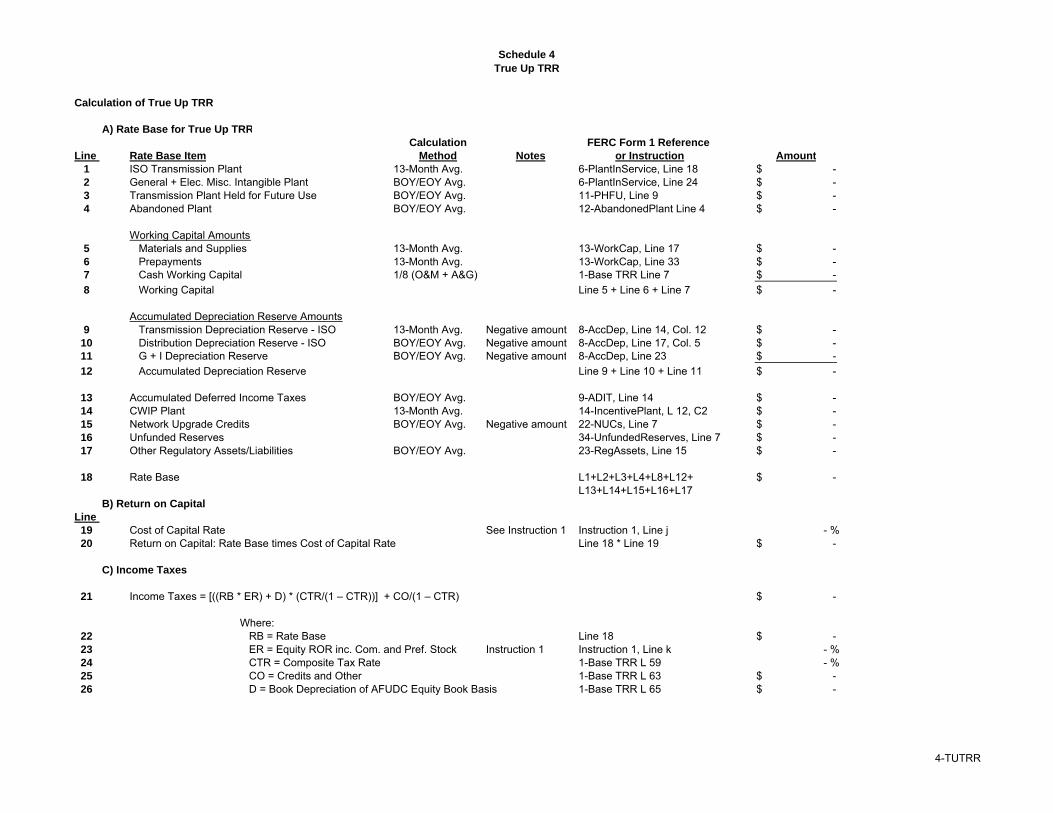
Schedule 4
True Up TRR
Calculation of True Up TRR
A) Rate Base for True Up TRR
Calculation FERC Form 1 Reference
Line Rate Base Item Method Notes or Instruction Amount
1 ISO Transmission Plant 13-Month Avg. 6-PlantInService, Line 18 -$ 2 General + Elec. Misc. Intangible Plant BOY/EOY Avg. 6-PlantInService, Line 24 -$ 3 Transmission Plant Held for Future Use BOY/EOY Avg. 11-PHFU, Line 9 -$ 4 Abandoned Plant BOY/EOY Avg. 12-AbandonedPlant Line 4 -$
Working Capital Amounts5 Materials and Supplies 13-Month Avg. 13-WorkCap, Line 17 -$ 6 Prepayments 13-Month Avg. 13-WorkCap, Line 33 -$ 7 Cash Working Capital 1/8 (O&M + A&G) 1-Base TRR Line 7 -$
8 Working Capital Line 5 + Line 6 + Line 7 -$
Accumulated Depreciation Reserve Amounts9 Transmission Depreciation Reserve - ISO 13-Month Avg. Negative amount 8-AccDep, Line 14, Col. 12 -$
10 Distribution Depreciation Reserve - ISO BOY/EOY Avg. Negative amount 8-AccDep, Line 17, Col. 5 -$ 11 G + I Depreciation Reserve BOY/EOY Avg. Negative amount 8-AccDep, Line 23 -$
12 Accumulated Depreciation Reserve Line 9 + Line 10 + Line 11 -$
13 Accumulated Deferred Income Taxes BOY/EOY Avg. 9-ADIT, Line 14 -$ 14 CWIP Plant 13-Month Avg. 14-IncentivePlant, L 12, C2 -$ 15 Network Upgrade Credits BOY/EOY Avg. Negative amount 22-NUCs, Line 7 -$ 16 Unfunded Reserves 34-UnfundedReserves, Line 7 -$ 17 Other Regulatory Assets/Liabilities BOY/EOY Avg. 23-RegAssets, Line 15 -$
18 Rate Base L1+L2+L3+L4+L8+L12+ -$ L13+L14+L15+L16+L17
B) Return on Capital
Line
19 Cost of Capital Rate See Instruction 1 Instruction 1, Line j - %20 Return on Capital: Rate Base times Cost of Capital Rate Line 18 * Line 19 -$
C) Income Taxes
21 Income Taxes = [((RB * ER) + D) * (CTR/(1 – CTR))] + CO/(1 – CTR) -$
Where:22 RB = Rate Base Line 18 -$ 23 ER = Equity ROR inc. Com. and Pref. Stock Instruction 1 Instruction 1, Line k - %24 CTR = Composite Tax Rate 1-Base TRR L 59 - %25 CO = Credits and Other 1-Base TRR L 63 -$ 26 D = Book Depreciation of AFUDC Equity Book Basis 1-Base TRR L 65 -$
4-TUTRR
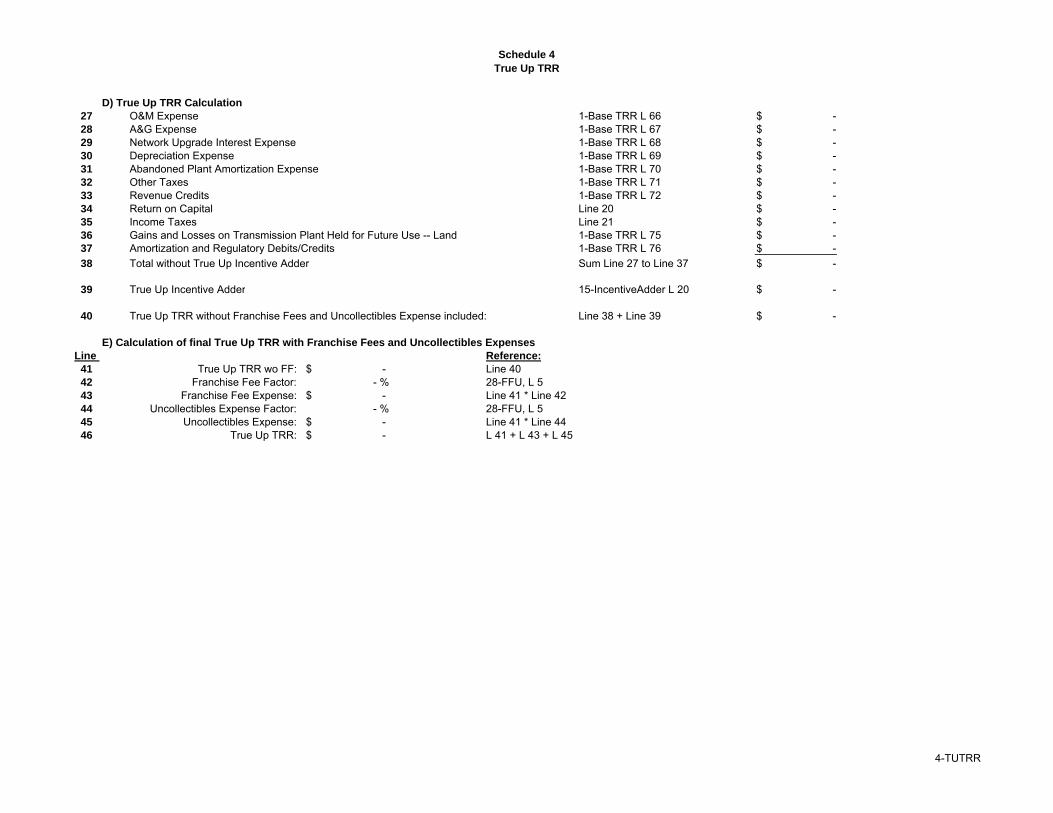
Schedule 4
True Up TRR
D) True Up TRR Calculation
27 O&M Expense 1-Base TRR L 66 -$ 28 A&G Expense 1-Base TRR L 67 -$ 29 Network Upgrade Interest Expense 1-Base TRR L 68 -$ 30 Depreciation Expense 1-Base TRR L 69 -$ 31 Abandoned Plant Amortization Expense 1-Base TRR L 70 -$ 32 Other Taxes 1-Base TRR L 71 -$ 33 Revenue Credits 1-Base TRR L 72 -$ 34 Return on Capital Line 20 -$ 35 Income Taxes Line 21 -$ 36 Gains and Losses on Transmission Plant Held for Future Use -- Land 1-Base TRR L 75 -$ 37 Amortization and Regulatory Debits/Credits 1-Base TRR L 76 -$
38 Total without True Up Incentive Adder Sum Line 27 to Line 37 -$
39 True Up Incentive Adder 15-IncentiveAdder L 20 -$
40 True Up TRR without Franchise Fees and Uncollectibles Expense included: Line 38 + Line 39 -$
E) Calculation of final True Up TRR with Franchise Fees and Uncollectibles Expenses
Line Reference:
41 True Up TRR wo FF: -$ Line 4042 Franchise Fee Factor: - % 28-FFU, L 543 Franchise Fee Expense: -$ Line 41 * Line 4244 Uncollectibles Expense Factor: - % 28-FFU, L 545 Uncollectibles Expense: -$ Line 41 * Line 4446 True Up TRR: -$ L 41 + L 43 + L 45
4-TUTRR
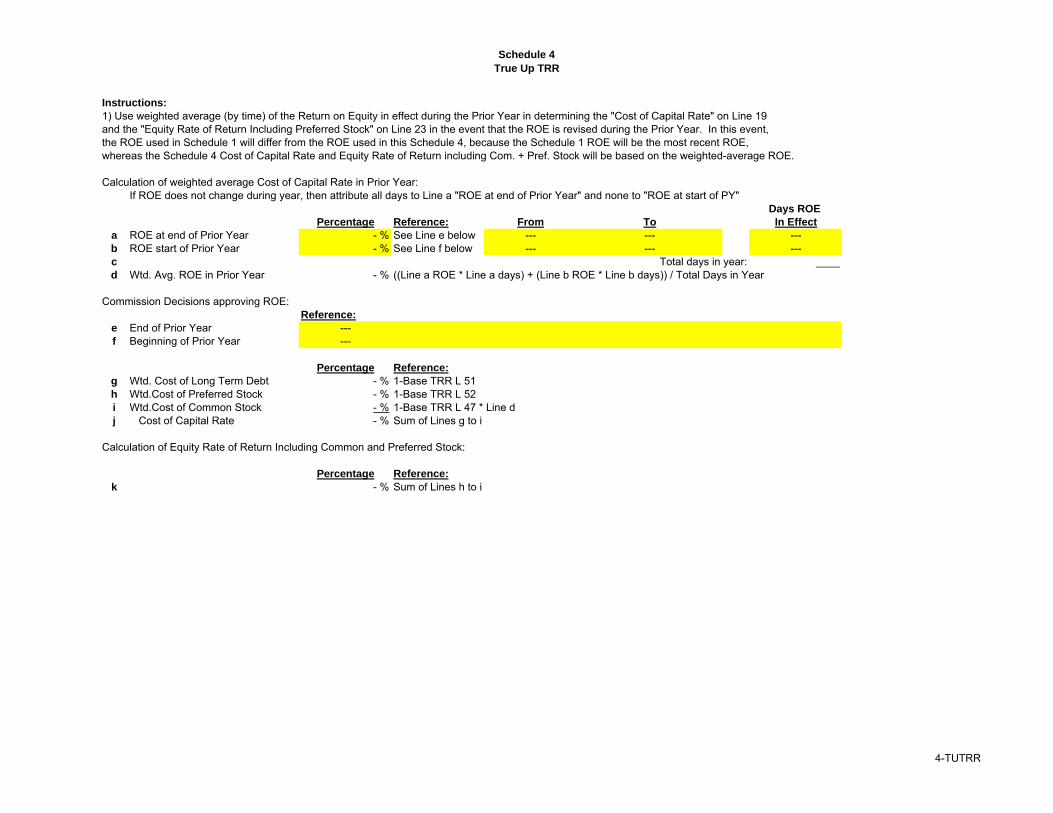
Schedule 4
True Up TRR
Instructions:
1) Use weighted average (by time) of the Return on Equity in effect during the Prior Year in determining the "Cost of Capital Rate" on Line 19and the "Equity Rate of Return Including Preferred Stock" on Line 23 in the event that the ROE is revised during the Prior Year. In this event,the ROE used in Schedule 1 will differ from the ROE used in this Schedule 4, because the Schedule 1 ROE will be the most recent ROE,whereas the Schedule 4 Cost of Capital Rate and Equity Rate of Return including Com. + Pref. Stock will be based on the weighted-average ROE.
Calculation of weighted average Cost of Capital Rate in Prior Year:If ROE does not change during year, then attribute all days to Line a "ROE at end of Prior Year" and none to "ROE at start of PY"
Days ROE
Percentage Reference: From To In Effect
a ROE at end of Prior Year - % See Line e below --- --- ---b ROE start of Prior Year - % See Line f below --- --- ---c Total days in year: ____d Wtd. Avg. ROE in Prior Year - % ((Line a ROE * Line a days) + (Line b ROE * Line b days)) / Total Days in Year
Commission Decisions approving ROE:Reference:
e End of Prior Year ---f Beginning of Prior Year ---
Percentage Reference:
g Wtd. Cost of Long Term Debt - % 1-Base TRR L 51h Wtd.Cost of Preferred Stock - % 1-Base TRR L 52i Wtd.Cost of Common Stock - % 1-Base TRR L 47 * Line dj Cost of Capital Rate - % Sum of Lines g to i
Calculation of Equity Rate of Return Including Common and Preferred Stock:
Percentage Reference:
k - % Sum of Lines h to i
4-TUTRR
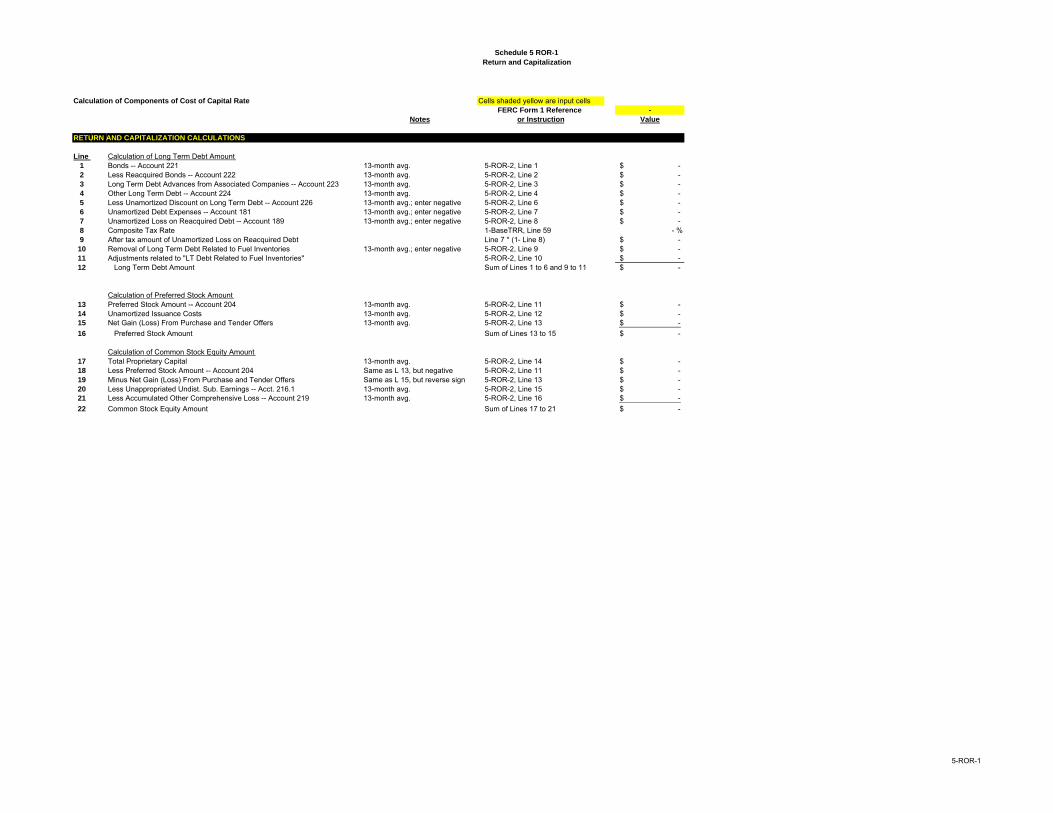
Schedule 5 ROR-1
Return and Capitalization
Calculation of Components of Cost of Capital Rate Cells shaded yellow are input cellsFERC Form 1 Reference -
Notes or Instruction Value
RETURN AND CAPITALIZATION CALCULATIONS
Line Calculation of Long Term Debt Amount1 Bonds -- Account 221 13-month avg. 5-ROR-2, Line 1 -$ 2 Less Reacquired Bonds -- Account 222 13-month avg. 5-ROR-2, Line 2 -$ 3 Long Term Debt Advances from Associated Companies -- Account 223 13-month avg. 5-ROR-2, Line 3 -$ 4 Other Long Term Debt -- Account 224 13-month avg. 5-ROR-2, Line 4 -$ 5 Less Unamortized Discount on Long Term Debt -- Account 226 13-month avg.; enter negative 5-ROR-2, Line 6 -$ 6 Unamortized Debt Expenses -- Account 181 13-month avg.; enter negative 5-ROR-2, Line 7 -$ 7 Unamortized Loss on Reacquired Debt -- Account 189 13-month avg.; enter negative 5-ROR-2, Line 8 -$ 8 Composite Tax Rate 1-BaseTRR, Line 59 - %9 After tax amount of Unamortized Loss on Reacquired Debt Line 7 * (1- Line 8) -$
10 Removal of Long Term Debt Related to Fuel Inventories 13-month avg.; enter negative 5-ROR-2, Line 9 -$ 11 Adjustments related to "LT Debt Related to Fuel Inventories" 5-ROR-2, Line 10 -$ 12 Long Term Debt Amount Sum of Lines 1 to 6 and 9 to 11 -$
Calculation of Preferred Stock Amount13 Preferred Stock Amount -- Account 204 13-month avg. 5-ROR-2, Line 11 -$ 14 Unamortized Issuance Costs 13-month avg. 5-ROR-2, Line 12 -$ 15 Net Gain (Loss) From Purchase and Tender Offers 13-month avg. 5-ROR-2, Line 13 -$
16 Preferred Stock Amount Sum of Lines 13 to 15 -$
Calculation of Common Stock Equity Amount17 Total Proprietary Capital 13-month avg. 5-ROR-2, Line 14 -$ 18 Less Preferred Stock Amount -- Account 204 Same as L 13, but negative 5-ROR-2, Line 11 -$ 19 Minus Net Gain (Loss) From Purchase and Tender Offers Same as L 15, but reverse sign 5-ROR-2, Line 13 -$ 20 Less Unappropriated Undist. Sub. Earnings -- Acct. 216.1 13-month avg. 5-ROR-2, Line 15 -$ 21 Less Accumulated Other Comprehensive Loss -- Account 219 13-month avg. 5-ROR-2, Line 16 -$
22 Common Stock Equity Amount Sum of Lines 17 to 21 -$
5-ROR-1
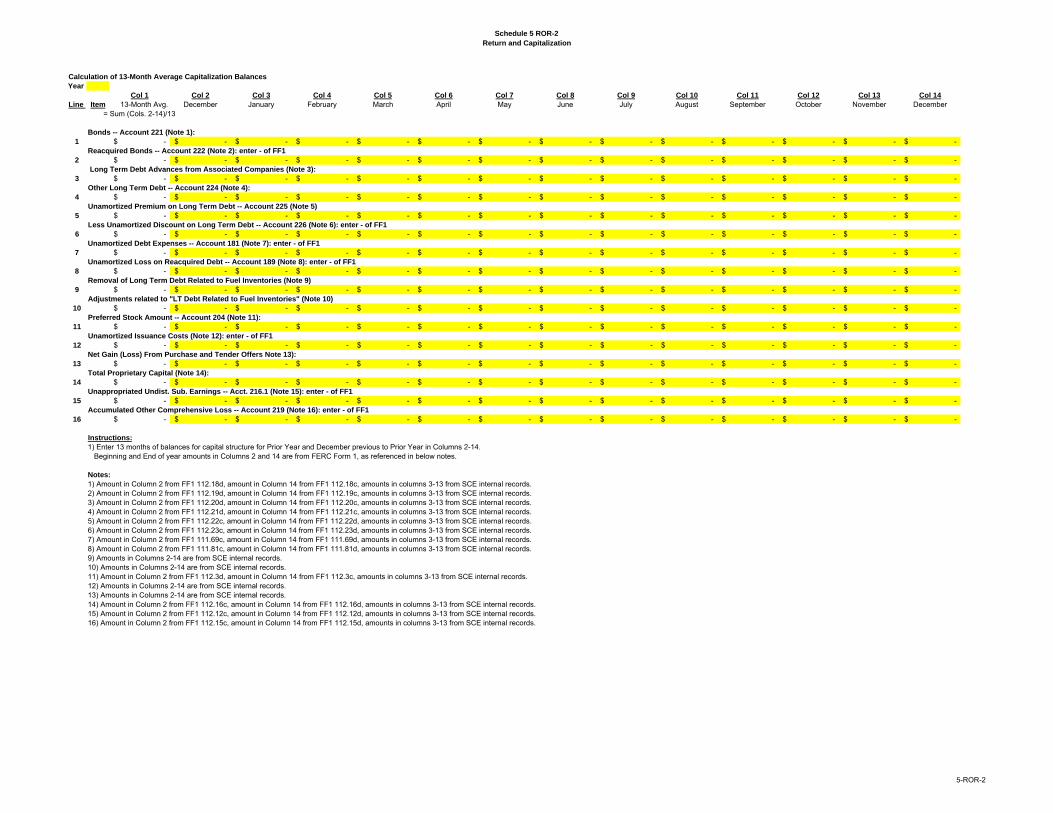
Schedule 5 ROR-2
Return and Capitalization
Calculation of 13-Month Average Capitalization Balances
Year
Col 1 Col 2 Col 3 Col 4 Col 5 Col 6 Col 7 Col 8 Col 9 Col 10 Col 11 Col 12 Col 13 Col 14
Line Item 13-Month Avg. December January February March April May June July August September October November December= Sum (Cols. 2-14)/13
Bonds -- Account 221 (Note 1):
1 -$ -$ -$ -$ -$ -$ -$ -$ -$ -$ -$ -$ -$ -$ Reacquired Bonds -- Account 222 (Note 2): enter - of FF1
2 -$ -$ -$ -$ -$ -$ -$ -$ -$ -$ -$ -$ -$ -$ Long Term Debt Advances from Associated Companies (Note 3):
3 -$ -$ -$ -$ -$ -$ -$ -$ -$ -$ -$ -$ -$ -$ Other Long Term Debt -- Account 224 (Note 4):
4 -$ -$ -$ -$ -$ -$ -$ -$ -$ -$ -$ -$ -$ -$ Unamortized Premium on Long Term Debt -- Account 225 (Note 5)
5 -$ -$ -$ -$ -$ -$ -$ -$ -$ -$ -$ -$ -$ -$ Less Unamortized Discount on Long Term Debt -- Account 226 (Note 6): enter - of FF1
6 -$ -$ -$ -$ -$ -$ -$ -$ -$ -$ -$ -$ -$ -$ Unamortized Debt Expenses -- Account 181 (Note 7): enter - of FF1
7 -$ -$ -$ -$ -$ -$ -$ -$ -$ -$ -$ -$ -$ -$ Unamortized Loss on Reacquired Debt -- Account 189 (Note 8): enter - of FF1
8 -$ -$ -$ -$ -$ -$ -$ -$ -$ -$ -$ -$ -$ -$ Removal of Long Term Debt Related to Fuel Inventories (Note 9)
9 -$ -$ -$ -$ -$ -$ -$ -$ -$ -$ -$ -$ -$ -$ Adjustments related to "LT Debt Related to Fuel Inventories" (Note 10)
10 -$ -$ -$ -$ -$ -$ -$ -$ -$ -$ -$ -$ -$ -$ Preferred Stock Amount -- Account 204 (Note 11):
11 -$ -$ -$ -$ -$ -$ -$ -$ -$ -$ -$ -$ -$ -$ Unamortized Issuance Costs (Note 12): enter - of FF1
12 -$ -$ -$ -$ -$ -$ -$ -$ -$ -$ -$ -$ -$ -$ Net Gain (Loss) From Purchase and Tender Offers Note 13):
13 -$ -$ -$ -$ -$ -$ -$ -$ -$ -$ -$ -$ -$ -$ Total Proprietary Capital (Note 14):
14 -$ -$ -$ -$ -$ -$ -$ -$ -$ -$ -$ -$ -$ -$ Unappropriated Undist. Sub. Earnings -- Acct. 216.1 (Note 15): enter - of FF1
15 -$ -$ -$ -$ -$ -$ -$ -$ -$ -$ -$ -$ -$ -$ Accumulated Other Comprehensive Loss -- Account 219 (Note 16): enter - of FF1
16 -$ -$ -$ -$ -$ -$ -$ -$ -$ -$ -$ -$ -$ -$
Instructions:
1) Enter 13 months of balances for capital structure for Prior Year and December previous to Prior Year in Columns 2-14. Beginning and End of year amounts in Columns 2 and 14 are from FERC Form 1, as referenced in below notes.
Notes:
1) Amount in Column 2 from FF1 112.18d, amount in Column 14 from FF1 112.18c, amounts in columns 3-13 from SCE internal records. 2) Amount in Column 2 from FF1 112.19d, amount in Column 14 from FF1 112.19c, amounts in columns 3-13 from SCE internal records. 3) Amount in Column 2 from FF1 112.20d, amount in Column 14 from FF1 112.20c, amounts in columns 3-13 from SCE internal records. 4) Amount in Column 2 from FF1 112.21d, amount in Column 14 from FF1 112.21c, amounts in columns 3-13 from SCE internal records. 5) Amount in Column 2 from FF1 112.22c, amount in Column 14 from FF1 112.22d, amounts in columns 3-13 from SCE internal records. 6) Amount in Column 2 from FF1 112.23c, amount in Column 14 from FF1 112.23d, amounts in columns 3-13 from SCE internal records. 7) Amount in Column 2 from FF1 111.69c, amount in Column 14 from FF1 111.69d, amounts in columns 3-13 from SCE internal records. 8) Amount in Column 2 from FF1 111.81c, amount in Column 14 from FF1 111.81d, amounts in columns 3-13 from SCE internal records. 9) Amounts in Columns 2-14 are from SCE internal records.10) Amounts in Columns 2-14 are from SCE internal records.11) Amount in Column 2 from FF1 112.3d, amount in Column 14 from FF1 112.3c, amounts in columns 3-13 from SCE internal records. 12) Amounts in Columns 2-14 are from SCE internal records.13) Amounts in Columns 2-14 are from SCE internal records.14) Amount in Column 2 from FF1 112.16c, amount in Column 14 from FF1 112.16d, amounts in columns 3-13 from SCE internal records. 15) Amount in Column 2 from FF1 112.12c, amount in Column 14 from FF1 112.12d, amounts in columns 3-13 from SCE internal records. 16) Amount in Column 2 from FF1 112.15c, amount in Column 14 from FF1 112.15d, amounts in columns 3-13 from SCE internal records.
5-ROR-2
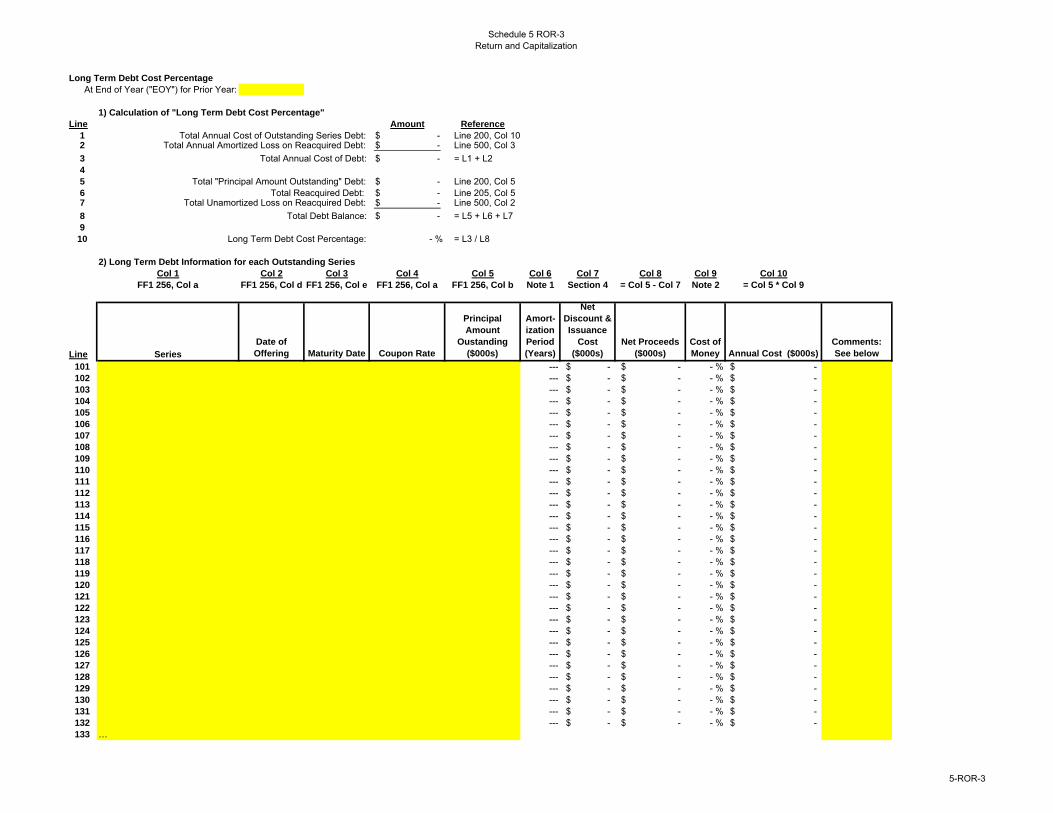
Schedule 5 ROR-3Return and Capitalization
Long Term Debt Cost Percentage
At End of Year ("EOY") for Prior Year:
1) Calculation of "Long Term Debt Cost Percentage"
Line Amount Reference
1 Total Annual Cost of Outstanding Series Debt: -$ Line 200, Col 102 Total Annual Amortized Loss on Reacquired Debt: -$ Line 500, Col 3
3 Total Annual Cost of Debt: -$ = L1 + L24
5 Total "Principal Amount Outstanding" Debt: -$ Line 200, Col 56 Total Reacquired Debt: -$ Line 205, Col 57 Total Unamortized Loss on Reacquired Debt: -$ Line 500, Col 2
8 Total Debt Balance: -$ = L5 + L6 + L79
10 Long Term Debt Cost Percentage: - % = L3 / L8
2) Long Term Debt Information for each Outstanding Series
Col 1 Col 2 Col 3 Col 4 Col 5 Col 6 Col 7 Col 8 Col 9 Col 10
FF1 256, Col a FF1 256, Col d FF1 256, Col e FF1 256, Col a FF1 256, Col b Note 1 Section 4 = Col 5 - Col 7 Note 2 = Col 5 * Col 9
Line Series
Date of
Offering Maturity Date Coupon Rate
Principal
Amount
Oustanding
($000s)
Amort-
ization
Period
(Years)
Net
Discount &
Issuance
Cost
($000s)
Net Proceeds
($000s)
Cost of
Money Annual Cost ($000s)
Comments:
See below
101 --- -$ -$ - % -$ 102 --- -$ -$ - % -$ 103 --- -$ -$ - % -$ 104 --- -$ -$ - % -$ 105 --- -$ -$ - % -$ 106 --- -$ -$ - % -$ 107 --- -$ -$ - % -$ 108 --- -$ -$ - % -$ 109 --- -$ -$ - % -$ 110 --- -$ -$ - % -$ 111 --- -$ -$ - % -$ 112 --- -$ -$ - % -$ 113 --- -$ -$ - % -$ 114 --- -$ -$ - % -$ 115 --- -$ -$ - % -$ 116 --- -$ -$ - % -$ 117 --- -$ -$ - % -$ 118 --- -$ -$ - % -$ 119 --- -$ -$ - % -$ 120 --- -$ -$ - % -$ 121 --- -$ -$ - % -$ 122 --- -$ -$ - % -$ 123 --- -$ -$ - % -$ 124 --- -$ -$ - % -$ 125 --- -$ -$ - % -$ 126 --- -$ -$ - % -$ 127 --- -$ -$ - % -$ 128 --- -$ -$ - % -$ 129 --- -$ -$ - % -$ 130 --- -$ -$ - % -$ 131 --- -$ -$ - % -$ 132 --- -$ -$ - % -$ 133 …
5-ROR-3

Schedule 5 ROR-3Return and Capitalization
Comments for Section 2 "Long Term Debt Information for each Outstanding Series":
Comment #: Comment
…
200 Total Principal Amount Outstanding (sum of above * 1,000): -$ Total Annual Cost (sum of above * 1,000): -$
3) Long Term Debt Information for each Reacquired Series
Col 1 Col 2 Col 3 Col 4 Col 5
Series
Date of
Offering Maturity Date Coupon Rate
Principal
Amount ($000s)
201
202
203
204 …
205 Total Principal Amount (sum of above * 1,000): -$
Comments for Section 3 "Long Term Debt Information for each Reacquired Series":
Comment #: Comment
Comment #
5-ROR-3

Schedule 5 ROR-3Return and Capitalization
4) Debt Issuance Cost and Discount Details for each Outstanding Series
Col 1 Col 2 Col 3
Line Series
Unamortized
Debt Issuance
Cost (Dec of
Prior Year)
Total
Unamortized
Debt
Discounts
(Dec of PY)
301
302
303
304
305
306
307
308
309
310
311
312
313
314
315
316
317
318
319
320
321
322
323
324
325
326
327
328
329
330
331
332
333
334 …
5-ROR-3
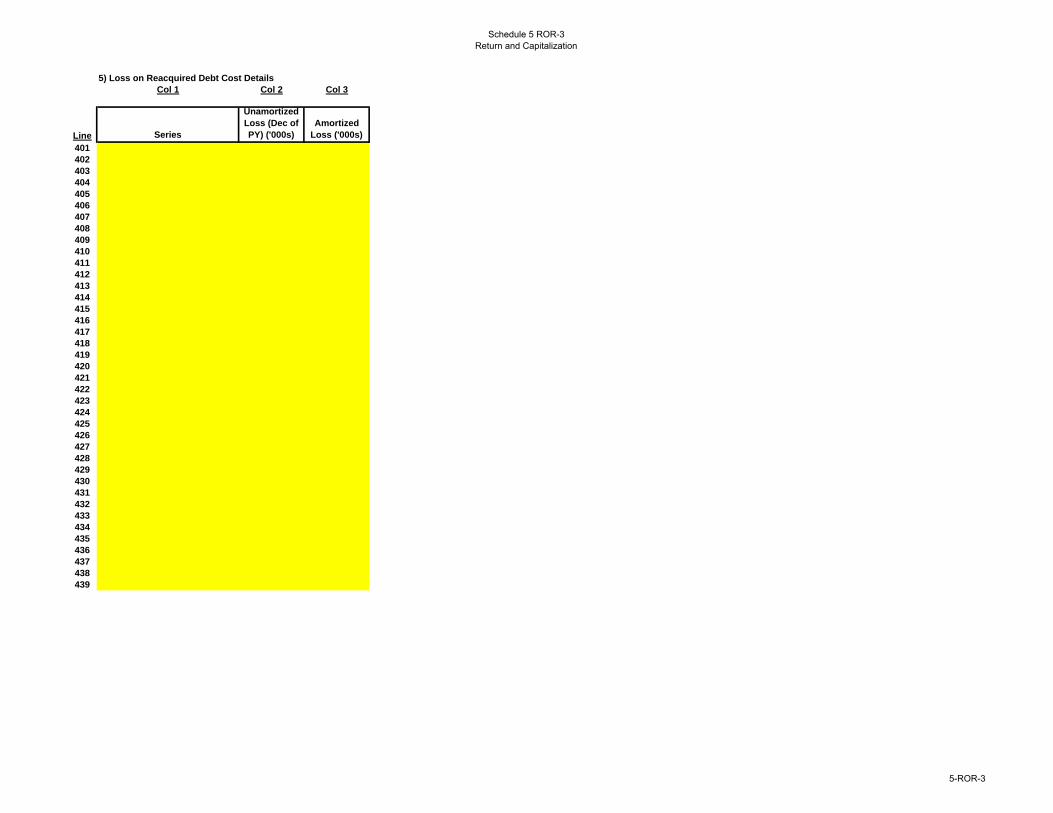
Schedule 5 ROR-3Return and Capitalization
5) Loss on Reacquired Debt Cost Details
Col 1 Col 2 Col 3
Line Series
Unamortized
Loss (Dec of
PY) ('000s)
Amortized
Loss ('000s)
401
402
403
404
405
406
407
408
409
410
411
412
413
414
415
416
417
418
419
420
421
422
423
424
425
426
427
428
429
430
431
432
433
434
435
436
437
438
439
5-ROR-3
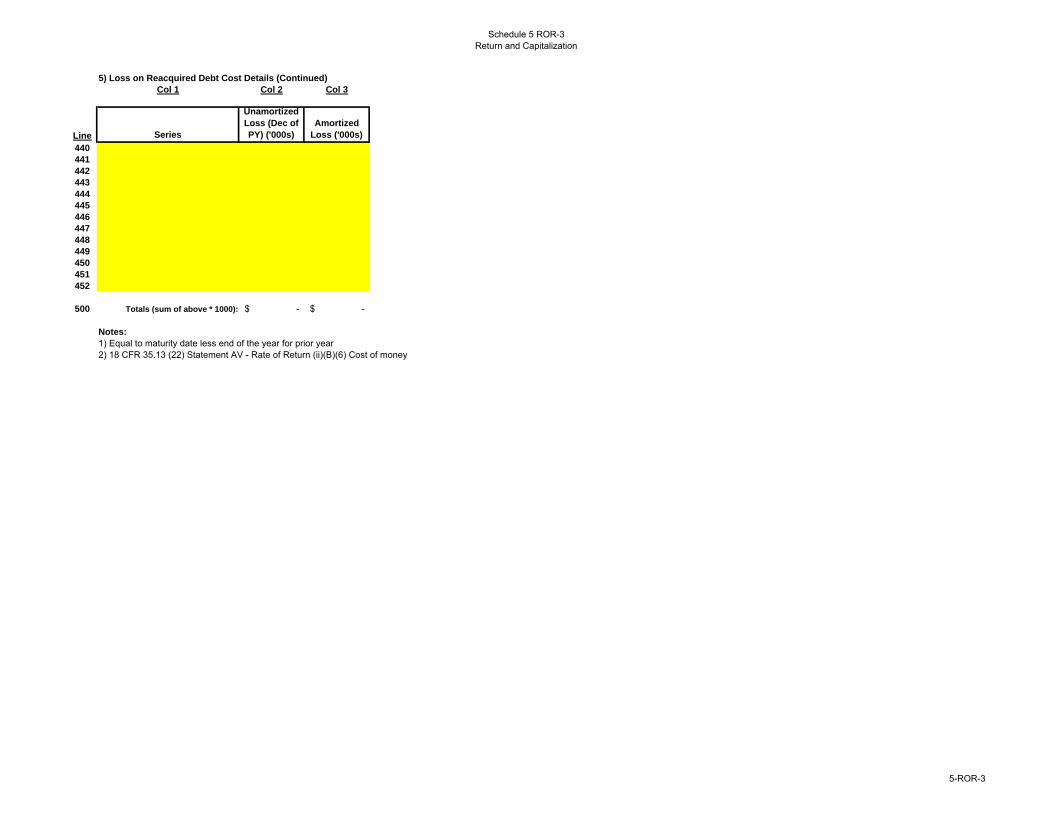
Schedule 5 ROR-3Return and Capitalization
5) Loss on Reacquired Debt Cost Details (Continued)
Col 1 Col 2 Col 3
Line Series
Unamortized
Loss (Dec of
PY) ('000s)
Amortized
Loss ('000s)
440
441
442
443
444
445
446
447
448
449
450
451
452
500 Totals (sum of above * 1000): -$ -$
Notes:
1) Equal to maturity date less end of the year for prior year2) 18 CFR 35.13 (22) Statement AV - Rate of Return (ii)(B)(6) Cost of money
5-ROR-3
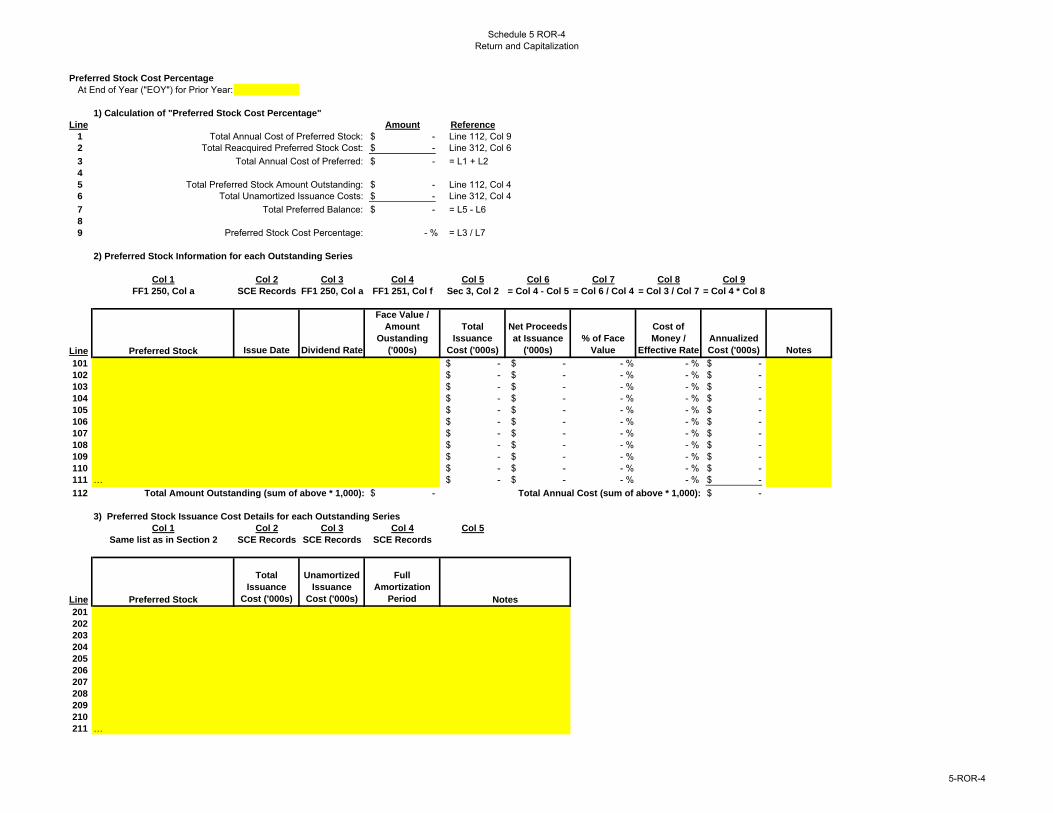
Schedule 5 ROR-4Return and Capitalization
Preferred Stock Cost Percentage
At End of Year ("EOY") for Prior Year:
1) Calculation of "Preferred Stock Cost Percentage"
Line Amount Reference
1 Total Annual Cost of Preferred Stock: -$ Line 112, Col 92 Total Reacquired Preferred Stock Cost: -$ Line 312, Col 6
3 Total Annual Cost of Preferred: -$ = L1 + L24
5 Total Preferred Stock Amount Outstanding: -$ Line 112, Col 46 Total Unamortized Issuance Costs: -$ Line 312, Col 4
7 Total Preferred Balance: -$ = L5 - L68
9 Preferred Stock Cost Percentage: - % = L3 / L7
2) Preferred Stock Information for each Outstanding Series
Col 1 Col 2 Col 3 Col 4 Col 5 Col 6 Col 7 Col 8 Col 9
FF1 250, Col a SCE Records FF1 250, Col a FF1 251, Col f Sec 3, Col 2 = Col 4 - Col 5 = Col 6 / Col 4 = Col 3 / Col 7 = Col 4 * Col 8
Line Preferred Stock Issue Date Dividend Rate
Face Value /
Amount
Oustanding
('000s)
Total
Issuance
Cost ('000s)
Net Proceeds
at Issuance
('000s)
% of Face
Value
Cost of
Money /
Effective Rate
Annualized
Cost ('000s) Notes
101 -$ -$ - % - % -$ 102 -$ -$ - % - % -$ 103 -$ -$ - % - % -$ 104 -$ -$ - % - % -$ 105 -$ -$ - % - % -$ 106 -$ -$ - % - % -$ 107 -$ -$ - % - % -$ 108 -$ -$ - % - % -$ 109 -$ -$ - % - % -$ 110 -$ -$ - % - % -$ 111 … -$ -$ - % - % -$
112 Total Amount Outstanding (sum of above * 1,000): -$ Total Annual Cost (sum of above * 1,000): -$
3) Preferred Stock Issuance Cost Details for each Outstanding Series
Col 1 Col 2 Col 3 Col 4 Col 5
Same list as in Section 2 SCE Records SCE Records SCE Records
Line Preferred Stock
Total
Issuance
Cost ('000s)
Unamortized
Issuance
Cost ('000s)
Full
Amortization
Period
201
202
203
204
205
206
207
208
209
210
211 …
Notes
5-ROR-4
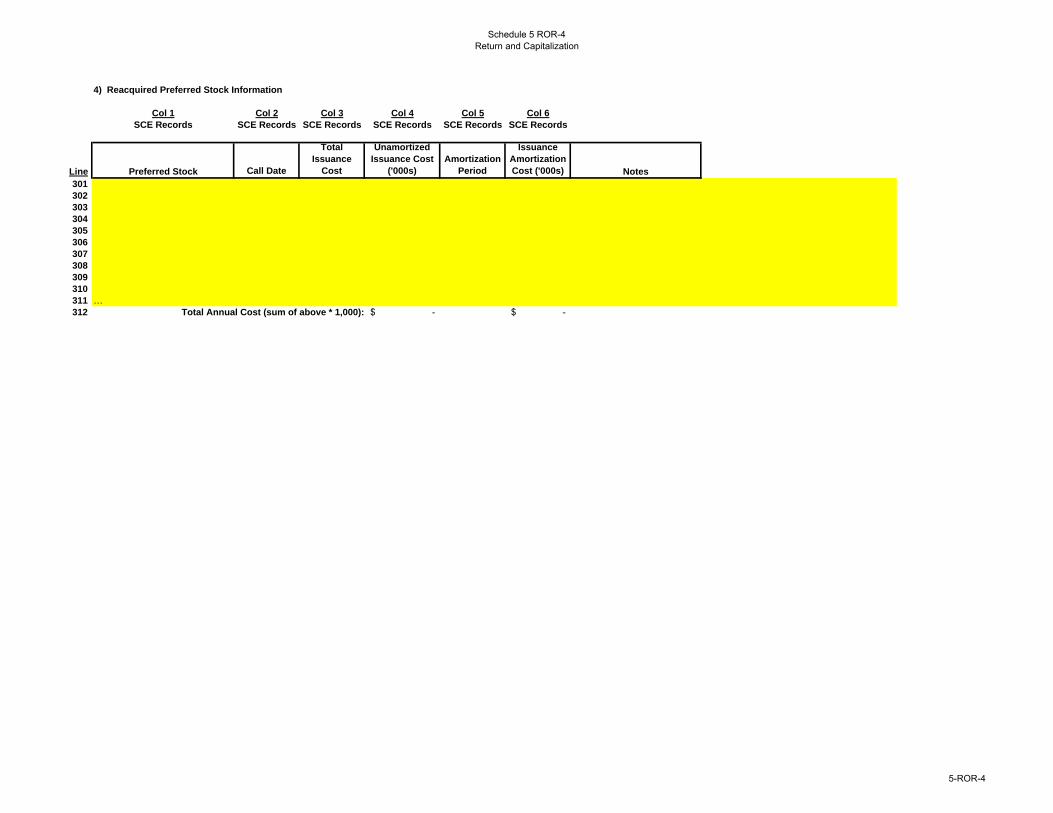
Schedule 5 ROR-4Return and Capitalization
4) Reacquired Preferred Stock Information
Col 1 Col 2 Col 3 Col 4 Col 5 Col 6
SCE Records SCE Records SCE Records SCE Records SCE Records SCE Records
Line Preferred Stock Call Date
Total
Issuance
Cost
Unamortized
Issuance Cost
('000s)
Amortization
Period
Issuance
Amortization
Cost ('000s)
301
302
303
304
305
306
307
308
309
310
311 …312 Total Annual Cost (sum of above * 1,000): -$ -$
Notes
5-ROR-4
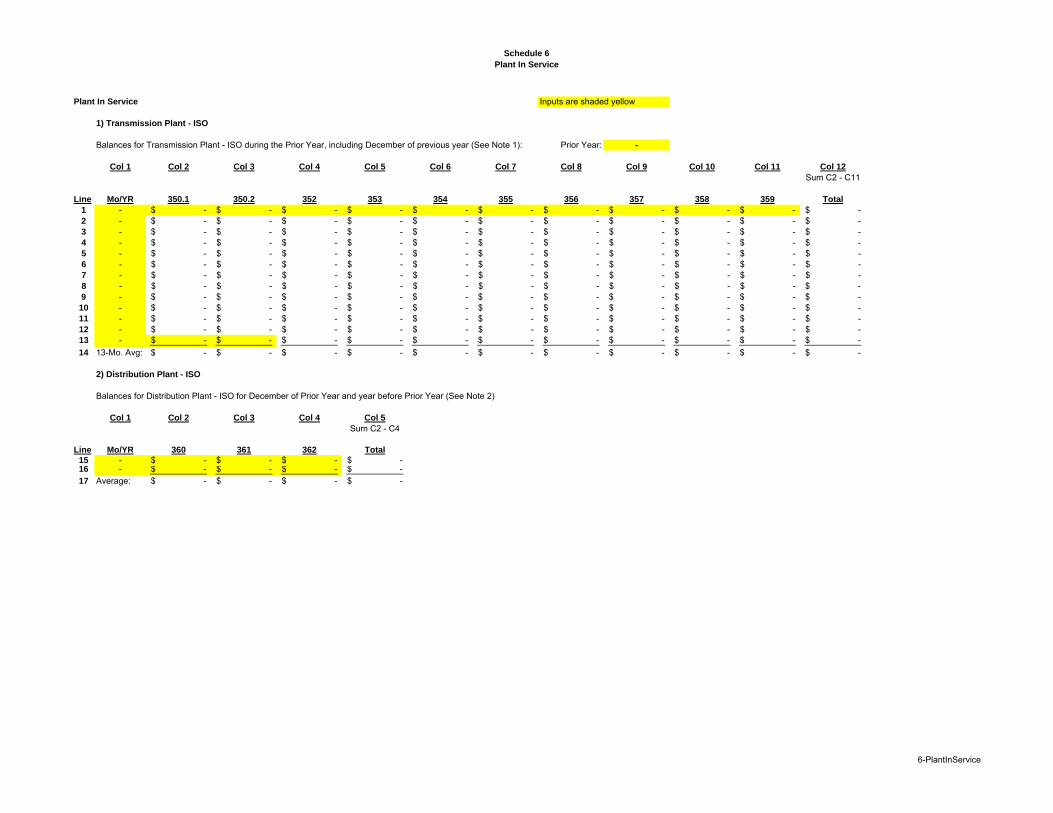
Schedule 6
Plant In Service
Plant In Service Inputs are shaded yellow
1) Transmission Plant - ISO
Balances for Transmission Plant - ISO during the Prior Year, including December of previous year (See Note 1): Prior Year: -
Col 1 Col 2 Col 3 Col 4 Col 5 Col 6 Col 7 Col 8 Col 9 Col 10 Col 11 Col 12
Sum C2 - C11
Line Mo/YR 350.1 350.2 352 353 354 355 356 357 358 359 Total
1 - -$ -$ -$ -$ -$ -$ -$ -$ -$ -$ -$ 2 - -$ -$ -$ -$ -$ -$ -$ -$ -$ -$ -$ 3 - -$ -$ -$ -$ -$ -$ -$ -$ -$ -$ -$ 4 - -$ -$ -$ -$ -$ -$ -$ -$ -$ -$ -$ 5 - -$ -$ -$ -$ -$ -$ -$ -$ -$ -$ -$ 6 - -$ -$ -$ -$ -$ -$ -$ -$ -$ -$ -$ 7 - -$ -$ -$ -$ -$ -$ -$ -$ -$ -$ -$ 8 - -$ -$ -$ -$ -$ -$ -$ -$ -$ -$ -$ 9 - -$ -$ -$ -$ -$ -$ -$ -$ -$ -$ -$ 10 - -$ -$ -$ -$ -$ -$ -$ -$ -$ -$ -$ 11 - -$ -$ -$ -$ -$ -$ -$ -$ -$ -$ -$ 12 - -$ -$ -$ -$ -$ -$ -$ -$ -$ -$ -$ 13 - -$ -$ -$ -$ -$ -$ -$ -$ -$ -$ -$
14 13-Mo. Avg: -$ -$ -$ -$ -$ -$ -$ -$ -$ -$ -$
2) Distribution Plant - ISO
Balances for Distribution Plant - ISO for December of Prior Year and year before Prior Year (See Note 2)
Col 1 Col 2 Col 3 Col 4 Col 5
Sum C2 - C4
Line Mo/YR 360 361 362 Total
15 - -$ -$ -$ -$ 16 - -$ -$ -$ -$ 17 Average: -$ -$ -$ -$
6-PlantInService
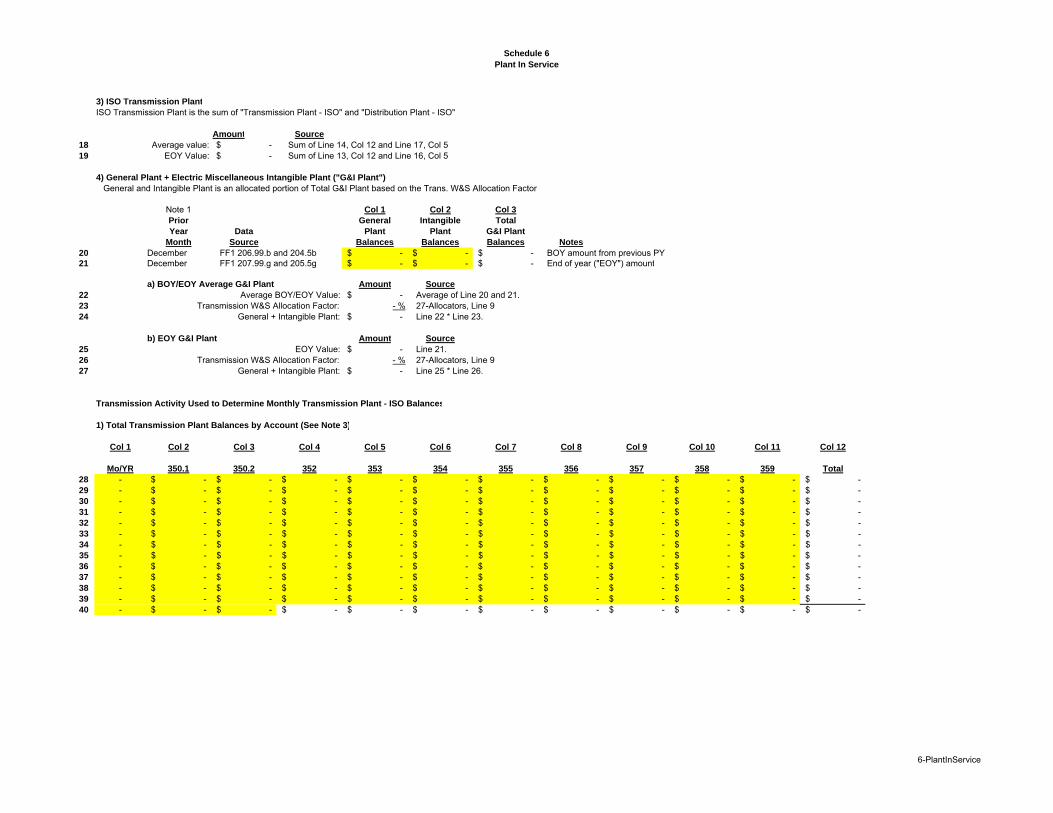
Schedule 6
Plant In Service
3) ISO Transmission Plant
ISO Transmission Plant is the sum of "Transmission Plant - ISO" and "Distribution Plant - ISO"
Amount Source
18 Average value: -$ Sum of Line 14, Col 12 and Line 17, Col 519 EOY Value: -$ Sum of Line 13, Col 12 and Line 16, Col 5
4) General Plant + Electric Miscellaneous Intangible Plant ("G&I Plant")
General and Intangible Plant is an allocated portion of Total G&I Plant based on the Trans. W&S Allocation Factor
Note 1 Col 1 Col 2 Col 3
Prior General Intangible Total
Year Data Plant Plant G&I Plant
Month Source Balances Balances Balances Notes
20 December FF1 206.99.b and 204.5b -$ -$ -$ BOY amount from previous PY21 December FF1 207.99.g and 205.5g -$ -$ -$ End of year ("EOY") amount
a) BOY/EOY Average G&I Plant Amount Source
22 Average BOY/EOY Value: -$ Average of Line 20 and 21.23 Transmission W&S Allocation Factor: - % 27-Allocators, Line 924 General + Intangible Plant: -$ Line 22 * Line 23.
b) EOY G&I Plant Amount Source
25 EOY Value: -$ Line 21.26 Transmission W&S Allocation Factor: - % 27-Allocators, Line 927 General + Intangible Plant: -$ Line 25 * Line 26.
Transmission Activity Used to Determine Monthly Transmission Plant - ISO Balances
1) Total Transmission Plant Balances by Account (See Note 3)
Col 1 Col 2 Col 3 Col 4 Col 5 Col 6 Col 7 Col 8 Col 9 Col 10 Col 11 Col 12
Mo/YR 350.1 350.2 352 353 354 355 356 357 358 359 Total
28 - -$ -$ -$ -$ -$ -$ -$ -$ -$ -$ -$ 29 - -$ -$ -$ -$ -$ -$ -$ -$ -$ -$ -$ 30 - -$ -$ -$ -$ -$ -$ -$ -$ -$ -$ -$ 31 - -$ -$ -$ -$ -$ -$ -$ -$ -$ -$ -$ 32 - -$ -$ -$ -$ -$ -$ -$ -$ -$ -$ -$ 33 - -$ -$ -$ -$ -$ -$ -$ -$ -$ -$ -$ 34 - -$ -$ -$ -$ -$ -$ -$ -$ -$ -$ -$ 35 - -$ -$ -$ -$ -$ -$ -$ -$ -$ -$ -$ 36 - -$ -$ -$ -$ -$ -$ -$ -$ -$ -$ -$ 37 - -$ -$ -$ -$ -$ -$ -$ -$ -$ -$ -$ 38 - -$ -$ -$ -$ -$ -$ -$ -$ -$ -$ -$ 39 - -$ -$ -$ -$ -$ -$ -$ -$ -$ -$ -$ 40 - -$ -$ -$ -$ -$ -$ -$ -$ -$ -$ -$
6-PlantInService
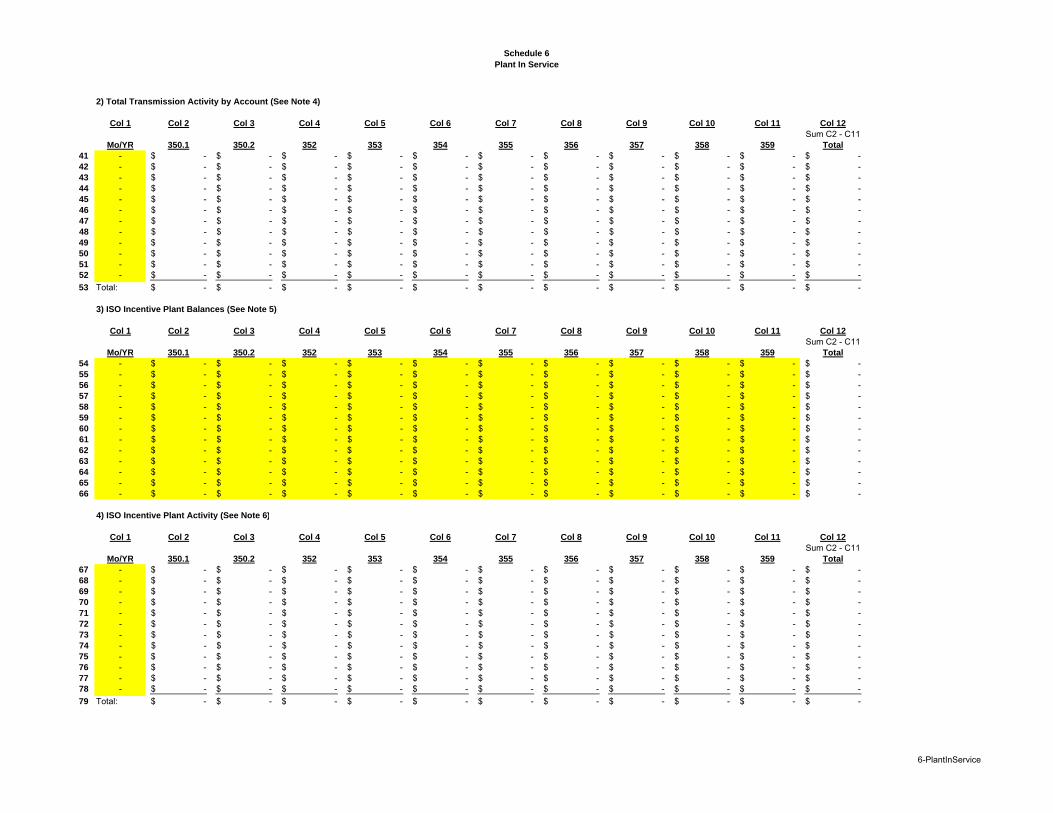
Schedule 6
Plant In Service
2) Total Transmission Activity by Account (See Note 4):
Col 1 Col 2 Col 3 Col 4 Col 5 Col 6 Col 7 Col 8 Col 9 Col 10 Col 11 Col 12
Sum C2 - C11Mo/YR 350.1 350.2 352 353 354 355 356 357 358 359 Total
41 - -$ -$ -$ -$ -$ -$ -$ -$ -$ -$ -$ 42 - -$ -$ -$ -$ -$ -$ -$ -$ -$ -$ -$ 43 - -$ -$ -$ -$ -$ -$ -$ -$ -$ -$ -$ 44 - -$ -$ -$ -$ -$ -$ -$ -$ -$ -$ -$ 45 - -$ -$ -$ -$ -$ -$ -$ -$ -$ -$ -$ 46 - -$ -$ -$ -$ -$ -$ -$ -$ -$ -$ -$ 47 - -$ -$ -$ -$ -$ -$ -$ -$ -$ -$ -$ 48 - -$ -$ -$ -$ -$ -$ -$ -$ -$ -$ -$ 49 - -$ -$ -$ -$ -$ -$ -$ -$ -$ -$ -$ 50 - -$ -$ -$ -$ -$ -$ -$ -$ -$ -$ -$ 51 - -$ -$ -$ -$ -$ -$ -$ -$ -$ -$ -$ 52 - -$ -$ -$ -$ -$ -$ -$ -$ -$ -$ -$
53 Total: -$ -$ -$ -$ -$ -$ -$ -$ -$ -$ -$
3) ISO Incentive Plant Balances (See Note 5)
Col 1 Col 2 Col 3 Col 4 Col 5 Col 6 Col 7 Col 8 Col 9 Col 10 Col 11 Col 12
Sum C2 - C11Mo/YR 350.1 350.2 352 353 354 355 356 357 358 359 Total
54 - -$ -$ -$ -$ -$ -$ -$ -$ -$ -$ -$ 55 - -$ -$ -$ -$ -$ -$ -$ -$ -$ -$ -$ 56 - -$ -$ -$ -$ -$ -$ -$ -$ -$ -$ -$ 57 - -$ -$ -$ -$ -$ -$ -$ -$ -$ -$ -$ 58 - -$ -$ -$ -$ -$ -$ -$ -$ -$ -$ -$ 59 - -$ -$ -$ -$ -$ -$ -$ -$ -$ -$ -$ 60 - -$ -$ -$ -$ -$ -$ -$ -$ -$ -$ -$ 61 - -$ -$ -$ -$ -$ -$ -$ -$ -$ -$ -$ 62 - -$ -$ -$ -$ -$ -$ -$ -$ -$ -$ -$ 63 - -$ -$ -$ -$ -$ -$ -$ -$ -$ -$ -$ 64 - -$ -$ -$ -$ -$ -$ -$ -$ -$ -$ -$ 65 - -$ -$ -$ -$ -$ -$ -$ -$ -$ -$ -$ 66 - -$ -$ -$ -$ -$ -$ -$ -$ -$ -$ -$
4) ISO Incentive Plant Activity (See Note 6)
Col 1 Col 2 Col 3 Col 4 Col 5 Col 6 Col 7 Col 8 Col 9 Col 10 Col 11 Col 12
Sum C2 - C11Mo/YR 350.1 350.2 352 353 354 355 356 357 358 359 Total
67 - -$ -$ -$ -$ -$ -$ -$ -$ -$ -$ -$ 68 - -$ -$ -$ -$ -$ -$ -$ -$ -$ -$ -$ 69 - -$ -$ -$ -$ -$ -$ -$ -$ -$ -$ -$ 70 - -$ -$ -$ -$ -$ -$ -$ -$ -$ -$ -$ 71 - -$ -$ -$ -$ -$ -$ -$ -$ -$ -$ -$ 72 - -$ -$ -$ -$ -$ -$ -$ -$ -$ -$ -$ 73 - -$ -$ -$ -$ -$ -$ -$ -$ -$ -$ -$ 74 - -$ -$ -$ -$ -$ -$ -$ -$ -$ -$ -$ 75 - -$ -$ -$ -$ -$ -$ -$ -$ -$ -$ -$ 76 - -$ -$ -$ -$ -$ -$ -$ -$ -$ -$ -$ 77 - -$ -$ -$ -$ -$ -$ -$ -$ -$ -$ -$ 78 - -$ -$ -$ -$ -$ -$ -$ -$ -$ -$ -$
79 Total: -$ -$ -$ -$ -$ -$ -$ -$ -$ -$ -$
6-PlantInService
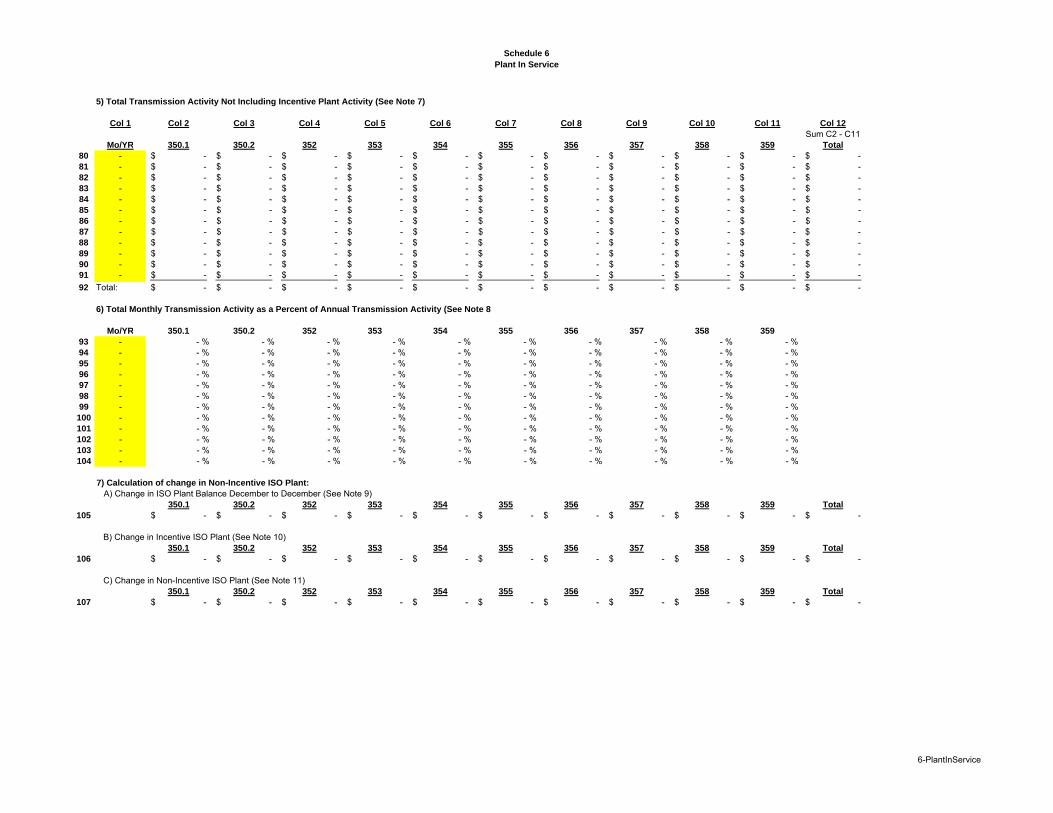
Schedule 6
Plant In Service
5) Total Transmission Activity Not Including Incentive Plant Activity (See Note 7)
Col 1 Col 2 Col 3 Col 4 Col 5 Col 6 Col 7 Col 8 Col 9 Col 10 Col 11 Col 12
Sum C2 - C11Mo/YR 350.1 350.2 352 353 354 355 356 357 358 359 Total
80 - -$ -$ -$ -$ -$ -$ -$ -$ -$ -$ -$ 81 - -$ -$ -$ -$ -$ -$ -$ -$ -$ -$ -$ 82 - -$ -$ -$ -$ -$ -$ -$ -$ -$ -$ -$ 83 - -$ -$ -$ -$ -$ -$ -$ -$ -$ -$ -$ 84 - -$ -$ -$ -$ -$ -$ -$ -$ -$ -$ -$ 85 - -$ -$ -$ -$ -$ -$ -$ -$ -$ -$ -$ 86 - -$ -$ -$ -$ -$ -$ -$ -$ -$ -$ -$ 87 - -$ -$ -$ -$ -$ -$ -$ -$ -$ -$ -$ 88 - -$ -$ -$ -$ -$ -$ -$ -$ -$ -$ -$ 89 - -$ -$ -$ -$ -$ -$ -$ -$ -$ -$ -$ 90 - -$ -$ -$ -$ -$ -$ -$ -$ -$ -$ -$ 91 - -$ -$ -$ -$ -$ -$ -$ -$ -$ -$ -$
92 Total: -$ -$ -$ -$ -$ -$ -$ -$ -$ -$ -$
6) Total Monthly Transmission Activity as a Percent of Annual Transmission Activity (See Note 8
Mo/YR 350.1 350.2 352 353 354 355 356 357 358 359
93 - - % - % - % - % - % - % - % - % - % - %94 - - % - % - % - % - % - % - % - % - % - %95 - - % - % - % - % - % - % - % - % - % - %96 - - % - % - % - % - % - % - % - % - % - %97 - - % - % - % - % - % - % - % - % - % - %98 - - % - % - % - % - % - % - % - % - % - %99 - - % - % - % - % - % - % - % - % - % - %100 - - % - % - % - % - % - % - % - % - % - %101 - - % - % - % - % - % - % - % - % - % - %102 - - % - % - % - % - % - % - % - % - % - %103 - - % - % - % - % - % - % - % - % - % - %104 - - % - % - % - % - % - % - % - % - % - %
7) Calculation of change in Non-Incentive ISO Plant:
A) Change in ISO Plant Balance December to December (See Note 9)350.1 350.2 352 353 354 355 356 357 358 359 Total
105 -$ -$ -$ -$ -$ -$ -$ -$ -$ -$ -$
B) Change in Incentive ISO Plant (See Note 10)350.1 350.2 352 353 354 355 356 357 358 359 Total
106 -$ -$ -$ -$ -$ -$ -$ -$ -$ -$ -$
C) Change in Non-Incentive ISO Plant (See Note 11)350.1 350.2 352 353 354 355 356 357 358 359 Total
107 -$ -$ -$ -$ -$ -$ -$ -$ -$ -$ -$
6-PlantInService
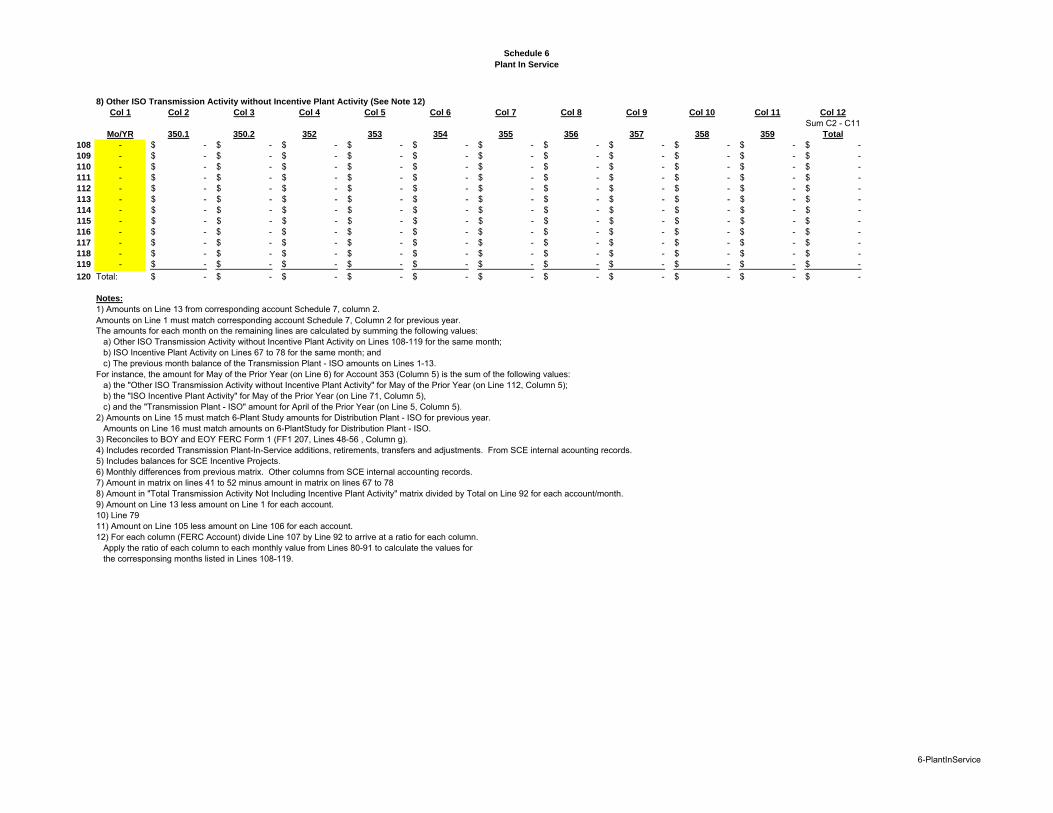
Schedule 6
Plant In Service
8) Other ISO Transmission Activity without Incentive Plant Activity (See Note 12):
Col 1 Col 2 Col 3 Col 4 Col 5 Col 6 Col 7 Col 8 Col 9 Col 10 Col 11 Col 12
Sum C2 - C11Mo/YR 350.1 350.2 352 353 354 355 356 357 358 359 Total
108 - -$ -$ -$ -$ -$ -$ -$ -$ -$ -$ -$ 109 - -$ -$ -$ -$ -$ -$ -$ -$ -$ -$ -$ 110 - -$ -$ -$ -$ -$ -$ -$ -$ -$ -$ -$ 111 - -$ -$ -$ -$ -$ -$ -$ -$ -$ -$ -$ 112 - -$ -$ -$ -$ -$ -$ -$ -$ -$ -$ -$ 113 - -$ -$ -$ -$ -$ -$ -$ -$ -$ -$ -$ 114 - -$ -$ -$ -$ -$ -$ -$ -$ -$ -$ -$ 115 - -$ -$ -$ -$ -$ -$ -$ -$ -$ -$ -$ 116 - -$ -$ -$ -$ -$ -$ -$ -$ -$ -$ -$ 117 - -$ -$ -$ -$ -$ -$ -$ -$ -$ -$ -$ 118 - -$ -$ -$ -$ -$ -$ -$ -$ -$ -$ -$ 119 - -$ -$ -$ -$ -$ -$ -$ -$ -$ -$ -$
120 Total: -$ -$ -$ -$ -$ -$ -$ -$ -$ -$ -$
Notes:
1) Amounts on Line 13 from corresponding account Schedule 7, column 2. Amounts on Line 1 must match corresponding account Schedule 7, Column 2 for previous year.The amounts for each month on the remaining lines are calculated by summing the following values:
a) Other ISO Transmission Activity without Incentive Plant Activity on Lines 108-119 for the same month;b) ISO Incentive Plant Activity on Lines 67 to 78 for the same month; andc) The previous month balance of the Transmission Plant - ISO amounts on Lines 1-13.
For instance, the amount for May of the Prior Year (on Line 6) for Account 353 (Column 5) is the sum of the following values: a) the "Other ISO Transmission Activity without Incentive Plant Activity" for May of the Prior Year (on Line 112, Column 5);b) the "ISO Incentive Plant Activity" for May of the Prior Year (on Line 71, Column 5),c) and the "Transmission Plant - ISO" amount for April of the Prior Year (on Line 5, Column 5).
2) Amounts on Line 15 must match 6-Plant Study amounts for Distribution Plant - ISO for previous year.Amounts on Line 16 must match amounts on 6-PlantStudy for Distribution Plant - ISO.
3) Reconciles to BOY and EOY FERC Form 1 (FF1 207, Lines 48-56 , Column g).4) Includes recorded Transmission Plant-In-Service additions, retirements, transfers and adjustments. From SCE internal acounting records.5) Includes balances for SCE Incentive Projects.6) Monthly differences from previous matrix. Other columns from SCE internal accounting records.7) Amount in matrix on lines 41 to 52 minus amount in matrix on lines 67 to 788) Amount in "Total Transmission Activity Not Including Incentive Plant Activity" matrix divided by Total on Line 92 for each account/month.9) Amount on Line 13 less amount on Line 1 for each account.
10) Line 7911) Amount on Line 105 less amount on Line 106 for each account.12) For each column (FERC Account) divide Line 107 by Line 92 to arrive at a ratio for each column.
Apply the ratio of each column to each monthly value from Lines 80-91 to calculate the values forthe corresponsing months listed in Lines 108-119.
6-PlantInService
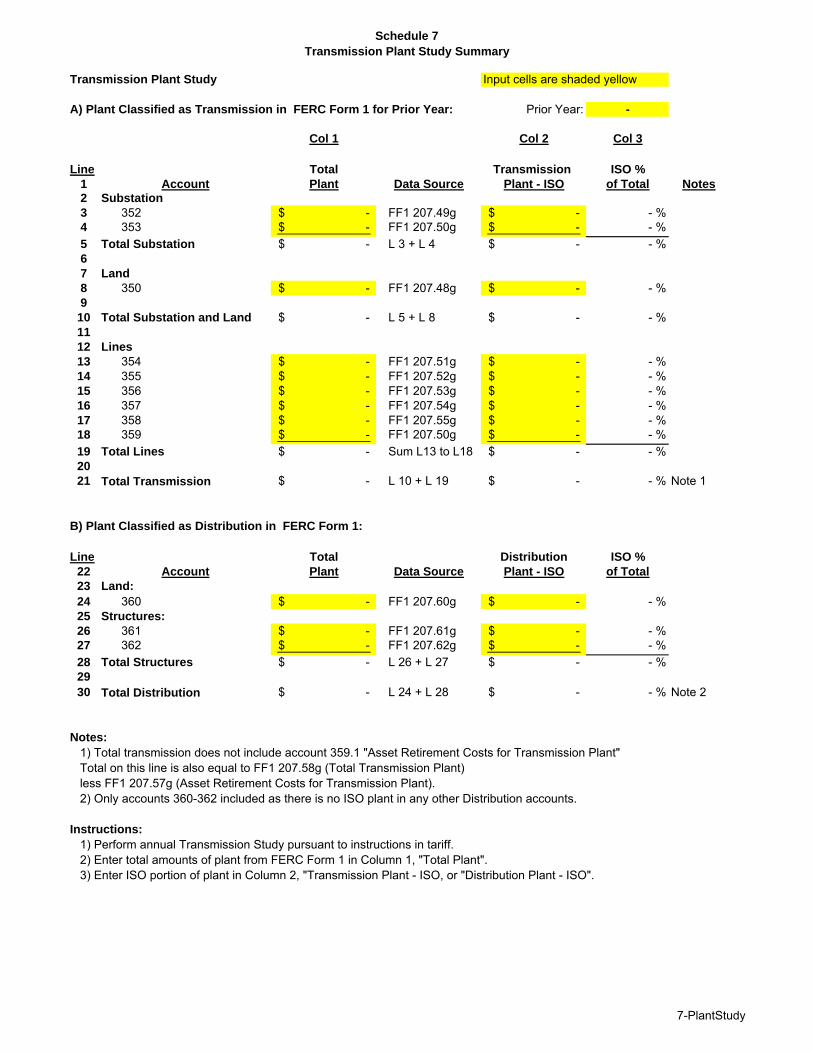
Schedule 7
Transmission Plant Study Summary
Transmission Plant Study Input cells are shaded yellow
A) Plant Classified as Transmission in FERC Form 1 for Prior Year: Prior Year: -
Col 1 Col 2 Col 3
Line Total Transmission ISO %
1 Account Plant Data Source Plant - ISO of Total Notes
2 Substation
3 352 -$ FF1 207.49g -$ - %4 353 -$ FF1 207.50g -$ - %
5 Total Substation -$ L 3 + L 4 -$ - %6
7 Land
8 350 -$ FF1 207.48g -$ - %9
10 Total Substation and Land -$ L 5 + L 8 -$ - %11
12 Lines
13 354 -$ FF1 207.51g -$ - %14 355 -$ FF1 207.52g -$ - %15 356 -$ FF1 207.53g -$ - %16 357 -$ FF1 207.54g -$ - %17 358 -$ FF1 207.55g -$ - %18 359 -$ FF1 207.50g -$ - %
19 Total Lines -$ Sum L13 to L18 -$ - %20
21 Total Transmission -$ L 10 + L 19 -$ - % Note 1
B) Plant Classified as Distribution in FERC Form 1:
Line Total Distribution ISO %
22 Account Plant Data Source Plant - ISO of Total
23 Land:
24 360 -$ FF1 207.60g -$ - %25 Structures:
26 361 -$ FF1 207.61g -$ - %27 362 -$ FF1 207.62g -$ - %
28 Total Structures -$ L 26 + L 27 -$ - %29
30 Total Distribution -$ L 24 + L 28 -$ - % Note 2
Notes:
1) Total transmission does not include account 359.1 "Asset Retirement Costs for Transmission Plant"Total on this line is also equal to FF1 207.58g (Total Transmission Plant)less FF1 207.57g (Asset Retirement Costs for Transmission Plant).2) Only accounts 360-362 included as there is no ISO plant in any other Distribution accounts.
Instructions:
1) Perform annual Transmission Study pursuant to instructions in tariff.2) Enter total amounts of plant from FERC Form 1 in Column 1, "Total Plant".3) Enter ISO portion of plant in Column 2, "Transmission Plant - ISO, or "Distribution Plant - ISO".
7-PlantStudy
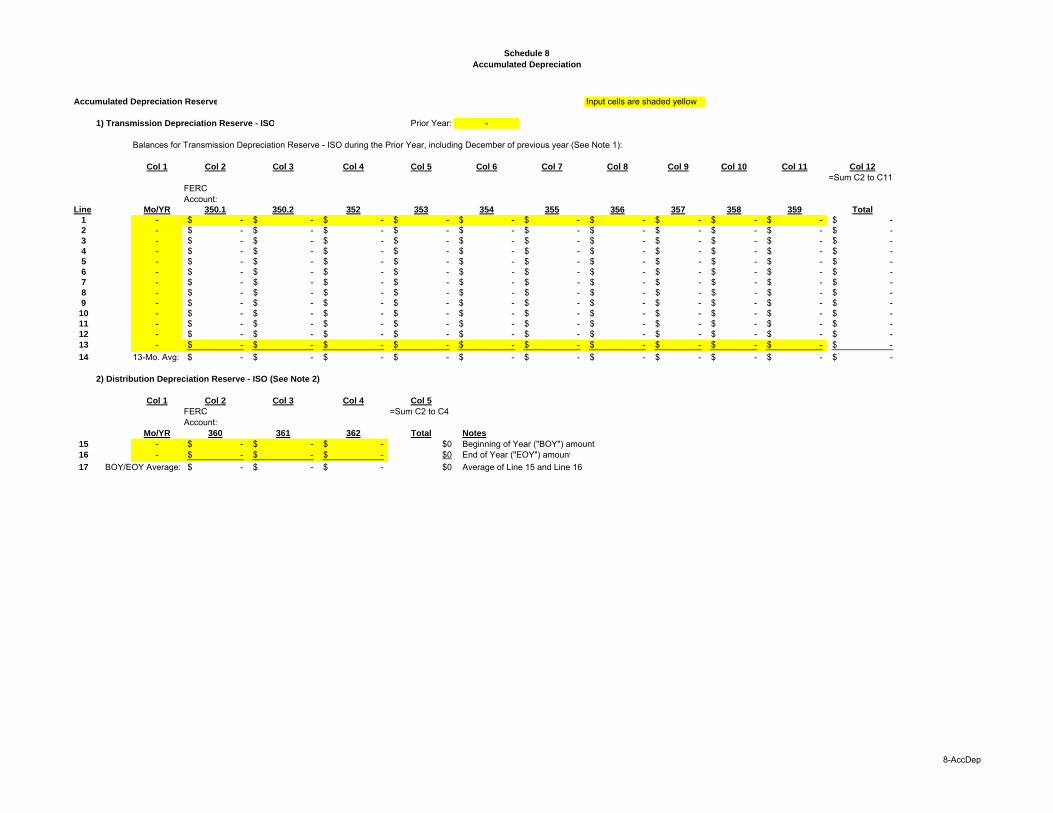
Schedule 8
Accumulated Depreciation
Accumulated Depreciation Reserve Input cells are shaded yellow
1) Transmission Depreciation Reserve - ISO Prior Year: -
Balances for Transmission Depreciation Reserve - ISO during the Prior Year, including December of previous year (See Note 1):
Col 1 Col 2 Col 3 Col 4 Col 5 Col 6 Col 7 Col 8 Col 9 Col 10 Col 11 Col 12
=Sum C2 to C11FERCAccount:
Line Mo/YR 350.1 350.2 352 353 354 355 356 357 358 359 Total
1 - -$ -$ -$ -$ -$ -$ -$ -$ -$ -$ -$ 2 - -$ -$ -$ -$ -$ -$ -$ -$ -$ -$ -$ 3 - -$ -$ -$ -$ -$ -$ -$ -$ -$ -$ -$ 4 - -$ -$ -$ -$ -$ -$ -$ -$ -$ -$ -$ 5 - -$ -$ -$ -$ -$ -$ -$ -$ -$ -$ -$ 6 - -$ -$ -$ -$ -$ -$ -$ -$ -$ -$ -$ 7 - -$ -$ -$ -$ -$ -$ -$ -$ -$ -$ -$ 8 - -$ -$ -$ -$ -$ -$ -$ -$ -$ -$ -$ 9 - -$ -$ -$ -$ -$ -$ -$ -$ -$ -$ -$ 10 - -$ -$ -$ -$ -$ -$ -$ -$ -$ -$ -$ 11 - -$ -$ -$ -$ -$ -$ -$ -$ -$ -$ -$ 12 - -$ -$ -$ -$ -$ -$ -$ -$ -$ -$ -$ 13 - -$ -$ -$ -$ -$ -$ -$ -$ -$ -$ -$
14 13-Mo. Avg: -$ -$ -$ -$ -$ -$ -$ -$ -$ -$ -$
2) Distribution Depreciation Reserve - ISO (See Note 2)
Col 1 Col 2 Col 3 Col 4 Col 5
FERC =Sum C2 to C4Account:
Mo/YR 360 361 362 Total Notes
15 - -$ -$ -$ $0 Beginning of Year ("BOY") amount16 - -$ -$ -$ $0 End of Year ("EOY") amount
17 BOY/EOY Average: -$ -$ -$ $0 Average of Line 15 and Line 16
8-AccDep
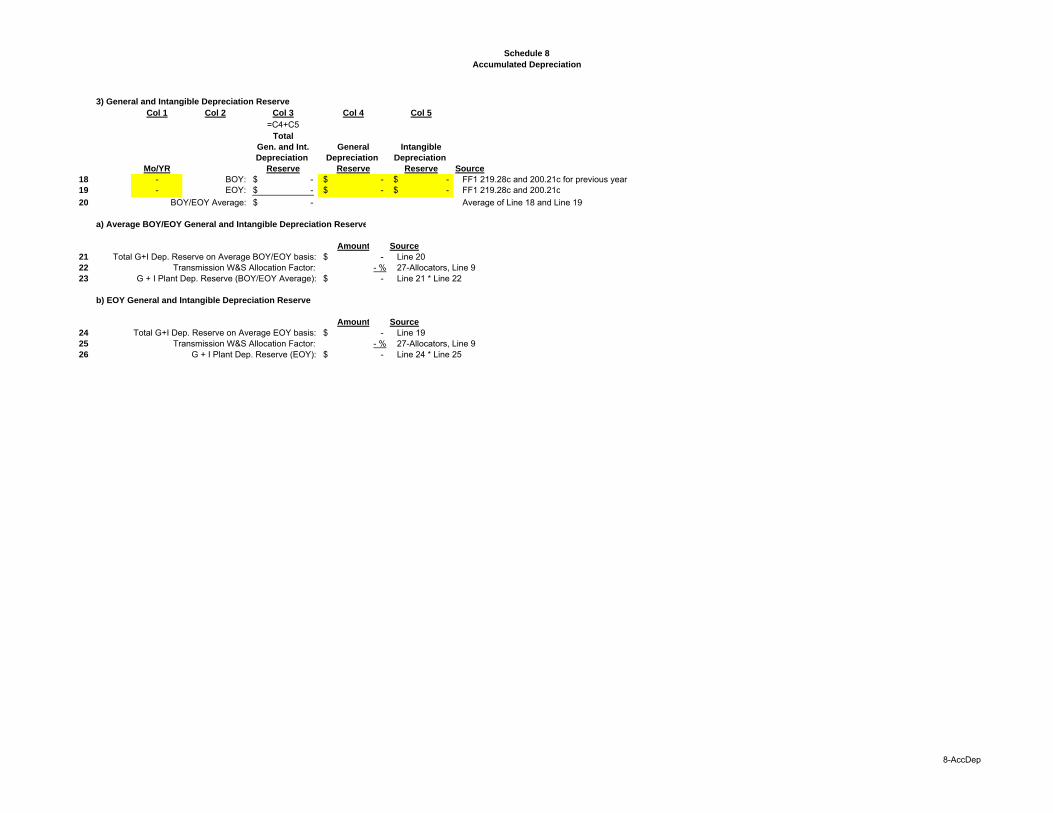
Schedule 8
Accumulated Depreciation
3) General and Intangible Depreciation Reserve
Col 1 Col 2 Col 3 Col 4 Col 5
=C4+C5Total
Gen. and Int. General Intangible
Depreciation Depreciation Depreciation
Mo/YR Reserve Reserve Reserve Source
18 - BOY: -$ -$ -$ FF1 219.28c and 200.21c for previous year19 - EOY: -$ -$ -$ FF1 219.28c and 200.21c
20 BOY/EOY Average: -$ Average of Line 18 and Line 19
a) Average BOY/EOY General and Intangible Depreciation Reserve
Amount Source
21 Total G+I Dep. Reserve on Average BOY/EOY basis: -$ Line 2022 Transmission W&S Allocation Factor: - % 27-Allocators, Line 923 G + I Plant Dep. Reserve (BOY/EOY Average): -$ Line 21 * Line 22
b) EOY General and Intangible Depreciation Reserve
Amount Source
24 Total G+I Dep. Reserve on Average EOY basis: -$ Line 1925 Transmission W&S Allocation Factor: - % 27-Allocators, Line 926 G + I Plant Dep. Reserve (EOY): -$ Line 24 * Line 25
8-AccDep
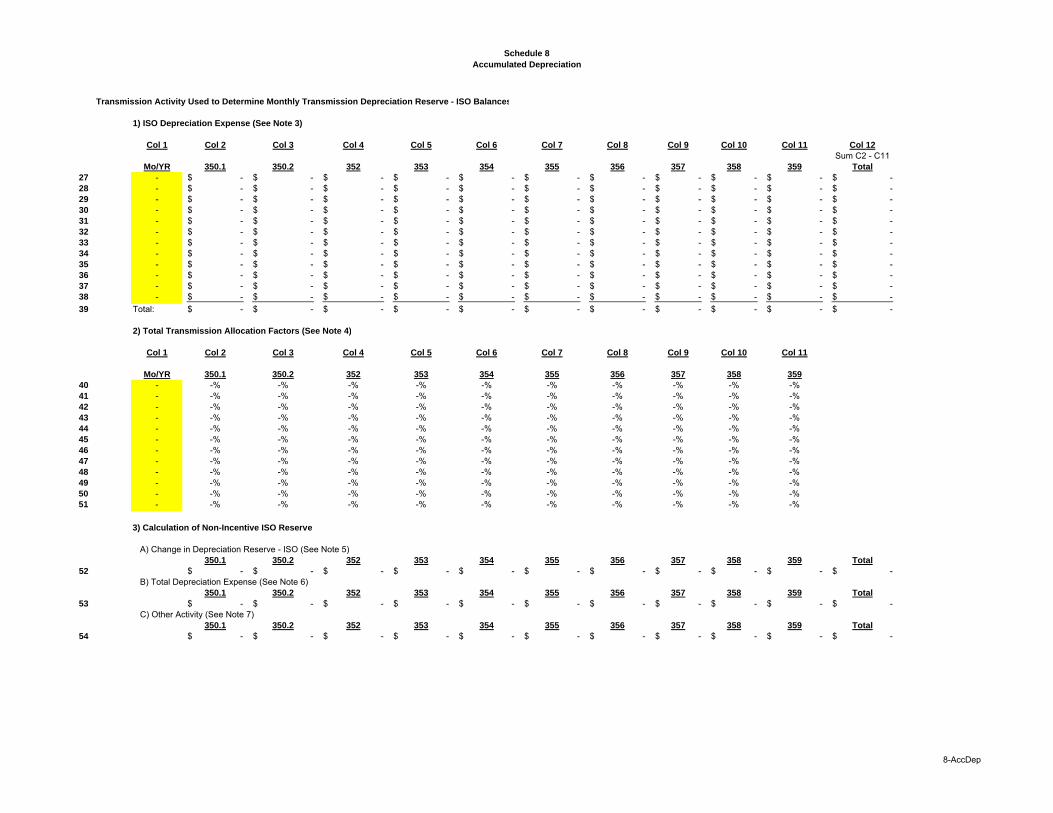
Schedule 8
Accumulated Depreciation
Transmission Activity Used to Determine Monthly Transmission Depreciation Reserve - ISO Balances
1) ISO Depreciation Expense (See Note 3)
Col 1 Col 2 Col 3 Col 4 Col 5 Col 6 Col 7 Col 8 Col 9 Col 10 Col 11 Col 12
Sum C2 - C11Mo/YR 350.1 350.2 352 353 354 355 356 357 358 359 Total
27 - -$ -$ -$ -$ -$ -$ -$ -$ -$ -$ -$ 28 - -$ -$ -$ -$ -$ -$ -$ -$ -$ -$ -$ 29 - -$ -$ -$ -$ -$ -$ -$ -$ -$ -$ -$ 30 - -$ -$ -$ -$ -$ -$ -$ -$ -$ -$ -$ 31 - -$ -$ -$ -$ -$ -$ -$ -$ -$ -$ -$ 32 - -$ -$ -$ -$ -$ -$ -$ -$ -$ -$ -$ 33 - -$ -$ -$ -$ -$ -$ -$ -$ -$ -$ -$ 34 - -$ -$ -$ -$ -$ -$ -$ -$ -$ -$ -$ 35 - -$ -$ -$ -$ -$ -$ -$ -$ -$ -$ -$ 36 - -$ -$ -$ -$ -$ -$ -$ -$ -$ -$ -$ 37 - -$ -$ -$ -$ -$ -$ -$ -$ -$ -$ -$ 38 - -$ -$ -$ -$ -$ -$ -$ -$ -$ -$ -$
39 Total: -$ -$ -$ -$ -$ -$ -$ -$ -$ -$ -$
2) Total Transmission Allocation Factors (See Note 4)
Col 1 Col 2 Col 3 Col 4 Col 5 Col 6 Col 7 Col 8 Col 9 Col 10 Col 11
Mo/YR 350.1 350.2 352 353 354 355 356 357 358 359
40 - -% -% -% -% -% -% -% -% -% -%41 - -% -% -% -% -% -% -% -% -% -%42 - -% -% -% -% -% -% -% -% -% -%43 - -% -% -% -% -% -% -% -% -% -%44 - -% -% -% -% -% -% -% -% -% -%45 - -% -% -% -% -% -% -% -% -% -%46 - -% -% -% -% -% -% -% -% -% -%47 - -% -% -% -% -% -% -% -% -% -%48 - -% -% -% -% -% -% -% -% -% -%49 - -% -% -% -% -% -% -% -% -% -%50 - -% -% -% -% -% -% -% -% -% -%51 - -% -% -% -% -% -% -% -% -% -%
3) Calculation of Non-Incentive ISO Reserve
A) Change in Depreciation Reserve - ISO (See Note 5)350.1 350.2 352 353 354 355 356 357 358 359 Total
52 -$ -$ -$ -$ -$ -$ -$ -$ -$ -$ -$ B) Total Depreciation Expense (See Note 6)
350.1 350.2 352 353 354 355 356 357 358 359 Total
53 -$ -$ -$ -$ -$ -$ -$ -$ -$ -$ -$ C) Other Activity (See Note 7)
350.1 350.2 352 353 354 355 356 357 358 359 Total
54 -$ -$ -$ -$ -$ -$ -$ -$ -$ -$ -$
8-AccDep
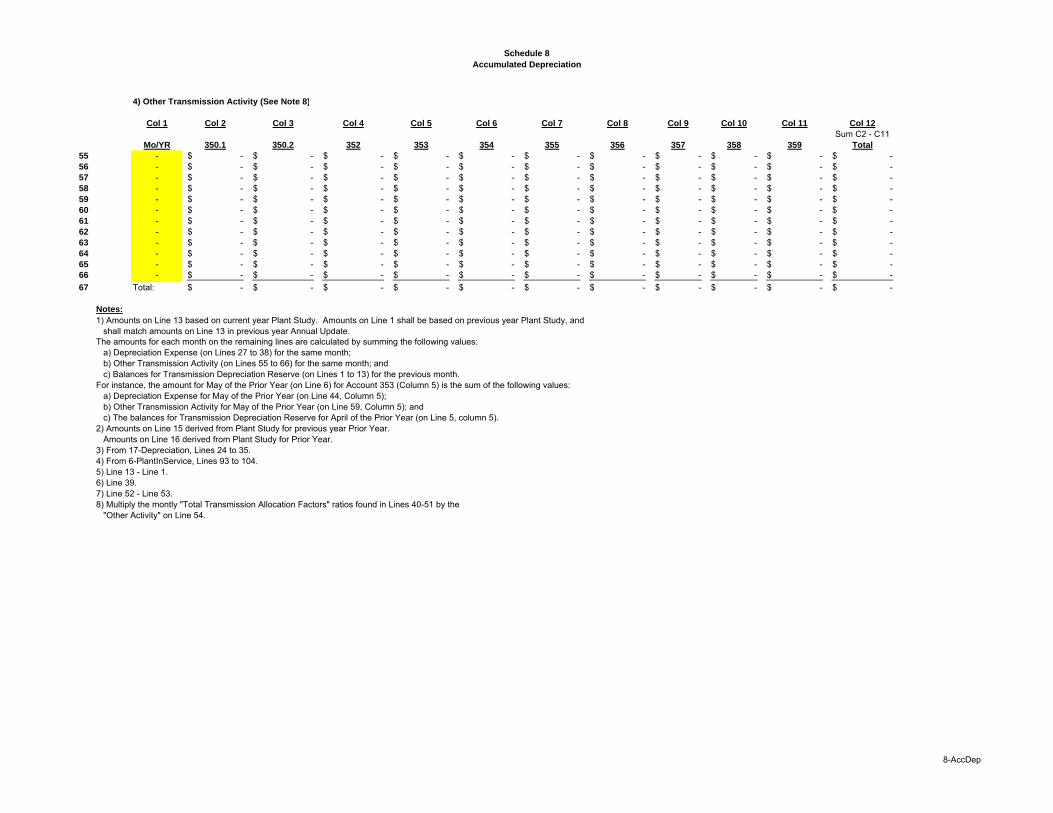
Schedule 8
Accumulated Depreciation
4) Other Transmission Activity (See Note 8)
Col 1 Col 2 Col 3 Col 4 Col 5 Col 6 Col 7 Col 8 Col 9 Col 10 Col 11 Col 12
Sum C2 - C11Mo/YR 350.1 350.2 352 353 354 355 356 357 358 359 Total
55 - -$ -$ -$ -$ -$ -$ -$ -$ -$ -$ -$ 56 - -$ -$ -$ -$ -$ -$ -$ -$ -$ -$ -$ 57 - -$ -$ -$ -$ -$ -$ -$ -$ -$ -$ -$ 58 - -$ -$ -$ -$ -$ -$ -$ -$ -$ -$ -$ 59 - -$ -$ -$ -$ -$ -$ -$ -$ -$ -$ -$ 60 - -$ -$ -$ -$ -$ -$ -$ -$ -$ -$ -$ 61 - -$ -$ -$ -$ -$ -$ -$ -$ -$ -$ -$ 62 - -$ -$ -$ -$ -$ -$ -$ -$ -$ -$ -$ 63 - -$ -$ -$ -$ -$ -$ -$ -$ -$ -$ -$ 64 - -$ -$ -$ -$ -$ -$ -$ -$ -$ -$ -$ 65 - -$ -$ -$ -$ -$ -$ -$ -$ -$ -$ -$ 66 - -$ -$ -$ -$ -$ -$ -$ -$ -$ -$ -$
67 Total: -$ -$ -$ -$ -$ -$ -$ -$ -$ -$ -$
Notes:
1) Amounts on Line 13 based on current year Plant Study. Amounts on Line 1 shall be based on previous year Plant Study, and shall match amounts on Line 13 in previous year Annual Update.
The amounts for each month on the remaining lines are calculated by summing the following values:a) Depreciation Expense (on Lines 27 to 38) for the same month;b) Other Transmission Activity (on Lines 55 to 66) for the same month; and c) Balances for Transmission Depreciation Reserve (on Lines 1 to 13) for the previous month.
For instance, the amount for May of the Prior Year (on Line 6) for Account 353 (Column 5) is the sum of the following values:a) Depreciation Expense for May of the Prior Year (on Line 44, Column 5);b) Other Transmission Activity for May of the Prior Year (on Line 59, Column 5); and c) The balances for Transmission Depreciation Reserve for April of the Prior Year (on Line 5, column 5).
2) Amounts on Line 15 derived from Plant Study for previous year Prior Year.Amounts on Line 16 derived from Plant Study for Prior Year.
3) From 17-Depreciation, Lines 24 to 35.4) From 6-PlantInService, Lines 93 to 104.5) Line 13 - Line 1.6) Line 39.7) Line 52 - Line 53.8) Multiply the montly "Total Transmission Allocation Factors" ratios found in Lines 40-51 by the
"Other Activity" on Line 54.
8-AccDep
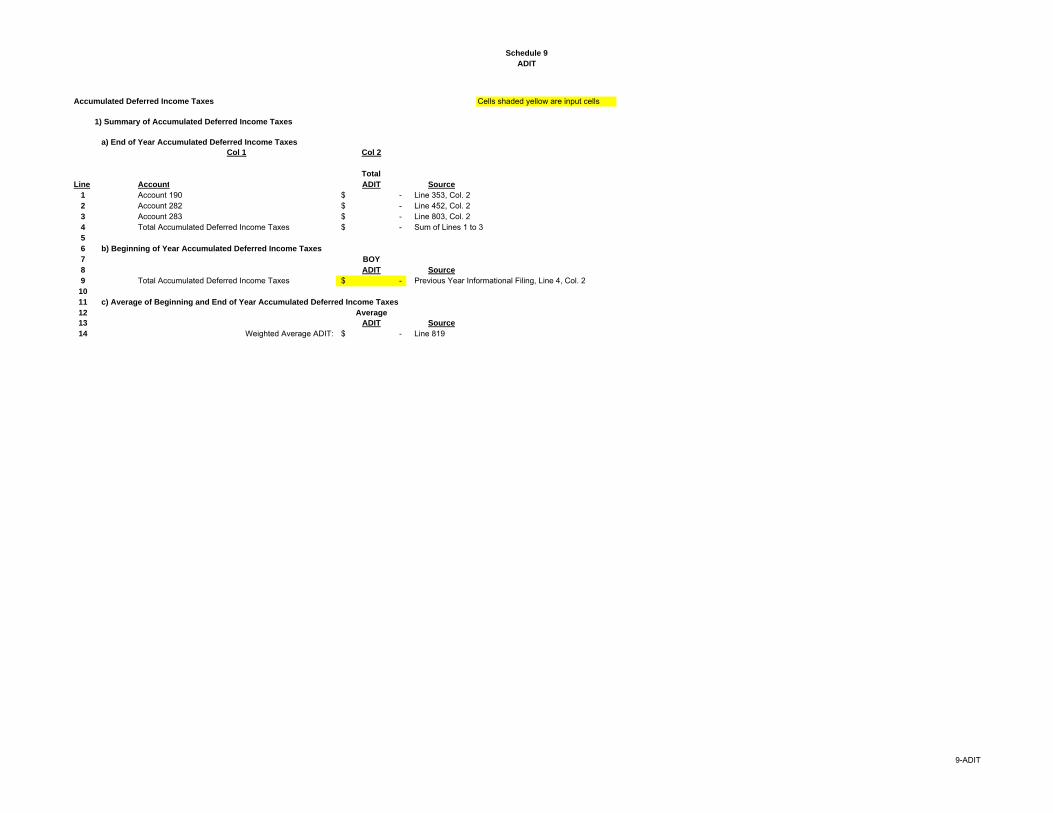
Schedule 9
ADIT
Accumulated Deferred Income Taxes Cells shaded yellow are input cells
1) Summary of Accumulated Deferred Income Taxes
a) End of Year Accumulated Deferred Income Taxes
Col 1 Col 2
Total
Line Account ADIT Source
1 Account 190 -$ Line 353, Col. 22 Account 282 -$ Line 452, Col. 23 Account 283 -$ Line 803, Col. 24 Total Accumulated Deferred Income Taxes -$ Sum of Lines 1 to 35
6 b) Beginning of Year Accumulated Deferred Income Taxes
7 BOY
8 ADIT Source
9 Total Accumulated Deferred Income Taxes -$ Previous Year Informational Filing, Line 4, Col. 210
11 c) Average of Beginning and End of Year Accumulated Deferred Income Taxes
12 Average
13 ADIT Source
14 Weighted Average ADIT: -$ Line 819
9-ADIT
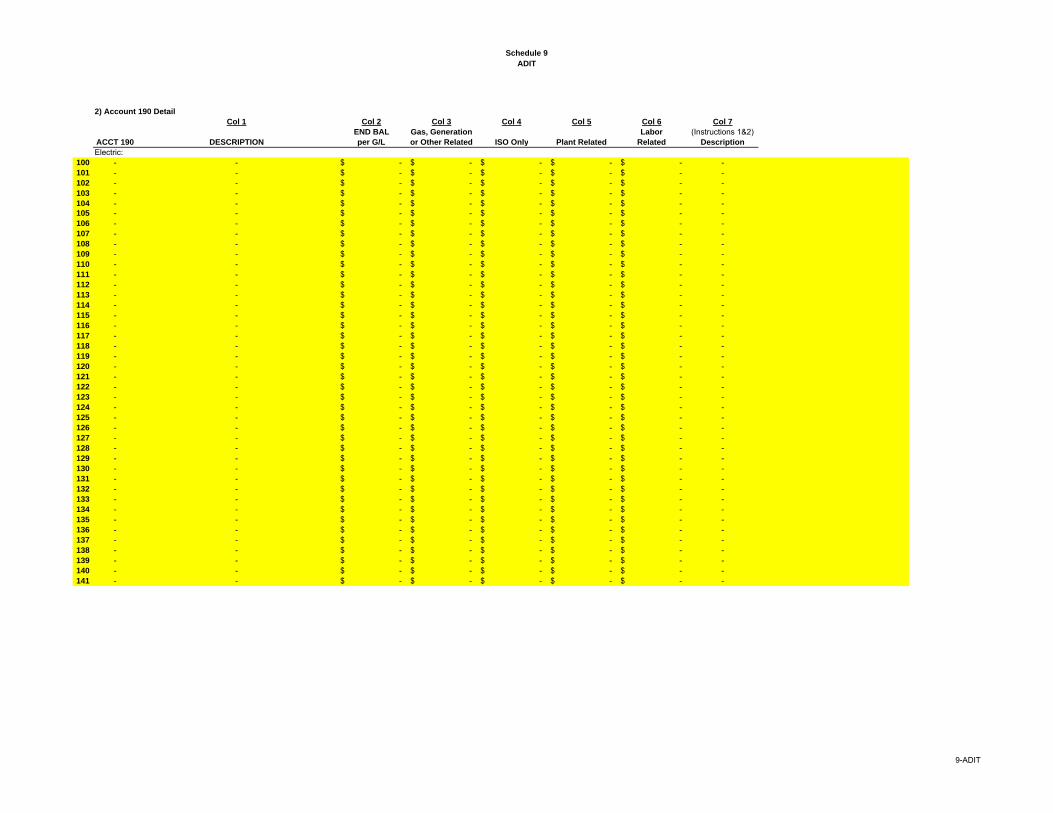
Schedule 9
ADIT
2) Account 190 Detail
Col 1 Col 2 Col 3 Col 4 Col 5 Col 6 Col 7
END BAL Gas, Generation Labor (Instructions 1&2)ACCT 190 DESCRIPTION per G/L or Other Related ISO Only Plant Related Related Description
Electric:100 - - -$ -$ -$ -$ -$ -101 - - -$ -$ -$ -$ -$ -102 - - -$ -$ -$ -$ -$ -103 - - -$ -$ -$ -$ -$ -104 - - -$ -$ -$ -$ -$ -105 - - -$ -$ -$ -$ -$ -106 - - -$ -$ -$ -$ -$ -107 - - -$ -$ -$ -$ -$ -108 - - -$ -$ -$ -$ -$ -109 - - -$ -$ -$ -$ -$ -110 - - -$ -$ -$ -$ -$ -111 - - -$ -$ -$ -$ -$ -112 - - -$ -$ -$ -$ -$ -113 - - -$ -$ -$ -$ -$ -114 - - -$ -$ -$ -$ -$ -115 - - -$ -$ -$ -$ -$ -116 - - -$ -$ -$ -$ -$ -117 - - -$ -$ -$ -$ -$ -118 - - -$ -$ -$ -$ -$ -119 - - -$ -$ -$ -$ -$ -120 - - -$ -$ -$ -$ -$ -121 - - -$ -$ -$ -$ -$ -122 - - -$ -$ -$ -$ -$ -123 - - -$ -$ -$ -$ -$ -124 - - -$ -$ -$ -$ -$ -125 - - -$ -$ -$ -$ -$ -126 - - -$ -$ -$ -$ -$ -127 - - -$ -$ -$ -$ -$ -128 - - -$ -$ -$ -$ -$ -129 - - -$ -$ -$ -$ -$ -130 - - -$ -$ -$ -$ -$ -131 - - -$ -$ -$ -$ -$ -132 - - -$ -$ -$ -$ -$ -133 - - -$ -$ -$ -$ -$ -134 - - -$ -$ -$ -$ -$ -135 - - -$ -$ -$ -$ -$ -136 - - -$ -$ -$ -$ -$ -137 - - -$ -$ -$ -$ -$ -138 - - -$ -$ -$ -$ -$ -139 - - -$ -$ -$ -$ -$ -140 - - -$ -$ -$ -$ -$ -141 - - -$ -$ -$ -$ -$ -
9-ADIT
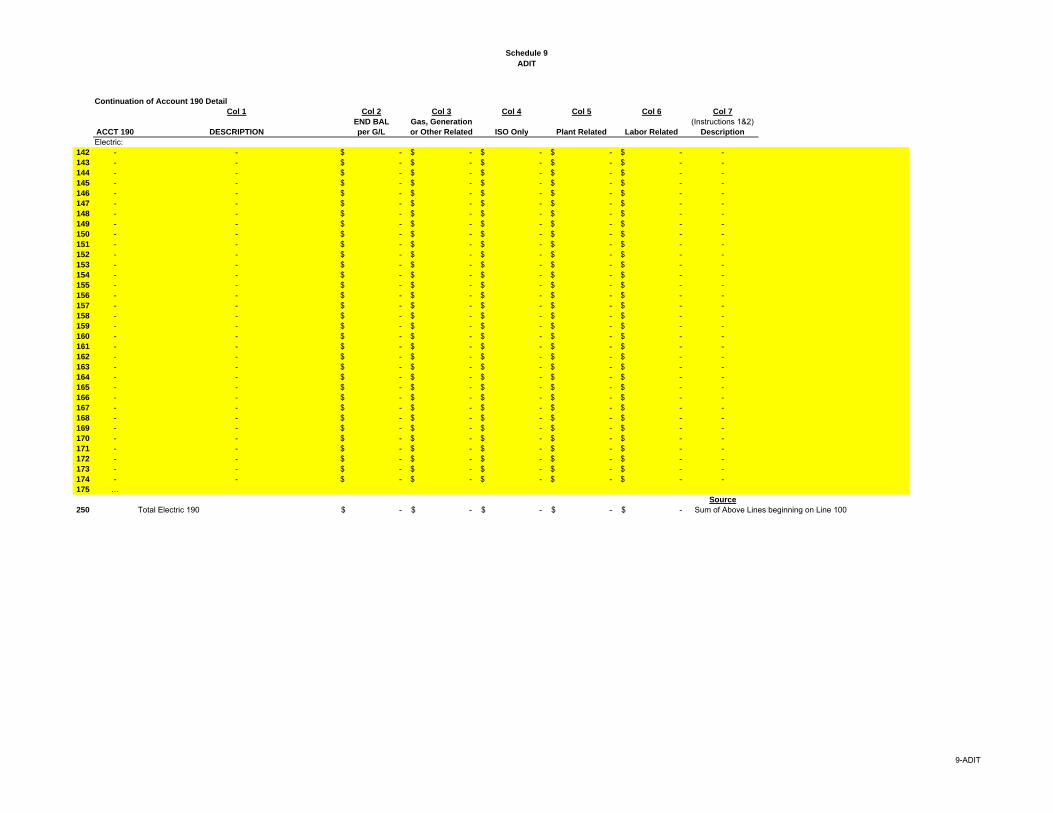
Schedule 9
ADIT
Continuation of Account 190 Detail
Col 1 Col 2 Col 3 Col 4 Col 5 Col 6 Col 7
END BAL Gas, Generation (Instructions 1&2)ACCT 190 DESCRIPTION per G/L or Other Related ISO Only Plant Related Labor Related Description
Electric:142 - - -$ -$ -$ -$ -$ -143 - - -$ -$ -$ -$ -$ -144 - - -$ -$ -$ -$ -$ -145 - - -$ -$ -$ -$ -$ -146 - - -$ -$ -$ -$ -$ -147 - - -$ -$ -$ -$ -$ -148 - - -$ -$ -$ -$ -$ -149 - - -$ -$ -$ -$ -$ -150 - - -$ -$ -$ -$ -$ -151 - - -$ -$ -$ -$ -$ -152 - - -$ -$ -$ -$ -$ -153 - - -$ -$ -$ -$ -$ -154 - - -$ -$ -$ -$ -$ -155 - - -$ -$ -$ -$ -$ -156 - - -$ -$ -$ -$ -$ -157 - - -$ -$ -$ -$ -$ -158 - - -$ -$ -$ -$ -$ -159 - - -$ -$ -$ -$ -$ -160 - - -$ -$ -$ -$ -$ -161 - - -$ -$ -$ -$ -$ -162 - - -$ -$ -$ -$ -$ -163 - - -$ -$ -$ -$ -$ -164 - - -$ -$ -$ -$ -$ -165 - - -$ -$ -$ -$ -$ -166 - - -$ -$ -$ -$ -$ -167 - - -$ -$ -$ -$ -$ -168 - - -$ -$ -$ -$ -$ -169 - - -$ -$ -$ -$ -$ -170 - - -$ -$ -$ -$ -$ -171 - - -$ -$ -$ -$ -$ -172 - - -$ -$ -$ -$ -$ -173 - - -$ -$ -$ -$ -$ -174 - - -$ -$ -$ -$ -$ -175 …
Source
250 Total Electric 190 -$ -$ -$ -$ -$ Sum of Above Lines beginning on Line 100
9-ADIT
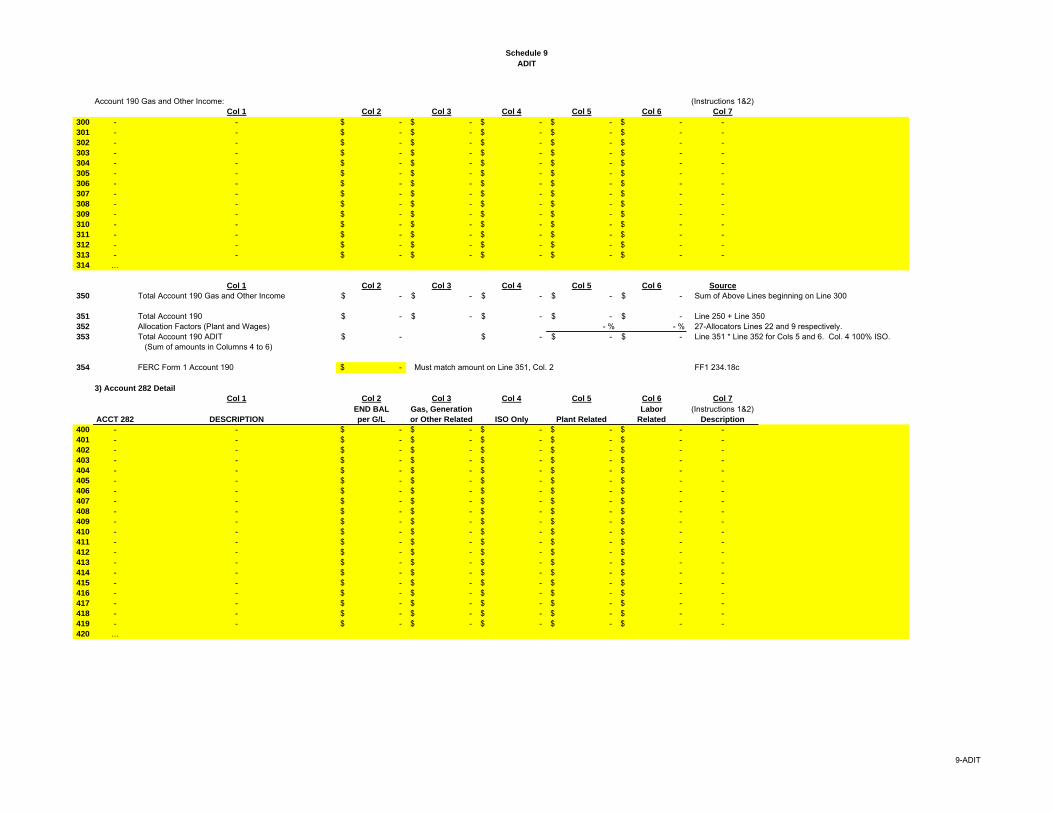
Schedule 9
ADIT
Account 190 Gas and Other Income: (Instructions 1&2)Col 1 Col 2 Col 3 Col 4 Col 5 Col 6 Col 7
300 - - -$ -$ -$ -$ -$ -301 - - -$ -$ -$ -$ -$ -302 - - -$ -$ -$ -$ -$ -303 - - -$ -$ -$ -$ -$ -304 - - -$ -$ -$ -$ -$ -305 - - -$ -$ -$ -$ -$ -306 - - -$ -$ -$ -$ -$ -307 - - -$ -$ -$ -$ -$ -308 - - -$ -$ -$ -$ -$ -309 - - -$ -$ -$ -$ -$ -310 - - -$ -$ -$ -$ -$ -311 - - -$ -$ -$ -$ -$ -312 - - -$ -$ -$ -$ -$ -313 - - -$ -$ -$ -$ -$ -314 …
Col 1 Col 2 Col 3 Col 4 Col 5 Col 6 Source
350 Total Account 190 Gas and Other Income -$ -$ -$ -$ -$ Sum of Above Lines beginning on Line 300
351 Total Account 190 -$ -$ -$ -$ -$ Line 250 + Line 350352 Allocation Factors (Plant and Wages) - % - % 27-Allocators Lines 22 and 9 respectively.353 Total Account 190 ADIT -$ -$ -$ -$ Line 351 * Line 352 for Cols 5 and 6. Col. 4 100% ISO.
(Sum of amounts in Columns 4 to 6)
354 FERC Form 1 Account 190 -$ Must match amount on Line 351, Col. 2 FF1 234.18c
3) Account 282 Detail
Col 1 Col 2 Col 3 Col 4 Col 5 Col 6 Col 7
END BAL Gas, Generation Labor (Instructions 1&2)ACCT 282 DESCRIPTION per G/L or Other Related ISO Only Plant Related Related Description
400 - - -$ -$ -$ -$ -$ -401 - - -$ -$ -$ -$ -$ -402 - - -$ -$ -$ -$ -$ -403 - - -$ -$ -$ -$ -$ -404 - - -$ -$ -$ -$ -$ -405 - - -$ -$ -$ -$ -$ -406 - - -$ -$ -$ -$ -$ -407 - - -$ -$ -$ -$ -$ -408 - - -$ -$ -$ -$ -$ -409 - - -$ -$ -$ -$ -$ -410 - - -$ -$ -$ -$ -$ -411 - - -$ -$ -$ -$ -$ -412 - - -$ -$ -$ -$ -$ -413 - - -$ -$ -$ -$ -$ -414 - - -$ -$ -$ -$ -$ -415 - - -$ -$ -$ -$ -$ -416 - - -$ -$ -$ -$ -$ -417 - - -$ -$ -$ -$ -$ -418 - - -$ -$ -$ -$ -$ -419 - - -$ -$ -$ -$ -$ -420 …
9-ADIT
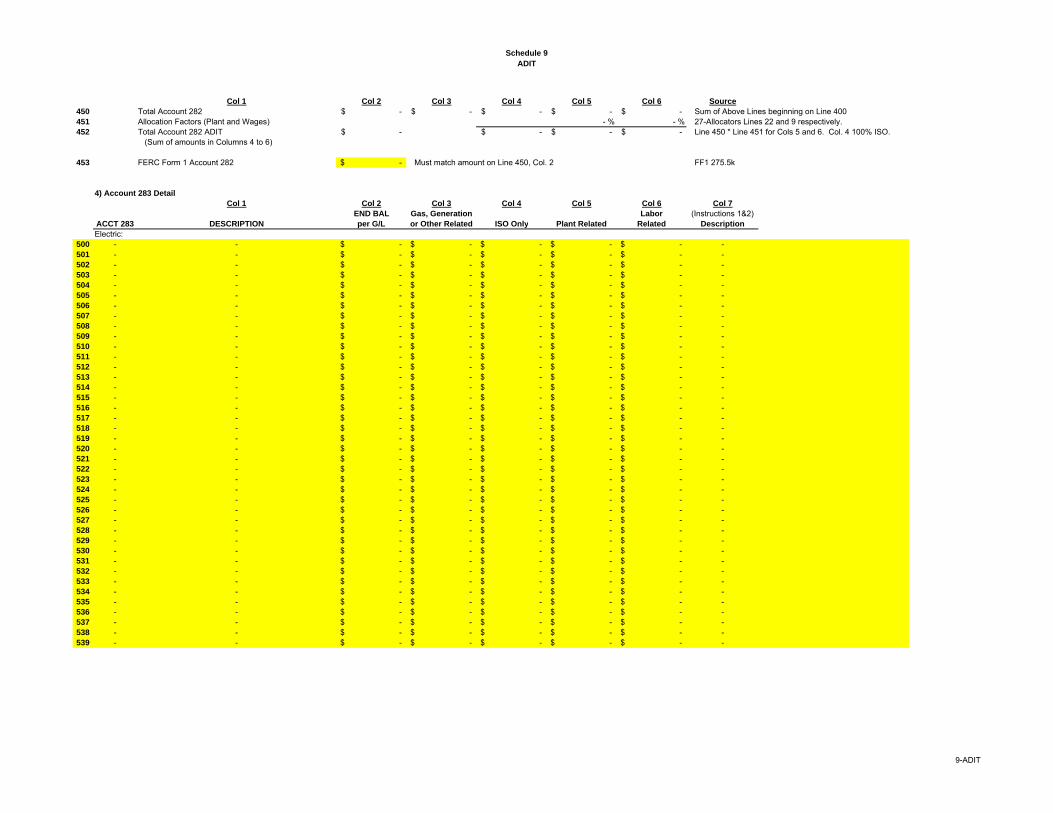
Schedule 9
ADIT
Col 1 Col 2 Col 3 Col 4 Col 5 Col 6 Source
450 Total Account 282 -$ -$ -$ -$ -$ Sum of Above Lines beginning on Line 400451 Allocation Factors (Plant and Wages) - % - % 27-Allocators Lines 22 and 9 respectively.452 Total Account 282 ADIT -$ -$ -$ -$ Line 450 * Line 451 for Cols 5 and 6. Col. 4 100% ISO.
(Sum of amounts in Columns 4 to 6)
453 FERC Form 1 Account 282 -$ Must match amount on Line 450, Col. 2 FF1 275.5k
4) Account 283 Detail
Col 1 Col 2 Col 3 Col 4 Col 5 Col 6 Col 7
END BAL Gas, Generation Labor (Instructions 1&2)ACCT 283 DESCRIPTION per G/L or Other Related ISO Only Plant Related Related Description
Electric:500 - - -$ -$ -$ -$ -$ -501 - - -$ -$ -$ -$ -$ -502 - - -$ -$ -$ -$ -$ -503 - - -$ -$ -$ -$ -$ -504 - - -$ -$ -$ -$ -$ -505 - - -$ -$ -$ -$ -$ -506 - - -$ -$ -$ -$ -$ -507 - - -$ -$ -$ -$ -$ -508 - - -$ -$ -$ -$ -$ -509 - - -$ -$ -$ -$ -$ -510 - - -$ -$ -$ -$ -$ -511 - - -$ -$ -$ -$ -$ -512 - - -$ -$ -$ -$ -$ -513 - - -$ -$ -$ -$ -$ -514 - - -$ -$ -$ -$ -$ -515 - - -$ -$ -$ -$ -$ -516 - - -$ -$ -$ -$ -$ -517 - - -$ -$ -$ -$ -$ -518 - - -$ -$ -$ -$ -$ -519 - - -$ -$ -$ -$ -$ -520 - - -$ -$ -$ -$ -$ -521 - - -$ -$ -$ -$ -$ -522 - - -$ -$ -$ -$ -$ -523 - - -$ -$ -$ -$ -$ -524 - - -$ -$ -$ -$ -$ -525 - - -$ -$ -$ -$ -$ -526 - - -$ -$ -$ -$ -$ -527 - - -$ -$ -$ -$ -$ -528 - - -$ -$ -$ -$ -$ -529 - - -$ -$ -$ -$ -$ -530 - - -$ -$ -$ -$ -$ -531 - - -$ -$ -$ -$ -$ -532 - - -$ -$ -$ -$ -$ -533 - - -$ -$ -$ -$ -$ -534 - - -$ -$ -$ -$ -$ -535 - - -$ -$ -$ -$ -$ -536 - - -$ -$ -$ -$ -$ -537 - - -$ -$ -$ -$ -$ -538 - - -$ -$ -$ -$ -$ -539 - - -$ -$ -$ -$ -$ -
9-ADIT
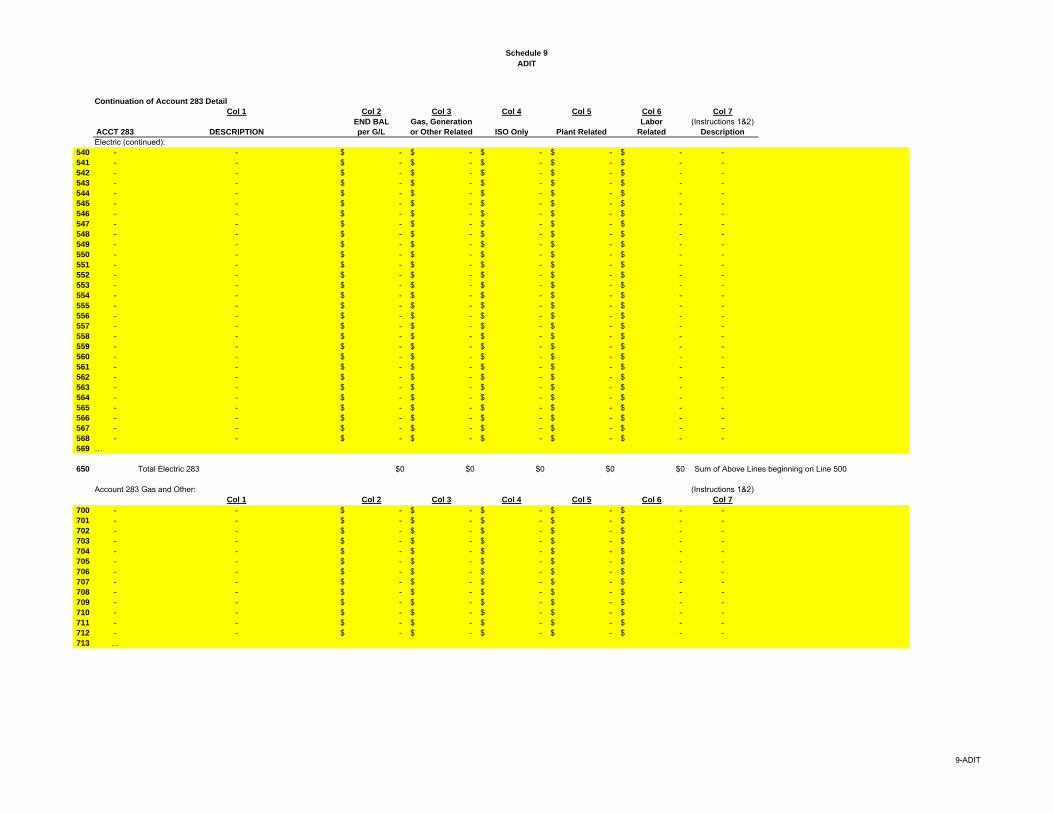
Schedule 9
ADIT
Continuation of Account 283 Detail
Col 1 Col 2 Col 3 Col 4 Col 5 Col 6 Col 7
END BAL Gas, Generation Labor (Instructions 1&2)ACCT 283 DESCRIPTION per G/L or Other Related ISO Only Plant Related Related Description
Electric (continued):540 - - -$ -$ -$ -$ -$ -541 - - -$ -$ -$ -$ -$ -542 - - -$ -$ -$ -$ -$ -543 - - -$ -$ -$ -$ -$ -544 - - -$ -$ -$ -$ -$ -545 - - -$ -$ -$ -$ -$ -546 - - -$ -$ -$ -$ -$ -547 - - -$ -$ -$ -$ -$ -548 - - -$ -$ -$ -$ -$ -549 - - -$ -$ -$ -$ -$ -550 - - -$ -$ -$ -$ -$ -551 - - -$ -$ -$ -$ -$ -552 - - -$ -$ -$ -$ -$ -553 - - -$ -$ -$ -$ -$ -554 - - -$ -$ -$ -$ -$ -555 - - -$ -$ -$ -$ -$ -556 - - -$ -$ -$ -$ -$ -557 - - -$ -$ -$ -$ -$ -558 - - -$ -$ -$ -$ -$ -559 - - -$ -$ -$ -$ -$ -560 - - -$ -$ -$ -$ -$ -561 - - -$ -$ -$ -$ -$ -562 - - -$ -$ -$ -$ -$ -563 - - -$ -$ -$ -$ -$ -564 - - -$ -$ -$ -$ -$ -565 - - -$ -$ -$ -$ -$ -566 - - -$ -$ -$ -$ -$ -567 - - -$ -$ -$ -$ -$ -568 - - -$ -$ -$ -$ -$ -569 …
650 Total Electric 283 $0 $0 $0 $0 $0 Sum of Above Lines beginning on Line 500
Account 283 Gas and Other: (Instructions 1&2)Col 1 Col 2 Col 3 Col 4 Col 5 Col 6 Col 7
700 - - -$ -$ -$ -$ -$ -701 - - -$ -$ -$ -$ -$ -702 - - -$ -$ -$ -$ -$ -703 - - -$ -$ -$ -$ -$ -704 - - -$ -$ -$ -$ -$ -705 - - -$ -$ -$ -$ -$ -706 - - -$ -$ -$ -$ -$ -707 - - -$ -$ -$ -$ -$ -708 - - -$ -$ -$ -$ -$ -709 - - -$ -$ -$ -$ -$ -710 - - -$ -$ -$ -$ -$ -711 - - -$ -$ -$ -$ -$ -712 - - -$ -$ -$ -$ -$ -713 …
9-ADIT
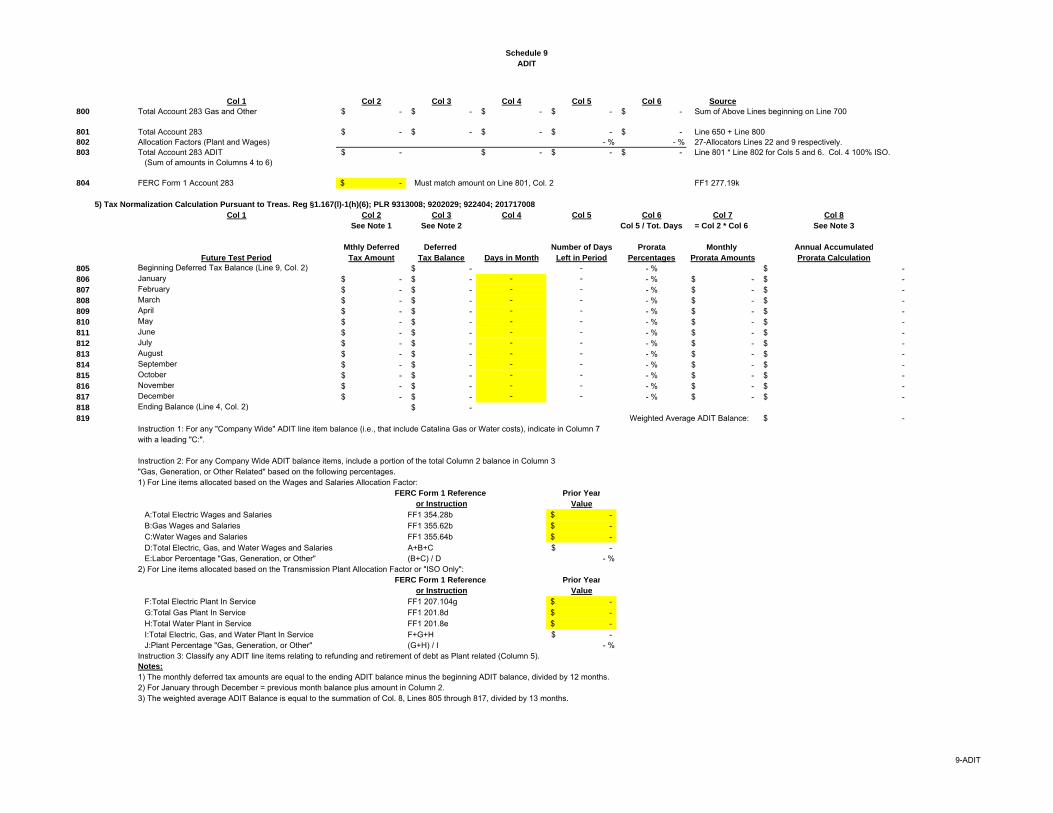
Schedule 9
ADIT
Col 1 Col 2 Col 3 Col 4 Col 5 Col 6 Source
800 Total Account 283 Gas and Other -$ -$ -$ -$ -$ Sum of Above Lines beginning on Line 700
801 Total Account 283 -$ -$ -$ -$ -$ Line 650 + Line 800802 Allocation Factors (Plant and Wages) - % - % 27-Allocators Lines 22 and 9 respectively.803 Total Account 283 ADIT -$ -$ -$ -$ Line 801 * Line 802 for Cols 5 and 6. Col. 4 100% ISO.
(Sum of amounts in Columns 4 to 6)
804 FERC Form 1 Account 283 -$ Must match amount on Line 801, Col. 2 FF1 277.19k
5) Tax Normalization Calculation Pursuant to Treas. Reg §1.167(l)-1(h)(6); PLR 9313008; 9202029; 922404; 201717008
Col 1 Col 2 Col 3 Col 4 Col 5 Col 6 Col 7 Col 8
See Note 1 See Note 2 Col 5 / Tot. Days = Col 2 * Col 6 See Note 3
Mthly Deferred Deferred Number of Days Prorata Monthly Annual Accumulated
Future Test Period Tax Amount Tax Balance Days in Month Left in Period Percentages Prorata Amounts Prorata Calculation
805 Beginning Deferred Tax Balance (Line 9, Col. 2) -$ - - % -$ 806 January -$ -$ - - - % -$ -$ 807 February -$ -$ - - - % -$ -$ 808 March -$ -$ - - - % -$ -$ 809 April -$ -$ - - - % -$ -$ 810 May -$ -$ - - - % -$ -$ 811 June -$ -$ - - - % -$ -$ 812 July -$ -$ - - - % -$ -$ 813 August -$ -$ - - - % -$ -$ 814 September -$ -$ - - - % -$ -$ 815 October -$ -$ - - - % -$ -$ 816 November -$ -$ - - - % -$ -$ 817 December -$ -$ - - - % -$ -$ 818 Ending Balance (Line 4, Col. 2) -$ 819 Weighted Average ADIT Balance: -$
Instruction 1: For any "Company Wide" ADIT line item balance (i.e., that include Catalina Gas or Water costs), indicate in Column 7with a leading "C:".
Instruction 2: For any Company Wide ADIT balance items, include a portion of the total Column 2 balance in Column 3 "Gas, Generation, or Other Related" based on the following percentages.
1) For Line items allocated based on the Wages and Salaries Allocation Factor: FERC Form 1 Reference Prior Year
or Instruction Value
A:Total Electric Wages and Salaries FF1 354.28b -$ B:Gas Wages and Salaries FF1 355.62b -$ C:Water Wages and Salaries FF1 355.64b -$ D:Total Electric, Gas, and Water Wages and Salaries A+B+C -$ E:Labor Percentage "Gas, Generation, or Other" (B+C) / D - %
2) For Line items allocated based on the Transmission Plant Allocation Factor or "ISO Only": FERC Form 1 Reference Prior Year
or Instruction Value
F:Total Electric Plant In Service FF1 207.104g -$ G:Total Gas Plant In Service FF1 201.8d -$ H:Total Water Plant in Service FF1 201.8e -$ I:Total Electric, Gas, and Water Plant In Service F+G+H -$ J:Plant Percentage "Gas, Generation, or Other" (G+H) / I - %
Instruction 3: Classify any ADIT line items relating to refunding and retirement of debt as Plant related (Column 5).Notes:
1) The monthly deferred tax amounts are equal to the ending ADIT balance minus the beginning ADIT balance, divided by 12 months.2) For January through December = previous month balance plus amount in Column 2.3) The weighted average ADIT Balance is equal to the summation of Col. 8, Lines 805 through 817, divided by 13 months.
9-ADIT
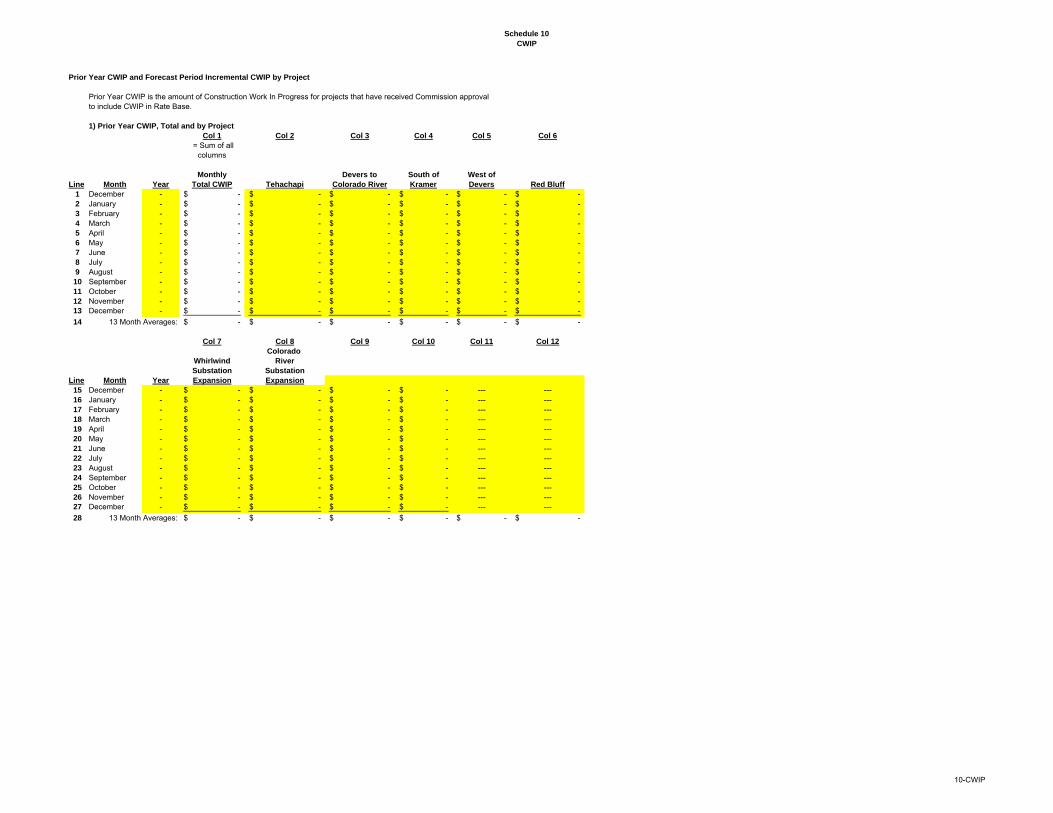
Schedule 10
CWIP
Prior Year CWIP and Forecast Period Incremental CWIP by Project
Prior Year CWIP is the amount of Construction Work In Progress for projects that have received Commission approvalto include CWIP in Rate Base.
1) Prior Year CWIP, Total and by Project
Col 1 Col 2 Col 3 Col 4 Col 5 Col 6
= Sum of allcolumns
Monthly Devers to South of West of
Line Month Year Total CWIP Tehachapi Colorado River Kramer Devers Red Bluff
1 December - -$ -$ -$ -$ -$ -$ 2 January - -$ -$ -$ -$ -$ -$ 3 February - -$ -$ -$ -$ -$ -$ 4 March - -$ -$ -$ -$ -$ -$ 5 April - -$ -$ -$ -$ -$ -$ 6 May - -$ -$ -$ -$ -$ -$ 7 June - -$ -$ -$ -$ -$ -$ 8 July - -$ -$ -$ -$ -$ -$ 9 August - -$ -$ -$ -$ -$ -$ 10 September - -$ -$ -$ -$ -$ -$ 11 October - -$ -$ -$ -$ -$ -$ 12 November - -$ -$ -$ -$ -$ -$ 13 December - -$ -$ -$ -$ -$ -$
14 13 Month Averages: -$ -$ -$ -$ -$ -$
Col 7 Col 8 Col 9 Col 10 Col 11 Col 12
Colorado
Whirlwind River
Substation Substation
Line Month Year Expansion Expansion
15 December - -$ -$ -$ -$ --- ---16 January - -$ -$ -$ -$ --- ---17 February - -$ -$ -$ -$ --- ---18 March - -$ -$ -$ -$ --- ---19 April - -$ -$ -$ -$ --- ---20 May - -$ -$ -$ -$ --- ---21 June - -$ -$ -$ -$ --- ---22 July - -$ -$ -$ -$ --- ---23 August - -$ -$ -$ -$ --- ---24 September - -$ -$ -$ -$ --- ---25 October - -$ -$ -$ -$ --- ---26 November - -$ -$ -$ -$ --- ---27 December - -$ -$ -$ -$ --- ---
28 13 Month Averages: -$ -$ -$ -$ -$ -$
10-CWIP

Schedule 10
CWIP
2) Total Forecast Period CWIP Expenditures (see Note 1)
Col 1 Col 2 Col 3 Col 4 Col 5 Col 6 Col 7 Col 8
See Note 2 See Note 2 See Note 2 See Note 2 See Note 2 See Note 2 See Note 2 See Note 2Unloaded
Forecast Corporate Total Total Prior Period Over Heads Forecast Forecast Period
Line Month Year Expenditures Overheads CWIP Exp Plant Adds CWIP Closed Closed to PIS Period CWIP Incremental CWIP
29 December - --- --- --- --- --- --- -$ ---30 January - -$ -$ -$ -$ -$ -$ -$ -$ 31 February - -$ -$ -$ -$ -$ -$ -$ -$ 32 March - -$ -$ -$ -$ -$ -$ -$ -$ 33 April - -$ -$ -$ -$ -$ -$ -$ -$ 34 May - -$ -$ -$ -$ -$ -$ -$ -$ 35 June - -$ -$ -$ -$ -$ -$ -$ -$ 36 July - -$ -$ -$ -$ -$ -$ -$ -$ 37 August - -$ -$ -$ -$ -$ -$ -$ -$ 38 September - -$ -$ -$ -$ -$ -$ -$ -$ 39 October - -$ -$ -$ -$ -$ -$ -$ -$ 40 November - -$ -$ -$ -$ -$ -$ -$ -$ 41 December - -$ -$ -$ -$ -$ -$ -$ -$ 42 January - -$ -$ -$ -$ -$ -$ -$ -$ 43 February - -$ -$ -$ -$ -$ -$ -$ -$ 44 March - -$ -$ -$ -$ -$ -$ -$ -$ 45 April - -$ -$ -$ -$ -$ -$ -$ -$ 46 May - -$ -$ -$ -$ -$ -$ -$ -$ 47 June - -$ -$ -$ -$ -$ -$ -$ -$ 48 July - -$ -$ -$ -$ -$ -$ -$ -$ 49 August - -$ -$ -$ -$ -$ -$ -$ -$ 50 September - -$ -$ -$ -$ -$ -$ -$ -$ 51 October - -$ -$ -$ -$ -$ -$ -$ -$ 52 November - -$ -$ -$ -$ -$ -$ -$ -$ 53 December - -$ -$ -$ -$ -$ -$ -$ -$
54 13-Month Averages: -$
3) Forecast Period CWIP Expenditures by Project (see Note 1)
3a) Project:
Col 1 Col 2 Col 3 Col 4 Col 5 Col 6 Col 7 Col 8
= C1 * 16-Plnt Add Line 74 = C1 + C2
= (C4 - C5) *16-Plnt Add Line 74
= Prior Month C7+ C3 - C4 - C6
= C7 - Dec Prior Year C7
Unloaded
Forecast Corporate Total Total Prior Period Over Heads Forecast Forecast Period
Line Month Year Expenditures Overheads CWIP Exp Plant Adds CWIP Closed Closed to PIS Period CWIP Incremental CWIP
55 December - --- --- --- --- --- --- -$ ---56 January - -$ -$ -$ -$ -$ -$ -$ -$ 57 February - -$ -$ -$ -$ -$ -$ -$ -$ 58 March - -$ -$ -$ -$ -$ -$ -$ -$ 59 April - -$ -$ -$ -$ -$ -$ -$ -$ 60 May - -$ -$ -$ -$ -$ -$ -$ -$ 61 June - -$ -$ -$ -$ -$ -$ -$ -$ 62 July - -$ -$ -$ -$ -$ -$ -$ -$ 63 August - -$ -$ -$ -$ -$ -$ -$ -$ 64 September - -$ -$ -$ -$ -$ -$ -$ -$ 65 October - -$ -$ -$ -$ -$ -$ -$ -$ 66 November - -$ -$ -$ -$ -$ -$ -$ -$ 67 December - -$ -$ -$ -$ -$ -$ -$ -$ 68 January - -$ -$ -$ -$ -$ -$ -$ -$ 69 February - -$ -$ -$ -$ -$ -$ -$ -$ 70 March - -$ -$ -$ -$ -$ -$ -$ -$ 71 April - -$ -$ -$ -$ -$ -$ -$ -$ 72 May - -$ -$ -$ -$ -$ -$ -$ -$ 73 June - -$ -$ -$ -$ -$ -$ -$ -$ 74 July - -$ -$ -$ -$ -$ -$ -$ -$ 75 August - -$ -$ -$ -$ -$ -$ -$ -$ 76 September - -$ -$ -$ -$ -$ -$ -$ -$ 77 October - -$ -$ -$ -$ -$ -$ -$ -$ 78 November - -$ -$ -$ -$ -$ -$ -$ -$ 79 December - -$ -$ -$ -$ -$ -$ -$ -$
80 13-Month Averages: -$
Tehachapi
10-CWIP
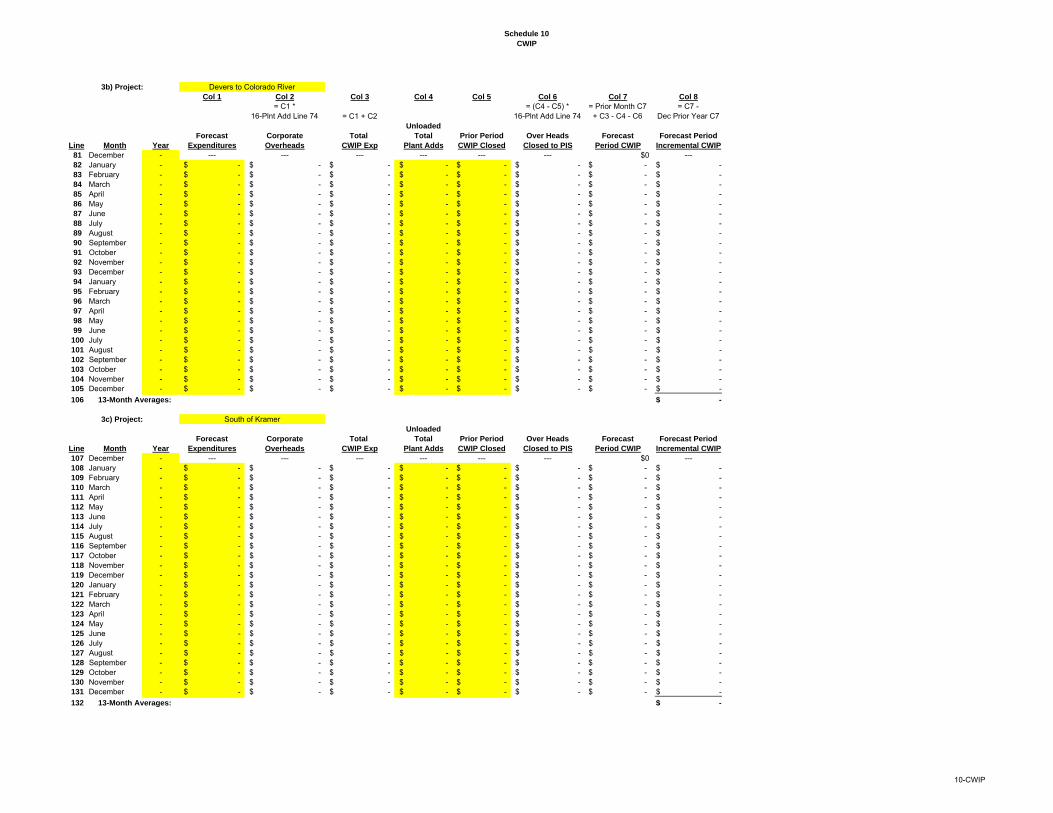
Schedule 10
CWIP
3b) Project:
Col 1 Col 2 Col 3 Col 4 Col 5 Col 6 Col 7 Col 8
= C1 * 16-Plnt Add Line 74 = C1 + C2
= (C4 - C5) *16-Plnt Add Line 74
= Prior Month C7+ C3 - C4 - C6
= C7 - Dec Prior Year C7
Unloaded
Forecast Corporate Total Total Prior Period Over Heads Forecast Forecast Period
Line Month Year Expenditures Overheads CWIP Exp Plant Adds CWIP Closed Closed to PIS Period CWIP Incremental CWIP
81 December - --- --- --- --- --- --- $0 ---82 January - -$ -$ -$ -$ -$ -$ -$ -$ 83 February - -$ -$ -$ -$ -$ -$ -$ -$ 84 March - -$ -$ -$ -$ -$ -$ -$ -$ 85 April - -$ -$ -$ -$ -$ -$ -$ -$ 86 May - -$ -$ -$ -$ -$ -$ -$ -$ 87 June - -$ -$ -$ -$ -$ -$ -$ -$ 88 July - -$ -$ -$ -$ -$ -$ -$ -$ 89 August - -$ -$ -$ -$ -$ -$ -$ -$ 90 September - -$ -$ -$ -$ -$ -$ -$ -$ 91 October - -$ -$ -$ -$ -$ -$ -$ -$ 92 November - -$ -$ -$ -$ -$ -$ -$ -$ 93 December - -$ -$ -$ -$ -$ -$ -$ -$ 94 January - -$ -$ -$ -$ -$ -$ -$ -$ 95 February - -$ -$ -$ -$ -$ -$ -$ -$ 96 March - -$ -$ -$ -$ -$ -$ -$ -$ 97 April - -$ -$ -$ -$ -$ -$ -$ -$ 98 May - -$ -$ -$ -$ -$ -$ -$ -$ 99 June - -$ -$ -$ -$ -$ -$ -$ -$
100 July - -$ -$ -$ -$ -$ -$ -$ -$ 101 August - -$ -$ -$ -$ -$ -$ -$ -$ 102 September - -$ -$ -$ -$ -$ -$ -$ -$ 103 October - -$ -$ -$ -$ -$ -$ -$ -$ 104 November - -$ -$ -$ -$ -$ -$ -$ -$ 105 December - -$ -$ -$ -$ -$ -$ -$ -$
106 13-Month Averages: -$
3c) Project:
Unloaded
Forecast Corporate Total Total Prior Period Over Heads Forecast Forecast Period
Line Month Year Expenditures Overheads CWIP Exp Plant Adds CWIP Closed Closed to PIS Period CWIP Incremental CWIP
107 December - --- --- --- --- --- --- $0 ---108 January - -$ -$ -$ -$ -$ -$ -$ -$ 109 February - -$ -$ -$ -$ -$ -$ -$ -$ 110 March - -$ -$ -$ -$ -$ -$ -$ -$ 111 April - -$ -$ -$ -$ -$ -$ -$ -$ 112 May - -$ -$ -$ -$ -$ -$ -$ -$ 113 June - -$ -$ -$ -$ -$ -$ -$ -$ 114 July - -$ -$ -$ -$ -$ -$ -$ -$ 115 August - -$ -$ -$ -$ -$ -$ -$ -$ 116 September - -$ -$ -$ -$ -$ -$ -$ -$ 117 October - -$ -$ -$ -$ -$ -$ -$ -$ 118 November - -$ -$ -$ -$ -$ -$ -$ -$ 119 December - -$ -$ -$ -$ -$ -$ -$ -$ 120 January - -$ -$ -$ -$ -$ -$ -$ -$ 121 February - -$ -$ -$ -$ -$ -$ -$ -$ 122 March - -$ -$ -$ -$ -$ -$ -$ -$ 123 April - -$ -$ -$ -$ -$ -$ -$ -$ 124 May - -$ -$ -$ -$ -$ -$ -$ -$ 125 June - -$ -$ -$ -$ -$ -$ -$ -$ 126 July - -$ -$ -$ -$ -$ -$ -$ -$ 127 August - -$ -$ -$ -$ -$ -$ -$ -$ 128 September - -$ -$ -$ -$ -$ -$ -$ -$ 129 October - -$ -$ -$ -$ -$ -$ -$ -$ 130 November - -$ -$ -$ -$ -$ -$ -$ -$ 131 December - -$ -$ -$ -$ -$ -$ -$ -$
132 13-Month Averages: -$
Devers to Colorado River
South of Kramer
10-CWIP

Schedule 10
CWIP
3d) Project:
Col 1 Col 2 Col 3 Col 4 Col 5 Col 6 Col 7 Col 8
= C1 * 16-Plnt Add Line 74 = C1 + C2
= (C4 - C5) *16-Plnt Add Line 74
= Prior Month C7+ C3 - C4 - C6
= C7 - Dec Prior Year C7
Unloaded
Forecast Corporate Total Total Prior Period Over Heads Forecast Forecast Period
Line Month Year Expenditures Overheads CWIP Exp Plant Adds CWIP Closed Closed to PIS Period CWIP Incremental CWIP
133 December - --- --- --- --- --- --- $0 ---134 January - -$ -$ -$ -$ -$ -$ -$ -$ 135 February - -$ -$ -$ -$ -$ -$ -$ -$ 136 March - -$ -$ -$ -$ -$ -$ -$ -$ 137 April - -$ -$ -$ -$ -$ -$ -$ -$ 138 May - -$ -$ -$ -$ -$ -$ -$ -$ 139 June - -$ -$ -$ -$ -$ -$ -$ -$ 140 July - -$ -$ -$ -$ -$ -$ -$ -$ 141 August - -$ -$ -$ -$ -$ -$ -$ -$ 142 September - -$ -$ -$ -$ -$ -$ -$ -$ 143 October - -$ -$ -$ -$ -$ -$ -$ -$ 144 November - -$ -$ -$ -$ -$ -$ -$ -$ 145 December - -$ -$ -$ -$ -$ -$ -$ -$ 146 January - -$ -$ -$ -$ -$ -$ -$ -$ 147 February - -$ -$ -$ -$ -$ -$ -$ -$ 148 March - -$ -$ -$ -$ -$ -$ -$ -$ 149 April - -$ -$ -$ -$ -$ -$ -$ -$ 150 May - -$ -$ -$ -$ -$ -$ -$ -$ 151 June - -$ -$ -$ -$ -$ -$ -$ -$ 152 July - -$ -$ -$ -$ -$ -$ -$ -$ 153 August - -$ -$ -$ -$ -$ -$ -$ -$ 154 September - -$ -$ -$ -$ -$ -$ -$ -$ 155 October - -$ -$ -$ -$ -$ -$ -$ -$ 156 November - -$ -$ -$ -$ -$ -$ -$ -$ 157 December - -$ -$ -$ -$ -$ -$ -$ -$
158 13-Month Averages: -$
3e) Project:
Unloaded
Forecast Corporate Total Total Prior Period Over Heads Forecast Forecast Period
Line Month Year Expenditures Overheads CWIP Exp Plant Adds CWIP Closed Closed to PIS Period CWIP Incremental CWIP
159 December - --- --- --- --- --- --- $0 ---160 January - -$ -$ -$ -$ -$ -$ -$ -$ 161 February - -$ -$ -$ -$ -$ -$ -$ -$ 162 March - -$ -$ -$ -$ -$ -$ -$ -$ 163 April - -$ -$ -$ -$ -$ -$ -$ -$ 164 May - -$ -$ -$ -$ -$ -$ -$ -$ 165 June - -$ -$ -$ -$ -$ -$ -$ -$ 166 July - -$ -$ -$ -$ -$ -$ -$ -$ 167 August - -$ -$ -$ -$ -$ -$ -$ -$ 168 September - -$ -$ -$ -$ -$ -$ -$ -$ 169 October - -$ -$ -$ -$ -$ -$ -$ -$ 170 November - -$ -$ -$ -$ -$ -$ -$ -$ 171 December - -$ -$ -$ -$ -$ -$ -$ -$ 172 January - -$ -$ -$ -$ -$ -$ -$ -$ 173 February - -$ -$ -$ -$ -$ -$ -$ -$ 174 March - -$ -$ -$ -$ -$ -$ -$ -$ 175 April - -$ -$ -$ -$ -$ -$ -$ -$ 176 May - -$ -$ -$ -$ -$ -$ -$ -$ 177 June - -$ -$ -$ -$ -$ -$ -$ -$ 178 July - -$ -$ -$ -$ -$ -$ -$ -$ 179 August - -$ -$ -$ -$ -$ -$ -$ -$ 180 September - -$ -$ -$ -$ -$ -$ -$ -$ 181 October - -$ -$ -$ -$ -$ -$ -$ -$ 182 November - -$ -$ -$ -$ -$ -$ -$ -$ 183 December - -$ -$ -$ -$ -$ -$ -$ -$
184 13-Month Averages: -$
West of Devers
Red Bluff
10-CWIP
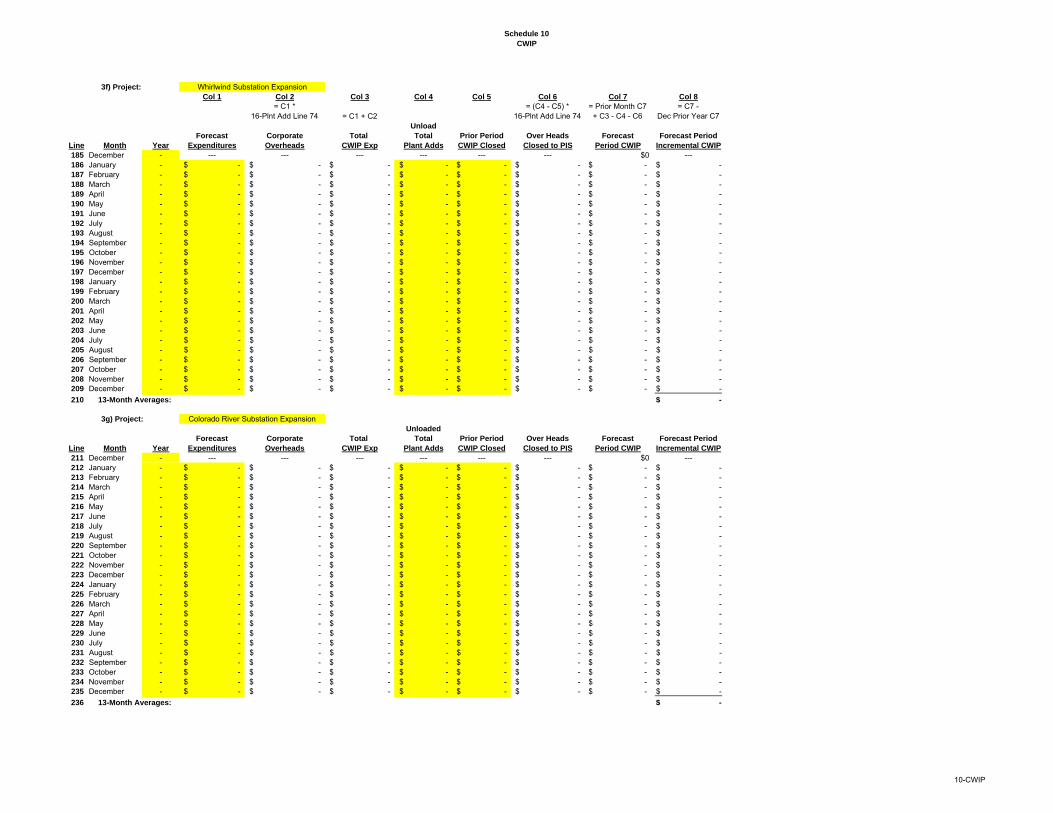
Schedule 10
CWIP
3f) Project:
Col 1 Col 2 Col 3 Col 4 Col 5 Col 6 Col 7 Col 8
= C1 * 16-Plnt Add Line 74 = C1 + C2
= (C4 - C5) *16-Plnt Add Line 74
= Prior Month C7+ C3 - C4 - C6
= C7 - Dec Prior Year C7
Unload
Forecast Corporate Total Total Prior Period Over Heads Forecast Forecast Period
Line Month Year Expenditures Overheads CWIP Exp Plant Adds CWIP Closed Closed to PIS Period CWIP Incremental CWIP
185 December - --- --- --- --- --- --- $0 ---186 January - -$ -$ -$ -$ -$ -$ -$ -$ 187 February - -$ -$ -$ -$ -$ -$ -$ -$ 188 March - -$ -$ -$ -$ -$ -$ -$ -$ 189 April - -$ -$ -$ -$ -$ -$ -$ -$ 190 May - -$ -$ -$ -$ -$ -$ -$ -$ 191 June - -$ -$ -$ -$ -$ -$ -$ -$ 192 July - -$ -$ -$ -$ -$ -$ -$ -$ 193 August - -$ -$ -$ -$ -$ -$ -$ -$ 194 September - -$ -$ -$ -$ -$ -$ -$ -$ 195 October - -$ -$ -$ -$ -$ -$ -$ -$ 196 November - -$ -$ -$ -$ -$ -$ -$ -$ 197 December - -$ -$ -$ -$ -$ -$ -$ -$ 198 January - -$ -$ -$ -$ -$ -$ -$ -$ 199 February - -$ -$ -$ -$ -$ -$ -$ -$ 200 March - -$ -$ -$ -$ -$ -$ -$ -$ 201 April - -$ -$ -$ -$ -$ -$ -$ -$ 202 May - -$ -$ -$ -$ -$ -$ -$ -$ 203 June - -$ -$ -$ -$ -$ -$ -$ -$ 204 July - -$ -$ -$ -$ -$ -$ -$ -$ 205 August - -$ -$ -$ -$ -$ -$ -$ -$ 206 September - -$ -$ -$ -$ -$ -$ -$ -$ 207 October - -$ -$ -$ -$ -$ -$ -$ -$ 208 November - -$ -$ -$ -$ -$ -$ -$ -$ 209 December - -$ -$ -$ -$ -$ -$ -$ -$
210 13-Month Averages: -$
3g) Project:
Unloaded
Forecast Corporate Total Total Prior Period Over Heads Forecast Forecast Period
Line Month Year Expenditures Overheads CWIP Exp Plant Adds CWIP Closed Closed to PIS Period CWIP Incremental CWIP
211 December - --- --- --- --- --- --- $0 ---212 January - -$ -$ -$ -$ -$ -$ -$ -$ 213 February - -$ -$ -$ -$ -$ -$ -$ -$ 214 March - -$ -$ -$ -$ -$ -$ -$ -$ 215 April - -$ -$ -$ -$ -$ -$ -$ -$ 216 May - -$ -$ -$ -$ -$ -$ -$ -$ 217 June - -$ -$ -$ -$ -$ -$ -$ -$ 218 July - -$ -$ -$ -$ -$ -$ -$ -$ 219 August - -$ -$ -$ -$ -$ -$ -$ -$ 220 September - -$ -$ -$ -$ -$ -$ -$ -$ 221 October - -$ -$ -$ -$ -$ -$ -$ -$ 222 November - -$ -$ -$ -$ -$ -$ -$ -$ 223 December - -$ -$ -$ -$ -$ -$ -$ -$ 224 January - -$ -$ -$ -$ -$ -$ -$ -$ 225 February - -$ -$ -$ -$ -$ -$ -$ -$ 226 March - -$ -$ -$ -$ -$ -$ -$ -$ 227 April - -$ -$ -$ -$ -$ -$ -$ -$ 228 May - -$ -$ -$ -$ -$ -$ -$ -$ 229 June - -$ -$ -$ -$ -$ -$ -$ -$ 230 July - -$ -$ -$ -$ -$ -$ -$ -$ 231 August - -$ -$ -$ -$ -$ -$ -$ -$ 232 September - -$ -$ -$ -$ -$ -$ -$ -$ 233 October - -$ -$ -$ -$ -$ -$ -$ -$ 234 November - -$ -$ -$ -$ -$ -$ -$ -$ 235 December - -$ -$ -$ -$ -$ -$ -$ -$
236 13-Month Averages: -$
Colorado River Substation Expansion
Whirlwind Substation Expansion
10-CWIP
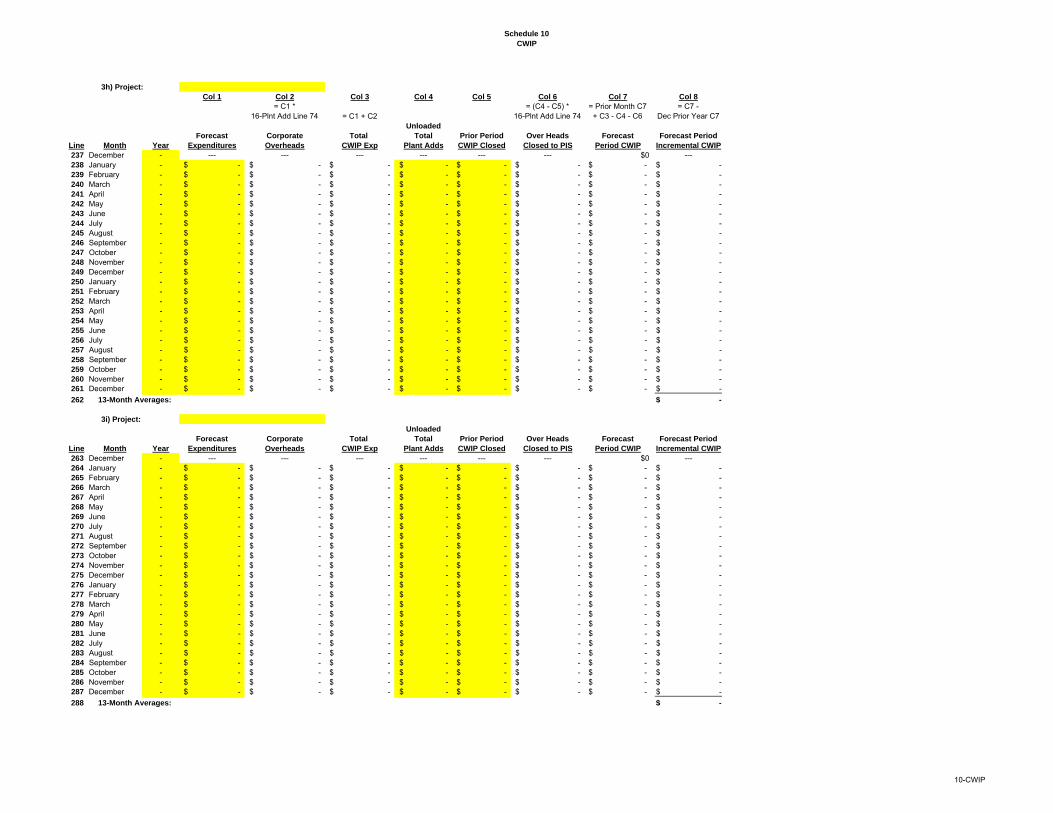
Schedule 10
CWIP
3h) Project:
Col 1 Col 2 Col 3 Col 4 Col 5 Col 6 Col 7 Col 8
= C1 * 16-Plnt Add Line 74 = C1 + C2
= (C4 - C5) *16-Plnt Add Line 74
= Prior Month C7+ C3 - C4 - C6
= C7 - Dec Prior Year C7
Unloaded
Forecast Corporate Total Total Prior Period Over Heads Forecast Forecast Period
Line Month Year Expenditures Overheads CWIP Exp Plant Adds CWIP Closed Closed to PIS Period CWIP Incremental CWIP
237 December - --- --- --- --- --- --- $0 ---238 January - -$ -$ -$ -$ -$ -$ -$ -$ 239 February - -$ -$ -$ -$ -$ -$ -$ -$ 240 March - -$ -$ -$ -$ -$ -$ -$ -$ 241 April - -$ -$ -$ -$ -$ -$ -$ -$ 242 May - -$ -$ -$ -$ -$ -$ -$ -$ 243 June - -$ -$ -$ -$ -$ -$ -$ -$ 244 July - -$ -$ -$ -$ -$ -$ -$ -$ 245 August - -$ -$ -$ -$ -$ -$ -$ -$ 246 September - -$ -$ -$ -$ -$ -$ -$ -$ 247 October - -$ -$ -$ -$ -$ -$ -$ -$ 248 November - -$ -$ -$ -$ -$ -$ -$ -$ 249 December - -$ -$ -$ -$ -$ -$ -$ -$ 250 January - -$ -$ -$ -$ -$ -$ -$ -$ 251 February - -$ -$ -$ -$ -$ -$ -$ -$ 252 March - -$ -$ -$ -$ -$ -$ -$ -$ 253 April - -$ -$ -$ -$ -$ -$ -$ -$ 254 May - -$ -$ -$ -$ -$ -$ -$ -$ 255 June - -$ -$ -$ -$ -$ -$ -$ -$ 256 July - -$ -$ -$ -$ -$ -$ -$ -$ 257 August - -$ -$ -$ -$ -$ -$ -$ -$ 258 September - -$ -$ -$ -$ -$ -$ -$ -$ 259 October - -$ -$ -$ -$ -$ -$ -$ -$ 260 November - -$ -$ -$ -$ -$ -$ -$ -$ 261 December - -$ -$ -$ -$ -$ -$ -$ -$
262 13-Month Averages: -$
3i) Project:
Unloaded
Forecast Corporate Total Total Prior Period Over Heads Forecast Forecast Period
Line Month Year Expenditures Overheads CWIP Exp Plant Adds CWIP Closed Closed to PIS Period CWIP Incremental CWIP
263 December - --- --- --- --- --- --- $0 ---264 January - -$ -$ -$ -$ -$ -$ -$ -$ 265 February - -$ -$ -$ -$ -$ -$ -$ -$ 266 March - -$ -$ -$ -$ -$ -$ -$ -$ 267 April - -$ -$ -$ -$ -$ -$ -$ -$ 268 May - -$ -$ -$ -$ -$ -$ -$ -$ 269 June - -$ -$ -$ -$ -$ -$ -$ -$ 270 July - -$ -$ -$ -$ -$ -$ -$ -$ 271 August - -$ -$ -$ -$ -$ -$ -$ -$ 272 September - -$ -$ -$ -$ -$ -$ -$ -$ 273 October - -$ -$ -$ -$ -$ -$ -$ -$ 274 November - -$ -$ -$ -$ -$ -$ -$ -$ 275 December - -$ -$ -$ -$ -$ -$ -$ -$ 276 January - -$ -$ -$ -$ -$ -$ -$ -$ 277 February - -$ -$ -$ -$ -$ -$ -$ -$ 278 March - -$ -$ -$ -$ -$ -$ -$ -$ 279 April - -$ -$ -$ -$ -$ -$ -$ -$ 280 May - -$ -$ -$ -$ -$ -$ -$ -$ 281 June - -$ -$ -$ -$ -$ -$ -$ -$ 282 July - -$ -$ -$ -$ -$ -$ -$ -$ 283 August - -$ -$ -$ -$ -$ -$ -$ -$ 284 September - -$ -$ -$ -$ -$ -$ -$ -$ 285 October - -$ -$ -$ -$ -$ -$ -$ -$ 286 November - -$ -$ -$ -$ -$ -$ -$ -$ 287 December - -$ -$ -$ -$ -$ -$ -$ -$
288 13-Month Averages: -$
10-CWIP
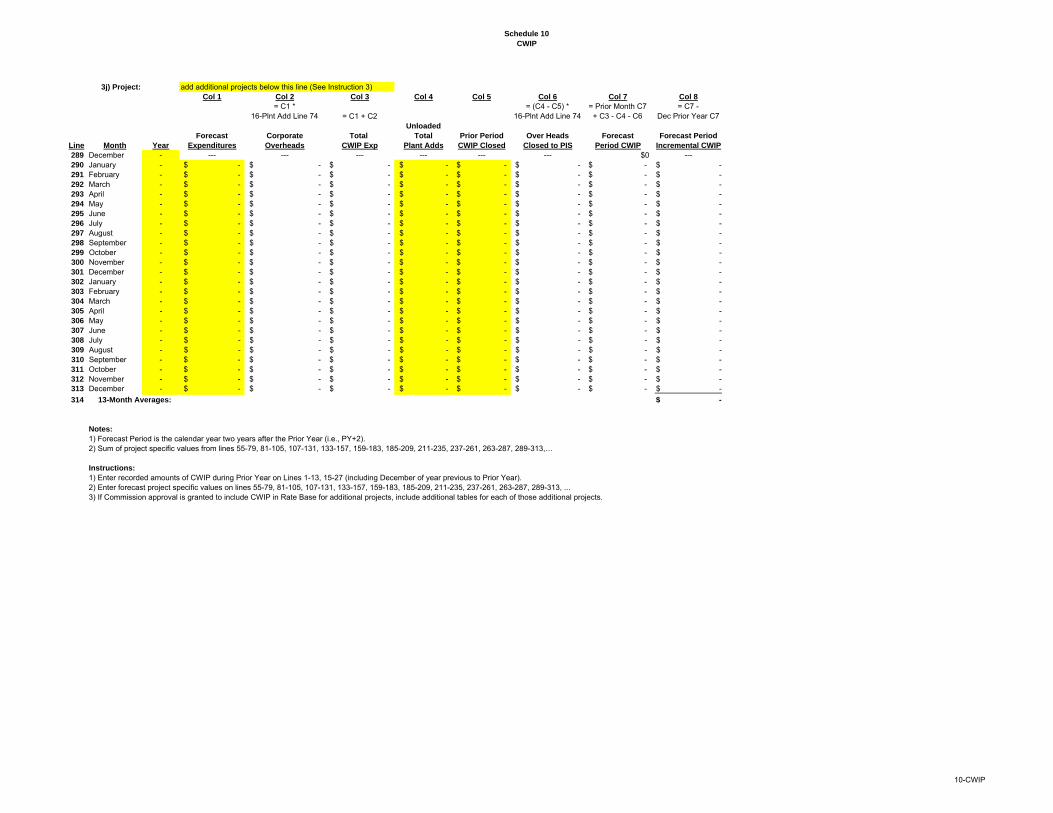
Schedule 10
CWIP
3j) Project: add additional projects below this line (See Instruction 3)Col 1 Col 2 Col 3 Col 4 Col 5 Col 6 Col 7 Col 8
= C1 * 16-Plnt Add Line 74 = C1 + C2
= (C4 - C5) *16-Plnt Add Line 74
= Prior Month C7+ C3 - C4 - C6
= C7 - Dec Prior Year C7
Unloaded
Forecast Corporate Total Total Prior Period Over Heads Forecast Forecast Period
Line Month Year Expenditures Overheads CWIP Exp Plant Adds CWIP Closed Closed to PIS Period CWIP Incremental CWIP
289 December - --- --- --- --- --- --- $0 ---290 January - -$ -$ -$ -$ -$ -$ -$ -$ 291 February - -$ -$ -$ -$ -$ -$ -$ -$ 292 March - -$ -$ -$ -$ -$ -$ -$ -$ 293 April - -$ -$ -$ -$ -$ -$ -$ -$ 294 May - -$ -$ -$ -$ -$ -$ -$ -$ 295 June - -$ -$ -$ -$ -$ -$ -$ -$ 296 July - -$ -$ -$ -$ -$ -$ -$ -$ 297 August - -$ -$ -$ -$ -$ -$ -$ -$ 298 September - -$ -$ -$ -$ -$ -$ -$ -$ 299 October - -$ -$ -$ -$ -$ -$ -$ -$ 300 November - -$ -$ -$ -$ -$ -$ -$ -$ 301 December - -$ -$ -$ -$ -$ -$ -$ -$ 302 January - -$ -$ -$ -$ -$ -$ -$ -$ 303 February - -$ -$ -$ -$ -$ -$ -$ -$ 304 March - -$ -$ -$ -$ -$ -$ -$ -$ 305 April - -$ -$ -$ -$ -$ -$ -$ -$ 306 May - -$ -$ -$ -$ -$ -$ -$ -$ 307 June - -$ -$ -$ -$ -$ -$ -$ -$ 308 July - -$ -$ -$ -$ -$ -$ -$ -$ 309 August - -$ -$ -$ -$ -$ -$ -$ -$ 310 September - -$ -$ -$ -$ -$ -$ -$ -$ 311 October - -$ -$ -$ -$ -$ -$ -$ -$ 312 November - -$ -$ -$ -$ -$ -$ -$ -$ 313 December - -$ -$ -$ -$ -$ -$ -$ -$
314 13-Month Averages: -$
Notes:
1) Forecast Period is the calendar year two years after the Prior Year (i.e., PY+2). 2) Sum of project specific values from lines 55-79, 81-105, 107-131, 133-157, 159-183, 185-209, 211-235, 237-261, 263-287, 289-313,…
Instructions:
1) Enter recorded amounts of CWIP during Prior Year on Lines 1-13, 15-27 (including December of year previous to Prior Year).2) Enter forecast project specific values on lines 55-79, 81-105, 107-131, 133-157, 159-183, 185-209, 211-235, 237-261, 263-287, 289-313, ...3) If Commission approval is granted to include CWIP in Rate Base for additional projects, include additional tables for each of those additional projects.
10-CWIP
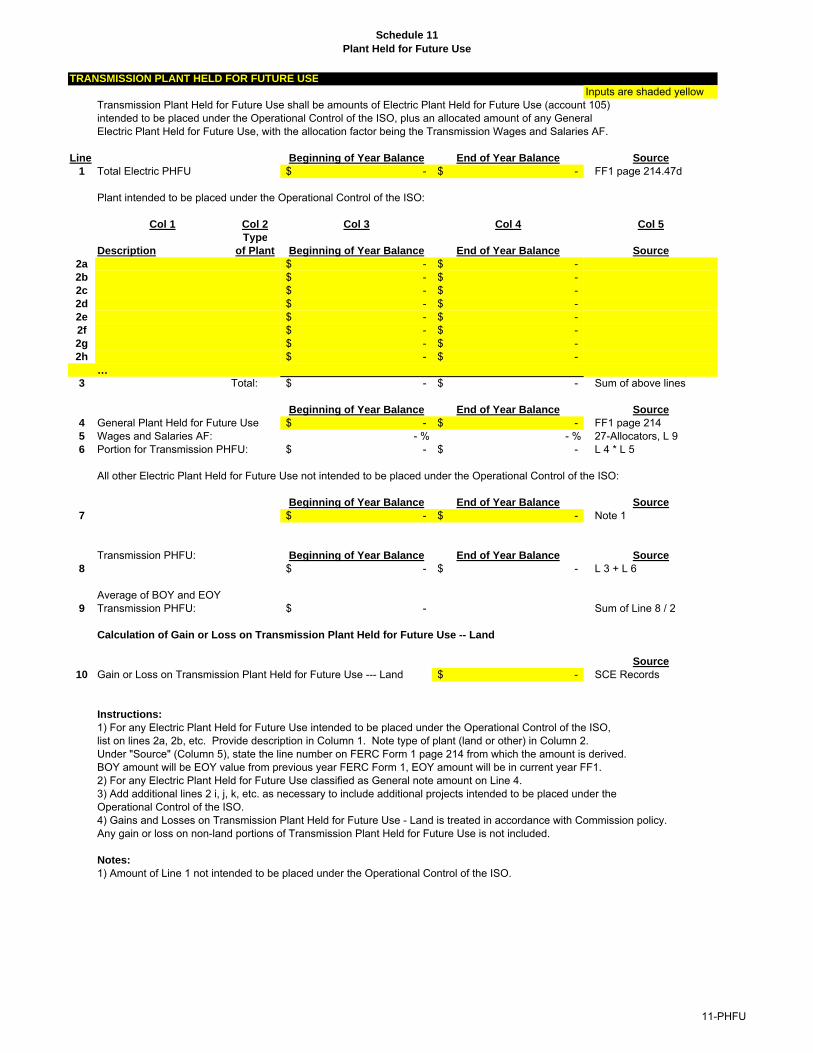
Schedule 11
Plant Held for Future Use
TRANSMISSION PLANT HELD FOR FUTURE USE
Inputs are shaded yellowTransmission Plant Held for Future Use shall be amounts of Electric Plant Held for Future Use (account 105)intended to be placed under the Operational Control of the ISO, plus an allocated amount of any GeneralElectric Plant Held for Future Use, with the allocation factor being the Transmission Wages and Salaries AF.
Line Beginning of Year Balance End of Year Balance Source
1 Total Electric PHFU -$ -$ FF1 page 214.47d
Plant intended to be placed under the Operational Control of the ISO:
Col 1 Col 2 Col 3 Col 4 Col 5
Type
Description of Plant Beginning of Year Balance End of Year Balance Source
2a -$ -$ 2b -$ -$ 2c -$ -$ 2d -$ -$ 2e -$ -$ 2f -$ -$ 2g -$ -$ 2h -$ -$
…
3 Total: -$ -$ Sum of above lines
Beginning of Year Balance End of Year Balance Source
4 General Plant Held for Future Use -$ -$ FF1 page 2145 Wages and Salaries AF: - % - % 27-Allocators, L 96 Portion for Transmission PHFU: -$ -$ L 4 * L 5
All other Electric Plant Held for Future Use not intended to be placed under the Operational Control of the ISO:
Beginning of Year Balance End of Year Balance Source
7 -$ -$ Note 1
Transmission PHFU: Beginning of Year Balance End of Year Balance Source
8 -$ -$ L 3 + L 6
Average of BOY and EOY9 Transmission PHFU: -$ Sum of Line 8 / 2
Calculation of Gain or Loss on Transmission Plant Held for Future Use -- Land
Source
10 Gain or Loss on Transmission Plant Held for Future Use --- Land -$ SCE Records
Instructions:
1) For any Electric Plant Held for Future Use intended to be placed under the Operational Control of the ISO,list on lines 2a, 2b, etc. Provide description in Column 1. Note type of plant (land or other) in Column 2.Under "Source" (Column 5), state the line number on FERC Form 1 page 214 from which the amount is derived.BOY amount will be EOY value from previous year FERC Form 1, EOY amount will be in current year FF1.2) For any Electric Plant Held for Future Use classified as General note amount on Line 4.3) Add additional lines 2 i, j, k, etc. as necessary to include additional projects intended to be placed under the Operational Control of the ISO.4) Gains and Losses on Transmission Plant Held for Future Use - Land is treated in accordance with Commission policy.Any gain or loss on non-land portions of Transmission Plant Held for Future Use is not included.
Notes:
1) Amount of Line 1 not intended to be placed under the Operational Control of the ISO.
11-PHFU
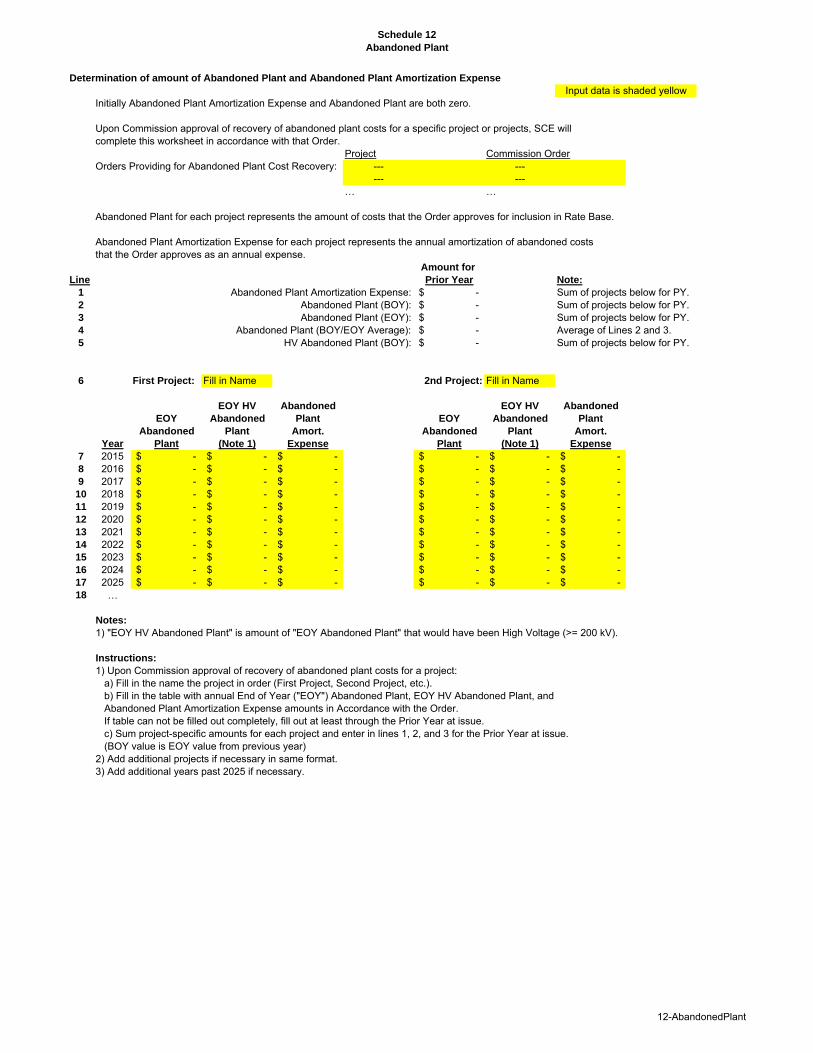
Schedule 12
Abandoned Plant
Determination of amount of Abandoned Plant and Abandoned Plant Amortization Expense
Input data is shaded yellowInitially Abandoned Plant Amortization Expense and Abandoned Plant are both zero.
Upon Commission approval of recovery of abandoned plant costs for a specific project or projects, SCE willcomplete this worksheet in accordance with that Order.
Project Commission OrderOrders Providing for Abandoned Plant Cost Recovery: --- ---
--- ---… …
Abandoned Plant for each project represents the amount of costs that the Order approves for inclusion in Rate Base.
Abandoned Plant Amortization Expense for each project represents the annual amortization of abandoned costs that the Order approves as an annual expense.
Amount for
Line Prior Year Note:
1 Abandoned Plant Amortization Expense: -$ Sum of projects below for PY.2 Abandoned Plant (BOY): -$ Sum of projects below for PY.3 Abandoned Plant (EOY): -$ Sum of projects below for PY.4 Abandoned Plant (BOY/EOY Average): -$ Average of Lines 2 and 3.5 HV Abandoned Plant (BOY): -$ Sum of projects below for PY.
6 First Project: Fill in Name 2nd Project: Fill in Name
EOY HV Abandoned EOY HV Abandoned
EOY Abandoned Plant EOY Abandoned Plant
Abandoned Plant Amort. Abandoned Plant Amort.
Year Plant (Note 1) Expense Plant (Note 1) Expense
7 2015 -$ -$ -$ -$ -$ -$ 8 2016 -$ -$ -$ -$ -$ -$ 9 2017 -$ -$ -$ -$ -$ -$
10 2018 -$ -$ -$ -$ -$ -$ 11 2019 -$ -$ -$ -$ -$ -$ 12 2020 -$ -$ -$ -$ -$ -$ 13 2021 -$ -$ -$ -$ -$ -$ 14 2022 -$ -$ -$ -$ -$ -$ 15 2023 -$ -$ -$ -$ -$ -$ 16 2024 -$ -$ -$ -$ -$ -$ 17 2025 -$ -$ -$ -$ -$ -$ 18 …
Notes:
1) "EOY HV Abandoned Plant" is amount of "EOY Abandoned Plant" that would have been High Voltage (>= 200 kV).
Instructions:
1) Upon Commission approval of recovery of abandoned plant costs for a project:a) Fill in the name the project in order (First Project, Second Project, etc.).b) Fill in the table with annual End of Year ("EOY") Abandoned Plant, EOY HV Abandoned Plant, andAbandoned Plant Amortization Expense amounts in Accordance with the Order.If table can not be filled out completely, fill out at least through the Prior Year at issue.c) Sum project-specific amounts for each project and enter in lines 1, 2, and 3 for the Prior Year at issue.(BOY value is EOY value from previous year)
2) Add additional projects if necessary in same format.3) Add additional years past 2025 if necessary.
12-AbandonedPlant
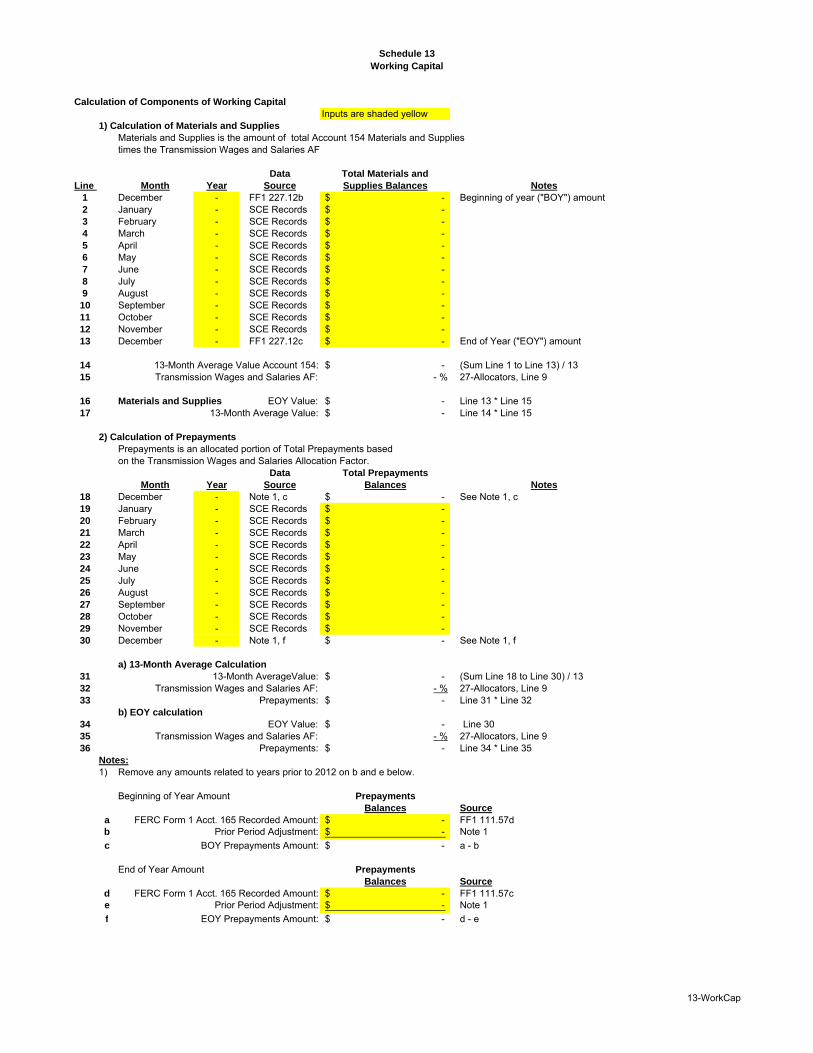
Schedule 13
Working Capital
Calculation of Components of Working Capital
Inputs are shaded yellow1) Calculation of Materials and Supplies
Materials and Supplies is the amount of total Account 154 Materials and Supplies times the Transmission Wages and Salaries AF
Data Total Materials and
Line Month Year Source Supplies Balances Notes
1 December - FF1 227.12b -$ Beginning of year ("BOY") amount2 January - SCE Records -$ 3 February - SCE Records -$ 4 March - SCE Records -$ 5 April - SCE Records -$ 6 May - SCE Records -$ 7 June - SCE Records -$ 8 July - SCE Records -$ 9 August - SCE Records -$ 10 September - SCE Records -$ 11 October - SCE Records -$ 12 November - SCE Records -$ 13 December - FF1 227.12c -$ End of Year ("EOY") amount
14 13-Month Average Value Account 154: -$ (Sum Line 1 to Line 13) / 1315 Transmission Wages and Salaries AF: - % 27-Allocators, Line 9
16 Materials and Supplies EOY Value: -$ Line 13 * Line 1517 13-Month Average Value: -$ Line 14 * Line 15
2) Calculation of Prepayments
Prepayments is an allocated portion of Total Prepayments based on the Transmission Wages and Salaries Allocation Factor.
Data Total Prepayments
Month Year Source Balances Notes
18 December - Note 1, c -$ See Note 1, c19 January - SCE Records -$ 20 February - SCE Records -$ 21 March - SCE Records -$ 22 April - SCE Records -$ 23 May - SCE Records -$ 24 June - SCE Records -$ 25 July - SCE Records -$ 26 August - SCE Records -$ 27 September - SCE Records -$ 28 October - SCE Records -$ 29 November - SCE Records -$ 30 December - Note 1, f -$ See Note 1, f
a) 13-Month Average Calculation
31 13-Month AverageValue: -$ (Sum Line 18 to Line 30) / 1332 Transmission Wages and Salaries AF: - % 27-Allocators, Line 933 Prepayments: -$ Line 31 * Line 32
b) EOY calculation
34 EOY Value: -$ Line 3035 Transmission Wages and Salaries AF: - % 27-Allocators, Line 936 Prepayments: -$ Line 34 * Line 35
Notes:
1) Remove any amounts related to years prior to 2012 on b and e below.
Beginning of Year Amount Prepayments
Balances Source
a FERC Form 1 Acct. 165 Recorded Amount: -$ FF1 111.57db Prior Period Adjustment: -$ Note 1
c BOY Prepayments Amount: -$ a - b
End of Year Amount Prepayments
Balances Source
d FERC Form 1 Acct. 165 Recorded Amount: -$ FF1 111.57ce Prior Period Adjustment: -$ Note 1
f EOY Prepayments Amount: -$ d - e
13-WorkCap
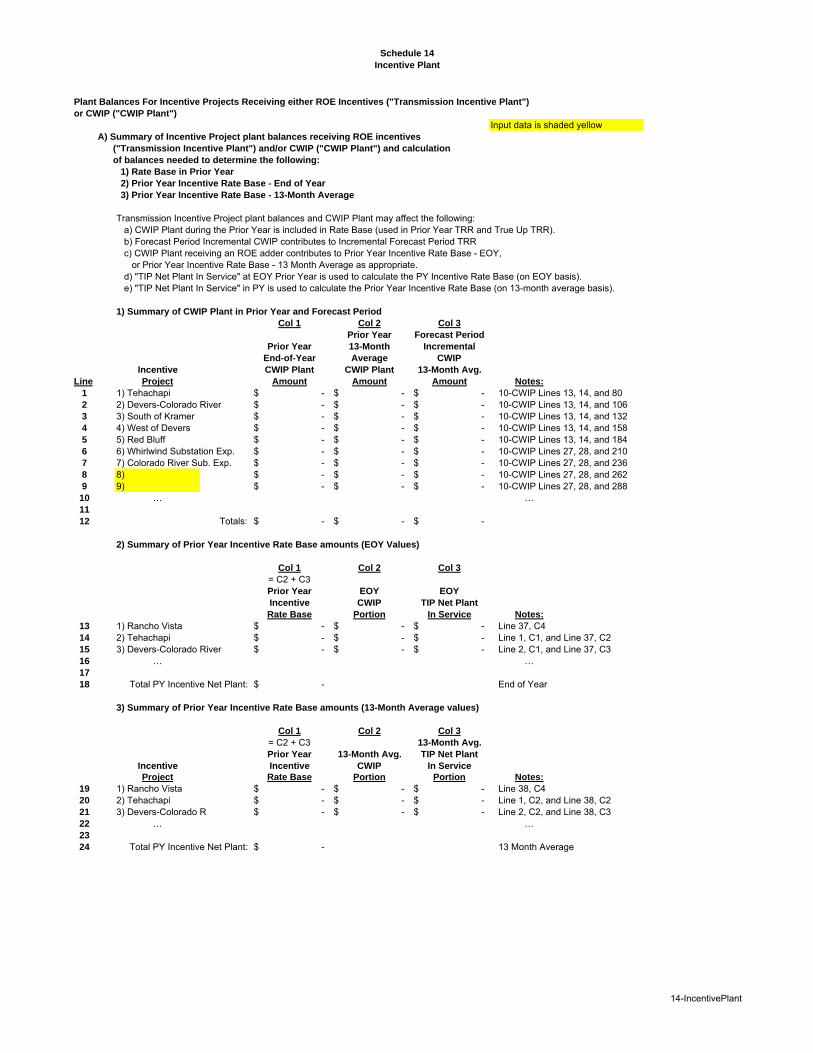
Schedule 14
Incentive Plant
Plant Balances For Incentive Projects Receiving either ROE Incentives ("Transmission Incentive Plant")
or CWIP ("CWIP Plant")
Input data is shaded yellowA) Summary of Incentive Project plant balances receiving ROE incentives
("Transmission Incentive Plant") and/or CWIP ("CWIP Plant") and calculation
of balances needed to determine the following:
1) Rate Base in Prior Year
2) Prior Year Incentive Rate Base - End of Year
3) Prior Year Incentive Rate Base - 13-Month Average
Transmission Incentive Project plant balances and CWIP Plant may affect the following: a) CWIP Plant during the Prior Year is included in Rate Base (used in Prior Year TRR and True Up TRR).b) Forecast Period Incremental CWIP contributes to Incremental Forecast Period TRR c) CWIP Plant receiving an ROE adder contributes to Prior Year Incentive Rate Base - EOY,
or Prior Year Incentive Rate Base - 13 Month Average as appropriate.d) "TIP Net Plant In Service" at EOY Prior Year is used to calculate the PY Incentive Rate Base (on EOY basis).e) "TIP Net Plant In Service" in PY is used to calculate the Prior Year Incentive Rate Base (on 13-month average basis).
1) Summary of CWIP Plant in Prior Year and Forecast Period
Col 1 Col 2 Col 3
Prior Year Forecast Period
Prior Year 13-Month Incremental
End-of-Year Average CWIP
Incentive CWIP Plant CWIP Plant 13-Month Avg.
Line Project Amount Amount Amount Notes:
1 1) Tehachapi -$ -$ -$ 10-CWIP Lines 13, 14, and 802 2) Devers-Colorado River -$ -$ -$ 10-CWIP Lines 13, 14, and 1063 3) South of Kramer -$ -$ -$ 10-CWIP Lines 13, 14, and 1324 4) West of Devers -$ -$ -$ 10-CWIP Lines 13, 14, and 1585 5) Red Bluff -$ -$ -$ 10-CWIP Lines 13, 14, and 1846 6) Whirlwind Substation Exp. -$ -$ -$ 10-CWIP Lines 27, 28, and 2107 7) Colorado River Sub. Exp. -$ -$ -$ 10-CWIP Lines 27, 28, and 2368 8) -$ -$ -$ 10-CWIP Lines 27, 28, and 2629 9) -$ -$ -$ 10-CWIP Lines 27, 28, and 28810 … …11
12 Totals: -$ -$ -$
2) Summary of Prior Year Incentive Rate Base amounts (EOY Values)
Col 1 Col 2 Col 3
= C2 + C3Prior Year EOY EOY
Incentive CWIP TIP Net Plant
Rate Base Portion In Service Notes:
13 1) Rancho Vista -$ -$ -$ Line 37, C414 2) Tehachapi -$ -$ -$ Line 1, C1, and Line 37, C215 3) Devers-Colorado River -$ -$ -$ Line 2, C1, and Line 37, C316 … …17
18 Total PY Incentive Net Plant: -$ End of Year
3) Summary of Prior Year Incentive Rate Base amounts (13-Month Average values)
Col 1 Col 2 Col 3
= C2 + C3 13-Month Avg.
Prior Year 13-Month Avg. TIP Net Plant
Incentive Incentive CWIP In Service
Project Rate Base Portion Portion Notes:
19 1) Rancho Vista -$ -$ -$ Line 38, C420 2) Tehachapi -$ -$ -$ Line 1, C2, and Line 38, C221 3) Devers-Colorado R -$ -$ -$ Line 2, C2, and Line 38, C322 … …23
24 Total PY Incentive Net Plant: -$ 13 Month Average
14-IncentivePlant
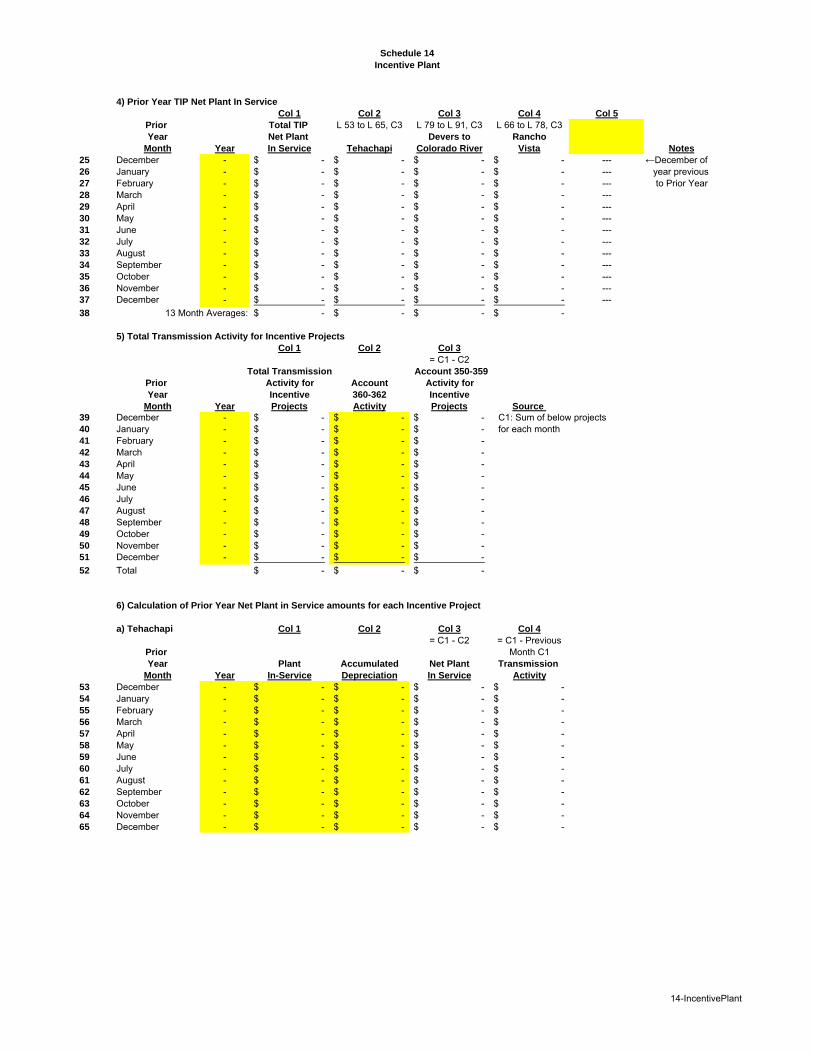
Schedule 14
Incentive Plant
4) Prior Year TIP Net Plant In Service
Col 1 Col 2 Col 3 Col 4 Col 5
Prior Total TIP L 53 to L 65, C3 L 79 to L 91, C3 L 66 to L 78, C3Year Net Plant Devers to Rancho
Month Year In Service Tehachapi Colorado River Vista Notes
25 December - -$ -$ -$ -$ --- ←December of26 January - -$ -$ -$ -$ --- year previous27 February - -$ -$ -$ -$ --- to Prior Year28 March - -$ -$ -$ -$ ---29 April - -$ -$ -$ -$ ---30 May - -$ -$ -$ -$ ---31 June - -$ -$ -$ -$ ---32 July - -$ -$ -$ -$ ---33 August - -$ -$ -$ -$ ---34 September - -$ -$ -$ -$ ---35 October - -$ -$ -$ -$ ---36 November - -$ -$ -$ -$ ---37 December - -$ -$ -$ -$ ---
38 13 Month Averages: -$ -$ -$ -$
5) Total Transmission Activity for Incentive Projects
Col 1 Col 2 Col 3
= C1 - C2Total Transmission Account 350-359
Prior Activity for Account Activity for
Year Incentive 360-362 Incentive
Month Year Projects Activity Projects Source
39 December - -$ -$ -$ C1: Sum of below projects40 January - -$ -$ -$ for each month41 February - -$ -$ -$ 42 March - -$ -$ -$ 43 April - -$ -$ -$ 44 May - -$ -$ -$ 45 June - -$ -$ -$ 46 July - -$ -$ -$ 47 August - -$ -$ -$ 48 September - -$ -$ -$ 49 October - -$ -$ -$ 50 November - -$ -$ -$ 51 December - -$ -$ -$
52 Total -$ -$ -$
6) Calculation of Prior Year Net Plant in Service amounts for each Incentive Project
a) Tehachapi Col 1 Col 2 Col 3 Col 4
= C1 - C2 = C1 - PreviousPrior Month C1Year Plant Accumulated Net Plant Transmission
Month Year In-Service Depreciation In Service Activity
53 December - -$ -$ -$ -$ 54 January - -$ -$ -$ -$ 55 February - -$ -$ -$ -$ 56 March - -$ -$ -$ -$ 57 April - -$ -$ -$ -$ 58 May - -$ -$ -$ -$ 59 June - -$ -$ -$ -$ 60 July - -$ -$ -$ -$ 61 August - -$ -$ -$ -$ 62 September - -$ -$ -$ -$ 63 October - -$ -$ -$ -$ 64 November - -$ -$ -$ -$ 65 December - -$ -$ -$ -$
14-IncentivePlant
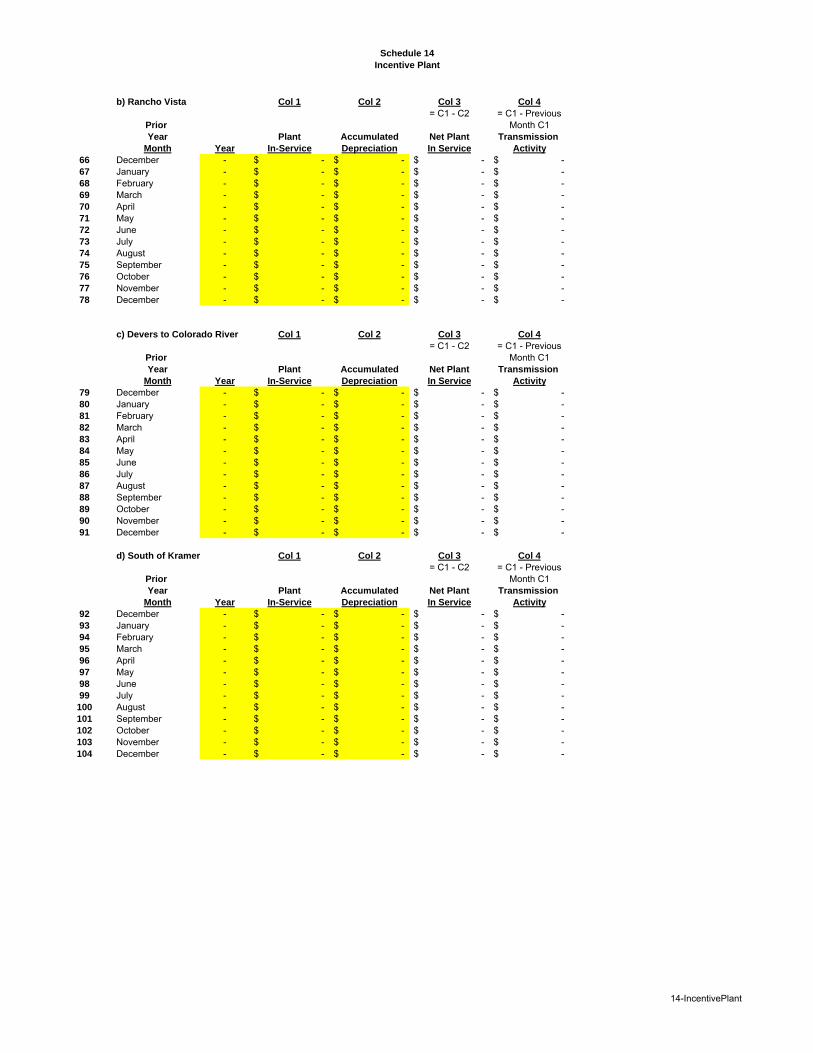
Schedule 14
Incentive Plant
b) Rancho Vista Col 1 Col 2 Col 3 Col 4
= C1 - C2 = C1 - PreviousPrior Month C1Year Plant Accumulated Net Plant Transmission
Month Year In-Service Depreciation In Service Activity
66 December - -$ -$ -$ -$ 67 January - -$ -$ -$ -$ 68 February - -$ -$ -$ -$ 69 March - -$ -$ -$ -$ 70 April - -$ -$ -$ -$ 71 May - -$ -$ -$ -$ 72 June - -$ -$ -$ -$ 73 July - -$ -$ -$ -$ 74 August - -$ -$ -$ -$ 75 September - -$ -$ -$ -$ 76 October - -$ -$ -$ -$ 77 November - -$ -$ -$ -$ 78 December - -$ -$ -$ -$
c) Devers to Colorado River Col 1 Col 2 Col 3 Col 4
= C1 - C2 = C1 - PreviousPrior Month C1Year Plant Accumulated Net Plant Transmission
Month Year In-Service Depreciation In Service Activity
79 December - -$ -$ -$ -$ 80 January - -$ -$ -$ -$ 81 February - -$ -$ -$ -$ 82 March - -$ -$ -$ -$ 83 April - -$ -$ -$ -$ 84 May - -$ -$ -$ -$ 85 June - -$ -$ -$ -$ 86 July - -$ -$ -$ -$ 87 August - -$ -$ -$ -$ 88 September - -$ -$ -$ -$ 89 October - -$ -$ -$ -$ 90 November - -$ -$ -$ -$ 91 December - -$ -$ -$ -$
d) South of Kramer Col 1 Col 2 Col 3 Col 4
= C1 - C2 = C1 - PreviousPrior Month C1Year Plant Accumulated Net Plant Transmission
Month Year In-Service Depreciation In Service Activity
92 December - -$ -$ -$ -$ 93 January - -$ -$ -$ -$ 94 February - -$ -$ -$ -$ 95 March - -$ -$ -$ -$ 96 April - -$ -$ -$ -$ 97 May - -$ -$ -$ -$ 98 June - -$ -$ -$ -$ 99 July - -$ -$ -$ -$ 100 August - -$ -$ -$ -$ 101 September - -$ -$ -$ -$ 102 October - -$ -$ -$ -$ 103 November - -$ -$ -$ -$ 104 December - -$ -$ -$ -$
14-IncentivePlant
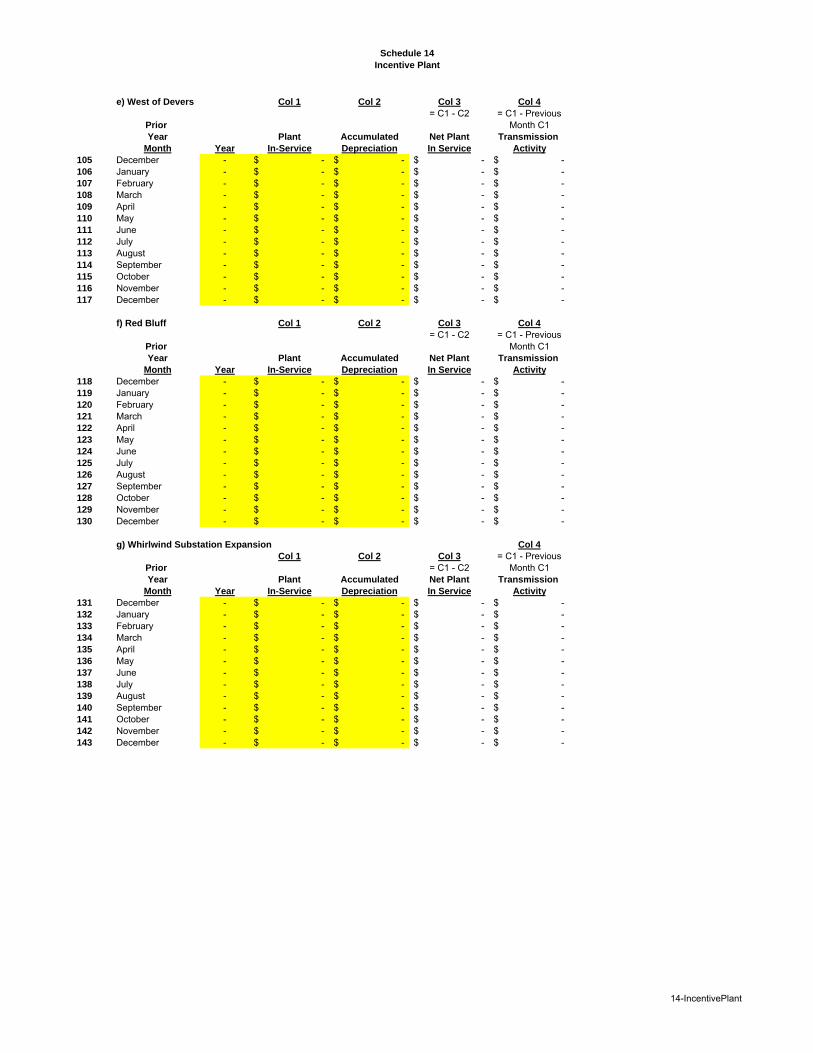
Schedule 14
Incentive Plant
e) West of Devers Col 1 Col 2 Col 3 Col 4
= C1 - C2 = C1 - PreviousPrior Month C1Year Plant Accumulated Net Plant Transmission
Month Year In-Service Depreciation In Service Activity
105 December - -$ -$ -$ -$ 106 January - -$ -$ -$ -$ 107 February - -$ -$ -$ -$ 108 March - -$ -$ -$ -$ 109 April - -$ -$ -$ -$ 110 May - -$ -$ -$ -$ 111 June - -$ -$ -$ -$ 112 July - -$ -$ -$ -$ 113 August - -$ -$ -$ -$ 114 September - -$ -$ -$ -$ 115 October - -$ -$ -$ -$ 116 November - -$ -$ -$ -$ 117 December - -$ -$ -$ -$
f) Red Bluff Col 1 Col 2 Col 3 Col 4
= C1 - C2 = C1 - PreviousPrior Month C1Year Plant Accumulated Net Plant Transmission
Month Year In-Service Depreciation In Service Activity
118 December - -$ -$ -$ -$ 119 January - -$ -$ -$ -$ 120 February - -$ -$ -$ -$ 121 March - -$ -$ -$ -$ 122 April - -$ -$ -$ -$ 123 May - -$ -$ -$ -$ 124 June - -$ -$ -$ -$ 125 July - -$ -$ -$ -$ 126 August - -$ -$ -$ -$ 127 September - -$ -$ -$ -$ 128 October - -$ -$ -$ -$ 129 November - -$ -$ -$ -$ 130 December - -$ -$ -$ -$
g) Whirlwind Substation Expansion Col 4
Col 1 Col 2 Col 3 = C1 - PreviousPrior = C1 - C2 Month C1Year Plant Accumulated Net Plant Transmission
Month Year In-Service Depreciation In Service Activity
131 December - -$ -$ -$ -$ 132 January - -$ -$ -$ -$ 133 February - -$ -$ -$ -$ 134 March - -$ -$ -$ -$ 135 April - -$ -$ -$ -$ 136 May - -$ -$ -$ -$ 137 June - -$ -$ -$ -$ 138 July - -$ -$ -$ -$ 139 August - -$ -$ -$ -$ 140 September - -$ -$ -$ -$ 141 October - -$ -$ -$ -$ 142 November - -$ -$ -$ -$ 143 December - -$ -$ -$ -$
14-IncentivePlant
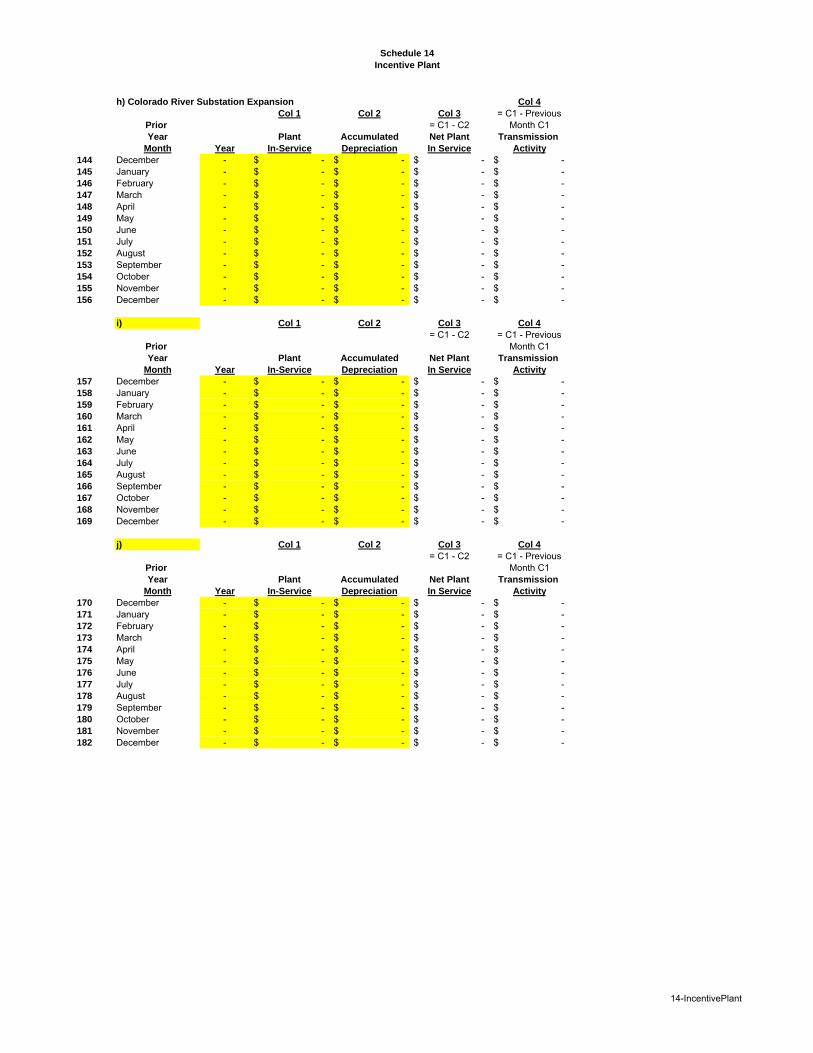
Schedule 14
Incentive Plant
h) Colorado River Substation Expansion Col 4
Col 1 Col 2 Col 3 = C1 - PreviousPrior = C1 - C2 Month C1Year Plant Accumulated Net Plant Transmission
Month Year In-Service Depreciation In Service Activity
144 December - -$ -$ -$ -$ 145 January - -$ -$ -$ -$ 146 February - -$ -$ -$ -$ 147 March - -$ -$ -$ -$ 148 April - -$ -$ -$ -$ 149 May - -$ -$ -$ -$ 150 June - -$ -$ -$ -$ 151 July - -$ -$ -$ -$ 152 August - -$ -$ -$ -$ 153 September - -$ -$ -$ -$ 154 October - -$ -$ -$ -$ 155 November - -$ -$ -$ -$ 156 December - -$ -$ -$ -$
i) Col 1 Col 2 Col 3 Col 4
= C1 - C2 = C1 - PreviousPrior Month C1Year Plant Accumulated Net Plant Transmission
Month Year In-Service Depreciation In Service Activity
157 December - -$ -$ -$ -$ 158 January - -$ -$ -$ -$ 159 February - -$ -$ -$ -$ 160 March - -$ -$ -$ -$ 161 April - -$ -$ -$ -$ 162 May - -$ -$ -$ -$ 163 June - -$ -$ -$ -$ 164 July - -$ -$ -$ -$ 165 August - -$ -$ -$ -$ 166 September - -$ -$ -$ -$ 167 October - -$ -$ -$ -$ 168 November - -$ -$ -$ -$ 169 December - -$ -$ -$ -$
j) Col 1 Col 2 Col 3 Col 4
= C1 - C2 = C1 - PreviousPrior Month C1Year Plant Accumulated Net Plant Transmission
Month Year In-Service Depreciation In Service Activity
170 December - -$ -$ -$ -$ 171 January - -$ -$ -$ -$ 172 February - -$ -$ -$ -$ 173 March - -$ -$ -$ -$ 174 April - -$ -$ -$ -$ 175 May - -$ -$ -$ -$ 176 June - -$ -$ -$ -$ 177 July - -$ -$ -$ -$ 178 August - -$ -$ -$ -$ 179 September - -$ -$ -$ -$ 180 October - -$ -$ -$ -$ 181 November - -$ -$ -$ -$ 182 December - -$ -$ -$ -$
14-IncentivePlant
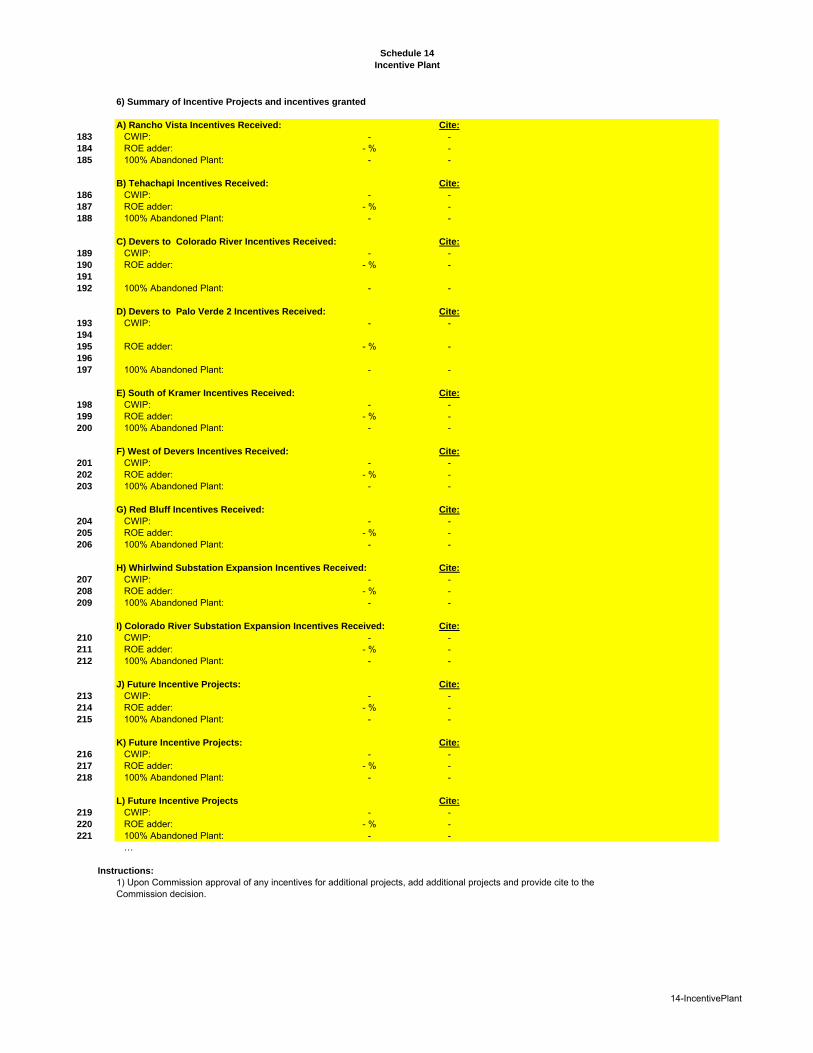
Schedule 14
Incentive Plant
6) Summary of Incentive Projects and incentives granted
A) Rancho Vista Incentives Received: Cite:
183 CWIP: - -184 ROE adder: - % -185 100% Abandoned Plant: - -
B) Tehachapi Incentives Received: Cite:
186 CWIP: - -187 ROE adder: - % -188 100% Abandoned Plant: - -
C) Devers to Colorado River Incentives Received: Cite:
189 CWIP: - -190 ROE adder: - % -191
192 100% Abandoned Plant: - -
D) Devers to Palo Verde 2 Incentives Received: Cite:
193 CWIP: - -194
195 ROE adder: - % -196
197 100% Abandoned Plant: - -
E) South of Kramer Incentives Received: Cite:
198 CWIP: - -199 ROE adder: - % -200 100% Abandoned Plant: - -
F) West of Devers Incentives Received: Cite:
201 CWIP: - -202 ROE adder: - % -203 100% Abandoned Plant: - -
G) Red Bluff Incentives Received: Cite:
204 CWIP: - -205 ROE adder: - % -206 100% Abandoned Plant: - -
H) Whirlwind Substation Expansion Incentives Received: Cite:
207 CWIP: - -208 ROE adder: - % -209 100% Abandoned Plant: - -
I) Colorado River Substation Expansion Incentives Received: Cite:
210 CWIP: - -211 ROE adder: - % -212 100% Abandoned Plant: - -
J) Future Incentive Projects: Cite:
213 CWIP: - -214 ROE adder: - % -215 100% Abandoned Plant: - -
K) Future Incentive Projects: Cite:
216 CWIP: - -217 ROE adder: - % -218 100% Abandoned Plant: - -
L) Future Incentive Projects Cite:
219 CWIP: - -220 ROE adder: - % -221 100% Abandoned Plant: - -
…
Instructions:
1) Upon Commission approval of any incentives for additional projects, add additional projects and provide cite to the Commission decision.
14-IncentivePlant
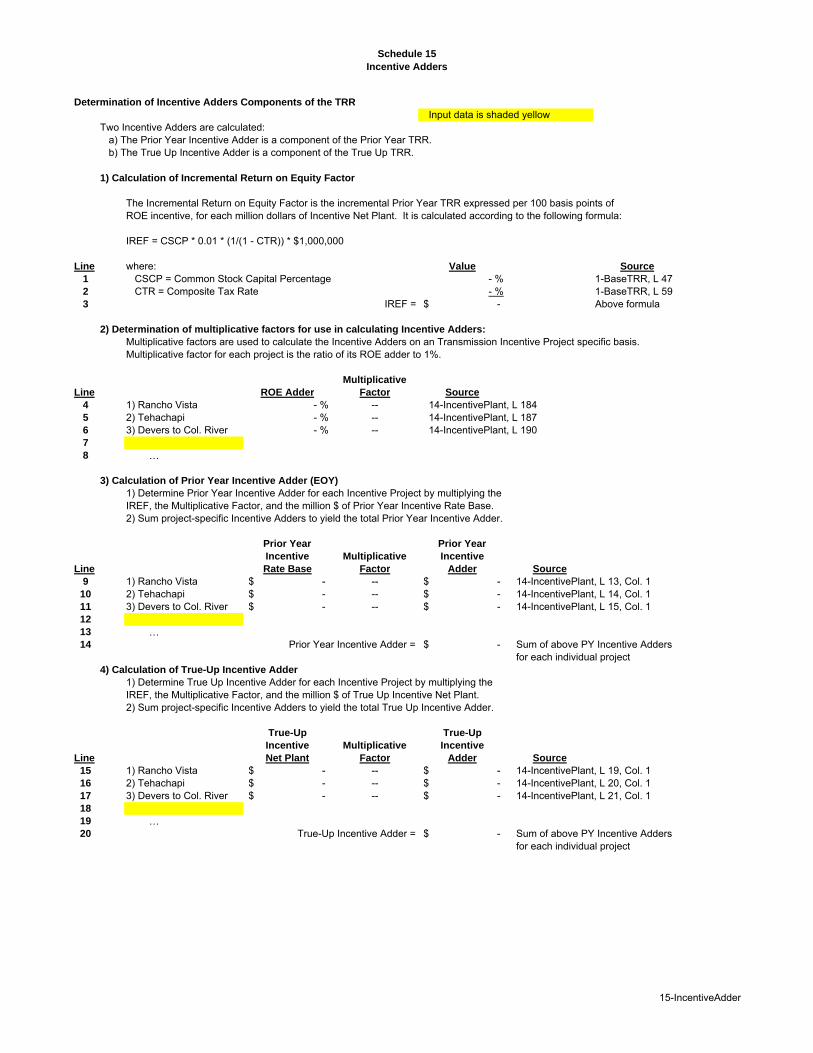
Schedule 15
Incentive Adders
Determination of Incentive Adders Components of the TRR
Input data is shaded yellowTwo Incentive Adders are calculated:
a) The Prior Year Incentive Adder is a component of the Prior Year TRR.b) The True Up Incentive Adder is a component of the True Up TRR.
1) Calculation of Incremental Return on Equity Factor
The Incremental Return on Equity Factor is the incremental Prior Year TRR expressed per 100 basis points ofROE incentive, for each million dollars of Incentive Net Plant. It is calculated according to the following formula:
IREF = CSCP * 0.01 * (1/(1 - CTR)) * $1,000,000
Line where: Value Source
1 CSCP = Common Stock Capital Percentage - % 1-BaseTRR, L 472 CTR = Composite Tax Rate - % 1-BaseTRR, L 593 IREF = -$ Above formula
2) Determination of multiplicative factors for use in calculating Incentive Adders:
Multiplicative factors are used to calculate the Incentive Adders on an Transmission Incentive Project specific basis. Multiplicative factor for each project is the ratio of its ROE adder to 1%.
Multiplicative
Line ROE Adder Factor Source
4 1) Rancho Vista - % -- 14-IncentivePlant, L 1845 2) Tehachapi - % -- 14-IncentivePlant, L 1876 3) Devers to Col. River - % -- 14-IncentivePlant, L 1907
8 …
3) Calculation of Prior Year Incentive Adder (EOY)
1) Determine Prior Year Incentive Adder for each Incentive Project by multiplying the IREF, the Multiplicative Factor, and the million $ of Prior Year Incentive Rate Base.2) Sum project-specific Incentive Adders to yield the total Prior Year Incentive Adder.
Prior Year Prior Year
Incentive Multiplicative Incentive
Line Rate Base Factor Adder Source
9 1) Rancho Vista -$ -- -$ 14-IncentivePlant, L 13, Col. 110 2) Tehachapi -$ -- -$ 14-IncentivePlant, L 14, Col. 111 3) Devers to Col. River -$ -- -$ 14-IncentivePlant, L 15, Col. 112
13 …14 Prior Year Incentive Adder = -$ Sum of above PY Incentive Adders
for each individual project4) Calculation of True-Up Incentive Adder
1) Determine True Up Incentive Adder for each Incentive Project by multiplying the IREF, the Multiplicative Factor, and the million $ of True Up Incentive Net Plant.2) Sum project-specific Incentive Adders to yield the total True Up Incentive Adder.
True-Up True-Up
Incentive Multiplicative Incentive
Line Net Plant Factor Adder Source
15 1) Rancho Vista -$ -- -$ 14-IncentivePlant, L 19, Col. 116 2) Tehachapi -$ -- -$ 14-IncentivePlant, L 20, Col. 117 3) Devers to Col. River -$ -- -$ 14-IncentivePlant, L 21, Col. 118
19 …20 True-Up Incentive Adder = -$ Sum of above PY Incentive Adders
for each individual project
15-IncentiveAdder
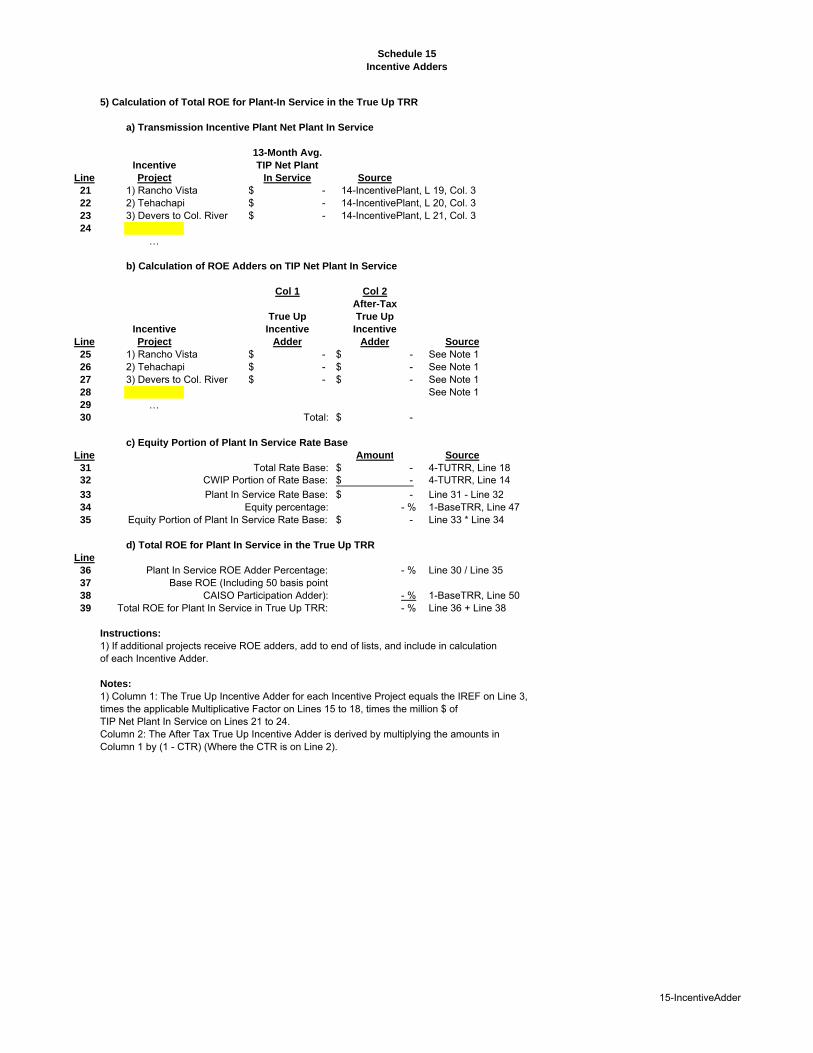
Schedule 15
Incentive Adders
5) Calculation of Total ROE for Plant-In Service in the True Up TRR
a) Transmission Incentive Plant Net Plant In Service
13-Month Avg.
Incentive TIP Net Plant
Line Project In Service Source
21 1) Rancho Vista -$ 14-IncentivePlant, L 19, Col. 322 2) Tehachapi -$ 14-IncentivePlant, L 20, Col. 323 3) Devers to Col. River -$ 14-IncentivePlant, L 21, Col. 324
…
b) Calculation of ROE Adders on TIP Net Plant In Service
Col 1 Col 2
After-Tax
True Up True Up
Incentive Incentive Incentive
Line Project Adder Adder Source
25 1) Rancho Vista -$ -$ See Note 126 2) Tehachapi -$ -$ See Note 127 3) Devers to Col. River -$ -$ See Note 128 See Note 129 …30 Total: -$
c) Equity Portion of Plant In Service Rate Base
Line Amount Source
31 Total Rate Base: -$ 4-TUTRR, Line 1832 CWIP Portion of Rate Base: -$ 4-TUTRR, Line 14
33 Plant In Service Rate Base: -$ Line 31 - Line 3234 Equity percentage: - % 1-BaseTRR, Line 4735 Equity Portion of Plant In Service Rate Base: -$ Line 33 * Line 34
d) Total ROE for Plant In Service in the True Up TRR
Line
36 Plant In Service ROE Adder Percentage: - % Line 30 / Line 3537 Base ROE (Including 50 basis point38 CAISO Participation Adder): - % 1-BaseTRR, Line 5039 Total ROE for Plant In Service in True Up TRR: - % Line 36 + Line 38
Instructions:
1) If additional projects receive ROE adders, add to end of lists, and include in calculationof each Incentive Adder.
Notes:
1) Column 1: The True Up Incentive Adder for each Incentive Project equals the IREF on Line 3,times the applicable Multiplicative Factor on Lines 15 to 18, times the million $ ofTIP Net Plant In Service on Lines 21 to 24.Column 2: The After Tax True Up Incentive Adder is derived by multiplying the amounts inColumn 1 by (1 - CTR) (Where the CTR is on Line 2).
15-IncentiveAdder

Schedule 16
Plant Additions
Forecast Plant Additions for In-Service ISO Transmission Plant
Yellow shaded cells are Input DataForecast Plant Additions represents the total increase in ISO Transmission Net Plant, not including CWIP, during the Rate Year, incremental to the year-end Prior Year amount.It is calculated on a 13-Month Average Basis during the Rate Year.
1) Total Plant Additions Forecast (See Note 1)
Col 1 Col 2 Col 3 Col 4 Col 5 Col 6 Col 7 Col 8 Col 9 Col 10 Col 11 Col 12
See Note 2 See Note 2 See Note 2 See Note 2 See Note 2 See Note 2 See Note 2 See Note 2 See Note 2 See Note 2 See Note 2 See Note 2Forecast Unloaded AFUDC Unloaded Loaded
Period Total Prior Period Over Heads Cost of Eligible Plant Incremental Depreciation Incremental Low Voltage Low Voltage
Line Month Year Plant Adds CWIP Closed Closed to PIS Removal Additions AFUDC Gross Plant Accrual Reserve Net Plant Additions Additions
1 January - -$ -$ -$ -$ -$ -$ -$ -$ -$ -$ -$ -$ 2 February - -$ -$ -$ -$ -$ -$ -$ -$ -$ -$ -$ -$ 3 March - -$ -$ -$ -$ -$ -$ -$ -$ -$ -$ -$ -$ 4 April - -$ -$ -$ -$ -$ -$ -$ -$ -$ -$ -$ -$ 5 May - -$ -$ -$ -$ -$ -$ -$ -$ -$ -$ -$ -$ 6 June - -$ -$ -$ -$ -$ -$ -$ -$ -$ -$ -$ -$ 7 July - -$ -$ -$ -$ -$ -$ -$ -$ -$ -$ -$ -$ 8 August - -$ -$ -$ -$ -$ -$ -$ -$ -$ -$ -$ -$ 9 September - -$ -$ -$ -$ -$ -$ -$ -$ -$ -$ -$ -$ 10 October - -$ -$ -$ -$ -$ -$ -$ -$ -$ -$ -$ -$ 11 November - -$ -$ -$ -$ -$ -$ -$ -$ -$ -$ -$ -$ 12 December - -$ -$ -$ -$ -$ -$ -$ -$ -$ -$ -$ -$ 13 January - -$ -$ -$ -$ -$ -$ -$ -$ -$ -$ -$ -$ 14 February - -$ -$ -$ -$ -$ -$ -$ -$ -$ -$ -$ -$ 15 March - -$ -$ -$ -$ -$ -$ -$ -$ -$ -$ -$ -$ 16 April - -$ -$ -$ -$ -$ -$ -$ -$ -$ -$ -$ -$ 17 May - -$ -$ -$ -$ -$ -$ -$ -$ -$ -$ -$ -$ 18 June - -$ -$ -$ -$ -$ -$ -$ -$ -$ -$ -$ -$ 19 July - -$ -$ -$ -$ -$ -$ -$ -$ -$ -$ -$ -$ 20 August - -$ -$ -$ -$ -$ -$ -$ -$ -$ -$ -$ -$ 21 September - -$ -$ -$ -$ -$ -$ -$ -$ -$ -$ -$ -$ 22 October - -$ -$ -$ -$ -$ -$ -$ -$ -$ -$ -$ -$ 23 November - -$ -$ -$ -$ -$ -$ -$ -$ -$ -$ -$ -$ 24 December - -$ -$ -$ -$ -$ -$ -$ -$ -$ -$ -$ -$
25 13-Month Averages: -$ -$ -$
2) Incentive Plant Forecast (See Note 1)
Col 1 Col 2 Col 3 Col 4 Col 5 Col 6 Col 7 Col 8 Col 9 Col 10 Col 11 Col 12
C4 10-CWIPL30-53
C5 10-CWIPL30-53
C6 10-CWIPL30-53 N/A N/A N/A
= Prior Month C7+C1+C3
= Prior Month C7 * L91/12
= Prior Month C9 + C4 + C8 =C7-C9
=C11* (1-L75)* (1+L74+L76)
Forecast Unloaded AFUDC Unloaded Loaded
Period Total Prior Period Over Heads Cost of Eligible Plant Incremental Depreciation Low Voltage Low Voltage
Line Month Year Plant Adds CWIP Closed Closed to PIS Removal Additions AFUDC Gross Plant Accrual Reserve Net Plant Additions Additions
26 January - -$ -$ -$ $0 $0 $0 -$ -$ -$ -$ -$ -$ 27 February - -$ -$ -$ $0 $0 $0 -$ -$ -$ -$ -$ -$ 28 March - -$ -$ -$ $0 $0 $0 -$ -$ -$ -$ -$ -$ 29 April - -$ -$ -$ $0 $0 $0 -$ -$ -$ -$ -$ -$ 30 May - -$ -$ -$ $0 $0 $0 -$ -$ -$ -$ -$ -$ 31 June - -$ -$ -$ $0 $0 $0 -$ -$ -$ -$ -$ -$ 32 July - -$ -$ -$ $0 $0 $0 -$ -$ -$ -$ -$ -$ 33 August - -$ -$ -$ $0 $0 $0 -$ -$ -$ -$ -$ -$ 34 September - -$ -$ -$ $0 $0 $0 -$ -$ -$ -$ -$ -$ 35 October - -$ -$ -$ $0 $0 $0 -$ -$ -$ -$ -$ -$ 36 November - -$ -$ -$ $0 $0 $0 -$ -$ -$ -$ -$ -$ 37 December - -$ -$ -$ $0 $0 $0 -$ -$ -$ -$ -$ -$ 38 January - -$ -$ -$ $0 $0 $0 -$ -$ -$ -$ -$ -$ 39 February - -$ -$ -$ $0 $0 $0 -$ -$ -$ -$ -$ -$ 40 March - -$ -$ -$ $0 $0 $0 -$ -$ -$ -$ -$ -$ 41 April - -$ -$ -$ $0 $0 $0 -$ -$ -$ -$ -$ -$ 42 May - -$ -$ -$ $0 $0 $0 -$ -$ -$ -$ -$ -$ 43 June - -$ -$ -$ $0 $0 $0 -$ -$ -$ -$ -$ -$ 44 July - -$ -$ -$ $0 $0 $0 -$ -$ -$ -$ -$ -$ 45 August - -$ -$ -$ $0 $0 $0 -$ -$ -$ -$ -$ -$ 46 September - -$ -$ -$ $0 $0 $0 -$ -$ -$ -$ -$ -$ 47 October - -$ -$ -$ $0 $0 $0 -$ -$ -$ -$ -$ -$ 48 November - -$ -$ -$ $0 $0 $0 -$ -$ -$ -$ -$ -$ 49 December - -$ -$ -$ $0 $0 $0 -$ -$ -$ -$ -$ -$
16-PlantAdditions
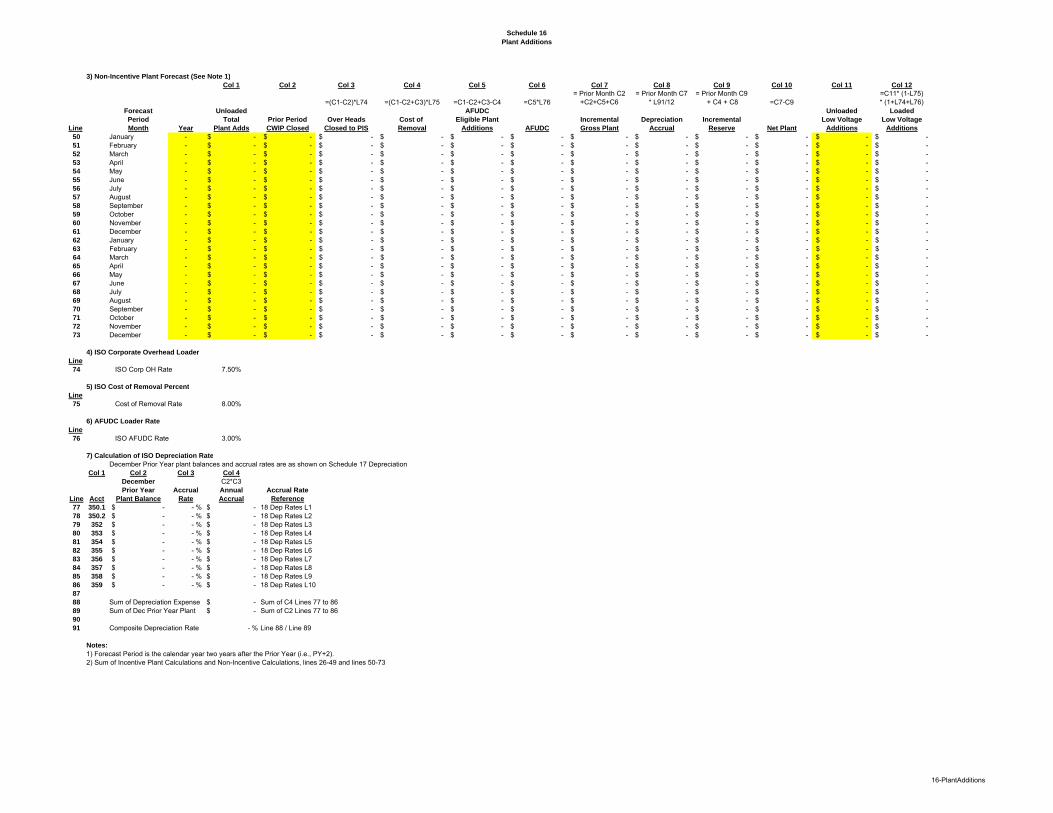
Schedule 16
Plant Additions
3) Non-Incentive Plant Forecast (See Note 1)
Col 1 Col 2 Col 3 Col 4 Col 5 Col 6 Col 7 Col 8 Col 9 Col 10 Col 11 Col 12
=(C1-C2)*L74 =(C1-C2+C3)*L75 =C1-C2+C3-C4 =C5*L76= Prior Month C2
+C2+C5+C6= Prior Month C7
* L91/12= Prior Month C9
+ C4 + C8 =C7-C9=C11* (1-L75)* (1+L74+L76)
Forecast Unloaded AFUDC Unloaded Loaded
Period Total Prior Period Over Heads Cost of Eligible Plant Incremental Depreciation Incremental Low Voltage Low Voltage
Line Month Year Plant Adds CWIP Closed Closed to PIS Removal Additions AFUDC Gross Plant Accrual Reserve Net Plant Additions Additions
50 January - -$ -$ -$ -$ -$ -$ -$ -$ -$ -$ -$ -$ 51 February - -$ -$ -$ -$ -$ -$ -$ -$ -$ -$ -$ -$ 52 March - -$ -$ -$ -$ -$ -$ -$ -$ -$ -$ -$ -$ 53 April - -$ -$ -$ -$ -$ -$ -$ -$ -$ -$ -$ -$ 54 May - -$ -$ -$ -$ -$ -$ -$ -$ -$ -$ -$ -$ 55 June - -$ -$ -$ -$ -$ -$ -$ -$ -$ -$ -$ -$ 56 July - -$ -$ -$ -$ -$ -$ -$ -$ -$ -$ -$ -$ 57 August - -$ -$ -$ -$ -$ -$ -$ -$ -$ -$ -$ -$ 58 September - -$ -$ -$ -$ -$ -$ -$ -$ -$ -$ -$ -$ 59 October - -$ -$ -$ -$ -$ -$ -$ -$ -$ -$ -$ -$ 60 November - -$ -$ -$ -$ -$ -$ -$ -$ -$ -$ -$ -$ 61 December - -$ -$ -$ -$ -$ -$ -$ -$ -$ -$ -$ -$ 62 January - -$ -$ -$ -$ -$ -$ -$ -$ -$ -$ -$ -$ 63 February - -$ -$ -$ -$ -$ -$ -$ -$ -$ -$ -$ -$ 64 March - -$ -$ -$ -$ -$ -$ -$ -$ -$ -$ -$ -$ 65 April - -$ -$ -$ -$ -$ -$ -$ -$ -$ -$ -$ -$ 66 May - -$ -$ -$ -$ -$ -$ -$ -$ -$ -$ -$ -$ 67 June - -$ -$ -$ -$ -$ -$ -$ -$ -$ -$ -$ -$ 68 July - -$ -$ -$ -$ -$ -$ -$ -$ -$ -$ -$ -$ 69 August - -$ -$ -$ -$ -$ -$ -$ -$ -$ -$ -$ -$ 70 September - -$ -$ -$ -$ -$ -$ -$ -$ -$ -$ -$ -$ 71 October - -$ -$ -$ -$ -$ -$ -$ -$ -$ -$ -$ -$ 72 November - -$ -$ -$ -$ -$ -$ -$ -$ -$ -$ -$ -$ 73 December - -$ -$ -$ -$ -$ -$ -$ -$ -$ -$ -$ -$
4) ISO Corporate Overhead Loader
Line
74 ISO Corp OH Rate 7.50%
5) ISO Cost of Removal Percent
Line
75 Cost of Removal Rate 8.00%
6) AFUDC Loader Rate
Line
76 ISO AFUDC Rate 3.00%
7) Calculation of ISO Depreciation Rate
December Prior Year plant balances and accrual rates are as shown on Schedule 17 DepreciationCol 1 Col 2 Col 3 Col 4
December C2*C3Prior Year Accrual Annual Accrual Rate
Line Acct Plant Balance Rate Accrual Reference
77 350.1 -$ - % -$ 18 Dep Rates L178 350.2 -$ - % -$ 18 Dep Rates L279 352 -$ - % -$ 18 Dep Rates L380 353 -$ - % -$ 18 Dep Rates L481 354 -$ - % -$ 18 Dep Rates L582 355 -$ - % -$ 18 Dep Rates L683 356 -$ - % -$ 18 Dep Rates L784 357 -$ - % -$ 18 Dep Rates L885 358 -$ - % -$ 18 Dep Rates L986 359 -$ - % -$ 18 Dep Rates L1087
88 Sum of Depreciation Expense -$ Sum of C4 Lines 77 to 8689 Sum of Dec Prior Year Plant -$ Sum of C2 Lines 77 to 8690
91 Composite Depreciation Rate - % Line 88 / Line 89
Notes:
1) Forecast Period is the calendar year two years after the Prior Year (i.e., PY+2). 2) Sum of Incentive Plant Calculations and Non-Incentive Calculations, lines 26-49 and lines 50-73
16-PlantAdditions
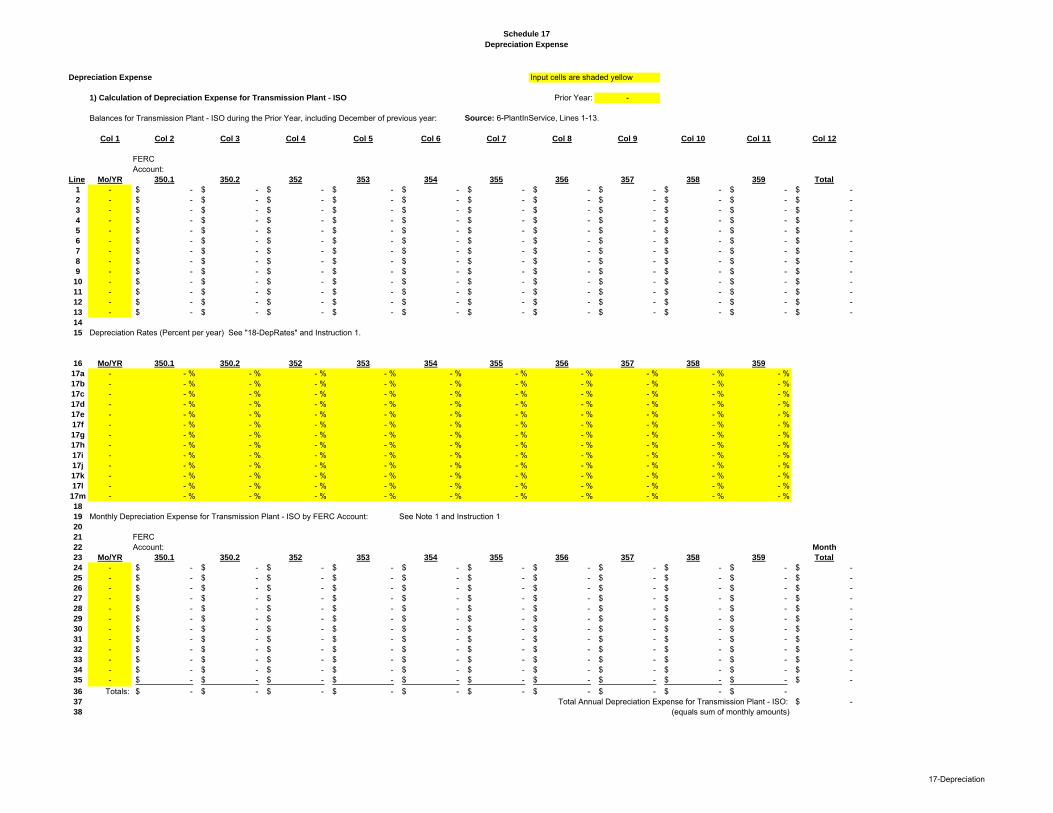
Schedule 17
Depreciation Expense
Depreciation Expense Input cells are shaded yellow
1) Calculation of Depreciation Expense for Transmission Plant - ISO Prior Year: -
Balances for Transmission Plant - ISO during the Prior Year, including December of previous year: Source: 6-PlantInService, Lines 1-13.
Col 1 Col 2 Col 3 Col 4 Col 5 Col 6 Col 7 Col 8 Col 9 Col 10 Col 11 Col 12
FERCAccount:
Line Mo/YR 350.1 350.2 352 353 354 355 356 357 358 359 Total
1 - -$ -$ -$ -$ -$ -$ -$ -$ -$ -$ -$ 2 - -$ -$ -$ -$ -$ -$ -$ -$ -$ -$ -$ 3 - -$ -$ -$ -$ -$ -$ -$ -$ -$ -$ -$ 4 - -$ -$ -$ -$ -$ -$ -$ -$ -$ -$ -$ 5 - -$ -$ -$ -$ -$ -$ -$ -$ -$ -$ -$ 6 - -$ -$ -$ -$ -$ -$ -$ -$ -$ -$ -$ 7 - -$ -$ -$ -$ -$ -$ -$ -$ -$ -$ -$ 8 - -$ -$ -$ -$ -$ -$ -$ -$ -$ -$ -$ 9 - -$ -$ -$ -$ -$ -$ -$ -$ -$ -$ -$
10 - -$ -$ -$ -$ -$ -$ -$ -$ -$ -$ -$ 11 - -$ -$ -$ -$ -$ -$ -$ -$ -$ -$ -$ 12 - -$ -$ -$ -$ -$ -$ -$ -$ -$ -$ -$ 13 - -$ -$ -$ -$ -$ -$ -$ -$ -$ -$ -$ 14
15 Depreciation Rates (Percent per year) See "18-DepRates" and Instruction 1.
16 Mo/YR 350.1 350.2 352 353 354 355 356 357 358 359
17a - - % - % - % - % - % - % - % - % - % - %17b - - % - % - % - % - % - % - % - % - % - %17c - - % - % - % - % - % - % - % - % - % - %17d - - % - % - % - % - % - % - % - % - % - %17e - - % - % - % - % - % - % - % - % - % - %17f - - % - % - % - % - % - % - % - % - % - %17g - - % - % - % - % - % - % - % - % - % - %17h - - % - % - % - % - % - % - % - % - % - %17i - - % - % - % - % - % - % - % - % - % - %17j - - % - % - % - % - % - % - % - % - % - %17k - - % - % - % - % - % - % - % - % - % - %17l - - % - % - % - % - % - % - % - % - % - %
17m - - % - % - % - % - % - % - % - % - % - %18
19 Monthly Depreciation Expense for Transmission Plant - ISO by FERC Account: See Note 1 and Instruction 120
21 FERC22 Account: Month
23 Mo/YR 350.1 350.2 352 353 354 355 356 357 358 359 Total
24 - -$ -$ -$ -$ -$ -$ -$ -$ -$ -$ -$ 25 - -$ -$ -$ -$ -$ -$ -$ -$ -$ -$ -$ 26 - -$ -$ -$ -$ -$ -$ -$ -$ -$ -$ -$ 27 - -$ -$ -$ -$ -$ -$ -$ -$ -$ -$ -$ 28 - -$ -$ -$ -$ -$ -$ -$ -$ -$ -$ -$ 29 - -$ -$ -$ -$ -$ -$ -$ -$ -$ -$ -$ 30 - -$ -$ -$ -$ -$ -$ -$ -$ -$ -$ -$ 31 - -$ -$ -$ -$ -$ -$ -$ -$ -$ -$ -$ 32 - -$ -$ -$ -$ -$ -$ -$ -$ -$ -$ -$ 33 - -$ -$ -$ -$ -$ -$ -$ -$ -$ -$ -$ 34 - -$ -$ -$ -$ -$ -$ -$ -$ -$ -$ -$ 35 - -$ -$ -$ -$ -$ -$ -$ -$ -$ -$ -$
36 Totals: -$ -$ -$ -$ -$ -$ -$ -$ -$ -$ 37 Total Annual Depreciation Expense for Transmission Plant - ISO: -$ 38 (equals sum of monthly amounts)
17-Depreciation
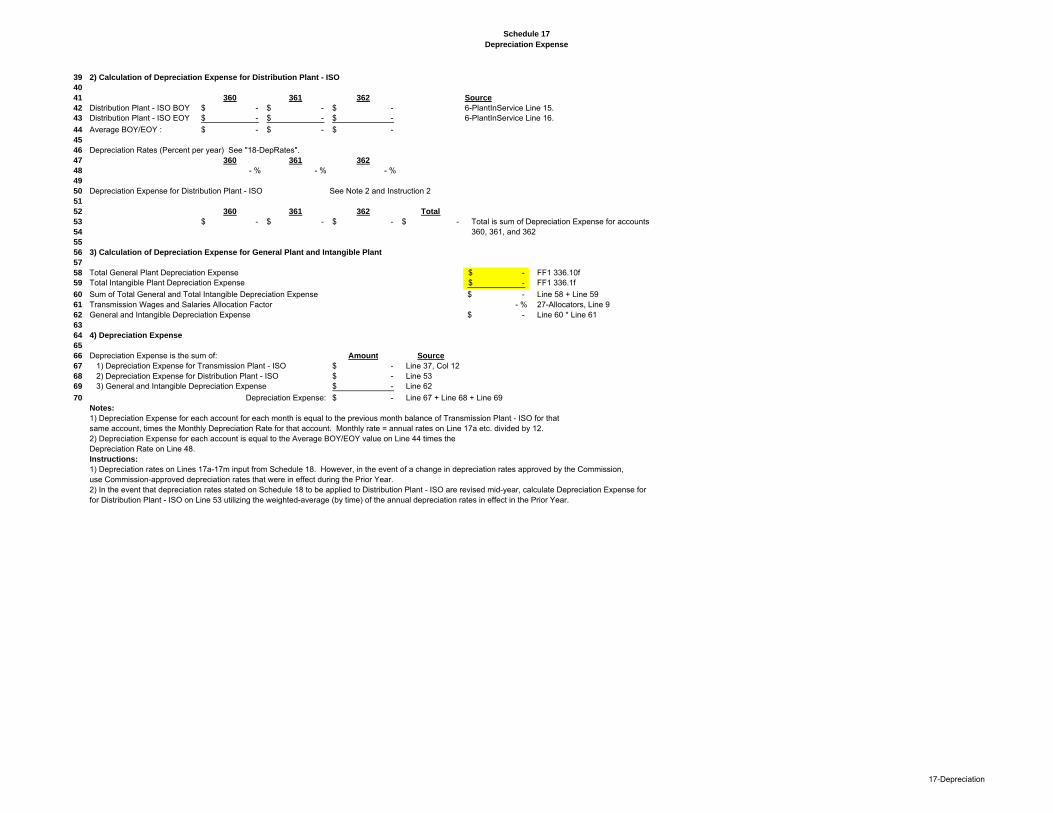
Schedule 17
Depreciation Expense
39 2) Calculation of Depreciation Expense for Distribution Plant - ISO
40
41 360 361 362 Source
42 Distribution Plant - ISO BOY -$ -$ -$ 6-PlantInService Line 15.43 Distribution Plant - ISO EOY -$ -$ -$ 6-PlantInService Line 16.
44 Average BOY/EOY : -$ -$ -$ 45
46 Depreciation Rates (Percent per year) See "18-DepRates".47 360 361 362
48 - % - % - %49
50 Depreciation Expense for Distribution Plant - ISO See Note 2 and Instruction 251
52 360 361 362 Total
53 -$ -$ -$ -$ Total is sum of Depreciation Expense for accounts 54 360, 361, and 36255
56 3) Calculation of Depreciation Expense for General Plant and Intangible Plant
57
58 Total General Plant Depreciation Expense -$ FF1 336.10f59 Total Intangible Plant Depreciation Expense -$ FF1 336.1f
60 Sum of Total General and Total Intangible Depreciation Expense -$ Line 58 + Line 5961 Transmission Wages and Salaries Allocation Factor - % 27-Allocators, Line 962 General and Intangible Depreciation Expense -$ Line 60 * Line 6163
64 4) Depreciation Expense
65
66 Depreciation Expense is the sum of: Amount Source
67 1) Depreciation Expense for Transmission Plant - ISO -$ Line 37, Col 1268 2) Depreciation Expense for Distribution Plant - ISO -$ Line 5369 3) General and Intangible Depreciation Expense -$ Line 62
70 Depreciation Expense: -$ Line 67 + Line 68 + Line 69Notes:
1) Depreciation Expense for each account for each month is equal to the previous month balance of Transmission Plant - ISO for that same account, times the Monthly Depreciation Rate for that account. Monthly rate = annual rates on Line 17a etc. divided by 12.2) Depreciation Expense for each account is equal to the Average BOY/EOY value on Line 44 times theDepreciation Rate on Line 48.Instructions:
1) Depreciation rates on Lines 17a-17m input from Schedule 18. However, in the event of a change in depreciation rates approved by the Commission,use Commission-approved depreciation rates that were in effect during the Prior Year.2) In the event that depreciation rates stated on Schedule 18 to be applied to Distribution Plant - ISO are revised mid-year, calculate Depreciation Expense for for Distribution Plant - ISO on Line 53 utilizing the weighted-average (by time) of the annual depreciation rates in effect in the Prior Year.
17-Depreciation
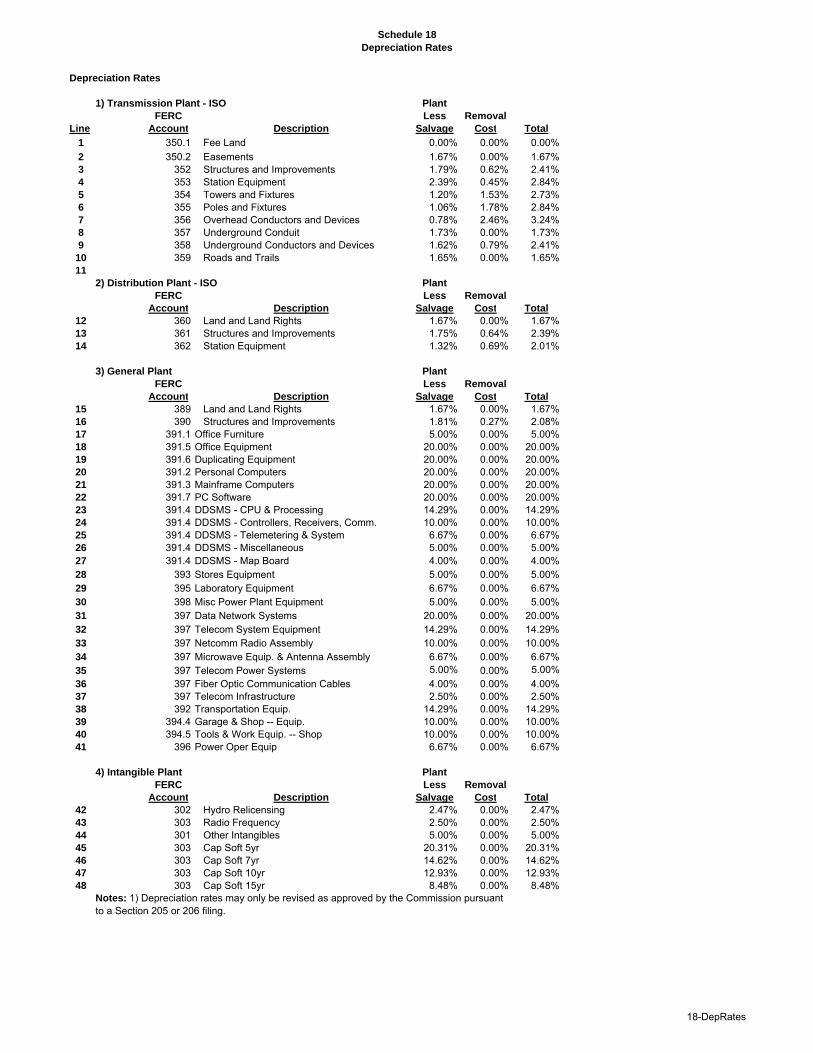
Schedule 18
Depreciation Rates
Depreciation Rates
1) Transmission Plant - ISO Plant
FERC Less Removal
Line Account Description Salvage Cost Total
1 350.1 Fee Land 0.00% 0.00% 0.00%
2 350.2 Easements 1.67% 0.00% 1.67%3 352 Structures and Improvements 1.79% 0.62% 2.41%4 353 Station Equipment 2.39% 0.45% 2.84%5 354 Towers and Fixtures 1.20% 1.53% 2.73%6 355 Poles and Fixtures 1.06% 1.78% 2.84%7 356 Overhead Conductors and Devices 0.78% 2.46% 3.24%8 357 Underground Conduit 1.73% 0.00% 1.73%9 358 Underground Conductors and Devices 1.62% 0.79% 2.41%
10 359 Roads and Trails 1.65% 0.00% 1.65%11
2) Distribution Plant - ISO Plant
FERC Less Removal
Account Description Salvage Cost Total
12 360 Land and Land Rights 1.67% 0.00% 1.67%13 361 Structures and Improvements 1.75% 0.64% 2.39%14 362 Station Equipment 1.32% 0.69% 2.01%
3) General Plant Plant
FERC Less Removal
Account Description Salvage Cost Total
15 389 Land and Land Rights 1.67% 0.00% 1.67%16 390 Structures and Improvements 1.81% 0.27% 2.08%17 391.1 Office Furniture 5.00% 0.00% 5.00%18 391.5 Office Equipment 20.00% 0.00% 20.00%19 391.6 Duplicating Equipment 20.00% 0.00% 20.00%20 391.2 Personal Computers 20.00% 0.00% 20.00%21 391.3 Mainframe Computers 20.00% 0.00% 20.00%22 391.7 PC Software 20.00% 0.00% 20.00%23 391.4 DDSMS - CPU & Processing 14.29% 0.00% 14.29%24 391.4 DDSMS - Controllers, Receivers, Comm. 10.00% 0.00% 10.00%25 391.4 DDSMS - Telemetering & System 6.67% 0.00% 6.67%26 391.4 DDSMS - Miscellaneous 5.00% 0.00% 5.00%27 391.4 DDSMS - Map Board 4.00% 0.00% 4.00%28 393 Stores Equipment 5.00% 0.00% 5.00%29 395 Laboratory Equipment 6.67% 0.00% 6.67%30 398 Misc Power Plant Equipment 5.00% 0.00% 5.00%31 397 Data Network Systems 20.00% 0.00% 20.00%32 397 Telecom System Equipment 14.29% 0.00% 14.29%33 397 Netcomm Radio Assembly 10.00% 0.00% 10.00%34 397 Microwave Equip. & Antenna Assembly 6.67% 0.00% 6.67%35 397 Telecom Power Systems 5.00% 0.00% 5.00%
36 397 Fiber Optic Communication Cables 4.00% 0.00% 4.00%37 397 Telecom Infrastructure 2.50% 0.00% 2.50%38 392 Transportation Equip. 14.29% 0.00% 14.29%39 394.4 Garage & Shop -- Equip. 10.00% 0.00% 10.00%40 394.5 Tools & Work Equip. -- Shop 10.00% 0.00% 10.00%41 396 Power Oper Equip 6.67% 0.00% 6.67%
4) Intangible Plant Plant
FERC Less Removal
Account Description Salvage Cost Total
42 302 Hydro Relicensing 2.47% 0.00% 2.47%43 303 Radio Frequency 2.50% 0.00% 2.50%44 301 Other Intangibles 5.00% 0.00% 5.00%45 303 Cap Soft 5yr 20.31% 0.00% 20.31%46 303 Cap Soft 7yr 14.62% 0.00% 14.62%47 303 Cap Soft 10yr 12.93% 0.00% 12.93%48 303 Cap Soft 15yr 8.48% 0.00% 8.48%
Notes: 1) Depreciation rates may only be revised as approved by the Commission pursuantto a Section 205 or 206 filing.
18-DepRates
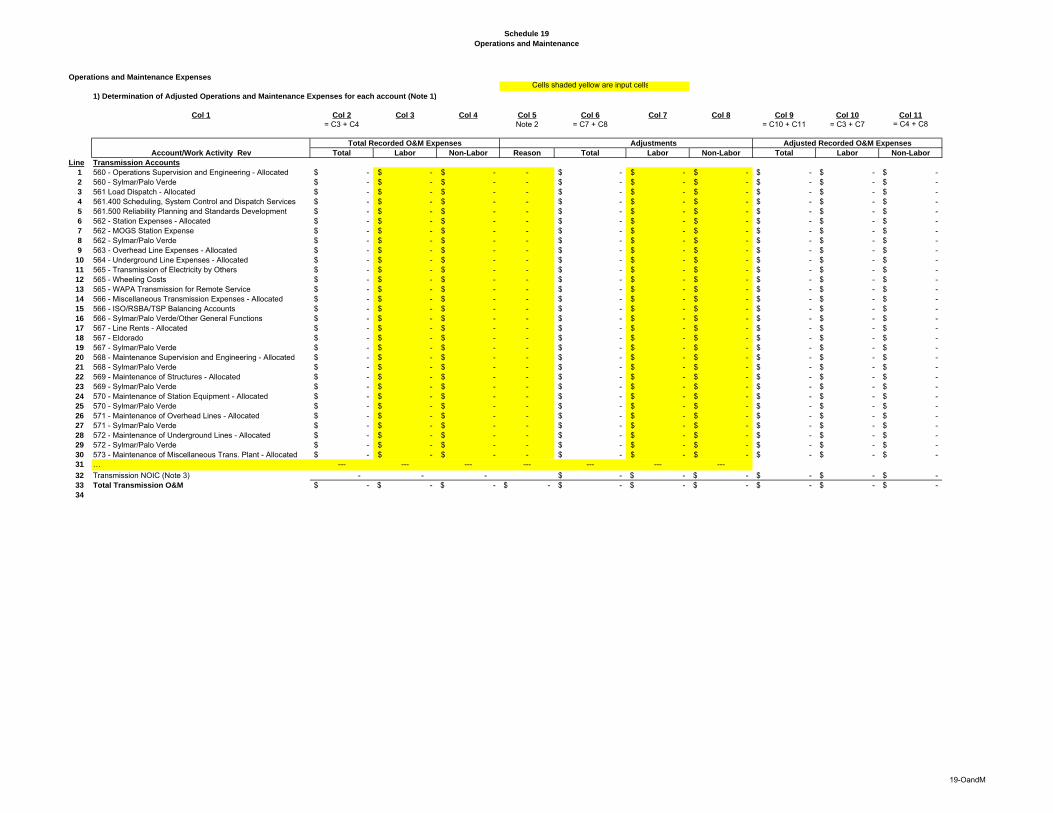
Schedule 19
Operations and Maintenance
Operations and Maintenance ExpensesCells shaded yellow are input cells
1) Determination of Adjusted Operations and Maintenance Expenses for each account (Note 1)
Col 1 Col 2 Col 3 Col 4 Col 5 Col 6 Col 7 Col 8 Col 9 Col 10 Col 11
= C3 + C4 Note 2 = C7 + C8 = C10 + C11 = C3 + C7 = C4 + C8
Total Labor Non-Labor Reason Total Labor Non-Labor Total Labor Non-Labor
Line Transmission Accounts
1 560 - Operations Supervision and Engineering - Allocated -$ -$ -$ - -$ -$ -$ -$ -$ -$ 2 560 - Sylmar/Palo Verde -$ -$ -$ - -$ -$ -$ -$ -$ -$ 3 561 Load Dispatch - Allocated -$ -$ -$ - -$ -$ -$ -$ -$ -$ 4 561.400 Scheduling, System Control and Dispatch Services -$ -$ -$ - -$ -$ -$ -$ -$ -$ 5 561.500 Reliability Planning and Standards Development -$ -$ -$ - -$ -$ -$ -$ -$ -$ 6 562 - Station Expenses - Allocated -$ -$ -$ - -$ -$ -$ -$ -$ -$ 7 562 - MOGS Station Expense -$ -$ -$ - -$ -$ -$ -$ -$ -$ 8 562 - Sylmar/Palo Verde -$ -$ -$ - -$ -$ -$ -$ -$ -$ 9 563 - Overhead Line Expenses - Allocated -$ -$ -$ - -$ -$ -$ -$ -$ -$
10 564 - Underground Line Expenses - Allocated -$ -$ -$ - -$ -$ -$ -$ -$ -$ 11 565 - Transmission of Electricity by Others -$ -$ -$ - -$ -$ -$ -$ -$ -$ 12 565 - Wheeling Costs -$ -$ -$ - -$ -$ -$ -$ -$ -$ 13 565 - WAPA Transmission for Remote Service -$ -$ -$ - -$ -$ -$ -$ -$ -$ 14 566 - Miscellaneous Transmission Expenses - Allocated -$ -$ -$ - -$ -$ -$ -$ -$ -$ 15 566 - ISO/RSBA/TSP Balancing Accounts -$ -$ -$ - -$ -$ -$ -$ -$ -$ 16 566 - Sylmar/Palo Verde/Other General Functions -$ -$ -$ - -$ -$ -$ -$ -$ -$ 17 567 - Line Rents - Allocated -$ -$ -$ - -$ -$ -$ -$ -$ -$ 18 567 - Eldorado -$ -$ -$ - -$ -$ -$ -$ -$ -$ 19 567 - Sylmar/Palo Verde -$ -$ -$ - -$ -$ -$ -$ -$ -$ 20 568 - Maintenance Supervision and Engineering - Allocated -$ -$ -$ - -$ -$ -$ -$ -$ -$ 21 568 - Sylmar/Palo Verde -$ -$ -$ - -$ -$ -$ -$ -$ -$ 22 569 - Maintenance of Structures - Allocated -$ -$ -$ - -$ -$ -$ -$ -$ -$ 23 569 - Sylmar/Palo Verde -$ -$ -$ - -$ -$ -$ -$ -$ -$ 24 570 - Maintenance of Station Equipment - Allocated -$ -$ -$ - -$ -$ -$ -$ -$ -$ 25 570 - Sylmar/Palo Verde -$ -$ -$ - -$ -$ -$ -$ -$ -$ 26 571 - Maintenance of Overhead Lines - Allocated -$ -$ -$ - -$ -$ -$ -$ -$ -$ 27 571 - Sylmar/Palo Verde -$ -$ -$ - -$ -$ -$ -$ -$ -$ 28 572 - Maintenance of Underground Lines - Allocated -$ -$ -$ - -$ -$ -$ -$ -$ -$ 29 572 - Sylmar/Palo Verde -$ -$ -$ - -$ -$ -$ -$ -$ -$ 30 573 - Maintenance of Miscellaneous Trans. Plant - Allocated -$ -$ -$ - -$ -$ -$ -$ -$ -$ 31 … --- --- --- --- --- --- ---
32 Transmission NOIC (Note 3) - - - -$ -$ -$ -$ -$ -$ 33 Total Transmission O&M -$ -$ -$ -$ -$ -$ -$ -$ -$ -$ 34
Account/Work Activity Rev
Total Recorded O&M Expenses Adjustments Adjusted Recorded O&M Expenses
19-OandM
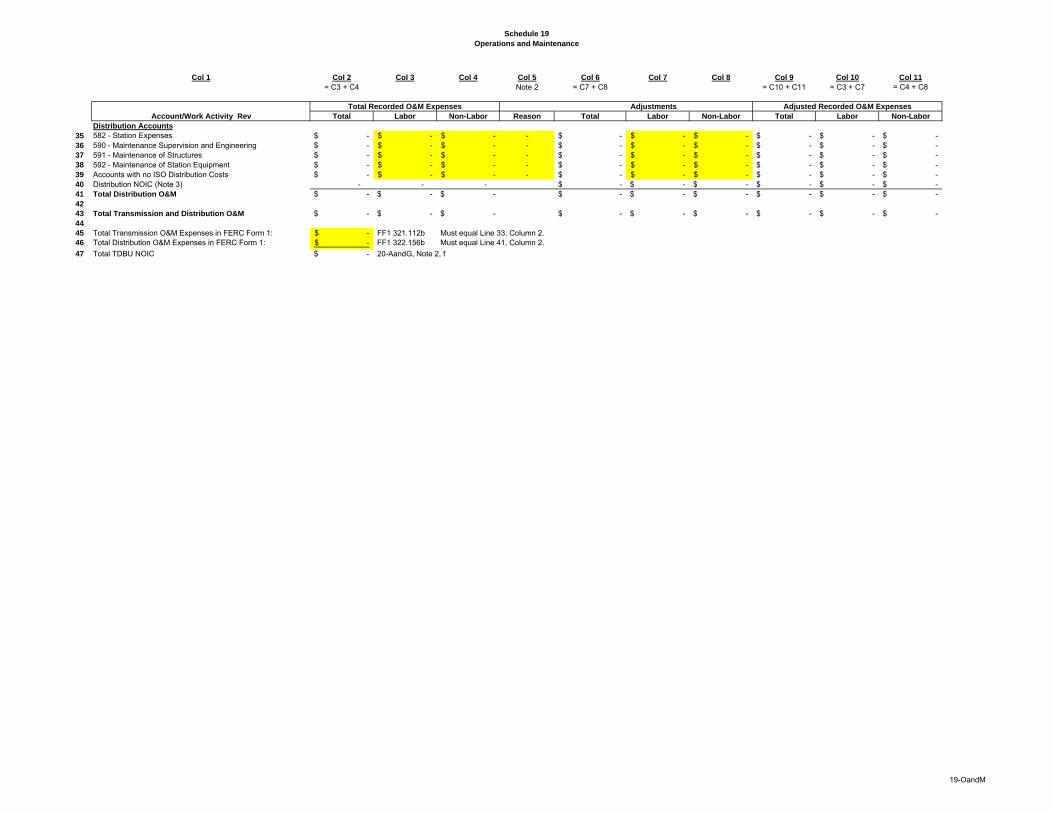
Schedule 19
Operations and Maintenance
Col 1 Col 2 Col 3 Col 4 Col 5 Col 6 Col 7 Col 8 Col 9 Col 10 Col 11
= C3 + C4 Note 2 = C7 + C8 = C10 + C11 = C3 + C7 = C4 + C8
Total Labor Non-Labor Reason Total Labor Non-Labor Total Labor Non-Labor
Distribution Accounts
35 582 - Station Expenses -$ -$ -$ - -$ -$ -$ -$ -$ -$ 36 590 - Maintenance Supervision and Engineering -$ -$ -$ - -$ -$ -$ -$ -$ -$ 37 591 - Maintenance of Structures -$ -$ -$ - -$ -$ -$ -$ -$ -$ 38 592 - Maintenance of Station Equipment -$ -$ -$ - -$ -$ -$ -$ -$ -$ 39 Accounts with no ISO Distribution Costs -$ -$ -$ - -$ -$ -$ -$ -$ -$ 40 Distribution NOIC (Note 3) - - - -$ -$ -$ -$ -$ -$ 41 Total Distribution O&M -$ -$ -$ -$ -$ -$ -$ -$ -$ 42
43 Total Transmission and Distribution O&M -$ -$ -$ -$ -$ -$ -$ -$ -$ 44
45 Total Transmission O&M Expenses in FERC Form 1: -$ FF1 321.112b Must equal Line 33, Column 2.46 Total Distribution O&M Expenses in FERC Form 1: -$ FF1 322.156b Must equal Line 41, Column 2.
47 Total TDBU NOIC -$ 20-AandG, Note 2, f
Account/Work Activity Rev
Total Recorded O&M Expenses Adjustments Adjusted Recorded O&M Expenses
19-OandM
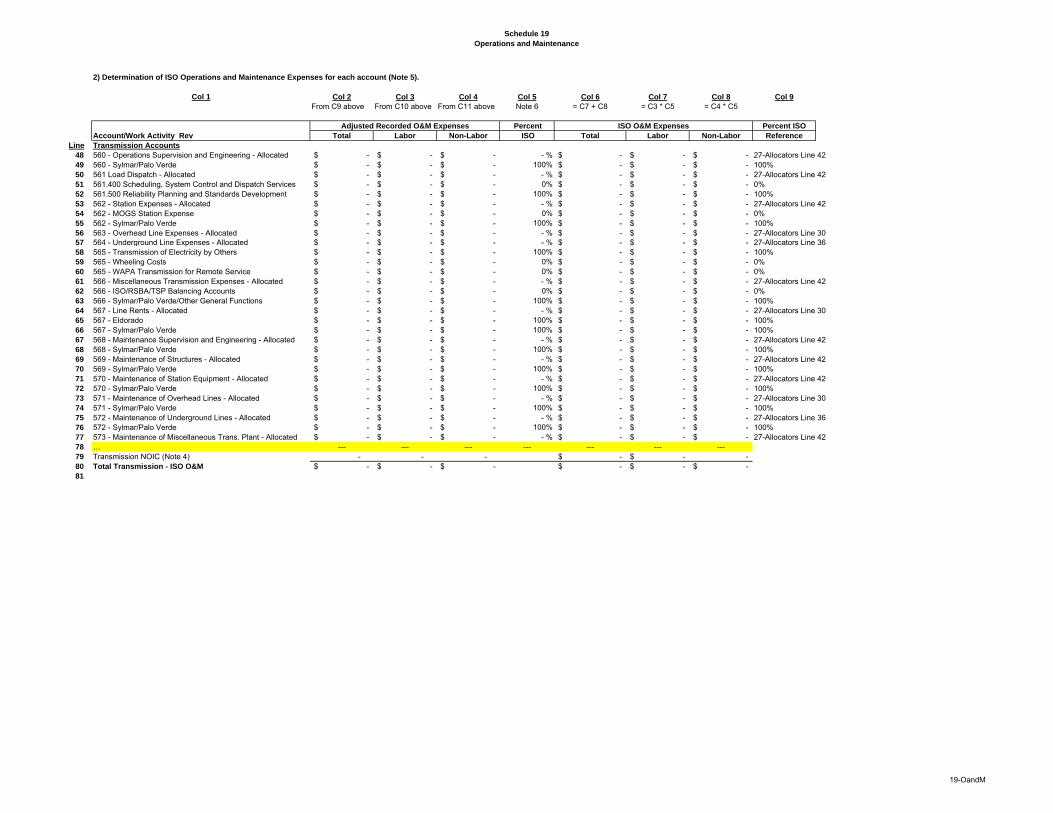
Schedule 19
Operations and Maintenance
2) Determination of ISO Operations and Maintenance Expenses for each account (Note 5).
Col 1 Col 2 Col 3 Col 4 Col 5 Col 6 Col 7 Col 8 Col 9
From C9 above From C10 above From C11 above Note 6 = C7 + C8 = C3 * C5 = C4 * C5
Percent Percent ISO
Total Labor Non-Labor ISO Total Labor Non-Labor Reference
Line Transmission Accounts
48 560 - Operations Supervision and Engineering - Allocated -$ -$ -$ - % -$ -$ -$ 27-Allocators Line 4249 560 - Sylmar/Palo Verde -$ -$ -$ 100% -$ -$ -$ 100%50 561 Load Dispatch - Allocated -$ -$ -$ - % -$ -$ -$ 27-Allocators Line 4251 561.400 Scheduling, System Control and Dispatch Services -$ -$ -$ 0% -$ -$ -$ 0%52 561.500 Reliability Planning and Standards Development -$ -$ -$ 100% -$ -$ -$ 100%53 562 - Station Expenses - Allocated -$ -$ -$ - % -$ -$ -$ 27-Allocators Line 4254 562 - MOGS Station Expense -$ -$ -$ 0% -$ -$ -$ 0%55 562 - Sylmar/Palo Verde -$ -$ -$ 100% -$ -$ -$ 100%56 563 - Overhead Line Expenses - Allocated -$ -$ -$ - % -$ -$ -$ 27-Allocators Line 3057 564 - Underground Line Expenses - Allocated -$ -$ -$ - % -$ -$ -$ 27-Allocators Line 3658 565 - Transmission of Electricity by Others -$ -$ -$ 100% -$ -$ -$ 100%59 565 - Wheeling Costs -$ -$ -$ 0% -$ -$ -$ 0%60 565 - WAPA Transmission for Remote Service -$ -$ -$ 0% -$ -$ -$ 0%61 566 - Miscellaneous Transmission Expenses - Allocated -$ -$ -$ - % -$ -$ -$ 27-Allocators Line 4262 566 - ISO/RSBA/TSP Balancing Accounts -$ -$ -$ 0% -$ -$ -$ 0%63 566 - Sylmar/Palo Verde/Other General Functions -$ -$ -$ 100% -$ -$ -$ 100%64 567 - Line Rents - Allocated -$ -$ -$ - % -$ -$ -$ 27-Allocators Line 3065 567 - Eldorado -$ -$ -$ 100% -$ -$ -$ 100%66 567 - Sylmar/Palo Verde -$ -$ -$ 100% -$ -$ -$ 100%67 568 - Maintenance Supervision and Engineering - Allocated -$ -$ -$ - % -$ -$ -$ 27-Allocators Line 4268 568 - Sylmar/Palo Verde -$ -$ -$ 100% -$ -$ -$ 100%69 569 - Maintenance of Structures - Allocated -$ -$ -$ - % -$ -$ -$ 27-Allocators Line 4270 569 - Sylmar/Palo Verde -$ -$ -$ 100% -$ -$ -$ 100%71 570 - Maintenance of Station Equipment - Allocated -$ -$ -$ - % -$ -$ -$ 27-Allocators Line 4272 570 - Sylmar/Palo Verde -$ -$ -$ 100% -$ -$ -$ 100%73 571 - Maintenance of Overhead Lines - Allocated -$ -$ -$ - % -$ -$ -$ 27-Allocators Line 3074 571 - Sylmar/Palo Verde -$ -$ -$ 100% -$ -$ -$ 100%75 572 - Maintenance of Underground Lines - Allocated -$ -$ -$ - % -$ -$ -$ 27-Allocators Line 3676 572 - Sylmar/Palo Verde -$ -$ -$ 100% -$ -$ -$ 100%77 573 - Maintenance of Miscellaneous Trans. Plant - Allocated -$ -$ -$ - % -$ -$ -$ 27-Allocators Line 4278 … --- --- --- --- --- --- ---79 Transmission NOIC (Note 4) - - - -$ -$ - 80 Total Transmission - ISO O&M -$ -$ -$ -$ -$ -$ 81
ISO O&M Expenses
Account/Work Activity Rev
Adjusted Recorded O&M Expenses
19-OandM
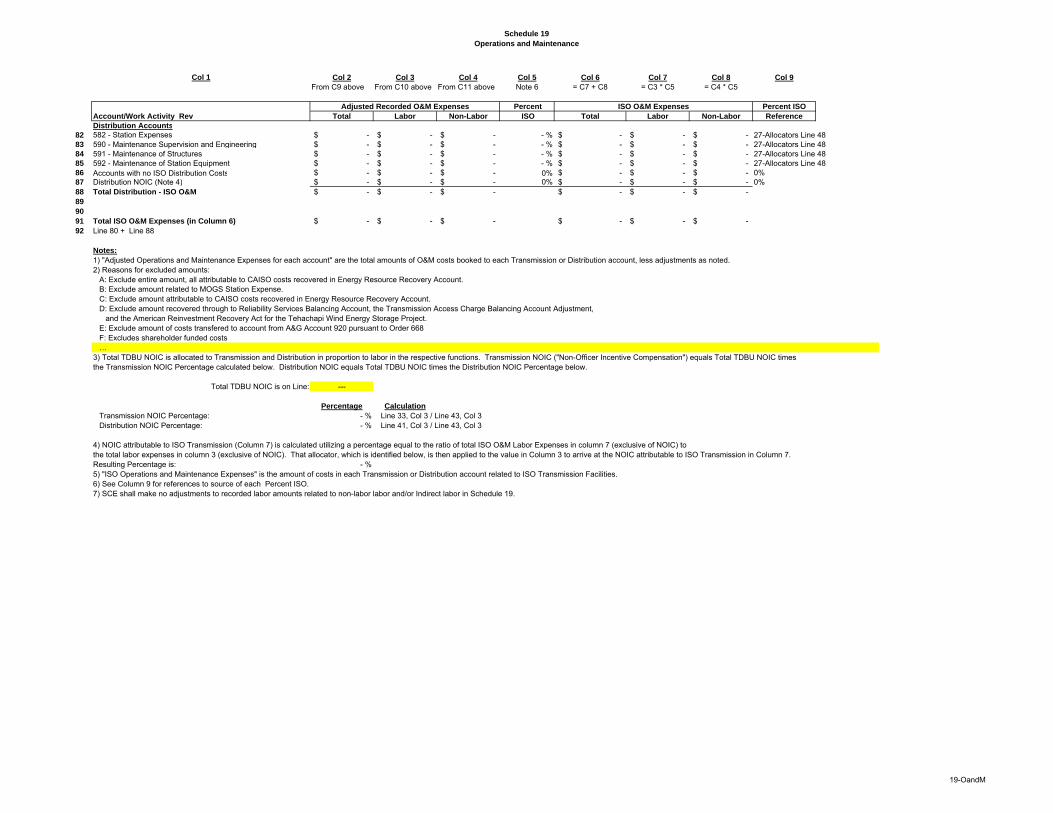
Schedule 19
Operations and Maintenance
Col 1 Col 2 Col 3 Col 4 Col 5 Col 6 Col 7 Col 8 Col 9
From C9 above From C10 above From C11 above Note 6 = C7 + C8 = C3 * C5 = C4 * C5
Percent Percent ISO
Total Labor Non-Labor ISO Total Labor Non-Labor Reference
Distribution Accounts
82 582 - Station Expenses -$ -$ -$ - % -$ -$ -$ 27-Allocators Line 4883 590 - Maintenance Supervision and Engineering -$ -$ -$ - % -$ -$ -$ 27-Allocators Line 4884 591 - Maintenance of Structures -$ -$ -$ - % -$ -$ -$ 27-Allocators Line 4885 592 - Maintenance of Station Equipment -$ -$ -$ - % -$ -$ -$ 27-Allocators Line 4886 Accounts with no ISO Distribution Costs -$ -$ -$ 0% -$ -$ -$ 0%87 Distribution NOIC (Note 4) -$ -$ -$ 0% -$ -$ -$ 0%88 Total Distribution - ISO O&M -$ -$ -$ -$ -$ -$ 89
90
91 Total ISO O&M Expenses (in Column 6) -$ -$ -$ -$ -$ -$ 92 Line 80 + Line 88
Notes:
1) "Adjusted Operations and Maintenance Expenses for each account" are the total amounts of O&M costs booked to each Transmission or Distribution account, less adjustments as noted.2) Reasons for excluded amounts:
A: Exclude entire amount, all attributable to CAISO costs recovered in Energy Resource Recovery Account.B: Exclude amount related to MOGS Station Expense.C: Exclude amount attributable to CAISO costs recovered in Energy Resource Recovery Account.D: Exclude amount recovered through to Reliability Services Balancing Account, the Transmission Access Charge Balancing Account Adjustment,
and the American Reinvestment Recovery Act for the Tehachapi Wind Energy Storage Project.E: Exclude amount of costs transfered to account from A&G Account 920 pursuant to Order 668F: Excludes shareholder funded costs…
3) Total TDBU NOIC is allocated to Transmission and Distribution in proportion to labor in the respective functions. Transmission NOIC ("Non-Officer Incentive Compensation") equals Total TDBU NOIC timesthe Transmission NOIC Percentage calculated below. Distribution NOIC equals Total TDBU NOIC times the Distribution NOIC Percentage below.
Total TDBU NOIC is on Line: ---
Percentage Calculation
Transmission NOIC Percentage: - % Line 33, Col 3 / Line 43, Col 3Distribution NOIC Percentage: - % Line 41, Col 3 / Line 43, Col 3
4) NOIC attributable to ISO Transmission (Column 7) is calculated utilizing a percentage equal to the ratio of total ISO O&M Labor Expenses in column 7 (exclusive of NOIC) to the total labor expenses in column 3 (exclusive of NOIC). That allocator, which is identified below, is then applied to the value in Column 3 to arrive at the NOIC attributable to ISO Transmission in Column 7.Resulting Percentage is: - %5) "ISO Operations and Maintenance Expenses" is the amount of costs in each Transmission or Distribution account related to ISO Transmission Facilities.6) See Column 9 for references to source of each Percent ISO.7) SCE shall make no adjustments to recorded labor amounts related to non-labor labor and/or Indirect labor in Schedule 19.
ISO O&M Expenses
Account/Work Activity Rev
Adjusted Recorded O&M Expenses
19-OandM
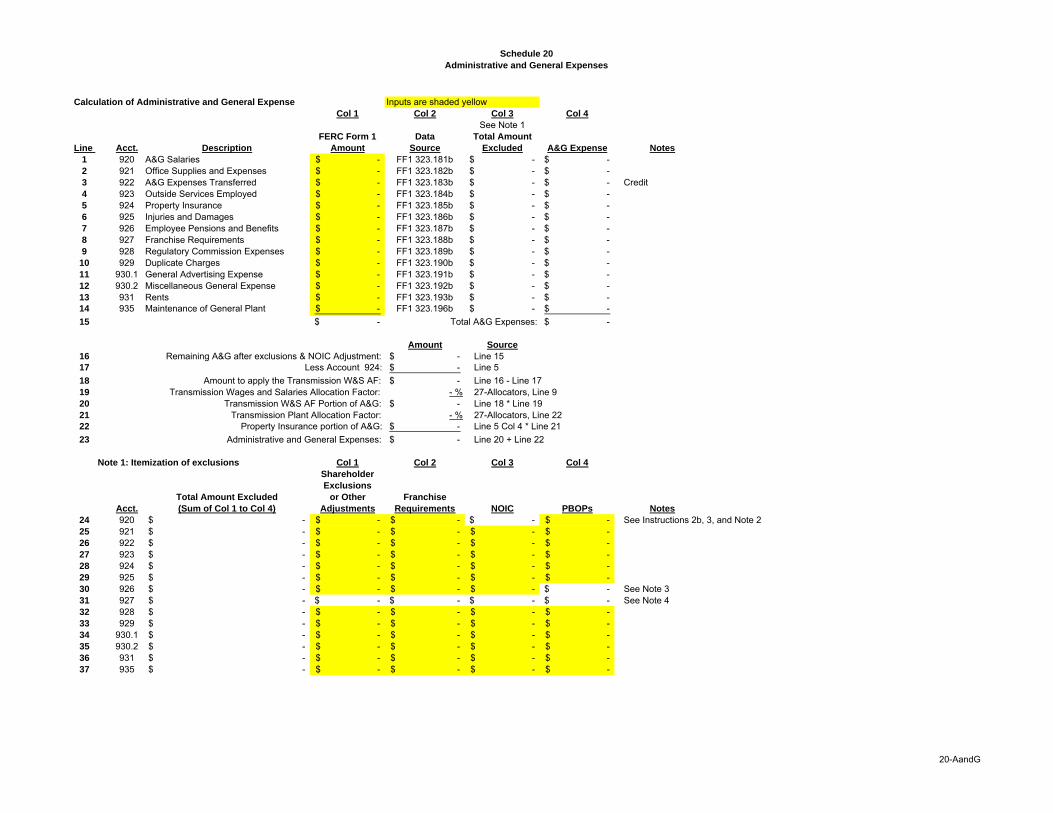
Schedule 20
Administrative and General Expenses
Calculation of Administrative and General Expense Inputs are shaded yellowCol 1 Col 2 Col 3 Col 4
See Note 1FERC Form 1 Data Total Amount
Line Acct. Description Amount Source Excluded A&G Expense Notes
1 920 A&G Salaries -$ FF1 323.181b -$ -$ 2 921 Office Supplies and Expenses -$ FF1 323.182b -$ -$ 3 922 A&G Expenses Transferred -$ FF1 323.183b -$ -$ Credit4 923 Outside Services Employed -$ FF1 323.184b -$ -$ 5 924 Property Insurance -$ FF1 323.185b -$ -$ 6 925 Injuries and Damages -$ FF1 323.186b -$ -$ 7 926 Employee Pensions and Benefits -$ FF1 323.187b -$ -$ 8 927 Franchise Requirements -$ FF1 323.188b -$ -$ 9 928 Regulatory Commission Expenses -$ FF1 323.189b -$ -$
10 929 Duplicate Charges -$ FF1 323.190b -$ -$ 11 930.1 General Advertising Expense -$ FF1 323.191b -$ -$ 12 930.2 Miscellaneous General Expense -$ FF1 323.192b -$ -$ 13 931 Rents -$ FF1 323.193b -$ -$ 14 935 Maintenance of General Plant -$ FF1 323.196b -$ -$
15 -$ Total A&G Expenses: -$
Amount Source
16 Remaining A&G after exclusions & NOIC Adjustment: -$ Line 1517 Less Account 924: -$ Line 5
18 Amount to apply the Transmission W&S AF: -$ Line 16 - Line 1719 Transmission Wages and Salaries Allocation Factor: - % 27-Allocators, Line 920 Transmission W&S AF Portion of A&G: -$ Line 18 * Line 1921 Transmission Plant Allocation Factor: - % 27-Allocators, Line 2222 Property Insurance portion of A&G: -$ Line 5 Col 4 * Line 21
23 Administrative and General Expenses: -$ Line 20 + Line 22
Note 1: Itemization of exclusions Col 1 Col 2 Col 3 Col 4
Shareholder
Exclusions
Total Amount Excluded or Other Franchise
Acct. (Sum of Col 1 to Col 4) Adjustments Requirements NOIC PBOPs Notes
24 920 -$ -$ -$ -$ -$ See Instructions 2b, 3, and Note 225 921 -$ -$ -$ -$ -$ 26 922 -$ -$ -$ -$ -$ 27 923 -$ -$ -$ -$ -$ 28 924 -$ -$ -$ -$ -$ 29 925 -$ -$ -$ -$ -$ 30 926 -$ -$ -$ -$ -$ See Note 331 927 -$ -$ -$ -$ -$ See Note 432 928 -$ -$ -$ -$ -$ 33 929 -$ -$ -$ -$ -$ 34 930.1 -$ -$ -$ -$ -$ 35 930.2 -$ -$ -$ -$ -$ 36 931 -$ -$ -$ -$ -$ 37 935 -$ -$ -$ -$ -$
20-AandG
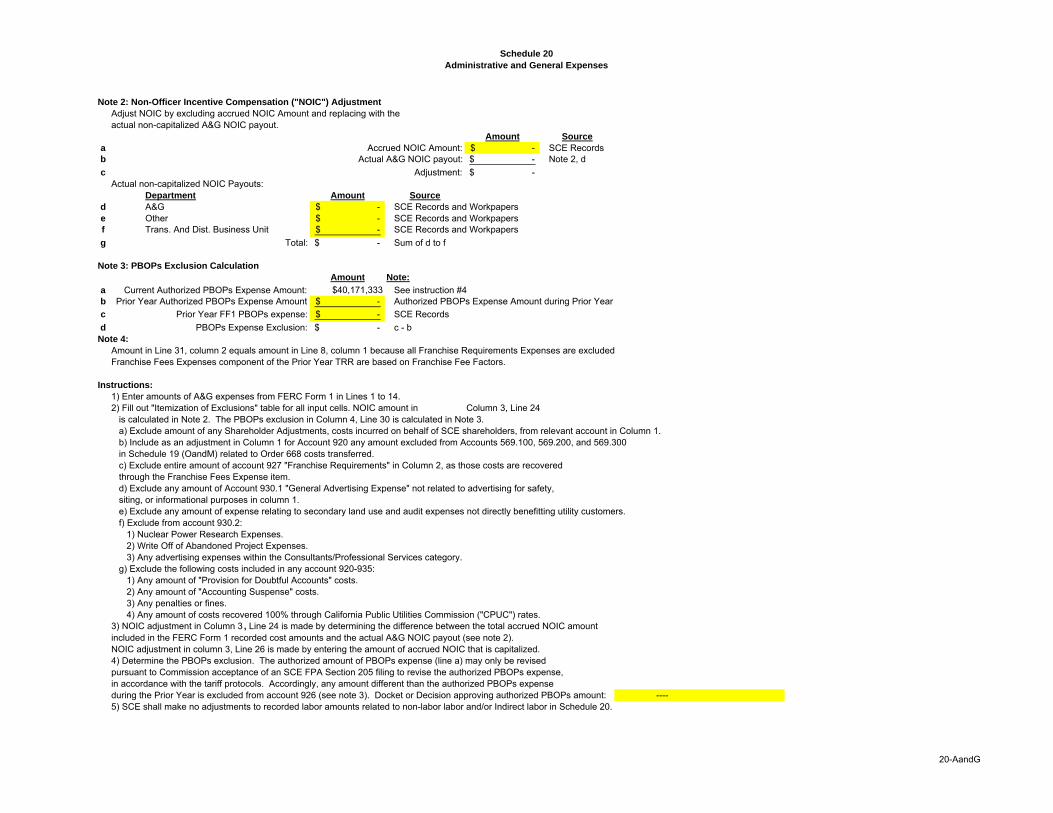
Schedule 20
Administrative and General Expenses
Note 2: Non-Officer Incentive Compensation ("NOIC") Adjustment
Adjust NOIC by excluding accrued NOIC Amount and replacing with the actual non-capitalized A&G NOIC payout.
Amount Source
a Accrued NOIC Amount: -$ SCE Recordsb Actual A&G NOIC payout: -$ Note 2, d
c Adjustment: -$ Actual non-capitalized NOIC Payouts:
Department Amount Source
d A&G -$ SCE Records and Workpaperse Other -$ SCE Records and Workpapersf Trans. And Dist. Business Unit -$ SCE Records and Workpapers
g Total: -$ Sum of d to f
Note 3: PBOPs Exclusion Calculation
Amount Note:
a Current Authorized PBOPs Expense Amount: $40,171,333 See instruction #4b Prior Year Authorized PBOPs Expense Amount -$ Authorized PBOPs Expense Amount during Prior Year
c Prior Year FF1 PBOPs expense: -$ SCE Records
d PBOPs Expense Exclusion: -$ c - bNote 4:
Amount in Line 31, column 2 equals amount in Line 8, column 1 because all Franchise Requirements Expenses are excludedFranchise Fees Expenses component of the Prior Year TRR are based on Franchise Fee Factors.
Instructions:
1) Enter amounts of A&G expenses from FERC Form 1 in Lines 1 to 14.2) Fill out "Itemization of Exclusions" table for all input cells. NOIC amount in Column 3, Line 24
is calculated in Note 2. The PBOPs exclusion in Column 4, Line 30 is calculated in Note 3.a) Exclude amount of any Shareholder Adjustments, costs incurred on behalf of SCE shareholders, from relevant account in Column 1.b) Include as an adjustment in Column 1 for Account 920 any amount excluded from Accounts 569.100, 569.200, and 569.300in Schedule 19 (OandM) related to Order 668 costs transferred.c) Exclude entire amount of account 927 "Franchise Requirements" in Column 2, as those costs are recovered through the Franchise Fees Expense item.d) Exclude any amount of Account 930.1 "General Advertising Expense" not related to advertising for safety, siting, or informational purposes in column 1.e) Exclude any amount of expense relating to secondary land use and audit expenses not directly benefitting utility customers.f) Exclude from account 930.2:
1) Nuclear Power Research Expenses.2) Write Off of Abandoned Project Expenses.3) Any advertising expenses within the Consultants/Professional Services category.
g) Exclude the following costs included in any account 920-935:1) Any amount of "Provision for Doubtful Accounts" costs. 2) Any amount of "Accounting Suspense" costs.3) Any penalties or fines.4) Any amount of costs recovered 100% through California Public Utilities Commission ("CPUC") rates.
3) NOIC adjustment in Column 3 , Line 24 is made by determining the difference between the total accrued NOIC amount included in the FERC Form 1 recorded cost amounts and the actual A&G NOIC payout (see note 2).NOIC adjustment in column 3, Line 26 is made by entering the amount of accrued NOIC that is capitalized.4) Determine the PBOPs exclusion. The authorized amount of PBOPs expense (line a) may only be revisedpursuant to Commission acceptance of an SCE FPA Section 205 filing to revise the authorized PBOPs expense,in accordance with the tariff protocols. Accordingly, any amount different than the authorized PBOPs expenseduring the Prior Year is excluded from account 926 (see note 3). Docket or Decision approving authorized PBOPs amount: ----5) SCE shall make no adjustments to recorded labor amounts related to non-labor labor and/or Indirect labor in Schedule 20.
20-AandG
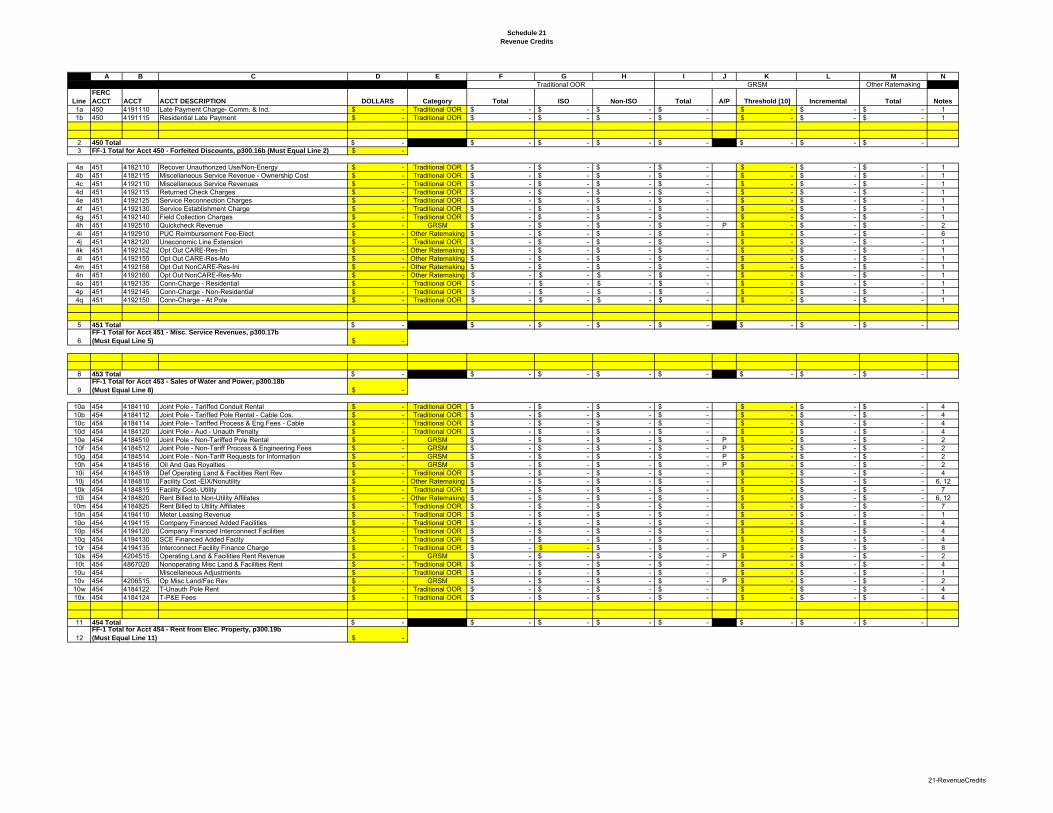
Schedule 21
Revenue Credits
A B C D E F G H I J K L M N
Other Ratemaking
Line
FERC
ACCT ACCT ACCT DESCRIPTION DOLLARS Category Total ISO Non-ISO Total A/P Threshold [10] Incremental Total Notes
1a 450 4191110 Late Payment Charge- Comm. & Ind. -$ Traditional OOR -$ -$ -$ -$ -$ -$ -$ 11b 450 4191115 Residential Late Payment -$ Traditional OOR -$ -$ -$ -$ -$ -$ -$ 1
2 -$ -$ -$ -$ -$ -$ -$ -$ 3 -$
4a 451 4182110 Recover Unauthorized Use/Non-Energy -$ Traditional OOR -$ -$ -$ -$ -$ -$ -$ 14b 451 4182115 Miscellaneous Service Revenue - Ownership Cost -$ Traditional OOR -$ -$ -$ -$ -$ -$ -$ 14c 451 4192110 Miscellaneous Service Revenues -$ Traditional OOR -$ -$ -$ -$ -$ -$ -$ 14d 451 4192115 Returned Check Charges -$ Traditional OOR -$ -$ -$ -$ -$ -$ -$ 14e 451 4192125 Service Reconnection Charges -$ Traditional OOR -$ -$ -$ -$ -$ -$ -$ 14f 451 4192130 Service Establishment Charge -$ Traditional OOR -$ -$ -$ -$ -$ -$ -$ 14g 451 4192140 Field Collection Charges -$ Traditional OOR -$ -$ -$ -$ -$ -$ -$ 14h 451 4192510 Quickcheck Revenue -$ GRSM -$ -$ -$ -$ P -$ -$ -$ 24i 451 4192910 PUC Reimbursement Fee-Elect -$ Other Ratemaking -$ -$ -$ -$ -$ -$ -$ 64j 451 4182120 Uneconomic Line Extension -$ Traditional OOR -$ -$ -$ -$ -$ -$ -$ 14k 451 4192152 Opt Out CARE-Res-Ini -$ Other Ratemaking -$ -$ -$ -$ -$ -$ -$ 14l 451 4192155 Opt Out CARE-Res-Mo -$ Other Ratemaking -$ -$ -$ -$ -$ -$ -$ 1
4m 451 4192158 Opt Out NonCARE-Res-Ini -$ Other Ratemaking -$ -$ -$ -$ -$ -$ -$ 14n 451 4192160 Opt Out NonCARE-Res-Mo -$ Other Ratemaking -$ -$ -$ -$ -$ -$ -$ 14o 451 4192135 Conn-Charge - Residential -$ Traditional OOR -$ -$ -$ -$ -$ -$ -$ 14p 451 4192145 Conn-Charge - Non-Residential -$ Traditional OOR -$ -$ -$ -$ -$ -$ -$ 14q 451 4192150 Conn-Charge - At Pole -$ Traditional OOR -$ -$ -$ -$ -$ -$ -$ 1
5 -$ -$ -$ -$ -$ -$ -$ -$
6 -$
8 -$ -$ -$ -$ -$ -$ -$ -$
9 -$
10a 454 4184110 Joint Pole - Tariffed Conduit Rental -$ Traditional OOR -$ -$ -$ -$ -$ -$ -$ 410b 454 4184112 Joint Pole - Tariffed Pole Rental - Cable Cos. -$ Traditional OOR -$ -$ -$ -$ -$ -$ -$ 410c 454 4184114 Joint Pole - Tariffed Process & Eng Fees - Cable -$ Traditional OOR -$ -$ -$ -$ -$ -$ -$ 410d 454 4184120 Joint Pole - Aud - Unauth Penalty -$ Traditional OOR -$ -$ -$ -$ -$ -$ -$ 410e 454 4184510 Joint Pole - Non-Tariffed Pole Rental -$ GRSM -$ -$ -$ -$ P -$ -$ -$ 210f 454 4184512 Joint Pole - Non-Tariff Process & Engineering Fees -$ GRSM -$ -$ -$ -$ P -$ -$ -$ 210g 454 4184514 Joint Pole - Non-Tariff Requests for Information -$ GRSM -$ -$ -$ -$ P -$ -$ -$ 210h 454 4184516 Oil And Gas Royalties -$ GRSM -$ -$ -$ -$ P -$ -$ -$ 210i 454 4184518 Def Operating Land & Facilities Rent Rev -$ Traditional OOR -$ -$ -$ -$ -$ -$ -$ 410j 454 4184810 Facility Cost -EIX/Nonutility -$ Other Ratemaking -$ -$ -$ -$ -$ -$ -$ 6, 1210k 454 4184815 Facility Cost- Utility -$ Traditional OOR -$ -$ -$ -$ -$ -$ -$ 710l 454 4184820 Rent Billed to Non-Utility Affiliates -$ Other Ratemaking -$ -$ -$ -$ -$ -$ -$ 6, 12
10m 454 4184825 Rent Billed to Utility Affiliates -$ Traditional OOR -$ -$ -$ -$ -$ -$ -$ 710n 454 4194110 Meter Leasing Revenue -$ Traditional OOR -$ -$ -$ -$ -$ -$ -$ 110o 454 4194115 Company Financed Added Facilities -$ Traditional OOR -$ -$ -$ -$ -$ -$ -$ 410p 454 4194120 Company Financed Interconnect Facilities -$ Traditional OOR -$ -$ -$ -$ -$ -$ -$ 410q 454 4194130 SCE Financed Added Faclty -$ Traditional OOR -$ -$ -$ -$ -$ -$ -$ 410r 454 4194135 Interconnect Facility Finance Charge -$ Traditional OOR -$ -$ -$ -$ -$ -$ -$ 810s 454 4204515 Operating Land & Facilities Rent Revenue -$ GRSM -$ -$ -$ -$ P -$ -$ -$ 210t 454 4867020 Nonoperating Misc Land & Facilities Rent -$ Traditional OOR -$ -$ -$ -$ -$ -$ -$ 410u 454 - Miscellaneous Adjustments -$ Traditional OOR -$ -$ -$ -$ -$ -$ -$ 110v 454 4206515 Op Misc Land/Fac Rev -$ GRSM -$ -$ -$ -$ P -$ -$ -$ 210w 454 4184122 T-Unauth Pole Rent -$ Traditional OOR -$ -$ -$ -$ -$ -$ -$ 410x 454 4184124 T-P&E Fees -$ Traditional OOR -$ -$ -$ -$ -$ -$ -$ 4
11 -$ -$ -$ -$ -$ -$ -$ -$
12 -$
GRSMTraditional OOR
FF-1 Total for Acct 454 - Rent from Elec. Property, p300.19b
(Must Equal Line 11)
FF-1 Total for Acct 453 - Sales of Water and Power, p300.18b
(Must Equal Line 8)
FF-1 Total for Acct 451 - Misc. Service Revenues, p300.17b
(Must Equal Line 5)
450 Total
FF-1 Total for Acct 450 - Forfeited Discounts, p300.16b (Must Equal Line 2)
453 Total
451 Total
454 Total
21-RevenueCredits
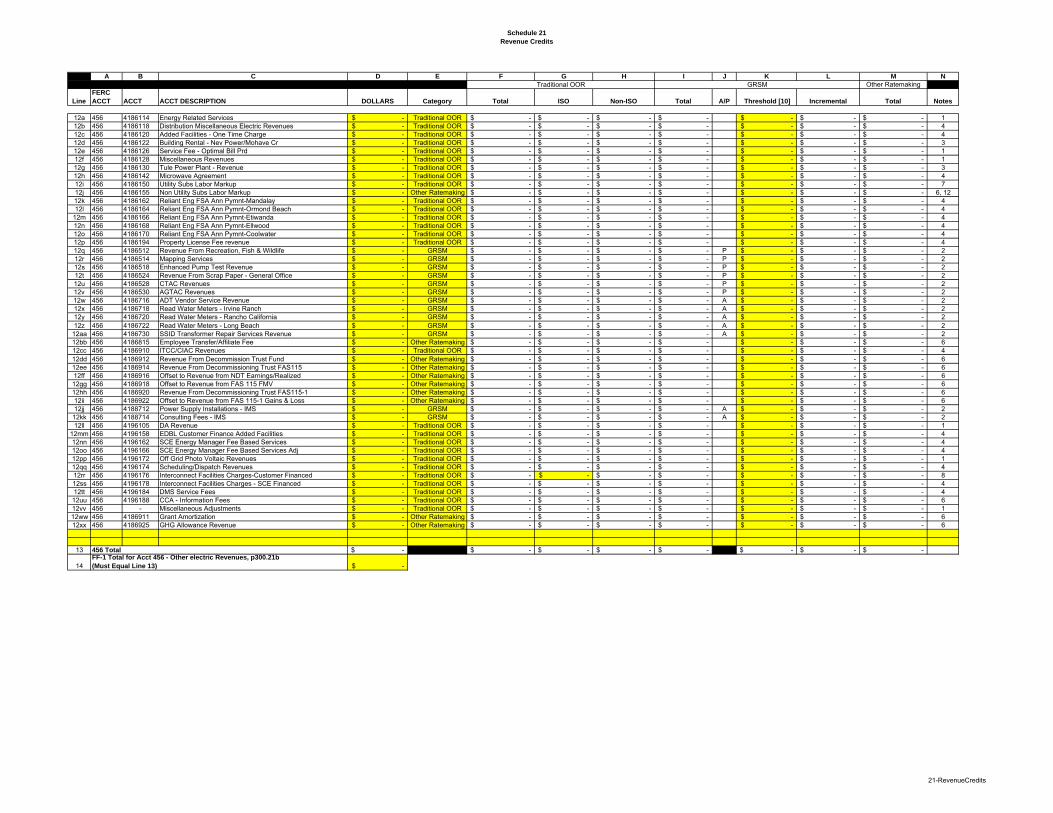
Schedule 21
Revenue Credits
A B C D E F G H I J K L M N
Other Ratemaking
Line
FERC
ACCT ACCT ACCT DESCRIPTION DOLLARS Category Total ISO Non-ISO Total A/P Threshold [10] Incremental Total Notes
GRSMTraditional OOR
12a 456 4186114 Energy Related Services -$ Traditional OOR -$ -$ -$ -$ -$ -$ -$ 112b 456 4186118 Distribution Miscellaneous Electric Revenues -$ Traditional OOR -$ -$ -$ -$ -$ -$ -$ 412c 456 4186120 Added Facilities - One Time Charge -$ Traditional OOR -$ -$ -$ -$ -$ -$ -$ 412d 456 4186122 Building Rental - Nev Power/Mohave Cr -$ Traditional OOR -$ -$ -$ -$ -$ -$ -$ 312e 456 4186126 Service Fee - Optimal Bill Prd -$ Traditional OOR -$ -$ -$ -$ -$ -$ -$ 112f 456 4186128 Miscellaneous Revenues -$ Traditional OOR -$ -$ -$ -$ -$ -$ -$ 112g 456 4186130 Tule Power Plant - Revenue -$ Traditional OOR -$ -$ -$ -$ -$ -$ -$ 312h 456 4186142 Microwave Agreement -$ Traditional OOR -$ -$ -$ -$ -$ -$ -$ 412i 456 4186150 Utility Subs Labor Markup -$ Traditional OOR -$ -$ -$ -$ -$ -$ -$ 712j 456 4186155 Non Utility Subs Labor Markup -$ Other Ratemaking -$ -$ -$ -$ -$ -$ -$ 6, 1212k 456 4186162 Reliant Eng FSA Ann Pymnt-Mandalay -$ Traditional OOR -$ -$ -$ -$ -$ -$ -$ 412l 456 4186164 Reliant Eng FSA Ann Pymnt-Ormond Beach -$ Traditional OOR -$ -$ -$ -$ -$ -$ -$ 4
12m 456 4186166 Reliant Eng FSA Ann Pymnt-Etiwanda -$ Traditional OOR -$ -$ -$ -$ -$ -$ -$ 412n 456 4186168 Reliant Eng FSA Ann Pymnt-Ellwood -$ Traditional OOR -$ -$ -$ -$ -$ -$ -$ 412o 456 4186170 Reliant Eng FSA Ann Pymnt-Coolwater -$ Traditional OOR -$ -$ -$ -$ -$ -$ -$ 412p 456 4186194 Property License Fee revenue -$ Traditional OOR -$ -$ -$ -$ -$ -$ -$ 412q 456 4186512 Revenue From Recreation, Fish & Wildlife -$ GRSM -$ -$ -$ -$ P -$ -$ -$ 212r 456 4186514 Mapping Services -$ GRSM -$ -$ -$ -$ P -$ -$ -$ 212s 456 4186518 Enhanced Pump Test Revenue -$ GRSM -$ -$ -$ -$ P -$ -$ -$ 212t 456 4186524 Revenue From Scrap Paper - General Office -$ GRSM -$ -$ -$ -$ P -$ -$ -$ 212u 456 4186528 CTAC Revenues -$ GRSM -$ -$ -$ -$ P -$ -$ -$ 212v 456 4186530 AGTAC Revenues -$ GRSM -$ -$ -$ -$ P -$ -$ -$ 212w 456 4186716 ADT Vendor Service Revenue -$ GRSM -$ -$ -$ -$ A -$ -$ -$ 212x 456 4186718 Read Water Meters - Irvine Ranch -$ GRSM -$ -$ -$ -$ A -$ -$ -$ 212y 456 4186720 Read Water Meters - Rancho California -$ GRSM -$ -$ -$ -$ A -$ -$ -$ 212z 456 4186722 Read Water Meters - Long Beach -$ GRSM -$ -$ -$ -$ A -$ -$ -$ 2
12aa 456 4186730 SSID Transformer Repair Services Revenue -$ GRSM -$ -$ -$ -$ A -$ -$ -$ 212bb 456 4186815 Employee Transfer/Affiliate Fee -$ Other Ratemaking -$ -$ -$ -$ -$ -$ -$ 612cc 456 4186910 ITCC/CIAC Revenues -$ Traditional OOR -$ -$ -$ -$ -$ -$ -$ 412dd 456 4186912 Revenue From Decommission Trust Fund -$ Other Ratemaking -$ -$ -$ -$ -$ -$ -$ 612ee 456 4186914 Revenue From Decommissioning Trust FAS115 -$ Other Ratemaking -$ -$ -$ -$ -$ -$ -$ 612ff 456 4186916 Offset to Revenue from NDT Earnings/Realized -$ Other Ratemaking -$ -$ -$ -$ -$ -$ -$ 612gg 456 4186918 Offset to Revenue from FAS 115 FMV -$ Other Ratemaking -$ -$ -$ -$ -$ -$ -$ 612hh 456 4186920 Revenue From Decommissioning Trust FAS115-1 -$ Other Ratemaking -$ -$ -$ -$ -$ -$ -$ 612ii 456 4186922 Offset to Revenue from FAS 115-1 Gains & Loss -$ Other Ratemaking -$ -$ -$ -$ -$ -$ -$ 612jj 456 4188712 Power Supply Installations - IMS -$ GRSM -$ -$ -$ -$ A -$ -$ -$ 212kk 456 4188714 Consulting Fees - IMS -$ GRSM -$ -$ -$ -$ A -$ -$ -$ 212ll 456 4196105 DA Revenue -$ Traditional OOR -$ -$ -$ -$ -$ -$ -$ 1
12mm 456 4196158 EDBL Customer Finance Added Facilities -$ Traditional OOR -$ -$ -$ -$ -$ -$ -$ 412nn 456 4196162 SCE Energy Manager Fee Based Services -$ Traditional OOR -$ -$ -$ -$ -$ -$ -$ 412oo 456 4196166 SCE Energy Manager Fee Based Services Adj -$ Traditional OOR -$ -$ -$ -$ -$ -$ -$ 412pp 456 4196172 Off Grid Photo Voltaic Revenues -$ Traditional OOR -$ -$ -$ -$ -$ -$ -$ 112qq 456 4196174 Scheduling/Dispatch Revenues -$ Traditional OOR -$ -$ -$ -$ -$ -$ -$ 412rr 456 4196176 Interconnect Facilities Charges-Customer Financed -$ Traditional OOR -$ -$ -$ -$ -$ -$ -$ 812ss 456 4196178 Interconnect Facilities Charges - SCE Financed -$ Traditional OOR -$ -$ -$ -$ -$ -$ -$ 412tt 456 4196184 DMS Service Fees -$ Traditional OOR -$ -$ -$ -$ -$ -$ -$ 412uu 456 4196188 CCA - Information Fees -$ Traditional OOR -$ -$ -$ -$ -$ -$ -$ 612vv 456 - Miscellaneous Adjustments -$ Traditional OOR -$ -$ -$ -$ -$ -$ -$ 112ww 456 4186911 Grant Amortization -$ Other Ratemaking -$ -$ -$ -$ -$ -$ -$ 612xx 456 4186925 GHG Allowance Revenue -$ Other Ratemaking -$ -$ -$ -$ -$ -$ -$ 6
13 -$ -$ -$ -$ -$ -$ -$ -$
14 -$ FF-1 Total for Acct 456 - Other electric Revenues, p300.21b
(Must Equal Line 13)
456 Total
21-RevenueCredits
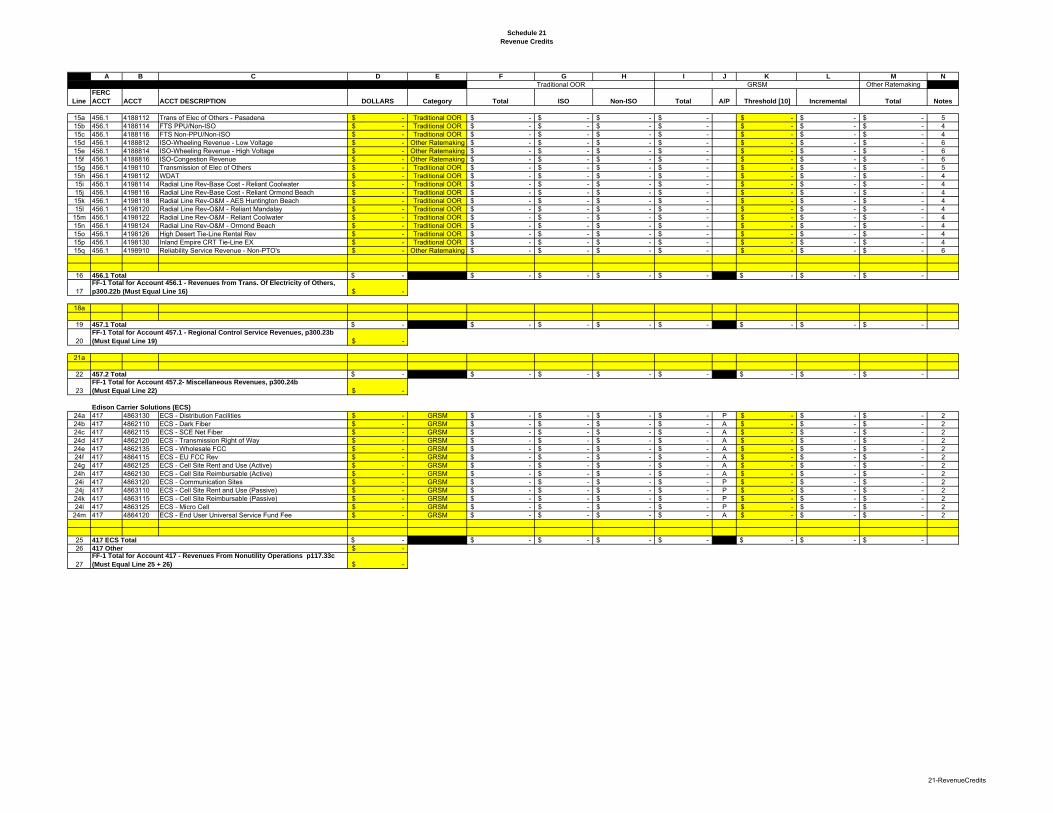
Schedule 21
Revenue Credits
A B C D E F G H I J K L M N
Other Ratemaking
Line
FERC
ACCT ACCT ACCT DESCRIPTION DOLLARS Category Total ISO Non-ISO Total A/P Threshold [10] Incremental Total Notes
GRSMTraditional OOR
15a 456.1 4188112 Trans of Elec of Others - Pasadena -$ Traditional OOR -$ -$ -$ -$ -$ -$ -$ 515b 456.1 4188114 FTS PPU/Non-ISO -$ Traditional OOR -$ -$ -$ -$ -$ -$ -$ 415c 456.1 4188116 FTS Non-PPU/Non-ISO -$ Traditional OOR -$ -$ -$ -$ -$ -$ -$ 415d 456.1 4188812 ISO-Wheeling Revenue - Low Voltage -$ Other Ratemaking -$ -$ -$ -$ -$ -$ -$ 615e 456.1 4188814 ISO-Wheeling Revenue - High Voltage -$ Other Ratemaking -$ -$ -$ -$ -$ -$ -$ 615f 456.1 4188816 ISO-Congestion Revenue -$ Other Ratemaking -$ -$ -$ -$ -$ -$ -$ 615g 456.1 4198110 Transmission of Elec of Others -$ Traditional OOR -$ -$ -$ -$ -$ -$ -$ 515h 456.1 4198112 WDAT -$ Traditional OOR -$ -$ -$ -$ -$ -$ -$ 415i 456.1 4198114 Radial Line Rev-Base Cost - Reliant Coolwater -$ Traditional OOR -$ -$ -$ -$ -$ -$ -$ 415j 456.1 4198116 Radial Line Rev-Base Cost - Reliant Ormond Beach -$ Traditional OOR -$ -$ -$ -$ -$ -$ -$ 415k 456.1 4198118 Radial Line Rev-O&M - AES Huntington Beach -$ Traditional OOR -$ -$ -$ -$ -$ -$ -$ 415l 456.1 4198120 Radial Line Rev-O&M - Reliant Mandalay -$ Traditional OOR -$ -$ -$ -$ -$ -$ -$ 4
15m 456.1 4198122 Radial Line Rev-O&M - Reliant Coolwater -$ Traditional OOR -$ -$ -$ -$ -$ -$ -$ 415n 456.1 4198124 Radial Line Rev-O&M - Ormond Beach -$ Traditional OOR -$ -$ -$ -$ -$ -$ -$ 415o 456.1 4198126 High Desert Tie-Line Rental Rev -$ Traditional OOR -$ -$ -$ -$ -$ -$ -$ 415p 456.1 4198130 Inland Empire CRT Tie-Line EX -$ Traditional OOR -$ -$ -$ -$ -$ -$ -$ 415q 456.1 4198910 Reliability Service Revenue - Non-PTO's -$ Other Ratemaking -$ -$ -$ -$ -$ -$ -$ 6
16 -$ -$ -$ -$ -$ -$ -$ -$
17 -$
18a
19 -$ -$ -$ -$ -$ -$ -$ -$
20 -$
21a
22 -$ -$ -$ -$ -$ -$ -$ -$
23 -$
Edison Carrier Solutions (ECS)
24a 417 4863130 ECS - Distribution Facilities -$ GRSM -$ -$ -$ -$ P -$ -$ -$ 224b 417 4862110 ECS - Dark Fiber -$ GRSM -$ -$ -$ -$ A -$ -$ -$ 224c 417 4862115 ECS - SCE Net Fiber -$ GRSM -$ -$ -$ -$ A -$ -$ -$ 224d 417 4862120 ECS - Transmission Right of Way -$ GRSM -$ -$ -$ -$ A -$ -$ -$ 224e 417 4862135 ECS - Wholesale FCC -$ GRSM -$ -$ -$ -$ A -$ -$ -$ 224f 417 4864115 ECS - EU FCC Rev -$ GRSM -$ -$ -$ -$ A -$ -$ -$ 224g 417 4862125 ECS - Cell Site Rent and Use (Active) -$ GRSM -$ -$ -$ -$ A -$ -$ -$ 224h 417 4862130 ECS - Cell Site Reimbursable (Active) -$ GRSM -$ -$ -$ -$ A -$ -$ -$ 224i 417 4863120 ECS - Communication Sites -$ GRSM -$ -$ -$ -$ P -$ -$ -$ 224j 417 4863110 ECS - Cell Site Rent and Use (Passive) -$ GRSM -$ -$ -$ -$ P -$ -$ -$ 224k 417 4863115 ECS - Cell Site Reimbursable (Passive) -$ GRSM -$ -$ -$ -$ P -$ -$ -$ 224l 417 4863125 ECS - Micro Cell -$ GRSM -$ -$ -$ -$ P -$ -$ -$ 2
24m 417 4864120 ECS - End User Universal Service Fund Fee -$ GRSM -$ -$ -$ -$ A -$ -$ -$ 2
25 -$ -$ -$ -$ -$ -$ -$ -$ 26 -$
27 -$
FF-1 Total for Account 417 - Revenues From Nonutility Operations p117.33c
(Must Equal Line 25 + 26)
FF-1 Total for Account 456.1 - Revenues from Trans. Of Electricity of Others,
p300.22b (Must Equal Line 16)
417 Other
457.2 Total
FF-1 Total for Account 457.1 - Regional Control Service Revenues, p300.23b
(Must Equal Line 19)
417 ECS Total
FF-1 Total for Account 457.2- Miscellaneous Revenues, p300.24b
(Must Equal Line 22)
457.1 Total
456.1 Total
21-RevenueCredits
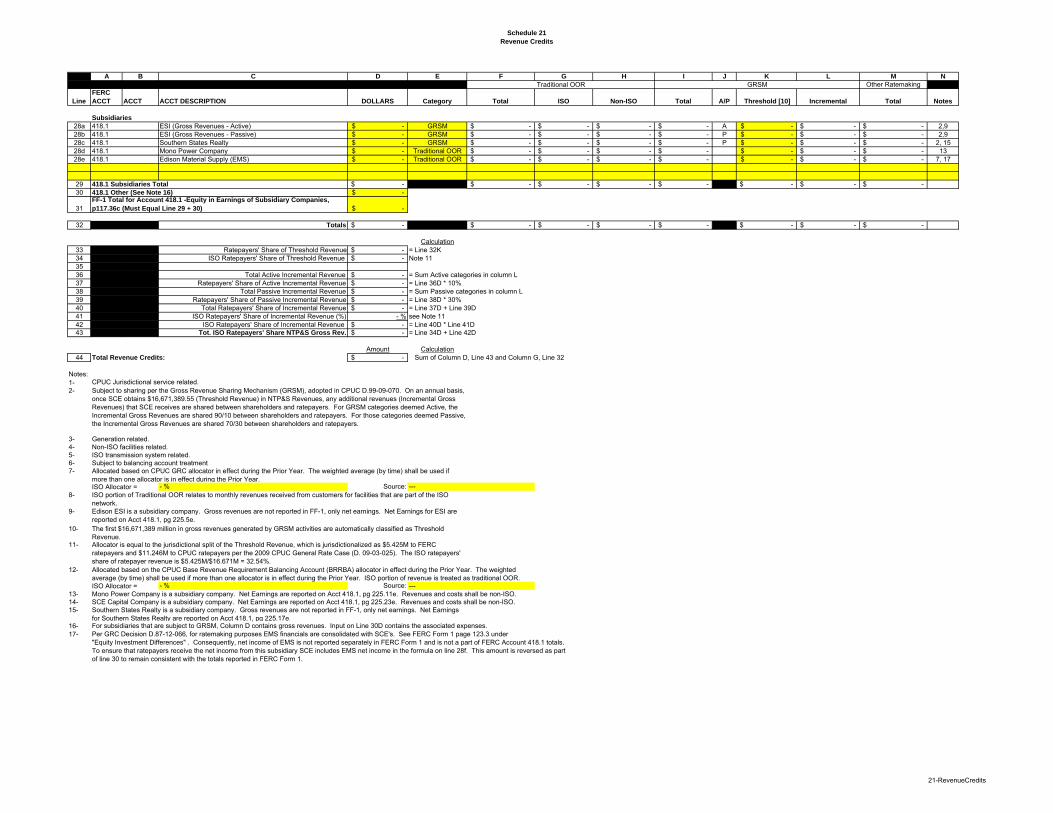
Schedule 21
Revenue Credits
A B C D E F G H I J K L M N
Other Ratemaking
Line
FERC
ACCT ACCT ACCT DESCRIPTION DOLLARS Category Total ISO Non-ISO Total A/P Threshold [10] Incremental Total Notes
GRSMTraditional OOR
Subsidiaries
28a ESI (Gross Revenues - Active) -$ GRSM -$ -$ -$ -$ A -$ -$ -$ 2,928b ESI (Gross Revenues - Passive) -$ GRSM -$ -$ -$ -$ P -$ -$ -$ 2,928c Southern States Realty -$ GRSM -$ -$ -$ -$ P -$ -$ -$ 2, 1528d Mono Power Company -$ Traditional OOR -$ -$ -$ -$ -$ -$ -$ 1328e 418.1 Edison Material Supply (EMS) -$ Traditional OOR -$ -$ -$ -$ -$ -$ -$ 7, 17
29 -$ -$ -$ -$ -$ -$ -$ -$ 30 -$
31 -$
32 Totals -$ -$ -$ -$ -$ -$ -$ -$
Calculation33 Ratepayers' Share of Threshold Revenue -$ = Line 32K34 ISO Ratepayers' Share of Threshold Revenue -$ Note 113536 Total Active Incremental Revenue -$ = Sum Active categories in column L37 Ratepayers' Share of Active Incremental Revenue -$ = Line 36D * 10%38 Total Passive Incremental Revenue -$ = Sum Passive categories in column L39 Ratepayers' Share of Passive Incremental Revenue -$ = Line 38D * 30%40 Total Ratepayers' Share of Incremental Revenue -$ = Line 37D + Line 39D41 ISO Ratepayers' Share of Incremental Revenue (%) - % see Note 1142 ISO Ratepayers' Share of Incremental Revenue -$ = Line 40D * Line 41D43 Tot. ISO Ratepayers' Share NTP&S Gross Rev. -$ = Line 34D + Line 42D
Amount Calculation44 Total Revenue Credits: -$ Sum of Column D, Line 43 and Column G, Line 32
Notes:1-2-
3-4-5-6-7-
- % Source: ---8-
9-
10-
11-
12-
- % Source: ---13-14-15-
16- For subsidiaries that are subject to GRSM, Column D contains gross revenues. Input on Line 30D contains the associated expenses.17- Per GRC Decision D.87-12-066, for ratemaking purposes EMS financials are consolidated with SCE's. See FERC Form 1 page 123.3 under
"Equity Investment Differences" . Consequently, net income of EMS is not reported separately in FERC Form 1 and is not a part of FERC Account 418.1 totals.To ensure that ratepayers receive the net income from this subsidiary SCE includes EMS net income in the formula on line 28f. This amount is reversed as partof line 30 to remain consistent with the totals reported in FERC Form 1.
Southern States Realty is a subsidiary company. Gross revenues are not reported in FF-1, only net earnings. Net Earnings for Southern States Realty are reported on Acct 418.1, pg 225.17e.
Generation related.Non-ISO facilities related.
Subject to balancing account treatmentISO transmission system related.
ISO portion of Traditional OOR relates to monthly revenues received from customers for facilities that are part of the ISO network.
Subject to sharing per the Gross Revenue Sharing Mechanism (GRSM), adopted in CPUC D.99-09-070. On an annual basis, once SCE obtains $16,671,389.55 (Threshold Revenue) in NTP&S Revenues, any additional revenues (Incremental Gross Revenues) that SCE receives are shared between shareholders and ratepayers. For GRSM categories deemed Active, the Incremental Gross Revenues are shared 90/10 between shareholders and ratepayers. For those categories deemed Passive, the Incremental Gross Revenues are shared 70/30 between shareholders and ratepayers.
418.1418.1
418.1
418.1 Subsidiaries Total
FF-1 Total for Account 418.1 -Equity in Earnings of Subsidiary Companies,
p117.36c (Must Equal Line 29 + 30)
418.1 Other (See Note 16)
418.1
Mono Power Company is a subsidiary company. Net Earnings are reported on Acct 418.1, pg 225.11e. Revenues and costs shall be non-ISO.SCE Capital Company is a subsidiary company. Net Earnings are reported on Acct 418.1, pg 225.23e. Revenues and costs shall be non-ISO.
The first $16,671,389 million in gross revenues generated by GRSM activities are automatically classified as Threshold Revenue.Allocator is equal to the jurisdictional split of the Threshold Revenue, which is jurisdictionalized as $5.425M to FERC ratepayers and $11.246M to CPUC ratepayers per the 2009 CPUC General Rate Case (D. 09-03-025). The ISO ratepayers' share of ratepayer revenue is $5.425M/$16.671M = 32.54%.
ISO Allocator =
Allocated based on the CPUC Base Revenue Requirement Balancing Account (BRRBA) allocator in effect during the Prior Year. The weighted average (by time) shall be used if more than one allocator is in effect during the Prior Year. ISO portion of revenue is treated as traditional OOR.
CPUC Jurisdictional service related.
ISO Allocator =
Allocated based on CPUC GRC allocator in effect during the Prior Year. The weighted average (by time) shall be used if more than one allocator is in effect during the Prior Year.
Edison ESI is a subsidiary company. Gross revenues are not reported in FF-1, only net earnings. Net Earnings for ESI are reported on Acct 418.1, pg 225.5e.
21-RevenueCredits
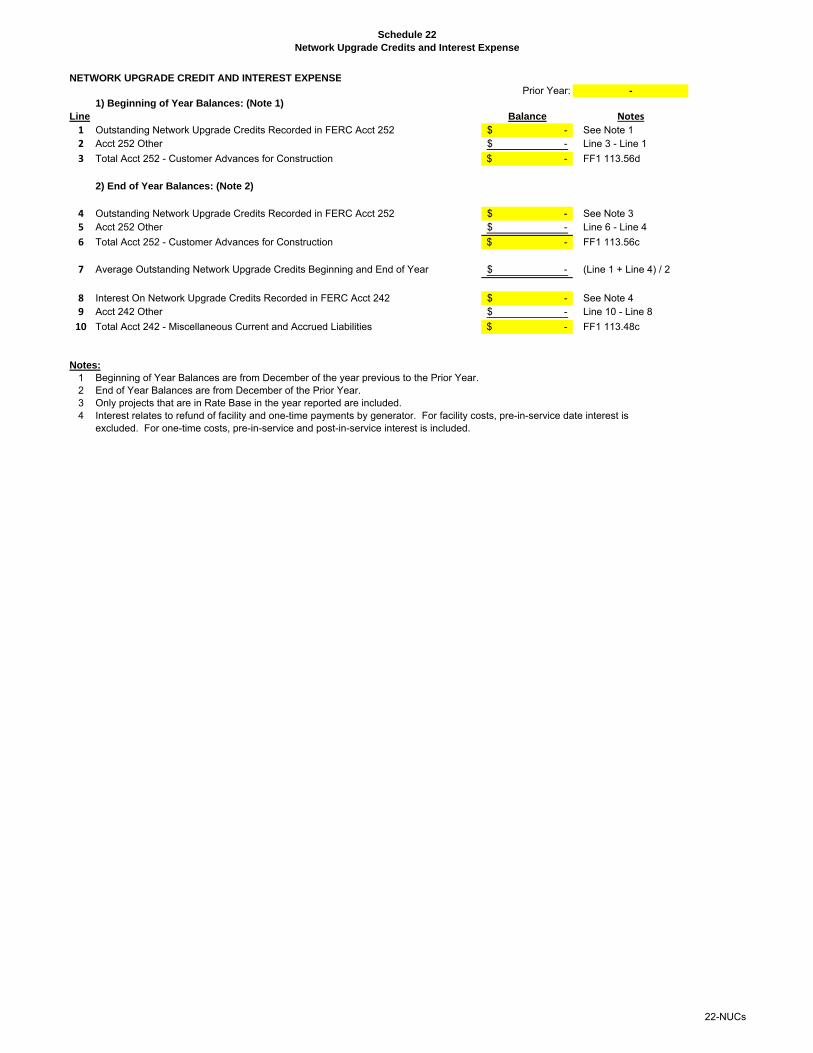
Schedule 22
Network Upgrade Credits and Interest Expense
NETWORK UPGRADE CREDIT AND INTEREST EXPENSE
Prior Year: -
1) Beginning of Year Balances: (Note 1)
Line Balance Notes1 Outstanding Network Upgrade Credits Recorded in FERC Acct 252 -$ See Note 12 Acct 252 Other -$ Line 3 - Line 1
3 Total Acct 252 - Customer Advances for Construction -$ FF1 113.56d
2) End of Year Balances: (Note 2)
4 Outstanding Network Upgrade Credits Recorded in FERC Acct 252 -$ See Note 35 Acct 252 Other -$ Line 6 - Line 4
6 Total Acct 252 - Customer Advances for Construction -$ FF1 113.56c
7 Average Outstanding Network Upgrade Credits Beginning and End of Year -$ (Line 1 + Line 4) / 2
8 Interest On Network Upgrade Credits Recorded in FERC Acct 242 -$ See Note 49 Acct 242 Other -$ Line 10 - Line 8
10 Total Acct 242 - Miscellaneous Current and Accrued Liabilities -$ FF1 113.48c
Notes:
1 Beginning of Year Balances are from December of the year previous to the Prior Year.2 End of Year Balances are from December of the Prior Year.3 Only projects that are in Rate Base in the year reported are included.4 Interest relates to refund of facility and one-time payments by generator. For facility costs, pre-in-service date interest is
excluded. For one-time costs, pre-in-service and post-in-service interest is included.
22-NUCs

Schedule 23
Regulatory Assets and Liabilities
Determination of Regulatory Assets/Liabilities and Associated Amortization and Regulatory Debits/Credits
Line
1 Other Regulatory Assets/Liabilities are a component of Rate Base representing costs that are created resulting from the ratemaking2 actions of regulatory agencies. Pursuant to the Commission's Uniform System of Accounts, these items include amounts recorded 3 in accounts 182.x and 254. This Schedule shall not include any costs recovered through Schedule 12.4
5 SCE shall include a non-zero amount of Other Regulatory Assets/Liabilities only with Commission 6 approval received subsequent to an SCE Section 205 filing requesting such treatment.7
8 Amortization and Regulatory Debits/Credits are amounts approved for recovery in this formula transmission rate representing the9 approved annual recovery of Other Regulatory Assets/Liabilities as an expense item in the Base TRR, consistent10 with a Commission Order. 11
12 Prior Year
13 Amount Calculation or Source
14 Other Regulatory Assets/Liabilities (EOY): -$ Sum of Column 2 below15 Other Regulatory Assets/Liabilities (BOY/EOY average): -$ Avg. of Sum of Cols. 1 and 2 below16 Amortization and Regulatory Debits/Credits: -$ Sum of Column 3 below
Col 1 Col 2 Col 3
Prior Year Prior Year Prior Year
Description of Issue BOY EOY Amortization or Commission Order
Resulting in Other Regulatory Other Reg Other Reg Regulatory Granting Approval of
Asset/Liability Asset/Liability Asset/Liability Debit/Credit Regulatory Liability
17 Issue #1 -$ -$ -$ ---18 Issue #2 -$ -$ -$ ---19 Issue #3 -$ -$ -$ ---
20 Totals: -$ -$ -$ Sum of above
Instructions:
1) Upon Commission approval of recovery of Other Regulatory Assets/Liabilities, Amortization and Regulatory Debits/Creditscosts through this formula transmission rate:
a) Fill in Description for issue in above table.b) Enter costs in columns 1-3 in above table for the applicable Prior Year.
2) Add additional lines as necessary for additional issues.
23-RegAssets
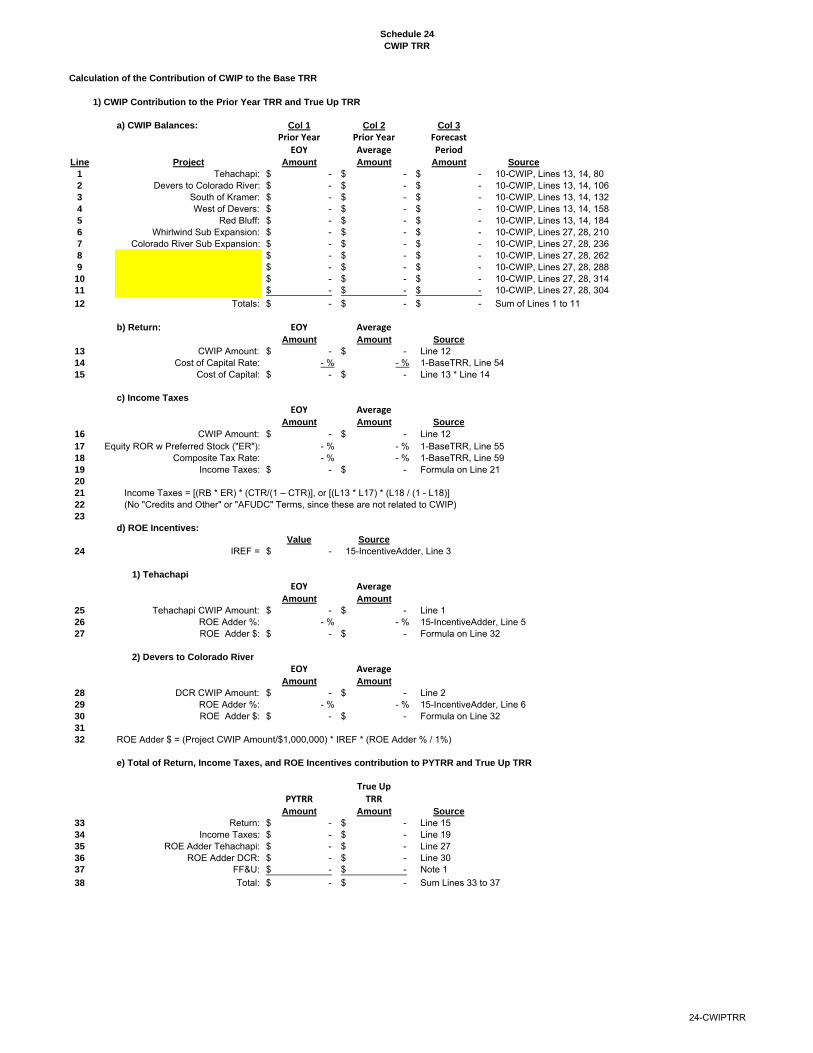
Schedule 24
CWIP TRR
Calculation of the Contribution of CWIP to the Base TRR
1) CWIP Contribution to the Prior Year TRR and True Up TRR
a) CWIP Balances: Col 1 Col 2 Col 3
Prior Year Prior Year ForecastEOY Average Period
Line Project Amount Amount Amount Source
1 Tehachapi: -$ -$ -$ 10-CWIP, Lines 13, 14, 802 Devers to Colorado River: -$ -$ -$ 10-CWIP, Lines 13, 14, 1063 South of Kramer: -$ -$ -$ 10-CWIP, Lines 13, 14, 1324 West of Devers: -$ -$ -$ 10-CWIP, Lines 13, 14, 1585 Red Bluff: -$ -$ -$ 10-CWIP, Lines 13, 14, 1846 Whirlwind Sub Expansion: -$ -$ -$ 10-CWIP, Lines 27, 28, 2107 Colorado River Sub Expansion: -$ -$ -$ 10-CWIP, Lines 27, 28, 2368 -$ -$ -$ 10-CWIP, Lines 27, 28, 2629 -$ -$ -$ 10-CWIP, Lines 27, 28, 28810 -$ -$ -$ 10-CWIP, Lines 27, 28, 31411 -$ -$ -$ 10-CWIP, Lines 27, 28, 304
12 Totals: -$ -$ -$ Sum of Lines 1 to 11
b) Return: EOY AverageAmount Amount Source
13 CWIP Amount: -$ -$ Line 1214 Cost of Capital Rate: - % - % 1-BaseTRR, Line 5415 Cost of Capital: -$ -$ Line 13 * Line 14
c) Income Taxes
EOY AverageAmount Amount Source
16 CWIP Amount: -$ -$ Line 1217 Equity ROR w Preferred Stock ("ER"): - % - % 1-BaseTRR, Line 5518 Composite Tax Rate: - % - % 1-BaseTRR, Line 5919 Income Taxes: -$ -$ Formula on Line 2120
21 Income Taxes = [(RB * ER) * (CTR/(1 – CTR)], or [(L13 * L17) * (L18 / (1 - L18)]22 (No "Credits and Other" or "AFUDC" Terms, since these are not related to CWIP)23
d) ROE Incentives:
Value Source
24 IREF = -$ 15-IncentiveAdder, Line 3
1) Tehachapi
EOY AverageAmount Amount
25 Tehachapi CWIP Amount: -$ -$ Line 126 ROE Adder %: - % - % 15-IncentiveAdder, Line 527 ROE Adder $: -$ -$ Formula on Line 32
2) Devers to Colorado River
EOY AverageAmount Amount
28 DCR CWIP Amount: -$ -$ Line 229 ROE Adder %: - % - % 15-IncentiveAdder, Line 630 ROE Adder $: -$ -$ Formula on Line 3231
32 ROE Adder $ = (Project CWIP Amount/$1,000,000) * IREF * (ROE Adder % / 1%)
e) Total of Return, Income Taxes, and ROE Incentives contribution to PYTRR and True Up TRR
True UpPYTRR TRR
Amount Amount Source
33 Return: -$ -$ Line 1534 Income Taxes: -$ -$ Line 1935 ROE Adder Tehachapi: -$ -$ Line 2736 ROE Adder DCR: -$ -$ Line 3037 FF&U: -$ -$ Note 1
38 Total: -$ -$ Sum Lines 33 to 37
24-CWIPTRR
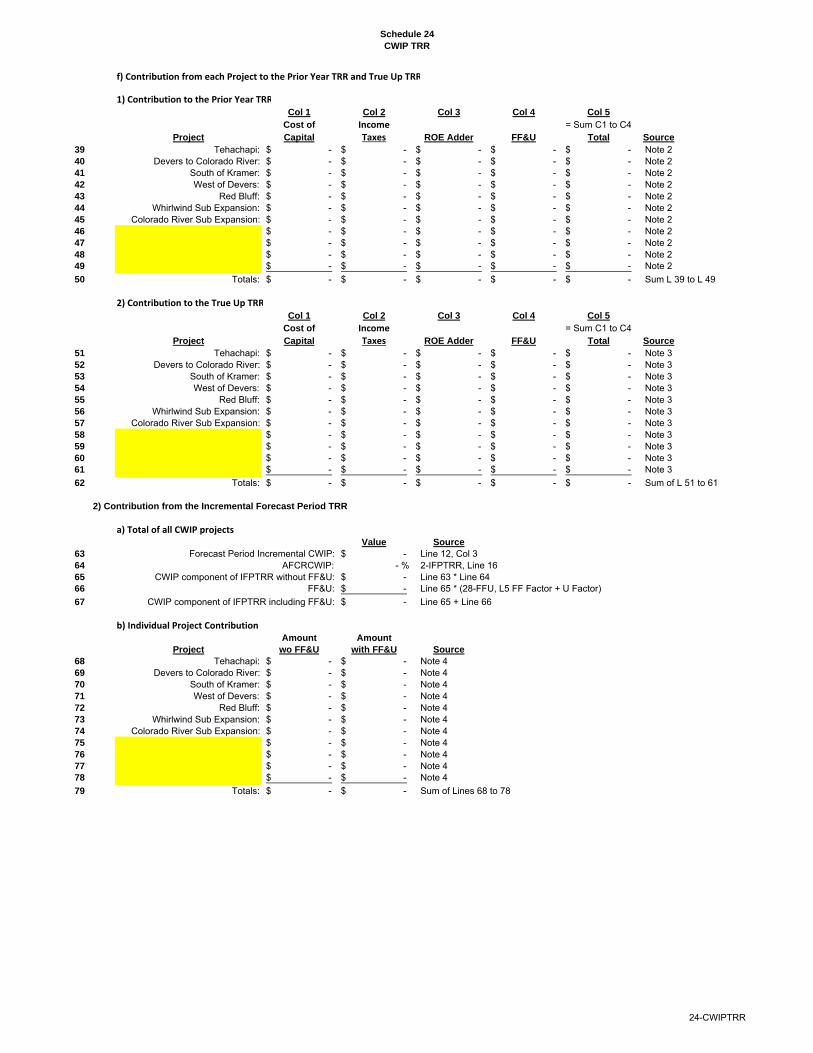
Schedule 24
CWIP TRR
f) Contribution from each Project to the Prior Year TRR and True Up TRR
1) Contribution to the Prior Year TRRCol 1 Col 2 Col 3 Col 4 Col 5
Cost of Income = Sum C1 to C4Project Capital Taxes ROE Adder FF&U Total Source
39 Tehachapi: -$ -$ -$ -$ -$ Note 240 Devers to Colorado River: -$ -$ -$ -$ -$ Note 241 South of Kramer: -$ -$ -$ -$ -$ Note 242 West of Devers: -$ -$ -$ -$ -$ Note 243 Red Bluff: -$ -$ -$ -$ -$ Note 244 Whirlwind Sub Expansion: -$ -$ -$ -$ -$ Note 245 Colorado River Sub Expansion: -$ -$ -$ -$ -$ Note 246 -$ -$ -$ -$ -$ Note 247 -$ -$ -$ -$ -$ Note 248 -$ -$ -$ -$ -$ Note 249 -$ -$ -$ -$ -$ Note 2
50 Totals: -$ -$ -$ -$ -$ Sum L 39 to L 49
2) Contribution to the True Up TRRCol 1 Col 2 Col 3 Col 4 Col 5
Cost of Income = Sum C1 to C4Project Capital Taxes ROE Adder FF&U Total Source
51 Tehachapi: -$ -$ -$ -$ -$ Note 352 Devers to Colorado River: -$ -$ -$ -$ -$ Note 353 South of Kramer: -$ -$ -$ -$ -$ Note 354 West of Devers: -$ -$ -$ -$ -$ Note 355 Red Bluff: -$ -$ -$ -$ -$ Note 356 Whirlwind Sub Expansion: -$ -$ -$ -$ -$ Note 357 Colorado River Sub Expansion: -$ -$ -$ -$ -$ Note 358 -$ -$ -$ -$ -$ Note 359 -$ -$ -$ -$ -$ Note 360 -$ -$ -$ -$ -$ Note 361 -$ -$ -$ -$ -$ Note 3
62 Totals: -$ -$ -$ -$ -$ Sum of L 51 to 61
2) Contribution from the Incremental Forecast Period TRR
a) Total of all CWIP projectsValue Source
63 Forecast Period Incremental CWIP: -$ Line 12, Col 364 AFCRCWIP: - % 2-IFPTRR, Line 1665 CWIP component of IFPTRR without FF&U: -$ Line 63 * Line 6466 FF&U: -$ Line 65 * (28-FFU, L5 FF Factor + U Factor)
67 CWIP component of IFPTRR including FF&U: -$ Line 65 + Line 66
b) Individual Project ContributionAmount Amount
Project wo FF&U with FF&U Source
68 Tehachapi: -$ -$ Note 469 Devers to Colorado River: -$ -$ Note 470 South of Kramer: -$ -$ Note 471 West of Devers: -$ -$ Note 472 Red Bluff: -$ -$ Note 473 Whirlwind Sub Expansion: -$ -$ Note 474 Colorado River Sub Expansion: -$ -$ Note 475 -$ -$ Note 476 -$ -$ Note 477 -$ -$ Note 478 -$ -$ Note 4
79 Totals: -$ -$ Sum of Lines 68 to 78
24-CWIPTRR
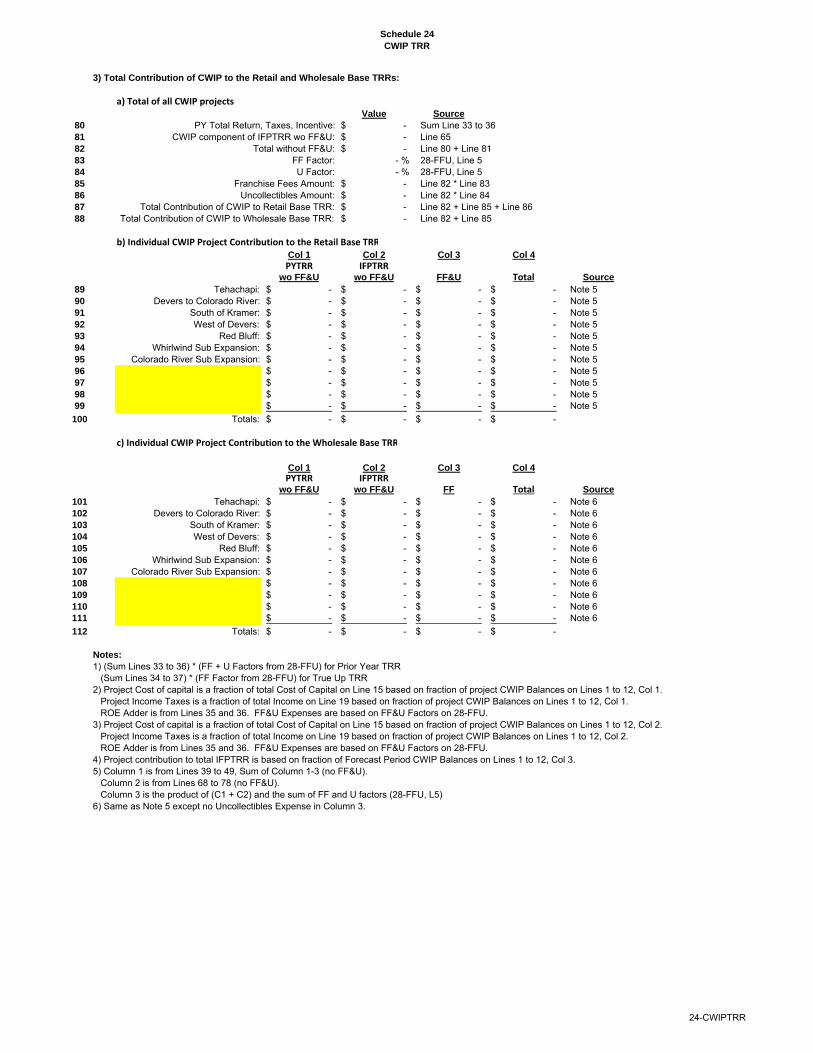
Schedule 24
CWIP TRR
3) Total Contribution of CWIP to the Retail and Wholesale Base TRRs:
a) Total of all CWIP projectsValue Source
80 PY Total Return, Taxes, Incentive: -$ Sum Line 33 to 3681 CWIP component of IFPTRR wo FF&U: -$ Line 6582 Total without FF&U: -$ Line 80 + Line 8183 FF Factor: - % 28-FFU, Line 584 U Factor: - % 28-FFU, Line 585 Franchise Fees Amount: -$ Line 82 * Line 8386 Uncollectibles Amount: -$ Line 82 * Line 8487 Total Contribution of CWIP to Retail Base TRR: -$ Line 82 + Line 85 + Line 8688 Total Contribution of CWIP to Wholesale Base TRR: -$ Line 82 + Line 85
b) Individual CWIP Project Contribution to the Retail Base TRRCol 1 Col 2 Col 3 Col 4
PYTRR IFPTRRwo FF&U wo FF&U FF&U Total Source
89 Tehachapi: -$ -$ -$ -$ Note 590 Devers to Colorado River: -$ -$ -$ -$ Note 591 South of Kramer: -$ -$ -$ -$ Note 592 West of Devers: -$ -$ -$ -$ Note 593 Red Bluff: -$ -$ -$ -$ Note 594 Whirlwind Sub Expansion: -$ -$ -$ -$ Note 595 Colorado River Sub Expansion: -$ -$ -$ -$ Note 596 -$ -$ -$ -$ Note 597 -$ -$ -$ -$ Note 598 -$ -$ -$ -$ Note 599 -$ -$ -$ -$ Note 5
100 Totals: -$ -$ -$ -$
c) Individual CWIP Project Contribution to the Wholesale Base TRR
Col 1 Col 2 Col 3 Col 4PYTRR IFPTRR
wo FF&U wo FF&U FF Total Source
101 Tehachapi: -$ -$ -$ -$ Note 6102 Devers to Colorado River: -$ -$ -$ -$ Note 6103 South of Kramer: -$ -$ -$ -$ Note 6104 West of Devers: -$ -$ -$ -$ Note 6105 Red Bluff: -$ -$ -$ -$ Note 6106 Whirlwind Sub Expansion: -$ -$ -$ -$ Note 6107 Colorado River Sub Expansion: -$ -$ -$ -$ Note 6108 -$ -$ -$ -$ Note 6109 -$ -$ -$ -$ Note 6110 -$ -$ -$ -$ Note 6111 -$ -$ -$ -$ Note 6
112 Totals: -$ -$ -$ -$
Notes:
1) (Sum Lines 33 to 36) * (FF + U Factors from 28-FFU) for Prior Year TRR(Sum Lines 34 to 37) * (FF Factor from 28-FFU) for True Up TRR
2) Project Cost of capital is a fraction of total Cost of Capital on Line 15 based on fraction of project CWIP Balances on Lines 1 to 12, Col 1.Project Income Taxes is a fraction of total Income on Line 19 based on fraction of project CWIP Balances on Lines 1 to 12, Col 1.ROE Adder is from Lines 35 and 36. FF&U Expenses are based on FF&U Factors on 28-FFU.
3) Project Cost of capital is a fraction of total Cost of Capital on Line 15 based on fraction of project CWIP Balances on Lines 1 to 12, Col 2.Project Income Taxes is a fraction of total Income on Line 19 based on fraction of project CWIP Balances on Lines 1 to 12, Col 2.ROE Adder is from Lines 35 and 36. FF&U Expenses are based on FF&U Factors on 28-FFU.
4) Project contribution to total IFPTRR is based on fraction of Forecast Period CWIP Balances on Lines 1 to 12, Col 3.5) Column 1 is from Lines 39 to 49, Sum of Column 1-3 (no FF&U).
Column 2 is from Lines 68 to 78 (no FF&U).Column 3 is the product of (C1 + C2) and the sum of FF and U factors (28-FFU, L5)
6) Same as Note 5 except no Uncollectibles Expense in Column 3.
24-CWIPTRR
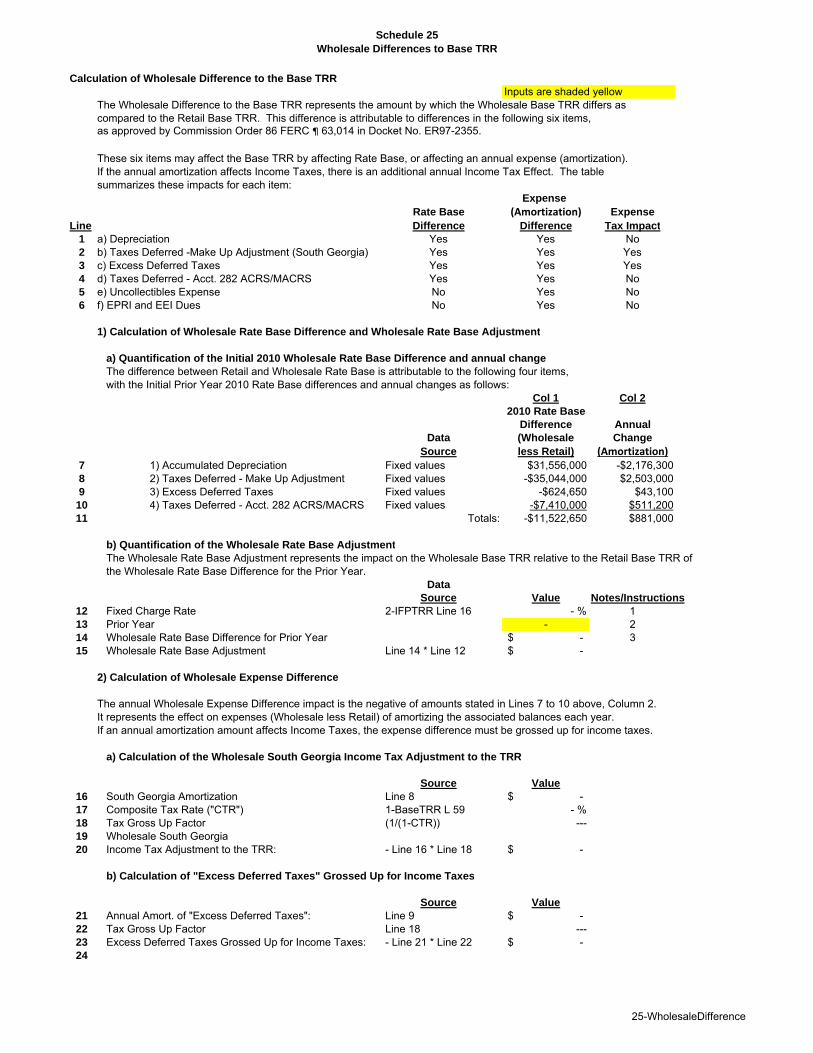
Schedule 25
Wholesale Differences to Base TRR
Calculation of Wholesale Difference to the Base TRR
Inputs are shaded yellowThe Wholesale Difference to the Base TRR represents the amount by which the Wholesale Base TRR differs as compared to the Retail Base TRR. This difference is attributable to differences in the following six items,as approved by Commission Order 86 FERC ¶ 63,014 in Docket No. ER97-2355.
These six items may affect the Base TRR by affecting Rate Base, or affecting an annual expense (amortization).If the annual amortization affects Income Taxes, there is an additional annual Income Tax Effect. The tablesummarizes these impacts for each item:
Expense
Rate Base (Amortization) Expense
Line Difference Difference Tax Impact
1 a) Depreciation Yes Yes No2 b) Taxes Deferred -Make Up Adjustment (South Georgia) Yes Yes Yes3 c) Excess Deferred Taxes Yes Yes Yes4 d) Taxes Deferred - Acct. 282 ACRS/MACRS Yes Yes No5 e) Uncollectibles Expense No Yes No6 f) EPRI and EEI Dues No Yes No
1) Calculation of Wholesale Rate Base Difference and Wholesale Rate Base Adjustment
a) Quantification of the Initial 2010 Wholesale Rate Base Difference and annual change
The difference between Retail and Wholesale Rate Base is attributable to the following four items,with the Initial Prior Year 2010 Rate Base differences and annual changes as follows:
Col 1 Col 2
2010 Rate Base
Difference Annual
Data (Wholesale Change
Source less Retail) (Amortization)7 1) Accumulated Depreciation Fixed values $31,556,000 -$2,176,3008 2) Taxes Deferred - Make Up Adjustment Fixed values -$35,044,000 $2,503,0009 3) Excess Deferred Taxes Fixed values -$624,650 $43,100
10 4) Taxes Deferred - Acct. 282 ACRS/MACRS Fixed values -$7,410,000 $511,20011 Totals: -$11,522,650 $881,000
b) Quantification of the Wholesale Rate Base Adjustment
The Wholesale Rate Base Adjustment represents the impact on the Wholesale Base TRR relative to the Retail Base TRR ofthe Wholesale Rate Base Difference for the Prior Year.
Data
Source Value Notes/Instructions
12 Fixed Charge Rate 2-IFPTRR Line 16 - % 113 Prior Year - 214 Wholesale Rate Base Difference for Prior Year -$ 315 Wholesale Rate Base Adjustment Line 14 * Line 12 -$
2) Calculation of Wholesale Expense Difference
The annual Wholesale Expense Difference impact is the negative of amounts stated in Lines 7 to 10 above, Column 2.It represents the effect on expenses (Wholesale less Retail) of amortizing the associated balances each year.If an annual amortization amount affects Income Taxes, the expense difference must be grossed up for income taxes.
a) Calculation of the Wholesale South Georgia Income Tax Adjustment to the TRR
Source Value
16 South Georgia Amortization Line 8 -$ 17 Composite Tax Rate ("CTR") 1-BaseTRR L 59 - %18 Tax Gross Up Factor (1/(1-CTR)) ---19 Wholesale South Georgia20 Income Tax Adjustment to the TRR: - Line 16 * Line 18 -$
b) Calculation of "Excess Deferred Taxes" Grossed Up for Income Taxes
Source Value
21 Annual Amort. of "Excess Deferred Taxes": Line 9 -$ 22 Tax Gross Up Factor Line 18 ---23 Excess Deferred Taxes Grossed Up for Income Taxes: - Line 21 * Line 22 -$ 24
25-WholesaleDifference
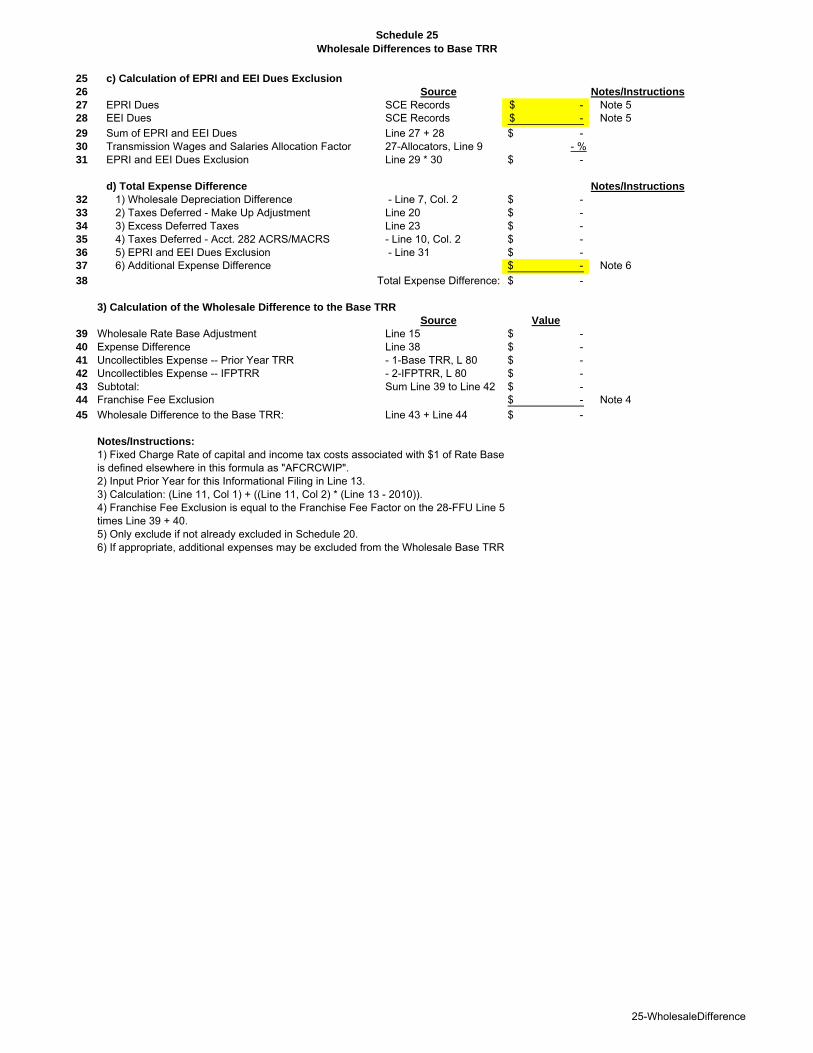
Schedule 25
Wholesale Differences to Base TRR
25 c) Calculation of EPRI and EEI Dues Exclusion
26 Source Notes/Instructions
27 EPRI Dues SCE Records -$ Note 528 EEI Dues SCE Records -$ Note 5
29 Sum of EPRI and EEI Dues Line 27 + 28 -$ 30 Transmission Wages and Salaries Allocation Factor 27-Allocators, Line 9 - %31 EPRI and EEI Dues Exclusion Line 29 * 30 -$
d) Total Expense Difference Notes/Instructions
32 1) Wholesale Depreciation Difference - Line 7, Col. 2 -$ 33 2) Taxes Deferred - Make Up Adjustment Line 20 -$ 34 3) Excess Deferred Taxes Line 23 -$ 35 4) Taxes Deferred - Acct. 282 ACRS/MACRS - Line 10, Col. 2 -$ 36 5) EPRI and EEI Dues Exclusion - Line 31 -$ 37 6) Additional Expense Difference -$ Note 6
38 Total Expense Difference: -$
3) Calculation of the Wholesale Difference to the Base TRR
Source Value
39 Wholesale Rate Base Adjustment Line 15 -$ 40 Expense Difference Line 38 -$ 41 Uncollectibles Expense -- Prior Year TRR - 1-Base TRR, L 80 -$ 42 Uncollectibles Expense -- IFPTRR - 2-IFPTRR, L 80 -$ 43 Subtotal: Sum Line 39 to Line 42 -$ 44 Franchise Fee Exclusion -$ Note 4
45 Wholesale Difference to the Base TRR: Line 43 + Line 44 -$
Notes/Instructions:
1) Fixed Charge Rate of capital and income tax costs associated with $1 of Rate Baseis defined elsewhere in this formula as "AFCRCWIP".2) Input Prior Year for this Informational Filing in Line 13.3) Calculation: (Line 11, Col 1) + ((Line 11, Col 2) * (Line 13 - 2010)).4) Franchise Fee Exclusion is equal to the Franchise Fee Factor on the 28-FFU Line 5times Line 39 + 40.5) Only exclude if not already excluded in Schedule 20.6) If appropriate, additional expenses may be excluded from the Wholesale Base TRR
25-WholesaleDifference
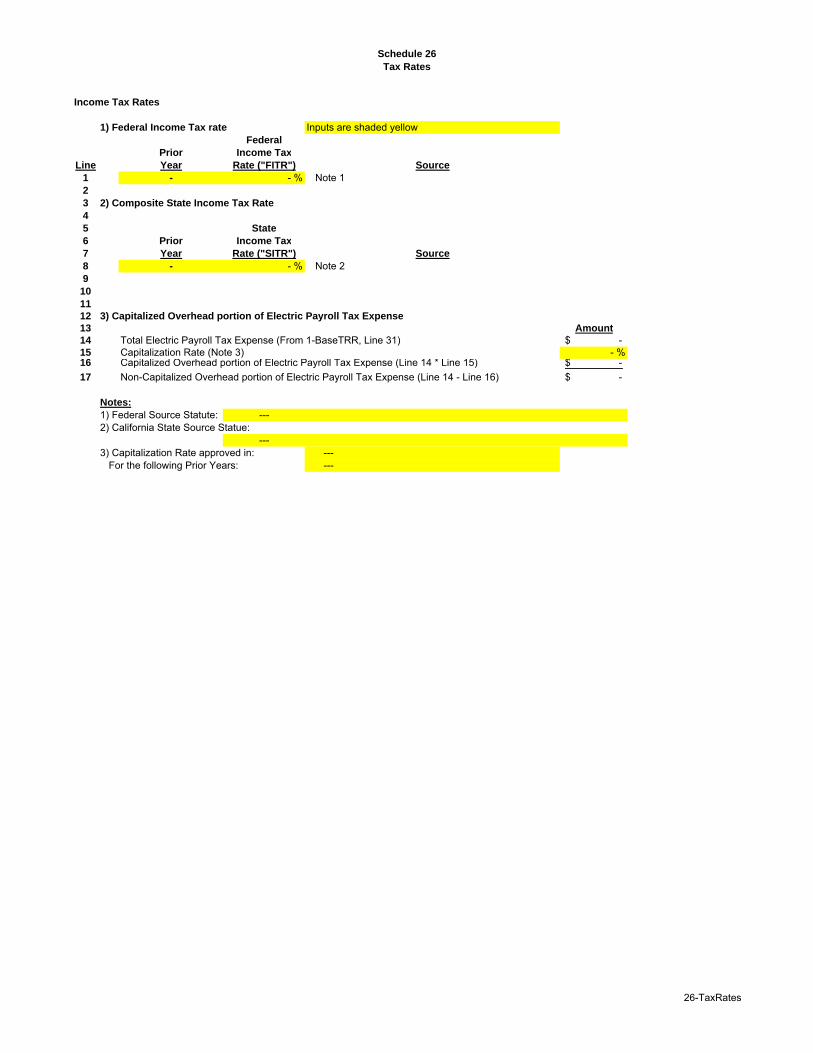
Schedule 26
Tax Rates
Income Tax Rates
1) Federal Income Tax rate Inputs are shaded yellowFederal
Prior Income Tax
Line Year Rate ("FITR") Source
1 - - % Note 12
3 2) Composite State Income Tax Rate
4
5 State
6 Prior Income Tax
7 Year Rate ("SITR") Source
8 - - % Note 29
10
11
12 3) Capitalized Overhead portion of Electric Payroll Tax Expense
13 Amount
14 Total Electric Payroll Tax Expense (From 1-BaseTRR, Line 31) -$ 15 Capitalization Rate (Note 3) - %16 Capitalized Overhead portion of Electric Payroll Tax Expense (Line 14 * Line 15) -$
17 Non-Capitalized Overhead portion of Electric Payroll Tax Expense (Line 14 - Line 16) -$
Notes:
1) Federal Source Statute: ---2) California State Source Statue:
---3) Capitalization Rate approved in: ---
For the following Prior Years: ---
26-TaxRates
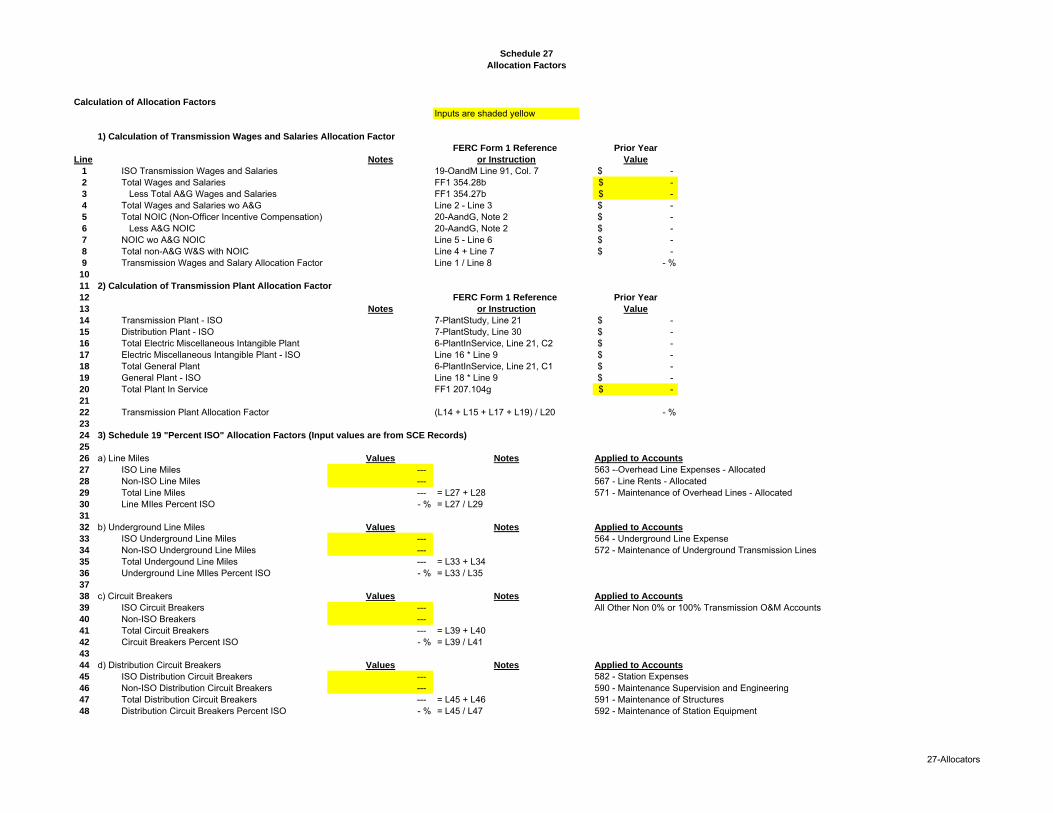
Schedule 27
Allocation Factors
Calculation of Allocation Factors
Inputs are shaded yellow
1) Calculation of Transmission Wages and Salaries Allocation Factor
FERC Form 1 Reference Prior Year
Line Notes or Instruction Value
1 ISO Transmission Wages and Salaries 19-OandM Line 91, Col. 7 -$ 2 Total Wages and Salaries FF1 354.28b -$ 3 Less Total A&G Wages and Salaries FF1 354.27b -$ 4 Total Wages and Salaries wo A&G Line 2 - Line 3 -$ 5 Total NOIC (Non-Officer Incentive Compensation) 20-AandG, Note 2 -$ 6 Less A&G NOIC 20-AandG, Note 2 -$ 7 NOIC wo A&G NOIC Line 5 - Line 6 -$ 8 Total non-A&G W&S with NOIC Line 4 + Line 7 -$ 9 Transmission Wages and Salary Allocation Factor Line 1 / Line 8 - %
10
11 2) Calculation of Transmission Plant Allocation Factor
12 FERC Form 1 Reference Prior Year
13 Notes or Instruction Value
14 Transmission Plant - ISO 7-PlantStudy, Line 21 -$ 15 Distribution Plant - ISO 7-PlantStudy, Line 30 -$ 16 Total Electric Miscellaneous Intangible Plant 6-PlantInService, Line 21, C2 -$ 17 Electric Miscellaneous Intangible Plant - ISO Line 16 * Line 9 -$ 18 Total General Plant 6-PlantInService, Line 21, C1 -$ 19 General Plant - ISO Line 18 * Line 9 -$ 20 Total Plant In Service FF1 207.104g -$ 21
22 Transmission Plant Allocation Factor (L14 + L15 + L17 + L19) / L20 - %23
24 3) Schedule 19 "Percent ISO" Allocation Factors (Input values are from SCE Records)
25
26 a) Line Miles Values Notes Applied to Accounts
27 ISO Line Miles --- 563 - Overhead Line Expenses - Allocated28 Non-ISO Line Miles --- 567 - Line Rents - Allocated29 Total Line Miles --- = L27 + L28 571 - Maintenance of Overhead Lines - Allocated30 Line MIles Percent ISO - % = L27 / L2931
32 b) Underground Line Miles Values Notes Applied to Accounts
33 ISO Underground Line Miles --- 564 - Underground Line Expense34 Non-ISO Underground Line Miles --- 572 - Maintenance of Underground Transmission Lines35 Total Undergound Line Miles --- = L33 + L3436 Underground Line MIles Percent ISO - % = L33 / L3537
38 c) Circuit Breakers Values Notes Applied to Accounts
39 ISO Circuit Breakers --- All Other Non 0% or 100% Transmission O&M Accounts40 Non-ISO Breakers --- 41 Total Circuit Breakers --- = L39 + L4042 Circuit Breakers Percent ISO - % = L39 / L4143
44 d) Distribution Circuit Breakers Values Notes Applied to Accounts
45 ISO Distribution Circuit Breakers --- 582 - Station Expenses 46 Non-ISO Distribution Circuit Breakers --- 590 - Maintenance Supervision and Engineering47 Total Distribution Circuit Breakers --- = L45 + L46 591 - Maintenance of Structures48 Distribution Circuit Breakers Percent ISO - % = L45 / L47 592 - Maintenance of Station Equipment
27-Allocators

Schedule 28
FF and U
Franchise Fees and Uncollectibles Expense Factors
1) Approved Franchise Fee Factor(s) Inputs are shaded yellow
Days in
Line From To Prior Year FF Factor Reference
1 --- --- --- - % ---2 --- --- --- - % ---
2) Approved Uncollectibles Expense Factor(s)
Days in
From To Prior Year U Factor Reference
3 --- --- --- - % ---4 --- --- --- - % ---
3) FF and U Factors
Prior
Year FF Factor U Factor Notes
5 --- - % - % Calculated according to Instruction 3
Notes:
1) Franchise Fees represent payments that SCE makes to municipal entities for the right to locate facilities within the municipality.
Instructions:
1) Enter Franchise Fee and Uncollectibles Factors as approved by the California Public Utilities Commission ("CPUC")in modules 1 and 2 above pursuant to Instruction 2. If approved factors changed during Prior Year, enter both,and note period of time for which each applies in "From" and "To" columns, and number of days each was in effectduring the Prior Year in "Days in Prior Year" Column.2) Franchise Fees Factor is calculated from CPUC Decision by dividing adopted Franchise Feesby Total Operating Revenues less Franchise Fees. Uncollectibles Factor is calculated by dividing adopted Uncollectibles expense by Total Operating revenues less Uncollectibles Expense. Resulting FF & UFactors represent factors that, when applied to TRR without FF and U will correctly determine FF and U expense.3) Calculate in module 3 the weighted average FF and U factors from the factors in modules 1 and 2 basedon the number of days each FF and U factor was in effect during the Prior Year at issue.
Percent Calculation
Prior Year FF Factor: - % ((L1 FF Factor * L1 Days) + (L2 FF Factor * L2 Days))/(L1+L2 Days)Prior Year U Factor: - % ((L3 U Factor * L3 Days) + (L4 U Factor * L4 Days))/(L3+L4 Days)
28-FFU
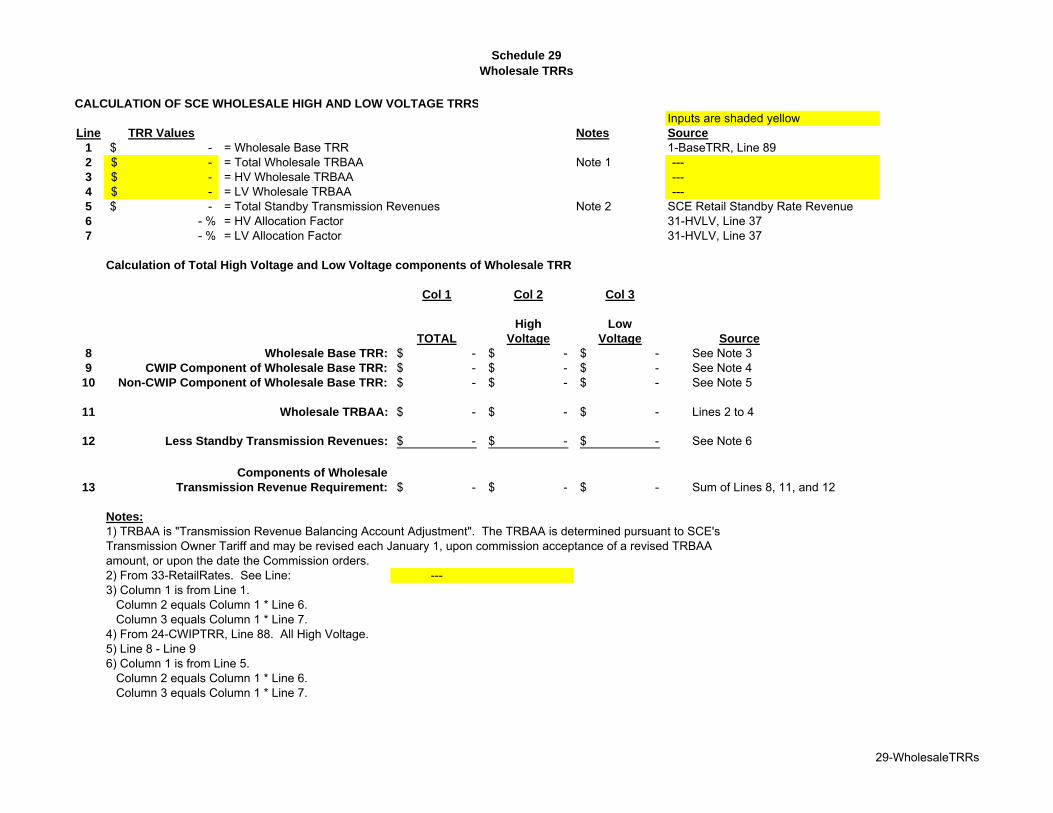
Schedule 29
Wholesale TRRs
CALCULATION OF SCE WHOLESALE HIGH AND LOW VOLTAGE TRRS
Inputs are shaded yellowLine TRR Values Notes Source
1 -$ = Wholesale Base TRR 1-BaseTRR, Line 892 -$ = Total Wholesale TRBAA Note 1 ---3 -$ = HV Wholesale TRBAA ---4 -$ = LV Wholesale TRBAA ---5 -$ = Total Standby Transmission Revenues Note 2 SCE Retail Standby Rate Revenue6 - % = HV Allocation Factor 31-HVLV, Line 377 - % = LV Allocation Factor 31-HVLV, Line 37
Calculation of Total High Voltage and Low Voltage components of Wholesale TRR
Col 1 Col 2 Col 3
High Low
TOTAL Voltage Voltage Source
8 Wholesale Base TRR: -$ -$ -$ See Note 39 CWIP Component of Wholesale Base TRR: -$ -$ -$ See Note 4
10 Non-CWIP Component of Wholesale Base TRR: -$ -$ -$ See Note 5
11 Wholesale TRBAA: -$ -$ -$ Lines 2 to 4
12 Less Standby Transmission Revenues: -$ -$ -$ See Note 6
Components of Wholesale
13 Transmission Revenue Requirement: -$ -$ -$ Sum of Lines 8, 11, and 12
Notes:
1) TRBAA is "Transmission Revenue Balancing Account Adjustment". The TRBAA is determined pursuant to SCE's Transmission Owner Tariff and may be revised each January 1, upon commission acceptance of a revised TRBAAamount, or upon the date the Commission orders.2) From 33-RetailRates. See Line: ---3) Column 1 is from Line 1.
Column 2 equals Column 1 * Line 6.Column 3 equals Column 1 * Line 7.
4) From 24-CWIPTRR, Line 88. All High Voltage.5) Line 8 - Line 96) Column 1 is from Line 5.
Column 2 equals Column 1 * Line 6.Column 3 equals Column 1 * Line 7.
29-WholesaleTRRs
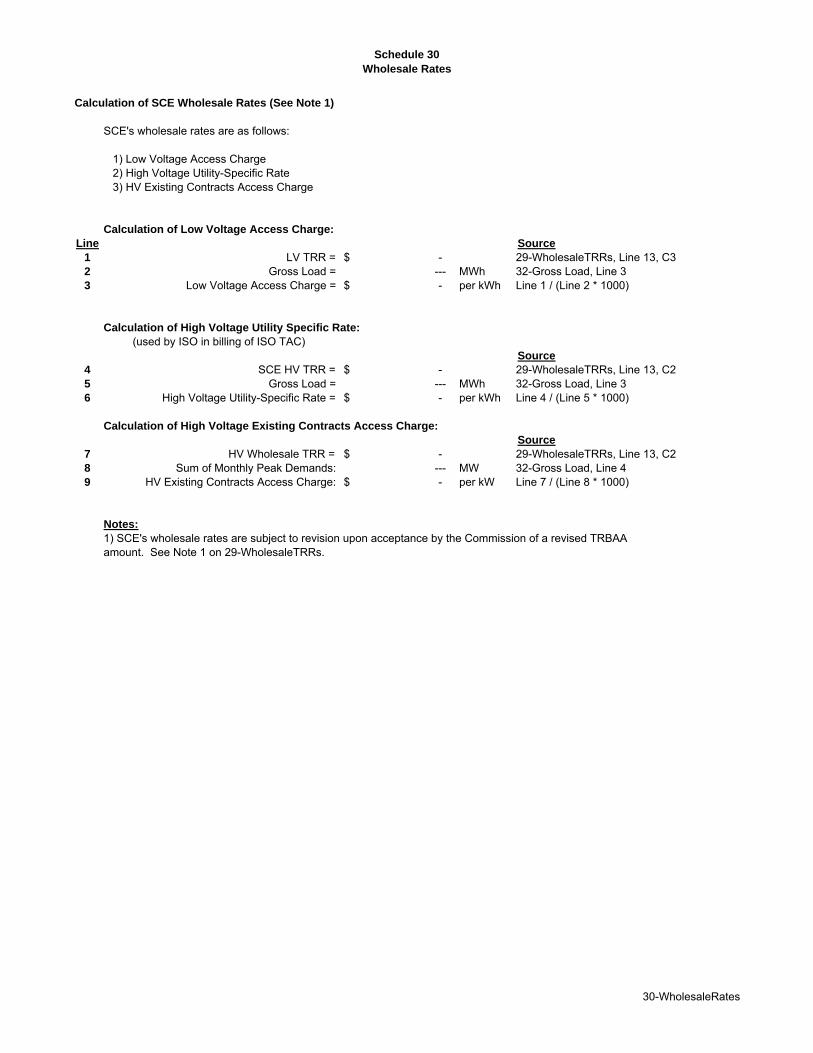
Schedule 30
Wholesale Rates
Calculation of SCE Wholesale Rates (See Note 1)
SCE's wholesale rates are as follows:
1) Low Voltage Access Charge2) High Voltage Utility-Specific Rate3) HV Existing Contracts Access Charge
Calculation of Low Voltage Access Charge:
Line Source
1 LV TRR = -$ 29-WholesaleTRRs, Line 13, C32 Gross Load = --- MWh 32-Gross Load, Line 33 Low Voltage Access Charge = -$ per kWh Line 1 / (Line 2 * 1000)
Calculation of High Voltage Utility Specific Rate:
(used by ISO in billing of ISO TAC)Source
4 SCE HV TRR = -$ 29-WholesaleTRRs, Line 13, C25 Gross Load = --- MWh 32-Gross Load, Line 36 High Voltage Utility-Specific Rate = -$ per kWh Line 4 / (Line 5 * 1000)
Calculation of High Voltage Existing Contracts Access Charge:
Source
7 HV Wholesale TRR = -$ 29-WholesaleTRRs, Line 13, C28 Sum of Monthly Peak Demands: --- MW 32-Gross Load, Line 49 HV Existing Contracts Access Charge: -$ per kW Line 7 / (Line 8 * 1000)
Notes:
1) SCE's wholesale rates are subject to revision upon acceptance by the Commission of a revised TRBAAamount. See Note 1 on 29-WholesaleTRRs.
30-WholesaleRates
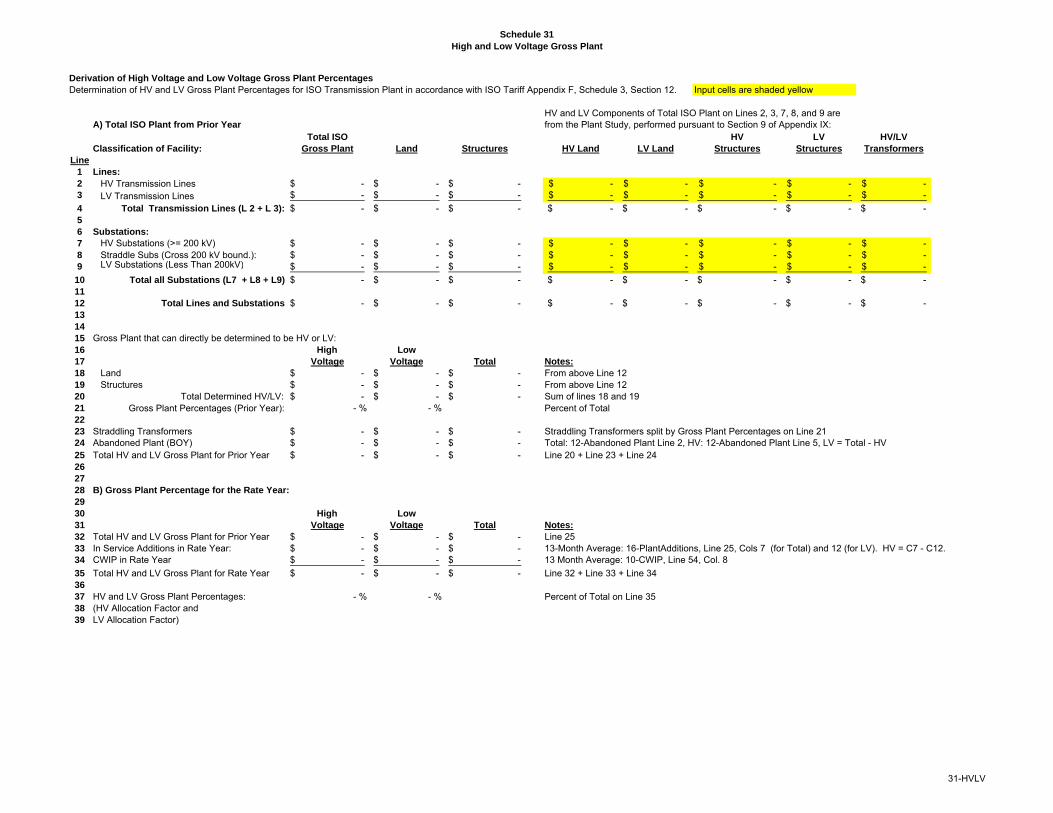
Schedule 31
High and Low Voltage Gross Plant
Derivation of High Voltage and Low Voltage Gross Plant Percentages
Determination of HV and LV Gross Plant Percentages for ISO Transmission Plant in accordance with ISO Tariff Appendix F, Schedule 3, Section 12. Input cells are shaded yellow
HV and LV Components of Total ISO Plant on Lines 2, 3, 7, 8, and 9 areA) Total ISO Plant from Prior Year from the Plant Study, performed pursuant to Section 9 of Appendix IX:
Total ISO HV LV HV/LV
Classification of Facility: Gross Plant Land Structures HV Land LV Land Structures Structures Transformers
Line
1 Lines:
2 HV Transmission Lines -$ -$ -$ -$ -$ -$ -$ -$ 3 LV Transmission Lines -$ -$ -$ -$ -$ -$ -$ -$
4 Total Transmission Lines (L 2 + L 3): -$ -$ -$ -$ -$ -$ -$ -$ 5
6 Substations:
7 HV Substations (>= 200 kV) -$ -$ -$ -$ -$ -$ -$ -$ 8 Straddle Subs (Cross 200 kV bound.): -$ -$ -$ -$ -$ -$ -$ -$ 9 LV Substations (Less Than 200kV) -$ -$ -$ -$ -$ -$ -$ -$
10 Total all Substations (L7 + L8 + L9) -$ -$ -$ -$ -$ -$ -$ -$ 11
12 Total Lines and Substations -$ -$ -$ -$ -$ -$ -$ -$ 13
14
15 Gross Plant that can directly be determined to be HV or LV:16 High Low
17 Voltage Voltage Total Notes:
18 Land -$ -$ -$ From above Line 1219 Structures -$ -$ -$ From above Line 1220 Total Determined HV/LV: -$ -$ -$ Sum of lines 18 and 1921 Gross Plant Percentages (Prior Year): - % - % Percent of Total22
23 Straddling Transformers -$ -$ -$ Straddling Transformers split by Gross Plant Percentages on Line 2124 Abandoned Plant (BOY) -$ -$ -$ Total: 12-Abandoned Plant Line 2, HV: 12-Abandoned Plant Line 5, LV = Total - HV25 Total HV and LV Gross Plant for Prior Year -$ -$ -$ Line 20 + Line 23 + Line 2426
27
28 B) Gross Plant Percentage for the Rate Year:
29
30 High Low
31 Voltage Voltage Total Notes:
32 Total HV and LV Gross Plant for Prior Year -$ -$ -$ Line 2533 In Service Additions in Rate Year: -$ -$ -$ 13-Month Average: 16-PlantAdditions, Line 25, Cols 7 (for Total) and 12 (for LV). HV = C7 - C12.34 CWIP in Rate Year -$ -$ -$ 13 Month Average: 10-CWIP, Line 54, Col. 8
35 Total HV and LV Gross Plant for Rate Year -$ -$ -$ Line 32 + Line 33 + Line 3436
37 HV and LV Gross Plant Percentages: - % - % Percent of Total on Line 3538 (HV Allocation Factor and 39 LV Allocation Factor)
31-HVLV

Schedule 32
Gross Load
Calculation of Forecast Gross Load
Line MWh Calculation Source
1 SCE Retail Sales at ISO Grid level: --- Note 12 Pump Load forecast: --- Note 23 Forecast Gross Load: --- Line 1 + Line 2 Sum of above
4 Forecast 12-CP Retail Load: --- Note 1
Notes:
1) Latest SCE approved sales forecast as of April 15 of each year.2) SCE pump load forecast as of April 15 of each year.3) The load forecast used in Schedule 32 shall be for the calendar year in which the rates are to be in effect.
32-GrossLoad
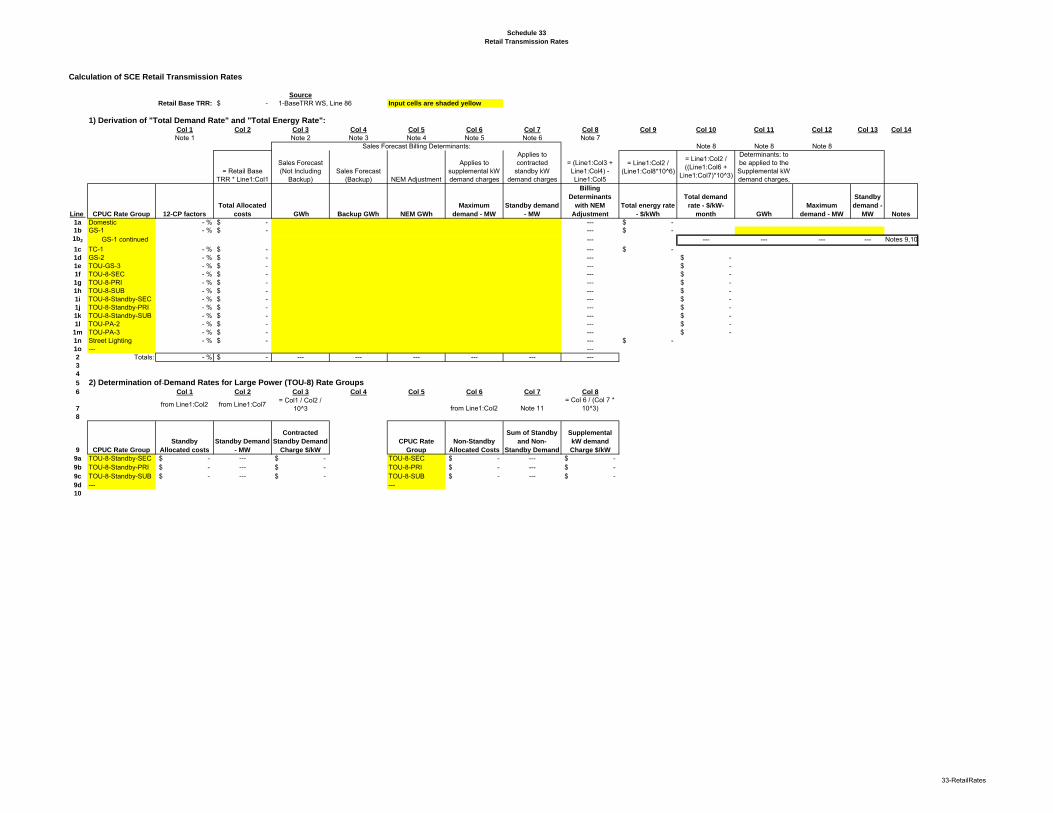
Schedule 33
Retail Transmission Rates
Calculation of SCE Retail Transmission Rates
Source
Retail Base TRR: -$ 1-BaseTRR WS, Line 86 Input cells are shaded yellow
1) Derivation of "Total Demand Rate" and "Total Energy Rate":Col 1 Col 2 Col 3 Col 4 Col 5 Col 6 Col 7 Col 8 Col 9 Col 10 Col 11 Col 12 Col 13 Col 14
Note 1 Note 2 Note 3 Note 4 Note 5 Note 6 Note 7Note 8 Note 8 Note 8
= Retail Base TRR * Line1:Col1
Sales Forecast (Not Including
Backup)Sales Forecast
(Backup) NEM Adjustment
Applies to supplemental kW demand charges
Applies to contracted
standby kW demand charges
= (Line1:Col3 + Line1:Col4) - Line1:Col5
= Line1:Col2 / (Line1:Col8*10^6)
= Line1:Col2 / ((Line1:Col6 +
Line1:Col7)*10^3)
Determinants: to be applied to the Supplemental kW demand charges,
Line CPUC Rate Group 12-CP factors
Total Allocated
costs GWh Backup GWh NEM GWh
Maximum
demand - MW
Standby demand
- MW
Billing
Determinants
with NEM
Adjustment
Total energy rate
- $/kWh
Total demand
rate - $/kW-
month GWh
Maximum
demand - MW
Standby
demand -
MW Notes
1a Domestic - % -$ --- -$ 1b GS-1 - % -$ --- -$ 1b2 GS-1 continued --- --- --- --- --- Notes 9,10
1c TC-1 - % -$ --- -$ 1d GS-2 - % -$ --- -$ 1e TOU-GS-3 - % -$ --- -$ 1f TOU-8-SEC - % -$ --- -$ 1g TOU-8-PRI - % -$ --- -$ 1h TOU-8-SUB - % -$ --- -$ 1i TOU-8-Standby-SEC - % -$ --- -$ 1j TOU-8-Standby-PRI - % -$ --- -$ 1k TOU-8-Standby-SUB - % -$ --- -$ 1l TOU-PA-2 - % -$ --- -$
1m TOU-PA-3 - % -$ --- -$ 1n Street Lighting - % -$ --- -$ 1o --- ---2 Totals: - % -$ --- --- --- --- --- ---3
4
5 2) Determination of Demand Rates for Large Power (TOU-8) Rate Groups6 Col 1 Col 2 Col 3 Col 4 Col 5 Col 6 Col 7 Col 8
7from Line1:Col2 from Line1:Col7
= Col1 / Col2 / 10^3 from Line1:Col2 Note 11
= Col 6 / (Col 7 * 10^3)
8
9 CPUC Rate Group
Standby
Allocated costs
Standby Demand
- MW
Contracted
Standby Demand
Charge $/kW
CPUC Rate
Group
Non-Standby
Allocated Costs
Sum of Standby
and Non-
Standby Demand
Supplemental
kW demand
Charge $/kW
9a TOU-8-Standby-SEC -$ ‐‐‐ -$ TOU-8-SEC -$ --- -$ 9b TOU-8-Standby-PRI -$ ‐‐‐ -$ TOU-8-PRI -$ --- -$ 9c TOU-8-Standby-SUB -$ ‐‐‐ -$ TOU-8-SUB -$ --- -$ 9d --- ---10
Sales Forecast Billing Determinants:
33-RetailRates
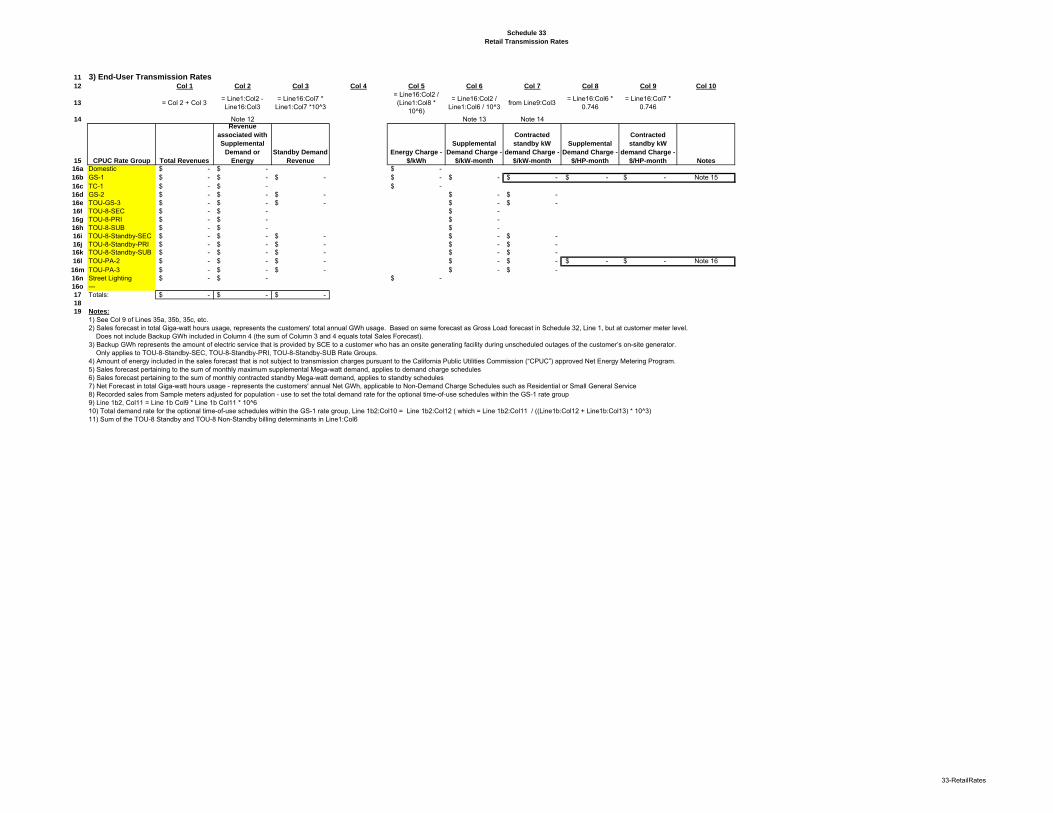
Schedule 33
Retail Transmission Rates
11 3) End-User Transmission Rates12 Col 1 Col 2 Col 3 Col 4 Col 5 Col 6 Col 7 Col 8 Col 9 Col 10
13 = Col 2 + Col 3= Line1:Col2 - Line16:Col3
= Line16:Col7 * Line1:Col7 *10^3
= Line16:Col2 / (Line1:Col8 *
10^6)
= Line16:Col2 / Line1:Col6 / 10^3
from Line9:Col3= Line16:Col6 *
0.746= Line16:Col7 *
0.746
14 Note 12 Note 13 Note 14
15 CPUC Rate Group Total Revenues
Revenue
associated with
Supplemental
Demand or
Energy
Standby Demand
Revenue
Energy Charge -
$/kWh
Supplemental
Demand Charge -
$/kW-month
Contracted
standby kW
demand Charge -
$/kW-month
Supplemental
Demand Charge -
$/HP-month
Contracted
standby kW
demand Charge -
$/HP-month Notes
16a Domestic -$ -$ -$ 16b GS-1 -$ -$ -$ -$ -$ -$ -$ -$ Note 1516c TC-1 -$ -$ -$ 16d GS-2 -$ -$ -$ -$ -$ 16e TOU-GS-3 -$ -$ -$ -$ -$ 16f TOU-8-SEC -$ -$ -$ 16g TOU-8-PRI -$ -$ -$ 16h TOU-8-SUB -$ -$ -$ 16i TOU-8-Standby-SEC -$ -$ -$ -$ -$ 16j TOU-8-Standby-PRI -$ -$ -$ -$ -$ 16k TOU-8-Standby-SUB -$ -$ -$ -$ -$ 16l TOU-PA-2 -$ -$ -$ -$ -$ -$ -$ Note 16
16m TOU-PA-3 -$ -$ -$ -$ -$ 16n Street Lighting -$ -$ -$ 16o ---17 Totals: -$ -$ -$ 18
19 Notes:
1) See Col 9 of Lines 35a, 35b, 35c, etc.2) Sales forecast in total Giga-watt hours usage, represents the customers' total annual GWh usage. Based on same forecast as Gross Load forecast in Schedule 32, Line 1, but at customer meter level. Does not include Backup GWh included in Column 4 (the sum of Column 3 and 4 equals total Sales Forecast).3) Backup GWh represents the amount of electric service that is provided by SCE to a customer who has an onsite generating facility during unscheduled outages of the customer’s on-site generator. Only applies to TOU-8-Standby-SEC, TOU-8-Standby-PRI, TOU-8-Standby-SUB Rate Groups.4) Amount of energy included in the sales forecast that is not subject to transmission charges pursuant to the California Public Utilities Commission (“CPUC”) approved Net Energy Metering Program.5) Sales forecast pertaining to the sum of monthly maximum supplemental Mega-watt demand, applies to demand charge schedules6) Sales forecast pertaining to the sum of monthly contracted standby Mega-watt demand, applies to standby schedules7) Net Forecast in total Giga-watt hours usage - represents the customers' annual Net GWh, applicable to Non-Demand Charge Schedules such as Residential or Small General Service8) Recorded sales from Sample meters adjusted for population - use to set the total demand rate for the optional time-of-use schedules within the GS-1 rate group9) Line 1b2, Col11 = Line 1b Col9 * Line 1b Col11 * 10^610) Total demand rate for the optional time-of-use schedules within the GS-1 rate group, Line 1b2:Col10 = Line 1b2:Col12 ( which = Line 1b2:Col11 / ((Line1b:Col12 + Line1b:Col13) * 10^3)11) Sum of the TOU-8 Standby and TOU-8 Non-Standby billing determinants in Line1:Col6
33-RetailRates
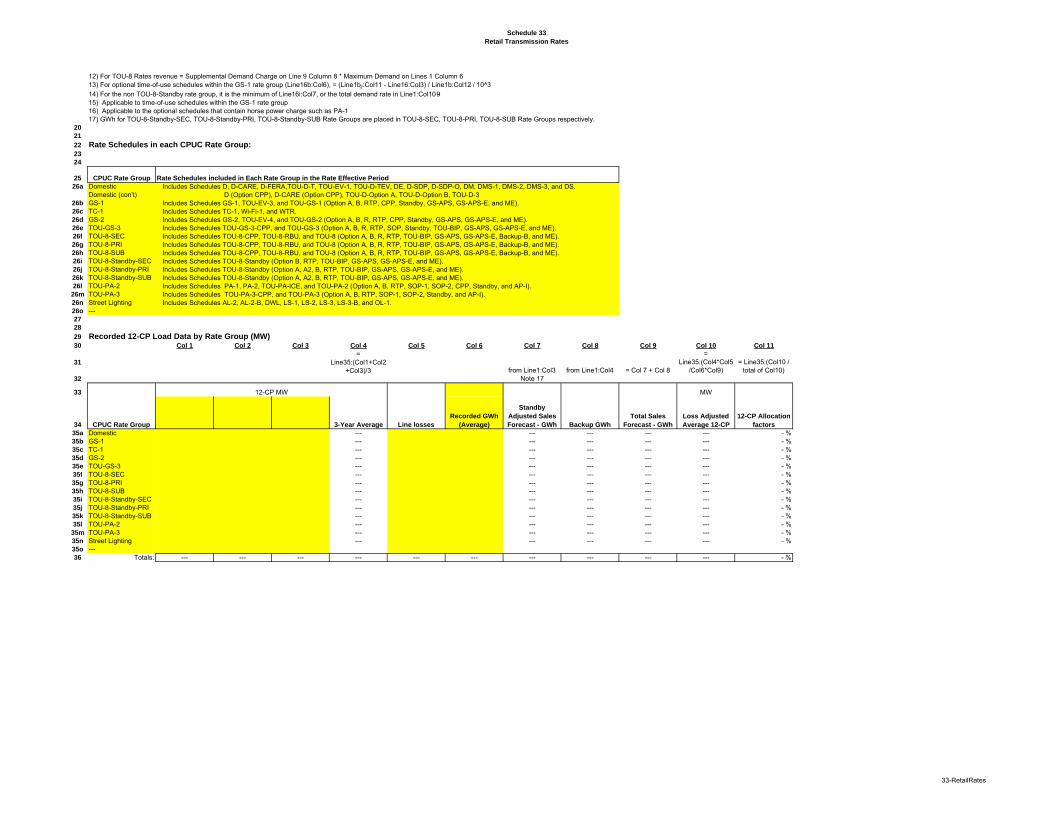
Schedule 33
Retail Transmission Rates
12) For TOU-8 Rates revenue = Supplemental Demand Charge on Line 9 Column 8 * Maximum Demand on Lines 1 Column 613) For optional time-of-use schedules within the GS-1 rate group (Line16b:Col6), = (Line1b2:Col11 - Line16:Col3) / Line1b:Col12 / 10^3
14) For the non TOU-8-Standby rate group, it is the minimum of Line16i:Col7, or the total demand rate in Line1:Col10915) Applicable to time-of-use schedules within the GS-1 rate group16) Applicable to the optional schedules that contain horse power charge such as PA-117) GWh for TOU-8-Standby-SEC, TOU-8-Standby-PRI, TOU-8-Standby-SUB Rate Groups are placed in TOU-8-SEC, TOU-8-PRI, TOU-8-SUB Rate Groups respectively.
20
21
22 Rate Schedules in each CPUC Rate Group:23
24
25 CPUC Rate Group Rate Schedules included in Each Rate Group in the Rate Effective Period
26a Domestic Includes Schedules D, D-CARE, D-FERA,TOU-D-T, TOU-EV-1, TOU-D-TEV, DE, D-SDP, D-SDP-O, DM, DMS-1, DMS-2, DMS-3, and DS.Domestic (con't) D (Option CPP), D-CARE (Option CPP), TOU-D-Option A, TOU-D-Option B, TOU-D-3
26b GS-1 Includes Schedules GS-1, TOU-EV-3, and TOU-GS-1 (Option A, B, RTP, CPP, Standby, GS-APS, GS-APS-E, and ME).26c TC-1 Includes Schedules TC-1, Wi-Fi-1, and WTR.26d GS-2 Includes Schedules GS-2, TOU-EV-4, and TOU-GS-2 (Option A, B, R, RTP, CPP, Standby, GS-APS, GS-APS-E, and ME). 26e TOU-GS-3 Includes Schedules TOU-GS-3-CPP, and TOU-GS-3 (Option A, B, R, RTP, SOP, Standby, TOU-BIP, GS-APS, GS-APS-E, and ME).26f TOU-8-SEC Includes Schedules TOU-8-CPP, TOU-8-RBU, and TOU-8 (Option A, B, R, RTP, TOU-BIP, GS-APS, GS-APS-E, Backup-B, and ME).26g TOU-8-PRI Includes Schedules TOU-8-CPP, TOU-8-RBU, and TOU-8 (Option A, B, R, RTP, TOU-BIP, GS-APS, GS-APS-E, Backup-B, and ME).26h TOU-8-SUB Includes Schedules TOU-8-CPP, TOU-8-RBU, and TOU-8 (Option A, B, R, RTP, TOU-BIP, GS-APS, GS-APS-E, Backup-B, and ME).26i TOU-8-Standby-SEC Includes Schedules TOU-8-Standby (Option B, RTP, TOU-BIP, GS-APS, GS-APS-E, and ME).26j TOU-8-Standby-PRI Includes Schedules TOU-8-Standby (Option A, A2, B, RTP, TOU-BIP, GS-APS, GS-APS-E, and ME).26k TOU-8-Standby-SUB Includes Schedules TOU-8-Standby (Option A, A2, B, RTP, TOU-BIP, GS-APS, GS-APS-E, and ME).26l TOU-PA-2 Includes Schedules PA-1, PA-2, TOU-PA-ICE, and TOU-PA-2 (Option A, B, RTP, SOP-1, SOP-2, CPP, Standby, and AP-I).
26m TOU-PA-3 Includes Schedules TOU-PA-3-CPP, and TOU-PA-3 (Option A, B, RTP, SOP-1, SOP-2, Standby, and AP-I).26n Street Lighting Includes Schedules AL-2, AL-2-B, DWL, LS-1, LS-2, LS-3, LS-3-B, and OL-1.26o ---27
28
29 Recorded 12-CP Load Data by Rate Group (MW)30 Col 1 Col 2 Col 3 Col 4 Col 5 Col 6 Col 7 Col 8 Col 9 Col 10 Col 11
31
= Line35:(Col1+Col2
+Col3)/3 from Line1:Col3 from Line1:Col4 = Col 7 + Col 8
= Line35:(Col4*Col5
/Col6*Col9)= Line35:(Col10 /
total of Col10)32 Note 17
33 MW
34 CPUC Rate Group 3-Year Average Line losses
Recorded GWh
(Average)
Standby
Adjusted Sales
Forecast - GWh Backup GWh
Total Sales
Forecast - GWh
Loss Adjusted
Average 12-CP
12-CP Allocation
factors
35a Domestic --- --- --- --- --- - %35b GS-1 --- --- --- --- --- - %35c TC-1 --- --- --- --- --- - %35d GS-2 --- --- --- --- --- - %35e TOU-GS-3 --- --- --- --- --- - %35f TOU-8-SEC --- --- --- --- --- - %35g TOU-8-PRI --- --- --- --- --- - %35h TOU-8-SUB --- --- --- --- --- - %35i TOU-8-Standby-SEC --- --- --- --- --- - %35j TOU-8-Standby-PRI --- --- --- --- --- - %35k TOU-8-Standby-SUB --- --- --- --- --- - %35l TOU-PA-2 --- --- --- --- --- - %
35m TOU-PA-3 --- --- --- --- --- - %35n Street Lighting --- --- --- --- --- - %35o ---36 Totals: --- --- --- --- --- --- --- --- --- --- - %
12-CP MW
33-RetailRates
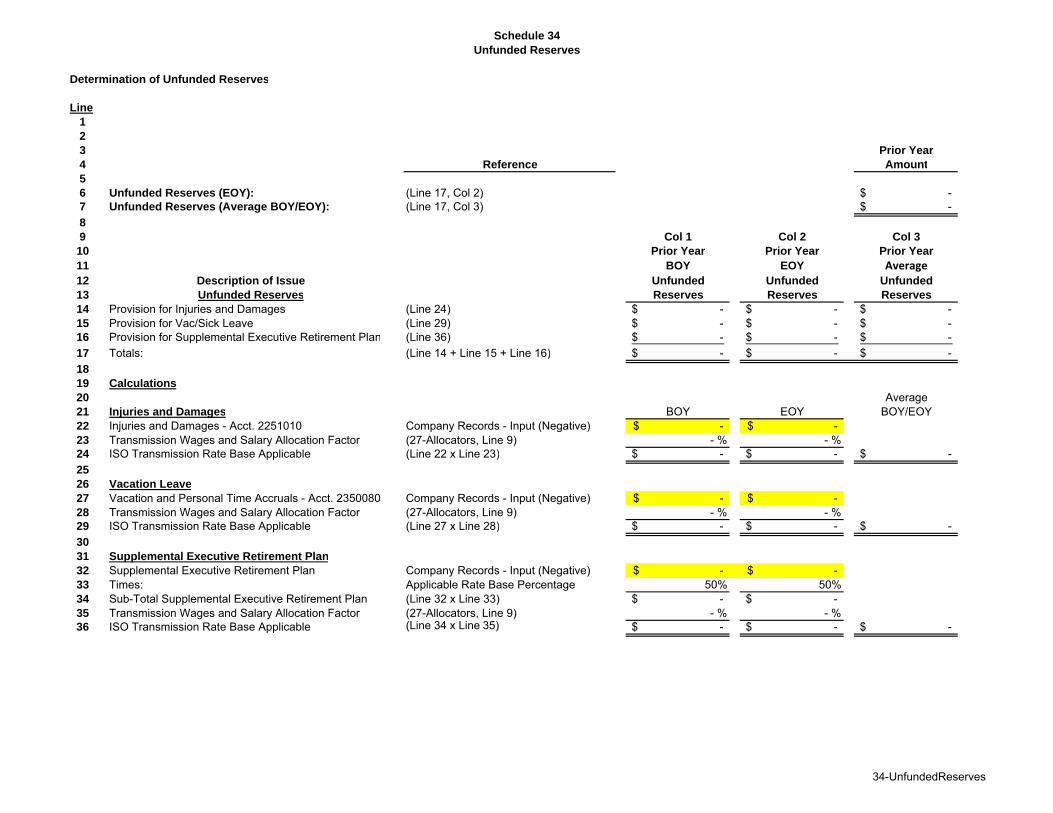
Schedule 34
Unfunded Reserves
Determination of Unfunded Reserves
Line
1
2
3 Prior Year
4 Reference Amount
5
6 Unfunded Reserves (EOY): (Line 17, Col 2) -$ 7 Unfunded Reserves (Average BOY/EOY): (Line 17, Col 3) -$
8
9 Col 1 Col 2 Col 3
10 Prior Year Prior Year Prior Year
11 BOY EOY Average12 Description of Issue Unfunded Unfunded Unfunded
13 Unfunded Reserves Reserves Reserves Reserves
14 Provision for Injuries and Damages (Line 24) -$ -$ -$ 15 Provision for Vac/Sick Leave (Line 29) -$ -$ -$ 16 Provision for Supplemental Executive Retirement Plan (Line 36) -$ -$ -$
17 Totals: (Line 14 + Line 15 + Line 16) -$ -$ -$
18
19 Calculations
20 Average21 Injuries and Damages BOY EOY BOY/EOY22 Injuries and Damages - Acct. 2251010 Company Records - Input (Negative) -$ -$ 23 Transmission Wages and Salary Allocation Factor (27-Allocators, Line 9) - % - %24 ISO Transmission Rate Base Applicable (Line 22 x Line 23) -$ -$ -$
25
26 Vacation Leave
27 Vacation and Personal Time Accruals - Acct. 2350080 Company Records - Input (Negative) -$ -$ 28 Transmission Wages and Salary Allocation Factor (27-Allocators, Line 9) - % - %29 ISO Transmission Rate Base Applicable (Line 27 x Line 28) -$ -$ -$
30
31 Supplemental Executive Retirement Plan
32 Supplemental Executive Retirement Plan Company Records - Input (Negative) -$ -$ 33 Times: Applicable Rate Base Percentage 50% 50%34 Sub-Total Supplemental Executive Retirement Plan (Line 32 x Line 33) -$ -$ 35 Transmission Wages and Salary Allocation Factor (27-Allocators, Line 9) - % - %36 ISO Transmission Rate Base Applicable (Line 34 x Line 35) -$ -$ -$
34-UnfundedReserves
REVISED CLEAN VERSION OF
SCE’S TO TARIFF SHEETS
REFLECTING THE PROPOSED
FORMULA RATE
REVISED CLEAN VERSION OF
SCE’S TO TARIFF SHEETS
REFLECTING THE PROPOSED
FORMULA RATE
RED-LINED VERSION OF
SCE’S TO TARIFF SHEETS
REFLECTING THE PROPOSED
FORMULA RATE
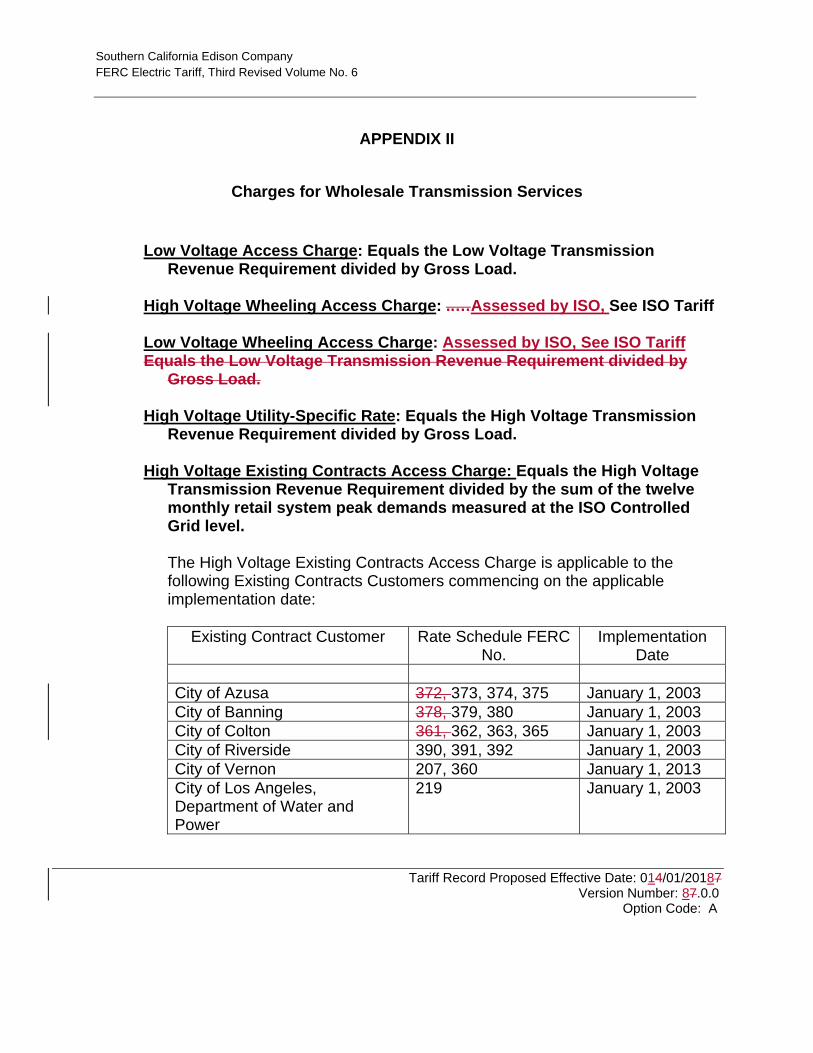
Southern California Edison Company
FERC Electric Tariff, Third Revised Volume No. 6
APPENDIX II
Charges for Wholesale Transmission Services
Low Voltage Access Charge: Equals the Low Voltage Transmission
Revenue Requirement divided by Gross Load. High Voltage Wheeling Access Charge: ..…Assessed by ISO, See ISO Tariff Low Voltage Wheeling Access Charge: Assessed by ISO, See ISO Tariff Equals the Low Voltage Transmission Revenue Requirement divided by
Gross Load. High Voltage Utility-Specific Rate: Equals the High Voltage Transmission
Revenue Requirement divided by Gross Load. High Voltage Existing Contracts Access Charge: Equals the High Voltage
Transmission Revenue Requirement divided by the sum of the twelve monthly retail system peak demands measured at the ISO Controlled Grid level.
The High Voltage Existing Contracts Access Charge is applicable to the following Existing Contracts Customers commencing on the applicable implementation date:
Existing Contract Customer Rate Schedule FERC No.
Implementation Date
City of Azusa 372, 373, 374, 375 January 1, 2003
City of Banning 378, 379, 380 January 1, 2003
City of Colton 361, 362, 363, 365 January 1, 2003
City of Riverside 390, 391, 392 January 1, 2003
City of Vernon 207, 360 January 1, 2013
City of Los Angeles, Department of Water and Power
219 January 1, 2003
Tariff Record Proposed Effective Date: 014/01/20187 Version Number: 87.0.0
Option Code: A
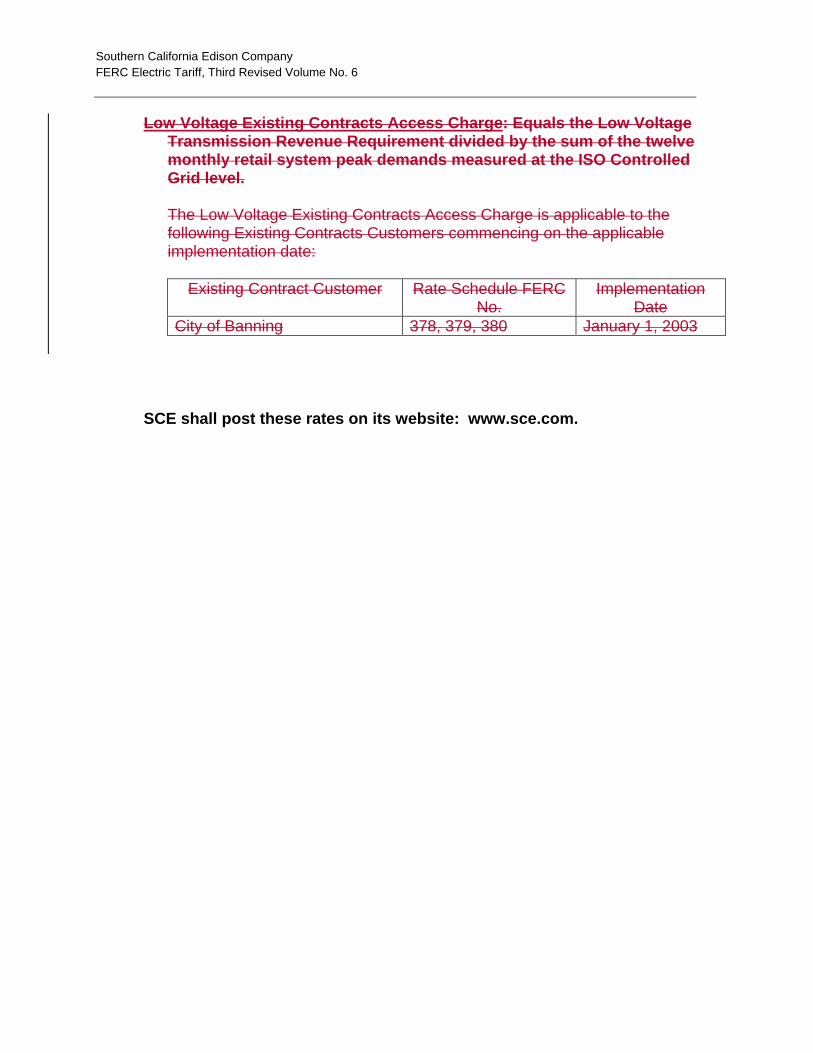
Southern California Edison Company
FERC Electric Tariff, Third Revised Volume No. 6
Low Voltage Existing Contracts Access Charge: Equals the Low Voltage Transmission Revenue Requirement divided by the sum of the twelve monthly retail system peak demands measured at the ISO Controlled Grid level.
The Low Voltage Existing Contracts Access Charge is applicable to the following Existing Contracts Customers commencing on the applicable implementation date:
Existing Contract Customer Rate Schedule FERC No.
Implementation Date
City of Banning 378, 379, 380 January 1, 2003
SCE shall post these rates on its website: www.sce.com.
APPENDIX IX
ATTACHMENT 1
FORMULA RATE PROTOCOLS
1. INTRODUCTION SCE shall calculate its Base Transmission Revenue Requirement (“Base TRR”), as defined in Section 3.6 of the main definitions section of this TO Tariff, using the formula rate that is presented in spreadsheet format in Attachment 2 to Appendix IX (“Formula Rate Spreadsheet”).1 The Formula Rate Spreadsheet contains fixed formulae that are only subject to change pursuant to Sections 205 and 206 of the Federal Power Act, and will be populated with data from SCE’s annual Federal Energy Regulatory Commission (“FERC” or the “Commission”) Form 1 filing or from other SCE records. The sources of the data used in the Formula Rate will be: (a) identified in the Formula Rate Spreadsheet by fixed references to specific locations in FERC Form 1, or (b) provided by SCE in accordance with Section 3 of these Protocols.
The Base TRR shall be calculated annually in accordance with the Formula Rate and shall be equal to the sum of the Prior Year TRR, the Incremental Forecast Period TRR, and the True Up Adjustment. Additionally, SCE shall include a Cost Adjustment in the Base TRR for the upcoming Rate Year in the event that a discrete cost of service item (e.g., individual O&M expense, tax expense, or revenue credit) incurred anytime between the beginning of the Prior Year and the September 30 immediately preceding the Annual Update filing (i.e., a 21 month window) is a one-time item that will not recur in such Rate Year. Individual items shall not be aggregated for purpose of determining a discrete cost of service item. The discrete cost of service item must amount to at least 3% of the Base TRR in such Annual Update filing in order for a Cost Adjustment to be included as a component of the Base TRR. The Cost Adjustment shall be handled as follows:
a) If the discrete cost of service item occurred during the Prior Year, then the Cost
Adjustment component of the Base TRR shall be an amount with the same magnitude but of the opposite sign as the discrete cost of service item. For example, if the discrete cost of service item is a $100 million one-time property tax refund (a negative item) received during 2012 but which will not recur during 2014, + $100 million will be included as a Cost Adjustment component of the Base TRR in the Annual Update for the 2014 Rate Year. If the discrete cost of
1 Attachment 2 consists of thirty-fourive (345) individual Schedules. All references in the Formula Rate Protocols (“Protocols”) to Schedules refer to Schedules in the Formula Rate Spreadsheet. The Formula Rate Spreadsheet and Formula Rate Protocols together comprise the “Formula Rate.” The formula rate that was in effect from January 1, 2012 through December 31, 2017 pursuant to Docket No. ER11-3697 shall be referred to herein as the “Original Formula Rate”.
Southern California Edison Company FERC Electric Tariff, Third Revised Volume No. 6 _____________________________________________________________________________________________________
________________________________________________________________________________________________________ Tariff Record Proposed Effective Date: 01/01/2018
Version Number: 4.0.0 Option Code: A
service item is a $100 million one-time O&M cost (a positive item) incurred during 2012 that will not recur in 2014, - $100 million will be included as a Cost Adjustment component of the Base TRR in the Annual Update for the 2014 Rate Year. Both examples assume the 3% threshold is met.
b) If the discrete cost of service item occurred between January 1 and September
30 of the year in which the Annual Update filing is submitted to FERC (i.e., the year before the upcoming Rate Year), then the Cost Adjustment component of the Base TRR shall be an amount with the same magnitude and the same sign as the discrete cost of service item. For example, if the discrete cost of service item is a $100 million one-time property tax refund (a negative item) received during the first nine months of 2013 but which will not recur during 2014, - $100 million will be included as a Cost Adjustment component of the Base TRR in the Annual Update for the 2014 Rate Year. If the discrete cost of service item is a $100 million one-time O&M cost (a positive item) incurred during the first nine months of 2013 that will not recur in 2014, + $100 million will be included as a Cost Adjustment component of the Base TRR in the Annual Update for the 2014 Rate Year. Both examples assume the 3% threshold is met.
If SCE includes a Cost Adjustment in its Base TRR, SCE shall include with its Annual Update an explanation of its belief that the discrete cost of service item that is the subject of such Cost Adjustment will not recur in the upcoming Rate Year.
The Wholesale Base TRR is equal to the Base TRR adjusted as follows (as set forth in Schedule 25): (1) Uncollectibles Expense is not included in the Wholesale Base TRR; (2) the Wholesale Rate Base Adjustment and associated Wholesale Expense Difference is included in the Wholesale TRR; (3) EEI dues and EPRI duesExpenses are excluded from the Wholesale Base TRR; and (4) Franchise Fees Expense included in the Wholesale Base TRR is lower than that included in the Base TRR due to the Franchise Fee Factor being applied to a lower Base TRR.
2. TERM OF THE FORMULA RATE
The Formula Rate shall become effective on January 1, 20182, and SCE’s Base TRR shall be subject to true up beginning on that date in accordance with these Protocols. Retail and Wholesale transmission rates shall become effective on January 1, 20182, and shall be redetermined annually in accordance with these Protocols and the Formula Rate Spreadsheet. The Formula Rate will remain in effect without termination unless and until SCE files pursuant to Section 205 of the Federal Power Act to replace the Formula Rate with a successor transmission rate mechanism and the Commission accepts such successor transmission rate mechanism. Except as set forth below, the Formula Rate shall terminate December 31, 2017. SCE shall submit a filing under Section 205 of the Federal Power Act by no later than 60 days prior to December 31, 2017, proposing a transmission rate schedule, which may include revised transmission rates. The rates and other components of such filing shall be at SCE’s sole discretion, and may be in the form of a formula rate or a traditional stated rate. Parties retain all rights to oppose the filing. Such filing shall request an effective date of January 1, 2018. In the event that the
Southern California Edison Company FERC Electric Tariff, Third Revised Volume No. 6 _____________________________________________________________________________________________________
________________________________________________________________________________________________________ Tariff Record Proposed Effective Date: 01/01/2018
Version Number: 4.0.0 Option Code: A
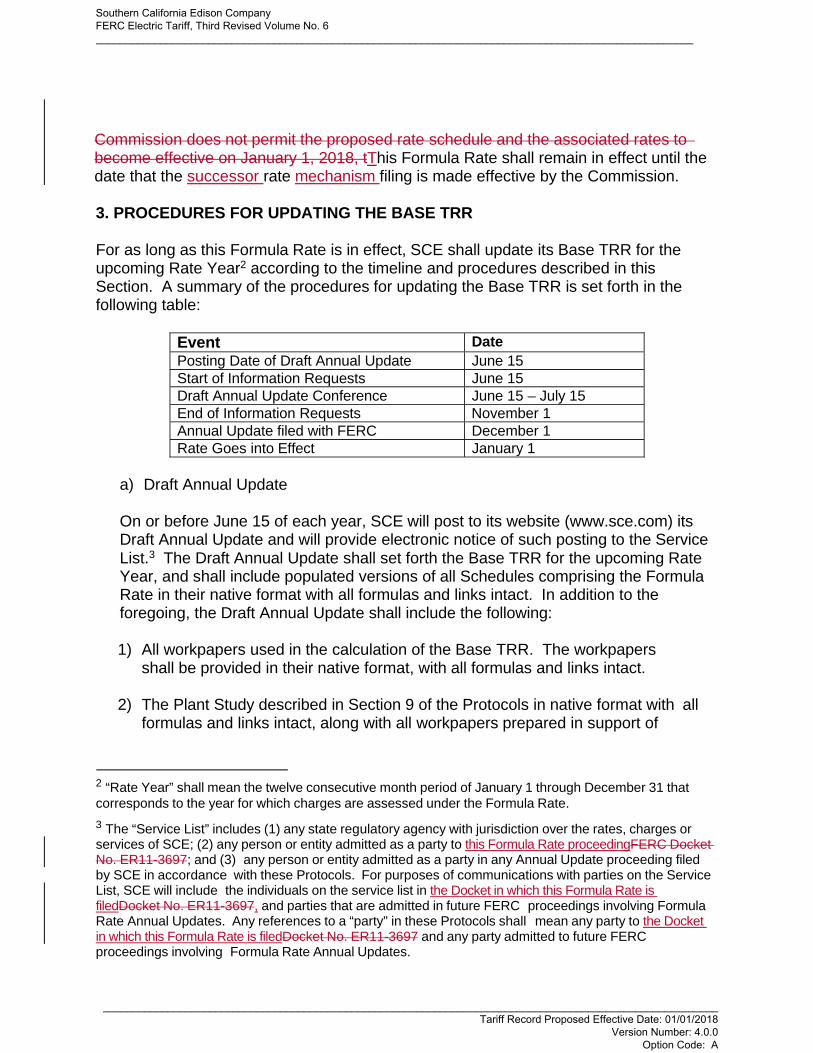
Commission does not permit the proposed rate schedule and the associated rates to become effective on January 1, 2018, tThis Formula Rate shall remain in effect until the date that the successor rate mechanism filing is made effective by the Commission.
3. PROCEDURES FOR UPDATING THE BASE TRR
For as long as this Formula Rate is in effect, SCE shall update its Base TRR for the upcoming Rate Year2 according to the timeline and procedures described in this Section. A summary of the procedures for updating the Base TRR is set forth in the following table:
Event Date
Posting Date of Draft Annual Update June 15
Start of Information Requests June 15
Draft Annual Update Conference June 15 – July 15
End of Information Requests November 1
Annual Update filed with FERC December 1
Rate Goes into Effect January 1
a) Draft Annual Update
On or before June 15 of each year, SCE will post to its website (www.sce.com) its Draft Annual Update and will provide electronic notice of such posting to the Service List.3 The Draft Annual Update shall set forth the Base TRR for the upcoming Rate Year, and shall include populated versions of all Schedules comprising the Formula Rate in their native format with all formulas and links intact. In addition to the foregoing, the Draft Annual Update shall include the following:
1) All workpapers used in the calculation of the Base TRR. The workpapers
shall be provided in their native format, with all formulas and links intact.
2) The Plant Study described in Section 9 of the Protocols in native format with all formulas and links intact, along with all workpapers prepared in support of
2 “Rate Year” shall mean the twelve consecutive month period of January 1 through December 31 that
corresponds to the year for which charges are assessed under the Formula Rate.
3 The “Service List” includes (1) any state regulatory agency with jurisdiction over the rates, charges or services of SCE; (2) any person or entity admitted as a party to this Formula Rate proceedingFERC Docket No. ER11-3697; and (3) any person or entity admitted as a party in any Annual Update proceeding filed by SCE in accordance with these Protocols. For purposes of communications with parties on the Service List, SCE will include the individuals on the service list in the Docket in which this Formula Rate is filedDocket No. ER11-3697, and parties that are admitted in future FERC proceedings involving Formula Rate Annual Updates. Any references to a “party” in these Protocols shall mean any party to the Docket in which this Formula Rate is filedDocket No. ER11-3697 and any party admitted to future FERC proceedings involving Formula Rate Annual Updates.
Southern California Edison Company FERC Electric Tariff, Third Revised Volume No. 6 _____________________________________________________________________________________________________
________________________________________________________________________________________________________ Tariff Record Proposed Effective Date: 01/01/2018
Version Number: 4.0.0 Option Code: A
the Plant Study, and a description of any changes in the methodology used to perform the Plant Study as compared with the Prior Year’s Annual Update.
3) Workpapers supporting the inputs that appear in Schedule 27 in equivalent form
to the workpapers provided in FERC Docket No. ER11-3697, Volume 4, Workpapers for Exhibit SCE-600, pages 1-268.
4) Workpapers that demonstrate the historical corporate overhead expenses
recorded for ISO projects by Project Identification Number (PIN) that closed in the prior year and have accumulated ISO project costs greater than $5 million.
5) Workpapers that demonstrate the derivation of the AFUDC rates applicable to all
projects in the prior year.
6) Workpapers supporting the forecasted gross plant expenditures shown on Schedule 16.
7) A statement that identifies each ISO project (PIN) with total direct expenditures
(recorded and forecast) greater than $5 million projected to go into rate base during the forecast periodupcoming Rate Year. The statement will also include the monthly budgeted direct expenditures, to the extent such currently projected costs are shown on the most recent applicable SCE budget documents, and the total project cost of each project.
8) Workpapers showing the beginning of year and end of year outstanding network
upgrade credits, as well as interest on network upgrade credits that is recorded in Account 252 listed by entity due those credits. The workpapers shall be provided in equivalent form to the workpapers entitled “Workpapers for Exhibit SCE-800” provided by SCE in FERC Docket No. ER11-3697.
9) Workpapers showing forecast period incentive Construction Work in Progress (“CWIP”) projects by PIN and by month that support the values in Schedule 10 at lines 29-70 in equivalent form to the workpapers provided in FERC Docket No. ER11-3697, Volume 3, Workpapers for Exhibit SCE-500, pages 149-175.
10)9) A description of any Material Accounting Changes contained in the Draft
Annual Update.4
4 “Material Accounting Changes” shall mean any material change in SCE’s (i) accounting policies and practices from those in effect for the PriorRate Year upon which the immediately preceding Annual Update was based, or (ii) internal corporate cost allocation policies or practices from those policies and/or practices in effect for the PriorRate Year upon which the immediately preceding Annual Update was based.
Southern California Edison Company FERC Electric Tariff, Third Revised Volume No. 6 _____________________________________________________________________________________________________
________________________________________________________________________________________________________ Tariff Record Proposed Effective Date: 01/01/2018
Version Number: 4.0.0 Option Code: A
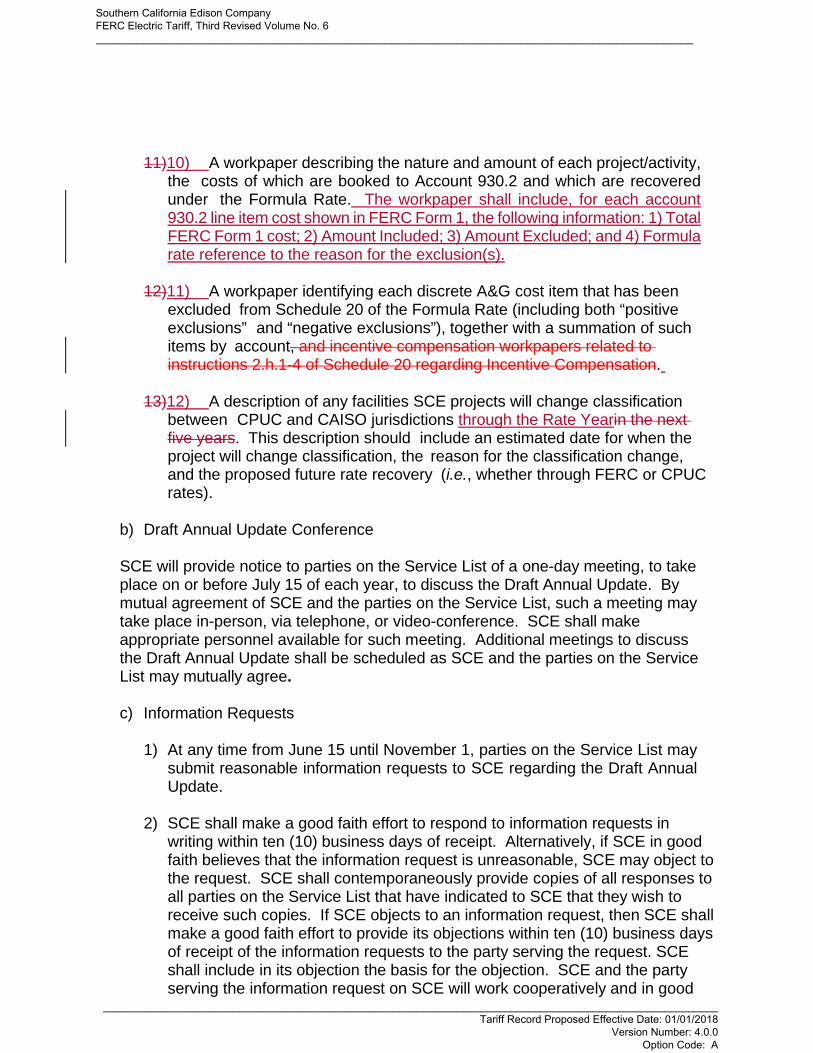
11)10) A workpaper describing the nature and amount of each project/activity, the costs of which are booked to Account 930.2 and which are recovered under the Formula Rate. The workpaper shall include, for each account 930.2 line item cost shown in FERC Form 1, the following information: 1) Total FERC Form 1 cost; 2) Amount Included; 3) Amount Excluded; and 4) Formula rate reference to the reason for the exclusion(s).
12)11) A workpaper identifying each discrete A&G cost item that has been
excluded from Schedule 20 of the Formula Rate (including both “positive exclusions” and “negative exclusions”), together with a summation of such items by account, and incentive compensation workpapers related to instructions 2.h.1-4 of Schedule 20 regarding Incentive Compensation.
13)12) A description of any facilities SCE projects will change classification
between CPUC and CAISO jurisdictions through the Rate Yearin the next five years. This description should include an estimated date for when the project will change classification, the reason for the classification change, and the proposed future rate recovery (i.e., whether through FERC or CPUC rates).
b) Draft Annual Update Conference
SCE will provide notice to parties on the Service List of a one-day meeting, to take place on or before July 15 of each year, to discuss the Draft Annual Update. By mutual agreement of SCE and the parties on the Service List, such a meeting may take place in-person, via telephone, or video-conference. SCE shall make appropriate personnel available for such meeting. Additional meetings to discuss the Draft Annual Update shall be scheduled as SCE and the parties on the Service List may mutually agree.
c) Information Requests
1) At any time from June 15 until November 1, parties on the Service List may
submit reasonable information requests to SCE regarding the Draft Annual Update.
2) SCE shall make a good faith effort to respond to information requests in
writing within ten (10) business days of receipt. Alternatively, if SCE in good faith believes that the information request is unreasonable, SCE may object to the request. SCE shall contemporaneously provide copies of all responses to all parties on the Service List that have indicated to SCE that they wish to receive such copies. If SCE objects to an information request, then SCE shall make a good faith effort to provide its objections within ten (10) business days of receipt of the information requests to the party serving the request. SCE shall include in its objection the basis for the objection. SCE and the party serving the information request on SCE will work cooperatively and in good
Southern California Edison Company FERC Electric Tariff, Third Revised Volume No. 6 _____________________________________________________________________________________________________
________________________________________________________________________________________________________ Tariff Record Proposed Effective Date: 01/01/2018
Version Number: 4.0.0 Option Code: A
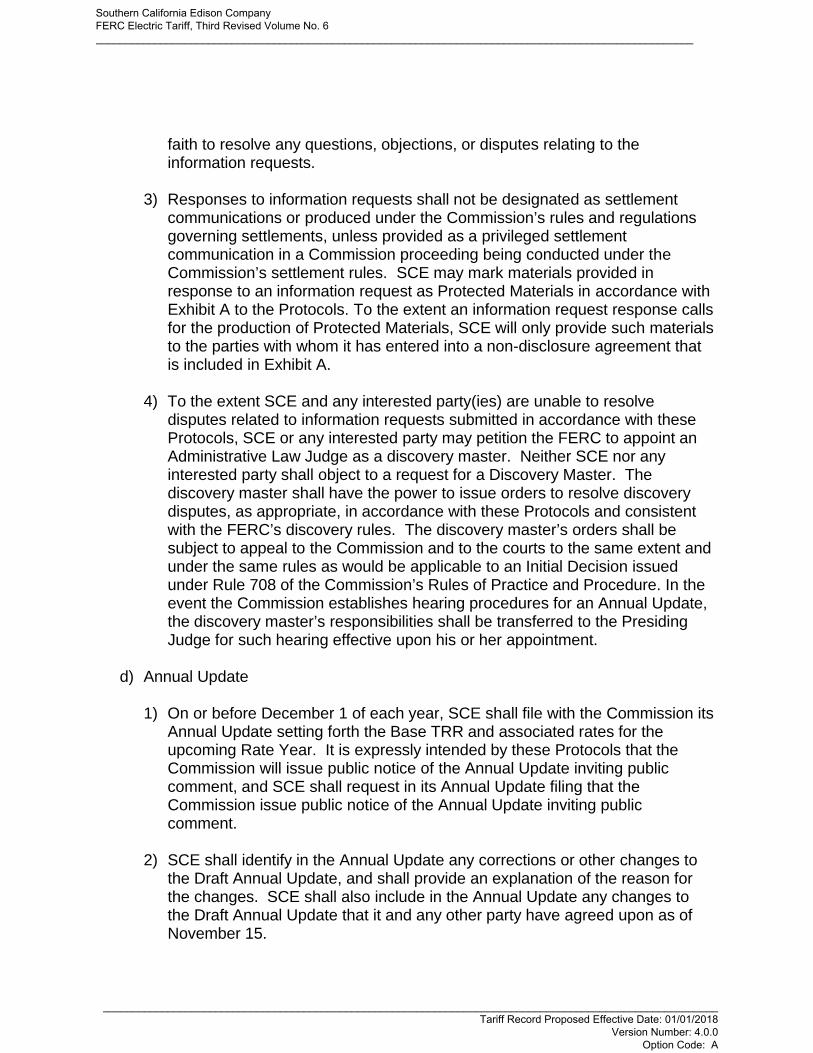
faith to resolve any questions, objections, or disputes relating to the information requests.
3) Responses to information requests shall not be designated as settlement
communications or produced under the Commission’s rules and regulations governing settlements, unless provided as a privileged settlement communication in a Commission proceeding being conducted under the Commission’s settlement rules. SCE may mark materials provided in response to an information request as Protected Materials in accordance with Exhibit A to the Protocols. To the extent an information request response calls for the production of Protected Materials, SCE will only provide such materials to the parties with whom it has entered into a non-disclosure agreement that is included in Exhibit A.
4) To the extent SCE and any interested party(ies) are unable to resolve
disputes related to information requests submitted in accordance with these Protocols, SCE or any interested party may petition the FERC to appoint an Administrative Law Judge as a discovery master. Neither SCE nor any interested party shall object to a request for a Discovery Master. The discovery master shall have the power to issue orders to resolve discovery disputes, as appropriate, in accordance with these Protocols and consistent with the FERC’s discovery rules. The discovery master’s orders shall be subject to appeal to the Commission and to the courts to the same extent and under the same rules as would be applicable to an Initial Decision issued under Rule 708 of the Commission’s Rules of Practice and Procedure. In the event the Commission establishes hearing procedures for an Annual Update, the discovery master’s responsibilities shall be transferred to the Presiding Judge for such hearing effective upon his or her appointment.
d) Annual Update
1) On or before December 1 of each year, SCE shall file with the Commission its
Annual Update setting forth the Base TRR and associated rates for the upcoming Rate Year. It is expressly intended by these Protocols that the Commission will issue public notice of the Annual Update inviting public comment, and SCE shall request in its Annual Update filing that the Commission issue public notice of the Annual Update inviting public comment.
2) SCE shall identify in the Annual Update any corrections or other changes to
the Draft Annual Update, and shall provide an explanation of the reason for the changes. SCE shall also include in the Annual Update any changes to the Draft Annual Update that it and any other party have agreed upon as of November 15.
Southern California Edison Company FERC Electric Tariff, Third Revised Volume No. 6 _____________________________________________________________________________________________________
________________________________________________________________________________________________________ Tariff Record Proposed Effective Date: 01/01/2018
Version Number: 4.0.0 Option Code: A
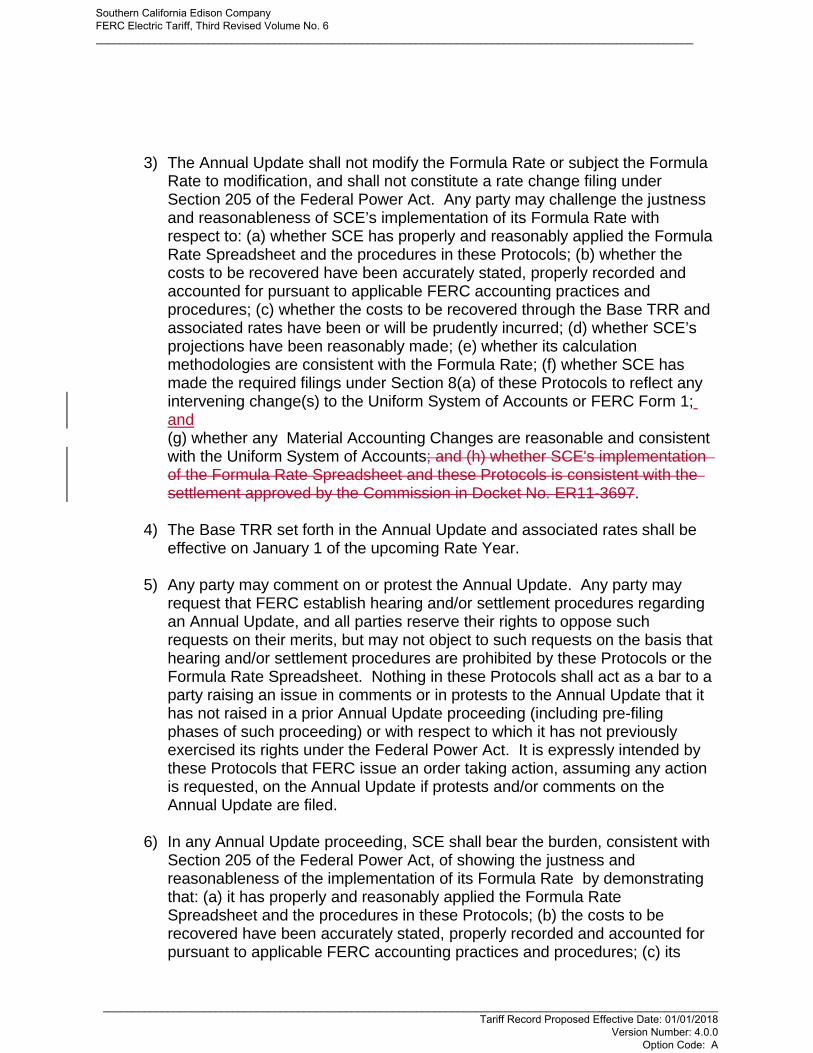
3) The Annual Update shall not modify the Formula Rate or subject the Formula Rate to modification, and shall not constitute a rate change filing under Section 205 of the Federal Power Act. Any party may challenge the justness and reasonableness of SCE’s implementation of its Formula Rate with respect to: (a) whether SCE has properly and reasonably applied the Formula Rate Spreadsheet and the procedures in these Protocols; (b) whether the costs to be recovered have been accurately stated, properly recorded and accounted for pursuant to applicable FERC accounting practices and procedures; (c) whether the costs to be recovered through the Base TRR and associated rates have been or will be prudently incurred; (d) whether SCE’s projections have been reasonably made; (e) whether its calculation methodologies are consistent with the Formula Rate; (f) whether SCE has made the required filings under Section 8(a) of these Protocols to reflect any intervening change(s) to the Uniform System of Accounts or FERC Form 1; and (g) whether any Material Accounting Changes are reasonable and consistent with the Uniform System of Accounts; and (h) whether SCE's implementation of the Formula Rate Spreadsheet and these Protocols is consistent with the settlement approved by the Commission in Docket No. ER11-3697.
4) The Base TRR set forth in the Annual Update and associated rates shall be
effective on January 1 of the upcoming Rate Year.
5) Any party may comment on or protest the Annual Update. Any party may request that FERC establish hearing and/or settlement procedures regarding an Annual Update, and all parties reserve their rights to oppose such requests on their merits, but may not object to such requests on the basis that hearing and/or settlement procedures are prohibited by these Protocols or the Formula Rate Spreadsheet. Nothing in these Protocols shall act as a bar to a party raising an issue in comments or in protests to the Annual Update that it has not raised in a prior Annual Update proceeding (including pre-filing phases of such proceeding) or with respect to which it has not previously exercised its rights under the Federal Power Act. It is expressly intended by these Protocols that FERC issue an order taking action, assuming any action is requested, on the Annual Update if protests and/or comments on the Annual Update are filed.
6) In any Annual Update proceeding, SCE shall bear the burden, consistent with
Section 205 of the Federal Power Act, of showing the justness and reasonableness of the implementation of its Formula Rate by demonstrating that: (a) it has properly and reasonably applied the Formula Rate Spreadsheet and the procedures in these Protocols; (b) the costs to be recovered have been accurately stated, properly recorded and accounted for pursuant to applicable FERC accounting practices and procedures; (c) its
Southern California Edison Company FERC Electric Tariff, Third Revised Volume No. 6 _____________________________________________________________________________________________________
________________________________________________________________________________________________________ Tariff Record Proposed Effective Date: 01/01/2018
Version Number: 4.0.0 Option Code: A
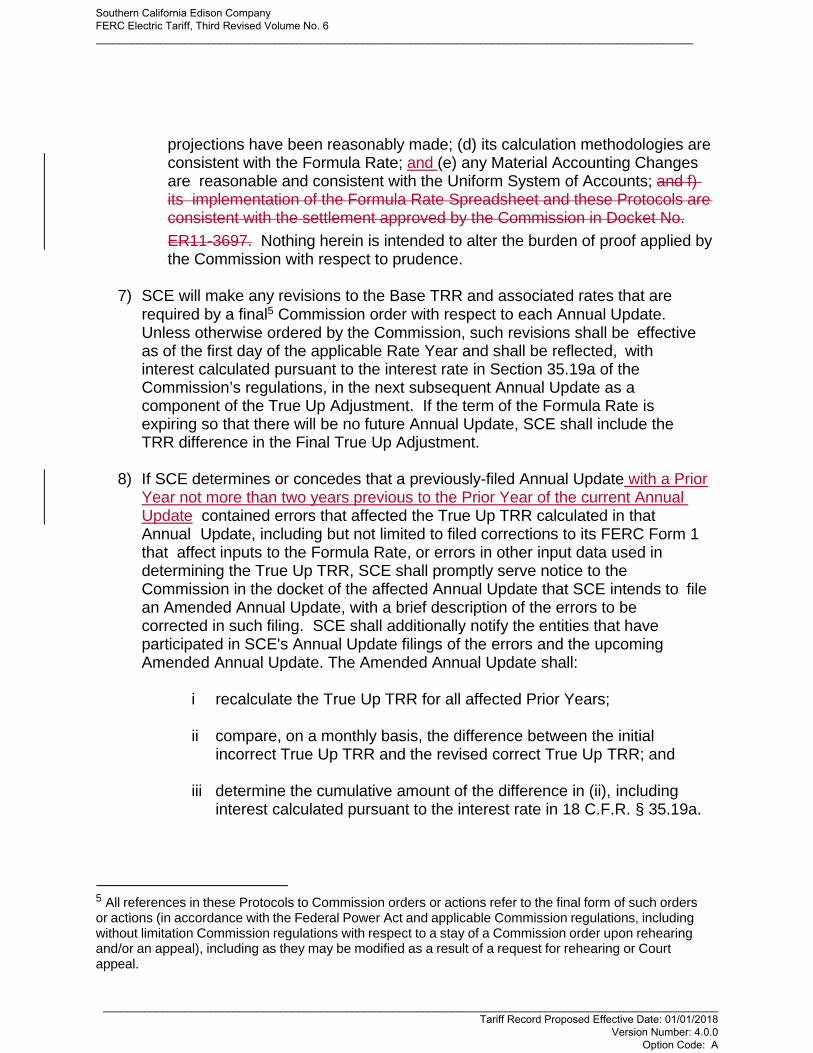
projections have been reasonably made; (d) its calculation methodologies are consistent with the Formula Rate; and (e) any Material Accounting Changes are reasonable and consistent with the Uniform System of Accounts; and f) its implementation of the Formula Rate Spreadsheet and these Protocols are consistent with the settlement approved by the Commission in Docket No.
ER11-3697. Nothing herein is intended to alter the burden of proof applied by the Commission with respect to prudence.
7) SCE will make any revisions to the Base TRR and associated rates that are
required by a final5 Commission order with respect to each Annual Update. Unless otherwise ordered by the Commission, such revisions shall be effective as of the first day of the applicable Rate Year and shall be reflected, with interest calculated pursuant to the interest rate in Section 35.19a of the Commission’s regulations, in the next subsequent Annual Update as a component of the True Up Adjustment. If the term of the Formula Rate is expiring so that there will be no future Annual Update, SCE shall include the TRR difference in the Final True Up Adjustment.
8) If SCE determines or concedes that a previously-filed Annual Update with a Prior
Year not more than two years previous to the Prior Year of the current Annual Update contained errors that affected the True Up TRR calculated in that Annual Update, including but not limited to filed corrections to its FERC Form 1 that affect inputs to the Formula Rate, or errors in other input data used in determining the True Up TRR, SCE shall promptly serve notice to the Commission in the docket of the affected Annual Update that SCE intends to file an Amended Annual Update, with a brief description of the errors to be corrected in such filing. SCE shall additionally notify the entities that have participated in SCE's Annual Update filings of the errors and the upcoming Amended Annual Update. The Amended Annual Update shall:
i recalculate the True Up TRR for all affected Prior Years;
ii compare, on a monthly basis, the difference between the initial
incorrect True Up TRR and the revised correct True Up TRR; and
iii determine the cumulative amount of the difference in (ii), including interest calculated pursuant to the interest rate in 18 C.F.R. § 35.19a.
5 All references in these Protocols to Commission orders or actions refer to the final form of such orders or actions (in accordance with the Federal Power Act and applicable Commission regulations, including without limitation Commission regulations with respect to a stay of a Commission order upon rehearing and/or an appeal), including as they may be modified as a result of a request for rehearing or Court appeal.
Southern California Edison Company FERC Electric Tariff, Third Revised Volume No. 6 _____________________________________________________________________________________________________
________________________________________________________________________________________________________ Tariff Record Proposed Effective Date: 01/01/2018
Version Number: 4.0.0 Option Code: A
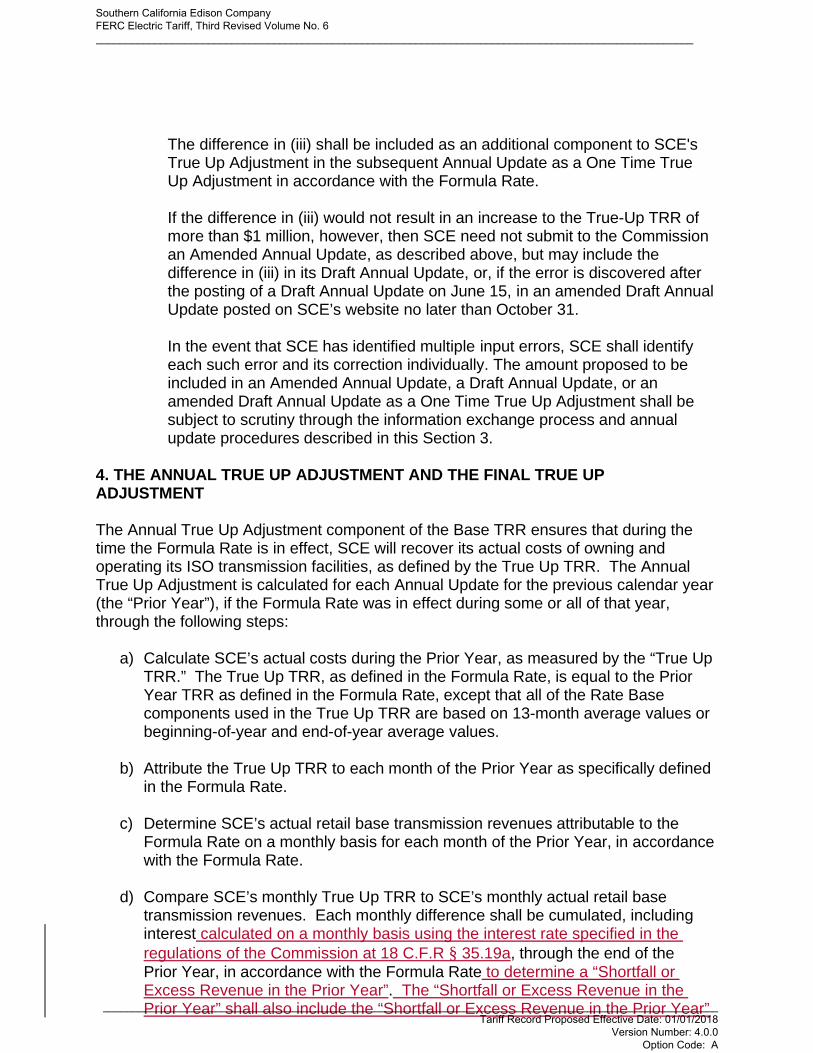
The difference in (iii) shall be included as an additional component to SCE's True Up Adjustment in the subsequent Annual Update as a One Time True Up Adjustment in accordance with the Formula Rate.
If the difference in (iii) would not result in an increase to the True-Up TRR of more than $1 million, however, then SCE need not submit to the Commission an Amended Annual Update, as described above, but may include the difference in (iii) in its Draft Annual Update, or, if the error is discovered after the posting of a Draft Annual Update on June 15, in an amended Draft Annual Update posted on SCE’s website no later than October 31.
In the event that SCE has identified multiple input errors, SCE shall identify each such error and its correction individually. The amount proposed to be included in an Amended Annual Update, a Draft Annual Update, or an amended Draft Annual Update as a One Time True Up Adjustment shall be subject to scrutiny through the information exchange process and annual update procedures described in this Section 3.
4. THE ANNUAL TRUE UP ADJUSTMENT AND THE FINAL TRUE UP ADJUSTMENT
The Annual True Up Adjustment component of the Base TRR ensures that during the time the Formula Rate is in effect, SCE will recover its actual costs of owning and operating its ISO transmission facilities, as defined by the True Up TRR. The Annual True Up Adjustment is calculated for each Annual Update for the previous calendar year (the “Prior Year”), if the Formula Rate was in effect during some or all of that year, through the following steps:
a) Calculate SCE’s actual costs during the Prior Year, as measured by the “True Up
TRR.” The True Up TRR, as defined in the Formula Rate, is equal to the Prior Year TRR as defined in the Formula Rate, except that all of the Rate Base components used in the True Up TRR are based on 13-month average values or beginning-of-year and end-of-year average values.
b) Attribute the True Up TRR to each month of the Prior Year as specifically defined
in the Formula Rate.
c) Determine SCE’s actual retail base transmission revenues attributable to the Formula Rate on a monthly basis for each month of the Prior Year, in accordance with the Formula Rate.
d) Compare SCE’s monthly True Up TRR to SCE’s monthly actual retail base
transmission revenues. Each monthly difference shall be cumulated, including interest calculated on a monthly basis using the interest rate specified in the
regulations of the Commission at 18 C.F.R § 35.19a, through the end of the Prior Year, in accordance with the Formula Rate to determine a “Shortfall or Excess Revenue in the Prior Year”. The “Shortfall or Excess Revenue in the Prior Year” shall also include the “Shortfall or Excess Revenue in the Prior Year”
Southern California Edison Company FERC Electric Tariff, Third Revised Volume No. 6 _____________________________________________________________________________________________________
________________________________________________________________________________________________________ Tariff Record Proposed Effective Date: 01/01/2018
Version Number: 4.0.0 Option Code: A
from the previous Annual Update, as specifically included in Schedule 3 of the Formula Rate Spreadsheet, Schedule 3, Line 11, and any applicable One Time Adjustments.
Southern California Edison Company FERC Electric Tariff, Third Revised Volume No. 6 _____________________________________________________________________________________________________
________________________________________________________________________________________________________ Tariff Record Proposed Effective Date: 01/01/2018
Version Number: 4.0.0 Option Code: A
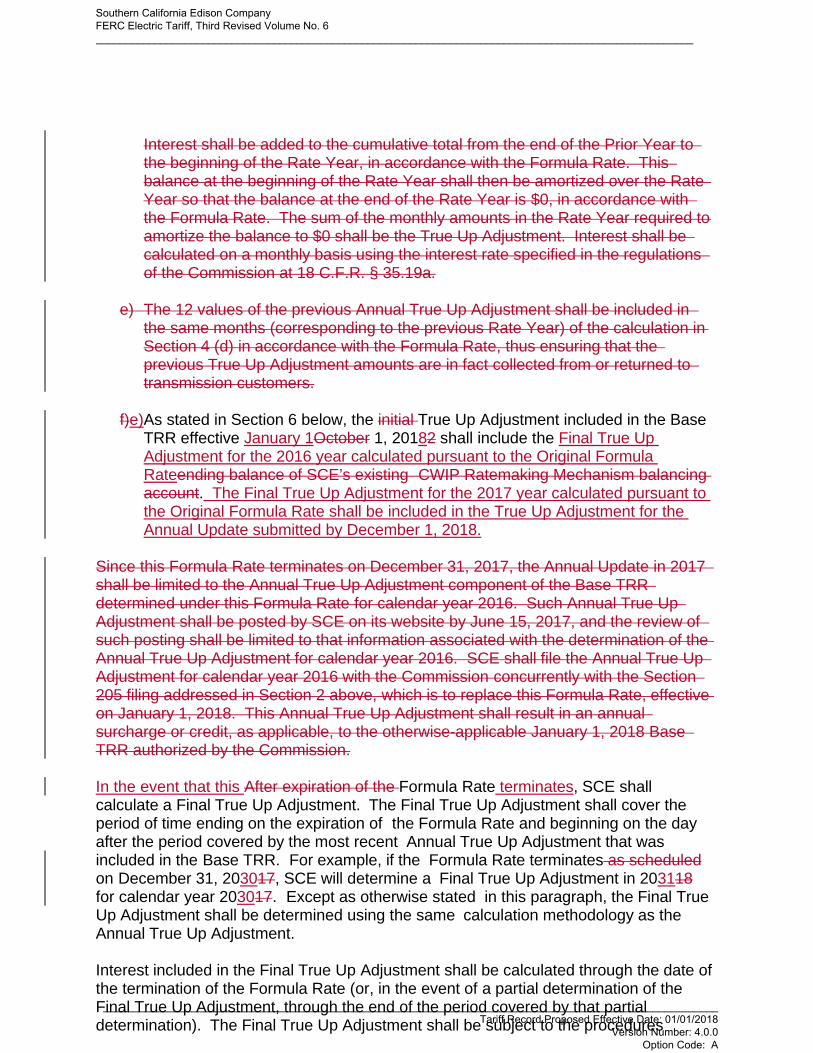
Interest shall be added to the cumulative total from the end of the Prior Year to the beginning of the Rate Year, in accordance with the Formula Rate. This balance at the beginning of the Rate Year shall then be amortized over the Rate Year so that the balance at the end of the Rate Year is $0, in accordance with the Formula Rate. The sum of the monthly amounts in the Rate Year required to amortize the balance to $0 shall be the True Up Adjustment. Interest shall be calculated on a monthly basis using the interest rate specified in the regulations of the Commission at 18 C.F.R. § 35.19a.
e) The 12 values of the previous Annual True Up Adjustment shall be included in
the same months (corresponding to the previous Rate Year) of the calculation in Section 4 (d) in accordance with the Formula Rate, thus ensuring that the previous True Up Adjustment amounts are in fact collected from or returned to transmission customers.
f)e)As stated in Section 6 below, the initial True Up Adjustment included in the Base
TRR effective January 1October 1, 20182 shall include the Final True Up Adjustment for the 2016 year calculated pursuant to the Original Formula Rateending balance of SCE’s existing CWIP Ratemaking Mechanism balancing account. The Final True Up Adjustment for the 2017 year calculated pursuant to the Original Formula Rate shall be included in the True Up Adjustment for the Annual Update submitted by December 1, 2018.
Since this Formula Rate terminates on December 31, 2017, the Annual Update in 2017 shall be limited to the Annual True Up Adjustment component of the Base TRR determined under this Formula Rate for calendar year 2016. Such Annual True Up Adjustment shall be posted by SCE on its website by June 15, 2017, and the review of such posting shall be limited to that information associated with the determination of the Annual True Up Adjustment for calendar year 2016. SCE shall file the Annual True Up Adjustment for calendar year 2016 with the Commission concurrently with the Section 205 filing addressed in Section 2 above, which is to replace this Formula Rate, effective on January 1, 2018. This Annual True Up Adjustment shall result in an annual surcharge or credit, as applicable, to the otherwise-applicable January 1, 2018 Base TRR authorized by the Commission.
In the event that this After expiration of the Formula Rate terminates, SCE shall calculate a Final True Up Adjustment. The Final True Up Adjustment shall cover the period of time ending on the expiration of the Formula Rate and beginning on the day after the period covered by the most recent Annual True Up Adjustment that was included in the Base TRR. For example, if the Formula Rate terminates as scheduled on December 31, 203017, SCE will determine a Final True Up Adjustment in 203118 for calendar year 203017. Except as otherwise stated in this paragraph, the Final True Up Adjustment shall be determined using the same calculation methodology as the Annual True Up Adjustment.
Interest included in the Final True Up Adjustment shall be calculated through the date of the termination of the Formula Rate (or, in the event of a partial determination of the Final True Up Adjustment, through the end of the period covered by that partial determination). The Final True Up Adjustment shall be subject to the procedures
Southern California Edison Company FERC Electric Tariff, Third Revised Volume No. 6 _____________________________________________________________________________________________________
________________________________________________________________________________________________________ Tariff Record Proposed Effective Date: 01/01/2018
Version Number: 4.0.0 Option Code: A
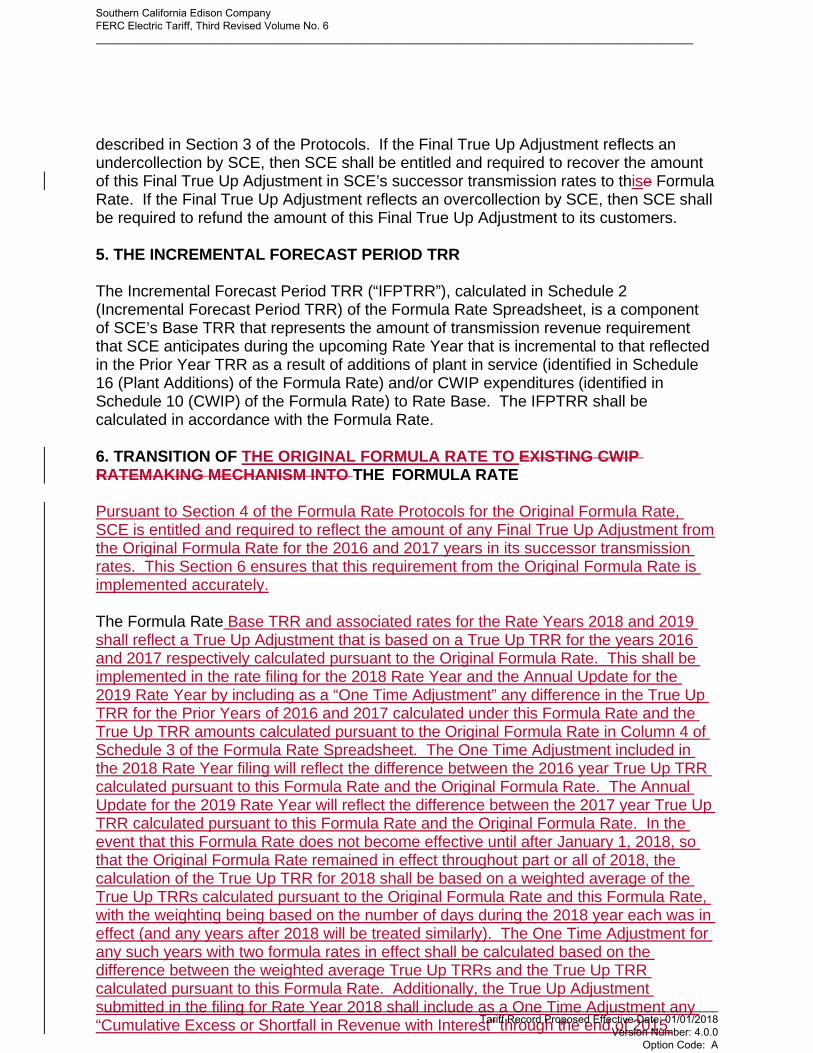
described in Section 3 of the Protocols. If the Final True Up Adjustment reflects an undercollection by SCE, then SCE shall be entitled and required to recover the amount of this Final True Up Adjustment in SCE’s successor transmission rates to thise Formula Rate. If the Final True Up Adjustment reflects an overcollection by SCE, then SCE shall be required to refund the amount of this Final True Up Adjustment to its customers.
5. THE INCREMENTAL FORECAST PERIOD TRR
The Incremental Forecast Period TRR (“IFPTRR”), calculated in Schedule 2 (Incremental Forecast Period TRR) of the Formula Rate Spreadsheet, is a component of SCE’s Base TRR that represents the amount of transmission revenue requirement that SCE anticipates during the upcoming Rate Year that is incremental to that reflected in the Prior Year TRR as a result of additions of plant in service (identified in Schedule 16 (Plant Additions) of the Formula Rate) and/or CWIP expenditures (identified in Schedule 10 (CWIP) of the Formula Rate) to Rate Base. The IFPTRR shall be calculated in accordance with the Formula Rate.
6. TRANSITION OF THE ORIGINAL FORMULA RATE TO EXISTING CWIP RATEMAKING MECHANISM INTO THE FORMULA RATE
Pursuant to Section 4 of the Formula Rate Protocols for the Original Formula Rate, SCE is entitled and required to reflect the amount of any Final True Up Adjustment from the Original Formula Rate for the 2016 and 2017 years in its successor transmission rates. This Section 6 ensures that this requirement from the Original Formula Rate is implemented accurately. The Formula Rate Base TRR and associated rates for the Rate Years 2018 and 2019 shall reflect a True Up Adjustment that is based on a True Up TRR for the years 2016 and 2017 respectively calculated pursuant to the Original Formula Rate. This shall be implemented in the rate filing for the 2018 Rate Year and the Annual Update for the 2019 Rate Year by including as a “One Time Adjustment” any difference in the True Up TRR for the Prior Years of 2016 and 2017 calculated under this Formula Rate and the True Up TRR amounts calculated pursuant to the Original Formula Rate in Column 4 of Schedule 3 of the Formula Rate Spreadsheet. The One Time Adjustment included in the 2018 Rate Year filing will reflect the difference between the 2016 year True Up TRR calculated pursuant to this Formula Rate and the Original Formula Rate. The Annual Update for the 2019 Rate Year will reflect the difference between the 2017 year True Up TRR calculated pursuant to this Formula Rate and the Original Formula Rate. In the event that this Formula Rate does not become effective until after January 1, 2018, so that the Original Formula Rate remained in effect throughout part or all of 2018, the calculation of the True Up TRR for 2018 shall be based on a weighted average of the True Up TRRs calculated pursuant to the Original Formula Rate and this Formula Rate, with the weighting being based on the number of days during the 2018 year each was in effect (and any years after 2018 will be treated similarly). The One Time Adjustment for any such years with two formula rates in effect shall be calculated based on the difference between the weighted average True Up TRRs and the True Up TRR calculated pursuant to this Formula Rate. Additionally, the True Up Adjustment submitted in the filing for Rate Year 2018 shall include as a One Time Adjustment any “Cumulative Excess or Shortfall in Revenue with Interest” through the end of 2015
Southern California Edison Company FERC Electric Tariff, Third Revised Volume No. 6 _____________________________________________________________________________________________________
________________________________________________________________________________________________________ Tariff Record Proposed Effective Date: 01/01/2018
Version Number: 4.0.0 Option Code: A
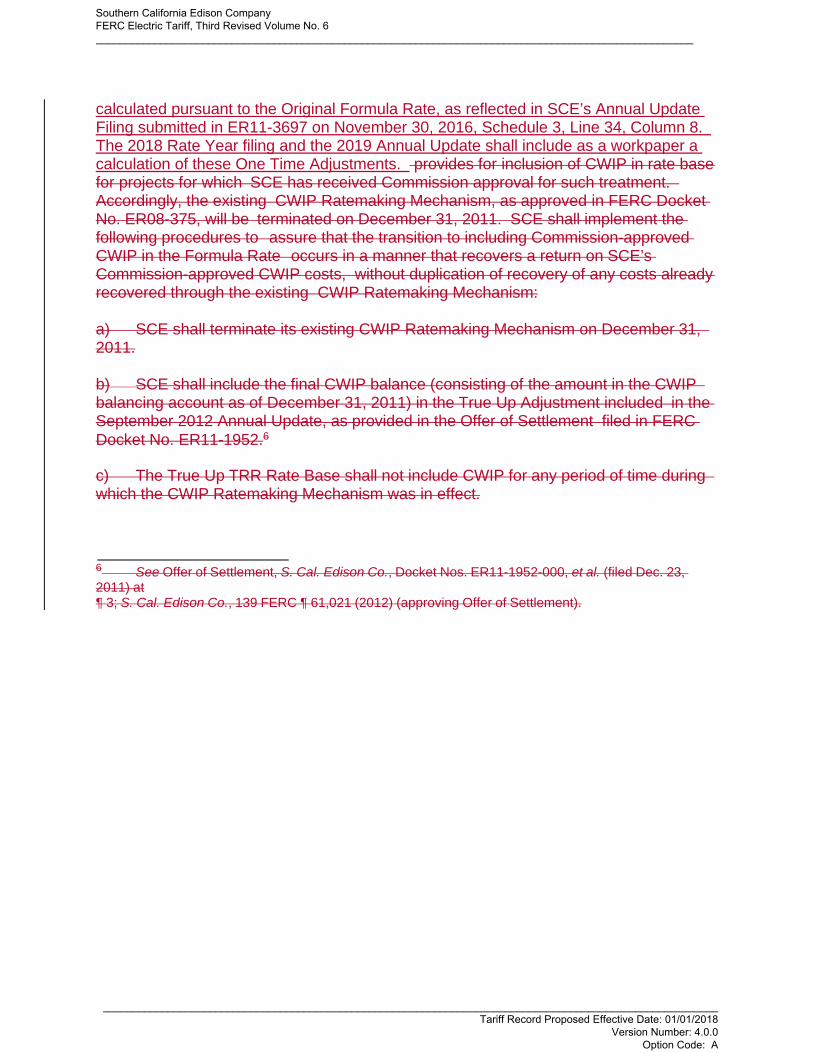
calculated pursuant to the Original Formula Rate, as reflected in SCE’s Annual Update Filing submitted in ER11-3697 on November 30, 2016, Schedule 3, Line 34, Column 8. The 2018 Rate Year filing and the 2019 Annual Update shall include as a workpaper a calculation of these One Time Adjustments. provides for inclusion of CWIP in rate base for projects for which SCE has received Commission approval for such treatment. Accordingly, the existing CWIP Ratemaking Mechanism, as approved in FERC Docket No. ER08-375, will be terminated on December 31, 2011. SCE shall implement the following procedures to assure that the transition to including Commission-approved CWIP in the Formula Rate occurs in a manner that recovers a return on SCE’s Commission-approved CWIP costs, without duplication of recovery of any costs already recovered through the existing CWIP Ratemaking Mechanism: a) SCE shall terminate its existing CWIP Ratemaking Mechanism on December 31, 2011. b) SCE shall include the final CWIP balance (consisting of the amount in the CWIP balancing account as of December 31, 2011) in the True Up Adjustment included in the September 2012 Annual Update, as provided in the Offer of Settlement filed in FERC
Docket No. ER11-1952.6
c) The True Up TRR Rate Base shall not include CWIP for any period of time during which the CWIP Ratemaking Mechanism was in effect.
6 See Offer of Settlement, S. Cal. Edison Co., Docket Nos. ER11-1952-000, et al. (filed Dec. 23, 2011) at ¶ 3; S. Cal. Edison Co., 139 FERC ¶ 61,021 (2012) (approving Offer of Settlement).
Southern California Edison Company FERC Electric Tariff, Third Revised Volume No. 6 _____________________________________________________________________________________________________
________________________________________________________________________________________________________ Tariff Record Proposed Effective Date: 01/01/2018
Version Number: 4.0.0 Option Code: A
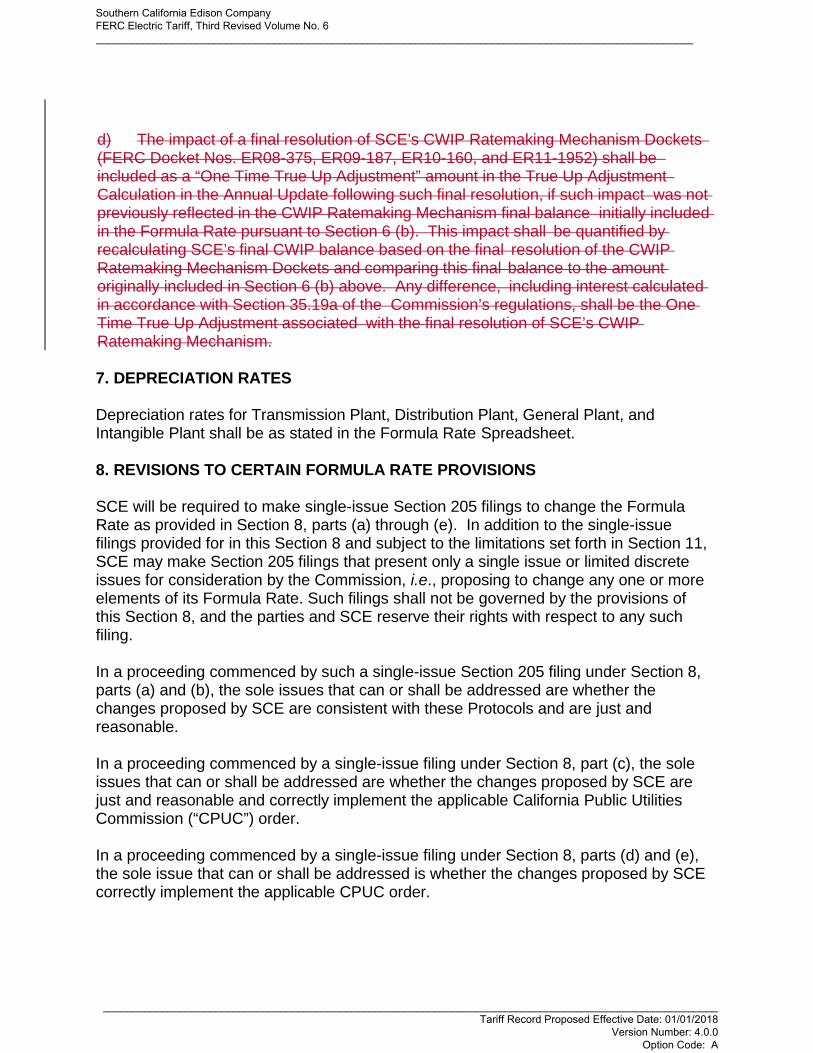
d) The impact of a final resolution of SCE’s CWIP Ratemaking Mechanism Dockets (FERC Docket Nos. ER08-375, ER09-187, ER10-160, and ER11-1952) shall be included as a “One Time True Up Adjustment” amount in the True Up Adjustment Calculation in the Annual Update following such final resolution, if such impact was not previously reflected in the CWIP Ratemaking Mechanism final balance initially included in the Formula Rate pursuant to Section 6 (b). This impact shall be quantified by recalculating SCE’s final CWIP balance based on the final resolution of the CWIP Ratemaking Mechanism Dockets and comparing this final balance to the amount originally included in Section 6 (b) above. Any difference, including interest calculated in accordance with Section 35.19a of the Commission’s regulations, shall be the One Time True Up Adjustment associated with the final resolution of SCE’s CWIP Ratemaking Mechanism.
7. DEPRECIATION RATES
Depreciation rates for Transmission Plant, Distribution Plant, General Plant, and Intangible Plant shall be as stated in the Formula Rate Spreadsheet.
8. REVISIONS TO CERTAIN FORMULA RATE PROVISIONS
SCE will be required to make single-issue Section 205 filings to change the Formula Rate as provided in Section 8, parts (a) through (e). In addition to the single-issue filings provided for in this Section 8 and subject to the limitations set forth in Section 11, SCE may make Section 205 filings that present only a single issue or limited discrete issues for consideration by the Commission, i.e., proposing to change any one or more elements of its Formula Rate. Such filings shall not be governed by the provisions of this Section 8, and the parties and SCE reserve their rights with respect to any such filing.
In a proceeding commenced by such a single-issue Section 205 filing under Section 8, parts (a) and (b), the sole issues that can or shall be addressed are whether the changes proposed by SCE are consistent with these Protocols and are just and reasonable.
In a proceeding commenced by a single-issue filing under Section 8, part (c), the sole issues that can or shall be addressed are whether the changes proposed by SCE are just and reasonable and correctly implement the applicable California Public Utilities Commission (“CPUC”) order.
In a proceeding commenced by a single-issue filing under Section 8, parts (d) and (e), the sole issue that can or shall be addressed is whether the changes proposed by SCE correctly implement the applicable CPUC order.
Southern California Edison Company FERC Electric Tariff, Third Revised Volume No. 6 _____________________________________________________________________________________________________
________________________________________________________________________________________________________ Tariff Record Proposed Effective Date: 01/01/2018
Version Number: 4.0.0 Option Code: A
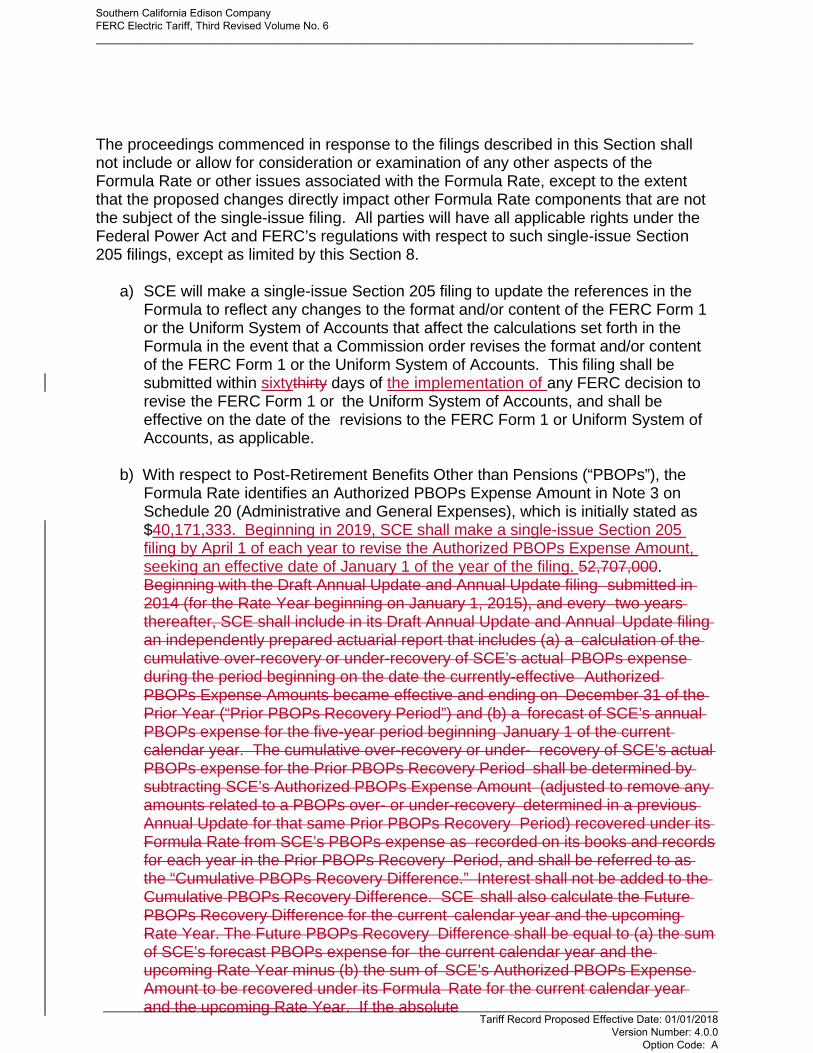
The proceedings commenced in response to the filings described in this Section shall not include or allow for consideration or examination of any other aspects of the Formula Rate or other issues associated with the Formula Rate, except to the extent that the proposed changes directly impact other Formula Rate components that are not the subject of the single-issue filing. All parties will have all applicable rights under the Federal Power Act and FERC’s regulations with respect to such single-issue Section 205 filings, except as limited by this Section 8.
a) SCE will make a single-issue Section 205 filing to update the references in the
Formula to reflect any changes to the format and/or content of the FERC Form 1 or the Uniform System of Accounts that affect the calculations set forth in the Formula in the event that a Commission order revises the format and/or content of the FERC Form 1 or the Uniform System of Accounts. This filing shall be submitted within sixtythirty days of the implementation of any FERC decision to revise the FERC Form 1 or the Uniform System of Accounts, and shall be effective on the date of the revisions to the FERC Form 1 or Uniform System of Accounts, as applicable.
b) With respect to Post-Retirement Benefits Other than Pensions (“PBOPs”), the
Formula Rate identifies an Authorized PBOPs Expense Amount in Note 3 on Schedule 20 (Administrative and General Expenses), which is initially stated as $40,171,333. Beginning in 2019, SCE shall make a single-issue Section 205 filing by April 1 of each year to revise the Authorized PBOPs Expense Amount, seeking an effective date of January 1 of the year of the filing. 52,707,000. Beginning with the Draft Annual Update and Annual Update filing submitted in 2014 (for the Rate Year beginning on January 1, 2015), and every two years thereafter, SCE shall include in its Draft Annual Update and Annual Update filing an independently prepared actuarial report that includes (a) a calculation of the cumulative over-recovery or under-recovery of SCE’s actual PBOPs expense during the period beginning on the date the currently-effective Authorized PBOPs Expense Amounts became effective and ending on December 31 of the Prior Year (“Prior PBOPs Recovery Period”) and (b) a forecast of SCE’s annual PBOPs expense for the five-year period beginning January 1 of the current calendar year. The cumulative over-recovery or under- recovery of SCE’s actual PBOPs expense for the Prior PBOPs Recovery Period shall be determined by subtracting SCE’s Authorized PBOPs Expense Amount (adjusted to remove any amounts related to a PBOPs over- or under-recovery determined in a previous Annual Update for that same Prior PBOPs Recovery Period) recovered under its Formula Rate from SCE’s PBOPs expense as recorded on its books and records for each year in the Prior PBOPs Recovery Period, and shall be referred to as the “Cumulative PBOPs Recovery Difference.” Interest shall not be added to the Cumulative PBOPs Recovery Difference. SCE shall also calculate the Future PBOPs Recovery Difference for the current calendar year and the upcoming Rate Year. The Future PBOPs Recovery Difference shall be equal to (a) the sum of SCE’s forecast PBOPs expense for the current calendar year and the upcoming Rate Year minus (b) the sum of SCE’s Authorized PBOPs Expense Amount to be recovered under its Formula Rate for the current calendar year and the upcoming Rate Year. If the absolute
Southern California Edison Company FERC Electric Tariff, Third Revised Volume No. 6 _____________________________________________________________________________________________________
________________________________________________________________________________________________________ Tariff Record Proposed Effective Date: 01/01/2018
Version Number: 4.0.0 Option Code: A
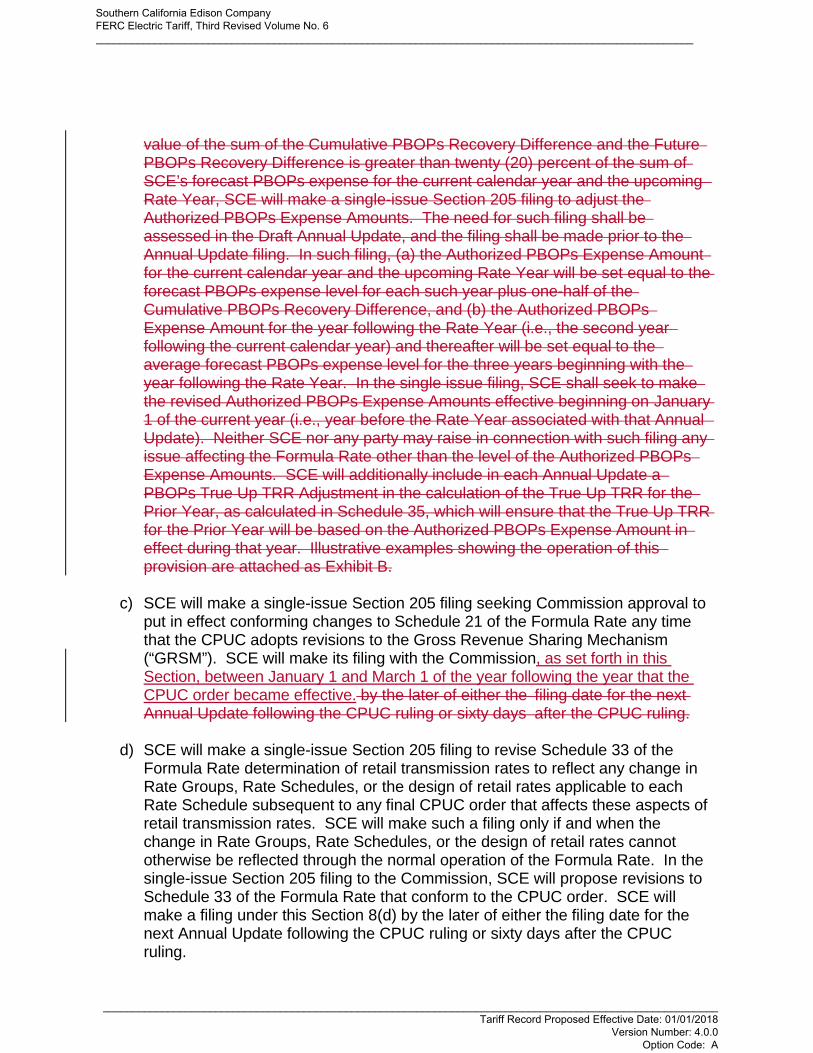
value of the sum of the Cumulative PBOPs Recovery Difference and the Future PBOPs Recovery Difference is greater than twenty (20) percent of the sum of SCE’s forecast PBOPs expense for the current calendar year and the upcoming Rate Year, SCE will make a single-issue Section 205 filing to adjust the Authorized PBOPs Expense Amounts. The need for such filing shall be assessed in the Draft Annual Update, and the filing shall be made prior to the Annual Update filing. In such filing, (a) the Authorized PBOPs Expense Amount for the current calendar year and the upcoming Rate Year will be set equal to the forecast PBOPs expense level for each such year plus one-half of the Cumulative PBOPs Recovery Difference, and (b) the Authorized PBOPs Expense Amount for the year following the Rate Year (i.e., the second year following the current calendar year) and thereafter will be set equal to the average forecast PBOPs expense level for the three years beginning with the year following the Rate Year. In the single issue filing, SCE shall seek to make the revised Authorized PBOPs Expense Amounts effective beginning on January 1 of the current year (i.e., year before the Rate Year associated with that Annual Update). Neither SCE nor any party may raise in connection with such filing any issue affecting the Formula Rate other than the level of the Authorized PBOPs Expense Amounts. SCE will additionally include in each Annual Update a PBOPs True Up TRR Adjustment in the calculation of the True Up TRR for the Prior Year, as calculated in Schedule 35, which will ensure that the True Up TRR for the Prior Year will be based on the Authorized PBOPs Expense Amount in effect during that year. Illustrative examples showing the operation of this provision are attached as Exhibit B.
c) SCE will make a single-issue Section 205 filing seeking Commission approval to
put in effect conforming changes to Schedule 21 of the Formula Rate any time that the CPUC adopts revisions to the Gross Revenue Sharing Mechanism (“GRSM”). SCE will make its filing with the Commission, as set forth in this Section, between January 1 and March 1 of the year following the year that the CPUC order became effective. by the later of either the filing date for the next Annual Update following the CPUC ruling or sixty days after the CPUC ruling.
d) SCE will make a single-issue Section 205 filing to revise Schedule 33 of the
Formula Rate determination of retail transmission rates to reflect any change in Rate Groups, Rate Schedules, or the design of retail rates applicable to each Rate Schedule subsequent to any final CPUC order that affects these aspects of retail transmission rates. SCE will make such a filing only if and when the change in Rate Groups, Rate Schedules, or the design of retail rates cannot otherwise be reflected through the normal operation of the Formula Rate. In the single-issue Section 205 filing to the Commission, SCE will propose revisions to Schedule 33 of the Formula Rate that conform to the CPUC order. SCE will make a filing under this Section 8(d) by the later of either the filing date for the next Annual Update following the CPUC ruling or sixty days after the CPUC ruling.
Southern California Edison Company FERC Electric Tariff, Third Revised Volume No. 6 _____________________________________________________________________________________________________
________________________________________________________________________________________________________ Tariff Record Proposed Effective Date: 01/01/2018
Version Number: 4.0.0 Option Code: A
e) SCE will make a single-issue Section 205 filing to change the depreciation rates for General, Intangible or Distribution plant in Schedule 18 upon approval by the CPUC of revised depreciation rates for these plant categories. SCE shall make a filing at the Commission, as set forth in this section, between January 1 and March 1 of the year following the year that the CPUC order became effective.by the later of either the filing date for the next Annual Update following the CPUC ruling or sixty days after the CPUC ruling.
9. DETERMINATION OF AMOUNT OF TRANSMISSION PLANT - ISO AND DISTRIBUTION PLANT - ISO
SCE shall perform for the Prior Year a study (“Plant Study”) to determine:
The amount of plant classified as Transmission in SCE’s annual FERC Form 1 filing that is under the Operational Control of the ISO. Such amount shall be called Transmission Plant - ISO; and
The amount of plant classified as Distribution in SCE’s annual FERC Form 1 filing that is under the Operational Control of the ISO. Such amount shall be called Distribution Plant - ISO.
The Plant Study determination of Transmission Plant - ISO and Distribution Plant - ISO will correspond to the end-of-year plant values for transmission and distribution published in SCE’s FERC Form 1, and also shall be based on actual end-of-year ISO Operational Control of facilities; provided, however, that the facilities affected by SCE’s Devers-Mirage split project shall not be included as Transmission Plant - ISO. SCE will identify in the Plant Study major transmission facilities that have moved to or from ISO Operational Control in the Prior Year. Additionally, in submitting its future CPUC General Rate Case applications, SCE shall exclude from its CPUC-jurisdictional cost of service forecast, the cost of transmission and distribution facilities that SCE projects will be under the Operational Control of the ISO during the test year.
The methodology used in the Plant Study to determine Transmission Plant - ISO and Distribution Plant - ISO shall be as follows:
a) For each Transmission account 350-359 and Distribution account 360-362,
identify the year-end recorded gross plant amount.
b) For Transmission accounts 350-359 and Distribution accounts 360-362, classify the assets by each location into one of the following categories:
1) All ISO: All Transmission or Distribution assets at the location are under the
Operational Control of the ISO.
Southern California Edison Company FERC Electric Tariff, Third Revised Volume No. 6 _____________________________________________________________________________________________________
________________________________________________________________________________________________________ Tariff Record Proposed Effective Date: 01/01/2018
Version Number: 4.0.0 Option Code: A
2) Non-ISO: No Transmission or Distribution assets at the location are under the Operational Control of the ISO.
3) Mixed ISO and Non-ISO Substation: The Transmission or Distribution
substation location has a mixture of assets under the Operational Control of the ISO and assets that are not under the Operational Control of the ISO.
4) Mixed ISO and Non-ISO Line: Transmission line locations that have a
mixture of assets under the Operational Control of the ISO and assets that are not under the Operational Control of the ISO that need to be analyzed using the Transmission Line methodology.
5) Other: Assets for which there is not sufficient data to categorize into one of
the above categories.
For all plant costs classified as (1) “All ISO”, classify all such plant costs as Transmission Plant - ISO or Distribution Plant - ISO, as appropriate. For all plant costs classified as (2) “Non-ISO”, classify none of such plant costs as “Transmission Plant - ISO” or “Distribution Plant - ISO.”
For all plant costs classified as (3) “Mixed ISO and Non-ISO Substation,” perform an analysis of plant costs based on individual components of the substation. Component plant costs that are under the Operational Control of the ISO shall be attributed to either Transmission Plant - ISO or Distribution Plant - ISO, as appropriate. Component plant costs that are not under the Operational Control of the ISO shall not be attributed to either Transmission Plant - ISO or Distribution Plant - ISO. Dual Use assets (supporting both ISO and non-ISO plant) shall be allocated to Transmission Plant - ISO or Distribution Plant - ISO based on the percentage of ISO assets for the location.
For all plant costs classified as (4) “Mixed ISO and Non-ISO Line,” apply the methodology set forth in Section 910(c) below to classify such costs.
For all plant costs classified as (5) “Other” in a location, classify such costs as Transmission Plant - ISO or Distribution Plant - ISO in proportion to the total percentage of Transmission Plant - ISO or Distribution Plant - ISO determined in parts (1) through (4) for that location.
c) Transmission line costs (including any amounts in accounts 350, 352, and 353)
required to be analyzed under the Transmission Line methodology pursuant to (b) (4) above shall be attributed to Transmission Plant - ISO according to the following methodology:
Southern California Edison Company FERC Electric Tariff, Third Revised Volume No. 6 _____________________________________________________________________________________________________
________________________________________________________________________________________________________ Tariff Record Proposed Effective Date: 01/01/2018
Version Number: 4.0.0 Option Code: A
1) For each location, determine the total line miles and total line miles that are under the Operational Control of the ISO. Determine the percent of total line miles under the Operational Control of the ISO to total line miles at that location. This calculation shall be done separately for overhead and underground facilities in the location.
2) Determine the amount of Transmission Plant - ISO by applying the percent
determined in (1) to the appropriate plant costs by account at that location.
SCE shall present a summary of the Plant Study for the Prior Year in each annual Draft Annual Update, in accordance with the Formula Rate.
10. DETERMINATION OF AMOUNT OF TRANSMISSION OPERATION AND MAINTENANCE - ISO AND DISTRIBUTION ISO OPERATION AND MAINTENANCE - ISO EXPENSE
SCE shall annually determine the amount of recorded Transmission and Distribution Operation and Maintenance (“O&M”) expenses that is attributable to facilities under the Operational Control of the ISO (“ISO O&M Expense”). The method used to determine ISO O&M Expense shall be to allocate total recorded O&M Expenses as stated in FERC Form 1 based on specific allocation factors applied to the expenses recorded to the O&M accounts set forth in Schedule 19 of the Formula Rate Spreadsheet the following:.
a) For each Transmission O&M account 560-574 and for each Distribution O&M
account 580-598, identify the total recorded O&M costs reported on SCE’s FERC Form 1, and separate each O&M account into subcategories for purposes of determining the allocation of costs to ISO and non-ISO, as described below.
1) Identify the amount for each Transmission and Distribution O&M account that
has ISO-related costs.
2) For accounts with no ISO-related costs, show the subtotal of those Transmission and Distribution O&M accounts.
b) The following adjustments shall be made to Transmission and Distribution FERC
Form 1 recorded expense to determine Adjusted Recorded O&M Expense:
1) Remove all O&M expenses recovered through other FERC-authorized rate mechanisms.
2) Remove all O&M expenses that are recovered through CPUC-authorized rate
mechanisms, and any shareholder-funded O&M expenses.
3) Add the Non-Officer Incentive Compensation (“NOIC”) amount from Schedule 20 (A&G), Note 2.f., for employees of the Transmission and Distribution Business Unit (“TDBU”), further adjusted as follows.
Southern California Edison Company FERC Electric Tariff, Third Revised Volume No. 6 _____________________________________________________________________________________________________
________________________________________________________________________________________________________ Tariff Record Proposed Effective Date: 01/01/2018
Version Number: 4.0.0 Option Code: A
i The annual NOIC expense for Transmission will be based on the ratio of Transmission labor expense to the total of Transmission and Distribution labor expense reported in FERC Form 1.
ii The annual NOIC expense for Distribution will be based on the ratio of Distribution labor expense to the total of Transmission and Distribution labor expense reported in FERC Form 1.
iii The ISO portion of the Transmission NOIC shall be based on the ratio of ISO labor for Accounts 560-573 to the total Transmission labor for Accounts 560-573, and the ISO labor amounts are calculated using the allocations described in the next section.
iv None of the Distribution NOIC should be allocated as ISO O&M expenses.
c) Classify each Adjusted Recorded O&M Expense into one of the following three
categories (All ISO O&M, All Non-ISO O&M, or Dual Use O&M), and allocate each Adjusted Recorded O&M Expense included in each category between ISO and non-ISO in accordance with the following allocation principles:
1) All ISO O&M: O&M expenses attributable to assets and/or entitlements under
the Operational Control of the ISO shall be allocated 100% to ISO O&M Expense. The following activities in these accounts are All ISO O&M:
i Account 560 – Sylmar/Palo Verde; ii Account 561.500 – Reliability, Planning and Standards Development iii Account 562 – Sylmar/Palo Verde; iv Account 565 – Transmission for Four Corners; v Account 566 – Sylmar/Palo Verde; vi Account 567 – Eldorado; vii Account 567 – Sylmar/Palo Verde; viii Account 568 – Sylmar/Palo Verde; ix Account 569 – Sylmar/Palo Verde; x Account 570 – Sylmar/Palo Verde; xi Account 571 – Sylmar/Palo Verde; xii Account 572 – Sylmar/Palo Verde
2) All Non-ISO O&M: Expenses that are not associated with O&M attributable to
assets and/or entitlements under the Operational Control of the ISO shall be allocated 0% to ISO O&M Expense. Such expenses are subject to the jurisdiction of the CPUC. The following accounts are All Non-ISO O&M:
i Account 565 – WAPA Transmission for Remote Service ii All Distribution O&M Accounts not listed as Dual Use O&M in Part 3.
below.
Southern California Edison Company FERC Electric Tariff, Third Revised Volume No. 6 _____________________________________________________________________________________________________
________________________________________________________________________________________________________ Tariff Record Proposed Effective Date: 01/01/2018
Version Number: 4.0.0 Option Code: A
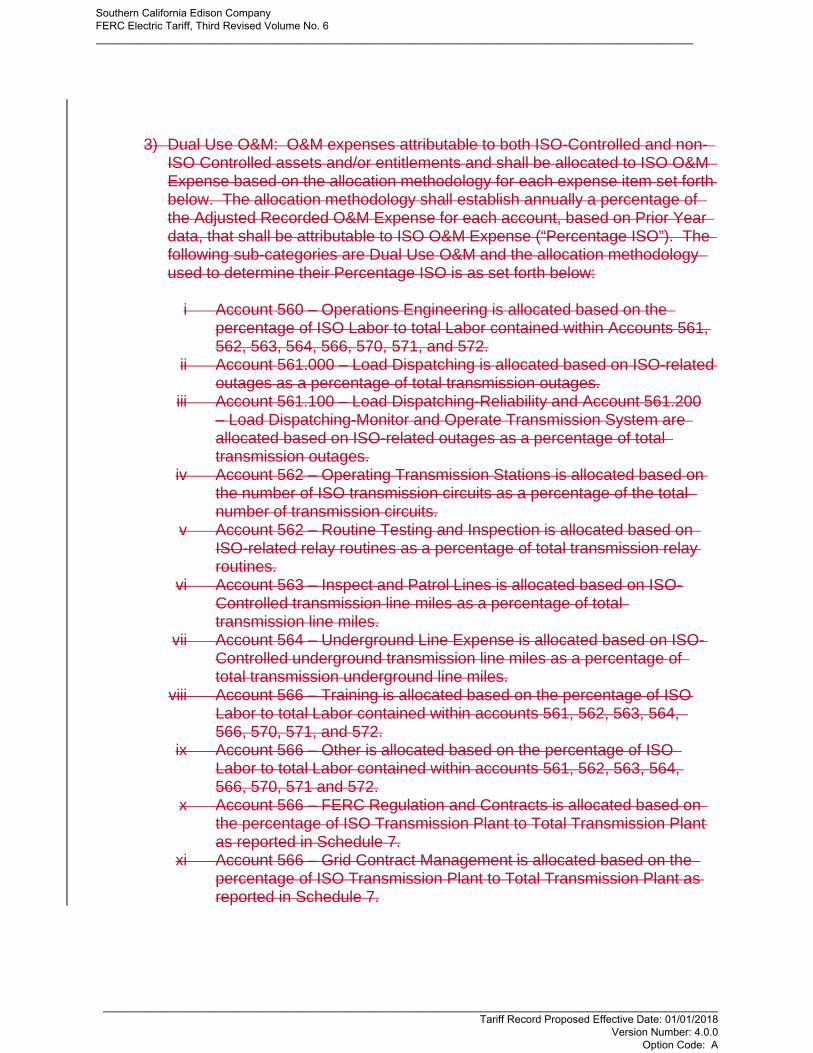
3) Dual Use O&M: O&M expenses attributable to both ISO-Controlled and non- ISO Controlled assets and/or entitlements and shall be allocated to ISO O&M Expense based on the allocation methodology for each expense item set forth below. The allocation methodology shall establish annually a percentage of the Adjusted Recorded O&M Expense for each account, based on Prior Year data, that shall be attributable to ISO O&M Expense (“Percentage ISO”). The following sub-categories are Dual Use O&M and the allocation methodology used to determine their Percentage ISO is as set forth below:
i Account 560 – Operations Engineering is allocated based on the
percentage of ISO Labor to total Labor contained within Accounts 561, 562, 563, 564, 566, 570, 571, and 572.
ii Account 561.000 – Load Dispatching is allocated based on ISO-related outages as a percentage of total transmission outages.
iii Account 561.100 – Load Dispatching-Reliability and Account 561.200 – Load Dispatching-Monitor and Operate Transmission System are allocated based on ISO-related outages as a percentage of total transmission outages.
iv Account 562 – Operating Transmission Stations is allocated based on the number of ISO transmission circuits as a percentage of the total number of transmission circuits.
v Account 562 – Routine Testing and Inspection is allocated based on ISO-related relay routines as a percentage of total transmission relay routines.
vi Account 563 – Inspect and Patrol Lines is allocated based on ISO- Controlled transmission line miles as a percentage of total transmission line miles.
vii Account 564 – Underground Line Expense is allocated based on ISO- Controlled underground transmission line miles as a percentage of total transmission underground line miles.
viii Account 566 – Training is allocated based on the percentage of ISO Labor to total Labor contained within accounts 561, 562, 563, 564, 566, 570, 571, and 572.
ix Account 566 – Other is allocated based on the percentage of ISO Labor to total Labor contained within accounts 561, 562, 563, 564, 566, 570, 571 and 572.
x Account 566 – FERC Regulation and Contracts is allocated based on the percentage of ISO Transmission Plant to Total Transmission Plant as reported in Schedule 7.
xi Account 566 – Grid Contract Management is allocated based on the percentage of ISO Transmission Plant to Total Transmission Plant as reported in Schedule 7.
Southern California Edison Company FERC Electric Tariff, Third Revised Volume No. 6 _____________________________________________________________________________________________________
________________________________________________________________________________________________________ Tariff Record Proposed Effective Date: 01/01/2018
Version Number: 4.0.0 Option Code: A
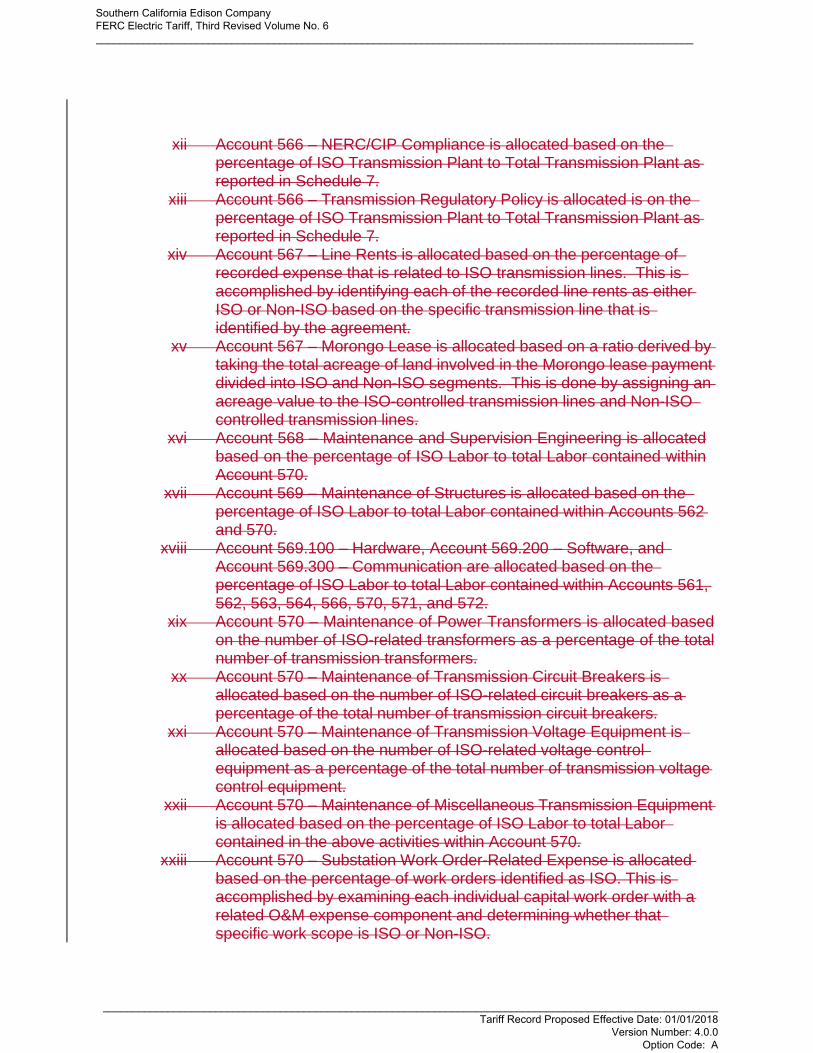
xii Account 566 – NERC/CIP Compliance is allocated based on the percentage of ISO Transmission Plant to Total Transmission Plant as reported in Schedule 7.
xiii Account 566 – Transmission Regulatory Policy is allocated is on the percentage of ISO Transmission Plant to Total Transmission Plant as reported in Schedule 7.
xiv Account 567 – Line Rents is allocated based on the percentage of recorded expense that is related to ISO transmission lines. This is accomplished by identifying each of the recorded line rents as either ISO or Non-ISO based on the specific transmission line that is identified by the agreement.
xv Account 567 – Morongo Lease is allocated based on a ratio derived by taking the total acreage of land involved in the Morongo lease payment divided into ISO and Non-ISO segments. This is done by assigning an acreage value to the ISO-controlled transmission lines and Non-ISO controlled transmission lines.
xvi Account 568 – Maintenance and Supervision Engineering is allocated based on the percentage of ISO Labor to total Labor contained within Account 570.
xvii Account 569 – Maintenance of Structures is allocated based on the percentage of ISO Labor to total Labor contained within Accounts 562 and 570.
xviii Account 569.100 – Hardware, Account 569.200 – Software, and Account 569.300 – Communication are allocated based on the percentage of ISO Labor to total Labor contained within Accounts 561, 562, 563, 564, 566, 570, 571, and 572.
xix Account 570 – Maintenance of Power Transformers is allocated based on the number of ISO-related transformers as a percentage of the total number of transmission transformers.
xx Account 570 – Maintenance of Transmission Circuit Breakers is allocated based on the number of ISO-related circuit breakers as a percentage of the total number of transmission circuit breakers.
xxi Account 570 – Maintenance of Transmission Voltage Equipment is allocated based on the number of ISO-related voltage control equipment as a percentage of the total number of transmission voltage control equipment.
xxii Account 570 – Maintenance of Miscellaneous Transmission Equipment is allocated based on the percentage of ISO Labor to total Labor contained in the above activities within Account 570.
xxiii Account 570 – Substation Work Order-Related Expense is allocated based on the percentage of work orders identified as ISO. This is accomplished by examining each individual capital work order with a related O&M expense component and determining whether that specific work scope is ISO or Non-ISO.
Southern California Edison Company FERC Electric Tariff, Third Revised Volume No. 6 _____________________________________________________________________________________________________
________________________________________________________________________________________________________ Tariff Record Proposed Effective Date: 01/01/2018
Version Number: 4.0.0 Option Code: A
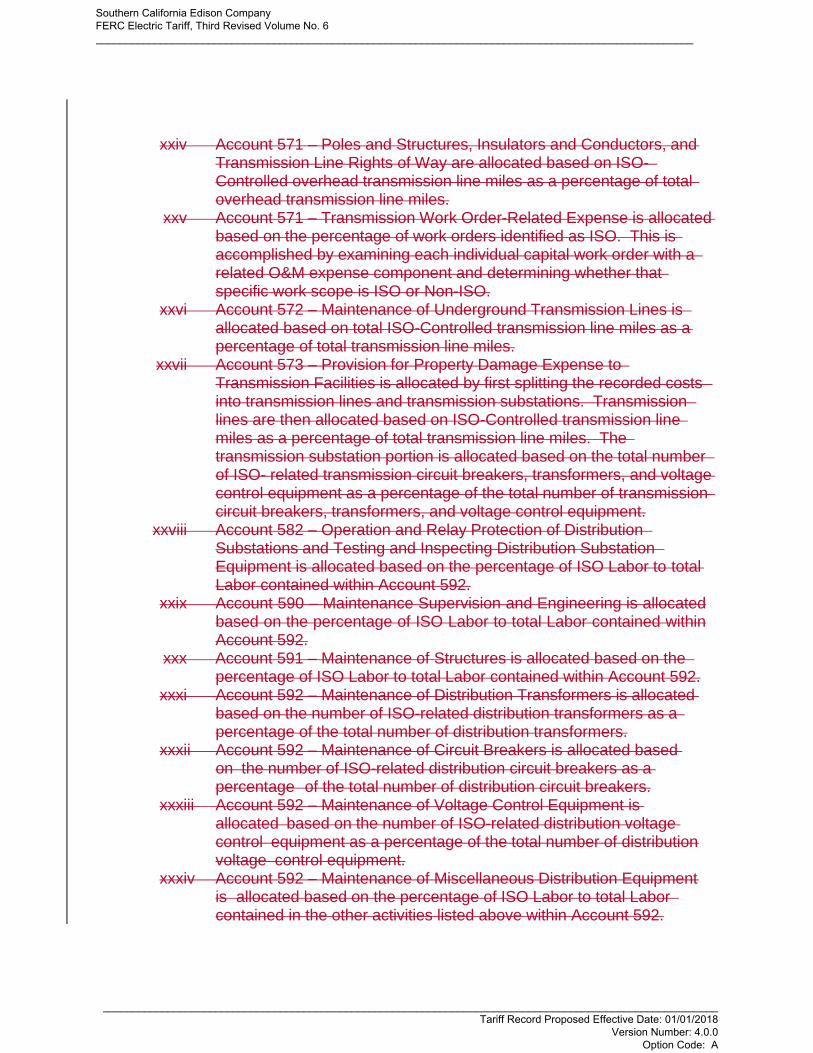
xxiv Account 571 – Poles and Structures, Insulators and Conductors, and Transmission Line Rights of Way are allocated based on ISO- Controlled overhead transmission line miles as a percentage of total overhead transmission line miles.
xxv Account 571 – Transmission Work Order-Related Expense is allocated based on the percentage of work orders identified as ISO. This is accomplished by examining each individual capital work order with a related O&M expense component and determining whether that specific work scope is ISO or Non-ISO.
xxvi Account 572 – Maintenance of Underground Transmission Lines is allocated based on total ISO-Controlled transmission line miles as a percentage of total transmission line miles.
xxvii Account 573 – Provision for Property Damage Expense to Transmission Facilities is allocated by first splitting the recorded costs into transmission lines and transmission substations. Transmission lines are then allocated based on ISO-Controlled transmission line miles as a percentage of total transmission line miles. The transmission substation portion is allocated based on the total number of ISO- related transmission circuit breakers, transformers, and voltage control equipment as a percentage of the total number of transmission circuit breakers, transformers, and voltage control equipment.
xxviii Account 582 – Operation and Relay Protection of Distribution Substations and Testing and Inspecting Distribution Substation Equipment is allocated based on the percentage of ISO Labor to total Labor contained within Account 592.
xxix Account 590 – Maintenance Supervision and Engineering is allocated based on the percentage of ISO Labor to total Labor contained within Account 592.
xxx Account 591 – Maintenance of Structures is allocated based on the percentage of ISO Labor to total Labor contained within Account 592.
xxxi Account 592 – Maintenance of Distribution Transformers is allocated based on the number of ISO-related distribution transformers as a percentage of the total number of distribution transformers.
xxxii Account 592 – Maintenance of Circuit Breakers is allocated based on the number of ISO-related distribution circuit breakers as a percentage of the total number of distribution circuit breakers.
xxxiii Account 592 – Maintenance of Voltage Control Equipment is allocated based on the number of ISO-related distribution voltage control equipment as a percentage of the total number of distribution voltage control equipment.
xxxiv Account 592 – Maintenance of Miscellaneous Distribution Equipment is allocated based on the percentage of ISO Labor to total Labor contained in the other activities listed above within Account 592.
Southern California Edison Company FERC Electric Tariff, Third Revised Volume No. 6 _____________________________________________________________________________________________________
________________________________________________________________________________________________________ Tariff Record Proposed Effective Date: 01/01/2018
Version Number: 4.0.0 Option Code: A
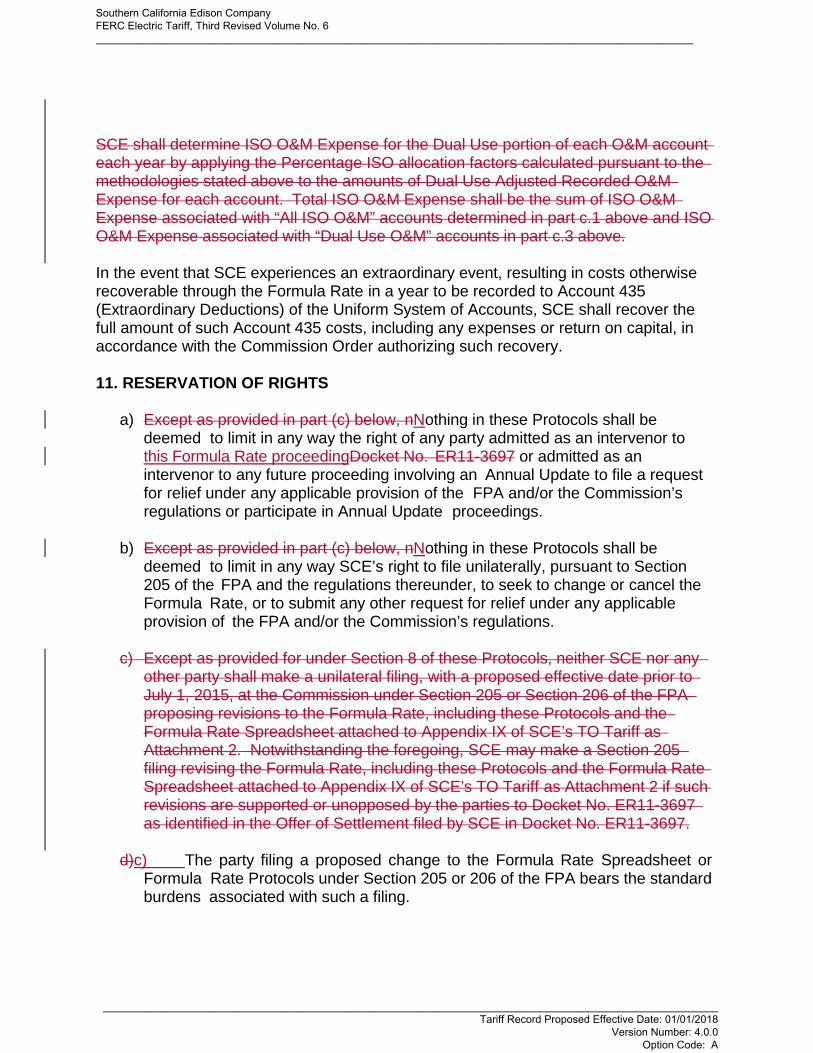
SCE shall determine ISO O&M Expense for the Dual Use portion of each O&M account each year by applying the Percentage ISO allocation factors calculated pursuant to the methodologies stated above to the amounts of Dual Use Adjusted Recorded O&M Expense for each account. Total ISO O&M Expense shall be the sum of ISO O&M Expense associated with “All ISO O&M” accounts determined in part c.1 above and ISO O&M Expense associated with “Dual Use O&M” accounts in part c.3 above.
In the event that SCE experiences an extraordinary event, resulting in costs otherwise recoverable through the Formula Rate in a year to be recorded to Account 435 (Extraordinary Deductions) of the Uniform System of Accounts, SCE shall recover the full amount of such Account 435 costs, including any expenses or return on capital, in accordance with the Commission Order authorizing such recovery.
11. RESERVATION OF RIGHTS
a) Except as provided in part (c) below, nNothing in these Protocols shall be
deemed to limit in any way the right of any party admitted as an intervenor to this Formula Rate proceedingDocket No. ER11-3697 or admitted as an intervenor to any future proceeding involving an Annual Update to file a request for relief under any applicable provision of the FPA and/or the Commission’s regulations or participate in Annual Update proceedings.
b) Except as provided in part (c) below, nNothing in these Protocols shall be
deemed to limit in any way SCE’s right to file unilaterally, pursuant to Section 205 of the FPA and the regulations thereunder, to seek to change or cancel the Formula Rate, or to submit any other request for relief under any applicable provision of the FPA and/or the Commission’s regulations.
c) Except as provided for under Section 8 of these Protocols, neither SCE nor any
other party shall make a unilateral filing, with a proposed effective date prior to July 1, 2015, at the Commission under Section 205 or Section 206 of the FPA proposing revisions to the Formula Rate, including these Protocols and the Formula Rate Spreadsheet attached to Appendix IX of SCE’s TO Tariff as Attachment 2. Notwithstanding the foregoing, SCE may make a Section 205 filing revising the Formula Rate, including these Protocols and the Formula Rate Spreadsheet attached to Appendix IX of SCE’s TO Tariff as Attachment 2 if such revisions are supported or unopposed by the parties to Docket No. ER11-3697 as identified in the Offer of Settlement filed by SCE in Docket No. ER11-3697.
d)c) The party filing a proposed change to the Formula Rate Spreadsheet or
Formula Rate Protocols under Section 205 or 206 of the FPA bears the standard burdens associated with such a filing.
Southern California Edison Company FERC Electric Tariff, Third Revised Volume No. 6 _____________________________________________________________________________________________________
________________________________________________________________________________________________________ Tariff Record Proposed Effective Date: 01/01/2018
Version Number: 4.0.0 Option Code: A
12. PERIODIC INFORMATIONAL SUBMITTALS
a) Quarterly Tracking Reports: On a quarterly basis, SCE shall provide Quarterly Tracking Reports to the CPUC and any other interested party that so requests. The Quarterly Tracking Reports will be accompanied by workpapers and supporting documentation as appropriate and shall provide:
1) Recorded in-service monthly transmission plant additions for ISO projects
with a total cost exceeding $3 million;
2) Reports on the status of CWIP projects, including any non-confidential information that SCE may have regarding any potential delays associated with such projects that have not been reported in previous Quarterly Tracking Reports; and
3) Identification of recorded ISO Transmission O&M costs for the FERC
subaccounts shown in Schedule 19 of the Formula Rate Spreadsheet for the quarter.
4) The Quarterly Tracking Reports will be provided on the following dates:
May 1, for the quarter ending March 31 August 1, for the quarter ending June 30 November 1, for the quarter ending September 30 February 1, for the quarter ending December 31
b) Transfer of Control Informational Submission: No later than December 1 of each
year that the Formula Rate remains in effect, SCE shall provide the CPUC, through a letter to the CPUC Energy Division, with a list of each transmission and distribution facility that has, in the course of the prior twelve months, changed Operational Control to or from the CAISO.
c) Transmission Capital Review (“Review”): SCE shall cooperate in an annual
review (“Review”) of its forecasted capital additions by the CPUC and, to aid the CPUC in such Review process, shall provide $ 275,000 per year in each of 2014, 2015, 2016 and 2017, which amounts will be recovered by SCE through the Base TRR. The first Review shall be in 2014. The Review will be conducted under Section 3 (c) of the Formula Rate Protocols, except that:
1) The CPUC may elect to utilize the services of a consultant or consultants to
conduct the Review, and if so, the CPUC will select one or more competent consultants by May 15 of each year. The consultant(s) shall have the appropriate professional background and experience to conduct the
Southern California Edison Company FERC Electric Tariff, Third Revised Volume No. 6 _____________________________________________________________________________________________________
________________________________________________________________________________________________________ Tariff Record Proposed Effective Date: 01/01/2018
Version Number: 4.0.0 Option Code: A
assessments of the type contemplated. The consultant(s) will contract directly with, and be paid by, SCE, provided, however, that no party hereto may argue that SCE has approved, agreed to or endorsed in any way either the consultant selected by the CPUC or any recommendations made or work product generated by such a consultant.
2) By June 1 each year, SCE shall provide to the consultant(s) a list of all
projects estimated to cost $3,000,000 or more that are projected to go into service during the current, and the two subsequent, calendar years.
3) The CPUC, in consultation with the selected consultant(s), will select the
individual projects to be reviewed, but SCE will have no payment responsibility for the Review work in a particular year beyond the amounts specified above. Projects that have previously received a CPCN shall not be eligible for the Review.
4) Over the course of the Review, the consultant(s) may submit to SCE
Information Requests, in accordance with the provisions set forth in the Protocols, regarding the selected projects.
5) By October 1 each year, the consultant(s) may provide recommendations to
SCE and the CPUC with respect to the proposed capital projects, which recommendations SCE may accept or elect not to implement, in its discretion.
6) The consultant may also participate in the CAISO annual planning process.
13.12. USE OF INFORMATION
Information produced pursuant to these Protocols may be used in any proceeding concerning the Formula Rate Spreadsheet, the Protocols, or the Annual Update; provided, however, that to the extent that any information provided pursuant to these Protocols has been designated and provided as Protected Materials, subject to the provisions of Exhibit A to these Protocols, the use of such information shall be governed by Exhibit A.
This section shall not apply to any information produced in the course of Commission- established settlement proceedings pursuant to the Commission’s rules and regulations governing settlement.
Southern California Edison Company FERC Electric Tariff, Third Revised Volume No. 6 _____________________________________________________________________________________________________
________________________________________________________________________________________________________ Tariff Record Proposed Effective Date: 01/01/2018
Version Number: 4.0.0 Option Code: A
EXHIBIT A
UNITED STATES OF AMERICA FEDERAL ENERGY REGULATORY COMMISSION
PROTECTIVE ORDER APPLICABLE TO INFORMATION PRODUCED BY SOUTHERN CALIFORNIA EDISON COMPANY PURSUANT TO THE FORMULA RATE PROTOCOLS
1. This Exhibit (hereinafter referred to as the “Protective Order”) shall govern the use of all Protected Materials produced by, or on behalf of, Southern California Edison Company (“SCE”) pursuant to the SCE Formula Rate Protocols.
2. This Protective Order applies to the following two categories of materials: (A) A Participant may designate as protected those materials which customarily are treated by that Participant as sensitive or proprietary, which are not available to the public, and which, if disclosed freely, would subject that Participant or its customers to risk of competitive disadvantage or other business injury; and (B) A Participant shall designate as protected those materials which contain critical energy infrastructure information, as defined in 18 CFR§ 388.113(c)(1) ("Critical Energy Infrastructure Information").
3. Definitions -- For purposes of this Order:
(a) The term "Participant" shall mean a Participant as defined in 18 CFR
§ 385.102(b).
(b) (1) The term "Protected Materials" means (A) materials (including depositions) provided by a Participant in response to discovery requests and designated by such Participant as protected; (B) any information contained in or obtained from such designated materials; (C) any other materials which are made subject to this Protective Order by the Presiding Administrative Law Judge appointed upon the Annual Update being set for hearing and/or settlement procedures or by the Discovery Master appointed pursuant to the Formula Rate Protocols (both referred to herein as the “Presiding Judge”), by the Commission, by any court or other body having appropriate authority, or by agreement of the Participants; (D) notes of Protected Materials; and (E) copies of Protected Materials. The Participant producing the Protected Materials shall physically
Southern California Edison Company FERC Electric Tariff, Third Revised Volume No. 6 _____________________________________________________________________________________________________
________________________________________________________________________________________________________ Tariff Record Proposed Effective Date: 01/01/2018
Version Number: 4.0.0 Option Code: A

mark them on each page as "PROTECTED MATERIALS" or with words of similar import as long as the term "Protected Materials" is included in that designation to indicate that they are Protected Materials. If the Protected Materials contain Critical Energy Infrastructure Information, the Participant producing such information shall additionally mark on each page containing such information the words "Contains Critical Energy Infrastructure Information B Do Not Release".
(2) The term "Notes of Protected Materials" means memoranda, handwritten
notes, or any other form of information (including electronic form) which copies or discloses materials described in Paragraph 3(b)(1). Notes of Protected Materials are subject to the same restrictions provided in this order for Protected Materials except as specifically provided in this order.
(3) Protected Materials shall not include (A) any information or document that has
been filed with and accepted into the public files of the Commission, or contained in the public files of any other federal or state agency, or any federal or state court, unless the information or document has been determined to be protected by such agency or court, or (B) information that is public knowledge, or which becomes public knowledge, other than through disclosure in violation of this Protective Order. Protected Materials do include any information or document contained in the files of the Commission that has been designated as Critical Energy Infrastructure Information.
(c) The term "Non-Disclosure Certificate" shall mean the certificate annexed
hereto by which Participants who have been granted access to Protected Materials shall certify their understanding that such access to Protected Materials is provided pursuant to the terms and restrictions of this Protective Order, and that such Participants have read the Protective Order and agree to be bound by it. All Non-Disclosure Certificates shall be served on all parties on the Service List, as defined in the SCE Formula Rate Protocols.
(d) The term "Reviewing Representative" shall mean a person who has signed a
Non-Disclosure Certificate and who is:
(1) Commission Trial Staff;
(2) an attorney who has made an appearance for a Participant;
(3) attorneys, paralegals, and other employees associated with an attorney described in Subparagraph (2);
Southern California Edison Company FERC Electric Tariff, Third Revised Volume No. 6 _____________________________________________________________________________________________________
________________________________________________________________________________________________________ Tariff Record Proposed Effective Date: 01/01/2018
Version Number: 4.0.0 Option Code: A

(4) an expert or an employee of an expert retained by a Participant for the purpose of advising, preparing for or testifying in connection with the Annual Update for which the information was requested;
(5) a person designated as a Reviewing Representative by order of the Presiding
Judge or the Commission; or
(6) employees or other representatives of Participants with significant responsibility for SCE’s Formula Rate.
4. Protected Materials shall be made available under the terms of this Protective Order only to Participants and only through their Reviewing Representatives as provided in Paragraphs 7-9.
5. Protected Materials shall remain available to Participants until the date that any Commission proceeding relating to the Protected Material is concluded and no longer subject to judicial review. If requested to do so in writing after that date, the Participants shall, within fifteen days of such request, return the Protected Materials (excluding Notes of Protected Materials) to the Participant that produced them, or shall destroy the materials, except that copies of filings, official transcripts and exhibits in this proceeding that contain Protected Materials, and Notes of Protected Material may be retained, if they are maintained in accordance with Paragraph 6, below. Within such time period each Participant, if requested to do so, shall also submit to the producing Participant an affidavit stating that, to the best of its knowledge, all Protected Materials and all Notes of Protected Materials have been returned or have been destroyed or will be maintained in accordance with Paragraph 6. To the extent Protected Materials are not returned or destroyed, they shall remain subject to the Protective Order.
6. All Protected Materials shall be maintained by the Participant in a secure place. Access to those materials shall be limited to those Reviewing Representatives specifically authorized pursuant to Paragraphs 8-9. The Secretary shall place any Protected Materials filed with the Commission in a non-public file. By placing such documents in a non- public file, the Commission is not making a determination of any claim of privilege. The Commission retains the right to make determinations regarding any claim of privilege and the discretion to release information necessary to carry out its jurisdictional responsibilities. For documents submitted to Commission Trial Staff ("Staff"), Staff shall follow the notification procedures of 18 CFR § 388.112 before making public any Protected Materials.
7. Protected Materials shall be treated as confidential by each Participant and by the Reviewing Representative in accordance with the certificate executed pursuant to
Southern California Edison Company FERC Electric Tariff, Third Revised Volume No. 6 _____________________________________________________________________________________________________
________________________________________________________________________________________________________ Tariff Record Proposed Effective Date: 01/01/2018
Version Number: 4.0.0 Option Code: A

Paragraph 9. Protected Materials shall not be used except as necessary under SCE’s Formula Rate Protocols, nor shall they be disclosed in any manner to any person except a Reviewing Representative who is engaged in working on SCE’s Annual Update for which the information was requested and who needs to know the information in order to carry out such responsibilities. Reviewing Representatives may make copies of Protected Materials, but such copies become Protected Materials. Reviewing Representatives may make notes of Protected Materials, which shall be treated as Notes of Protected Materials if they disclose the contents of Protected Materials.
8. (a) If a Reviewing Representative's scope of employment includes the marketing of energy, the direct supervision of any employee or employees whose duties include the marketing of energy, the provision of consulting services to any person whose duties include the marketing of energy, or the direct supervision of any employee or employees whose duties include the marketing of energy, such Reviewing Representative may not use information contained in any Protected Materials obtained under SCE’s Formula Rate Protocols to give any Participant or any competitor of any Participant a commercial advantage.
(b) In the event that a Participant wishes to designate as a Reviewing
Representative a person not described in Paragraph 3 (d) above, the Participant shall seek agreement from the Participant providing the Protected Materials. If an agreement is reached that person shall be a Reviewing Representative pursuant to Paragraphs 3(d) above with respect to those materials. If no agreement is reached, the Participant shall submit the disputed designation to the Presiding Judge for resolution.
9. (a) A Reviewing Representative shall not be permitted to inspect, participate in discussions regarding, or otherwise be permitted access to Protected Materials pursuant to this Protective Order unless that Reviewing Representative has first executed a Non- Disclosure Certificate; provided, that if an attorney qualified as a Reviewing Representative has executed such a certificate, the paralegals, secretarial and clerical personnel under the attorney’s instruction, supervision or control need not do so. A copy of each Non-Disclosure Certificate shall be provided to counsel for the Participant asserting confidentiality prior to disclosure of any Protected Material to that Reviewing Representative.
(b) Attorneys qualified as Reviewing Representatives are responsible for ensuring
that persons under their supervision or control comply with this order.
Southern California Edison Company FERC Electric Tariff, Third Revised Volume No. 6 _____________________________________________________________________________________________________
________________________________________________________________________________________________________ Tariff Record Proposed Effective Date: 01/01/2018
Version Number: 4.0.0 Option Code: A
10. Any Reviewing Representative may disclose Protected Materials to any other Reviewing Representative as long as the disclosing Reviewing Representative and the receiving Reviewing Representative both have executed a Non-Disclosure Certificate. In the event that any Reviewing Representative to whom the Protected Materials are disclosed ceases to be engaged in working on the Annual Update, as set forth above, or is employed or retained for a position whose occupant is not qualified to be a Reviewing Representative under Paragraph 3(d), access to Protected Materials by that person shall be terminated. Even if no longer engaged in this proceeding, every person who has executed a Non- Disclosure Certificate shall continue to be bound by the provisions of this Protective Order and the certification.
11. Subject to Paragraph 18, the Presiding Administrative Law Judge shall resolve any disputes arising under this Protective Order. Prior to presenting any dispute under this Protective Order to the Presiding Administrative Law Judge, the parties to the dispute shall use their best efforts to resolve it. Any participant that contests the designation of materials as protected shall notify the party that provided the protected materials by specifying in writing the materials the designation of which is contested. This Protective Order shall automatically cease to apply to such materials five (5) business days after the notification is made unless the designator, within said 5-day period, files a motion with the Presiding Administrative Law Judge, with supporting affidavits, demonstrating that the materials should continue to be protected. In any challenge to the designation of materials as protected, the burden of proof shall be on the participant seeking protection. If the Presiding Administrative Law Judge finds that the materials at issue are not entitled to protection, the procedures of Paragraph 18 shall apply. The procedures described above shall not apply to protected materials designated by a Participant as Critical Energy Infrastructure Information. Materials so designated shall remain protected and subject to the provisions of this Protective Order, unless a Participant requests and obtains a determination from the Commission's Critical Energy Infrastructure Information Coordinator that such materials need not remain protected.
12. All copies of all documents reflecting Protected Materials, including the portion of the hearing testimony, exhibits, transcripts, briefs and other documents which refer to Protected Materials, shall be filed and served in sealed envelopes or other appropriate containers endorsed to the effect that they are sealed pursuant to this Protective Order. Such documents shall be marked "PROTECTED MATERIALS" and shall be filed under seal and served under seal upon the Presiding Judge and all Reviewing Representatives who are on the service list. Such documents containing Critical Energy Infrastructure Information shall be additionally marked "Contains Critical Energy Infrastructure Information - Do Not Release". For anything filed under seal, redacted versions or, where an entire
Southern California Edison Company FERC Electric Tariff, Third Revised Volume No. 6 _____________________________________________________________________________________________________
________________________________________________________________________________________________________ Tariff Record Proposed Effective Date: 01/01/2018
Version Number: 4.0.0 Option Code: A
document is protected, a letter indicating such, will also be filed with the Commission and served on all parties on the service list and the Presiding Judge. Counsel for the producing Participant shall provide to all Participants who request the same, a list of Reviewing Representatives who are entitled to receive such material. Counsel shall take all reasonable precautions necessary to assure that Protected Materials are not distributed to unauthorized persons.
13. If any Participant desires to include, utilize or refer to any Protected Materials or information derived therefrom in testimony or exhibits during a hearing under the SCE Formula Rate Protocols in such a manner that might require disclosure of such material to persons other than reviewing representatives, such participant shall first notify both counsel for the disclosing participant and the Presiding Judge of such desire, identifying with particularity each of the Protected Materials. Thereafter, use of such Protected Material will be governed by procedures determined by the Presiding Judge.
14. Nothing in this Protective Order shall be construed as precluding any Participant from objecting to the use of Protected Materials on any legal grounds.
15. Nothing in this Protective Order shall preclude any Participant from requesting the Presiding Judge, the Commission, or any other body having appropriate authority, to find that this Protective Order should not apply to all or any materials previously designated as Protected Materials pursuant to this Protective Order. The Presiding Judge may alter or amend this Protective Order as circumstances warrant at any time during the course of this proceeding.
16. Each party governed by this Protective Order has the right to seek changes in it as appropriate from the Presiding Judge or the Commission.
17. All Protected Materials filed with the Commission, the Presiding Judge, or any other judicial or administrative body, in support of, or as a part of, a motion, other pleading, brief, or other document, shall be filed and served in sealed envelopes or other appropriate containers bearing prominent markings indicating that the contents include Protected Materials subject to this Protective Order. Such documents containing Critical Energy Infrastructure Information shall be additionally marked “Contains Critical Energy Infrastructure Information – Do Not Release.”
18. If the Presiding Judge finds at any time in the course of a proceeding that all or part of the Protected Materials need not be protected, those materials shall, nevertheless, be subject to the protection afforded by this Protective Order for three (3) business days from the date of issuance of the Presiding Judge's determination, and if the Participant seeking protection files an interlocutory
Southern California Edison Company FERC Electric Tariff, Third Revised Volume No. 6 _____________________________________________________________________________________________________
________________________________________________________________________________________________________ Tariff Record Proposed Effective Date: 01/01/2018
Version Number: 4.0.0 Option Code: A
appeal or requests that the issue be certified to the Commission, for an additional seven (7) business days. None of the Participants waives its rights to seek additional administrative or judicial remedies after the Presiding Judge's decision respecting Protected Materials or Reviewing Representatives, or the Commission's denial of any appeal thereof. The provisions of 18 CFR §§ 388.112 and 388.113 shall apply to any requests under the Freedom of Information Act. (5 U.S.C. § 552) for Protected Materials in the files of the Commission.
19. Nothing in this Protective Order shall be deemed to preclude any Participant from independently seeking through discovery in any other administrative or judicial proceeding information or materials produced under the SCE Formula Rate Protocols under this Protective Order.
20. None of the Participants waives the right to pursue any other legal or equitable remedies that may be available in the event of actual or anticipated disclosure of Protected Materials.
21. The contents of Protected Materials or any other form of information that copies or discloses Protected Materials shall not be disclosed to anyone other than in accordance with this Protective Order and shall be used only in connection with this (these) proceeding(s). Any violation of this Protective Order and of any Non- Disclosure Certificate executed hereunder shall constitute a violation of an order of the Commission.
Southern California Edison Company FERC Electric Tariff, Third Revised Volume No. 6 _____________________________________________________________________________________________________
________________________________________________________________________________________________________ Tariff Record Proposed Effective Date: 01/01/2018
Version Number: 4.0.0 Option Code: A
UNITEDSTATESOFAMERICAFEDERALENERGYREGULATORYCOMMISSIONNON‐DISCLOSURECERTIFICATEI hereby certify my understanding that access to Protected Materials is provided to me pursuant to the terms and restrictions of the Protective Order under the Southern California Edison Formula Rate Protocols, that I have been given a copy of and have read the Protective Order, and that I agree to be bound by it. I understand that the contents of the Protected Materials, any notes or other memoranda, or any other form of information that copies or discloses Protected Materials shall not be disclosed to anyone other than in accordance with that Protective Order. I acknowledge that a violation of this certificate constitutes a violation of an order of the Federal Energy Regulatory Commission.
By: Printed Name: Title: Representing: _ Date:
Southern California Edison Company FERC Electric Tariff, Third Revised Volume No. 6 _____________________________________________________________________________________________________
________________________________________________________________________________________________________ Tariff Record Proposed Effective Date: 01/01/2018
Version Number: 4.0.0 Option Code: A
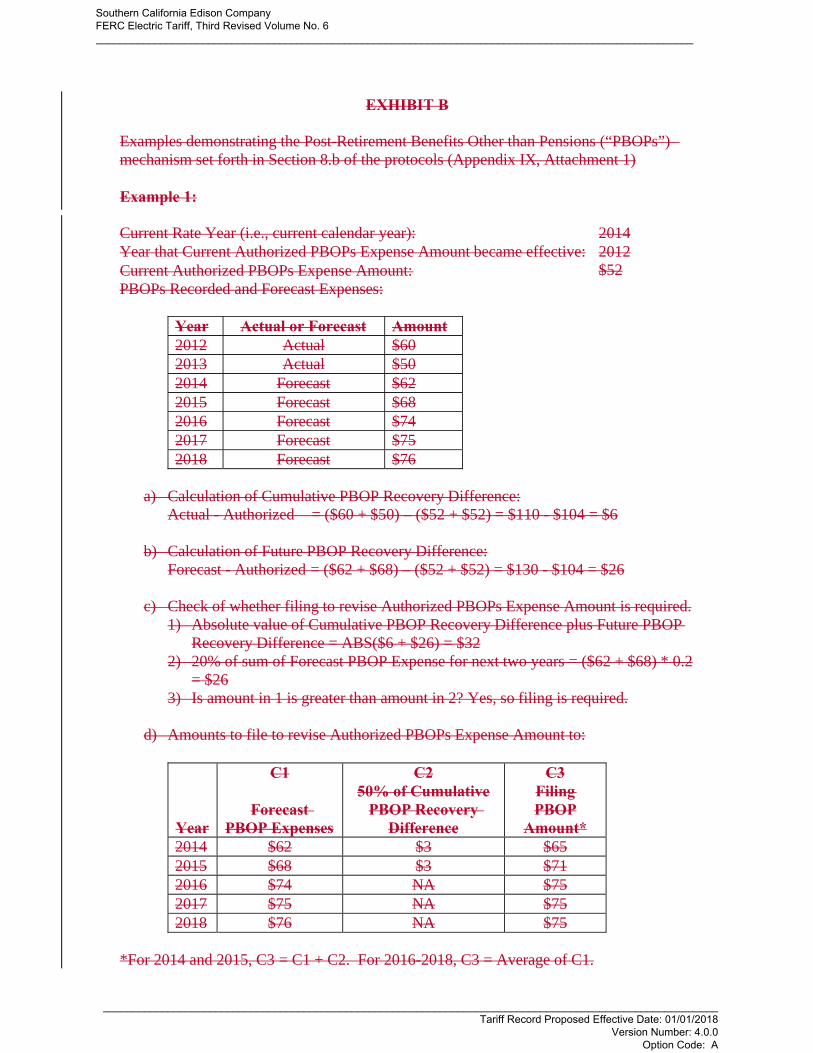
EXHIBIT B
Examples demonstrating the Post-Retirement Benefits Other than Pensions (“PBOPs”) mechanism set forth in Section 8.b of the protocols (Appendix IX, Attachment 1)
Example 1:
Current Rate Year (i.e., current calendar year): 2014 Year that Current Authorized PBOPs Expense Amount became effective: 2012 Current Authorized PBOPs Expense Amount: PBOPs Recorded and Forecast Expenses:
$52
Year Actual or Forecast Amount 2012 Actual $602013 Actual $502014 Forecast $62 2015 Forecast $682016 Forecast $742017 Forecast $752018 Forecast $76
a) Calculation of Cumulative PBOP Recovery Difference: Actual - Authorized = ($60 + $50) – ($52 + $52) = $110 - $104 = $6
b) Calculation of Future PBOP Recovery Difference:
Forecast - Authorized = ($62 + $68) – ($52 + $52) = $130 - $104 = $26
c) Check of whether filing to revise Authorized PBOPs Expense Amount is required. 1) Absolute value of Cumulative PBOP Recovery Difference plus Future PBOP
Recovery Difference = ABS($6 + $26) = $32 2) 20% of sum of Forecast PBOP Expense for next two years = ($62 + $68) * 0.2
= $26 3) Is amount in 1 is greater than amount in 2? Yes, so filing is required.
d) Amounts to file to revise Authorized PBOPs Expense Amount to:
Year
C1
Forecast PBOP Expenses
C2 50% of Cumulative
PBOP Recovery Difference
C3 Filing PBOP
Amount* 2014 $62 $3 $652015 $68 $3 $71 2016 $74 NA $752017 $75 NA $752018 $76 NA $75
*For 2014 and 2015, C3 = C1 + C2. For 2016-2018, C3 = Average of C1.
Southern California Edison Company FERC Electric Tariff, Third Revised Volume No. 6 _____________________________________________________________________________________________________
________________________________________________________________________________________________________ Tariff Record Proposed Effective Date: 01/01/2018
Version Number: 4.0.0 Option Code: A
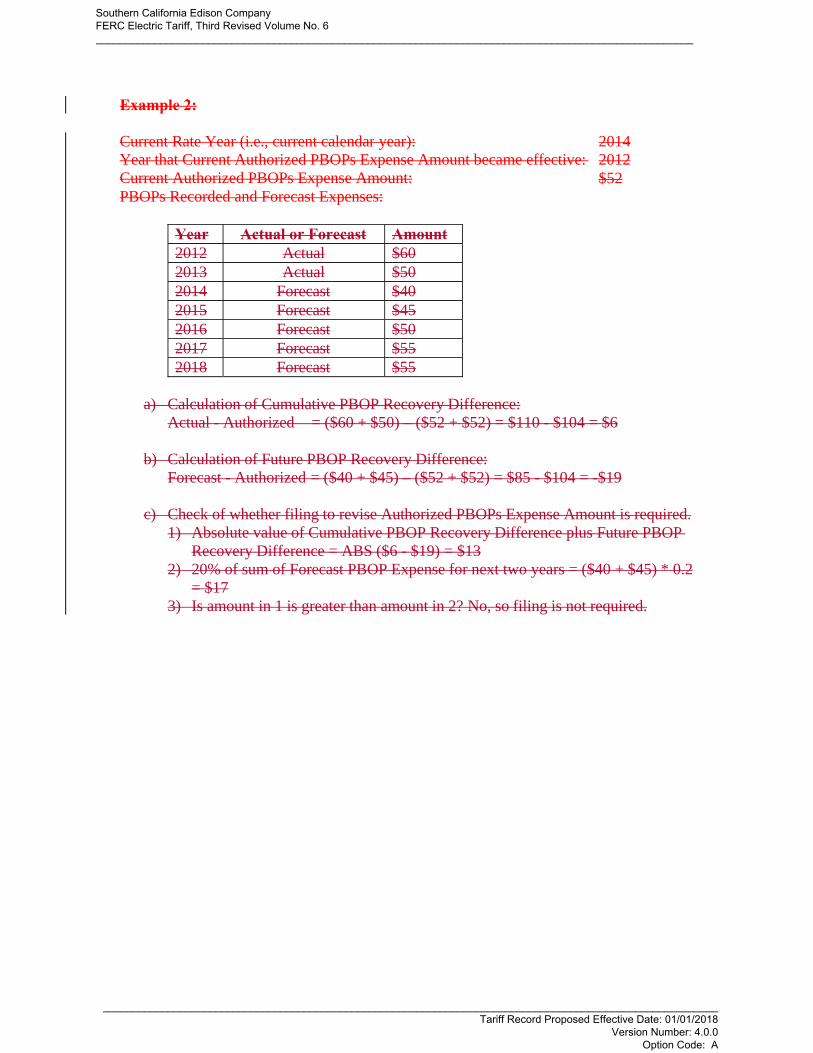
Example 2:
Current Rate Year (i.e., current calendar year):Year that Current Authorized PBOPs Expense Amount became effective: Current Authorized PBOPs Expense Amount: PBOPs Recorded and Forecast Expenses:
2014 2012 $52
Year Actual or Forecast Amount 2012 Actual $602013 Actual $502014 Forecast $40 2015 Forecast $452016 Forecast $502017 Forecast $552018 Forecast $55
a) Calculation of Cumulative PBOP Recovery Difference: Actual - Authorized = ($60 + $50) – ($52 + $52) = $110 - $104 = $6
b) Calculation of Future PBOP Recovery Difference:
Forecast - Authorized = ($40 + $45) – ($52 + $52) = $85 - $104 = -$19
c) Check of whether filing to revise Authorized PBOPs Expense Amount is required. 1) Absolute value of Cumulative PBOP Recovery Difference plus Future PBOP
Recovery Difference = ABS ($6 - $19) = $13 2) 20% of sum of Forecast PBOP Expense for next two years = ($40 + $45) * 0.2
= $17 3) Is amount in 1 is greater than amount in 2? No, so filing is not required.
Southern California Edison Company FERC Electric Tariff, Third Revised Volume No. 6 _____________________________________________________________________________________________________
________________________________________________________________________________________________________ Tariff Record Proposed Effective Date: 01/01/2018
Version Number: 4.0.0 Option Code: A
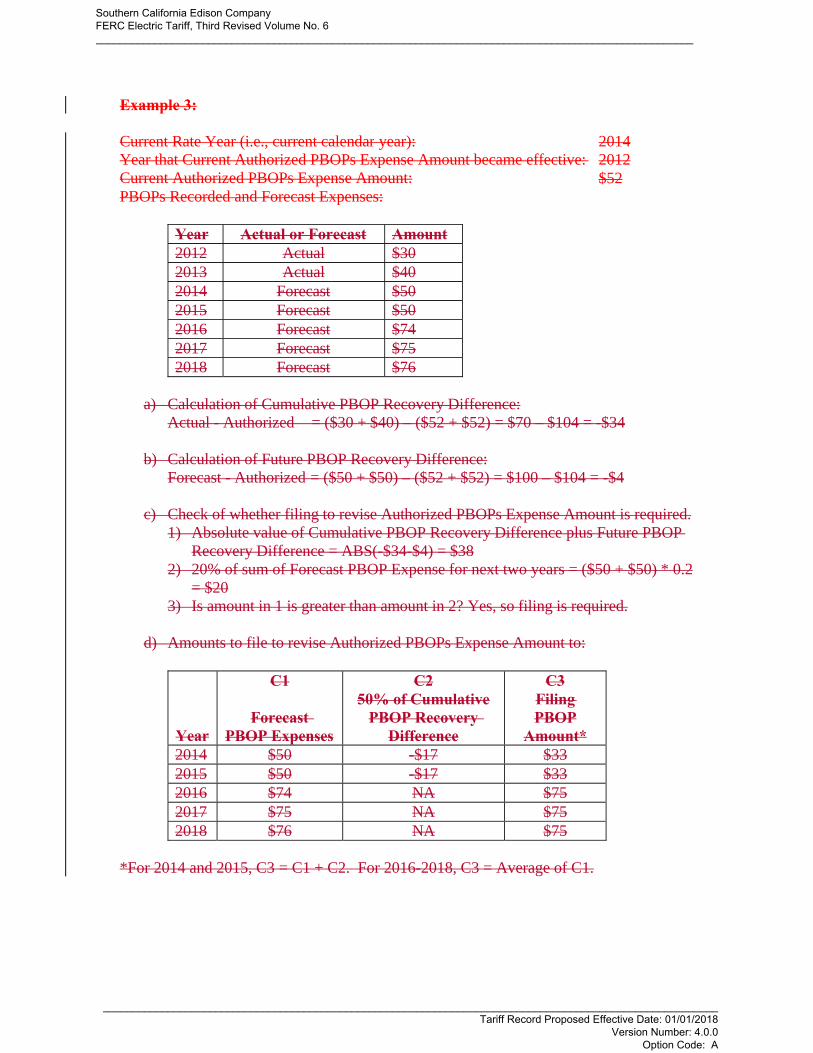
Example 3:
Current Rate Year (i.e., current calendar year):Year that Current Authorized PBOPs Expense Amount became effective: Current Authorized PBOPs Expense Amount: PBOPs Recorded and Forecast Expenses:
2014 2012 $52
Year Actual or Forecast Amount 2012 Actual $302013 Actual $402014 Forecast $50 2015 Forecast $502016 Forecast $742017 Forecast $752018 Forecast $76
a) Calculation of Cumulative PBOP Recovery Difference: Actual - Authorized = ($30 + $40) – ($52 + $52) = $70 – $104 = -$34
b) Calculation of Future PBOP Recovery Difference:
Forecast - Authorized = ($50 + $50) – ($52 + $52) = $100 – $104 = -$4
c) Check of whether filing to revise Authorized PBOPs Expense Amount is required. 1) Absolute value of Cumulative PBOP Recovery Difference plus Future PBOP
Recovery Difference = ABS(-$34-$4) = $38 2) 20% of sum of Forecast PBOP Expense for next two years = ($50 + $50) * 0.2
= $20 3) Is amount in 1 is greater than amount in 2? Yes, so filing is required.
d) Amounts to file to revise Authorized PBOPs Expense Amount to:
Year
C1
Forecast PBOP Expenses
C2 50% of Cumulative
PBOP Recovery Difference
C3 Filing PBOP
Amount* 2014 $50 -$17 $332015 $50 -$17 $33 2016 $74 NA $752017 $75 NA $752018 $76 NA $75
*For 2014 and 2015, C3 = C1 + C2. For 2016-2018, C3 = Average of C1.
Southern California Edison Company FERC Electric Tariff, Third Revised Volume No. 6 _____________________________________________________________________________________________________
________________________________________________________________________________________________________ Tariff Record Proposed Effective Date: 01/01/2018
Version Number: 4.0.0 Option Code: A

Attachment 2 to Appendix IX
Formula Rate Spreadsheet
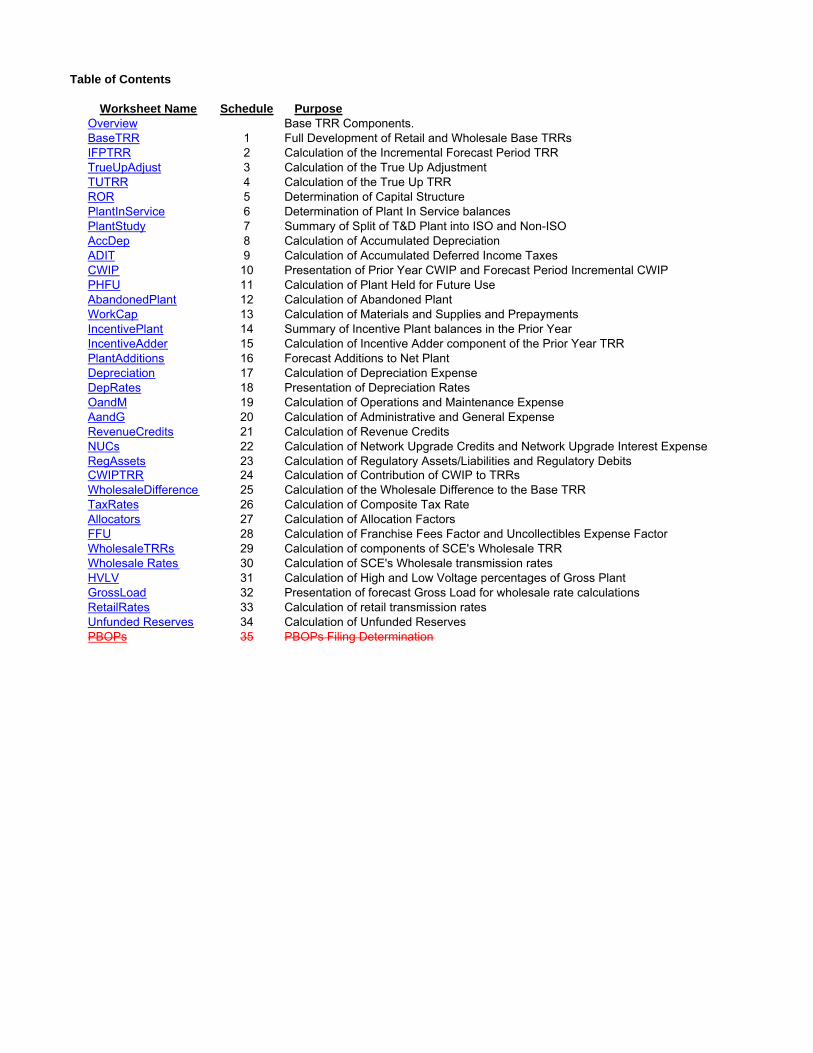
Table of Contents
Worksheet Name Schedule Purpose
Overview Base TRR Components.BaseTRR 1 Full Development of Retail and Wholesale Base TRRsIFPTRR 2 Calculation of the Incremental Forecast Period TRRTrueUpAdjust 3 Calculation of the True Up AdjustmentTUTRR 4 Calculation of the True Up TRRROR 5 Determination of Capital StructurePlantInService 6 Determination of Plant In Service balances PlantStudy 7 Summary of Split of T&D Plant into ISO and Non-ISOAccDep 8 Calculation of Accumulated DepreciationADIT 9 Calculation of Accumulated Deferred Income TaxesCWIP 10 Presentation of Prior Year CWIP and Forecast Period Incremental CWIPPHFU 11 Calculation of Plant Held for Future UseAbandonedPlant 12 Calculation of Abandoned PlantWorkCap 13 Calculation of Materials and Supplies and Prepayments IncentivePlant 14 Summary of Incentive Plant balances in the Prior YearIncentiveAdder 15 Calculation of Incentive Adder component of the Prior Year TRRPlantAdditions 16 Forecast Additions to Net PlantDepreciation 17 Calculation of Depreciation ExpenseDepRates 18 Presentation of Depreciation RatesOandM 19 Calculation of Operations and Maintenance ExpenseAandG 20 Calculation of Administrative and General ExpenseRevenueCredits 21 Calculation of Revenue CreditsNUCs 22 Calculation of Network Upgrade Credits and Network Upgrade Interest ExpenseRegAssets 23 Calculation of Regulatory Assets/Liabilities and Regulatory DebitsCWIPTRR 24 Calculation of Contribution of CWIP to TRRsWholesaleDifference 25 Calculation of the Wholesale Difference to the Base TRRTaxRates 26 Calculation of Composite Tax RateAllocators 27 Calculation of Allocation FactorsFFU 28 Calculation of Franchise Fees Factor and Uncollectibles Expense FactorWholesaleTRRs 29 Calculation of components of SCE's Wholesale TRRWholesale Rates 30 Calculation of SCE's Wholesale transmission ratesHVLV 31 Calculation of High and Low Voltage percentages of Gross PlantGrossLoad 32 Presentation of forecast Gross Load for wholesale rate calculationsRetailRates 33 Calculation of retail transmission ratesUnfunded Reserves 34 Calculation of Unfunded ReservesPBOPs 35 PBOPs Filing Determination
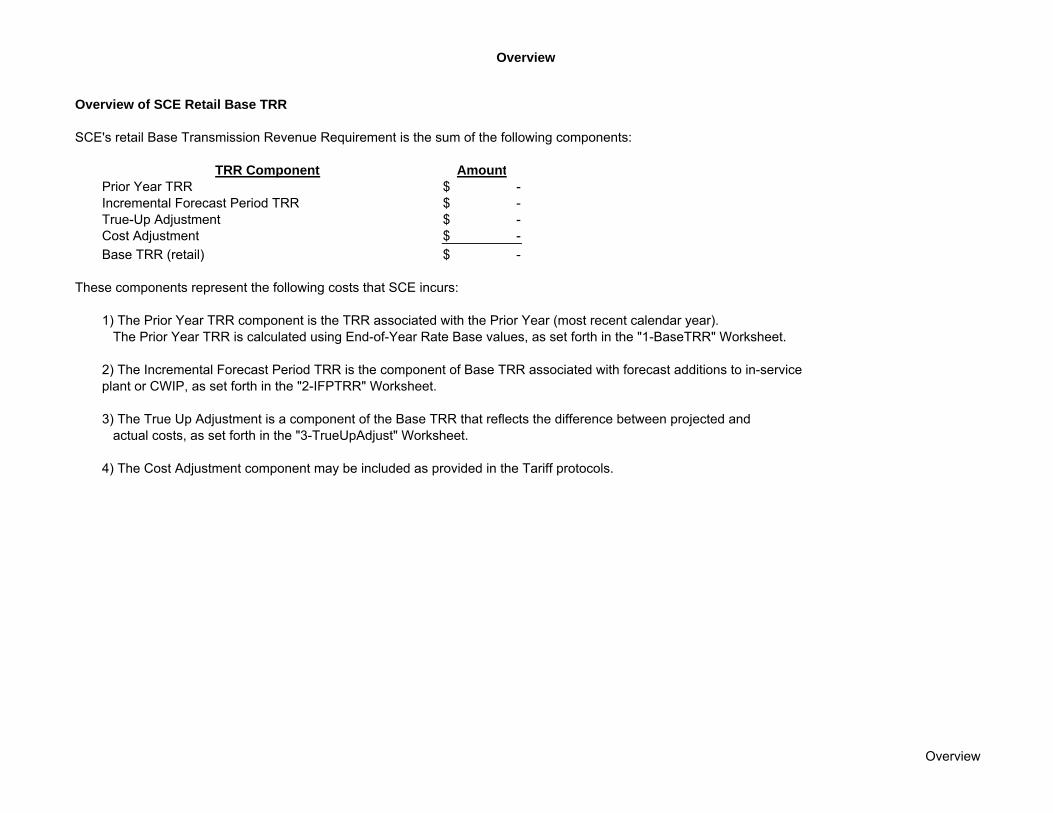
Overview
Overview of SCE Retail Base TRR
SCE's retail Base Transmission Revenue Requirement is the sum of the following components:
TRR Component Amount
Prior Year TRR -$ Incremental Forecast Period TRR -$ True-Up Adjustment -$ Cost Adjustment -$
Base TRR (retail) -$
These components represent the following costs that SCE incurs:
1) The Prior Year TRR component is the TRR associated with the Prior Year (most recent calendar year). The Prior Year TRR is calculated using End-of-Year Rate Base values, as set forth in the "1-BaseTRR" Worksheet.
2) The Incremental Forecast Period TRR is the component of Base TRR associated with forecast additions to in-serviceplant or CWIP, as set forth in the "2-IFPTRR" Worksheet.
3) The True Up Adjustment is a component of the Base TRR that reflects the difference between projected andactual costs, as set forth in the "3-TrueUpAdjust" Worksheet.
4) The Cost Adjustment component may be included as provided in the Tariff protocols.
Overview
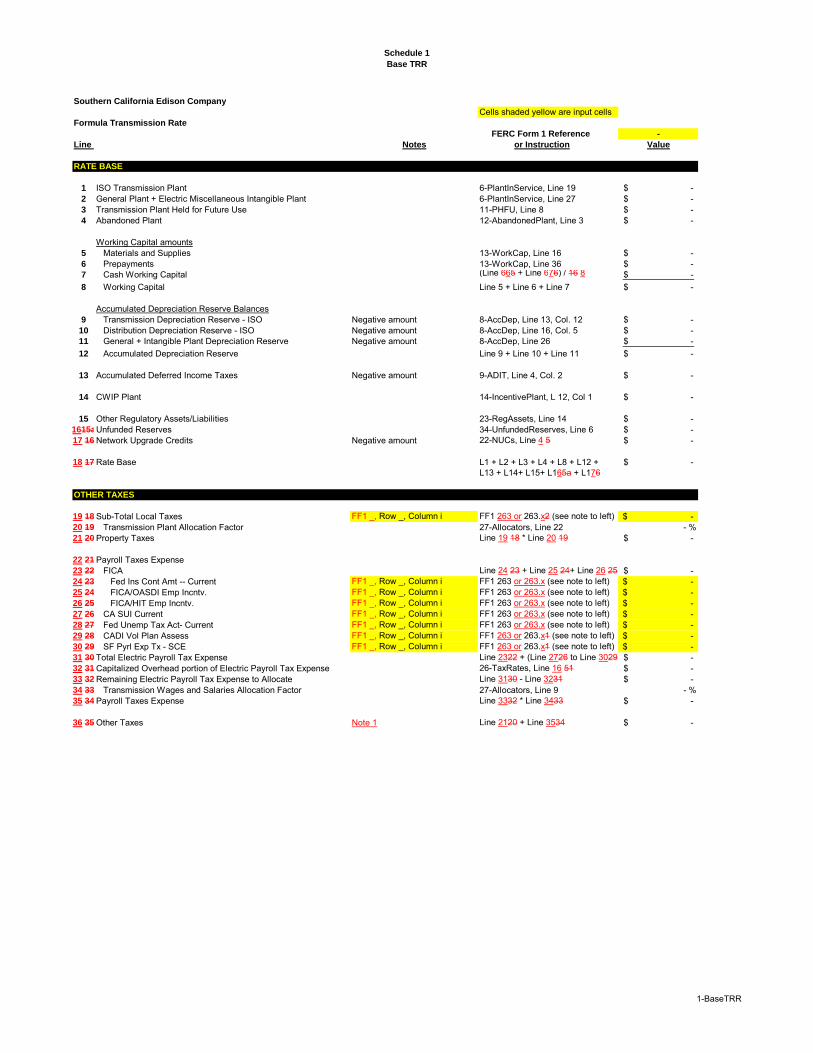
Schedule 1
Base TRR
Southern California Edison Company
Cells shaded yellow are input cellsFormula Transmission Rate
FERC Form 1 Reference -
Line Notes or Instruction Value
RATE BASE
1 ISO Transmission Plant 6-PlantInService, Line 19 -$ 2 General Plant + Electric Miscellaneous Intangible Plant 6-PlantInService, Line 27 -$ 3 Transmission Plant Held for Future Use 11-PHFU, Line 8 -$ 4 Abandoned Plant 12-AbandonedPlant, Line 3 -$
Working Capital amounts5 Materials and Supplies 13-WorkCap, Line 16 -$ 6 Prepayments 13-WorkCap, Line 36 -$ 7 Cash Working Capital (Line 665 + Line 676) / 16 8 -$
8 Working Capital Line 5 + Line 6 + Line 7 -$
Accumulated Depreciation Reserve Balances9 Transmission Depreciation Reserve - ISO Negative amount 8-AccDep, Line 13, Col. 12 -$ 10 Distribution Depreciation Reserve - ISO Negative amount 8-AccDep, Line 16, Col. 5 -$ 11 General + Intangible Plant Depreciation Reserve Negative amount 8-AccDep, Line 26 -$
12 Accumulated Depreciation Reserve Line 9 + Line 10 + Line 11 -$
13 Accumulated Deferred Income Taxes Negative amount 9-ADIT, Line 4, Col. 2 -$
14 CWIP Plant 14-IncentivePlant, L 12, Col 1 -$
15 Other Regulatory Assets/Liabilities 23-RegAssets, Line 14 -$ 1615aUnfunded Reserves 34-UnfundedReserves, Line 6 -$ 17 16 Network Upgrade Credits Negative amount 22-NUCs, Line 4 5 -$
18 17 Rate Base L1 + L2 + L3 + L4 + L8 + L12 + -$ L13 + L14+ L15+ L165a + L176
OTHER TAXES
19 18 Sub-Total Local Taxes FF1 _, Row _, Column i FF1 263 or 263.x2 (see note to left) -$ 20 19 Transmission Plant Allocation Factor 27-Allocators, Line 22 - %21 20 Property Taxes Line 19 18 * Line 20 19 -$
22 21 Payroll Taxes Expense23 22 FICA Line 24 23 + Line 25 24+ Line 26 25 -$ 24 23 Fed Ins Cont Amt -- Current FF1 _, Row _, Column i FF1 263 or 263.x (see note to left) -$ 25 24 FICA/OASDI Emp Incntv. FF1 _, Row _, Column i FF1 263 or 263.x (see note to left) -$ 26 25 FICA/HIT Emp Incntv. FF1 _, Row _, Column i FF1 263 or 263.x (see note to left) -$ 27 26 CA SUI Current FF1 _, Row _, Column i FF1 263 or 263.x (see note to left) -$ 28 27 Fed Unemp Tax Act- Current FF1 _, Row _, Column i FF1 263 or 263.x (see note to left) -$ 29 28 CADI Vol Plan Assess FF1 _, Row _, Column i FF1 263 or 263.x1 (see note to left) -$ 30 29 SF Pyrl Exp Tx - SCE FF1 _, Row _, Column i FF1 263 or 263.x1 (see note to left) -$ 31 30 Total Electric Payroll Tax Expense Line 2322 + (Line 2726 to Line 3029 -$ 32 31 Capitalized Overhead portion of Electric Payroll Tax Expense 26-TaxRates, Line 16 51 -$ 33 32 Remaining Electric Payroll Tax Expense to Allocate Line 3130 - Line 3231 -$ 34 33 Transmission Wages and Salaries Allocation Factor 27-Allocators, Line 9 - %35 34 Payroll Taxes Expense Line 3332 * Line 3433 -$
36 35 Other Taxes Note 1 Line 2120 + Line 3534 -$
1-BaseTRR
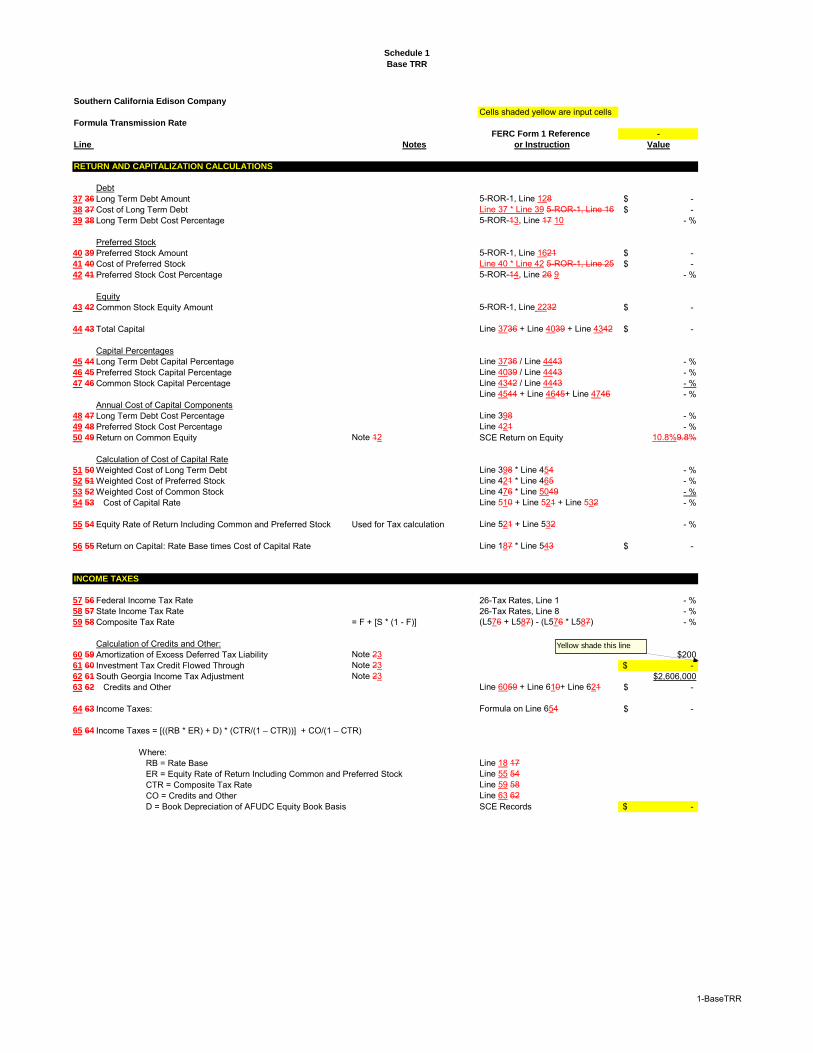
Schedule 1
Base TRR
Southern California Edison Company
Cells shaded yellow are input cellsFormula Transmission Rate
FERC Form 1 Reference -
Line Notes or Instruction Value
RETURN AND CAPITALIZATION CALCULATIONS
Debt37 36 Long Term Debt Amount 5-ROR-1, Line 128 -$ 38 37 Cost of Long Term Debt Line 37 * Line 39 5-ROR-1, Line 16 -$ 39 38 Long Term Debt Cost Percentage 5-ROR-13, Line 17 10 - %
Preferred Stock40 39 Preferred Stock Amount 5-ROR-1, Line 1621 -$ 41 40 Cost of Preferred Stock Line 40 * Line 42 5-ROR-1, Line 25 -$ 42 41 Preferred Stock Cost Percentage 5-ROR-14, Line 26 9 - %
Equity43 42 Common Stock Equity Amount 5-ROR-1, Line 2232 -$
44 43 Total Capital Line 3736 + Line 4039 + Line 4342 -$
Capital Percentages45 44 Long Term Debt Capital Percentage Line 3736 / Line 4443 - %46 45 Preferred Stock Capital Percentage Line 4039 / Line 4443 - %47 46 Common Stock Capital Percentage Line 4342 / Line 4443 - %
Line 4544 + Line 4645+ Line 4746 - %Annual Cost of Capital Components
48 47 Long Term Debt Cost Percentage Line 398 - %49 48 Preferred Stock Cost Percentage Line 421 - %50 49 Return on Common Equity Note 12 SCE Return on Equity 10.8%9.8%
Calculation of Cost of Capital Rate51 50 Weighted Cost of Long Term Debt Line 398 * Line 454 - %52 51 Weighted Cost of Preferred Stock Line 421 * Line 465 - %53 52 Weighted Cost of Common Stock Line 476 * Line 5049 - %54 53 Cost of Capital Rate Line 510 + Line 521 + Line 532 - %
55 54 Equity Rate of Return Including Common and Preferred Stock Used for Tax calculation Line 521 + Line 532 - %
56 55 Return on Capital: Rate Base times Cost of Capital Rate Line 187 * Line 543 -$
INCOME TAXES
57 56 Federal Income Tax Rate 26-Tax Rates, Line 1 - %58 57 State Income Tax Rate 26-Tax Rates, Line 8 - %59 58 Composite Tax Rate = F + [S * (1 - F)] (L576 + L587) - (L576 * L587) - %
Calculation of Credits and Other:60 59 Amortization of Excess Deferred Tax Liability Note 23 $20061 60 Investment Tax Credit Flowed Through Note 23 -$ 62 61 South Georgia Income Tax Adjustment Note 23 $2,606,00063 62 Credits and Other Line 6059 + Line 610+ Line 621 -$
64 63 Income Taxes: Formula on Line 654 -$
65 64 Income Taxes = [((RB * ER) + D) * (CTR/(1 – CTR))] + CO/(1 – CTR)
Where:RB = Rate Base Line 18 17ER = Equity Rate of Return Including Common and Preferred Stock Line 55 54CTR = Composite Tax Rate Line 59 58CO = Credits and Other Line 63 62D = Book Depreciation of AFUDC Equity Book Basis SCE Records -$
Yellow shade this line
1-BaseTRR
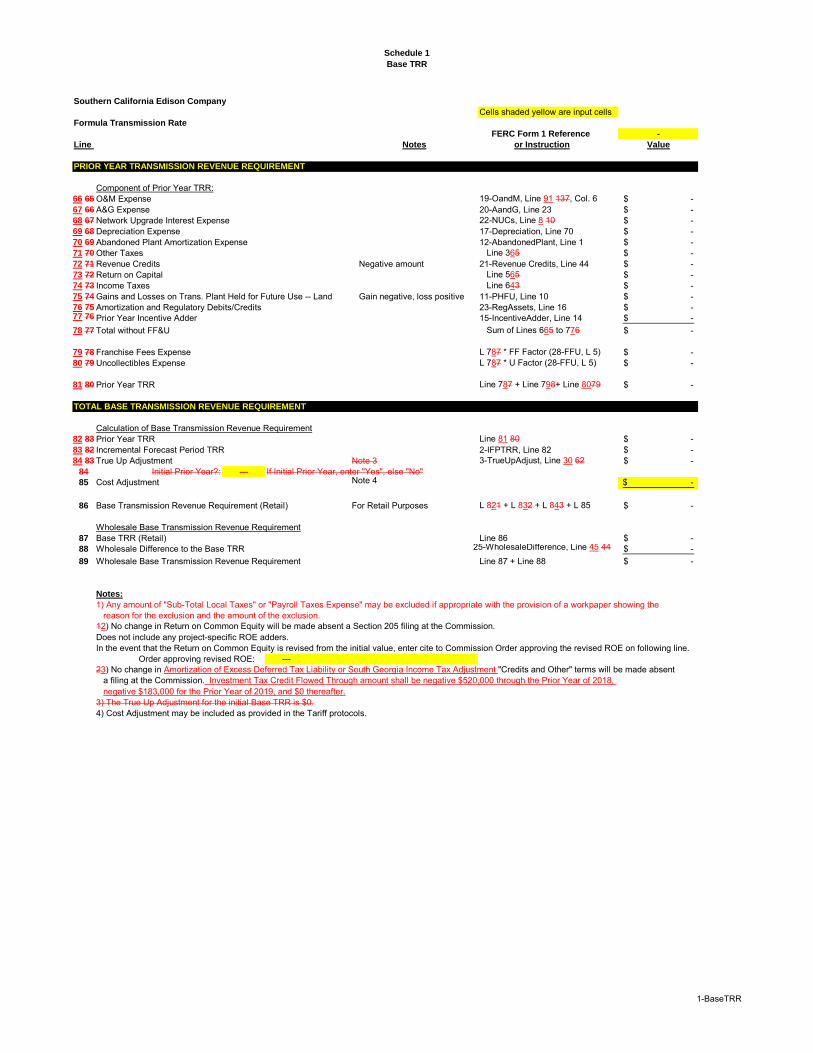
Schedule 1
Base TRR
Southern California Edison Company
Cells shaded yellow are input cellsFormula Transmission Rate
FERC Form 1 Reference -
Line Notes or Instruction Value
PRIOR YEAR TRANSMISSION REVENUE REQUIREMENT
Component of Prior Year TRR:66 65 O&M Expense 19-OandM, Line 91 137, Col. 6 -$ 67 66 A&G Expense 20-AandG, Line 23 -$ 68 67 Network Upgrade Interest Expense 22-NUCs, Line 8 10 -$ 69 68 Depreciation Expense 17-Depreciation, Line 70 -$ 70 69 Abandoned Plant Amortization Expense 12-AbandonedPlant, Line 1 -$ 71 70 Other Taxes Line 365 -$ 72 71 Revenue Credits Negative amount 21-Revenue Credits, Line 44 -$ 73 72 Return on Capital Line 565 -$ 74 73 Income Taxes Line 643 -$ 75 74 Gains and Losses on Trans. Plant Held for Future Use -- Land Gain negative, loss positive 11-PHFU, Line 10 -$ 76 75 Amortization and Regulatory Debits/Credits 23-RegAssets, Line 16 -$ 77 76 Prior Year Incentive Adder 15-IncentiveAdder, Line 14 -$
78 77 Total without FF&U Sum of Lines 665 to 776 -$
79 78 Franchise Fees Expense L 787 * FF Factor (28-FFU, L 5) -$ 80 79 Uncollectibles Expense L 787 * U Factor (28-FFU, L 5) -$
81 80 Prior Year TRR Line 787 + Line 798+ Line 8079 -$
TOTAL BASE TRANSMISSION REVENUE REQUIREMENT
Calculation of Base Transmission Revenue Requirement82 83 Prior Year TRR Line 81 80 -$ 83 82 Incremental Forecast Period TRR 2-IFPTRR, Line 82 -$ 84 83 True Up Adjustment Note 3 3-TrueUpAdjust, Line 30 62 -$
84 Initial Prior Year?: --- If Initial Prior Year, enter "Yes", else "No"85 Cost Adjustment Note 4 -$
86 Base Transmission Revenue Requirement (Retail) For Retail Purposes L 821 + L 832 + L 843 + L 85 -$
Wholesale Base Transmission Revenue Requirement87 Base TRR (Retail) Line 86 -$ 88 Wholesale Difference to the Base TRR 25-WholesaleDifference, Line 45 44 -$
89 Wholesale Base Transmission Revenue Requirement Line 87 + Line 88 -$
Notes:
1) Any amount of "Sub-Total Local Taxes" or "Payroll Taxes Expense" may be excluded if appropriate with the provision of a workpaper showing the reason for the exclusion and the amount of the exclusion.
12) No change in Return on Common Equity will be made absent a Section 205 filing at the Commission. Does not include any project-specific ROE adders.In the event that the Return on Common Equity is revised from the initial value, enter cite to Commission Order approving the revised ROE on following line.
Order approving revised ROE: ---23) No change in Amortization of Excess Deferred Tax Liability or South Georgia Income Tax Adjustment "Credits and Other" terms will be made absent
a filing at the Commission. Investment Tax Credit Flowed Through amount shall be negative $520,000 through the Prior Year of 2018, negative $183,000 for the Prior Year of 2019, and $0 thereafter.
3) The True Up Adjustment for the initial Base TRR is $0.4) Cost Adjustment may be included as provided in the Tariff protocols.
1-BaseTRR

Schedule 2
Incremental Forecast Period TRR
Calculation of Incremental Forecast Period TRR ("IFPTRR")
The IFP TRR is equal to the sum of:1) Forecast Plant Additions * AFCR2) Forecast Period Incremental CWIP * AFCR for CWIP
1) Calculation of Annual Fixed Charge Rates:
Line a) Annual Fixed Charge Rate for CWIP ("AFCRCWIP")
1
2 AFCRCWIP represents the return and income tax costs associated with $1 of CWIP,3 expressed as a percent.4
5 AFCRCWIP = CLTD + (COS * (1/(1 - CTR)))6
7 where:8 CLTD = Weighted Cost of Long Term Debt9 COS = Weighted Cost of Common and Preferred Stock
10 CTR = Composite Tax Rate11 Reference
12 Wtd. Cost of Long Term Debt: - % 1-BaseTRR, Line 51 5013 Wtd. Cost of Common + Pref. Stock: - % 1-BaseTRR, Line 55 5414 Composite Tax Rate: - % 1-BaseTRR, Line 59 5815
16 AFCRCWIP = - % Line 12 + (Line 13 * (1/(1 - Line 14)))17
18 b) Annual Fixed Charge Rate ("AFCR")
19
20 The AFCR is calculated by dividing the Prior Year TRR (without CWIP related costs)21 by Net Plant:22
23 AFCR = (Prior Year TRR - CWIP-related costs) / Net Plant24
25 Determination of Net Plant:
26 Reference
27 Transmission Plant - ISO: -$ 6-PlantInService, Line 1328 Distribution Plant - ISO: -$ 6-PlantInService, Line 1629 Transmission Dep. Reserve - ISO: -$ 8-AccDep, Line 1330 Distribution Dep. Reserve - ISO: -$ 8-AccDep, Line 16
31 Net Plant: -$ (L27 + L28) - (L29 + L30)32
33 Determination of Prior Year TRR without CWIP related costs:
34
35 a) Determination of CWIP-Related Costs
36 1) Direct (without ROE adder) CWIP costs
37 CWIP Plant - Prior Year: -$ 10-CWIP, L 13 C138 AFCRCWIP: - % Line 1639 Direct CWIP Related Costs: -$ Line 37 * Line 3840
41 2) CWIP ROE Adder costs:
42 IREF: -$ 15-IncentiveAdder, Line 343
44 Tehachapi CWIP Amount: -$ 10-CWIP, Line 1345 Tehachapi ROE Adder %: - % 15-IncentiveAdder, Line 546 Tehachapi ROE Adder $: -$ Formula on Line 5247
48 DCR CWIP Amount: -$ 10-CWIP, Line 1349 DCR ROE Adder %: - % 15-IncentiveAdder, Line 650 DCR ROE Adder $: -$ Formula on Line 5251
52 ROE Adder $ = (CWIP/$1,000,000) * IREF * (ROE Adder/1%)53
54 CWIP Related Costs wo FF&U: -$ Line 39 + Line 46 + Line 5055 FF&U Expenses: -$ (28-FFU, L5 FF Factor + U Factor) * L54
56 CWIP Related Costs with FF&U: -$ Line 54 + Line 5557
2-IFPTRR
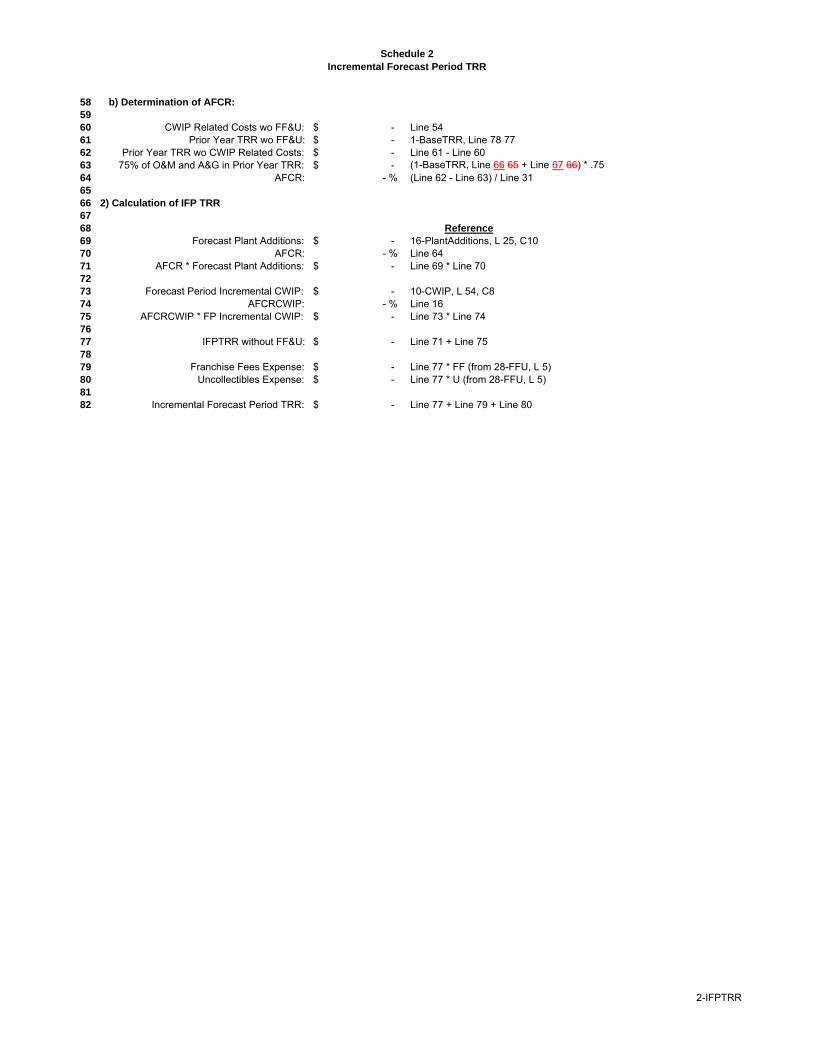
Schedule 2
Incremental Forecast Period TRR
58 b) Determination of AFCR:
59
60 CWIP Related Costs wo FF&U: -$ Line 5461 Prior Year TRR wo FF&U: -$ 1-BaseTRR, Line 78 7762 Prior Year TRR wo CWIP Related Costs: -$ Line 61 - Line 6063 75% of O&M and A&G in Prior Year TRR: -$ (1-BaseTRR, Line 66 65 + Line 67 66) * .7564 AFCR: - % (Line 62 - Line 63) / Line 3165
66 2) Calculation of IFP TRR
67
68 Reference
69 Forecast Plant Additions: -$ 16-PlantAdditions, L 25, C1070 AFCR: - % Line 6471 AFCR * Forecast Plant Additions: -$ Line 69 * Line 7072
73 Forecast Period Incremental CWIP: -$ 10-CWIP, L 54, C874 AFCRCWIP: - % Line 1675 AFCRCWIP * FP Incremental CWIP: -$ Line 73 * Line 7476
77 IFPTRR without FF&U: -$ Line 71 + Line 7578
79 Franchise Fees Expense: -$ Line 77 * FF (from 28-FFU, L 5)80 Uncollectibles Expense: -$ Line 77 * U (from 28-FFU, L 5)81
82 Incremental Forecast Period TRR: -$ Line 77 + Line 79 + Line 80
2-IFPTRR
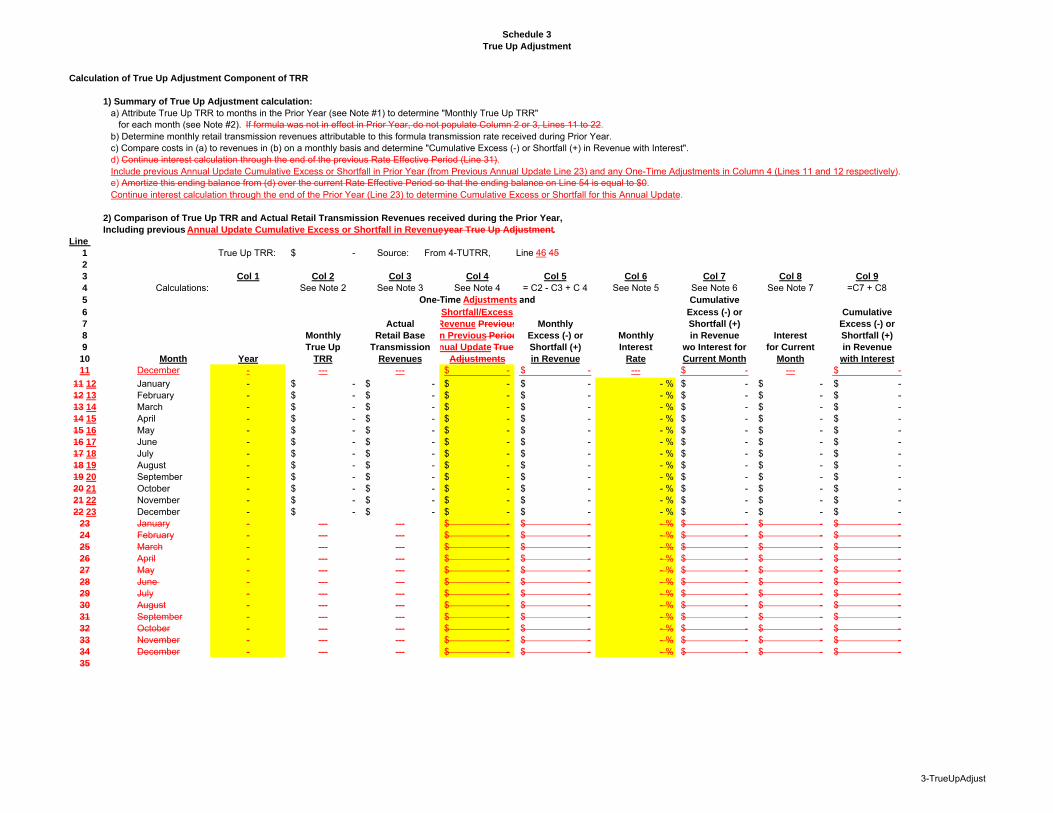
Schedule 3
True Up Adjustment
Calculation of True Up Adjustment Component of TRR
1) Summary of True Up Adjustment calculation:
a) Attribute True Up TRR to months in the Prior Year (see Note #1) to determine "Monthly True Up TRR"for each month (see Note #2). If formula was not in effect in Prior Year, do not populate Column 2 or 3, Lines 11 to 22.
b) Determine monthly retail transmission revenues attributable to this formula transmission rate received during Prior Year.c) Compare costs in (a) to revenues in (b) on a monthly basis and determine "Cumulative Excess (-) or Shortfall (+) in Revenue with Interest".d) Continue interest calculation through the end of the previous Rate Effective Period (Line 31).Include previous Annual Update Cumulative Excess or Shortfall in Prior Year (from Previous Annual Update Line 23) and any One-Time Adjustments in Column 4 (Lines 11 and 12 respectively).e) Amortize this ending balance from (d) over the current Rate Effective Period so that the ending balance on Line 54 is equal to $0.Continue interest calculation through the end of the Prior Year (Line 23) to determine Cumulative Excess or Shortfall for this Annual Update.
2) Comparison of True Up TRR and Actual Retail Transmission Revenues received during the Prior Year,
Including previous Annual Update Cumulative Excess or Shortfall in Revenue year True Up Adjustment.
Line
1 True Up TRR: -$ Source: From 4-TUTRR, Line 46 452
3 Col 1 Col 2 Col 3 Col 4 Col 5 Col 6 Col 7 Col 8 Col 9
4 Calculations: See Note 2 See Note 3 See Note 4 = C2 - C3 + C 4 See Note 5 See Note 6 See Note 7 =C7 + C85 One‐Time Adjustments and Cumulative
6 Shortfall/Excess Excess (-) or Cumulative
7 Actual Revenue Previous Monthly Shortfall (+) Excess (-) or
8 Monthly Retail Base n Previous Period Excess (-) or Monthly in Revenue Interest Shortfall (+)
9 True Up Transmission nual Update True Shortfall (+) Interest wo Interest for for Current in Revenue
10 Month Year TRR Revenues Adjustments in Revenue Rate Current Month Month with Interest
11 December - --- --- -$ -$ --- -$ --- -$
11 12 January - -$ -$ -$ -$ - % -$ -$ -$ 12 13 February - -$ -$ -$ -$ - % -$ -$ -$ 13 14 March - -$ -$ -$ -$ - % -$ -$ -$ 14 15 April - -$ -$ -$ -$ - % -$ -$ -$ 15 16 May - -$ -$ -$ -$ - % -$ -$ -$ 16 17 June - -$ -$ -$ -$ - % -$ -$ -$ 17 18 July - -$ -$ -$ -$ - % -$ -$ -$ 18 19 August - -$ -$ -$ -$ - % -$ -$ -$ 19 20 September - -$ -$ -$ -$ - % -$ -$ -$ 20 21 October - -$ -$ -$ -$ - % -$ -$ -$ 21 22 November - -$ -$ -$ -$ - % -$ -$ -$ 22 23 December - -$ -$ -$ -$ - % -$ -$ -$
23 January - --- --- -$ -$ - % -$ -$ -$ 24 February - --- --- -$ -$ - % -$ -$ -$ 25 March - --- --- -$ -$ - % -$ -$ -$ 26 April - --- --- -$ -$ - % -$ -$ -$ 27 May - --- --- -$ -$ - % -$ -$ -$ 28 June - --- --- -$ -$ - % -$ -$ -$ 29 July - --- --- -$ -$ - % -$ -$ -$ 30 August - --- --- -$ -$ - % -$ -$ -$ 31 September - --- --- -$ -$ - % -$ -$ -$ 32 October - --- --- -$ -$ - % -$ -$ -$ 33 November - --- --- -$ -$ - % -$ -$ -$ 34 December - --- --- -$ -$ - % -$ -$ -$ 35
3-TrueUpAdjust
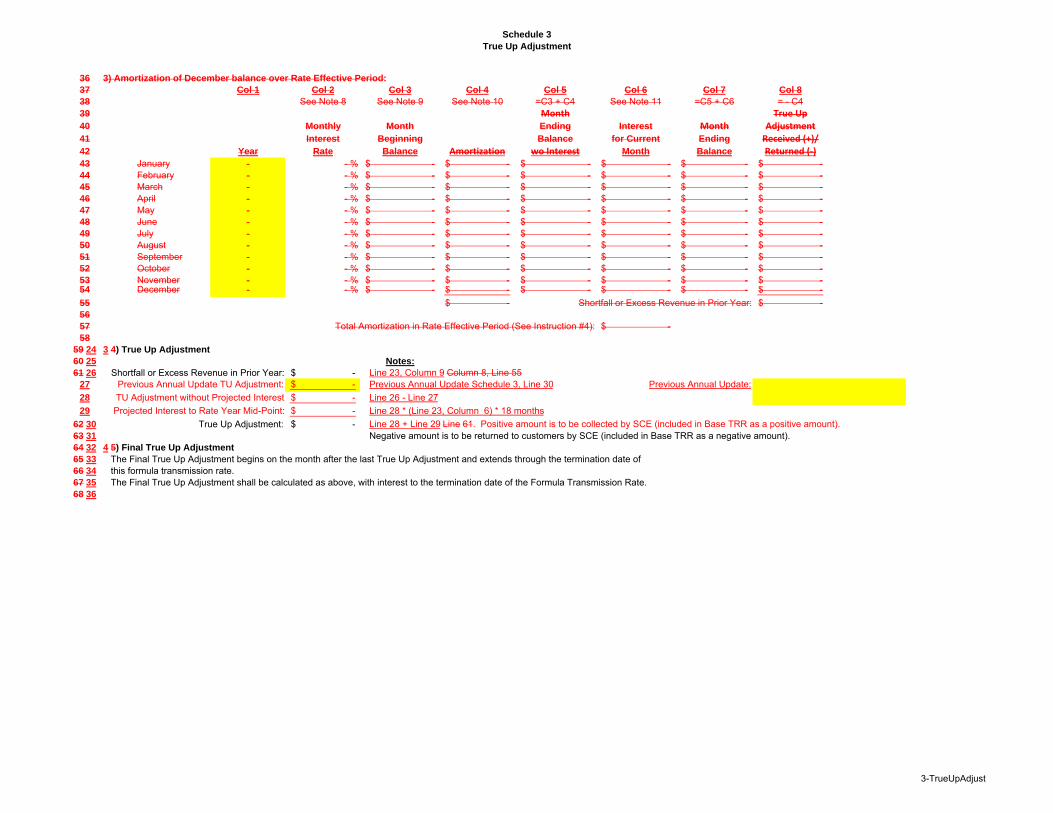
Schedule 3
True Up Adjustment
36 3) Amortization of December balance over Rate Effective Period:
37 Col 1 Col 2 Col 3 Col 4 Col 5 Col 6 Col 7 Col 8
38 See Note 8 See Note 9 See Note 10 =C3 + C4 See Note 11 =C5 + C6 = - C439 Month True Up40 Monthly Month Ending Interest Month Adjustment41 Interest Beginning Balance for Current Ending Received (+)/42 Year Rate Balance Amortization wo Interest Month Balance Returned (‐)43 January - - % -$ -$ -$ -$ -$ -$ 44 February - - % -$ -$ -$ -$ -$ -$ 45 March - - % -$ -$ -$ -$ -$ -$ 46 April - - % -$ -$ -$ -$ -$ -$ 47 May - - % -$ -$ -$ -$ -$ -$ 48 June - - % -$ -$ -$ -$ -$ -$ 49 July - - % -$ -$ -$ -$ -$ -$ 50 August - - % -$ -$ -$ -$ -$ -$ 51 September - - % -$ -$ -$ -$ -$ -$ 52 October - - % -$ -$ -$ -$ -$ -$ 53 November - - % -$ -$ -$ -$ -$ -$ 54 December - - % -$ -$ -$ -$ -$ -$
55 -$ Shortfall or Excess Revenue in Prior Year: -$ 56
57 Total Amortization in Rate Effective Period (See Instruction #4): -$ 58
59 24 3 4) True Up Adjustment
60 25 Notes:
61 26 Shortfall or Excess Revenue in Prior Year: -$ Line 23, Column 9 Column 8, Line 5527 Previous Annual Update TU Adjustment: -$ Previous Annual Update Schedule 3, Line 30 Previous Annual Update:
28 TU Adjustment without Projected Interest -$ Line 26 - Line 27
29 Projected Interest to Rate Year Mid-Point: -$ Line 28 * (Line 23, Column 6) * 18 months
62 30 True Up Adjustment: -$ Line 28 + Line 29 Line 61. Positive amount is to be collected by SCE (included in Base TRR as a positive amount).63 31 Negative amount is to be returned to customers by SCE (included in Base TRR as a negative amount).64 32 4 5) Final True Up Adjustment
65 33 The Final True Up Adjustment begins on the month after the last True Up Adjustment and extends through the termination date of 66 34 this formula transmission rate.67 35 The Final True Up Adjustment shall be calculated as above, with interest to the termination date of the Formula Transmission Rate.68 36
3-TrueUpAdjust
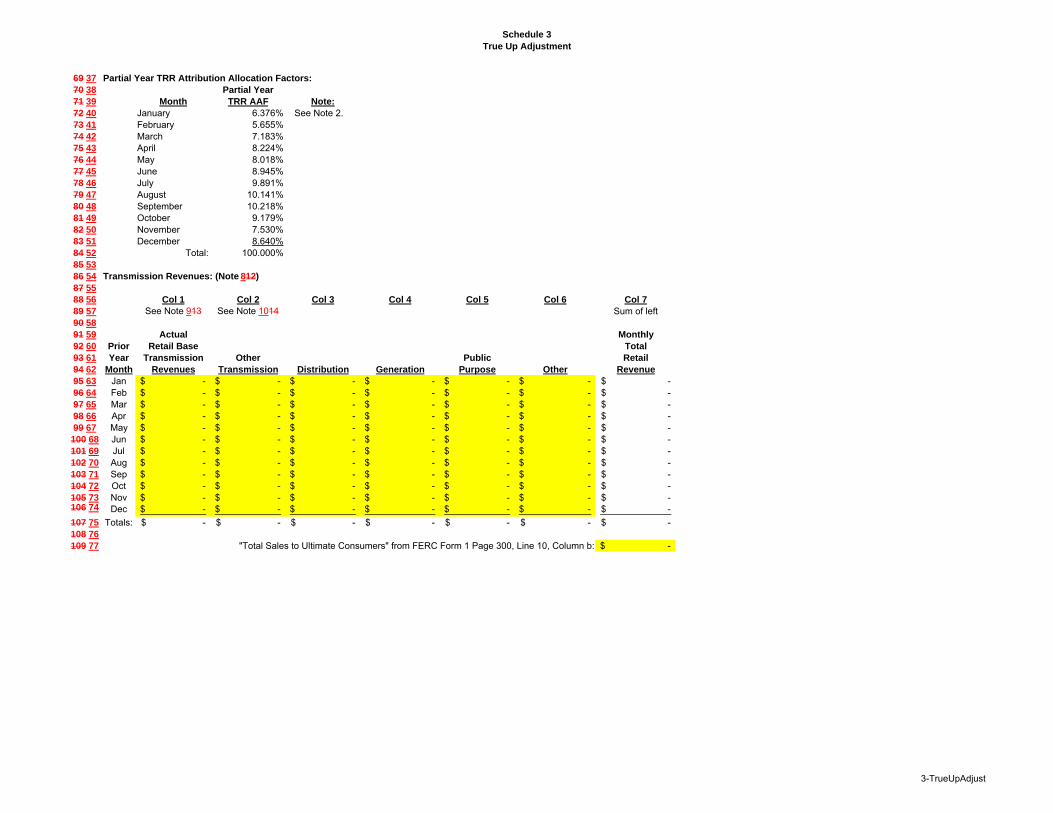
Schedule 3
True Up Adjustment
69 37 Partial Year TRR Attribution Allocation Factors:
70 38 Partial Year
71 39 Month TRR AAF Note:
72 40 January 6.376% See Note 2.73 41 February 5.655%74 42 March 7.183%75 43 April 8.224%76 44 May 8.018%77 45 June 8.945%78 46 July 9.891%79 47 August 10.141%80 48 September 10.218%81 49 October 9.179%82 50 November 7.530%83 51 December 8.640%84 52 Total: 100.000%85 53
86 54 Transmission Revenues: (Note 812)
87 55
88 56 Col 1 Col 2 Col 3 Col 4 Col 5 Col 6 Col 7
89 57 See Note 913 See Note 1014 Sum of left90 58
91 59 Actual Monthly
92 60 Prior Retail Base Total
93 61 Year Transmission Other Public Retail
94 62 Month Revenues Transmission Distribution Generation Purpose Other Revenue
95 63 Jan -$ -$ -$ -$ -$ -$ -$ 96 64 Feb -$ -$ -$ -$ -$ -$ -$ 97 65 Mar -$ -$ -$ -$ -$ -$ -$ 98 66 Apr -$ -$ -$ -$ -$ -$ -$ 99 67 May -$ -$ -$ -$ -$ -$ -$ 100 68 Jun -$ -$ -$ -$ -$ -$ -$ 101 69 Jul -$ -$ -$ -$ -$ -$ -$ 102 70 Aug -$ -$ -$ -$ -$ -$ -$ 103 71 Sep -$ -$ -$ -$ -$ -$ -$ 104 72 Oct -$ -$ -$ -$ -$ -$ -$ 105 73 Nov -$ -$ -$ -$ -$ -$ -$ 106 74 Dec -$ -$ -$ -$ -$ -$ -$
107 75 Totals: -$ -$ -$ -$ -$ -$ -$ 108 76
109 77 "Total Sales to Ultimate Consumers" from FERC Form 1 Page 300, Line 10, Column b: -$
3-TrueUpAdjust
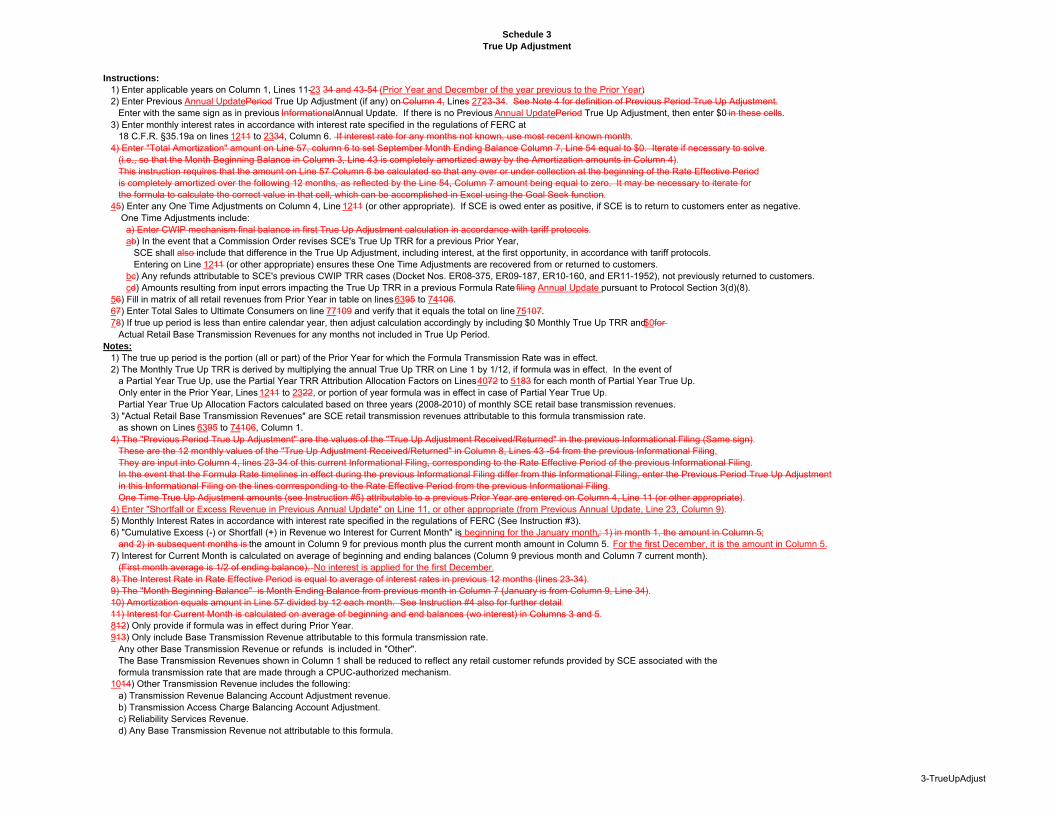
Schedule 3
True Up Adjustment
Instructions:
1) Enter applicable years on Column 1, Lines 11-23 34 and 43-54 (Prior Year and December of the year previous to the Prior Year).2) Enter Previous Annual UpdatePeriod True Up Adjustment (if any) on Column 4, Lines 2723-34. See Note 4 for definition of Previous Period True Up Adjustment.
Enter with the same sign as in previous InformationalAnnual Update. If there is no Previous Annual UpdatePeriod True Up Adjustment, then enter $0 in these cells.3) Enter monthly interest rates in accordance with interest rate specified in the regulations of FERC at
18 C.F.R. §35.19a on lines 1211 to 2334, Column 6. If interest rate for any months not known, use most recent known month.4) Enter "Total Amortization" amount on Line 57, column 6 to set September Month Ending Balance Column 7, Line 54 equal to $0. Iterate if necessary to solve.
(i.e., so that the Month Beginning Balance in Column 3, Line 43 is completely amortized away by the Amortization amounts in Column 4).This instruction requires that the amount on Line 57 Column 6 be calculated so that any over or under collection at the beginning of the Rate Effective Periodis completely amortized over the following 12 months, as reflected by the Line 54, Column 7 amount being equal to zero. It may be necessary to iterate forthe formula to calculate the correct value in that cell, which can be accomplished in Excel using the Goal Seek function.
45) Enter any One Time Adjustments on Column 4, Line 1211 (or other appropriate). If SCE is owed enter as positive, if SCE is to return to customers enter as negative. One Time Adjustments include:
a) Enter CWIP mechanism final balance in first True Up Adjustment calculation in accordance with tariff protocols.ab) In the event that a Commission Order revises SCE's True Up TRR for a previous Prior Year,
SCE shall also include that difference in the True Up Adjustment, including interest, at the first opportunity, in accordance with tariff protocols.Entering on Line 1211 (or other appropriate) ensures these One Time Adjustments are recovered from or returned to customers.
bc) Any refunds attributable to SCE's previous CWIP TRR cases (Docket Nos. ER08-375, ER09-187, ER10-160, and ER11-1952), not previously returned to customers.cd) Amounts resulting from input errors impacting the True Up TRR in a previous Formula Rate filing Annual Update pursuant to Protocol Section 3(d)(8).
56) Fill in matrix of all retail revenues from Prior Year in table on lines 6395 to 74106.67) Enter Total Sales to Ultimate Consumers on line 77109 and verify that it equals the total on line 75107.78) If true up period is less than entire calendar year, then adjust calculation accordingly by including $0 Monthly True Up TRR and $0for
Actual Retail Base Transmission Revenues for any months not included in True Up Period.Notes:
1) The true up period is the portion (all or part) of the Prior Year for which the Formula Transmission Rate was in effect.2) The Monthly True Up TRR is derived by multiplying the annual True Up TRR on Line 1 by 1/12, if formula was in effect. In the event of
a Partial Year True Up, use the Partial Year TRR Attribution Allocation Factors on Lines 4072 to 5183 for each month of Partial Year True Up.Only enter in the Prior Year, Lines 1211 to 2322, or portion of year formula was in effect in case of Partial Year True Up.Partial Year True Up Allocation Factors calculated based on three years (2008-2010) of monthly SCE retail base transmission revenues.
3) "Actual Retail Base Transmission Revenues" are SCE retail transmission revenues attributable to this formula transmission rate.as shown on Lines 6395 to 74106, Column 1.
4) The "Previous Period True Up Adjustment" are the values of the "True Up Adjustment Received/Returned" in the previous Informational Filing (Same sign).These are the 12 monthly values of the "True Up Adjustment Received/Returned" in Column 8, Lines 43 -54 from the previous Informational Filing,They are input into Column 4, lines 23-34 of this current Informational Filing, corresponding to the Rate Effective Period of the previous Informational Filing.In the event that the Formula Rate timelines in effect during the previous Informational Filing differ from this Informational Filing, enter the Previous Period True Up Adjustmentin this Informational Filing on the lines corrresponding to the Rate Effective Period from the previous Informational Filing.One Time True Up Adjustment amounts (see Instruction #5) attributable to a previous Prior Year are entered on Column 4, Line 11 (or other appropriate).
4) Enter "Shortfall or Excess Revenue in Previous Annual Update" on Line 11, or other appropriate (from Previous Annual Update, Line 23, Column 9).5) Monthly Interest Rates in accordance with interest rate specified in the regulations of FERC (See Instruction #3).6) "Cumulative Excess (-) or Shortfall (+) in Revenue wo Interest for Current Month" is, beginning for the January month,: 1) in month 1, the amount in Column 5;
and 2) in subsequent months is the amount in Column 9 for previous month plus the current month amount in Column 5. For the first December, it is the amount in Column 5.7) Interest for Current Month is calculated on average of beginning and ending balances (Column 9 previous month and Column 7 current month).
(First month average is 1/2 of ending balance). No interest is applied for the first December.8) The Interest Rate in Rate Effective Period is equal to average of interest rates in previous 12 months (lines 23-34).9) The "Month Beginning Balance" is Month Ending Balance from previous month in Column 7 (January is from Column 9, Line 34).10) Amortization equals amount in Line 57 divided by 12 each month. See Instruction #4 also for further detail.11) Interest for Current Month is calculated on average of beginning and end balances (wo interest) in Columns 3 and 5.812) Only provide if formula was in effect during Prior Year.913) Only include Base Transmission Revenue attributable to this formula transmission rate.
Any other Base Transmission Revenue or refunds is included in "Other".The Base Transmission Revenues shown in Column 1 shall be reduced to reflect any retail customer refunds provided by SCE associated with theformula transmission rate that are made through a CPUC-authorized mechanism.
1014) Other Transmission Revenue includes the following:a) Transmission Revenue Balancing Account Adjustment revenue. b) Transmission Access Charge Balancing Account Adjustment.c) Reliability Services Revenue.d) Any Base Transmission Revenue not attributable to this formula.
3-TrueUpAdjust
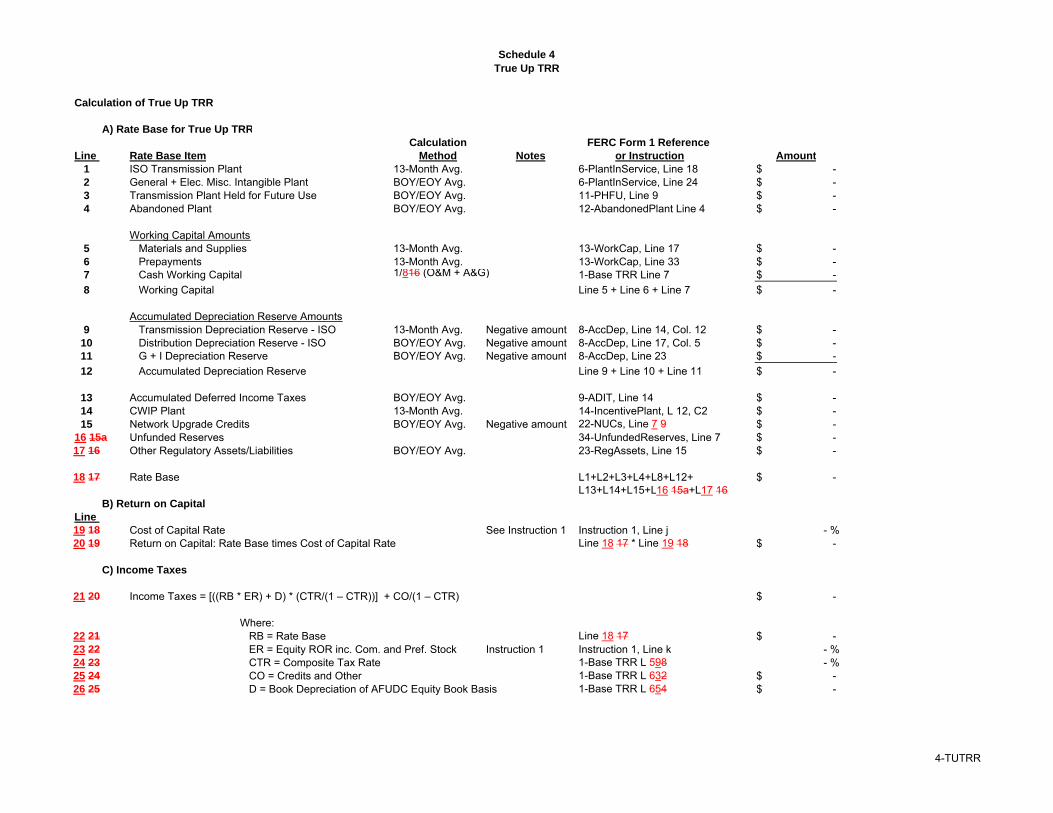
Schedule 4
True Up TRR
Calculation of True Up TRR
A) Rate Base for True Up TRR
Calculation FERC Form 1 Reference
Line Rate Base Item Method Notes or Instruction Amount
1 ISO Transmission Plant 13-Month Avg. 6-PlantInService, Line 18 -$ 2 General + Elec. Misc. Intangible Plant BOY/EOY Avg. 6-PlantInService, Line 24 -$ 3 Transmission Plant Held for Future Use BOY/EOY Avg. 11-PHFU, Line 9 -$ 4 Abandoned Plant BOY/EOY Avg. 12-AbandonedPlant Line 4 -$
Working Capital Amounts5 Materials and Supplies 13-Month Avg. 13-WorkCap, Line 17 -$ 6 Prepayments 13-Month Avg. 13-WorkCap, Line 33 -$ 7 Cash Working Capital 1/816 (O&M + A&G) 1-Base TRR Line 7 -$
8 Working Capital Line 5 + Line 6 + Line 7 -$
Accumulated Depreciation Reserve Amounts9 Transmission Depreciation Reserve - ISO 13-Month Avg. Negative amount 8-AccDep, Line 14, Col. 12 -$
10 Distribution Depreciation Reserve - ISO BOY/EOY Avg. Negative amount 8-AccDep, Line 17, Col. 5 -$ 11 G + I Depreciation Reserve BOY/EOY Avg. Negative amount 8-AccDep, Line 23 -$
12 Accumulated Depreciation Reserve Line 9 + Line 10 + Line 11 -$
13 Accumulated Deferred Income Taxes BOY/EOY Avg. 9-ADIT, Line 14 -$ 14 CWIP Plant 13-Month Avg. 14-IncentivePlant, L 12, C2 -$ 15 Network Upgrade Credits BOY/EOY Avg. Negative amount 22-NUCs, Line 7 9 -$
16 15a Unfunded Reserves 34-UnfundedReserves, Line 7 -$ 17 16 Other Regulatory Assets/Liabilities BOY/EOY Avg. 23-RegAssets, Line 15 -$
18 17 Rate Base L1+L2+L3+L4+L8+L12+ -$ L13+L14+L15+L16 15a+L17 16
B) Return on Capital
Line
19 18 Cost of Capital Rate See Instruction 1 Instruction 1, Line j - %20 19 Return on Capital: Rate Base times Cost of Capital Rate Line 18 17 * Line 19 18 -$
C) Income Taxes
21 20 Income Taxes = [((RB * ER) + D) * (CTR/(1 – CTR))] + CO/(1 – CTR) -$
Where:22 21 RB = Rate Base Line 18 17 -$ 23 22 ER = Equity ROR inc. Com. and Pref. Stock Instruction 1 Instruction 1, Line k - %24 23 CTR = Composite Tax Rate 1-Base TRR L 598 - %25 24 CO = Credits and Other 1-Base TRR L 632 -$ 26 25 D = Book Depreciation of AFUDC Equity Book Basis 1-Base TRR L 654 -$
4-TUTRR
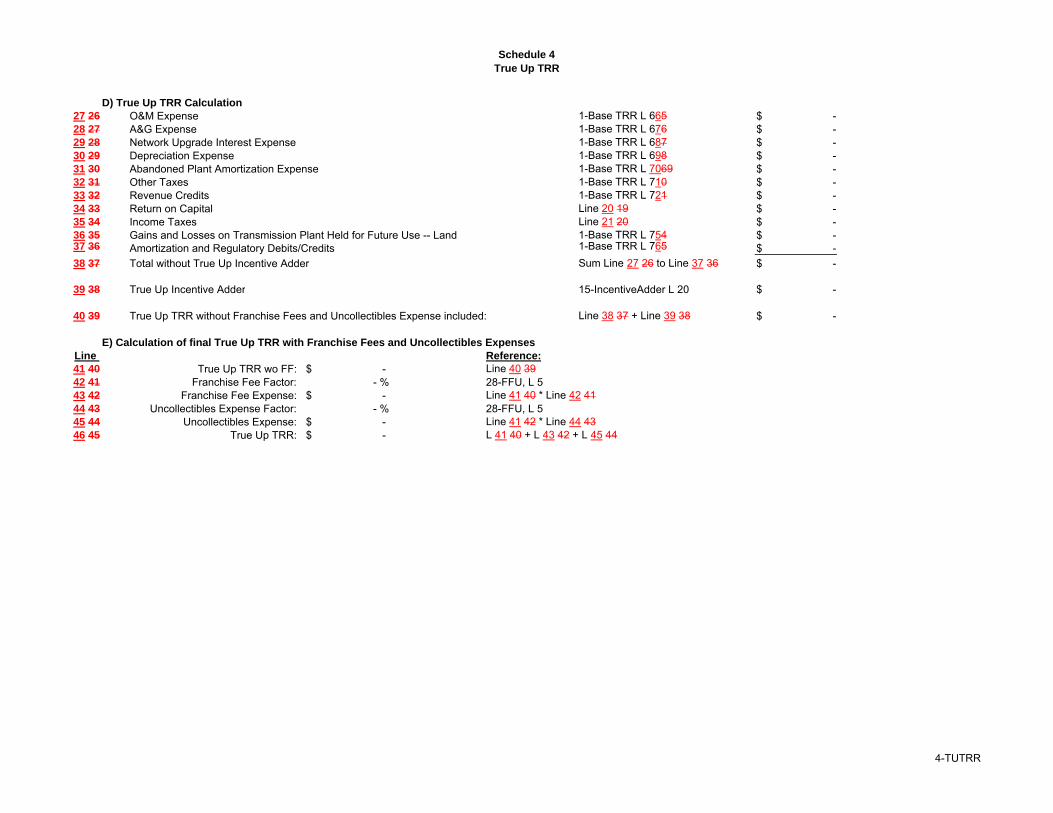
Schedule 4
True Up TRR
D) True Up TRR Calculation
27 26 O&M Expense 1-Base TRR L 665 -$ 28 27 A&G Expense 1-Base TRR L 676 -$ 29 28 Network Upgrade Interest Expense 1-Base TRR L 687 -$ 30 29 Depreciation Expense 1-Base TRR L 698 -$ 31 30 Abandoned Plant Amortization Expense 1-Base TRR L 7069 -$ 32 31 Other Taxes 1-Base TRR L 710 -$ 33 32 Revenue Credits 1-Base TRR L 721 -$ 34 33 Return on Capital Line 20 19 -$ 35 34 Income Taxes Line 21 20 -$ 36 35 Gains and Losses on Transmission Plant Held for Future Use -- Land 1-Base TRR L 754 -$ 37 36 Amortization and Regulatory Debits/Credits 1-Base TRR L 765 -$
38 37 Total without True Up Incentive Adder Sum Line 27 26 to Line 37 36 -$
39 38 True Up Incentive Adder 15-IncentiveAdder L 20 -$
40 39 True Up TRR without Franchise Fees and Uncollectibles Expense included: Line 38 37 + Line 39 38 -$
E) Calculation of final True Up TRR with Franchise Fees and Uncollectibles Expenses
Line Reference:
41 40 True Up TRR wo FF: -$ Line 40 3942 41 Franchise Fee Factor: - % 28-FFU, L 543 42 Franchise Fee Expense: -$ Line 41 40 * Line 42 4144 43 Uncollectibles Expense Factor: - % 28-FFU, L 545 44 Uncollectibles Expense: -$ Line 41 42 * Line 44 4346 45 True Up TRR: -$ L 41 40 + L 43 42 + L 45 44
4-TUTRR
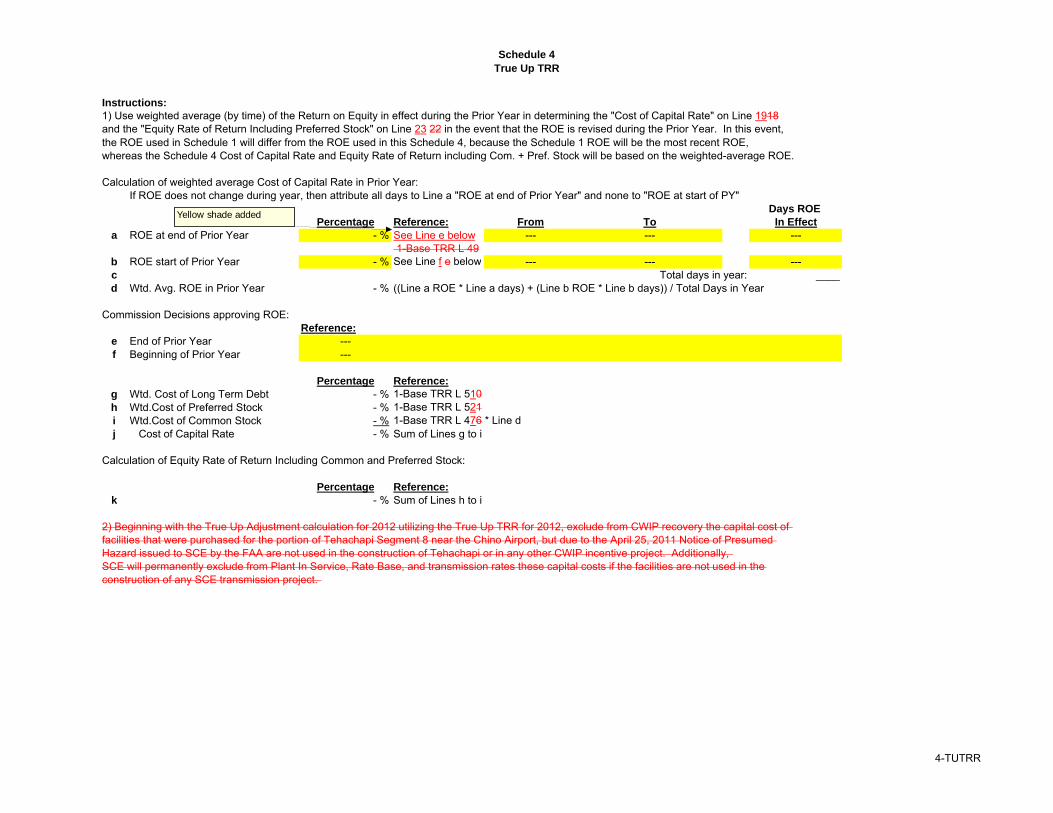
Schedule 4
True Up TRR
Instructions:
1) Use weighted average (by time) of the Return on Equity in effect during the Prior Year in determining the "Cost of Capital Rate" on Line 1918and the "Equity Rate of Return Including Preferred Stock" on Line 23 22 in the event that the ROE is revised during the Prior Year. In this event,the ROE used in Schedule 1 will differ from the ROE used in this Schedule 4, because the Schedule 1 ROE will be the most recent ROE,whereas the Schedule 4 Cost of Capital Rate and Equity Rate of Return including Com. + Pref. Stock will be based on the weighted-average ROE.
Calculation of weighted average Cost of Capital Rate in Prior Year:If ROE does not change during year, then attribute all days to Line a "ROE at end of Prior Year" and none to "ROE at start of PY"
Days ROE
Percentage Reference: From To In Effect
a ROE at end of Prior Year - % See Line e below --- --- --- 1-Base TRR L 49
b ROE start of Prior Year - % See Line f e below --- --- ---c Total days in year: ____d Wtd. Avg. ROE in Prior Year - % ((Line a ROE * Line a days) + (Line b ROE * Line b days)) / Total Days in Year
Commission Decisions approving ROE:Reference:
e End of Prior Year ---f Beginning of Prior Year ---
Percentage Reference:
g Wtd. Cost of Long Term Debt - % 1-Base TRR L 510h Wtd.Cost of Preferred Stock - % 1-Base TRR L 521i Wtd.Cost of Common Stock - % 1-Base TRR L 476 * Line dj Cost of Capital Rate - % Sum of Lines g to i
Calculation of Equity Rate of Return Including Common and Preferred Stock:
Percentage Reference:
k - % Sum of Lines h to i
2) Beginning with the True Up Adjustment calculation for 2012 utilizing the True Up TRR for 2012, exclude from CWIP recovery the capital cost of facilities that were purchased for the portion of Tehachapi Segment 8 near the Chino Airport, but due to the April 25, 2011 Notice of Presumed Hazard issued to SCE by the FAA are not used in the construction of Tehachapi or in any other CWIP incentive project. Additionally, SCE will permanently exclude from Plant In Service, Rate Base, and transmission rates these capital costs if the facilities are not used in theconstruction of any SCE transmission project.
Yellow shade added
4-TUTRR
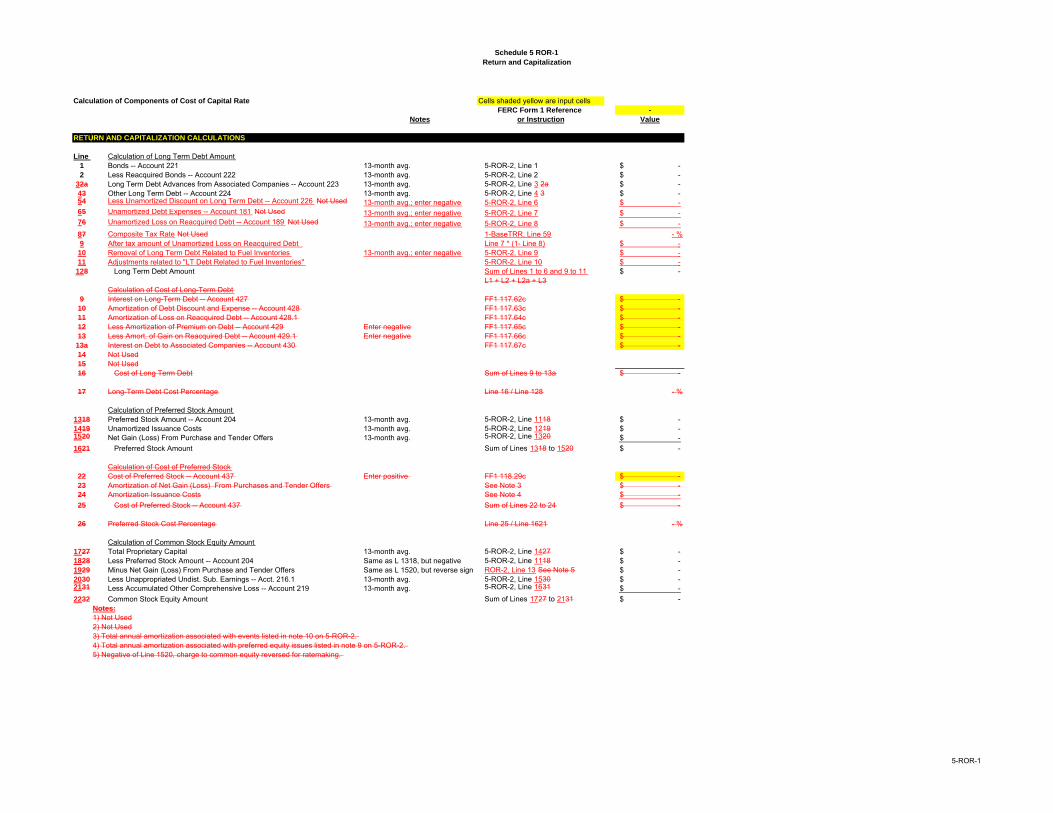
Schedule 5 ROR-1
Return and Capitalization
Calculation of Components of Cost of Capital Rate Cells shaded yellow are input cellsFERC Form 1 Reference -
Notes or Instruction Value
RETURN AND CAPITALIZATION CALCULATIONS
Line Calculation of Long Term Debt Amount1 Bonds -- Account 221 13-month avg. 5-ROR-2, Line 1 -$ 2 Less Reacquired Bonds -- Account 222 13-month avg. 5-ROR-2, Line 2 -$
32a Long Term Debt Advances from Associated Companies -- Account 223 13-month avg. 5-ROR-2, Line 3 2a -$ 43 Other Long Term Debt -- Account 224 13-month avg. 5-ROR-2, Line 4 3 -$ 54 Less Unamortized Discount on Long Term Debt -- Account 226 Not Used 13-month avg.; enter negative 5-ROR-2, Line 6 -$ 65 Unamortized Debt Expenses -- Account 181 Not Used 13-month avg.; enter negative 5-ROR-2, Line 7 -$ 76 Unamortized Loss on Reacquired Debt -- Account 189 Not Used 13-month avg.; enter negative 5-ROR-2, Line 8 -$
87 Composite Tax Rate Not Used 1-BaseTRR, Line 59 - %9 After tax amount of Unamortized Loss on Reacquired Debt Line 7 * (1- Line 8) -$
10 Removal of Long Term Debt Related to Fuel Inventories 13-month avg.; enter negative 5-ROR-2, Line 9 -$ 11 Adjustments related to "LT Debt Related to Fuel Inventories" 5-ROR-2, Line 10 -$
128 Long Term Debt Amount Sum of Lines 1 to 6 and 9 to 11 -$ L1 + L2 + L2a + L3
Calculation of Cost of Long-Term Debt9 Interest on Long-Term Debt -- Account 427 FF1 117.62c -$
10 Amortization of Debt Discount and Expense -- Account 428 FF1 117.63c -$ 11 Amortization of Loss on Reacquired Debt -- Account 428.1 FF1 117.64c -$ 12 Less Amortization of Premium on Debt -- Account 429 Enter negative FF1 117.65c -$ 13 Less Amort. of Gain on Reacquired Debt -- Account 429.1 Enter negative FF1 117.66c -$
13a Interest on Debt to Associated Companies -- Account 430 FF1 117.67c -$ 14 Not Used15 Not Used16 Cost of Long Term Debt Sum of Lines 9 to 13a -$
17 Long-Term Debt Cost Percentage Line 16 / Line 128 - %
Calculation of Preferred Stock Amount1318 Preferred Stock Amount -- Account 204 13-month avg. 5-ROR-2, Line 1118 -$ 1419 Unamortized Issuance Costs 13-month avg. 5-ROR-2, Line 1219 -$ 1520 Net Gain (Loss) From Purchase and Tender Offers 13-month avg. 5-ROR-2, Line 1320 -$
1621 Preferred Stock Amount Sum of Lines 1318 to 1520 -$
Calculation of Cost of Preferred Stock22 Cost of Preferred Stock -- Account 437 Enter positive FF1 118.29c -$ 23 Amortization of Net Gain (Loss) From Purchases and Tender Offers See Note 3 -$ 24 Amortization Issuance Costs See Note 4 -$
25 Cost of Preferred Stock -- Account 437 Sum of Lines 22 to 24 -$
26 Preferred Stock Cost Percentage Line 25 / Line 1621 - %
Calculation of Common Stock Equity Amount1727 Total Proprietary Capital 13-month avg. 5-ROR-2, Line 1427 -$ 1828 Less Preferred Stock Amount -- Account 204 Same as L 1318, but negative 5-ROR-2, Line 1118 -$ 1929 Minus Net Gain (Loss) From Purchase and Tender Offers Same as L 1520, but reverse sign ROR-2, Line 13 See Note 5 -$ 2030 Less Unappropriated Undist. Sub. Earnings -- Acct. 216.1 13-month avg. 5-ROR-2, Line 1530 -$ 2131 Less Accumulated Other Comprehensive Loss -- Account 219 13-month avg. 5-ROR-2, Line 1631 -$
2232 Common Stock Equity Amount Sum of Lines 1727 to 2131 -$ Notes:
1) Not Used2) Not Used3) Total annual amortization associated with events listed in note 10 on 5-ROR-2.4) Total annual amortization associated with preferred equity issues listed in note 9 on 5-ROR-2.5) Negative of Line 1520, charge to common equity reversed for ratemaking.
5-ROR-1
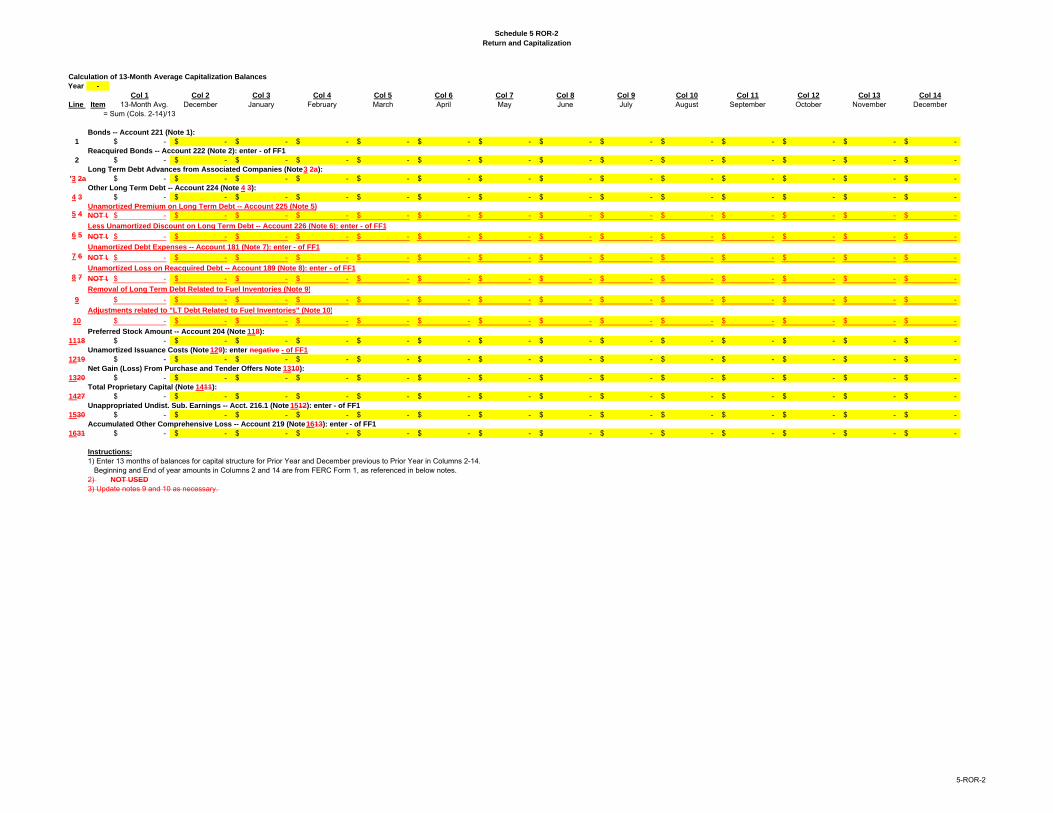
Schedule 5 ROR-2
Return and Capitalization
Calculation of 13-Month Average Capitalization Balances
Year -
Col 1 Col 2 Col 3 Col 4 Col 5 Col 6 Col 7 Col 8 Col 9 Col 10 Col 11 Col 12 Col 13 Col 14
Line Item 13-Month Avg. December January February March April May June July August September October November December= Sum (Cols. 2-14)/13
Bonds -- Account 221 (Note 1):
1 -$ -$ -$ -$ -$ -$ -$ -$ -$ -$ -$ -$ -$ -$ Reacquired Bonds -- Account 222 (Note 2): enter - of FF1
2 -$ -$ -$ -$ -$ -$ -$ -$ -$ -$ -$ -$ -$ -$ Long Term Debt Advances from Associated Companies (Note 3 2a):
'3 2a -$ -$ -$ -$ -$ -$ -$ -$ -$ -$ -$ -$ -$ -$ Other Long Term Debt -- Account 224 (Note 4 3):
4 3 -$ -$ -$ -$ -$ -$ -$ -$ -$ -$ -$ -$ -$ -$ Unamortized Premium on Long Term Debt -- Account 225 (Note 5)
5 4 NOT U -$ -$ -$ -$ -$ -$ -$ -$ -$ -$ -$ -$ -$ -$
Less Unamortized Discount on Long Term Debt -- Account 226 (Note 6): enter - of FF1
6 5 NOT U -$ -$ -$ -$ -$ -$ -$ -$ -$ -$ -$ -$ -$ -$
Unamortized Debt Expenses -- Account 181 (Note 7): enter - of FF1
7 6 NOT U -$ -$ -$ -$ -$ -$ -$ -$ -$ -$ -$ -$ -$ -$
Unamortized Loss on Reacquired Debt -- Account 189 (Note 8): enter - of FF1
8 7 NOT U -$ -$ -$ -$ -$ -$ -$ -$ -$ -$ -$ -$ -$ -$
Removal of Long Term Debt Related to Fuel Inventories (Note 9)
9 -$ -$ -$ -$ -$ -$ -$ -$ -$ -$ -$ -$ -$ -$
Adjustments related to "LT Debt Related to Fuel Inventories" (Note 10)
10 -$ -$ -$ -$ -$ -$ -$ -$ -$ -$ -$ -$ -$ -$
Preferred Stock Amount -- Account 204 (Note 118):
1118 -$ -$ -$ -$ -$ -$ -$ -$ -$ -$ -$ -$ -$ -$ Unamortized Issuance Costs (Note 129): enter negative - of FF1
1219 -$ -$ -$ -$ -$ -$ -$ -$ -$ -$ -$ -$ -$ -$ Net Gain (Loss) From Purchase and Tender Offers Note 1310):
1320 -$ -$ -$ -$ -$ -$ -$ -$ -$ -$ -$ -$ -$ -$ Total Proprietary Capital (Note 1411):
1427 -$ -$ -$ -$ -$ -$ -$ -$ -$ -$ -$ -$ -$ -$ Unappropriated Undist. Sub. Earnings -- Acct. 216.1 (Note 1512): enter - of FF1
1530 -$ -$ -$ -$ -$ -$ -$ -$ -$ -$ -$ -$ -$ -$ Accumulated Other Comprehensive Loss -- Account 219 (Note 1613): enter - of FF1
1631 -$ -$ -$ -$ -$ -$ -$ -$ -$ -$ -$ -$ -$ -$
Instructions:
1) Enter 13 months of balances for capital structure for Prior Year and December previous to Prior Year in Columns 2-14. Beginning and End of year amounts in Columns 2 and 14 are from FERC Form 1, as referenced in below notes.
2) NOT USED
3) Update notes 9 and 10 as necessary.
5-ROR-2
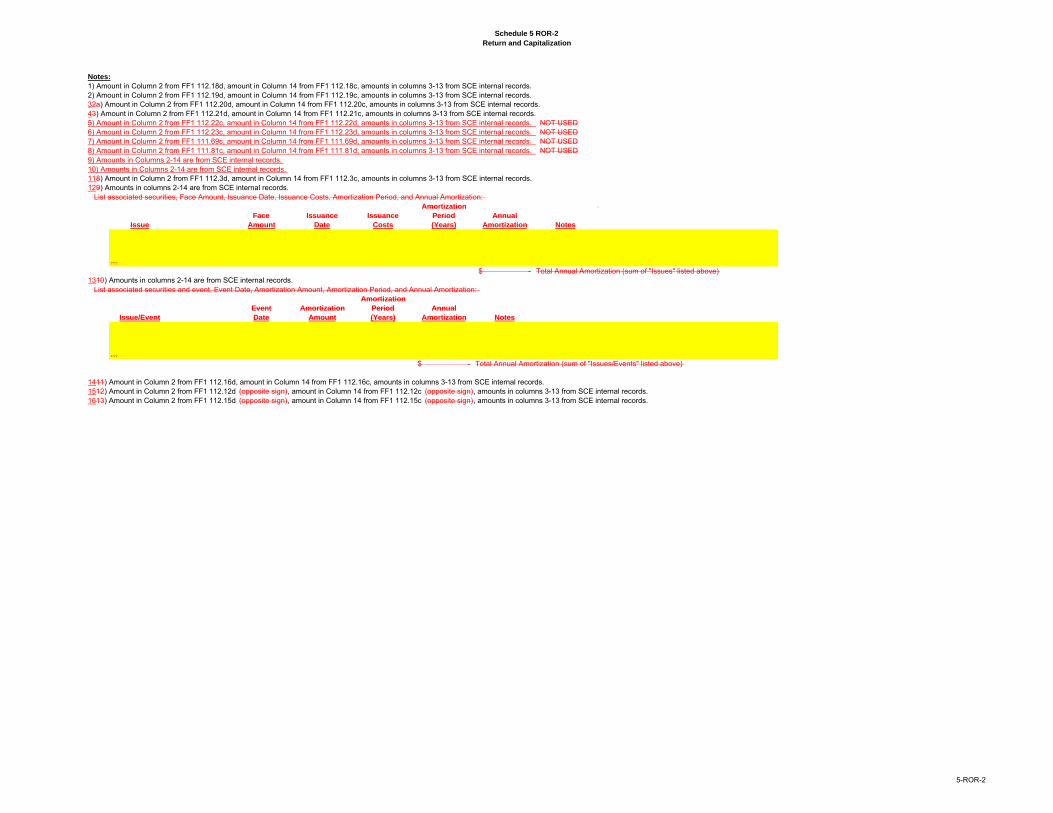
Schedule 5 ROR-2
Return and Capitalization
Notes:
1) Amount in Column 2 from FF1 112.18d, amount in Column 14 from FF1 112.18c, amounts in columns 3-13 from SCE internal records. 2) Amount in Column 2 from FF1 112.19d, amount in Column 14 from FF1 112.19c, amounts in columns 3-13 from SCE internal records. 32a) Amount in Column 2 from FF1 112.20d, amount in Column 14 from FF1 112.20c, amounts in columns 3-13 from SCE internal records. 43) Amount in Column 2 from FF1 112.21d, amount in Column 14 from FF1 112.21c, amounts in columns 3-13 from SCE internal records. 5) Amount in Column 2 from FF1 112.22c, amount in Column 14 from FF1 112.22d, amounts in columns 3-13 from SCE internal records. NOT USED6) Amount in Column 2 from FF1 112.23c, amount in Column 14 from FF1 112.23d, amounts in columns 3-13 from SCE internal records. NOT USED7) Amount in Column 2 from FF1 111.69c, amount in Column 14 from FF1 111.69d, amounts in columns 3-13 from SCE internal records. NOT USED8) Amount in Column 2 from FF1 111.81c, amount in Column 14 from FF1 111.81d, amounts in columns 3-13 from SCE internal records. NOT USED9) Amounts in Columns 2-14 are from SCE internal records.10) Amounts in Columns 2-14 are from SCE internal records.118) Amount in Column 2 from FF1 112.3d, amount in Column 14 from FF1 112.3c, amounts in columns 3-13 from SCE internal records. 129) Amounts in columns 2-14 are from SCE internal records.
List associated securities, Face Amount, Issuance Date, Issuance Costs, Amortization Period, and Annual Amortization:Amortization
Face Issuance Issuance Period Annual
Issue Amount Date Costs (Years) Amortization Notes
…-$ Total Annual Amortization (sum of "Issues" listed above)
1310) Amounts in columns 2-14 are from SCE internal records.List associated securities and event, Event Date, Amortization Amount, Amortization Period, and Annual Amortization:
Amortization
Event Amortization Period Annual
Issue/Event Date Amount (Years) Amortization Notes
…-$ Total Annual Amortization (sum of "Issues/Events" listed above)
1411) Amount in Column 2 from FF1 112.16d, amount in Column 14 from FF1 112.16c, amounts in columns 3-13 from SCE internal records. 1512) Amount in Column 2 from FF1 112.12d (opposite sign), amount in Column 14 from FF1 112.12c (opposite sign), amounts in columns 3-13 from SCE internal records. 1613) Amount in Column 2 from FF1 112.15d (opposite sign), amount in Column 14 from FF1 112.15c (opposite sign), amounts in columns 3-13 from SCE internal records.
5-ROR-2
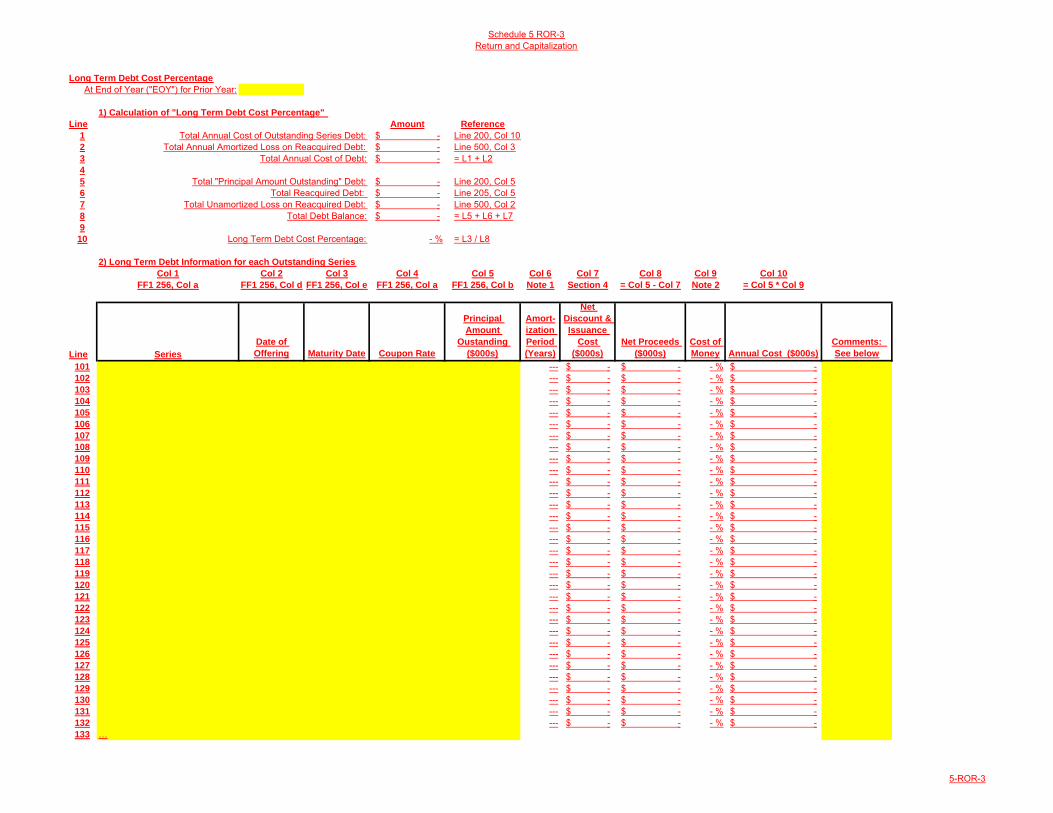
Schedule 5 ROR-3Return and Capitalization
Long Term Debt Cost Percentage
At End of Year ("EOY") for Prior Year:
1) Calculation of "Long Term Debt Cost Percentage"
Line Amount Reference
1 Total Annual Cost of Outstanding Series Debt: -$ Line 200, Col 102 Total Annual Amortized Loss on Reacquired Debt: -$ Line 500, Col 33 Total Annual Cost of Debt: -$ = L1 + L24
5 Total "Principal Amount Outstanding" Debt: -$ Line 200, Col 56 Total Reacquired Debt: -$ Line 205, Col 57 Total Unamortized Loss on Reacquired Debt: -$ Line 500, Col 28 Total Debt Balance: -$ = L5 + L6 + L79
10 Long Term Debt Cost Percentage: - % = L3 / L8
2) Long Term Debt Information for each Outstanding Series
Col 1 Col 2 Col 3 Col 4 Col 5 Col 6 Col 7 Col 8 Col 9 Col 10
FF1 256, Col a FF1 256, Col d FF1 256, Col e FF1 256, Col a FF1 256, Col b Note 1 Section 4 = Col 5 - Col 7 Note 2 = Col 5 * Col 9
Line Series
Date of
Offering Maturity Date Coupon Rate
Principal
Amount
Oustanding
($000s)
Amort-
ization
Period
(Years)
Net
Discount &
Issuance
Cost
($000s)
Net Proceeds
($000s)
Cost of
Money Annual Cost ($000s)
Comments:
See below
101 --- -$ -$ - % -$ 102 --- -$ -$ - % -$ 103 --- -$ -$ - % -$ 104 --- -$ -$ - % -$ 105 --- -$ -$ - % -$ 106 --- -$ -$ - % -$ 107 --- -$ -$ - % -$ 108 --- -$ -$ - % -$ 109 --- -$ -$ - % -$ 110 --- -$ -$ - % -$ 111 --- -$ -$ - % -$ 112 --- -$ -$ - % -$ 113 --- -$ -$ - % -$ 114 --- -$ -$ - % -$ 115 --- -$ -$ - % -$ 116 --- -$ -$ - % -$ 117 --- -$ -$ - % -$ 118 --- -$ -$ - % -$ 119 --- -$ -$ - % -$ 120 --- -$ -$ - % -$ 121 --- -$ -$ - % -$ 122 --- -$ -$ - % -$ 123 --- -$ -$ - % -$ 124 --- -$ -$ - % -$ 125 --- -$ -$ - % -$ 126 --- -$ -$ - % -$ 127 --- -$ -$ - % -$ 128 --- -$ -$ - % -$ 129 --- -$ -$ - % -$ 130 --- -$ -$ - % -$ 131 --- -$ -$ - % -$ 132 --- -$ -$ - % -$ 133 …
5-ROR-3
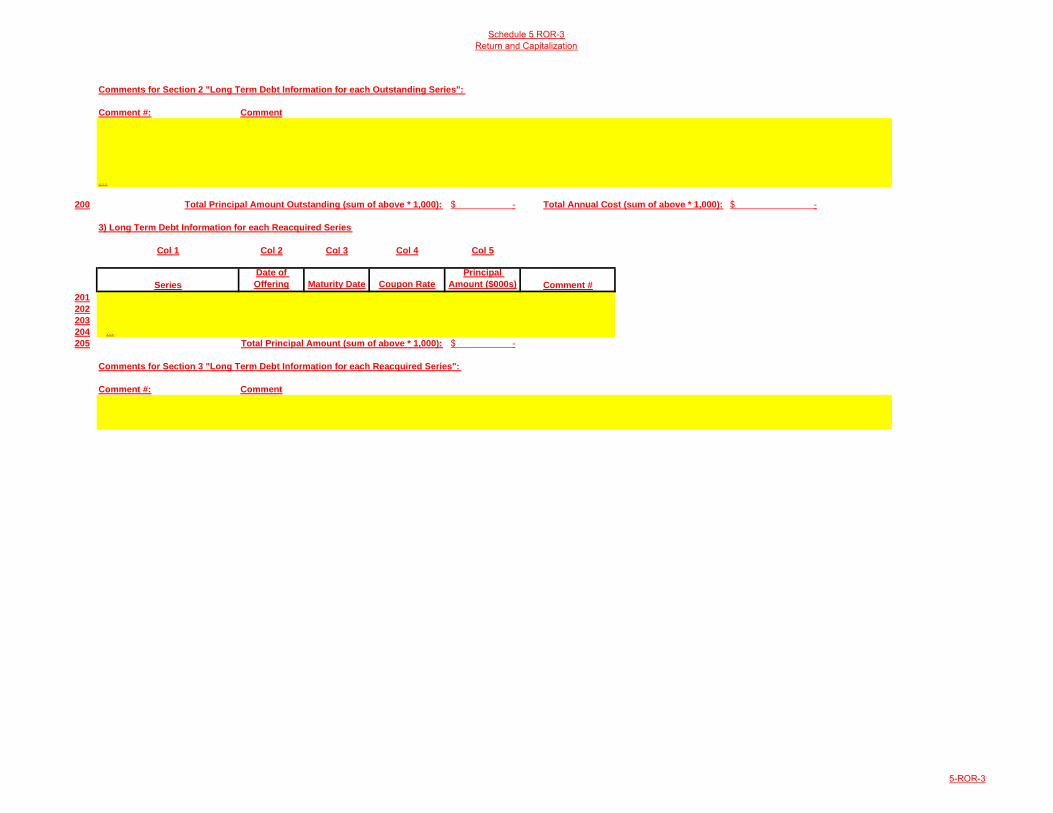
Schedule 5 ROR-3Return and Capitalization
Comments for Section 2 "Long Term Debt Information for each Outstanding Series":
Comment #: Comment
…
200 Total Principal Amount Outstanding (sum of above * 1,000): -$ Total Annual Cost (sum of above * 1,000): -$
3) Long Term Debt Information for each Reacquired Series
Col 1 Col 2 Col 3 Col 4 Col 5
Series
Date of
Offering Maturity Date Coupon Rate
Principal
Amount ($000s)
201
202
203
204 …
205 Total Principal Amount (sum of above * 1,000): -$
Comments for Section 3 "Long Term Debt Information for each Reacquired Series":
Comment #: Comment
Comment #
5-ROR-3
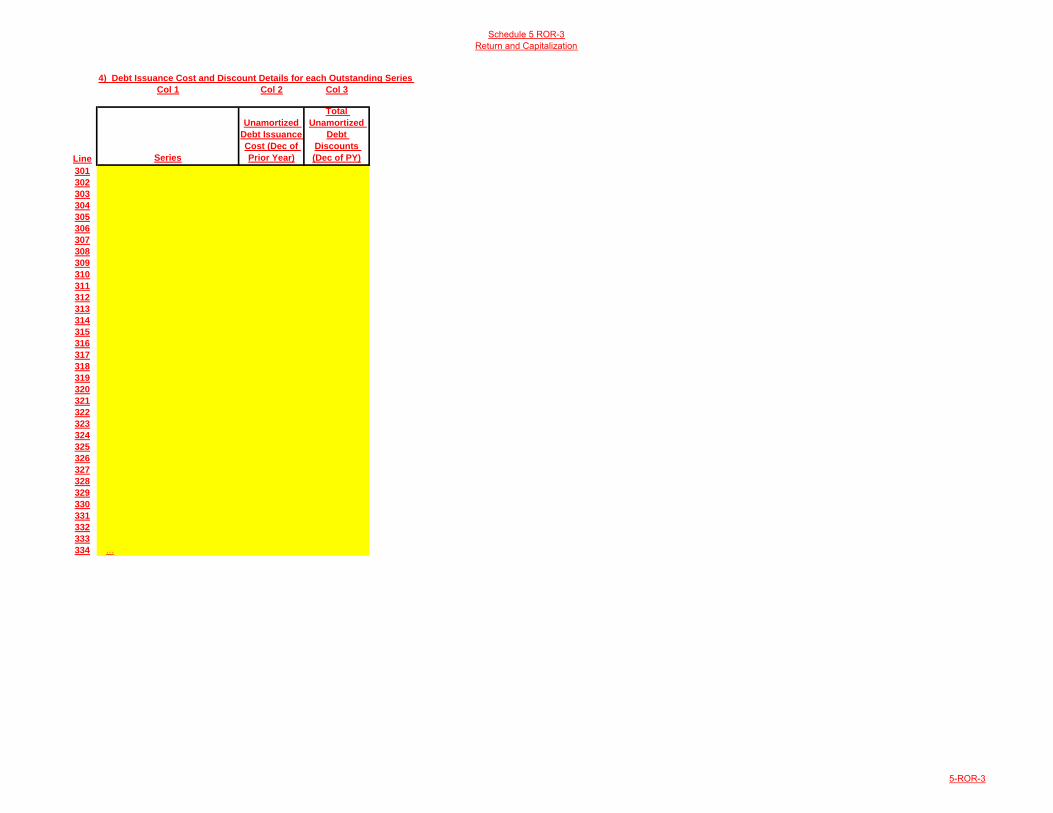
Schedule 5 ROR-3Return and Capitalization
4) Debt Issuance Cost and Discount Details for each Outstanding Series
Col 1 Col 2 Col 3
Line Series
Unamortized
Debt Issuance
Cost (Dec of
Prior Year)
Total
Unamortized
Debt
Discounts
(Dec of PY)
301
302
303
304
305
306
307
308
309
310
311
312
313
314
315
316
317
318
319
320
321
322
323
324
325
326
327
328
329
330
331
332
333
334 …
5-ROR-3
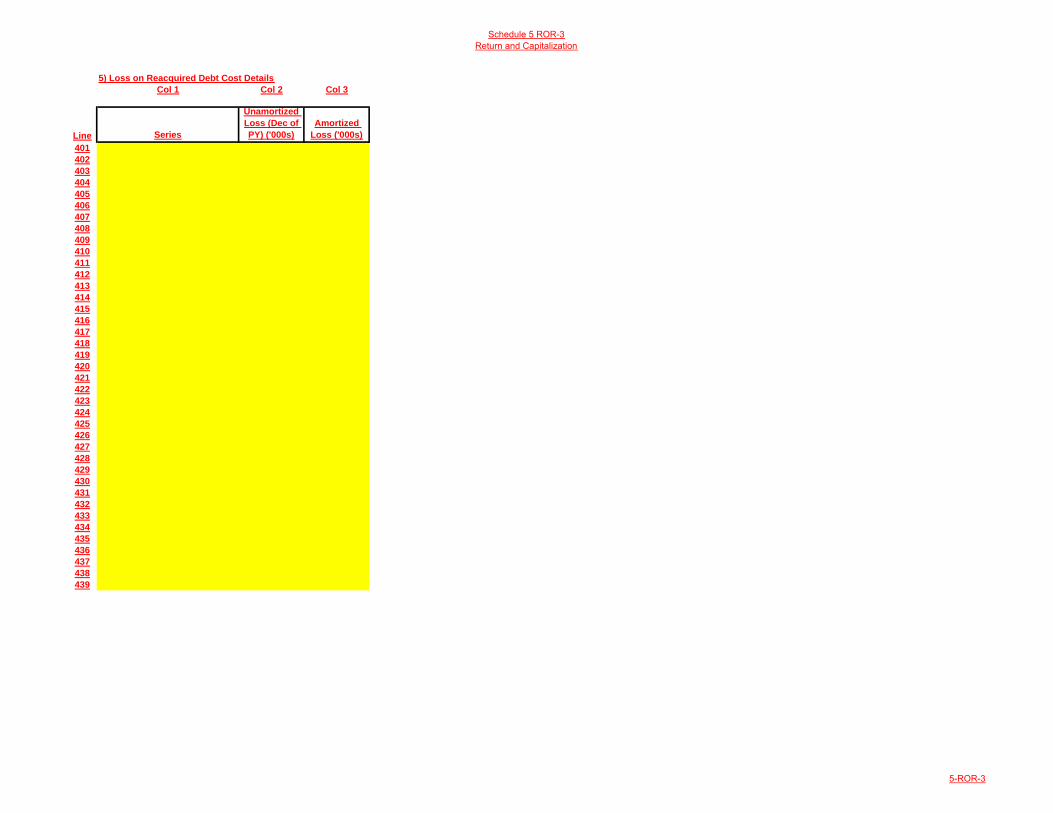
Schedule 5 ROR-3Return and Capitalization
5) Loss on Reacquired Debt Cost Details
Col 1 Col 2 Col 3
Line Series
Unamortized
Loss (Dec of
PY) ('000s)
Amortized
Loss ('000s)
401
402
403
404
405
406
407
408
409
410
411
412
413
414
415
416
417
418
419
420
421
422
423
424
425
426
427
428
429
430
431
432
433
434
435
436
437
438
439
5-ROR-3
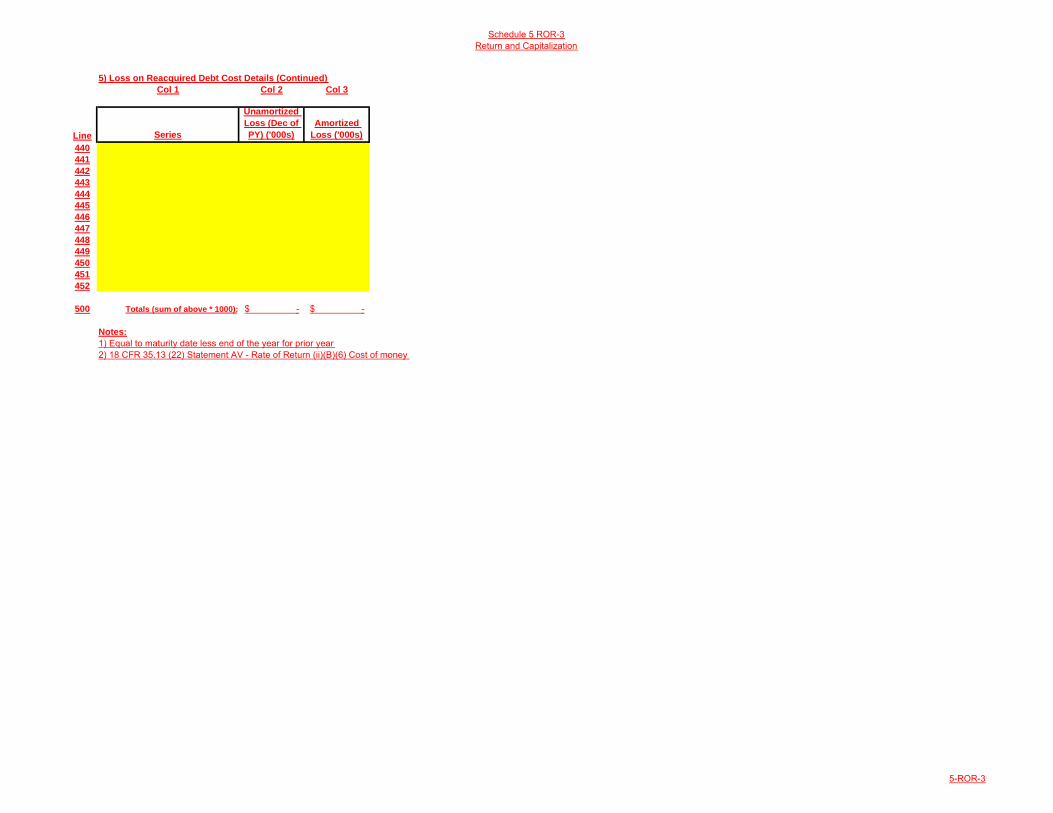
Schedule 5 ROR-3Return and Capitalization
5) Loss on Reacquired Debt Cost Details (Continued)
Col 1 Col 2 Col 3
Line Series
Unamortized
Loss (Dec of
PY) ('000s)
Amortized
Loss ('000s)
440
441
442
443
444
445
446
447
448
449
450
451
452
500 Totals (sum of above * 1000): -$ -$
Notes:
1) Equal to maturity date less end of the year for prior year2) 18 CFR 35.13 (22) Statement AV - Rate of Return (ii)(B)(6) Cost of money
5-ROR-3
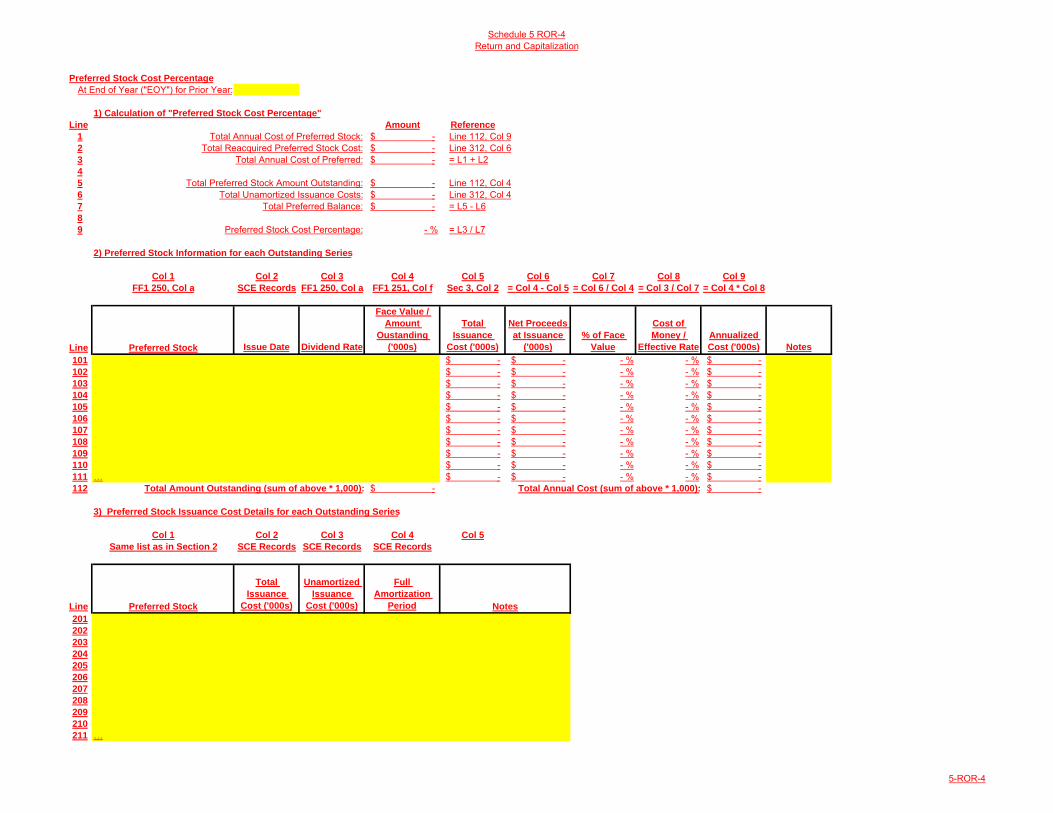
Schedule 5 ROR-4Return and Capitalization
Preferred Stock Cost Percentage
At End of Year ("EOY") for Prior Year:
1) Calculation of "Preferred Stock Cost Percentage"
Line Amount Reference
1 Total Annual Cost of Preferred Stock: -$ Line 112, Col 92 Total Reacquired Preferred Stock Cost: -$ Line 312, Col 63 Total Annual Cost of Preferred: -$ = L1 + L24
5 Total Preferred Stock Amount Outstanding: -$ Line 112, Col 46 Total Unamortized Issuance Costs: -$ Line 312, Col 47 Total Preferred Balance: -$ = L5 - L68
9 Preferred Stock Cost Percentage: - % = L3 / L7
2) Preferred Stock Information for each Outstanding Series
Col 1 Col 2 Col 3 Col 4 Col 5 Col 6 Col 7 Col 8 Col 9
FF1 250, Col a SCE Records FF1 250, Col a FF1 251, Col f Sec 3, Col 2 = Col 4 - Col 5 = Col 6 / Col 4 = Col 3 / Col 7 = Col 4 * Col 8
Line Preferred Stock Issue Date Dividend Rate
Face Value /
Amount
Oustanding
('000s)
Total
Issuance
Cost ('000s)
Net Proceeds
at Issuance
('000s)
% of Face
Value
Cost of
Money /
Effective Rate
Annualized
Cost ('000s) Notes
101 -$ -$ - % - % -$ 102 -$ -$ - % - % -$ 103 -$ -$ - % - % -$ 104 -$ -$ - % - % -$ 105 -$ -$ - % - % -$ 106 -$ -$ - % - % -$ 107 -$ -$ - % - % -$ 108 -$ -$ - % - % -$ 109 -$ -$ - % - % -$ 110 -$ -$ - % - % -$ 111 … -$ -$ - % - % -$ 112 Total Amount Outstanding (sum of above * 1,000): -$ Total Annual Cost (sum of above * 1,000): -$
3) Preferred Stock Issuance Cost Details for each Outstanding Series
Col 1 Col 2 Col 3 Col 4 Col 5
Same list as in Section 2 SCE Records SCE Records SCE Records
Line Preferred Stock
Total
Issuance
Cost ('000s)
Unamortized
Issuance
Cost ('000s)
Full
Amortization
Period
201
202
203
204
205
206
207
208
209
210
211 …
Notes
5-ROR-4
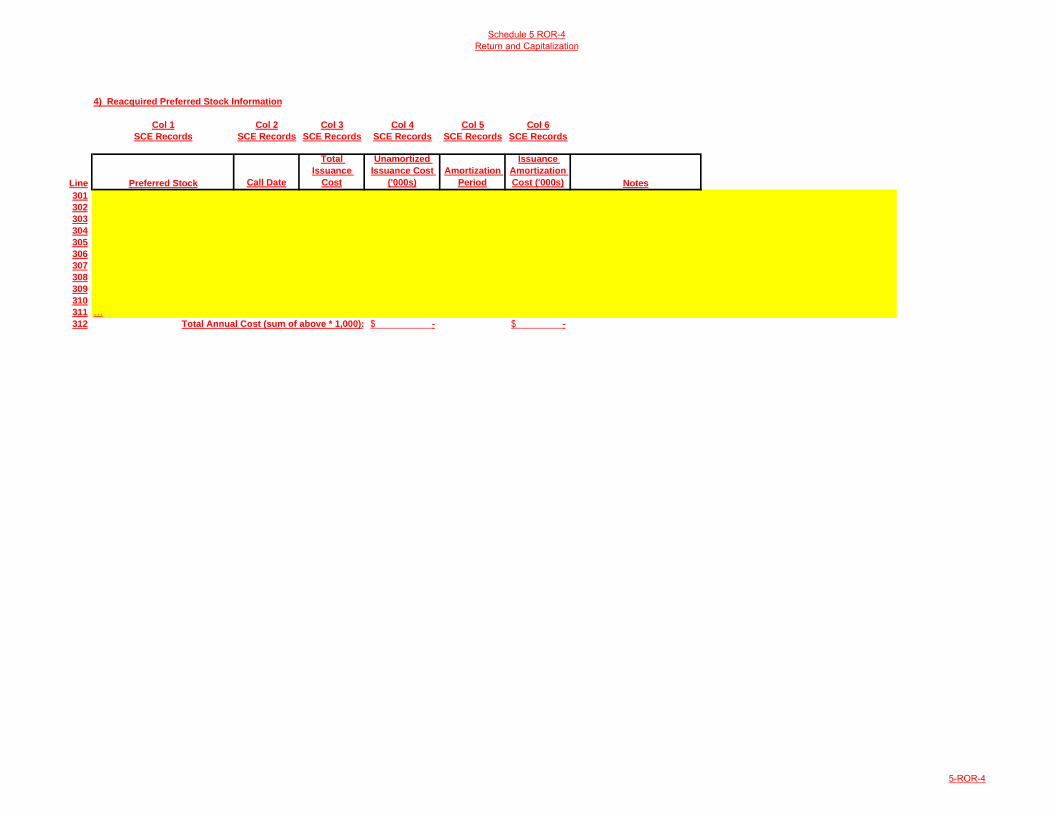
Schedule 5 ROR-4Return and Capitalization
4) Reacquired Preferred Stock Information
Col 1 Col 2 Col 3 Col 4 Col 5 Col 6
SCE Records SCE Records SCE Records SCE Records SCE Records SCE Records
Line Preferred Stock Call Date
Total
Issuance
Cost
Unamortized
Issuance Cost
('000s)
Amortization
Period
Issuance
Amortization
Cost ('000s)
301
302
303
304
305
306
307
308
309
310
311 …312 Total Annual Cost (sum of above * 1,000): -$ -$
Notes
5-ROR-4
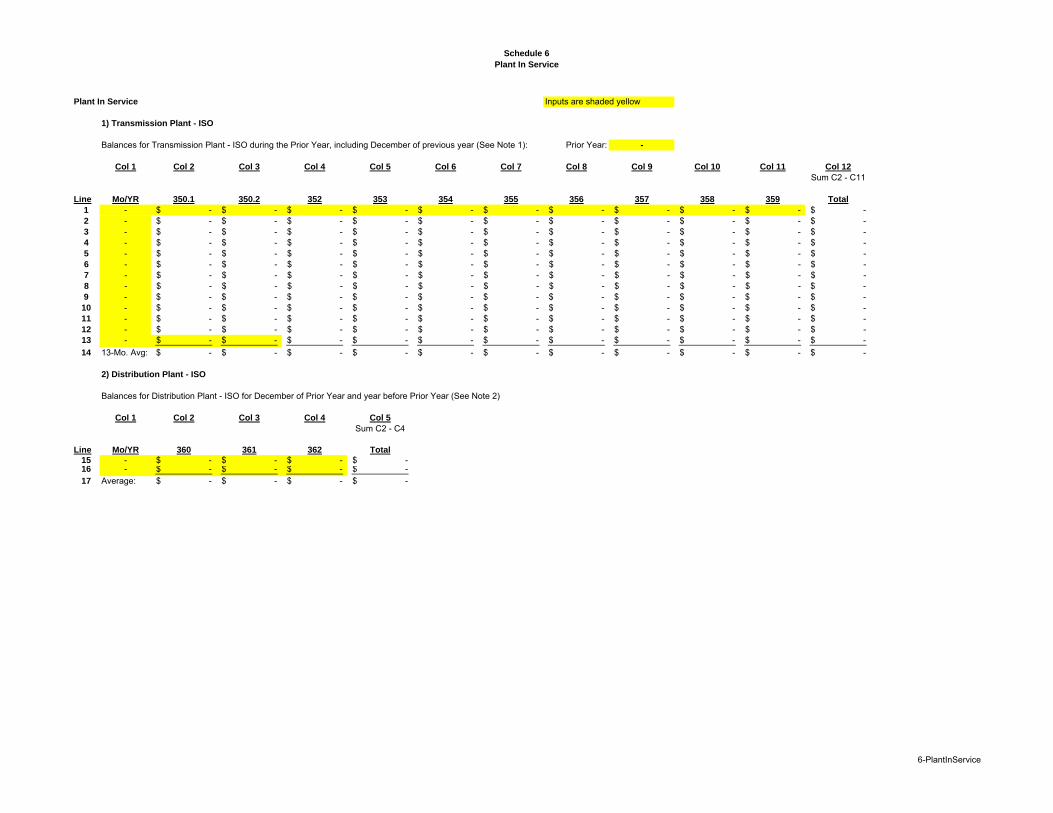
Schedule 6
Plant In Service
Plant In Service Inputs are shaded yellow
1) Transmission Plant - ISO
Balances for Transmission Plant - ISO during the Prior Year, including December of previous year (See Note 1): Prior Year: -
Col 1 Col 2 Col 3 Col 4 Col 5 Col 6 Col 7 Col 8 Col 9 Col 10 Col 11 Col 12
Sum C2 - C11
Line Mo/YR 350.1 350.2 352 353 354 355 356 357 358 359 Total
1 - -$ -$ -$ -$ -$ -$ -$ -$ -$ -$ -$ 2 - -$ -$ -$ -$ -$ -$ -$ -$ -$ -$ -$ 3 - -$ -$ -$ -$ -$ -$ -$ -$ -$ -$ -$ 4 - -$ -$ -$ -$ -$ -$ -$ -$ -$ -$ -$ 5 - -$ -$ -$ -$ -$ -$ -$ -$ -$ -$ -$ 6 - -$ -$ -$ -$ -$ -$ -$ -$ -$ -$ -$ 7 - -$ -$ -$ -$ -$ -$ -$ -$ -$ -$ -$ 8 - -$ -$ -$ -$ -$ -$ -$ -$ -$ -$ -$ 9 - -$ -$ -$ -$ -$ -$ -$ -$ -$ -$ -$ 10 - -$ -$ -$ -$ -$ -$ -$ -$ -$ -$ -$ 11 - -$ -$ -$ -$ -$ -$ -$ -$ -$ -$ -$ 12 - -$ -$ -$ -$ -$ -$ -$ -$ -$ -$ -$ 13 - -$ -$ -$ -$ -$ -$ -$ -$ -$ -$ -$
14 13-Mo. Avg: -$ -$ -$ -$ -$ -$ -$ -$ -$ -$ -$
2) Distribution Plant - ISO
Balances for Distribution Plant - ISO for December of Prior Year and year before Prior Year (See Note 2)
Col 1 Col 2 Col 3 Col 4 Col 5
Sum C2 - C4
Line Mo/YR 360 361 362 Total
15 - -$ -$ -$ -$ 16 - -$ -$ -$ -$ 17 Average: -$ -$ -$ -$
6-PlantInService
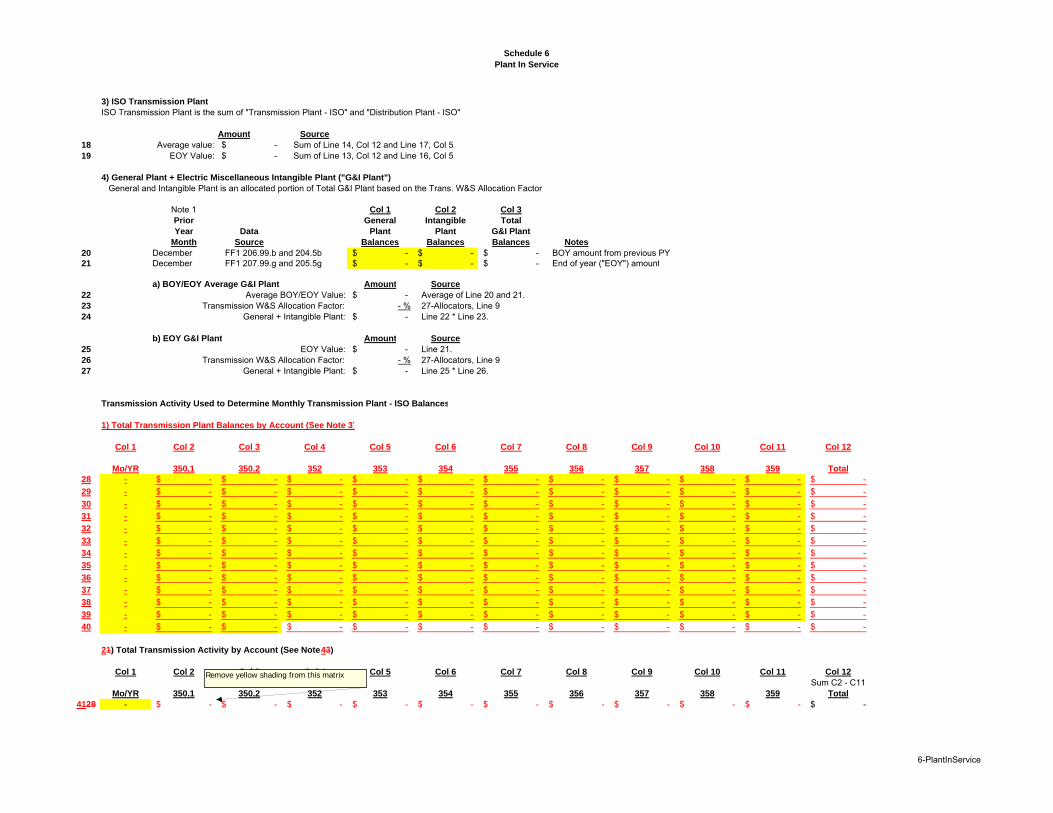
Schedule 6
Plant In Service
3) ISO Transmission Plant
ISO Transmission Plant is the sum of "Transmission Plant - ISO" and "Distribution Plant - ISO"
Amount Source
18 Average value: -$ Sum of Line 14, Col 12 and Line 17, Col 519 EOY Value: -$ Sum of Line 13, Col 12 and Line 16, Col 5
4) General Plant + Electric Miscellaneous Intangible Plant ("G&I Plant")
General and Intangible Plant is an allocated portion of Total G&I Plant based on the Trans. W&S Allocation Factor
Note 1 Col 1 Col 2 Col 3
Prior General Intangible Total
Year Data Plant Plant G&I Plant
Month Source Balances Balances Balances Notes
20 December FF1 206.99.b and 204.5b -$ -$ -$ BOY amount from previous PY21 December FF1 207.99.g and 205.5g -$ -$ -$ End of year ("EOY") amount
a) BOY/EOY Average G&I Plant Amount Source
22 Average BOY/EOY Value: -$ Average of Line 20 and 21.23 Transmission W&S Allocation Factor: - % 27-Allocators, Line 924 General + Intangible Plant: -$ Line 22 * Line 23.
b) EOY G&I Plant Amount Source
25 EOY Value: -$ Line 21.26 Transmission W&S Allocation Factor: - % 27-Allocators, Line 927 General + Intangible Plant: -$ Line 25 * Line 26.
Transmission Activity Used to Determine Monthly Transmission Plant - ISO Balances
1) Total Transmission Plant Balances by Account (See Note 3)
Col 1 Col 2 Col 3 Col 4 Col 5 Col 6 Col 7 Col 8 Col 9 Col 10 Col 11 Col 12
Mo/YR 350.1 350.2 352 353 354 355 356 357 358 359 Total
28 - -$ -$ -$ -$ -$ -$ -$ -$ -$ -$ -$
29 - -$ -$ -$ -$ -$ -$ -$ -$ -$ -$ -$
30 - -$ -$ -$ -$ -$ -$ -$ -$ -$ -$ -$
31 - -$ -$ -$ -$ -$ -$ -$ -$ -$ -$ -$
32 - -$ -$ -$ -$ -$ -$ -$ -$ -$ -$ -$
33 - -$ -$ -$ -$ -$ -$ -$ -$ -$ -$ -$
34 - -$ -$ -$ -$ -$ -$ -$ -$ -$ -$ -$
35 - -$ -$ -$ -$ -$ -$ -$ -$ -$ -$ -$
36 - -$ -$ -$ -$ -$ -$ -$ -$ -$ -$ -$
37 - -$ -$ -$ -$ -$ -$ -$ -$ -$ -$ -$
38 - -$ -$ -$ -$ -$ -$ -$ -$ -$ -$ -$
39 - -$ -$ -$ -$ -$ -$ -$ -$ -$ -$ -$
40 - -$ -$ -$ -$ -$ -$ -$ -$ -$ -$ -$
21) Total Transmission Activity by Account (See Note 43)
Col 1 Col 2 Col 3 Col 4 Col 5 Col 6 Col 7 Col 8 Col 9 Col 10 Col 11 Col 12
Sum C2 - C11Mo/YR 350.1 350.2 352 353 354 355 356 357 358 359 Total
4128 - -$ -$ -$ -$ -$ -$ -$ -$ -$ -$ -$
Remove yellow shading from this matrix
6-PlantInService
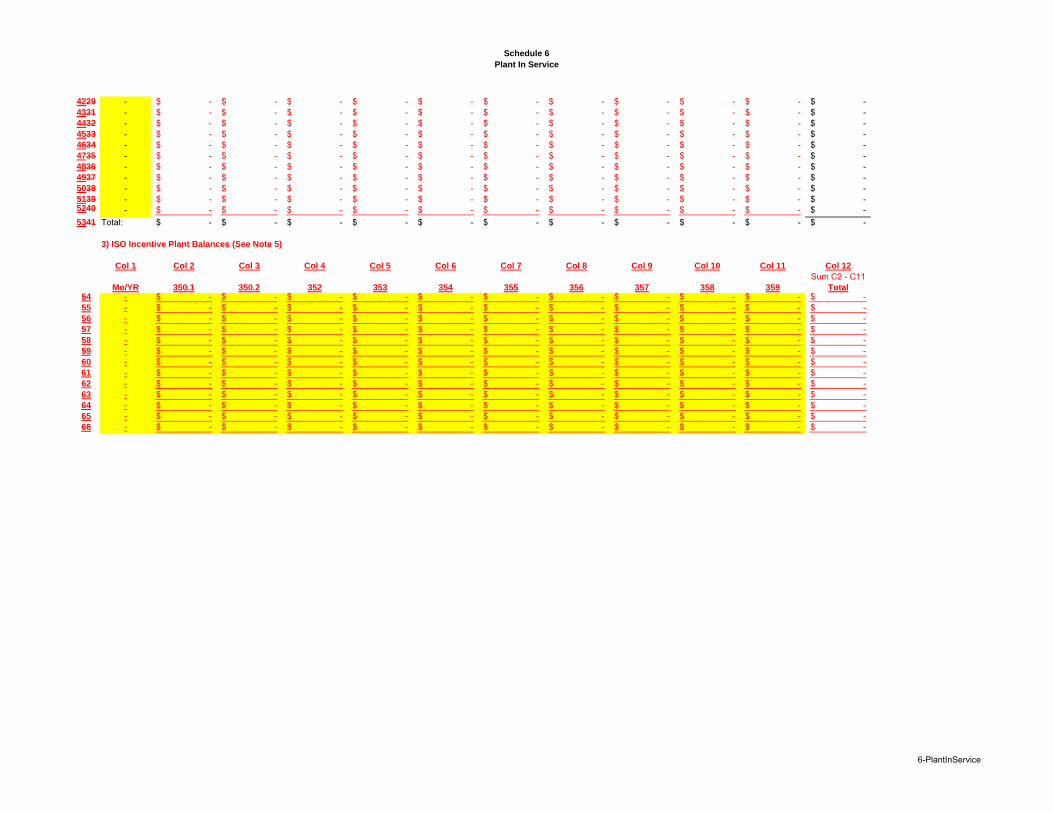
Schedule 6
Plant In Service
4229 - -$ -$ -$ -$ -$ -$ -$ -$ -$ -$ -$ 4331 - -$ -$ -$ -$ -$ -$ -$ -$ -$ -$ -$ 4432 - -$ -$ -$ -$ -$ -$ -$ -$ -$ -$ -$ 4533 - -$ -$ -$ -$ -$ -$ -$ -$ -$ -$ -$ 4634 - -$ -$ -$ -$ -$ -$ -$ -$ -$ -$ -$ 4735 - -$ -$ -$ -$ -$ -$ -$ -$ -$ -$ -$ 4836 - -$ -$ -$ -$ -$ -$ -$ -$ -$ -$ -$ 4937 - -$ -$ -$ -$ -$ -$ -$ -$ -$ -$ -$ 5038 - -$ -$ -$ -$ -$ -$ -$ -$ -$ -$ -$ 5139 - -$ -$ -$ -$ -$ -$ -$ -$ -$ -$ -$ 5240 - -$ -$ -$ -$ -$ -$ -$ -$ -$ -$ -$
5341 Total: -$ -$ -$ -$ -$ -$ -$ -$ -$ -$ -$
3) ISO Incentive Plant Balances (See Note 5)
Col 1 Col 2 Col 3 Col 4 Col 5 Col 6 Col 7 Col 8 Col 9 Col 10 Col 11 Col 12
Sum C2 - C11Mo/YR 350.1 350.2 352 353 354 355 356 357 358 359 Total
54 - -$ -$ -$ -$ -$ -$ -$ -$ -$ -$ -$ 55 - -$ -$ -$ -$ -$ -$ -$ -$ -$ -$ -$ 56 - -$ -$ -$ -$ -$ -$ -$ -$ -$ -$ -$ 57 - -$ -$ -$ -$ -$ -$ -$ -$ -$ -$ -$ 58 - -$ -$ -$ -$ -$ -$ -$ -$ -$ -$ -$ 59 - -$ -$ -$ -$ -$ -$ -$ -$ -$ -$ -$ 60 - -$ -$ -$ -$ -$ -$ -$ -$ -$ -$ -$ 61 - -$ -$ -$ -$ -$ -$ -$ -$ -$ -$ -$ 62 - -$ -$ -$ -$ -$ -$ -$ -$ -$ -$ -$ 63 - -$ -$ -$ -$ -$ -$ -$ -$ -$ -$ -$ 64 - -$ -$ -$ -$ -$ -$ -$ -$ -$ -$ -$ 65 - -$ -$ -$ -$ -$ -$ -$ -$ -$ -$ -$ 66 - -$ -$ -$ -$ -$ -$ -$ -$ -$ -$ -$
6-PlantInService
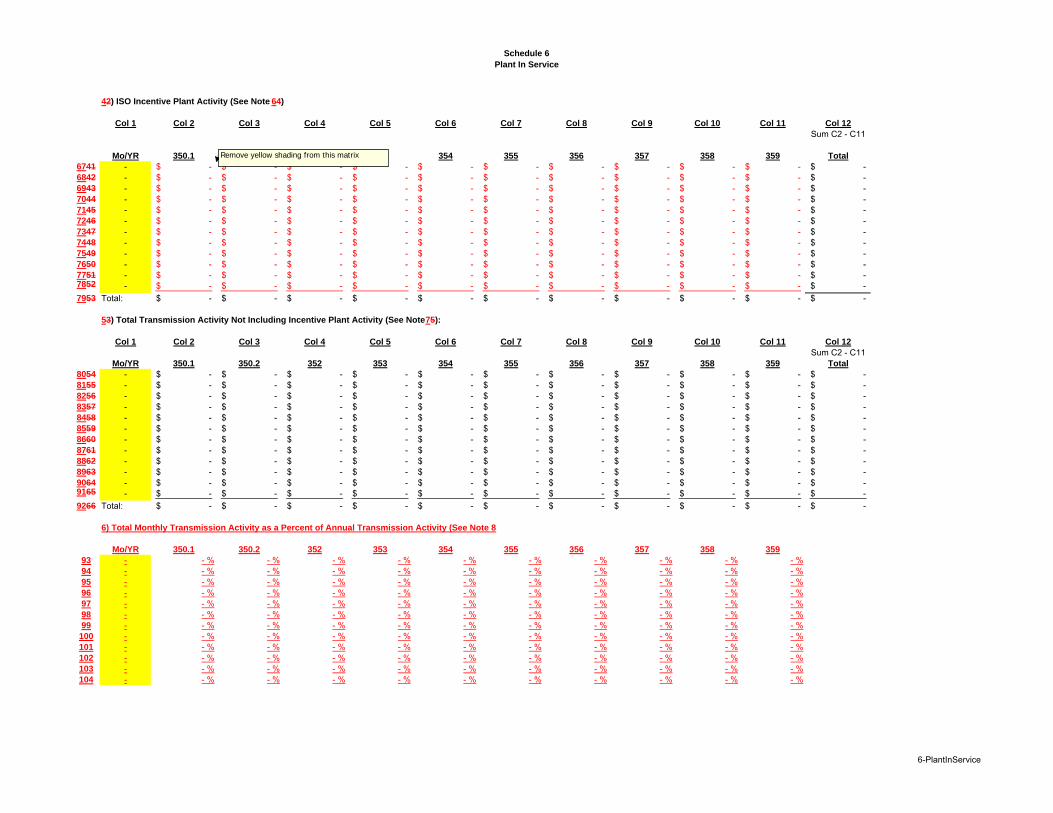
Schedule 6
Plant In Service
42) ISO Incentive Plant Activity (See Note 64)
Col 1 Col 2 Col 3 Col 4 Col 5 Col 6 Col 7 Col 8 Col 9 Col 10 Col 11 Col 12
Sum C2 - C11
Mo/YR 350.1 350.2 352 353 354 355 356 357 358 359 Total
6741 - -$ -$ -$ -$ -$ -$ -$ -$ -$ -$ -$ 6842 - -$ -$ -$ -$ -$ -$ -$ -$ -$ -$ -$ 6943 - -$ -$ -$ -$ -$ -$ -$ -$ -$ -$ -$ 7044 - -$ -$ -$ -$ -$ -$ -$ -$ -$ -$ -$ 7145 - -$ -$ -$ -$ -$ -$ -$ -$ -$ -$ -$ 7246 - -$ -$ -$ -$ -$ -$ -$ -$ -$ -$ -$ 7347 - -$ -$ -$ -$ -$ -$ -$ -$ -$ -$ -$ 7448 - -$ -$ -$ -$ -$ -$ -$ -$ -$ -$ -$ 7549 - -$ -$ -$ -$ -$ -$ -$ -$ -$ -$ -$ 7650 - -$ -$ -$ -$ -$ -$ -$ -$ -$ -$ -$ 7751 - -$ -$ -$ -$ -$ -$ -$ -$ -$ -$ -$ 7852 - -$ -$ -$ -$ -$ -$ -$ -$ -$ -$ -$
7953 Total: -$ -$ -$ -$ -$ -$ -$ -$ -$ -$ -$
53) Total Transmission Activity Not Including Incentive Plant Activity (See Note 75):
Col 1 Col 2 Col 3 Col 4 Col 5 Col 6 Col 7 Col 8 Col 9 Col 10 Col 11 Col 12
Sum C2 - C11Mo/YR 350.1 350.2 352 353 354 355 356 357 358 359 Total
8054 - -$ -$ -$ -$ -$ -$ -$ -$ -$ -$ -$ 8155 - -$ -$ -$ -$ -$ -$ -$ -$ -$ -$ -$ 8256 - -$ -$ -$ -$ -$ -$ -$ -$ -$ -$ -$ 8357 - -$ -$ -$ -$ -$ -$ -$ -$ -$ -$ -$ 8458 - -$ -$ -$ -$ -$ -$ -$ -$ -$ -$ -$ 8559 - -$ -$ -$ -$ -$ -$ -$ -$ -$ -$ -$ 8660 - -$ -$ -$ -$ -$ -$ -$ -$ -$ -$ -$ 8761 - -$ -$ -$ -$ -$ -$ -$ -$ -$ -$ -$ 8862 - -$ -$ -$ -$ -$ -$ -$ -$ -$ -$ -$ 8963 - -$ -$ -$ -$ -$ -$ -$ -$ -$ -$ -$ 9064 - -$ -$ -$ -$ -$ -$ -$ -$ -$ -$ -$ 9165 - -$ -$ -$ -$ -$ -$ -$ -$ -$ -$ -$
9266 Total: -$ -$ -$ -$ -$ -$ -$ -$ -$ -$ -$
6) Total Monthly Transmission Activity as a Percent of Annual Transmission Activity (See Note 8
Mo/YR 350.1 350.2 352 353 354 355 356 357 358 359
93 - - % - % - % - % - % - % - % - % - % - %94 - - % - % - % - % - % - % - % - % - % - %95 - - % - % - % - % - % - % - % - % - % - %96 - - % - % - % - % - % - % - % - % - % - %97 - - % - % - % - % - % - % - % - % - % - %98 - - % - % - % - % - % - % - % - % - % - %99 - - % - % - % - % - % - % - % - % - % - %100 - - % - % - % - % - % - % - % - % - % - %101 - - % - % - % - % - % - % - % - % - % - %102 - - % - % - % - % - % - % - % - % - % - %103 - - % - % - % - % - % - % - % - % - % - %104 - - % - % - % - % - % - % - % - % - % - %
Remove yellow shading from this matrix
6-PlantInService
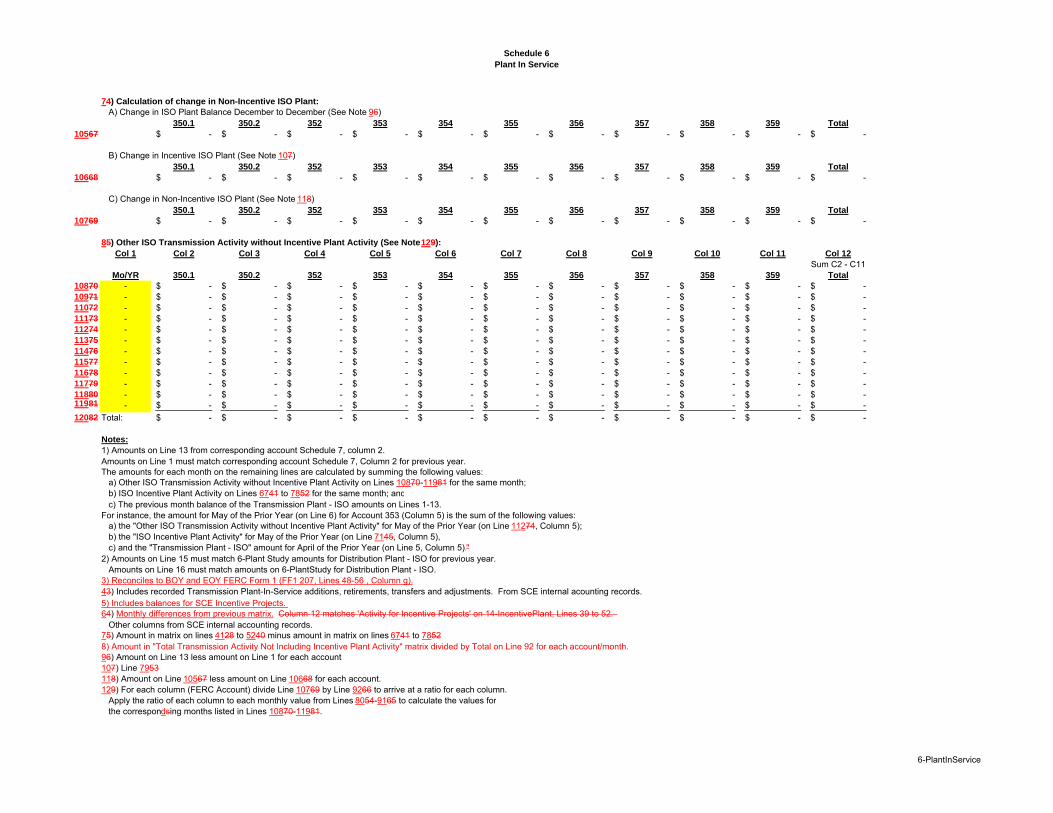
Schedule 6
Plant In Service
74) Calculation of change in Non-Incentive ISO Plant:
A) Change in ISO Plant Balance December to December (See Note 96)350.1 350.2 352 353 354 355 356 357 358 359 Total
10567 -$ -$ -$ -$ -$ -$ -$ -$ -$ -$ -$
B) Change in Incentive ISO Plant (See Note 107)350.1 350.2 352 353 354 355 356 357 358 359 Total
10668 -$ -$ -$ -$ -$ -$ -$ -$ -$ -$ -$
C) Change in Non-Incentive ISO Plant (See Note 118)350.1 350.2 352 353 354 355 356 357 358 359 Total
10769 -$ -$ -$ -$ -$ -$ -$ -$ -$ -$ -$
85) Other ISO Transmission Activity without Incentive Plant Activity (See Note 129):
Col 1 Col 2 Col 3 Col 4 Col 5 Col 6 Col 7 Col 8 Col 9 Col 10 Col 11 Col 12
Sum C2 - C11Mo/YR 350.1 350.2 352 353 354 355 356 357 358 359 Total
10870 - -$ -$ -$ -$ -$ -$ -$ -$ -$ -$ -$ 10971 - -$ -$ -$ -$ -$ -$ -$ -$ -$ -$ -$ 11072 - -$ -$ -$ -$ -$ -$ -$ -$ -$ -$ -$ 11173 - -$ -$ -$ -$ -$ -$ -$ -$ -$ -$ -$ 11274 - -$ -$ -$ -$ -$ -$ -$ -$ -$ -$ -$ 11375 - -$ -$ -$ -$ -$ -$ -$ -$ -$ -$ -$ 11476 - -$ -$ -$ -$ -$ -$ -$ -$ -$ -$ -$ 11577 - -$ -$ -$ -$ -$ -$ -$ -$ -$ -$ -$ 11678 - -$ -$ -$ -$ -$ -$ -$ -$ -$ -$ -$ 11779 - -$ -$ -$ -$ -$ -$ -$ -$ -$ -$ -$ 11880 - -$ -$ -$ -$ -$ -$ -$ -$ -$ -$ -$ 11981 - -$ -$ -$ -$ -$ -$ -$ -$ -$ -$ -$
12082 Total: -$ -$ -$ -$ -$ -$ -$ -$ -$ -$ -$
Notes:
1) Amounts on Line 13 from corresponding account Schedule 7, column 2. Amounts on Line 1 must match corresponding account Schedule 7, Column 2 for previous year.The amounts for each month on the remaining lines are calculated by summing the following values:
a) Other ISO Transmission Activity without Incentive Plant Activity on Lines 10870-11981 for the same month;b) ISO Incentive Plant Activity on Lines 6741 to 7852 for the same month; andc) The previous month balance of the Transmission Plant - ISO amounts on Lines 1-13.
For instance, the amount for May of the Prior Year (on Line 6) for Account 353 (Column 5) is the sum of the following values: a) the "Other ISO Transmission Activity without Incentive Plant Activity" for May of the Prior Year (on Line 11274, Column 5);b) the "ISO Incentive Plant Activity" for May of the Prior Year (on Line 7145, Column 5),c) and the "Transmission Plant - ISO" amount for April of the Prior Year (on Line 5, Column 5)."
2) Amounts on Line 15 must match 6-Plant Study amounts for Distribution Plant - ISO for previous year.Amounts on Line 16 must match amounts on 6-PlantStudy for Distribution Plant - ISO.
3) Reconciles to BOY and EOY FERC Form 1 (FF1 207, Lines 48-56 , Column g).43) Includes recorded Transmission Plant-In-Service additions, retirements, transfers and adjustments. From SCE internal acounting records.5) Includes balances for SCE Incentive Projects. 64) Monthly differences from previous matrix. Column 12 matches 'Activity for Incentive Projects' on 14-IncentivePlant, Lines 39 to 52.
Other columns from SCE internal accounting records.75) Amount in matrix on lines 4128 to 5240 minus amount in matrix on lines 6741 to 78528) Amount in "Total Transmission Activity Not Including Incentive Plant Activity" matrix divided by Total on Line 92 for each account/month.96) Amount on Line 13 less amount on Line 1 for each account.107) Line 7953118) Amount on Line 10567 less amount on Line 10668 for each account.129) For each column (FERC Account) divide Line 10769 by Line 9266 to arrive at a ratio for each column.
Apply the ratio of each column to each monthly value from Lines 8054-9165 to calculate the values forthe correspondsing months listed in Lines 10870-11981.
6-PlantInService

Schedule 7
Transmission Plant Study Summary
Transmission Plant Study Input cells are shaded yellow
A) Plant Classified as Transmission in FERC Form 1 for Prior Year: Prior Year: -
Col 1 Col 2 Col 3
Line Total Transmission ISO %
1 Account Plant Data Source Plant - ISO of Total Notes
2 Substation
3 352 -$ FF1 207.49g -$ - %4 353 -$ FF1 207.50g -$ - %
5 Total Substation -$ L 3 + L 4 -$ - %6
7 Land
8 350 -$ FF1 207.48g -$ - %9
10 Total Substation and Land -$ L 5 + L 8 -$ - %11
12 Lines
13 354 -$ FF1 207.51g -$ - %14 355 -$ FF1 207.52g -$ - %15 356 -$ FF1 207.53g -$ - %16 357 -$ FF1 207.54g -$ - %17 358 -$ FF1 207.55g -$ - %18 359 -$ FF1 207.50g -$ - %
19 Total Lines -$ Sum L13 to L18 -$ - %20
21 Total Transmission -$ L 10 + L 19 -$ - % Note 1
B) Plant Classified as Distribution in FERC Form 1:
Line Total Distribution ISO %
22 Account Plant Data Source Plant - ISO of Total
23 Land:
24 360 -$ FF1 207.60g -$ - %25 Structures:
26 361 -$ FF1 207.61g -$ - %27 362 -$ FF1 207.62g -$ - %
28 Total Structures -$ L 26 + L 27 -$ - %29
30 Total Distribution -$ L 24 + L 28 -$ - % Note 2
Notes:
1) Total transmission does not include account 359.1 "Asset Retirement Costs for Transmission Plant"Total on this line is also equal to FF1 207.58g (Total Transmission Plant)less FF1 207.57g (Asset Retirement Costs for Transmission Plant).2) Only accounts 360-362 included as there is no ISO plant in any other Distribution accounts.
Instructions:
1) Perform annual Transmission Study pursuant to instructions in tariff.2) Enter total amounts of plant from FERC Form 1 in Column 1, "Total Plant".3) Enter ISO portion of plant in Column 2, "Transmission Plant - ISO, or "Distribution Plant - ISO".
7-PlantStudy
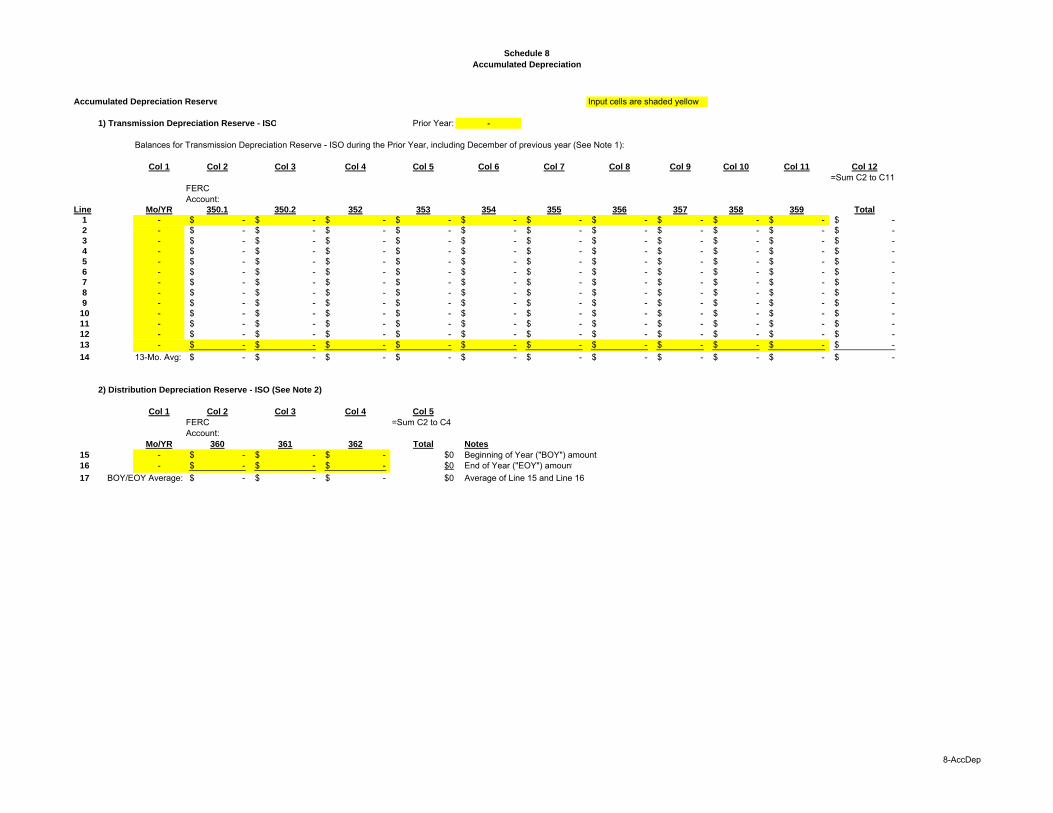
Schedule 8
Accumulated Depreciation
Accumulated Depreciation Reserve Input cells are shaded yellow
1) Transmission Depreciation Reserve - ISO Prior Year: -
Balances for Transmission Depreciation Reserve - ISO during the Prior Year, including December of previous year (See Note 1):
Col 1 Col 2 Col 3 Col 4 Col 5 Col 6 Col 7 Col 8 Col 9 Col 10 Col 11 Col 12
=Sum C2 to C11FERCAccount:
Line Mo/YR 350.1 350.2 352 353 354 355 356 357 358 359 Total
1 - -$ -$ -$ -$ -$ -$ -$ -$ -$ -$ -$ 2 - -$ -$ -$ -$ -$ -$ -$ -$ -$ -$ -$ 3 - -$ -$ -$ -$ -$ -$ -$ -$ -$ -$ -$ 4 - -$ -$ -$ -$ -$ -$ -$ -$ -$ -$ -$ 5 - -$ -$ -$ -$ -$ -$ -$ -$ -$ -$ -$ 6 - -$ -$ -$ -$ -$ -$ -$ -$ -$ -$ -$ 7 - -$ -$ -$ -$ -$ -$ -$ -$ -$ -$ -$ 8 - -$ -$ -$ -$ -$ -$ -$ -$ -$ -$ -$ 9 - -$ -$ -$ -$ -$ -$ -$ -$ -$ -$ -$ 10 - -$ -$ -$ -$ -$ -$ -$ -$ -$ -$ -$ 11 - -$ -$ -$ -$ -$ -$ -$ -$ -$ -$ -$ 12 - -$ -$ -$ -$ -$ -$ -$ -$ -$ -$ -$ 13 - -$ -$ -$ -$ -$ -$ -$ -$ -$ -$ -$
14 13-Mo. Avg: -$ -$ -$ -$ -$ -$ -$ -$ -$ -$ -$
2) Distribution Depreciation Reserve - ISO (See Note 2)
Col 1 Col 2 Col 3 Col 4 Col 5
FERC =Sum C2 to C4Account:
Mo/YR 360 361 362 Total Notes
15 - -$ -$ -$ $0 Beginning of Year ("BOY") amount16 - -$ -$ -$ $0 End of Year ("EOY") amount
17 BOY/EOY Average: -$ -$ -$ $0 Average of Line 15 and Line 16
8-AccDep
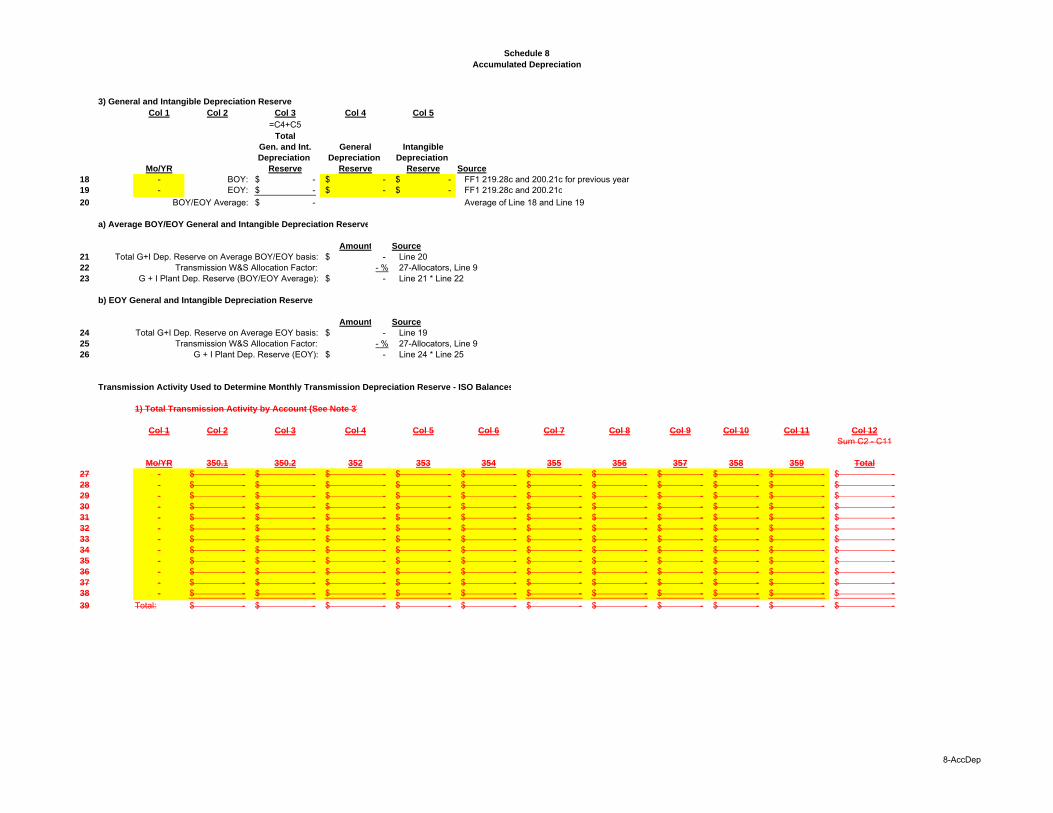
Schedule 8
Accumulated Depreciation
3) General and Intangible Depreciation Reserve
Col 1 Col 2 Col 3 Col 4 Col 5
=C4+C5Total
Gen. and Int. General Intangible
Depreciation Depreciation Depreciation
Mo/YR Reserve Reserve Reserve Source
18 - BOY: -$ -$ -$ FF1 219.28c and 200.21c for previous year19 - EOY: -$ -$ -$ FF1 219.28c and 200.21c
20 BOY/EOY Average: -$ Average of Line 18 and Line 19
a) Average BOY/EOY General and Intangible Depreciation Reserve
Amount Source
21 Total G+I Dep. Reserve on Average BOY/EOY basis: -$ Line 2022 Transmission W&S Allocation Factor: - % 27-Allocators, Line 923 G + I Plant Dep. Reserve (BOY/EOY Average): -$ Line 21 * Line 22
b) EOY General and Intangible Depreciation Reserve
Amount Source
24 Total G+I Dep. Reserve on Average EOY basis: -$ Line 1925 Transmission W&S Allocation Factor: - % 27-Allocators, Line 926 G + I Plant Dep. Reserve (EOY): -$ Line 24 * Line 25
Transmission Activity Used to Determine Monthly Transmission Depreciation Reserve - ISO Balances
1) Total Transmission Activity by Account (See Note 3)
Col 1 Col 2 Col 3 Col 4 Col 5 Col 6 Col 7 Col 8 Col 9 Col 10 Col 11 Col 12
Sum C2 - C11
Mo/YR 350.1 350.2 352 353 354 355 356 357 358 359 Total
27 - -$ -$ -$ -$ -$ -$ -$ -$ -$ -$ -$ 28 - -$ -$ -$ -$ -$ -$ -$ -$ -$ -$ -$ 29 - -$ -$ -$ -$ -$ -$ -$ -$ -$ -$ -$ 30 - -$ -$ -$ -$ -$ -$ -$ -$ -$ -$ -$ 31 - -$ -$ -$ -$ -$ -$ -$ -$ -$ -$ -$ 32 - -$ -$ -$ -$ -$ -$ -$ -$ -$ -$ -$ 33 - -$ -$ -$ -$ -$ -$ -$ -$ -$ -$ -$ 34 - -$ -$ -$ -$ -$ -$ -$ -$ -$ -$ -$ 35 - -$ -$ -$ -$ -$ -$ -$ -$ -$ -$ -$ 36 - -$ -$ -$ -$ -$ -$ -$ -$ -$ -$ -$ 37 - -$ -$ -$ -$ -$ -$ -$ -$ -$ -$ -$ 38 - -$ -$ -$ -$ -$ -$ -$ -$ -$ -$ -$
39 Total: -$ -$ -$ -$ -$ -$ -$ -$ -$ -$ -$
8-AccDep
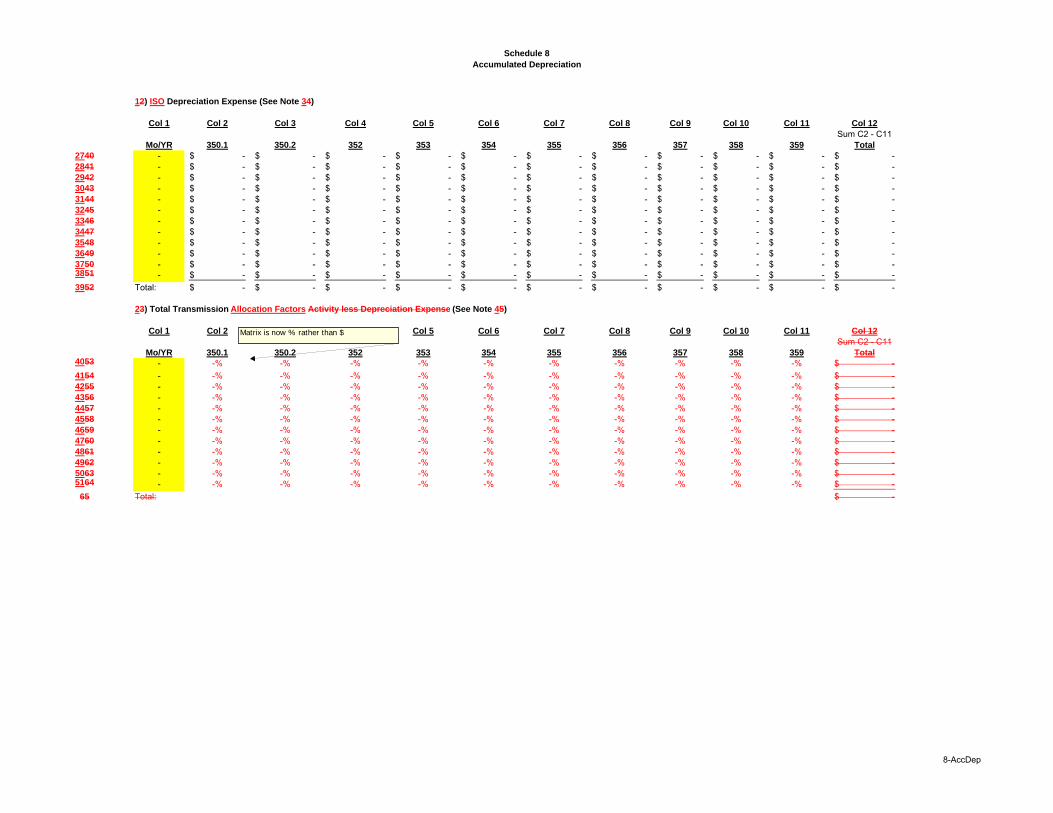
Schedule 8
Accumulated Depreciation
12) ISO Depreciation Expense (See Note 34)
Col 1 Col 2 Col 3 Col 4 Col 5 Col 6 Col 7 Col 8 Col 9 Col 10 Col 11 Col 12
Sum C2 - C11Mo/YR 350.1 350.2 352 353 354 355 356 357 358 359 Total
2740 - -$ -$ -$ -$ -$ -$ -$ -$ -$ -$ -$ 2841 - -$ -$ -$ -$ -$ -$ -$ -$ -$ -$ -$ 2942 - -$ -$ -$ -$ -$ -$ -$ -$ -$ -$ -$ 3043 - -$ -$ -$ -$ -$ -$ -$ -$ -$ -$ -$ 3144 - -$ -$ -$ -$ -$ -$ -$ -$ -$ -$ -$ 3245 - -$ -$ -$ -$ -$ -$ -$ -$ -$ -$ -$ 3346 - -$ -$ -$ -$ -$ -$ -$ -$ -$ -$ -$ 3447 - -$ -$ -$ -$ -$ -$ -$ -$ -$ -$ -$ 3548 - -$ -$ -$ -$ -$ -$ -$ -$ -$ -$ -$ 3649 - -$ -$ -$ -$ -$ -$ -$ -$ -$ -$ -$ 3750 - -$ -$ -$ -$ -$ -$ -$ -$ -$ -$ -$ 3851 - -$ -$ -$ -$ -$ -$ -$ -$ -$ -$ -$
3952 Total: -$ -$ -$ -$ -$ -$ -$ -$ -$ -$ -$
23) Total Transmission Allocation Factors Activity less Depreciation Expense (See Note 45)
Col 1 Col 2 Col 3 Col 4 Col 5 Col 6 Col 7 Col 8 Col 9 Col 10 Col 11 Col 12
Sum C2 - C11Mo/YR 350.1 350.2 352 353 354 355 356 357 358 359 Total
4053 - -% -% -% -% -% -% -% -% -% -% -$
4154 - -% -% -% -% -% -% -% -% -% -% -$ 4255 - -% -% -% -% -% -% -% -% -% -% -$ 4356 - -% -% -% -% -% -% -% -% -% -% -$ 4457 - -% -% -% -% -% -% -% -% -% -% -$ 4558 - -% -% -% -% -% -% -% -% -% -% -$ 4659 - -% -% -% -% -% -% -% -% -% -% -$ 4760 - -% -% -% -% -% -% -% -% -% -% -$ 4861 - -% -% -% -% -% -% -% -% -% -% -$ 4962 - -% -% -% -% -% -% -% -% -% -% -$ 5063 - -% -% -% -% -% -% -% -% -% -% -$ 5164 - -% -% -% -% -% -% -% -% -% -% -$
65 Total: -$
Matrix is now % rather than $
8-AccDep
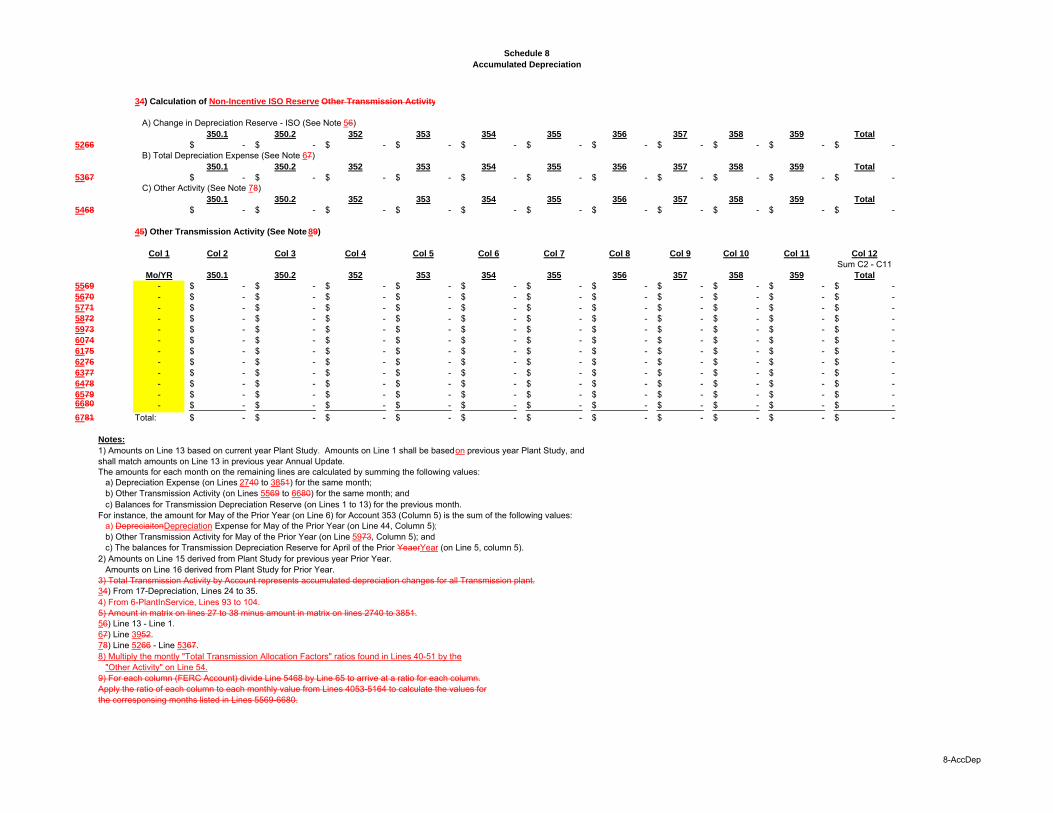
Schedule 8
Accumulated Depreciation
34) Calculation of Non-Incentive ISO Reserve Other Transmission Activity
A) Change in Depreciation Reserve - ISO (See Note 56)350.1 350.2 352 353 354 355 356 357 358 359 Total
5266 -$ -$ -$ -$ -$ -$ -$ -$ -$ -$ -$ B) Total Depreciation Expense (See Note 67)
350.1 350.2 352 353 354 355 356 357 358 359 Total
5367 -$ -$ -$ -$ -$ -$ -$ -$ -$ -$ -$ C) Other Activity (See Note 78)
350.1 350.2 352 353 354 355 356 357 358 359 Total
5468 -$ -$ -$ -$ -$ -$ -$ -$ -$ -$ -$
45) Other Transmission Activity (See Note 89)
Col 1 Col 2 Col 3 Col 4 Col 5 Col 6 Col 7 Col 8 Col 9 Col 10 Col 11 Col 12
Sum C2 - C11Mo/YR 350.1 350.2 352 353 354 355 356 357 358 359 Total
5569 - -$ -$ -$ -$ -$ -$ -$ -$ -$ -$ -$ 5670 - -$ -$ -$ -$ -$ -$ -$ -$ -$ -$ -$ 5771 - -$ -$ -$ -$ -$ -$ -$ -$ -$ -$ -$ 5872 - -$ -$ -$ -$ -$ -$ -$ -$ -$ -$ -$ 5973 - -$ -$ -$ -$ -$ -$ -$ -$ -$ -$ -$ 6074 - -$ -$ -$ -$ -$ -$ -$ -$ -$ -$ -$ 6175 - -$ -$ -$ -$ -$ -$ -$ -$ -$ -$ -$ 6276 - -$ -$ -$ -$ -$ -$ -$ -$ -$ -$ -$ 6377 - -$ -$ -$ -$ -$ -$ -$ -$ -$ -$ -$ 6478 - -$ -$ -$ -$ -$ -$ -$ -$ -$ -$ -$ 6579 - -$ -$ -$ -$ -$ -$ -$ -$ -$ -$ -$ 6680 - -$ -$ -$ -$ -$ -$ -$ -$ -$ -$ -$
6781 Total: -$ -$ -$ -$ -$ -$ -$ -$ -$ -$ -$
Notes:
1) Amounts on Line 13 based on current year Plant Study. Amounts on Line 1 shall be based on previous year Plant Study, and shall match amounts on Line 13 in previous year Annual Update.The amounts for each month on the remaining lines are calculated by summing the following values:
a) Depreciation Expense (on Lines 2740 to 3851) for the same month;b) Other Transmission Activity (on Lines 5569 to 6680) for the same month; and c) Balances for Transmission Depreciation Reserve (on Lines 1 to 13) for the previous month.
For instance, the amount for May of the Prior Year (on Line 6) for Account 353 (Column 5) is the sum of the following values:a) DepreciaitonDepreciation Expense for May of the Prior Year (on Line 44, Column 5);b) Other Transmission Activity for May of the Prior Year (on Line 5973, Column 5); and c) The balances for Transmission Depreciation Reserve for April of the Prior YeaerYear (on Line 5, column 5).
2) Amounts on Line 15 derived from Plant Study for previous year Prior Year.Amounts on Line 16 derived from Plant Study for Prior Year.
3) Total Transmission Activity by Account represents accumulated depreciation changes for all Transmission plant.34) From 17-Depreciation, Lines 24 to 35.4) From 6-PlantInService, Lines 93 to 104.5) Amount in matrix on lines 27 to 38 minus amount in matrix on lines 2740 to 3851.56) Line 13 - Line 1.67) Line 3952.78) Line 5266 - Line 5367.8) Multiply the montly "Total Transmission Allocation Factors" ratios found in Lines 40-51 by the
"Other Activity" on Line 54.9) For each column (FERC Account) divide Line 5468 by Line 65 to arrive at a ratio for each column.Apply the ratio of each column to each monthly value from Lines 4053-5164 to calculate the values forthe corresponsing months listed in Lines 5569-6680.
8-AccDep
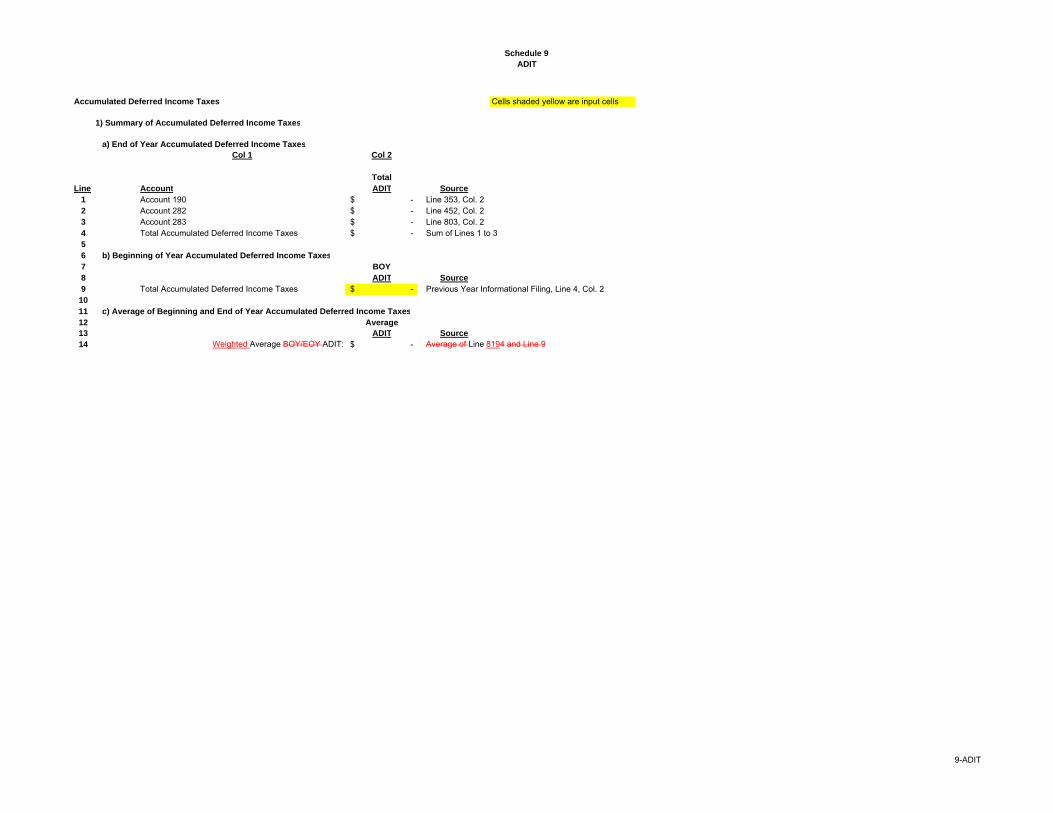
Schedule 9
ADIT
Accumulated Deferred Income Taxes Cells shaded yellow are input cells
1) Summary of Accumulated Deferred Income Taxes
a) End of Year Accumulated Deferred Income Taxes
Col 1 Col 2
Total
Line Account ADIT Source
1 Account 190 -$ Line 353, Col. 22 Account 282 -$ Line 452, Col. 23 Account 283 -$ Line 803, Col. 24 Total Accumulated Deferred Income Taxes -$ Sum of Lines 1 to 35
6 b) Beginning of Year Accumulated Deferred Income Taxes
7 BOY
8 ADIT Source
9 Total Accumulated Deferred Income Taxes -$ Previous Year Informational Filing, Line 4, Col. 210
11 c) Average of Beginning and End of Year Accumulated Deferred Income Taxes
12 Average
13 ADIT Source
14 Weighted Average BOY/EOY ADIT: -$ Average of Line 8194 and Line 9
9-ADIT
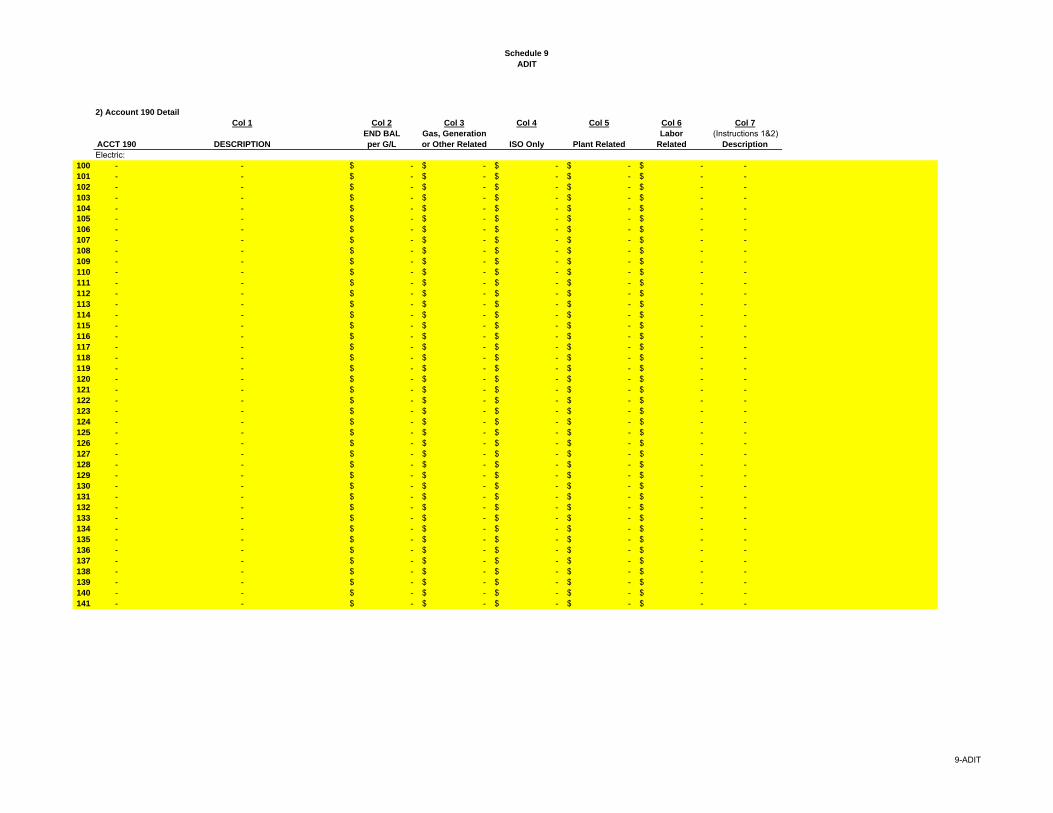
Schedule 9
ADIT
2) Account 190 Detail
Col 1 Col 2 Col 3 Col 4 Col 5 Col 6 Col 7
END BAL Gas, Generation Labor (Instructions 1&2)ACCT 190 DESCRIPTION per G/L or Other Related ISO Only Plant Related Related Description
Electric:100 - - -$ -$ -$ -$ -$ -101 - - -$ -$ -$ -$ -$ -102 - - -$ -$ -$ -$ -$ -103 - - -$ -$ -$ -$ -$ -104 - - -$ -$ -$ -$ -$ -105 - - -$ -$ -$ -$ -$ -106 - - -$ -$ -$ -$ -$ -107 - - -$ -$ -$ -$ -$ -108 - - -$ -$ -$ -$ -$ -109 - - -$ -$ -$ -$ -$ -110 - - -$ -$ -$ -$ -$ -111 - - -$ -$ -$ -$ -$ -112 - - -$ -$ -$ -$ -$ -113 - - -$ -$ -$ -$ -$ -114 - - -$ -$ -$ -$ -$ -115 - - -$ -$ -$ -$ -$ -116 - - -$ -$ -$ -$ -$ -117 - - -$ -$ -$ -$ -$ -118 - - -$ -$ -$ -$ -$ -119 - - -$ -$ -$ -$ -$ -120 - - -$ -$ -$ -$ -$ -121 - - -$ -$ -$ -$ -$ -122 - - -$ -$ -$ -$ -$ -123 - - -$ -$ -$ -$ -$ -124 - - -$ -$ -$ -$ -$ -125 - - -$ -$ -$ -$ -$ -126 - - -$ -$ -$ -$ -$ -127 - - -$ -$ -$ -$ -$ -128 - - -$ -$ -$ -$ -$ -129 - - -$ -$ -$ -$ -$ -130 - - -$ -$ -$ -$ -$ -131 - - -$ -$ -$ -$ -$ -132 - - -$ -$ -$ -$ -$ -133 - - -$ -$ -$ -$ -$ -134 - - -$ -$ -$ -$ -$ -135 - - -$ -$ -$ -$ -$ -136 - - -$ -$ -$ -$ -$ -137 - - -$ -$ -$ -$ -$ -138 - - -$ -$ -$ -$ -$ -139 - - -$ -$ -$ -$ -$ -140 - - -$ -$ -$ -$ -$ -141 - - -$ -$ -$ -$ -$ -
9-ADIT
Schedule 9
ADIT
Continuation of Account 190 Detail
Col 1 Col 2 Col 3 Col 4 Col 5 Col 6 Col 7
END BAL Gas, Generation (Instructions 1&2)ACCT 190 DESCRIPTION per G/L or Other Related ISO Only Plant Related Labor Related Description
Electric:142 - - -$ -$ -$ -$ -$ -143 - - -$ -$ -$ -$ -$ -144 - - -$ -$ -$ -$ -$ -145 - - -$ -$ -$ -$ -$ -146 - - -$ -$ -$ -$ -$ -147 - - -$ -$ -$ -$ -$ -148 - - -$ -$ -$ -$ -$ -149 - - -$ -$ -$ -$ -$ -150 - - -$ -$ -$ -$ -$ -151 - - -$ -$ -$ -$ -$ -152 - - -$ -$ -$ -$ -$ -153 - - -$ -$ -$ -$ -$ -154 - - -$ -$ -$ -$ -$ -155 - - -$ -$ -$ -$ -$ -156 - - -$ -$ -$ -$ -$ -157 - - -$ -$ -$ -$ -$ -158 - - -$ -$ -$ -$ -$ -159 - - -$ -$ -$ -$ -$ -160 - - -$ -$ -$ -$ -$ -161 - - -$ -$ -$ -$ -$ -162 - - -$ -$ -$ -$ -$ -163 - - -$ -$ -$ -$ -$ -164 - - -$ -$ -$ -$ -$ -165 - - -$ -$ -$ -$ -$ -166 - - -$ -$ -$ -$ -$ -167 - - -$ -$ -$ -$ -$ -168 - - -$ -$ -$ -$ -$ -169 - - -$ -$ -$ -$ -$ -170 - - -$ -$ -$ -$ -$ -171 - - -$ -$ -$ -$ -$ -172 - - -$ -$ -$ -$ -$ -173 - - -$ -$ -$ -$ -$ -174 - - -$ -$ -$ -$ -$ -175 …
Source
250 Total Electric 190 -$ -$ -$ -$ -$ Sum of Above Lines beginning on Line 100
9-ADIT
Schedule 9
ADIT
Account 190 Gas and Other Income: (Instructions 1&2)Col 1 Col 2 Col 3 Col 4 Col 5 Col 6 Col 7
300 - - -$ -$ -$ -$ -$ -301 - - -$ -$ -$ -$ -$ -302 - - -$ -$ -$ -$ -$ -303 - - -$ -$ -$ -$ -$ -304 - - -$ -$ -$ -$ -$ -305 - - -$ -$ -$ -$ -$ -306 - - -$ -$ -$ -$ -$ -307 - - -$ -$ -$ -$ -$ -308 - - -$ -$ -$ -$ -$ -309 - - -$ -$ -$ -$ -$ -310 - - -$ -$ -$ -$ -$ -311 - - -$ -$ -$ -$ -$ -312 - - -$ -$ -$ -$ -$ -313 - - -$ -$ -$ -$ -$ -314 …
Col 1 Col 2 Col 3 Col 4 Col 5 Col 6 Source
350 Total Account 190 Gas and Other Income -$ -$ -$ -$ -$ Sum of Above Lines beginning on Line 300
351 Total Account 190 -$ -$ -$ -$ -$ Line 250 + Line 350352 Allocation Factors (Plant and Wages) - % - % 27-Allocators Lines 22 and 9 respectively.353 Total Account 190 ADIT -$ -$ -$ -$ Line 351 * Line 352 for Cols 5 and 6. Col. 4 100% ISO.
(Sum of amounts in Columns 4 to 6)
354 FERC Form 1 Account 190 -$ Must match amount on Line 351, Col. 2 FF1 234.18c
3) Account 282 Detail
Col 1 Col 2 Col 3 Col 4 Col 5 Col 6 Col 7
END BAL Gas, Generation Labor (Instructions 1&2)ACCT 282 DESCRIPTION per G/L or Other Related ISO Only Plant Related Related Description
400 - - -$ -$ -$ -$ -$ -401 - - -$ -$ -$ -$ -$ -402 - - -$ -$ -$ -$ -$ -403 - - -$ -$ -$ -$ -$ -404 - - -$ -$ -$ -$ -$ -405 - - -$ -$ -$ -$ -$ -406 - - -$ -$ -$ -$ -$ -407 - - -$ -$ -$ -$ -$ -408 - - -$ -$ -$ -$ -$ -409 - - -$ -$ -$ -$ -$ -410 - - -$ -$ -$ -$ -$ -411 - - -$ -$ -$ -$ -$ -412 - - -$ -$ -$ -$ -$ -413 - - -$ -$ -$ -$ -$ -414 - - -$ -$ -$ -$ -$ -415 - - -$ -$ -$ -$ -$ -416 - - -$ -$ -$ -$ -$ -417 - - -$ -$ -$ -$ -$ -418 - - -$ -$ -$ -$ -$ -419 - - -$ -$ -$ -$ -$ -420 …
9-ADIT
Schedule 9
ADIT
Col 1 Col 2 Col 3 Col 4 Col 5 Col 6 Source
450 Total Account 282 -$ -$ -$ -$ -$ Sum of Above Lines beginning on Line 400451 Allocation Factors (Plant and Wages) - % - % 27-Allocators Lines 22 and 9 respectively.452 Total Account 282 ADIT -$ -$ -$ -$ Line 450 * Line 451 for Cols 5 and 6. Col. 4 100% ISO.
(Sum of amounts in Columns 4 to 6)
453 FERC Form 1 Account 282 -$ Must match amount on Line 450, Col. 2 FF1 275.5k
4) Account 283 Detail
Col 1 Col 2 Col 3 Col 4 Col 5 Col 6 Col 7
END BAL Gas, Generation Labor (Instructions 1&2)ACCT 283 DESCRIPTION per G/L or Other Related ISO Only Plant Related Related Description
Electric:500 - - -$ -$ -$ -$ -$ -501 - - -$ -$ -$ -$ -$ -502 - - -$ -$ -$ -$ -$ -503 - - -$ -$ -$ -$ -$ -504 - - -$ -$ -$ -$ -$ -505 - - -$ -$ -$ -$ -$ -506 - - -$ -$ -$ -$ -$ -507 - - -$ -$ -$ -$ -$ -508 - - -$ -$ -$ -$ -$ -509 - - -$ -$ -$ -$ -$ -510 - - -$ -$ -$ -$ -$ -511 - - -$ -$ -$ -$ -$ -512 - - -$ -$ -$ -$ -$ -513 - - -$ -$ -$ -$ -$ -514 - - -$ -$ -$ -$ -$ -515 - - -$ -$ -$ -$ -$ -516 - - -$ -$ -$ -$ -$ -517 - - -$ -$ -$ -$ -$ -518 - - -$ -$ -$ -$ -$ -519 - - -$ -$ -$ -$ -$ -520 - - -$ -$ -$ -$ -$ -521 - - -$ -$ -$ -$ -$ -522 - - -$ -$ -$ -$ -$ -523 - - -$ -$ -$ -$ -$ -524 - - -$ -$ -$ -$ -$ -525 - - -$ -$ -$ -$ -$ -526 - - -$ -$ -$ -$ -$ -527 - - -$ -$ -$ -$ -$ -528 - - -$ -$ -$ -$ -$ -529 - - -$ -$ -$ -$ -$ -530 - - -$ -$ -$ -$ -$ -531 - - -$ -$ -$ -$ -$ -532 - - -$ -$ -$ -$ -$ -533 - - -$ -$ -$ -$ -$ -534 - - -$ -$ -$ -$ -$ -535 - - -$ -$ -$ -$ -$ -536 - - -$ -$ -$ -$ -$ -537 - - -$ -$ -$ -$ -$ -538 - - -$ -$ -$ -$ -$ -539 - - -$ -$ -$ -$ -$ -
9-ADIT
Schedule 9
ADIT
Continuation of Account 283 Detail
Col 1 Col 2 Col 3 Col 4 Col 5 Col 6 Col 7
END BAL Gas, Generation Labor (Instructions 1&2)ACCT 283 DESCRIPTION per G/L or Other Related ISO Only Plant Related Related Description
Electric (continued):540 - - -$ -$ -$ -$ -$ -541 - - -$ -$ -$ -$ -$ -542 - - -$ -$ -$ -$ -$ -543 - - -$ -$ -$ -$ -$ -544 - - -$ -$ -$ -$ -$ -545 - - -$ -$ -$ -$ -$ -546 - - -$ -$ -$ -$ -$ -547 - - -$ -$ -$ -$ -$ -548 - - -$ -$ -$ -$ -$ -549 - - -$ -$ -$ -$ -$ -550 - - -$ -$ -$ -$ -$ -551 - - -$ -$ -$ -$ -$ -552 - - -$ -$ -$ -$ -$ -553 - - -$ -$ -$ -$ -$ -554 - - -$ -$ -$ -$ -$ -555 - - -$ -$ -$ -$ -$ -556 - - -$ -$ -$ -$ -$ -557 - - -$ -$ -$ -$ -$ -558 - - -$ -$ -$ -$ -$ -559 - - -$ -$ -$ -$ -$ -560 - - -$ -$ -$ -$ -$ -561 - - -$ -$ -$ -$ -$ -562 - - -$ -$ -$ -$ -$ -563 - - -$ -$ -$ -$ -$ -564 - - -$ -$ -$ -$ -$ -565 - - -$ -$ -$ -$ -$ -566 - - -$ -$ -$ -$ -$ -567 - - -$ -$ -$ -$ -$ -568 - - -$ -$ -$ -$ -$ -569 …
650 Total Electric 283 $0 $0 $0 $0 $0 Sum of Above Lines beginning on Line 500
Account 283 Gas and Other: (Instructions 1&2)Col 1 Col 2 Col 3 Col 4 Col 5 Col 6 Col 7
700 - - -$ -$ -$ -$ -$ -701 - - -$ -$ -$ -$ -$ -702 - - -$ -$ -$ -$ -$ -703 - - -$ -$ -$ -$ -$ -704 - - -$ -$ -$ -$ -$ -705 - - -$ -$ -$ -$ -$ -706 - - -$ -$ -$ -$ -$ -707 - - -$ -$ -$ -$ -$ -708 - - -$ -$ -$ -$ -$ -709 - - -$ -$ -$ -$ -$ -710 - - -$ -$ -$ -$ -$ -711 - - -$ -$ -$ -$ -$ -712 - - -$ -$ -$ -$ -$ -713 …
9-ADIT
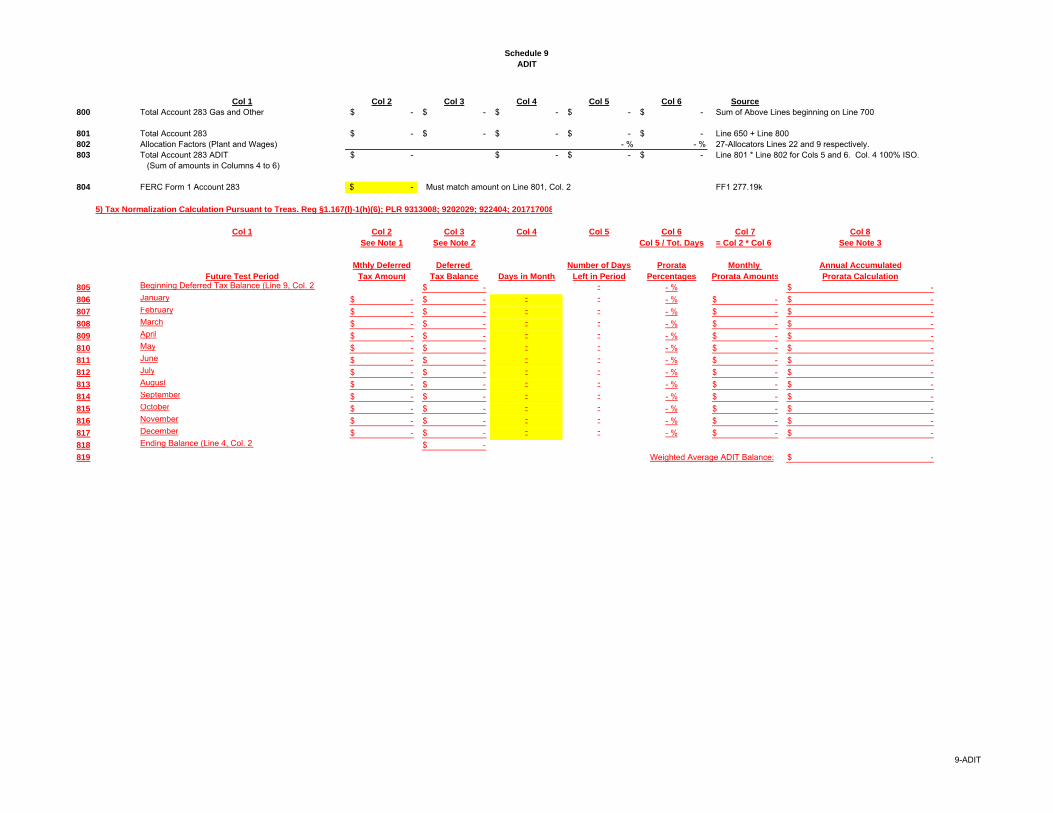
Schedule 9
ADIT
Col 1 Col 2 Col 3 Col 4 Col 5 Col 6 Source
800 Total Account 283 Gas and Other -$ -$ -$ -$ -$ Sum of Above Lines beginning on Line 700
801 Total Account 283 -$ -$ -$ -$ -$ Line 650 + Line 800802 Allocation Factors (Plant and Wages) - % - % 27-Allocators Lines 22 and 9 respectively.803 Total Account 283 ADIT -$ -$ -$ -$ Line 801 * Line 802 for Cols 5 and 6. Col. 4 100% ISO.
(Sum of amounts in Columns 4 to 6)
804 FERC Form 1 Account 283 -$ Must match amount on Line 801, Col. 2 FF1 277.19k
5) Tax Normalization Calculation Pursuant to Treas. Reg §1.167(l)-1(h)(6); PLR 9313008; 9202029; 922404; 201717008
Col 1 Col 2 Col 3 Col 4 Col 5 Col 6 Col 7 Col 8
See Note 1 See Note 2 Col 5 / Tot. Days = Col 2 * Col 6 See Note 3
Mthly Deferred Deferred Number of Days Prorata Monthly Annual Accumulated
Future Test Period Tax Amount Tax Balance Days in Month Left in Period Percentages Prorata Amounts Prorata Calculation
805 Beginning Deferred Tax Balance (Line 9, Col. 2) -$ - - % -$
806 January -$ -$ - - - % -$ -$
807 February -$ -$ - - - % -$ -$
808 March -$ -$ - - - % -$ -$
809 April -$ -$ - - - % -$ -$
810 May -$ -$ - - - % -$ -$
811 June -$ -$ - - - % -$ -$
812 July -$ -$ - - - % -$ -$
813 August -$ -$ - - - % -$ -$
814 September -$ -$ - - - % -$ -$
815 October -$ -$ - - - % -$ -$
816 November -$ -$ - - - % -$ -$
817 December -$ -$ - - - % -$ -$
818 Ending Balance (Line 4, Col. 2) -$
819 Weighted Average ADIT Balance: -$
9-ADIT
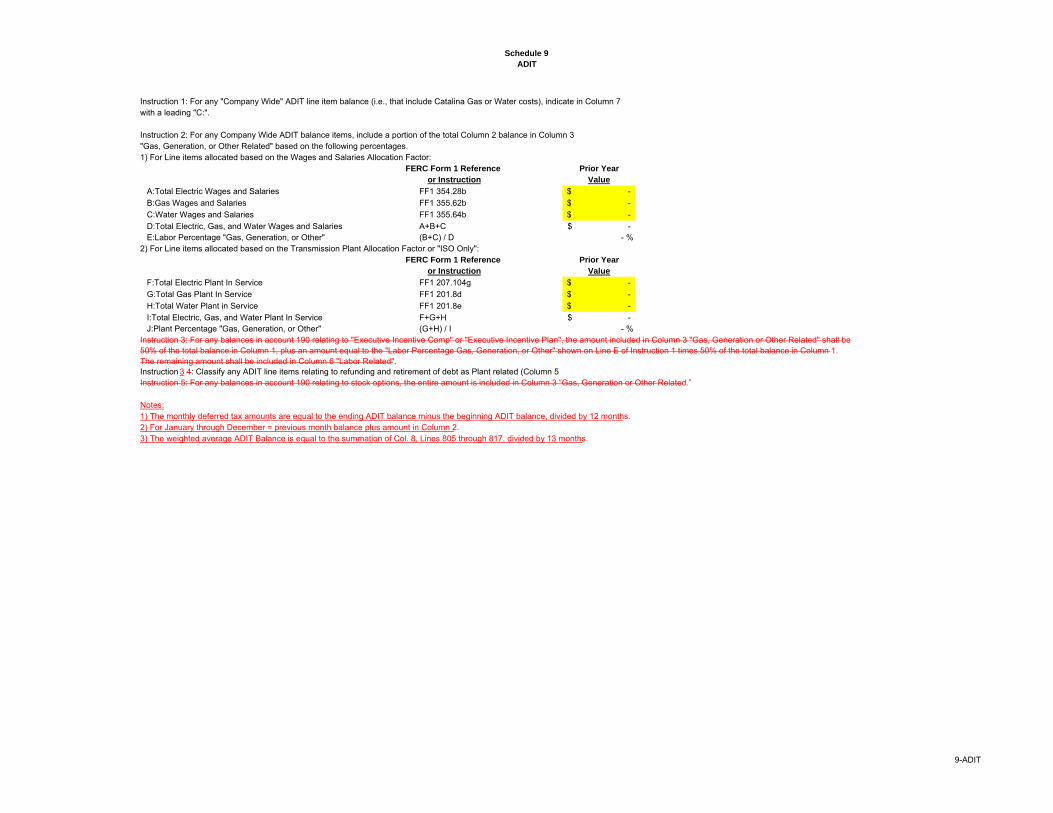
Schedule 9
ADIT
Instruction 1: For any "Company Wide" ADIT line item balance (i.e., that include Catalina Gas or Water costs), indicate in Column 7with a leading "C:".
Instruction 2: For any Company Wide ADIT balance items, include a portion of the total Column 2 balance in Column 3 "Gas, Generation, or Other Related" based on the following percentages.1) For Line items allocated based on the Wages and Salaries Allocation Factor:
FERC Form 1 Reference Prior Year
or Instruction Value
A:Total Electric Wages and Salaries FF1 354.28b -$
B:Gas Wages and Salaries FF1 355.62b -$
C:Water Wages and Salaries FF1 355.64b -$
D:Total Electric, Gas, and Water Wages and Salaries A+B+C -$ E:Labor Percentage "Gas, Generation, or Other" (B+C) / D - %
2) For Line items allocated based on the Transmission Plant Allocation Factor or "ISO Only": FERC Form 1 Reference Prior Year
or Instruction Value
F:Total Electric Plant In Service FF1 207.104g -$
G:Total Gas Plant In Service FF1 201.8d -$
H:Total Water Plant in Service FF1 201.8e -$
I:Total Electric, Gas, and Water Plant In Service F+G+H -$ J:Plant Percentage "Gas, Generation, or Other" (G+H) / I - %
Instruction 3: For any balances in account 190 relating to "Executive Incentive Comp" or "Executive Incentive Plan", the amount included in Column 3 "Gas, Generation or Other Related" shall be 50% of the total balance in Column 1, plus an amount equal to the "Labor Percentage Gas, Generation, or Other" shown on Line E of Instruction 1 times 50% of the total balance in Column 1. The remaining amount shall be included in Column 6 "Labor Related".Instruction 3 4: Classify any ADIT line items relating to refunding and retirement of debt as Plant related (Column 5Instruction 5: For any balances in account 190 relating to stock options, the entire amount is included in Column 3 “Gas, Generation or Other Related.”
Notes:1) The monthly deferred tax amounts are equal to the ending ADIT balance minus the beginning ADIT balance, divided by 12 months.2) For January through December = previous month balance plus amount in Column 2.3) The weighted average ADIT Balance is equal to the summation of Col. 8, Lines 805 through 817, divided by 13 months.
9-ADIT
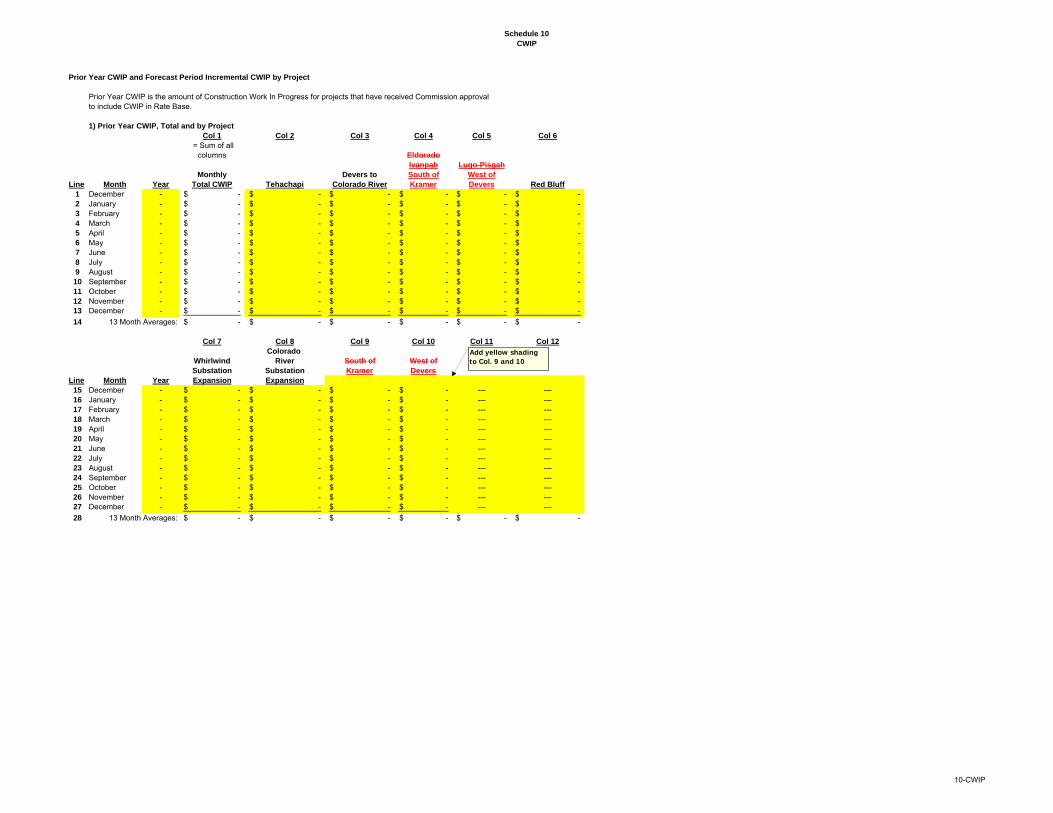
Schedule 10
CWIP
Prior Year CWIP and Forecast Period Incremental CWIP by Project
Prior Year CWIP is the amount of Construction Work In Progress for projects that have received Commission approvalto include CWIP in Rate Base.
1) Prior Year CWIP, Total and by Project
Col 1 Col 2 Col 3 Col 4 Col 5 Col 6
= Sum of allcolumns Eldorado
Ivanpah Lugo-Pisgah
Monthly Devers to South of West of
Line Month Year Total CWIP Tehachapi Colorado River Kramer Devers Red Bluff
1 December - -$ -$ -$ -$ -$ -$ 2 January - -$ -$ -$ -$ -$ -$ 3 February - -$ -$ -$ -$ -$ -$ 4 March - -$ -$ -$ -$ -$ -$ 5 April - -$ -$ -$ -$ -$ -$ 6 May - -$ -$ -$ -$ -$ -$ 7 June - -$ -$ -$ -$ -$ -$ 8 July - -$ -$ -$ -$ -$ -$ 9 August - -$ -$ -$ -$ -$ -$ 10 September - -$ -$ -$ -$ -$ -$ 11 October - -$ -$ -$ -$ -$ -$ 12 November - -$ -$ -$ -$ -$ -$ 13 December - -$ -$ -$ -$ -$ -$
14 13 Month Averages: -$ -$ -$ -$ -$ -$
Col 7 Col 8 Col 9 Col 10 Col 11 Col 12
Colorado
Whirlwind River South of West of
Substation Substation Kramer Devers
Line Month Year Expansion Expansion
15 December - -$ -$ -$ -$ --- ---16 January - -$ -$ -$ -$ --- ---17 February - -$ -$ -$ -$ --- ---18 March - -$ -$ -$ -$ --- ---19 April - -$ -$ -$ -$ --- ---20 May - -$ -$ -$ -$ --- ---21 June - -$ -$ -$ -$ --- ---22 July - -$ -$ -$ -$ --- ---23 August - -$ -$ -$ -$ --- ---24 September - -$ -$ -$ -$ --- ---25 October - -$ -$ -$ -$ --- ---26 November - -$ -$ -$ -$ --- ---27 December - -$ -$ -$ -$ --- ---
28 13 Month Averages: -$ -$ -$ -$ -$ -$
Add yellow shading to Col. 9 and 10
10-CWIP
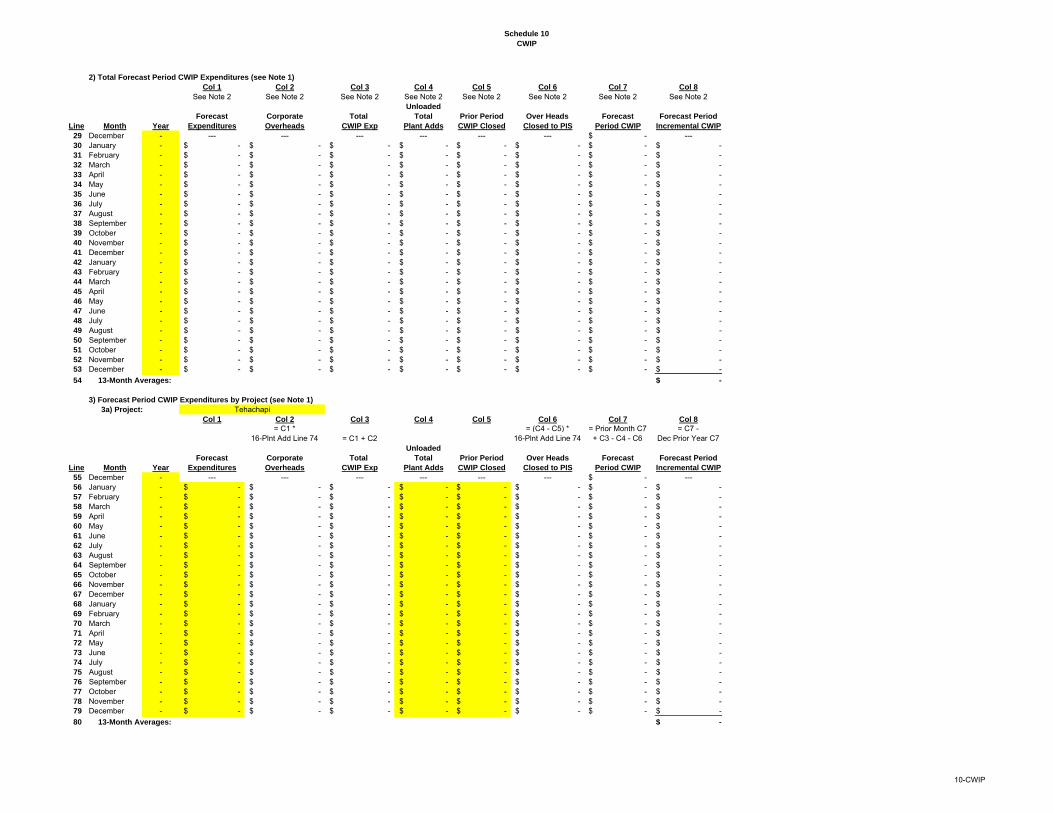
Schedule 10
CWIP
2) Total Forecast Period CWIP Expenditures (see Note 1)
Col 1 Col 2 Col 3 Col 4 Col 5 Col 6 Col 7 Col 8
See Note 2 See Note 2 See Note 2 See Note 2 See Note 2 See Note 2 See Note 2 See Note 2Unloaded
Forecast Corporate Total Total Prior Period Over Heads Forecast Forecast Period
Line Month Year Expenditures Overheads CWIP Exp Plant Adds CWIP Closed Closed to PIS Period CWIP Incremental CWIP
29 December - --- --- --- --- --- --- -$ ---30 January - -$ -$ -$ -$ -$ -$ -$ -$ 31 February - -$ -$ -$ -$ -$ -$ -$ -$ 32 March - -$ -$ -$ -$ -$ -$ -$ -$ 33 April - -$ -$ -$ -$ -$ -$ -$ -$ 34 May - -$ -$ -$ -$ -$ -$ -$ -$ 35 June - -$ -$ -$ -$ -$ -$ -$ -$ 36 July - -$ -$ -$ -$ -$ -$ -$ -$ 37 August - -$ -$ -$ -$ -$ -$ -$ -$ 38 September - -$ -$ -$ -$ -$ -$ -$ -$ 39 October - -$ -$ -$ -$ -$ -$ -$ -$ 40 November - -$ -$ -$ -$ -$ -$ -$ -$ 41 December - -$ -$ -$ -$ -$ -$ -$ -$ 42 January - -$ -$ -$ -$ -$ -$ -$ -$ 43 February - -$ -$ -$ -$ -$ -$ -$ -$ 44 March - -$ -$ -$ -$ -$ -$ -$ -$ 45 April - -$ -$ -$ -$ -$ -$ -$ -$ 46 May - -$ -$ -$ -$ -$ -$ -$ -$ 47 June - -$ -$ -$ -$ -$ -$ -$ -$ 48 July - -$ -$ -$ -$ -$ -$ -$ -$ 49 August - -$ -$ -$ -$ -$ -$ -$ -$ 50 September - -$ -$ -$ -$ -$ -$ -$ -$ 51 October - -$ -$ -$ -$ -$ -$ -$ -$ 52 November - -$ -$ -$ -$ -$ -$ -$ -$ 53 December - -$ -$ -$ -$ -$ -$ -$ -$
54 13-Month Averages: -$
3) Forecast Period CWIP Expenditures by Project (see Note 1)
3a) Project:
Col 1 Col 2 Col 3 Col 4 Col 5 Col 6 Col 7 Col 8
= C1 * 16-Plnt Add Line 74 = C1 + C2
= (C4 - C5) *16-Plnt Add Line 74
= Prior Month C7+ C3 - C4 - C6
= C7 - Dec Prior Year C7
Unloaded
Forecast Corporate Total Total Prior Period Over Heads Forecast Forecast Period
Line Month Year Expenditures Overheads CWIP Exp Plant Adds CWIP Closed Closed to PIS Period CWIP Incremental CWIP
55 December - --- --- --- --- --- --- -$ ---56 January - -$ -$ -$ -$ -$ -$ -$ -$ 57 February - -$ -$ -$ -$ -$ -$ -$ -$ 58 March - -$ -$ -$ -$ -$ -$ -$ -$ 59 April - -$ -$ -$ -$ -$ -$ -$ -$ 60 May - -$ -$ -$ -$ -$ -$ -$ -$ 61 June - -$ -$ -$ -$ -$ -$ -$ -$ 62 July - -$ -$ -$ -$ -$ -$ -$ -$ 63 August - -$ -$ -$ -$ -$ -$ -$ -$ 64 September - -$ -$ -$ -$ -$ -$ -$ -$ 65 October - -$ -$ -$ -$ -$ -$ -$ -$ 66 November - -$ -$ -$ -$ -$ -$ -$ -$ 67 December - -$ -$ -$ -$ -$ -$ -$ -$ 68 January - -$ -$ -$ -$ -$ -$ -$ -$ 69 February - -$ -$ -$ -$ -$ -$ -$ -$ 70 March - -$ -$ -$ -$ -$ -$ -$ -$ 71 April - -$ -$ -$ -$ -$ -$ -$ -$ 72 May - -$ -$ -$ -$ -$ -$ -$ -$ 73 June - -$ -$ -$ -$ -$ -$ -$ -$ 74 July - -$ -$ -$ -$ -$ -$ -$ -$ 75 August - -$ -$ -$ -$ -$ -$ -$ -$ 76 September - -$ -$ -$ -$ -$ -$ -$ -$ 77 October - -$ -$ -$ -$ -$ -$ -$ -$ 78 November - -$ -$ -$ -$ -$ -$ -$ -$ 79 December - -$ -$ -$ -$ -$ -$ -$ -$
80 13-Month Averages: -$
Tehachapi
10-CWIP
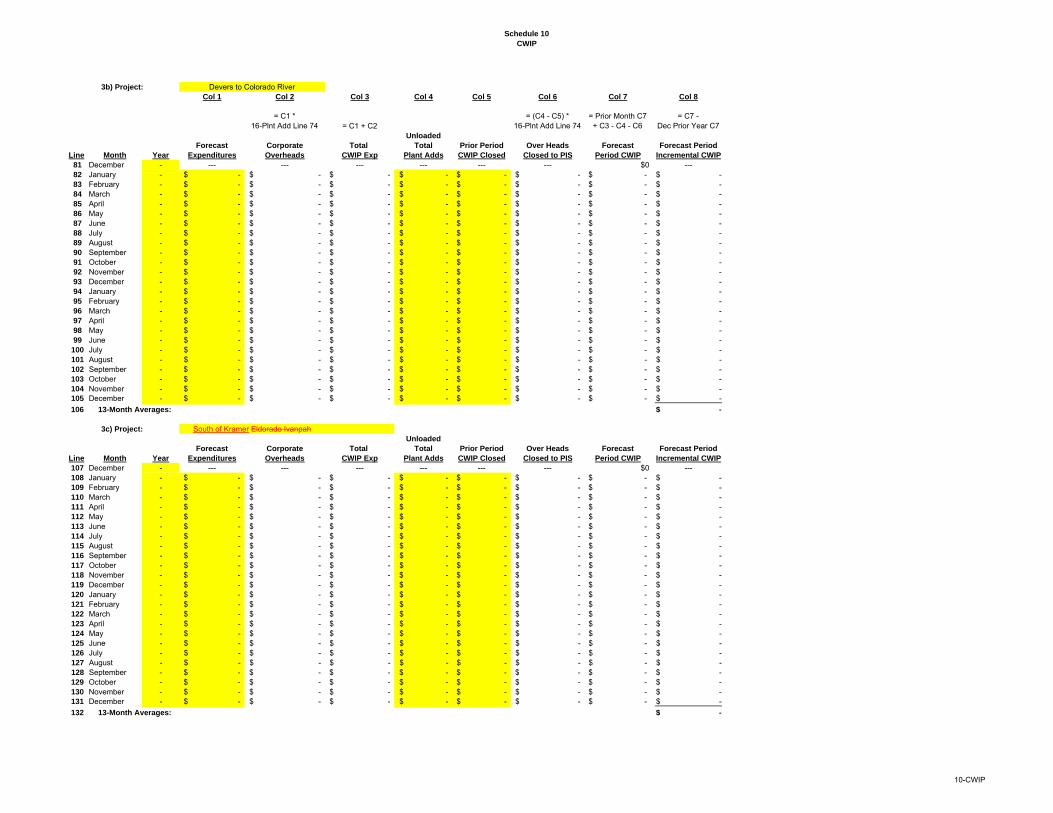
Schedule 10
CWIP
3b) Project:
Col 1 Col 2 Col 3 Col 4 Col 5 Col 6 Col 7 Col 8
= C1 * 16-Plnt Add Line 74 = C1 + C2
= (C4 - C5) *16-Plnt Add Line 74
= Prior Month C7+ C3 - C4 - C6
= C7 - Dec Prior Year C7
Unloaded
Forecast Corporate Total Total Prior Period Over Heads Forecast Forecast Period
Line Month Year Expenditures Overheads CWIP Exp Plant Adds CWIP Closed Closed to PIS Period CWIP Incremental CWIP
81 December - --- --- --- --- --- --- $0 ---82 January - -$ -$ -$ -$ -$ -$ -$ -$ 83 February - -$ -$ -$ -$ -$ -$ -$ -$ 84 March - -$ -$ -$ -$ -$ -$ -$ -$ 85 April - -$ -$ -$ -$ -$ -$ -$ -$ 86 May - -$ -$ -$ -$ -$ -$ -$ -$ 87 June - -$ -$ -$ -$ -$ -$ -$ -$ 88 July - -$ -$ -$ -$ -$ -$ -$ -$ 89 August - -$ -$ -$ -$ -$ -$ -$ -$ 90 September - -$ -$ -$ -$ -$ -$ -$ -$ 91 October - -$ -$ -$ -$ -$ -$ -$ -$ 92 November - -$ -$ -$ -$ -$ -$ -$ -$ 93 December - -$ -$ -$ -$ -$ -$ -$ -$ 94 January - -$ -$ -$ -$ -$ -$ -$ -$ 95 February - -$ -$ -$ -$ -$ -$ -$ -$ 96 March - -$ -$ -$ -$ -$ -$ -$ -$ 97 April - -$ -$ -$ -$ -$ -$ -$ -$ 98 May - -$ -$ -$ -$ -$ -$ -$ -$ 99 June - -$ -$ -$ -$ -$ -$ -$ -$
100 July - -$ -$ -$ -$ -$ -$ -$ -$ 101 August - -$ -$ -$ -$ -$ -$ -$ -$ 102 September - -$ -$ -$ -$ -$ -$ -$ -$ 103 October - -$ -$ -$ -$ -$ -$ -$ -$ 104 November - -$ -$ -$ -$ -$ -$ -$ -$ 105 December - -$ -$ -$ -$ -$ -$ -$ -$
106 13-Month Averages: -$
3c) Project:
Unloaded
Forecast Corporate Total Total Prior Period Over Heads Forecast Forecast Period
Line Month Year Expenditures Overheads CWIP Exp Plant Adds CWIP Closed Closed to PIS Period CWIP Incremental CWIP
107 December - --- --- --- --- --- --- $0 ---108 January - -$ -$ -$ -$ -$ -$ -$ -$ 109 February - -$ -$ -$ -$ -$ -$ -$ -$ 110 March - -$ -$ -$ -$ -$ -$ -$ -$ 111 April - -$ -$ -$ -$ -$ -$ -$ -$ 112 May - -$ -$ -$ -$ -$ -$ -$ -$ 113 June - -$ -$ -$ -$ -$ -$ -$ -$ 114 July - -$ -$ -$ -$ -$ -$ -$ -$ 115 August - -$ -$ -$ -$ -$ -$ -$ -$ 116 September - -$ -$ -$ -$ -$ -$ -$ -$ 117 October - -$ -$ -$ -$ -$ -$ -$ -$ 118 November - -$ -$ -$ -$ -$ -$ -$ -$ 119 December - -$ -$ -$ -$ -$ -$ -$ -$ 120 January - -$ -$ -$ -$ -$ -$ -$ -$ 121 February - -$ -$ -$ -$ -$ -$ -$ -$ 122 March - -$ -$ -$ -$ -$ -$ -$ -$ 123 April - -$ -$ -$ -$ -$ -$ -$ -$ 124 May - -$ -$ -$ -$ -$ -$ -$ -$ 125 June - -$ -$ -$ -$ -$ -$ -$ -$ 126 July - -$ -$ -$ -$ -$ -$ -$ -$ 127 August - -$ -$ -$ -$ -$ -$ -$ -$ 128 September - -$ -$ -$ -$ -$ -$ -$ -$ 129 October - -$ -$ -$ -$ -$ -$ -$ -$ 130 November - -$ -$ -$ -$ -$ -$ -$ -$ 131 December - -$ -$ -$ -$ -$ -$ -$ -$
132 13-Month Averages: -$
Devers to Colorado River
South of Kramer Eldorado Ivanpah
10-CWIP

Schedule 10
CWIP
3d) Project:
Col 1 Col 2 Col 3 Col 4 Col 5 Col 6 Col 7 Col 8
= C1 * 16-Plnt Add Line 74 = C1 + C2
= (C4 - C5) *16-Plnt Add Line 74
= Prior Month C7+ C3 - C4 - C6
= C7 - Dec Prior Year C7
Unloaded
Forecast Corporate Total Total Prior Period Over Heads Forecast Forecast Period
Line Month Year Expenditures Overheads CWIP Exp Plant Adds CWIP Closed Closed to PIS Period CWIP Incremental CWIP
133 December - --- --- --- --- --- --- $0 ---134 January - -$ -$ -$ -$ -$ -$ -$ -$ 135 February - -$ -$ -$ -$ -$ -$ -$ -$ 136 March - -$ -$ -$ -$ -$ -$ -$ -$ 137 April - -$ -$ -$ -$ -$ -$ -$ -$ 138 May - -$ -$ -$ -$ -$ -$ -$ -$ 139 June - -$ -$ -$ -$ -$ -$ -$ -$ 140 July - -$ -$ -$ -$ -$ -$ -$ -$ 141 August - -$ -$ -$ -$ -$ -$ -$ -$ 142 September - -$ -$ -$ -$ -$ -$ -$ -$ 143 October - -$ -$ -$ -$ -$ -$ -$ -$ 144 November - -$ -$ -$ -$ -$ -$ -$ -$ 145 December - -$ -$ -$ -$ -$ -$ -$ -$ 146 January - -$ -$ -$ -$ -$ -$ -$ -$ 147 February - -$ -$ -$ -$ -$ -$ -$ -$ 148 March - -$ -$ -$ -$ -$ -$ -$ -$ 149 April - -$ -$ -$ -$ -$ -$ -$ -$ 150 May - -$ -$ -$ -$ -$ -$ -$ -$ 151 June - -$ -$ -$ -$ -$ -$ -$ -$ 152 July - -$ -$ -$ -$ -$ -$ -$ -$ 153 August - -$ -$ -$ -$ -$ -$ -$ -$ 154 September - -$ -$ -$ -$ -$ -$ -$ -$ 155 October - -$ -$ -$ -$ -$ -$ -$ -$ 156 November - -$ -$ -$ -$ -$ -$ -$ -$ 157 December - -$ -$ -$ -$ -$ -$ -$ -$
158 13-Month Averages: -$
3e) Project:
Unloaded
Forecast Corporate Total Total Prior Period Over Heads Forecast Forecast Period
Line Month Year Expenditures Overheads CWIP Exp Plant Adds CWIP Closed Closed to PIS Period CWIP Incremental CWIP
159 December - --- --- --- --- --- --- $0 ---160 January - -$ -$ -$ -$ -$ -$ -$ -$ 161 February - -$ -$ -$ -$ -$ -$ -$ -$ 162 March - -$ -$ -$ -$ -$ -$ -$ -$ 163 April - -$ -$ -$ -$ -$ -$ -$ -$ 164 May - -$ -$ -$ -$ -$ -$ -$ -$ 165 June - -$ -$ -$ -$ -$ -$ -$ -$ 166 July - -$ -$ -$ -$ -$ -$ -$ -$ 167 August - -$ -$ -$ -$ -$ -$ -$ -$ 168 September - -$ -$ -$ -$ -$ -$ -$ -$ 169 October - -$ -$ -$ -$ -$ -$ -$ -$ 170 November - -$ -$ -$ -$ -$ -$ -$ -$ 171 December - -$ -$ -$ -$ -$ -$ -$ -$ 172 January - -$ -$ -$ -$ -$ -$ -$ -$ 173 February - -$ -$ -$ -$ -$ -$ -$ -$ 174 March - -$ -$ -$ -$ -$ -$ -$ -$ 175 April - -$ -$ -$ -$ -$ -$ -$ -$ 176 May - -$ -$ -$ -$ -$ -$ -$ -$ 177 June - -$ -$ -$ -$ -$ -$ -$ -$ 178 July - -$ -$ -$ -$ -$ -$ -$ -$ 179 August - -$ -$ -$ -$ -$ -$ -$ -$ 180 September - -$ -$ -$ -$ -$ -$ -$ -$ 181 October - -$ -$ -$ -$ -$ -$ -$ -$ 182 November - -$ -$ -$ -$ -$ -$ -$ -$ 183 December - -$ -$ -$ -$ -$ -$ -$ -$
184 13-Month Averages: -$
West of Devers Lugo-Pisgah
Red Bluff
10-CWIP
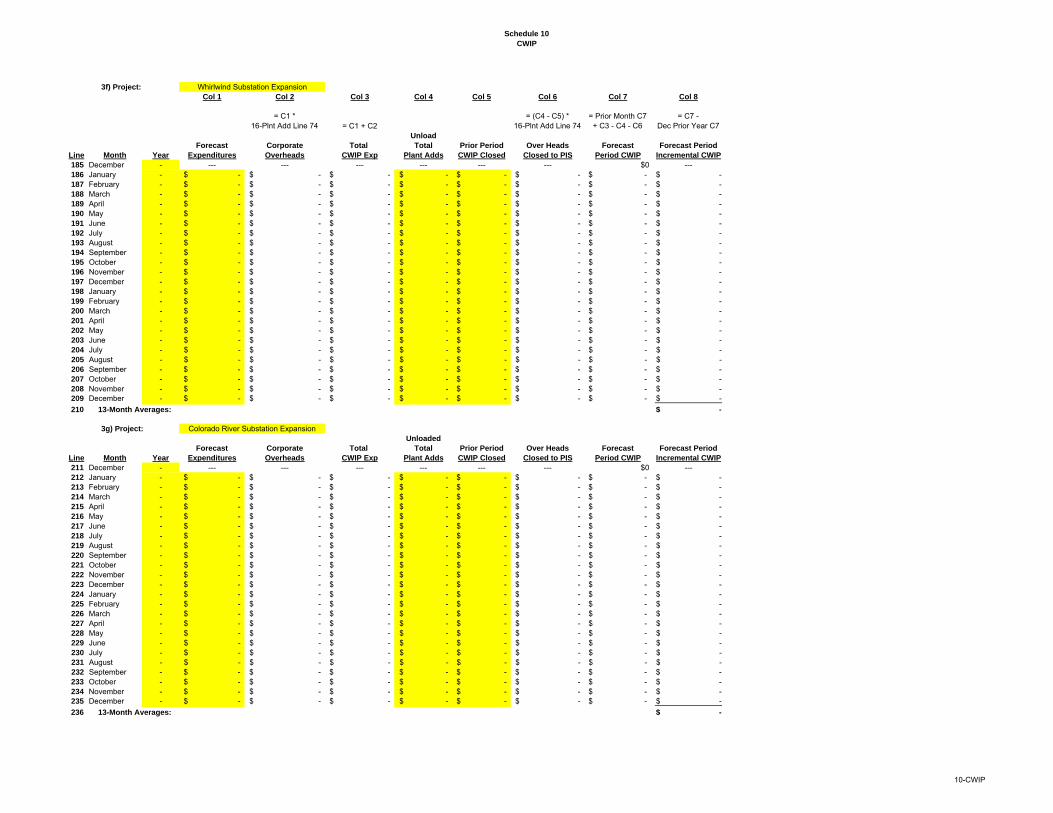
Schedule 10
CWIP
3f) Project:
Col 1 Col 2 Col 3 Col 4 Col 5 Col 6 Col 7 Col 8
= C1 * 16-Plnt Add Line 74 = C1 + C2
= (C4 - C5) *16-Plnt Add Line 74
= Prior Month C7+ C3 - C4 - C6
= C7 - Dec Prior Year C7
Unload
Forecast Corporate Total Total Prior Period Over Heads Forecast Forecast Period
Line Month Year Expenditures Overheads CWIP Exp Plant Adds CWIP Closed Closed to PIS Period CWIP Incremental CWIP
185 December - --- --- --- --- --- --- $0 ---186 January - -$ -$ -$ -$ -$ -$ -$ -$ 187 February - -$ -$ -$ -$ -$ -$ -$ -$ 188 March - -$ -$ -$ -$ -$ -$ -$ -$ 189 April - -$ -$ -$ -$ -$ -$ -$ -$ 190 May - -$ -$ -$ -$ -$ -$ -$ -$ 191 June - -$ -$ -$ -$ -$ -$ -$ -$ 192 July - -$ -$ -$ -$ -$ -$ -$ -$ 193 August - -$ -$ -$ -$ -$ -$ -$ -$ 194 September - -$ -$ -$ -$ -$ -$ -$ -$ 195 October - -$ -$ -$ -$ -$ -$ -$ -$ 196 November - -$ -$ -$ -$ -$ -$ -$ -$ 197 December - -$ -$ -$ -$ -$ -$ -$ -$ 198 January - -$ -$ -$ -$ -$ -$ -$ -$ 199 February - -$ -$ -$ -$ -$ -$ -$ -$ 200 March - -$ -$ -$ -$ -$ -$ -$ -$ 201 April - -$ -$ -$ -$ -$ -$ -$ -$ 202 May - -$ -$ -$ -$ -$ -$ -$ -$ 203 June - -$ -$ -$ -$ -$ -$ -$ -$ 204 July - -$ -$ -$ -$ -$ -$ -$ -$ 205 August - -$ -$ -$ -$ -$ -$ -$ -$ 206 September - -$ -$ -$ -$ -$ -$ -$ -$ 207 October - -$ -$ -$ -$ -$ -$ -$ -$ 208 November - -$ -$ -$ -$ -$ -$ -$ -$ 209 December - -$ -$ -$ -$ -$ -$ -$ -$
210 13-Month Averages: -$
3g) Project:
Unloaded
Forecast Corporate Total Total Prior Period Over Heads Forecast Forecast Period
Line Month Year Expenditures Overheads CWIP Exp Plant Adds CWIP Closed Closed to PIS Period CWIP Incremental CWIP
211 December - --- --- --- --- --- --- $0 ---212 January - -$ -$ -$ -$ -$ -$ -$ -$ 213 February - -$ -$ -$ -$ -$ -$ -$ -$ 214 March - -$ -$ -$ -$ -$ -$ -$ -$ 215 April - -$ -$ -$ -$ -$ -$ -$ -$ 216 May - -$ -$ -$ -$ -$ -$ -$ -$ 217 June - -$ -$ -$ -$ -$ -$ -$ -$ 218 July - -$ -$ -$ -$ -$ -$ -$ -$ 219 August - -$ -$ -$ -$ -$ -$ -$ -$ 220 September - -$ -$ -$ -$ -$ -$ -$ -$ 221 October - -$ -$ -$ -$ -$ -$ -$ -$ 222 November - -$ -$ -$ -$ -$ -$ -$ -$ 223 December - -$ -$ -$ -$ -$ -$ -$ -$ 224 January - -$ -$ -$ -$ -$ -$ -$ -$ 225 February - -$ -$ -$ -$ -$ -$ -$ -$ 226 March - -$ -$ -$ -$ -$ -$ -$ -$ 227 April - -$ -$ -$ -$ -$ -$ -$ -$ 228 May - -$ -$ -$ -$ -$ -$ -$ -$ 229 June - -$ -$ -$ -$ -$ -$ -$ -$ 230 July - -$ -$ -$ -$ -$ -$ -$ -$ 231 August - -$ -$ -$ -$ -$ -$ -$ -$ 232 September - -$ -$ -$ -$ -$ -$ -$ -$ 233 October - -$ -$ -$ -$ -$ -$ -$ -$ 234 November - -$ -$ -$ -$ -$ -$ -$ -$ 235 December - -$ -$ -$ -$ -$ -$ -$ -$
236 13-Month Averages: -$
Colorado River Substation Expansion
Whirlwind Substation Expansion
10-CWIP

Schedule 10
CWIP
3h) Project:
Col 1 Col 2 Col 3 Col 4 Col 5 Col 6 Col 7 Col 8
= C1 * 16-Plnt Add Line 74 = C1 + C2
= (C4 - C5) *16-Plnt Add Line 74
= Prior Month C7+ C3 - C4 - C6
= C7 - Dec Prior Year C7
Unloaded
Forecast Corporate Total Total Prior Period Over Heads Forecast Forecast Period
Line Month Year Expenditures Overheads CWIP Exp Plant Adds CWIP Closed Closed to PIS Period CWIP Incremental CWIP
237 December - --- --- --- --- --- --- $0 ---238 January - -$ -$ -$ -$ -$ -$ -$ -$ 239 February - -$ -$ -$ -$ -$ -$ -$ -$ 240 March - -$ -$ -$ -$ -$ -$ -$ -$ 241 April - -$ -$ -$ -$ -$ -$ -$ -$ 242 May - -$ -$ -$ -$ -$ -$ -$ -$ 243 June - -$ -$ -$ -$ -$ -$ -$ -$ 244 July - -$ -$ -$ -$ -$ -$ -$ -$ 245 August - -$ -$ -$ -$ -$ -$ -$ -$ 246 September - -$ -$ -$ -$ -$ -$ -$ -$ 247 October - -$ -$ -$ -$ -$ -$ -$ -$ 248 November - -$ -$ -$ -$ -$ -$ -$ -$ 249 December - -$ -$ -$ -$ -$ -$ -$ -$ 250 January - -$ -$ -$ -$ -$ -$ -$ -$ 251 February - -$ -$ -$ -$ -$ -$ -$ -$ 252 March - -$ -$ -$ -$ -$ -$ -$ -$ 253 April - -$ -$ -$ -$ -$ -$ -$ -$ 254 May - -$ -$ -$ -$ -$ -$ -$ -$ 255 June - -$ -$ -$ -$ -$ -$ -$ -$ 256 July - -$ -$ -$ -$ -$ -$ -$ -$ 257 August - -$ -$ -$ -$ -$ -$ -$ -$ 258 September - -$ -$ -$ -$ -$ -$ -$ -$ 259 October - -$ -$ -$ -$ -$ -$ -$ -$ 260 November - -$ -$ -$ -$ -$ -$ -$ -$ 261 December - -$ -$ -$ -$ -$ -$ -$ -$
262 13-Month Averages: -$
3i) Project:
Unloaded
Forecast Corporate Total Total Prior Period Over Heads Forecast Forecast Period
Line Month Year Expenditures Overheads CWIP Exp Plant Adds CWIP Closed Closed to PIS Period CWIP Incremental CWIP
263 December - --- --- --- --- --- --- $0 ---264 January - -$ -$ -$ -$ -$ -$ -$ -$ 265 February - -$ -$ -$ -$ -$ -$ -$ -$ 266 March - -$ -$ -$ -$ -$ -$ -$ -$ 267 April - -$ -$ -$ -$ -$ -$ -$ -$ 268 May - -$ -$ -$ -$ -$ -$ -$ -$ 269 June - -$ -$ -$ -$ -$ -$ -$ -$ 270 July - -$ -$ -$ -$ -$ -$ -$ -$ 271 August - -$ -$ -$ -$ -$ -$ -$ -$ 272 September - -$ -$ -$ -$ -$ -$ -$ -$ 273 October - -$ -$ -$ -$ -$ -$ -$ -$ 274 November - -$ -$ -$ -$ -$ -$ -$ -$ 275 December - -$ -$ -$ -$ -$ -$ -$ -$ 276 January - -$ -$ -$ -$ -$ -$ -$ -$ 277 February - -$ -$ -$ -$ -$ -$ -$ -$ 278 March - -$ -$ -$ -$ -$ -$ -$ -$ 279 April - -$ -$ -$ -$ -$ -$ -$ -$ 280 May - -$ -$ -$ -$ -$ -$ -$ -$ 281 June - -$ -$ -$ -$ -$ -$ -$ -$ 282 July - -$ -$ -$ -$ -$ -$ -$ -$ 283 August - -$ -$ -$ -$ -$ -$ -$ -$ 284 September - -$ -$ -$ -$ -$ -$ -$ -$ 285 October - -$ -$ -$ -$ -$ -$ -$ -$ 286 November - -$ -$ -$ -$ -$ -$ -$ -$ 287 December - -$ -$ -$ -$ -$ -$ -$ -$
288 13-Month Averages: -$
South of Kramer
West of Devers
Add yellow shading
10-CWIP
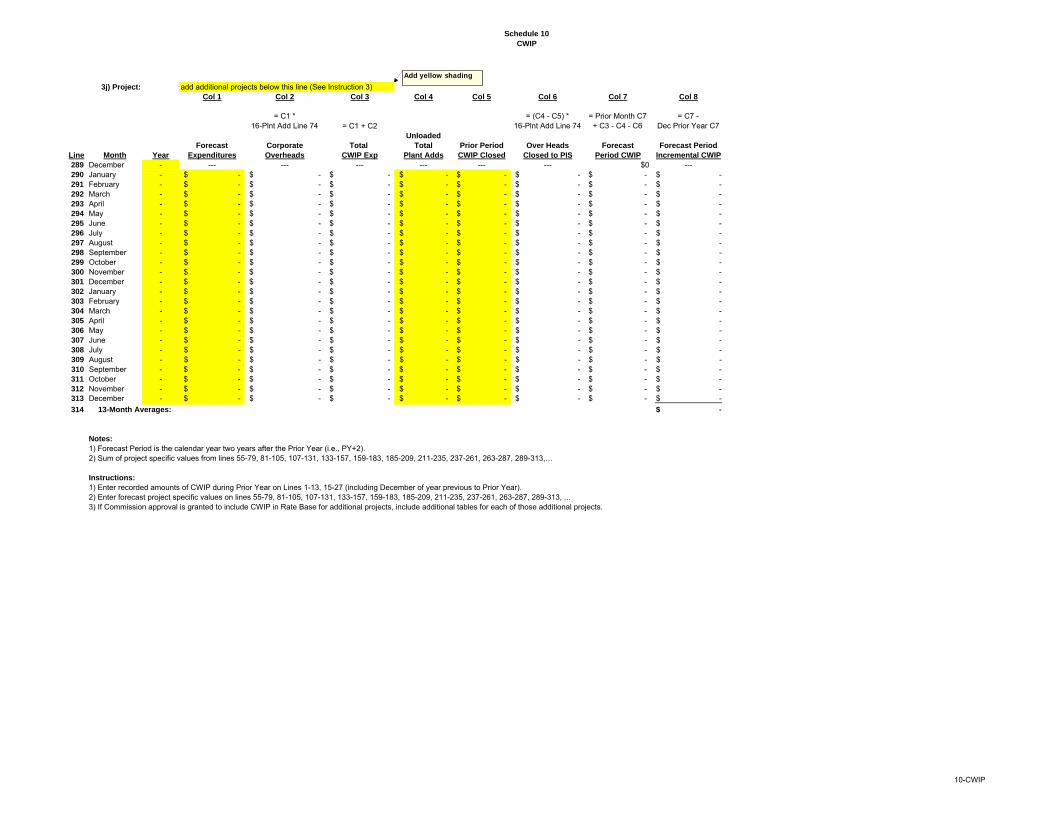
Schedule 10
CWIP
3j) Project: add additional projects below this line (See Instruction 3)Col 1 Col 2 Col 3 Col 4 Col 5 Col 6 Col 7 Col 8
= C1 * 16-Plnt Add Line 74 = C1 + C2
= (C4 - C5) *16-Plnt Add Line 74
= Prior Month C7+ C3 - C4 - C6
= C7 - Dec Prior Year C7
Unloaded
Forecast Corporate Total Total Prior Period Over Heads Forecast Forecast Period
Line Month Year Expenditures Overheads CWIP Exp Plant Adds CWIP Closed Closed to PIS Period CWIP Incremental CWIP
289 December - --- --- --- --- --- --- $0 ---290 January - -$ -$ -$ -$ -$ -$ -$ -$ 291 February - -$ -$ -$ -$ -$ -$ -$ -$ 292 March - -$ -$ -$ -$ -$ -$ -$ -$ 293 April - -$ -$ -$ -$ -$ -$ -$ -$ 294 May - -$ -$ -$ -$ -$ -$ -$ -$ 295 June - -$ -$ -$ -$ -$ -$ -$ -$ 296 July - -$ -$ -$ -$ -$ -$ -$ -$ 297 August - -$ -$ -$ -$ -$ -$ -$ -$ 298 September - -$ -$ -$ -$ -$ -$ -$ -$ 299 October - -$ -$ -$ -$ -$ -$ -$ -$ 300 November - -$ -$ -$ -$ -$ -$ -$ -$ 301 December - -$ -$ -$ -$ -$ -$ -$ -$ 302 January - -$ -$ -$ -$ -$ -$ -$ -$ 303 February - -$ -$ -$ -$ -$ -$ -$ -$ 304 March - -$ -$ -$ -$ -$ -$ -$ -$ 305 April - -$ -$ -$ -$ -$ -$ -$ -$ 306 May - -$ -$ -$ -$ -$ -$ -$ -$ 307 June - -$ -$ -$ -$ -$ -$ -$ -$ 308 July - -$ -$ -$ -$ -$ -$ -$ -$ 309 August - -$ -$ -$ -$ -$ -$ -$ -$ 310 September - -$ -$ -$ -$ -$ -$ -$ -$ 311 October - -$ -$ -$ -$ -$ -$ -$ -$ 312 November - -$ -$ -$ -$ -$ -$ -$ -$ 313 December - -$ -$ -$ -$ -$ -$ -$ -$
314 13-Month Averages: -$
Notes:
1) Forecast Period is the calendar year two years after the Prior Year (i.e., PY+2). 2) Sum of project specific values from lines 55-79, 81-105, 107-131, 133-157, 159-183, 185-209, 211-235, 237-261, 263-287, 289-313,…
Instructions:
1) Enter recorded amounts of CWIP during Prior Year on Lines 1-13, 15-27 (including December of year previous to Prior Year).2) Enter forecast project specific values on lines 55-79, 81-105, 107-131, 133-157, 159-183, 185-209, 211-235, 237-261, 263-287, 289-313, ...3) If Commission approval is granted to include CWIP in Rate Base for additional projects, include additional tables for each of those additional projects.
Add yellow shading
10-CWIP

Schedule 11
Plant Held for Future Use
TRANSMISSION PLANT HELD FOR FUTURE USE
Inputs are shaded yellowTransmission Plant Held for Future Use shall be amounts of Electric Plant Held for Future Use (account 105)intended to be placed under the Operational Control of the ISO, plus an allocated amount of any GeneralElectric Plant Held for Future Use, with the allocation factor being the Transmission Wages and Salaries AF.
Line Beginning of Year Balance End of Year Balance Source
1 Total Electric PHFU -$ -$ FF1 page 214.47d
Plant intended to be placed under the Operational Control of the ISO:
Col 1 Col 2 Col 3 Col 4 Col 5
Type
Description of Plant Beginning of Year Balance End of Year Balance Source
2a -$ -$ 2b -$ -$ 2c -$ -$ 2d -$ -$ 2e -$ -$ 2f -$ -$ 2g -$ -$ 2h -$ -$
…
3 Total: -$ -$ Sum of above lines
Beginning of Year Balance End of Year Balance Source
4 General Plant Held for Future Use -$ -$ FF1 page 2145 Wages and Salaries AF: - % - % 27-Allocators, L 96 Portion for Transmission PHFU: -$ -$ L 4 * L 5
All other Electric Plant Held for Future Use not intended to be placed under the Operational Control of the ISO:
Beginning of Year Balance End of Year Balance Source
7 -$ -$ Note 1
Transmission PHFU: Beginning of Year Balance End of Year Balance Source
8 -$ -$ L 3 + L 6
Average of BOY and EOY9 Transmission PHFU: -$ Sum of Line 8 / 2
Calculation of Gain or Loss on Transmission Plant Held for Future Use -- Land
Source
10 Gain or Loss on Transmission Plant Held for Future Use --- Land -$ SCE Records
Instructions:
1) For any Electric Plant Held for Future Use intended to be placed under the Operational Control of the ISO,list on lines 2a, 2b, etc. Provide description in Column 1. Note type of plant (land or other) in Column 2.Under "Source" (Column 5), state the line number on FERC Form 1 page 214 from which the amount is derived.BOY amount will be EOY value from previous year FERC Form 1, EOY amount will be in current year FF1.2) For any Electric Plant Held for Future Use classified as General note amount on Line 4.3) Add additional lines 2 i, j, k, etc. as necessary to include additional projects intended to be placed under the Operational Control of the ISO.4) Gains and Losses on Transmission Plant Held for Future Use - Land is treated in accordance with Commission policy.Any gain or loss on non-land portions of Transmission Plant Held for Future Use is not included.
Notes:
1) Amount of Line 1 not intended to be placed under the Operational Control of the ISO.
11-PHFU
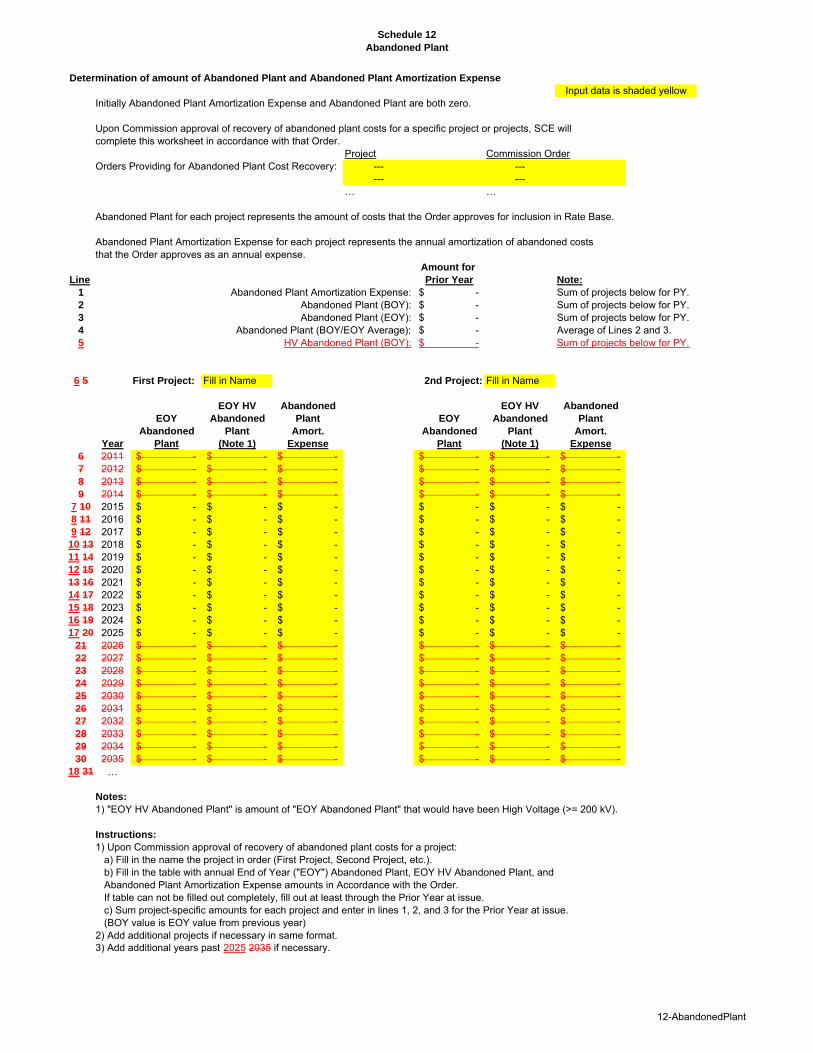
Schedule 12
Abandoned Plant
Determination of amount of Abandoned Plant and Abandoned Plant Amortization Expense
Input data is shaded yellowInitially Abandoned Plant Amortization Expense and Abandoned Plant are both zero.
Upon Commission approval of recovery of abandoned plant costs for a specific project or projects, SCE willcomplete this worksheet in accordance with that Order.
Project Commission OrderOrders Providing for Abandoned Plant Cost Recovery: --- ---
--- ---… …
Abandoned Plant for each project represents the amount of costs that the Order approves for inclusion in Rate Base.
Abandoned Plant Amortization Expense for each project represents the annual amortization of abandoned costs that the Order approves as an annual expense.
Amount for
Line Prior Year Note:
1 Abandoned Plant Amortization Expense: -$ Sum of projects below for PY.2 Abandoned Plant (BOY): -$ Sum of projects below for PY.3 Abandoned Plant (EOY): -$ Sum of projects below for PY.4 Abandoned Plant (BOY/EOY Average): -$ Average of Lines 2 and 3.5 HV Abandoned Plant (BOY): -$ Sum of projects below for PY.
6 5 First Project: Fill in Name 2nd Project: Fill in Name
EOY HV Abandoned EOY HV Abandoned
EOY Abandoned Plant EOY Abandoned Plant
Abandoned Plant Amort. Abandoned Plant Amort.
Year Plant (Note 1) Expense Plant (Note 1) Expense
6 2011 -$ -$ -$ -$ -$ -$ 7 2012 -$ -$ -$ -$ -$ -$ 8 2013 -$ -$ -$ -$ -$ -$ 9 2014 -$ -$ -$ -$ -$ -$
7 10 2015 -$ -$ -$ -$ -$ -$ 8 11 2016 -$ -$ -$ -$ -$ -$ 9 12 2017 -$ -$ -$ -$ -$ -$
10 13 2018 -$ -$ -$ -$ -$ -$ 11 14 2019 -$ -$ -$ -$ -$ -$ 12 15 2020 -$ -$ -$ -$ -$ -$ 13 16 2021 -$ -$ -$ -$ -$ -$ 14 17 2022 -$ -$ -$ -$ -$ -$ 15 18 2023 -$ -$ -$ -$ -$ -$ 16 19 2024 -$ -$ -$ -$ -$ -$ 17 20 2025 -$ -$ -$ -$ -$ -$
21 2026 -$ -$ -$ -$ -$ -$ 22 2027 -$ -$ -$ -$ -$ -$ 23 2028 -$ -$ -$ -$ -$ -$ 24 2029 -$ -$ -$ -$ -$ -$ 25 2030 -$ -$ -$ -$ -$ -$ 26 2031 -$ -$ -$ -$ -$ -$ 27 2032 -$ -$ -$ -$ -$ -$ 28 2033 -$ -$ -$ -$ -$ -$ 29 2034 -$ -$ -$ -$ -$ -$ 30 2035 -$ -$ -$ -$ -$ -$
18 31 …
Notes:
1) "EOY HV Abandoned Plant" is amount of "EOY Abandoned Plant" that would have been High Voltage (>= 200 kV).
Instructions:
1) Upon Commission approval of recovery of abandoned plant costs for a project:a) Fill in the name the project in order (First Project, Second Project, etc.).b) Fill in the table with annual End of Year ("EOY") Abandoned Plant, EOY HV Abandoned Plant, andAbandoned Plant Amortization Expense amounts in Accordance with the Order.If table can not be filled out completely, fill out at least through the Prior Year at issue.c) Sum project-specific amounts for each project and enter in lines 1, 2, and 3 for the Prior Year at issue.(BOY value is EOY value from previous year)
2) Add additional projects if necessary in same format.3) Add additional years past 2025 2035 if necessary.
12-AbandonedPlant
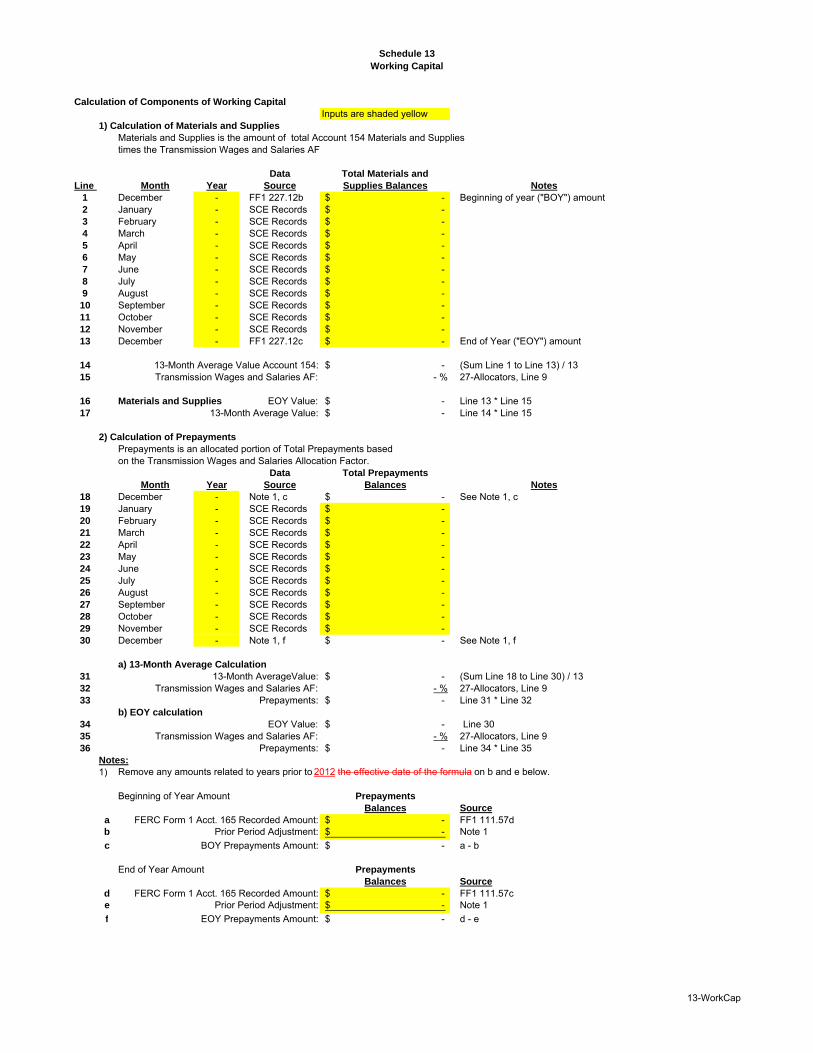
Schedule 13
Working Capital
Calculation of Components of Working Capital
Inputs are shaded yellow1) Calculation of Materials and Supplies
Materials and Supplies is the amount of total Account 154 Materials and Supplies times the Transmission Wages and Salaries AF
Data Total Materials and
Line Month Year Source Supplies Balances Notes
1 December - FF1 227.12b -$ Beginning of year ("BOY") amount2 January - SCE Records -$ 3 February - SCE Records -$ 4 March - SCE Records -$ 5 April - SCE Records -$ 6 May - SCE Records -$ 7 June - SCE Records -$ 8 July - SCE Records -$ 9 August - SCE Records -$ 10 September - SCE Records -$ 11 October - SCE Records -$ 12 November - SCE Records -$ 13 December - FF1 227.12c -$ End of Year ("EOY") amount
14 13-Month Average Value Account 154: -$ (Sum Line 1 to Line 13) / 1315 Transmission Wages and Salaries AF: - % 27-Allocators, Line 9
16 Materials and Supplies EOY Value: -$ Line 13 * Line 1517 13-Month Average Value: -$ Line 14 * Line 15
2) Calculation of Prepayments
Prepayments is an allocated portion of Total Prepayments based on the Transmission Wages and Salaries Allocation Factor.
Data Total Prepayments
Month Year Source Balances Notes
18 December - Note 1, c -$ See Note 1, c19 January - SCE Records -$ 20 February - SCE Records -$ 21 March - SCE Records -$ 22 April - SCE Records -$ 23 May - SCE Records -$ 24 June - SCE Records -$ 25 July - SCE Records -$ 26 August - SCE Records -$ 27 September - SCE Records -$ 28 October - SCE Records -$ 29 November - SCE Records -$ 30 December - Note 1, f -$ See Note 1, f
a) 13-Month Average Calculation
31 13-Month AverageValue: -$ (Sum Line 18 to Line 30) / 1332 Transmission Wages and Salaries AF: - % 27-Allocators, Line 933 Prepayments: -$ Line 31 * Line 32
b) EOY calculation
34 EOY Value: -$ Line 3035 Transmission Wages and Salaries AF: - % 27-Allocators, Line 936 Prepayments: -$ Line 34 * Line 35
Notes:
1) Remove any amounts related to years prior to 2012 the effective date of the formula on b and e below.
Beginning of Year Amount Prepayments
Balances Source
a FERC Form 1 Acct. 165 Recorded Amount: -$ FF1 111.57db Prior Period Adjustment: -$ Note 1
c BOY Prepayments Amount: -$ a - b
End of Year Amount Prepayments
Balances Source
d FERC Form 1 Acct. 165 Recorded Amount: -$ FF1 111.57ce Prior Period Adjustment: -$ Note 1
f EOY Prepayments Amount: -$ d - e
13-WorkCap
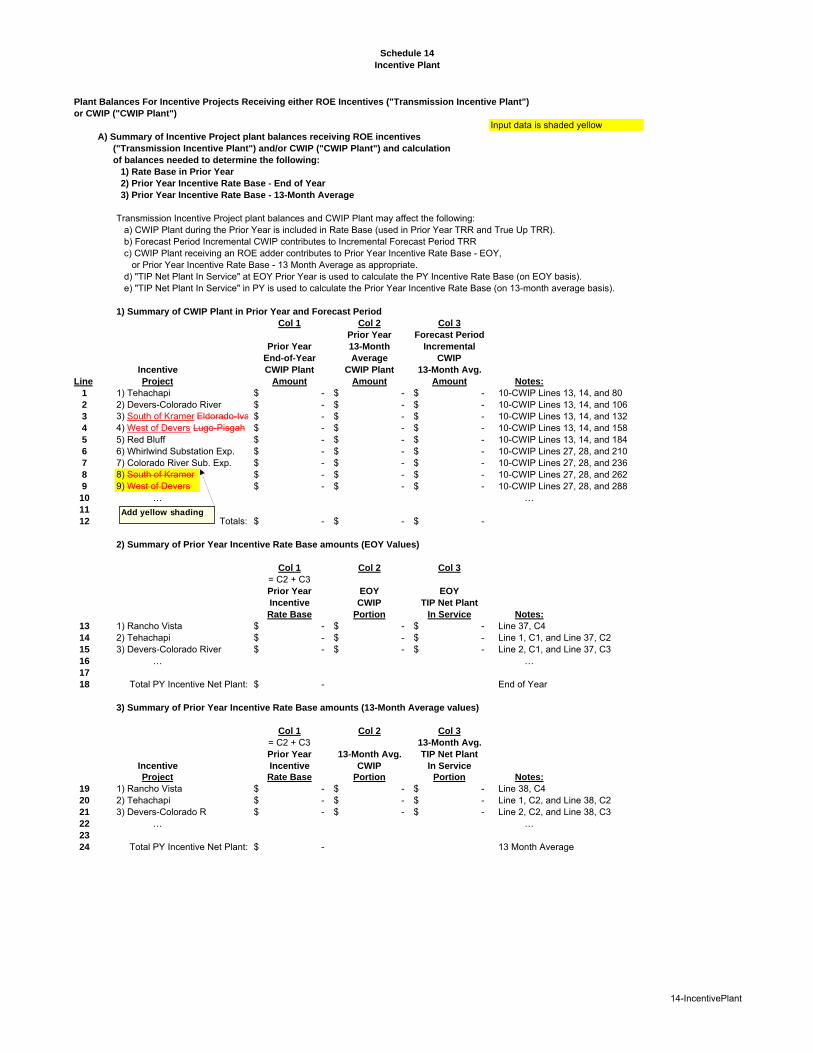
Schedule 14
Incentive Plant
Plant Balances For Incentive Projects Receiving either ROE Incentives ("Transmission Incentive Plant")
or CWIP ("CWIP Plant")
Input data is shaded yellowA) Summary of Incentive Project plant balances receiving ROE incentives
("Transmission Incentive Plant") and/or CWIP ("CWIP Plant") and calculation
of balances needed to determine the following:
1) Rate Base in Prior Year
2) Prior Year Incentive Rate Base - End of Year
3) Prior Year Incentive Rate Base - 13-Month Average
Transmission Incentive Project plant balances and CWIP Plant may affect the following: a) CWIP Plant during the Prior Year is included in Rate Base (used in Prior Year TRR and True Up TRR).b) Forecast Period Incremental CWIP contributes to Incremental Forecast Period TRR c) CWIP Plant receiving an ROE adder contributes to Prior Year Incentive Rate Base - EOY,
or Prior Year Incentive Rate Base - 13 Month Average as appropriate.d) "TIP Net Plant In Service" at EOY Prior Year is used to calculate the PY Incentive Rate Base (on EOY basis).e) "TIP Net Plant In Service" in PY is used to calculate the Prior Year Incentive Rate Base (on 13-month average basis).
1) Summary of CWIP Plant in Prior Year and Forecast Period
Col 1 Col 2 Col 3
Prior Year Forecast Period
Prior Year 13-Month Incremental
End-of-Year Average CWIP
Incentive CWIP Plant CWIP Plant 13-Month Avg.
Line Project Amount Amount Amount Notes:
1 1) Tehachapi -$ -$ -$ 10-CWIP Lines 13, 14, and 802 2) Devers-Colorado River -$ -$ -$ 10-CWIP Lines 13, 14, and 1063 3) South of Kramer Eldorado-Iva -$ -$ -$ 10-CWIP Lines 13, 14, and 1324 4) West of Devers Lugo-Pisgah -$ -$ -$ 10-CWIP Lines 13, 14, and 1585 5) Red Bluff -$ -$ -$ 10-CWIP Lines 13, 14, and 1846 6) Whirlwind Substation Exp. -$ -$ -$ 10-CWIP Lines 27, 28, and 2107 7) Colorado River Sub. Exp. -$ -$ -$ 10-CWIP Lines 27, 28, and 2368 8) South of Kramer -$ -$ -$ 10-CWIP Lines 27, 28, and 2629 9) West of Devers -$ -$ -$ 10-CWIP Lines 27, 28, and 28810 … …11
12 Totals: -$ -$ -$
2) Summary of Prior Year Incentive Rate Base amounts (EOY Values)
Col 1 Col 2 Col 3
= C2 + C3Prior Year EOY EOY
Incentive CWIP TIP Net Plant
Rate Base Portion In Service Notes:
13 1) Rancho Vista -$ -$ -$ Line 37, C414 2) Tehachapi -$ -$ -$ Line 1, C1, and Line 37, C215 3) Devers-Colorado River -$ -$ -$ Line 2, C1, and Line 37, C316 … …17
18 Total PY Incentive Net Plant: -$ End of Year
3) Summary of Prior Year Incentive Rate Base amounts (13-Month Average values)
Col 1 Col 2 Col 3
= C2 + C3 13-Month Avg.
Prior Year 13-Month Avg. TIP Net Plant
Incentive Incentive CWIP In Service
Project Rate Base Portion Portion Notes:
19 1) Rancho Vista -$ -$ -$ Line 38, C420 2) Tehachapi -$ -$ -$ Line 1, C2, and Line 38, C221 3) Devers-Colorado R -$ -$ -$ Line 2, C2, and Line 38, C322 … …23
24 Total PY Incentive Net Plant: -$ 13 Month Average
Add yellow shading
14-IncentivePlant

Schedule 14
Incentive Plant
4) Prior Year TIP Net Plant In Service
Col 1 Col 2 Col 3 Col 4 Col 5
Prior Total TIP L 53 to L 65, C3 L 79 to L 91, C3 L 66 to L 78, C3Year Net Plant Devers to Rancho
Month Year In Service Tehachapi Colorado River Vista Notes
25 December - -$ -$ -$ -$ --- ←December of26 January - -$ -$ -$ -$ --- year previous27 February - -$ -$ -$ -$ --- to Prior Year28 March - -$ -$ -$ -$ ---29 April - -$ -$ -$ -$ ---30 May - -$ -$ -$ -$ ---31 June - -$ -$ -$ -$ ---32 July - -$ -$ -$ -$ ---33 August - -$ -$ -$ -$ ---34 September - -$ -$ -$ -$ ---35 October - -$ -$ -$ -$ ---36 November - -$ -$ -$ -$ ---37 December - -$ -$ -$ -$ ---
38 13 Month Averages: -$ -$ -$ -$
5) Total Transmission Activity for Incentive Projects
Col 1 Col 2 Col 3
= C1 - C2Total Transmission Account 350-359
Prior Activity for Account Activity for
Year Incentive 360-362 Incentive
Month Year Projects Activity Projects Source
39 December - -$ -$ -$ C1: Sum of below projects40 January - -$ -$ -$ for each month41 February - -$ -$ -$ 42 March - -$ -$ -$ 43 April - -$ -$ -$ 44 May - -$ -$ -$ 45 June - -$ -$ -$ 46 July - -$ -$ -$ 47 August - -$ -$ -$ 48 September - -$ -$ -$ 49 October - -$ -$ -$ 50 November - -$ -$ -$ 51 December - -$ -$ -$
52 Total -$ -$ -$
6) Calculation of Prior Year Net Plant in Service amounts for each Incentive Project
a) Tehachapi Col 1 Col 2 Col 3 Col 4
= C1 - C2 = C1 - PreviousPrior Month C1Year Plant Accumulated Net Plant Transmission
Month Year In-Service Depreciation In Service Activity
53 December - -$ -$ -$ -$ 54 January - -$ -$ -$ -$ 55 February - -$ -$ -$ -$ 56 March - -$ -$ -$ -$ 57 April - -$ -$ -$ -$ 58 May - -$ -$ -$ -$ 59 June - -$ -$ -$ -$ 60 July - -$ -$ -$ -$ 61 August - -$ -$ -$ -$ 62 September - -$ -$ -$ -$ 63 October - -$ -$ -$ -$ 64 November - -$ -$ -$ -$ 65 December - -$ -$ -$ -$
14-IncentivePlant
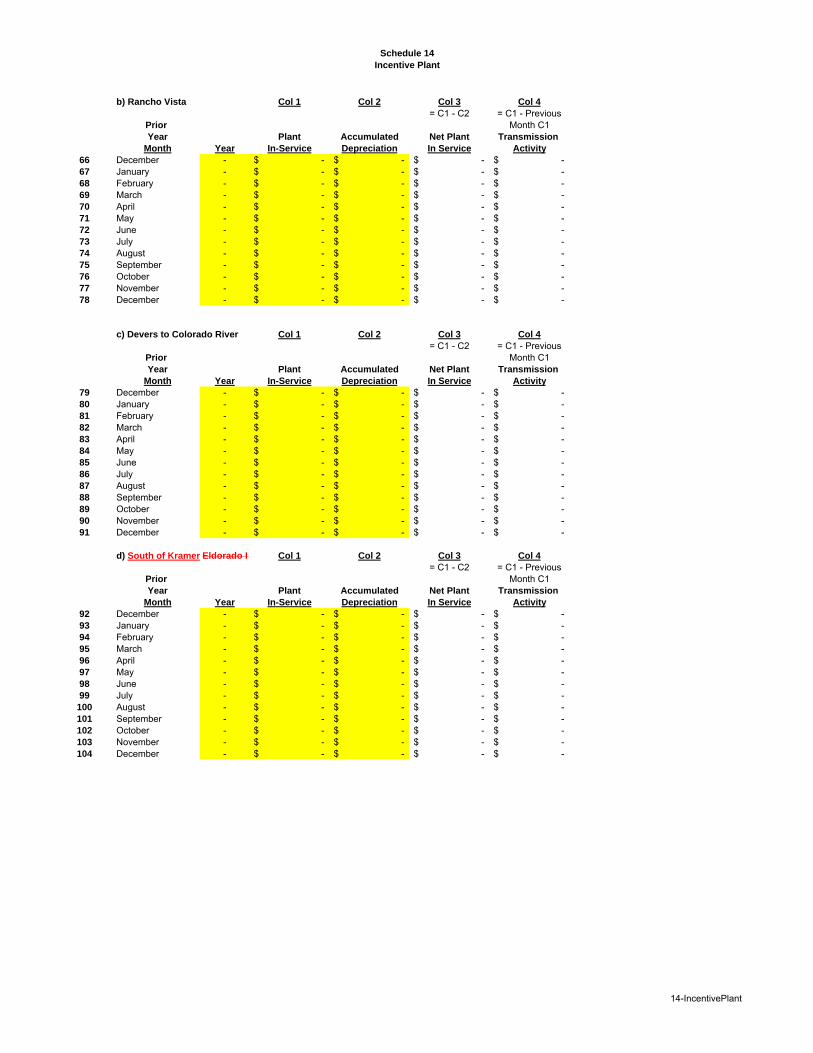
Schedule 14
Incentive Plant
b) Rancho Vista Col 1 Col 2 Col 3 Col 4
= C1 - C2 = C1 - PreviousPrior Month C1Year Plant Accumulated Net Plant Transmission
Month Year In-Service Depreciation In Service Activity
66 December - -$ -$ -$ -$ 67 January - -$ -$ -$ -$ 68 February - -$ -$ -$ -$ 69 March - -$ -$ -$ -$ 70 April - -$ -$ -$ -$ 71 May - -$ -$ -$ -$ 72 June - -$ -$ -$ -$ 73 July - -$ -$ -$ -$ 74 August - -$ -$ -$ -$ 75 September - -$ -$ -$ -$ 76 October - -$ -$ -$ -$ 77 November - -$ -$ -$ -$ 78 December - -$ -$ -$ -$
c) Devers to Colorado River Col 1 Col 2 Col 3 Col 4
= C1 - C2 = C1 - PreviousPrior Month C1Year Plant Accumulated Net Plant Transmission
Month Year In-Service Depreciation In Service Activity
79 December - -$ -$ -$ -$ 80 January - -$ -$ -$ -$ 81 February - -$ -$ -$ -$ 82 March - -$ -$ -$ -$ 83 April - -$ -$ -$ -$ 84 May - -$ -$ -$ -$ 85 June - -$ -$ -$ -$ 86 July - -$ -$ -$ -$ 87 August - -$ -$ -$ -$ 88 September - -$ -$ -$ -$ 89 October - -$ -$ -$ -$ 90 November - -$ -$ -$ -$ 91 December - -$ -$ -$ -$
d) South of Kramer Eldorado Iv Col 1 Col 2 Col 3 Col 4
= C1 - C2 = C1 - PreviousPrior Month C1Year Plant Accumulated Net Plant Transmission
Month Year In-Service Depreciation In Service Activity
92 December - -$ -$ -$ -$ 93 January - -$ -$ -$ -$ 94 February - -$ -$ -$ -$ 95 March - -$ -$ -$ -$ 96 April - -$ -$ -$ -$ 97 May - -$ -$ -$ -$ 98 June - -$ -$ -$ -$ 99 July - -$ -$ -$ -$ 100 August - -$ -$ -$ -$ 101 September - -$ -$ -$ -$ 102 October - -$ -$ -$ -$ 103 November - -$ -$ -$ -$ 104 December - -$ -$ -$ -$
14-IncentivePlant

Schedule 14
Incentive Plant
e) West of Devers Lugo Pisgah Col 1 Col 2 Col 3 Col 4
= C1 - C2 = C1 - PreviousPrior Month C1Year Plant Accumulated Net Plant Transmission
Month Year In-Service Depreciation In Service Activity
105 December - -$ -$ -$ -$ 106 January - -$ -$ -$ -$ 107 February - -$ -$ -$ -$ 108 March - -$ -$ -$ -$ 109 April - -$ -$ -$ -$ 110 May - -$ -$ -$ -$ 111 June - -$ -$ -$ -$ 112 July - -$ -$ -$ -$ 113 August - -$ -$ -$ -$ 114 September - -$ -$ -$ -$ 115 October - -$ -$ -$ -$ 116 November - -$ -$ -$ -$ 117 December - -$ -$ -$ -$
f) Red Bluff Col 1 Col 2 Col 3 Col 4
= C1 - C2 = C1 - PreviousPrior Month C1Year Plant Accumulated Net Plant Transmission
Month Year In-Service Depreciation In Service Activity
118 December - -$ -$ -$ -$ 119 January - -$ -$ -$ -$ 120 February - -$ -$ -$ -$ 121 March - -$ -$ -$ -$ 122 April - -$ -$ -$ -$ 123 May - -$ -$ -$ -$ 124 June - -$ -$ -$ -$ 125 July - -$ -$ -$ -$ 126 August - -$ -$ -$ -$ 127 September - -$ -$ -$ -$ 128 October - -$ -$ -$ -$ 129 November - -$ -$ -$ -$ 130 December - -$ -$ -$ -$
g) Whirlwind Substation Expansion Col 4
Col 1 Col 2 Col 3 = C1 - PreviousPrior = C1 - C2 Month C1Year Plant Accumulated Net Plant Transmission
Month Year In-Service Depreciation In Service Activity
131 December - -$ -$ -$ -$ 132 January - -$ -$ -$ -$ 133 February - -$ -$ -$ -$ 134 March - -$ -$ -$ -$ 135 April - -$ -$ -$ -$ 136 May - -$ -$ -$ -$ 137 June - -$ -$ -$ -$ 138 July - -$ -$ -$ -$ 139 August - -$ -$ -$ -$ 140 September - -$ -$ -$ -$ 141 October - -$ -$ -$ -$ 142 November - -$ -$ -$ -$ 143 December - -$ -$ -$ -$
14-IncentivePlant
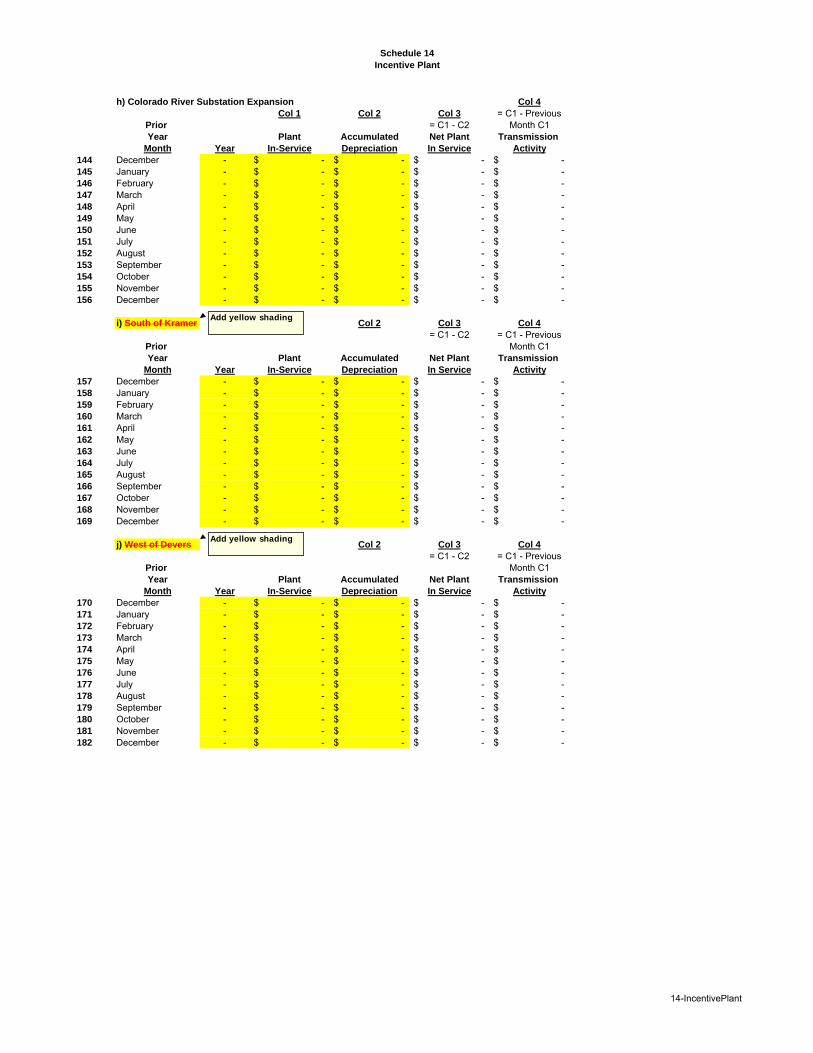
Schedule 14
Incentive Plant
h) Colorado River Substation Expansion Col 4
Col 1 Col 2 Col 3 = C1 - PreviousPrior = C1 - C2 Month C1Year Plant Accumulated Net Plant Transmission
Month Year In-Service Depreciation In Service Activity
144 December - -$ -$ -$ -$ 145 January - -$ -$ -$ -$ 146 February - -$ -$ -$ -$ 147 March - -$ -$ -$ -$ 148 April - -$ -$ -$ -$ 149 May - -$ -$ -$ -$ 150 June - -$ -$ -$ -$ 151 July - -$ -$ -$ -$ 152 August - -$ -$ -$ -$ 153 September - -$ -$ -$ -$ 154 October - -$ -$ -$ -$ 155 November - -$ -$ -$ -$ 156 December - -$ -$ -$ -$
i) South of Kramer Col 1 Col 2 Col 3 Col 4
= C1 - C2 = C1 - PreviousPrior Month C1Year Plant Accumulated Net Plant Transmission
Month Year In-Service Depreciation In Service Activity
157 December - -$ -$ -$ -$ 158 January - -$ -$ -$ -$ 159 February - -$ -$ -$ -$ 160 March - -$ -$ -$ -$ 161 April - -$ -$ -$ -$ 162 May - -$ -$ -$ -$ 163 June - -$ -$ -$ -$ 164 July - -$ -$ -$ -$ 165 August - -$ -$ -$ -$ 166 September - -$ -$ -$ -$ 167 October - -$ -$ -$ -$ 168 November - -$ -$ -$ -$ 169 December - -$ -$ -$ -$
j) West of Devers Col 1 Col 2 Col 3 Col 4
= C1 - C2 = C1 - PreviousPrior Month C1Year Plant Accumulated Net Plant Transmission
Month Year In-Service Depreciation In Service Activity
170 December - -$ -$ -$ -$ 171 January - -$ -$ -$ -$ 172 February - -$ -$ -$ -$ 173 March - -$ -$ -$ -$ 174 April - -$ -$ -$ -$ 175 May - -$ -$ -$ -$ 176 June - -$ -$ -$ -$ 177 July - -$ -$ -$ -$ 178 August - -$ -$ -$ -$ 179 September - -$ -$ -$ -$ 180 October - -$ -$ -$ -$ 181 November - -$ -$ -$ -$ 182 December - -$ -$ -$ -$
Add yellow shading
Add yellow shading
14-IncentivePlant
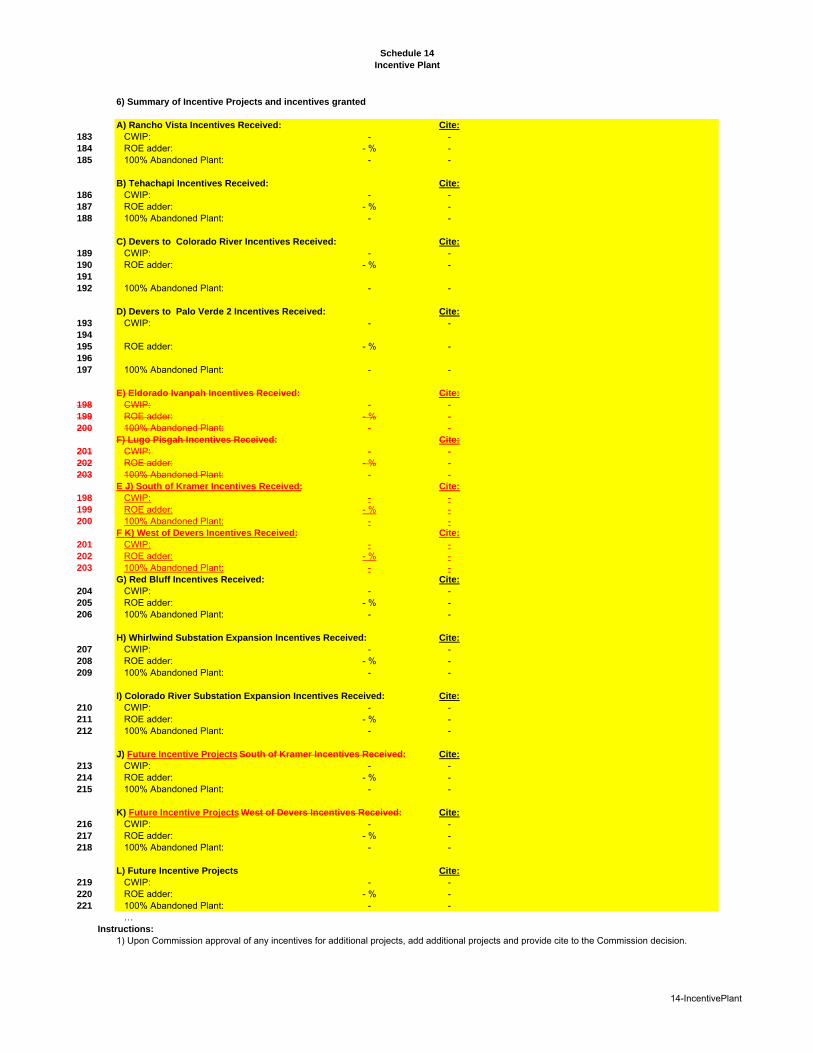
Schedule 14
Incentive Plant
6) Summary of Incentive Projects and incentives granted
A) Rancho Vista Incentives Received: Cite:
183 CWIP: - -184 ROE adder: - % -185 100% Abandoned Plant: - -
B) Tehachapi Incentives Received: Cite:
186 CWIP: - -187 ROE adder: - % -188 100% Abandoned Plant: - -
C) Devers to Colorado River Incentives Received: Cite:
189 CWIP: - -190 ROE adder: - % -191
192 100% Abandoned Plant: - -
D) Devers to Palo Verde 2 Incentives Received: Cite:
193 CWIP: - -194
195 ROE adder: - % -196
197 100% Abandoned Plant: - -
E) Eldorado Ivanpah Incentives Received: Cite:
198 CWIP: - -199 ROE adder: - % -200 100% Abandoned Plant: - -
F) Lugo Pisgah Incentives Received: Cite:
201 CWIP: - -202 ROE adder: - % -203 100% Abandoned Plant: - -
E J) South of Kramer Incentives Received: Cite:
198 CWIP: - -199 ROE adder: - % -200 100% Abandoned Plant: - -
F K) West of Devers Incentives Received: Cite:
201 CWIP: - -202 ROE adder: - % -203 100% Abandoned Plant: - -
G) Red Bluff Incentives Received: Cite:
204 CWIP: - -205 ROE adder: - % -206 100% Abandoned Plant: - -
H) Whirlwind Substation Expansion Incentives Received: Cite:
207 CWIP: - -208 ROE adder: - % -209 100% Abandoned Plant: - -
I) Colorado River Substation Expansion Incentives Received: Cite:
210 CWIP: - -211 ROE adder: - % -212 100% Abandoned Plant: - -
J) Future Incentive Projects South of Kramer Incentives Received: Cite:
213 CWIP: - -214 ROE adder: - % -215 100% Abandoned Plant: - -
K) Future Incentive Projects West of Devers Incentives Received: Cite:
216 CWIP: - -217 ROE adder: - % -218 100% Abandoned Plant: - -
L) Future Incentive Projects Cite:
219 CWIP: - -220 ROE adder: - % -221 100% Abandoned Plant: - -
…Instructions:
1) Upon Commission approval of any incentives for additional projects, add additional projects and provide cite to the Commission decision.
14-IncentivePlant
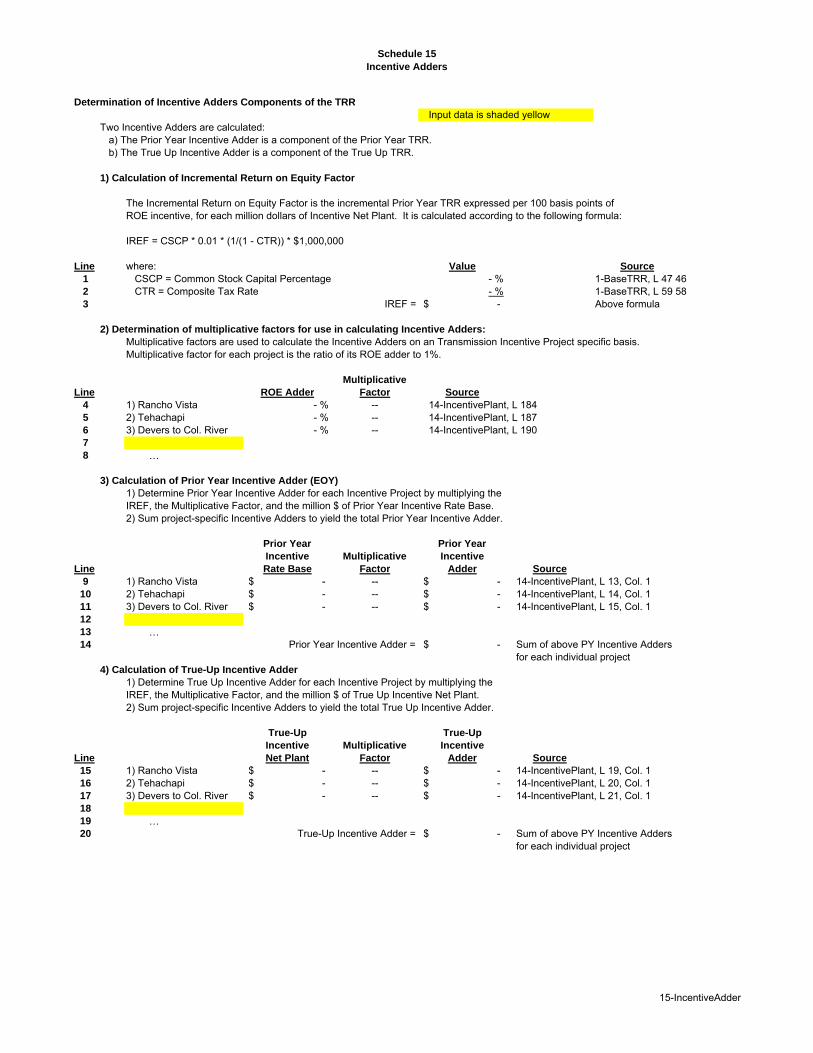
Schedule 15
Incentive Adders
Determination of Incentive Adders Components of the TRR
Input data is shaded yellowTwo Incentive Adders are calculated:
a) The Prior Year Incentive Adder is a component of the Prior Year TRR.b) The True Up Incentive Adder is a component of the True Up TRR.
1) Calculation of Incremental Return on Equity Factor
The Incremental Return on Equity Factor is the incremental Prior Year TRR expressed per 100 basis points ofROE incentive, for each million dollars of Incentive Net Plant. It is calculated according to the following formula:
IREF = CSCP * 0.01 * (1/(1 - CTR)) * $1,000,000
Line where: Value Source
1 CSCP = Common Stock Capital Percentage - % 1-BaseTRR, L 47 462 CTR = Composite Tax Rate - % 1-BaseTRR, L 59 583 IREF = -$ Above formula
2) Determination of multiplicative factors for use in calculating Incentive Adders:
Multiplicative factors are used to calculate the Incentive Adders on an Transmission Incentive Project specific basis. Multiplicative factor for each project is the ratio of its ROE adder to 1%.
Multiplicative
Line ROE Adder Factor Source
4 1) Rancho Vista - % -- 14-IncentivePlant, L 1845 2) Tehachapi - % -- 14-IncentivePlant, L 1876 3) Devers to Col. River - % -- 14-IncentivePlant, L 1907
8 …
3) Calculation of Prior Year Incentive Adder (EOY)
1) Determine Prior Year Incentive Adder for each Incentive Project by multiplying the IREF, the Multiplicative Factor, and the million $ of Prior Year Incentive Rate Base.2) Sum project-specific Incentive Adders to yield the total Prior Year Incentive Adder.
Prior Year Prior Year
Incentive Multiplicative Incentive
Line Rate Base Factor Adder Source
9 1) Rancho Vista -$ -- -$ 14-IncentivePlant, L 13, Col. 110 2) Tehachapi -$ -- -$ 14-IncentivePlant, L 14, Col. 111 3) Devers to Col. River -$ -- -$ 14-IncentivePlant, L 15, Col. 112
13 …14 Prior Year Incentive Adder = -$ Sum of above PY Incentive Adders
for each individual project4) Calculation of True-Up Incentive Adder
1) Determine True Up Incentive Adder for each Incentive Project by multiplying the IREF, the Multiplicative Factor, and the million $ of True Up Incentive Net Plant.2) Sum project-specific Incentive Adders to yield the total True Up Incentive Adder.
True-Up True-Up
Incentive Multiplicative Incentive
Line Net Plant Factor Adder Source
15 1) Rancho Vista -$ -- -$ 14-IncentivePlant, L 19, Col. 116 2) Tehachapi -$ -- -$ 14-IncentivePlant, L 20, Col. 117 3) Devers to Col. River -$ -- -$ 14-IncentivePlant, L 21, Col. 118
19 …20 True-Up Incentive Adder = -$ Sum of above PY Incentive Adders
for each individual project
15-IncentiveAdder

Schedule 15
Incentive Adders
5) Calculation of Total ROE for Plant-In Service in the True Up TRR
a) Transmission Incentive Plant Net Plant In Service
13-Month Avg.
Incentive TIP Net Plant
Line Project In Service Source
21 1) Rancho Vista -$ 14-IncentivePlant, L 19, Col. 322 2) Tehachapi -$ 14-IncentivePlant, L 20, Col. 323 3) Devers to Col. River -$ 14-IncentivePlant, L 21, Col. 324
…
b) Calculation of ROE Adders on TIP Net Plant In Service
Col 1 Col 2
After-Tax
True Up True Up
Incentive Incentive Incentive
Line Project Adder Adder Source
25 1) Rancho Vista -$ -$ See Note 126 2) Tehachapi -$ -$ See Note 127 3) Devers to Col. River -$ -$ See Note 128 See Note 129 …30 Total: -$
c) Equity Portion of Plant In Service Rate Base
Line Amount Source
31 Total Rate Base: -$ 4-TUTRR, Line 18 1732 CWIP Portion of Rate Base: -$ 4-TUTRR, Line 14
33 Plant In Service Rate Base: -$ Line 31 - Line 3234 Equity percentage: - % 1-BaseTRR, Line 47 4635 Equity Portion of Plant In Service Rate Base: -$ Line 33 * Line 34
d) Total ROE for Plant In Service in the True Up TRR
Line
36 Plant In Service ROE Adder Percentage: - % Line 30 / Line 3537 Base ROE (Including 50 basis point38 CAISO Participation Adder): - % 1-BaseTRR, Line 50 4939 Total ROE for Plant In Service in True Up TRR: - % Line 36 + Line 38
Instructions:
1) If additional projects receive ROE adders, add to end of lists, and include in calculationof each Incentive Adder.
Notes:
1) Column 1: The True Up Incentive Adder for each Incentive Project equals the IREF on Line 3,times the applicable Multiplicative Factor on Lines 15 to 18, times the million $ ofTIP Net Plant In Service on Lines 21 to 24.Column 2: The After Tax True Up Incentive Adder is derived by multiplying the amounts inColumn 1 by (1 - CTR) (Where the CTR is on Line 2).
15-IncentiveAdder
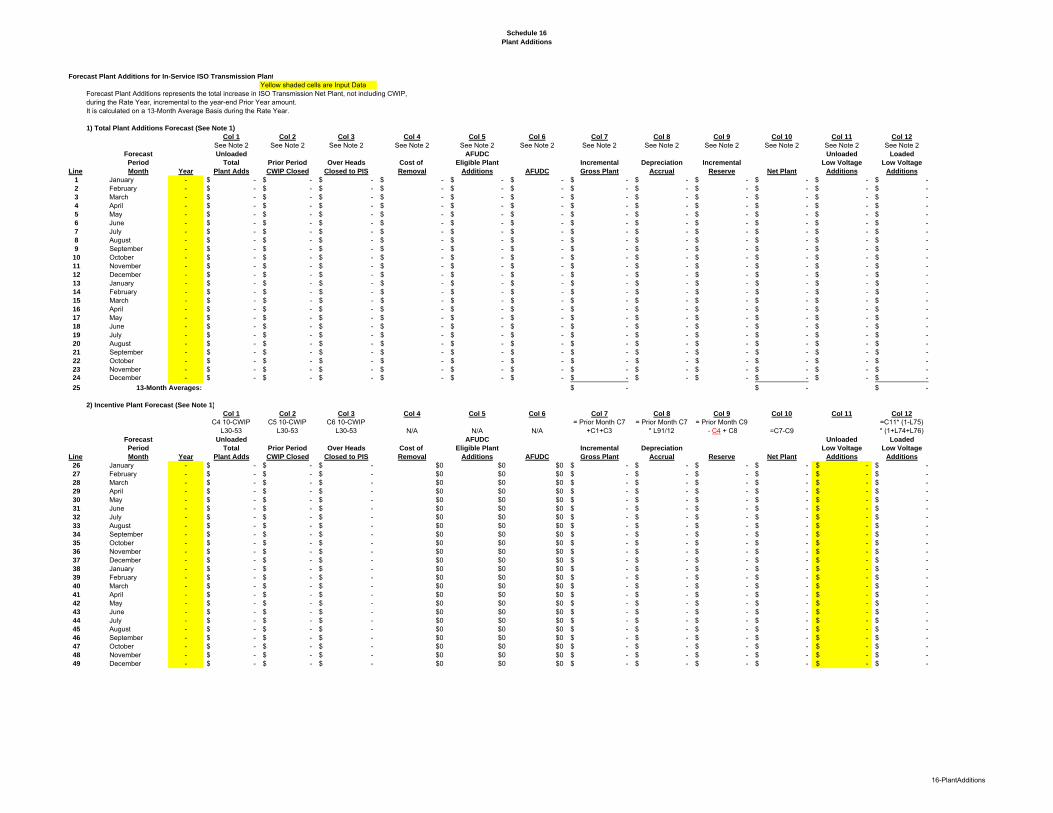
Schedule 16
Plant Additions
Forecast Plant Additions for In-Service ISO Transmission Plant
Yellow shaded cells are Input DataForecast Plant Additions represents the total increase in ISO Transmission Net Plant, not including CWIP, during the Rate Year, incremental to the year-end Prior Year amount.It is calculated on a 13-Month Average Basis during the Rate Year.
1) Total Plant Additions Forecast (See Note 1)
Col 1 Col 2 Col 3 Col 4 Col 5 Col 6 Col 7 Col 8 Col 9 Col 10 Col 11 Col 12
See Note 2 See Note 2 See Note 2 See Note 2 See Note 2 See Note 2 See Note 2 See Note 2 See Note 2 See Note 2 See Note 2 See Note 2Forecast Unloaded AFUDC Unloaded Loaded
Period Total Prior Period Over Heads Cost of Eligible Plant Incremental Depreciation Incremental Low Voltage Low Voltage
Line Month Year Plant Adds CWIP Closed Closed to PIS Removal Additions AFUDC Gross Plant Accrual Reserve Net Plant Additions Additions
1 January - -$ -$ -$ -$ -$ -$ -$ -$ -$ -$ -$ -$ 2 February - -$ -$ -$ -$ -$ -$ -$ -$ -$ -$ -$ -$ 3 March - -$ -$ -$ -$ -$ -$ -$ -$ -$ -$ -$ -$ 4 April - -$ -$ -$ -$ -$ -$ -$ -$ -$ -$ -$ -$ 5 May - -$ -$ -$ -$ -$ -$ -$ -$ -$ -$ -$ -$ 6 June - -$ -$ -$ -$ -$ -$ -$ -$ -$ -$ -$ -$ 7 July - -$ -$ -$ -$ -$ -$ -$ -$ -$ -$ -$ -$ 8 August - -$ -$ -$ -$ -$ -$ -$ -$ -$ -$ -$ -$ 9 September - -$ -$ -$ -$ -$ -$ -$ -$ -$ -$ -$ -$ 10 October - -$ -$ -$ -$ -$ -$ -$ -$ -$ -$ -$ -$ 11 November - -$ -$ -$ -$ -$ -$ -$ -$ -$ -$ -$ -$ 12 December - -$ -$ -$ -$ -$ -$ -$ -$ -$ -$ -$ -$ 13 January - -$ -$ -$ -$ -$ -$ -$ -$ -$ -$ -$ -$ 14 February - -$ -$ -$ -$ -$ -$ -$ -$ -$ -$ -$ -$ 15 March - -$ -$ -$ -$ -$ -$ -$ -$ -$ -$ -$ -$ 16 April - -$ -$ -$ -$ -$ -$ -$ -$ -$ -$ -$ -$ 17 May - -$ -$ -$ -$ -$ -$ -$ -$ -$ -$ -$ -$ 18 June - -$ -$ -$ -$ -$ -$ -$ -$ -$ -$ -$ -$ 19 July - -$ -$ -$ -$ -$ -$ -$ -$ -$ -$ -$ -$ 20 August - -$ -$ -$ -$ -$ -$ -$ -$ -$ -$ -$ -$ 21 September - -$ -$ -$ -$ -$ -$ -$ -$ -$ -$ -$ -$ 22 October - -$ -$ -$ -$ -$ -$ -$ -$ -$ -$ -$ -$ 23 November - -$ -$ -$ -$ -$ -$ -$ -$ -$ -$ -$ -$ 24 December - -$ -$ -$ -$ -$ -$ -$ -$ -$ -$ -$ -$
25 13-Month Averages: -$ -$ -$
2) Incentive Plant Forecast (See Note 1)
Col 1 Col 2 Col 3 Col 4 Col 5 Col 6 Col 7 Col 8 Col 9 Col 10 Col 11 Col 12
C4 10-CWIPL30-53
C5 10-CWIPL30-53
C6 10-CWIPL30-53 N/A N/A N/A
= Prior Month C7+C1+C3
= Prior Month C7 * L91/12
= Prior Month C9 - C4 + C8 =C7-C9
=C11* (1-L75)* (1+L74+L76)
Forecast Unloaded AFUDC Unloaded Loaded
Period Total Prior Period Over Heads Cost of Eligible Plant Incremental Depreciation Low Voltage Low Voltage
Line Month Year Plant Adds CWIP Closed Closed to PIS Removal Additions AFUDC Gross Plant Accrual Reserve Net Plant Additions Additions
26 January - -$ -$ -$ $0 $0 $0 -$ -$ -$ -$ -$ -$ 27 February - -$ -$ -$ $0 $0 $0 -$ -$ -$ -$ -$ -$ 28 March - -$ -$ -$ $0 $0 $0 -$ -$ -$ -$ -$ -$ 29 April - -$ -$ -$ $0 $0 $0 -$ -$ -$ -$ -$ -$ 30 May - -$ -$ -$ $0 $0 $0 -$ -$ -$ -$ -$ -$ 31 June - -$ -$ -$ $0 $0 $0 -$ -$ -$ -$ -$ -$ 32 July - -$ -$ -$ $0 $0 $0 -$ -$ -$ -$ -$ -$ 33 August - -$ -$ -$ $0 $0 $0 -$ -$ -$ -$ -$ -$ 34 September - -$ -$ -$ $0 $0 $0 -$ -$ -$ -$ -$ -$ 35 October - -$ -$ -$ $0 $0 $0 -$ -$ -$ -$ -$ -$ 36 November - -$ -$ -$ $0 $0 $0 -$ -$ -$ -$ -$ -$ 37 December - -$ -$ -$ $0 $0 $0 -$ -$ -$ -$ -$ -$ 38 January - -$ -$ -$ $0 $0 $0 -$ -$ -$ -$ -$ -$ 39 February - -$ -$ -$ $0 $0 $0 -$ -$ -$ -$ -$ -$ 40 March - -$ -$ -$ $0 $0 $0 -$ -$ -$ -$ -$ -$ 41 April - -$ -$ -$ $0 $0 $0 -$ -$ -$ -$ -$ -$ 42 May - -$ -$ -$ $0 $0 $0 -$ -$ -$ -$ -$ -$ 43 June - -$ -$ -$ $0 $0 $0 -$ -$ -$ -$ -$ -$ 44 July - -$ -$ -$ $0 $0 $0 -$ -$ -$ -$ -$ -$ 45 August - -$ -$ -$ $0 $0 $0 -$ -$ -$ -$ -$ -$ 46 September - -$ -$ -$ $0 $0 $0 -$ -$ -$ -$ -$ -$ 47 October - -$ -$ -$ $0 $0 $0 -$ -$ -$ -$ -$ -$ 48 November - -$ -$ -$ $0 $0 $0 -$ -$ -$ -$ -$ -$ 49 December - -$ -$ -$ $0 $0 $0 -$ -$ -$ -$ -$ -$
16-PlantAdditions

Schedule 16
Plant Additions
3) Non-Incentive Plant Forecast (See Note 1)
Col 1 Col 2 Col 3 Col 4 Col 5 Col 6 Col 7 Col 8 Col 9 Col 10 Col 11 Col 12
=(C1-C2)*L74 =(C1-C2+C3)*L75 =C1-C2+C3-C4 =C5*L76= Prior Month C2
+C2+C5+C6= Prior Month C7
* L91/12= Prior Month C9
- C4 + C8 =C7-C9=C11* (1-L75)* (1+L74+L76)
Forecast Unloaded AFUDC Unloaded Loaded
Period Total Prior Period Over Heads Cost of Eligible Plant Incremental Depreciation Incremental Low Voltage Low Voltage
Line Month Year Plant Adds CWIP Closed Closed to PIS Removal Additions AFUDC Gross Plant Accrual Reserve Net Plant Additions Additions
50 January - -$ -$ -$ -$ -$ -$ -$ -$ -$ -$ -$ -$ 51 February - -$ -$ -$ -$ -$ -$ -$ -$ -$ -$ -$ -$ 52 March - -$ -$ -$ -$ -$ -$ -$ -$ -$ -$ -$ -$ 53 April - -$ -$ -$ -$ -$ -$ -$ -$ -$ -$ -$ -$ 54 May - -$ -$ -$ -$ -$ -$ -$ -$ -$ -$ -$ -$ 55 June - -$ -$ -$ -$ -$ -$ -$ -$ -$ -$ -$ -$ 56 July - -$ -$ -$ -$ -$ -$ -$ -$ -$ -$ -$ -$ 57 August - -$ -$ -$ -$ -$ -$ -$ -$ -$ -$ -$ -$ 58 September - -$ -$ -$ -$ -$ -$ -$ -$ -$ -$ -$ -$ 59 October - -$ -$ -$ -$ -$ -$ -$ -$ -$ -$ -$ -$ 60 November - -$ -$ -$ -$ -$ -$ -$ -$ -$ -$ -$ -$ 61 December - -$ -$ -$ -$ -$ -$ -$ -$ -$ -$ -$ -$ 62 January - -$ -$ -$ -$ -$ -$ -$ -$ -$ -$ -$ -$ 63 February - -$ -$ -$ -$ -$ -$ -$ -$ -$ -$ -$ -$ 64 March - -$ -$ -$ -$ -$ -$ -$ -$ -$ -$ -$ -$ 65 April - -$ -$ -$ -$ -$ -$ -$ -$ -$ -$ -$ -$ 66 May - -$ -$ -$ -$ -$ -$ -$ -$ -$ -$ -$ -$ 67 June - -$ -$ -$ -$ -$ -$ -$ -$ -$ -$ -$ -$ 68 July - -$ -$ -$ -$ -$ -$ -$ -$ -$ -$ -$ -$ 69 August - -$ -$ -$ -$ -$ -$ -$ -$ -$ -$ -$ -$ 70 September - -$ -$ -$ -$ -$ -$ -$ -$ -$ -$ -$ -$ 71 October - -$ -$ -$ -$ -$ -$ -$ -$ -$ -$ -$ -$ 72 November - -$ -$ -$ -$ -$ -$ -$ -$ -$ -$ -$ -$ 73 December - -$ -$ -$ -$ -$ -$ -$ -$ -$ -$ -$ -$
4) ISO Corporate Overhead Loader
Line
74 ISO Corp OH Rate 7.50%
5) ISO Cost of Removal Percent
Line
75 Cost of Removal Rate 8.00%
6) AFUDC Loader Rate
Line
76 ISO AFUDC Rate 3.00%
7) Calculation of ISO Depreciation Rate
December Prior Year plant balances and accrual rates are as shown on Schedule 17 DepreciationCol 1 Col 2 Col 3 Col 4
December C2*C3Prior Year Accrual Annual Accrual Rate
Line Acct Plant Balance Rate Accrual Reference
77 350.1 -$ - % -$ 18 Dep Rates L178 350.2 -$ - % -$ 18 Dep Rates L279 352 -$ - % -$ 18 Dep Rates L380 353 -$ - % -$ 18 Dep Rates L481 354 -$ - % -$ 18 Dep Rates L582 355 -$ - % -$ 18 Dep Rates L683 356 -$ - % -$ 18 Dep Rates L784 357 -$ - % -$ 18 Dep Rates L885 358 -$ - % -$ 18 Dep Rates L986 359 -$ - % -$ 18 Dep Rates L1087
88 Sum of Depreciation Expense -$ Sum of C4 Lines 77 to 8689 Sum of Dec Prior Year Plant -$ Sum of C2 Lines 77 to 8690
91 Composite Depreciation Rate - % Line 88 / Line 89
Notes:
1) Forecast Period is the calendar year two years after the Prior Year (i.e., PY+2). 2) Sum of Incentive Plant Calculations and Non-Incentive Calculations, lines 26-49 and lines 50-73
16-PlantAdditions

Schedule 17
Depreciation Expense
Depreciation Expense Input cells are shaded yellow
1) Calculation of Depreciation Expense for Transmission Plant - ISO Prior Year: -
Balances for Transmission Plant - ISO during the Prior Year, including December of previous year: Source: 6-PlantInService, Lines 1-13.
Col 1 Col 2 Col 3 Col 4 Col 5 Col 6 Col 7 Col 8 Col 9 Col 10 Col 11 Col 12
FERCAccount:
Line Mo/YR 350.1 350.2 352 353 354 355 356 357 358 359 Total
1 - -$ -$ -$ -$ -$ -$ -$ -$ -$ -$ -$ 2 - -$ -$ -$ -$ -$ -$ -$ -$ -$ -$ -$ 3 - -$ -$ -$ -$ -$ -$ -$ -$ -$ -$ -$ 4 - -$ -$ -$ -$ -$ -$ -$ -$ -$ -$ -$ 5 - -$ -$ -$ -$ -$ -$ -$ -$ -$ -$ -$ 6 - -$ -$ -$ -$ -$ -$ -$ -$ -$ -$ -$ 7 - -$ -$ -$ -$ -$ -$ -$ -$ -$ -$ -$ 8 - -$ -$ -$ -$ -$ -$ -$ -$ -$ -$ -$ 9 - -$ -$ -$ -$ -$ -$ -$ -$ -$ -$ -$
10 - -$ -$ -$ -$ -$ -$ -$ -$ -$ -$ -$ 11 - -$ -$ -$ -$ -$ -$ -$ -$ -$ -$ -$ 12 - -$ -$ -$ -$ -$ -$ -$ -$ -$ -$ -$ 13 - -$ -$ -$ -$ -$ -$ -$ -$ -$ -$ -$ 14
15 Depreciation Rates (Percent per year) See "18-DepRates" and Instruction 1.
16 Mo/YR 350.1 350.2 352 353 354 355 356 357 358 359
17a - - % - % - % - % - % - % - % - % - % - %17b - - % - % - % - % - % - % - % - % - % - %17c - - % - % - % - % - % - % - % - % - % - %17d - - % - % - % - % - % - % - % - % - % - %17e - - % - % - % - % - % - % - % - % - % - %17f - - % - % - % - % - % - % - % - % - % - %17g - - % - % - % - % - % - % - % - % - % - %17h - - % - % - % - % - % - % - % - % - % - %17i - - % - % - % - % - % - % - % - % - % - %17j - - % - % - % - % - % - % - % - % - % - %17k - - % - % - % - % - % - % - % - % - % - %17l - - % - % - % - % - % - % - % - % - % - %
17m - - % - % - % - % - % - % - % - % - % - %18
19 Monthly Depreciation Expense for Transmission Plant - ISO by FERC Account: See Note 1 and Instruction 120
21 FERC22 Account: Month
23 Mo/YR 350.1 350.2 352 353 354 355 356 357 358 359 Total
24 - -$ -$ -$ -$ -$ -$ -$ -$ -$ -$ -$ 25 - -$ -$ -$ -$ -$ -$ -$ -$ -$ -$ -$ 26 - -$ -$ -$ -$ -$ -$ -$ -$ -$ -$ -$ 27 - -$ -$ -$ -$ -$ -$ -$ -$ -$ -$ -$ 28 - -$ -$ -$ -$ -$ -$ -$ -$ -$ -$ -$ 29 - -$ -$ -$ -$ -$ -$ -$ -$ -$ -$ -$ 30 - -$ -$ -$ -$ -$ -$ -$ -$ -$ -$ -$ 31 - -$ -$ -$ -$ -$ -$ -$ -$ -$ -$ -$ 32 - -$ -$ -$ -$ -$ -$ -$ -$ -$ -$ -$ 33 - -$ -$ -$ -$ -$ -$ -$ -$ -$ -$ -$ 34 - -$ -$ -$ -$ -$ -$ -$ -$ -$ -$ -$ 35 - -$ -$ -$ -$ -$ -$ -$ -$ -$ -$ -$
36 Totals: -$ -$ -$ -$ -$ -$ -$ -$ -$ -$ 37 Total Annual Depreciation Expense for Transmission Plant - ISO: -$ 38 (equals sum of monthly amounts)
17-Depreciation
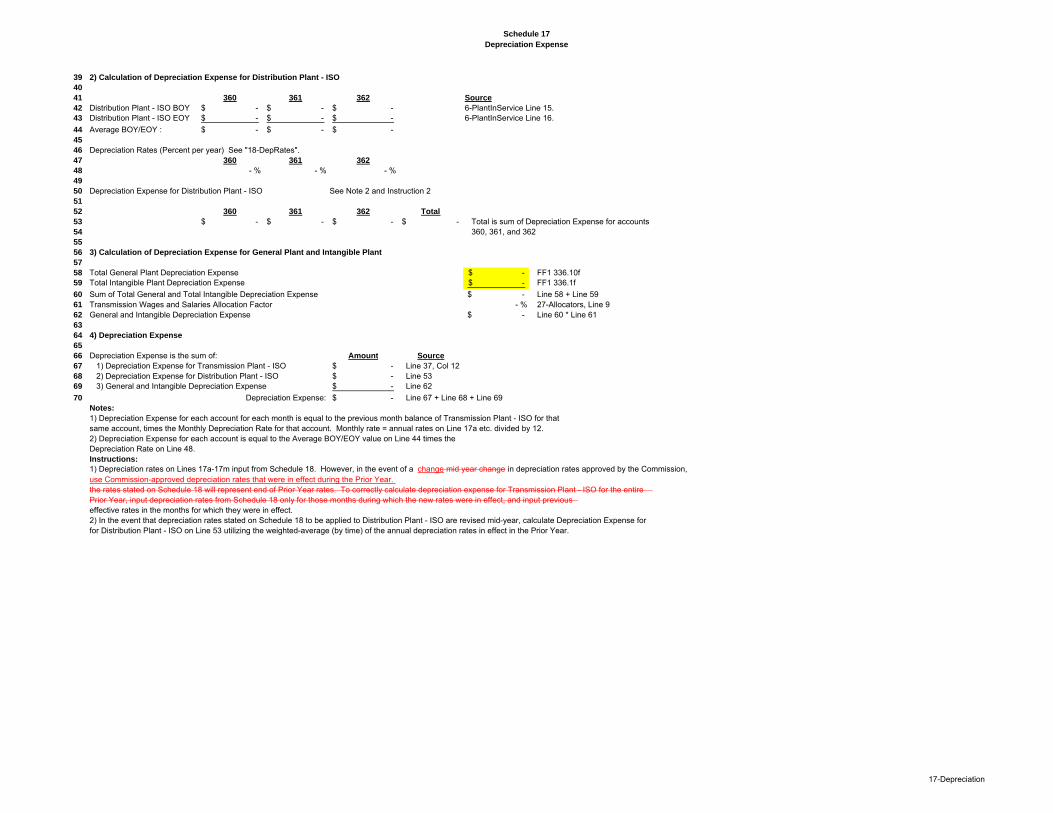
Schedule 17
Depreciation Expense
39 2) Calculation of Depreciation Expense for Distribution Plant - ISO
40
41 360 361 362 Source
42 Distribution Plant - ISO BOY -$ -$ -$ 6-PlantInService Line 15.43 Distribution Plant - ISO EOY -$ -$ -$ 6-PlantInService Line 16.
44 Average BOY/EOY : -$ -$ -$ 45
46 Depreciation Rates (Percent per year) See "18-DepRates".47 360 361 362
48 - % - % - %49
50 Depreciation Expense for Distribution Plant - ISO See Note 2 and Instruction 251
52 360 361 362 Total
53 -$ -$ -$ -$ Total is sum of Depreciation Expense for accounts 54 360, 361, and 36255
56 3) Calculation of Depreciation Expense for General Plant and Intangible Plant
57
58 Total General Plant Depreciation Expense -$ FF1 336.10f59 Total Intangible Plant Depreciation Expense -$ FF1 336.1f
60 Sum of Total General and Total Intangible Depreciation Expense -$ Line 58 + Line 5961 Transmission Wages and Salaries Allocation Factor - % 27-Allocators, Line 962 General and Intangible Depreciation Expense -$ Line 60 * Line 6163
64 4) Depreciation Expense
65
66 Depreciation Expense is the sum of: Amount Source
67 1) Depreciation Expense for Transmission Plant - ISO -$ Line 37, Col 1268 2) Depreciation Expense for Distribution Plant - ISO -$ Line 5369 3) General and Intangible Depreciation Expense -$ Line 62
70 Depreciation Expense: -$ Line 67 + Line 68 + Line 69Notes:
1) Depreciation Expense for each account for each month is equal to the previous month balance of Transmission Plant - ISO for that same account, times the Monthly Depreciation Rate for that account. Monthly rate = annual rates on Line 17a etc. divided by 12.2) Depreciation Expense for each account is equal to the Average BOY/EOY value on Line 44 times theDepreciation Rate on Line 48.Instructions:
1) Depreciation rates on Lines 17a-17m input from Schedule 18. However, in the event of a change mid year change in depreciation rates approved by the Commission,use Commission-approved depreciation rates that were in effect during the Prior Year.the rates stated on Schedule 18 will represent end of Prior Year rates. To correctly calculate depreciation expense for Transmission Plant - ISO for the entire Prior Year, input depreciation rates from Schedule 18 only for those months during which the new rates were in effect, and input previous effective rates in the months for which they were in effect.2) In the event that depreciation rates stated on Schedule 18 to be applied to Distribution Plant - ISO are revised mid-year, calculate Depreciation Expense for for Distribution Plant - ISO on Line 53 utilizing the weighted-average (by time) of the annual depreciation rates in effect in the Prior Year.
17-Depreciation
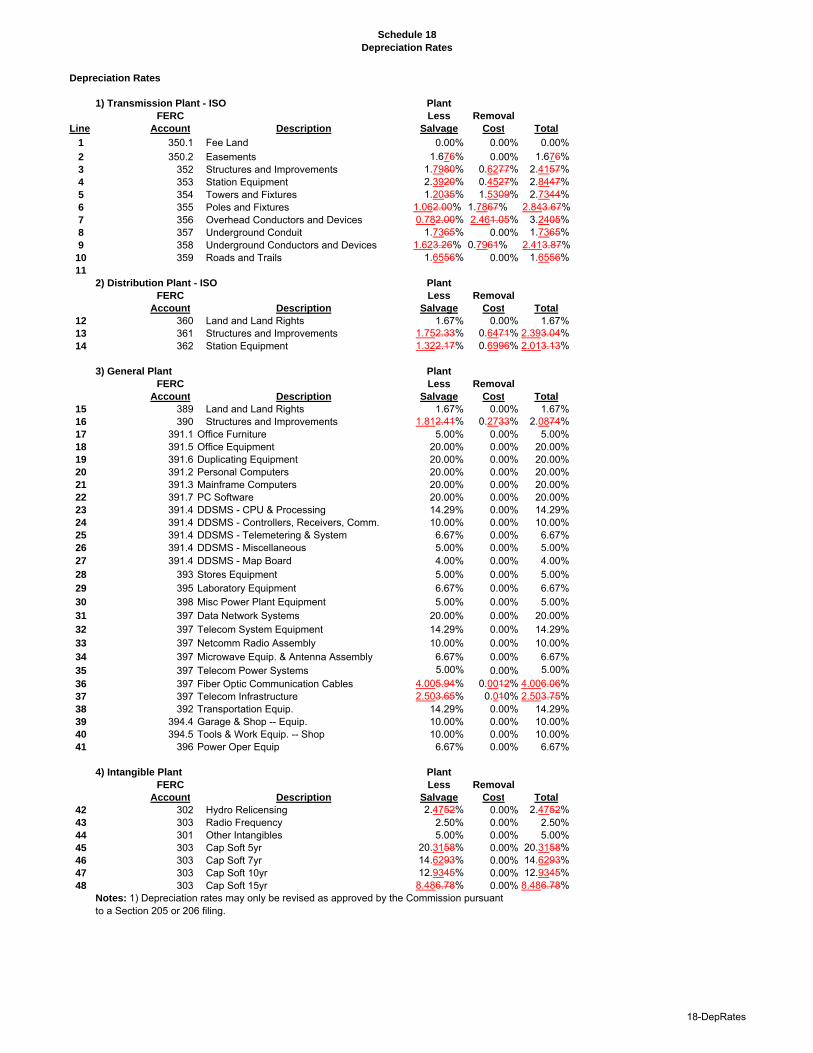
Schedule 18
Depreciation Rates
Depreciation Rates
1) Transmission Plant - ISO Plant
FERC Less Removal
Line Account Description Salvage Cost Total
1 350.1 Fee Land 0.00% 0.00% 0.00%
2 350.2 Easements 1.676% 0.00% 1.676%3 352 Structures and Improvements 1.7980% 0.6277% 2.4157%4 353 Station Equipment 2.3920% 0.4527% 2.8447%5 354 Towers and Fixtures 1.2035% 1.5309% 2.7344%6 355 Poles and Fixtures 1.062.00% 1.7867% 2.843.67%7 356 Overhead Conductors and Devices 0.782.00% 2.461.05% 3.2405%8 357 Underground Conduit 1.7365% 0.00% 1.7365%9 358 Underground Conductors and Devices 1.623.26% 0.7961% 2.413.87%
10 359 Roads and Trails 1.6556% 0.00% 1.6556%11
2) Distribution Plant - ISO Plant
FERC Less Removal
Account Description Salvage Cost Total
12 360 Land and Land Rights 1.67% 0.00% 1.67%13 361 Structures and Improvements 1.752.33% 0.6471% 2.393.04%14 362 Station Equipment 1.322.17% 0.6996% 2.013.13%
3) General Plant Plant
FERC Less Removal
Account Description Salvage Cost Total
15 389 Land and Land Rights 1.67% 0.00% 1.67%16 390 Structures and Improvements 1.812.41% 0.2733% 2.0874%17 391.1 Office Furniture 5.00% 0.00% 5.00%18 391.5 Office Equipment 20.00% 0.00% 20.00%19 391.6 Duplicating Equipment 20.00% 0.00% 20.00%20 391.2 Personal Computers 20.00% 0.00% 20.00%21 391.3 Mainframe Computers 20.00% 0.00% 20.00%22 391.7 PC Software 20.00% 0.00% 20.00%23 391.4 DDSMS - CPU & Processing 14.29% 0.00% 14.29%24 391.4 DDSMS - Controllers, Receivers, Comm. 10.00% 0.00% 10.00%25 391.4 DDSMS - Telemetering & System 6.67% 0.00% 6.67%26 391.4 DDSMS - Miscellaneous 5.00% 0.00% 5.00%27 391.4 DDSMS - Map Board 4.00% 0.00% 4.00%28 393 Stores Equipment 5.00% 0.00% 5.00%29 395 Laboratory Equipment 6.67% 0.00% 6.67%30 398 Misc Power Plant Equipment 5.00% 0.00% 5.00%31 397 Data Network Systems 20.00% 0.00% 20.00%32 397 Telecom System Equipment 14.29% 0.00% 14.29%33 397 Netcomm Radio Assembly 10.00% 0.00% 10.00%34 397 Microwave Equip. & Antenna Assembly 6.67% 0.00% 6.67%35 397 Telecom Power Systems 5.00% 0.00% 5.00%
36 397 Fiber Optic Communication Cables 4.005.94% 0.0012% 4.006.06%37 397 Telecom Infrastructure 2.503.65% 0.010% 2.503.75%38 392 Transportation Equip. 14.29% 0.00% 14.29%39 394.4 Garage & Shop -- Equip. 10.00% 0.00% 10.00%40 394.5 Tools & Work Equip. -- Shop 10.00% 0.00% 10.00%41 396 Power Oper Equip 6.67% 0.00% 6.67%
4) Intangible Plant Plant
FERC Less Removal
Account Description Salvage Cost Total
42 302 Hydro Relicensing 2.4752% 0.00% 2.4752%43 303 Radio Frequency 2.50% 0.00% 2.50%44 301 Other Intangibles 5.00% 0.00% 5.00%45 303 Cap Soft 5yr 20.3158% 0.00% 20.3158%46 303 Cap Soft 7yr 14.6293% 0.00% 14.6293%47 303 Cap Soft 10yr 12.9345% 0.00% 12.9345%48 303 Cap Soft 15yr 8.486.78% 0.00% 8.486.78%
Notes: 1) Depreciation rates may only be revised as approved by the Commission pursuantto a Section 205 or 206 filing.
18-DepRates
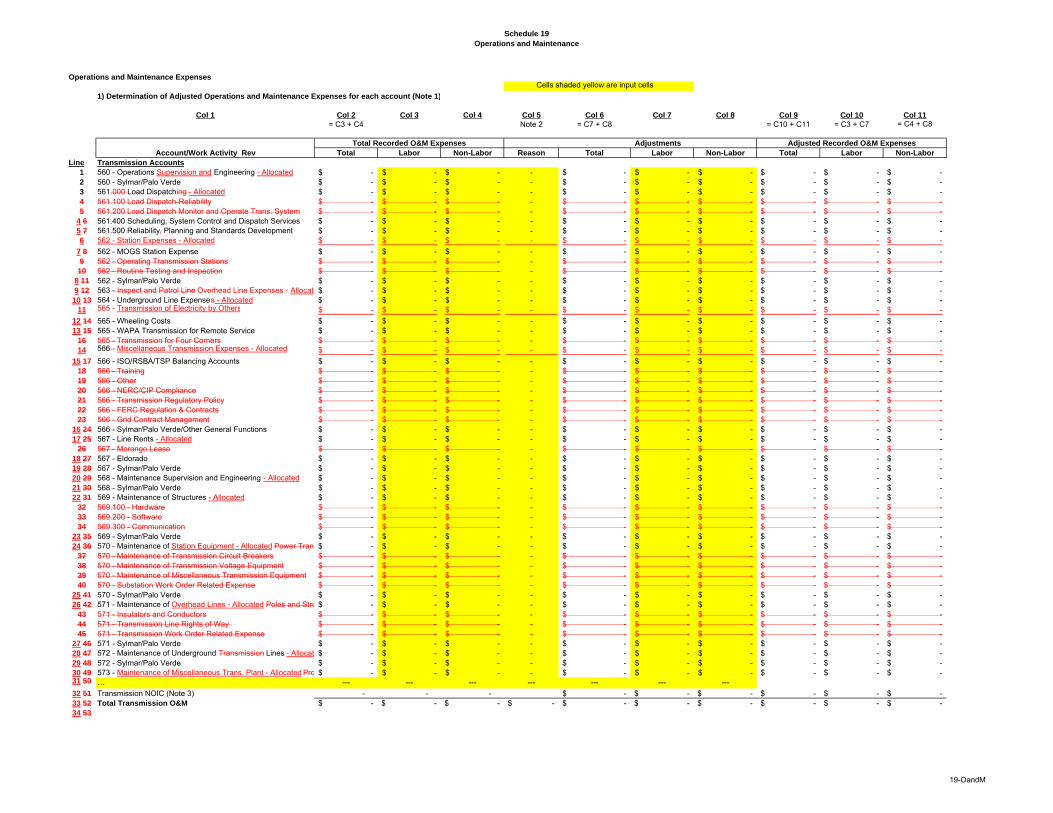
Schedule 19
Operations and Maintenance
Operations and Maintenance ExpensesCells shaded yellow are input cells
1) Determination of Adjusted Operations and Maintenance Expenses for each account (Note 1)
Col 1 Col 2 Col 3 Col 4 Col 5 Col 6 Col 7 Col 8 Col 9 Col 10 Col 11
= C3 + C4 Note 2 = C7 + C8 = C10 + C11 = C3 + C7 = C4 + C8
Total Labor Non-Labor Reason Total Labor Non-Labor Total Labor Non-Labor
Line Transmission Accounts
1 560 - Operations Supervision and Engineering - Allocated -$ -$ -$ - -$ -$ -$ -$ -$ -$ 2 560 - Sylmar/Palo Verde -$ -$ -$ - -$ -$ -$ -$ -$ -$ 3 561.000 Load Dispatching - Allocated -$ -$ -$ - -$ -$ -$ -$ -$ -$ 4 561.100 Load Dispatch-Reliability -$ -$ -$ - -$ -$ -$ -$ -$ -$ 5 561.200 Load Dispatch Monitor and Operate Trans. System -$ -$ -$ - -$ -$ -$ -$ -$ -$
4 6 561.400 Scheduling, System Control and Dispatch Services -$ -$ -$ - -$ -$ -$ -$ -$ -$ 5 7 561.500 Reliability, Planning and Standards Development -$ -$ -$ - -$ -$ -$ -$ -$ -$ 6 562 - Station Expenses - Allocated -$ -$ -$ - -$ -$ -$ -$ -$ -$
7 8 562 - MOGS Station Expense -$ -$ -$ - -$ -$ -$ -$ -$ -$ 9 562 - Operating Transmission Stations -$ -$ -$ - -$ -$ -$ -$ -$ -$ 10 562 - Routine Testing and Inspection -$ -$ -$ - -$ -$ -$ -$ -$ -$
8 11 562 - Sylmar/Palo Verde -$ -$ -$ - -$ -$ -$ -$ -$ -$ 9 12 563 - Inspect and Patrol Line Overhead Line Expenses - Allocate -$ -$ -$ - -$ -$ -$ -$ -$ -$
10 13 564 - Underground Line Expenses - Allocated -$ -$ -$ - -$ -$ -$ -$ -$ -$ 11 565 - Transmission of Electricity by Others -$ -$ -$ - -$ -$ -$ -$ -$ -$
12 14 565 - Wheeling Costs -$ -$ -$ - -$ -$ -$ -$ -$ -$ 13 15 565 - WAPA Transmission for Remote Service -$ -$ -$ - -$ -$ -$ -$ -$ -$
16 565 - Transmission for Four Corners -$ -$ -$ - -$ -$ -$ -$ -$ -$ 14 566 - Miscellaneous Transmission Expenses - Allocated -$ -$ -$ - -$ -$ -$ -$ -$ -$
15 17 566 - ISO/RSBA/TSP Balancing Accounts -$ -$ -$ - -$ -$ -$ -$ -$ -$ 18 566 - Training -$ -$ -$ - -$ -$ -$ -$ -$ -$ 19 566 - Other -$ -$ -$ - -$ -$ -$ -$ -$ -$ 20 566 - NERC/CIP Compliance -$ -$ -$ - -$ -$ -$ -$ -$ -$ 21 566 - Transmission Regulatory Policy -$ -$ -$ - -$ -$ -$ -$ -$ -$ 22 566 - FERC Regulation & Contracts -$ -$ -$ - -$ -$ -$ -$ -$ -$ 23 566 - Grid Contract Management -$ -$ -$ - -$ -$ -$ -$ -$ -$
16 24 566 - Sylmar/Palo Verde/Other General Functions -$ -$ -$ - -$ -$ -$ -$ -$ -$ 17 25 567 - Line Rents - Allocated -$ -$ -$ - -$ -$ -$ -$ -$ -$
26 567 - Morongo Lease -$ -$ -$ - -$ -$ -$ -$ -$ -$ 18 27 567 - Eldorado -$ -$ -$ - -$ -$ -$ -$ -$ -$ 19 28 567 - Sylmar/Palo Verde -$ -$ -$ - -$ -$ -$ -$ -$ -$ 20 29 568 - Maintenance Supervision and Engineering - Allocated -$ -$ -$ - -$ -$ -$ -$ -$ -$ 21 30 568 - Sylmar/Palo Verde -$ -$ -$ - -$ -$ -$ -$ -$ -$ 22 31 569 - Maintenance of Structures - Allocated -$ -$ -$ - -$ -$ -$ -$ -$ -$
32 569.100 - Hardware -$ -$ -$ - -$ -$ -$ -$ -$ -$ 33 569.200 - Software -$ -$ -$ - -$ -$ -$ -$ -$ -$ 34 569.300 - Communication -$ -$ -$ - -$ -$ -$ -$ -$ -$
23 35 569 - Sylmar/Palo Verde -$ -$ -$ - -$ -$ -$ -$ -$ -$ 24 36 570 - Maintenance of Station Equipment - Allocated Power Tran -$ -$ -$ - -$ -$ -$ -$ -$ -$
37 570 - Maintenance of Transmission Circuit Breakers -$ -$ -$ - -$ -$ -$ -$ -$ -$ 38 570 - Maintenance of Transmission Voltage Equipment -$ -$ -$ - -$ -$ -$ -$ -$ -$ 39 570 - Maintenance of Miscellaneous Transmission Equipment -$ -$ -$ - -$ -$ -$ -$ -$ -$ 40 570 - Substation Work Order Related Expense -$ -$ -$ - -$ -$ -$ -$ -$ -$
25 41 570 - Sylmar/Palo Verde -$ -$ -$ - -$ -$ -$ -$ -$ -$ 26 42 571 - Maintenance of Overhead Lines - Allocated Poles and Stru -$ -$ -$ - -$ -$ -$ -$ -$ -$
43 571 - Insulators and Conductors -$ -$ -$ - -$ -$ -$ -$ -$ -$ 44 571 - Transmission Line Rights of Way -$ -$ -$ - -$ -$ -$ -$ -$ -$ 45 571 - Transmission Work Order Related Expense -$ -$ -$ - -$ -$ -$ -$ -$ -$
27 46 571 - Sylmar/Palo Verde -$ -$ -$ - -$ -$ -$ -$ -$ -$ 28 47 572 - Maintenance of Underground Transmission Lines - Allocat -$ -$ -$ - -$ -$ -$ -$ -$ -$ 29 48 572 - Sylmar/Palo Verde -$ -$ -$ - -$ -$ -$ -$ -$ -$ 30 49 573 - Maintenance of Miscellaneous Trans. Plant - Allocated Pro -$ -$ -$ - -$ -$ -$ -$ -$ -$ 31 50 … --- --- --- --- --- --- ---
32 51 Transmission NOIC (Note 3) - - - -$ -$ -$ -$ -$ -$ 33 52 Total Transmission O&M -$ -$ -$ -$ -$ -$ -$ -$ -$ -$ 34 53
Account/Work Activity Rev
Total Recorded O&M Expenses Adjustments Adjusted Recorded O&M Expenses
19-OandM
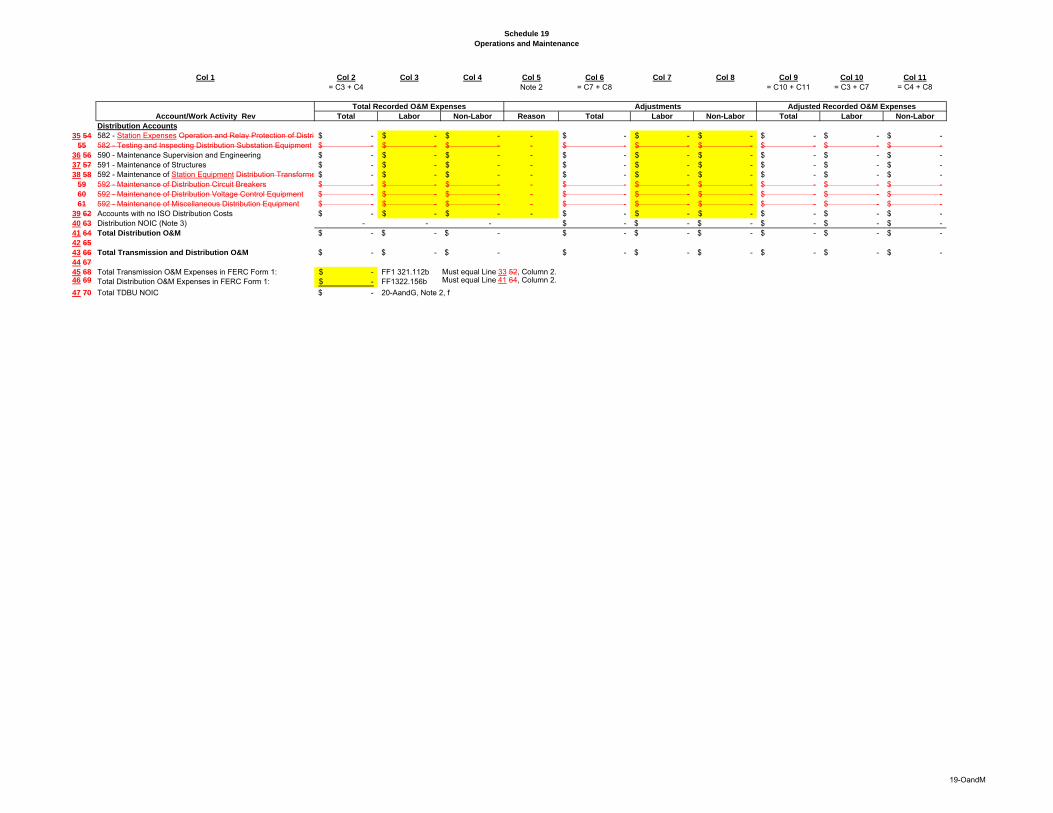
Schedule 19
Operations and Maintenance
Col 1 Col 2 Col 3 Col 4 Col 5 Col 6 Col 7 Col 8 Col 9 Col 10 Col 11
= C3 + C4 Note 2 = C7 + C8 = C10 + C11 = C3 + C7 = C4 + C8
Total Labor Non-Labor Reason Total Labor Non-Labor Total Labor Non-Labor
Distribution Accounts
35 54 582 - Station Expenses Operation and Relay Protection of Distri -$ -$ -$ - -$ -$ -$ -$ -$ -$ 55 582 - Testing and Inspecting Distribution Substation Equipment -$ -$ -$ - -$ -$ -$ -$ -$ -$
36 56 590 - Maintenance Supervision and Engineering -$ -$ -$ - -$ -$ -$ -$ -$ -$ 37 57 591 - Maintenance of Structures -$ -$ -$ - -$ -$ -$ -$ -$ -$ 38 58 592 - Maintenance of Station Equipment Distribution Transforme -$ -$ -$ - -$ -$ -$ -$ -$ -$
59 592 - Maintenance of Distribution Circuit Breakers -$ -$ -$ - -$ -$ -$ -$ -$ -$ 60 592 - Maintenance of Distribution Voltage Control Equipment -$ -$ -$ - -$ -$ -$ -$ -$ -$ 61 592 - Maintenance of Miscellaneous Distribution Equipment -$ -$ -$ - -$ -$ -$ -$ -$ -$
39 62 Accounts with no ISO Distribution Costs -$ -$ -$ - -$ -$ -$ -$ -$ -$ 40 63 Distribution NOIC (Note 3) - - - -$ -$ -$ -$ -$ -$ 41 64 Total Distribution O&M -$ -$ -$ -$ -$ -$ -$ -$ -$ 42 65
43 66 Total Transmission and Distribution O&M -$ -$ -$ -$ -$ -$ -$ -$ -$ 44 67
45 68 Total Transmission O&M Expenses in FERC Form 1: -$ FF1 321.112b Must equal Line 33 52, Column 2.46 69 Total Distribution O&M Expenses in FERC Form 1: -$ FF1322.156b Must equal Line 41 64, Column 2.
47 70 Total TDBU NOIC -$ 20-AandG, Note 2, f
Account/Work Activity Rev
Total Recorded O&M Expenses Adjustments Adjusted Recorded O&M Expenses
19-OandM
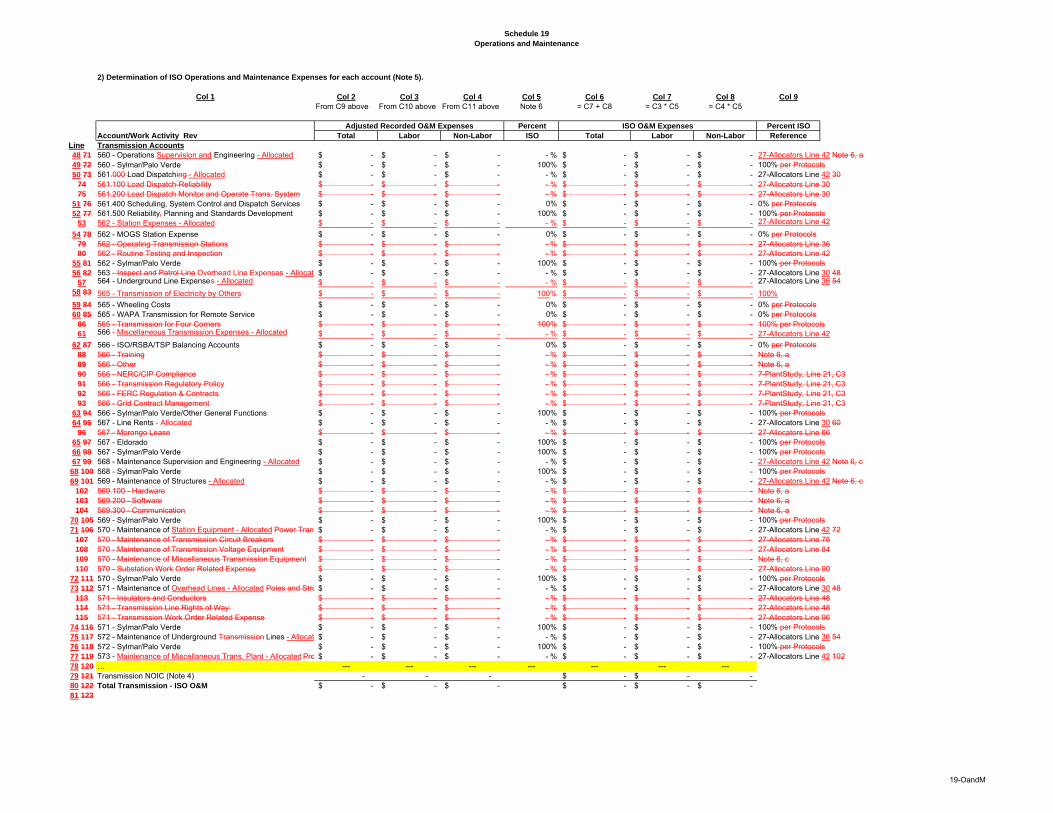
Schedule 19
Operations and Maintenance
2) Determination of ISO Operations and Maintenance Expenses for each account (Note 5).
Col 1 Col 2 Col 3 Col 4 Col 5 Col 6 Col 7 Col 8 Col 9
From C9 above From C10 above From C11 above Note 6 = C7 + C8 = C3 * C5 = C4 * C5
Percent Percent ISO
Total Labor Non-Labor ISO Total Labor Non-Labor Reference
Line Transmission Accounts
48 71 560 - Operations Supervision and Engineering - Allocated -$ -$ -$ - % -$ -$ -$ 27-Allocators Line 42 Note 6, a49 72 560 - Sylmar/Palo Verde -$ -$ -$ 100% -$ -$ -$ 100% per Protocols50 73 561.000 Load Dispatching - Allocated -$ -$ -$ - % -$ -$ -$ 27-Allocators Line 42 30
74 561.100 Load Dispatch-Reliability -$ -$ -$ - % -$ -$ -$ 27-Allocators Line 3075 561.200 Load Dispatch Monitor and Operate Trans. System -$ -$ -$ - % -$ -$ -$ 27-Allocators Line 30
51 76 561.400 Scheduling, System Control and Dispatch Services -$ -$ -$ 0% -$ -$ -$ 0% per Protocols52 77 561.500 Reliability, Planning and Standards Development -$ -$ -$ 100% -$ -$ -$ 100% per Protocols
53 562 - Station Expenses - Allocated -$ -$ -$ - % -$ -$ -$ 27-Allocators Line 42
54 78 562 - MOGS Station Expense -$ -$ -$ 0% -$ -$ -$ 0% per Protocols79 562 - Operating Transmission Stations -$ -$ -$ - % -$ -$ -$ 27-Allocators Line 3680 562 - Routine Testing and Inspection -$ -$ -$ - % -$ -$ -$ 27-Allocators Line 42
55 81 562 - Sylmar/Palo Verde -$ -$ -$ 100% -$ -$ -$ 100% per Protocols56 82 563 - Inspect and Patrol Line Overhead Line Expenses - Allocate -$ -$ -$ - % -$ -$ -$ 27-Allocators Line 30 48
57 564 - Underground Line Expenses - Allocated -$ -$ -$ - % -$ -$ -$ 27-Allocators Line 36 54
58 83 565 - Transmission of Electricity by Others -$ -$ -$ 100% -$ -$ -$ 100%
59 84 565 - Wheeling Costs -$ -$ -$ 0% -$ -$ -$ 0% per Protocols60 85 565 - WAPA Transmission for Remote Service -$ -$ -$ 0% -$ -$ -$ 0% per Protocols
86 565 - Transmission for Four Corners -$ -$ -$ 100% -$ -$ -$ 100% per Protocols61 566 - Miscellaneous Transmission Expenses - Allocated -$ -$ -$ - % -$ -$ -$ 27-Allocators Line 42
62 87 566 - ISO/RSBA/TSP Balancing Accounts -$ -$ -$ 0% -$ -$ -$ 0% per Protocols88 566 - Training -$ -$ -$ - % -$ -$ -$ Note 6, a89 566 - Other -$ -$ -$ - % -$ -$ -$ Note 6, a90 566 - NERC/CIP Compliance -$ -$ -$ - % -$ -$ -$ 7-PlantStudy, Line 21, C391 566 - Transmission Regulatory Policy -$ -$ -$ - % -$ -$ -$ 7-PlantStudy, Line 21, C392 566 - FERC Regulation & Contracts -$ -$ -$ - % -$ -$ -$ 7-PlantStudy, Line 21, C393 566 - Grid Contract Management -$ -$ -$ - % -$ -$ -$ 7-PlantStudy, Line 21, C3
63 94 566 - Sylmar/Palo Verde/Other General Functions -$ -$ -$ 100% -$ -$ -$ 100% per Protocols64 95 567 - Line Rents - Allocated -$ -$ -$ - % -$ -$ -$ 27-Allocators Line 30 60
96 567 - Morongo Lease -$ -$ -$ - % -$ -$ -$ 27-Allocators Line 6665 97 567 - Eldorado -$ -$ -$ 100% -$ -$ -$ 100% per Protocols66 98 567 - Sylmar/Palo Verde -$ -$ -$ 100% -$ -$ -$ 100% per Protocols67 99 568 - Maintenance Supervision and Engineering - Allocated -$ -$ -$ - % -$ -$ -$ 27-Allocators Line 42 Note 6, c68 100 568 - Sylmar/Palo Verde -$ -$ -$ 100% -$ -$ -$ 100% per Protocols69 101 569 - Maintenance of Structures - Allocated -$ -$ -$ - % -$ -$ -$ 27-Allocators Line 42 Note 6, c
102 569.100 - Hardware -$ -$ -$ - % -$ -$ -$ Note 6, a103 569.200 - Software -$ -$ -$ - % -$ -$ -$ Note 6, a104 569.300 - Communication -$ -$ -$ - % -$ -$ -$ Note 6, a
70 105 569 - Sylmar/Palo Verde -$ -$ -$ 100% -$ -$ -$ 100% per Protocols71 106 570 - Maintenance of Station Equipment - Allocated Power Tran -$ -$ -$ - % -$ -$ -$ 27-Allocators Line 42 72
107 570 - Maintenance of Transmission Circuit Breakers -$ -$ -$ - % -$ -$ -$ 27-Allocators Line 78108 570 - Maintenance of Transmission Voltage Equipment -$ -$ -$ - % -$ -$ -$ 27-Allocators Line 84109 570 - Maintenance of Miscellaneous Transmission Equipment -$ -$ -$ - % -$ -$ -$ Note 6, c110 570 - Substation Work Order Related Expense -$ -$ -$ - % -$ -$ -$ 27-Allocators Line 90
72 111 570 - Sylmar/Palo Verde -$ -$ -$ 100% -$ -$ -$ 100% per Protocols73 112 571 - Maintenance of Overhead Lines - Allocated Poles and Stru -$ -$ -$ - % -$ -$ -$ 27-Allocators Line 30 48
113 571 - Insulators and Conductors -$ -$ -$ - % -$ -$ -$ 27-Allocators Line 48114 571 - Transmission Line Rights of Way -$ -$ -$ - % -$ -$ -$ 27-Allocators Line 48115 571 - Transmission Work Order Related Expense -$ -$ -$ - % -$ -$ -$ 27-Allocators Line 96
74 116 571 - Sylmar/Palo Verde -$ -$ -$ 100% -$ -$ -$ 100% per Protocols75 117 572 - Maintenance of Underground Transmission Lines - Allocat -$ -$ -$ - % -$ -$ -$ 27-Allocators Line 36 5476 118 572 - Sylmar/Palo Verde -$ -$ -$ 100% -$ -$ -$ 100% per Protocols77 119 573 - Maintenance of Miscellaneous Trans. Plant - Allocated Pro -$ -$ -$ - % -$ -$ -$ 27-Allocators Line 42 10278 120 … --- --- --- --- --- --- ---79 121 Transmission NOIC (Note 4) - - - -$ -$ - 80 122 Total Transmission - ISO O&M -$ -$ -$ -$ -$ -$ 81 123
ISO O&M Expenses
Account/Work Activity Rev
Adjusted Recorded O&M Expenses
19-OandM
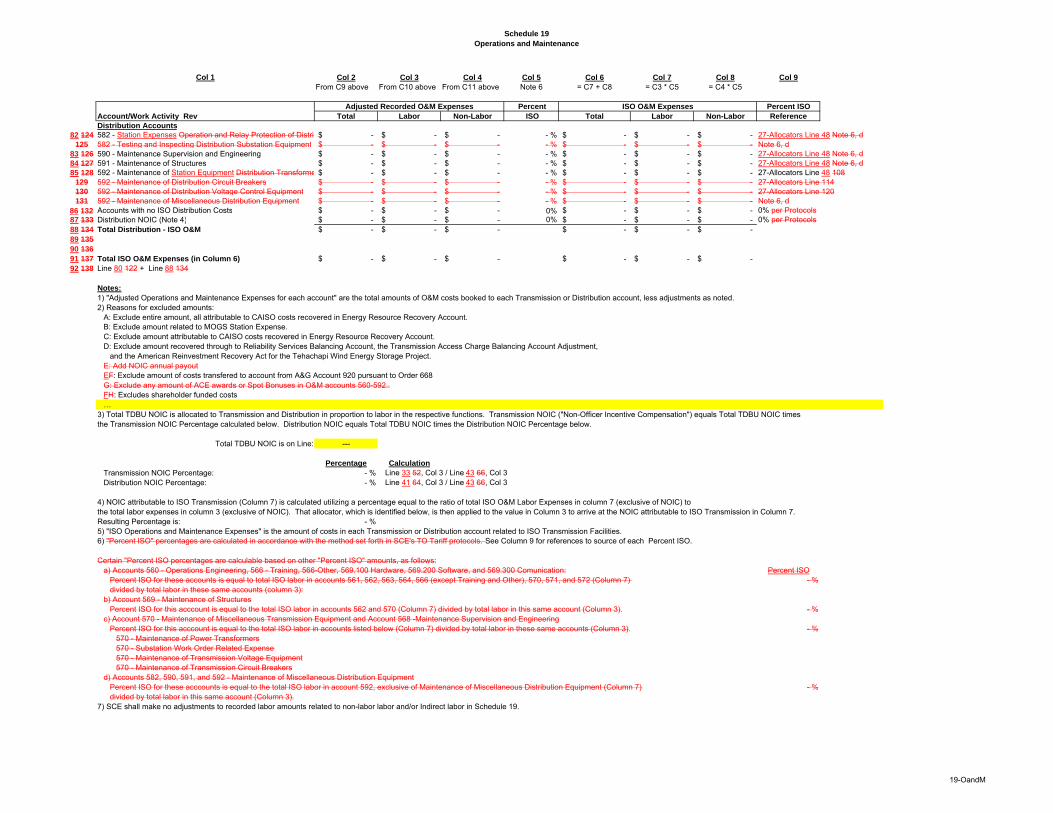
Schedule 19
Operations and Maintenance
Col 1 Col 2 Col 3 Col 4 Col 5 Col 6 Col 7 Col 8 Col 9
From C9 above From C10 above From C11 above Note 6 = C7 + C8 = C3 * C5 = C4 * C5
Percent Percent ISO
Total Labor Non-Labor ISO Total Labor Non-Labor Reference
Distribution Accounts
82 124 582 - Station Expenses Operation and Relay Protection of Distri -$ -$ -$ - % -$ -$ -$ 27-Allocators Line 48 Note 6, d125 582 - Testing and Inspecting Distribution Substation Equipment -$ -$ -$ - % -$ -$ -$ Note 6, d
83 126 590 - Maintenance Supervision and Engineering -$ -$ -$ - % -$ -$ -$ 27-Allocators Line 48 Note 6, d84 127 591 - Maintenance of Structures -$ -$ -$ - % -$ -$ -$ 27-Allocators Line 48 Note 6, d85 128 592 - Maintenance of Station Equipment Distribution Transforme -$ -$ -$ - % -$ -$ -$ 27-Allocators Line 48 108
129 592 - Maintenance of Distribution Circuit Breakers -$ -$ -$ - % -$ -$ -$ 27-Allocators Line 114130 592 - Maintenance of Distribution Voltage Control Equipment -$ -$ -$ - % -$ -$ -$ 27-Allocators Line 120131 592 - Maintenance of Miscellaneous Distribution Equipment -$ -$ -$ - % -$ -$ -$ Note 6, d
86 132 Accounts with no ISO Distribution Costs -$ -$ -$ 0% -$ -$ -$ 0% per Protocols87 133 Distribution NOIC (Note 4) -$ -$ -$ 0% -$ -$ -$ 0% per Protocols88 134 Total Distribution - ISO O&M -$ -$ -$ -$ -$ -$ 89 135
90 136
91 137 Total ISO O&M Expenses (in Column 6) -$ -$ -$ -$ -$ -$ 92 138 Line 80 122 + Line 88 134
Notes:
1) "Adjusted Operations and Maintenance Expenses for each account" are the total amounts of O&M costs booked to each Transmission or Distribution account, less adjustments as noted.2) Reasons for excluded amounts:
A: Exclude entire amount, all attributable to CAISO costs recovered in Energy Resource Recovery Account.B: Exclude amount related to MOGS Station Expense.C: Exclude amount attributable to CAISO costs recovered in Energy Resource Recovery Account.D: Exclude amount recovered through to Reliability Services Balancing Account, the Transmission Access Charge Balancing Account Adjustment,
and the American Reinvestment Recovery Act for the Tehachapi Wind Energy Storage Project.E: Add NOIC annual payoutEF: Exclude amount of costs transfered to account from A&G Account 920 pursuant to Order 668G: Exclude any amount of ACE awards or Spot Bonuses in O&M accounts 560-592..FH: Excludes shareholder funded costs…
3) Total TDBU NOIC is allocated to Transmission and Distribution in proportion to labor in the respective functions. Transmission NOIC ("Non-Officer Incentive Compensation") equals Total TDBU NOIC timesthe Transmission NOIC Percentage calculated below. Distribution NOIC equals Total TDBU NOIC times the Distribution NOIC Percentage below.
Total TDBU NOIC is on Line: ---
Percentage Calculation
Transmission NOIC Percentage: - % Line 33 52, Col 3 / Line 43 66, Col 3Distribution NOIC Percentage: - % Line 41 64, Col 3 / Line 43 66, Col 3
4) NOIC attributable to ISO Transmission (Column 7) is calculated utilizing a percentage equal to the ratio of total ISO O&M Labor Expenses in column 7 (exclusive of NOIC) to the total labor expenses in column 3 (exclusive of NOIC). That allocator, which is identified below, is then applied to the value in Column 3 to arrive at the NOIC attributable to ISO Transmission in Column 7.Resulting Percentage is: - %5) "ISO Operations and Maintenance Expenses" is the amount of costs in each Transmission or Distribution account related to ISO Transmission Facilities.6) "Percent ISO" percentages are calculated in accordance with the method set forth in SCE's TO Tariff protocols. See Column 9 for references to source of each Percent ISO.
Certain "Percent ISO percentages are calculable based on other "Percent ISO" amounts, as follows:a) Accounts 560 - Operations Engineering, 566 - Training, 566-Other, 569.100 Hardware, 569.200 Software, and 569.300 Comunication: Percent ISO
Percent ISO for these accounts is equal to total ISO labor in accounts 561, 562, 563, 564, 566 (except Training and Other), 570, 571, and 572 (Column 7) - %divided by total labor in these same accounts (column 3):
b) Account 569 - Maintenance of StructuresPercent ISO for this acccount is equal to the total ISO labor in accounts 562 and 570 (Column 7) divided by total labor in this same account (Column 3). - %
c) Account 570 - Maintenance of Miscellaneous Transmission Equipment and Account 568 -Maintenance Supervision and EngineeringPercent ISO for this acccount is equal to the total ISO labor in accounts listed below (Column 7) divided by total labor in these same accounts (Column 3). - %
570 - Maintenance of Power Transformers570 - Substation Work Order Related Expense570 - Maintenance of Transmission Voltage Equipment570 - Maintenance of Transmission Circuit Breakers
d) Accounts 582, 590, 591, and 592 - Maintenance of Miscellaneous Distribution EquipmentPercent ISO for these acccounts is equal to the total ISO labor in account 592, exclusive of Maintenance of Miscellaneous Distribution Equipment (Column 7) - %divided by total labor in this same account (Column 3).
7) SCE shall make no adjustments to recorded labor amounts related to non-labor labor and/or Indirect labor in Schedule 19.
ISO O&M Expenses
Account/Work Activity Rev
Adjusted Recorded O&M Expenses
19-OandM
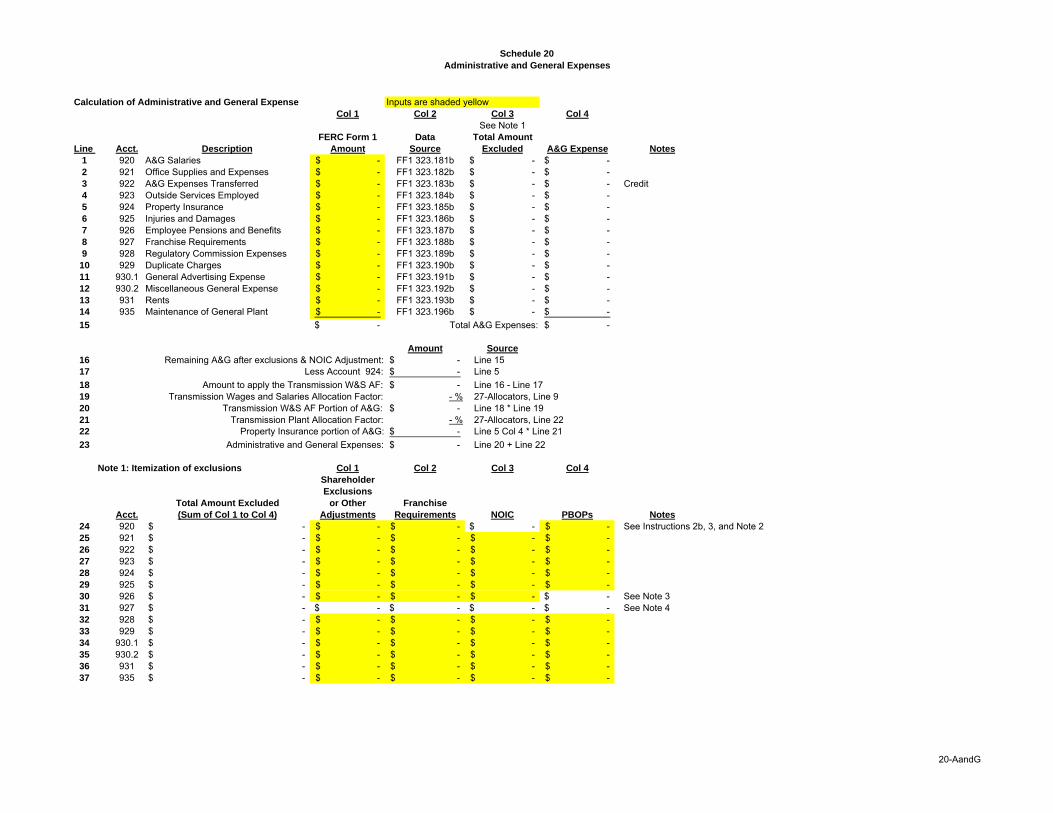
Schedule 20
Administrative and General Expenses
Calculation of Administrative and General Expense Inputs are shaded yellowCol 1 Col 2 Col 3 Col 4
See Note 1FERC Form 1 Data Total Amount
Line Acct. Description Amount Source Excluded A&G Expense Notes
1 920 A&G Salaries -$ FF1 323.181b -$ -$ 2 921 Office Supplies and Expenses -$ FF1 323.182b -$ -$ 3 922 A&G Expenses Transferred -$ FF1 323.183b -$ -$ Credit4 923 Outside Services Employed -$ FF1 323.184b -$ -$ 5 924 Property Insurance -$ FF1 323.185b -$ -$ 6 925 Injuries and Damages -$ FF1 323.186b -$ -$ 7 926 Employee Pensions and Benefits -$ FF1 323.187b -$ -$ 8 927 Franchise Requirements -$ FF1 323.188b -$ -$ 9 928 Regulatory Commission Expenses -$ FF1 323.189b -$ -$ 10 929 Duplicate Charges -$ FF1 323.190b -$ -$ 11 930.1 General Advertising Expense -$ FF1 323.191b -$ -$ 12 930.2 Miscellaneous General Expense -$ FF1 323.192b -$ -$ 13 931 Rents -$ FF1 323.193b -$ -$ 14 935 Maintenance of General Plant -$ FF1 323.196b -$ -$
15 -$ Total A&G Expenses: -$
Amount Source
16 Remaining A&G after exclusions & NOIC Adjustment: -$ Line 1517 Less Account 924: -$ Line 5
18 Amount to apply the Transmission W&S AF: -$ Line 16 - Line 1719 Transmission Wages and Salaries Allocation Factor: - % 27-Allocators, Line 920 Transmission W&S AF Portion of A&G: -$ Line 18 * Line 1921 Transmission Plant Allocation Factor: - % 27-Allocators, Line 2222 Property Insurance portion of A&G: -$ Line 5 Col 4 * Line 21
23 Administrative and General Expenses: -$ Line 20 + Line 22
Note 1: Itemization of exclusions Col 1 Col 2 Col 3 Col 4
Shareholder
Exclusions
Total Amount Excluded or Other Franchise
Acct. (Sum of Col 1 to Col 4) Adjustments Requirements NOIC PBOPs Notes
24 920 -$ -$ -$ -$ -$ See Instructions 2b, 3, and Note 225 921 -$ -$ -$ -$ -$ 26 922 -$ -$ -$ -$ -$ 27 923 -$ -$ -$ -$ -$ 28 924 -$ -$ -$ -$ -$ 29 925 -$ -$ -$ -$ -$ 30 926 -$ -$ -$ -$ -$ See Note 331 927 -$ -$ -$ -$ -$ See Note 432 928 -$ -$ -$ -$ -$ 33 929 -$ -$ -$ -$ -$ 34 930.1 -$ -$ -$ -$ -$ 35 930.2 -$ -$ -$ -$ -$ 36 931 -$ -$ -$ -$ -$ 37 935 -$ -$ -$ -$ -$
20-AandG
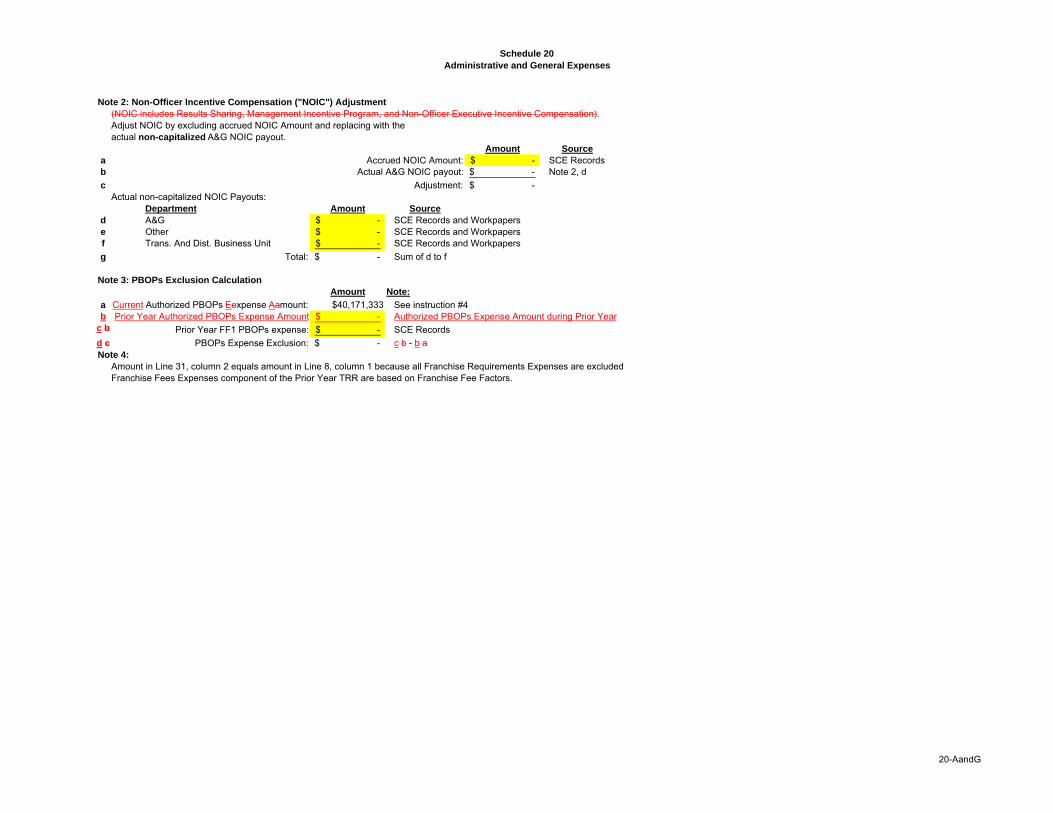
Schedule 20
Administrative and General Expenses
Note 2: Non-Officer Incentive Compensation ("NOIC") Adjustment
(NOIC includes Results Sharing, Management Incentive Program, and Non-Officer Executive Incentive Compensation).Adjust NOIC by excluding accrued NOIC Amount and replacing with the actual non-capitalized A&G NOIC payout.
Amount Source
a Accrued NOIC Amount: -$ SCE Recordsb Actual A&G NOIC payout: -$ Note 2, d
c Adjustment: -$ Actual non-capitalized NOIC Payouts:
Department Amount Source
d A&G -$ SCE Records and Workpaperse Other -$ SCE Records and Workpapersf Trans. And Dist. Business Unit -$ SCE Records and Workpapers
g Total: -$ Sum of d to f
Note 3: PBOPs Exclusion Calculation
Amount Note:
a Current Authorized PBOPs Eexpense Aamount: $40,171,333 See instruction #4b Prior Year Authorized PBOPs Expense Amount -$ Authorized PBOPs Expense Amount during Prior Year
c b Prior Year FF1 PBOPs expense: -$ SCE Records
d c PBOPs Expense Exclusion: -$ c b - b aNote 4:
Amount in Line 31, column 2 equals amount in Line 8, column 1 because all Franchise Requirements Expenses are excludedFranchise Fees Expenses component of the Prior Year TRR are based on Franchise Fee Factors.
20-AandG
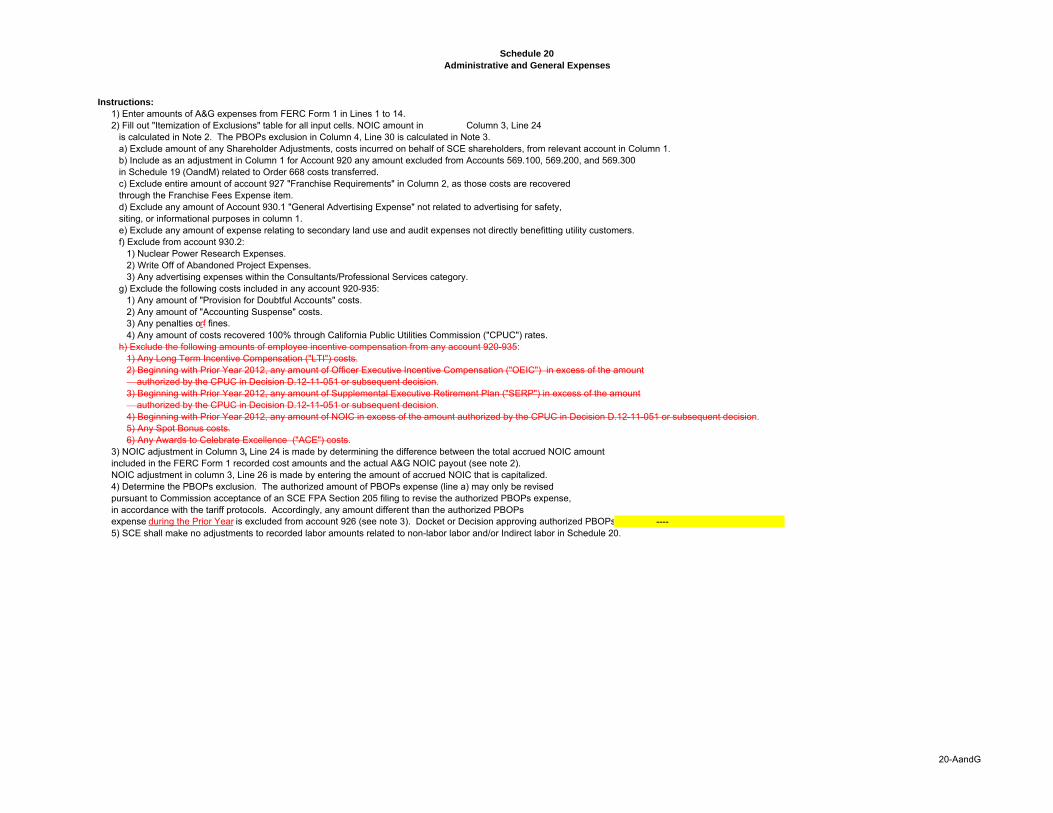
Schedule 20
Administrative and General Expenses
Instructions:
1) Enter amounts of A&G expenses from FERC Form 1 in Lines 1 to 14.2) Fill out "Itemization of Exclusions" table for all input cells. NOIC amount in Column 3, Line 24
is calculated in Note 2. The PBOPs exclusion in Column 4, Line 30 is calculated in Note 3.a) Exclude amount of any Shareholder Adjustments, costs incurred on behalf of SCE shareholders, from relevant account in Column 1.b) Include as an adjustment in Column 1 for Account 920 any amount excluded from Accounts 569.100, 569.200, and 569.300in Schedule 19 (OandM) related to Order 668 costs transferred.c) Exclude entire amount of account 927 "Franchise Requirements" in Column 2, as those costs are recovered through the Franchise Fees Expense item.d) Exclude any amount of Account 930.1 "General Advertising Expense" not related to advertising for safety, siting, or informational purposes in column 1.e) Exclude any amount of expense relating to secondary land use and audit expenses not directly benefitting utility customers.f) Exclude from account 930.2:
1) Nuclear Power Research Expenses.2) Write Off of Abandoned Project Expenses.3) Any advertising expenses within the Consultants/Professional Services category.
g) Exclude the following costs included in any account 920-935:1) Any amount of "Provision for Doubtful Accounts" costs. 2) Any amount of "Accounting Suspense" costs.3) Any penalties orf fines.4) Any amount of costs recovered 100% through California Public Utilities Commission ("CPUC") rates.
h) Exclude the following amounts of employee incentive compensation from any account 920-935:1) Any Long Term Incentive Compensation ("LTI") costs.2) Beginning with Prior Year 2012, any amount of Officer Executive Incentive Compensation ("OEIC") in excess of the amount authorized by the CPUC in Decision D.12-11-051 or subsequent decision.3) Beginning with Prior Year 2012, any amount of Supplemental Executive Retirement Plan ("SERP") in excess of the amount authorized by the CPUC in Decision D.12-11-051 or subsequent decision.4) Beginning with Prior Year 2012, any amount of NOIC in excess of the amount authorized by the CPUC in Decision D.12-11-051 or subsequent decision.5) Any Spot Bonus costs.6) Any Awards to Celebrate Excellence ("ACE") costs.
3) NOIC adjustment in Column 3, Line 24 is made by determining the difference between the total accrued NOIC amount included in the FERC Form 1 recorded cost amounts and the actual A&G NOIC payout (see note 2).NOIC adjustment in column 3, Line 26 is made by entering the amount of accrued NOIC that is capitalized.4) Determine the PBOPs exclusion. The authorized amount of PBOPs expense (line a) may only be revisedpursuant to Commission acceptance of an SCE FPA Section 205 filing to revise the authorized PBOPs expense,in accordance with the tariff protocols. Accordingly, any amount different than the authorized PBOPsexpense during the Prior Year is excluded from account 926 (see note 3). Docket or Decision approving authorized PBOPs ----5) SCE shall make no adjustments to recorded labor amounts related to non-labor labor and/or Indirect labor in Schedule 20.
20-AandG
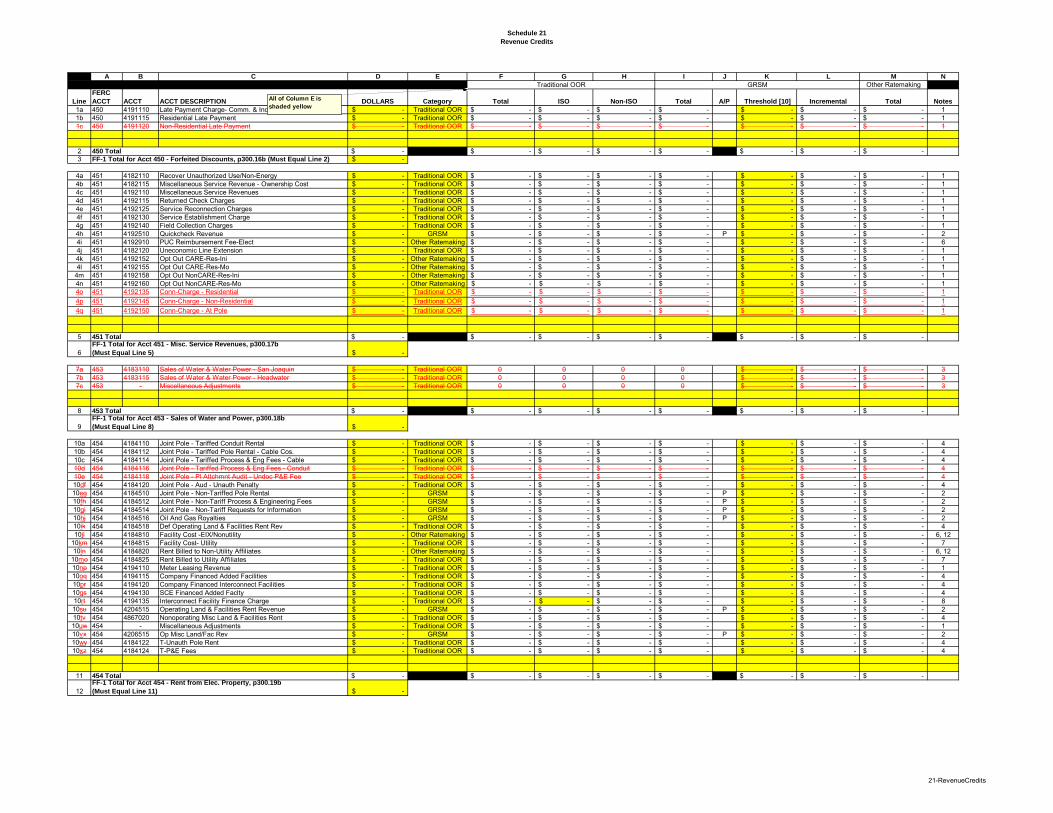
Schedule 21
Revenue Credits
A B C D E F G H I J K L M N
Other Ratemaking
Line
FERC
ACCT ACCT ACCT DESCRIPTION DOLLARS Category Total ISO Non-ISO Total A/P Threshold [10] Incremental Total Notes
1a 450 4191110 Late Payment Charge- Comm. & Ind. -$ Traditional OOR -$ -$ -$ -$ -$ -$ -$ 11b 450 4191115 Residential Late Payment -$ Traditional OOR -$ -$ -$ -$ -$ -$ -$ 11c 450 4191120 Non-Residential Late Payment -$ Traditional OOR -$ -$ -$ -$ -$ -$ -$ 1
2 -$ -$ -$ -$ -$ -$ -$ -$ 3 -$
4a 451 4182110 Recover Unauthorized Use/Non-Energy -$ Traditional OOR -$ -$ -$ -$ -$ -$ -$ 14b 451 4182115 Miscellaneous Service Revenue - Ownership Cost -$ Traditional OOR -$ -$ -$ -$ -$ -$ -$ 14c 451 4192110 Miscellaneous Service Revenues -$ Traditional OOR -$ -$ -$ -$ -$ -$ -$ 14d 451 4192115 Returned Check Charges -$ Traditional OOR -$ -$ -$ -$ -$ -$ -$ 14e 451 4192125 Service Reconnection Charges -$ Traditional OOR -$ -$ -$ -$ -$ -$ -$ 14f 451 4192130 Service Establishment Charge -$ Traditional OOR -$ -$ -$ -$ -$ -$ -$ 14g 451 4192140 Field Collection Charges -$ Traditional OOR -$ -$ -$ -$ -$ -$ -$ 14h 451 4192510 Quickcheck Revenue -$ GRSM -$ -$ -$ -$ P -$ -$ -$ 24i 451 4192910 PUC Reimbursement Fee-Elect -$ Other Ratemaking -$ -$ -$ -$ -$ -$ -$ 64j 451 4182120 Uneconomic Line Extension -$ Traditional OOR -$ -$ -$ -$ -$ -$ -$ 14k 451 4192152 Opt Out CARE-Res-Ini -$ Other Ratemaking -$ -$ -$ -$ -$ -$ -$ 14l 451 4192155 Opt Out CARE-Res-Mo -$ Other Ratemaking -$ -$ -$ -$ -$ -$ -$ 1
4m 451 4192158 Opt Out NonCARE-Res-Ini -$ Other Ratemaking -$ -$ -$ -$ -$ -$ -$ 14n 451 4192160 Opt Out NonCARE-Res-Mo -$ Other Ratemaking -$ -$ -$ -$ -$ -$ -$ 14o 451 4192135 Conn-Charge - Residential -$ Traditional OOR -$ -$ -$ -$ -$ -$ -$ 1
4p 451 4192145 Conn-Charge - Non-Residential -$ Traditional OOR -$ -$ -$ -$ -$ -$ -$ 1
4q 451 4192150 Conn-Charge - At Pole -$ Traditional OOR -$ -$ -$ -$ -$ -$ -$ 1
5 -$ -$ -$ -$ -$ -$ -$ -$
6 -$
7a 453 4183110 Sales of Water & Water Power - San Joaquin -$ Traditional OOR 0 0 0 0 -$ -$ -$ 37b 453 4183115 Sales of Water & Water Power - Headwater -$ Traditional OOR 0 0 0 0 -$ -$ -$ 37c 453 - Miscellaneous Adjustments -$ Traditional OOR 0 0 0 0 -$ -$ -$ 3
8 -$ -$ -$ -$ -$ -$ -$ -$
9 -$
10a 454 4184110 Joint Pole - Tariffed Conduit Rental -$ Traditional OOR -$ -$ -$ -$ -$ -$ -$ 410b 454 4184112 Joint Pole - Tariffed Pole Rental - Cable Cos. -$ Traditional OOR -$ -$ -$ -$ -$ -$ -$ 410c 454 4184114 Joint Pole - Tariffed Process & Eng Fees - Cable -$ Traditional OOR -$ -$ -$ -$ -$ -$ -$ 410d 454 4184116 Joint Pole - Tariffed Process & Eng Fees - Conduit -$ Traditional OOR -$ -$ -$ -$ -$ -$ -$ 410e 454 4184118 Joint Pole - Pl Attchmnt Audit - Undoc P&E Fee -$ Traditional OOR -$ -$ -$ -$ -$ -$ -$ 410df 454 4184120 Joint Pole - Aud - Unauth Penalty -$ Traditional OOR -$ -$ -$ -$ -$ -$ -$ 410eg 454 4184510 Joint Pole - Non-Tariffed Pole Rental -$ GRSM -$ -$ -$ -$ P -$ -$ -$ 210fh 454 4184512 Joint Pole - Non-Tariff Process & Engineering Fees -$ GRSM -$ -$ -$ -$ P -$ -$ -$ 210gi 454 4184514 Joint Pole - Non-Tariff Requests for Information -$ GRSM -$ -$ -$ -$ P -$ -$ -$ 210hj 454 4184516 Oil And Gas Royalties -$ GRSM -$ -$ -$ -$ P -$ -$ -$ 210ik 454 4184518 Def Operating Land & Facilities Rent Rev -$ Traditional OOR -$ -$ -$ -$ -$ -$ -$ 410jl 454 4184810 Facility Cost -EIX/Nonutility -$ Other Ratemaking -$ -$ -$ -$ -$ -$ -$ 6, 12
10km 454 4184815 Facility Cost- Utility -$ Traditional OOR -$ -$ -$ -$ -$ -$ -$ 710ln 454 4184820 Rent Billed to Non-Utility Affiliates -$ Other Ratemaking -$ -$ -$ -$ -$ -$ -$ 6, 12
10mo 454 4184825 Rent Billed to Utility Affiliates -$ Traditional OOR -$ -$ -$ -$ -$ -$ -$ 710np 454 4194110 Meter Leasing Revenue -$ Traditional OOR -$ -$ -$ -$ -$ -$ -$ 110oq 454 4194115 Company Financed Added Facilities -$ Traditional OOR -$ -$ -$ -$ -$ -$ -$ 410pr 454 4194120 Company Financed Interconnect Facilities -$ Traditional OOR -$ -$ -$ -$ -$ -$ -$ 410qs 454 4194130 SCE Financed Added Faclty -$ Traditional OOR -$ -$ -$ -$ -$ -$ -$ 410rt 454 4194135 Interconnect Facility Finance Charge -$ Traditional OOR -$ -$ -$ -$ -$ -$ -$ 810su 454 4204515 Operating Land & Facilities Rent Revenue -$ GRSM -$ -$ -$ -$ P -$ -$ -$ 210tv 454 4867020 Nonoperating Misc Land & Facilities Rent -$ Traditional OOR -$ -$ -$ -$ -$ -$ -$ 410uw 454 - Miscellaneous Adjustments -$ Traditional OOR -$ -$ -$ -$ -$ -$ -$ 110vx 454 4206515 Op Misc Land/Fac Rev -$ GRSM -$ -$ -$ -$ P -$ -$ -$ 210wy 454 4184122 T-Unauth Pole Rent -$ Traditional OOR -$ -$ -$ -$ -$ -$ -$ 410xz 454 4184124 T-P&E Fees -$ Traditional OOR -$ -$ -$ -$ -$ -$ -$ 4
11 -$ -$ -$ -$ -$ -$ -$ -$
12 -$
GRSMTraditional OOR
FF-1 Total for Acct 454 - Rent from Elec. Property, p300.19b
(Must Equal Line 11)
FF-1 Total for Acct 453 - Sales of Water and Power, p300.18b
(Must Equal Line 8)
FF-1 Total for Acct 451 - Misc. Service Revenues, p300.17b
(Must Equal Line 5)
450 Total
FF-1 Total for Acct 450 - Forfeited Discounts, p300.16b (Must Equal Line 2)
453 Total
451 Total
454 Total
All of Column E is shaded yellow
21-RevenueCredits
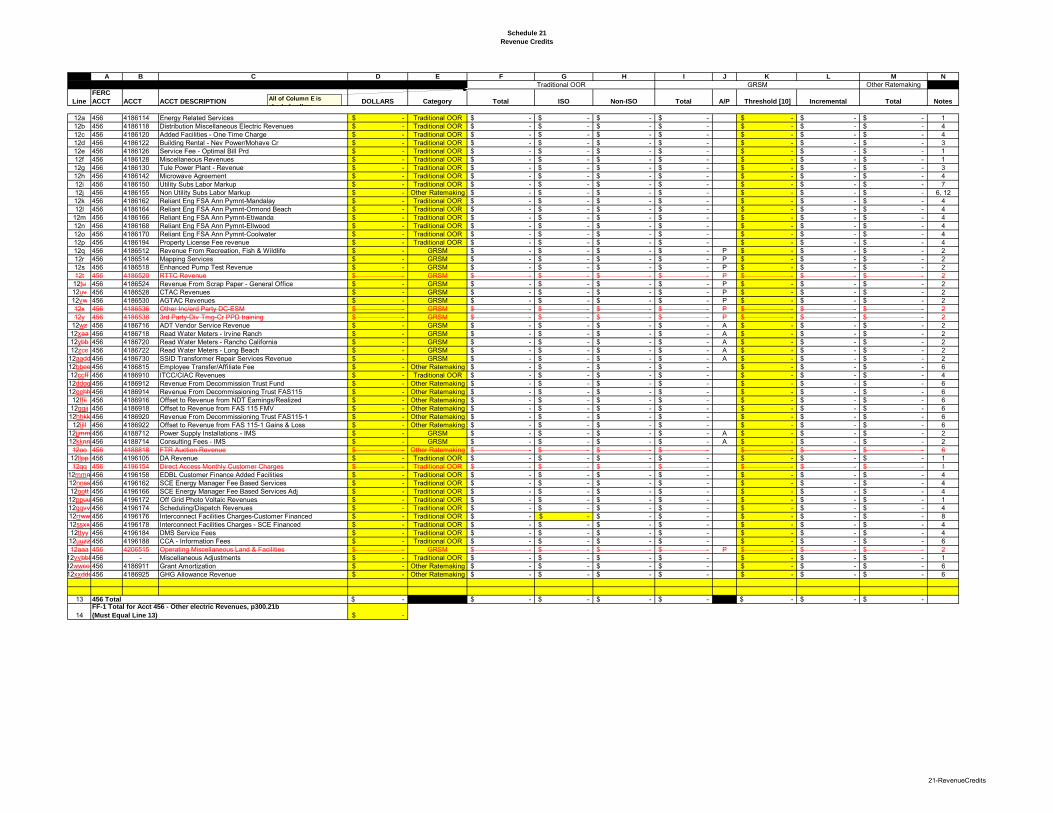
Schedule 21
Revenue Credits
A B C D E F G H I J K L M N
Other Ratemaking
Line
FERC
ACCT ACCT ACCT DESCRIPTION DOLLARS Category Total ISO Non-ISO Total A/P Threshold [10] Incremental Total Notes
GRSMTraditional OOR
All of Column E is shaded yellow
12a 456 4186114 Energy Related Services -$ Traditional OOR -$ -$ -$ -$ -$ -$ -$ 112b 456 4186118 Distribution Miscellaneous Electric Revenues -$ Traditional OOR -$ -$ -$ -$ -$ -$ -$ 412c 456 4186120 Added Facilities - One Time Charge -$ Traditional OOR -$ -$ -$ -$ -$ -$ -$ 412d 456 4186122 Building Rental - Nev Power/Mohave Cr -$ Traditional OOR -$ -$ -$ -$ -$ -$ -$ 312e 456 4186126 Service Fee - Optimal Bill Prd -$ Traditional OOR -$ -$ -$ -$ -$ -$ -$ 112f 456 4186128 Miscellaneous Revenues -$ Traditional OOR -$ -$ -$ -$ -$ -$ -$ 112g 456 4186130 Tule Power Plant - Revenue -$ Traditional OOR -$ -$ -$ -$ -$ -$ -$ 312h 456 4186142 Microwave Agreement -$ Traditional OOR -$ -$ -$ -$ -$ -$ -$ 412i 456 4186150 Utility Subs Labor Markup -$ Traditional OOR -$ -$ -$ -$ -$ -$ -$ 712j 456 4186155 Non Utility Subs Labor Markup -$ Other Ratemaking -$ -$ -$ -$ -$ -$ -$ 6, 1212k 456 4186162 Reliant Eng FSA Ann Pymnt-Mandalay -$ Traditional OOR -$ -$ -$ -$ -$ -$ -$ 412l 456 4186164 Reliant Eng FSA Ann Pymnt-Ormond Beach -$ Traditional OOR -$ -$ -$ -$ -$ -$ -$ 4
12m 456 4186166 Reliant Eng FSA Ann Pymnt-Etiwanda -$ Traditional OOR -$ -$ -$ -$ -$ -$ -$ 412n 456 4186168 Reliant Eng FSA Ann Pymnt-Ellwood -$ Traditional OOR -$ -$ -$ -$ -$ -$ -$ 412o 456 4186170 Reliant Eng FSA Ann Pymnt-Coolwater -$ Traditional OOR -$ -$ -$ -$ -$ -$ -$ 412p 456 4186194 Property License Fee revenue -$ Traditional OOR -$ -$ -$ -$ -$ -$ -$ 412q 456 4186512 Revenue From Recreation, Fish & Wildlife -$ GRSM -$ -$ -$ -$ P -$ -$ -$ 212r 456 4186514 Mapping Services -$ GRSM -$ -$ -$ -$ P -$ -$ -$ 212s 456 4186518 Enhanced Pump Test Revenue -$ GRSM -$ -$ -$ -$ P -$ -$ -$ 212t 456 4186520 RTTC Revenue -$ GRSM -$ -$ -$ -$ P -$ -$ -$ 212tu 456 4186524 Revenue From Scrap Paper - General Office -$ GRSM -$ -$ -$ -$ P -$ -$ -$ 212uv 456 4186528 CTAC Revenues -$ GRSM -$ -$ -$ -$ P -$ -$ -$ 212vw 456 4186530 AGTAC Revenues -$ GRSM -$ -$ -$ -$ P -$ -$ -$ 212x 456 4186536 Other Inc/erd Party DC-ESM -$ GRSM -$ -$ -$ -$ P -$ -$ -$ 212y 456 4186538 3rd Party-Div Tmg-Cr PPD training -$ GRSM -$ -$ -$ -$ P -$ -$ -$ 2
12wz 456 4186716 ADT Vendor Service Revenue -$ GRSM -$ -$ -$ -$ A -$ -$ -$ 212xaa 456 4186718 Read Water Meters - Irvine Ranch -$ GRSM -$ -$ -$ -$ A -$ -$ -$ 212ybb 456 4186720 Read Water Meters - Rancho California -$ GRSM -$ -$ -$ -$ A -$ -$ -$ 212zcc 456 4186722 Read Water Meters - Long Beach -$ GRSM -$ -$ -$ -$ A -$ -$ -$ 2
12aadd 456 4186730 SSID Transformer Repair Services Revenue -$ GRSM -$ -$ -$ -$ A -$ -$ -$ 212bbee 456 4186815 Employee Transfer/Affiliate Fee -$ Other Ratemaking -$ -$ -$ -$ -$ -$ -$ 612ccff 456 4186910 ITCC/CIAC Revenues -$ Traditional OOR -$ -$ -$ -$ -$ -$ -$ 4
12ddgg 456 4186912 Revenue From Decommission Trust Fund -$ Other Ratemaking -$ -$ -$ -$ -$ -$ -$ 612eehh 456 4186914 Revenue From Decommissioning Trust FAS115 -$ Other Ratemaking -$ -$ -$ -$ -$ -$ -$ 612ffii 456 4186916 Offset to Revenue from NDT Earnings/Realized -$ Other Ratemaking -$ -$ -$ -$ -$ -$ -$ 612ggjj 456 4186918 Offset to Revenue from FAS 115 FMV -$ Other Ratemaking -$ -$ -$ -$ -$ -$ -$ 612hhkk 456 4186920 Revenue From Decommissioning Trust FAS115-1 -$ Other Ratemaking -$ -$ -$ -$ -$ -$ -$ 6
12iill 456 4186922 Offset to Revenue from FAS 115-1 Gains & Loss -$ Other Ratemaking -$ -$ -$ -$ -$ -$ -$ 612jjmm 456 4188712 Power Supply Installations - IMS -$ GRSM -$ -$ -$ -$ A -$ -$ -$ 212kknn 456 4188714 Consulting Fees - IMS -$ GRSM -$ -$ -$ -$ A -$ -$ -$ 212oo 456 4188818 FTR Auction Revenue -$ Other Ratemaking -$ -$ -$ -$ -$ -$ -$ 612llpp 456 4196105 DA Revenue -$ Traditional OOR -$ -$ -$ -$ -$ -$ -$ 112qq 456 4196154 Direct Access Monthly Customer Charges -$ Traditional OOR -$ -$ -$ -$ -$ -$ -$ 1
12mmrr 456 4196158 EDBL Customer Finance Added Facilities -$ Traditional OOR -$ -$ -$ -$ -$ -$ -$ 412nnss 456 4196162 SCE Energy Manager Fee Based Services -$ Traditional OOR -$ -$ -$ -$ -$ -$ -$ 412oott 456 4196166 SCE Energy Manager Fee Based Services Adj -$ Traditional OOR -$ -$ -$ -$ -$ -$ -$ 412ppuu 456 4196172 Off Grid Photo Voltaic Revenues -$ Traditional OOR -$ -$ -$ -$ -$ -$ -$ 112qqvv 456 4196174 Scheduling/Dispatch Revenues -$ Traditional OOR -$ -$ -$ -$ -$ -$ -$ 412rrww 456 4196176 Interconnect Facilities Charges-Customer Financed -$ Traditional OOR -$ -$ -$ -$ -$ -$ -$ 812ssxx 456 4196178 Interconnect Facilities Charges - SCE Financed -$ Traditional OOR -$ -$ -$ -$ -$ -$ -$ 412ttyy 456 4196184 DMS Service Fees -$ Traditional OOR -$ -$ -$ -$ -$ -$ -$ 412uuzz 456 4196188 CCA - Information Fees -$ Traditional OOR -$ -$ -$ -$ -$ -$ -$ 612aaa 456 4206515 Operating Miscellaneous Land & Facilities -$ GRSM -$ -$ -$ -$ P -$ -$ -$ 2
12vvbbb456 - Miscellaneous Adjustments -$ Traditional OOR -$ -$ -$ -$ -$ -$ -$ 112wwccc456 4186911 Grant Amortization -$ Other Ratemaking -$ -$ -$ -$ -$ -$ -$ 612xxddd456 4186925 GHG Allowance Revenue -$ Other Ratemaking -$ -$ -$ -$ -$ -$ -$ 6
13 -$ -$ -$ -$ -$ -$ -$ -$
14 -$ FF-1 Total for Acct 456 - Other electric Revenues, p300.21b
(Must Equal Line 13)
456 Total
21-RevenueCredits
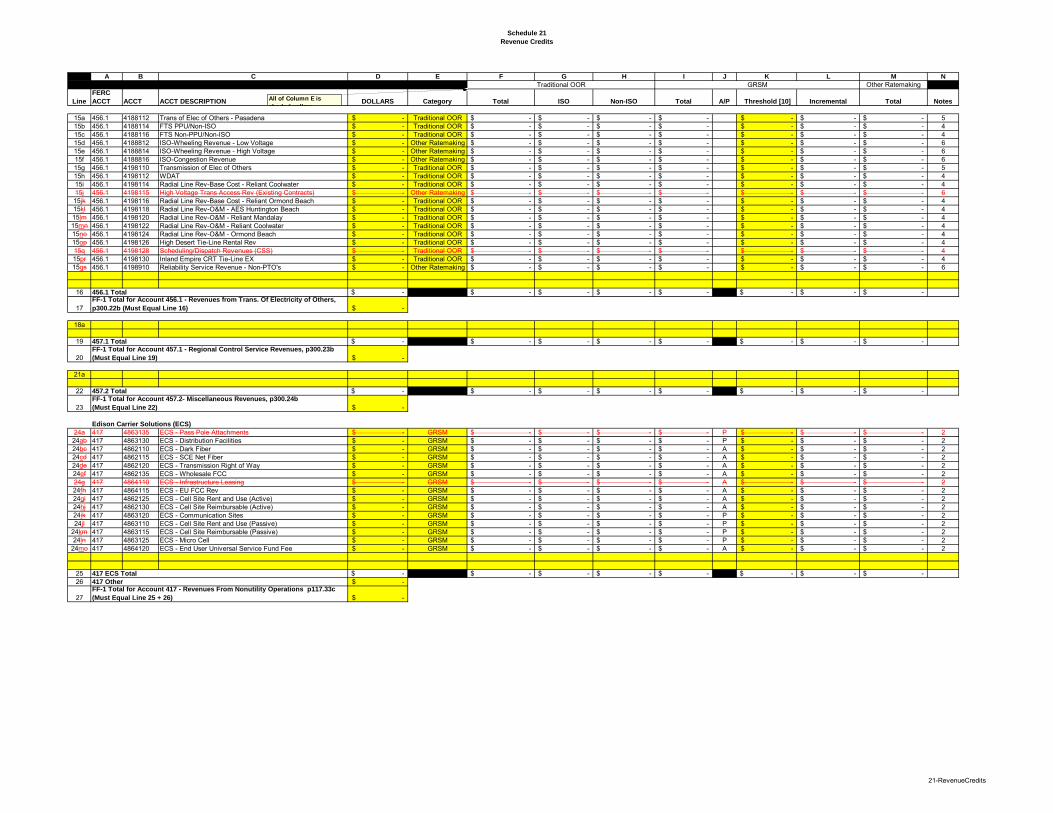
Schedule 21
Revenue Credits
A B C D E F G H I J K L M N
Other Ratemaking
Line
FERC
ACCT ACCT ACCT DESCRIPTION DOLLARS Category Total ISO Non-ISO Total A/P Threshold [10] Incremental Total Notes
GRSMTraditional OOR
All of Column E is shaded yellow
15a 456.1 4188112 Trans of Elec of Others - Pasadena -$ Traditional OOR -$ -$ -$ -$ -$ -$ -$ 515b 456.1 4188114 FTS PPU/Non-ISO -$ Traditional OOR -$ -$ -$ -$ -$ -$ -$ 415c 456.1 4188116 FTS Non-PPU/Non-ISO -$ Traditional OOR -$ -$ -$ -$ -$ -$ -$ 415d 456.1 4188812 ISO-Wheeling Revenue - Low Voltage -$ Other Ratemaking -$ -$ -$ -$ -$ -$ -$ 615e 456.1 4188814 ISO-Wheeling Revenue - High Voltage -$ Other Ratemaking -$ -$ -$ -$ -$ -$ -$ 615f 456.1 4188816 ISO-Congestion Revenue -$ Other Ratemaking -$ -$ -$ -$ -$ -$ -$ 615g 456.1 4198110 Transmission of Elec of Others -$ Traditional OOR -$ -$ -$ -$ -$ -$ -$ 515h 456.1 4198112 WDAT -$ Traditional OOR -$ -$ -$ -$ -$ -$ -$ 415i 456.1 4198114 Radial Line Rev-Base Cost - Reliant Coolwater -$ Traditional OOR -$ -$ -$ -$ -$ -$ -$ 415j 456.1 4198115 High Voltage Trans Access Rev (Existing Contracts) -$ Other Ratemaking -$ -$ -$ -$ -$ -$ -$ 615jk 456.1 4198116 Radial Line Rev-Base Cost - Reliant Ormond Beach -$ Traditional OOR -$ -$ -$ -$ -$ -$ -$ 415kl 456.1 4198118 Radial Line Rev-O&M - AES Huntington Beach -$ Traditional OOR -$ -$ -$ -$ -$ -$ -$ 415lm 456.1 4198120 Radial Line Rev-O&M - Reliant Mandalay -$ Traditional OOR -$ -$ -$ -$ -$ -$ -$ 415mn 456.1 4198122 Radial Line Rev-O&M - Reliant Coolwater -$ Traditional OOR -$ -$ -$ -$ -$ -$ -$ 415no 456.1 4198124 Radial Line Rev-O&M - Ormond Beach -$ Traditional OOR -$ -$ -$ -$ -$ -$ -$ 415op 456.1 4198126 High Desert Tie-Line Rental Rev -$ Traditional OOR -$ -$ -$ -$ -$ -$ -$ 415q 456.1 4198128 Scheduling/Dispatch Revenues (CSS) -$ Traditional OOR -$ -$ -$ -$ -$ -$ -$ 415pr 456.1 4198130 Inland Empire CRT Tie-Line EX -$ Traditional OOR -$ -$ -$ -$ -$ -$ -$ 415qs 456.1 4198910 Reliability Service Revenue - Non-PTO's -$ Other Ratemaking -$ -$ -$ -$ -$ -$ -$ 6
16 -$ -$ -$ -$ -$ -$ -$ -$
17 -$
18a
19 -$ -$ -$ -$ -$ -$ -$ -$
20 -$
21a
22 -$ -$ -$ -$ -$ -$ -$ -$
23 -$
Edison Carrier Solutions (ECS)
24a 417 4863135 ECS - Pass Pole Attachments -$ GRSM -$ -$ -$ -$ P -$ -$ -$ 224ab 417 4863130 ECS - Distribution Facilities -$ GRSM -$ -$ -$ -$ P -$ -$ -$ 224bc 417 4862110 ECS - Dark Fiber -$ GRSM -$ -$ -$ -$ A -$ -$ -$ 224cd 417 4862115 ECS - SCE Net Fiber -$ GRSM -$ -$ -$ -$ A -$ -$ -$ 224de 417 4862120 ECS - Transmission Right of Way -$ GRSM -$ -$ -$ -$ A -$ -$ -$ 224ef 417 4862135 ECS - Wholesale FCC -$ GRSM -$ -$ -$ -$ A -$ -$ -$ 224g 417 4864110 ECS - Infrastructure Leasing -$ GRSM -$ -$ -$ -$ A -$ -$ -$ 224fh 417 4864115 ECS - EU FCC Rev -$ GRSM -$ -$ -$ -$ A -$ -$ -$ 224gi 417 4862125 ECS - Cell Site Rent and Use (Active) -$ GRSM -$ -$ -$ -$ A -$ -$ -$ 224hj 417 4862130 ECS - Cell Site Reimbursable (Active) -$ GRSM -$ -$ -$ -$ A -$ -$ -$ 224ik 417 4863120 ECS - Communication Sites -$ GRSM -$ -$ -$ -$ P -$ -$ -$ 224jl 417 4863110 ECS - Cell Site Rent and Use (Passive) -$ GRSM -$ -$ -$ -$ P -$ -$ -$ 2
24km 417 4863115 ECS - Cell Site Reimbursable (Passive) -$ GRSM -$ -$ -$ -$ P -$ -$ -$ 224ln 417 4863125 ECS - Micro Cell -$ GRSM -$ -$ -$ -$ P -$ -$ -$ 2
24mo 417 4864120 ECS - End User Universal Service Fund Fee -$ GRSM -$ -$ -$ -$ A -$ -$ -$ 2
25 -$ -$ -$ -$ -$ -$ -$ -$ 26 -$
27 -$
FF-1 Total for Account 417 - Revenues From Nonutility Operations p117.33c
(Must Equal Line 25 + 26)
FF-1 Total for Account 456.1 - Revenues from Trans. Of Electricity of Others,
p300.22b (Must Equal Line 16)
417 Other
457.2 Total
FF-1 Total for Account 457.1 - Regional Control Service Revenues, p300.23b
(Must Equal Line 19)
417 ECS Total
FF-1 Total for Account 457.2- Miscellaneous Revenues, p300.24b
(Must Equal Line 22)
457.1 Total
456.1 Total
21-RevenueCredits
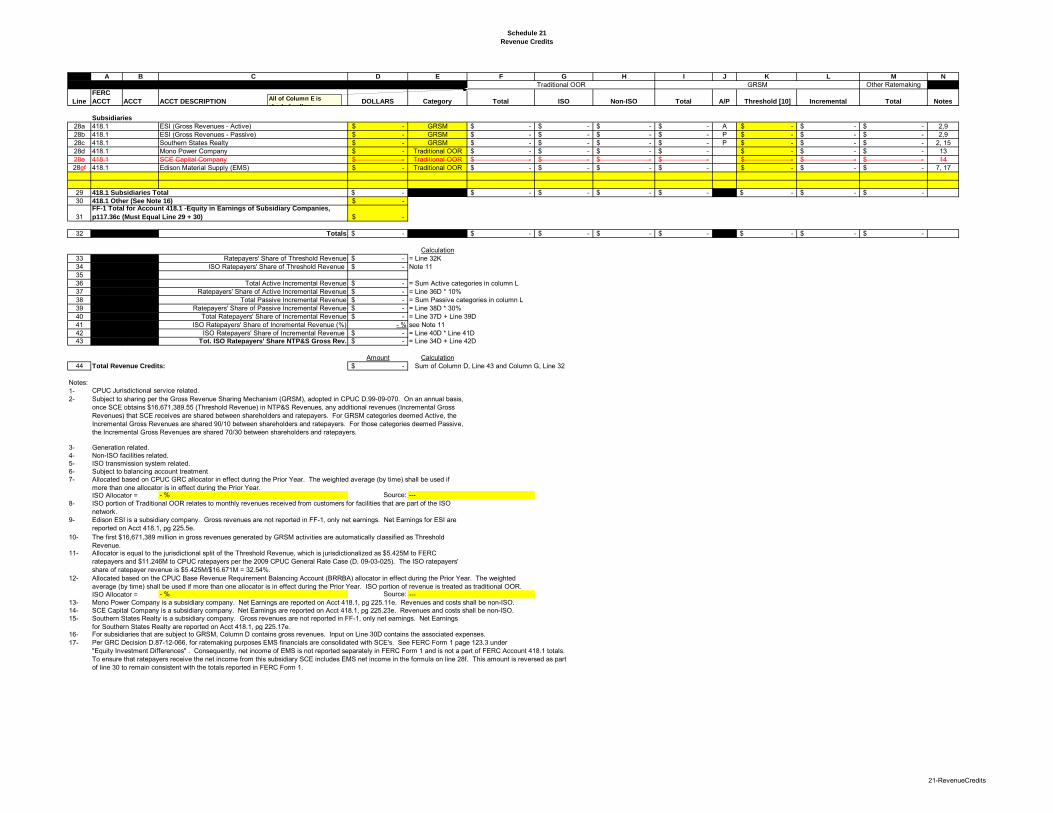
Schedule 21
Revenue Credits
A B C D E F G H I J K L M N
Other Ratemaking
Line
FERC
ACCT ACCT ACCT DESCRIPTION DOLLARS Category Total ISO Non-ISO Total A/P Threshold [10] Incremental Total Notes
GRSMTraditional OOR
All of Column E is shaded yellow
Subsidiaries
28a ESI (Gross Revenues - Active) -$ GRSM -$ -$ -$ -$ A -$ -$ -$ 2,928b ESI (Gross Revenues - Passive) -$ GRSM -$ -$ -$ -$ P -$ -$ -$ 2,928c Southern States Realty -$ GRSM -$ -$ -$ -$ P -$ -$ -$ 2, 1528d Mono Power Company -$ Traditional OOR -$ -$ -$ -$ -$ -$ -$ 1328e SCE Capital Company -$ Traditional OOR -$ -$ -$ -$ -$ -$ -$ 1428ef 418.1 Edison Material Supply (EMS) -$ Traditional OOR -$ -$ -$ -$ -$ -$ -$ 7, 17
29 -$ -$ -$ -$ -$ -$ -$ -$ 30 -$
31 -$
32 Totals -$ -$ -$ -$ -$ -$ -$ -$
Calculation33 Ratepayers' Share of Threshold Revenue -$ = Line 32K34 ISO Ratepayers' Share of Threshold Revenue -$ Note 113536 Total Active Incremental Revenue -$ = Sum Active categories in column L37 Ratepayers' Share of Active Incremental Revenue -$ = Line 36D * 10%38 Total Passive Incremental Revenue -$ = Sum Passive categories in column L39 Ratepayers' Share of Passive Incremental Revenue -$ = Line 38D * 30%40 Total Ratepayers' Share of Incremental Revenue -$ = Line 37D + Line 39D41 ISO Ratepayers' Share of Incremental Revenue (%) - % see Note 1142 ISO Ratepayers' Share of Incremental Revenue -$ = Line 40D * Line 41D43 Tot. ISO Ratepayers' Share NTP&S Gross Rev. -$ = Line 34D + Line 42D
Amount Calculation44 Total Revenue Credits: -$ Sum of Column D, Line 43 and Column G, Line 32
Notes:1-2-
3-4-5-6-7-
- % Source: ---8-
9-
10-
11-
12-
- % Source: ---13-14-15-
16- For subsidiaries that are subject to GRSM, Column D contains gross revenues. Input on Line 30D contains the associated expenses.17- Per GRC Decision D.87-12-066, for ratemaking purposes EMS financials are consolidated with SCE's. See FERC Form 1 page 123.3 under
"Equity Investment Differences" . Consequently, net income of EMS is not reported separately in FERC Form 1 and is not a part of FERC Account 418.1 totals.To ensure that ratepayers receive the net income from this subsidiary SCE includes EMS net income in the formula on line 28f. This amount is reversed as partof line 30 to remain consistent with the totals reported in FERC Form 1.
Southern States Realty is a subsidiary company. Gross revenues are not reported in FF-1, only net earnings. Net Earnings for Southern States Realty are reported on Acct 418.1, pg 225.17e.
Edison ESI is a subsidiary company. Gross revenues are not reported in FF-1, only net earnings. Net Earnings for ESI are reported on Acct 418.1, pg 225.5e.
Subject to sharing per the Gross Revenue Sharing Mechanism (GRSM), adopted in CPUC D.99-09-070. On an annual basis, once SCE obtains $16,671,389.55 (Threshold Revenue) in NTP&S Revenues, any additional revenues (Incremental Gross Revenues) that SCE receives are shared between shareholders and ratepayers. For GRSM categories deemed Active, the Incremental Gross Revenues are shared 90/10 between shareholders and ratepayers. For those categories deemed Passive, the Incremental Gross Revenues are shared 70/30 between shareholders and ratepayers.
418.1418.1
418.1
418.1 Subsidiaries Total
FF-1 Total for Account 418.1 -Equity in Earnings of Subsidiary Companies,
p117.36c (Must Equal Line 29 + 30)
418.1 Other (See Note 16)
418.1
Generation related.Non-ISO facilities related.
Subject to balancing account treatmentISO transmission system related.
ISO portion of Traditional OOR relates to monthly revenues received from customers for facilities that are part of the ISO network.
Mono Power Company is a subsidiary company. Net Earnings are reported on Acct 418.1, pg 225.11e. Revenues and costs shall be non-ISO.SCE Capital Company is a subsidiary company. Net Earnings are reported on Acct 418.1, pg 225.23e. Revenues and costs shall be non-ISO.
The first $16,671,389 million in gross revenues generated by GRSM activities are automatically classified as Threshold Revenue.Allocator is equal to the jurisdictional split of the Threshold Revenue, which is jurisdictionalized as $5.425M to FERC ratepayers and $11.246M to CPUC ratepayers per the 2009 CPUC General Rate Case (D. 09-03-025). The ISO ratepayers' share of ratepayer revenue is $5.425M/$16.671M = 32.54%.
ISO Allocator =
Allocated based on the CPUC Base Revenue Requirement Balancing Account (BRRBA) allocator in effect during the Prior Year. The weighted average (by time) shall be used if more than one allocator is in effect during the Prior Year. ISO portion of revenue is treated as traditional OOR.
418.1
CPUC Jurisdictional service related.
ISO Allocator =
Allocated based on CPUC GRC allocator in effect during the Prior Year. The weighted average (by time) shall be used if more than one allocator is in effect during the Prior Year.
21-RevenueCredits
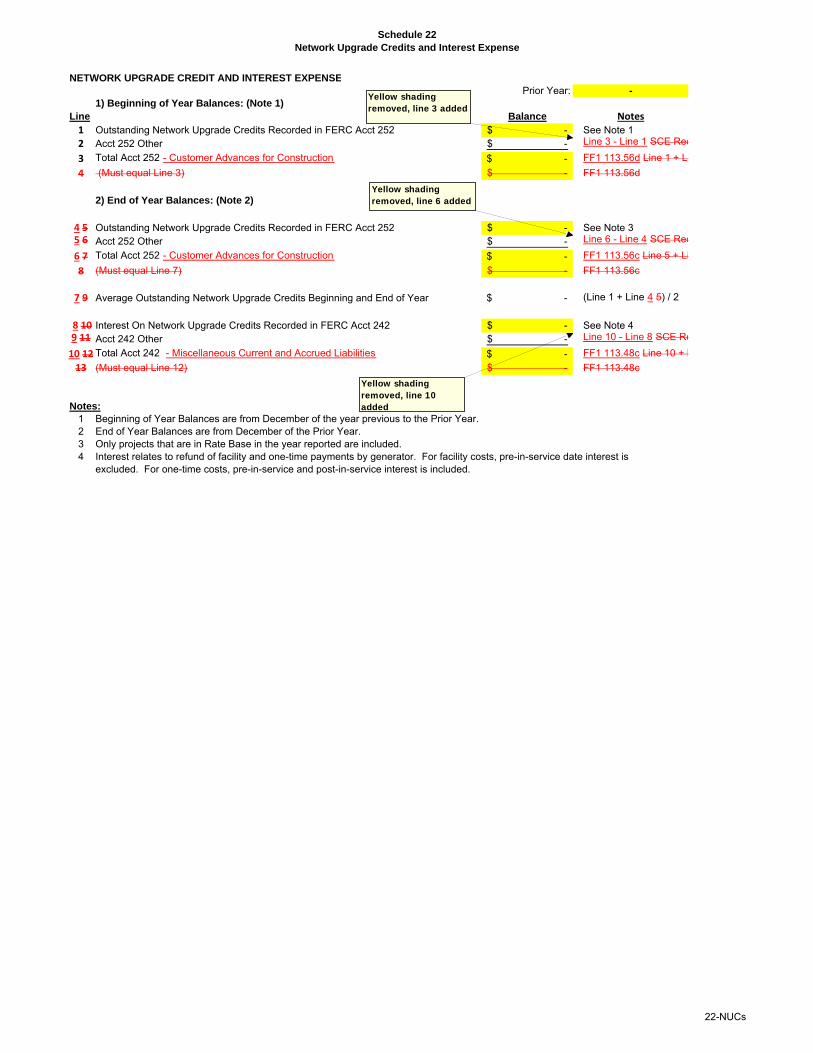
Schedule 22
Network Upgrade Credits and Interest Expense
NETWORK UPGRADE CREDIT AND INTEREST EXPENSE
Prior Year: -
1) Beginning of Year Balances: (Note 1)
Line Balance Notes1 Outstanding Network Upgrade Credits Recorded in FERC Acct 252 -$ See Note 12 Acct 252 Other -$ Line 3 - Line 1 SCE Rec
3 Total Acct 252 - Customer Advances for Construction -$ FF1 113.56d Line 1 + Li
4 -$ FF1 113.56d
2) End of Year Balances: (Note 2)
4 5 Outstanding Network Upgrade Credits Recorded in FERC Acct 252 -$ See Note 35 6 Acct 252 Other -$ Line 6 - Line 4 SCE Rec
6 7 Total Acct 252 - Customer Advances for Construction -$ FF1 113.56c Line 5 + Li
8 -$ FF1 113.56c
7 9 Average Outstanding Network Upgrade Credits Beginning and End of Year -$ (Line 1 + Line 4 5) / 2
8 10 Interest On Network Upgrade Credits Recorded in FERC Acct 242 -$ See Note 49 11 Acct 242 Other -$ Line 10 - Line 8 SCE Re
10 12 Total Acct 242 - Miscellaneous Current and Accrued Liabilities -$ FF1 113.48c Line 10 + L
13 -$ FF1 113.48c
Notes:
1 Beginning of Year Balances are from December of the year previous to the Prior Year.2 End of Year Balances are from December of the Prior Year.3 Only projects that are in Rate Base in the year reported are included.4 Interest relates to refund of facility and one-time payments by generator. For facility costs, pre-in-service date interest is
excluded. For one-time costs, pre-in-service and post-in-service interest is included.
(Must equal Line 3)
(Must equal Line 7)
(Must equal Line 12)
Yellow shading removed, line 3 added
Yellow shading removed, line 6 added
Yellow shading removed, line 10 added
22-NUCs
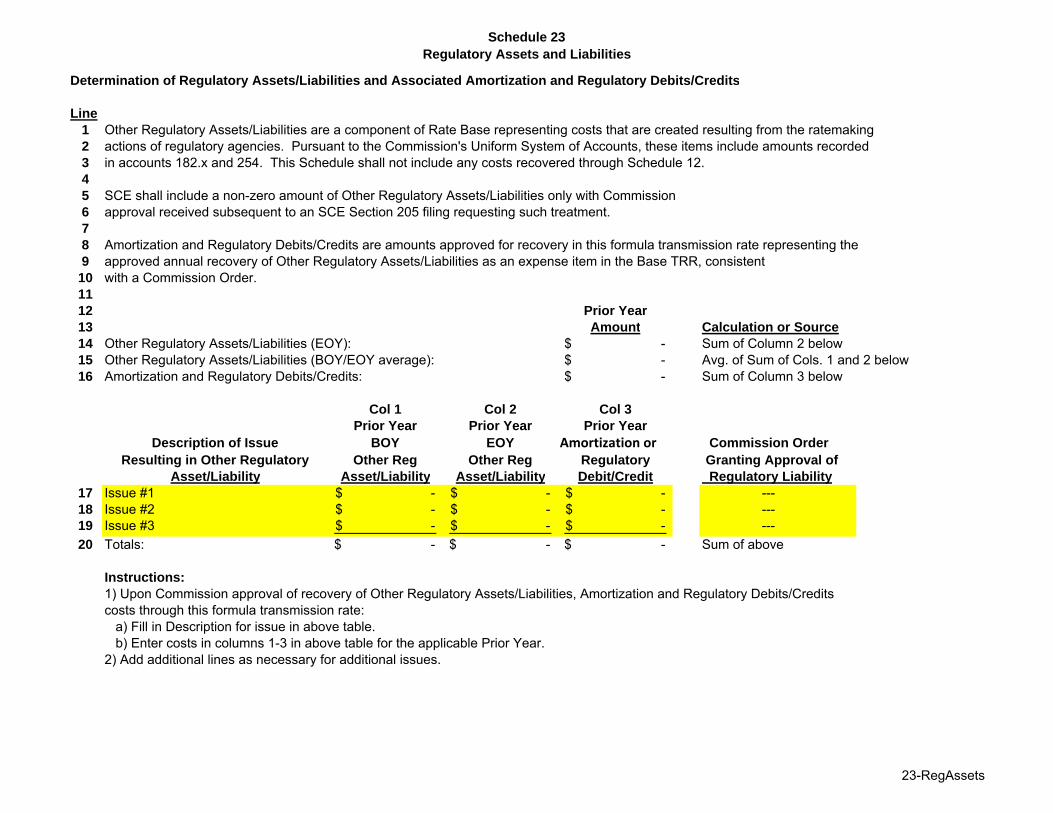
Schedule 23
Regulatory Assets and Liabilities
Determination of Regulatory Assets/Liabilities and Associated Amortization and Regulatory Debits/Credits
Line
1 Other Regulatory Assets/Liabilities are a component of Rate Base representing costs that are created resulting from the ratemaking2 actions of regulatory agencies. Pursuant to the Commission's Uniform System of Accounts, these items include amounts recorded 3 in accounts 182.x and 254. This Schedule shall not include any costs recovered through Schedule 12.4
5 SCE shall include a non-zero amount of Other Regulatory Assets/Liabilities only with Commission 6 approval received subsequent to an SCE Section 205 filing requesting such treatment.7
8 Amortization and Regulatory Debits/Credits are amounts approved for recovery in this formula transmission rate representing the9 approved annual recovery of Other Regulatory Assets/Liabilities as an expense item in the Base TRR, consistent10 with a Commission Order. 11
12 Prior Year
13 Amount Calculation or Source
14 Other Regulatory Assets/Liabilities (EOY): -$ Sum of Column 2 below15 Other Regulatory Assets/Liabilities (BOY/EOY average): -$ Avg. of Sum of Cols. 1 and 2 below16 Amortization and Regulatory Debits/Credits: -$ Sum of Column 3 below
Col 1 Col 2 Col 3
Prior Year Prior Year Prior Year
Description of Issue BOY EOY Amortization or Commission Order
Resulting in Other Regulatory Other Reg Other Reg Regulatory Granting Approval of
Asset/Liability Asset/Liability Asset/Liability Debit/Credit Regulatory Liability
17 Issue #1 -$ -$ -$ ---18 Issue #2 -$ -$ -$ ---19 Issue #3 -$ -$ -$ ---
20 Totals: -$ -$ -$ Sum of above
Instructions:
1) Upon Commission approval of recovery of Other Regulatory Assets/Liabilities, Amortization and Regulatory Debits/Creditscosts through this formula transmission rate:
a) Fill in Description for issue in above table.b) Enter costs in columns 1-3 in above table for the applicable Prior Year.
2) Add additional lines as necessary for additional issues.
23-RegAssets
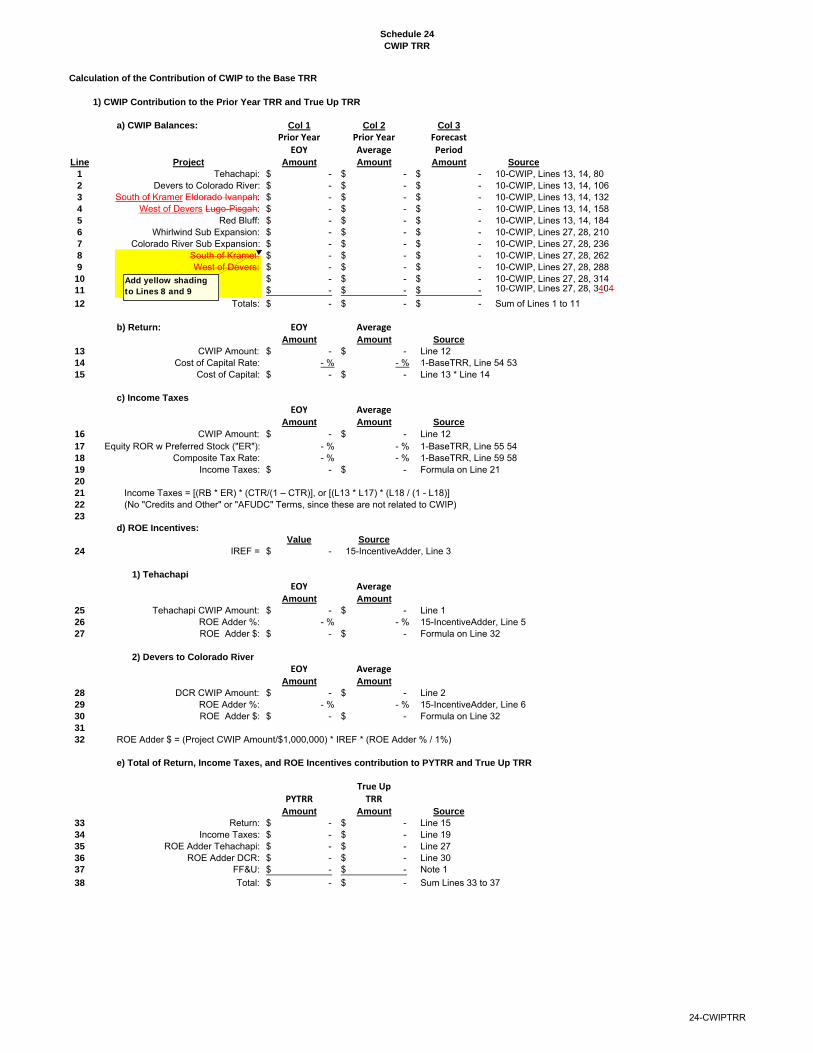
Schedule 24
CWIP TRR
Calculation of the Contribution of CWIP to the Base TRR
1) CWIP Contribution to the Prior Year TRR and True Up TRR
a) CWIP Balances: Col 1 Col 2 Col 3
Prior Year Prior Year ForecastEOY Average Period
Line Project Amount Amount Amount Source
1 Tehachapi: -$ -$ -$ 10-CWIP, Lines 13, 14, 802 Devers to Colorado River: -$ -$ -$ 10-CWIP, Lines 13, 14, 1063 South of Kramer Eldorado Ivanpah: -$ -$ -$ 10-CWIP, Lines 13, 14, 1324 West of Devers Lugo-Pisgah: -$ -$ -$ 10-CWIP, Lines 13, 14, 1585 Red Bluff: -$ -$ -$ 10-CWIP, Lines 13, 14, 1846 Whirlwind Sub Expansion: -$ -$ -$ 10-CWIP, Lines 27, 28, 2107 Colorado River Sub Expansion: -$ -$ -$ 10-CWIP, Lines 27, 28, 2368 South of Kramer: -$ -$ -$ 10-CWIP, Lines 27, 28, 2629 West of Devers: -$ -$ -$ 10-CWIP, Lines 27, 28, 28810 -$ -$ -$ 10-CWIP, Lines 27, 28, 31411 -$ -$ -$ 10-CWIP, Lines 27, 28, 3404
12 Totals: -$ -$ -$ Sum of Lines 1 to 11
b) Return: EOY AverageAmount Amount Source
13 CWIP Amount: -$ -$ Line 1214 Cost of Capital Rate: - % - % 1-BaseTRR, Line 54 5315 Cost of Capital: -$ -$ Line 13 * Line 14
c) Income Taxes
EOY AverageAmount Amount Source
16 CWIP Amount: -$ -$ Line 1217 Equity ROR w Preferred Stock ("ER"): - % - % 1-BaseTRR, Line 55 5418 Composite Tax Rate: - % - % 1-BaseTRR, Line 59 5819 Income Taxes: -$ -$ Formula on Line 2120
21 Income Taxes = [(RB * ER) * (CTR/(1 – CTR)], or [(L13 * L17) * (L18 / (1 - L18)]22 (No "Credits and Other" or "AFUDC" Terms, since these are not related to CWIP)23
d) ROE Incentives:
Value Source
24 IREF = -$ 15-IncentiveAdder, Line 3
1) Tehachapi
EOY AverageAmount Amount
25 Tehachapi CWIP Amount: -$ -$ Line 126 ROE Adder %: - % - % 15-IncentiveAdder, Line 527 ROE Adder $: -$ -$ Formula on Line 32
2) Devers to Colorado River
EOY AverageAmount Amount
28 DCR CWIP Amount: -$ -$ Line 229 ROE Adder %: - % - % 15-IncentiveAdder, Line 630 ROE Adder $: -$ -$ Formula on Line 3231
32 ROE Adder $ = (Project CWIP Amount/$1,000,000) * IREF * (ROE Adder % / 1%)
e) Total of Return, Income Taxes, and ROE Incentives contribution to PYTRR and True Up TRR
True UpPYTRR TRR
Amount Amount Source
33 Return: -$ -$ Line 1534 Income Taxes: -$ -$ Line 1935 ROE Adder Tehachapi: -$ -$ Line 2736 ROE Adder DCR: -$ -$ Line 3037 FF&U: -$ -$ Note 1
38 Total: -$ -$ Sum Lines 33 to 37
Add yellow shading to Lines 8 and 9
24-CWIPTRR
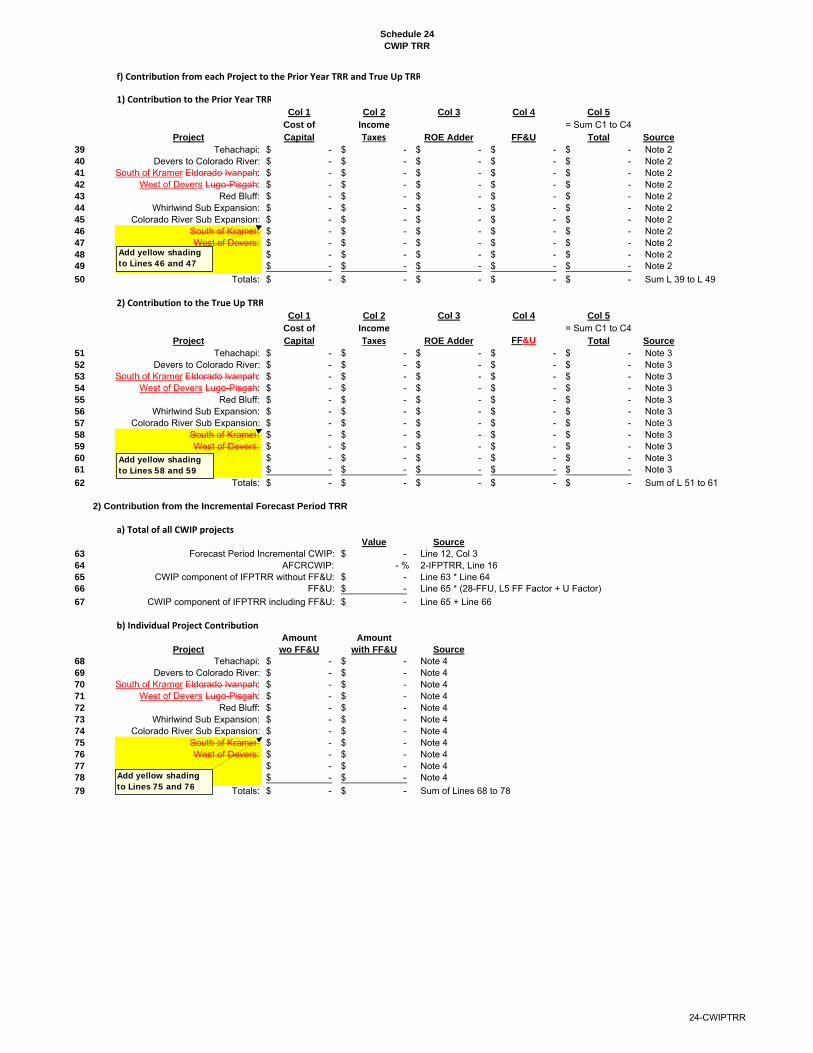
Schedule 24
CWIP TRR
f) Contribution from each Project to the Prior Year TRR and True Up TRR
1) Contribution to the Prior Year TRRCol 1 Col 2 Col 3 Col 4 Col 5
Cost of Income = Sum C1 to C4Project Capital Taxes ROE Adder FF&U Total Source
39 Tehachapi: -$ -$ -$ -$ -$ Note 240 Devers to Colorado River: -$ -$ -$ -$ -$ Note 241 South of Kramer Eldorado Ivanpah: -$ -$ -$ -$ -$ Note 242 West of Devers Lugo-Pisgah: -$ -$ -$ -$ -$ Note 243 Red Bluff: -$ -$ -$ -$ -$ Note 244 Whirlwind Sub Expansion: -$ -$ -$ -$ -$ Note 245 Colorado River Sub Expansion: -$ -$ -$ -$ -$ Note 246 South of Kramer: -$ -$ -$ -$ -$ Note 247 West of Devers: -$ -$ -$ -$ -$ Note 248 -$ -$ -$ -$ -$ Note 249 -$ -$ -$ -$ -$ Note 2
50 Totals: -$ -$ -$ -$ -$ Sum L 39 to L 49
2) Contribution to the True Up TRRCol 1 Col 2 Col 3 Col 4 Col 5
Cost of Income = Sum C1 to C4Project Capital Taxes ROE Adder FF&U Total Source
51 Tehachapi: -$ -$ -$ -$ -$ Note 352 Devers to Colorado River: -$ -$ -$ -$ -$ Note 353 South of Kramer Eldorado Ivanpah: -$ -$ -$ -$ -$ Note 354 West of Devers Lugo-Pisgah: -$ -$ -$ -$ -$ Note 355 Red Bluff: -$ -$ -$ -$ -$ Note 356 Whirlwind Sub Expansion: -$ -$ -$ -$ -$ Note 357 Colorado River Sub Expansion: -$ -$ -$ -$ -$ Note 358 South of Kramer: -$ -$ -$ -$ -$ Note 359 West of Devers: -$ -$ -$ -$ -$ Note 360 -$ -$ -$ -$ -$ Note 361 -$ -$ -$ -$ -$ Note 3
62 Totals: -$ -$ -$ -$ -$ Sum of L 51 to 61
2) Contribution from the Incremental Forecast Period TRR
a) Total of all CWIP projectsValue Source
63 Forecast Period Incremental CWIP: -$ Line 12, Col 364 AFCRCWIP: - % 2-IFPTRR, Line 1665 CWIP component of IFPTRR without FF&U: -$ Line 63 * Line 6466 FF&U: -$ Line 65 * (28-FFU, L5 FF Factor + U Factor)
67 CWIP component of IFPTRR including FF&U: -$ Line 65 + Line 66
b) Individual Project ContributionAmount Amount
Project wo FF&U with FF&U Source
68 Tehachapi: -$ -$ Note 469 Devers to Colorado River: -$ -$ Note 470 South of Kramer Eldorado Ivanpah: -$ -$ Note 471 West of Devers Lugo-Pisgah: -$ -$ Note 472 Red Bluff: -$ -$ Note 473 Whirlwind Sub Expansion: -$ -$ Note 474 Colorado River Sub Expansion: -$ -$ Note 475 South of Kramer: -$ -$ Note 476 West of Devers: -$ -$ Note 477 -$ -$ Note 478 -$ -$ Note 4
79 Totals: -$ -$ Sum of Lines 68 to 78
Add yellow shading to Lines 46 and 47
Add yellow shading to Lines 58 and 59
Add yellow shading to Lines 75 and 76
24-CWIPTRR
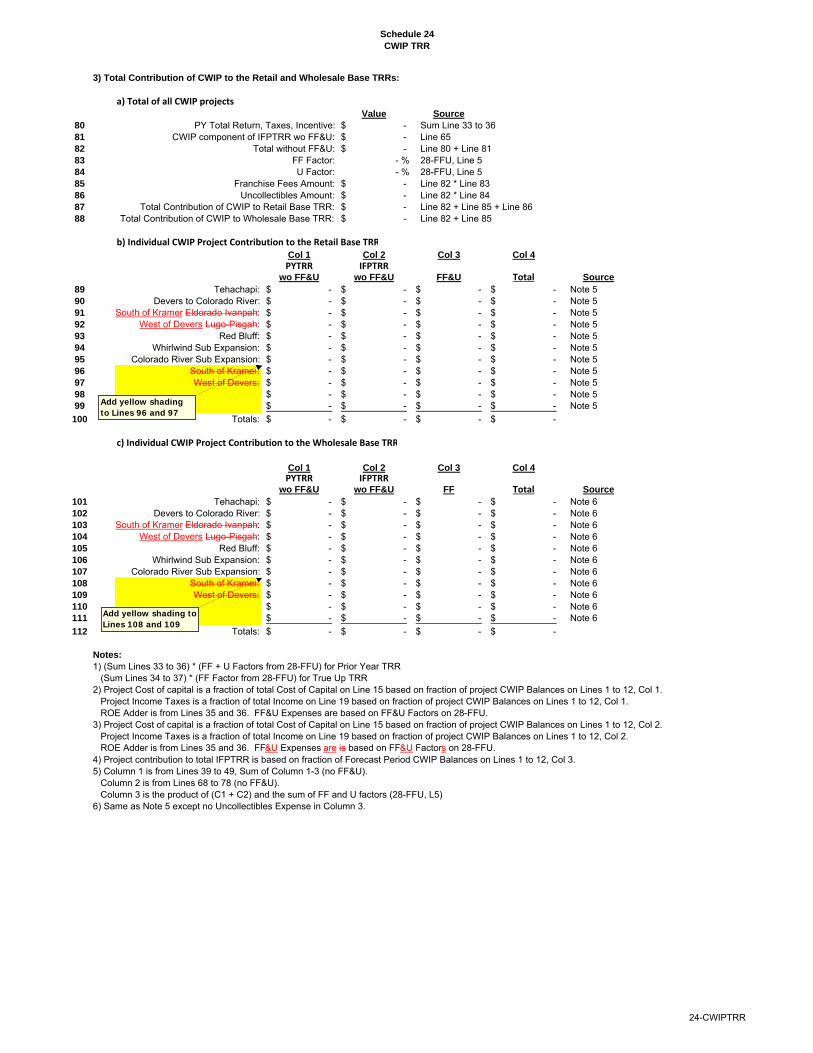
Schedule 24
CWIP TRR
3) Total Contribution of CWIP to the Retail and Wholesale Base TRRs:
a) Total of all CWIP projectsValue Source
80 PY Total Return, Taxes, Incentive: -$ Sum Line 33 to 3681 CWIP component of IFPTRR wo FF&U: -$ Line 6582 Total without FF&U: -$ Line 80 + Line 8183 FF Factor: - % 28-FFU, Line 584 U Factor: - % 28-FFU, Line 585 Franchise Fees Amount: -$ Line 82 * Line 8386 Uncollectibles Amount: -$ Line 82 * Line 8487 Total Contribution of CWIP to Retail Base TRR: -$ Line 82 + Line 85 + Line 8688 Total Contribution of CWIP to Wholesale Base TRR: -$ Line 82 + Line 85
b) Individual CWIP Project Contribution to the Retail Base TRRCol 1 Col 2 Col 3 Col 4
PYTRR IFPTRRwo FF&U wo FF&U FF&U Total Source
89 Tehachapi: -$ -$ -$ -$ Note 590 Devers to Colorado River: -$ -$ -$ -$ Note 591 South of Kramer Eldorado Ivanpah: -$ -$ -$ -$ Note 592 West of Devers Lugo-Pisgah: -$ -$ -$ -$ Note 593 Red Bluff: -$ -$ -$ -$ Note 594 Whirlwind Sub Expansion: -$ -$ -$ -$ Note 595 Colorado River Sub Expansion: -$ -$ -$ -$ Note 596 South of Kramer: -$ -$ -$ -$ Note 597 West of Devers: -$ -$ -$ -$ Note 598 -$ -$ -$ -$ Note 599 -$ -$ -$ -$ Note 5
100 Totals: -$ -$ -$ -$
c) Individual CWIP Project Contribution to the Wholesale Base TRR
Col 1 Col 2 Col 3 Col 4PYTRR IFPTRR
wo FF&U wo FF&U FF Total Source
101 Tehachapi: -$ -$ -$ -$ Note 6102 Devers to Colorado River: -$ -$ -$ -$ Note 6103 South of Kramer Eldorado Ivanpah: -$ -$ -$ -$ Note 6104 West of Devers Lugo-Pisgah: -$ -$ -$ -$ Note 6105 Red Bluff: -$ -$ -$ -$ Note 6106 Whirlwind Sub Expansion: -$ -$ -$ -$ Note 6107 Colorado River Sub Expansion: -$ -$ -$ -$ Note 6108 South of Kramer: -$ -$ -$ -$ Note 6109 West of Devers: -$ -$ -$ -$ Note 6110 -$ -$ -$ -$ Note 6111 -$ -$ -$ -$ Note 6
112 Totals: -$ -$ -$ -$
Notes:
1) (Sum Lines 33 to 36) * (FF + U Factors from 28-FFU) for Prior Year TRR(Sum Lines 34 to 37) * (FF Factor from 28-FFU) for True Up TRR
2) Project Cost of capital is a fraction of total Cost of Capital on Line 15 based on fraction of project CWIP Balances on Lines 1 to 12, Col 1.Project Income Taxes is a fraction of total Income on Line 19 based on fraction of project CWIP Balances on Lines 1 to 12, Col 1.ROE Adder is from Lines 35 and 36. FF&U Expenses are based on FF&U Factors on 28-FFU.
3) Project Cost of capital is a fraction of total Cost of Capital on Line 15 based on fraction of project CWIP Balances on Lines 1 to 12, Col 2.Project Income Taxes is a fraction of total Income on Line 19 based on fraction of project CWIP Balances on Lines 1 to 12, Col 2.ROE Adder is from Lines 35 and 36. FF&U Expenses are is based on FF&U Factors on 28-FFU.
4) Project contribution to total IFPTRR is based on fraction of Forecast Period CWIP Balances on Lines 1 to 12, Col 3.5) Column 1 is from Lines 39 to 49, Sum of Column 1-3 (no FF&U).
Column 2 is from Lines 68 to 78 (no FF&U).Column 3 is the product of (C1 + C2) and the sum of FF and U factors (28-FFU, L5)
6) Same as Note 5 except no Uncollectibles Expense in Column 3.
Add yellow shading to Lines 96 and 97
Add yellow shading to Lines 108 and 109
24-CWIPTRR

Schedule 25
Wholesale Differences to Base TRR
Calculation of Wholesale Difference to the Base TRR
Inputs are shaded yellowThe Wholesale Difference to the Base TRR represents the amount by which the Wholesale Base TRR differs as compared to the Retail Base TRR. This difference is attributable to differences in the following six items,as approved by Commission Order 86 FERC ¶ 63,014 in Docket No. ER97-2355.
These six items may affect the Base TRR by affecting Rate Base, or affecting an annual expense (amortization).If the annual amortization affects Income Taxes, there is an additional annual Income Tax Effect. The tablesummarizes these impacts for each item:
Expense
Rate Base (Amortization) Expense
Line Difference Difference Tax Impact
1 a) Depreciation Yes Yes No2 b) Taxes Deferred -Make Up Adjustment (South Georgia) Yes Yes Yes3 c) Excess Deferred Taxes Yes Yes Yes4 d) Taxes Deferred - Acct. 282 ACRS/MACRS Yes Yes No5 e) Uncollectibles Expense No Yes No6 f) EPRI and EEI Dues Expenses No Yes No
1) Calculation of Wholesale Rate Base Difference and Wholesale Rate Base Adjustment
a) Quantification of the Initial 2010 Wholesale Rate Base Difference and annual change
The difference between Retail and Wholesale Rate Base is attributable to the following four items, withwith the Initial Prior Year 2010 Rate Base differences and annual changes as follows:
Col 1 Col 2
2010 Rate Base
Difference Annual
Data (Wholesale Change
Source less Retail) (Amortization)7 1) Accumulated Depreciation Fixed values $31,556,000 -$2,176,3008 2) Taxes Deferred - Make Up Adjustment Fixed values -$35,044,000 $2,503,0009 3) Excess Deferred Taxes Fixed values -$624,650 $43,100
10 4) Taxes Deferred - Acct. 282 ACRS/MACRS Fixed values -$7,410,000 $511,20011 Totals: -$11,522,650 $881,000
b) Quantification of the Wholesale Rate Base Adjustment
The Wholesale Rate Base Adjustment represents the impact on the Wholesale Base TRR relative to the Retail Base TRR ofthe Wholesale Rate Base Difference for the Prior Year.
Data
Source Value Notes/Instructions
12 Fixed Charge Rate 2-IFPTRR Line 16 - % 113 Prior Year - 214 Wholesale Rate Base Difference for Prior Year -$ 315 Wholesale Rate Base Adjustment Line 14 * Line 12 -$
2) Calculation of Wholesale Expense Difference
The annual Wholesale Expense Difference impact is the negative of amounts stated in Lines 7 to 10 above, Column 2.It represents the effect on expenses (Wholesale less Retail) of amortizing the associated balances each year.If an annual amortization amount affects Income Taxes, the expense difference must be grossed up for income taxes.
a) Calculation of the Wholesale South Georgia Income Tax Adjustment to the TRR
Source Value
16 South Georgia Amortization Line 8 -$ 17 Composite Tax Rate ("CTR") 1-BaseTRR L 59 58 - %18 Tax Gross Up Factor (1/(1-CTR)) ---19 Wholesale South Georgia20 Income Tax Adjustment to the TRR: - Line 16 * Line 18 -$
b) Calculation of "Excess Deferred Taxes" Grossed Up for Income Taxes
Source Value
21 Annual Amort. of "Excess Deferred Taxes": Line 9 -$ 22 Tax Gross Up Factor Line 18 ---23 Excess Deferred Taxes Grossed Up for Income Taxes: - Line 21 * Line 22 -$ 24
25-WholesaleDifference
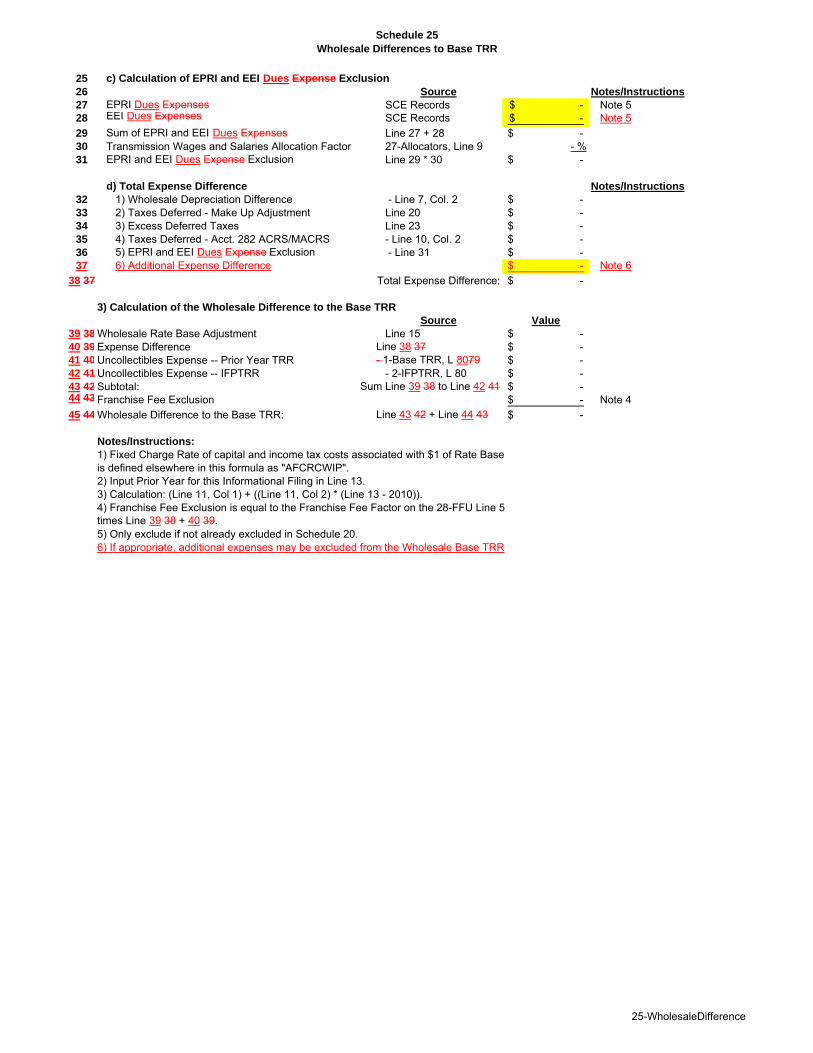
Schedule 25
Wholesale Differences to Base TRR
25 c) Calculation of EPRI and EEI Dues Expense Exclusion
26 Source Notes/Instructions
27 EPRI Dues Expenses SCE Records -$ Note 528 EEI Dues Expenses SCE Records -$ Note 5
29 Sum of EPRI and EEI Dues Expenses Line 27 + 28 -$ 30 Transmission Wages and Salaries Allocation Factor 27-Allocators, Line 9 - %31 EPRI and EEI Dues Expense Exclusion Line 29 * 30 -$
d) Total Expense Difference Notes/Instructions
32 1) Wholesale Depreciation Difference - Line 7, Col. 2 -$ 33 2) Taxes Deferred - Make Up Adjustment Line 20 -$ 34 3) Excess Deferred Taxes Line 23 -$ 35 4) Taxes Deferred - Acct. 282 ACRS/MACRS - Line 10, Col. 2 -$ 36 5) EPRI and EEI Dues Expense Exclusion - Line 31 -$ 37 6) Additional Expense Difference -$ Note 6
38 37 Total Expense Difference: -$
3) Calculation of the Wholesale Difference to the Base TRR
Source Value
39 38 Wholesale Rate Base Adjustment Line 15 -$ 40 39 Expense Difference Line 38 37 -$ 41 40 Uncollectibles Expense -- Prior Year TRR - 1-Base TRR, L 8079 -$ 42 41 Uncollectibles Expense -- IFPTRR - 2-IFPTRR, L 80 -$ 43 42 Subtotal: Sum Line 39 38 to Line 42 41 -$ 44 43 Franchise Fee Exclusion -$ Note 4
45 44 Wholesale Difference to the Base TRR: Line 43 42 + Line 44 43 -$
Notes/Instructions:
1) Fixed Charge Rate of capital and income tax costs associated with $1 of Rate Baseis defined elsewhere in this formula as "AFCRCWIP".2) Input Prior Year for this Informational Filing in Line 13.3) Calculation: (Line 11, Col 1) + ((Line 11, Col 2) * (Line 13 - 2010)).4) Franchise Fee Exclusion is equal to the Franchise Fee Factor on the 28-FFU Line 5times Line 39 38 + 40 39.5) Only exclude if not already excluded in Schedule 20.6) If appropriate, additional expenses may be excluded from the Wholesale Base TRR
25-WholesaleDifference
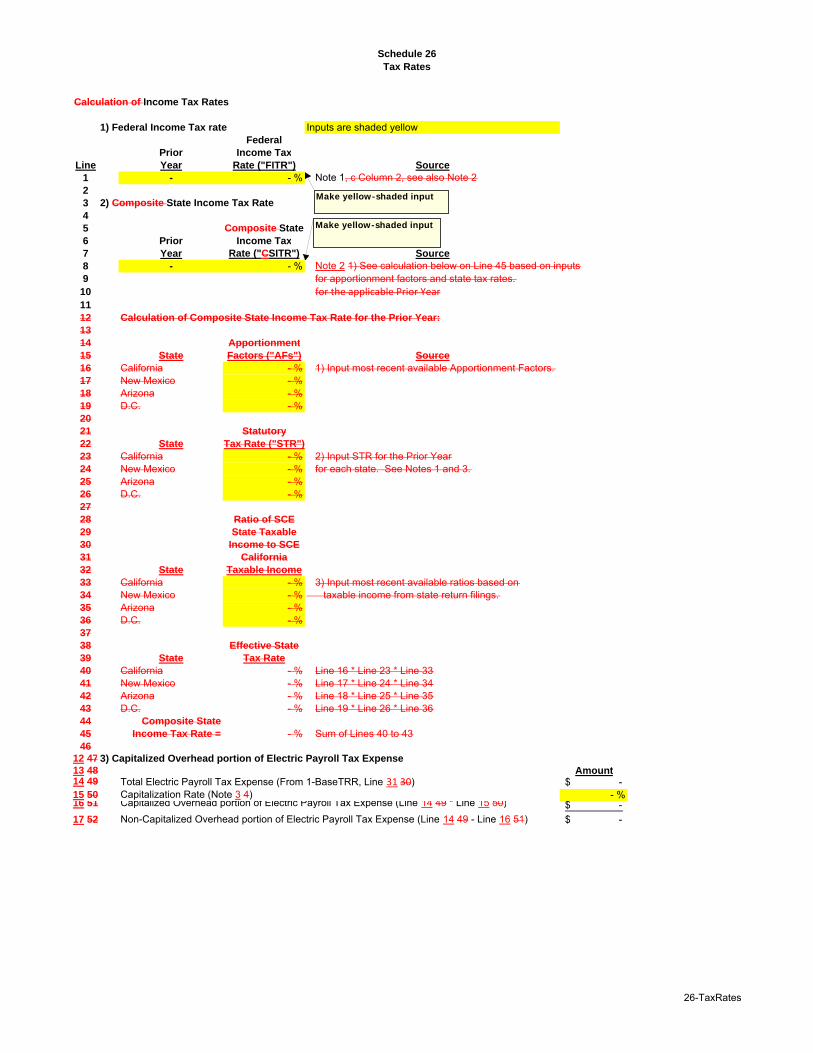
Schedule 26
Tax Rates
Calculation of Income Tax Rates
1) Federal Income Tax rate Inputs are shaded yellowFederal
Prior Income Tax
Line Year Rate ("FITR") Source
1 - - % Note 1, c Column 2, see also Note 22
3 2) Composite State Income Tax Rate
4
5 Composite State
6 Prior Income Tax
7 Year Rate ("CSITR") Source
8 - - % Note 2 1) See calculation below on Line 45 based on inputs9 for apportionment factors and state tax rates.
10 for the applicable Prior Year11
12 Calculation of Composite State Income Tax Rate for the Prior Year:
13
14 Apportionment
15 State Factors ("AFs") Source
16 California - % 1) Input most recent available Apportionment Factors.17 New Mexico - %18 Arizona - %19 D.C. - %20
21 Statutory
22 State Tax Rate ("STR")
23 California - % 2) Input STR for the Prior Year24 New Mexico - % for each state. See Notes 1 and 3.25 Arizona - %26 D.C. - %27
28 Ratio of SCE
29 State Taxable
30 Income to SCE
31 California
32 State Taxable Income
33 California - % 3) Input most recent available ratios based on34 New Mexico - % taxable income from state return filings.35 Arizona - %36 D.C. - %37
38 Effective State
39 State Tax Rate
40 California - % Line 16 * Line 23 * Line 3341 New Mexico - % Line 17 * Line 24 * Line 3442 Arizona - % Line 18 * Line 25 * Line 3543 D.C. - % Line 19 * Line 26 * Line 3644 Composite State
45 Income Tax Rate = - % Sum of Lines 40 to 4346
12 47 3) Capitalized Overhead portion of Electric Payroll Tax Expense
13 48 Amount14 49 Total Electric Payroll Tax Expense (From 1-BaseTRR, Line 31 30) -$ 15 50 Capitalization Rate (Note 3 4) - %16 51 Capitalized Overhead portion of Electric Payroll Tax Expense (Line 14 49 * Line 15 50) -$
17 52 Non-Capitalized Overhead portion of Electric Payroll Tax Expense (Line 14 49 - Line 16 51) -$
Make yellow-shaded input
Make yellow-shaded input
26-TaxRates
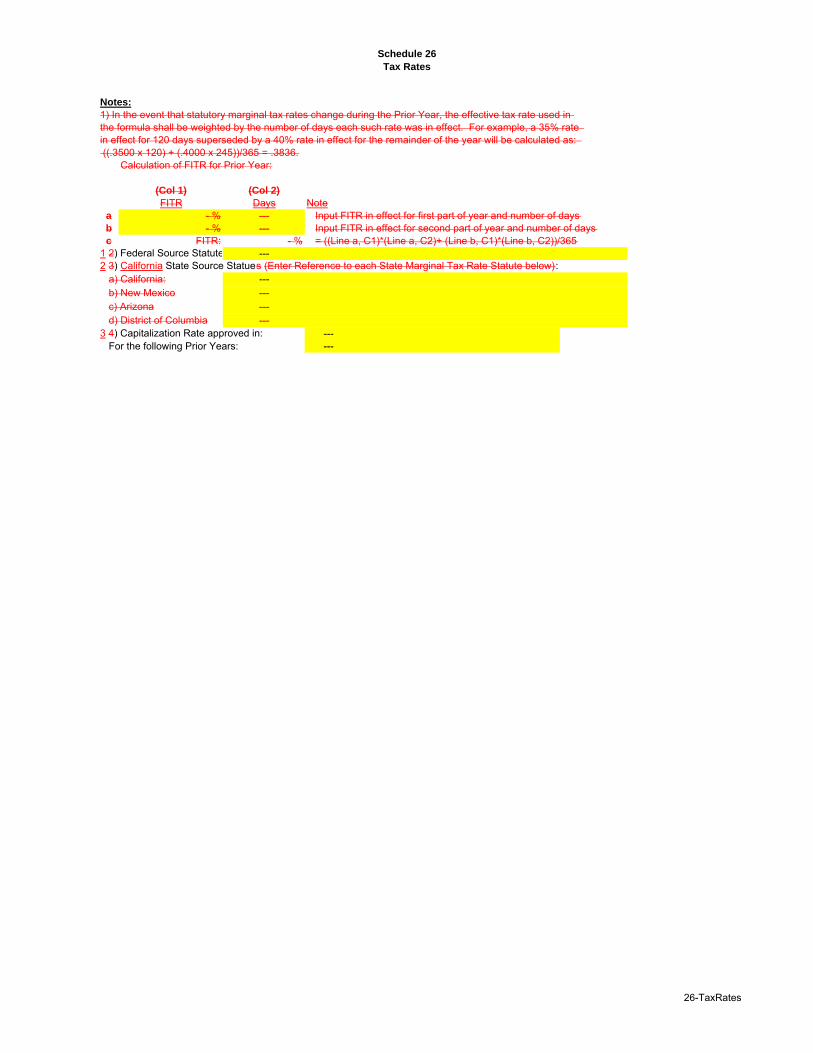
Schedule 26
Tax Rates
Notes:
1) In the event that statutory marginal tax rates change during the Prior Year, the effective tax rate used inthe formula shall be weighted by the number of days each such rate was in effect. For example, a 35% rate in effect for 120 days superseded by a 40% rate in effect for the remainder of the year will be calculated as: ((.3500 x 120) + (.4000 x 245))/365 = .3836.
Calculation of FITR for Prior Year:
(Col 1) (Col 2)
FITR Days Notea - % --- Input FITR in effect for first part of year and number of daysb - % --- Input FITR in effect for second part of year and number of daysc FITR: - % = ((Line a, C1)*(Line a, C2)+ (Line b, C1)*(Line b, C2))/365
1 2) Federal Source Statute ---2 3) California State Source Statues (Enter Reference to each State Marginal Tax Rate Statute below):
a) California: ---b) New Mexico ---c) Arizona ---d) District of Columbia ---
3 4) Capitalization Rate approved in: ---For the following Prior Years: ---
26-TaxRates
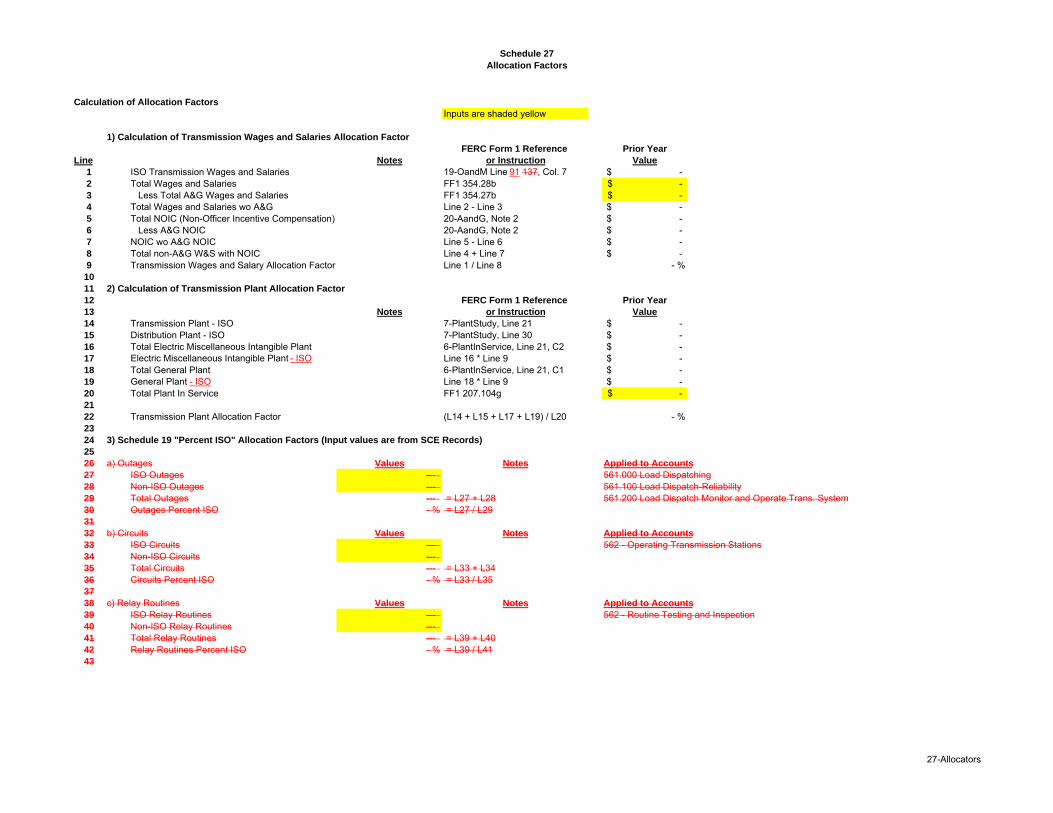
Schedule 27
Allocation Factors
Calculation of Allocation Factors
Inputs are shaded yellow
1) Calculation of Transmission Wages and Salaries Allocation Factor
FERC Form 1 Reference Prior Year
Line Notes or Instruction Value
1 ISO Transmission Wages and Salaries 19-OandM Line 91 137, Col. 7 -$ 2 Total Wages and Salaries FF1 354.28b -$ 3 Less Total A&G Wages and Salaries FF1 354.27b -$ 4 Total Wages and Salaries wo A&G Line 2 - Line 3 -$ 5 Total NOIC (Non-Officer Incentive Compensation) 20-AandG, Note 2 -$ 6 Less A&G NOIC 20-AandG, Note 2 -$ 7 NOIC wo A&G NOIC Line 5 - Line 6 -$ 8 Total non-A&G W&S with NOIC Line 4 + Line 7 -$ 9 Transmission Wages and Salary Allocation Factor Line 1 / Line 8 - %10
11 2) Calculation of Transmission Plant Allocation Factor
12 FERC Form 1 Reference Prior Year
13 Notes or Instruction Value
14 Transmission Plant - ISO 7-PlantStudy, Line 21 -$ 15 Distribution Plant - ISO 7-PlantStudy, Line 30 -$ 16 Total Electric Miscellaneous Intangible Plant 6-PlantInService, Line 21, C2 -$ 17 Electric Miscellaneous Intangible Plant - ISO Line 16 * Line 9 -$ 18 Total General Plant 6-PlantInService, Line 21, C1 -$ 19 General Plant - ISO Line 18 * Line 9 -$ 20 Total Plant In Service FF1 207.104g -$ 21
22 Transmission Plant Allocation Factor (L14 + L15 + L17 + L19) / L20 - %23
24 3) Schedule 19 "Percent ISO" Allocation Factors (Input values are from SCE Records)
25
26 a) Outages Values Notes Applied to Accounts
27 ISO Outages --- 561.000 Load Dispatching28 Non-ISO Outages --- 561.100 Load Dispatch-Reliability29 Total Outages --- = L27 + L28 561.200 Load Dispatch Monitor and Operate Trans. System30 Outages Percent ISO - % = L27 / L2931
32 b) Circuits Values Notes Applied to Accounts
33 ISO Circuits --- 562 - Operating Transmission Stations34 Non-ISO Circuits --- 35 Total Circuits --- = L33 + L3436 Circuits Percent ISO - % = L33 / L3537
38 c) Relay Routines Values Notes Applied to Accounts
39 ISO Relay Routines --- 562 - Routine Testing and Inspection40 Non-ISO Relay Routines --- 41 Total Relay Routines --- = L39 + L4042 Relay Routines Percent ISO - % = L39 / L4143
27-Allocators
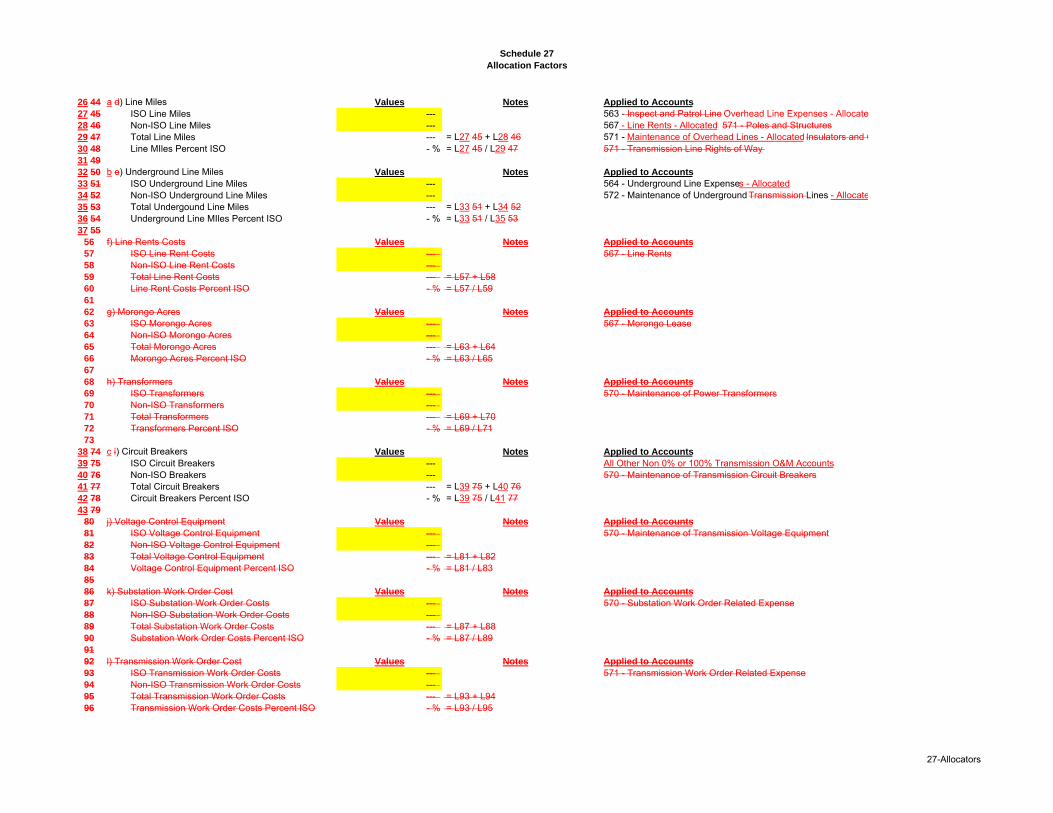
Schedule 27
Allocation Factors
26 44 a d) Line Miles Values Notes Applied to Accounts
27 45 ISO Line Miles --- 563 - Inspect and Patrol Line Overhead Line Expenses - Allocate28 46 Non-ISO Line Miles --- 567 - Line Rents - Allocated 571 - Poles and Structures29 47 Total Line Miles --- = L27 45 + L28 46 571 - Maintenance of Overhead Lines - Allocated Insulators and C30 48 Line MIles Percent ISO - % = L27 45 / L29 47 571 - Transmission Line Rights of Way 31 49
32 50 b e) Underground Line Miles Values Notes Applied to Accounts
33 51 ISO Underground Line Miles --- 564 - Underground Line Expenses - Allocated34 52 Non-ISO Underground Line Miles --- 572 - Maintenance of Underground Transmission Lines - Allocate35 53 Total Undergound Line Miles --- = L33 51 + L34 5236 54 Underground Line MIles Percent ISO - % = L33 51 / L35 5337 55
56 f) Line Rents Costs Values Notes Applied to Accounts
57 ISO Line Rent Costs --- 567 - Line Rents58 Non-ISO Line Rent Costs --- 59 Total Line Rent Costs --- = L57 + L5860 Line Rent Costs Percent ISO - % = L57 / L5961
62 g) Morongo Acres Values Notes Applied to Accounts
63 ISO Morongo Acres --- 567 - Morongo Lease64 Non-ISO Morongo Acres --- 65 Total Morongo Acres --- = L63 + L6466 Morongo Acres Percent ISO - % = L63 / L6567
68 h) Transformers Values Notes Applied to Accounts
69 ISO Transformers --- 570 - Maintenance of Power Transformers70 Non-ISO Transformers --- 71 Total Transformers --- = L69 + L7072 Transformers Percent ISO - % = L69 / L7173
38 74 c i) Circuit Breakers Values Notes Applied to Accounts
39 75 ISO Circuit Breakers --- All Other Non 0% or 100% Transmission O&M Accounts40 76 Non-ISO Breakers --- 570 - Maintenance of Transmission Circuit Breakers41 77 Total Circuit Breakers --- = L39 75 + L40 7642 78 Circuit Breakers Percent ISO - % = L39 75 / L41 7743 79
80 j) Voltage Control Equipment Values Notes Applied to Accounts
81 ISO Voltage Control Equipment --- 570 - Maintenance of Transmission Voltage Equipment82 Non-ISO Voltage Control Equipment --- 83 Total Voltage Control Equipment --- = L81 + L8284 Voltage Control Equipment Percent ISO - % = L81 / L8385
86 k) Substation Work Order Cost Values Notes Applied to Accounts
87 ISO Substation Work Order Costs --- 570 - Substation Work Order Related Expense88 Non-ISO Substation Work Order Costs --- 89 Total Substation Work Order Costs --- = L87 + L8890 Substation Work Order Costs Percent ISO - % = L87 / L8991
92 l) Transmission Work Order Cost Values Notes Applied to Accounts
93 ISO Transmission Work Order Costs --- 571 - Transmission Work Order Related Expense94 Non-ISO Transmission Work Order Costs --- 95 Total Transmission Work Order Costs --- = L93 + L9496 Transmission Work Order Costs Percent ISO - % = L93 / L95
27-Allocators
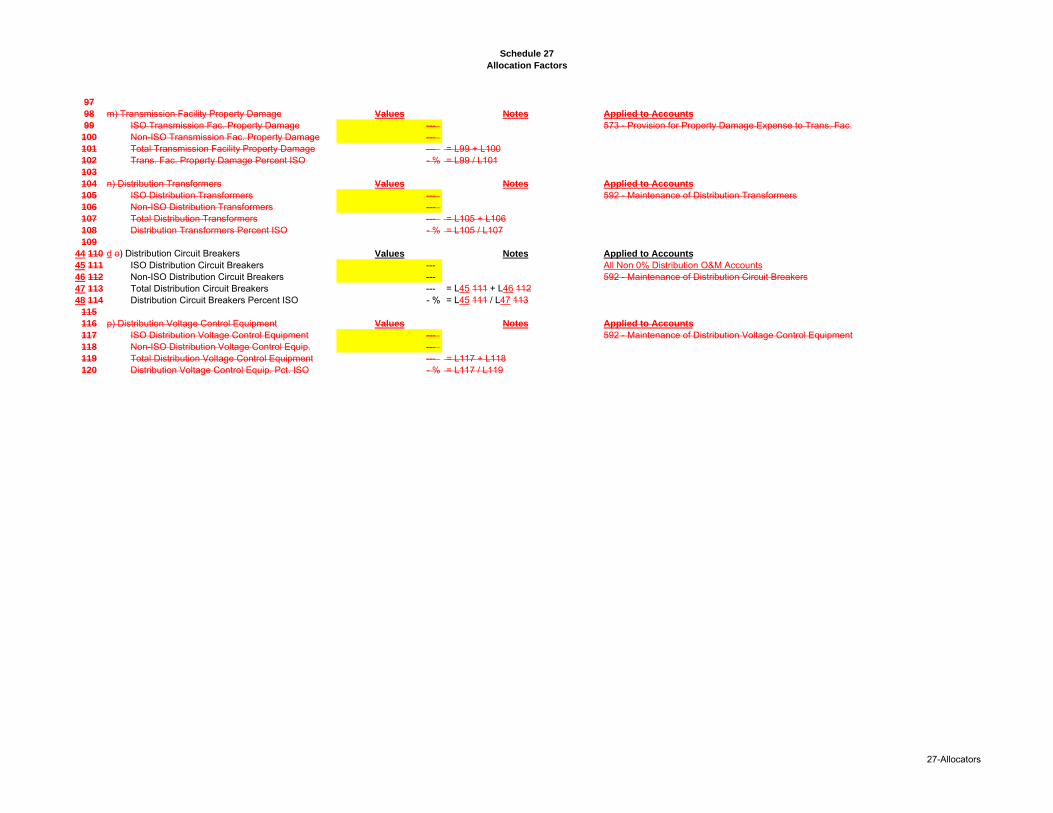
Schedule 27
Allocation Factors
97
98 m) Transmission Facility Property Damage Values Notes Applied to Accounts
99 ISO Transmission Fac. Property Damage --- 573 - Provision for Property Damage Expense to Trans. Fac.100 Non-ISO Transmission Fac. Property Damage --- 101 Total Transmission Facility Property Damage --- = L99 + L100102 Trans. Fac. Property Damage Percent ISO - % = L99 / L101103
104 n) Distribution Transformers Values Notes Applied to Accounts
105 ISO Distribution Transformers --- 592 - Maintenance of Distribution Transformers106 Non-ISO Distribution Transformers --- 107 Total Distribution Transformers --- = L105 + L106108 Distribution Transformers Percent ISO - % = L105 / L107109
44 110 d o) Distribution Circuit Breakers Values Notes Applied to Accounts
45 111 ISO Distribution Circuit Breakers --- All Non 0% Distribution O&M Accounts46 112 Non-ISO Distribution Circuit Breakers --- 592 - Maintenance of Distribution Circuit Breakers47 113 Total Distribution Circuit Breakers --- = L45 111 + L46 11248 114 Distribution Circuit Breakers Percent ISO - % = L45 111 / L47 113
115
116 p) Distribution Voltage Control Equipment Values Notes Applied to Accounts
117 ISO Distribution Voltage Control Equipment --- 592 - Maintenance of Distribution Voltage Control Equipment118 Non-ISO Distribution Voltage Control Equip. --- 119 Total Distribution Voltage Control Equipment --- = L117 + L118120 Distribution Voltage Control Equip. Pct. ISO - % = L117 / L119
27-Allocators
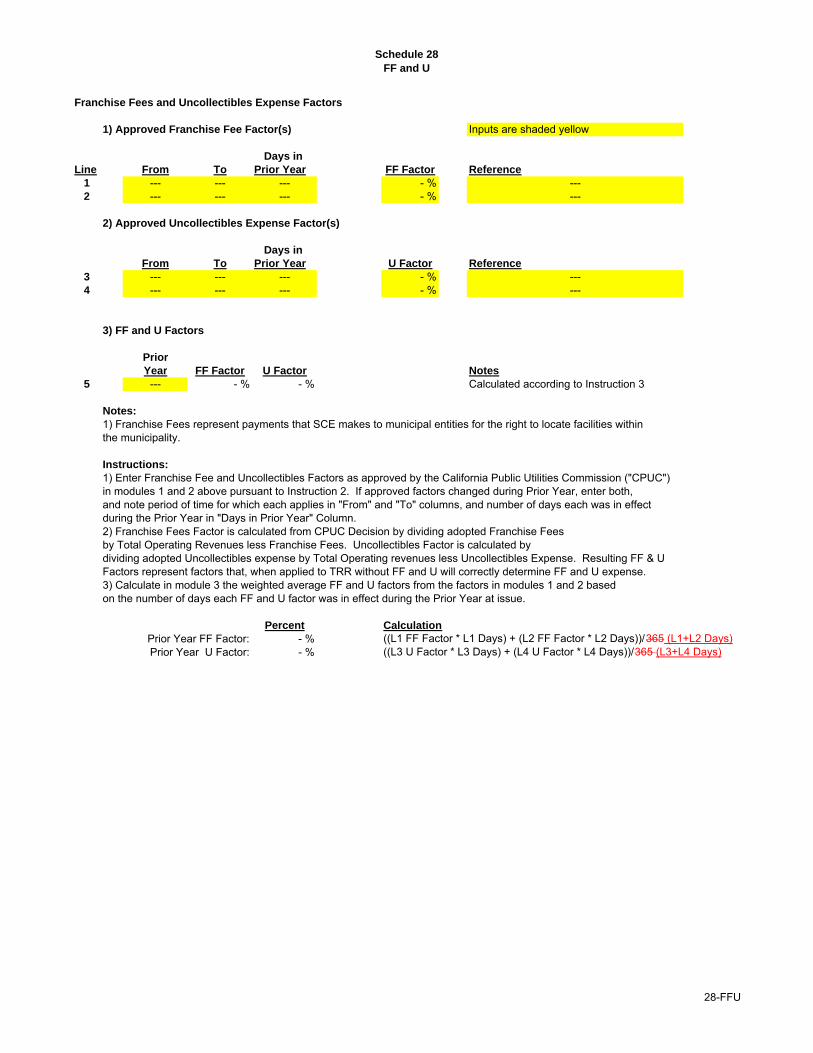
Schedule 28
FF and U
Franchise Fees and Uncollectibles Expense Factors
1) Approved Franchise Fee Factor(s) Inputs are shaded yellow
Days in
Line From To Prior Year FF Factor Reference
1 --- --- --- - % ---2 --- --- --- - % ---
2) Approved Uncollectibles Expense Factor(s)
Days in
From To Prior Year U Factor Reference
3 --- --- --- - % ---4 --- --- --- - % ---
3) FF and U Factors
Prior
Year FF Factor U Factor Notes
5 --- - % - % Calculated according to Instruction 3
Notes:
1) Franchise Fees represent payments that SCE makes to municipal entities for the right to locate facilities within the municipality.
Instructions:
1) Enter Franchise Fee and Uncollectibles Factors as approved by the California Public Utilities Commission ("CPUC")in modules 1 and 2 above pursuant to Instruction 2. If approved factors changed during Prior Year, enter both,and note period of time for which each applies in "From" and "To" columns, and number of days each was in effectduring the Prior Year in "Days in Prior Year" Column.2) Franchise Fees Factor is calculated from CPUC Decision by dividing adopted Franchise Feesby Total Operating Revenues less Franchise Fees. Uncollectibles Factor is calculated by dividing adopted Uncollectibles expense by Total Operating revenues less Uncollectibles Expense. Resulting FF & UFactors represent factors that, when applied to TRR without FF and U will correctly determine FF and U expense.3) Calculate in module 3 the weighted average FF and U factors from the factors in modules 1 and 2 basedon the number of days each FF and U factor was in effect during the Prior Year at issue.
Percent Calculation
Prior Year FF Factor: - % ((L1 FF Factor * L1 Days) + (L2 FF Factor * L2 Days))/365 (L1+L2 Days)Prior Year U Factor: - % ((L3 U Factor * L3 Days) + (L4 U Factor * L4 Days))/365 (L3+L4 Days)
28-FFU

Schedule 29
Wholesale TRRs
CALCULATION OF SCE WHOLESALE HIGH AND LOW VOLTAGE TRRS
Inputs are shaded yellowLine TRR Values Notes Source
1 -$ = Wholesale Base TRR 1-BaseTRR, Line 892 -$ = Total Wholesale TRBAA Note 1 ---3 -$ = HV Wholesale TRBAA ---4 -$ = LV Wholesale TRBAA ---5 -$ = Total Standby Transmission Revenues Note 2 SCE Retail Standby Rate Revenue6 - % = HV Allocation Factor 31-HVLV, Line 377 - % = LV Allocation Factor 31-HVLV, Line 37
Calculation of Total High Voltage and Low Voltage components of Wholesale TRR
Col 1 Col 2 Col 3
High Low
TOTAL Voltage Voltage Source
8 Wholesale Base TRR: -$ -$ -$ See Note 39 CWIP Component of Wholesale Base TRR: -$ -$ -$ See Note 4
10 Non-CWIP Component of Wholesale Base TRR: -$ -$ -$ See Note 5
11 Wholesale TRBAA: -$ -$ -$ Lines 2 to 4
12 Less Standby Transmission Revenues: -$ -$ -$ See Note 6
Components of Wholesale
13 Transmission Revenue Requirement: -$ -$ -$ Sum of Lines 8, 11, and 12
Notes:
1) TRBAA is "Transmission Revenue Balancing Account Adjustment". The TRBAA is determined pursuant to SCE's Transmission Owner Tariff and may be revised each January 1, upon commission acceptance of a revised TRBAAamount, or upon the date the Commission orders.2) From 33-RetailRates. See Line: ---3) Column 1 is from Line 1.
Column 2 equals Column 1 * Line 6.Column 3 equals Column 1 * Line 7.
4) From 24-CWIPTRR, Line 88. All High Voltage.5) Line 8 - Line 96) Column 1 is from Line 5.
Column 2 equals Column 1 * Line 6.Column 3 equals Column 1 * Line 7.
29-WholesaleTRRs
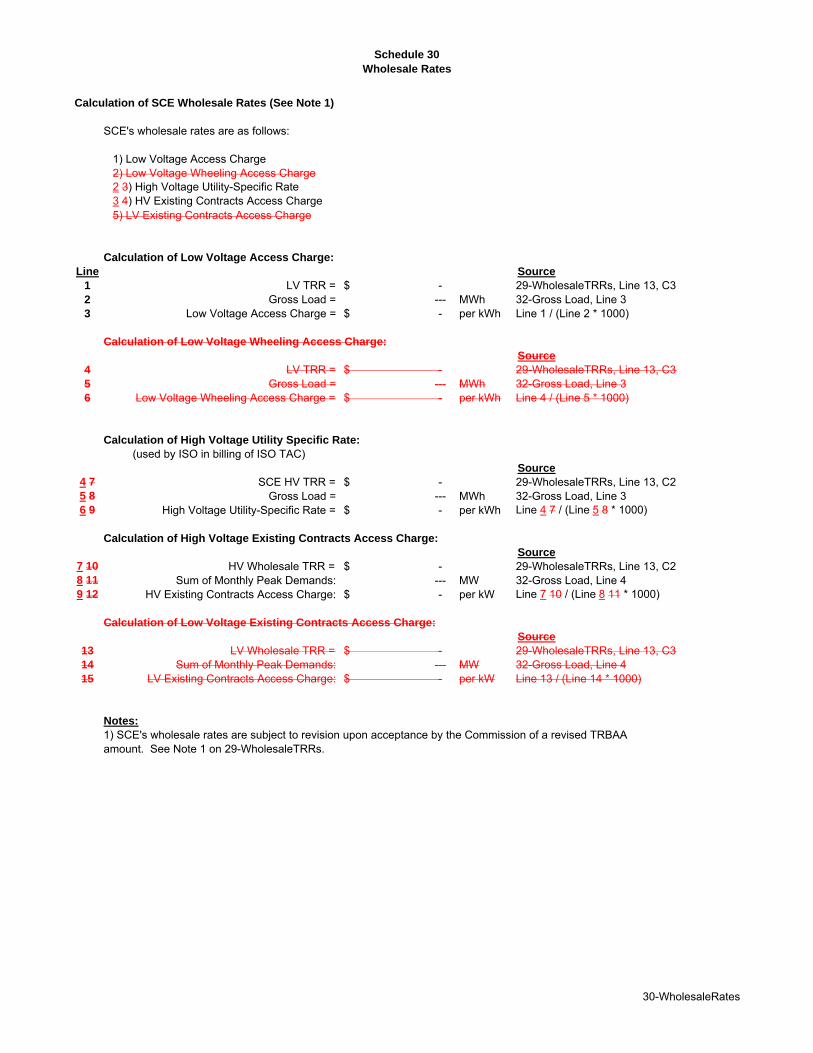
Schedule 30
Wholesale Rates
Calculation of SCE Wholesale Rates (See Note 1)
SCE's wholesale rates are as follows:
1) Low Voltage Access Charge2) Low Voltage Wheeling Access Charge2 3) High Voltage Utility-Specific Rate3 4) HV Existing Contracts Access Charge5) LV Existing Contracts Access Charge
Calculation of Low Voltage Access Charge:
Line Source
1 LV TRR = -$ 29-WholesaleTRRs, Line 13, C32 Gross Load = --- MWh 32-Gross Load, Line 33 Low Voltage Access Charge = -$ per kWh Line 1 / (Line 2 * 1000)
Calculation of Low Voltage Wheeling Access Charge:
Source
4 LV TRR = -$ 29-WholesaleTRRs, Line 13, C35 Gross Load = --- MWh 32-Gross Load, Line 36 Low Voltage Wheeling Access Charge = -$ per kWh Line 4 / (Line 5 * 1000)
Calculation of High Voltage Utility Specific Rate:
(used by ISO in billing of ISO TAC)Source
4 7 SCE HV TRR = -$ 29-WholesaleTRRs, Line 13, C25 8 Gross Load = --- MWh 32-Gross Load, Line 36 9 High Voltage Utility-Specific Rate = -$ per kWh Line 4 7 / (Line 5 8 * 1000)
Calculation of High Voltage Existing Contracts Access Charge:
Source
7 10 HV Wholesale TRR = -$ 29-WholesaleTRRs, Line 13, C28 11 Sum of Monthly Peak Demands: --- MW 32-Gross Load, Line 49 12 HV Existing Contracts Access Charge: -$ per kW Line 7 10 / (Line 8 11 * 1000)
Calculation of Low Voltage Existing Contracts Access Charge:
Source
13 LV Wholesale TRR = -$ 29-WholesaleTRRs, Line 13, C314 Sum of Monthly Peak Demands: --- MW 32-Gross Load, Line 415 LV Existing Contracts Access Charge: -$ per kW Line 13 / (Line 14 * 1000)
Notes:
1) SCE's wholesale rates are subject to revision upon acceptance by the Commission of a revised TRBAAamount. See Note 1 on 29-WholesaleTRRs.
30-WholesaleRates
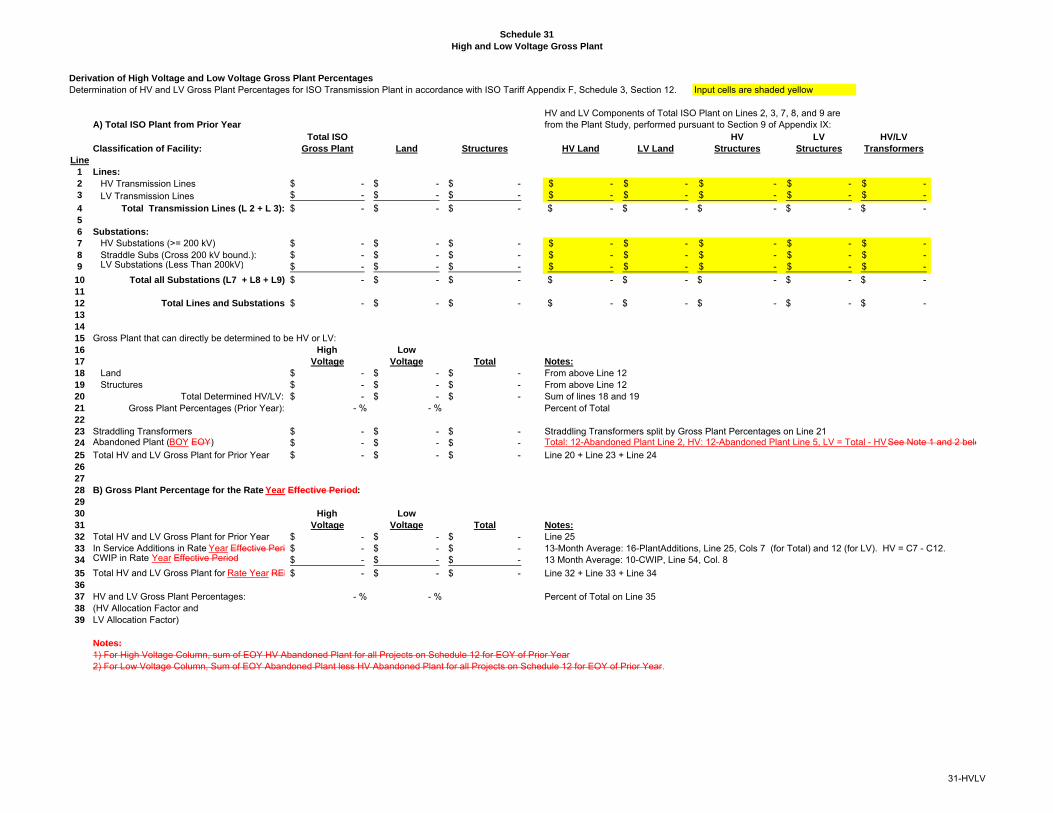
Schedule 31
High and Low Voltage Gross Plant
Derivation of High Voltage and Low Voltage Gross Plant Percentages
Determination of HV and LV Gross Plant Percentages for ISO Transmission Plant in accordance with ISO Tariff Appendix F, Schedule 3, Section 12. Input cells are shaded yellow
HV and LV Components of Total ISO Plant on Lines 2, 3, 7, 8, and 9 areA) Total ISO Plant from Prior Year from the Plant Study, performed pursuant to Section 9 of Appendix IX:
Total ISO HV LV HV/LV
Classification of Facility: Gross Plant Land Structures HV Land LV Land Structures Structures Transformers
Line
1 Lines:
2 HV Transmission Lines -$ -$ -$ -$ -$ -$ -$ -$ 3 LV Transmission Lines -$ -$ -$ -$ -$ -$ -$ -$
4 Total Transmission Lines (L 2 + L 3): -$ -$ -$ -$ -$ -$ -$ -$ 5
6 Substations:
7 HV Substations (>= 200 kV) -$ -$ -$ -$ -$ -$ -$ -$ 8 Straddle Subs (Cross 200 kV bound.): -$ -$ -$ -$ -$ -$ -$ -$ 9 LV Substations (Less Than 200kV) -$ -$ -$ -$ -$ -$ -$ -$
10 Total all Substations (L7 + L8 + L9) -$ -$ -$ -$ -$ -$ -$ -$ 11
12 Total Lines and Substations -$ -$ -$ -$ -$ -$ -$ -$ 13
14
15 Gross Plant that can directly be determined to be HV or LV:16 High Low
17 Voltage Voltage Total Notes:
18 Land -$ -$ -$ From above Line 1219 Structures -$ -$ -$ From above Line 1220 Total Determined HV/LV: -$ -$ -$ Sum of lines 18 and 1921 Gross Plant Percentages (Prior Year): - % - % Percent of Total22
23 Straddling Transformers -$ -$ -$ Straddling Transformers split by Gross Plant Percentages on Line 2124 Abandoned Plant (BOY EOY) -$ -$ -$ Total: 12-Abandoned Plant Line 2, HV: 12-Abandoned Plant Line 5, LV = Total - HV See Note 1 and 2 belo
25 Total HV and LV Gross Plant for Prior Year -$ -$ -$ Line 20 + Line 23 + Line 2426
27
28 B) Gross Plant Percentage for the Rate Year Effective Period:
29
30 High Low
31 Voltage Voltage Total Notes:
32 Total HV and LV Gross Plant for Prior Year -$ -$ -$ Line 2533 In Service Additions in Rate Year Effective Peri -$ -$ -$ 13-Month Average: 16-PlantAdditions, Line 25, Cols 7 (for Total) and 12 (for LV). HV = C7 - C12.34 CWIP in Rate Year Effective Period -$ -$ -$ 13 Month Average: 10-CWIP, Line 54, Col. 8
35 Total HV and LV Gross Plant for Rate Year REP -$ -$ -$ Line 32 + Line 33 + Line 3436
37 HV and LV Gross Plant Percentages: - % - % Percent of Total on Line 3538 (HV Allocation Factor and 39 LV Allocation Factor)
Notes:
1) For High Voltage Column, sum of EOY HV Abandoned Plant for all Projects on Schedule 12 for EOY of Prior Year2) For Low Voltage Column, Sum of EOY Abandoned Plant less HV Abandoned Plant for all Projects on Schedule 12 for EOY of Prior Year.
31-HVLV
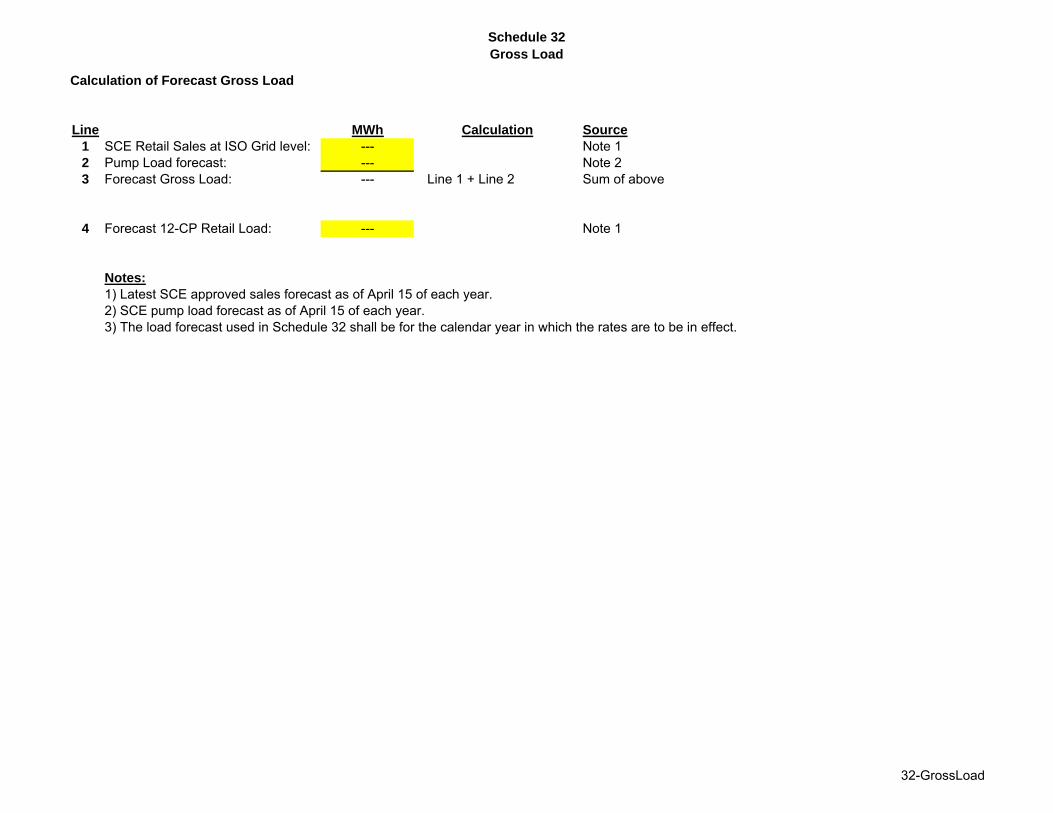
Schedule 32
Gross Load
Calculation of Forecast Gross Load
Line MWh Calculation Source
1 SCE Retail Sales at ISO Grid level: --- Note 12 Pump Load forecast: --- Note 23 Forecast Gross Load: --- Line 1 + Line 2 Sum of above
4 Forecast 12-CP Retail Load: --- Note 1
Notes:
1) Latest SCE approved sales forecast as of April 15 of each year.2) SCE pump load forecast as of April 15 of each year.3) The load forecast used in Schedule 32 shall be for the calendar year in which the rates are to be in effect.
32-GrossLoad

Schedule 33
Retail Transmission Rates
Calculation of SCE Retail Transmission Rates
Source
Retail Base TRR: -$ 1-BaseTRR WS, Line 86 Input cells are shaded yellow
1) Derivation of "Total Demand Rate" and "Total Energy Rate":Col 1 Col 2 Col 3 Col 4 Col 5 Col 6 Col 7 Col 8 Col 9 Col 10 Col 11 Col 12 Col 13 Col 14
Note 1 Note 2 Note 3 Note 4 Note 5 Note 6 Note 7Note 8 Note 8 Note 8
= Retail Base TRR * Line1:Col1
Sales Forecast (Not Including
Backup)Sales Forecast
(Backup) NEM Adjustment
Applies to supplemental kW demand charges
Applies to contracted
standby kW demand charges
= (Line1:Col3 + Line1:Col4) - Line1:Col5
= Line1:Col2 / (Line1:Col8*10^6)
= Line1:Col2 / ((Line1:Col6 +
Line1:Col7)*10^3)
Determinants: to be applied to the Supplemental kW demand charges,
Line CPUC Rate Group 12-CP factors
Total Allocated
costs GWh Backup GWh NEM GWh
Maximum
demand - MW
Standby demand
- MW
Billing
Determinants
with NEM
Adjustment
Total energy rate
- $/kWh
Total demand
rate - $/kW-
month GWh
Maximum
demand - MW
Standby
demand -
MW Notes
1a Domestic - % -$ --- -$ 1b GS-1 - % -$ --- -$ 1b2 GS-1 continued --- --- --- --- --- Notes 9,10
1c TC-1 - % -$ --- -$ 1d GS-2 - % -$ --- -$ 1e TOU-GS-3 - % -$ --- -$ 1f TOU-8-SEC - % -$ --- -$ 1g TOU-8-PRI - % -$ --- -$ 1h TOU-8-SUB - % -$ --- -$ 1i TOU-8-Standby-SEC - % -$ --- -$ 1j TOU-8-Standby-PRI - % -$ --- -$ 1k TOU-8-Standby-SUB - % -$ --- -$ 1l TOU-PA-2 - % -$ --- -$
1m TOU-PA-3 - % -$ --- -$ 1n Street Lighting - % -$ --- -$ 1o --- ---2 Totals: - % -$ --- --- --- --- --- ---3
4
5 2) Determination of Demand Rates for Large Power (TOU-8) Rate Groups6 Col 1 Col 2 Col 3 Col 4 Col 5 Col 6 Col 7 Col 8
7from Line1:Col2 from Line1:Col7
= Col1 / Col2 / 10^3 from Line1:Col2 Note 11
= Col 6 / (Col 7 * 10^3)
8
9 CPUC Rate Group
Standby
Allocated costs
Standby Demand
- MW
Contracted
Standby Demand
Charge $/kW
CPUC Rate
Group
Non-Standby
Allocated Costs
Sum of Standby
and Non-
Standby Demand
Supplemental
kW demand
Charge $/kW
9a TOU-8-Standby-SEC -$ ‐‐‐ -$ TOU-8-SEC -$ --- -$ 9b TOU-8-Standby-PRI -$ ‐‐‐ -$ TOU-8-PRI -$ --- -$ 9c TOU-8-Standby-SUB -$ ‐‐‐ -$ TOU-8-SUB -$ --- -$ 9d --- ---10
Sales Forecast Billing Determinants:
33-RetailRates

Schedule 33
Retail Transmission Rates
11 3) End-User Transmission Rates12 Col 1 Col 2 Col 3 Col 4 Col 5 Col 6 Col 7 Col 8 Col 9 Col 10
13 = Col 2 + Col 3= Line1:Col2 - Line16:Col3
= Line16:Col7 * Line1:Col7 *10^3
= Line16:Col2 / (Line1:Col8 *
10^6)
= Line16:Col2 / Line1:Col6 / 10^3
from Line9:Col3= Line16:Col6 *
0.746= Line16:Col7 *
0.746
14 Note 12 Note 13 Note 14
15 CPUC Rate Group Total Revenues
Revenue
associated with
Supplemental
Demand or
Energy
Standby Demand
Revenue
Energy Charge -
$/kWh
Supplemental
Demand Charge -
$/kW-month
Contracted
standby kW
demand Charge -
$/kW-month
Supplemental
Demand Charge -
$/HP-month
Contracted
standby kW
demand Charge -
$/HP-month Notes
16a Domestic -$ -$ -$ 16b GS-1 -$ -$ -$ -$ -$ -$ -$ -$ Note 1516c TC-1 -$ -$ -$ 16d GS-2 -$ -$ -$ -$ -$ 16e TOU-GS-3 -$ -$ -$ -$ -$ 16f TOU-8-SEC -$ -$ -$ 16g TOU-8-PRI -$ -$ -$ 16h TOU-8-SUB -$ -$ -$ 16i TOU-8-Standby-SEC -$ -$ -$ -$ -$ 16j TOU-8-Standby-PRI -$ -$ -$ -$ -$ 16k TOU-8-Standby-SUB -$ -$ -$ -$ -$ 16l TOU-PA-2 -$ -$ -$ -$ -$ -$ -$ Note 16
16m TOU-PA-3 -$ -$ -$ -$ -$ 16n Street Lighting -$ -$ -$ 16o ---17 Totals: -$ -$ -$ 18
19 Notes:
1) See Col 9 of Lines 35a, 35b, 35c, etc.2) Sales forecast in total Giga-watt hours usage, represents the customers' total annual GWh usage. Based on same forecast as Gross Load forecast in Schedule 32, Line 1, but at customer meter level. Does not include Backup GWh included in Column 4 (the sum of Column 3 and 4 equals total Sales Forecast).3) Backup GWh represents the amount of electric service that is provided by SCE to a customer who has an onsite generating facility during unscheduled outages of the customer’s on-site generator. Only applies to TOU-8-Standby-SEC, TOU-8-Standby-PRI, TOU-8-Standby-SUB Rate Groups.4) Amount of energy included in the sales forecast that is not subject to transmission charges pursuant to the California Public Utilities Commission (“CPUC”) approved Net Energy Metering Program.5) Sales forecast pertaining to the sum of monthly maximum supplemental Mega-watt demand, applies to demand charge schedules6) Sales forecast pertaining to the sum of monthly contracted standby Mega-watt demand, applies to standby schedules7) Net Forecast in total Giga-watt hours usage - represents the customers' annual Net GWh, applicable to Non-Demand Charge Schedules such as Residential or Small General Service8) Recorded sales from Sample meters adjusted for population - use to set the total demand rate for the optional time-of-use schedules within the GS-1 rate group9) Line 1b2, Col11 = Line 1b Col9 * Line 1b Col11 * 10^610) Total demand rate for the optional time-of-use schedules within the GS-1 rate group, Line 1b2:Col10 = Line 1b2:Col12 ( which = Line 1b2:Col11 / ((Line1b:Col12 + Line1b:Col13) * 10^3)11) Sum of the TOU-8 Standby and TOU-8 Non-Standby billing determinants in Line1:Col6
33-RetailRates

Schedule 33
Retail Transmission Rates
12) For TOU-8 Rates revenue = Supplemental Demand Charge on Line 9 Column 8 * Maximum Demand on Lines 1 Column 613) For optional time-of-use schedules within the GS-1 rate group (Line16b:Col6), = (Line1b2:Col11 - Line16:Col3) / Line1b:Col12 / 10^3
14) For the non TOU-8-Standby rate group, it is the minimum of Line16i:Col7, or the total demand rate in Line1:Col10915) Applicable to time-of-use schedules within the GS-1 rate group16) Applicable to the optional schedules that contain horse power charge such as PA-117) GWh for TOU-8-Standby-SEC, TOU-8-Standby-PRI, TOU-8-Standby-SUB Rate Groups are placed in TOU-8-SEC, TOU-8-PRI, TOU-8-SUB Rate Groups respectively.
20
21
22 Rate Schedules in each CPUC Rate Group:23
24
25 CPUC Rate Group Rate Schedules included in Each Rate Group in the Rate Effective Period
26a Domestic Includes Schedules D, D-CARE, D-FERA,TOU-D-T, TOU-EV-1, TOU-D-TEV, DE, D-SDP, D-SDP-O, DM, DMS-1, DMS-2, DMS-3, and DS.Domestic (con't) D (Option CPP), D-CARE (Option CPP), TOU-D-Option A, TOU-D-Option B, TOU-D-3
26b GS-1 Includes Schedules GS-1, TOU-EV-3, and TOU-GS-1 (Option A, B, RTP, CPP, Standby, GS-APS, GS-APS-E, and ME).26c TC-1 Includes Schedules TC-1, Wi-Fi-1, and WTR.26d GS-2 Includes Schedules GS-2, TOU-EV-4, and TOU-GS-2 (Option A, B, R, RTP, CPP, Standby, GS-APS, GS-APS-E, and ME). 26e TOU-GS-3 Includes Schedules TOU-GS-3-CPP, and TOU-GS-3 (Option A, B, R, RTP, SOP, Standby, TOU-BIP, GS-APS, GS-APS-E, and ME).26f TOU-8-SEC Includes Schedules TOU-8-CPP, TOU-8-RBU, and TOU-8 (Option A, B, R, RTP, TOU-BIP, GS-APS, GS-APS-E, Backup-B, and ME).26g TOU-8-PRI Includes Schedules TOU-8-CPP, TOU-8-RBU, and TOU-8 (Option A, B, R, RTP, TOU-BIP, GS-APS, GS-APS-E, Backup-B, and ME).26h TOU-8-SUB Includes Schedules TOU-8-CPP, TOU-8-RBU, and TOU-8 (Option A, B, R, RTP, TOU-BIP, GS-APS, GS-APS-E, Backup-B, and ME).26i TOU-8-Standby-SEC Includes Schedules TOU-8-Standby (Option B, RTP, TOU-BIP, GS-APS, GS-APS-E, and ME).26j TOU-8-Standby-PRI Includes Schedules TOU-8-Standby (Option A, A2, B, RTP, TOU-BIP, GS-APS, GS-APS-E, and ME).26k TOU-8-Standby-SUB Includes Schedules TOU-8-Standby (Option A, A2, B, RTP, TOU-BIP, GS-APS, GS-APS-E, and ME).26l TOU-PA-2 Includes Schedules PA-1, PA-2, TOU-PA-ICE, and TOU-PA-2 (Option A, B, RTP, SOP-1, SOP-2, CPP, Standby, and AP-I).
26m TOU-PA-3 Includes Schedules TOU-PA-3-CPP, and TOU-PA-3 (Option A, B, RTP, SOP-1, SOP-2, Standby, and AP-I).26n Street Lighting Includes Schedules AL-2, AL-2-B, DWL, LS-1, LS-2, LS-3, LS-3-B, and OL-1.26o ---27
28
29 Recorded 12-CP Load Data by Rate Group (MW)30 Col 1 Col 2 Col 3 Col 4 Col 5 Col 6 Col 7 Col 8 Col 9 Col 10 Col 11
31
= Line35:(Col1+Col2
+Col3)/3 from Line1:Col3 from Line1:Col4 = Col 7 + Col 8
= Line35:(Col4*Col5
/Col6*Col9)= Line35:(Col10 /
total of Col10)32 Note 17
33 MW
34 CPUC Rate Group 3-Year Average Line losses
Recorded GWh
(Average)
Standby
Adjusted Sales
Forecast - GWh Backup GWh
Total Sales
Forecast - GWh
Loss Adjusted
Average 12-CP
12-CP Allocation
factors
35a Domestic --- --- --- --- --- - %35b GS-1 --- --- --- --- --- - %35c TC-1 --- --- --- --- --- - %35d GS-2 --- --- --- --- --- - %35e TOU-GS-3 --- --- --- --- --- - %35f TOU-8-SEC --- --- --- --- --- - %35g TOU-8-PRI --- --- --- --- --- - %35h TOU-8-SUB --- --- --- --- --- - %35i TOU-8-Standby-SEC --- --- --- --- --- - %35j TOU-8-Standby-PRI --- --- --- --- --- - %35k TOU-8-Standby-SUB --- --- --- --- --- - %35l TOU-PA-2 --- --- --- --- --- - %
35m TOU-PA-3 --- --- --- --- --- - %35n Street Lighting --- --- --- --- --- - %35o ---36 Totals: --- --- --- --- --- --- --- --- --- --- - %
12-CP MW
33-RetailRates

Schedule 34
Unfunded Reserves
Determination of Unfunded Reserves
Line
1
2
3 Prior Year
4 Reference Amount
5
6 Unfunded Reserves (EOY): (Line 17, Col 2) -$ 7 Unfunded Reserves (Average BOY/EOY): (Line 17, Col 3) -$
8
9 Col 1 Col 2 Col 3
10 Prior Year Prior Year Prior Year
11 BOY EOY Average12 Description of Issue Unfunded Unfunded Unfunded
13 Unfunded Reserves Reserves Reserves Reserves
14 Provision for Injuries and Damages (Line 24) -$ -$ -$ 15 Provision for Vac/Sick Leave (Line 29) -$ -$ -$ 16 Provision for Supplemental Executive Retirement Plan (Line 36) -$ -$ -$
17 Totals: (Line 14 + Line 15 + Line 16) -$ -$ -$
18
19 Calculations
20 Average21 Injuries and Damages BOY EOY BOY/EOY22 Injuries and Damages - Acct. 2251010 Company Records - Input (Negative) -$ -$ 23 Transmission Wages and Salary Allocation Factor (27-Allocators, Line 9) - % - %24 ISO Transmission Rate Base Applicable (Line 22 x Line 23) -$ -$ -$
25
26 Vacation Leave
27 Vacation and Personal Time Accruals - Acct. 2350080 Company Records - Input (Negative) -$ -$ 28 Transmission Wages and Salary Allocation Factor (27-Allocators, Line 9) - % - %29 ISO Transmission Rate Base Applicable (Line 27 x Line 28) -$ -$ -$
30
31 Supplemental Executive Retirement Plan
32 Supplemental Executive Retirement Plan Company Records - Input (Negative) -$ -$ 33 Times: Applicable Rate Base Percentage 50% 50%34 Sub-Total Supplemental Executive Retirement Plan (Line 32 x Line 33) -$ -$ 35 Transmission Wages and Salary Allocation Factor (27-Allocators, Line 9) - % - %36 ISO Transmission Rate Base Applicable (Line 34 x Line 35) -$ -$ -$
34-UnfundedReserves
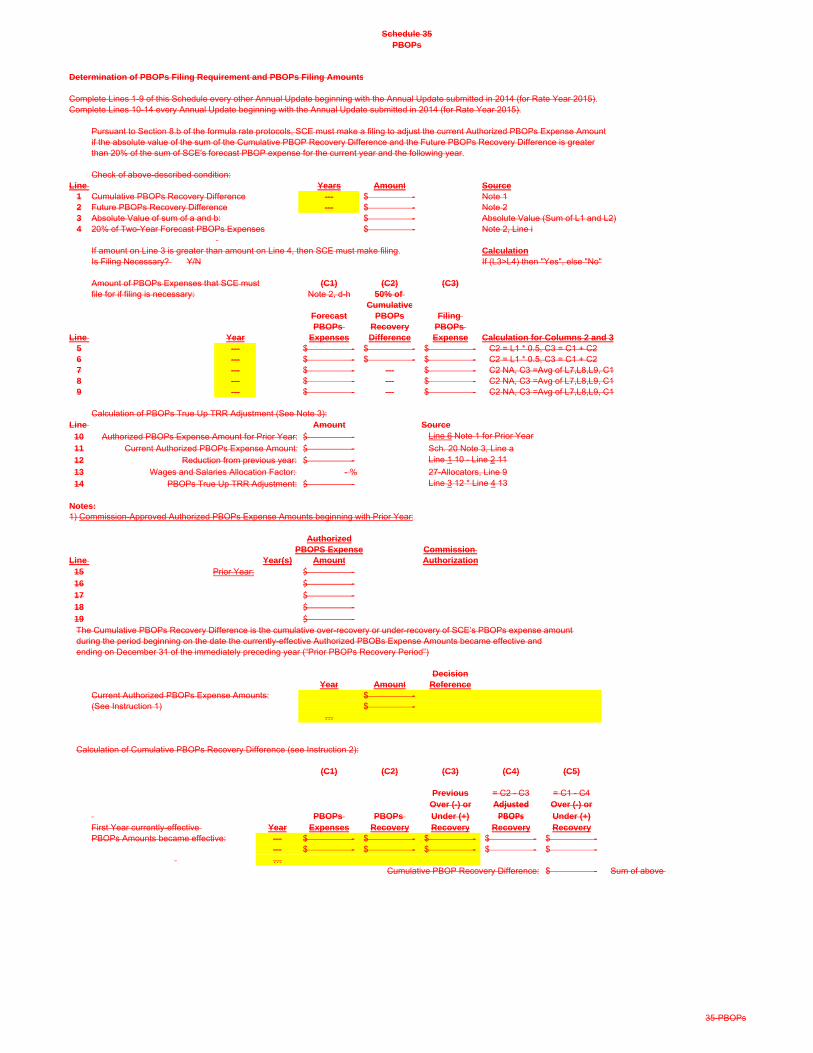
Schedule 35
PBOPs
Determination of PBOPs Filing Requirement and PBOPs Filing Amounts
Complete Lines 1-9 of this Schedule every other Annual Update beginning with the Annual Update submitted in 2014 (for Rate Year 2015).Complete Lines 10-14 every Annual Update beginning with the Annual Update submitted in 2014 (for Rate Year 2015).
Pursuant to Section 8.b of the formula rate protocols, SCE must make a filing to adjust the current Authorized PBOPs Expense Amountif the absolute value of the sum of the Cumulative PBOP Recovery Difference and the Future PBOPs Recovery Difference is greaterthan 20% of the sum of SCE's forecast PBOP expense for the current year and the following year.
Check of above-described condition:Line Years Amount Source
1 Cumulative PBOPs Recovery Difference --- -$ Note 12 Future PBOPs Recovery Difference --- -$ Note 23 Absolute Value of sum of a and b: -$ Absolute Value (Sum of L1 and L2)4 20% of Two-Year Forecast PBOPs Expenses -$ Note 2, Line i
If amount on Line 3 is greater than amount on Line 4, then SCE must make filing. Calculation
Is Filing Necessary? Y/N If (L3>L4) then "Yes", else "No"
Amount of PBOPs Expenses that SCE must (C1) (C2) (C3)
file for if filing is necessary: Note 2, d-h 50% of
Cumulative
Forecast PBOPs Filing
PBOPs Recovery PBOPs
Line Year Expenses Difference Expense Calculation for Columns 2 and 3
5 --- -$ -$ -$ C2 = L1 * 0.5, C3 = C1 + C26 --- -$ -$ -$ C2 = L1 * 0.5, C3 = C1 + C27 --- -$ --- -$ C2 NA, C3 =Avg of L7,L8,L9, C18 --- -$ --- -$ C2 NA, C3 =Avg of L7,L8,L9, C19 --- -$ --- -$ C2 NA, C3 =Avg of L7,L8,L9, C1
Calculation of PBOPs True Up TRR Adjustment (See Note 3):Line Amount Source
10 Authorized PBOPs Expense Amount for Prior Year: ‐$ Line 6 Note 1 for Prior Year
11 Current Authorized PBOPs Expense Amount: ‐$ Sch. 20 Note 3, Line a12 Reduction from previous year: ‐$ Line 1 10 - Line 2 11
13 Wages and Salaries Allocation Factor: - % 27-Allocators, Line 914 PBOPs True Up TRR Adjustment: ‐$ Line 3 12 * Line 4 13
Notes:
1) Commission-Approved Authorized PBOPs Expense Amounts beginning with Prior Year:
Authorized
PBOPS Expense Commission
Line Year(s) Amount Authorization
15 Prior Year: ‐$ 16 ‐$ 17 ‐$ 18 ‐$ 19 ‐$ The Cumulative PBOPs Recovery Difference is the cumulative over-recovery or under-recovery of SCE’s PBOPs expense amount during the period beginning on the date the currently-effective Authorized PBOBs Expense Amounts became effective and ending on December 31 of the immediately preceding year (“Prior PBOPs Recovery Period”)
Decision
Year Amount Reference
Current Authorized PBOPs Expense Amounts: -$ (See Instruction 1) -$
…
Calculation of Cumulative PBOPs Recovery Difference (see Instruction 2):
(C1) (C2) (C3) (C4) (C5)
Previous = C2 - C3 = C1 - C4Over (-) or Adjusted Over (-) or
PBOPs PBOPs Under (+) PBOPs Under (+)
First Year currently-effective Year Expenses Recovery Recovery Recovery Recovery
PBOPs Amounts became effective: --- -$ -$ -$ -$ -$ --- -$ -$ -$ -$ -$
…Cumulative PBOP Recovery Difference: -$ Sum of above
35-PBOPs
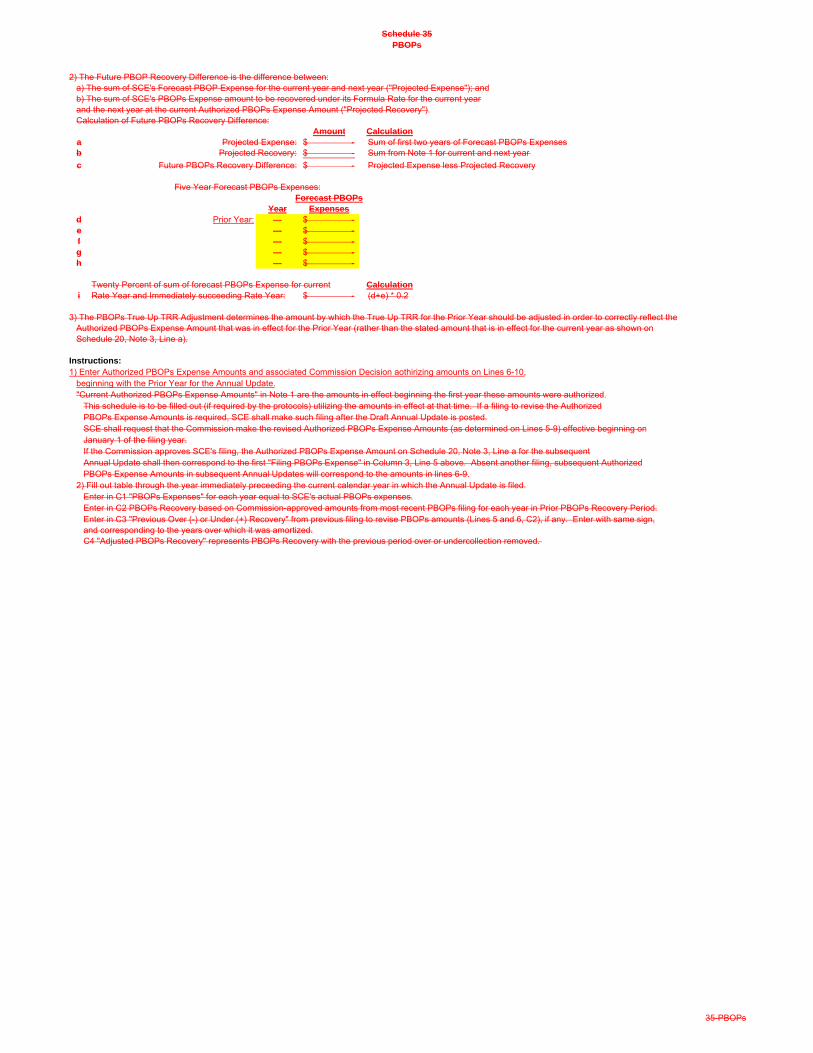
Schedule 35
PBOPs
2) The Future PBOP Recovery Difference is the difference between:a) The sum of SCE's Forecast PBOP Expense for the current year and next year ("Projected Expense"); andb) The sum of SCE's PBOPs Expense amount to be recovered under its Formula Rate for the current year and the next year at the current Authorized PBOPs Expense Amount ("Projected Recovery").Calculation of Future PBOPs Recovery Difference:
Amount Calculation
a Projected Expense: -$ Sum of first two years of Forecast PBOPs Expensesb Projected Recovery: -$ Sum from Note 1 for current and next year.
c Future PBOPs Recovery Difference: -$ Projected Expense less Projected Recovery
Five Year Forecast PBOPs Expenses:Forecast PBOPs
Year Expenses
d Prior Year: --- -$ e --- -$ f --- -$ g --- -$ h --- -$
Twenty Percent of sum of forecast PBOPs Expense for current Calculation
i Rate Year and Immediately succeeding Rate Year: -$ (d+e) * 0.2
3) The PBOPs True Up TRR Adjustment determines the amount by which the True Up TRR for the Prior Year should be adjusted in order to correctly reflect theAuthorized PBOPs Expense Amount that was in effect for the Prior Year (rather than the stated amount that is in effect for the current year as shown onSchedule 20, Note 3, Line a).
Instructions:
1) Enter Authorized PBOPs Expense Amounts and associated Commission Decision aothirizing amounts on Lines 6-10,beginning with the Prior Year for the Annual Update."Current Authorized PBOPs Expense Amounts" in Note 1 are the amounts in effect beginning the first year these amounts were authorized.
This schedule is to be filled out (if required by the protocols) utilizing the amounts in effect at that time. If a filing to revise the AuthorizedPBOPs Expense Amounts is required, SCE shall make such filing after the Draft Annual Update is posted.SCE shall request that the Commission make the revised Authorized PBOPs Expense Amounts (as determined on Lines 5-9) effective beginning onJanuary 1 of the filing year.If the Commission approves SCE's filing, the Authorized PBOPs Expense Amount on Schedule 20, Note 3, Line a for the subsequent Annual Update shall then correspond to the first "Filing PBOPs Expense" in Column 3, Line 5 above. Absent another filing, subsequent AuthorizedPBOPs Expense Amounts in subsequent Annual Updates will correspond to the amounts in lines 6-9.
2) Fill out table through the year immediately preceeding the current calendar year in which the Annual Update is filed.Enter in C1 "PBOPs Expenses" for each year equal to SCE's actual PBOPs expenses.Enter in C2 PBOPs Recovery based on Commission-approved amounts from most recent PBOPs filing for each year in Prior PBOPs Recovery Period.Enter in C3 "Previous Over (-) or Under (+) Recovery" from previous filing to revise PBOPs amounts (Lines 5 and 6, C2), if any. Enter with same sign,and corresponding to the years over which it was amortized.C4 "Adjusted PBOPs Recovery" represents PBOPs Recovery with the previous period over or undercollection removed.
35-PBOPs