Embed Size (px)
Citation preview
VOLUME 1 OF 1
CITY OF CORDOVA, ALASKA VALDEZ-CORDOVA CENSUS AREA
COMMUNITY NAME COMMUNITY NUMBER CITY OF CORDOVA 020037
REVISED:
FLOOD INSURANCE STUDY NUMBER 020037V000B Version Number 2.3.2.1
TABLE OF CONTENTS Page
SECTION 1.0 – INTRODUCTION 1 1.1 The National Flood Insurance Program 1 1.2 Purpose of this Flood Insurance Study Report 2 1.3 Jurisdictions Included in the Flood Insurance Study Project 2 1.4 Considerations for using this Flood Insurance Study Report 4
SECTION 2.0 – FLOODPLAIN MANAGEMENT APPLICATIONS 14 2.1 Floodplain Boundaries 14 2.2 Floodways 14 2.3 Base Flood Elevations 17 2.4 Non-Encroachment Zones 17 2.5 Coastal Flood Hazard Areas 18
2.5.1 Water Elevations and the Effects of Waves 18 2.5.2 Floodplain Boundaries and BFEs for Coastal Areas 19 2.5.3 Coastal High Hazard Areas 20 2.5.4 Limit of Moderate Wave Action 21
SECTION 3.0 – INSURANCE APPLICATIONS 21 3.1 National Flood Insurance Program Insurance Zones 21 3.2 Coastal Barrier Resources System 22
SECTION 4.0 – AREA STUDIED 22 4.1 Basin Description 22 4.2 Principal Flood Problems 23 4.3 Non-Levee Flood Protection Measures 23 4.4 Levees 24
SECTION 5.0 – ENGINEERING METHODS 24 5.1 Hydrologic Analyses 24 5.2 Hydraulic Analyses 28 5.3 Coastal Analyses 30
5.3.1 Total Stillwater Elevations 30 5.3.2 Waves 32 5.3.3 Coastal Erosion 32 5.3.4 Wave Hazard Analyses 32
5.4 Alluvial Fan Analyses 36
i
TABLE OF CONTENTS (continued)
SECTION 6.0 – MAPPING METHODS 36 6.1 Vertical and Horizontal Control 36 6.2 Base Map 37 6.3 Floodplain and Floodway Delineation 38 6.4 Coastal Flood Hazard Mapping 41 6.5 FIRM Revisions 42
6.5.1 Letters of Map Amendment 42 6.5.2 Letters of Map Revision Based on Fill 42 6.5.3 Letters of Map Revision 42 6.5.4 Physical Map Revisions 43 6.5.5 Contracted Restudies 43 6.5.6 Community Map History 43
SECTION 7.0 – CONTRACTED STUDIES AND COMMUNITY COORDINATION 44 7.1 Contracted Studies 44 7.2 Community Meetings 45
SECTION 8.0 – ADDITIONAL INFORMATION 47
SECTION 9.0 – BIBLIOGRAPHY AND REFERENCES 48
Figures Page
Figure 1: FIRM Panel Index 6 Figure 2: FIRM Notes to Users 7 Figure 3: Map Legend for FIRM 10 Figure 4: Floodway Schematic 15 Figure 5: Wave Runup Transect Schematic 19 Figure 6: Coastal Transect Schematic 21 Figure 7: Frequency Discharge-Drainage Area Curves 26 Figure 8: 1% Annual Chance Total Stillwater Elevations for Coastal Areas 31 Figure 9: Transect Location Map 35
Tables
Page
Table 1: Listing of NFIP Jurisdictions 3 Table 2: Flooding Sources Included in this FIS Report 16 Table 3: Flood Zone Designations by Community 22 Table 4: Coastal Barrier Resources System Information 22 Table 5: Basin Characteristics 22 Table 6: Principal Flood Problems 23 Table 7: Historic Flooding Elevations 23 Table 8: Non-Levee Flood Protection Measures 23 Table 9: Levees 24
ii
TABLE OF CONTENTS (continued) Tables (continued)
Table 10: Summary of Discharges 25 Table 11: Summary of Non-Coastal Stillwater Elevations 27 Table 12: Stream Gage Information used to Determine Discharges 28 Table 13: Summary of Hydrologic and Hydraulic Analyses 29 Table 14: Roughness Coefficients 30 Table 15: Summary of Coastal Analyses 30 Table 16: Tide Gage Analysis Specifics 32 Table 17: Coastal Transect Parameters 34 Table 18: Summary of Alluvial Fan Analyses 36 Table 19: Results of Alluvial Fan Analyses 36 Table 20: Countywide Vertical Datum Conversion 37 Table 21: Stream-by-Stream Vertical Datum Conversion 37 Table 22: Base Map Sources 37 Table 23: Summary of Topographic Elevation Data used in Mapping 39 Table 24: Floodway Data 40 Table 25: Flood Hazard and Non-Encroachment Data for Selected Streams 41 Table 26: Summary of Coastal Transect Mapping Considerations 41 Table 27: Incorporated Letters of Map Change 43 Table 28: Community Map History 44 Table 29: Summary of Contracted Studies Included in this FIS Report 45 Table 30: Community Meetings 46 Table 31: Map Repositories 47 Table 32: Additional Information 47 Table 33: Bibliography and References 49
Exhibits
Flood Profiles Panel Eyak River 01 P
Published Separately
Flood Insurance Rate Map (FIRM)
ii
FLOOD INSURANCE STUDY REPORT CITY OF CORDOVA, ALASKA
VALDEZ-CORDOVA CENSUS AREA
SECTION 1.0 – INTRODUCTION
1.1 The National Flood Insurance Program The National Flood Insurance Program (NFIP) is a voluntary Federal program that enables property owners in participating communities to purchase insurance protection against losses from flooding. This insurance is designed to provide an insurance alternative to disaster assistance to meet the escalating costs of repairing damage to buildings and their contents caused by floods.
For decades, the national response to flood disasters was generally limited to constructing flood-control works such as dams, levees, sea-walls, and the like, and providing disaster relief to flood victims. This approach did not reduce losses nor did it discourage unwise development. In some instances, it may have actually encouraged additional development. To compound the problem, the public generally could not buy flood coverage from insurance companies, and building techniques to reduce flood damage were often overlooked.
In the face of mounting flood losses and escalating costs of disaster relief to the general taxpayers, the U.S. Congress created the NFIP. The intent was to reduce future flood damage through community floodplain management ordinances, and provide protection for property owners against potential losses through an insurance mechanism that requires a premium to be paid for the protection.
The U.S. Congress established the NFIP on August 1, 1968, with the passage of the National Flood Insurance Act of 1968. The NFIP was broadened and modified with the passage of the Flood Disaster Protection Act of 1973 and other legislative measures. It was further modified by the National Flood Insurance Reform Act of 1994 and the Flood Insurance Reform Act of 2004. The NFIP is administered by the Federal Emergency Management Agency (FEMA), which is a component of the Department of Homeland Security (DHS).
Participation in the NFIP is based on an agreement between local communities and the Federal Government. If a community adopts and enforces floodplain management regulations to reduce future flood risks to new construction and substantially improved structures in Special Flood Hazard Areas (SFHAs), the Federal Government will make flood insurance available within the community as a financial protection against flood losses. The community’s floodplain management regulations must meet or exceed criteria established in accordance with Title 44 Code of Federal Regulations (CFR) Part 60.3, Criteria for land Management and Use.
SFHAs are delineated on the community’s Flood Insurance Rate Maps (FIRMs). Under the NFIP, buildings that were built before the flood hazard was identified on the community’s FIRMs are generally referred to as “Pre-FIRM” buildings. When the NFIP was created, the U.S. Congress recognized that insurance for Pre-FIRM buildings would be prohibitively expensive if the premiums were not subsidized by the Federal Government. Congress also recognized that most of these floodprone buildings were built by individuals who did not have sufficient knowledge of the flood hazard to make informed decisions. The NFIP requires that full actuarial rates reflecting the complete flood risk be charged on all buildings constructed or substantially improved on or after
1
the effective date of the initial FIRM for the community or after December 31, 1974, whichever is later. These buildings are generally referred to as “Post-FIRM” buildings.
1.2 Purpose of this Flood Insurance Study Report This Flood Insurance Study (FIS) report revises and updates information on the existence and severity of flood hazards for the study area. The studies described in this report developed flood hazard data that will be used to establish actuarial flood insurance rates and to assist communities in efforts to implement sound floodplain management.
In some states or communities, floodplain management criteria or regulations may exist that are more restrictive than the minimum Federal requirements. Contact your State NFIP Coordinator to ensure that any higher State standards are included in the community’s regulations.
1.3 Jurisdictions Included in the Flood Insurance Study Project This FIS Report covers the entire geographic area of the City of Cordova, Alaska.
The jurisdictions that are included in this project area, along with the Community Identification Number (CID) for each community and the 8-digit Hydrologic Unit Codes (HUC-8) sub-basins affecting each, are shown in Table 1. The Flood Insurance Rate Map (FIRM) panel numbers that affect each community are listed. If the flood hazard data for the community is not included in this FIS Report, the location of that data is identified.
The location of flood hazard data for participating communities in multiple jurisdictions is also indicated in the table.
Jurisdictions that have no identified SFHAs as of the effective date of this study are indicated in the table. Changed conditions in these communities (such as urbanization or annexation) or the availability of new scientific or technical data about flood hazards could make it necessary to determine SFHAs in these jurisdictions in the future.
2
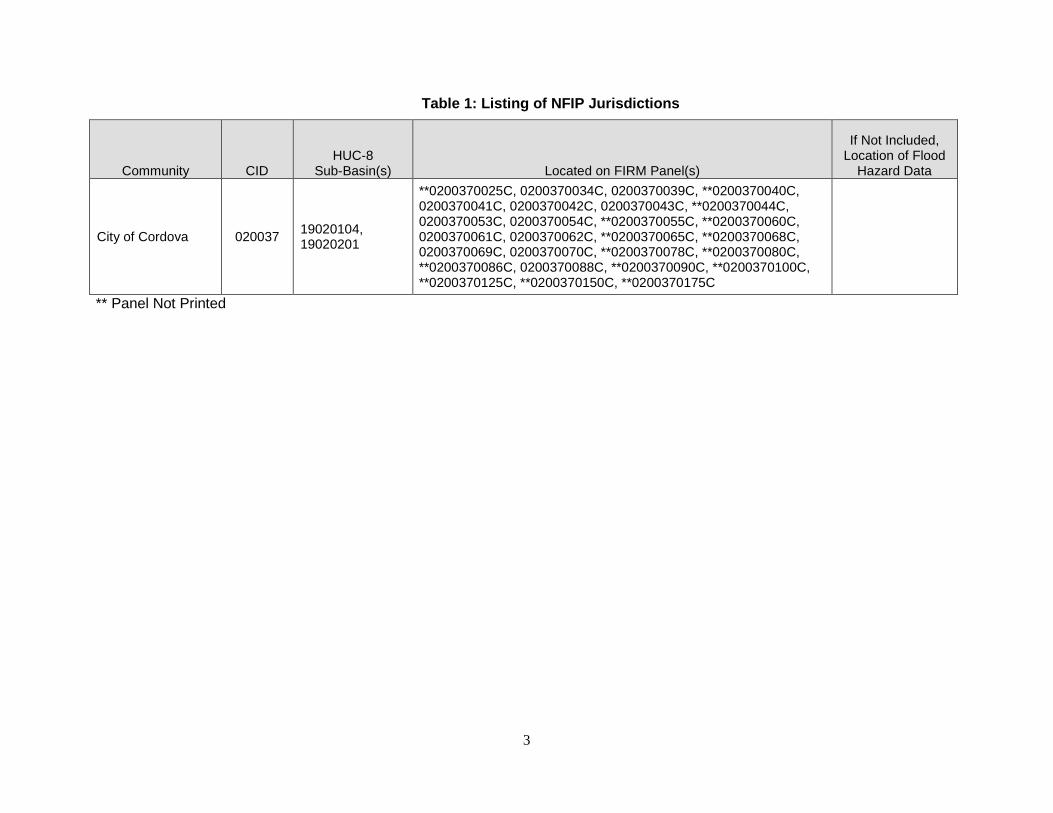
Table 1: Listing of NFIP Jurisdictions
Community CID HUC-8
Sub-Basin(s) Located on FIRM Panel(s)
If Not Included, Location of Flood
Hazard Data
City of Cordova 020037 19020104, 19020201
**0200370025C, 0200370034C, 0200370039C, **0200370040C, 0200370041C, 0200370042C, 0200370043C, **0200370044C, 0200370053C, 0200370054C, **0200370055C, **0200370060C, 0200370061C, 0200370062C, **0200370065C, **0200370068C, 0200370069C, 0200370070C, **0200370078C, **0200370080C, **0200370086C, 0200370088C, **0200370090C, **0200370100C, **0200370125C, **0200370150C, **0200370175C
** Panel Not Printed
3
1.4 Considerations for using this Flood Insurance Study Report The NFIP encourages State and local governments to implement sound floodplain management programs. To assist in this endeavor, each FIS Report provides floodplain data, which may include a combination of the following: 10-, 4-, 2-, 1-, and 0.2 % annual chance flood elevations (the 1% annual chance flood elevation is also referred to as the Base Flood Elevation (BFE)); delineations of the 1% annual chance and 0.2% annual chance floodplains; and 1% annual chance floodway. This information is presented on the FIRM and/or in many components of the FIS Report, including Flood Profiles, Floodway Data tables, Summary of Non-Coastal Stillwater Elevations tables, and Coastal Transect Parameters tables (not all components may be provided for a specific FIS).
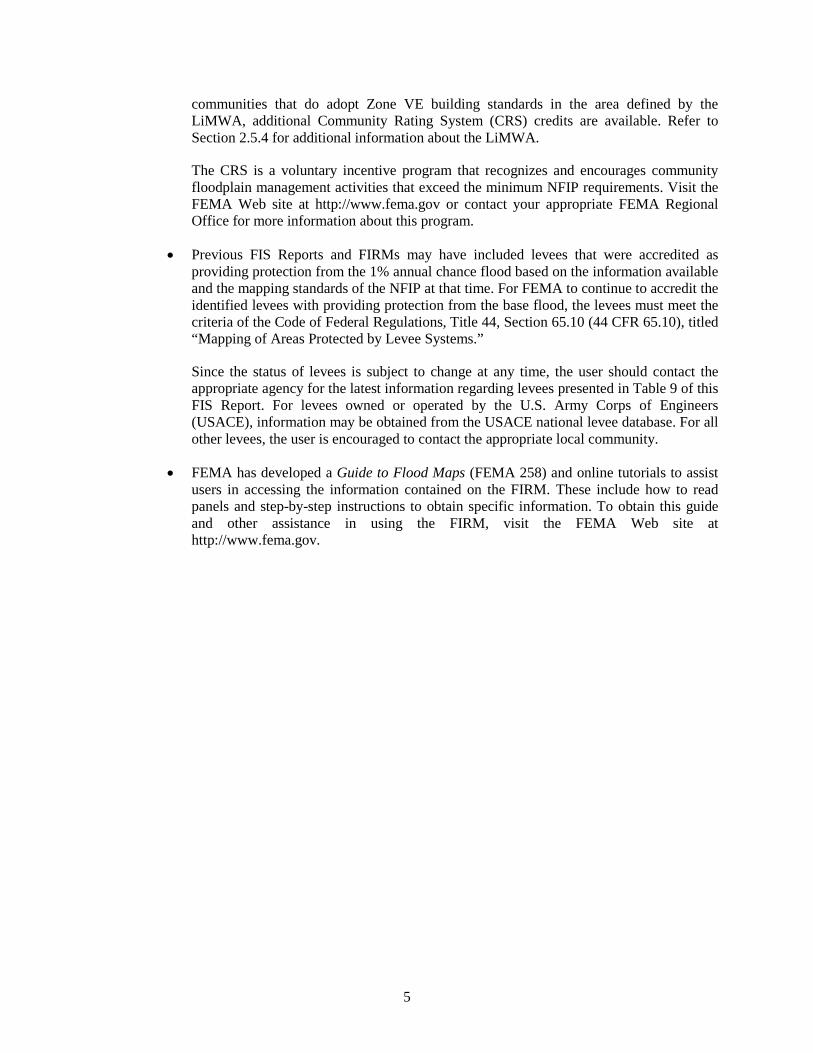
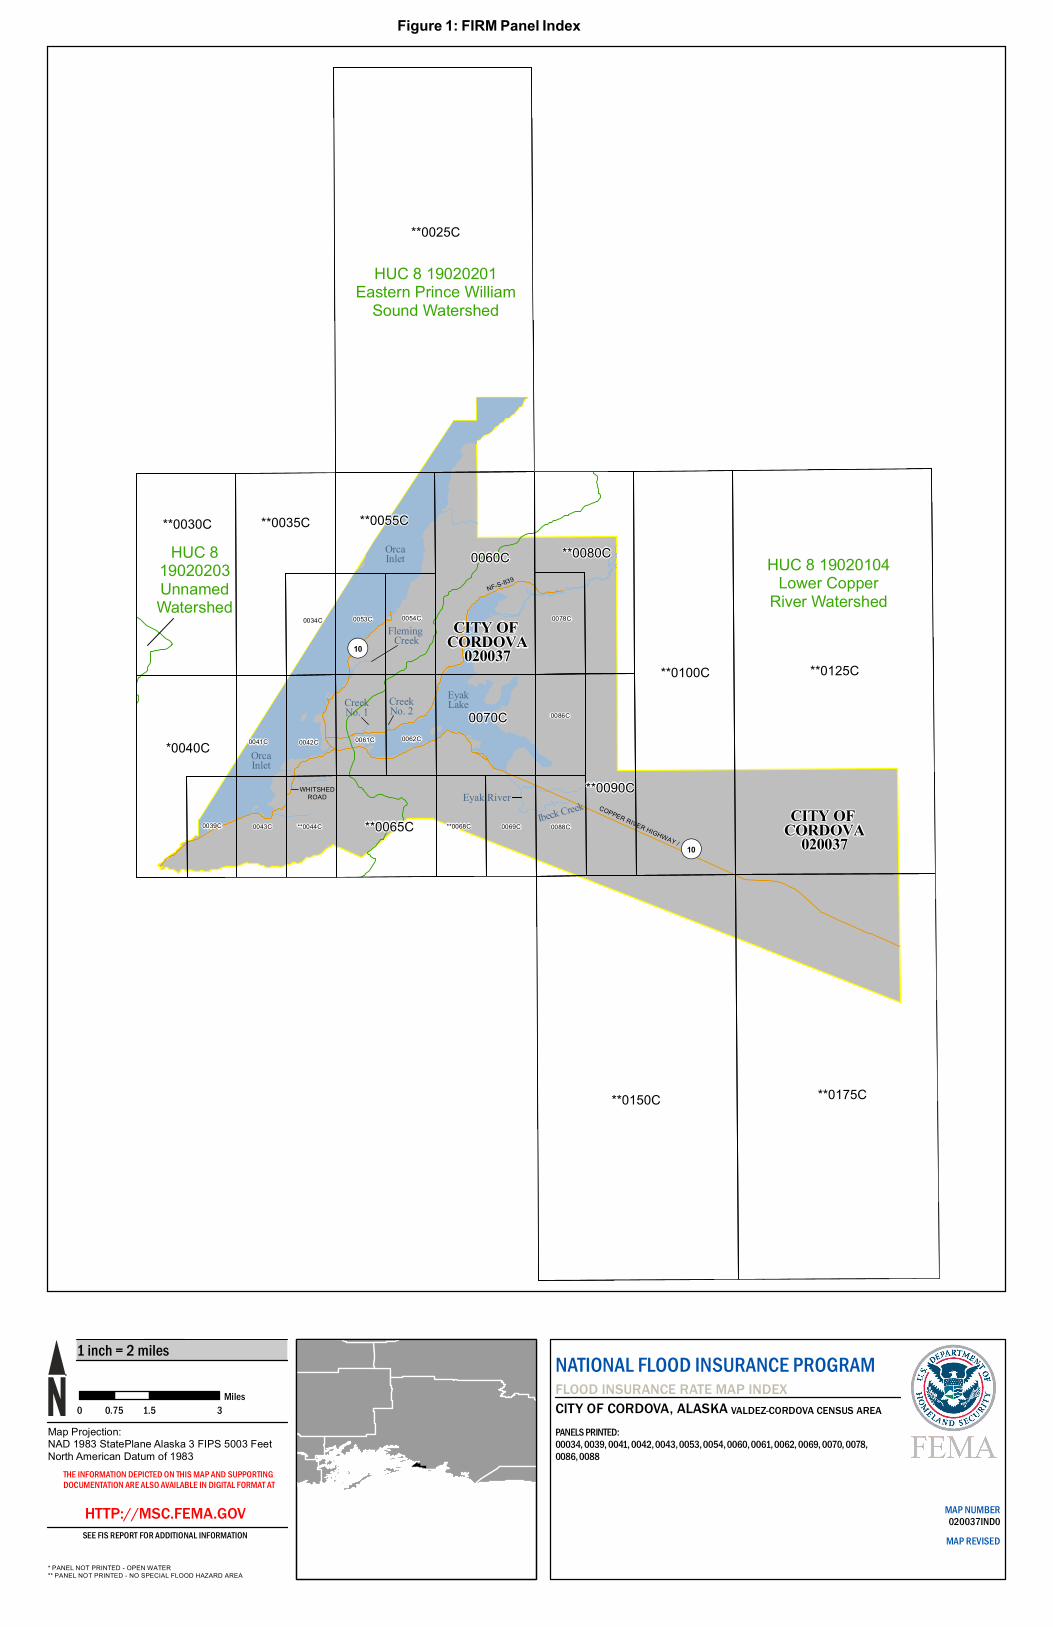
This section presents important considerations for using the information contained in this FIS Report and the FIRM, including changes in format and content. Figures 1, 2, and 3 present information that applies to using the FIRM with the FIS Report.
• Part or all of this FIS Report may be revised and republished at any time. In addition, part of this FIS Report may be revised by a Letter of Map Revision (LOMR), which does not involve republication or redistribution of the FIS Report. Refer to Section 6.5 of this FIS Report for information about the process to revise the FIS Report and/or FIRM.
It is, therefore, the responsibility of the user to consult with community officials by contacting the community repository to obtain the most current FIS Report components. Communities participating in the NFIP have established repositories of flood hazard data for floodplain management and flood insurance purposes. Community map repository addresses are provided in Table 31, “Map Repositories,” within this FIS Report.
• New FIS Reports are frequently developed for multiple communities, such as entire counties. A countywide FIS Report incorporates previous FIS Reports for individual communities and the unincorporated area of the county (if not jurisdictional) into a single document and supersedes those documents for the purposes of the NFIP.
The initial FIS Report for City of Cordova became effective on October 1978. Refer to Table 28 for information about subsequent revisions to the FIRMs.
• Selected FIRM panels for the community may contain information (such as floodways and cross sections) that was previously shown separately on the corresponding Flood Boundary and Floodway Map panels. In addition, former flood hazard zone designations have been changed as follows:
Old Zone New Zone A1 through A30 AE V1 through V30 B
VE X (shaded)
C X (unshaded)
• FEMA does not impose floodplain management requirements or special insurance ratings based on Limit of Moderate Wave Action (LiMWA) delineations at this time. The LiMWA represents the approximate landward limit of the 1.5-foot breaking wave. If the LiMWA is shown on the FIRM, it is being provided by FEMA as information only. For
4
communities that do adopt Zone VE building standards in the area defined by the LiMWA, additional Community Rating System (CRS) credits are available. Refer to Section 2.5.4 for additional information about the LiMWA.
The CRS is a voluntary incentive program that recognizes and encourages community floodplain management activities that exceed the minimum NFIP requirements. Visit the FEMA Web site at http://www.fema.gov or contact your appropriate FEMA Regional Office for more information about this program.
• Previous FIS Reports and FIRMs may have included levees that were accredited as providing protection from the 1% annual chance flood based on the information available and the mapping standards of the NFIP at that time. For FEMA to continue to accredit the identified levees with providing protection from the base flood, the levees must meet the criteria of the Code of Federal Regulations, Title 44, Section 65.10 (44 CFR 65.10), titled “Mapping of Areas Protected by Levee Systems.”
Since the status of levees is subject to change at any time, the user should contact the appropriate agency for the latest information regarding levees presented in Table 9 of this FIS Report. For levees owned or operated by the U.S. Army Corps of Engineers (USACE), information may be obtained from the USACE national levee database. For all other levees, the user is encouraged to contact the appropriate local community.
• FEMA has developed a Guide to Flood Maps (FEMA 258) and online tutorials to assist users in accessing the information contained on the FIRM. These include how to read panels and step-by-step instructions to obtain specific information. To obtain this guide and other assistance in using the FIRM, visit the FEMA Web site at http://www.fema.gov.
5
CITY OF CORDOVA020037
COPPER RIVER HIGHWAY /¬«10
0078C0034C 0053C 0054C
0041C 0042C
0086C
0061C 0062C
0088C0039C **0044C0043C 0069C**0068C
**0090C
**0055C
0070C
**0065C
**0080C**0035C
*0040C
**0030C
0060C
**0100C
**0025C
**0125C
**0150C **0175C
Eyak RiverIbeck Creek
Fleming Creek
HUC 8 19020201Eastern Prince William
Sound Watershed
HUC 8 19020104Lower Copper
River Watershed
HUC 819020203UnnamedWatershed
CITY OF CORDOVA020037
CreekNo. 2CreekNo. 1EyakLake
OrcaInlet
OrcaInlet
NF-S-839
WHITSHEDROAD
¬«10
NATIONAL FLOOD INSURANCE PROGRAMFLOOD INSURANCE RATE MAP INDEXCITY OF CORDOVA, ALASKA VALDEZ-CORDOVA CENSUS AREAPANELS PRINTED:00034, 0039, 0041, 0042, 0043, 0053, 0054, 0060, 0061, 0062, 0069, 0070, 0078, 0086, 0088
THE INFORMATION DEPICTED ON THIS MAP AND SUPPORTING DOCUMENTATION ARE ALSO AVAILABLE IN DIGITAL FORMAT AT
SEE FIS REPORT FOR ADDITIONAL INFORMATIONHTTP://MSC.FEMA.GOV MAP NUMBER
MAP REVISED020037IND0
Map Projection:NAD 1983 StatePlane Alaska 3 FIPS 5003 FeetNorth American Datum of 1983
1 inch = 2 miles
0 1.5 30.75Miles
* PANEL NOT PRINTED - OPEN WATER** PANEL NOT PRINTED - NO SPECIAL FLOOD HAZARD AREA
Figure 1: FIRM Panel Index
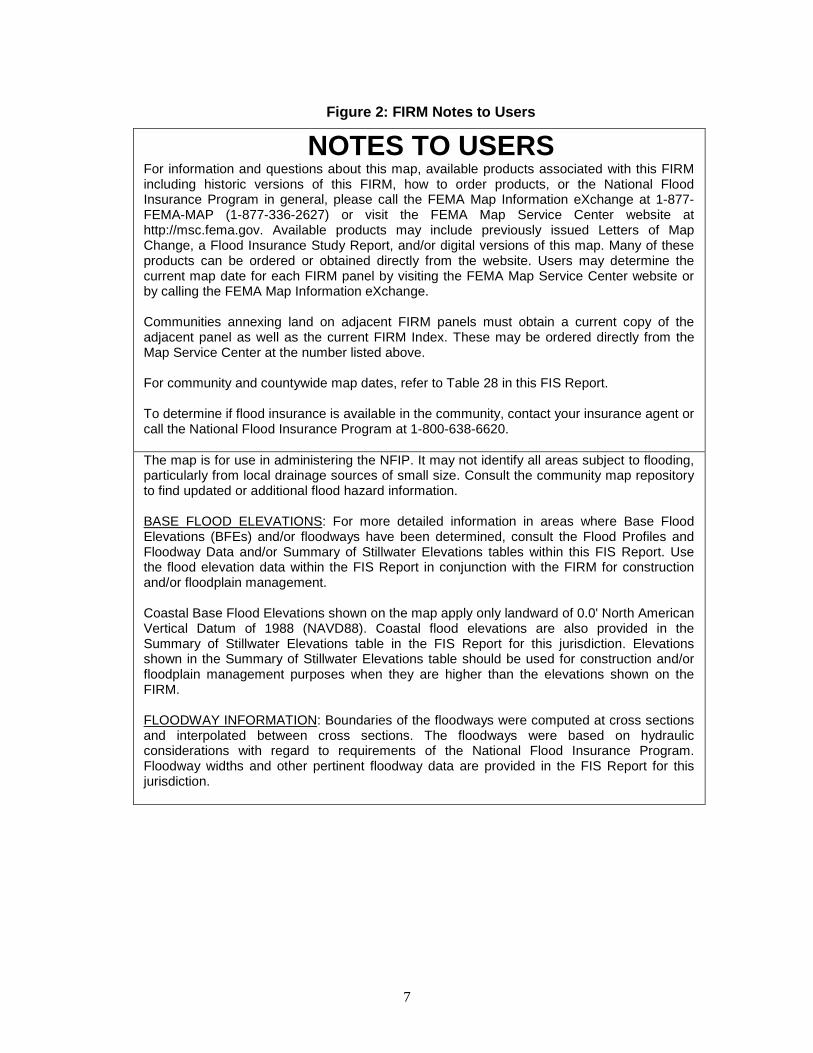
Figure 2: FIRM Notes to Users
NOTES TO USERS For information and questions about this map, available products associated with this FIRM including historic versions of this FIRM, how to order products, or the National Flood Insurance Program in general, please call the FEMA Map Information eXchange at 1-877-FEMA-MAP (1-877-336-2627) or visit the FEMA Map Service Center website at http://msc.fema.gov. Available products may include previously issued Letters of Map Change, a Flood Insurance Study Report, and/or digital versions of this map. Many of these products can be ordered or obtained directly from the website. Users may determine the current map date for each FIRM panel by visiting the FEMA Map Service Center website or by calling the FEMA Map Information eXchange. Communities annexing land on adjacent FIRM panels must obtain a current copy of the adjacent panel as well as the current FIRM Index. These may be ordered directly from the Map Service Center at the number listed above. For community and countywide map dates, refer to Table 28 in this FIS Report. To determine if flood insurance is available in the community, contact your insurance agent or call the National Flood Insurance Program at 1-800-638-6620. The map is for use in administering the NFIP. It may not identify all areas subject to flooding, particularly from local drainage sources of small size. Consult the community map repository to find updated or additional flood hazard information. BASE FLOOD ELEVATIONS: For more detailed information in areas where Base Flood Elevations (BFEs) and/or floodways have been determined, consult the Flood Profiles and Floodway Data and/or Summary of Stillwater Elevations tables within this FIS Report. Use the flood elevation data within the FIS Report in conjunction with the FIRM for construction and/or floodplain management. Coastal Base Flood Elevations shown on the map apply only landward of 0.0' North American Vertical Datum of 1988 (NAVD88). Coastal flood elevations are also provided in the Summary of Stillwater Elevations table in the FIS Report for this jurisdiction. Elevations shown in the Summary of Stillwater Elevations table should be used for construction and/or floodplain management purposes when they are higher than the elevations shown on the FIRM. FLOODWAY INFORMATION: Boundaries of the floodways were computed at cross sections and interpolated between cross sections. The floodways were based on hydraulic considerations with regard to requirements of the National Flood Insurance Program. Floodway widths and other pertinent floodway data are provided in the FIS Report for this jurisdiction.
7
Figure 2: FIRM Notes to Users (continued)
FLOOD CONTROL STRUCTURE INFORMATION: Certain areas not in Special Flood Hazard Areas may be protected by flood control structures. Refer to Section 4.3 "Non-Levee Flood Protection Measures" of this FIS Report for information on flood control structures for this jurisdiction. PROJECTION INFORMATION: The projection used in the preparation of the map was State_Plane Alaska 3 FIPS 5003 Feet. The horizontal datum was North American Datum of 1983 (NAD83). Differences in datum, spheroid, projection or State Plane zones used in the production of FIRMs for adjacent jurisdictions may result in slight positional differences in map features across jurisdiction boundaries. These differences do not affect the accuracy of the FIRM. ELEVATION DATUM: Flood elevations on the FIRM are referenced to the NAVD88. These flood elevations must be compared to structure and ground elevations referenced to the same vertical datum. For information regarding conversion between the National Geodetic Vertical Datum of 1929 (NGVD29) and NAVD88, visit the National Geodetic Survey (NGS) website at http://www.ngs.noaa.gov/ or contact the NGS at the following address: NGS Information Services NOAA, N/NGS12 National Geodetic Survey SSMC-3, #9202 1315 East-West Highway Silver Spring, Maryland 20910-3282 (301) 713-3242 Local vertical monuments may have been used to create the map. To obtain current monument information, please contact the appropriate local community listed in Table 31 of this FIS Report. BASE MAP INFORMATION: Base map information shown on the FIRM was provided in digital format by the United States Department of Agriculture Forest Service. This information was derived from digital orthophotography at a 2-foot resolution from photography dated 2011. For information about base maps, refer to Section 6.2 “Base Map” in this FIS Report. The map reflects more detailed and up-to-date stream channel configurations than those shown on the previous FIRM for this jurisdiction. The floodplains and floodways that were transferred from the previous FIRM may have been adjusted to conform to these new stream channel configurations. As a result, the Flood Profiles and Floodway Data tables may reflect stream channel distances that differ from what is shown on the map. Corporate limits shown on the map are based on the best data available at the time of publication. Because changes due to annexations or de-annexations may have occurred after the map was published, map users should contact appropriate community officials to verify current corporate limit locations. NOTES FOR FIRM INDEX REVISIONS TO INDEX: As new studies are performed and FIRM panels are updated within City of Cordova, Alaska, corresponding revisions to the FIRM Index will be incorporated within the FIS Report to reflect the effective dates of those panels. Please refer to Table 28 of this FIS Report to determine the most recent FIRM revision date for each community. The most recent FIRM panel effective date will correspond to the most recent index date.
8
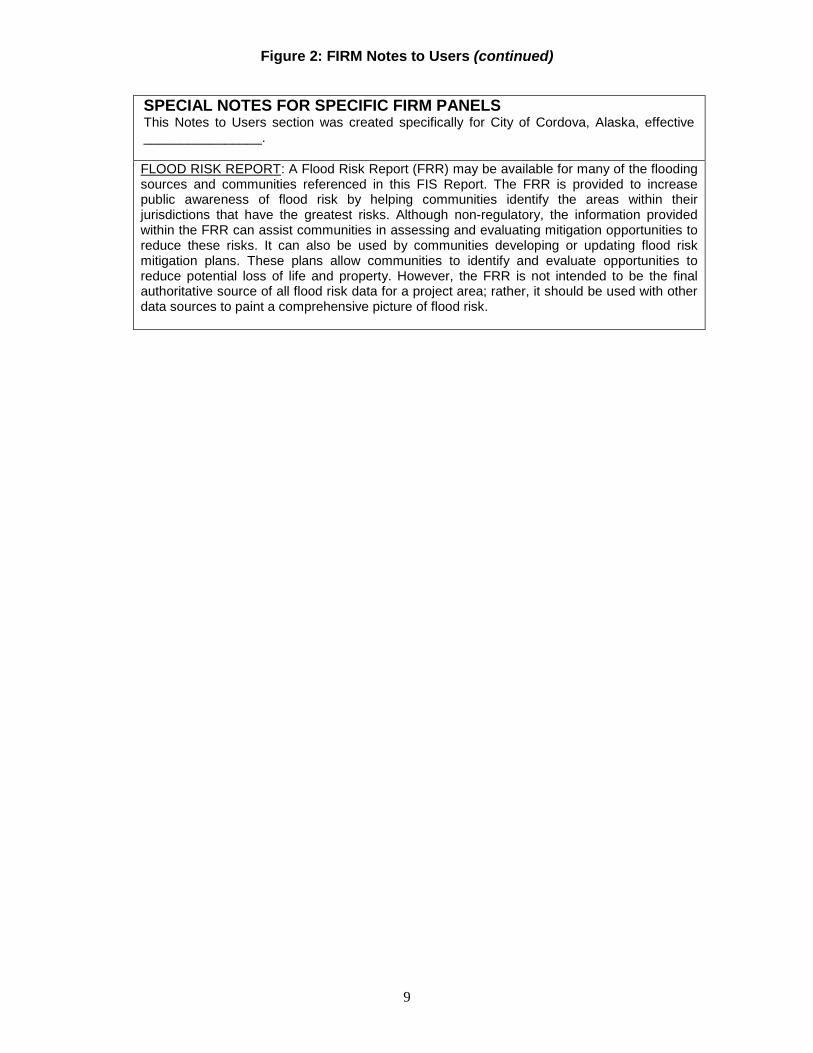
Figure 2: FIRM Notes to Users (continued)
SPECIAL NOTES FOR SPECIFIC FIRM PANELS This Notes to Users section was created specifically for City of Cordova, Alaska, effective ________________. FLOOD RISK REPORT: A Flood Risk Report (FRR) may be available for many of the flooding sources and communities referenced in this FIS Report. The FRR is provided to increase public awareness of flood risk by helping communities identify the areas within their jurisdictions that have the greatest risks. Although non-regulatory, the information provided within the FRR can assist communities in assessing and evaluating mitigation opportunities to reduce these risks. It can also be used by communities developing or updating flood risk mitigation plans. These plans allow communities to identify and evaluate opportunities to reduce potential loss of life and property. However, the FRR is not intended to be the final authoritative source of all flood risk data for a project area; rather, it should be used with other data sources to paint a comprehensive picture of flood risk.
9
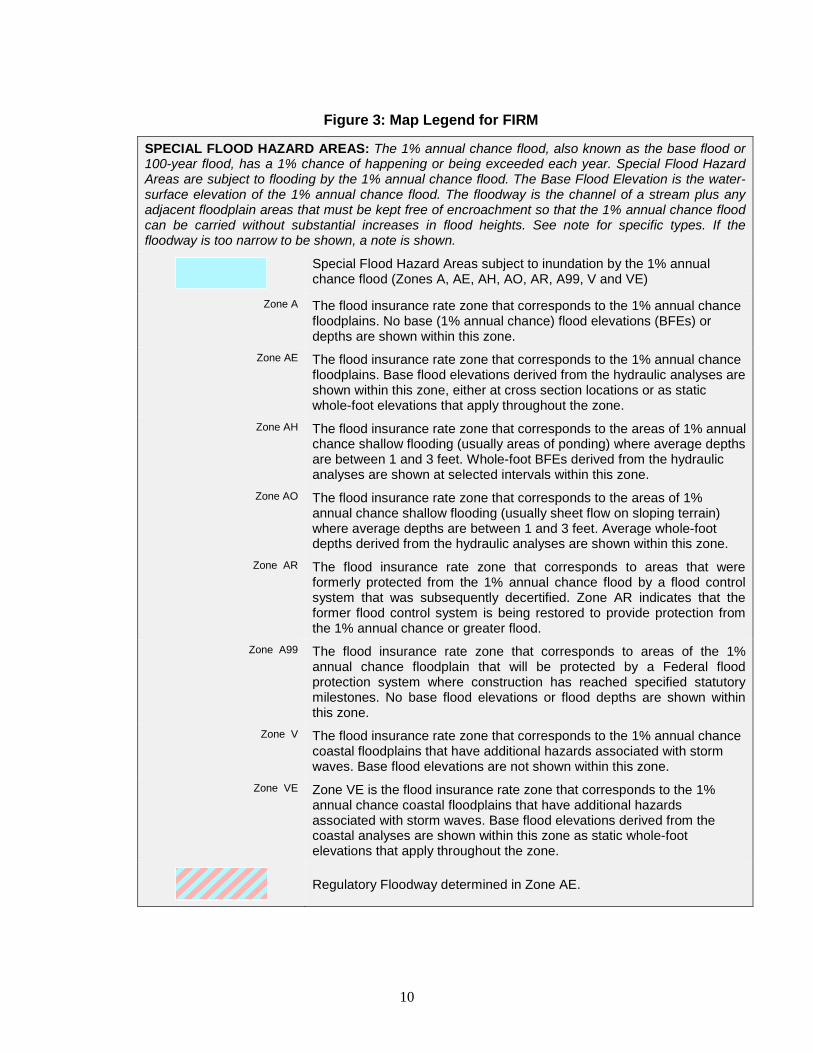
Figure 3: Map Legend for FIRM
SPECIAL FLOOD HAZARD AREAS: The 1% annual chance flood, also known as the base flood or 100-year flood, has a 1% chance of happening or being exceeded each year. Special Flood Hazard Areas are subject to flooding by the 1% annual chance flood. The Base Flood Elevation is the water-surface elevation of the 1% annual chance flood. The floodway is the channel of a stream plus any adjacent floodplain areas that must be kept free of encroachment so that the 1% annual chance flood can be carried without substantial increases in flood heights. See note for specific types. If the floodway is too narrow to be shown, a note is shown.
Special Flood Hazard Areas subject to inundation by the 1% annual chance flood (Zones A, AE, AH, AO, AR, A99, V and VE)
Zone A The flood insurance rate zone that corresponds to the 1% annual chance floodplains. No base (1% annual chance) flood elevations (BFEs) or depths are shown within this zone.
Zone AE The flood insurance rate zone that corresponds to the 1% annual chance floodplains. Base flood elevations derived from the hydraulic analyses are shown within this zone, either at cross section locations or as static whole-foot elevations that apply throughout the zone.
Zone AH The flood insurance rate zone that corresponds to the areas of 1% annual chance shallow flooding (usually areas of ponding) where average depths are between 1 and 3 feet. Whole-foot BFEs derived from the hydraulic analyses are shown at selected intervals within this zone.
Zone AO The flood insurance rate zone that corresponds to the areas of 1% annual chance shallow flooding (usually sheet flow on sloping terrain) where average depths are between 1 and 3 feet. Average whole-foot depths derived from the hydraulic analyses are shown within this zone.
Zone AR The flood insurance rate zone that corresponds to areas that were formerly protected from the 1% annual chance flood by a flood control system that was subsequently decertified. Zone AR indicates that the former flood control system is being restored to provide protection from the 1% annual chance or greater flood.
Zone A99 The flood insurance rate zone that corresponds to areas of the 1% annual chance floodplain that will be protected by a Federal flood protection system where construction has reached specified statutory milestones. No base flood elevations or flood depths are shown within this zone.
Zone V The flood insurance rate zone that corresponds to the 1% annual chance coastal floodplains that have additional hazards associated with storm waves. Base flood elevations are not shown within this zone.
Zone VE Zone VE is the flood insurance rate zone that corresponds to the 1% annual chance coastal floodplains that have additional hazards associated with storm waves. Base flood elevations derived from the coastal analyses are shown within this zone as static whole-foot elevations that apply throughout the zone.
Regulatory Floodway determined in Zone AE.
10
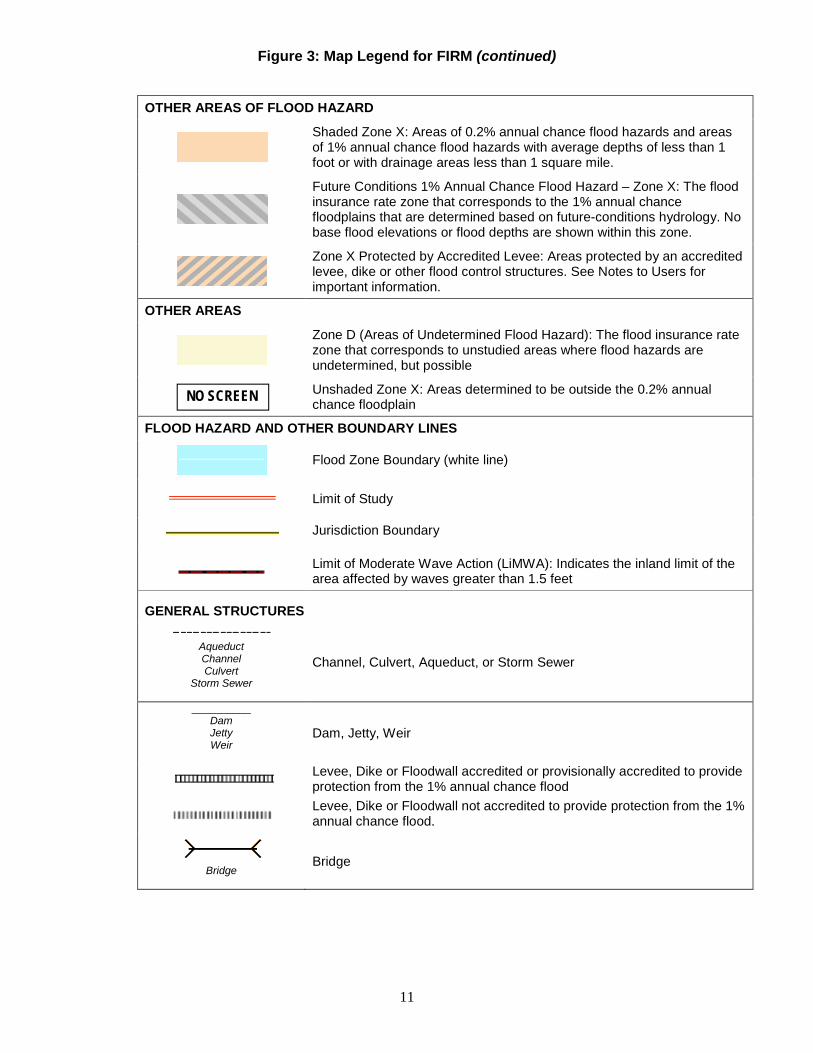
Figure 3: Map Legend for FIRM (continued)
OTHER AREAS OF FLOOD HAZARD
Shaded Zone X: Areas of 0.2% annual chance flood hazards and areas of 1% annual chance flood hazards with average depths of less than 1 foot or with drainage areas less than 1 square mile.
Future Conditions 1% Annual Chance Flood Hazard – Zone X: The flood insurance rate zone that corresponds to the 1% annual chance floodplains that are determined based on future-conditions hydrology. No base flood elevations or flood depths are shown within this zone.
Zone X Protected by Accredited Levee: Areas protected by an accredited levee, dike or other flood control structures. See Notes to Users for important information.
OTHER AREAS
Zone D (Areas of Undetermined Flood Hazard): The flood insurance rate zone that corresponds to unstudied areas where flood hazards are undetermined, but possible
Unshaded Zone X: Areas determined to be outside the 0.2% annual chance floodplain
FLOOD HAZARD AND OTHER BOUNDARY LINES
Flood Zone Boundary (white line)
Limit of Study
Jurisdiction Boundary
Limit of Moderate Wave Action (LiMWA): Indicates the inland limit of the area affected by waves greater than 1.5 feet
GENERAL STRUCTURES
Aqueduct Channel Culvert
Storm Sewer
Channel, Culvert, Aqueduct, or Storm Sewer
__________ Dam Jetty Weir
Dam, Jetty, Weir
Levee, Dike or Floodwall accredited or provisionally accredited to provide protection from the 1% annual chance flood
Levee, Dike or Floodwall not accredited to provide protection from the 1% annual chance flood.
Bridge
Bridge
NO SCREEN
11
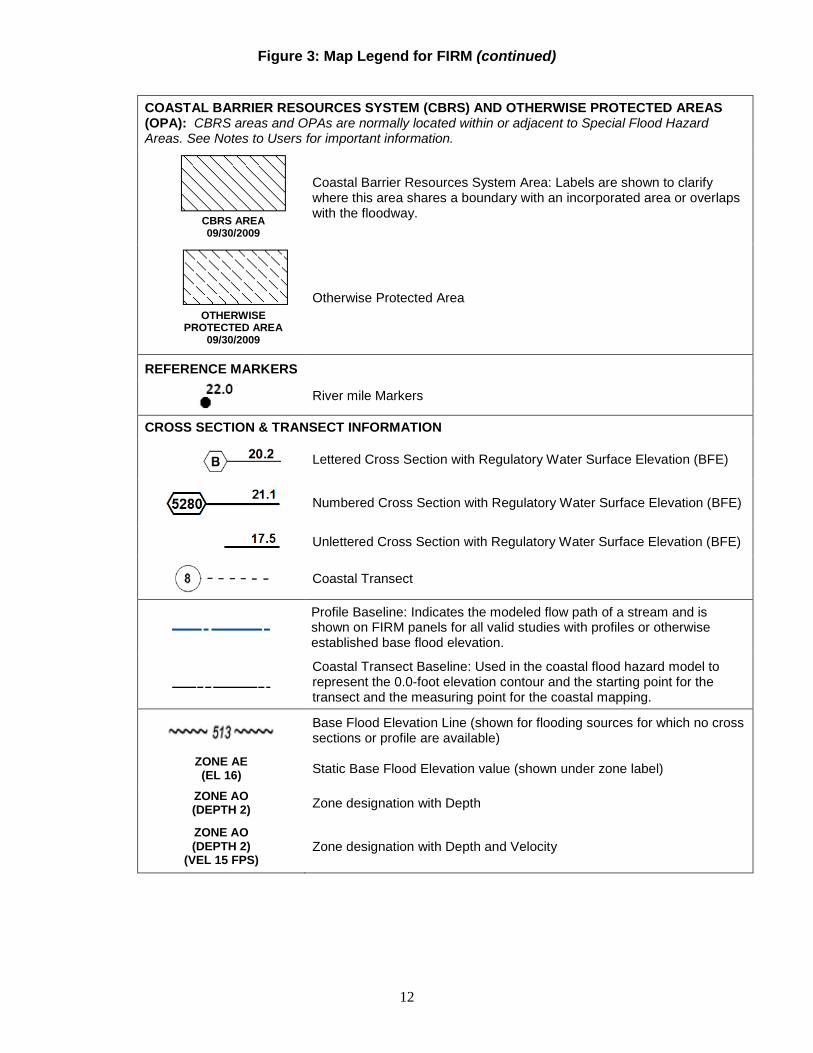
Figure 3: Map Legend for FIRM (continued)
COASTAL BARRIER RESOURCES SYSTEM (CBRS) AND OTHERWISE PROTECTED AREAS (OPA): CBRS areas and OPAs are normally located within or adjacent to Special Flood Hazard Areas. See Notes to Users for important information.
CBRS AREA 09/30/2009
Coastal Barrier Resources System Area: Labels are shown to clarify where this area shares a boundary with an incorporated area or overlaps with the floodway.
OTHERWISE PROTECTED AREA
09/30/2009
Otherwise Protected Area
REFERENCE MARKERS
River mile Markers
CROSS SECTION & TRANSECT INFORMATION
Lettered Cross Section with Regulatory Water Surface Elevation (BFE)
Numbered Cross Section with Regulatory Water Surface Elevation (BFE)
Unlettered Cross Section with Regulatory Water Surface Elevation (BFE)
Coastal Transect
Profile Baseline: Indicates the modeled flow path of a stream and is shown on FIRM panels for all valid studies with profiles or otherwise established base flood elevation.
Coastal Transect Baseline: Used in the coastal flood hazard model to represent the 0.0-foot elevation contour and the starting point for the transect and the measuring point for the coastal mapping.
Base Flood Elevation Line (shown for flooding sources for which no cross sections or profile are available)
ZONE AE (EL 16) Static Base Flood Elevation value (shown under zone label)
ZONE AO (DEPTH 2) Zone designation with Depth
ZONE AO (DEPTH 2)
(VEL 15 FPS) Zone designation with Depth and Velocity
12
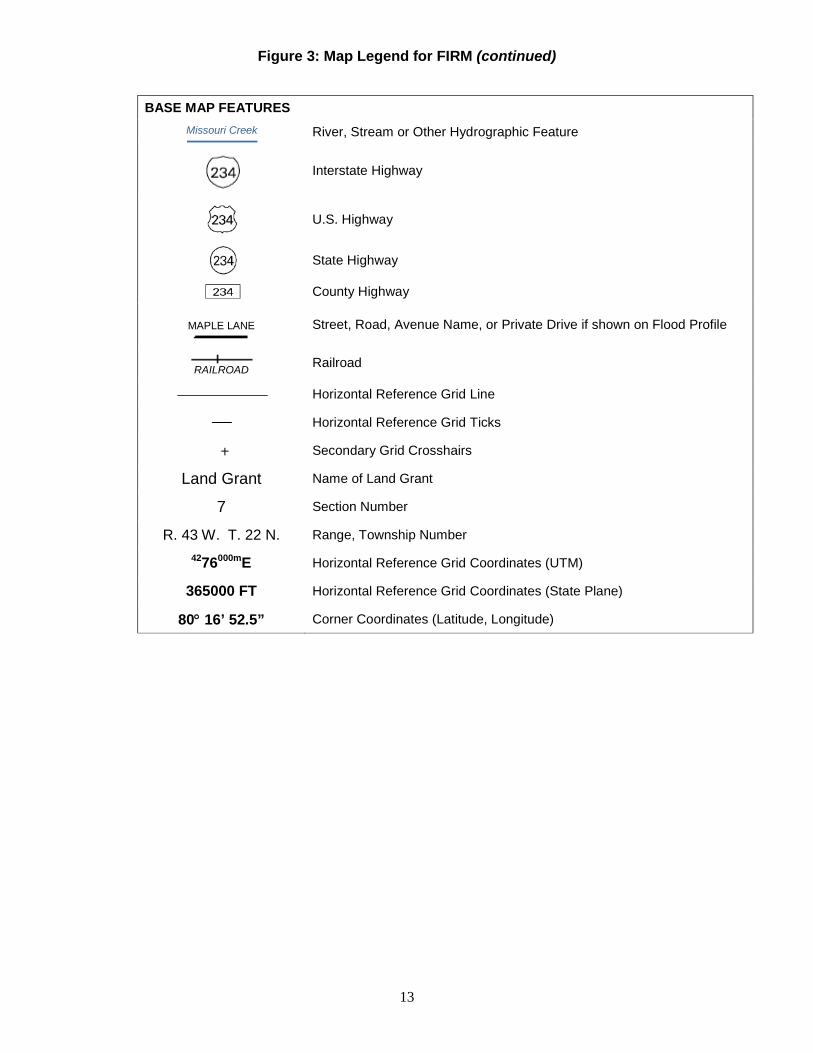
Figure 3: Map Legend for FIRM (continued)
BASE MAP FEATURES Missouri Creek River, Stream or Other Hydrographic Feature
Interstate Highway
U.S. Highway
State Highway
County Highway
MAPLE LANE
Street, Road, Avenue Name, or Private Drive if shown on Flood Profile
RAILROAD Railroad
Horizontal Reference Grid Line
Horizontal Reference Grid Ticks
Secondary Grid Crosshairs
Land Grant Name of Land Grant
7 Section Number
R. 43 W. T. 22 N. Range, Township Number 4276000mE Horizontal Reference Grid Coordinates (UTM)
365000 FT Horizontal Reference Grid Coordinates (State Plane)
80° 16’ 52.5” Corner Coordinates (Latitude, Longitude)
13
SECTION 2.0 – FLOODPLAIN MANAGEMENT APPLICATIONS
2.1 Floodplain Boundaries To provide a national standard without regional discrimination, the 1% annual chance (100-year) flood has been adopted by FEMA as the base flood for floodplain management purposes. The 0.2% annual chance (500-year) flood is employed to indicate additional areas of flood hazard in the community.
Each flooding source included in the project scope has been studied and mapped using professional engineering and mapping methodologies that were agreed upon by FEMA and the City of Cordova as appropriate to the risk level. Flood risk is evaluated based on factors such as known flood hazards and projected impact on the built environment. Engineering analyses were performed for each studied flooding source to calculate its 1% annual chance flood elevations; elevations corresponding to other floods (e.g. 10-, 4-, 2-, 0.2 % annual chance, etc.) may have also been computed for certain flooding sources. Engineering models and methods are described in detail in Section 5.0 of this FIS Report. The modeled elevations at cross sections were used to delineate the floodplain boundaries on the FIRM; between cross sections, the boundaries were interpolated using elevation data from various sources. More information on specific mapping methods is provided in Section 6.0 of this FIS Report.
Depending on the accuracy of available topographic data (Table 23), study methodologies employed (Section 5.0), and flood risk, certain flooding sources may be mapped to show both the 1% and 0.2% annual chance floodplain boundaries, regulatory water surface elevations (BFEs), and/or a regulatory floodway. Similarly, other flooding sources may be mapped to show only the 1% annual chance floodplain boundary on the FIRM, without published water surface elevations. In cases where the 1% and 0.2% annual chance floodplain boundaries are close together, only the 1% annual chance floodplain boundary is shown on the FIRM. Figure 3, “Map Legend for FIRM”, describes the flood zones that are used on the FIRMs to account for the varying levels of flood risk that exist along flooding sources within the project area. Table 2 and Table 3 indicate the flood zone designations for each flooding source and each community within the City of Cordova, respectively.
Table 2, “Flooding Sources Included in this FIS Report,” lists each flooding source, including its study limits, affected communities, mapped zone on the FIRM, and the completion date of its engineering analysis from which the flood elevations on the FIRM and in the FIS Report were derived. Descriptions and dates for the latest hydrologic and hydraulic analyses of the flooding sources are shown in Table 13. Floodplain boundaries for these flooding sources are shown on the FIRM (published separately) using the symbology described in Figure 3. On the map, the 1% annual chance floodplain corresponds to the SFHAs. The 0.2% annual chance floodplain shows areas that, although out of the regulatory floodplain, are still subject to flood hazards.
Small areas within the floodplain boundaries may lie above the flood elevations but cannot be shown due to limitations of the map scale and/or lack of detailed topographic data. The procedures to remove these areas from the SFHA are described in Section 6.5 of this FIS Report.
2.2 Floodways Encroachment on floodplains, such as structures and fill, reduces flood-carrying capacity, increases flood heights and velocities, and increases flood hazards in areas beyond the
14
encroachment itself. One aspect of floodplain management involves balancing the economic gain from floodplain development against the resulting increase in flood hazard.
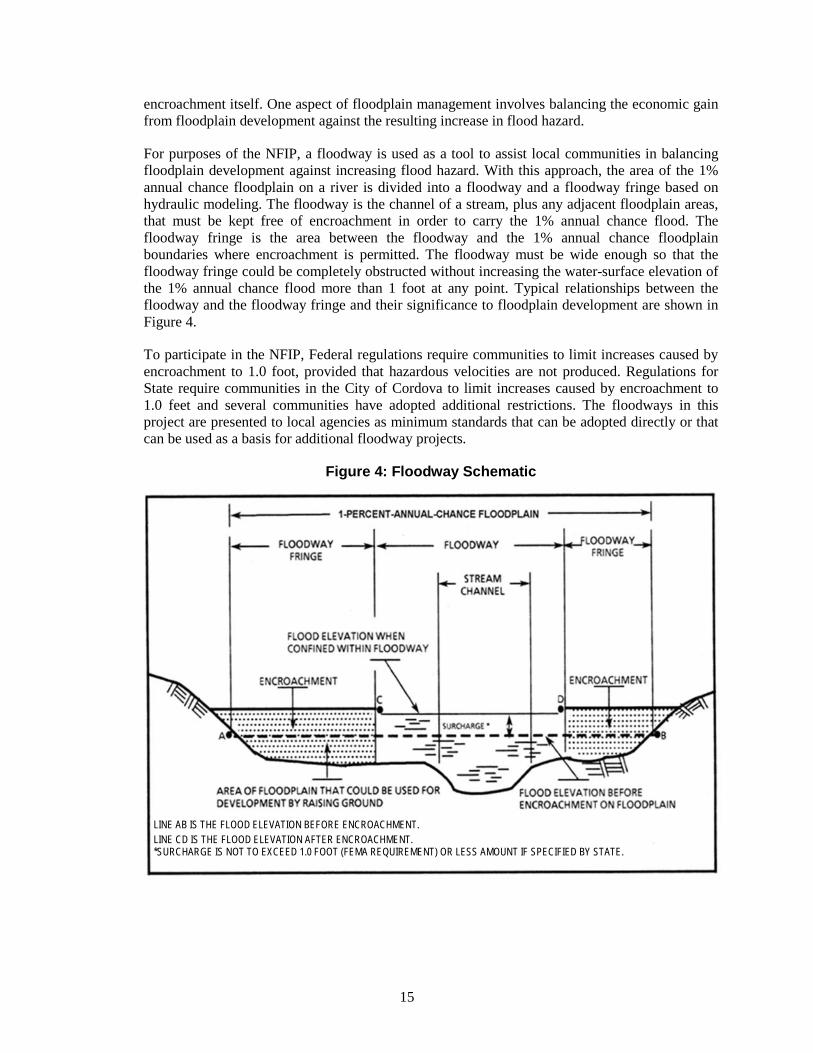
For purposes of the NFIP, a floodway is used as a tool to assist local communities in balancing floodplain development against increasing flood hazard. With this approach, the area of the 1% annual chance floodplain on a river is divided into a floodway and a floodway fringe based on hydraulic modeling. The floodway is the channel of a stream, plus any adjacent floodplain areas, that must be kept free of encroachment in order to carry the 1% annual chance flood. The floodway fringe is the area between the floodway and the 1% annual chance floodplain boundaries where encroachment is permitted. The floodway must be wide enough so that the floodway fringe could be completely obstructed without increasing the water-surface elevation of the 1% annual chance flood more than 1 foot at any point. Typical relationships between the floodway and the floodway fringe and their significance to floodplain development are shown in Figure 4.
To participate in the NFIP, Federal regulations require communities to limit increases caused by encroachment to 1.0 foot, provided that hazardous velocities are not produced. Regulations for State require communities in the City of Cordova to limit increases caused by encroachment to 1.0 feet and several communities have adopted additional restrictions. The floodways in this project are presented to local agencies as minimum standards that can be adopted directly or that can be used as a basis for additional floodway projects.
Figure 4: Floodway Schematic
LINE AB IS THE FLOOD ELEVATION BEFORE ENCROACHMENT. LINE CD IS THE FLOOD ELEVATION AFTER ENCROACHMENT. *SURCHARGE IS NOT TO EXCEED 1.0 FOOT (FEMA REQUIREMENT) OR LESS AMOUNT IF SPECIFIED BY STATE.
15
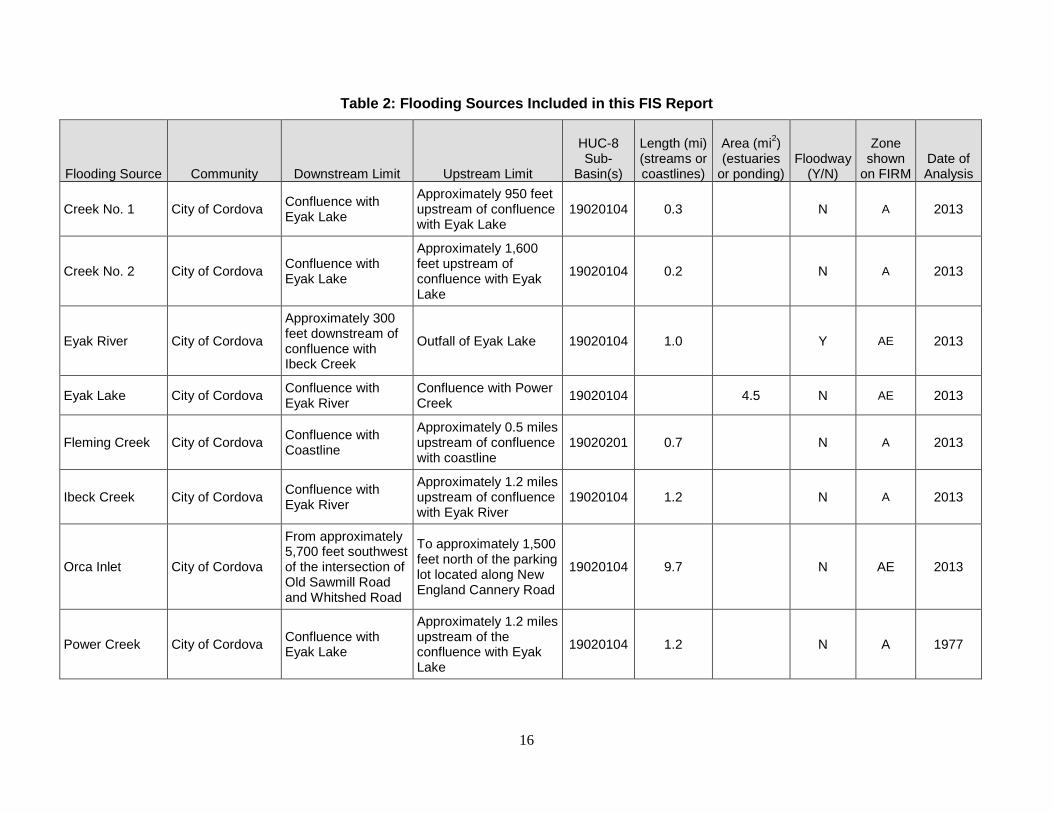
Table 2: Flooding Sources Included in this FIS Report
Flooding Source Community Downstream Limit Upstream Limit
HUC-8 Sub-
Basin(s)
Length (mi) (streams or coastlines)
Area (mi2) (estuaries
or ponding) Floodway
(Y/N)
Zone shown
on FIRM Date of Analysis
Creek No. 1 City of Cordova Confluence with Eyak Lake
Approximately 950 feet upstream of confluence with Eyak Lake
19020104 0.3 N A 2013
Creek No. 2 City of Cordova Confluence with Eyak Lake
Approximately 1,600 feet upstream of confluence with Eyak Lake
19020104 0.2 N A 2013
Eyak River City of Cordova
Approximately 300 feet downstream of confluence with Ibeck Creek
Outfall of Eyak Lake 19020104 1.0 Y AE 2013
Eyak Lake City of Cordova Confluence with Eyak River
Confluence with Power Creek 19020104 4.5 N AE 2013
Fleming Creek City of Cordova Confluence with Coastline
Approximately 0.5 miles upstream of confluence with coastline
19020201 0.7 N A 2013
Ibeck Creek City of Cordova Confluence with Eyak River
Approximately 1.2 miles upstream of confluence with Eyak River
19020104 1.2 N A 2013
Orca Inlet City of Cordova
From approximately 5,700 feet southwest of the intersection of Old Sawmill Road and Whitshed Road
To approximately 1,500 feet north of the parking lot located along New England Cannery Road
19020104 9.7 N AE 2013
Power Creek City of Cordova Confluence with Eyak Lake
Approximately 1.2 miles upstream of the confluence with Eyak Lake
19020104 1.2 N A 1977
16
Floodway widths presented in this FIS Report and on the FIRM were computed at cross sections. Between cross sections, the floodway boundaries were interpolated. For certain stream segments, floodways were adjusted so that the amount of floodwaters conveyed on each side of the floodplain would be reduced equally. The results of the floodway computations have been tabulated for selected cross sections and are shown in Table 24, “Floodway Data.”
All floodways that were developed for this FIS project are shown on the FIRM using the symbology described in Figure 3. In cases where the floodway and l% annual chance floodplain boundaries are either close together or collinear, only the floodway boundary has been shown on the FIRM. For information about the delineation of floodways on the FIRM, refer to Section 6.3.
2.3 Base Flood Elevations The hydraulic characteristics of flooding sources were analyzed to provide estimates of the elevations of floods of the selected recurrence intervals. The Base Flood Elevation (BFE) is the elevation of the 1% annual chance flood. These BFEs are most commonly rounded to the whole foot, as shown on the FIRM, but in certain circumstances or locations they may be rounded to 0.1 foot. Cross section lines shown on the FIRM may also be labeled with the BFE rounded to 0.1 foot. Whole-foot BFEs derived from engineering analyses that apply to coastal areas, areas of ponding, or other static areas with little elevation change may also be shown at selected intervals on the FIRM.
Cross sections with BFEs shown on the FIRM correspond to the cross sections shown in the Floodway Data table and Flood Profiles in this FIS Report. BFEs are primarily intended for flood insurance rating purposes. For construction and/or floodplain management purposes, users are cautioned to use the flood elevation data presented in this FIS Report in conjunction with the data shown on the FIRM.
2.4 Non-Encroachment Zones Some States and communities use non-encroachment zones to manage floodplain development. For flooding sources with medium flood risk, field surveys are often not collected and surveyed bridge and culvert geometry is not developed. Standard hydrologic and hydraulic analyses are still performed to determine BFEs in these areas. However, floodways are not typically determined, since specific channel profiles are not developed. To assist communities with managing floodplain development in these areas, a “non-encroachment zone” may be provided. While not a FEMA designated floodway, the non-encroachment zone represents that area around the stream that should be reserved to convey the 1% annual chance flood event. As with a floodway, all surcharges must fall within the acceptable range in the non-encroachment zone.
General setbacks can be used in areas of lower risk (e.g. unnumbered Zone A), but these are not considered sufficient where unnumbered Zone A is replaced by Zone AE. The NFIP requires communities to ensure that any development in a non-encroachment area causes no increase in BFEs. Communities must generally prohibit development within the area defined by the non-encroachment width to meet the NFIP requirement. Regulations for State require communities in Flood County to limit increases caused by encroachment to 0.5 foot and several communities have adopted additional restrictions for nonencroachment areas.
Non-encroachment determinations may be delineated where it is not possible to delineate floodways because specific channel profiles with bridge and culvert geometry were not developed. Any non-encroachment determinations for this FIS project have been tabulated for
17
selected cross sections and are shown in Table 25, “Flood Hazard and Non-Encroachment Data for Selected Streams.” Areas for which non-encroachment zones are provided show BFEs and the 1% annual chance floodplain boundaries mapped as zone AE on the FIRM but no floodways.
2.5 Coastal Flood Hazard Areas For most areas along rivers, streams, and small lakes, BFEs and floodplain boundaries are based on the amount of water expected to enter the area during a 1% annual chance flood and the geometry of the floodplain. Floods in these areas are typically caused by storm events. However, for areas on or near ocean coasts, large rivers, or large bodies of water, BFE and floodplain boundaries may need to be based on additional components, including storm surges and waves. Communities on or near ocean coasts face flood hazards caused by offshore seismic events as well as storm events.
Coastal flooding sources that are included in this FIS project are shown in Table 2.
2.5.1 Water Elevations and the Effects of Waves Specific terminology is used in coastal analyses to indicate which components have been included in evaluating flood hazards. The stillwater elevation (SWEL or still water level) is the surface of the water resulting from astronomical tides, storm surge, and freshwater inputs, but excluding wave setup contribution or the effects of waves.
• Astronomical tides are periodic rises and falls in large bodies of water caused by the rotation of the earth and by the gravitational forces exerted by the earth, moon, and sun.
• Storm surge is the additional water depth that occurs during large storm events. These events can bring air pressure changes and strong winds that force water up against the shore.
• Freshwater inputs include rainfall that falls directly on the body of water, runoff from surfaces and overland flow, and inputs from rivers.
The 1% annual chance stillwater elevation is the stillwater elevation that has been calculated for a storm surge from a 1% annual chance storm. The 1% annual chance storm surge can be determined from analyses of tidal gage records, statistical study of regional historical storms, or other modeling approaches. Stillwater elevations for storms of other frequencies can be developed using similar approaches. The total stillwater elevation (also referred to as the mean water level) is the stillwater elevation plus wave setup contribution but excluding the effects of waves.
• Wave setup is the increase in stillwater elevation at the shoreline caused by the reduction of waves in shallow water. It occurs as breaking wave momentum is transferred to the water column.
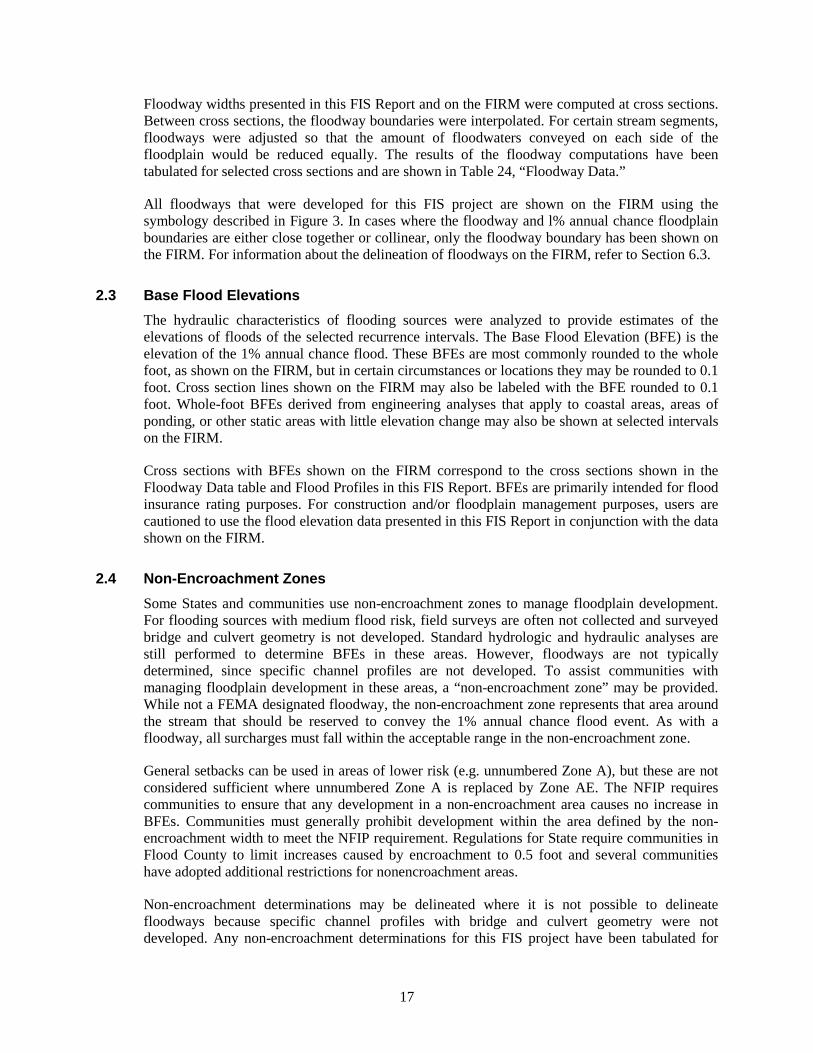
Like the stillwater elevation, the total stillwater elevation is based on a storm of a particular frequency, such as the 1% annual chance storm. Wave setup is typically estimated using standard engineering practices or calculated using models, since tidal gages are often sited in areas sheltered from wave action and do not capture this information. Coastal analyses may examine the effects of overland waves by analyzing storm-induced erosion, overland wave propagation, wave runup, and/or wave overtopping.
18
• Storm-induced erosion is the modification of existing topography by erosion caused by a specific storm event, as opposed to general erosion that occurs at a more constant rate.
• Overland wave propagation describes the combined effects of variation in ground elevation, vegetation, and physical features on wave characteristics as waves move onshore.
• Wave runup is the uprush of water from wave action on a shore barrier. It is a function of the roughness and geometry of the shoreline at the point where the stillwater elevation intersects the land.
• Wave overtopping refers to wave runup that occurs when waves pass over the crest of a barrier.
Figure 5: Wave Runup Transect Schematic
2.5.2 Floodplain Boundaries and BFEs for Coastal Areas For coastal communities along the Atlantic and Pacific Oceans, the Gulf of Mexico, the Great Lakes, and the Caribbean Sea, flood hazards must take into account how storm surges, waves, and extreme tides interact with factors such as topography and vegetation. Storm surge and waves must also be considered in assessing flood risk for certain communities on rivers or large inland bodies of water.
Beyond areas that are affected by waves and tides, coastal communities can also have riverine floodplains with designated floodways, as described in previous sections.
Floodplain Boundaries In many coastal areas, storm surge is the principle component of flooding. The extent of the 1% annual chance floodplain in these areas is derived from the total stillwater elevation (stillwater elevation including storm surge plus wave setup) for the 1% annual chance storm. The methods that were used for calculation of total stillwater elevations for coastal areas are described in Section 5.3 of this FIS Report. Location of total stillwater elevations for coastal areas are shown in Figure 8, “1% Annual Chance Total Stillwater Levels for Coastal Areas.”
In some areas, the 1% annual chance floodplain is determined based on the limit of wave runup or wave overtopping for the 1% annual chance storm surge. The methods that were used for calculation of wave hazards are described in Section 5.3 of this FIS Report.
19
Table 26 presents the types of coastal analyses that were used in mapping the 1% annual chance floodplain in coastal areas.
Coastal BFEs Coastal BFEs are calculated as the total stillwater elevation (stillwater elevation including storm surge plus wave setup) for the 1% annual chance storm plus the additional flood hazard from overland wave effects (storm-induced erosion, overland wave propagation, wave runup, and wave overtopping).
Where they apply, coastal BFEs are calculated along transects extending from offshore to the limit of coastal flooding onshore. Results of these analyses are accurate until local topography, vegetation, or development type and density within the community undergoes major changes.
Parameters that were included in calculating coastal BFEs for each transect included in this FIS Report are presented in Table 17, “Coastal Transect Parameters.” The locations of transects are shown in Figure 9, “Transect Location Map.” More detailed information about the methods used in coastal analyses and the results of intermediate steps in the coastal analyses are presented in Section 5.3 of this FIS Report. Additional information on specific mapping methods is provided in Section 6.4 of this FIS Report.
2.5.3 Coastal High Hazard Areas Certain areas along the open coast and other areas may have higher risk of experiencing structural damage caused by wave action and/or high-velocity water during the 1% annual chance flood. These areas will be identified on the FIRM as Coastal High Hazard Areas.
• Coastal High Hazard Area (CHHA) is a SFHA extending from offshore to the inland limit of the primary frontal dune (PFD) or any other area subject to damages caused by wave action and/or high-velocity water during the 1% annual chance flood.
• Primary Frontal Dune (PFD) is a continuous or nearly continuous mound or ridge of sand with relatively steep slopes immediately landward and adjacent to the beach. The PFD is subject to erosion and overtopping from high tides and waves during major coastal storms.
CHHAs are designated as “V” zones (for “velocity wave zones”) and are subject to more stringent regulatory requirements and a different flood insurance rate structure. The areas of greatest risk are shown as VE on the FIRM. Zone VE is further subdivided into elevation zones and shown with BFEs on the FIRM.
The landward limit of the PFD occurs at a point where there is a distinct change from a relatively steep slope to a relatively mild slope; this point represents the landward extension of Zone VE. Areas of lower risk in the CHHA are designated with Zone V on the FIRM. More detailed information about the identification and designation of Zone VE is presented in Section 6.4 of this FIS Report.
Areas that are not within the CHHA but are SFHAs may still be impacted by coastal flooding and damaging waves; these areas are shown as “A” zones on the FIRM.
Figure 6, “Coastal Transect Schematic,” illustrates the relationship between the base flood elevation, the 1% annual chance stillwater elevation, and the ground profile as well as the location of the Zone VE and Zone AE areas in an area without a PFD subject to overland wave
20

propagation. This figure also illustrates energy dissipation and regeneration of a wave as it moves inland.
Figure 6: Coastal Transect Schematic
Methods used in coastal analyses in this FIS project are presented in Section 5.3 and mapping methods are provided in Section 6.4 of this FIS Report. Coastal floodplains are shown on the FIRM using the symbology described in Figure 3, “Map Legend for FIRM.” In many cases, the BFE on the FIRM is higher than the stillwater elevations shown in Table 17 due to the presence of wave effects. The higher elevation should be used for construction and/or floodplain management purposes.
2.5.4 Limit of Moderate Wave Action This section is not applicable to this FIS project.
SECTION 3.0 – INSURANCE APPLICATIONS
3.1 National Flood Insurance Program Insurance Zones For flood insurance applications, the FIRM designates flood insurance rate zones as described in Figure 3, “Map Legend for FIRM.” Flood insurance zone designations are assigned to flooding sources based on the results of the hydraulic or coastal analyses. Insurance agents use the zones shown on the FIRM and depths and base flood elevations in this FIS Report in conjunction with information on structures and their contents to assign premium rates for flood insurance policies.
The 1% annual chance floodplain boundary corresponds to the boundary of the areas of special flood hazards (e.g. Zones A, AE, V, VE, etc.), and the 0.2% annual chance floodplain boundary corresponds to the boundary of areas of additional flood hazards.
Table 3 lists the flood insurance zones in the unincorporated and incorporated areas of the City of Cordova.
LiMWA
21

Table 3: Flood Zone Designations by Community
Community Flood Zone(s)
City of Cordova A, AE, X
3.2 Coastal Barrier Resources System The Coastal Barrier Resources Act (CBRA) of 1982 was established by Congress to create areas along the Atlantic and Gulf coasts and the Great Lakes, where restrictions for Federal financial assistance including flood insurance are prohibited. In 1990, Congress passed the Coastal Barrier Improvement Act (CBIA), which increased the extent of areas established by the CBRA and added “Otherwise Protected Areas” (OPA) to the system. These areas are collectively referred to as the John. H Chafee Coastal Barrier Resources System (CBRS). The CBRS boundaries that have been identified in the project area are in Table 4, “Coastal Barrier Resource System Information.”
Table 4: Coastal Barrier Resources System Information [Not Applicable to this FIS Project]
SECTION 4.0 – AREA STUDIED
4.1 Basin Description Table 5 contains a description of the characteristics of the HUC-8 sub-basins within which each community falls. The table includes the main flooding sources within each basin, a brief description of the basin, and its drainage area.
Table 5: Basin Characteristics
HUC-8 Sub-Basin Name
HUC-8 Sub-Basin Number
Primary Flooding Source Description of Affected Area
Drainage Area
(square miles)
Cordova_2 19020104 Eyak Lake Subbasin of Eyak Lake 41.9
Cordova_3 19020104 Ibeck Creek Subbasin of Ibeck Creek 1.1
Cordova_4 19020104 Eyak River Subbasin of Eyak River 42.2
Cordova_5 19020104 Eyak River Subbasin of Eyak River 43.3
Cordova_6 19020104 Creek No. 1 Subbasin of Creek No. 1 0.6
Cordova_7 19020201 Fleming Creek Subbasin of Fleming Creek 0.6
Cordova_8 19020104 Creek No.2 Subbasin of Creek No.2 0.5
22
4.2 Principal Flood Problems Table 6 contains a description of the principal flood problems that have been noted for the City of Cordova by flooding source.
Table 6: Principal Flood Problems
Flooding Source Description of Flood Problems
Eyak River The Eyak River, which drains Eyak Lake, does not have the capacity for peak flow and hence the lake level rises. The weir which was added does slightly increase the flooding problem. The weir will be submerged several feet during flood flows. Had the weir not been installed, the flooding problem probably would have been reduced as the lake and Eyak River eroded towards prequake levels. Local residents have reported high water in 1949 and several other times on the lake. The lake level has been over the landing strip next to Eyak Lake, which corresponds to a water level that is approximately six feet higher than the outlet weir on the lake.
Table 7 contains information about historic flood elevations in the communities within the City of Cordova.
Table 7: Historic Flooding Elevations [Not Applicable to this FIS Project]
4.3 Non-Levee Flood Protection Measures Table 8 contains information about non-levee flood protection measures within City of Cordova such as dams, jetties, and or dikes. Levees are addressed in Section 4.4 of this FIS Report.
Table 8: Non-Levee Flood Protection Measures
Flooding Source
Structure Name
Type of Measure Location Description of Measure
Eyak River N/A Dam Dam located on the lake at the mouth of the Eyak River
N/A
Eyak River Copper River
Highway Bridge Copper River
Highway N/A
Eyak River N/A Weir Eyak Lake Outfall 245 foot broad-crested spillway
Orca Inlet Cordova Marine
Breakwater Revetment
Approximately 1,500 feet west of the intersection of Railroad Avenue and Nicholoff Way
Coastal armoring structure
23
4.4 Levees This section is not applicable to this FIS project.
Table 9: Levees [Not Applicable to this FIS Project]
SECTION 5.0 – ENGINEERING METHODS For the flooding sources in the community, standard hydrologic and hydraulic study methods were used to determine the flood hazard data required for this study. Flood events of a magnitude that are expected to be equaled or exceeded at least once on the average during any 10-, 25-, 50-, 100-, or 500-year period (recurrence interval) have been selected as having special significance for floodplain management and for flood insurance rates. These events, commonly termed the 10-, 25-, 50-, 100-, and 500-year floods, have a 10-, 4-, 2-, 1-, and 0.2% annual chance, respectively, of being equaled or exceeded during any year.
Although the recurrence interval represents the long-term, average period between floods of a specific magnitude, rare floods could occur at short intervals or even within the same year. The risk of experiencing a rare flood increases when periods greater than 1 year are considered. For example, the risk of having a flood that equals or exceeds the 100-year flood (1-percent chance of annual exceedance) during the term of a 30-year mortgage is approximately 26 percent (about 3 in 10); for any 90-year period, the risk increases to approximately 60 percent (6 in 10). The analyses reported herein reflect flooding potentials based on conditions existing in the community at the time of completion of this study. Maps and flood elevations will be amended periodically to reflect future changes.
The engineering analyses described here incorporate the results of previously issued Letters of Map Change (LOMCs) listed in Table 27, “Incorporated Letters of Map Change”, which include Letters of Map Revision (LOMRs). For more information about LOMRs, refer to Section 6.5, “FIRM Revisions.”
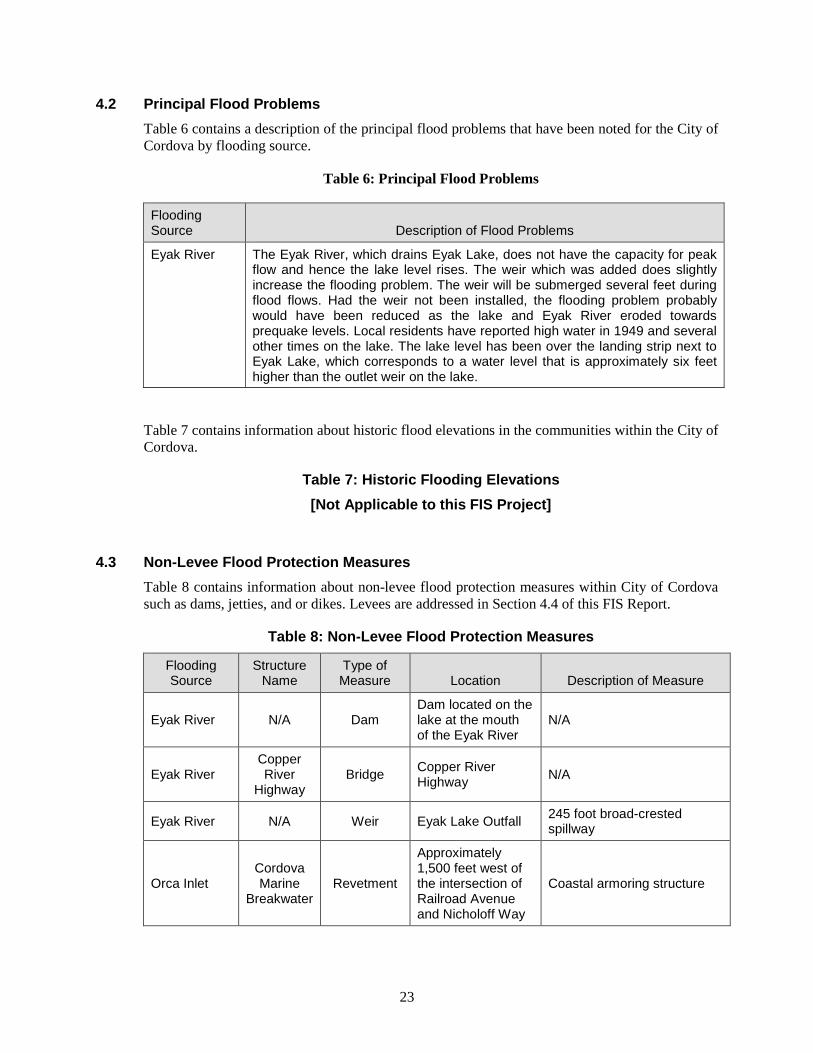
5.1 Hydrologic Analyses Hydrologic analyses were carried out to establish the peak elevation-frequency relationships for floods of the selected recurrence intervals for each flooding source studied. Hydrologic analyses are typically performed at the watershed level. Depending on factors such as watershed size and shape, land use and urbanization, and natural or man-made storage, various models or methodologies may be applied. A summary of the hydrologic methods applied to develop the discharges used in the hydraulic analyses for each stream is provided in Table 13. Greater detail (including assumptions, analysis, and results) is available in the archived project documentation.
A summary of the discharges is provided in Table 10. Frequency Discharge-Drainage Area Curves used to develop the hydrologic models may also be shown in Figure 7 for selected flooding sources. A summary of stillwater elevations developed for non-coastal flooding sources is provided in Table 11. (Coastal stillwater elevations are discussed in Section 5.3 and shown in Table 17.) Stream gage information is provided in Table 12.
24
Table 10: Summary of Discharges
Peak Discharge (cfs)
Flooding Source Location
Drainage Area (square miles)
10% Annual Chance
4% Annual Chance
2% Annual Chance
1% Annual Chance Existing
1% Annual Chance Future
0.2% Annual Chance
Creek No.1
Approximately 0.2 miles east of the intersection at Spruce Road and Eyak Lake Road
0.56 * * * 340 * *
Creek No.2
Just upstream of the intersection at Eyak Lake Road and Lake View Drive
0.49 * * * 310 * *
Eyak Lake At Outlet 41.88 8,660 10,230 11,420 12,550 * 15,290
Eyak River
Just upstream of the confluence with Ibeck Creek
42.21 3,480 4,230 4,810 5,380 * 6,780
Approximately 0.6 miles downstream of the confluence with Ibeck Creek
43.33 3,670 4,450 5,060 5,660 * 7,120
Ibeck Creek At the confluence of Eyak River 1.11 * * * 270 * *
Fleming Creek Approximately 0.75 miles north of the Cordova Ferry
0.64 * * * 360 * *
Power Creek Approximately 5.2 miles upstream of Copper River Highway
20.73 4,670 5,530 6,790 8,290 8,660
*Not calculated for this FIS project
25
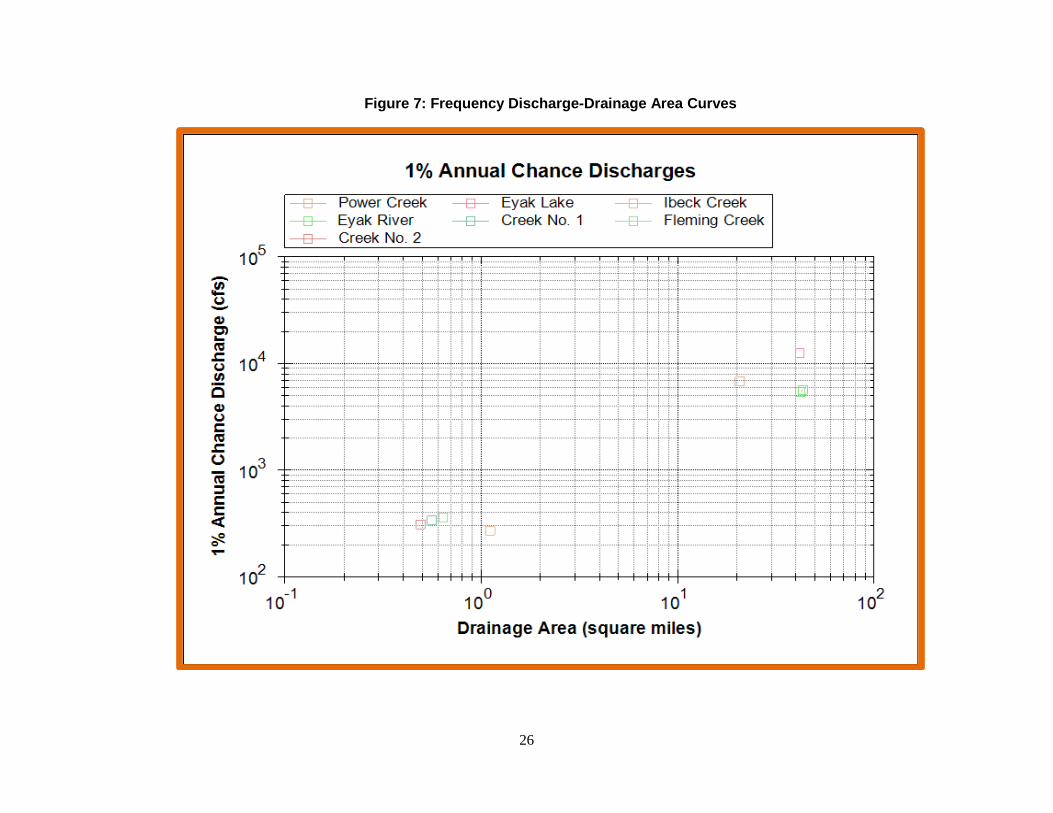
Figure 7: Frequency Discharge-Drainage Area Curves
26
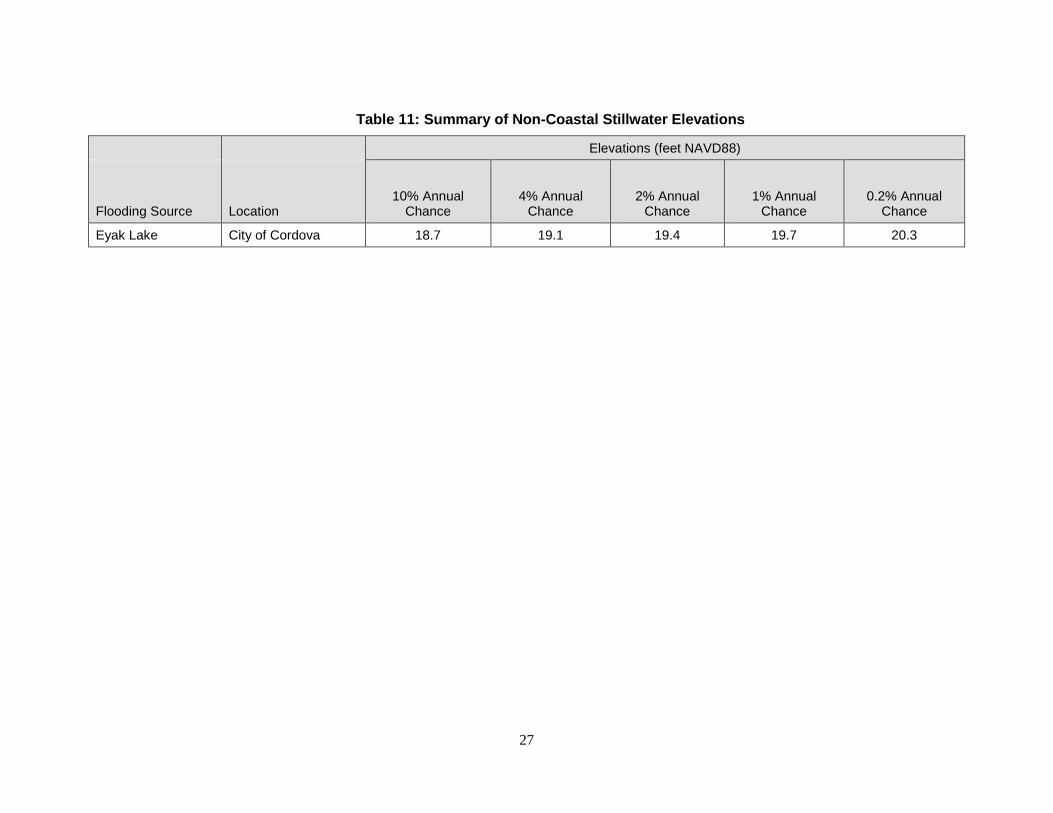
Table 11: Summary of Non-Coastal Stillwater Elevations
Elevations (feet NAVD88)
Flooding Source Location 10% Annual
Chance 4% Annual
Chance 2% Annual
Chance 1% Annual
Chance 0.2% Annual
Chance
Eyak Lake City of Cordova 18.7 19.1 19.4 19.7 20.3
27

Table 12: Stream Gage Information used to Determine Discharges
Flooding Source
Gage Identifier
Agency that
Maintains Gage Site Name
Drainage Area
(square miles)
Period of Record
From To
POWER CREEK (NEAR CORDOVA AK)
15216000
U.S. Geological Survey (USGS)
USGS GAGE ON POWER CREEK NEAR CORDOVA AK
21 10/1/1947 9/21/1995
5.2 Hydraulic Analyses Analyses of the hydraulic characteristics of flooding from the sources studied were carried out to provide estimates of the elevations of floods of the selected recurrence intervals. Base flood elevations on the FIRM represent the elevations shown on the Flood Profiles and in the Floodway Data tables in the FIS Report. Rounded whole-foot elevations may be shown on the FIRM in coastal areas, areas of ponding, and other areas with static base flood elevations. These whole-foot elevations may not exactly reflect the elevations derived from the hydraulic analyses. Flood elevations shown on the FIRM are primarily intended for flood insurance rating purposes. For construction and/or floodplain management purposes, users are cautioned to use the flood elevation data presented in this FIS Report in conjunction with the data shown on the FIRM. The hydraulic analyses for this FIS were based on unobstructed flow. The flood elevations shown on the profiles are thus considered valid only if hydraulic structures remain unobstructed, operate properly, and do not fail.
For streams for which hydraulic analyses were based on cross sections, locations of selected cross sections are shown on the Flood Profiles (Exhibit 1). For stream segments for which a floodway was computed (Section 6.3), selected cross sections are also listed on Table 24, “Floodway Data.”
A summary of the methods used in hydraulic analyses performed for this project is provided in Table 13. Roughness coefficients are provided in Table 14. Roughness coefficients are values representing the frictional resistance water experiences when passing overland or through a channel. They are used in the calculations to determine water surface elevations. Greater detail (including assumptions, analysis, and results) is available in the archived project documentation.
28
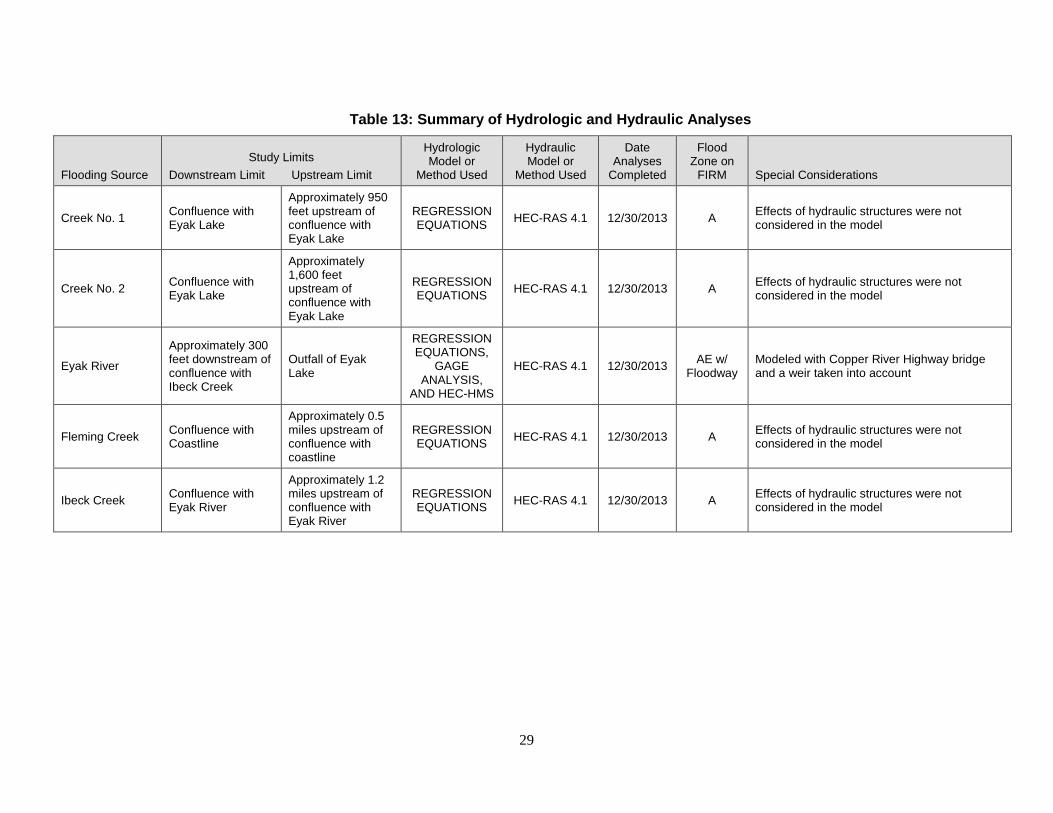
Table 13: Summary of Hydrologic and Hydraulic Analyses
Flooding Source Study Limits
Downstream Limit Upstream Limit
Hydrologic Model or
Method Used
Hydraulic Model or
Method Used
Date Analyses
Completed
Flood Zone on
FIRM Special Considerations
Creek No. 1 Confluence with Eyak Lake
Approximately 950 feet upstream of confluence with Eyak Lake
REGRESSION EQUATIONS HEC-RAS 4.1 12/30/2013 A Effects of hydraulic structures were not
considered in the model
Creek No. 2 Confluence with Eyak Lake
Approximately 1,600 feet upstream of confluence with Eyak Lake
REGRESSION EQUATIONS HEC-RAS 4.1 12/30/2013 A Effects of hydraulic structures were not
considered in the model
Eyak River
Approximately 300 feet downstream of confluence with Ibeck Creek
Outfall of Eyak Lake
REGRESSION EQUATIONS,
GAGE ANALYSIS,
AND HEC-HMS
HEC-RAS 4.1 12/30/2013 AE w/ Floodway
Modeled with Copper River Highway bridge and a weir taken into account
Fleming Creek Confluence with Coastline
Approximately 0.5 miles upstream of confluence with coastline
REGRESSION EQUATIONS HEC-RAS 4.1 12/30/2013 A Effects of hydraulic structures were not
considered in the model
Ibeck Creek Confluence with Eyak River
Approximately 1.2 miles upstream of confluence with Eyak River
REGRESSION EQUATIONS HEC-RAS 4.1 12/30/2013 A Effects of hydraulic structures were not
considered in the model
29
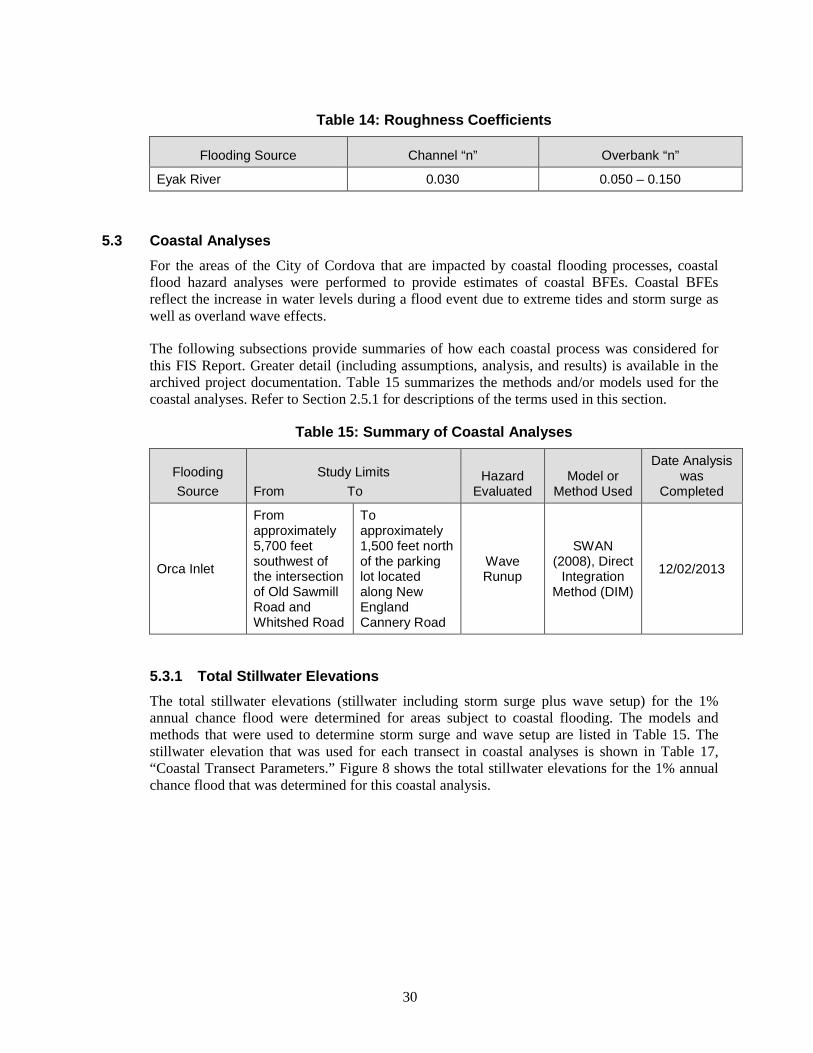
Table 14: Roughness Coefficients
Flooding Source Channel “n” Overbank “n”
Eyak River 0.030 0.050 – 0.150
5.3 Coastal Analyses For the areas of the City of Cordova that are impacted by coastal flooding processes, coastal flood hazard analyses were performed to provide estimates of coastal BFEs. Coastal BFEs reflect the increase in water levels during a flood event due to extreme tides and storm surge as well as overland wave effects.
The following subsections provide summaries of how each coastal process was considered for this FIS Report. Greater detail (including assumptions, analysis, and results) is available in the archived project documentation. Table 15 summarizes the methods and/or models used for the coastal analyses. Refer to Section 2.5.1 for descriptions of the terms used in this section.
Table 15: Summary of Coastal Analyses
Flooding Source
Study Limits From To
Hazard Evaluated
Model or Method Used
Date Analysis was
Completed
Orca Inlet
From approximately 5,700 feet southwest of the intersection of Old Sawmill Road and Whitshed Road
To approximately 1,500 feet north of the parking lot located along New England Cannery Road
Wave Runup
SWAN (2008), Direct
Integration Method (DIM)
12/02/2013
5.3.1 Total Stillwater Elevations The total stillwater elevations (stillwater including storm surge plus wave setup) for the 1% annual chance flood were determined for areas subject to coastal flooding. The models and methods that were used to determine storm surge and wave setup are listed in Table 15. The stillwater elevation that was used for each transect in coastal analyses is shown in Table 17, “Coastal Transect Parameters.” Figure 8 shows the total stillwater elevations for the 1% annual chance flood that was determined for this coastal analysis.
30
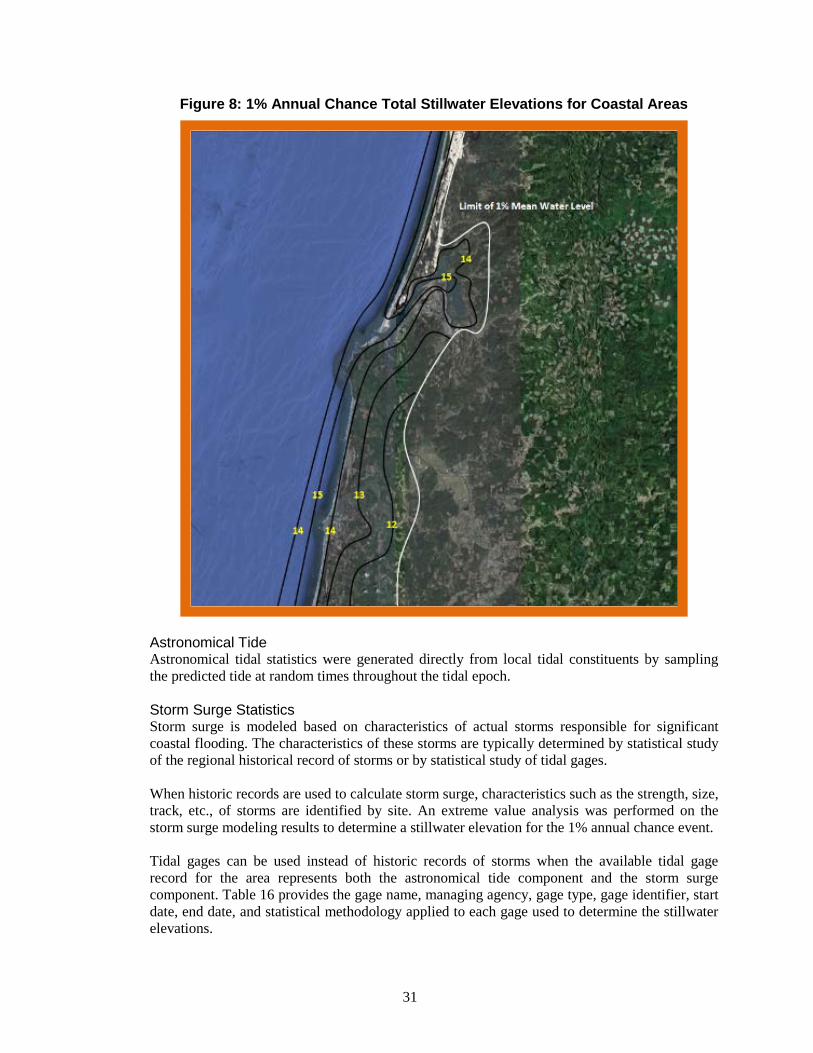
Figure 8: 1% Annual Chance Total Stillwater Elevations for Coastal Areas
Astronomical Tide Astronomical tidal statistics were generated directly from local tidal constituents by sampling the predicted tide at random times throughout the tidal epoch. Storm Surge Statistics Storm surge is modeled based on characteristics of actual storms responsible for significant coastal flooding. The characteristics of these storms are typically determined by statistical study of the regional historical record of storms or by statistical study of tidal gages. When historic records are used to calculate storm surge, characteristics such as the strength, size, track, etc., of storms are identified by site. An extreme value analysis was performed on the storm surge modeling results to determine a stillwater elevation for the 1% annual chance event. Tidal gages can be used instead of historic records of storms when the available tidal gage record for the area represents both the astronomical tide component and the storm surge component. Table 16 provides the gage name, managing agency, gage type, gage identifier, start date, end date, and statistical methodology applied to each gage used to determine the stillwater elevations.
31
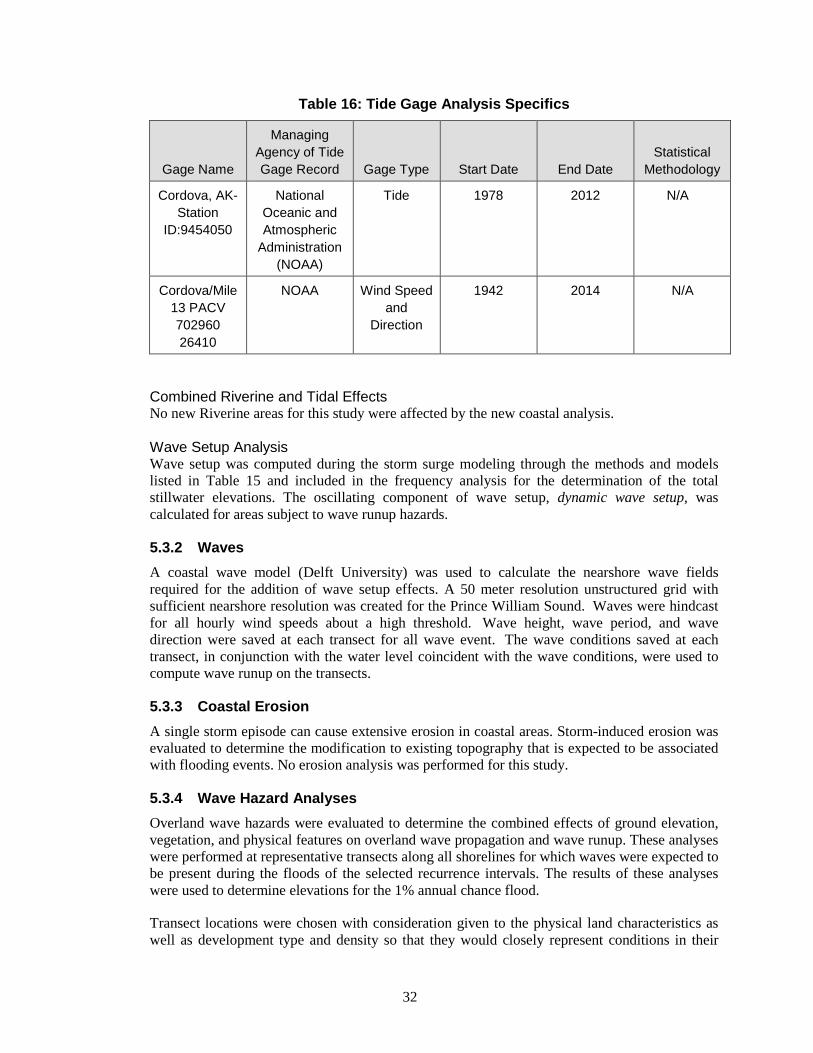
Table 16: Tide Gage Analysis Specifics
Gage Name
Managing Agency of Tide Gage Record Gage Type Start Date End Date
Statistical Methodology
Cordova, AK- Station
ID:9454050
National Oceanic and Atmospheric
Administration (NOAA)
Tide 1978 2012 N/A
Cordova/Mile 13 PACV 702960 26410
NOAA Wind Speed and
Direction
1942 2014 N/A
Combined Riverine and Tidal Effects No new Riverine areas for this study were affected by the new coastal analysis. Wave Setup Analysis Wave setup was computed during the storm surge modeling through the methods and models listed in Table 15 and included in the frequency analysis for the determination of the total stillwater elevations. The oscillating component of wave setup, dynamic wave setup, was calculated for areas subject to wave runup hazards.
5.3.2 Waves A coastal wave model (Delft University) was used to calculate the nearshore wave fields required for the addition of wave setup effects. A 50 meter resolution unstructured grid with sufficient nearshore resolution was created for the Prince William Sound. Waves were hindcast for all hourly wind speeds about a high threshold. Wave height, wave period, and wave direction were saved at each transect for all wave event. The wave conditions saved at each transect, in conjunction with the water level coincident with the wave conditions, were used to compute wave runup on the transects.
5.3.3 Coastal Erosion A single storm episode can cause extensive erosion in coastal areas. Storm-induced erosion was evaluated to determine the modification to existing topography that is expected to be associated with flooding events. No erosion analysis was performed for this study.
5.3.4 Wave Hazard Analyses Overland wave hazards were evaluated to determine the combined effects of ground elevation, vegetation, and physical features on overland wave propagation and wave runup. These analyses were performed at representative transects along all shorelines for which waves were expected to be present during the floods of the selected recurrence intervals. The results of these analyses were used to determine elevations for the 1% annual chance flood.
Transect locations were chosen with consideration given to the physical land characteristics as well as development type and density so that they would closely represent conditions in their
32
locality. Additional consideration was given to changes in the total stillwater elevation. Transects were spaced close together in areas of complex topography and dense development or where total stillwater elevations varied. In areas having more uniform characteristics, transects were spaced at larger intervals. Transects shown in Figure 9, “Transect Location Map,” are also depicted on the FIRM. Table 17 provides the location, stillwater elevations, and starting wave conditions for each transect evaluated for overland wave hazards. In this table, “starting” indicates the parameter value at the beginning of the transect.
Wave Height Analysis Wave height analyses were performed to determine wave heights and corresponding wave crest elevations for the areas inundated by coastal flooding and subject to overland wave propagation hazards. Refer to Figure 6 for a schematic of a coastal transect evaluated for overland wave propagation hazards.
Wave heights and wave crest elevations were modeled using the methods and models listed in Table 15, “Summary of Coastal Analyses”.
Wave Runup Analysis Wave runup analyses were performed to determine the height and extent of runup beyond the limit of stillwater inundation for the 1% annual chance flood. Wave runup elevations were modeled using the methods and models listed in Table 15.
33
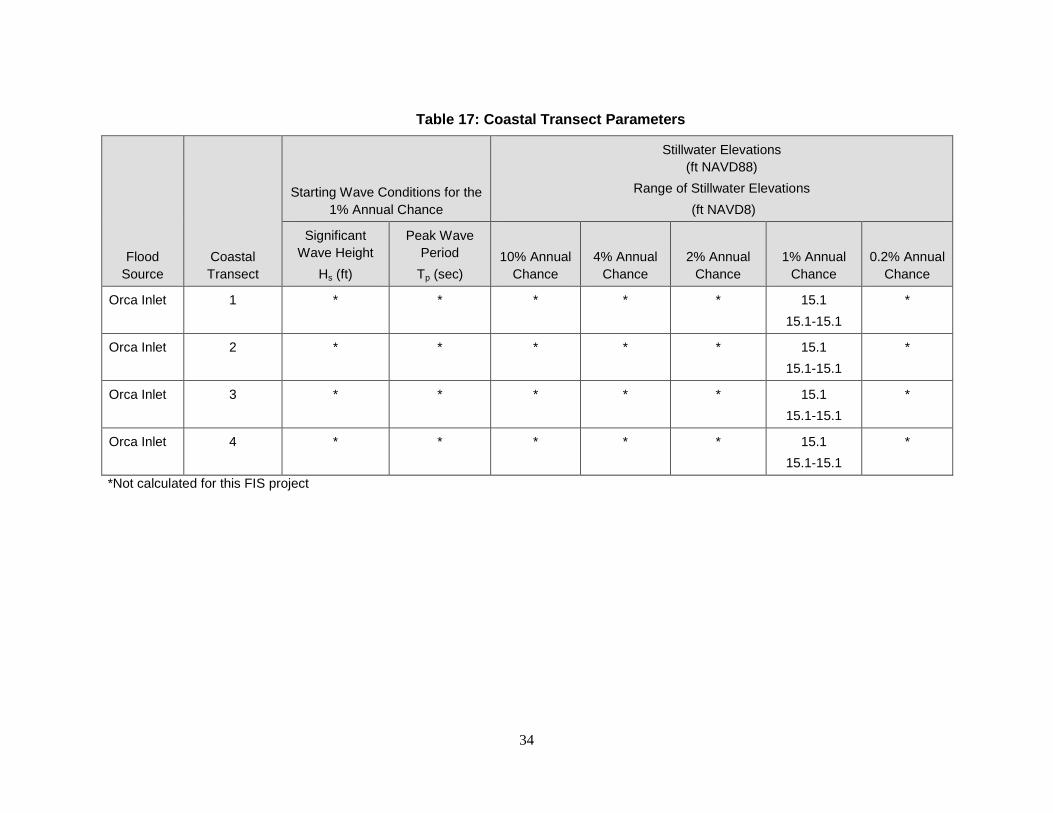
Table 17: Coastal Transect Parameters
Flood Source
Coastal Transect
Starting Wave Conditions for the 1% Annual Chance
Stillwater Elevations (ft NAVD88)
Range of Stillwater Elevations (ft NAVD8)
Significant Wave Height
Hs (ft)
Peak Wave Period
Tp (sec) 10% Annual
Chance 4% Annual
Chance 2% Annual
Chance 1% Annual
Chance 0.2% Annual
Chance
Orca Inlet 1 * * * * * 15.1 15.1-15.1
*
Orca Inlet 2 * * * * * 15.1 15.1-15.1
*
Orca Inlet 3 * * * * * 15.1 15.1-15.1
*
Orca Inlet 4 * * * * * 15.1 15.1-15.1
*
*Not calculated for this FIS project
34
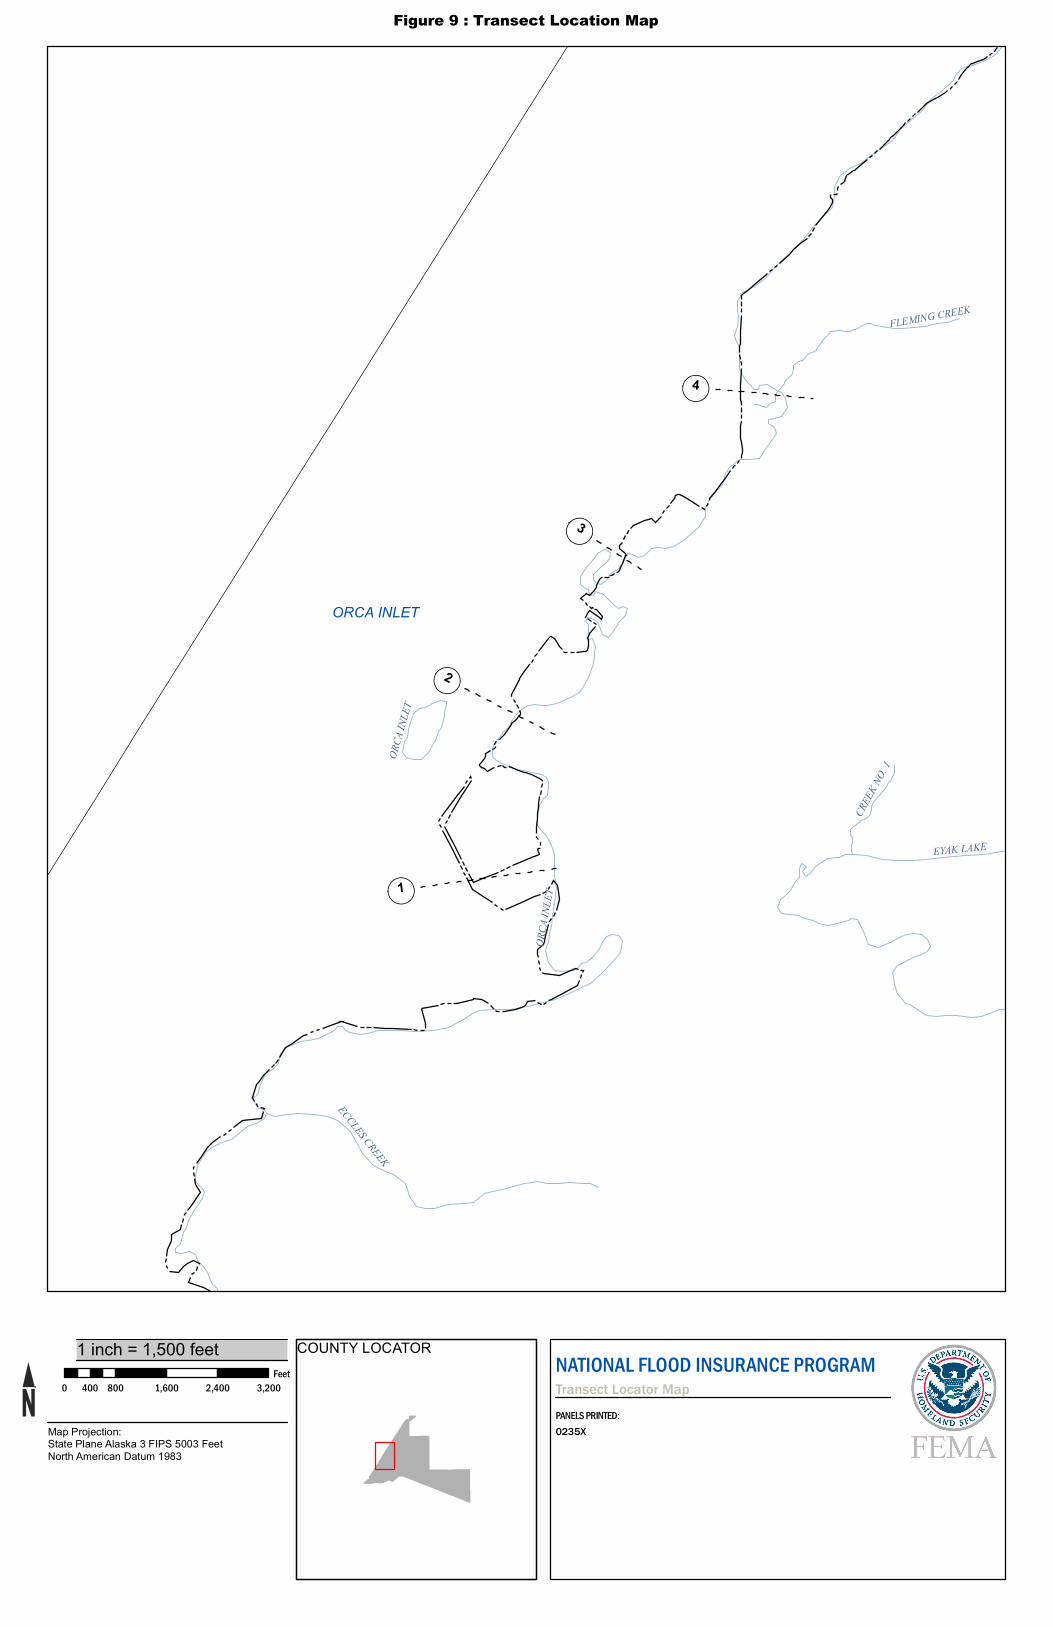
ORCA
INLE
T
ECCLES CREEK
EYAK LAKE
FLEMING CREEK
CREE
K NO.
1ORCA
INLE
T
!(1
!(2
!(4
!(3
NATIONAL FLOOD INSURANCE PROGRAMTransect Locator MapPANELS PRINTED:0235XMap Projection:
State Plane Alaska 3 FIPS 5003 FeetNorth American Datum 1983
0 800 1,600 2,400 3,200400Feet
1 inch = 1,500 feet COUNTY LOCATOR
ORCA INLET
Figure 9 : Transect Location Map
5.4 Alluvial Fan Analyses This section is not applicable to this FIS project.
Table 18: Summary of Alluvial Fan Analyses [Not Applicable to this FIS Project]
Table 19: Results of Alluvial Fan Analyses [Not Applicable to this FIS Project]
SECTION 6.0 – MAPPING METHODS
6.1 Vertical and Horizontal Control All FIS Reports and FIRMs are referenced to a specific vertical datum. The vertical datum provides a starting point against which flood, ground, and structure elevations can be referenced and compared. Until recently, the standard vertical datum used for newly created or revised FIS Reports and FIRMs was the NGVD29. With the completion of the NAVD88, many FIS Reports and FIRMs are now prepared using NAVD88 as the referenced vertical datum.
Flood elevations shown in this FIS Report and on the FIRMs are referenced to NAVD88. These flood elevations must be compared to structure and ground elevations referenced to the same vertical datum. For information regarding conversion between NGVD29 and NAVD88 or other datum conversion, visit the National Geodetic Survey website at www.ngs.noaa.gov, or contact the National Geodetic Survey at the following address:
NGS Information Services NOAA, N/NGS12
National Geodetic Survey SSMC-3, #9202
1315 East-West Highway Silver Spring, Maryland 20910-3282
(301) 713-3242
Temporary vertical monuments are often established during the preparation of a flood hazard analysis for the purpose of establishing local vertical control. Although these monuments are not shown on the FIRM, they may be found in the archived project documentation associated with the FIS Report and the FIRMs for this community. Interested individuals may contact FEMA to access these data.
To obtain current elevation, description, and/or location information for benchmarks in the area, please contact information services Branch of the NGS at (301) 713-3242, or visit their website at www.ngs.noaa.gov.
36
The datum conversion locations and values that were calculated for the City of Cordova are provided in Table 20.
Table 20: Countywide Vertical Datum Conversion[Not Applicable to this FIS Project]
A countywide conversion factor could not be generated for the City of Cordova because the maximum variance from average exceeds 0.25 feet. Calculations for the vertical offsets on a stream by stream basis are depicted in Table 21.
Table 21: Stream-by-Stream Vertical Datum Conversion [Not Applicable to this FIS Project]
6.2 Base Map The FIRMs and FIS Report for this project have been produced in a digital format. The flood hazard information was converted to a Geographic Information System (GIS) format that meets FEMA’s FIRM database specifications and geographic information standards. This information is provided in a digital format so that it can be incorporated into a local GIS and be accessed more easily by the community. The FIRM Database includes most of the tabular information contained in the FIS Report in such a way that the data can be associated with pertinent spatial features. For example, the information contained in the Floodway Data table and Flood Profiles can be linked to the cross sections that are shown on the FIRMs. Additional information about the FIRM Database and its contents can be found in FEMA’s Guidelines and Standards for Mapping Partners, Appendix L.
Base map information shown on the FIRM was derived from the sources described in Table 22.
Table 22: Base Map Sources
Data Type Data Provider Data Date
Data Scale Data Description
S_BASE_INDEX and Structures
United States Department of
Agriculture Forest Service
2008 N/A Represents effective DFIRMs and LOMRs available as of the publication date
Public Land Survey System Sections
Alaska Department of Natural Resources
2012 1:24,000 PLSS data were digitized from USGS quadrangles
Political Boundaries
Alaska Department of Community and
Economic Development
2003 N/A Municipal and county boundaries
37
Table 22: Base Map Sources (continued)
Data Type Data Provider Data Date
Data Scale Data Description
Transportation Features
Alaska Department of Natural
Resources, Information Resource
Management Section
2006 N/A Roads and railroads
Lakes
United States Department of
Agriculture - Natural Resources
Conservation Service (NRCS)
2011 N/A Water features
Streams United States Department of
Agriculture - NRCS 2012 1:31,380 Water features
USGS 7.5-Minute Series Topographic Maps
USGS 1989 1:24,000 Physical and cultural details of Cordova, AK
6.3 Floodplain and Floodway Delineation The FIRM shows tints, screens, and symbols to indicate floodplains and floodways as well as the locations of selected cross sections used in the hydraulic analyses and floodway computations.
For riverine flooding sources, the mapped floodplain boundaries shown on the FIRM have been delineated using the flood elevations determined at each cross section; between cross sections, the boundaries were interpolated using the topographic elevation data described in Table 23. For each coastal flooding source studied as part of this FIS Report, the mapped floodplain boundaries on the FIRM have been delineated using the flood and wave elevations determined at each transect; between transects, boundaries were delineated using land use and land cover data, the topographic elevation data described in Table 23, and knowledge of coastal flood processes. In ponding areas, flood elevations were determined at each junction of the model; between junctions, boundaries were interpolated using the topographic elevation data described in Table 23.
In cases where the 1% and 0.2% annual chance floodplain boundaries are close together, only the 1% annual chance floodplain boundary has been shown. Small areas within the floodplain boundaries may lie above the flood elevations but cannot be shown due to limitations of the map scale and/or lack of detailed topographic data.
The floodway widths presented in this FIS Report and on the FIRM were computed for certain stream segments on the basis of equal conveyance reduction from each side of the floodplain. Floodway widths were computed at cross sections. Between cross sections, the floodway
38
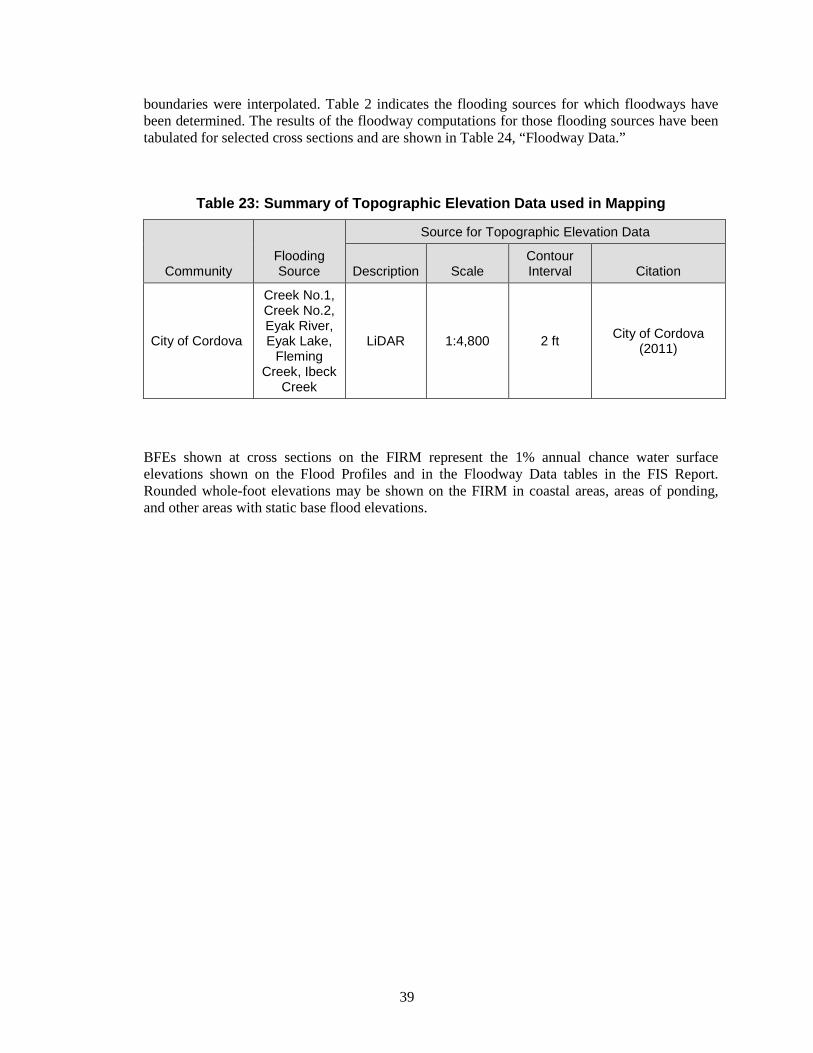
boundaries were interpolated. Table 2 indicates the flooding sources for which floodways have been determined. The results of the floodway computations for those flooding sources have been tabulated for selected cross sections and are shown in Table 24, “Floodway Data.”
Table 23: Summary of Topographic Elevation Data used in Mapping
Community Flooding Source
Source for Topographic Elevation Data
Description Scale Contour Interval Citation
City of Cordova
Creek No.1, Creek No.2, Eyak River, Eyak Lake,
Fleming Creek, Ibeck
Creek
LiDAR 1:4,800 2 ft City of Cordova (2011)
BFEs shown at cross sections on the FIRM represent the 1% annual chance water surface elevations shown on the Flood Profiles and in the Floodway Data tables in the FIS Report. Rounded whole-foot elevations may be shown on the FIRM in coastal areas, areas of ponding, and other areas with static base flood elevations.
39
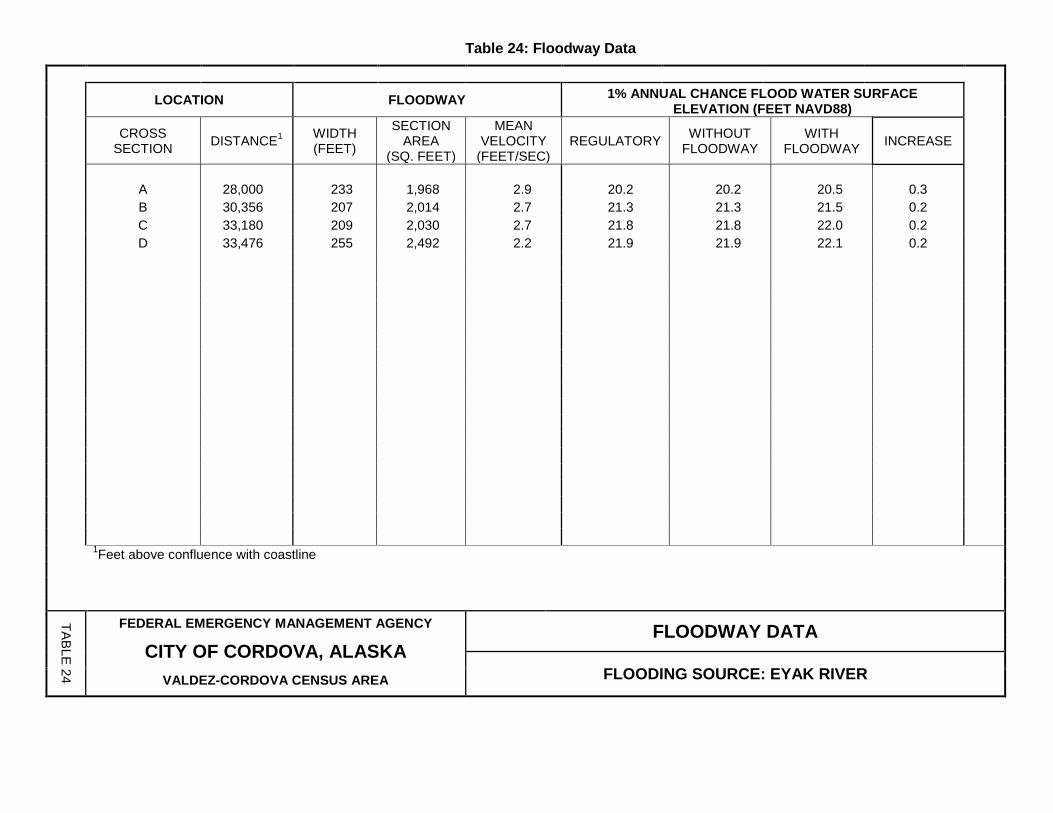
Table 24: Floodway Data
LOCATION FLOODWAY 1% ANNUAL CHANCE FLOOD WATER SURFACE
ELEVATION (FEET NAVD88)
CROSS SECTION DISTANCE1 WIDTH
(FEET)
SECTION AREA
(SQ. FEET)
MEAN VELOCITY
(FEET/SEC) REGULATORY WITHOUT
FLOODWAY WITH
FLOODWAY INCREASE
A 28,000 233 1,968 2.9 20.2 20.2 20.5 0.3 B 30,356 207 2,014 2.7 21.3 21.3 21.5 0.2 C 33,180 209 2,030 2.7 21.8 21.8 22.0 0.2 D 33,476 255 2,492 2.2 21.9 21.9 22.1 0.2 1Feet above confluence with coastline
TABLE 24
FEDERAL EMERGENCY MANAGEMENT AGENCY FLOODWAY DATA CITY OF CORDOVA, ALASKA
FLOODING SOURCE: EYAK RIVER
VALDEZ-CORDOVA CENSUS AREA
Table 25: Flood Hazard and Non-Encroachment Data for Selected Streams [Not Applicable to this FIS Project]
6.4 Coastal Flood Hazard Mapping Flood insurance zones and BFEs including the wave effects were identified on each transect based on the results from the onshore wave hazard analyses. Between transects, elevations were interpolated using topographic maps, land-use and land-cover data, and knowledge of coastal flood processes to determine the aerial extent of flooding. Sources for topographic data are shown in Table 23.
Zone VE is subdivided into elevation zones and BFEs are provided on the FIRM.
The limit of Zone VE shown on the FIRM is defined as the farthest inland extent of any of these criteria (determined for the 1% annual chance flood condition):
• The primary frontal dune zone is defined in 44 CFR Section 59.1 of the NFIP regulations. The primary frontal dune represents a continuous or nearly continuous mound or ridge of sand with relatively steep seaward and landward slopes that occur immediately landward and adjacent to the beach. The primary frontal dune zone is subject to erosion and overtopping from high tides and waves during major coastal storms. The inland limit of the primary frontal dune zone occurs at the point where there is a distinct change from a relatively steep slope to a relatively mild slope.
• The wave runup zone occurs where the (eroded) ground profile is 3.0 feet or more below the 2-percent wave runup elevation.
• The wave overtopping splash zone is the area landward of the crest of an overtopped barrier, in cases where the potential 2-percent wave runup exceeds the barrier crest elevation by 3.0 feet or more.
• The breaking wave height zone occurs where 3-foot or greater wave heights could occur (this is the area where the wave crest profile is 2.1 feet or more above the total stillwater elevation).
• The high-velocity flow zone is landward of the overtopping splash zone (or area on a sloping beach or other shore type), where the product of depth of flow times the flow velocity squared (hv2) is greater than or equal to 200 ft3/sec2. This zone may only be used on the Pacific Coast.
The SFHA boundary indicates the limit of SFHAs shown on the FIRM as either “V” zones or “A” zones.
Table 26 indicates the coastal analyses used for floodplain mapping and the criteria used to determine the inland limit of the open-coast Zone VE and the SFHA boundary at each transect.
Table 26: Summary of Coastal Transect Mapping Considerations [Not Applicable to this FIS Project]
41
6.5 FIRM Revisions This FIS Report and the FIRM are based on the most up-to-date information available to FEMA at the time of its publication; however, flood hazard conditions change over time. Communities or private parties may request flood map revisions at any time. Certain types of requests require submission of supporting data. FEMA may also initiate a revision. Revisions to FIS projects may take several forms, including Letters of Map Amendment (LOMAs), Letters of Map Revision Based on Fill (LOMR-Fs), Letters of Map Revision (LOMRs) (referred to collectively as Letters of Map Change (LOMCs)), Physical Map Revisions (PMRs), and FEMA-contracted restudies. These types of revisions are further described below. Some of these types of revisions do not result in the republishing of the FIS Report. To assure that any user is aware of all revisions, it is advisable to contact the community repository of flood-hazard data (shown in Table 31, “Map Repositories”).
6.5.1 Letters of Map Amendment A LOMA is an official revision by letter to an effective NFIP map. A LOMA results from an administrative process that involves the review of scientific or technical data submitted by the owner or lessee of property who believes the property has incorrectly been included in a designated SFHA. A LOMA amends the currently effective FEMA map and establishes that a specific property is not located in a SFHA. A LOMA cannot be issued for properties located on the PFD (primary frontal dune).
To obtain an application for a LOMA, visit http://www.fema.gov and download the form “MT-1 Application Forms and Instructions for Conditional and Final Letters of Map Amendment and Letters of Map Revision Based on Fill”. Visit the “Flood Map-Related Fees” section to determine the cost, if any, of applying for a LOMA.
FEMA offers a tutorial on how to apply for a LOMA. The LOMA Tutorial Series can be accessed at http://www.fema.gov/plan/prevent/fhm/ot_lmreq.shtm.
For more information about how to apply for a LOMA, call the FEMA Map Information eXchange; toll free, at 1-877-FEMA MAP (1-877-336-2627).
6.5.2 Letters of Map Revision Based on Fill A LOMR-F is an official revision by letter to an effective NFIP map. A LOMR-F states FEMA’s determination concerning whether a structure or parcel has been elevated on fill above the base flood elevation and is, therefore, excluded from the SFHA.
Information about obtaining an application for a LOMR-F can be obtained in the same manner as that for a LOMA, by visiting http://www.fema.gov for the “MT-1 Application Forms and Instructions for Conditional and Final Letters of Map Amendment and Letters of Map Revision Based on Fill” or by calling the FEMA Map Information eXchange, toll free, at 1-877-FEMA MAP (1-877-336-2627). Fees for applying for a LOMR-F, if any, are listed in the “Flood Map-Related Fees” section.
A tutorial for LOMR-F is available at http://www.fema.gov/plan/prevent/fhm/ot_lmreq.shtm.
6.5.3 Letters of Map Revision A LOMR is an official revision to the currently effective FEMA map. It is used to change flood zones, floodplain and floodway delineations, flood elevations and planimetric features. All requests for LOMRs should be made to FEMA through the chief executive officer of the community, since it is the community that must adopt any changes and revisions to the map. If
42
the request for a LOMR is not submitted through the chief executive officer of the community, evidence must be submitted that the community has been notified of the request.
To obtain an application for a LOMR, visit http://www.fema.gov and download the form “MT-2 Application Forms and Instructions for Conditional Letters of Map Revision and Letters of Map Revision”. Visit the “Flood Map-Related Fees” section to determine the cost of applying for a LOMR. For more information about how to apply for a LOMR, call the FEMA Map Information eXchange; toll free, at 1-877-FEMA MAP (1-877-336-2627) to speak to a Map Specialist.
Previously issued mappable LOMCs (including LOMRs) that have been incorporated into the the City of Cordova FIRM are listed in Table 27.
Table 27: Incorporated Letters of Map Change
[Not Applicable to this FIS Project]
6.5.4 Physical Map Revisions PMRs are an official republication of a community’s NFIP map to effect changes to base flood elevations, floodplain boundary delineations, regulatory floodways and planimetric features. These changes typically occur as a result of structural works or improvements, annexations resulting in additional flood hazard areas or correction to base flood elevations or SFHAs.
The community’s chief executive officer must submit scientific and technical data to FEMA to support the request for a PMR. The data will be analyzed and the map will be revised if warranted. The community is provided with copies of the revised information and is afforded a review period. When the base flood elevations are changed, a 90-day appeal period is provided. A 6-month adoption period for formal approval of the revised map(s) is also provided.
For more information about the PMR process, please visit http://www.fema.gov and visit the “Flood Map Revision Processes” section.
6.5.5 Contracted Restudies The NFIP provides for a periodic review and restudy of flood hazards within a given community. FEMA accomplishes this through a national watershed-based mapping needs assessment strategy, known as the Coordinated Needs Management Strategy (CNMS). The CNMS is used by FEMA to assign priorities and allocate funding for new flood hazard analyses used to update the FIS Report and FIRM. The goal of CNMS is to define the validity of the engineering study data within a mapped inventory. The CNMS is used to track the assessment process, document engineering gaps and their resolution, and aid in prioritization for using flood risk as a key factor for areas identified for flood map updates. Visit www.fema.gov to learn more about the CNMS or contact the FEMA Regional Office listed in Section 8 of this FIS Report.
6.5.6 Community Map History The current FIRM presents flooding information for the entire geographic area of the City of Cordova. Previously, separate FIRMs, Flood Hazard Boundary Maps (FHBMs) and/or Flood Boundary and Floodway Maps (FBFMs) may have been prepared for the incorporated communities and the unincorporated areas in the county that had identified SFHAs. Current and historical data relating to the maps prepared for the project area are presented in Table 28, “Community Map History.” A description of each of the column headings and the source of the date is also listed below.
43
• Community Name includes communities falling within the geographic area shown on the FIRM, including those that fall on the boundary line, nonparticipating communities, and communities with maps that have been rescinded. Communities with No Special Flood Hazards are indicated by a footnote. If all maps (FHBM, FBFM, and FIRM) were rescinded for a community, it is not listed in this table unless SFHAs have been identified in this community.
• Initial Identification Date (First NFIP Map Published) is the date of the first NFIP map that identified flood hazards in the community. If the FHBM has been converted to a FIRM, the initial FHBM date is shown. If the community has never been mapped, the upcoming effective date or “pending” (for Preliminary FIS Reports) is shown. If the community is listed in Table 28 but not identified on the map, the community is treated as if it were unmapped.
• Initial FHBM Effective Date is the effective date of the first Flood Hazard Boundary Map (FHBM). This date may be the same date as the Initial NFIP Map Date.
• FHBM Revision Date(s) is the date(s) that the FHBM was revised, if applicable.
• Initial FIRM Effective Date is the date of the first effective FIRM for the community. This is the first effective date that is shown on the FIRM panel.
• FIRM Revision Date(s) is the date(s) the FIRM was revised, if applicable. This is the revised date that is shown on the FIRM panel, if applicable. As countywide studies are completed or revised, each community listed should have its FIRM dates updated accordingly to reflect the date of the countywide study. Once the FIRMs exist in countywide format, as Physical Map Revisions (PMR) of FIRM panels within the county are completed, the FIRM Revision Dates in the table for each community affected by the PMR are updated with the date of the PMR, even if the PMR did not revise all the panels within that community.
The initial effective date for the City of Cordova FIRMs was 04/02/1979.
Table 28: Community Map History
Community Name
Initial Identification Date (First NFIP Map Published)
Initial FHBM Effective Date
FHBM Revision Date(s)
Initial FIRM Effective
Date
FIRM Revision Date(s)
City of Cordova 5/24/1977 5/24/1977 N/A 4/2/1979 N/A
SECTION 7.0 – CONTRACTED STUDIES AND COMMUNITY COORDINATION
7.1 Contracted Studies Table 29 provides a summary of the contracted studies, by flooding source, that are included in this FIS Report.
44
Table 29: Summary of Contracted Studies Included in this FIS Report
Flooding Source
FIS Report Dated Contractor Number
Work Completed
Date Affected Communities
Creek No. 1 STARR HSFBHQ-09-D-0370 12/30/2013 City of Cordova
Creek No. 2 STARR HSFBHQ-09-D-0370 12/30/2013 City of Cordova
Eyak River STARR HSFBHQ-09-D-0370 12/30/2013 City of Cordova
Fleming Creek STARR HSFBHQ-09-
D-0370 12/26/2013 City of Cordova
Ibeck Creek STARR HSFBHQ-09-D-0370 12/30/2013 City of Cordova
Power Creek October 1978 Tryck,
Nyman and Hayes
H-4060 09/1977 City of Cordova
7.2 Community Meetings The dates of the community meetings held for this FIS project and any previous FIS projects are shown in Table 30. These meetings may have previously been referred to by a variety of names (Community Coordination Officer (CCO), Scoping, Discovery, etc.), but all meetings represent opportunities for FEMA, community officials, study contractors, and other invited guests to discuss the planning for and results of the project.
45
Table 30: Community Meetings
Community FIS Report Dated Date of Meeting Meeting Type Attended By
City of Cordova 03/04/11 Project
Discovery
Alaska DHS&EM, City of Cordova, Div. of Community and Regional Affairs, FEMA, STARR, U.S. Army Corps of Engineers, U.S. Forest Service
06/25/14 Flood Risk Review State of Alaska, City of Cordova, FEMA, STARR
46
SECTION 8.0 – ADDITIONAL INFORMATION
Information concerning the pertinent data used in the preparation of this FIS Report can be obtained by submitting an order with any required payment to the FEMA Engineering Library. For more information on this process, see http://www.fema.gov.
Table 31 is a list of the locations where FIRMs for City of Cordova can be viewed. Please note that the maps at these locations are for reference only and are not for distribution. Also, please note that only the maps for the community listed in the table are available at that particular repository. A user may need to visit another repository to view maps from an adjacent community.
Table 31: Map Repositories
Community Address City State Zip Code
City of Cordova 602 Railroad Ave Cordova AK 99574
The National Flood Hazard Layer (NFHL) dataset is a compilation of effective FIRM databases and LOMCs. Together they create a GIS data layer for a State or Territory. The NFHL is updated as studies become effective and extracts are made available to the public monthly. NFHL data can be viewed or ordered from the website shown in Table 32.
Table 32 contains useful contact information regarding the FIS Report, the FIRM, and other relevant flood hazard and GIS data. In addition, information about the state NFIP Coordinator and GIS Coordinator is shown in this table. At the request of FEMA, each Governor has designated an agency of State or territorial government to coordinate that State's or territory's NFIP activities. These agencies often assist communities in developing and adopting necessary floodplain management measures. State GIS Coordinators are knowledgeable about the availability and location of state and local GIS data in their state.
Table 32: Additional Information
FEMA and the NFIP
FEMA and FEMA Engineering Library website
http://www.fema.gov
NFIP website http://www.fema.gov/business/nfip
NFHL Dataset http://msc.fema.gov
FEMA Region X Federal Regional Center, 130 228th Street SW. Bothell, WA 98021-9796 (425) 487-4657
Other Federal Agencies
USGS website http://www.usgs.gov
Hydraulic Engineering Center website
http://www.hec.usace.army.mil
State Agencies and Organizations
47
Table 32: Additional Information (continued)
State NFIP Coordinator State National Floodplain Insurance Program (NFIP) Coordinator Christy Miller, CFM Alaska Dept. Community & Econ. Dev. 550 West 7th Avenue, Suite 1770 Anchorage, AK 99501-3510 (907) 269-4567 FAX (907) 269-4563 [email protected]
State GIS Coordinator State GIS Coordinator Richard McMahon Chief, Land Records Information System State of Alaska, Department of Natural Resources 550 West 7th Avenue, Suite 706 Anchorage, AK 99501 Phone: 907-269-8836 Fax: 907-563-1497 [email protected]
SECTION 9.0 – BIBLIOGRAPHY AND REFERENCES Table 33 includes sources used in the preparation of and cited in this FIS Report as well as additional studies that have been conducted in the study area.
48
Table 33: Bibliography and References
Citation in this FIS
Publisher/ Issuer
Publication Title, “Article,” Volume, Number, etc. Author/Editor
Place of Publication
Publication Date/
Date of Issuance Link
S_FLD_HAZ_AR, S_BFE, S_XS FEMA DFIRM Study for
Cordova, Alaska STARR (Stantec) Washington, D.C. January 2014 http://hazards.fema.gov
49

-5
5 5
10 10
15 15
20 20
25 25
30 30
35 35
40 40
28,000 28,500 29,000 29,500 30,000 30,500 31,000 31,500 32,000 32,500 33,000 33,500 34,000 34,500
ELE
VA
TIO
N IN
F
EE
T (N
AV
D88)
STREAM DISTANCE IN FEET ABOVE CONFLUENCE WITH COASTLINE
FE
DE
RA
L E
ME
RG
EN
CY
M
AN
AG
EM
EN
T A
GE
NC
Y
CIT
Y O
F C
OR
DO
VA
, A
K
FL
OO
D P
RO
FILE
S
EY
AK
R
IV
ER
01P
LEGEND
0.2% ANNUAL CHANCE FLOOD
1% ANNUAL CHANCE FLOOD
2% ANNUAL CHANCE FLOOD
4% ANNUAL CHANCE FLOOD
10% ANNUAL CHANCE FLOOD
STREAM BED
CROSS SECTION LOCATION
A B
C
D
CO
NF
LU
EN
CE
O
F IB
EC
K C
RE
EK
0
CO
PP
ER
R
IV
ER
HIG
HW
AY
LIM
IT
O
F S
TU
DY
A
T
O
UT
FA
LL O
F E
YA
K LA
KE
VA
LD
EZ
-C
OR
DO
VA
C
EN
SU
S A
RE
A
WEIR


![The Cordova daily times. (Cordova, Alaska). 1922-02-01 [p 2]....Title The Cordova daily times. (Cordova, Alaska). 1922-02-01 [p 2]. Subject Page from The Cordova daily times. (Cordova,](https://img.pdfslide.net/doc/110x75/5f8f03bfcfa04450ab46065f/the-cordova-daily-times-cordova-alaska-1922-02-01-p-2-title-the-cordova.jpg)


![The Cordova daily times. (Cordova, Alaska). 1920-07-24 [p 2].€¦ · ONTEEL Perfumed with the new odor flowers OTHER JONTEEL BEAUTY REQUISITES FACE POWDER JONTEEL ODOR JONTEEL COMBINATION](https://img.pdfslide.net/doc/110x75/60f8eafa6eebe56ce122529b/the-cordova-daily-times-cordova-alaska-1920-07-24-p-2-onteel-perfumed-with.jpg)