Embed Size (px)
Citation preview

Instruction Manual For Exercising the New Substation Model 4/30/2016 Page 1 of 28
Volume 15
INSTRUCTION MANUAL
FOR
EXERCISING THE NEW
SUBSTATION MODEL
Richard A. Uher RAIL SYSTEMS CENTER
2013 Country Club Drive Mount Vernon, PA 15135-3040 [email protected]
TOM Version 3.6.3a Edition
April 30, 2016
Updated March 15, 2015 for TOM Version 3.6 Updated April 30, 2016 for TOM Version 3.6.3a

Instruction Manual For Exercising the New Substation Model 4/30/2016 Page 2 of 28
Preface
This document is part of a series of instruction manuals, which can be used as guidelines for applying the Train Operations Model (TOM) to rail systems throughout the world. In this connotation, rail system definition includes main line railroads, heavy and light rail, trolleybuses, high-speed rail and MAGLEV and people movers. There are several manuals in the series: Volume 1 – An Introduction to the Instruction Manual for Applying the TOM Volume 2 – Instruction Manual for Applying the TOM to Transit Systems DC Electric – English Units Volume 3 – Instruction Manual for Applying the TOM to Transit Systems DC Electric – Metric Units Volume 4 – Instruction Manual for Applying the TOM to Transit Systems AC Electric – English Units Volume 5 – Instruction Manual for Applying the TOM to Transit Systems AC Electric – Metric Units Volume 6 – Instruction Manual for Applying the TOM to Railroads Fueled – English Units Volume 7 – Instruction Manual for Applying the TOM to Railroads Fueled – Metric Units Volume 8 – Instruction Manual for Applying the TOM to Rail Systems; Technology Aspects Volume 9 – Instruction Manual for Procedures and Shortcuts in the TOM Volume 10 – Instruction Manual for Including the Return Circuit in Electric Rail Systems Volume 11 - Instruction Manual Exercising the AC Drive Model Volume 12 – Instruction Manual DC Electric Power System Methodology Volume 13 – Instruction Manual AC Electric Power System Methodology Volume 14 – Instruction Manual Exercising the Rail Voltage Model for DC Traction Systems Volume 15 – Instruction Manual for Exercising the New Substation Model Volumes 2-7 cover nearly all transit systems and railroads in the world. This instruction manual is Volume 15.
These volumes are unprotected. Thus the user is free to make notes or rewrite sections according to his preferences.
The primary purpose for using the TOM is evaluation. The evaluation generally takes the form of a study, with certain objectives, which may or may not be well defined. As the study is conducted, new objectives may result, because of unanticipated results. Within the framework of evaluation, designs may be modified and further evaluated, so that in this sense, the TOM may be considered a design tool.
The TOM is used together with other standard software, such as Microsoft Office (in particular, WORD, EXCEL and POWERPOINT). This combined package is most effective in assembling client data as well as presenting results. In some instances, the TOM interacts directly with these office programs, while in other cases; the user handles the office packages directly.

Instruction Manual For Exercising the New Substation Model 4/30/2016 Page 3 of 28
Table of Contents 1 INTRODUCTION.................................................................................................................................. 5 2 APPLICATION TO TEST DC RAIL SYSTEM.................................................................................... 6
2.1 DESCRIPTION OF THE DC TEST RAIL SYSTEM ....................................... 6 2.1.1 Train ....................................................................................................................................... 6
2.1.1.1 Train Consists ............................................................................................................... 6 2.1.1.1.1 Types of Cars in Fleet ......................................................................... 6 2.1.1.1.2 Train Types......................................................................................... 7
2.1.1.2 Train Resistance Information ........................................................................................ 8 2.1.1.3 Car Physical Characteristics.......................................................................................... 9 2.1.1.4 Car Propulsion System.................................................................................................. 9
2.1.1.4.1 Cam Control ..................................................................................... 10 2.1.1.4.1.1 Tractive Effort Vs. Speed ......................................................... 10 2.1.1.4.1.2 Efficiency Curve in Power ...................................................... 10
2.1.1.4.2 AC Drive ......................................................................................... 11 2.1.1.4.2.1 Tractive Effort Vs. Speed ........................................................ 11 2.1.1.4.2.2 Electrical Braking Effort Vs. Speed ....................................... 11 2.1.1.4.2.3 Efficiency Curve in Power ..................................................... 12 2.1.1.4.2.4 Efficiency Curve in Electrical Braking .................................. 12
2.1.2 Right of Way Data................................................................................................................ 13 2.1.2.1 Rail System Layout ..................................................................................................... 13 2.1.2.2 Passenger System Information .................................................................................... 13
2.1.2.2.1 Passenger Load Factor..................................................................... 13 2.1.2.2.2 Passenger Station Dwell Time........................................................ 13
2.1.3 Electrical Distribution System Data ..................................................................................... 13 2.1.3.1 Substation Data ........................................................................................................... 14 2.1.3.2 Catenary and Rail Return Data.................................................................................... 15
2.1.4 Train Location ...................................................................................................................... 15 2.1.5 Operating Time..................................................................................................................... 15 2.1.6 Current Measurement ........................................................................................................... 15
3 Results .................................................................................................................................................. 16 3.1 TPS RESULTS ................................................................................................. 16 3.2 ENS RESULTS (SCHEDULE OFFSET = 0) .................................................. 16
3.2.1 All Rectifier Substations (Base Case)................................................................................... 16 3.2.2 All Controlled Rectifier Substations..................................................................................... 17 3.2.3 All Rectifier Inverter Substations ......................................................................................... 17 3.2.4 All Controlled Rectifier Inverter Substations ....................................................................... 18 3.2.5 Energy Comparisons............................................................................................................. 19
3.2.5.1 Controlled Rectifier less Base ..................................................................................... 19 3.2.5.2 Rectifier Inverter less Base..................................................................................... 19 3.2.5.3 Controlled Rectifier Inverter Less Base ................................................................. 20
3.2.6 Minimum Line Voltage and Maximum Line Current........................................................... 20 3.2.6.1 Rectifier Substations ................................................................................................... 21 3.2.6.2 Controlled Rectifier Substations............................................................................. 22 3.2.6.3 Rectifier Inverter Substations ................................................................................. 23 3.2.6.4 Controlled Rectifier Inverter Substations ............................................................... 23
3.3 ENS RESULTS (VARYING SCHEDULE OFFSET) ..................................... 24 3.3.1 Rectifier Substations............................................................................................................. 24

Instruction Manual For Exercising the New Substation Model 4/30/2016 Page 4 of 28
3.3.2 Inverter Substations .............................................................................................................. 25 3.3.3 Energy Comparisons Inverter vs Rectifier Substations ........................................................ 25
3.4 ENS RESULTS (VARYING INVERTER CONTROL VOLTAGE) .............. 25 3.5 ENS RESULTS (VARYING CONTROLLED RECTIFIER CONTROL VOLTAGE) ................................................................................................................... 26
4 SUMMARY................................................................................................................................... 27

Instruction Manual For Exercising the New Substation Model 4/30/2016 Page 5 of 28
1 INTRODUCTION The purpose of this instruction manual is to provide the guidelines for applying the new substation model which is used in TOM Version 3.6.3. These models have been revisited and revised. This document can be used as a guideline for applying the TOM to most of the Transit Authorities in order to provide input to a cost-effective solution on substation types based on rectifiers, controlled rectifiers and/or inverters. The choice of substation types has an impact both on the capital costs of the power distribution system installation as well as on the energy component of operating cost. Questions to be answered would include:
1. How does the choice of a set of substation types influence the capital cost of the installation budget?
2. How does the choice of a set of substation types affect the energy component of operating cost in the future operation of the system?
3. Should there be a mixture of substation types to provide an optimum solution to the cost equation?
This manual concentrates on exercising the new substation model. A study is made of the variation of the parameters of the model to determine the effect on energy consumption and power distribution system capability. In order to keep things simple, the DC TEST Rail System is used. It consists of a two-track line between end of track positions 0.1 and 3.1, which is fed by four substations, at positions 0, 1, 2, 3. Both no regeneration and regeneration capability was included in the trains. Headways were varied at 1, 2, 3, 4, 5 minutes for both regeneration and no regeneration. All substations were rectifier, controlled rectifier, rectifier inverter and controlled rectifier inverter. The controlled rectifier, rectifier inverter and controlled rectifier inverter substations were compared to rectifier substations. At headways of 2 and 3 minutes, offsets were varied from 0 to 1 headway in five steps. Only regeneration was considered in each case and comparisons were made between rectifier inverter and rectifier substations. Finally, control voltage for inverter substations were varied from open circuit to 10% above open circuit. These were compared to rectifier substations for the 2 minute headway case with regeneration. In a similar manner the control voltage for the substation was varied between, zero, which indicates control of the voltage nearly to open circuit at rated power draw to one, which is controls the voltage to twice that number.

Instruction Manual For Exercising the New Substation Model 4/30/2016 Page 6 of 28
The purpose of this exercise was to show how the new substation model can be incorporated into power system studies. 2 APPLICATION TO TEST DC RAIL SYSTEM For this purpose, a simple DC Rail System was used as the basis for illustrating the methods and their comparison. Concentration was on the power distribution system (ENS - related) aspects, rather than the TPS aspects. The DC TEST Rail System consisted of a two-track line between end of track positions 0.1 and 3.1, which was fed by four substations, at positions 0, 1, 2, 3. Both no regeneration and regeneration capability was included in the trains. The system is described further in the next section. 2.1 DESCRIPTION OF THE DC TEST RAIL SYSTEM Certain kinds of data are required to describe a rail transit system for TOM application. These data are divided into five general categories:
o Train o Right of Way o Electrical Distribution o Operational Timetable o Basic System
Each of these is described in the following sections.
2.1.1 Train The group Train is further divided to include:
o Train Consists o Train Resistance Information o Car Physical Characteristics o Car Propulsion Characteristics
This kind of information is used to create the train files, which are input files to the TPS.
2.1.1.1 Train Consists The Train Consists are described by the types of cars in the fleet, which are used for service and how these cars are used in trains. A train is a group of one or more cars coupled together.
2.1.1.1.1 Types of Cars in Fleet

Instruction Manual For Exercising the New Substation Model 4/30/2016 Page 7 of 28
Two types of cars are considered.
o Type 1 - Self-propelled using DC Series motors with Cam control (Switched Resistor)(CAM Cars)
o Type 2 - Self-propelled using AC Induction motors with Inverter control (ACD Cars)
2.1.1.1.2 Train Types These are to be considered two different fleet scenarios, the Type 1 CAM Cars have no regeneration capability while the Type 2 ACD Cars do have regeneration capability. In both cases, trains have six cars.

Instruction Manual For Exercising the New Substation Model 4/30/2016 Page 8 of 28
2.1.1.2 Train Resistance Information Both types of trains have train resistance specified by the Davis Train Resistance formula.
9/11/2002 TOM Training Section 3/RAUher 39
Train Resistance
Davis Formula:TRR = 1.3 (6.37) * W + 29 (129) * n + f * W * v
TRA = [CA + CS *(C-1)] * A * v2
where in English (Metric) units:
W: weight of train(tons)(tonnes) n: number of axles/trainv: Speed of train(mph)(kph) f: flange coefficient(lbs/ton/mph)(nts/tonne/kph)C: Number of cars/train A: frontal area(ft2)(m2)
TRR : Train Rolling Resistance(lbs)(nts)
Aerodynamic coefficientsCA : Front car(lbs/ft2 /mph2 )(nts/m2/kph2) CS : Trail cars (lbs/ft2 /mph2 )(nts/m2/kph2)
TRA : Train Aerodynamic Resistance(lbs)(nts)
Davis Equation Parameters Parameter Value Number of Cars Per Train 6
Number of Axles per Car 4 Flange Coefficient ( lb/ton/mph) 0.071 Train Frontal Area ( ft2) 85 Front Car Aerodynamic Coefficient (lbs/ft2/mph2) 0.0024
Trail Car Aerodynamic Coefficient (lb/ft2/mph2) 0.00034

Instruction Manual For Exercising the New Substation Model 4/30/2016 Page 9 of 28
2.1.1.3 Car Physical Characteristics The car physical characteristics are shown next. Both cars are identical.
2.1.1.4 Car Propulsion System n systems for the two type cars are provided. This
Parameter CAM Car ACD CarEmpty Weight (tons) 36 36Number of Passengers at Crush Load (150 lbs/passenger) 220 220Full Weight (Crush Load) (tons) 52.5 52.5Number of Seats 80 80Length (ft) 80 80Auxiliary Power (kW) 30 30
CAR PHYSICAL CHARACTERISTICS
The characteristics of the car propulsioinformation is the Traction Effort Curves and the Efficiency Curves.

Instruction Manual For Exercising the New Substation Model 4/30/2016 Page 10 of 28
2.1.1.4.1 Cam Control
2.1.1.4.1.1 Tractive Effort Vs. Speed
2.1.1.4.1.2 Efficiency Curve in Power

Instruction Manual For Exercising the New Substation Model 4/30/2016 Page 11 of 28
2.1.1.4.2 AC Drive
2.1.1.4.2.1 Tractive Effort Vs. Speed
.1.1.4.2.2 Electrical Braking Effort Vs. Speed 2

Instruction Manual For Exercising the New Substation Model 4/30/2016 Page 12 of 28
2.1.1.4.2.3 Efficiency Curve in Power
.1.1.4.2.4 Efficiency Curve in Electrical Braking
2

Instruction Manual For Exercising the New Substation Model 4/30/2016 Page 13 of 28
2.1.2 Right of Way Data
2.1.2.1 Rail System Layout The layout is shown.
2.1.2.2 Passenger System Information
2.1.2.2.1 Passenger Load Factor The trains are run crush load for this exercise.
2.1.2.2.2 Passenger Station Dwell Time The dwell time is twenty seconds for this exercise.
2.1.3 Electrical Distribution System Data he Nodal Diagram for the TEST Rail System is shown next.
T

Instruction Manual For Exercising the New Substation Model 4/30/2016 Page 14 of 28
Initially the system is serviced by four substations 1 mile apart, located at positions shown in the diagram. These substations will be of a variety of types such as rectifier, controlled rectifier and inverter. The base case will be all rectifier substations.
2.1.3.1 Substation Data Data on the substations are presented in the following table:
eal value for a 12 pulse substation.
basis, where the unit voltage is 750 volts. This means that when the phase angle is zero indicating that the substation is a rectifier, the voltage drop through the substation is 0.1 or larger. When the substation type is an inverter, the control voltage can vary up to 0.1 per unit, which means that the substation can pass current back through the meters above the
The power factor used is the id When the substation type is a controlled rectifier, the control voltage is 0.1 on a per unit

Instruction Manual For Exercising the New Substation Model 4/30/2016 Page 15 of 28
blocking voltage. So that if the control voltage is set at 0.05, the inverter will not operate until the unit voltage on the DC side of the substation is 1.05 or higher. If the unit power is selected as the rating of the substation; namely, 5 MW, in terms of the unit values, the no load losses are 0.0035 and the rated load losses are 0.014.
2.1.3.2 Catenary and Rail Return Data he line resistances are shown below:
ince the unit voltage is the open circuit voltage of 750 v DC, and if the unit power is in
.1.4 Train Location
ero to the eadway. These offsets are expected to be more important in the case of regeneration.
Operating time will be one headway cycle in all cases. So that if the headway is two e for two minutes.
urrent will be measured into and out of each substation. Ammeters will be placed on the atenary immediately outside of the substation .
T
Sselected as the rating of a substation; namely, 5 MW, then the unit ohm is 0.1125. Thus unit ohm value, the loop resistance is 0.45111 unit ohms per mile.
2
Timetables for this study will be based on varying headways from 1 – 5 minutes. For timetable offsets, these will be varied in steps of 0.2 times the headway from zh
2.1.5 Operating Time
minutes, the operating time, or simulation time will b
2.1.6 Current Measurement Cc
Instruction Manual For Exercising the New Substation Model 4/30/2016 Page 16 of 28
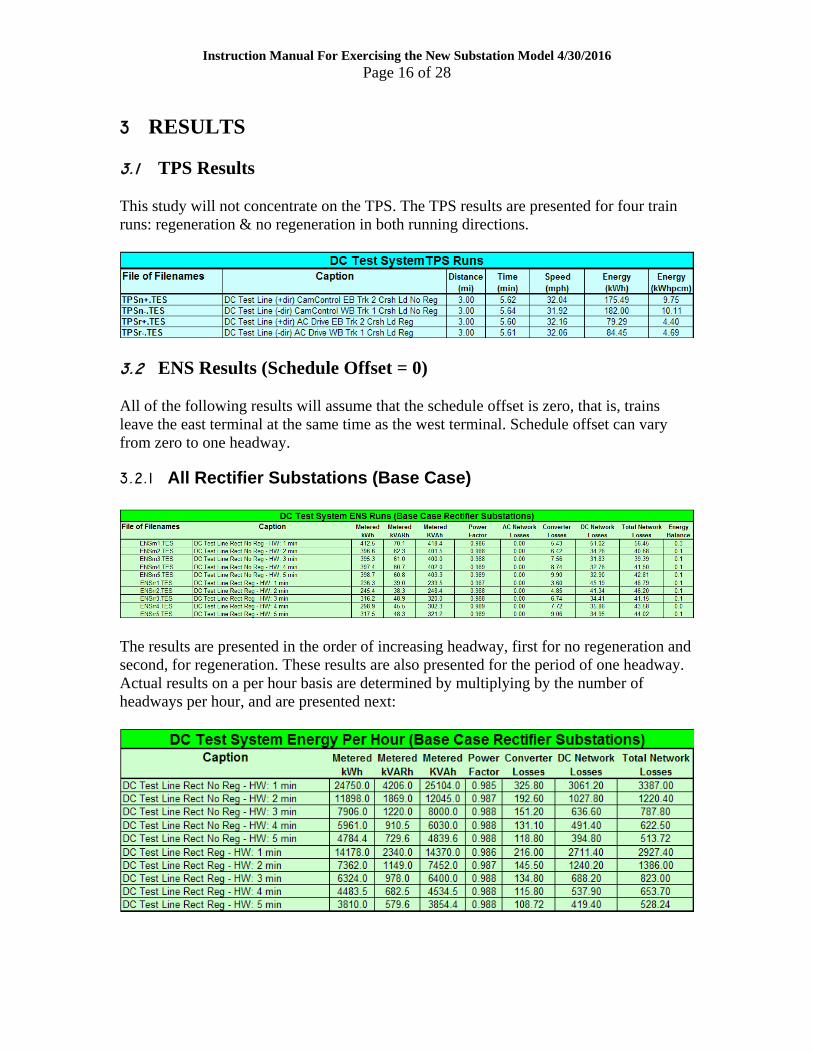
3 RESULTS 3.1 TPS Results
e TPS. The TPS results are presented for four train
3.2 ENS Results (Schedule Offset = 0) All of the following results will assume that the schedule offset is zero, that is, trains
This study will not concentrate on thruns: regeneration & no regeneration in both running directions.
leave the east terminal at the same time as the west terminal. Schedule offset can vary from zero to one headway.
3.2.1 All Rectifier Substations (Base Case)
The results are presented in the order of increasing headway, first for no regeneration and second, for regeneration. These results are also presented for the period of one headway. Actual results on a per hour basis are determined by multiplying by the number of headways per hour, and are presented next:

Instruction Manual For Exercising the New Substation Model 4/30/2016 Page 17 of 28
3.2.2 All Controlled Rectifier Substations
The results are presented in the order of increasing headway, first for no regeneration and second, for regeneration. These results are also presented for the period of one headway. Actual results on a per hour basis are determined by multiplying by the number of headways per hour, and are presented next:
The results are presented in the order of increasing headway, first for no regeneration and second, for regeneration. These results are also presented for the period of one headway.
ctual results on a per hour basis are determined by multiplying by the number of eadways per hour, and are presented next:
Ah
All Rectifier Inverter Substations 3.2.3

Instruction Manual For Exercising the New Substation Model 4/30/2016 Page 18 of 28
.2.4 All Controlled Rectifier Inverter Substations
he results are presented in the order of increasing headway, first for no regeneration and cond, for regeneration. These results are also presented for the period of one headway.
3
TseActual results on a per hour basis are determined by multiplying by the number of headways per hour, and are presented next:

Instruction Manual For Exercising the New Substation Model 4/30/2016 Page 19 of 28
3.2.5 Energy Comparisons Energy comparisons are made between the Controlled Rectifier and Rectifier
, the Rectifier Inverter and Rectifier Substations and the Controlled SubstationsRectifier Inverter Substations.
There are several observations to be made when comparing the Controlled Rectifier (CV=0) with the Rectifier Substation cases. In the case of both regeneration and no
generation, 1. The metered kWh is slightly smaller with controlled rectifiers. The reason is
because of the decreased losses in the DC line. 2. The metered kVARh is higher, which means a lower power factor on the AC line.
lled rectifier is larger
The first observation is that there is no change for the case of no regeneration since inverters prove useful only when regeneration is active. A second observation is that as the headway increases the inverters are more useful because the natural receptivity of the line decreases. This is to be expected.
3.2.5.1 Controlled Rectifier less Base
re
This is to be expected, since the phase angle of the controthan that of the rectifier. As the headway increases, the average phase angle is even larger.
3.2.5.2 Rectifier Inverter less Base

Instruction Manual For Exercising the New Substation Model 4/30/2016 Page 20 of 28
Finally the third observation is that the reactive power continues to flow from meter to substation, while the real power during inverter activation flows from the substation to the meter. Thus the overall power factor decreases slightly. In comparing Inverters to the Rectifiers base, the following table may prove useful:
3.2.5.3 Controlled Rectifier Inverter Less Base
The first observation is that there is a small change for the case of no regeneration since A second observation is that as the headway increases the inverters are more useful because the natural receptivity of the line decreases. This is to be expected. Finally the third observation is that the reactive power continues to flow from meter to substation, while the real power during inverter activation flows from the substation to the meter. Thus the overall power factor decreases.
3.2.6 Minimum Line Voltage and Maximum Line Current Using the Minimum Train Voltage Finder and Maximum Train Current Finder of the File Manipulation Module (FMM), the minimum train voltage and maximum train current can be determined for each of the runs. These will be shown in the following tables.
This table shows the density of trains (trains on the line per snapshot) as a function of headway. By observing the receptivity of the line in the regenerating cases, the usefulness of inverter substations is obvious. More power is fed back to the meters as the number of trains on the line decreases.

Instruction Manual For Exercising the New Substation Model 4/30/2016 Page 21 of 28
3.2.6.1 Rectifier Substations
adway runs, thus increasing both losses and heating effects on the line.
action standards indicate (+10%, -25%) or a
inimum allowed voltage of 562 volts. Since the open circuit voltage is 750 volts, trm
Currents are extremely high in the lower he

Instruction Manual For Exercising the New Substation Model 4/30/2016 Page 22 of 28
3.2.6.2 Controlled Rectifier Substations
Currents are substantially reduced in the low headway runs.
Instruction Manual For Exercising the New Substation Model 4/30/2016 Page 23 of 28
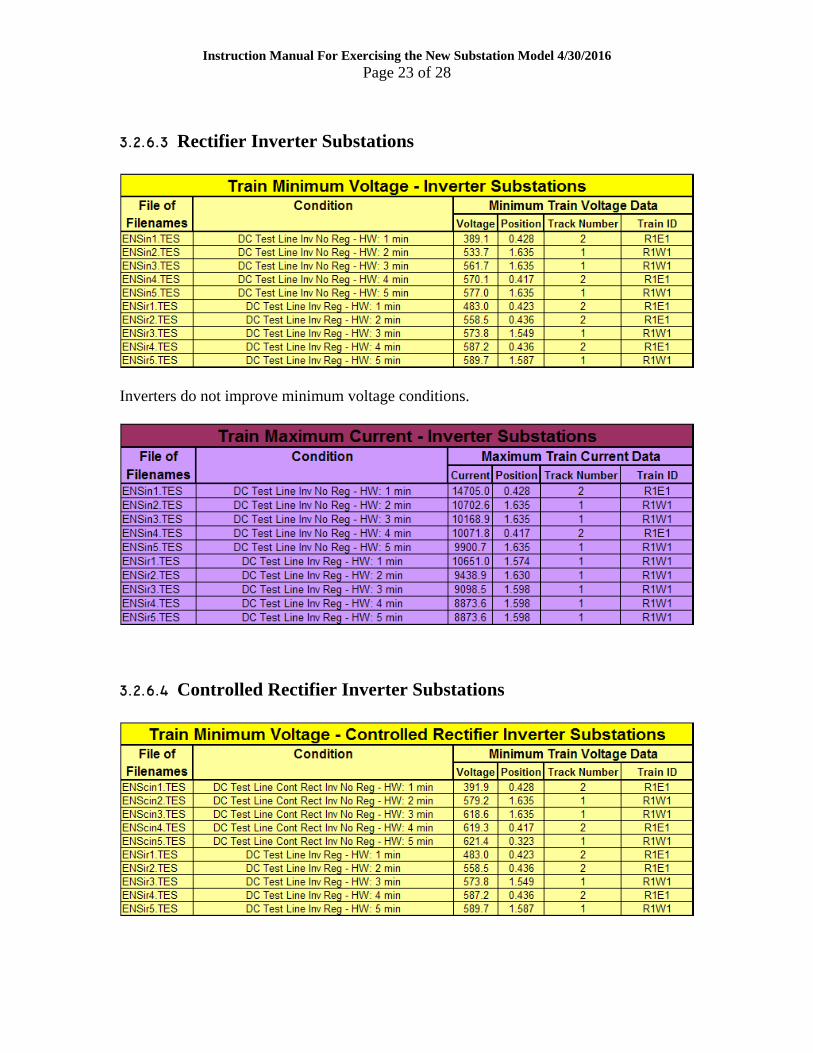
3.2.6.3 Rectifier Inverter Substations
Inverters do not improve minimum voltage conditions.
3.2.6.4 Controlled Rectifier Inverter Substations

Instruction Manual For Exercising the New Substation Model 4/30/2016 Page 24 of 28
Currents are not improved with inverters. The principal value of an inverter substation is to send power back to the AC line when the regeneration receptivity is low; which is the case for higher headways between trains. 3.3 ENS RESULTS (Varying Schedule Offset)
is important to determine how effective an inverter substation for different values of schedule offset. Two headway conditions were
The energy information for the rectifier substations is shown next as a function of offset.
The variation of metered energy is 242.4 – 266.0 kWh for 2 minutes of operation for the 2 minute headway case and 257.0 – 322.8 kWh for 3 minutes of operation for the 3 minute headway case. Since all offsets were not tested in this exercise, the offset variation could be larger and most likely is larger.
Especially for the case of regeneration, it
simulated; namely 2 min and 3 minutes, where the offset was varied in five steps from no offset to maximum offset. In the 2 minute HW case, the offsets are set at 20, 40, 60, 80, 100 seconds and in the 3 minute HW case, the offsets are set at 30, 60, 90, 120, 150 seconds. Only the regeneration cases are considered since a comparison is made between inverter and rectifier substations.
3.3.1 Rectifier Substations

Instruction Manual For Exercising the New Substation Model 4/30/2016 Page 25 of 28
3.3.2 Inverter Substations
is shown next as a function of offset.
The variation of metered energy is 217.5 – 221.6 kWh for 2 minutes of operation for the 2 minute headway case and 217.4 – 220.5 kWh for 3 minutes of operation for the 3 minute headway case. This is a much narrower range than in the case of rectifier
bstations because the assured receptivity provided by the inverters is less dependent on e positions of the trains and whether they are accelerating, cruising or braking.
As in the previous case, all offsets were not considered, so that the variation could be larger than indicated here.
For the two minute headway case, the kWh savings ranges from 12 – 21% and for the 3 minute headway case from 17 – 35%. It’s important to realize here that natural receptivity depends on relative train positions and whether or not they are accelerating, cruising or braking, while assured receptivity is not that dependent on these factors. 3.4 ENS RESULTS (Varying Inverter Control Voltage)
The energy information for the inverter substations
suth
3.3.3 Energy Comparisons Inverter vs Rectifier Substations The percent energy savings of inverters over rectifiers is shown in the next table as a function of offset for the two headways considered.

Instruction Manual For Exercising the New Substation Model 4/30/2016 Page 26 of 28
The TOM now has the capability to vary the Inverter Substation control voltage, which has the effect of blocking inverter operation until the voltage on the DC side of the
n-circuit value. This is demonstrated on the DC TEST system by varying the control voltage from 0 to 0.1 (per unit) above the open circuit voltage. Since regeneration is set to shut off at 0.1 above the open circuit voltage, at this value the inverter does not operate. The control voltage are set at 0.00, 0.02, 0.04, 0.06, 0.08 and 0.10. The results are shown in the table for the 3 min headway case.
rectifiers for these easing when the train voltage is
0.1 above open circuit, the voltage at the substations does not exceed .08 above open circuit. 3.5 ENS RESULTS (VARYING CONTROLLED RECTIFIER
CONTROL VOLTAGE) The Converter Control Voltage (CV) of Zero means that effectively there is no voltage drop through the converter until rated load is reached. This is accomplished by setting the secondary winding of the transformer above the open circuit voltage by an amount equal to the impedance of the converter at rated load. Thus if the impedance of the converter is 6 % at rated load, the open circuit voltage of the winding is 1.06 x Unit Voltage.
hus the relation –1 < CV < 1 must hold.
ince CV < 0 tend to defeat the purpose of the controlled rectifier, only variations 0 < ts are shown next.
substation reaches a certain value above the ope
By the time the control voltage reaches 0.08, the inverters are acting as runs. Thus for this case with regeneration on the trains c
T SCV <1 are considered, in particular: 0, 0.3, 0.6, 0.9. The resul

Instruction Manual For Exercising the New Substation Model 4/30/2016 Page 27 of 28
More important is the effect on voltage regulation, shown in the next table for the smallest headway.
The TOM is now capable of computing the voltage regulation and energy differences Rectifier,
ontrolled Rectifier, Rectifier-Inverter and Controlled Rectifier-Inverter. Thus
Thus raising the control voltage increases the minimum voltage on the line, as is expected. 4 SUMMARY
(both real and reactive power) of four different types of substations: Ctradeoff studies can be made with the TOM of traction power systems which utilize
ixtures of rectifier and controlled rectifier substations. m

Instruction Manual For Exercising the New Substation Model 4/30/2016 Page 28 of 28
The principal effect of the Controlled Rectifier Substation is to improve voltage regulation so that fewer substations will be necessary to perform the same job. The principal effect of the Rectifier-Inverter Substation is to increase the receptivity of the DC portion of the traction power system during regeneration. This short study demonstrates that increasing receptivity is more effective with lower train densities or larger headways. In addition, the Rectifier-Inverter Substation now has a voltage ontrol, which can block inverter operation when the DC line voltage is higher than the
ier-Inverter Substation combines both effects into one substation nd can also be used with the TOM.
he TOM now uses a better method for estimating substation losses, which depend on both no-load and load conditions.
copen circuit voltage but less than the voltage control. The Controlled Rectifa T