Embed Size (px)
Citation preview

Annex - 1
The following pages contain detailed tables on tourism related indicators such as international tourist arrivals, international tourism receipts and expenditure collected by UNWTO from national institutions, as well as the International tourism in the Balance of Payments and the evaluation of UNWTO Panel of Tourism Experts.
Tables reflect yearly data and monthly or quarterly data currently available. Most data are preliminary and may be subject to revision. See the Methodological Notes at the end of this annex for further information on the data.
The tables on the following pages are not included in the free extract of the UNWTO World Tourism Barometer. The full document is available in electronic format for sale and free for UNWTO members and subscribers through the UNWTO elibrary at: - English version: www.e-unwto.org/content/w83v37 - French version: www.e-unwto.org/content/t73863 - Spanish version: www.e-unwto.org/content/rn1422 - Russian version: www.e-unwto.org/content/j62835
Contents
- International Tourist Arrivals by (Sub)region and Outlook A-3 - International Tourist Arrivals and Tourism Receipts
(local currencies, constant prices), World and Regions A-4 - International Tourist Arrivals by Destination (Top 50) A-6 - International Tourism Receipts in US$ (Top 50) A-7 - International Tourism Receipts in euro (Top 50) A-8 - International Tourism Expenditure in US$ (Top 50) A-9 - International Tourism Expenditure in euro (Top 50) A-10 - Detailed tables by UNWTO regions and subregions:
International Tourist Arrivals and Tourism Receipts • Europe A-11 • Asia and the Pacific A-13 • Americas A-15 • Africa A-17 • Middle East A-19 - International tourism in the Balance of Payments (BOP) A-21 - Evaluation of UNWTO Panel of Tourism Experts A-22 - Methodological Notes A-26
Explanation of abbreviations and symbols used
* = provisional figure or data | = change of series or methodology .. = figure or data not (yet) available n/a = not applicable
mn = million (1,000,000) bn = billion (1,000,000,000) [note in Spanish ‘miles de millones’] trn = trillion (1,000,000,000,000) [note in Spanish ‘billones’]
Q1: January, February, March T1: From January to April Q2: April, May, June T2: From May to August Q3: July, August, September T3: From Sept. to December Q4: October, November, December
H1: from January to June H2: from July to December
YTD: Year-to-date refers to the change in the months with data available, compared to the same period of the previous year. The (sub)regional totals are approximations for the whole (sub)region based on trends in countries for which data is available.
Series of International Tourist Arrivals TF: International tourist arrivals (ITA) at frontiers (excluding same-day visitors); THS: ITA at hotels and similar establishments; TCE: ITA at collective tourism establishments; VF: International visitor arrivals at frontiers (tourists and same-day visitors); NHS: Nights of international tourists in hotels and similar establishments; NCE: Nights of international tourists in collective tourism establishments.
n Shaded rank numbers indicate an upward movement in the destination’s place in the ranking over the previous year.
Series of International Tourism Receipts and Expenditure All percentages are calculated from non-seasonally adjusted series in local currencies, unless otherwise indicated: $: in US dollars; €: in euros; sa: seasonally-adjusted series.
For more on concepts, definitions and computation of data, please see the Methodological Notes on page A-26.
Volume 19 • Issue 3 • May 2021

May 2021 – Statistical Annex
Annex - 2
The World Tourism Organization (UNWTO) is the United Nations specialized agency mandated with the promotion of responsible, sustainable and universally accessible tourism.
UNWTO’s membership includes 159 countries, 6 Associate Members, two Permanent Observers, and over 500 Affiliate Members representing the private sector, educational institutions, tourism associations and local tourism authorities.
Copyright © 2021 World Tourism Organization C/ Poeta Joan Maragall 42, 28020 Madrid, Spain
UNWTO World Tourism Barometer ISSN: 1728-9246
Published and printed by the World Tourism Organization, Madrid, Spain - First printing: 2021 (version 04/06/21) All rights reserved.
The designations employed and the presentation of material in this publication do not imply the expression of any opinions whatsoever on the part of the Secretariat of the World Tourism Organization (UNWTO) concerning the legal status of any country, territory, city or area, or of its authorities or concerning the delimitation of its frontiers or boundaries.
All UNWTO publications are protected by copyright. Therefore and unless otherwise specified, no part of a UNWTO publication may be reproduced, stored in a retrieval system or utilized in any form or by any means, electronic or mechanical, including photocopying, microfilm, scanning, without prior permission in writing. UNWTO encourages dissemination of its work and is pleased to consider permissions, licensing, and translation requests related to UNWTO publications. For permission to photocopy UNWTO material, please refer to the UNWTO website at www.unwto.org/publications.
The contents of this issue may be quoted, provided the source is given accurately and clearly. Distribution or reproduction in full is permitted for own or internal use only. Please do not post electronic copies on publicly accessible websites. UNWTO encourages you to include a link to www.unwto.org/market-intelligence.
World Tourism Organization C/ Poeta Joan Maragall 42, 28020 Madrid, Spain Tel (34) 91 567 81 00 / Fax (34) 91 131 17 02 [email protected] www.unwto.org
Follow us on:
About the UNWTO World Tourism Barometer
The UNWTO World Tourism Barometer is a publication of the World Tourism Organization (UNWTO) that monitors short-term tourism trends on a regular basis to provide global tourism stakeholders with up-to-date analysis on international tourism.
The information is updated several times a year and includes an analysis of the latest data on tourism destinations (inbound tourism) and source markets (outbound tourism). The Barometer also includes three times a year a Confidence Index based on the UNWTO Panel of Tourism Experts survey, which provides an evaluation of recent performance and short-term prospects on international tourism.
The UNWTO Secretariat wishes to express its gratitude to those who have contributed to the production of this UNWTO World Tourism Barometer, in particular to institutions that supplied data, and to the members of the UNWTO Panel of Tourism Experts for their valuable feedback and analysis.
This report was prepared by the UNWTO Tourism Market Intelligence and Competitiveness Department, under the supervision of Sandra Carvão, Chief of the Department. Authors include (in alphabetical order): Fernando Alonso, Michel Julian, and Javier Ruescas.
For more information including copies of previous issues, please visit: www.e-unwto.org/loi/wtobarometereng.
We welcome your comments and suggestions at [email protected].
Data collection for this issue was closed at the end of May 2021.
The next issue of the UNWTO World Tourism Barometer with more comprehensive results is scheduled to be published in July 2021.

May 2021 – Statistical Annex
Annex - 3
International Tourist Arrivals by (Sub)region
Monthly/quarterly data series
Share Change Percentage change*(million) (%) (%) 2021 over 2020 2021 over 2019
2018 2019 2020* 2020* 19/18 20*/19 YTD Q1 Jan. Feb. Mar. YTD Q1 Jan. Feb. Mar.
World 1,413 1,466 398 100 3.8 -72.8 -82.7 -82.7 -86.5 -86.4 -65.0 -87.5 -87.5 -86.5 -88.4 -87.7Advanced economies¹ 761 777 212 53.3 2.1 -72.7 -86.8 -86.8 -88.9 -90.1 -73.3 -90.8 -90.8 -88.9 -91.4 -91.8
Emerging economies¹ 651 689 186 46.7 5.7 -73.0 -79.0 -79.0 -84.4 -82.9 -58.5 -84.4 -84.4 -84.2 -85.6 -83.4
By UNWTO regions:
Europe 716.0 746.3 235.1 59.0 4.2 -68.5 -83.4 -83.4 -85.2 -87.3 -71.0 -87.0 -87.0 -84.6 -87.0 -88.8
Northern Europe 81.0 83.7 20.7 5.2 3.3 -75.3 -91.7 -91.7 -92.0 -92.5 -89.7 -93.2 -93.2 -91.5 -92.1 -95.5
Western Europe 200.2 205.4 79.1 19.8 2.6 -61.5 -89.9 -89.9 -87.4 -94.0 -84.9 -92.2 -92.2 -86.8 -93.7 -95.1
Central/Eastern Eur. 146.2 153.3 47.7 12.0 4.8 -68.9 -77.8 -77.8 -82.1 -79.8 -68.0 -81.6 -81.6 -82.6 -80.8 -81.3
Southern/Medit. Eur. 288.6 303.9 87.7 22.0 5.3 -71.2 -78.4 -78.4 -82.8 -83.7 -53.6 -83.7 -83.7 -81.5 -83.2 -85.7
- of which EU-27 523.8 540.7 177.9 44.7 3.2 -67.1 -85.6 -85.6 -86.4 -89.0 -75.6 -88.9 -88.9 -85.9 -88.7 -91.6
Asia and the Pacific 346.5 360.4 57.1 14.3 4.0 -84.1 -93.6 -93.6 -95.8 -93.9 -81.8 -96.6 -96.6 -96.0 -97.1 -96.8
North-East Asia 169.2 170.3 20.2 5.1 0.7 -88.1 -89.3 -89.3 -94.0 -86.2 -35.2 -96.2 -96.2 -95.1 -97.3 -96.4
South-East Asia 128.6 138.6 25.5 6.4 7.8 -81.6 -96.6 -96.6 -98.0 -96.8 -91.1 -97.8 -97.8 -97.9 -97.9 -97.6
Oceania 17.0 17.5 3.6 0.9 2.4 -79.4 -98.0 -98.0 -98.3 -98.3 -96.4 -98.5 -98.5 -98.2 -98.7 -98.6
South Asia 31.7 34.0 7.8 2.0 7.5 -77.0 -90.9 -90.9 -92.4 -91.8 -82.4 -92.9 -92.9 -91.9 -92.2 -94.7
Americas 216.0 219.3 69.7 17.5 1.5 -68.2 -71.2 -71.2 -76.4 -79.3 -46.8 -75.8 -75.8 -76.2 -78.5 -73.1
North America 142.2 146.6 46.7 11.7 3.1 -68.1 -67.1 -67.1 -71.3 -76.1 -46.5 -72.0 -72.0 -70.4 -75.3 -70.7
Caribbean 25.8 26.3 10.3 2.6 2.0 -60.7 -59.5 -59.5 -71.5 -71.5 -12.2 -66.3 -66.3 -70.7 -69.5 -59.7
Central America 10.8 10.9 2.9 0.7 0.8 -73.1 -76.3 -76.3 -82.3 -84.6 -45.0 -80.5 -80.5 -82.8 -83.5 -75.2
South America 37.2 35.4 9.7 2.4 -4.7 -72.6 -90.9 -90.9 -92.1 -92.4 -83.2 -92.5 -92.5 -92.5 -92.1 -93.1
Africa 68.7 70.1 18.2 4.6 2.0 -74.0 -80.7 -80.7 -83.4 -85.2 -69.4 -83.2 -83.2 -83.3 -85.1 -81.3
North Africa 24.1 25.6 5.5 1.4 6.4 -78.4 -76.8 -76.8 -79.7 -82.4 -54.6 -81.6 -81.6 -79.3 -80.7 -84.2
Subsaharan Africa 44.6 44.5 12.7 3.2 -0.3 -71.4 -82.2 -82.2 -84.9 -86.7 -72.9 -83.9 -83.9 -84.9 -87.2 -79.9
Middle East 65.5 70.0 18.2 4.6 6.8 -74.0 -78.0 -78.0 -83.6 -83.6 -43.0 -82.4 -82.4 -82.2 -83.1 -82.0
Source: World Tourism Organization (UNWTO) © (Data as collected by UNWTO, May 2021)* Provisional data¹ Classification based on the International Monetary Fund (IMF), see the Statistical Annex of the IMF World Economic Outlook of April 2017, page 175, at www.imf.org/external/ns/cs.aspx?id=29.See box in page 'Annex-1' for explanation of abbreviations and symbols used.

May 2021 – Statistical Annex
Annex - 4
International Tourism by (Sub)region
International Tourism Receipts International Tourist ArrivalsChange (%) USD per EUR per Share ChangeLocal currencies, constant prices (billion) arrival (billion) arrival (%) (million) (%)
18/17 19/18 20*/19 2019 2020* 2020* 2019 2020* 2020* 2020* 2019 2020* 19/18 20*/19
World 5.0 2.9 -63.6 1,466 536 1,350 1,309 469 1,180 100 1,466 398 3.8 -72.8Advanced economies¹ 4.1 1.3 -61.9 922 357 1,680 823 313 1,470 66.6 777 212 2.1 -72.7
Emerging economies¹ 6.6 6.0 -66.6 544 179 960 486 157 840 33.4 689 186 5.7 -73.0
By UNWTO regions:
Europe 4.9 4.3 -59.7 572.2 233.8 990 511.1 204.7 870 43.6 746.3 235.1 4.2 -68.5
Northern Europe 0.5 5.0 -63.6 89.6 33.0 1,600 80.0 28.9 1,400 6.2 83.7 20.7 3.3 -75.3
Western Europe 3.4 1.8 -46.8 179.6 98.3 1,240 160.4 86.1 1,090 18.3 205.4 79.1 2.6 -61.5
Central/Eastern Europe 8.5 1.6 -61.2 68.7 26.7 560 61.4 23.4 490 5.0 153.3 47.7 4.8 -68.9
Southern/Medit. Europe 6.7 6.8 -67.7 234.3 75.8 860 209.3 66.4 760 14.1 303.9 87.7 5.3 -71.2
- of which EU-27 3.8 3.4 -58.1 423.7 181.5 1,020 378.5 158.9 890 33.9 540.7 177.9 3.2 -67.1
Asia and the Pacific 8.5 1.0 -70.1 441.3 132.6 2,320 394.2 116.1 2,030 24.7 360.4 57.1 4.0 -84.1
North-East Asia 11.5 -3.6 -74.3 187.2 48.9 2,420 167.2 42.9 2,120 9.1 170.3 20.2 0.7 -88.1
South-East Asia 5.5 3.8 -78.0 146.9 32.3 1,270 131.2 28.3 1,110 6.0 138.6 25.5 7.8 -81.6
Oceania 6.8 5.6 -46.0 61.6 33.3 9,240 55.0 29.1 8,090 6.2 17.5 3.6 2.4 -79.4
South Asia 7.7 6.2 -60.7 45.6 18.1 2,300 40.7 15.8 2,020 3.4 34.0 7.8 7.5 -77.0
Americas 0.4 -0.6 -60.2 322.8 127.1 1,820 288.4 111.3 1,600 23.7 219.3 69.7 1.5 -68.2
North America -0.1 -1.7 -60.0 245.9 98.4 2,110 219.7 86.2 1,840 18.4 146.6 46.7 3.1 -68.1
Caribbean 1.9 6.0 -56.5 35.3 15.2 1,470 31.5 13.3 1,290 2.8 26.3 10.3 2.0 -60.7
Central America 1.2 2.9 -68.8 12.6 3.9 1,350 11.3 3.5 1,180 0.7 10.9 2.9 0.8 -73.1
South America 2.8 -0.6 -63.2 29.0 9.6 990 25.9 8.4 860 1.8 35.4 9.7 -4.7 -72.6
Africa 2.9 2.1 -63.6 38.9 14.0 770 34.7 12.3 670 2.6 70.1 18.2 2.0 -74.0
North Africa 4.7 7.0 -56.0 11.2 5.1 920 10.0 4.4 800 0.9 25.6 5.5 6.4 -78.4
Subsaharan Africa 2.2 0.3 -66.7 27.6 8.9 700 24.7 7.8 620 1.7 44.5 12.7 -0.3 -71.4
Middle East 8.0 19.7 -68.5 90.5 28.7 1,580 80.8 25.1 1,380 5.3 70.0 18.2 6.8 -74.0
Source: World Tourism Organization (UNWTO) © (Data as collected by UNWTO, May * Provisional data¹ Classification based on the International Monetary Fund (IMF), see the Statistical Annex of the IMF World Economic Outlook of April 2017, page 175, at www.imf.org/external/ns/cs.aspx?id=29.See box in page 'Annex-1' for explanation of abbreviations and symbols used.

May 2021 – Statistical Annex
Annex - 5
International Tourist Arrivals by month International Tourist Arrivals by month
World (million) Europe (million)
Source: World Tourism Organization (UNWTO) © Source: World Tourism Organization (UNWTO) ©
International Tourist Arrivals by month International Tourist Arrivals by month Asia and the Pacific (million) Americas (million)
Source: World Tourism Organization (UNWTO) © Source: World Tourism Organization (UNWTO) ©
International Tourist Arrivals by month International Tourist Arrivals by month Middle East (million) Africa (million)
Source: World Tourism Organization (UNWTO) © Source: World Tourism Organization (UNWTO) ©
0
10
20
30
40
50
60
70
80
90
100
Jan. Feb. Mar. Apr. May Jun. Jul. Aug. Sep. Oct. Nov. Dec.
201820192020*2021*
0
20
40
60
80
100
120
140
160
Jan. Feb. Mar. Apr. May Jun. Jul. Aug. Sep. Oct. Nov. Dec.
201820192020*2021*
0
5
10
15
20
25
30
35
Jan. Feb. Mar. Apr. May Jun. Jul. Aug. Sep. Oct. Nov. Dec.
201820192020*2021*
0
5
10
15
20
25
Jan. Feb. Mar. Apr. May Jun. Jul. Aug. Sep. Oct. Nov. Dec.
201820192020*2021*
0
1
2
3
4
5
6
7
8
9
Jan. Feb. Mar. Apr. May Jun. Jul. Aug. Sep. Oct. Nov. Dec.
201820192020*2021*
0
1
2
3
4
5
6
7
8
Jan. Feb. Mar. Apr. May Jun. Jul. Aug. Sep. Oct. Nov. Dec.
201820192020*2021*

May 2021 – Statistical Annex
Annex - 6
International Tourist Arrivals by Country of Destination
Percentage change*
Rank (million) Change (%) 2021 over 2020 2021 over 2019'19 '18 Series 2018 2019 2020* 19/18 20/19 Series YTD Q1 Jan. Feb. Mar. YTD Q1 Jan. Feb. Mar.
World 1413 1466 398 3.8 -72.8 -83.3 -83.3 -86.7 -86.7 -67.4 -88.0 -88.0 -86.6 -88.7 -88.5
1 1 France TF 89.4 .. .. .. .. TCE2 2 Spain TF 82.8 83.5 19.0 0.8 -77.3 TF -88.6 -88.6 -89.5 -93.6 -75.5 -91.5 -91.5 -89.6 -93.5 -91.33 3 United States TF 79.7 79.4 19.4 -0.4 -75.5 TF -79.8 -79.8 -81.9 -85.9 -66.1 -83.6 -83.6 -82.1 -86.2 -83.04 4 China TF 62.9 65.7 .. 4.5 .. TF5 5 Italy TF 61.6 64.5 25.2 4.8 -61.0 TF -77.8 -79.7 -75.5 -78.0 -78.9 -77.26 6 Turkey TF 45.8 51.2 15.9 11.9 -69.0 TF -53.8 -53.8 -71.4 -68.9 26.8 -64.1 -64.1 -66.9 -67.8 -59.37 7 Mexico TF 41.3 45.0 24.3 9.0 -46.0 TF -43.9 -43.9 -49.3 -57.9 -17.4 -47.7 -47.7 -44.8 -53.0 -45.88 10 Thailand TF 38.2 39.9 6.7 4.4 -83.2 TF -99.7 -99.7 -99.8 -99.7 -99.2 -99.8 -99.8 -99.8 -99.8 -99.89 8 Germany TCE 38.9 39.6 12.4 1.8 -68.5 TCE -92.3 -92.3 -92.3 -92.2 -92.2 -92.2
10 9 United Kingdom TF 38.7 39.4 .. 1.9 .. VF11 12 Austria TCE 30.8 31.9 15.1 3.5 -52.7 TCE -97.8 -97.8 -98.5 -98.6 -93.0 -98.2 -98.2 -98.3 -98.4 -97.812 11 Japan VF 31.2 31.9 4.1 2.2 -87.1 VF -98.3 -98.3 -98.3 -99.3 -93.6 -99.2 -99.2 -98.3 -99.7 -99.613 13 Greece TF 30.1 31.3 7.2 4.1 -77.0 TF -85.2 -85.2 -87.9 -87.8 -75.9 -86.0 -86.0 -85.5 -84.8 -87.214 15 Malaysia TF 25.8 26.1 4.3 1.0 -83.4 TF15 17 Portugal TF 22.8 24.6 .. 7.9 .. TCE -93.1 -90.1 -95.9 -92.5 -89.1 -95.616 16 Russian Federation VF 24.6 24.6 6.4 0.2 -74.1 VF17 14 Hong Kong (China) TF 29.3 23.8 1.4 -18.8 -94.3 TF -98.7 -98.7 -99.6 -94.1 -82.1 -99.8 -99.8 -99.8 -99.8 -99.718 19 Canada TF 21.1 22.1 3.0 4.8 -86.6 TF -93.6 -93.6 -93.8 -95.5 -88.6 -94.8 -94.8 -93.5 -95.4 -95.519 18 Utd Arab Emirates TF 21.3 21.6 7.2 1.3 -66.8 TF -64.4 -64.4 -74.2 -72.7 -9.4 -68.8 -68.8 -70.2 -70.0 -66.120 20 Poland TF 19.6 21.2 8.4 7.8 -60.2 TF21 21 Netherlands TCE 18.8 20.1 7.3 7.2 -63.9 TCE -92.5 -91.7 -93.3 -92.2 -91.3 -93.122 22 Macao (China) TF 18.5 18.6 2.8 0.8 -84.9 TF -39.6 -39.6 -79.6 225.8 221.6 -80.6 -80.6 -83.6 -83.8 -74.423 26 Vietnam VF 15.5 18.0 3.8 16.2 -78.7 VF -98.7 -98.7 -99.1 -99.1 -95.7 -98.9 -98.9 -98.8 -99.3 -98.624 23 India TF 17.4 17.9 .. 2.8 .. TF25 28 Saudi Arabia TF 15.3 17.5 4.1 14.3 -76.4 TF -86.0 -86.0 -88.2 -90.3 -32.8 -90.0 -90.0 -87.6 -90.4 -91.926 27 Korea (ROK) VF 15.3 17.5 2.5 14.0 -85.6 VF -90.3 -90.3 -95.4 -90.4 -10.7 -94.8 -94.8 -94.7 -94.5 -95.127 25 Croatia TCE 16.6 17.4 5.5 4.3 -68.0 TCE -87.5 -86.6 -88.2 -87.3 -86.3 -88.128 24 Hungary TF 17.2 16.9 7.4 -1.3 -56.2 TF29 32 Indonesia TF 13.4 15.5 .. 15.4 .. VF -85.4 -85.4 -89.4 -86.7 -72.7 -89.7 -89.7 -88.6 -90.7 -89.930 29 Singapore TF 14.7 15.1 .. 3.0 .. VF -97.4 -97.4 -98.6 -97.5 -88.7 -98.5 -98.5 -98.6 -98.8 -98.331 30 Czech Republic TF 14.3 14.7 .. 2.6 .. TCE -96.3 -96.3 -96.9 -97.2 -91.3 -97.2 -97.2 -96.5 -97.2 -97.832 33 Denmark TF 12.7 14.6 .. 14.3 .. TCE -88.5 -88.5 -88.2 -88.233 31 Ukraine TF 14.2 13.4 3.4 -5.4 -74.8 TF34 36 Egypt VF 11.3 13.0 .. 14.8 .. VF35 34 Morocco TF 12.3 12.9 2.8 5.2 -78.5 TF36 37 Taiwan (pr. of China) VF 11.1 11.9 1.4 7.2 -88.4 VF -96.3 -96.3 -98.2 -96.5 -76.5 -98.4 -98.4 -98.3 -98.7 -98.337 35 Switzerland TF 11.7 11.8 .. 0.9 .. THS -75.9 -75.9 -84.2 -82.0 -31.7 -82.3 -82.3 -82.7 -82.6 -81.738 38 Ireland TF 10.9 11.0 .. 0.2 .. TF39 39 South Africa TF 10.5 10.2 2.8 -2.3 -72.6 TF -84.1 -84.1 -87.3 -88.7 -70.5 -85.7 -85.7 -87.0 -88.7 -81.240 41 Australia VF 9.2 9.5 1.8 2.4 -80.7 VF -98.7 -98.7 -99.0 -99.1 -97.5 -99.1 -99.1 -98.9 -99.3 -99.041 43 Tunisia TF 8.3 9.4 2.0 13.6 -78.7 TF -73.7 -73.7 -75.6 -85.8 -42.7 -78.2 -78.2 -73.2 -84.4 -77.242 42 Belgium TCE 9.1 9.3 2.6 2.5 -71.7 TCE43 40 Bulgaria TF 9.3 9.3 .. 0.4 .. VF -45.9 -45.9 -60.0 -52.6 -8.0 -51.6 -51.6 -56.4 -50.1 -48.244 45 Iran VF 7.3 9.1 .. 24.4 .. VF45 47 Kyrgyzstan VF 6.9 8.5 .. 22.5 .. ..46 46 Philippines TF 7.2 8.3 1.5 15.2 -82.1 TF47 44 Sweden TCE 7.4 7.6 .. 2.4 .. TCE -80.3 -80.3 -80.4 -80.448 48 Argentina TF 6.9 7.4 2.1 6.6 -71.8 TF -97.6 -97.6 -97.5 -98.5 -95.7 -97.8 -97.8 -97.4 -98.3 -97.849 55 Uzbekistan VF 5.3 6.7 .. 26.2 .. VF50 51 Cambodia TF 6.2 6.6 1.3 6.6 -80.2 TF -93.9 -93.9 -96.2 -94.6 -86.7 -96.2 -96.2 -96.8 -96.6 -95.3Source: World Tourism Organization (UNWTO) © (Data as collected by UNWTO, May 2021)See box in page 'Annex-1' for explanation of abbreviations and symbols used. * Provisional data
May 2021 – Statistical Annex
Annex - 7
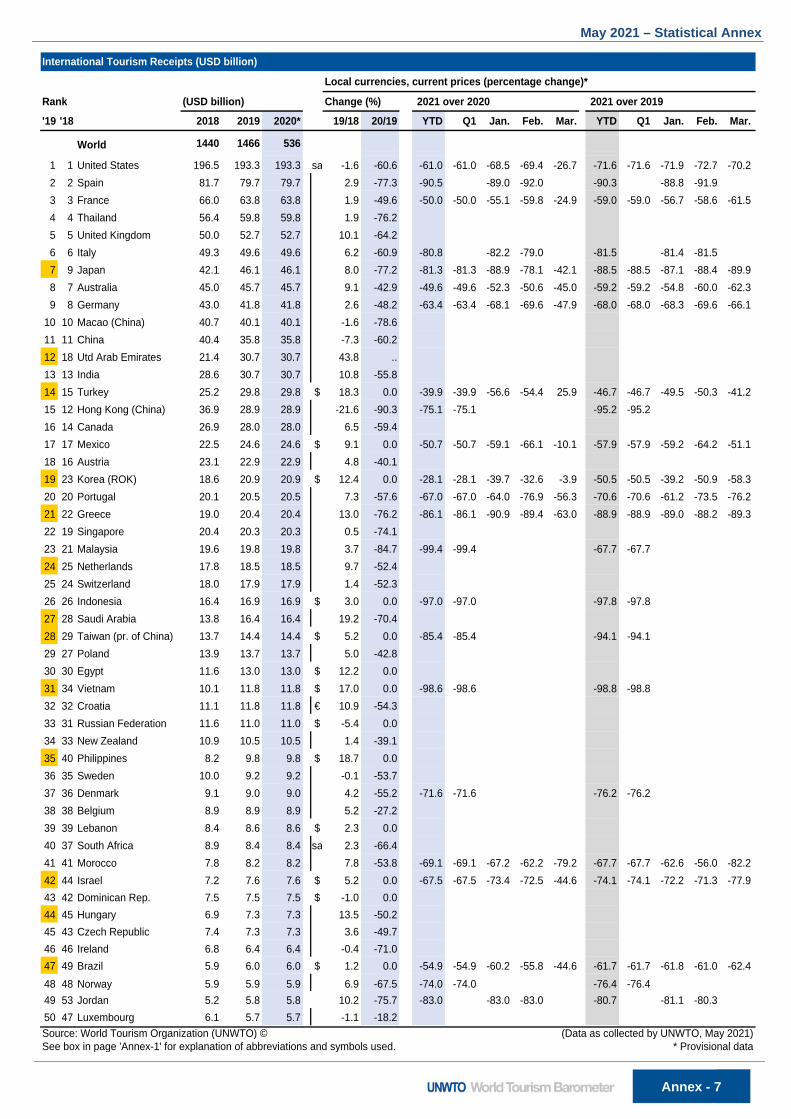
International Tourism Receipts (USD billion)
Local currencies, current prices (percentage change)*
Rank (USD billion) Change (%) 2021 over 2020 2021 over 2019'19 '18 2018 2019 2020* 19/18 20/19 YTD Q1 Jan. Feb. Mar. YTD Q1 Jan. Feb. Mar.
World 1440 1466 536
1 1 United States 196.5 193.3 193.3 sa -1.6 -60.6 -61.0 -61.0 -68.5 -69.4 -26.7 -71.6 -71.6 -71.9 -72.7 -70.22 2 Spain 81.7 79.7 79.7 2.9 -77.3 -90.5 -89.0 -92.0 -90.3 -88.8 -91.93 3 France 66.0 63.8 63.8 1.9 -49.6 -50.0 -50.0 -55.1 -59.8 -24.9 -59.0 -59.0 -56.7 -58.6 -61.54 4 Thailand 56.4 59.8 59.8 1.9 -76.25 5 United Kingdom 50.0 52.7 52.7 10.1 -64.26 6 Italy 49.3 49.6 49.6 6.2 -60.9 -80.8 -82.2 -79.0 -81.5 -81.4 -81.57 9 Japan 42.1 46.1 46.1 8.0 -77.2 -81.3 -81.3 -88.9 -78.1 -42.1 -88.5 -88.5 -87.1 -88.4 -89.98 7 Australia 45.0 45.7 45.7 9.1 -42.9 -49.6 -49.6 -52.3 -50.6 -45.0 -59.2 -59.2 -54.8 -60.0 -62.39 8 Germany 43.0 41.8 41.8 2.6 -48.2 -63.4 -63.4 -68.1 -69.6 -47.9 -68.0 -68.0 -68.3 -69.6 -66.1
10 10 Macao (China) 40.7 40.1 40.1 -1.6 -78.611 11 China 40.4 35.8 35.8 -7.3 -60.212 18 Utd Arab Emirates 21.4 30.7 30.7 43.8 ..13 13 India 28.6 30.7 30.7 10.8 -55.814 15 Turkey 25.2 29.8 29.8 $ 18.3 0.0 -39.9 -39.9 -56.6 -54.4 25.9 -46.7 -46.7 -49.5 -50.3 -41.215 12 Hong Kong (China) 36.9 28.9 28.9 -21.6 -90.3 -75.1 -75.1 -95.2 -95.216 14 Canada 26.9 28.0 28.0 6.5 -59.417 17 Mexico 22.5 24.6 24.6 $ 9.1 0.0 -50.7 -50.7 -59.1 -66.1 -10.1 -57.9 -57.9 -59.2 -64.2 -51.118 16 Austria 23.1 22.9 22.9 4.8 -40.119 23 Korea (ROK) 18.6 20.9 20.9 $ 12.4 0.0 -28.1 -28.1 -39.7 -32.6 -3.9 -50.5 -50.5 -39.2 -50.9 -58.320 20 Portugal 20.1 20.5 20.5 7.3 -57.6 -67.0 -67.0 -64.0 -76.9 -56.3 -70.6 -70.6 -61.2 -73.5 -76.221 22 Greece 19.0 20.4 20.4 13.0 -76.2 -86.1 -86.1 -90.9 -89.4 -63.0 -88.9 -88.9 -89.0 -88.2 -89.322 19 Singapore 20.4 20.3 20.3 0.5 -74.123 21 Malaysia 19.6 19.8 19.8 3.7 -84.7 -99.4 -99.4 -67.7 -67.724 25 Netherlands 17.8 18.5 18.5 9.7 -52.425 24 Switzerland 18.0 17.9 17.9 1.4 -52.326 26 Indonesia 16.4 16.9 16.9 $ 3.0 0.0 -97.0 -97.0 -97.8 -97.827 28 Saudi Arabia 13.8 16.4 16.4 19.2 -70.428 29 Taiwan (pr. of China) 13.7 14.4 14.4 $ 5.2 0.0 -85.4 -85.4 -94.1 -94.129 27 Poland 13.9 13.7 13.7 5.0 -42.830 30 Egypt 11.6 13.0 13.0 $ 12.2 0.031 34 Vietnam 10.1 11.8 11.8 $ 17.0 0.0 -98.6 -98.6 -98.8 -98.832 32 Croatia 11.1 11.8 11.8 € 10.9 -54.333 31 Russian Federation 11.6 11.0 11.0 $ -5.4 0.034 33 New Zealand 10.9 10.5 10.5 1.4 -39.135 40 Philippines 8.2 9.8 9.8 $ 18.7 0.036 35 Sweden 10.0 9.2 9.2 -0.1 -53.737 36 Denmark 9.1 9.0 9.0 4.2 -55.2 -71.6 -71.6 -76.2 -76.238 38 Belgium 8.9 8.9 8.9 5.2 -27.239 39 Lebanon 8.4 8.6 8.6 $ 2.3 0.040 37 South Africa 8.9 8.4 8.4 sa 2.3 -66.441 41 Morocco 7.8 8.2 8.2 7.8 -53.8 -69.1 -69.1 -67.2 -62.2 -79.2 -67.7 -67.7 -62.6 -56.0 -82.242 44 Israel 7.2 7.6 7.6 $ 5.2 0.0 -67.5 -67.5 -73.4 -72.5 -44.6 -74.1 -74.1 -72.2 -71.3 -77.943 42 Dominican Rep. 7.5 7.5 7.5 $ -1.0 0.044 45 Hungary 6.9 7.3 7.3 13.5 -50.245 43 Czech Republic 7.4 7.3 7.3 3.6 -49.746 46 Ireland 6.8 6.4 6.4 -0.4 -71.047 49 Brazil 5.9 6.0 6.0 $ 1.2 0.0 -54.9 -54.9 -60.2 -55.8 -44.6 -61.7 -61.7 -61.8 -61.0 -62.448 48 Norway 5.9 5.9 5.9 6.9 -67.5 -74.0 -74.0 -76.4 -76.449 53 Jordan 5.2 5.8 5.8 10.2 -75.7 -83.0 -83.0 -83.0 -80.7 -81.1 -80.350 47 Luxembourg 6.1 5.7 5.7 -1.1 -18.2Source: World Tourism Organization (UNWTO) © (Data as collected by UNWTO, May 2021)See box in page 'Annex-1' for explanation of abbreviations and symbols used. * Provisional data

May 2021 – Statistical Annex
Annex - 8
International Tourism Receipts (EUR billion)
Local currencies, current prices (percentage change)*
Rank (EUR billion) Change (%) 2021 over 2020 2021 over 2019'19 '18 2018 2019 2020* 19/18 20/19 YTD Q1 Jan. Feb. Mar. YTD Q1 Jan. Feb. Mar.
World 1219 1309 469
1 1 United States 166.4 172.7 169.2 sa -1.6 -60.6 -61.0 -61.0 -68.5 -69.4 -26.7 -71.6 -71.6 -71.9 -72.7 -70.22 2 Spain 69.2 71.2 69.8 2.9 -77.3 -90.5 -89.0 -92.0 -90.3 -88.8 -91.93 3 France 55.9 57.0 55.9 1.9 -49.6 -50.0 -50.0 -55.1 -59.8 -24.9 -59.0 -59.0 -56.7 -58.6 -61.54 4 Thailand 47.7 53.4 52.4 1.9 -76.25 5 United Kingdom 42.4 47.1 46.2 10.1 -64.26 6 Italy 41.7 44.3 43.4 6.2 -60.9 -80.8 -82.2 -79.0 -81.5 -81.4 -81.57 9 Japan 35.6 41.1 40.3 8.0 -77.2 -81.3 -81.3 -88.9 -78.1 -42.1 -88.5 -88.5 -87.1 -88.4 -89.98 7 Australia 38.1 40.8 40.0 9.1 -42.9 -49.6 -49.6 -52.3 -50.6 -45.0 -59.2 -59.2 -54.8 -60.0 -62.39 8 Germany 36.4 37.3 36.6 2.6 -48.2 -63.4 -63.4 -68.1 -69.6 -47.9 -68.0 -68.0 -68.3 -69.6 -66.1
10 10 Macao (China) 34.5 35.8 35.1 -1.6 -78.611 11 China 34.2 32.0 31.4 -7.3 -60.212 18 Utd Arab Emirates 18.1 27.5 26.9 43.8 ..13 13 India 24.2 27.4 26.9 10.8 -55.814 15 Turkey 21.4 26.6 26.1 $ 18.3 0.0 -39.9 -39.9 -56.6 -54.4 25.9 -46.7 -46.7 -49.5 -50.3 -41.215 12 Hong Kong (China) 31.2 25.8 25.3 -21.6 -90.3 -75.1 -75.1 -95.2 -95.216 14 Canada 22.8 25.0 24.5 6.5 -59.417 17 Mexico 19.1 22.0 21.5 $ 9.1 0.0 -50.7 -50.7 -59.1 -66.1 -10.1 -57.9 -57.9 -59.2 -64.2 -51.118 16 Austria 19.6 20.5 20.1 4.8 -40.119 23 Korea (ROK) 15.7 18.6 18.3 $ 12.4 0.0 -28.1 -28.1 -39.7 -32.6 -3.9 -50.5 -50.5 -39.2 -50.9 -58.320 20 Portugal 17.1 18.3 17.9 7.3 -57.6 -67.0 -67.0 -64.0 -76.9 -56.3 -70.6 -70.6 -61.2 -73.5 -76.221 22 Greece 16.1 18.2 17.8 13.0 -76.2 -86.1 -86.1 -90.9 -89.4 -63.0 -88.9 -88.9 -89.0 -88.2 -89.322 19 Singapore 17.3 18.1 17.8 0.5 -74.123 21 Malaysia 16.6 17.7 17.4 3.7 -84.7 -99.4 -99.4 -67.7 -67.724 25 Netherlands 15.1 16.5 16.2 9.7 -52.425 24 Switzerland 15.2 16.0 15.7 1.4 -52.326 26 Indonesia 13.9 15.1 14.8 $ 3.0 0.0 -97.0 -97.0 -97.8 -97.827 28 Saudi Arabia 11.7 14.7 14.4 19.2 -70.428 29 Taiwan (pr. of China) 11.6 12.9 12.6 $ 5.2 0.0 -85.4 -85.4 -94.1 -94.129 27 Poland 11.7 12.2 12.0 5.0 -42.830 30 Egypt 9.8 11.6 11.4 $ 12.2 0.031 34 Vietnam 8.5 10.5 10.3 $ 17.0 0.0 -98.6 -98.6 -98.8 -98.832 32 Croatia 9.4 10.5 10.3 € 10.9 -54.333 31 Russian Federation 9.8 9.8 9.6 $ -5.4 0.034 33 New Zealand 9.2 9.4 9.2 1.4 -39.135 40 Philippines 7.0 8.7 8.6 18.7 0.036 35 Sweden 8.5 8.2 8.0 -0.1 -53.737 36 Denmark 7.7 8.0 7.9 4.2 -55.2 -71.6 -71.6 -76.2 -76.238 38 Belgium 7.5 7.9 7.8 5.2 -27.239 39 Lebanon 7.1 7.7 7.5 $ 2.3 0.040 37 South Africa 7.6 7.5 7.3 sa 2.3 -66.441 41 Morocco 6.6 7.3 7.2 7.8 -53.8 -69.1 -69.1 -67.2 -62.2 -79.2 -67.7 -67.7 -62.6 -56.0 -82.242 44 Israel 6.1 6.8 6.7 $ 5.2 0.0 -67.5 -67.5 -73.4 -72.5 -44.6 -74.1 -74.1 -72.2 -71.3 -77.943 42 Dominican Rep. 6.4 6.7 6.5 $ -1.0 0.044 45 Hungary 5.9 6.5 6.4 13.5 -50.245 43 Czech Republic 6.3 6.5 6.4 3.6 -49.746 46 Ireland 5.8 5.7 5.6 -0.4 -71.047 49 Brazil 5.0 5.4 5.2 $ 1.2 0.0 -54.9 -54.9 -60.2 -55.8 -44.6 -61.7 -61.7 -61.8 -61.0 -62.448 48 Norway 5.0 5.2 5.1 6.9 -67.5 -74.0 -74.0 -76.4 -76.449 53 Jordan 4.4 5.2 5.1 10.2 -75.7 -83.0 -83.0 -83.0 -80.750 47 Luxembourg 5.2 5.1 5.0 $ -1.1 -18.2
Source: World Tourism Organization (UNWTO) © (Data as collected by UNWTO, May 2021)See box in page 'Annex-1' for explanation of abbreviations and symbols used. * Provisional data

May 2021 – Statistical Annex
Annex - 9
International Tourism Expenditure (USD billion)
Local currencies, current prices (percentage change)*
Rank (USD billion) Change (%) 2021 over 2020 2021 over 2019'19 '18 2018 2019 2020* 19/18 20/19 YTD Q1 Jan. Feb. Mar. YTD Q1 Jan. Feb. Mar.
World 1,440 1,466 536
1 1 China 277.3 254.6 254.6 -4.2 -48.72 2 United States 126.0 134.6 134.6 sa 6.8 -70.8 -67.2 -67.2 -74.1 -75.4 -19.1 -77.7 -77.7 -76.2 -79.0 -77.83 3 Germany 95.6 93.2 93.2 2.9 -56.9 -79.8 -79.8 -81.4 -84.1 -72.0 -80.1 -80.1 -78.0 -81.6 -80.54 4 United Kingdom 70.9 71.9 71.9 6.0 -70.05 5 France 48.9 51.7 51.7 11.5 -47.0 -49.2 -49.2 -52.0 -56.3 -38.2 -56.2 -56.2 -56.1 -57.7 -54.96 9 Russian Federation 34.3 36.2 36.2 $ 5.5 0.07 6 Australia 37.0 36.0 36.0 4.6 -81.0 -98.5 -98.5 -98.8 -98.6 -97.3 -98.8 -98.8 -98.8 -98.8 -98.88 8 Canada 34.5 35.8 35.8 6.1 -65.89 7 Korea (ROK) 35.1 32.7 32.7 $ -6.8 0.0 -34.5 -34.5 -50.1 -30.9 -3.6 -53.6 -53.6 -54.7 -56.5 -49.3
10 10 Italy 30.1 30.3 30.3 6.3 -64.7 -75.1 -79.2 -69.5 -76.1 -78.9 -72.511 12 Spain 26.4 27.9 27.9 11.3 -69.2 -86.8 -85.4 -88.4 -86.4 -85.1 -87.812 11 Singapore 26.5 27.3 27.3 4.2 -74.713 13 Hong Kong (China) 26.4 26.9 26.9 1.6 -80.3 -78.3 -78.3 -88.9 -88.914 21 Utd Arab Emirates 18.0 26.7 26.7 48.3 ..15 14 India 21.3 22.9 22.9 10.6 -42.416 16 Japan 20.2 21.3 21.3 3.8 -74.7 -80.8 -80.8 -84.1 -85.7 -55.0 -87.6 -87.6 -85.2 -87.3 -89.617 15 Netherlands 20.9 20.6 20.6 4.3 -66.318 17 Taiwan (pr. of China) 19.4 20.5 20.5 $ 5.5 0.0 -83.7 -83.7 -92.5 -92.519 18 Switzerland 19.1 18.8 18.8 -0.1 -51.820 19 Belgium 18.5 18.7 18.7 6.8 -30.521 20 Brazil 18.3 17.6 17.6 $ -3.7 0.0 -70.6 -70.6 -78.6 -72.8 -48.9 -80.1 -80.1 -81.8 -81.6 -76.422 22 Norway 17.1 16.5 16.5 4.7 -76.3 -93.7 -93.7 -94.7 -94.723 25 Kuwait 14.3 15.8 15.8 11.2 ..24 23 Saudi Arabia 16.7 15.1 15.1 -9.1 -44.625 24 Sweden 15.7 14.4 14.4 -0.4 -58.226 34 Nigeria 9.6 13.5 13.5 $ 41.2 0.027 26 Malaysia 12.1 12.4 12.4 4.8 .. -65.4 -65.428 27 Thailand 12.1 12.4 12.4 -1.5 -76.729 28 Philippines 11.9 12.0 12.0 $ 1.5 0.030 29 Austria 11.8 11.6 11.6 3.4 -58.731 33 Indonesia 10.3 11.3 11.3 $ 9.7 0.0 -95.3 -95.3 -97.4 -97.432 40 Iraq 7.9 10.9 10.9 $ 39.1 0.033 32 Denmark 10.5 10.1 10.1 1.4 -51.3 -52.3 -52.3 -60.5 -60.534 30 Mexico 11.2 9.9 9.9 $ -12.0 0.0 -58.3 -58.3 -64.2 -64.7 -39.0 -65.5 -65.5 -68.4 -67.7 -59.435 36 Qatar 9.3 9.5 9.5 2.3 -28.936 35 Poland 9.5 9.2 9.2 3.3 -43.137 37 Iran 8.7 .. .. $ .. ..38 38 Ukraine 7.9 8.5 8.5 $ 7.8 0.0 -57.5 -55.9 -59.0 -54.2 -52.5 -55.839 41 Ireland 7.6 8.2 8.2 13.9 -71.440 39 Israel 7.9 8.2 8.2 $ 3.5 0.041 31 Argentina 10.7 7.9 7.9 $ -26.4 0.042 43 Vietnam 6.1 6.4 6.4 $ 4.1 0.0 -34.8 -34.8 -35.3 -35.343 42 Lebanon 6.3 6.3 6.3 $ 1.3 0.044 47 Romania 5.3 6.0 6.0 € 18.6 -50.4 -42.8 -42.8 -61.2 -48.8 0.4 -42.5 -42.5 -50.5 -43.8 -33.545 45 Czech Republic 6.0 5.9 5.9 4.2 -41.246 46 Portugal 5.4 5.8 5.8 13.1 -46.1 -49.5 -49.5 -56.7 -60.4 -19.2 -55.6 -55.6 -53.3 -58.2 -55.447 44 Finland 6.1 5.7 5.7 -1.5 -72.548 48 Colombia 4.8 5.0 5.0 $ 3.1 0.049 49 New Zealand 4.6 4.4 4.4 0.5 -66.050 50 Turkey 4.6 4.1 4.1 $ -10.6 0.0 -71.4 -71.4 -80.3 -77.5 -40.8 -79.5 -79.5 -81.8 -80.2 -76.7Source: World Tourism Organization (UNWTO) © (Data as collected by UNWTO, May 2021)See box in page 'Annex-1' for explanation of abbreviations and symbols used. * Provisional data

May 2021 – Statistical Annex
Annex - 10
International Tourism Expenditure (EUR billion)
Local currencies, current prices (percentage change)*
Rank (EUR billion) Change (%) 2021 over 2020 2021 over 2019'19 '18 2018 2019 2020* 19/18 20/19 YTD Q1 Jan. Feb. Mar. YTD Q1 Jan. Feb. Mar.
World 1,219 1,309 469
1 1 China 234.8 227.4 222.9 -4.2 -48.72 2 United States 106.7 120.2 117.8 sa 6.8 -70.8 -67.2 -67.2 -74.1 -75.4 -19.1 -77.7 -77.7 -76.2 -79.0 -77.83 3 Germany 80.9 83.3 81.6 2.9 -56.9 -79.8 -79.8 -81.4 -84.1 -72.0 -80.1 -80.1 -78.0 -81.6 -80.54 4 United Kingdom 60.0 64.2 62.9 6.0 -70.05 5 France 41.4 46.1 45.2 11.5 -47.0 -49.2 -49.2 -52.0 -56.3 -38.2 -56.2 -56.2 -56.1 -57.7 -54.96 9 Russian Federation 29.0 32.3 31.7 5.5 0.07 6 Australia 31.3 32.1 31.5 4.6 -81.0 -98.5 -98.5 -98.8 -98.6 -97.3 -98.8 -98.8 -98.8 -98.8 -98.88 8 Canada 29.2 32.0 31.3 $ 6.1 -65.89 7 Korea (ROK) 29.7 29.2 28.7 $ -6.8 0.0 -34.5 -34.5 -50.1 -30.9 -3.6 -53.6 -53.6 -54.7 -56.5 -49.3
10 10 Italy 25.5 27.1 26.6 6.3 -64.7 -75.1 -79.2 -69.5 -76.1 -78.9 -72.511 12 Spain 22.4 24.9 24.4 11.3 -69.2 -86.8 -85.4 -88.4 -86.4 -85.1 -87.812 11 Singapore 22.5 24.4 23.9 4.2 -74.713 13 Hong Kong (China) 22.4 24.0 23.5 1.6 -80.3 -78.3 -78.3 -88.9 -88.914 21 Utd Arab Emirates 15.2 23.8 23.4 48.3 ..15 14 India 18.1 20.5 20.1 $ 10.6 -42.416 16 Japan 17.1 19.0 18.6 3.8 -74.7 -80.8 -80.8 -84.1 -85.7 -55.0 -87.6 -87.6 -85.2 -87.3 -89.617 15 Netherlands 17.7 18.4 18.1 4.3 -66.318 17 Taiwan (pr. of China) 16.5 18.3 17.9 5.5 0.0 -83.7 -83.7 -92.5 -92.519 18 Switzerland 16.1 16.8 16.4 -0.1 -51.820 19 Belgium 15.7 16.7 16.4 6.8 -30.521 20 Brazil 15.5 15.7 15.4 $ -3.7 0.0 -70.6 -70.6 -78.6 -72.8 -48.9 -80.1 -80.1 -81.8 -81.6 -76.422 22 Norway 14.5 14.8 14.5 4.7 -76.3 -93.7 -93.7 -94.7 -94.723 25 Kuwait 12.1 14.1 13.9 11.2 ..24 23 Saudi Arabia 14.1 13.5 13.3 -9.1 -44.625 24 Sweden 13.3 12.8 12.6 -0.4 -58.228 27 Thailand 10.2 11.0 10.8 $ -1.5 -76.726 34 Nigeria 8.1 12.1 11.8 41.2 0.027 26 Malaysia 10.3 11.1 10.8 $ 4.8 .. -65.4 -65.429 28 Philippines 10.0 10.8 10.5 $ 1.5 0.030 29 Austria 10.0 10.4 10.2 3.4 -58.731 33 Indonesia 8.7 10.1 9.9 $ 9.7 0.0 -95.3 -95.3 -97.4 -97.432 40 Iraq 6.7 9.8 9.6 $ 39.1 0.033 32 Denmark 8.9 9.0 8.9 1.4 -51.3 -52.3 -52.3 -60.5 -60.534 30 Mexico 9.5 8.8 8.7 -12.0 0.0 -58.3 -58.3 -64.2 -64.7 -39.0 -65.5 -65.5 -68.4 -67.7 -59.435 36 Qatar 7.9 8.5 8.3 2.3 -28.936 35 Poland 8.0 8.2 8.1 $ 3.3 -43.137 37 Iran 7.4 .. .. .. ..38 38 Ukraine 6.7 7.6 7.5 7.8 0.0 -57.5 -55.9 -59.0 -54.2 -52.5 -55.839 41 Ireland 6.4 7.3 7.1 $ 13.9 -71.440 39 Israel 6.7 7.3 7.1 $ 3.5 0.041 31 Argentina 9.0 7.0 6.9 -26.4 0.042 43 Vietnam 5.2 5.7 5.6 $ 4.1 0.0 -34.8 -34.8 -35.3 -35.343 42 Lebanon 5.3 5.7 5.5 $ 1.3 0.044 47 Romania 4.5 5.4 5.3 € 18.6 -50.4 -42.8 -42.8 -61.2 -48.8 0.4 -42.5 -42.5 -50.5 -43.8 -33.545 45 Czech Republic 5.1 5.3 5.2 4.2 -41.246 46 Portugal 4.6 5.2 5.1 13.1 -46.1 -49.5 -49.5 -56.7 -60.4 -19.2 -55.6 -55.6 -53.3 -58.2 -55.447 44 Finland 5.2 5.1 5.0 $ -1.5 -72.548 48 Colombia 4.1 4.4 4.4 $ 3.1 0.049 49 New Zealand 3.9 3.9 3.9 $ 0.5 -66.050 50 Turkey 3.9 3.7 3.6 -10.6 0.0 -71.4 -71.4 -80.3 -77.5 -40.8 -79.5 -79.5 -81.8 -80.2 -76.7Source: World Tourism Organization (UNWTO) © (Data as collected by UNWTO, May 2021)See box in page 'Annex-1' for explanation of abbreviations and symbols used. * Provisional data

May 2021 – Statistical Annex
Annex - 11
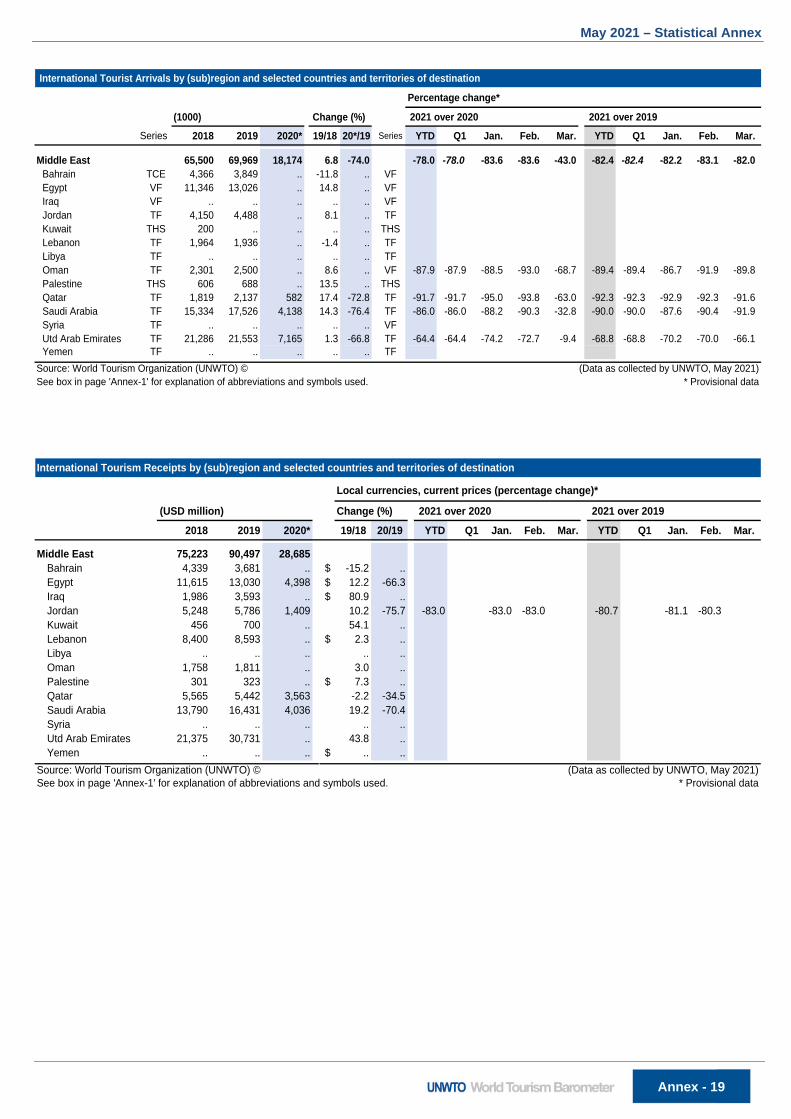
International Tourist Arrivals by (sub)region and selected countries and territories of destination
Percentage change*
(1000) Change (%) 2021 over 2020 2021 over 2019Series 2018 2019 2020* 19/18 20*/19 Series YTD Q1 Jan. Feb. Mar. YTD Q1 Jan. Feb. Mar.
Europe 715,994 746,294 235,079 4.2 -68.5 -83.4 -83.4 -85.2 -87.3 -71.0 -87.0 -87.0 -84.6 -87.0 -88.8- of which EU-27 523,835 540,666 177,938 3.2 -67.1 -85.6 -85.6 -86.4 -89.0 -75.6 -88.9 -88.9 -85.9 -88.7 -91.6Northern Europe 81,035 83,740 20,686 3.3 -75.3 -91.7 -91.7 -92.0 -92.5 -89.7 -93.2 -93.2 -91.5 -92.1 -95.5Denmark TF 12,749 14,573 .. 14.3 .. TCE -88.5 -88.5 -88.2 -88.2Finland TCE 3,224 3,290 896 2.0 -72.8 TCE -92.1 -92.1 -93.5 -93.0 -85.7 -93.3 -93.3 -92.9 -93.1 -94.0Iceland TF 2,344 2,013 486 -14.1 -75.8 TCE -97.1 -97.1 -97.9 -98.2 -94.0 -97.8 -97.8 -97.7 -98.5 -97.3Ireland TF 10,926 10,951 .. 0.2 .. TF*Norway TF 5,688 5,879 .. 3.4 .. TCE -88.3 -85.3 -90.7 -86.6 -83.5 -89.1Sweden TCE 7,440 7,616 .. 2.4 .. TCE -80.3 -80.3 -80.4 -80.4United Kingdom TF 38,664 39,418 .. 1.9 .. VF
Western Europe 200,164 205,367 79,050 2.6 -61.5 -89.9 -89.9 -87.4 -94.0 -84.9 -92.2 -92.2 -86.8 -93.7 -95.1Austria TCE 30,816 31,884 15,091 3.5 -52.7 TCE -97.8 -97.8 -98.5 -98.6 -93.0 -98.2 -98.2 -98.3 -98.4 -97.8Belgium TCE 9,119 9,343 2,641 2.5 -71.7 TCEFrance TF 89,400 .. .. .. .. TCEGermany TCE 38,881 39,563 12,449 1.8 -68.5 TCE -92.3 -92.3 -92.3 -92.2 -92.2 -92.2Liechtenstein TCE 87 98 59 12.3 -40.2 TCE -59.1 -63.1 -55.6 -50.2 -56.7 -44.0Luxembourg TCE 1,018 1,041 509 2.3 -51.1 TCE -56.7 -55.8 -57.7 -56.6 -55.6 -57.5Monaco THS 347 363 .. 4.6 .. THSNetherlands TCE 18,781 20,128 7,265 7.2 -63.9 TCE -92.5 -91.7 -93.3 -92.2 -91.3 -93.1Switzerland TF 11,715 11,818 .. 0.9 .. THS -75.9 -75.9 -84.2 -82.0 -31.7 -82.3 -82.3 -82.7 -82.6 -81.7
Central/Eastern Eur. 146,185 153,255 47,674 4.8 -68.9 -77.8 -77.8 -82.1 -79.8 -68.0 -81.6 -81.6 -82.6 -80.8 -81.3Armenia TF 1,652 1,894 375 14.7 -80.2 TF -71.9 -71.9 -76.3 -76.3Azerbaijan TF 2,605 2,864 .. 9.9 .. VF -77.4 -77.4 -84.0 -82.0 -51.6 -80.8 -80.8 -81.1 -79.2 -81.7Belarus TCE 2,142 2,201 .. 2.8 .. TCEBulgaria TF 9,273 9,312 .. 0.4 .. VF -45.9 -45.9 -60.0 -52.6 -8.0 -51.6 -51.6 -56.4 -50.1 -48.2Czech Republic TF 14,283 14,651 .. 2.6 .. TCE -96.3 -96.3 -96.9 -97.2 -91.3 -97.2 -97.2 -96.5 -97.2 -97.8Estonia TF 3,226 3,336 1,026 3.4 -69.2 TCE -89.2 -89.2 -91.9 -89.6 -80.7 -90.9 -90.9 -90.8 -88.7 -93.0Georgia TF 4,757 5,080 1,089 6.8 -78.6 TF -84.8 -84.8 -91.9 -86.1 -64.4 -86.8 -86.8 -90.4 -85.5 -84.4Hungary TF 17,152 16,937 7,418 -1.3 -56.2 TFKazakhstan TF .. .. .. .. .. VF -84.5 -84.5 -86.7 -86.7Kyrgyzstan VF 6,947 8,508 .. 22.5 .. ..Latvia TF 1,946 1,935 .. -0.6 .. TCE -91.2 -91.2 -93.4 -92.0 -83.7 -92.5 -92.5 -92.7 -90.9 -93.6Lithuania TF 2,825 2,875 .. 1.8 .. TCE -82.7 -82.7 -88.0 -85.6 -64.3 -86.3 -86.3 -88.1 -84.5 -86.1Poland TF 19,622 21,158 8,418 7.8 -60.2 TFRep. Moldova TCE 160 174 29 8.6 -83.5 TCE -60.4 -60.4 -76.4 -76.4Romania TCE 2,797 2,684 .. -4.0 .. TCE -77.2 -77.2 -85.0 -83.1 -27.2 -85.5 -85.5 -86.3 -84.9 -85.3Russian Federation VF 24,551 24,592 6,359 0.2 -74.1 VFSlovakia TF 5,453 .. .. .. .. TCE -95.7 -95.7 -96.8 -96.8 -88.4 -96.3 -96.3 -96.2 -96.6 -96.2Tajikistan VF 1,250 .. .. .. .. VFTurkmenistan TF .. .. .. .. .. TFUkraine TF 14,207 13,438 3,382 -5.4 -74.8 TFUzbekistan VF 5,346 6,749 .. 26.2 .. VF
Southern/Medit. Eur. 288,610 303,932 87,669 5.3 -71.2 -78.4 -78.4 -82.8 -83.7 -53.6 -83.7 -83.7 -81.5 -83.2 -85.7Albania TF 5,142 5,919 2,521 15.1 -57.4 VF -10.4 -10.4 -25.7 -30.9 78.6 -26.1 -26.1 -11.5 -21.5 -40.0Andorra TF 3,042 3,090 1,872 1.6 -39.4 TF -81.5 -81.5 -89.9 -82.8 -55.8 -82.8 -82.8 -88.4 -81.1 -78.6Bosnia & Herzg. TCE 1,053 1,198 196 13.8 -83.6 TCE -51.8 -51.8 -69.4 -52.6 9.7 -64.7 -64.7 -61.9 -56.0 -73.1Croatia TCE 16,645 17,353 5,545 4.3 -68.0 TCE -87.5 -86.6 -88.2 -87.3 -86.3 -88.1Cyprus TF 3,939 3,977 632 1.0 -84.1 TF -92.8 -92.8 -95.5 -95.2 -84.1 -95.0 -95.0 -95.3 -95.2 -94.8Greece TF 30,123 31,348 7,217 4.1 -77.0 TF -85.2 -85.2 -87.9 -87.8 -75.9 -64.4 -64.4 -63.6 -56.4 -70.9Israel TF 4,121 4,552 833 10.5 -81.7 TF -97.7 -97.7 -97.6 -99.2 -91.7 -86.0 -86.0 -85.5 -84.8 -87.2Italy TF 61,567 64,513 25,190 4.8 -61.0 TF -77.8 -79.7 -75.5 -98.4 -98.4 -97.4 -99.2 -98.4Malta TF 2,599 2,753 659 5.9 -76.1 TF -91.0 -91.0 -90.7 -93.7 -86.3 -78.0 -78.9 -77.2Montenegro TCE 2,077 2,510 351 20.8 -86.0 TCE -65.0 -51.4 -72.8 -92.2 -92.2 -89.2 -92.7 -94.1North Macedonia TCE 707 758 118 7.1 -84.4 TCE -56.1 -56.1 -69.8 -60.2 -1.6 -61.7 -49.2 -69.5Portugal TF 22,800 24,600 .. 7.9 .. TCE -93.1 -90.1 -95.9 -92.5 -89.1 -95.6San Marino THS 84 111 58 32.3 -47.7 TCE -62.4 -62.4 -83.6 -60.8 225.1 -66.4 -66.4 -74.5 -44.2 -73.9Serbia TCE 1,711 1,847 446 8.0 -75.9 TCE -61.2 -61.2 -75.0 -65.2 -13.4 -66.7 -66.7 -67.8 -60.5 -70.4Slovenia TCE 4,425 4,702 1,216 6.3 -74.1 TCE* -93.3 -93.3 -97.0 -95.0 -70.9 -95.2 -95.2 -96.8 -94.9 -94.1Spain TF 82,808 83,509 18,958 0.8 -77.3 TF -88.6 -88.6 -89.5 -93.6 -75.5 -91.5 -91.5 -89.6 -93.5 -91.3Turkey TF 45,768 51,192 15,887 11.9 -69.0 TF* -53.8 -53.8 -71.4 -68.9 26.8 -64.1 -64.1 -66.9 -67.8 -59.3
Source: World Tourism Organization (UNWTO) © (Data as collected by UNWTO, May 2021)See box in page 'Annex-1' for explanation of abbreviations and symbols used. * Provisional data

May 2021 – Statistical Annex
Annex - 12
International Tourism Receipts by (sub)region and selected countries and territories of destination
Local currencies, current prices (percentage change)*
(USD million) Change (%) 2021 over 2020 2021 over 20192018 2019 2020* 19/18 20/19 YTD Q1 Jan. Feb. Mar. YTD Q1 Jan. Feb. Mar.
Europe 569,192 572,187 233,839- of which EU-27 427,899 423,730 181,538
Northern Europe 88,691 89,598 33,045Denmark 9,111 8,985 4,104 4.2 -55.2 -71.6 -71.6 -76.2 -76.2Finland 3,666 3,726 1,315 7.2 -65.4Iceland 3,121 2,695 639 -2.3 -73.8Ireland 6,803 6,425 1,901 -0.4 -71.0Norway 5,929 5,855 1,781 6.9 -67.5 -74.0 -74.0 -76.4 -76.4Sweden 10,012 9,193 4,374 -0.1 -53.7United Kingdom 50,050 52,721 18,933 10.1 -64.2
Western Europe 182,881 179,588 98,295Austria 23,099 22,942 14,018 4.8 -40.1Belgium 8,891 8,870 6,588 5.2 -27.2France 66,031 63,801 32,789 1.9 -49.6 -50.0 -50.0 -55.1 -59.8 -24.9 -59.0 -59.0 -56.7 -58.6 -61.5Germany 42,977 41,807 22,080 2.6 -48.2 -63.4 -63.4 -68.1 -69.6 -47.9 -68.0 -68.0 -68.3 -69.6 -66.1Liechtenstein .. .. .. .. ..Luxembourg 6,112 5,731 4,781 -1.1 -18.2Monaco .. .. .. .. ..Netherlands 17,782 18,487 8,974 9.7 -52.4Switzerland 17,989 17,949 9,065 1.4 -52.3
Central/Eastern Eur. 69,032 68,710 26,672Armenia 1,329 1,528 290 $ 15.0 -81.0Azerbaijan 2,634 1,792 304 $ -32.0 -83.0Belarus 883 901 355 $ 2.0 -60.6Bulgaria 4,501 4,294 1,624 0.6 -62.8 -47.7 -47.7 -60.4 -55.2 -8.7 -53.5 -53.5 -57.4 -52.7 -50.3Czech Republic 7,442 7,303 3,628 3.6 -49.7Estonia 1,783 1,745 591 3.3 -66.8Georgia 3,222 3,269 542 $ 1.4 -83.4Hungary 6,924 7,305 3,432 13.5 -50.2Kazakhstan 2,255 2,463 459 $ 9.3 -81.4Kyrgyzstan 460 644 .. $ 40.0 ..Latvia 1,059 1,017 460 1.2 -55.6 -81.5 -81.5 -83.6 -84.1 -73.8 -82.0 -82.0 -81.3 -81.0 -83.6Lithuania 1,505 1,493 474 4.6 -68.9Poland 13,863 13,705 7,770 5.0 -42.8Rep. Moldova 381 396 316 $ 4.1 -20.3Romania 3,400 3,576 1,435 € 10.9 -60.7 -48.1 -48.1 -55.8 -57.8 -20.5 -53.6 -53.6 -52.8 -59.1 -49.7Russian Federation 11,591 10,961 2,854 $ -5.4 -74.0Slovakia 3,200 3,203 1,258 5.6 -61.5Tajikistan 9 14 6 $ 53.8 -53.5Turkmenistan .. .. .. .. ..Ukraine 1,445 1,620 374 $ 12.1 -76.9 -73.1 -70.8 -75.0 -67.7 -65.0 -70.0Uzbekistan 1,144 1,481 345 $ 29.4 -76.7
Southern/Medit. Eur. 228,588 234,291 75,826Albania 2,193 2,332 1,129 € 12.2 -52.6 Andorra .. .. .. .. ..Bosnia & Herzg. 1,101 1,176 350 12.6 -70.8Croatia 11,127 11,753 5,569 € 10.9 -54.3Cyprus 3,472 3,254 658 -1.1 -80.2Greece 18,998 20,351 4,933 13.0 -76.2 -86.1 -86.1 -90.9 -89.4 -63.0 -88.9 -88.9 -89.0 -88.2 -89.3Israel 7,225 7,600 2,520 $ 5.2 -66.8 -67.5 -67.5 -73.4 -72.5 -44.6 -74.1 -74.1 -72.2 -71.3 -77.9Italy 49,262 49,596 19,797 6.2 -60.9 -80.8 -82.2 -79.0 -81.5 -81.4 -81.5Malta 1,859 1,901 417 7.9 -78.5Montenegro 1,182 1,230 165 9.7 -86.8 -44.0 -44.0 -46.8 -46.8North Macedonia 382 396 252 € 9.0 -38.1Portugal 20,140 20,477 8,856 7.3 -57.6 -67.0 -67.0 -64.0 -76.9 -56.3 -70.6 -70.6 -61.2 -73.5 -76.2San Marino .. .. .. .. ..Serbia 1,547 1,606 1,249 € 9.1 -24.5 2.1 2.1 -15.4 3.4 27.0 10.0 10.0 -4.1 23.8 15.9Slovenia 3,193 3,081 1,236 1.8 -60.7 -80.0 -80.0 -86.7 -85.1 -46.7 -84.3 -84.3 -86.3 -84.5 -82.4Spain 81,689 79,708 18,477 2.9 -77.3 -90.5 -89.0 -92.0 -90.3 -88.8 -91.9Turkey 25,220 29,829 10,220 $ 18.3 -65.7 -39.9 -39.9 -56.6 -54.4 25.9 -46.7 -46.7 -49.5 -50.3 -41.2
Source: World Tourism Organization (UNWTO) © (Data as collected by UNWTO, May 2021)See box in page 'Annex-1' for explanation of abbreviations and symbols used. * Provisional data

May 2021 – Statistical Annex
Annex - 13
International Tourist Arrivals by (sub)region and selected countries and territories of destination
Percentage change*
(1000) Change (%) 2021 over 2020 2021 over 2019Series 2018 2019 2020* 19/18 20*/19 Series YTD Q1 Jan. Feb. Mar. YTD Q1 Jan. Feb. Mar.
Asia and the Pacific 346,518 360,386 57,141 4.0 -84.1 -93.6 -93.6 -95.8 -93.9 -81.8 -96.6 -96.6 -96.0 -97.1 -96.8North-East Asia 169,190 170,311 20,186 0.7 -88.1 -89.3 -89.3 -94.0 -86.2 -35.2 -96.2 -96.2 -95.1 -97.3 -96.4China TF 62,900 65,700 .. 4.5 .. TFHong Kong (China) TF 29,263 23,752 1,359 -18.8 -94.3 TF -98.7 -98.7 -99.6 -94.1 -82.1 -99.8 -99.8 -99.8 -99.8 -99.7Japan VF 31,192 31,882 4,116 2.2 -87.1 VF -98.3 -98.3 -98.3 -99.3 -93.6 -99.2 -99.2 -98.3 -99.7 -99.6Korea (DPRK) .. .. .. .. .. TFKorea (ROK) VF 15,347 17,503 2,519 14.0 -85.6 VF -90.3 -90.3 -95.4 -90.4 -10.7 -94.8 -94.8 -94.7 -94.5 -95.1Macao (China) TF 18,493 18,633 2,822 0.8 -84.9 TF -39.6 -39.6 -79.6 225.8 221.6 -80.6 -80.6 -83.6 -83.8 -74.4Mongolia TF 529 577 59 9.1 -89.8 TF -89.7 -89.7 -95.0 -95.0Taiwan (pr. of China) VF 11,067 11,864 1,378 7.2 -88.4 VF -96.3 -96.3 -98.2 -96.5 -76.5 -98.4 -98.4 -98.3 -98.7 -98.3
South-East Asia 128,620 138,590 25,518 7.8 -81.6 -96.6 -96.6 -98.0 -96.8 -91.1 -97.8 -97.8 -97.9 -97.9 -97.6Brunei TF 278 333 62 19.8 -81.3 TF -98.9 -98.9 -98.6 -98.6Cambodia TF 6,201 6,611 1,306 6.6 -80.2 TF -93.9 -93.9 -96.2 -94.6 -86.7 -96.2 -96.2 -96.8 -96.6 -95.3Indonesia TF 13,396 15,455 .. 15.4 .. VF -85.4 -85.4 -89.4 -86.7 -72.7 -89.7 -89.7 -88.6 -90.7 -89.9Laos TF 3,770 4,384 .. 16.3 .. VFMalaysia TF 25,832 26,101 4,333 1.0 -83.4 TFMyanmar TF 3,551 4,364 .. 22.9 .. TF -89.4 -89.4 -93.7 -89.2 -72.1 -92.4 -92.4 -92.1 -93.3 -91.8Philippines TF 7,168 8,261 1,483 15.2 -82.1 TFSingapore TF 14,673 15,119 .. 3.0 .. VF -97.4 -97.4 -98.6 -97.5 -88.7 -98.5 -98.5 -98.6 -98.8 -98.3Thailand TF 38,178 39,874 6,702 4.4 -83.2 TF -99.7 -99.7 -99.8 -99.7 -99.2 -99.8 -99.8 -99.8 -99.8 -99.8Timor-Leste TF 75 81 18 8.2 -77.9 VFVietnam VF 15,498 18,009 3,837 16.2 -78.7 VF -98.7 -98.7 -99.1 -99.1 -95.7 -98.9 -98.9 -98.8 -99.3 -98.6
Oceania 17,049 17,452 3,599 2.4 -79.4 -98.0 -98.0 -98.3 -98.3 -96.4 -98.5 -98.5 -98.2 -98.7 -98.6American Samoa TF 20 20 .. -0.1 .. TFAustralia VF 9,246 9,466 1,828 2.4 -80.7 VF -98.7 -98.7 -99.0 -99.1 -97.5 -99.1 -99.1 -98.9 -99.3 -99.0Cook Islands TF 169 172 25 1.7 -85.3 TF -98.9 -98.9 -99.4 -99.3 -97.6 -99.1 -99.1 -99.4 -99.2 -98.7Fiji TF 870 894 147 2.8 -83.6 TF -97.0 -97.0 -98.5 -97.3 -93.0 -97.5 -97.5 -98.4 -97.4 -96.7French Polynesia TF 216 237 77 9.4 -67.5 TF -71.9 -71.9 -73.9 -73.9Guam TF 1,549 1,667 328 7.6 -80.3 TF -96.2 -96.2 -97.1 -97.0 -89.5 -97.3 -97.3 -96.9 -97.5 -97.5Kiribati TF 7 8 .. 11.3 .. VFMarshall Islands TF 7 6 .. -10.3 .. TF*Micronesia FSM TF 19 18 .. -6.3 .. TFNew Caledonia TF 120 130 31 8.4 -76.1 TFNew Zealand TF 3,686 3,702 .. 0.4 .. VF -98.4 -98.4 -98.7 -98.6 -97.4 -98.7 -98.7 -98.6 -98.7 -98.8Niue TF 11 10 .. -2.9 .. TFN.Mariana Islands VF 518 487 .. -5.9 .. VFPalau TF 106 94 18 -11.6 -80.5 TFPapua New Guinea TF 140 160 .. 14.3 .. TFSamoa TF 164 172 21 4.8 -87.9 VF -100.0 -100.0 -100.0 -100.0 -100.0 -100.0 -100.0Solomon Islands TF 28 29 4 3.7 -85.9 TFTonga TF 54 .. .. .. .. TFTuvalu TF 3 4 .. 12.5 .. TFVanuatu TF 116 121 22 4.3 -81.8 TF -100.0 -100.0 -100.0 -100.0 -100.0 -100.0
South Asia 31,658 34,032 7,839 7.5 -77.0 -90.9 -90.9 -92.4 -91.8 -82.4 -92.9 -92.9 -91.9 -92.2 -94.7Bangladesh TF 267 323 .. 21.0 .. TFBhutan TF 274 316 .. 15.1 .. TF* -100.0 -100.0 -100.0 -100.0 -100.0 -100.0 -100.0India TF 17,427 17,910 .. 2.8 .. TFIran VF 7,295 9,073 .. 24.4 .. VFMaldives TF 1,484 1,703 555 14.7 -67.4 TF -22.0 -22.0 -46.9 -35.3 83.8 -38.2 -38.2 -39.2 -42.5 -32.7Nepal TF 1,173 1,197 230 2.1 -80.8 TF -85.0 -85.0 -88.9 -90.7 -65.0 -89.4 -89.4 -89.1 -91.1 -88.2Pakistan TF .. .. .. .. .. TFSri Lanka TF 2,334 1,914 508 -18.0 -73.5 TF -98.1 -98.1 -99.3 -98.4 -93.6 -98.7 -98.7 -99.3 -98.7 -98.1
Source: World Tourism Organization (UNWTO) © (Data as collected by UNWTO, May 2021)See box in page 'Annex-1' for explanation of abbreviations and symbols used. * Provisional data

May 2021 – Statistical Annex
Annex - 14
International Tourism Receipts by (sub)region and selected countries and territories of destination
Local currencies, current prices (percentage change)*
(USD million) Change (%) 2021 over 2020 2021 over 20192018 2019 2020* 19/18 20/19 YTD Q1 Jan. Feb. Mar. YTD Q1 Jan. Feb. Mar.
Asia and the Pacific 435,240 441,306 132,557North-East Asia 193,339 187,197 48,945China 40,386 35,832 14,233 -7.3 -60.2Hong Kong (China) 36,866 28,913 2,842 -21.6 -90.3 -75.1 -75.1 -95.2 -95.2Japan 42,096 46,054 10,700 8.0 -77.2 -81.3 -81.3 -88.9 -78.1 -42.1 -88.5 -88.5 -87.1 -88.4 -89.9Korea (DPRK) .. .. .. .. ..Korea (ROK) 18,567 20,867 10,528 $ 12.4 -49.5 -28.1 -28.1 -39.7 -32.6 -3.9 -50.5 -50.5 -39.2 -50.9 -58.3Macao (China) 40,707 40,060 8,646 -1.6 -78.6Mongolia 445 513 29 $ 15.3 -94.3 -83.7 -83.7 -94.5 -80.8 42.0 -93.3 -93.3 -94.8 -91.9 -93.2Taiwan (pr. of China) 13,704 14,411 1,846 $ 5.2 -87.2 -85.4 -85.4 -94.1 -94.1
South-East Asia 138,239 146,900 32,285Brunei 190 217 15 $ 13.9 -93.1Cambodia 4,352 4,769 1,015 9.8 -78.6Indonesia 16,426 16,911 3,312 $ 3.0 -80.4 -97.0 -97.0 -97.8 -97.8Laos 811 935 .. $ 15.3 ..Malaysia 19,622 19,829 2,988 3.7 -84.7 -99.4 -99.4 -67.7 -67.7Myanmar 1,652 2,483 .. $ 50.3 ..Philippines 8,240 9,781 2,010 $ 18.7 -79.5Singapore 20,422 20,302 5,189 0.5 -74.1Thailand 56,366 59,810 14,198 1.9 -76.2Timor-Leste 78 70 26 $ -9.2 -63.6Vietnam 10,080 11,792 2,500 $ 17.0 -78.8 -98.6 -98.6 -98.8 -98.8
Oceania 61,137 61,607 33,264Australia 45,035 45,709 25,822 9.1 -42.9 -49.6 -49.6 -52.3 -50.6 -45.0 -59.2 -59.2 -54.8 -60.0 -62.3Cook Islands 233 .. .. .. ..Fiji 972 963 154 2.6 -84.0French Polynesia 642 .. .. .. ..Guam .. .. .. .. ..Kiribati 3 .. .. $ .. ..Marshall Islands 9 .. .. .. ..Micronesia FSM .. .. .. .. ..New Caledonia .. .. .. .. ..New Zealand 10,875 10,500 6,292 1.4 -39.1Niue .. .. .. $ .. ..N.Mariana Islands .. .. .. .. ..Palau .. .. .. $ .. ..Papua New Guinea 3 2 1 -14.9 -73.3Samoa 192 207 24 10.0 -88.5Solomon Islands 81 71 6 -9.6 -91.4Tonga 48 57 .. $ 17.9 ..Tuvalu .. .. .. .. ..Vanuatu 295 278 .. $ -5.6 ..
South Asia 42,526 45,602 18,064Afghanistan 28 72 65 $ .. ..Bangladesh 353 388 217 11.3 -43.9Bhutan 103 120 .. $ 16.5 .. -100.0 -100.0 -100.0 -100.0 -100.0 -100.0India 28,568 30,720 13,036 10.8 -55.8Iran 5,024 .. .. $ .. ..Maldives 3,028 3,134 .. $ 3.5 ..Nepal 650 707 194 12.5 -71.2 -84.6 -84.6 -91.8 -89.1 -54.6 -87.9 -87.9 -90.2 -89.9 -84.4Pakistan 391 494 438 $ 26.6 -11.4 6.0 6.0 -3.6 -9.1 39.1 37.7 37.7 23.3 42.9 49.2Sri Lanka 4,381 3,607 682 $ -17.7 -81.1 -98.8 -99.3 -98.4 -99.3 -99.5 -99.0
Source: World Tourism Organization (UNWTO) © (Data as collected by UNWTO, May 2021)See box in page 'Annex-1' for explanation of abbreviations and symbols used. * Provisional data

May 2021 – Statistical Annex
Annex - 15
International Tourist Arrivals by (sub)region and selected countries and territories of destination
Percentage change*
(1000) Change (%) 2021 over 2020 2021 over 2019Series 2018 2019 2020* 19/18 20*/19 Series YTD Q1 Jan. Feb. Mar. YTD Q1 Jan. Feb. Mar.
Americas 216,031 219,284 69,709 1.5 -68.2 -71.2 -71.2 -76.4 -79.3 -46.8 -75.8 -75.8 -76.2 -78.5 -73.1North America 142,192 146,611 46,721 3.1 -68.1 -67.1 -67.1 -71.3 -76.1 -46.5 -72.0 -72.0 -70.4 -75.3 -70.7Canada TF 21,134 22,145 2,960 4.8 -86.6 TF -93.6 -93.6 -93.8 -95.5 -88.6 -94.8 -94.8 -93.5 -95.4 -95.5Mexico TF 41,313 45,024 24,316 9.0 -46.0 TF -43.9 -43.9 -49.3 -57.9 -17.4 -47.7 -47.7 -44.8 -53.0 -45.8United States TF 79,746 79,442 19,445 -0.4 -75.5 TF -79.8 -79.8 -81.9 -85.9 -66.1 -83.6 -83.6 -82.1 -86.2 -83.0
Caribbean 25,825 26,328 10,335 2.0 -60.7 -59.5 -59.5 -71.5 -71.5 -12.2 -66.3 -66.3 -70.7 -69.5 -59.7Anguilla TF 55 95 25 74.9 -73.4 TF -88.9 -89.2 -88.6 -88.5 -88.9 -88.0Antigua & Barbuda TF 268 301 125 12.2 -58.4 TF -74.0 -74.0 -76.8 -83.1 -49.7 -76.1 -76.1 -74.3 -81.0 -73.2Aruba TF 1,082 1,119 368 3.4 -67.1 TF -50.9 -50.9 -65.4 -66.4 14.3 -61.8 -61.8 -66.7 -65.7 -54.1Bahamas TF 1,624 1,804 450 11.1 -75.0 TF -73.0 -73.0 -85.7 -83.0 -31.8 -80.3 -80.3 -85.2 -83.8 -74.6Barbados TF 680 .. .. .. .. TFBermuda TF 282 269 42 -4.4 -84.4 TF -86.3 -86.3 -90.2 -92.8 -68.9 -91.5 -91.5 -90.8 -93.4 -90.6Bonaire TF .. .. .. .. .. TFBrit. Virgin Islands TF 192 302 83 57.3 -72.7 TFCayman Islands TF 463 503 122 8.6 -75.8 TF -98.2 -98.2 -98.0 -98.9 -97.4 -98.6 -98.6 -97.9 -98.7 -98.9Cuba TF 4,684 4,263 .. -9.0 .. VF -95.1 -95.1 -94.3 -96.7 -93.4 -96.7 -96.7 -95.4 -97.1 -97.6Curaçao TF 432 464 175 7.4 -62.3 TF -77.8 -77.8 -87.3 -81.6 -45.6 -81.1 -81.1 -86.9 -80.2 -75.8Dominica TF 63 90 22 42.5 -75.8 TF -89.3 -89.3 -87.9 -93.0 -81.9 -91.6 -91.6 -88.4 -91.7 -93.5Dominican Rep. TF 6,569 6,446 2,405 -1.9 -62.7 TF -48.5 -48.5 -63.2 -64.9 16.0 -61.8 -61.8 -65.7 -67.2 -53.4Grenada TF 186 188 .. 1.1 .. TF -94.2 -94.2 -94.8 -96.6 -87.5 -95.2 -95.2 -94.7 -96.5 -94.4Guadeloupe TCE 735 .. .. .. .. THSHaiti TF 447 286 .. -36.1 .. TFJamaica TF 2,473 2,681 880 8.4 -67.2 TF -71.9 -71.9 -80.7 -81.4 -33.8 -77.2 -77.2 -79.8 -80.1 -72.9Martinique TF 537 556 312 3.5 -43.9 TF -59.4 -59.4 -39.7 -68.9 -72.2 -63.7 -63.7 -37.6 -67.3 -82.5Montserrat TF 10 10 5 1.7 -56.3 TF -95.2 -95.2 -89.6 -93.6 -97.4 -95.4 -95.4 -87.3 -93.3 -97.7Neth. Antilles .. .. .. .. .. TFPuerto Rico TF 3,068 3,180 2,617 3.6 -17.7 THS -21.8 -21.8 -52.2 -42.3 67.3 -33.3 -33.3 -51.3 -37.3 -14.4Saba TF .. .. .. .. .. TFSaint Lucia TF 396 424 131 7.1 -69.2 TF -79.0 -79.0 -81.1 -87.7 -55.7 -83.2 -83.2 -81.6 -87.2 -80.8St. Eustatius TF .. .. .. .. .. TFSt. Kitts & Nevis TF 123 120 30 -2.2 -75.3 TF -92.8 -90.0 -94.9 -93.9 -92.7 -95.0St. Maarten TF 178 320 106 80.0 -66.7 TF(1) -53.5 -53.5 -60.3 -69.5 6.0 -59.7 -59.7 -52.4 -65.8 -60.4St. Vincent & Gren. TF 80 85 26 6.5 -69.3 TFTrinidad & Tobago TF 375 389 .. 3.5 .. TF -98.6 -98.7 -99.1 -96.6 -98.8 -98.8 -98.6 -99.0 -98.6Turks & Caicos TF 441 487 .. 10.4 .. TFUS Virgin Islands TF 381 .. .. .. .. VF(1) -26.9 -26.9 -40.3 -33.4 11.9 -33.8 -33.8 -32.5 -24.2 -43.0
Central America 10,845 10,932 2,936 0.8 -73.1 -76.3 -76.3 -82.3 -84.6 -45.0 -80.5 -80.5 -82.8 -83.5 -75.2Belize TF 489 503 144 2.8 -71.3 TF -75.4 -75.4 -85.8 -84.4 -35.5 -80.9 -80.9 -86.3 -84.1 -73.3Costa Rica TF 3,017 3,139 1,012 4.1 -67.8 TF -76.0 -76.0 -82.7 -83.8 -45.2 -79.4 -79.4 -82.5 -82.3 -73.4El Salvador TF 1,677 1,766 .. 5.3 .. TFGuatemala TF 1,781 1,752 396 -1.6 -77.4 TF -66.4 -66.4 -74.5 -83.5 -5.0 -74.4 -74.4 -75.4 -82.4 -67.6Honduras TF 847 724 204 -14.5 -71.9 TFNicaragua TF 1,256 1,295 .. 3.2 .. TFPanama TF 1,779 1,753 414 -1.5 -76.4 TF -80.4 -80.4 -87.9 -85.5 -49.4 -87.4 -87.4 -91.7 -88.0 -80.7
South America 37,169 35,412 9,717 -4.7 -72.6 -90.9 -90.9 -92.1 -92.4 -83.2 -92.5 -92.5 -92.5 -92.1 -93.1Argentina TF 6,942 7,399 2,090 6.6 -71.8 TF -97.6 -97.6 -97.5 -98.5 -95.7 -97.8 -97.8 -97.4 -98.3 -97.8Bolivia TF 1,142 1,239 323 8.5 -73.9 THS -89.3 -89.3 -90.7 -92.1 -78.1 -91.1 -91.1 -91.4 -91.7 -90.0Brazil TF 6,621 6,353 .. -4.1 .. TFChile TF 5,723 4,518 1,123 -21.1 -75.1 TF -92.6 -92.6 -94.6 -93.5 -84.1 -94.7 -94.7 -95.6 -94.1 -94.1Colombia TF 4,020 4,169 1,250 3.7 -70.0 TF -76.6 -73.7 -79.2 -75.5 -73.0 -77.8Ecuador VF 2,535 2,108 507 -16.9 -75.9 VF -70.9 -70.9 -78.2 -77.4 -32.0 -80.0 -80.0 -82.9 -79.9 -76.5French Guiana TF .. .. .. .. .. TFGuyana TF 287 315 87 9.8 -72.5 TF -72.9 -70.7 -75.0 -68.2 -67.8 -68.6Paraguay TF 1,181 1,216 252 2.9 -79.3 TF -94.3 -94.7 -93.7 -95.0 -95.2 -94.6Peru TF 4,419 4,372 897 -1.1 -79.5 TF -96.4 -96.4 -96.8 -98.3 -88.8 -97.2 -97.2 -96.9 -98.3 -96.6Suriname TF .. .. .. .. .. TFUruguay TF 3,469 3,056 .. -11.9 .. TFVenezuela TF 403 260 .. -35.5 .. TF
Source: World Tourism Organization (UNWTO) © (Data as collected by UNWTO, May 2021)See box in page 'Annex-1' for explanation of abbreviations and symbols used. * Provisional data

May 2021 – Statistical Annex
Annex - 16
International Tourism Receipts by (sub)region and selected countries and territories of destination
Local currencies, current prices (percentage change)*
(USD million) Change (%) 2021 over 2020 2021 over 20192018 2019 2020* 19/18 20/19 YTD Q1 Jan. Feb. Mar. YTD Q1 Jan. Feb. Mar.
Americas 321,172 322,827 127,143North America 245,910 245,900 98,410Canada 26,919 28,012 11,258 6.5 -59.4Mexico 22,526 24,573 11,025 $ 9.1 -55.1 -50.7 -50.7 -59.1 -66.1 -10.1 -57.9 -57.9 -59.2 -64.2 -51.1United States 196,465 193,315 76,127 sa -1.6 -60.6 -61.0 -61.0 -68.5 -69.4 -26.7 -71.6 -71.6 -71.9 -72.7 -70.2
Caribbean 32,993 35,294 15,193Anguilla 108 163 .. 51.3 ..Antigua & Barbuda 641 776 334 21.1 -56.9Aruba 2,029 2,091 1,073 3.0 -48.7Bahamas 3,728 4,126 .. 10.7 ..Barbados 1,115 1,241 574 11.3 -53.7 -82.3 -82.3 -84.0 -84.0Bermuda 585 600 .. 2.6 ..Bonaire .. .. .. .. ..Brit. Virgin Islands .. .. .. $ .. ..Cayman Islands 871 919 .. 5.4 ..Cuba 2,903 2,596 .. -10.6 ..Curaçao 593 703 .. 18.6 ..Dominica 82 105 30 29.1 -71.9Dominican Rep. 7,548 7,472 2,674 $ -1.0 -64.2Grenada 199 170 51 -14.7 -69.7Guadeloupe 860 .. .. .. ..Haiti 620 450 .. $ -27.4 ..Jamaica 3,099 3,599 .. $ 16.1 ..Martinique 533 549 .. 8.7 ..Montserrat 10 10 5 0.1 -48.6Neth. Antilles .. .. .. .. ..Puerto Rico 3,282 3,612 .. $ 10.1 ..Saba .. .. .. .. ..Saint Lucia 901 999 318 10.9 -68.2St. Eustatius .. .. .. .. ..St. Kitts & Nevis 196 189 46 -3.6 -75.9St. Maarten 453 682 .. 50.5 ..St. Vincent & Gren. 104 118 44 12.6 -62.8Trinidad & Tobago 429 437 .. $ 1.8 ..Turks & Caicos 787 .. .. .. ..US Virgin Islands 1,046 .. .. .. ..
Central America 12,245 12,628 3,950Belize 479 510 .. 6.6 ..Costa Rica 3,769 4,008 1,347 $ 6.3 -66.4El Salvador 1,014 1,306 636 $ 28.8 -51.3Guatemala 1,231 1,221 297 $ -0.8 -75.7Honduras 592 547 187 $ -7.6 -65.8Nicaragua 544 515 199 $ -5.3 -61.5Panama 4,617 4,521 1,117 -2.1 -75.3
South America 30,024 29,006 9,590Argentina 5,563 5,241 1,616 $ -5.8 -69.2Bolivia 815 837 197 $ 2.7 -76.4Brazil 5,921 5,995 3,044 $ 1.2 -49.2 -54.9 -54.9 -60.2 -55.8 -44.6 -61.7 -61.7 -61.8 -61.0 -62.4Chile 2,871 2,279 406 $ -20.6 -82.2Colombia 5,556 5,652 1,585 $ 1.7 -72.0Ecuador 2,272 2,282 702 $ 0.4 -69.2French Guiana .. .. .. .. ..Guyana 28 27 .. $ -2 ..Paraguay 363 379 81 $ 4.4 -78.7Peru 3,557 3,738 776 $ 5.1 -79.2 -89.7 -89.7 -91.8 -91.8Suriname 56 53 16 $ -6.7 -70.5Uruguay 2,620 2,245 1,061 $ -14.3 -52.7Venezuela .. .. .. $ .. ..
Source: World Tourism Organization (UNWTO) © (Data as collected by UNWTO, May 2021)See box in page 'Annex-1' for explanation of abbreviations and symbols used. * Provisional data

May 2021 – Statistical Annex
Annex - 17
International Tourist Arrivals by (sub)region and selected countries and territories of destination
Percentage change*
(1000) Change (%) 2021 over 2020 2021 over 2019Series 2018 2019 2020* 19/18 20*/19 Series YTD Q1 Jan. Feb. Mar. YTD Q1 Jan. Feb. Mar.
Africa 68,699 70,096 18,248 2.0 -74.0 -80.7 -80.7 -83.4 -85.2 -69.4 -83.2 -83.2 -83.3 -85.1 -81.3North Africa 24,081 25,622 5,542 6.4 -78.4 -76.8 -76.8 -79.7 -82.4 -54.6 -81.6 -81.6 -79.3 -80.7 -84.2Algeria VF 2,657 2,371 .. -10.8 .. VFMorocco TF 12,289 12,932 2,778 5.2 -78.5 TFSudan TF 836 .. .. .. .. TFTunisia TF 8,299 9,429 2,012 13.6 -78.7 TF -73.7 -73.7 -75.6 -85.8 -42.7 -78.2 -78.2 -73.2 -84.4 -77.2
Subsaharan Africa 44,618 44,474 12,706 -0.3 -71.4 -82.2 -82.2 -84.9 -86.7 -72.9 -83.9 -83.9 -84.9 -87.2 -79.9Angola TF 218 218 .. 0.0 .. TFBenin TF 295 309 .. 4.7 .. TFBotswana TF 1,655 .. .. .. .. TFBurkina Faso THS 144 143 .. -0.7 .. THSBurundi TF .. .. .. .. .. TFCameroon TF .. .. .. .. .. THSCabo Verde THS 710 758 180 6.8 -76.3 THSCentr. African Rep. TF 109 .. .. .. .. TFChad THS .. .. .. .. .. THSComoros TF 36 45 .. 25.6 .. TFCongo THS 156 .. .. .. .. THSCôte d'Ivoire VF 1,965 2,070 .. 5.3 .. TFDem. Rep. Congo TF .. .. .. .. .. TFDjibouti TF .. .. .. .. .. NHSEquatorial Guinea .. .. .. .. .. TFEritrea VF .. .. .. .. .. VFEswatini TF 782 680 .. -13.0 .. VF -83.2 -83.2 -82.1 -87.1 -80.5 -84.3 -84.3 -81.8 -86.5 -85.0Ethiopia TF 849 812 271 -4.4 -66.7 TFGabon TF .. .. .. .. .. TFGambia TF 552 619 .. 12.1 .. TF -74.9 -74.9 -78.5 -80.2 -55.2 -77.8 -77.8 -77.8 -78.6 -76.8Ghana TF 1,029 1,093 .. 6.2 .. TFGuinea TF .. .. .. .. .. TFGuinea-Bissau TF 55 52 .. -4.7 .. TFKenya TF 1,931 1,863 .. -3.5 .. VF(1) -66.7 -63.0 -70.7 -67.0 -63.6 -70.8Lesotho TF .. .. .. .. .. VFLiberia .. .. .. .. .. TFMadagascar TF 291 384 68 32.0 -82.2 TF -88.1 -88.1 -90.2 -88.6 -78.6 -93.2 -93.2 -91.6 -94.3 -94.0Malawi TF 871 .. .. .. .. TFMali TF 203 217 .. 6.9 .. TFMauritania TF .. .. .. .. .. TFMauritius TF 1,399 1,383 309 -1.1 -77.7 TF -99.1 -99.1 -99.1 -98.9 -99.4 -99.2 -99.2 -99.0 -98.9 -99.7Mozambique TF 2,743 2,019 .. -26.4 .. THSNamibia TF 1,557 1,596 .. 2.5 .. TFNiger TF 157 192 .. 22.3 .. TFNigeria TF .. .. .. .. .. TFReunion TF 535 534 217 -0.2 -59.4 TFRwanda TF 1,619 1,544 .. -4.6 .. VFSão Tomé & Príncipe TF 33 .. .. .. .. TFSenegal TF .. .. .. .. .. TF*Seychelles TF 362 384 115 6.2 -70.1 TF -92.4 -92.4 -96.6 -98.1 -72.5 -93.3 -93.3 -96.2 -98.1 -85.9Sierra Leone TF 57 63 .. 10.5 .. TFSomalia .. .. .. .. .. TFSouth Africa TF 10,472 10,229 2,802 -2.3 -72.6 TF -84.1 -84.1 -87.3 -88.7 -70.5 -85.7 -85.7 -87.0 -88.7 -81.2Tanzania TF 1,378 1,443 .. 4.7 .. VFTogo THS 573 876 .. 52.9 .. THSUganda TF 1,505 .. .. .. .. TFZambia TF 1,072 1,266 .. 18.1 .. TFZimbabwe VF 2,567 2,290 .. -10.8 .. VF
Source: World Tourism Organization (UNWTO) © (Data as collected by UNWTO, May 2021)See box in page 'Annex-1' for explanation of abbreviations and symbols used. * Provisional data

May 2021 – Statistical Annex
Annex - 18
International Tourism Receipts by (sub)region and selected countries and territories of destination
Local currencies, current prices (percentage change)*
(USD million) Change (%) 2021 over 2020 2021 over 20192018 2019 2020* 19/18 20/19 YTD Q1 Jan. Feb. Mar. YTD Q1 Jan. Feb. Mar.
Africa 38,805 38,874 14,020North Africa 10,735 11,239 5,074Algeria 168 112 .. $ -33.3 ..Morocco 7,782 8,189 3,829 7.8 -53.8 -69.1 -69.1 -67.2 -62.2 -79.2 -67.7 -67.7 -62.6 -56.0 -82.2Sudan 1,043 821 .. $ -21.3 ..Tunisia 1,741 2,116 839 34.7 -62.0
Subsaharan Africa 28,070 27,635 8,946 Angola 544 384 16 $ -29.4 -95.8Benin 162 240 .. 55.6 ..Botswana 582 571 .. 3.5 ..Burkina Faso 121 116 .. 1.5 ..Burundi 4 2 .. -35.9 ..Cameroon 581 653 .. $ 12.5 ..Cabo Verde 484 502 163 9.3 -68.1Centr. African Rep. .. .. .. .. ..Chad .. .. .. .. ..Comoros 73 72 .. 3.3 ..Congo .. .. .. .. ..Côte d'Ivoire 443 448 .. 6.7 ..Dem. Rep. Congo 60 100 .. $ .. ..Djibouti 33 63 .. 88.5 ..Equatorial Guinea .. .. .. .. ..Eritrea .. .. .. .. ..Eswatini 16 14 7 $ -12.2 -52.3Ethiopia 969 781 .. $ -19.4 ..Gabon .. .. .. .. ..Gambia 154 .. .. $ .. ..Ghana 944 1,425 .. $ 51.0 ..Guinea 3 9 .. $ 173.5 ..Guinea-Bissau 20 19 .. 0.5 ..Kenya 1,072 1,008 472 $ -6.0 -53.2Lesotho 24 21 5 $ -11.9 -76.7Liberia .. 2 .. $ .. ..Madagascar 697 747 .. $ 7.3 ..Malawi 38 42 .. 14.7 ..Mali 227 .. .. .. ..Mauritania 4 11 .. $ 163.0 ..Mauritius 1,887 1,779 449 -1.5 -72.0 -96.3 -96.3 -95.9 -96.4 -96.8 -96.8 -96.8 -96.1 -96.6 -98.0Mozambique 242 252 90 $ 4.3 -64.3 -51.3 -51.3 -64.0 -64.0Namibia 383 350 115 -0.3 -62.4Niger 98 116 .. 23.8 ..Nigeria 1,962 1,449 313 $ -26 -78Reunion 511 459 .. € -5.2 ..Rwanda 392 458 .. $ 16.8 ..São Tomé & Príncipe 72 44 .. $ -38.1 ..Senegal 496 .. .. .. ..Seychelles 559 590 221 $ 5.5 -62.5Sierra Leone 39 43 .. $ 9.8 ..Somalia .. .. .. .. ..South Africa 8,944 8,384 2,471 sa 2.3 -66.4Tanzania 2,449 2,605 1,068 $ 6.3 -59.0 -31.6 -31.6 -40.4 -41.9 7.3 -32.3 -32.3 -27.0 -35.3 -34.2Togo 153 .. .. .. ..Uganda 1,506 1,385 463 $ -8.1 -66.6Zambia 742 819 412 $ 10.4 -49.8Zimbabwe .. .. .. $ .. ..
Source: World Tourism Organization (UNWTO) © (Data as collected by UNWTO, May 2021)See box in page 'Annex-1' for explanation of abbreviations and symbols used. * Provisional data
May 2021 – Statistical Annex
Annex - 19
International Tourist Arrivals by (sub)region and selected countries and territories of destination
Percentage change*
(1000) Change (%) 2021 over 2020 2021 over 2019Series 2018 2019 2020* 19/18 20*/19 Series YTD Q1 Jan. Feb. Mar. YTD Q1 Jan. Feb. Mar.
Middle East 65,500 69,969 18,174 6.8 -74.0 -78.0 -78.0 -83.6 -83.6 -43.0 -82.4 -82.4 -82.2 -83.1 -82.0Bahrain TCE 4,366 3,849 .. -11.8 .. VFEgypt VF 11,346 13,026 .. 14.8 .. VFIraq VF .. .. .. .. .. VFJordan TF 4,150 4,488 .. 8.1 .. TFKuwait THS 200 .. .. .. .. THSLebanon TF 1,964 1,936 .. -1.4 .. TFLibya TF .. .. .. .. .. TFOman TF 2,301 2,500 .. 8.6 .. VF -87.9 -87.9 -88.5 -93.0 -68.7 -89.4 -89.4 -86.7 -91.9 -89.8Palestine THS 606 688 .. 13.5 .. THSQatar TF 1,819 2,137 582 17.4 -72.8 TF -91.7 -91.7 -95.0 -93.8 -63.0 -92.3 -92.3 -92.9 -92.3 -91.6Saudi Arabia TF 15,334 17,526 4,138 14.3 -76.4 TF -86.0 -86.0 -88.2 -90.3 -32.8 -90.0 -90.0 -87.6 -90.4 -91.9Syria TF .. .. .. .. .. VFUtd Arab Emirates TF 21,286 21,553 7,165 1.3 -66.8 TF -64.4 -64.4 -74.2 -72.7 -9.4 -68.8 -68.8 -70.2 -70.0 -66.1Yemen TF .. .. .. .. .. TF
Source: World Tourism Organization (UNWTO) © (Data as collected by UNWTO, May 2021)See box in page 'Annex-1' for explanation of abbreviations and symbols used. * Provisional data
International Tourism Receipts by (sub)region and selected countries and territories of destination
Local currencies, current prices (percentage change)*
(USD million) Change (%) 2021 over 2020 2021 over 20192018 2019 2020* 19/18 20/19 YTD Q1 Jan. Feb. Mar. YTD Q1 Jan. Feb. Mar.
Middle East 75,223 90,497 28,685Bahrain 4,339 3,681 .. $ -15.2 ..Egypt 11,615 13,030 4,398 $ 12.2 -66.3Iraq 1,986 3,593 .. $ 80.9 ..Jordan 5,248 5,786 1,409 10.2 -75.7 -83.0 -83.0 -83.0 -80.7 -81.1 -80.3Kuwait 456 700 .. 54.1 ..Lebanon 8,400 8,593 .. $ 2.3 ..Libya .. .. .. .. ..Oman 1,758 1,811 .. 3.0 ..Palestine 301 323 .. $ 7.3 ..Qatar 5,565 5,442 3,563 -2.2 -34.5Saudi Arabia 13,790 16,431 4,036 19.2 -70.4Syria .. .. .. .. ..Utd Arab Emirates 21,375 30,731 .. 43.8 ..Yemen .. .. .. $ .. ..
Source: World Tourism Organization (UNWTO) © (Data as collected by UNWTO, May 2021)See box in page 'Annex-1' for explanation of abbreviations and symbols used. * Provisional data

May 2021 – Statistical Annex
Annex - 20

May 2021 – Statistical Annex
Annex - 21
International tourism in the Balance of Payments (BOP)
USD billion Share (%)
2010 2015 2018 2019 2020* 2010 2019 2020*
WorldTotal exports of goods and services 19,270 21,560 25,577 25,159 22,566 100 100 100Goods 15,304 16,558 19,550 19,015 17,583 79.4 75.6 77.9Services 3,966 5,002 6,027 6,144 4,983 20.6 24.4 22.1
International Tourism (BOP Travel & Passenger transport) 1,149 1,423 1,691 1,716 639 6.0 6.8 2.8- International Tourism Receipts 976 1,208 1,440 1,466 536 5.1 5.8 2.4- International Passenger Transport 173 215 251 250 102 0.9 1.0 0.5
Advanced EconomiesTotal exports of goods and services 11,386 12,397 14,473 14,124 12,754 100 100 100Goods 9,416 9,896 11,534 11,163 10,333 82.7 79.0 81.0Services 1,970 2,501 2,939 2,961 2,421 17.3 21.0 19.0
International Tourism (BOP Travel & Passenger transport) 765 932 1,087 1,079 411 6.7 7.6 3.2- International Tourism Receipts 640 791 927 922 357 5.6 6.5 2.8- International Passenger Transport 125 141 159 157 54 1.1 1.1 0.4
Emerging EconomiesTotal exports of goods and services 7,884 9,163 11,104 11,034 9,812 100 100 100Goods 5,888 6,662 8,016 7,851 7,250 74.7 71.2 73.9Services 1,996 2,501 3,088 3,183 2,563 25.3 28.8 26.1
International Tourism (BOP Travel & Passenger transport) 384 490 604 637 228 4.9 5.8 2.3- International Tourism Receipts 336 417 512 544 179 4.3 4.9 1.8- International Passenger Transport 48 74 92 92 48 0.6 0.8 0.5
Source: World Tourism Organization (UNWTO) and World Trade Organization (WTO) (Data as collected by UNWTO, May 2021)

May 2021 – Statistical Annex
Annex - 22
Evaluation of UNWTO Panel of Tourism Experts
UNWTO Confidence Index: World
Better
Equal
Worse
Source: World Tourism Organization (UNWTO) ©
0
25
50
75
100
125
150
175
T120
03 T
2 T3 T120
04 T
2 T3 T120
05 T
2 T3 T120
06 T
2 T3 T120
07 T
2 T3 T120
08 T
2 T3 T120
09 T
2 T3 T120
10 T
2 T3 T120
11 T
2 T3 T120
12 T
2 T3 T120
13 T
2 T3 T120
14 T
2 T3 T120
15 T
2 T3 T120
16 T
2 T3 T120
17 T
2 T3 T120
18 T
2 T3 T120
19 T
2 T3 T120
20 T
2 T3 T120
21 T
2
Prospects (before)
Evaluation (after)
When do you expect a rebound in international tourism in your country?
0%
10%
20%
30%
40%
50%
60%
by Q1 2021 by Q2 2021 by Q3 2021 by Q4 2021 by 2022
October 2020 survey January 2021 survey May 2021 survey
0%
10%
20%
30%
40%
50%
60%
70%
80%
90%
100%
Africa Americas Asia / Pacific Europe Middle East
by Q2 2021
by Q3 2021
by Q4 2021
by 2022
When do you expect international tourism to return to pre-pandemic 2019 levels in your country?
0%
10%
20%
30%
40%
50%
2021 2022 2023 2024 or later
October 2020 survey January 2021 survey May 2021 survey
0%
10%
20%
30%
40%
50%
60%
70%
80%
90%
100%
Africa Americas Asia / Pacific Europe Middle East
2021
2022
2023
2024 or later

May 2021 – Statistical Annex
Annex - 23
What are the main factors weighing on the recovery of international tourism?
0% 20% 40% 60% 80% 100%
Travel restrictions
Slow virus containment
Economic environment
Lack of coordinated response among countries
Low consumer confidence
Slow flight resumption
Other
October 2020 survey
January 2021 survey
May 2021 survey
0%10%20%30%40%50%60%70%80%90%
100%
Africa Americas Asia /Pacific
Europe MiddleEast
Travel restrictions
Slow virus containment
Low consumer confidence
Economic environment
Lack of coordinatedresponse among countries
Slow virus containment
Other
Is domestic tourism driving the recovery in your destination?
0%
10%
20%
30%
40%
50%
60%
Yes Partially No
October 2020 survey January 2021 survey May 2021 survey
0%
10%
20%
30%
40%
50%
60%
70%
80%
90%
100%
Africa Americas Asia / Pacific Europe Middle East
Yes
Partially
No
Do you expect the vaccination rollout will contribute to the resumption of international tourism in 2021?
Yes67.6%
Probably24.1%
No8.2%

May 2021 – Statistical Annex
Annex - 24
The UNWTO Tourism Confidence Index
The UNWTO Tourism Confidence Index is based on the results of an email survey conducted every four months since 2003 by the UNWTO Secretariat among a Panel of Tourism Experts.
The purpose of this survey is to collect opinions from tourism stakeholders worldwide regarding the performance of their destination/business in the last four months, and their expectations for the next four months.
Methodological summary Questions on which the indicators are based: - What is your assessment of tourism performance in your destination or business for the four months just ended (or about to end) as against what you would reasonably expect for this time of year? [ ] much worse ; [ ] worse ; [ ] equal ; [ ] better ; [ ] much better - What are the tourism prospects of your destination or business in the coming four months compared with what you would reasonably expect for this time of year? [ ] much worse ; [ ] worse ; [ ] equal ; [ ] better ; [ ] much better At the end of the year, the questionnaire includes two additional questions on the performance of the entire year and on the expectations of the coming year which feeds into the forecasts issued at the beginning of each year by UNWTO. In addition, participants are also invited to include a qualitative assessment in their own words. The analysis contained in the UNWTO World Tourism Barometer is in large part based on their comments. Use of responses for calculation of the indicators
In each survey Panel members are asked to rate both the performance of the previous four-month period and outlook for the coming four-month period on the following scale: much worse [0]; worse [50], equal [100]; better [150], much better [200]. The average of all replies then determines the confidence index. A value below 100 indicates a deterioration of performance, while a value above 100 represents an improvement. Results are broken down by region and by sector of activity. These breakdowns should, however, be interpreted with caution as they may in some cases be based only on a relatively small number of responses. Weighting of respondents’ replies
There is no weighting. The score given by each respondent has the same weight, irrespective of the size of the destination or sector of activity. Sample
The number of regular respondents to the Barometer surveys stands currently at close to 200, spread across all regions and sectors but it is not a representative sample. However, the UNWTO Secretariat’s aim is to continuously expand and improve the Panel sample. Experts interested in participating in the survey are kindly invited to send an email to [email protected]. Calendar
This is an online survey conducted every four months, usually at the end of April, August and December, with responses collected over a period of 6 weeks, starting at the end of those months. Publication of results
Results are usually published in January/February, May/June and September/October.

May 2021 – Statistical Annex
Annex - 25
Methodological Notes About the data
The monthly and quarterly statistics included in this issue have been compiled by the UNWTO Secretariat based on preliminary data reported by the institutions of the various countries and territories (e.g. National Tourism Authorities, Statistics Offices, Central Banks) through websites, news releases and bulletins, or provided through direct contacts with officials or through international organisations such as the Caribbean Tourism Organization (CTO), the European Travel Commission (ETC), Eurostat, the Pacific Asia Travel Association (PATA) or the South Pacific Tourism Organization (SPTO).
Information in this issue reflects data available at the time of publication. Data may be updated or revised without notice in future issues of the UNWTO World Tourism Barometer as it becomes available.
Countries that are not included, but which have monthly data at their disposal, are kindly requested to contact the UNWTO Secretariat at [email protected].
For major concepts, definitions and classifications in the measurement of tourism, please see the International Recommendations for Tourism Statistics 2008 (IRTS 2008) at www.unwto.org/methodology.
International Tourist Arrivals data
In the tables on International Tourist Arrivals for the various UNWTO regions, series are chosen that can serve as an indicator of trends in selected destinations.
The monthly series represented do not always coincide with the annual series usually reported for the various countries (e.g. visitor arrivals or nights instead of tourist arrivals) and sometimes only relate to a part of the total tourism flow (e.g. air traffic, specific entry points). See ‘Explanation of abbreviations and symbols used’ for more detailed information.
Regional and subregional totals are estimates by UNWTO based on the latest trends and available data for individual destinations.
Data on international tourist arrivals for France correspond to Metropolitan France.
Starting in the March 2021 issue, data on international tourist arrivals for the United Arab Emirates (UAE) corresponds to the entire UAE, not only Dubai.
Starting in this issue, all tables with monthly and quarterly data also include percentage change figures for 2021 over 2019, as well as the usual year-on-year change (over 2020). This responds to the need to provide data that can be compared to the pre-pandemic levels of 2019, and not just to
the unusually low levels of 2020, when tourism was severely impacted by the coronavirus pandemic and global lockdowns. Some growth figures for March 2021 and later months may seem strong compared to 2020, but in fact are weak when compared to 2019.
International Tourism Receipts and Expenditure data
For destination countries, receipts from international tourism count as exports in the balance of payments (travel) of each country and cover all transactions related to the consumption of goods and services by international visitors, such as accommodation, food and drink, fuel, domestic transport, entertainment, shopping, etc.
They include transactions generated by same-day as well as overnight visitors. Receipts from same-day visitors can be substantial, especially in the case of neighbouring countries where shopping accounts for a large amount of spending by cross-border, same-day visitors.
International tourism receipts (travel) do not include receipts from international passenger transport contracted from companies outside the travellers’ countries of residence, which are reported in a separate category (passenger transport).
For the (sub)regional totals, estimates are made by UNWTO for countries that have not yet reported results, based on the previous year’s value and the trend for the (sub)region. Unlike arrivals, where revisions generally more or less balance out, receipts data tends to be revised upwards.
It should be noted that data as reflected by UNWTO on international tourism receipts and expenditure for China is based on the balance of payments (BOP) travel credit and debit (as with other countries for reasons of consistency and international comparability) reported by the State Administration of Foreign Exchange (SAFE) at www.safe.gov.cn/en/BalanceofPayments/index.html..
In addition, according to the International Recommendations for Tourism Statistics 2008 (IRTS 2008), the balance of payments includes both business and personal purposes in the “travel” item. Business travel covers goods and services acquired by persons going abroad for all types of business activities. Personal travel covers goods and services acquired by persons going abroad for purposes other than business, such as vacations, participation in recreational and cultural activities, visits with friends and relations, pilgrimages, and education and health-related purposes. The “travel” item does not include international passenger transport, which is reported in a separate category in the BOP, under “transport”. For more information, please see the International Recommendations for Tourism Statistics 2008

May 2021 – Statistical Annex
Annex - 26
(IRTS 2008) at: www.unwto.org/methodology and the IMF Balance of Payments and International Investment Position Manual (BPM6) at www.imf.org/external/pubs/ft/bop/2007/ bopman6.htm.
It should also be noted that there is a difference in the data of UNWTO and those produced by the Ministry of Culture and Tourism of China (formerly the China National Tourism Administration) for 2014 and subsequent years.
Ranking of International Tourism Receipts and Expenditure
It should be noted that changes in the ranking of international tourism receipts not only reflect relative performance of the destinations, but also exchange rate fluctuations of the local currencies against the US dollar. Conversely, changes in the ranking of international tourism expenditure do not only reflect variations in spending on outbound travel, relative to other countries, but also changes in the value of the local currency compared to the US dollar.
In 2018 exchange rate movements were generally moderate, with the US dollar depreciating by 4% against the Euro. The US dollar-euro exchange rate moved from an average of 0.885 euro per US dollar in 2017 to 0.847 in 2018. Thus, the effect of converting tourism receipts earned in euros (by Euro area destinations) to US dollars was relatively small. The US dollar also depreciated by 3% against the UK pound and by 2% against the Chinese yuan and Japanese yen, among others. In these destinations tourism receipts expressed in US dollars were higher due to the exchange rates, though to a small extent. The US dollar however, did appreciate to different extents versus the currencies of large emerging markets, such as Brazil, Russia, and India, and quite sharply versus the Argentine peso due to the economic crisis in that country.
Exchange rates and inflation With financial data measured in different currencies it is complicated to accurately determine variations in relative terms, as receipts have to be expressed in a common currency like the US dollar or the euro and generally are also reported at current prices, thus not taking account of exchange rate fluctuations and inflation.Exchange rate changes can substantially influence the values in US dollars reported from year to year. When the dollar appreciates against for instance the euro, worldwide receipts expressed in dollars relatively decrease, and vice versa in the case the dollar depreciates.
Exchange rate US$ to euro and vice versa, average for the year Year USD to EUR Change (%) EUR to USD Change (%) 2010 0.7543 5.2 1.3257 -5.0 2011 0.7184 -4.8 1.3920 5.0 2012 0.7783 8.3 1.2848 -7.7 2013 0.7530 -3.3 1.3281 3.4 2014 0.7527 0.0 1.3285 0.0 2015 0.9013 19.7 1.1095 -16.5 2016 0.9034 0.2 1.1069 -0.2 2017 0.8852 -2.0 1.1297 2.1 2018 0.8467 -4.3 1.1810 4.5 2019 0.8933 5.5 1.1195 -5.2 2020 0.8755 -2.0 1.1422 2.0
Note: Exchange rates are yearly averages. Source: Compiled from Eurostat
In order to account for exchange rate changes and inflation, international tourism receipts expressed in US dollar values (for reason of comparison) were converted back to the local currencies of each destination, weighted by the share in the total, and deflated by the relevant rate of inflation.
.

May 2021 – Statistical Annex
Annex - 27

UNWTO World Tourism Barometer
International Tourism Highlights, 2020 Edition
Yearbook of Tourism Statistics (2015-2019)
Compendium of Tourism Statistics (2015-2019)
Guidelines for Success in the Chinese Outbound
Tourism Market (2019)
Exploring Health Tourism (2018)
The Gulf Cooperation Council (GCC)
Outbound Travel Market (2018)
European Union Tourism Trends
(2018)
How are countries supporting tourism recovery?
Tourism and Covid-19 (2020)
Tourism in SIDS: the challenge of sustaining
livelihoods in times of Covid-19 (2020)
Understanding domestic tourism and seizing its
opportunities (2020)
UNWTO/GTERC Asia Tourism Trends,
2020 Edition
www.unwto.org/publications