Embed Size (px)
Citation preview
VOLUME 9 2011
SPAANFELLOWWorking Papersin Second or Foreign Language Assessment

Spaan Fellow Working Papers in Second or Foreign Language Assessment
Volume 9 2011
Edited by India Plough
Eric Lagergren
Guest Editor Spiros Papageorgiou

© 2011 Regents of the University of Michigan Spaan Committee Members: N. N. Chen, B. Dobson, E. Lagergren, I. Plough, S. Schilling Production: E. Lagergren, B. Wood The Regents of the University of Michigan: Julia Donovan Darlow, Laurence B. Deitch, Denise Ilitch, Olivia P. Maynard, Andrea Fischer Newman, Andrew C. Richner, S. Martin Taylor, Katherine E. White, Mary Sue Coleman (ex officio).
iii
Table of Contents
Spaan Fellowship Information.............................................................................iv Previous Volume Article Index ...........................................................................v Beverly A. Baker
Use of the Cloze-Elide Task in High-Stakes English Proficiency Testing.......................................................................1
Hongli Li
A Cognitive Diagnostic Analysis of the MELAB Reading Test .................17 Ching-Ni Hsieh
Rater effects in ITA testing: ESL teachers’ versus American undergraduates’ judgments of accentedness, comprehensibility, and oral proficiency ..................................................................................47

iv
The University of Michigan
SPAAN FELLOWSHIP For Studies in Second or Foreign Language Assessment
From 2002 through 2010, in honor of Mary C. Spaan, the Spaan Fellowship Program provided significant support for scholars in the field of language assessment. Their work has made lasting contributions to the field. It is with regret that we announce that the fellowship program will no longer be offered. The work of the Spaan Fellows will remain accessible to all through the Spaan Fellow Working Papers.

v
Previous Volume Article Index
Development of a Standardized Test for Young EFL Learners. Fleurquin, Fernando 1, 1–23
A Construct Validation Study of Emphasis Type Questions in the Michigan English Language Assessment Battery. Shin, Sang-Keun
1, 25–37
Investigating the Construct Validity of the Cloze Section in the Examination for the Certificate of Proficiency in English. Saito, Yoko
1, 39–82
An Investigation into Answer-Changing Practices on Multiple-Choice Questions with Gulf Arab Learners in an EFL Context. Al-Hamly, Mashael, & Coombe, Christine
1, 83–104
A Construct Validation Study of the Extended Listening Sections of the ECPE and MELAB. Wagner, Elvis
2, 1–25
Evaluating the Dimensionality of the Michigan English Language Assessment Battery. Jiao, Hong
2, 27–52
Effects of Language Errors and Importance Attributed to Language on Language and Rhetorical-Level Essay Scoring. Weltig, Matthew S.
2, 53–81
Investigating Language Performance on the Graph Description Task in a Semi-Direct Oral Test. Xi, Xiaoming
2, 83–134
Switching Constructs: On the Selection of an Appropriate Blueprint for Academic Literacy Assessment. Van Dyk, Tobie
2, 135–155
Language Learning Strategy Use and Language Performance on the MELAB. Song, Xiaomei
3, 1-26
An Empirical Investigation into the Nature of and Factors Affecting Test Takers’ Calibration within the Context of an English Placement Test (EPT). Phakiti, Aek
3, 27–71
A Validation Study of the ECCE NNS and NS Examiners’ Conversation Styles from a Discourse Analytic Perspective. Lu, Yang
3, 73–99
An Investigation of Lexical Profiles in Performance on EAP Speaking Tasks. Iwashita, Noriko
3, 101–111
A Summary of Construct Validation of an English for Academic Purposes Placement Test. Lee, Young-Ju
3, 113–131
Toward a Cognitive Processing Model of the MELAB Reading Test Item Performance. Gao, Lingyun
4, 1–39
Validation and Invariance of Factor Structure of the ECPE and MELAB across Gender. Wang, Shudong
4, 41–56
Evaluating the Use of Rating Scales in a High-Stakes Japanese University Entrance Examination. Weaver, Christopher
4, 57–79
Detecting DIF across Different Language and Gender Groups in the MELAB using the Logistic Regression Method. Park, Taejoon
4, 81–96
Bias Revisited. Hamp-Lyons, Liz & Davies, Alan 4, 97–108
Do Empirically Developed Rating Scales Function Differently to Conventional Rating Scales for Academic Writing? Knoch, Ute
5, 1–36
vi
Investigating the Construct Validity of the Grammar and Vocabulary Section and the Listening Section of the ECCE: Lexico-Grammatical Ability as a Predictor of L2 Listening Ability. Liao, Yen-Fen
5, 37–78
Lexical Diversity in MELAB Writing and Speaking Task Performances. Yu, Guoxing 5, 79–116
An Investigation of the Item Parameter Drift in the Examination for the Certificate of Proficiency in English (ECPE). Li, Xin
6, 1–28
Investigating the Invariance of the ECPE Factor Structure across Different Proficiency Levels. Römhild, Anja
6, 29–55
Investigating Proficiency Classification for the Examination for the Certificate of Proficiency in English (ECPE). Zhang, Bo
6, 57–75
Underlying Factors of MELAB Listening Constructs. Eom, Minhee 6, 77–94
Examining the Construct Validity of a Web-Based Academic Listening Test: An Investigation of the Effects of Response Formats. Shin, Sunyoung
6, 95–129
Investigating the Construct Validity of a Performance Test Designed to Measure Grammatical and Pragmatic Knowledge. Grabowski, Kirby
6, 131–179
Ratings of L2 Oral Performance in English: Relative Impact of Rater Characteristics and Acoustic Measures of Accentedness. Kang, Okim
6, 181–205
Conflicting Genre Expectations in a High-Stakes Writing Test for Teacher Certification in Quebec. Baker, Beverly A.
7, 1–20
Collaborating with ESP Stakeholders in Rating Scale Validation: The Case of the ICAO Rating Scale. Knoch, Ute
7, 21–46
Investigating Source Use, Discourse Features, and Process in Integrated Writing Tests. Gebril, Atta, & Plakans, Lia
7, 47–84
Investigating Different Item Response Models in Equating the Examination for the Certificate of Proficiency in English (ECPE). Song, Tian
7, 85–98
Decision Making in Marking Open-Ended Listening Test Items: The Case of the OET. Harding, Luke, & Ryan, Kerry
7, 99–113
Investigating the Construct Validity of a Speaking Performance Test. Kim, Hyun Jung 8, 1–30
Investigating the Construct Validity of the MELAB Listening Test through the Rasch Analysis and Correlated Uniqueness Modeling. Goh, Christine, & Aryadoust, S. Vahid
8, 31–68
Expanding a Second Language Speaking Rating Scale for Instructional and Assessment Purposes. Poonpon, Kornwipa
8, 69–94
Investigating Prompt Effects in Writing Performance Assessment. Lim, Gad S. 8, 95–115

Spaan Fellow Working Papers in Second or Foreign Language AssessmentCopyright © 2011Volume 9: 1–16
University of Michigan
1
Use of the Cloze-Elide Task in High-Stakes English Proficiency Testing
Beverly A. Baker McGill University, Montreal
ABSTRACT This study investigated the usefulness of the cloze-elide objective language task (Manning, 1987) in a test of teacher English language proficiency in Quebec, Canada. While the task has demonstrated its usefulness recently in low-stakes language diagnostic testing in a New Zealand university context (Elder & von Randow, 2008), it is important to examine its usefulness in other contexts. In addition, evidence was collected regarding the construct being addressed by this particular task, something that has not yet been examined. A cloze-elide task was administered to 346 preservice teachers at a Montreal university, in addition to other direct and indirect tasks, as part of a high-stakes exam for teacher certification. It was decided that the cloze-elide task would be deemed useful if it distinguished between English and French native speakers (assuming that French native speakers would be more in need of language support). In addition, the task would be deemed useful if it had sufficient face validity to be accepted by the test takers. Results from regression analysis show that the cloze-elide did not effectively predict language group. In addition, results on the authentic teacher communication tasks of the exam also did not predict language group, suggesting that distinguishing between English and French native speakers may not be useful, or may not even be possible in all cases in the Quebec context. A survey with students after the exam provided insight into students’ suspicion of the task. In addition, students’ descriptions of their reading strategies during the cloze elide task provided insight into the construct represented by the task. For example, students demonstrated awareness of the need to balance top-down and bottom-up approaches to the text. This study underlines the importance of considering the local context in determining test task usefulness, as well considering the input from the test takers themselves in test task validation.
Introduction
The cloze-elide (Manning, 1987; Davies, 1975; Bowen, 1978; Elder & von Randow, 2008) is an objective language test task whereby superfluous, incorrect words are inserted into a text and must be identified by the test taker within a limited time. This task got its name because originally test takers were expected to cross out the superfluous words on paper,
32 B. A. Baker
which was called “eliding” (Manning, 1987). In the only large scale study focussing on the cloze-elide task, Manning (1987) compared scores of more than 1,200 ESL students in U.S. universities and found that the task was useful as a reliable and efficient predictor of other English proficiency measures, such as TOEFL scores, graded essay scores, and teacher judgments of student proficiency.
While now seen as an inauthentic and indirect assessment of language ability, Manning (1987) was at the time considering the cloze-elide task as a way of testing language more directly: He was examining the possibility that this task could address deeper linguistic processing than the ubiquitous multiple-choice questions dominating standardised language testing at that time. Bowen (1978) also presented this task as a more communicative alternative to the standard testing practice of the day.
In discussing the conceptual basis of the task, Manning (1987) posited that the cloze-elide could be termed an “error-recognition task” that requires both top-down and bottom-up cognitive processing. He describes it as a comprehension task where “meaning is achieved through the elimination of semantic information that is errorful” (p. 80).
Integral to the conceptualisation of this task construct is the time limit imposed on the reader. “Speeding” a test is explained by Davies (1990) as “providing test items in a series which cannot be completed by all testees solely for reason of lack of time” (p. 123; italics in original). Davies (1990) contrasts speed tests and power tests. In power tests, test takers are all assumed to have sufficient time to complete the test, and the relative difficulty of the items discriminates the performance of test takers. In speed tests, test takers are primarily discriminated by who finishes and who does not. Davies (1990) emphasizes that reading speed tests must be both speed and power tests. In other words, evidence must be collected on comprehension of the language in some form or another, because there is no value in reading quickly without comprehension. A cloze-elide task is theoretically such a task, where test takers would be discriminated by whether or not they finish and by whether they are able to recognise the superfluous incorrect words (needing a certain level of comprehension of the text).
There is evidence that speed in itself may be an facilitator of text comprehension, either by freeing up cognitive resources or enabling the identification of words “in time for other cognitive processes to make use of them” (Biancarosa, 2005, p. 79). Biancarosa (2005) discusses a relationship between reading rate and comprehension, “not only as an index of efficient lower level word-reading processes, but also as an index of higher-level meaning-making processes” (p. 80). Slocum, Street, and Gilberts (1995) also discuss how rapid decoding of text facilitates comprehension. The authors draw on the literature of behaviour analysts as well as cognitive theories of reading regarding automaticity (Laberge & Samuels, 1974), noting that these two schools judge that comprehension is facilitated by fluent decoding.1
A cloze-elide task has recently been included in an initial prediagnostic screening for the DELNA test (Elder & von Randow, 2008), a voluntary diagnostic assessment in a New Zealand university context. The prediagnostic screening test is an automatically scored test used to identify who needs the full diagnostic test (Elder & von Randow, 2008). This screening lasts about 20 minutes, and consists of an academic vocabulary task as well as a cloze-elide task. This screening test was put in place to save resources and increase participation, as well as to create a nondiscriminatory way to determine which students were in need of additional language resources to encourage their success in university study (Elder
3Use of the Cloze-Elide Task in High-Stakes English Proficiency Testing
& von Randow, 2008). The cloze-elide task was chosen to be included in this screening for its use in predicting later performance on the full diagnostic assessment. In addition, Elder & von Randow (2008) were interested in using a speeded task because of the likelihood that this would discriminate between L1 and L2 users of English. L2 users of English were assumed to be “linguistically at-risk” (p. 173), meaning they would benefit from more focussed linguistic support. For these goals and this context, this task was found to be useful and practical to administer.
This recent use of the cloze-elide task demonstrates the ongoing utility of indirect tasks for certain purposes. This case also demonstrates how the decision of the inclusion of test tasks must be linked to the needs of the particular context—in this case, the need to encourage students to write a nonmandatory test and the need to test the most people the most efficiently (and inexpensively) possible, while still achieving high reliability and being able to make relatively valid interpretations about test-taker needs.
As with all other task types, in considering other possible uses of the cloze-elide task it is important to continue to consider the specific characteristics of the context for assessment. In the New Zealand context—as probably in many other mixed L1/L2 contexts—a task which distinguishes between first- and second-language users of a language effectively distinguishes between those who need additional language support from those who probably do not. However, this likely depends on both the general level of proficiency of the L2 test takers. In Elder and von Randow (2008), a large proportion of the L2 sample consisted of recent arrivals to New Zealand, and the test addressed readiness for university study. It would be beneficial to test that assumption in a location where the L2 groups have higher proficiency in the target language.
The DELNA screening test is an example of the cloze-elide being used for low-stakes purposes, so studying its use in higher-stakes contexts would also be warranted. There are initial doubts as to whether test takers (especially those who have been accustomed to a communicative orientation to their language instruction) would positively view a speeded indirect task, no matter how useful it turns out to be. It would be reasonable to assume that test-taker doubts about the task would be more pronounced in a high-stakes context than in a low one. Consideration of test-taker views is not an afterthought: as Weigle (2002) states, “[F]or a test or assessment method to serve its function well and to be accepted as a useful and equitable social tool, the perspectives of all stakeholders need to be addressed in the process of developing, administering, and communicating about a test” (p. 244). Other scholars who have recently discussed the importance of including multiple stakeholder viewpoints include Scharton (1996), Haswell (1998), Hamp-Lyons and Condon (2000) and Ryan (2002).
While considering appropriate contexts for use of the cloze-elide task, it is equally important to consider the construct being assessed by the task. Elder and von Randow (2008) call for more work to uncover the exact nature of the construct. Manning’s suspicions as to the processes required to be successful on the cloze-elide task have yet to be examined empirically; namely, that the task addresses both speed and power (i.e., that both speed and comprehension are necessary for success on the task), and that both top-down and bottom-up processes are being negotiated by the test takers while completing the task. Research into the completion of the traditional deletion-type cloze task (see Hudson, 2007) has provided evidence of test takers’ use of lexical, syntactic, and semantic processing, in addition to their conscious metacognitive knowledge regarding successful task strategies (see also Schoonen et
54 B. A. Baker
al., 1998). Here, again, the collection of test-taker reports—namely, of conscious strategies employed while completing the task—could prove to be useful in shedding light on the construct being addressed by the task.
Research Questions
The present study sought to evaluate the usefulness of the cloze-elide task as part of the English Exam for Teacher Certification (EETC), a high-stakes test for preservice teachers in Quebec, Canada. In addition, the study also sought to collect information on the construct being addressed by the cloze-elide task, as indirectly indicated by the strategies reported by the test takers in completing the task.
The research questions for the present study were as follows:
RQ1. Is the cloze task useful and appropriate for high-stakes language proficiency testing for preservice teachers in Quebec?
RQ2. What reading strategies are reported in completing the cloze-elide task?
Research Design and Method
Answering these questions required a mixed methods research design (Creswell & Plano
Clark, 2007), with the collection and analysis of qualitative and quantitative data. For the purposes of this study, the cloze elide was seen as useful if it distinguished between native and nonnative speakers of English, with nonnative speakers assumed to be more in need of language support (as in Elder & von Randow, 2008). In addition, a useful task must be accepted by the test takers as valuable (i.e., have face validity). Therefore, to respond to the first research question, a statistical analysis was performed on all the tasks of the pilot administration of the EETC (stepwise logistic regression) in order to see to what extent performance on the tasks predicted the students’ native language. In addressing issues of face validity, a survey of test takers after the test administration included questions regarding the cloze-elide task, in order to capture test takers’ impressions of this novel task. To answer the second question, the student survey also included questions about test takers’ strategies while doing the task. More specific details about research design will follow. Context: The Pilot EETC (Fall 2008)
The EETC was developed in 2008 in response to a request by the Quebec government’s Ministère de l'Éducation, du loisir et du sport (MELS) to provide a test of language proficiency as part of the teacher certification process. The test was designed for students enrolled in university programs leading to teacher certification, addressing the professional competency of communication for the education profession (CAPFE, 2001). In addition to this gatekeeping function, the EETC was also intended to indirectly serve a diagnostic function by determining student needs in order to best support their language development during their program (Aitken, Baker, & Hetherington, 2009).

5Use of the Cloze-Elide Task in High-Stakes English Proficiency Testing
The pilot administration of the EETC was held in the fall of 2008 with approximately 650 students at three Quebec postsecondary institutions, and consisted of five separate tasks in two sections:
1. Objective Section:
• Academic vocabulary (a multiple-choice task with 4 parallel versions) • Editing (a short-answer task with 8 parallel versions) • Cloze Elide (2 parallel versions)
2. Authentic Reading/Writing Section (1 version only in this pilot administration):
• Letter to parents, based on information from a government brochure • Email to colleagues (fellow teachers) based on a table of numbers to report.
Participants
The original participant pool for this study consisted of 375 preservice teachers who took EETC in December 2008 at one Montreal institution, and who had signed an agreement that their EETC exams could be used for research purposes. They were all students in a bachelor of education program (with 345 in the fall semester of their first year of studies, and 30 in the fall semester of their second year of study). The self-reported first language of the test takers was 74% English, 17% French, and 9% other. It was decided that only test takers with a reported L1 of English or French would be considered for this study, because of the great variety of proficiency in the “other” languages reported as L1. In the Montreal context, many second- and third-generation heritage language speakers may identify these heritage languages as their L1 for reasons of personal identity, not proficiency. Therefore, students reporting “other” as their first language vary from the recently arrived foreign student to the third generation Greek- or Italian-Montrealer who went through the English or French school system. As it was impossible to obtain more information about these test takers, these results were removed, taking the total number of participants down from 375 to 346.
Not surprisingly, there is a large number of French native-speaking students in English-medium universities in Quebec. The great majority of French native speakers were blocked by law from attending English schools prior to university (Winer, 2007), so for most of these students, this is the first English-medium institution that they are attending. Procedures: Data Collection and Analysis
Included below is a detailed discussion of the creation of the cloze-elide tasks for this pilot administration of the EETC, followed by the delivery and scoring of the EETC itself, then analysis of all pilot tasks, then collection and analysis of the test-taker survey data. Creation of Cloze-Elide Tasks
The creation of the cloze-elide tasks for the EETC required making decisions about the source text to be used, including the language level and length of the passage to be used in the task; the amount of time provided to complete the task; and the nature and location of the superfluous words to be inserted. In creating the cloze-elide tasks for his study, Manning (1987) chose authentic texts from books and magazine articles that were judged by expert informants to be representative of TOEFL reading passages in content and difficulty. For the present context, it was decided to write the texts, keeping to nonspecialist quasi-academic
76 B. A. Baker
topics, such as might be found in the foreward of an introductory textbook. The two versions were on the topics of critical thinking and media literacy. Passages were run through a vocabulary profiler to control for word frequency (Cobb, 2002). The two texts were found to be slightly below the 12% to 15% level of academic words associated with academic-level texts, and more at the level of a newspaper article or expository writing intended for a general audience (see Cobb & Horst, 2004).
Superfluous words were chosen to be in the same frequency range and register as the original passage. As in Manning (1987), a variety of word classes was inserted, about one-half function words and one-half content words. It was important to keep the proportions of function and content words roughly equal due to the results of eye-tracking research that indicates that readers fix content words much more frequently than function words (Just & Carpenter, 1987)—possibly making it harder to catch errors in function words. No specialist words were used, only words from the academic wordlist or at the 2000-word frequency level or more frequent (Cobb, 2002). Each line at the end of a paragraph was at least ten words, so as not to make it too easy to guess the superfluous word on that particular line by process of elimination.
Superfluous words were not simply inserted randomly, because previous researchers (Manning, 1987; Bowen, 1978) have reported some weaknesses with this procedure. Firstly, as Bowen (1978) mentions, not all insertions are created equal: “some insertions are very conspicuous, while others manage to partially conceal themselves” (p. 3). In addition, Bowen also mentions that with random insertion, by chance some words would be inserted into reasonable places without need for deletion. Inserted words must “damage the grammatical or lexical integrity” (Bowen, 1978, p. 14) of the sentence so that test takers are not asked to remove some words that are clearly ungrammatical and others that are only deemed not necessary because they did not happen to be in the original! Test takers should be questioning whether words are accurate grammatically and lexically, not whether each word is absolutely necessary. An additional issue is whether items necessitate the examination of adjacent or nonadjacent data to judge appropriateness. This is a similar concern in traditional rational-deletion cloze: as Hudson (2007) notes about the rational-deletion cloze, the “source of item difficulty involves relatively short-range grammatical constraints—usually a few words on either side of the blank or within a single grammatical phrase or clause” (p. 102).
Therefore, the process for the creation of the final versions of the cloze-elide were as follows:
• superfluous words were initially inserted randomly upon the line, then adjusted to
make sure words were damaging grammatically and not too conspicuous by their placement (like the last word of a paragraph), and to make sure they were varied in their syntactic placement.
• Items were also verified to ensure that while most superfluous words would require examination only of adjacent data to detect, some of the words would require inspection of nonadjacent data (either before or after the superfluous word, or both) and that this would be roughly equal across versions. Words requiring examination of nonadjacent data came to approximately 15% of the superfluous words in Version 1 and 20% in Version 2.

7Use of the Cloze-Elide Task in High-Stakes English Proficiency Testing
These pilot cloze-elide tasks, along with all the other tasks on the EETC, were initially trialled on 132 students at three Quebec universities. The original cloze-elide passages were 75 lines, with one superfluous word per line, and test takers were given ten minutes to complete the task (similar to Elder & von Randow, 2008). However, after initial trialling of the tasks (Aitken, Baker & Hetherington, 2009), it was decided to adjust the passage to 35 lines and allow 5 minutes to complete the task. This decision was made because it allowed the sufficient information to be collected without the fatigue and repetitiveness reported by test takers. An excerpt from one of the final versions of the cloze-elide task can be found below in Figure 1. The inserted words in square brackets can be located with reference to its adjacent words only, while the inserted words in parentheses need reference to nonadjacent words.
Critical thinking, for the purposes [extend] of this discussion, does not use “critical” in a negative sense. Certainly, contrary to what many [yet] people believe, being critical is not about being negative or (behaviour) about finding what is wrong with something. Critical thinking is [be] thinking which involves constant questioning [up] and a heightened awareness of the origins of our opinions. Critical thinking involves making this reasoning process (decide) more conscious.
Figure 1. Excerpt from one cloze-elide task version. Administration and scoring of the EETC
The administration for the pilot EETC was held in December 2008. Scores were gathered for all 346 study participants on all tasks of the exam. Just as in the creation of the cloze-elide task, scoring the task was not straightforward and required certain decisions to be made. Bowen (1978) noted errors of omission and commission in his scoring of this task, which he called “insufficient” vs. “superfluous” editing (p. 2). Manning (1987) calculated a score which corrected for guessing and accounted for errors of both omission and commission. Elder and von Randow (2008) counted errors of omission only (i.e., they didn’t take point off if a test taker deleted a word they didn’t need to), unless they deleted more than one per line, which was against the instructions. It was decided to apply the same scoring procedure as Elder and von Randow (2008) here: as these students were encouraged to take risks in other areas of their academic work, it did not seem appropriate in the academic context to penalise test takers for the test-taking strategy of guessing. Incomplete items at the end of a passage were also marked incorrect. Incorrect items were also categorized according to whether a wrong word was deleted (evidence of a problem with text comprehension) or if an item at the end of the task was not attempted (evidence that the test taker was not fast enough to complete the task). Statistical Analysis of Test Tasks
Univariate statistical tests such as t-test or MANOVA were not found to be applicable to this context: There were not equal numbers of English and French speakers, and assumptions of normal distribution and homogeneity were not met, even after attempted transformations of objective variables. Logistic regression was chosen as the most appropriate test, because it has no distributional assumptions on the predictors. The regression analysis
98 B. A. Baker
was performed to determine to what extent scores on all tasks (including the cloze-elide) predicted language group (English or French). Collection and Analysis of Test Taker Surveys
One month after the test administration, test takers were asked to voluntarily complete an online survey about their experience with the pilot EETC. A total of 66 test takers responded. The survey covered issues such as preparation, their impressions of tasks and of the overall test, and their language background. Three of the survey questions provided responses that addressed the research questions of this study:
• If you could give one piece of advice to next year’s test takers, what would it be?
(provided responses that related to research questions 1 and 2) • If you could take out one part of the test, what would it be? (related to research
questions 1 and 2) • One of the tasks was called “speed reading.” How did you complete this task? Write
down any strategies you used. (related to research question 2)
While research into reading strategies has generally made use of think-aloud protocols (see Hudson, 2007), as this was an authentic testing situation the data had to be collected after the test itself, through retrospective reports. Responses were coded by techniques associated with grounded theory (Strauss & Corbin, 1998): Responses were first coded for references to task acceptance/authenticity, task construct, and reading strategies. The initial coding of the category of reading strategies was then further broken down into subcategories by individual strategy. The coding of the comments was done by the researcher, and then independently by a research associate, with discussion until agreement was reached.
Results Quantitative Results
Descriptive Statistics
Of the 346 completed cloze-elide tasks, 13 were unsuccessful—judged here to be those who received less than 50% (17/35 or below). Not all the students completed the task—incomplete cloze tasks (i.e., those that did not supply any responses for items found at the end of the task) represented 67 out of 346, or 19.4% of the test-taker sample. Nine of the unsuccessful tasks were incomplete and four were complete. This provides some evidence that the task is a speed as well as a power task (Davies, 1990): students were sometimes unsuccessful because they were unable to complete the task within the given time, but simply completing the task on time did not assure success on the task. Table 1 below shows means and standard deviations by language group for each of the test tasks.

9Use of the Cloze-Elide Task in High-Stakes English Proficiency Testing
Table 1. Mean results by language group on each test task Task Mean SD
English (n = 279)
French (n = 60)
English French
Grammar editing (/10) 7.5 6.3 1.6 2.2
Vocabulary (/10) 8.8 7.6 1.1 1.8
Cloze Elide (/35) 31.9 29.6 4.4 5.8
Letter writing (/5) 3.1 2.9 0.7 0.9
Email writing (/5) 2.9 2.8 1.0 1.0
Stepwise logistic regression was used to determine to what extent scores on all tasks predicted language group (English or French). This analysis revealed that both vocabulary score and the editing score were both significant predictors of language group. Nagelkerke’s pseudo R square = 0.22, meaning that 22% of the total variance in the dependent variable (language group) was explained by the vocabulary and editing scores. Chi-Square (3) = 2.66; p > 0.05. This Chi Square reflects the good fit of the model which included the two significant predictors. The cloze-elide task, as well as the two writing tasks (letter and email) were not significant predictors of language group. Table 2 below shows the significance levels for all predictors, as well as regression coefficients, Wald statistics, and odds ratios for the two significant predictors. Table 2. Results of Logistic Regression Predictor (test tasks) B Wald Sig. Odds Ratio Vocabulary -0.586 22.36 0.00 0.56 Editing -0.228 7.54 0.01 0.80 Cloze Elide n.s n.s 0.91 n.s. Letter n.s n.s 0.37 n.s. Email n.s n.s 0.73 n.s. Qualitative Results
A total of 57 comments were coded that related to the research questions. Survey comments are organised here in terms of the research questions they address. First, comments related to face validity of the task are presented, as they relate to the first research question regarding usefulness of the task in this context. Second, comments are presented related to
1110 B. A. Baker
reported strategies while completing the task, providing insight into the second research question regarding the construct being addressed by the task. Comments Regarding Issues of Face Validity
These comments were all in response to the question “If you could take out one part of the test, what would it be?” As shown here, in discussing the removal of the cloze-elide (here called “speed reading”), the test takers themselves sometimes comment explicitly on what they feel is being addressed by this task (stress, speed), as well as commenting on what the test should be addressing.
• “I would take out the speed reading test, because I felt that it was a measure of how to
cope with stress rather than assessing my ability to edit a document … I found this part of the test to be useless, and it proved nothing.”
• “I don’t think that good writing skills have anything to do with a clock.” • “I thought that the point of the exam was to see if we are able to write proper English,
not if we can find 40 mistakes in 5 minutes.” Another theme which emerged was the authenticity of the task, as well as the validity of
applying scores on such a task to interpretations of good teaching or being a good teacher: • “I don't see how speed reading is a necessary skill for being a teacher.” • “I do not understand why speed reading would ever be a useful tool for teachers to
have, actually I am frightened it would ever be expected.” • “I don’t think that it takes a quick reader to be a good teacher.”
Comments Regarding Reading Strategies
Test takers were asked to provide strategies they used while completing the cloze-elide task. Some students’ responses to the question about strategies revealed a lack of metacognitive awareness (Schoonen et al., 1998)—their awareness of the specific cognitive demands of this task and their abilities to select and monitor the effectiveness of strategies that respond to these task demands. This is evidenced by the following comments:
• “I just read the text … not special strategies were used,” • “I really don’t have any strategy. I just read the paragraph like i [sic] would anything
else.” • “I didn’t use any strategies.” • “I sped read.”
However, comments like these were in the minority. Students in general proved
remarkably articulate regarding their conscious strategy use in completing this task. For example, students mentioned some of Paris, Wasik, and Turner’s (1991) “while-reading” strategies, including skipping ahead or rereading:
• “Re-read sentence without the circled word to see if it makes sense.” • “[I] read sentence minimum twice. Identified the ‘nonsense word.’ Reread the
sentence after taking off the word.”
11Use of the Cloze-Elide Task in High-Stakes English Proficiency Testing
• “When I finished, I read over it all together to make sure it made sense.” • “A second read over the text confirmed that the words eliminated from each line
clarified the meaning of the paragraph.” • “I read each sentence minimum twice to find the awkward word that does not fit in the
sentence.” • “There was 1 wrong word per phrase, so I did not bother to read the remainder of the
sentence.” • “I do not necessarily read all the sentences.” • “For speed reading, I did not entirely read each word.”
Many students discussed activities that could be associated with bottom-up or top-
down processing of the text (see Hudson, 2007). For example, strategies associated with top-down processing included concentrating on a global reading of the text with the incorrect words “jumping out”:
• “As a rule I skim large paragraphs to make sense of them; for this exercise I did the
same & only review in detail what I can't make sense of through the first reading.” • “I found it more important to get through it all then to get stuck on one sentence.” • “Skimmed though, half reading and looking for mistakes.” • “I skimmed the text, and whatever did not fit simply stood out to me.” • “Except for skimming through the sentences, I didn’t actually read every single word.” • “I skimmed and tried to retain the vital information of the text, any words that stuck
out etc.” • “By going through the text quickly the words seemed to jump out.” • “I skim read the section picking out key words as I went.”
Comments related to bottom-up processing included discussions of focusing on each
individual word, an even using a finger or a pencil to follow each word. Sometimes it was even explicitly stated that the global understanding of the whole sentence or text was unimportant to this particular task.
• “I followed the words with my finger so it was easier to pick up mistakes.” • “Focus on words” • “Think about every word.” • “I felt that I had ample time, however, I read with a pencil underlining key
words.” • “I focus on finding the word, I didn't focus on understanding the text.” • “For this part of the exam I took my time and read every single line, one at a
time.” Accompanying this enumeration of bottom-up strategies was the common observation
that a top-down approach is inappropriate for this particular task—test takers note the conscious attempt to work against a top-down approach, to force more word-by-word processing slowly and systematically in order to make the inserted word more salient:

1312 B. A. Baker
• “If you read fast your mind will skip over the words that do not make sense, making the sentence right. Therefore, one must read slowly, so that they are able to catch what does not make sense.”
• “The strategy I used was to read slower, and relax. I found the first time when I did the exam, my brain was automatically correcting the mistakes and I was reading over them.”
• “I read and looked for faults. The faults were words typically skipped when speed reading so it was important to read the whole text.”
• “Just read it sentence by sentence. I found it a bit difficult because your mind kind of just skips over the words that aren't supposed to be there. You really have to read carefully to be able to circle the incorrect words.”
• “If you read too fast you may miss the mistake but slowing down a little helps.” • “I tried to read slower, really stressing each word. If I would speed read too quickly,
my mind would construct the right sentence and I would not notice if a small word was misplaced. So as I read, I really took a brief pause after every word.”
• “My strategy for doing it is reading slowly to observe what word doesn’t make sense. I don’t focuse [sic] on the meaning of the while sentence.”
• “I attempted to skip words, but I think that affected my accuracy of detecting the grammatical errors.”
Another strategy related to bottom-up processes was reading each word out loud quietly
while completing the task:
• “I realized that once we read out load, it was much more easier [sic] because you can listen to the meaning of the sentence.”
• “When reading a good idea is to read it loud in your head so that the mistake stands out easily.”
• “I read the texte [sic] out loude [sic] to myself.” • “I try to speak loud in my head so it was easier to see the errors.” • “I read the text out loud to myself, more like whispering to myself, so I can hear what
sounded wrong.” • “Read aloud in your head.” • “I mouthed the words as I read them in my head, it made it easier to find the
mistakes.”
Discussion There is evidence that the cloze elide task did indeed function as both a speed task and
a power task in this context (Davies, 1990). In other words, both comprehension and speed were required: student performance was discriminated both by who finished and who did not, but also by whether they were able to recognize and eliminate the superfluous words in the text. The following discussion responds to each of the research questions in turn.
13Use of the Cloze-Elide Task in High-Stakes English Proficiency Testing
RQ1. Is this task useful and appropriate for this context?
For the purposes of this study, the cloze elide was deemed useful if it distinguished between English and French native speakers. In addition, the task must be accepted by the test takers as valuable (i.e., have face validity).
While the mean score suggested that scores on cloze depended on the language group the test taker belonged to, multivariate analysis combining performance on several tasks did not find that cloze results were a significant predictor of what language group the student belonged to. These were not the same results as Elder and von Randow (2008), whose population of non-English speakers consisted of many first-generation Asian and Polynesian immigrants and foreign students. In the Quebec context, it is very possible that the French L1 speakers had a higher level of proficiency. Another explanation for this lack of distinction may be the blurring between the categories of native and nonnative speaker in this part of the world. For example, in Quebec, English native speakers often attend French schools or French immersion programs within the English school system, so they may be as proficient as native speakers of French.
It was reasonably assumed in the New Zealand context that nonnative speakers would be in need of greater English language support in their academic and professional preparation. This assumption has proven to be problematic in Montreal. Besides the performance on the cloze, neither of the writing tasks was predictive of language group, either. These writing tasks were more authentic and direct assessments of the test takers’ communication abilities in the teaching profession. Given that these tasks do not distinguish between French and English L1, it cannot even be reasonably concluded that L2 means “linguistically at risk” in this context; therefore, aiming to distinguish between them may not be helpful.
Regarding the face validity of the task, there is evidence from the test-taker survey responses that several people view the cloze-elide task sceptically, to say the least. Test takers’ hypotheses about the construct being assessed did not extend to more than the ability to read fast, which was not judged to be relevant. In addition, raised on communicative language learning and on direct performance assessment, this population may view any task that they do not have time to complete—the definition of a speeded task—as inherently unfair. Fulcher (2000) states, “It would be difficult to market a new large-scale test that did not claim to be “communicative” (p. 39). In this case, even one noncommunicative task resulted in a substantial outcry against it; general acceptance of the cloze-elide task by this test-taking population seems unlikely. It must therefore be concluded that this task is not useful or appropriate for this context.
1514 B. A. Baker
RQ2. What reading strategies are reportedly used in completing the cloze-elide task? Hudson (2007), in discussing the comprehension processes involved in completing
traditional deletion cloze tasks, noted that while placing words in the blanks of a traditional cloze, errors perceived in syntax or lexicon would cause “dissonance” to occur:
Readers then begin to exert their control in order to make the coherent text representation. Successful readers possess the necessary linguistic knowledge, background knowledge, and strategies, and their metacognitive knowledge selects strategy or strategies that will repair the dissonance (p. 117). Students in completing the cloze-elide task also showed evidence of looking for the
word which caused “dissonance,” then demonstrated metacognitive awareness of the strategies they needed to employ to repair this dissonance. There was evidence from the students’ reports of the use of both top-down and bottom-up strategies in completing the task, as postulated by Manning (1987). Concerning top-down strategies, there was evidence that test takers made tentative decisions which were confirmed with rereading, and they skipped areas of the text, skimming for the gist. In other words, their reading was anticipatory in that they were continually changing hypotheses as predictions were confirmed.
Test takers acknowledged the tendency to ignore the wrong words in an attempt to construct the general meaning from the text, which was a top-down process which they tried to consciously counter with a more bottom-up approach, focusing word by word and integrating each word in a linear fashion. In other words, to be successful at this particular task, fluent readers may have had to consciously work against the processes that make them fluent readers in the first place. This is evidence that the strategies useful in reading this complete text for global comprehension are not be the same strategies that are useful for finding superfluous words. In addition, test takers reported reading aloud or moving their lips while reading printed text, known as “speech recoding” (Just & Carpenter, 1986). This is done by beginning readers, as well as by all readers for sounding out new words or for certain specific reading purposes, such as judging whether two words rhyme. This strategy of reading aloud could be interpreted as a type of forced phonological encoding—another conscious bottom-up strategy, more characteristic of beginning readers (Paris et al., 1991) to make sure that each word is processed individually. While it would be overly simplified to conceptualise reading as a simple interaction of top-down and bottom-up processes (see Hudson, 2007), this exercise has provided evidence that the reading of this test task may require a greater focussed attention to bottom-up processing than would be required of fluent readers in other academic and professional contexts.
In addition, as revealed by the high stakes conditions under which the task was completed, part of the construct-irrelevant variance of a speeded task is the anxiety created by this speededness. Put another way, part of the construct may be said to be the ability to deal with this stress while completing a language task. Therefore, this task may be useful in situations where the target language use domain does indeed involve stressful and time-restricted situations—such as air traffic control.
15Use of the Cloze-Elide Task in High-Stakes English Proficiency Testing
Limitations and Future Research
One limitation of this study concerns the categorisation of test takers by first language. Some students may have reported their L1 as English but did the majority of their schooling in French, either through the French public school system or through extensive immersion. So English may not necessarily be their strongest language despite what they have reported. Therefore, the English L1 group may not be very distinct from the French L1 group. A related limitation concerns the assumption of logistic regression that categorical variables are mutually exclusive, that is, that one cannot be in the English and the French groups simultaneously. In practical terms, this means that there can be no completely balanced bilinguals among our test takers, which may not be the case for this participant group.
Another limitation of the study was that, as the survey results were anonymous, it was impossible to ascertain the relationship between strategies reported by the test takers and success on the task—or conversely, whether those who reported little or no strategy use did more poorly on the task as a result. While the reading literature does report that strategy use varies with reading ability (Paris et al., 1991), a larger study would be warranted with this particular task, designed to capture perceptions of strategy use as a function of success on the task. In this way, students’ own awareness of the strategies they use may not only serve as a source of indirect evidence of cognitive processes, but also as an indicator of their reading proficiency.
Despite its limited usefulness in this context, these findings do not detract from the demonstrated usefulness of this task in other language assessment situations, such as low-stakes screening (Elder & von Randow, 2008). In fact, this work underscores the importance of taking into account the context of the test situation—including the stakes, the test taker background, and the goals of the test—in any consideration of the usefulness of a given test task.
Acknowlegements
I wish to thank the English Language Institute at the University of Michigan for granting me the funds to enable me to present this work. I also wish to thank Avril Aitken, Anne Hetherington, Candace Farris, May Tan, and especially to Carlos Gomez-Garibello for his valuable contribution to this project. References Aitken, A., Baker, B. A., & Hetherington, A. (2009). English exam for teacher certification
development report. Unpublished report submitted to the Centre for the English Exam for Teacher Certification, Montreal, Quebec.
Biancarosa, G. (2005). Speed and time, texts and sentences: Choosing the best metric for relating reading rate to comprehension. Written Language and Literacy, 8(2), 79–100.
Bowen, J. D. (1978). The identification of irrelevant lexical distraction: An editing task. TESL Reporter, 12(1), 1–3, 14–15.
PB16 B. A. Baker
CAPFE (Comité d’agrément des programmes de formation à l’enseignement) (2001). Formation des maîtres et qualité de la langue française. Québec: Gouvernement du Québec.
Cobb, T. (2002). Web VocabProfile. Retrieved from http://www.er.uqam.ca/nobel/r21270/cgi-bin/webfreqs/web_vp.cgi
Cobb, T., & Horst, M. (2004). Is there room for an AWL in French? In P. Bogaards, & B. Laufer (Eds.), Vocabulary in a second language: Selection, acquisition, and testing (pp. 15–38). Amsterdam: John Benjamins.
Davies, A. (1975). Two tests of speeded reading. In R. L. Jones & J. B. Spolsky (Eds.), Testing language proficiency (pp. 119–130). Washington, DC. Center for Applied Linguistics.
Davies, A. (1990). Principles of language testing. Oxford, UK: Blackwell. Elder, C., & von Randow, J. (2008). Exploring the utility of a web-based English language
screening tool. Language Assessment Quarterly, 5(3), 173–194. Hamp-Lyons, L., & Condon, W. (2000). Assessing the portfolio: Principles for practice,
theory, and research. Cresskill, NJ: Hampton Press. Haswell, R. H. (1998). Multiple inquiry in the validation of writing tests. Assessing Writing,
5(1), 89–109. Heller, H. W., & Spooner, F. (Eds.). (1990). Precision Teaching [Special Issue]. Teaching
Exceptional Children, 22(3), 4–96. Hudson, T. (2007). Teaching second language reading. New York: Oxford University Press. Laberge, D., & Samuels, S. J. (1974). Toward a theory of automatic information processing in
reading. Cognitive Psychology, 6, 293–323. Lindsley, O. R. (1991). Precision Teaching’s unique legacy from B. F. Skinner. Journal of
Behavioural Education, 1, 253–266. Manning, W. H. (1987). Development of cloze-elide tests of English as a Second Language. (TOEFL Research Report 23). Princeton, NJ: Educational Testing Service. Paris, S. G., Wasik, B. A., & Turner, J. C. (1991). The development of strategic readers. In R.
Barr, M. Kamil, P. Mosenthal, & P.D. Pearson (Eds.), Handbook of reading research, Vol. II (pp. 609–640). Mahwah, NJ: Lawrence Erlbaum. Ryan, K. (2002). Assessment validation in the context of high-stakes assessment. Educational Measurement: Issues and Practice, 21(1), 7–15.
Scharton, M. (1996). The politics of validity. In E. M. White, W. D. Lutz and S. Kamuskiri (Eds.), Assessment of writing: Politics, policies, practices. New York: The Modern Language Association of America.
Slocum, T. A., Street, E. M., & Gilberts, G. (1995). A review of research and theory on the relation between oral reading rate and reading comprehension. Journal of Behavioural Education, 5(4), 377–398.
Winer, L. (2007). No ESL in English schools: Language policy in Quebec and implications for TESL teacher education. TESOL Quarterly, 41(3), 489–508.
Weigle, S. C. (2002). Assessing writing. Cambridge: Cambridge University Press. Note
1. See also Lindsley (1991) and Heller & Spooner (1990) for a discussion of Precision Teaching, which is based on the assumption that reading rate is as important as accuracy in predicting and in improving reading skill.
Spaan Fellow Working Papers in Second or Foreign Language AssessmentCopyright © 2011Volume 9: 17–46
University of Michigan
17
A Cognitive Diagnostic Analysis of the MELAB Reading Test
Hongli Li Georgia State University
ABSTRACT With cognitive diagnostic analysis, each examinee receives a multidimensional skill profile expressing whether he/she is a master or nonmaster of each skill measured by the test. Fine-grained diagnostic feedback that facilitates teaching and learning can thus be provided to teachers and students. This study investigated cognitive diagnostic analysis as applied to the Michigan English Language Assessment Battery (MELAB) reading test. The Fusion Model (Hartz, 2002) was used to estimate examinee profiles on each reading subskill underlying the MELAB reading test. With data collected from multiple sources, such as the think-aloud protocol and expert rating, a tentative Q-matrix was initially developed to indicate the subskills required by each item. This Q-matrix was then validated via an application of the Fusion Model using data from the MELAB reading test. Four subskills were found to underlie the test, e.g., vocabulary, syntax, extracting explicit information, and understanding implicit information. Examinee skill mastery profiles were produced as the result of the cognitive diagnostic analysis. Finally, issues involved in the cognitive diagnostic analysis of reading tests were discussed, and areas for future research were also suggested. With traditional Item Response Theory (IRT) (Lord & Novick, 1968) modeling,
examinees’ abilities are ordered along a continuum. Typically, a scaled score and/or a percentile rank are provided as the reported score. Results of scoring via Cognitive Diagnostic Models (CDMs) are different, however, in that examinees are assigned multidimensional skill profiles by being classified as masters versus non-masters of each skill involved in the test (DiBello, Roussos, & Stout, 2007). A typical procedure of the cognitive diagnostic analysis using CDMs is as follows: (i) identifying a set of skills involved in a test; (ii) demonstrating which skills are required for correctly answering each item in the test; (iii) estimating the profiles of skill mastery for individual examinees based on actual test performance data using the CDM; and (iv) providing score reporting and/or diagnostic feedback to examinees and other stakeholders (Lee & Sawaki, 2009b). Fine-grained diagnostic feedback can thus be provided to facilitate teaching and learning.
Despite their relatively new status, CDMs have been actively applied to large-scale language tests. For instance, the Rule Space Model (Tatsuoka, 1983) has been applied to the TOEFL reading (e.g, Kasai, 1997; Scott, 1998), the TOEIC reading (Buck, Tatsuoka, & Kostin, 1997), the TOEIC listening (Buck & Tatsuoka, 1998), and the SAT Verbal (Buck et al.,
1918 H. Li
1998). Recently, the Fusion Model (Hartz, 2002) has been used for diagnostic analysis of the TOEFL iBT reading and listening (Jang, 2005; Lee & Sawaki, 2009a; von Davier, 2005). Wang and Gierl (2007) have also applied the Attribute Hierarchy Method (AHM) (Leighton, Gierl, & Hunka, 2004) to SAT Verbal. Despite the challenge in understanding the content domains and the complexity of the psychometric modeling procedure, these studies have shown the potential of using CDMs with existing language tests.
The Michigan English Language Assessment Battery (MELAB) is developed by the English Language Institute at the University of Michigan (ELI-UM) to evaluate advanced-level English language competence of adult nonnative speakers of English who will use English for academic purposes in a university setting. It consists of three parts: Part 1 composition, Part 2 a listening test comprising 60 multiple-choice items, and Part 3 a grammar/cloze/vocabulary/reading test with a total of 110 multiple-choice items. There is also an optional speaking test. A score for each part is reported, and the final MELAB score is also reported, which is the average of the scores of Part 1, Part 2, and Part 3. The speaking test score is not averaged into the Final MELAB score (ELI-UM, 2010).
The reading section of the MELAB is designed to assess examinees’ understanding of college-level reading texts. It consists of four passages, each of which is followed by five multiple-choice items. According to the item-writing guidelines provided by the ELI-UM, the questions following each passage are intended to assess a variety of reading abilities, including recognizing the main idea, understanding the relationships between sentences and portions of the text, drawing text-based inferences, synthesizing, understanding the author’s purpose or attitude, and recognizing vocabulary in context (ELI-UM, 2003). At present, since reading is only part of the grammar/cloze/vocabulary/reading section, no score is provided specifically to indicate an examinee’s reading competence. Thus the diagnostic information on reading is rather limited. Gao (2006) developed a model of the cognitive processes used by examinees taking the MELAB reading test and validated the model with the tree-based regression (TBR) (Sheehan, 1997). This investigation has set a foundation for studying the diagnostic potential of the MELAB reading test.
In order to maximize the instructional and washback values of the MELAB, it is useful to explore how the CDMs can be used with the MELAB reading test. The purpose of this study is thus to investigate the use of cognitive diagnostic analysis with the MELAB reading test so as to provide rich diagnostic information for examinees.
Literature Review
Overview of Cognitive Diagnostic Models
With a CDM, examinees are assigned multidimensional skill profiles that classify them as masters or nonmasters of each skill involved in the test. Despite disagreement over the definition and scope of CDMs, Rupp and Templin’s (2008) review is regarded as the most detailed and comprehensive one in recent years. In this review, CDMs are defined as:
probabilistic, confirmatory multidimensional latent-variable models with a simple or complex loading structure. They are suitable for modeling observable categorical response variables and contain unobservable (i.e., latent) categorical predictor variables. The predictor variables are combined in compensatory and noncompensatory ways to generate latent classes. (p. 226). A large number of CDMs have been proposed (62 models as listed by Fu & Li, 2007).
One of the earliest methods for cognitive diagnostic analysis, Tatsuoka’s (1983)

19A Cognitive Diagnostic Analysis of the MELAB Reading Test
groundbreaking work on the Rule Space Model classifies examinee item responses into categories of cognitive skill patterns. The Attribute Hierarchy Method (AHM) is an updated version of the Rule Space Model. It specifies the hierarchical relations among the attributes (or skills), whereas the Rule Space Model assumes a linear relationship. Besides these two models, which are mostly regarded as classification algorithms, most of the other CDMs are IRT-based latent class models (see Roussos, Templin, & Henson, 2007 for a full review). In the following section, some of the important characteristics of CDMs are discussed based on the definition given by Rupp and Templin (2008).
To begin with, one salient characteristic of CDMs is multidimensionality. In unidimensional IRT models, examinee ability is modeled by a single general ability parameter. CDMs make it possible to investigate the mental processes underlying the observed response by breaking the overall ability down into different components. The number of dimensions depends on the number of skill components involved in the assessment.
Second, CDMs are inherently confirmatory. The loading structure of a CDM is the Q-matrix, i.e., a particular hypothesis about which skills are required for successfully answering each item. We will let k stand for the number of skills being measured, i for the number of items, and j for the number of examinees. Q = {qik}, where qik = 1 when skill k is required by item i, and qik = 0 when skill k is not required by item i. As shown in Table 1, skill A is required by item 1, whereas skill B and skill C are required by item 2.
Table 1. Sample Q-Matrix Skill A Skill B Skill C Item 1 1 0 0 Item 2 …
0 …
1 …
1 …
Third, CDMs allow for both compensatory and non-compensatory (or conjunctive)
relationships among subskills, although noncompensatory models are currently more popular (Roussos, Templin, & Henson, 2007). With a compensatory model, a high level of competence on one skill can compensate for a low level of competence on another skill in performing a task. In contrast, with a non-compensatory model, a high level of competence on one skill cannot offset a low level of competence on another skill. Some of the most well-known noncompensatory models are the Rule Space Model, the Attribute Hierarchy Method, the DINA (deterministic input noisy and) model of Haertel (1984, 1989, 1990), the NIDA model of Junker and Sijtsma (2001), the HYBRID Latent Class Model of Gitomer and Yamamoto (1991), and the Reparameterized Unified Model (RUM) or Fusion Model of Hartz(2002). The DINO (deterministic input noisy or) model of Templin and Henson (2006) and the NIDO (noisy input deterministic or) model of Templin, Henson, and Douglas (2006) are compensatory.
Finally, unlike traditional IRT models which generally model continuous latent variables, the latent variables modeled in CDMs are discrete. Currently, most CDMs and the associated estimation procedures only allow for dichotomous latent variables (e.g., mastery vs. nonmastery), though theoretically the models can be extended to polytomous/ordinal levels, such as a rating variable with the values of “outstanding performance,” “good performance” “fair performance,” and “poor performance.” The MDLTM software (von Davier, 2006) for the General Diagnostic Model allows for dichotomous or polytomous latent variables; however, in practice most application studies using this software to date have modeled dichotomous latent variables in order to reduce the complexity of estimation.

2120 H. Li
Introduction to the Fusion Model Among the large number of CDMs, the Fusion Model (Hartz, 2002; Roussos, DiBello,
et al., 2007) is particularly promising for cognitive diagnostic analysis with reading tests. Also known as the Reparameterized Unified Model (RUM), the Fusion Model is an IRT-like multidimensional model that expresses the stochastic relationship between item responses and underlying skills as follows:
!"#$=1'$,)$=*#∗ ,=1,-#,∗(1−'$,) 1#,23# ()$) (1) Where, Xij is response of examinee j to item i (1 if correct; 0 if incorrect); and qik specifies the requirement for mastery of skill k for item i (qik = 1 if skill k is required by item i; qik = 0 if otherwise). There are two ability parameters, 'j and θj:. 'j refers to a vector of cognitive skill mastery for examinee j for the skill k specified by the Q-matrix ('jk = 1 if examinee j has mastered skill k; 'jk = 0 if examinee j has not mastered skill k); and θj represents a residual ability parameter of potentially important skills unspecified in the Q-matrix in the range of -∞ to ∞. There are three item parameters, πi*, rik*, and ci: πi* is the probability that an examinee, having mastered all the Q-matrix skills required for item i, will correctly apply all the skills to solving the item i. πi* can be interpreted as the Q-matrix-based difficulty level of item i, ranging from 0 to 1; and rik* = P(Yijk = 1|αjk = 0)/P(Yijk = 1|αjk = 1) is an indicator of the diagnostic capacity of item i for skill k, ranging from 0 to 1. The more strongly the item requires mastery of skill k, the lower is rik*. rik* can be interpreted as the discrimination parameter of item i for skill k; and ci is an indicator of the degree to which the item response function relies on skills other than those assigned by the Q-matrix, ranging from 0 to 3. The lower the ci is, the more the item response function depends on residual ability θj. Therefore, ci is regarded as the Q-matrix completeness index.
The biggest advantage of the Fusion Model over other CDMs is that it acknowledges
the incompleteness of the Q-matrix and compensates for this by including the residual parameter ci, which represents all the other skills that have been used by the examinees but have not been specified in the Q-matrix (Roussos, DiBello, et al., 2007). As we do not have a full understanding of the cognitive processes underlying reading comprehension, it is impossible to be certain that we have identified all the skills necessary to correctly answer an item. The inclusion of the residual parameter admits this practical limitation.
Furthermore, the Arpeggio program (Bolt et al., 2008) helps to modify the Q-matrix by removing nonsignificant item parameters, thereby facilitating the process of building a valid Q-matrix. As demonstrated in Hartz (2002), the Fusion Model uses a stepwise reduction algorithm to increase the estimation accuracy of the item parameters by eliminating noninformative parameters. Therefore, the Q-matrix can be refined iteratively. For instance, if the best possible rik* is 0.9, which indicates a lack of diagnostic capacity for discriminating the masters from the non-masters for skill k for item i, the corresponding Q-matrix entry can be dropped. Also, a ci parameter above 2.0 indicates that the skills required to successfully

21A Cognitive Diagnostic Analysis of the MELAB Reading Test
answer the item are completely specified by the Q-matrix, and thus ci can be dropped in this case.
Another advantage of the Fusion Model is that it not only evaluates examinee performance on the cognitive skills, but it also evaluates the diagnostic capacity of the items and the test. For instance, the rik* parameter indicates how strongly an item requires mastery of a skill. The more strongly the item requires mastery of skill k, the lower is rik*. If all the rik* values are very small, the test is considered to have a “high cognitive structure” (Roussos, Xu, & Stout, 2003).
The Fusion Model has been intensively studied in the past several years, and some new developments have emerged. For instance, Roussos, Xu and Stout (2003) studied how to equate with the Fusion Model using item parameter invariance; Bolt, Li, and Stout (2003) explored linking calibrations based on the Fusion Model, and Fu (2005) extended the Fusion Model to handle polytomously scored data using a cumulative score probability function (referred to as PFM-C). Templin (2005) developed a generalized linear mixed model for the proficiency space of examinee abilities (GLMPM) using the Fusion Model. Henson and Templin (2004) developed a procedure for analyzing National Assessment of Educational Progress (NAEP) data with the framework of the Fusion Model.
Due to its relatively new status, the Fusion Model has not yet been widely used. The most exemplary study using the Fusion Model is by Jang (2005), who studied the reading comprehension part of the TOEFL iBT. Based on think-aloud protocols, expert rating, and content analysis, Jang identified nine primary reading skills involved in TOEFL reading and created a Q-matrix demonstrating the specific skills required by each item. Then she fitted the Fusion Model with the LanguEdge field test data of TOEFL iBT to estimate the skill mastery probability for 2,703 test takers. Another accomplishment of the study was profile reporting and the use of diagnostic reports. Before teaching a summer TOEFL class, Jang assessed some students via the Fusion Model and provided diagnostic feedback to each student. Following the class, each student was assessed again, with overall gains in skill mastery shown on the score report. The average change in posterior probability of mastery was an approximate gain of about 0.12, and approximately 85% of the students improved their performance on average over the skills. All the participating teachers reported that the diagnostic feedback was useful for increasing students’ awareness of their strengths and weaknesses in reading skills. Overall, Jang’s study has shown the great potential of using CDMs with existing language tests.
A similar application of the Fusion Model was conducted by Lee and Sawaki (2009a). Data from a large-scale field test of TOEFL iBT reading and listening were used. Different from Jang’s study, only four skills were identified as underlying the TOEFL reading test. In addition to reading tests, the Fusion Model has been applied to other tests, such as the Preliminary SAT/National Merit Scholarship Qualifying Test (PSAT/NMSQT, Hartz, 2002), the ACT math (Hartz, 2002), an end-of-course high school geometry examination (Montero et al., 2003), a math test on mixed-number subtraction problems (Yan, Almond, & Mislevy, 2004), the Iowa Tests of Educational Development (ITED, Schrader, 2006), and the Concept Assessment Tool for Statistics (CATS, Román, 2009).
Overall, given the complexity of reading comprehension, the Fusion Model has great potential for conducting cognitive diagnostic analysis with reading tests. Therefore, in the current study, the Fusion Model was applied to the MELAB reading test to investigate its diagnostic potential.
2322 H. Li
Q-Matrix Construction and Validation
The Q-matrix is an essential input for using the Fusion Model and any other CDMs. However, because the construct being tested and the underlying cognitive processes associated with it are usually not fully understood, establishing a Q-matrix, especially for an existing test, is a challenging task. In the present study, the following procedures were followed to construct and validate the Q-matrix for the MELAB reading test.
Initial Q-Matrix Construction
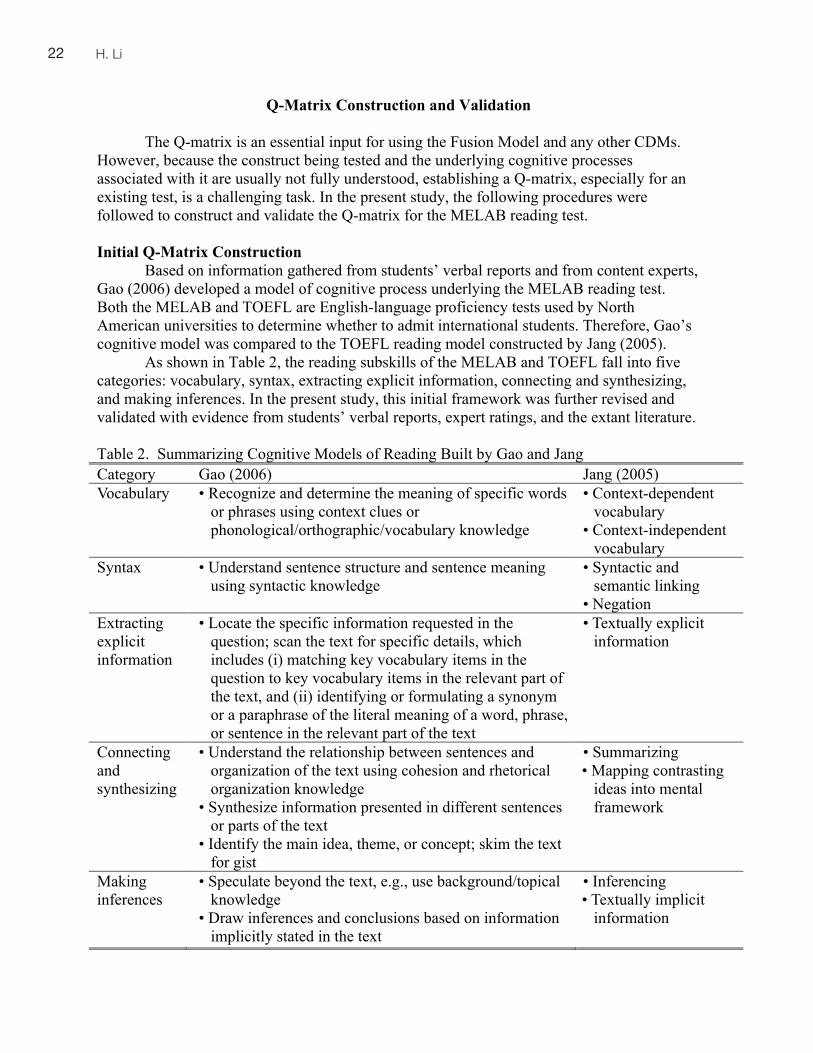
Based on information gathered from students’ verbal reports and from content experts, Gao (2006) developed a model of cognitive process underlying the MELAB reading test. Both the MELAB and TOEFL are English-language proficiency tests used by North American universities to determine whether to admit international students. Therefore, Gao’s cognitive model was compared to the TOEFL reading model constructed by Jang (2005).
As shown in Table 2, the reading subskills of the MELAB and TOEFL fall into five categories: vocabulary, syntax, extracting explicit information, connecting and synthesizing, and making inferences. In the present study, this initial framework was further revised and validated with evidence from students’ verbal reports, expert ratings, and the extant literature. Table 2. Summarizing Cognitive Models of Reading Built by Gao and Jang Category Gao (2006) Jang (2005) Vocabulary • Recognize and determine the meaning of specific words
or phrases using context clues or phonological/orthographic/vocabulary knowledge
• Context-dependent vocabulary
• Context-independent vocabulary
Syntax • Understand sentence structure and sentence meaning using syntactic knowledge
• Syntactic and semantic linking
• Negation Extracting explicit information
• Locate the specific information requested in the question; scan the text for specific details, which includes (i) matching key vocabulary items in the question to key vocabulary items in the relevant part of the text, and (ii) identifying or formulating a synonym or a paraphrase of the literal meaning of a word, phrase, or sentence in the relevant part of the text
• Textually explicit information
Connecting and synthesizing
• Understand the relationship between sentences and organization of the text using cohesion and rhetorical organization knowledge
• Synthesize information presented in different sentences or parts of the text
• Identify the main idea, theme, or concept; skim the text for gist
• Summarizing • Mapping contrasting
ideas into mental framework
Making inferences
• Speculate beyond the text, e.g., use background/topical knowledge
• Draw inferences and conclusions based on information implicitly stated in the text
• Inferencing • Textually implicit
information

23A Cognitive Diagnostic Analysis of the MELAB Reading Test
Think-Aloud Protocol To supplement the initial framework shown in Table 2, think-aloud protocols
(Ericsson & Simon, 1993; Pressley & Afflerbach, 1995) were conducted in order to gather information about possible cognitive processes involved in responding to the MELAB items. In total, 13 ESL learners participated in the study, and their background information is shown in Table 3.
Table 3. Background Characteristics of Think-Aloud Participants Name First
language (native country)
Highest degree (where obtained)
Major or field of study
TOEFL score
Self-rating of English reading ability
Jin Chinese (China)
Bachelor (China)
Engineering 65 Basic
Ted Chinese (China)
Master (China)
Education 85 Excellent
Fei Chinese (China)
Bachelor (China)
Philosophy N/A Between basic and good
Yao Chinese (China)
Bachelor (China)
Educational technology
85 Basic
Ming Chinese (China)
Bachelor (China)
Computer science
83 Good
Hon Korean (Korea)
Bachelor (Korea)
Biochemical engineering
N/A Basic
Chika Japanese (Japan)
Bachelor (Japan)
Social welfare N/A Basic
Afsar Persian (Iran)
Master (Iran)
Textile engineering
88 Good
Sabina Spanish (Colombia)
Master (US.)
Agricultural engineering
110 Very good
Katia Portuguese (Brazil)
Master (US.)
Environmental engineering
N/A Very good
Dora French (Morocco)
High school N/A 85 Good
Leon Spanish (Colombia)
High school N/A N/A Basic
Eva Spanish (Spain)
Master (Spain)
History and musicology
N/A Basic
A brief training session was provided prior to the formal think-aloud activity. During
the concurrent think-aloud session, the participant talked out what he/she was thinking while reading the passage and responding to the 20 reading items of the MELAB Form E. It was important not to distract the participant; therefore, only when a silence of 10 seconds or so had occurred, would I prompt the participant with questions such as “What are you thinking
2524 H. Li
now?” Then after finishing all five questions following one passage, the participant would recount the processes he/she had used. At this retrospective think-aloud session, I asked some questions mainly for clarification and further inquiry. The whole process was recorded using a digital voice recorder.
I read through the transcribed verbal reports line-by-line in order to understand the reading skills involved. The initial framework was mostly confirmed by the data. First, it was difficult to distinguish whether students determined the meaning of specific words by using context clues or by using phonological/orthographic/vocabulary knowledge. Therefore, I decided to have one vocabulary skill as Sawaki, Kim, and Gentile (2009) did in their diagnostic analysis of the TOEFL reading. Second, syntactic knowledge was critical for responding to some items. In particular, long and complicated sentences with relative clauses, inversion of subject and verb, passive voice, subjunctive mood, and pronoun references seemed to be difficult for students. Third, in many cases, students needed the skill of understanding explicit information at the local level in order to find answers to the items. Most often, students read the items and then scanned the text searching for specific information relevant to the item. Comprehension usually inhered in a literal understanding of a sentence at the local level. The fourth category appeared to involve different levels of elements. In some cases, students only needed to read and connect information from adjacent sentences in a single paragraph. However, in other cases, students had to read across different paragraphs or the whole passage in order to identify the main idea of the passage. Only two items were found to test main ideas, and thus it was not practical to have a separate skill for main ideas. Therefore, a final decision was made to use the general skill designated as connecting and synthesizing. The fifth category pertained to making inferences, in which students went beyond the text in order to draw conclusions based on implicit information in the text.
In addition to the above five skills, skills relating to metacognition, test-taking, and guessing were noticeable in the think-aloud verbal reports. For instance, some students read the questions before reading the passage or skipped the question when they were not able to answer a question upon first encountering it. Also, some students consistently guessed at or eliminated alternative choices. A residual skill category seemed to exist, which may include metacognition, test-taking, guessing, or any other skills (or strategies due to the potential overlapping between skills and strategies) not specified in the cognitive framework.
With reference to Gao (2006) and Jang (2005), a coding scheme, as shown in Table 4, was built based on the cognitive framework and the think-aloud data. The think-aloud data helped to build the coding scheme, which was later used to guide the coding of the data.

25A Cognitive Diagnostic Analysis of the MELAB Reading Test
Table 4. Think-Aloud Protocols Coding Scheme
Skills Elaboration Coding guide 1. Vocabulary
• Recognize and determine the meanings of specific words or phrases using context clues
• Recognize and determine the meaning of specific words or phrases using phonological/orthographic/vocabulary knowledge
•Understanding the word is critical for comprehension.
•The words are usually infrequently used.
2. Syntax
• Understand sentence structure and sentence meaning using syntax, grammar, punctuation, parts of speech, etc.
• Understanding the sentence is critical for comprehension, and its structure is complex (for instance, inversion, relative clauses, passive voice, pronoun references).
3. Extracting explicit information
• Match lexical and/or syntactic information in the question to those in the relevant part of the text
• Identify or formulate a synonym or a paraphrase of the literal meaning of a word, phrase, or sentence in the relevant part of the text
• Information is explicitly stated at local level, usually in one sentence.
•The items usually ask for specific details, and only literal understanding is necessary to answer the question.
4. Connecting and synthesizing
• Integrate, relate, or summarize the information presented in different sentences or parts of the text to generate meaning
• Understand the relationship between sentences and organization of the text using cohesion and rhetorical organization knowledge
• Recognize and evaluate relative importance of information in the text by distinguishing major ideas from supporting details
•The information is stated in different places of the text.
• Answering the question involves connecting two or more ideas or pieces of information across sentences or paragraphs, but it is not necessary to go much beyond the text.
5. Making inferences
• Speculate beyond the text, e.g., use background/topical knowledge
• Draw inferences and conclusions or form hypotheses based on information implicitly stated in the text
• Information is implicitly stated. • It is necessary to make further
inferences based on other information from text and/or on background knowledge.
6. Residual skills
Including but not limited to: • Metacognitive skills (e.g., adjusting reading
speed, decision to skip/skim/carefully read materials, decision to reread materials, attempt to pinpoint confusion, etc.)
• Test-taking skills • Guessing
• All the skills (or strategies) not explicitly specified in the cognitive framework belong to this category.
• Residual skills are affiliated with all the items, and thus it is not necessary to code.
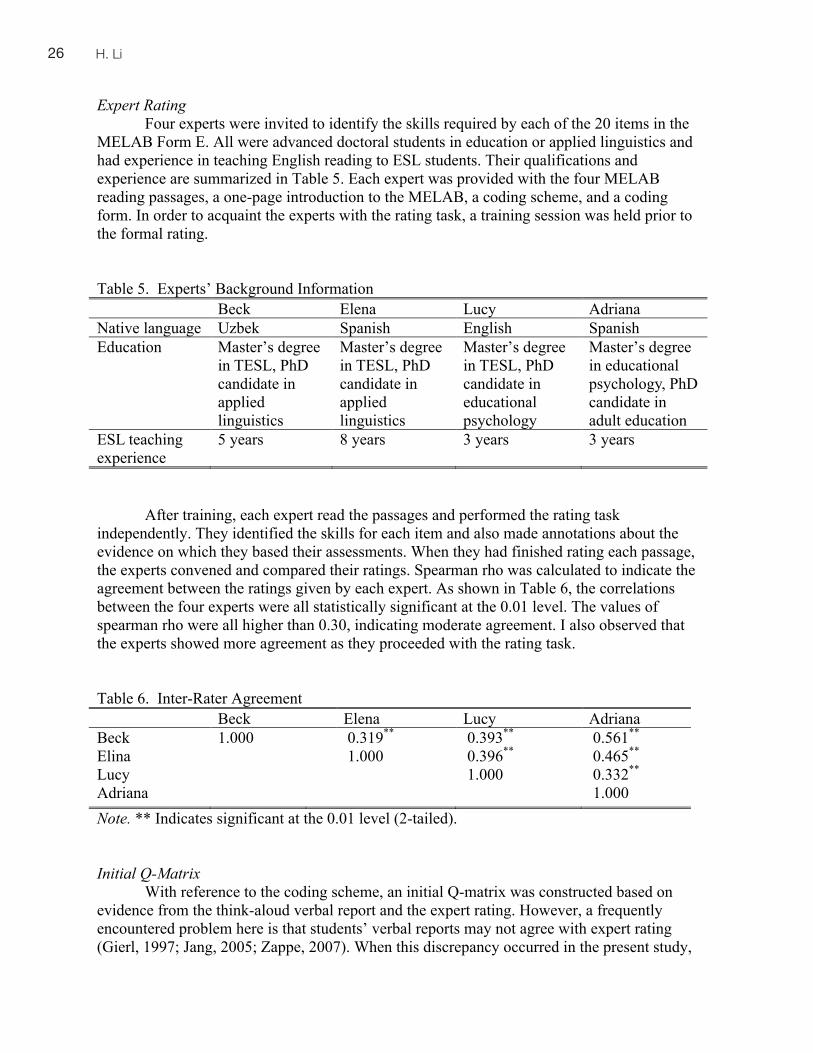
2726 H. Li
Expert Rating Four experts were invited to identify the skills required by each of the 20 items in the
MELAB Form E. All were advanced doctoral students in education or applied linguistics and had experience in teaching English reading to ESL students. Their qualifications and experience are summarized in Table 5. Each expert was provided with the four MELAB reading passages, a one-page introduction to the MELAB, a coding scheme, and a coding form. In order to acquaint the experts with the rating task, a training session was held prior to the formal rating.
Table 5. Experts’ Background Information Beck Elena Lucy Adriana Native language Uzbek Spanish English Spanish Education Master’s degree
in TESL, PhD candidate in applied linguistics
Master’s degree in TESL, PhD candidate in applied linguistics
Master’s degree in TESL, PhD candidate in educational psychology
Master’s degree in educational psychology, PhD candidate in adult education
ESL teaching experience
5 years 8 years 3 years 3 years
After training, each expert read the passages and performed the rating task
independently. They identified the skills for each item and also made annotations about the evidence on which they based their assessments. When they had finished rating each passage, the experts convened and compared their ratings. Spearman rho was calculated to indicate the agreement between the ratings given by each expert. As shown in Table 6, the correlations between the four experts were all statistically significant at the 0.01 level. The values of spearman rho were all higher than 0.30, indicating moderate agreement. I also observed that the experts showed more agreement as they proceeded with the rating task. Table 6. Inter-Rater Agreement Beck Elena Lucy Adriana Beck 1.000 0.319** 0.393** 0.561** Elina 1.000 0.396** 0.465** Lucy 1.000 0.332** Adriana 1.000 Note. ** Indicates significant at the 0.01 level (2-tailed). Initial Q-Matrix
With reference to the coding scheme, an initial Q-matrix was constructed based on evidence from the think-aloud verbal report and the expert rating. However, a frequently encountered problem here is that students’ verbal reports may not agree with expert rating (Gierl, 1997; Jang, 2005; Zappe, 2007). When this discrepancy occurred in the present study,
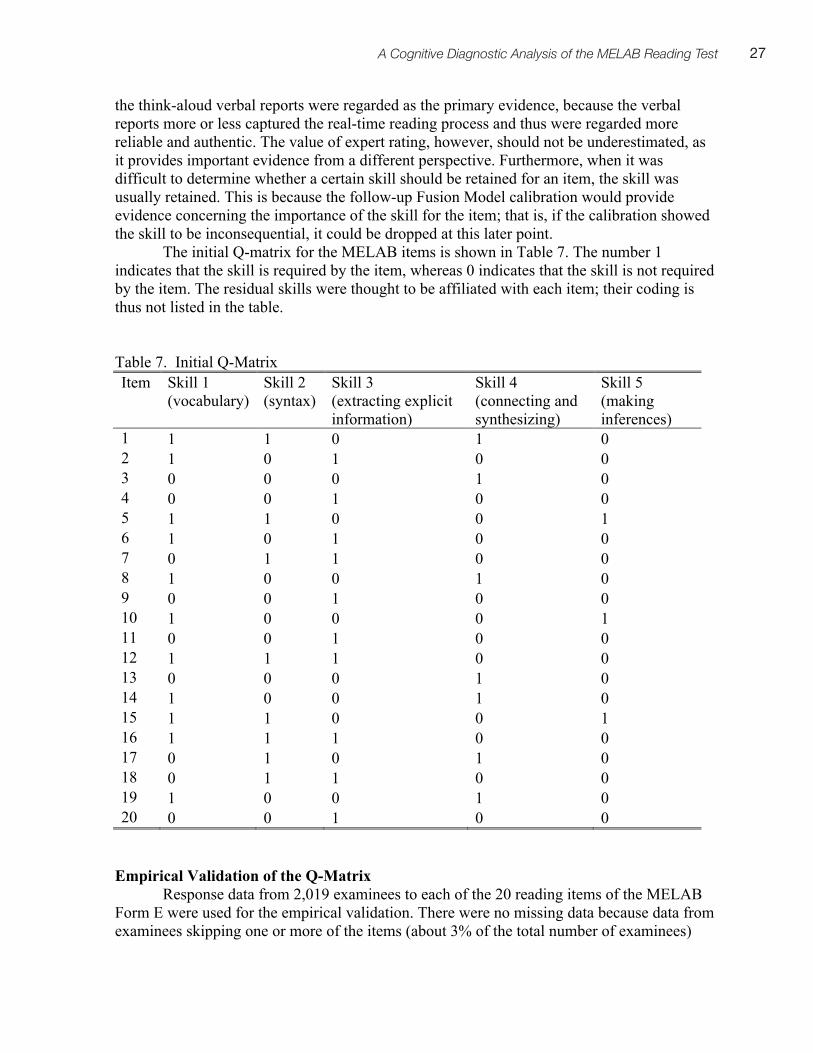
27A Cognitive Diagnostic Analysis of the MELAB Reading Test
the think-aloud verbal reports were regarded as the primary evidence, because the verbal reports more or less captured the real-time reading process and thus were regarded more reliable and authentic. The value of expert rating, however, should not be underestimated, as it provides important evidence from a different perspective. Furthermore, when it was difficult to determine whether a certain skill should be retained for an item, the skill was usually retained. This is because the follow-up Fusion Model calibration would provide evidence concerning the importance of the skill for the item; that is, if the calibration showed the skill to be inconsequential, it could be dropped at this later point.
The initial Q-matrix for the MELAB items is shown in Table 7. The number 1 indicates that the skill is required by the item, whereas 0 indicates that the skill is not required by the item. The residual skills were thought to be affiliated with each item; their coding is thus not listed in the table. Table 7. Initial Q-Matrix Item Skill 1
(vocabulary) Skill 2 (syntax)
Skill 3 (extracting explicit information)
Skill 4 (connecting and synthesizing)
Skill 5 (making inferences)
1 1 1 0 1 0 2 1 0 1 0 0 3 0 0 0 1 0 4 0 0 1 0 0 5 1 1 0 0 1 6 1 0 1 0 0 7 0 1 1 0 0 8 1 0 0 1 0 9 0 0 1 0 0 10 1 0 0 0 1 11 0 0 1 0 0 12 1 1 1 0 0 13 0 0 0 1 0 14 1 0 0 1 0 15 1 1 0 0 1 16 1 1 1 0 0 17 0 1 0 1 0 18 0 1 1 0 0 19 1 0 0 1 0 20 0 0 1 0 0
Empirical Validation of the Q-Matrix
Response data from 2,019 examinees to each of the 20 reading items of the MELAB Form E were used for the empirical validation. There were no missing data because data from examinees skipping one or more of the items (about 3% of the total number of examinees)
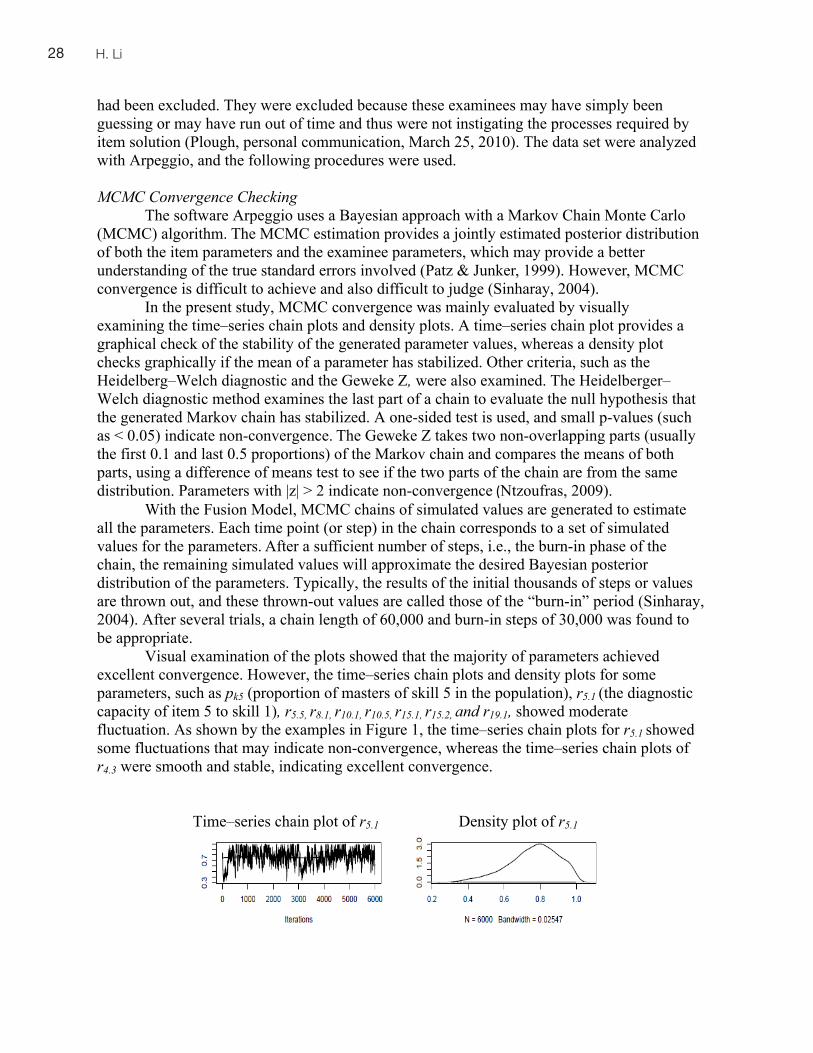
2928 H. Li
had been excluded. They were excluded because these examinees may have simply been guessing or may have run out of time and thus were not instigating the processes required by item solution (Plough, personal communication, March 25, 2010). The data set were analyzed with Arpeggio, and the following procedures were used.
MCMC Convergence Checking
The software Arpeggio uses a Bayesian approach with a Markov Chain Monte Carlo (MCMC) algorithm. The MCMC estimation provides a jointly estimated posterior distribution of both the item parameters and the examinee parameters, which may provide a better understanding of the true standard errors involved (Patz & Junker, 1999). However, MCMC convergence is difficult to achieve and also difficult to judge (Sinharay, 2004).
In the present study, MCMC convergence was mainly evaluated by visually examining the time–series chain plots and density plots. A time–series chain plot provides a graphical check of the stability of the generated parameter values, whereas a density plot checks graphically if the mean of a parameter has stabilized. Other criteria, such as the Heidelberg–Welch diagnostic and the Geweke Z, were also examined. The Heidelberger–Welch diagnostic method examines the last part of a chain to evaluate the null hypothesis that the generated Markov chain has stabilized. A one-sided test is used, and small p-values (such as < 0.05) indicate non-convergence. The Geweke Z takes two non-overlapping parts (usually the first 0.1 and last 0.5 proportions) of the Markov chain and compares the means of both parts, using a difference of means test to see if the two parts of the chain are from the same distribution. Parameters with |z| > 2 indicate non-convergence (Ntzoufras, 2009).
With the Fusion Model, MCMC chains of simulated values are generated to estimate all the parameters. Each time point (or step) in the chain corresponds to a set of simulated values for the parameters. After a sufficient number of steps, i.e., the burn-in phase of the chain, the remaining simulated values will approximate the desired Bayesian posterior distribution of the parameters. Typically, the results of the initial thousands of steps or values are thrown out, and these thrown-out values are called those of the “burn-in” period (Sinharay, 2004). After several trials, a chain length of 60,000 and burn-in steps of 30,000 was found to be appropriate.
Visual examination of the plots showed that the majority of parameters achieved excellent convergence. However, the time–series chain plots and density plots for some parameters, such as pk5 (proportion of masters of skill 5 in the population), r5.1 (the diagnostic capacity of item 5 to skill 1), r5.5, r8.1, r10.1, r10.5, r15.1, r15.2, and r19.1, showed moderate fluctuation. As shown by the examples in Figure 1, the time–series chain plots for r5.1 showed some fluctuations that may indicate non-convergence, whereas the time–series chain plots of r4.3 were smooth and stable, indicating excellent convergence.
Time–series chain plot of r5.1 Density plot of r5.1
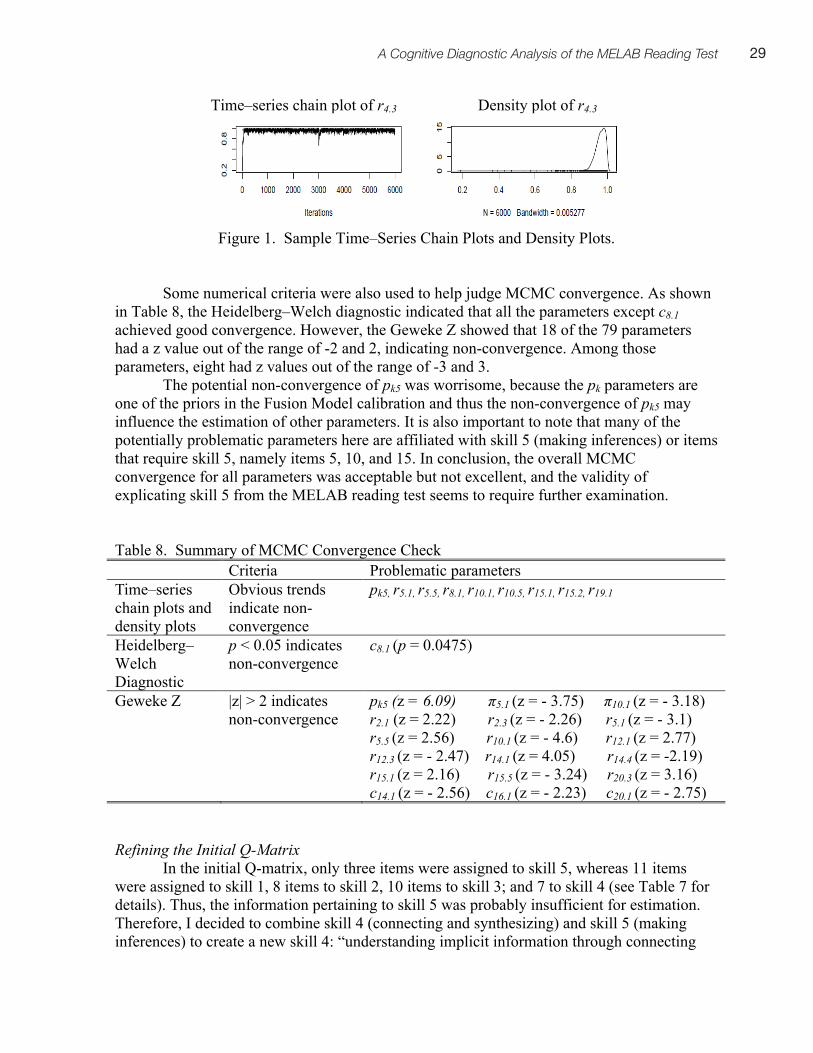
29A Cognitive Diagnostic Analysis of the MELAB Reading Test
Time–series chain plot of r4.3 Density plot of r4.3
Figure 1. Sample Time–Series Chain Plots and Density Plots.
Some numerical criteria were also used to help judge MCMC convergence. As shown
in Table 8, the Heidelberg–Welch diagnostic indicated that all the parameters except c8.1 achieved good convergence. However, the Geweke Z showed that 18 of the 79 parameters had a z value out of the range of -2 and 2, indicating non-convergence. Among those parameters, eight had z values out of the range of -3 and 3.
The potential non-convergence of pk5 was worrisome, because the pk parameters are one of the priors in the Fusion Model calibration and thus the non-convergence of pk5 may influence the estimation of other parameters. It is also important to note that many of the potentially problematic parameters here are affiliated with skill 5 (making inferences) or items that require skill 5, namely items 5, 10, and 15. In conclusion, the overall MCMC convergence for all parameters was acceptable but not excellent, and the validity of explicating skill 5 from the MELAB reading test seems to require further examination.
Table 8. Summary of MCMC Convergence Check Criteria Problematic parameters Time–series chain plots and density plots
Obvious trends indicate non-convergence
pk5, r5.1, r5.5, r8.1, r10.1, r10.5, r15.1, r15.2, r19.1
Heidelberg–Welch Diagnostic
p < 0.05 indicates non-convergence
c8.1 (p = 0.0475)
Geweke Z |z| > 2 indicates non-convergence
pk5 (z = 6.09) π5.1 (z = - 3.75) π10.1 (z = - 3.18) r2.1 (z = 2.22) r2.3 (z = - 2.26) r5.1 (z = - 3.1) r5.5 (z = 2.56) r10.1 (z = - 4.6) r12.1 (z = 2.77) r12.3 (z = - 2.47) r14.1 (z = 4.05) r14.4 (z = -2.19) r15.1 (z = 2.16) r15.5 (z = - 3.24) r20.3 (z = 3.16) c14.1 (z = - 2.56) c16.1 (z = - 2.23) c20.1 (z = - 2.75)
Refining the Initial Q-Matrix In the initial Q-matrix, only three items were assigned to skill 5, whereas 11 items
were assigned to skill 1, 8 items to skill 2, 10 items to skill 3; and 7 to skill 4 (see Table 7 for details). Thus, the information pertaining to skill 5 was probably insufficient for estimation. Therefore, I decided to combine skill 4 (connecting and synthesizing) and skill 5 (making inferences) to create a new skill 4: “understanding implicit information through connecting
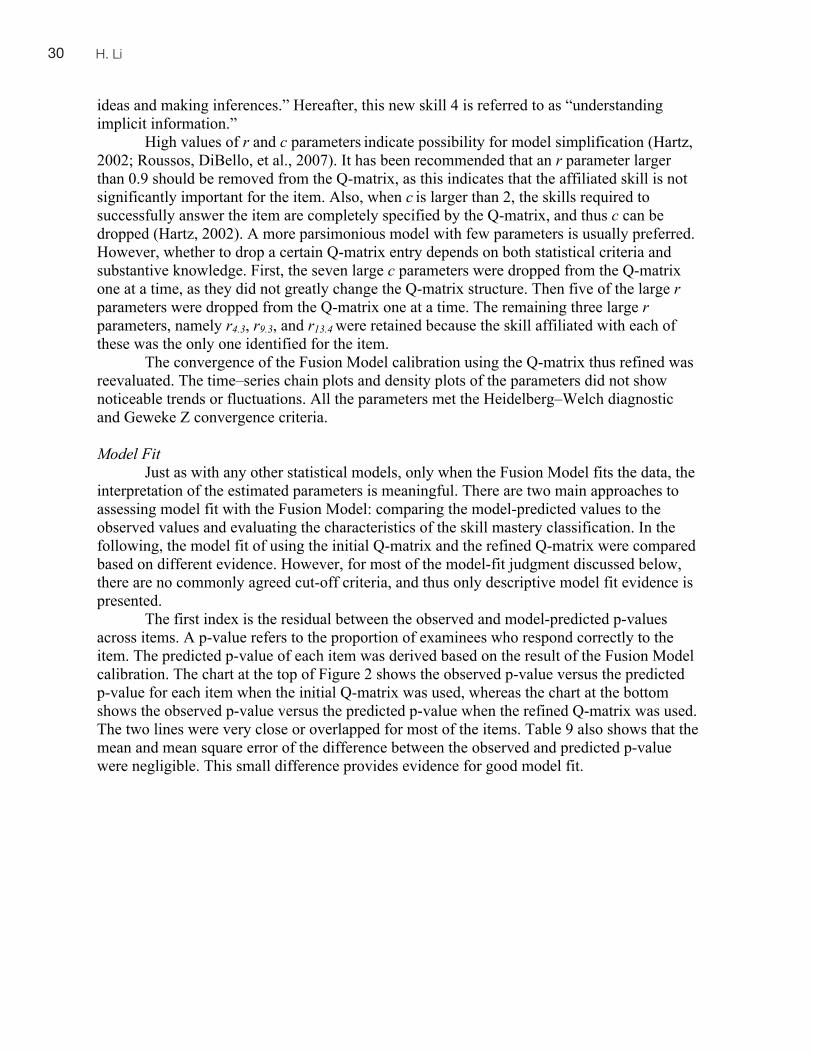
3130 H. Li
ideas and making inferences.” Hereafter, this new skill 4 is referred to as “understanding implicit information.”
High values of r and c parameters indicate possibility for model simplification (Hartz, 2002; Roussos, DiBello, et al., 2007). It has been recommended that an r parameter larger than 0.9 should be removed from the Q-matrix, as this indicates that the affiliated skill is not significantly important for the item. Also, when c is larger than 2, the skills required to successfully answer the item are completely specified by the Q-matrix, and thus c can be dropped (Hartz, 2002). A more parsimonious model with few parameters is usually preferred. However, whether to drop a certain Q-matrix entry depends on both statistical criteria and substantive knowledge. First, the seven large c parameters were dropped from the Q-matrix one at a time, as they did not greatly change the Q-matrix structure. Then five of the large r parameters were dropped from the Q-matrix one at a time. The remaining three large r parameters, namely r4.3, r9.3, and r13.4 were retained because the skill affiliated with each of these was the only one identified for the item.
The convergence of the Fusion Model calibration using the Q-matrix thus refined was reevaluated. The time–series chain plots and density plots of the parameters did not show noticeable trends or fluctuations. All the parameters met the Heidelberg–Welch diagnostic and Geweke Z convergence criteria.
Model Fit
Just as with any other statistical models, only when the Fusion Model fits the data, the interpretation of the estimated parameters is meaningful. There are two main approaches to assessing model fit with the Fusion Model: comparing the model-predicted values to the observed values and evaluating the characteristics of the skill mastery classification. In the following, the model fit of using the initial Q-matrix and the refined Q-matrix were compared based on different evidence. However, for most of the model-fit judgment discussed below, there are no commonly agreed cut-off criteria, and thus only descriptive model fit evidence is presented.
The first index is the residual between the observed and model-predicted p-values across items. A p-value refers to the proportion of examinees who respond correctly to the item. The predicted p-value of each item was derived based on the result of the Fusion Model calibration. The chart at the top of Figure 2 shows the observed p-value versus the predicted p-value for each item when the initial Q-matrix was used, whereas the chart at the bottom shows the observed p-value versus the predicted p-value when the refined Q-matrix was used. The two lines were very close or overlapped for most of the items. Table 9 also shows that the mean and mean square error of the difference between the observed and predicted p-value were negligible. This small difference provides evidence for good model fit.
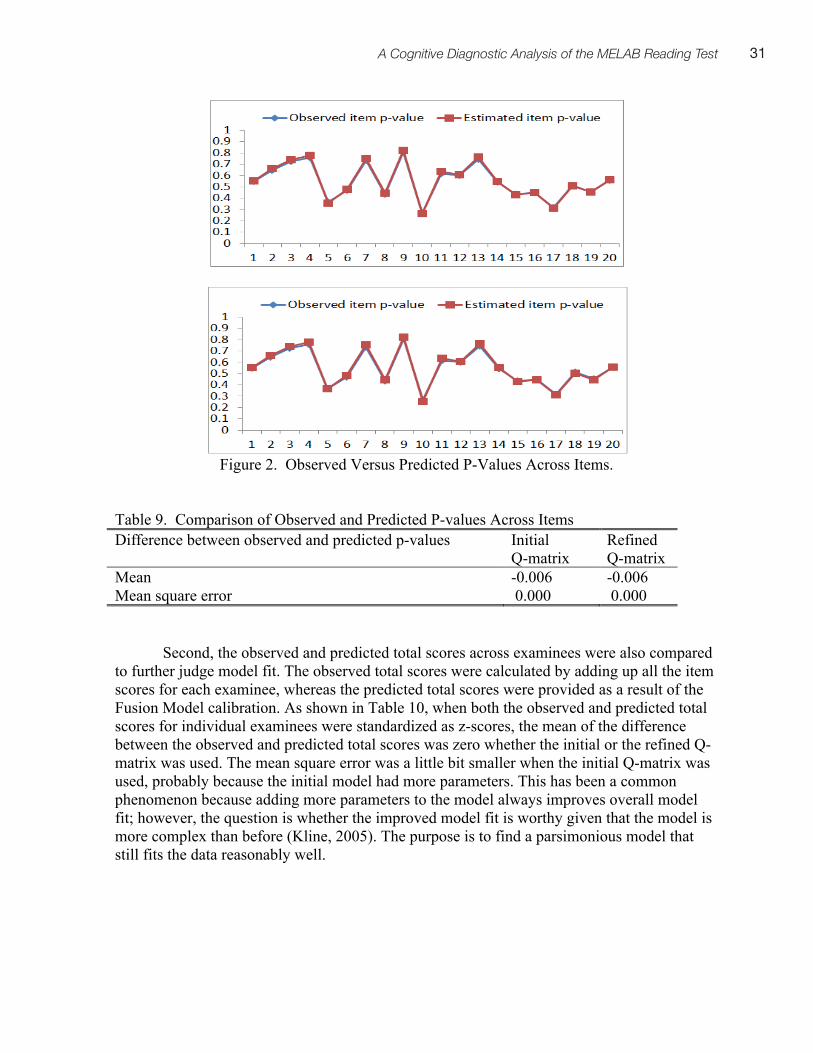
31A Cognitive Diagnostic Analysis of the MELAB Reading Test
Figure 2. Observed Versus Predicted P-Values Across Items.
Table 9. Comparison of Observed and Predicted P-values Across Items Difference between observed and predicted p-values Initial
Q-matrix Refined Q-matrix
Mean -0.006 -0.006 Mean square error 0.000 0.000
Second, the observed and predicted total scores across examinees were also compared
to further judge model fit. The observed total scores were calculated by adding up all the item scores for each examinee, whereas the predicted total scores were provided as a result of the Fusion Model calibration. As shown in Table 10, when both the observed and predicted total scores for individual examinees were standardized as z-scores, the mean of the difference between the observed and predicted total scores was zero whether the initial or the refined Q-matrix was used. The mean square error was a little bit smaller when the initial Q-matrix was used, probably because the initial model had more parameters. This has been a common phenomenon because adding more parameters to the model always improves overall model fit; however, the question is whether the improved model fit is worthy given that the model is more complex than before (Kline, 2005). The purpose is to find a parsimonious model that still fits the data reasonably well.
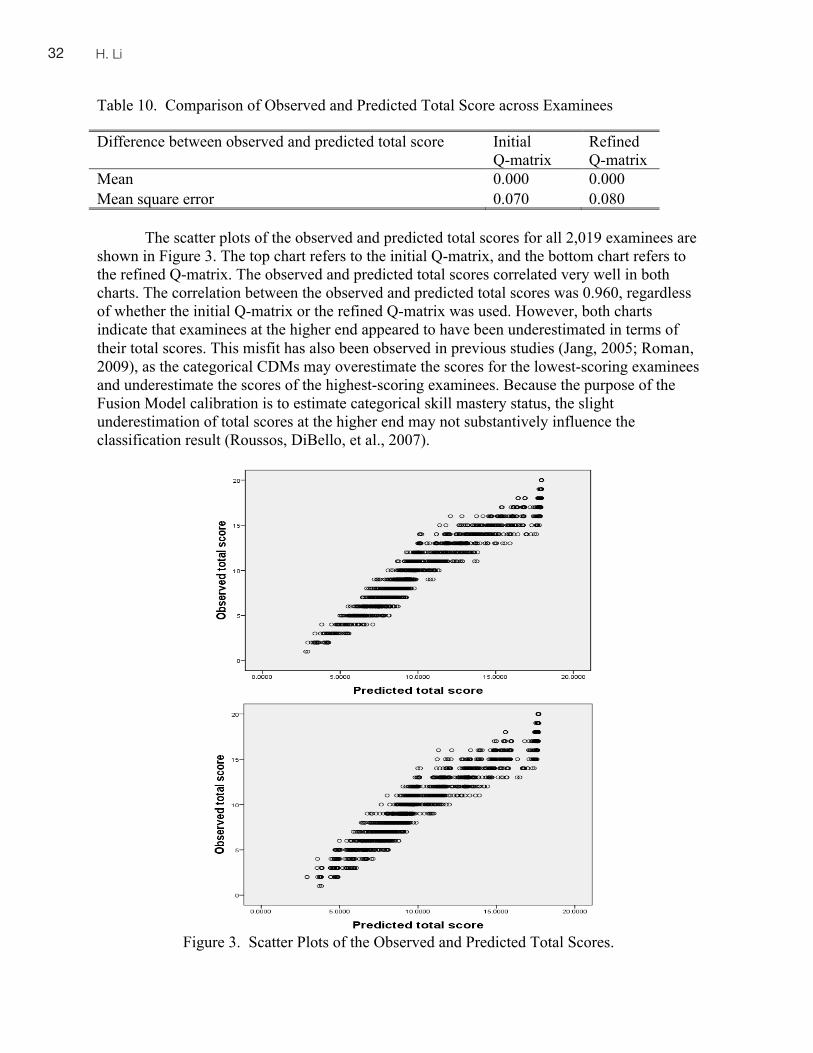
3332 H. Li
Table 10. Comparison of Observed and Predicted Total Score across Examinees
Difference between observed and predicted total score Initial Q-matrix
Refined Q-matrix
Mean 0.000 0.000 Mean square error 0.070 0.080
The scatter plots of the observed and predicted total scores for all 2,019 examinees are
shown in Figure 3. The top chart refers to the initial Q-matrix, and the bottom chart refers to the refined Q-matrix. The observed and predicted total scores correlated very well in both charts. The correlation between the observed and predicted total scores was 0.960, regardless of whether the initial Q-matrix or the refined Q-matrix was used. However, both charts indicate that examinees at the higher end appeared to have been underestimated in terms of their total scores. This misfit has also been observed in previous studies (Jang, 2005; Roman, 2009), as the categorical CDMs may overestimate the scores for the lowest-scoring examinees and underestimate the scores of the highest-scoring examinees. Because the purpose of the Fusion Model calibration is to estimate categorical skill mastery status, the slight underestimation of total scores at the higher end may not substantively influence the classification result (Roussos, DiBello, et al., 2007).
Figure 3. Scatter Plots of the Observed and Predicted Total Scores.
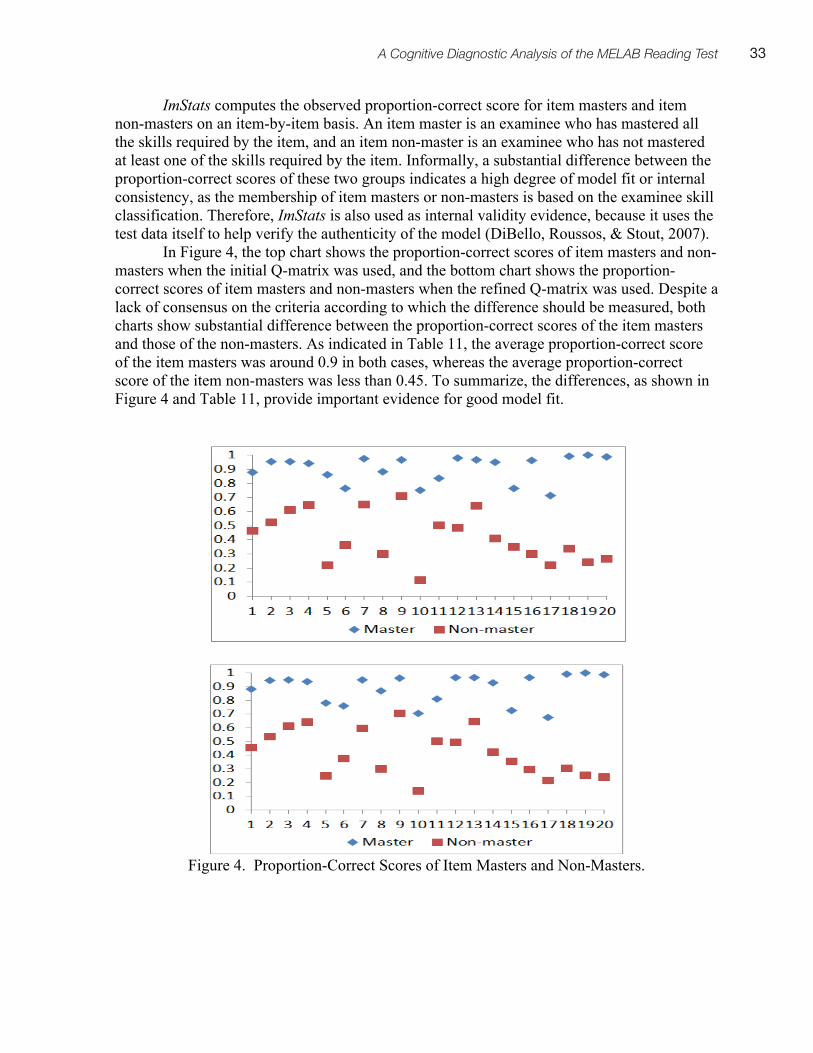
33A Cognitive Diagnostic Analysis of the MELAB Reading Test
ImStats computes the observed proportion-correct score for item masters and item non-masters on an item-by-item basis. An item master is an examinee who has mastered all the skills required by the item, and an item non-master is an examinee who has not mastered at least one of the skills required by the item. Informally, a substantial difference between the proportion-correct scores of these two groups indicates a high degree of model fit or internal consistency, as the membership of item masters or non-masters is based on the examinee skill classification. Therefore, ImStats is also used as internal validity evidence, because it uses the test data itself to help verify the authenticity of the model (DiBello, Roussos, & Stout, 2007).
In Figure 4, the top chart shows the proportion-correct scores of item masters and non-masters when the initial Q-matrix was used, and the bottom chart shows the proportion-correct scores of item masters and non-masters when the refined Q-matrix was used. Despite a lack of consensus on the criteria according to which the difference should be measured, both charts show substantial difference between the proportion-correct scores of the item masters and those of the non-masters. As indicated in Table 11, the average proportion-correct score of the item masters was around 0.9 in both cases, whereas the average proportion-correct score of the item non-masters was less than 0.45. To summarize, the differences, as shown in Figure 4 and Table 11, provide important evidence for good model fit.
Figure 4. Proportion-Correct Scores of Item Masters and Non-Masters.
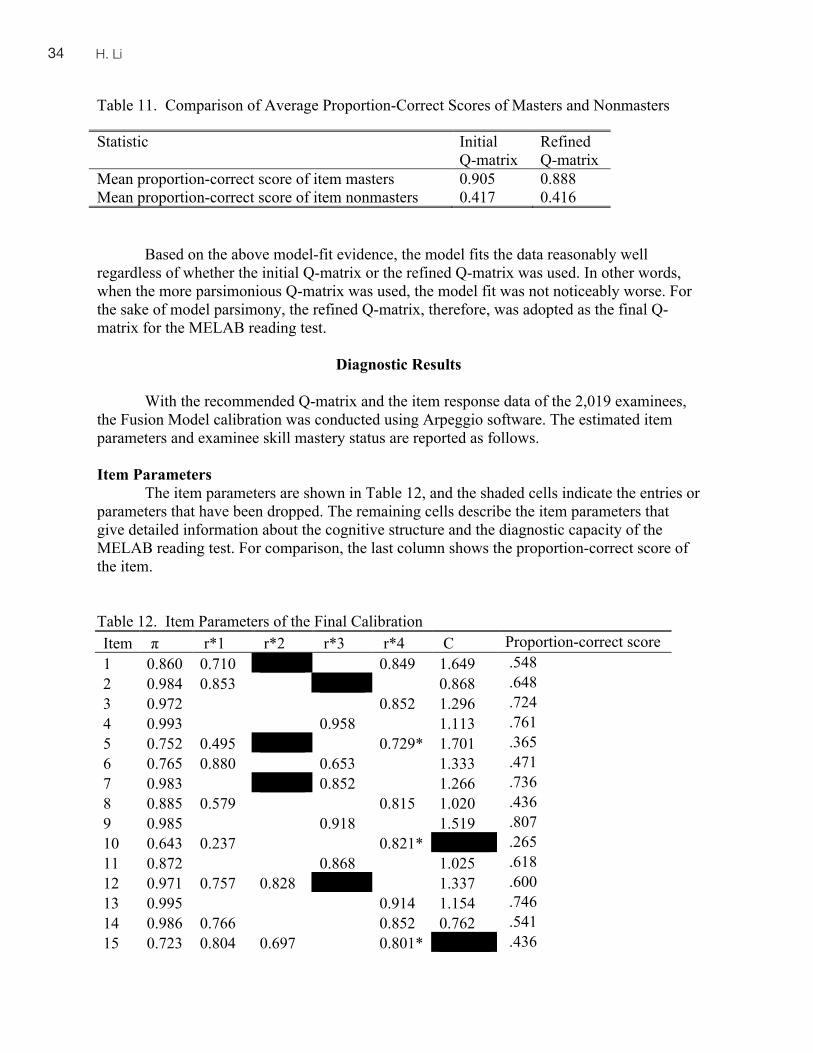
3534 H. Li
Table 11. Comparison of Average Proportion-Correct Scores of Masters and Nonmasters
Statistic Initial Q-matrix
Refined Q-matrix
Mean proportion-correct score of item masters 0.905 0.888 Mean proportion-correct score of item nonmasters 0.417 0.416
Based on the above model-fit evidence, the model fits the data reasonably well regardless of whether the initial Q-matrix or the refined Q-matrix was used. In other words, when the more parsimonious Q-matrix was used, the model fit was not noticeably worse. For the sake of model parsimony, the refined Q-matrix, therefore, was adopted as the final Q-matrix for the MELAB reading test.
Diagnostic Results
With the recommended Q-matrix and the item response data of the 2,019 examinees,
the Fusion Model calibration was conducted using Arpeggio software. The estimated item parameters and examinee skill mastery status are reported as follows.
Item Parameters
The item parameters are shown in Table 12, and the shaded cells indicate the entries or parameters that have been dropped. The remaining cells describe the item parameters that give detailed information about the cognitive structure and the diagnostic capacity of the MELAB reading test. For comparison, the last column shows the proportion-correct score of the item.
Table 12. Item Parameters of the Final Calibration Item π r*1 r*2 r*3 r*4 C Proportion-correct score 1 0.860 0.710 0.849 1.649 .548 2 0.984 0.853 0.868 .648 3 0.972 0.852 1.296 .724 4 0.993 0.958 1.113 .761 5 0.752 0.495 0.729* 1.701 .365 6 0.765 0.880 0.653 1.333 .471 7 0.983 0.852 1.266 .736 8 0.885 0.579 0.815 1.020 .436 9 0.985 0.918 1.519 .807 10 0.643 0.237 0.821* .265 11 0.872 0.868 1.025 .618 12 0.971 0.757 0.828 1.337 .600 13 0.995 0.914 1.154 .746 14 0.986 0.766 0.852 0.762 .541 15 0.723 0.804 0.697 0.801* .436
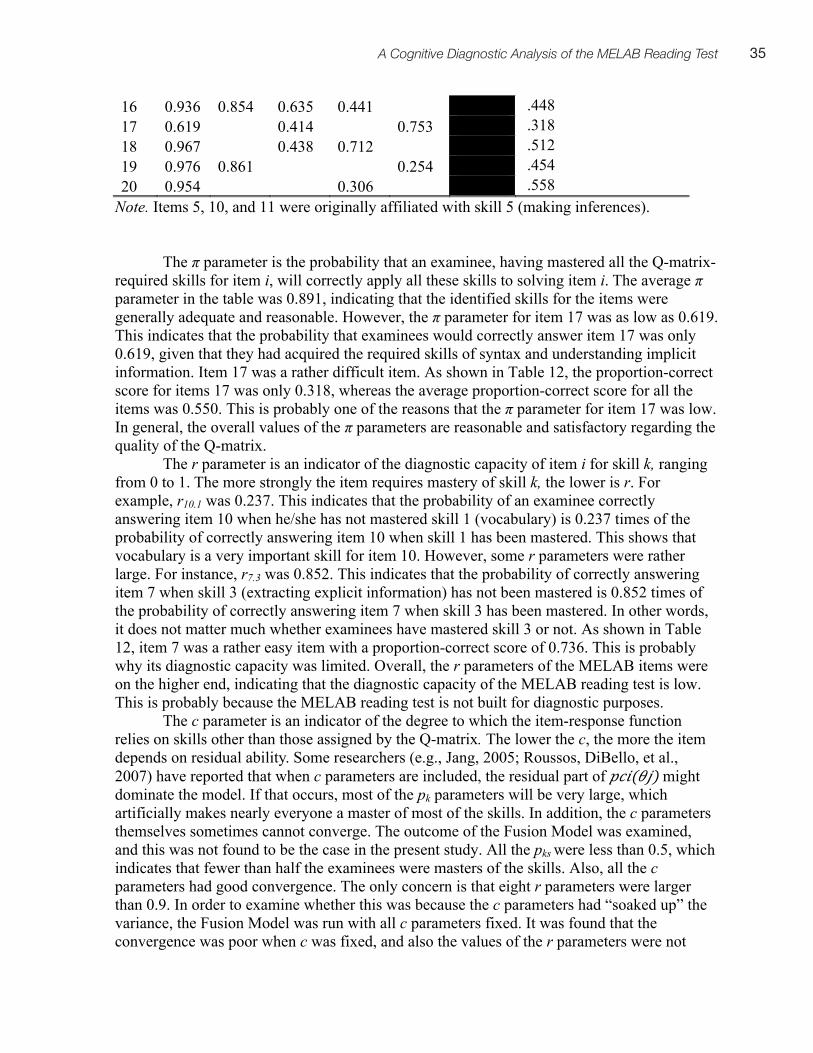
35A Cognitive Diagnostic Analysis of the MELAB Reading Test
16 0.936 0.854 0.635 0.441 .448 17 0.619 0.414 0.753 .318 18 0.967 0.438 0.712 .512 19 0.976 0.861 0.254 .454 20 0.954 0.306 .558
Note. Items 5, 10, and 11 were originally affiliated with skill 5 (making inferences).
The π parameter is the probability that an examinee, having mastered all the Q-matrix-required skills for item i, will correctly apply all these skills to solving item i. The average π parameter in the table was 0.891, indicating that the identified skills for the items were generally adequate and reasonable. However, the π parameter for item 17 was as low as 0.619. This indicates that the probability that examinees would correctly answer item 17 was only 0.619, given that they had acquired the required skills of syntax and understanding implicit information. Item 17 was a rather difficult item. As shown in Table 12, the proportion-correct score for items 17 was only 0.318, whereas the average proportion-correct score for all the items was 0.550. This is probably one of the reasons that the π parameter for item 17 was low. In general, the overall values of the π parameters are reasonable and satisfactory regarding the quality of the Q-matrix.
The r parameter is an indicator of the diagnostic capacity of item i for skill k, ranging from 0 to 1. The more strongly the item requires mastery of skill k, the lower is r. For example, r10.1 was 0.237. This indicates that the probability of an examinee correctly answering item 10 when he/she has not mastered skill 1 (vocabulary) is 0.237 times of the probability of correctly answering item 10 when skill 1 has been mastered. This shows that vocabulary is a very important skill for item 10. However, some r parameters were rather large. For instance, r7.3 was 0.852. This indicates that the probability of correctly answering item 7 when skill 3 (extracting explicit information) has not been mastered is 0.852 times of the probability of correctly answering item 7 when skill 3 has been mastered. In other words, it does not matter much whether examinees have mastered skill 3 or not. As shown in Table 12, item 7 was a rather easy item with a proportion-correct score of 0.736. This is probably why its diagnostic capacity was limited. Overall, the r parameters of the MELAB items were on the higher end, indicating that the diagnostic capacity of the MELAB reading test is low. This is probably because the MELAB reading test is not built for diagnostic purposes.
The c parameter is an indicator of the degree to which the item-response function relies on skills other than those assigned by the Q-matrix. The lower the c, the more the item depends on residual ability. Some researchers (e.g., Jang, 2005; Roussos, DiBello, et al., 2007) have reported that when c parameters are included, the residual part of 23#()$) might dominate the model. If that occurs, most of the pk parameters will be very large, which artificially makes nearly everyone a master of most of the skills. In addition, the c parameters themselves sometimes cannot converge. The outcome of the Fusion Model was examined, and this was not found to be the case in the present study. All the pks were less than 0.5, which indicates that fewer than half the examinees were masters of the skills. Also, all the c parameters had good convergence. The only concern is that eight r parameters were larger than 0.9. In order to examine whether this was because the c parameters had “soaked up” the variance, the Fusion Model was run with all c parameters fixed. It was found that the convergence was poor when c was fixed, and also the values of the r parameters were not
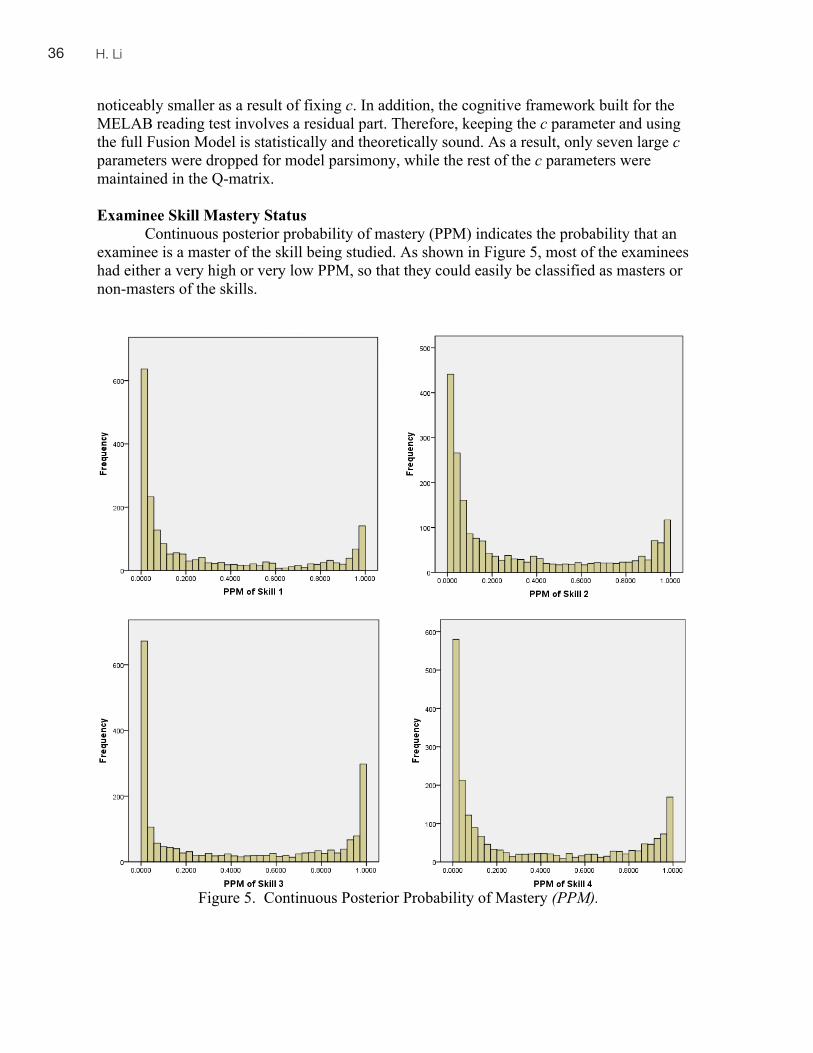
3736 H. Li
noticeably smaller as a result of fixing c. In addition, the cognitive framework built for the MELAB reading test involves a residual part. Therefore, keeping the c parameter and using the full Fusion Model is statistically and theoretically sound. As a result, only seven large c parameters were dropped for model parsimony, while the rest of the c parameters were maintained in the Q-matrix. Examinee Skill Mastery Status
Continuous posterior probability of mastery (PPM) indicates the probability that an examinee is a master of the skill being studied. As shown in Figure 5, most of the examinees had either a very high or very low PPM, so that they could easily be classified as masters or non-masters of the skills.
Figure 5. Continuous Posterior Probability of Mastery (PPM).
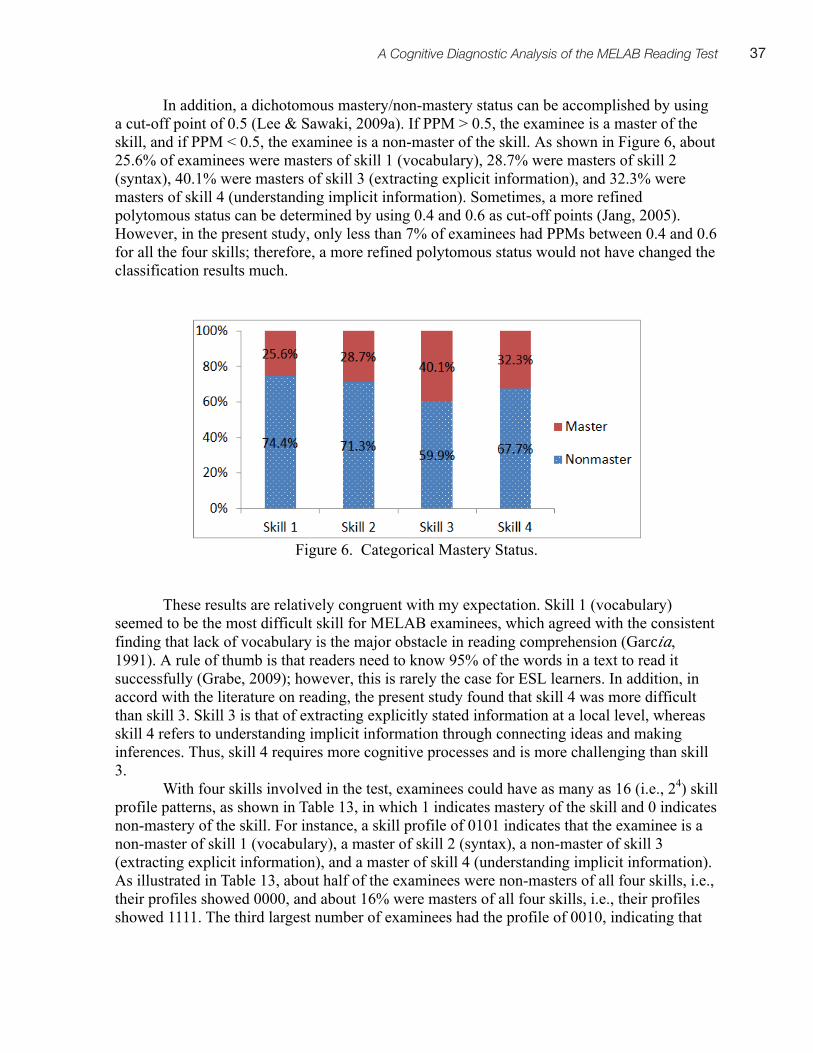
37A Cognitive Diagnostic Analysis of the MELAB Reading Test
In addition, a dichotomous mastery/non-mastery status can be accomplished by using a cut-off point of 0.5 (Lee & Sawaki, 2009a). If PPM > 0.5, the examinee is a master of the skill, and if PPM < 0.5, the examinee is a non-master of the skill. As shown in Figure 6, about 25.6% of examinees were masters of skill 1 (vocabulary), 28.7% were masters of skill 2 (syntax), 40.1% were masters of skill 3 (extracting explicit information), and 32.3% were masters of skill 4 (understanding implicit information). Sometimes, a more refined polytomous status can be determined by using 0.4 and 0.6 as cut-off points (Jang, 2005). However, in the present study, only less than 7% of examinees had PPMs between 0.4 and 0.6 for all the four skills; therefore, a more refined polytomous status would not have changed the classification results much.
Figure 6. Categorical Mastery Status.
These results are relatively congruent with my expectation. Skill 1 (vocabulary) seemed to be the most difficult skill for MELAB examinees, which agreed with the consistent finding that lack of vocabulary is the major obstacle in reading comprehension (Garc#4, 1991). A rule of thumb is that readers need to know 95% of the words in a text to read it successfully (Grabe, 2009); however, this is rarely the case for ESL learners. In addition, in accord with the literature on reading, the present study found that skill 4 was more difficult than skill 3. Skill 3 is that of extracting explicitly stated information at a local level, whereas skill 4 refers to understanding implicit information through connecting ideas and making inferences. Thus, skill 4 requires more cognitive processes and is more challenging than skill 3.
With four skills involved in the test, examinees could have as many as 16 (i.e., 24) skill profile patterns, as shown in Table 13, in which 1 indicates mastery of the skill and 0 indicates non-mastery of the skill. For instance, a skill profile of 0101 indicates that the examinee is a non-master of skill 1 (vocabulary), a master of skill 2 (syntax), a non-master of skill 3 (extracting explicit information), and a master of skill 4 (understanding implicit information). As illustrated in Table 13, about half of the examinees were non-masters of all four skills, i.e., their profiles showed 0000, and about 16% were masters of all four skills, i.e., their profiles showed 1111. The third largest number of examinees had the profile of 0010, indicating that

3938 H. Li
they were only masters of skill 3 (extracting explicit information). This was to be expected, as skill 3 was found to be the least challenging in the think-aloud protocols.
Table 13. Skill Mastery Patterns Skill mastery patterns Frequency Percentage 0000 1042 51.61% 1111 324 16.05% 0010 136 6.74% 0111 96 4.75% 0011 70 3.47% 0110 60 2.97% 1011 58 2.87% 0001 52 2.58% 1110 37 1.83% 1000 31 1.54% 1010 29 1.44% 0100 24 1.19% 0101 22 1.09% 1001 22 1.09% 1101 9 0.45% 1100 7 0.35%
Figure 7 illustrates a sample skill profile report for an MELAB examinee about his/her mastery of the reading skills. The horizontal axis shows the PPMs of each skill, and a vertical line indicates the cut-off point of 0.5. As can be seen, this examinee is a master of skills 1(vocabulary), 3(extracting explicit information), and 4 (understanding implicit information), but not skill 2 (syntax). Providing such a skill profile report can help the examinee identify his/her weakness, and thus more efficiently facilitate the learning and teaching of reading comprehension.
Figure 7. Sample Skill Profile.
39A Cognitive Diagnostic Analysis of the MELAB Reading Test
Discussion The present study yielded useful diagnostic information to MELAB examinees than
are currently available to. However, cognitive diagnostic modeling is new to the field of language assessment, and many issues need further investigation.
Retrofitting the MELAB Reading Test with CDMs
As suggested by Gierl and Cui (2008, p. 265), “a cognitive model would be developed first to specify the knowledge and skills evaluated on the test and then items would be created to measure these specific cognitive skills.” However, currently very few large-scale tests are designed with a cognitive diagnostic purpose; therefore, in most application studies, the Q-matrices have been constructed retrospectively for existing tests. Retrofitting the MELAB reading test has produced more diagnostic information than if only a total score is provided. It also deepens our understanding of the MELAB reading test so as to accumulate empirical evidence for further diagnostic assessment and test development. However, retrofitting with preexisting tests involves a time-consuming process of Q-matrix construction, which may yield results that are not optimal.
A noticeable indeterminacy involved in the retrofitting is the grain size of the subskills (Lee & Sawaki, 2009b). The more skills identified, the richer the diagnostic information that can be provided; however, including a high number of skills places a stress on the capacity of statistical modeling, given the fixed length of the test. Two major factors considered were the modeling capacity and the meaningfulness of the skill mastery profile. Gao (2006) suggested that ten reading skill components underlie the MELAB test. However, given the fact that this test consists of only 20 items, the present study only involved five subskills: vocabulary, syntax, extracting explicit information, synthesizing and connecting, and making inferences. However, only three items were initially identified as requiring skill 5 (making inferences). In order to have more information for parameter estimation, skill 5 (making inferences) and skill 4 (connecting and synthesizing) were collapsed into the more general skill of understanding implicit information through connecting ideas and making inferences. One important implication for the test developers is, therefore, to keep balance between the number of subskills being measured and the numbers of items in the test, i.e. more items should be included if more fine-grained diagnostic information is of interest.
Jang (2009) and Sawaki, Kim, and Gentile (2009) also commented on the skill granularity issue. For the same TOEFL iBT reading test, Jang identified nine skills, whereas Sawaki et al. identified only four skills. In particular, Jang identified two vocabulary skills, one with and the other without the use of context clues, but Sawaki et al. included only one vocabulary skill. Sawaki et al. acknowledged that they had considered the two different approaches but decided not to include the context clues for two reasons. First, only when a reader is not sufficiently familiar with a word in question, using context clues is required as part of the process of responding to a vocabulary item. Also, though two vocabulary skills may help to extract more fine-grained diagnostic information, using two may not be feasible if a test includes only a small number of items requiring vocabulary as an essential skill. To summarize, as Jang (2009) suggested, decisions about the grain sizes of the subskills should be made by considering theoretical (construct representativeness), technical (availability of test items), and practical (purposes and context of using diagnostic feedback) factors. It is also very important to note that given this indeterminacy of the grain sizes, there are always
4140 H. Li
alternative Q-matrices as a function of the definitions and categories of subskills (Lee & Sawaki, 2009b).
The present study shows that it is possible to extract richer diagnostic information than the MELAB reading test was designed to elicit. However, retrofitting CDMs with existing tests is by no means an optimal approach for diagnostic assessment. In order for a test to generate detailed diagnostic feedback, it is essential that it be built for a skills-based diagnostic purpose (DiBello, Roussos, & Stout, 2007). Thus, a successful cognitive diagnostic assessment of reading comprehension largely depends on test development, which again depends on more insightful understanding of the cognitive processes underlying reading comprehension. Selecting Diagnostic Models for Reading Tests
With a large number of CDMs available, the question is which one to choose for reading tests. Lee and Sawaki (2009b) and Rupp and Templin (2008) presented good reviews on the available CDMs and software. In addition to a full understanding of the conditions and assumptions of the CDMs, one major decision is to make the choice between compensatory and non-compensatory models for diagnostic analysis of reading tests.
CDMs allow for both compensatory and non-compensatory relationships among subskills. Non-compensatory models have been preferred for cognitive diagnostic analysis, as they can generate more fine-grained diagnostic information. However, the question of whether we should use non-compensatory or compensatory models with reading tests does not have a clear-cut answer. Lee and Sawaki (2009a) applied three different CDMs to TOEFL iBT reading and listening data, including the non-compensatory Fusion Model, the non-compensatory Latent Class Model (Gitomer &Yamamoto, 1991), and the compensatory General Diagnostic Model (von Davier, 2005). They found that “the examinee classification results were highly similar across the three cognitive diagnostic models (p. 258). Jang (2005) also found that reading skills involved in the TOEFL iBT appeared to be a mixture of non-compensatory and compensatory interactions.
In the literature on reading, Stanovich (1980) proposed a compensatory-interactive model. A major claim of the model is that “a deficit in any particular process will result in a greater reliance on other knowledge source, regardless of their level in the processing hierarchy” (p.32). However, according to another equally influential model, the “Simple View of Reading” (Gough & Tunmer, 1986), reading comprehension (RC) is the product of comprehension (C) and decoding (D), i.e. RC = C x D. The multiplication indicates a non-compensatory relationship. In fact, except for extreme cases when examinee ability in one subskill is zero, the additive property of compensatory models is theoretically equivalent to the multiplicative property of non-compensatory models. No matter which model is used, the more skills the examinee acquires, the more likely it is that the examinee can correctly answer the item requiring those skills. Therefore, at a macro-level, whether a compensatory or non-compensatory model is used for reading tests is probably inconsequential.
Also, it seems that the relationships between the subskills may depend on the relative difficulty levels of the subskills needed for solving a particular item. Thus this relationship may vary across items. If interested, one could empirically test the relationships between reading subskills using a log-linear approach (Henson, Templin, & Willse, 2008). Henson et al. reparameterized the cognitive diagnostic modeling family with a log-linear approach. In this way, estimation could be conducted with more commonly used software such as Mplus
41A Cognitive Diagnostic Analysis of the MELAB Reading Test
(Muthén & Muthén, 2010). An interaction term in the log-linear model indicates the relationship between the subskills. With this approach, it is not necessary to choose between a compensatory or non-compensatory model, and the relationship between subskills can vary across items. With more evidence for the robustness of the log-linear approach for cognitive diagnostic analysis, it may prove to be an effective estimation method for diagnostic analysis of reading tests. Potential Use of Scale Scores for Diagnostic Assessment
Cognitive diagnostic analysis via the Fusion Model or most other CDMs is usually technically challenging. It involves a principal dilemma: On the one hand, the use of the CDMs is especially helpful for classroom instructors. On the other hand, currently, only a small number of psychometricians are trained to use multidimensional CDMs. Therefore, an important task is to make the CDMs “absolutely opaque to classroom teachers, to coordinators of language education programs, and to other in-the-trenches educators” (Davidson, 2010, p. 106).
In order to reduce the sophistication involved in model calibration and thus maximize the advantages of the CDMs, one available option for classroom teachers and non-technical researchers is to use scale scores for the subskills (Henson, Templin, & Douglas, 2007). Given that the cognitive structure of a test is well validated, a scale score could be calculated by averaging the scores of the items associated with a given skill. Item scores may also be weighted while contributing to the sum score. With a simulation study, Henson et al. (2007) concluded that scale scores could be used to estimate the continuous posterior probability of mastery (PPM) with only a moderate reduction in the accuracy of the classification rates. The weighted sum score approach, which takes into consideration unequal contributions of the item scores, may be more appropriate for complex associations between skills and items.
As a post-hoc analysis, the scale scores for each skill in the present study were obtained by averaging the scores of the items requiring the skill. The spearman rho correlation between the average scale score and the average PPM extracted from the Fusion Model calibration for skill 1 (vocabulary), skill 2 (syntax), skill 3 (extracting explicit information), and skill 4 (understanding implicit information) were respectively 0.956, 0.887, 894, and 0.878. Likewise, Jang (2005) also found high correlations between the scale scores and PPMs in her study with TOEFL reading, which was regarded evidence for the validity of the Fusion Model calibration.
The Fusion Model as well as other IRT-based CDMs have the advantages of IRT models, such as being sample-independent and item- (or skill-) independent. The PPMs are probabilities of latent subskill mastery, whereas the scale scores are the observed skill scores. The relationship between the PPMs and scale scores is thus similar to the relationship between the IRT ability scores and the classical raw scores (Suen, personal communication, December 27, 2010). The PPMs have more desirable psychometric features than do the scale scores; however, the scale scores can be an easy and quick way for less technically competent users to derive diagnostic information from a test with a clear cognitive structure.
4342 H. Li
Acknowledgments
I would like to express my appreciation to the English Language Institute at the
University of Michigan for funding this project and providing the data. I am also grateful for the funding from the TOEFL program of the Educational Testing Service. I especially wish to thank my advisor Dr. Hoi K. Suen at the Pennsylvania State University for his insightful comments and suggestions.
References
Bolt, D., Chen, H., DiBello, L., Hartz, S., Henson, R., Roussos, L., Stout, W., & Templin, J. (2008). The Arpeggio Suite: software for cognitive skills diagnostic assessment [Computer software and Manual]. St. Paul, MN: Assessment Systems.
Bolt, D., Li, Y. & Stout, W. (2003). A low-dimensional IRT approach to linking calibrations based on the Fusion Model. Unpublished Manuscript, University of Wisconsin-Madison, Madison, MI.
Buck, G., & Tatsuoka, K. (1998). Application of the rule-space procedure to language testing: Examining attributes of a free response listening test. Language Testing, 15(2), 119–157.
Buck, G. Tatsuoka, K. & Kostin, I. (1997). The sub-skills of reading: rule space analysis of a multiple-choice test of second language reading comprehension. Language Learning, 47 (3), 423–466.
Buck, G., VanEssen, T., Tatsuoka, K., Kostin, I., Lutz, D., & Phelps, M. (1998). Development, selection and validation of a set of cognitive and linguistic attributes for the SAT I Verbal: Analogy section (Research Report, RR-98-19). Princeton, NJ: Educational Testing Service.
ELI-UM (2003). The MELAB technical manual. Retrieved from http://www.lsa.umich.edu/UMICH/eli/Home/Test%20Programs/MELAB/Officers%20&%20Professionals/Revised02TechManual.pdf
ELI-UM (2010). The MELAB information and registration bulletin. Retrieved from http://www.lsa.umich.edu/UMICH/eli/Home/Test%20Programs/MELAB/Officers%20&%20Professionals/MELABInfoBulletin.pdf
Ericsson, K. A., & Simon, H. A. (1993). Protocol analysis: Verbal reports as data. Cambridge, MA: MIT press.
Davidson, F. (2010). Why is cognitive diagnosis necessary? A reaction. Language Assessment Quarterly, 7 (1), 104–107.
DiBello, L.V., Roussos, L. A., & Stout, W. (2007). Review of cognitively diagnostic assessment and a summary of psychometric models. In C. V. Rao & S. Sinharay (Eds.), Handbook of Statistics (Vol.26, Psychometrics) (pp. 979–1027). Amsterdam: Elsevier.
Fu, J. (2005).The polytomous extension of the fusion model and its Bayesian parameter estimation. Unpublished doctoral dissertation, University of Wisconsin-Madison, Madison, WI.
Fu, J., & Li, Y. (2007). An integrated review of cognitively diagnostic psychometric models. Paper presented at the annual meeting of the National Council on Measurement in Education, Chicago, IL.

43A Cognitive Diagnostic Analysis of the MELAB Reading Test
Gao, L. (2006). Toward a cognitive processing model of MELAB reading test item performance. Spann Fellow Working Papers in Second or Foreign Language Assessment, 4, 1–39. English Language Institute, University of Michigan, MI.
Garc#4, G. (1991). Factors influencing the English reading test performance of Spanish-speaking Hispanic students. Reading Research Quarterly, 26, 371–392.
Gierl, M.J. (1997). Comparing the cognitive representations of test developers and students on a mathematics achievement test using Bloom’s taxonomy. Journal of Educational Research, 91, 26–32.
Gierl, M.J., & Cui, Y. (2008) Defining characteristics of diagnostic classification models and the problem of retrofitting in cognitive diagnostic assessment. Measurement: Interdisciplinary Research & Perspective, 6(4), 263–268.
Gitomer, D.H., & Yamamoto, K. (1991). Performance modeling that integrates latent trait and class theory. Journal of Educational Measurement, 28, 173–189.
Gough, P. B., & Tunmer, W. E. (1986). Decoding, reading, and reading disability. Remedial and Special Education, 7(1), 6–10.
Grabe, W. (2009). Reading in a second language: Moving from theory to practice. Cambridge, UK: Cambridge University Press.
Haertel, E. H. (1984). An application of latent class models to assessment data. Applied Psychological Measurement, 8, 333–346.
Haertel, E. H. (1989). Using restricted latent class models to map skill structure of achievement items. Journal of Educational Measurement, 26, 301–321.
Haertel, E. H. (1990). Continuous and discrete latent structure models of item response data. Psychometrika, 55, 477–494.
Hartz, S.M. (2002). A Bayesian framework for the unified model for assessing cognitive abilities: Blending theory with practicality. Unpublished doctoral dissertation, University of Illinois at Urbana–Champaign, Urbana, IL.
Henson, R. A., & Templin, J. L. (2004). Modifications of the Arpeggio algorithm to permit analysis of NAEP. Unpublished ETS project report, Princeton, NJ.
Henson, R., Templin, J., & Douglas, J. (2007). Use of subscores for estimation of skill masteries. Journal of Educational Measurement, 44, 361–376.
Henson, R., Templin, J., & Willse, J. (2008). Defining a family of cognitive diagnosis models using log-linear models with latent variables. Psychometrika, 74 (2), 191–210.
Jang, E.E. (2005). A validity narrative: Effects of reading skills diagnosis on teaching and learning in the context of NG-TOEFL. Unpublished doctoral dissertation, University of Illinois at Urbana–Champaign, Urbana, IL.
Junker, B., & Sijtsma, K. (2001). Cognitive assessment models with few assumptions, and connections with nonparametric item response theory. Applied Psychological Measurement, 25, 258–272.
Kasai, M. (1997). Application of the rule space model to the reading comprehension section of the test of English as a foreign language (TOEFL). Unpublished doctoral dissertation, University of Illinois at Urbana–Champaign, Urbana, IL.
Kline, R. B. (2005) Principles and practice of structural equation modeling. (2nd Edition) Guilford Press.
Lee, Y-W., & Sawaki, Y. (2009a). Application of three cognitive diagnosis models to ESL reading and listening. Assessments: Language Assessment Quarterly, 6(3), 239–263.
4544 H. Li
Lee, Y-W., & Sawaki, Y. (2009b). Cognitive diagnosis approaches to language assessment: An overview. Assessments: Language Assessment Quarterly, 6(3), 172–189.
Leighton, J. P., Gierl, M. J., & Hunka, S. M. (2004). The attribute hierarchy model for cognitive assessment: A variation on Tatsuoka's rule-space approach. Journal of Educational Measurement, 41, 205–237.
Lord, F.M., & Novick, M.R. (1968). Statistical theories of mental test scores. Reading, MA: Addison-Wesley.
Montero, D. H., Monfils, L., Wang, J., Yen, W. M., & Julian, M. W. (2003). Investigation of the application of cognitive diagnostic testing to an end-of-course high school examination. Paper presented at the annual meeting of the National Council on Measurement in Education, Chicago, IL.
Muthén, B. O., & Muthén, L. K. (2010). Mplus 6 [Computer software]. Los Angeles, CA: Ntzoufras, I. (2009). Bayesian modeling using WinBUGS. Hoboken, NJ: John Wiley & Sons. Patz, R. J., & Junker, B.W. (1999). Applications and extensions of MCMC in IRT: Multiple
item types, missing data, and rated responses. Journal of Educational and Behavioral Statistics, 24(4), 342 –366.
Pressley, M., & Afflerbach, P. (1995). Verbal protocols of reading: The nature of constructively responsive reading. Hillsdale, NJ: Erlbaum.
Román, A. I. S. (2009). Fitting cognitive diagnostic assessment to the cognitive assessment tool for statistics (Unpublished doctoral dissertation). Purdue University, Lafayette, OH.
Roussos, L.A., DiBello, L.V., Stout, W.F., Hartz, S.M., Henson, R.A., & Templin, J.H. (2007). The fusion model skills diagnostic system. In J. Leighton & M. Gierl (Eds.), Cognitive diagnostic assessment for education: Theory and applications. New York: Cambridge University Press.
Roussos, L. A., Templin, J. L., & Henson, R. A. (2007). Skills diagnosis using IRT-based latent class models. Journal of Educational Measurement, 44 (4), 293–311.
Roussos, L., Xu, X., & Stout, W. (2003). Skills diagnosis data simulation program, version 1.1. Unpublished ETS project report: Princeton, NJ.
Rupp, A. A. & Templin, J. L. (2008). Unique characteristics of diagnostic classification models: A comprehensive review of the current state-of-the-art. Measurement: Interdisciplinary Research and Perspectives, 6(4), 219–262.
Sawaki, Y., Kim, H.J., & Gentile, C. (2009). Q-Matrix construction: Defining the kink between constructs and test items in large-scale reading and listening comprehension assessments. Language Assessment Quarterly, 6(3), 190–209.
Schrader, S. v. (2006). On the feasibility of applying skills assessment models to achievement test data (Unpublished doctoral dissertation). University of Iowa, Iowa city, IA.
Scott, H. S. (1998). Cognitive diagnostic perspectives of a second language reading test. Unpublished doctoral dissertation, University of Illinois at Urbana-Champaign, Urbana, IL.
Sheehan, K. (1997). A tree-based approach to proficiency scaling and diagnostic assessment. Journal of Educational Measurement, 34(4), 333–352.
Sinharay, S. (2004). Experiences with Markov Chain Monte Carlo convergence assessment in two psychometric examples. Journal of Educational and Behavioral Statistics, 29, 461–488.
45A Cognitive Diagnostic Analysis of the MELAB Reading Test
Stanovich, K.E. (1980). Toward an interactive compensatory model of individual differences in the development of reading proficiency. Reading Research Quarterly, 16(1), 32–71.
Tatsuoka, K.K. (1983). Rule-space: An approach for dealing with misconceptions based on item response theory. Journal of Educational Measurement, 20, 345–354.
Templin, J. L. (2005). Generalized linear mixed proficiency models for cognitive diagnosis. Unpublished doctoral dissertation, University of Illinois at Urbana-Champaign, Urbana, IL.
Templin, J. L., & Henson, R. A. (2006). Measurement of psychological disorders using cognitive diagnosis models. Psychological Methods, 11, 287–305.
Templin, J. L., Henson, R. A., & Douglas, J. (2006). General theory and estimation of cognitive diagnosis models: Using Mplus to derive model estimates. Unpublished manuscript.
von Davier, M. (2005). A general diagnostic model applied to language testing data (Research Report No. RR-05-16). Princeton, NJ: Educational Testing Service.
von Davier, M. (2006). Multidimensional latent trait modelling (MDLTM) [Software program]. Princeton, NJ: Educational Testing Service.
Wang, C., & Gierl, M. J. (2007). Investigating the cognitive attributes underlying student performance on the SAT® critical reading subtest: An application of the Attribute Hierarchy Method. Paper presented at the 2007 annual meeting of the National Council on Measurement in Education.
Yan, D., Almond, R. G., & Mislevy, R. J. (2004). Comparisons of cognitive diagnostic models (Research Report, RR-04-02), Princeton, NJ: Educational Testing Service.
Zappe, S. (2007). Response process validation of equivalent test forms: How qualitative data can support the construct validity of multiple test forms. Unpublished doctoral dissertation, Pennsylvania State University, State College, PA.

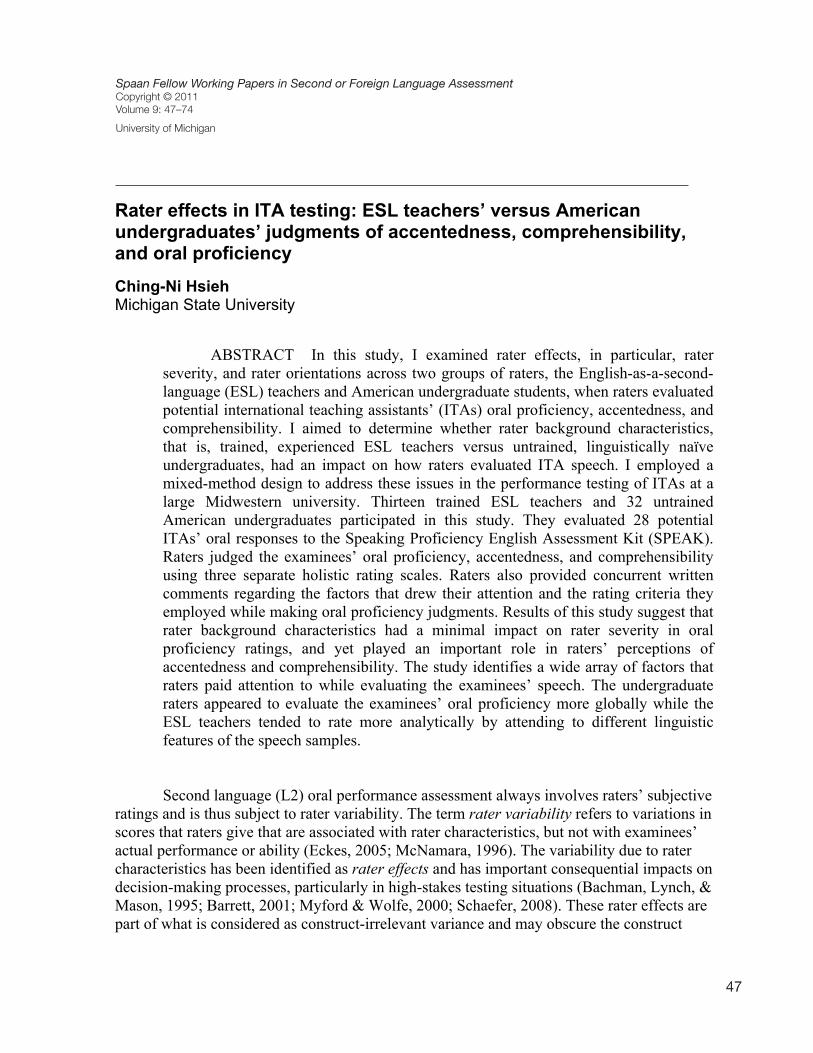
Spaan Fellow Working Papers in Second or Foreign Language AssessmentCopyright © 2011Volume 9: 47–74
University of Michigan
47
Rater effects in ITA testing: ESL teachers’ versus American undergraduates’ judgments of accentedness, comprehensibility, and oral proficiency
Ching-Ni Hsieh Michigan State University
ABSTRACT In this study, I examined rater effects, in particular, rater
severity, and rater orientations across two groups of raters, the English-as-a-second-language (ESL) teachers and American undergraduate students, when raters evaluated potential international teaching assistants’ (ITAs) oral proficiency, accentedness, and comprehensibility. I aimed to determine whether rater background characteristics, that is, trained, experienced ESL teachers versus untrained, linguistically naïve undergraduates, had an impact on how raters evaluated ITA speech. I employed a mixed-method design to address these issues in the performance testing of ITAs at a large Midwestern university. Thirteen trained ESL teachers and 32 untrained American undergraduates participated in this study. They evaluated 28 potential ITAs’ oral responses to the Speaking Proficiency English Assessment Kit (SPEAK). Raters judged the examinees’ oral proficiency, accentedness, and comprehensibility using three separate holistic rating scales. Raters also provided concurrent written comments regarding the factors that drew their attention and the rating criteria they employed while making oral proficiency judgments. Results of this study suggest that rater background characteristics had a minimal impact on rater severity in oral proficiency ratings, and yet played an important role in raters’ perceptions of accentedness and comprehensibility. The study identifies a wide array of factors that raters paid attention to while evaluating the examinees’ speech. The undergraduate raters appeared to evaluate the examinees’ oral proficiency more globally while the ESL teachers tended to rate more analytically by attending to different linguistic features of the speech samples.
Second language (L2) oral performance assessment always involves raters’ subjective ratings and is thus subject to rater variability. The term rater variability refers to variations in scores that raters give that are associated with rater characteristics, but not with examinees’ actual performance or ability (Eckes, 2005; McNamara, 1996). The variability due to rater characteristics has been identified as rater effects and has important consequential impacts on decision-making processes, particularly in high-stakes testing situations (Bachman, Lynch, & Mason, 1995; Barrett, 2001; Myford & Wolfe, 2000; Schaefer, 2008). These rater effects are part of what is considered as construct-irrelevant variance and may obscure the construct
4948 C. Hsieh
(Bailey, 1984; Bryd & Constantinides, 1992; Hoekje & Linnell, 1994; Hoekje & Williams, 1992; Rounds, 1987; Tyler, 1992; Williams, 1992). Following Bailey’s seminal work on the communicative problems of foreign TAs in the early 1980s (Bailey, 1983, 1984), a wide range of ITA speech features and their impact on native listeners’ or undergraduates’ comprehensibility have been explored (e.g., Anderson-Hsieh & Koehler, 1988; Hinofotis & Bailey, 1981; Pickering, 2004; Williams, 1992). These studies suggested factors such as speech rate (Munro & Derwing, 1998), discourse-level language use (Davies, Tyler, & Koran, 1989; Pica, Barnes, & Finger, 1990; Tyler, 1992), intonation and tone (Kang, 2008, 2010; Pickering, 2001, 2004), accent familiarity (Gass & Varonis, 1984; Rubin, 1992; Rubin & Smith, 1990), and personal emotions (Yook & Albert, 1999) are all attributable to comprehension difficulties in different ways. In addition, Douglas and Smith (1997), Hoekje and Williams (1992), and Hoekje and Linnell (1994) have investigated the communicative competence of ITAs and its theoretical implication for ITA assessment. Briggs (1994), Ginther (2004), Plakans and Abraham (1990), and Saif (2002) researched different assessment methods to screen ITAs. Others examined measurement issues pertaining to the oral proficiency test instruments used for ITAs selections (Douglas & Smith, 1997; Hoekje & Linnell, 1994; Plough, Briggs, & Van Bonn, 2010).
While research on issues related to ITAs has established that the English language proficiency of ITAs and ITAs’ foreign accented speech may affect undergraduate students’ comprehension, very few studies thus far have examined the issues of rater variability and rater orientations within an ITA testing situation (e.g., Meiron, 1998; Myford & Wolfe, 2000). The scarcity of research in the area of rater effects and rater orientations in ITA testing signals a gap in the ITA and language testing literature. Given the increasing number of ITAs at U.S. universities, research into rater effects and rater orientations in ITA testing is critical and needed because decisions made by raters who evaluate ITAs’ oral performance has important bearings on the quality of U.S. undergraduate education.
The main purpose of this study was to examine rater variability associated with the characteristics of two groups of raters, English-as-a-second-language (ESL) teachers and American undergraduates, on their ratings of potential ITAs’ oral performances. The second purpose of the study was to explore the factors that drew raters’ attention while raters judged ITAs’ performances on speaking tasks. Since ITAs’ communication problems, as indicated in the bulk of the ITA literature (e.g.,Bailey, 1984; Hoekje & Linnell, 1994; Hoekje & Williams, 1992; Rubin, 1992; Rubin & Smith, 1990), are often associated with not only ITAs’ oral proficiency, but also their pronunciation problems, particularly their foreign accent, the study examined rater variability between the two groups of raters in terms of examinees’ oral proficiency, degree of foreign accent (accentedness), and perceived comprehensibility.
In this study, oral proficiency is operationalized as an examinee’s global communicative competence to function at an instructional setting at U.S. higher educational institutions (Douglas & Smith, 1997). The construct definition of accentedness follows Munro and Derwing’s work on L2 speech perception and production (Derwing & Munro, 2009; Munro & Derwing, 1995). Accentedness is defined as how closely the pronunciation of an utterance approaches that of the native speaker norm and comprehensibility is defined as the listeners’ estimation of how easy or difficult it is to understand a given speaker (Derwing & Munro, 1997; Munro & Derwing, 1995).
being measured (Congdon & McQueen, 2000). These effects, therefore, call into question the validity and fairness of performance assessments (Kunnan, 2000; Messick, 1989).
Rater effects exhibit in many different forms. One of the most prevalent rater effects in performance assessment is rater severity. This effect occurs when raters provide ratings that are consistently either too harsh or too lenient as compared to other raters (Lumley & McNamara, 1995; McNamara, 1996). In addition to rater severity, raters may differ in the way they apply the rating criteria or vary in the degree to which they weigh specific linguistic or nonlinguistic features of the performance and thus derive different ratings for the same performance or derive the same ratings for different reasons (Brown, Iwashita, & McNamara, 2005; Orr, 2002). Rater background variables, such as raters’ occupations (Brown, 1995; Chalhoub-Deville, 1995; Hadden, 1991; Meiron & Schick, 2000), gender (O'Loughlin, 2007), first languages (Chalhoub-Deville, 1995; Johnson & Lim, 2009; Kim, 2009; Xi & Mollaun, 2009) and rating experience (Cumming, 1990; Weigle, 1994, 1999) may also influence how raters determine their ratings.
Since many important decisions are made based on raters’ judgments of test takers’ test performances in high-stakes test situations, research studies concerning how to minimize measurement errors resulting from rater effects are crucial. To this end, studies that examine the sources of rater effects and explore rater orientations (i.e. factors that draw raters’ attention while they are rating) are most relevant. Results of such research can inform our understanding of the exact nature of rater variability and help us tackle practical problems regarding rater training. An examination of the relevant literature indicates that research on rater effects and rater orientations has predominantly focused on L2 writing assessment (e.g., Cumming, 1990; Cumming, Kantor, & Powers, 2002; Eckes, 2005; Lumley, 2002, 2005; Milanovic, Saville, & Shuhong, 1996; Schaefer, 2008; Weigle, 1994, 1998, 1999). There are as of yet relatively few studies that have investigated the effects of rater variability in ratings and how raters make their rating decisions in L2 speaking assessment, despite a growing interest in general in how different rater effects influence the quality of ratings and what raters actually do (Brown, 2007; Brown & Hill, 2007; Chalhoub-Deville, 1995; McNamara & Lumley, 1997).
While high-stakes language tests, such as the TOEFL® (Test of English as a Foreign LanguageTM) iBT (Internet-based test) (Xi & Mollaun, 2009) or the International English Language Testing System (IELTS) (Brown, 2007; Brown & Hill, 2007), have been the focus of many investigations on rater effects, published research on rater effects and rater orientations in L2 oral performance assessment has paid little attention to one particular high-stakes testing situation, the English language tests for those who hope to become international teaching assistants (ITAs) at higher educational institutions in North America. This testing situation, henceforth referred to as ITA testing, should also be considered when examining rater effects involved in the rating process because the screening of an increasing number of ITAs present at U.S. universities has considerable impact on a wide range of stakeholders, including the test takers themselves, the universities that employ the ITAs, and the ITAs’ students.
The growing percentage of ITAs at U.S. universities has raised serious nationwide concerns with the English proficiency of the ITAs and how their proficiency impacts the quality of undergraduate education (Bailey, 1983, 1984; Chiang, 2009; Muthuswamy, Smith, & Strom, 2004; Plakans, 1997; Tyler, 1992). A number of applied linguists have devoted substantial research effort to address the concerns about the English oral proficiency of ITAs
49Rater effects in ITA testing: ESL teachers’ versus American undergraduates’ judgments of accentedness, comprehensibility, and oral proficiency
(Bailey, 1984; Bryd & Constantinides, 1992; Hoekje & Linnell, 1994; Hoekje & Williams, 1992; Rounds, 1987; Tyler, 1992; Williams, 1992). Following Bailey’s seminal work on the communicative problems of foreign TAs in the early 1980s (Bailey, 1983, 1984), a wide range of ITA speech features and their impact on native listeners’ or undergraduates’ comprehensibility have been explored (e.g., Anderson-Hsieh & Koehler, 1988; Hinofotis & Bailey, 1981; Pickering, 2004; Williams, 1992). These studies suggested factors such as speech rate (Munro & Derwing, 1998), discourse-level language use (Davies, Tyler, & Koran, 1989; Pica, Barnes, & Finger, 1990; Tyler, 1992), intonation and tone (Kang, 2008, 2010; Pickering, 2001, 2004), accent familiarity (Gass & Varonis, 1984; Rubin, 1992; Rubin & Smith, 1990), and personal emotions (Yook & Albert, 1999) are all attributable to comprehension difficulties in different ways. In addition, Douglas and Smith (1997), Hoekje and Williams (1992), and Hoekje and Linnell (1994) have investigated the communicative competence of ITAs and its theoretical implication for ITA assessment. Briggs (1994), Ginther (2004), Plakans and Abraham (1990), and Saif (2002) researched different assessment methods to screen ITAs. Others examined measurement issues pertaining to the oral proficiency test instruments used for ITAs selections (Douglas & Smith, 1997; Hoekje & Linnell, 1994; Plough, Briggs, & Van Bonn, 2010).
While research on issues related to ITAs has established that the English language proficiency of ITAs and ITAs’ foreign accented speech may affect undergraduate students’ comprehension, very few studies thus far have examined the issues of rater variability and rater orientations within an ITA testing situation (e.g., Meiron, 1998; Myford & Wolfe, 2000). The scarcity of research in the area of rater effects and rater orientations in ITA testing signals a gap in the ITA and language testing literature. Given the increasing number of ITAs at U.S. universities, research into rater effects and rater orientations in ITA testing is critical and needed because decisions made by raters who evaluate ITAs’ oral performance has important bearings on the quality of U.S. undergraduate education.
The main purpose of this study was to examine rater variability associated with the characteristics of two groups of raters, English-as-a-second-language (ESL) teachers and American undergraduates, on their ratings of potential ITAs’ oral performances. The second purpose of the study was to explore the factors that drew raters’ attention while raters judged ITAs’ performances on speaking tasks. Since ITAs’ communication problems, as indicated in the bulk of the ITA literature (e.g.,Bailey, 1984; Hoekje & Linnell, 1994; Hoekje & Williams, 1992; Rubin, 1992; Rubin & Smith, 1990), are often associated with not only ITAs’ oral proficiency, but also their pronunciation problems, particularly their foreign accent, the study examined rater variability between the two groups of raters in terms of examinees’ oral proficiency, degree of foreign accent (accentedness), and perceived comprehensibility.
In this study, oral proficiency is operationalized as an examinee’s global communicative competence to function at an instructional setting at U.S. higher educational institutions (Douglas & Smith, 1997). The construct definition of accentedness follows Munro and Derwing’s work on L2 speech perception and production (Derwing & Munro, 2009; Munro & Derwing, 1995). Accentedness is defined as how closely the pronunciation of an utterance approaches that of the native speaker norm and comprehensibility is defined as the listeners’ estimation of how easy or difficult it is to understand a given speaker (Derwing & Munro, 1997; Munro & Derwing, 1995).
5150 C. Hsieh
Raters Two rater groups participated in this study. The first rater group included 13 ESL
teachers who were trained, experienced SPEAK raters. All the ESL teachers had extensive experience in rating speaking tests (e.g., SPEAK, placement tests, classroom-based achievement tests). There were 5 males and 8 females. Their ages ranged from 29 to 56 years (M = 39.9, SD = 9.1). The teacher raters all had academic backgrounds in language education or linguistics and experience teaching ESL at a level similar to the test examinees in the present study. Their years of ESL teaching experience ranged from 6 to 22 years (M = 12.5, SD = 6.1). The mean length of their SPEAK rating experience was 4.5 years (SD = 5.5). The teacher raters reported a variety of nonnative accents they were familiar with. The most commonly mentioned accents included Arabic, Chinese, Korean, Japanese, and Spanish.
The second rater group included 32 American undergraduate students. The undergraduate raters were all native speakers of English and from a wide range of academic programs. There were 9 males and 23 females. Their ages ranged from 18 to 22 years (M = 20.1, SD = 1.2). The undergraduate raters all had experience taking courses taught by ITAs. The number of courses they had taken by ITAs ranged from 1 to 6 (M = 2.9, SD = 1.6). None of the undergraduates reported having rated nonnative English speakers’ speech. All the undergraduates reported having ITAs whose first languages were either Chinese or Korean. Few reported having Arabic, Japanese, Hindi, or Spanish ITAs. Twelve undergraduates reported having no foreign friend and no foreign-accent familiarity. Twenty undergraduates reported having a few foreign friends (mostly Arabic, Chinese, Korean, and Hindi speakers) and had limited exposure to foreign accents.
Procedure
Prior to rating, raters were first instructed about the purpose of the research project, the construct definitions of oral proficiency, accentedness, and comprehensibility, and the three rating scales employed. Then raters completed a background questionnaire that contained questions about their demographic information. Since the ESL teachers were all trained, experienced raters, no rater training or norming session was undertaken. The undergraduate raters were engaged in a minimal, one-on-one training, which consisted of acquainting the raters with the rating tasks and the rating scales. The training was minimized in order to capture the undergraduate raters’ rating behaviors and to reflect their impressionistic judgments of foreign TAs’ oral performances.
Raters evaluated the examinee performances online individually. They listened to each response and assigned ratings on oral proficiency, accentedness, and comprehensibility, respectively. Immediately after the raters made their rating judgments, they provided the factors or speech features that drew their attention or the rating criteria they employed to make their oral proficiency rating decisions. Raters were allowed to skip the entering of written comments for any particular recording if they chose to. Once they completed the written comments (or chose to skip it), they then moved on to the next recording. The entire ratings took between four and six hours.
Data Analysis A combination of quantitative and qualitative approaches to data analysis was used. To answer the first research question dealing with rater severity across rater groups, the rating data were analyzed using (a) descriptive statistics and (b) the many-facet Rasch measurement
The research questions guiding this study are: 1. Do ESL teachers and American undergraduate students differ in severity with
which they evaluate potential ITAs’ oral proficiency, accentedness, and comprehensibility, respectively, and if so, to what extent?
2. What factors draw raters’ attention while the raters evaluate potential ITAs’ oral proficiency? Are different factors more or less salient to different rater groups?
Methodology
Test Examinees
The test examinees were 28 international graduate students who were seeking an ITA opportunity at a large Midwestern university. They were 10 Chinese, 10 Korean, and 8 Arabic native speakers; 19 were males and 9 were females. The examinees’ academic backgrounds varied from engineering, mathematics, to humanities.
Rating Materials
The rating materials consisted of each test examinee’s responses to an English oral proficiency test, the Speaking Proficiency English Assessment Kit (SPEAK), during operational SPEAK test administrations. The SPEAK test is a semidirect oral proficiency test and used as the ITA screening tool at the university where the study took place. The examinees’ actual SPEAK scores ranged from 40 to 55, with five-point increments. (The cut score for a qualified ITA was 50.)
The SPEAK test comprises twelve tasks, each of which is designed to elicit a particular speech act from the examinees. In order to reduce raters’ workload in terms of the number of tasks to be rated for the study, three tasks were chosen for rating. These tasks included a picture description task, a topic discussion task, and a presentation on a revised schedule task. The entire response time of these three tasks was approximately four minutes. There were a total of 84 responses (28 responses on each of the three tasks) for evaluation. These speech samples were saved on an online rating system for rater evaluations. All raters rated all 84 samples.
Rating Scales
Raters judged the examinee performances using three sets of rating scales. The first one was the official, 5-point holistic SPEAK rating scale. This scale was used to assess examinees’ oral proficiency. Raters utilized this scale, ranging from 20 to 60 (20 = no effective communication; no evidence of ability to perform task; 60 = communication almost always effective; task performed very competently), with a 10-point increment. The ratings indicate raters’ evaluations of an examinee’s overall task performance with respect to each task. The second and third rating scales were both a 9-point holistic scale, following Munro and Derwing (1995). These two scales were used for the ratings of accentedness (1 = no accent; 9 = heavily accented) and comprehensibility (1 = very easy to understand; 9 extremely difficult or impossible to understand), respectively.
51Rater effects in ITA testing: ESL teachers’ versus American undergraduates’ judgments of accentedness, comprehensibility, and oral proficiency
Raters Two rater groups participated in this study. The first rater group included 13 ESL
teachers who were trained, experienced SPEAK raters. All the ESL teachers had extensive experience in rating speaking tests (e.g., SPEAK, placement tests, classroom-based achievement tests). There were 5 males and 8 females. Their ages ranged from 29 to 56 years (M = 39.9, SD = 9.1). The teacher raters all had academic backgrounds in language education or linguistics and experience teaching ESL at a level similar to the test examinees in the present study. Their years of ESL teaching experience ranged from 6 to 22 years (M = 12.5, SD = 6.1). The mean length of their SPEAK rating experience was 4.5 years (SD = 5.5). The teacher raters reported a variety of nonnative accents they were familiar with. The most commonly mentioned accents included Arabic, Chinese, Korean, Japanese, and Spanish.
The second rater group included 32 American undergraduate students. The undergraduate raters were all native speakers of English and from a wide range of academic programs. There were 9 males and 23 females. Their ages ranged from 18 to 22 years (M = 20.1, SD = 1.2). The undergraduate raters all had experience taking courses taught by ITAs. The number of courses they had taken by ITAs ranged from 1 to 6 (M = 2.9, SD = 1.6). None of the undergraduates reported having rated nonnative English speakers’ speech. All the undergraduates reported having ITAs whose first languages were either Chinese or Korean. Few reported having Arabic, Japanese, Hindi, or Spanish ITAs. Twelve undergraduates reported having no foreign friend and no foreign-accent familiarity. Twenty undergraduates reported having a few foreign friends (mostly Arabic, Chinese, Korean, and Hindi speakers) and had limited exposure to foreign accents.
Procedure
Prior to rating, raters were first instructed about the purpose of the research project, the construct definitions of oral proficiency, accentedness, and comprehensibility, and the three rating scales employed. Then raters completed a background questionnaire that contained questions about their demographic information. Since the ESL teachers were all trained, experienced raters, no rater training or norming session was undertaken. The undergraduate raters were engaged in a minimal, one-on-one training, which consisted of acquainting the raters with the rating tasks and the rating scales. The training was minimized in order to capture the undergraduate raters’ rating behaviors and to reflect their impressionistic judgments of foreign TAs’ oral performances.
Raters evaluated the examinee performances online individually. They listened to each response and assigned ratings on oral proficiency, accentedness, and comprehensibility, respectively. Immediately after the raters made their rating judgments, they provided the factors or speech features that drew their attention or the rating criteria they employed to make their oral proficiency rating decisions. Raters were allowed to skip the entering of written comments for any particular recording if they chose to. Once they completed the written comments (or chose to skip it), they then moved on to the next recording. The entire ratings took between four and six hours.
Data Analysis A combination of quantitative and qualitative approaches to data analysis was used. To answer the first research question dealing with rater severity across rater groups, the rating data were analyzed using (a) descriptive statistics and (b) the many-facet Rasch measurement
5352 C. Hsieh
to the main category of linguistic resources could be further coded to the subcategory of grammar or vocabulary. When tallying the frequency of codes within each main category and subcategory, each code was counted once for the main category and the subcategory. The entire dataset was hence coded into a total of 4,308 coding decisions at the main category level, with 1,650 (38.3%) from the ESL teachers’ original comments, and 2,658 (61.7%) from the undergraduates’ comments. To check the reliability of the coding, a second coder and myself coded 10% of the data. Intercoder percentage agreement achieved was 79.7%. Percentage agreement within each category varied, with the highest agreement achieved among the phonological and fluency features and lowest among the global assessment of the speech features. I discussed with the second order the difficult cases one by one. Once a 100% agreement was achieved, I coded the entire data set. Table 2. Coding Scheme
Results
Rater Reliability and Descriptive Statistics Interrater reliability was calculated at the group level for the three measures
separately, using Cronbach’s Alpha. For oral proficiency, the interrater reliability was computed at 0.96 for the whole rater group, 0.88 for the ESL teachers, and 0.95 for the undergraduates. For accentedness, the interrater reliability was computed at 0.97 for the whole rater group, 0.92 for the ESL teachers, and 0.95 for the undergraduates. For comprehensibility, the interrater reliability was computed at 0.96 for the whole rater group,
Main categories Subcategories Linguistic resources Grammar
Vocabulary Expressions Textualization
Phonology Pronunciation Intonation Rhythm and stress Accent
Fluency Pauses Repetition and repair Speech rate Global fluency
Content Task fulfillment Ideas Organization
Global assessment No subcategory Nonlinguistic factors No subcategory
(MFRM) analysis, using the computer program FACETS (Version 3.67) (Linacre, 2010). The MRFM model implemented in this study included four facets: examinees, raters, tasks, and rater status (ESL teachers versus undergraduate raters). The FACETS analyses for the three measures, oral proficiency, accentedness, and comprehensibility, were carried out separately. The Rasch model is a prescriptive statistical method and requires the data to fit the Rasch model well. If the data fit the model, then the dataset as a whole supports a unidimensional measurement and captures one latent variable (Linacre, 1989). To estimate the overall data-model fit for each of the FACETS runs, the unexpected responses given the model assumptions were investigated. Linacre (2010) suggests that satisfactory model fit is achieved when about 5% or less of the absolute standardized residuals are equal or greater than 2, and about 1% or less are equal or greater than 3.
There were a total of 3,780 valid responses in each of the three measures. The percentage of responses associated with absolute standardized residuals equal or greater than 2 and equal or greater than 3 were calculated to assess data-model fit. Table 1 details the estimates. The examination of the standardized residuals indicated a satisfactory model fit for the three separate measures.
Table 1. Global Model Fit StdRes ≥ |2| StdRes ≥ |3| Oral proficiency 0.9% 4.7% Accentedness 1.1% 4.2% Comprehensibility 0.9% 4.8% To answer the second research question regarding factors that draw raters’ attention while they (the raters) make judgements on the examinees’ oral proficiency, the written comments raters provided were analyzed following procedures for qualitative data analysis suggested by Miles and Huberman (1994). The first step in the qualitative data analysis was to develop a coding scheme that would adequately describe the raters’ written comments and address the research question. The coding scheme was developed based on the criteria in the official SPEAK rating scale, several cycles of inspections of the data, and Brown et al.’s (2005) empirically developed coding scheme for rater orientations on speaking tasks. Brown et al.’s coding scheme was very instrumental for this study because it could account for the majority of the data. However, additional categories (accent and organization) were identified and added while others (amount and framing) were perceived as less relevant and removed. The coding scheme consisted of 21 codes, grouped into six main categories and 15 subcategories (see Table 2). The coding scheme allowed the interpretations of the linguistic features raters based their judgments on as well as several nonlinguistic factors raters noticed during the rating process. Each written comment was coded in terms of the main category and the subcategory, whenever relevant. Each comment was first coded as being related to one or more of the six main categories. Then the comment was further coded in terms of one or more of the subcategories within the main category if relevant. For example, a comment coded as relevant
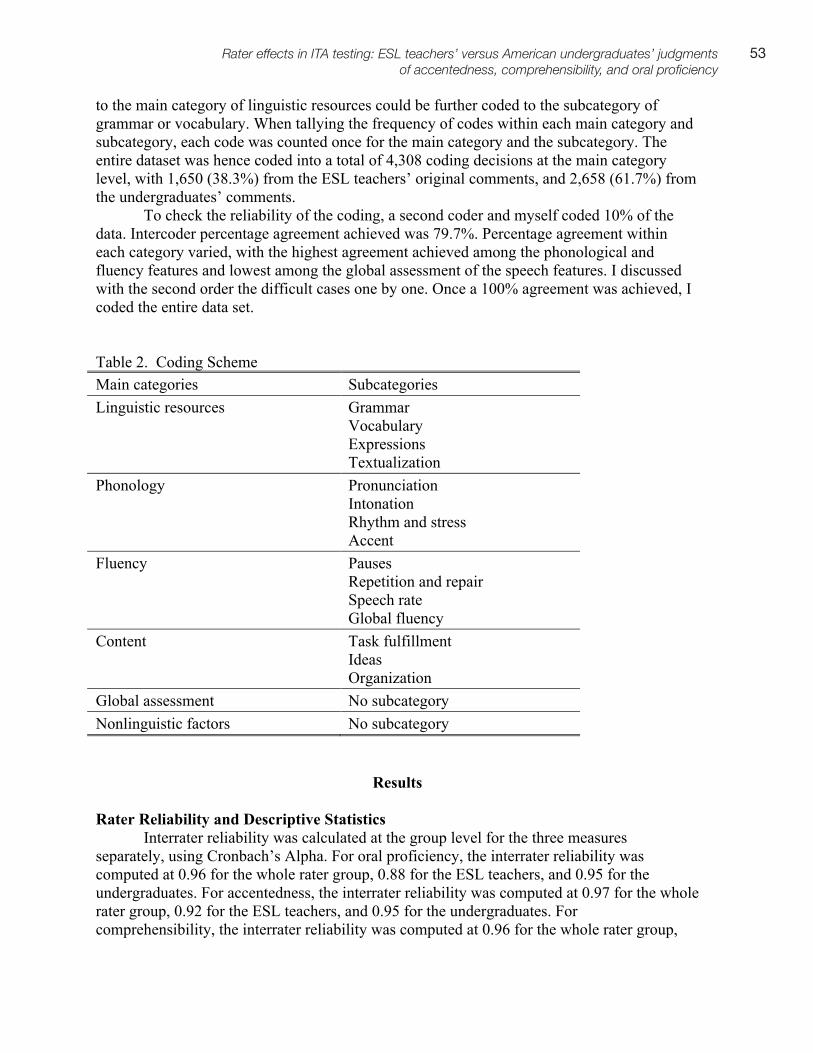
53Rater effects in ITA testing: ESL teachers’ versus American undergraduates’ judgments of accentedness, comprehensibility, and oral proficiency
to the main category of linguistic resources could be further coded to the subcategory of grammar or vocabulary. When tallying the frequency of codes within each main category and subcategory, each code was counted once for the main category and the subcategory. The entire dataset was hence coded into a total of 4,308 coding decisions at the main category level, with 1,650 (38.3%) from the ESL teachers’ original comments, and 2,658 (61.7%) from the undergraduates’ comments. To check the reliability of the coding, a second coder and myself coded 10% of the data. Intercoder percentage agreement achieved was 79.7%. Percentage agreement within each category varied, with the highest agreement achieved among the phonological and fluency features and lowest among the global assessment of the speech features. I discussed with the second order the difficult cases one by one. Once a 100% agreement was achieved, I coded the entire data set. Table 2. Coding Scheme
Results
Rater Reliability and Descriptive Statistics Interrater reliability was calculated at the group level for the three measures
separately, using Cronbach’s Alpha. For oral proficiency, the interrater reliability was computed at 0.96 for the whole rater group, 0.88 for the ESL teachers, and 0.95 for the undergraduates. For accentedness, the interrater reliability was computed at 0.97 for the whole rater group, 0.92 for the ESL teachers, and 0.95 for the undergraduates. For comprehensibility, the interrater reliability was computed at 0.96 for the whole rater group,
Main categories Subcategories Linguistic resources Grammar
Vocabulary Expressions Textualization
Phonology Pronunciation Intonation Rhythm and stress Accent
Fluency Pauses Repetition and repair Speech rate Global fluency
Content Task fulfillment Ideas Organization
Global assessment No subcategory Nonlinguistic factors No subcategory
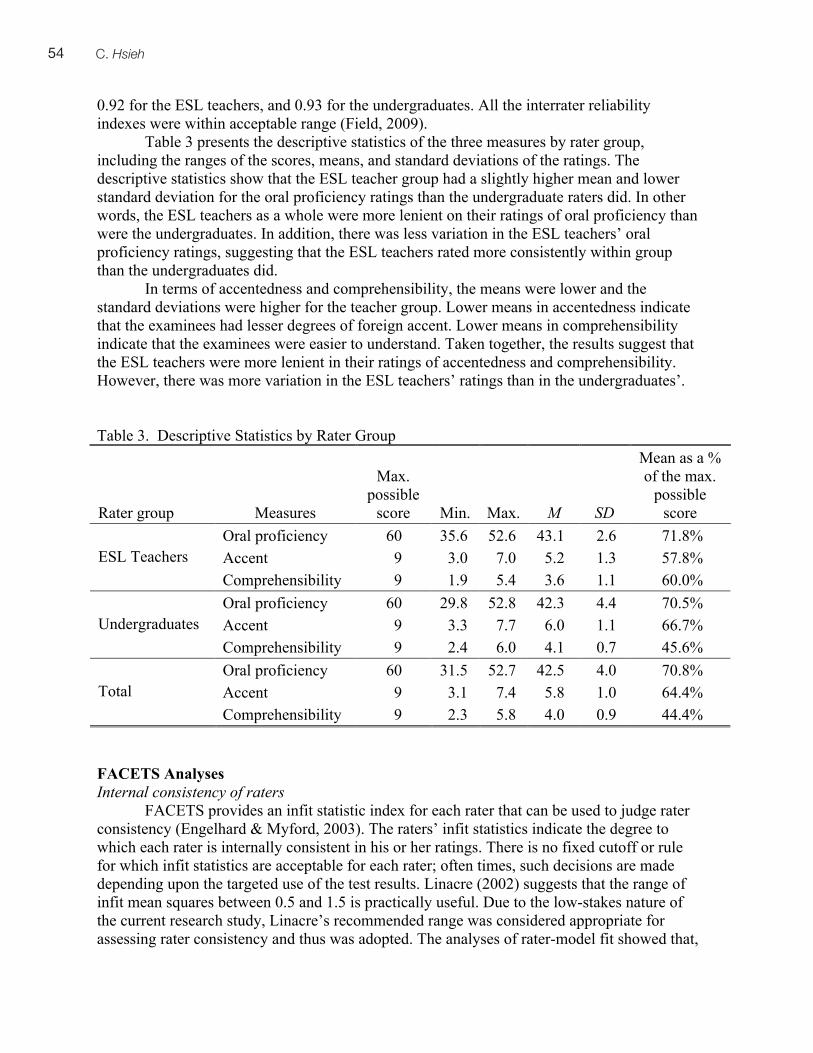
5554 C. Hsieh
for the most part, raters were internationally consistent (over 73% of the raters were consistent in each of the three measures).
For the purpose of this study, all the 45 raters were included in the FACETS analyses, regardless of rater fit. Generally, in validation studies, misfitting raters are omitted one by one from the analysis in order to improve the overall model fit (Engelhard & Myford, 2003; Linacre, 1989). The reason for the inclusion of all the raters was because the main purpose of this study was to compare the rating differences between the two rater groups rather than to pinpoint inconsistent raters. Additionally, the undergraduate raters were not systematically trained and thus unpredictable ratings were expected at the outset of the study. Since the paramount Rasch model assumption of unidimensional measurement has been checked and met, I considered that there was no need to eliminate any misfitting rater from the analyses, although the FACETS results should be interpreted with caution.
Comparison of Rater Groups.
To answer the first research question regarding the differences in the levels of severity the ESL teachers and the American undergraduate raters exercised when they evaluated the potential ITA’s oral proficiency, accentedness, and comprehensibility, the average severity estimates of the rater groups in each of the three measures were compared separately.
Table 4 shows the results of whether the ESL teachers tended to rate any more severely or leniently on average than the undergraduate raters when they evaluated the examinees’ oral proficiency. The fixed (all same) chi-square tests the null hypothesis that the rater groups can be thought of as equally lenient after allowing for measurement errors. Results of the chi-square test indicate that the rater groups did not differ in the average levels of severity they exercised when evaluating the examinees’ oral proficiency, χ2 = (1, N = 2) = 3.2, p = 0.07.
Table 5 shows the results of whether the ESL teachers tended to rate any more severely or leniently on average than the undergraduate raters when they evaluated the examinees’ accentedness. Results of the fixed (all-same) chi-square test indicate that the rater groups differed significantly in the average levels of severity they exercised when evaluating the examinees’ accentedness, χ2 = (1, N = 2) = 67.6, p = 0.00. The results suggest that the undergraduate raters as a whole tended to rate more harshly on accentedness than the ESL teachers did.
Table 6 shows whether the ESL teachers tended to rate any more severely or leniently on average than the undergraduate raters when they evaluated the examinees’ comprehensibility. Results of the fixed (all-same) chi-square test indicate that the rater groups differed significantly in the average levels of severity they exercised when evaluating the examinees’ comprehensibility, χ2 = (1, N = 2) = 75.4, p = 0.00. The results suggest that the undergraduate raters as a whole tended to rate more harshly on comprehensibility than the ESL teachers did.
0.92 for the ESL teachers, and 0.93 for the undergraduates. All the interrater reliability indexes were within acceptable range (Field, 2009).
Table 3 presents the descriptive statistics of the three measures by rater group, including the ranges of the scores, means, and standard deviations of the ratings. The descriptive statistics show that the ESL teacher group had a slightly higher mean and lower standard deviation for the oral proficiency ratings than the undergraduate raters did. In other words, the ESL teachers as a whole were more lenient on their ratings of oral proficiency than were the undergraduates. In addition, there was less variation in the ESL teachers’ oral proficiency ratings, suggesting that the ESL teachers rated more consistently within group than the undergraduates did.
In terms of accentedness and comprehensibility, the means were lower and the standard deviations were higher for the teacher group. Lower means in accentedness indicate that the examinees had lesser degrees of foreign accent. Lower means in comprehensibility indicate that the examinees were easier to understand. Taken together, the results suggest that the ESL teachers were more lenient in their ratings of accentedness and comprehensibility. However, there was more variation in the ESL teachers’ ratings than in the undergraduates’.
Table 3. Descriptive Statistics by Rater Group
Rater group Measures
Max. possible
score Min. Max. M SD
Mean as a % of the max.
possible score
Oral proficiency 60 35.6 52.6 43.1 2.6 71.8% Accent 9 3.0 7.0 5.2 1.3 57.8% ESL Teachers Comprehensibility 9 1.9 5.4 3.6 1.1 60.0% Oral proficiency 60 29.8 52.8 42.3 4.4 70.5% Accent 9 3.3 7.7 6.0 1.1 66.7% Undergraduates Comprehensibility 9 2.4 6.0 4.1 0.7 45.6% Oral proficiency 60 31.5 52.7 42.5 4.0 70.8% Accent 9 3.1 7.4 5.8 1.0 64.4% Total Comprehensibility 9 2.3 5.8 4.0 0.9 44.4%
FACETS Analyses Internal consistency of raters
FACETS provides an infit statistic index for each rater that can be used to judge rater consistency (Engelhard & Myford, 2003). The raters’ infit statistics indicate the degree to which each rater is internally consistent in his or her ratings. There is no fixed cutoff or rule for which infit statistics are acceptable for each rater; often times, such decisions are made depending upon the targeted use of the test results. Linacre (2002) suggests that the range of infit mean squares between 0.5 and 1.5 is practically useful. Due to the low-stakes nature of the current research study, Linacre’s recommended range was considered appropriate for assessing rater consistency and thus was adopted. The analyses of rater-model fit showed that,
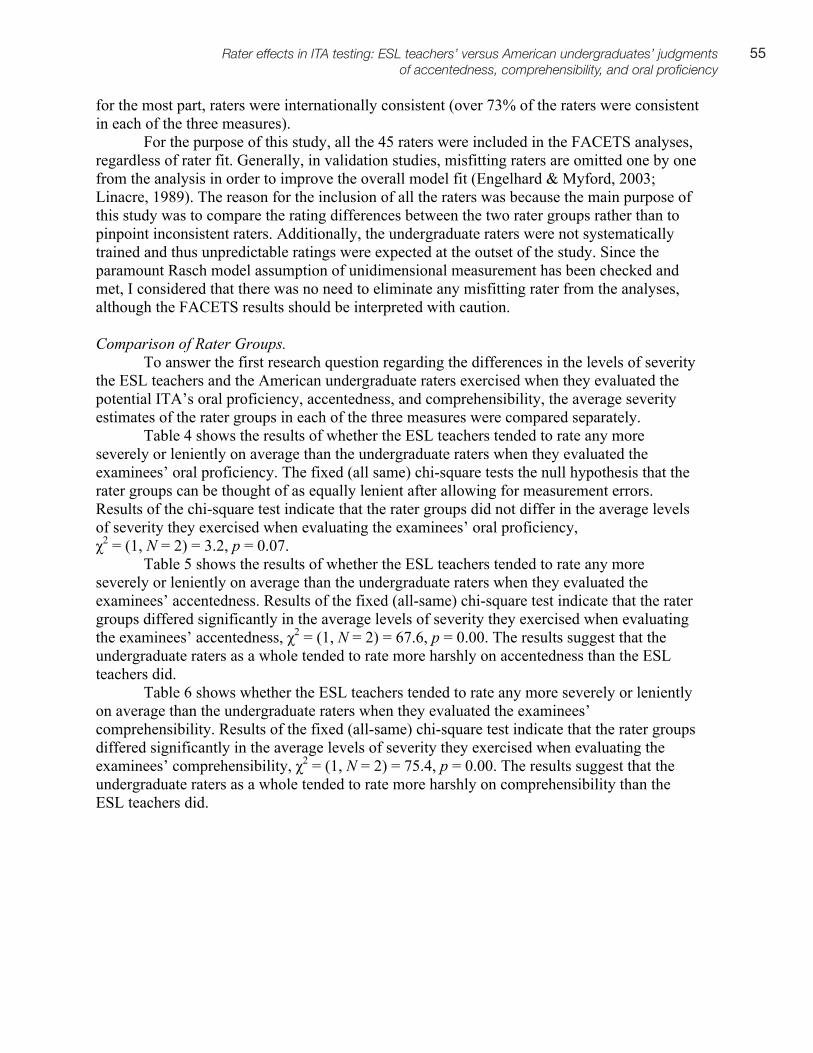
55Rater effects in ITA testing: ESL teachers’ versus American undergraduates’ judgments of accentedness, comprehensibility, and oral proficiency
for the most part, raters were internationally consistent (over 73% of the raters were consistent in each of the three measures).
For the purpose of this study, all the 45 raters were included in the FACETS analyses, regardless of rater fit. Generally, in validation studies, misfitting raters are omitted one by one from the analysis in order to improve the overall model fit (Engelhard & Myford, 2003; Linacre, 1989). The reason for the inclusion of all the raters was because the main purpose of this study was to compare the rating differences between the two rater groups rather than to pinpoint inconsistent raters. Additionally, the undergraduate raters were not systematically trained and thus unpredictable ratings were expected at the outset of the study. Since the paramount Rasch model assumption of unidimensional measurement has been checked and met, I considered that there was no need to eliminate any misfitting rater from the analyses, although the FACETS results should be interpreted with caution.
Comparison of Rater Groups.
To answer the first research question regarding the differences in the levels of severity the ESL teachers and the American undergraduate raters exercised when they evaluated the potential ITA’s oral proficiency, accentedness, and comprehensibility, the average severity estimates of the rater groups in each of the three measures were compared separately.
Table 4 shows the results of whether the ESL teachers tended to rate any more severely or leniently on average than the undergraduate raters when they evaluated the examinees’ oral proficiency. The fixed (all same) chi-square tests the null hypothesis that the rater groups can be thought of as equally lenient after allowing for measurement errors. Results of the chi-square test indicate that the rater groups did not differ in the average levels of severity they exercised when evaluating the examinees’ oral proficiency, χ2 = (1, N = 2) = 3.2, p = 0.07.
Table 5 shows the results of whether the ESL teachers tended to rate any more severely or leniently on average than the undergraduate raters when they evaluated the examinees’ accentedness. Results of the fixed (all-same) chi-square test indicate that the rater groups differed significantly in the average levels of severity they exercised when evaluating the examinees’ accentedness, χ2 = (1, N = 2) = 67.6, p = 0.00. The results suggest that the undergraduate raters as a whole tended to rate more harshly on accentedness than the ESL teachers did.
Table 6 shows whether the ESL teachers tended to rate any more severely or leniently on average than the undergraduate raters when they evaluated the examinees’ comprehensibility. Results of the fixed (all-same) chi-square test indicate that the rater groups differed significantly in the average levels of severity they exercised when evaluating the examinees’ comprehensibility, χ2 = (1, N = 2) = 75.4, p = 0.00. The results suggest that the undergraduate raters as a whole tended to rate more harshly on comprehensibility than the ESL teachers did.
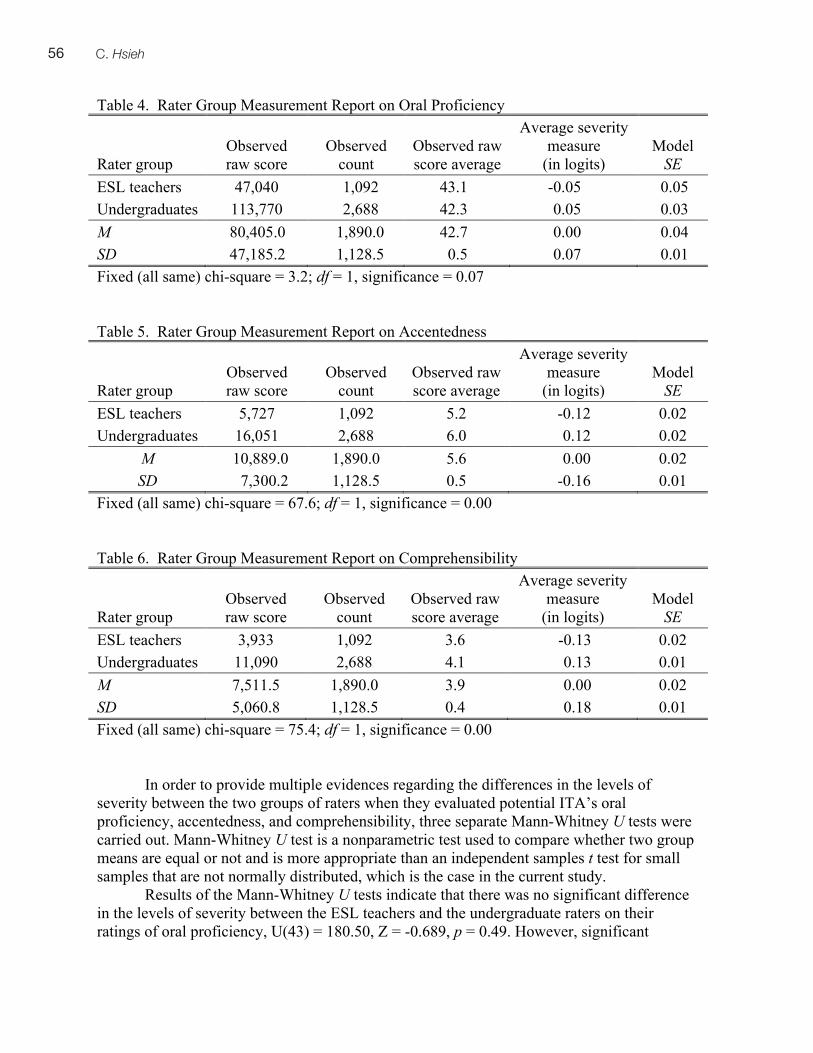
5756 C. Hsieh
differences were found in the comparisons of accentedness and comprehensibility. The undergraduate raters were significantly more severe in the ratings of accentedness than the ESL teachers, U(43)= 124.50 , Z = -2.091, p = 0.03. The undergraduates were also significantly more severe in the ratings of comprehensibility than the ESL teachers, U(43) = 125.0, Z = -2.079, p = 0.03.
To summarize, the Mann-Whitney U tests and the FACETS analyses yielded converging results, suggesting that the undergraduate raters were significantly more severe on their ratings of accentedness and comprehensibility than the ESL teachers. However, the rater groups did not differ in the levels of severity they exercised in their ratings of oral proficiency. Analyses of Written Comments To answer the second research question regarding factors that drew raters’ attention when they evaluated the examinees’ oral proficiency, the written comments were analyzed both qualitatively and quantitatively. The qualitative analysis involves content analysis (Miles & Huberman, 1994) of the written comments. (Examples of the written comments coded for each coding category is presented in the Appendix.) The quantitative analysis of the written comments includes descriptive statistics of the coded categories and the comparisons of the mean frequencies of coded categories across rater groups to determine whether the ESL teachers and the undergraduates differed in the rating criteria they employed.
Table 7 reports the raw frequency counts and Figure 1 illustrates graphically the proportion of the written comments coded for the six main categories. The ESL teachers made larger numbers of comments on phonology, linguistic resources, and fluency, and less on content and global assessment. The undergraduates made larger numbers of comments on phonology, linguistic resources, fluency, and global assessment, and less on content. Both groups made very few comments pertaining to nonlinguistic factors. Table 7. Frequency Counts of Written Comments Across Rater Groups Linguistic
resources Phonology Fluency Content Global
Assessment Nonlinguistic
factors Total ESL teachers (n = 13) 393 597 381 144 115 20 1,650
Undergraduates (n = 32) 474 806 598 210 531 39 2,658
Overall (N = 45) 867 1,403 979 354 646 59 4,308
Table 4. Rater Group Measurement Report on Oral Proficiency
Rater group Observed raw score
Observed count
Observed raw score average
Average severity measure
(in logits) Model
SE ESL teachers 47,040 1,092 43.1 -0.05 0.05 Undergraduates 113,770 2,688 42.3 0.05 0.03 M 80,405.0 1,890.0 42.7 0.00 0.04 SD 47,185.2 1,128.5 0.5 0.07 0.01 Fixed (all same) chi-square = 3.2; df = 1, significance = 0.07 Table 5. Rater Group Measurement Report on Accentedness
Rater group Observed raw score
Observed count
Observed raw score average
Average severity measure
(in logits) Model
SE ESL teachers 5,727 1,092 5.2 -0.12 0.02 Undergraduates 16,051 2,688 6.0 0.12 0.02
M 10,889.0 1,890.0 5.6 0.00 0.02 SD 7,300.2 1,128.5 0.5 -0.16 0.01
Fixed (all same) chi-square = 67.6; df = 1, significance = 0.00 Table 6. Rater Group Measurement Report on Comprehensibility
Rater group Observed raw score
Observed count
Observed raw score average
Average severity measure
(in logits) Model
SE ESL teachers 3,933 1,092 3.6 -0.13 0.02 Undergraduates 11,090 2,688 4.1 0.13 0.01 M 7,511.5 1,890.0 3.9 0.00 0.02 SD 5,060.8 1,128.5 0.4 0.18 0.01 Fixed (all same) chi-square = 75.4; df = 1, significance = 0.00
In order to provide multiple evidences regarding the differences in the levels of
severity between the two groups of raters when they evaluated potential ITA’s oral proficiency, accentedness, and comprehensibility, three separate Mann-Whitney U tests were carried out. Mann-Whitney U test is a nonparametric test used to compare whether two group means are equal or not and is more appropriate than an independent samples t test for small samples that are not normally distributed, which is the case in the current study.
Results of the Mann-Whitney U tests indicate that there was no significant difference in the levels of severity between the ESL teachers and the undergraduate raters on their ratings of oral proficiency, U(43) = 180.50, Z = -0.689, p = 0.49. However, significant
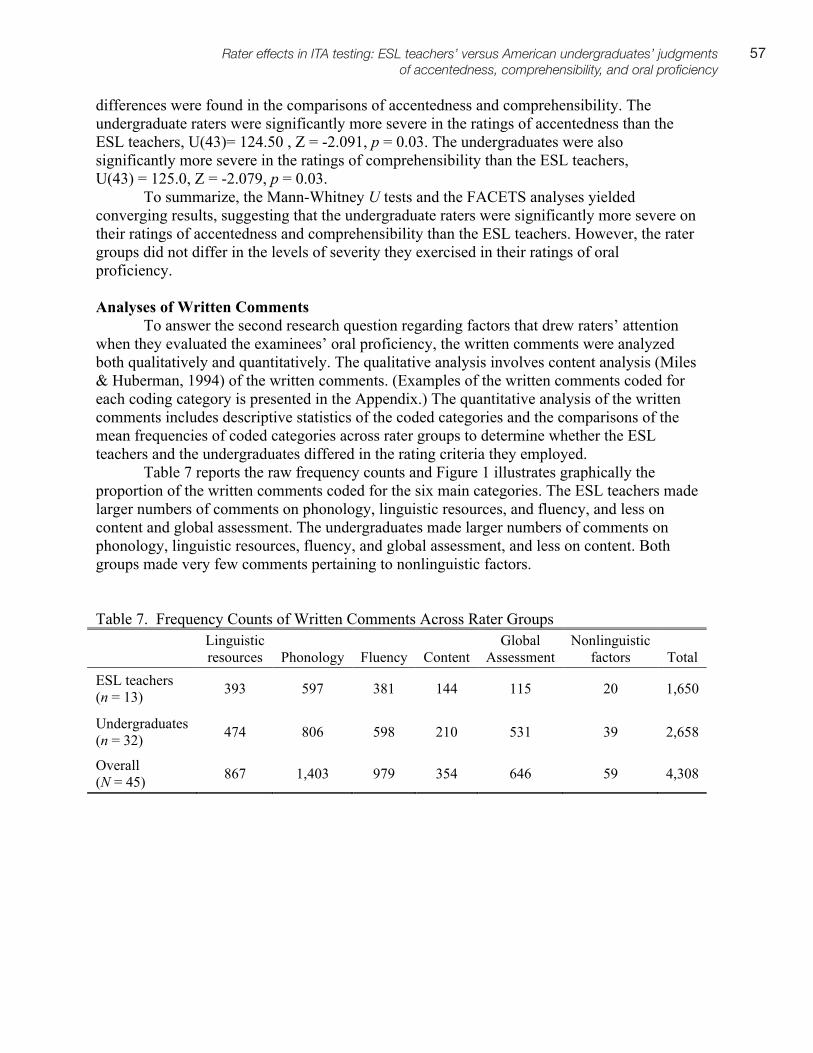
57Rater effects in ITA testing: ESL teachers’ versus American undergraduates’ judgments of accentedness, comprehensibility, and oral proficiency
differences were found in the comparisons of accentedness and comprehensibility. The undergraduate raters were significantly more severe in the ratings of accentedness than the ESL teachers, U(43)= 124.50 , Z = -2.091, p = 0.03. The undergraduates were also significantly more severe in the ratings of comprehensibility than the ESL teachers, U(43) = 125.0, Z = -2.079, p = 0.03.
To summarize, the Mann-Whitney U tests and the FACETS analyses yielded converging results, suggesting that the undergraduate raters were significantly more severe on their ratings of accentedness and comprehensibility than the ESL teachers. However, the rater groups did not differ in the levels of severity they exercised in their ratings of oral proficiency. Analyses of Written Comments To answer the second research question regarding factors that drew raters’ attention when they evaluated the examinees’ oral proficiency, the written comments were analyzed both qualitatively and quantitatively. The qualitative analysis involves content analysis (Miles & Huberman, 1994) of the written comments. (Examples of the written comments coded for each coding category is presented in the Appendix.) The quantitative analysis of the written comments includes descriptive statistics of the coded categories and the comparisons of the mean frequencies of coded categories across rater groups to determine whether the ESL teachers and the undergraduates differed in the rating criteria they employed.
Table 7 reports the raw frequency counts and Figure 1 illustrates graphically the proportion of the written comments coded for the six main categories. The ESL teachers made larger numbers of comments on phonology, linguistic resources, and fluency, and less on content and global assessment. The undergraduates made larger numbers of comments on phonology, linguistic resources, fluency, and global assessment, and less on content. Both groups made very few comments pertaining to nonlinguistic factors. Table 7. Frequency Counts of Written Comments Across Rater Groups Linguistic
resources Phonology Fluency Content Global
Assessment Nonlinguistic
factors Total ESL teachers (n = 13) 393 597 381 144 115 20 1,650
Undergraduates (n = 32) 474 806 598 210 531 39 2,658
Overall (N = 45) 867 1,403 979 354 646 59 4,308
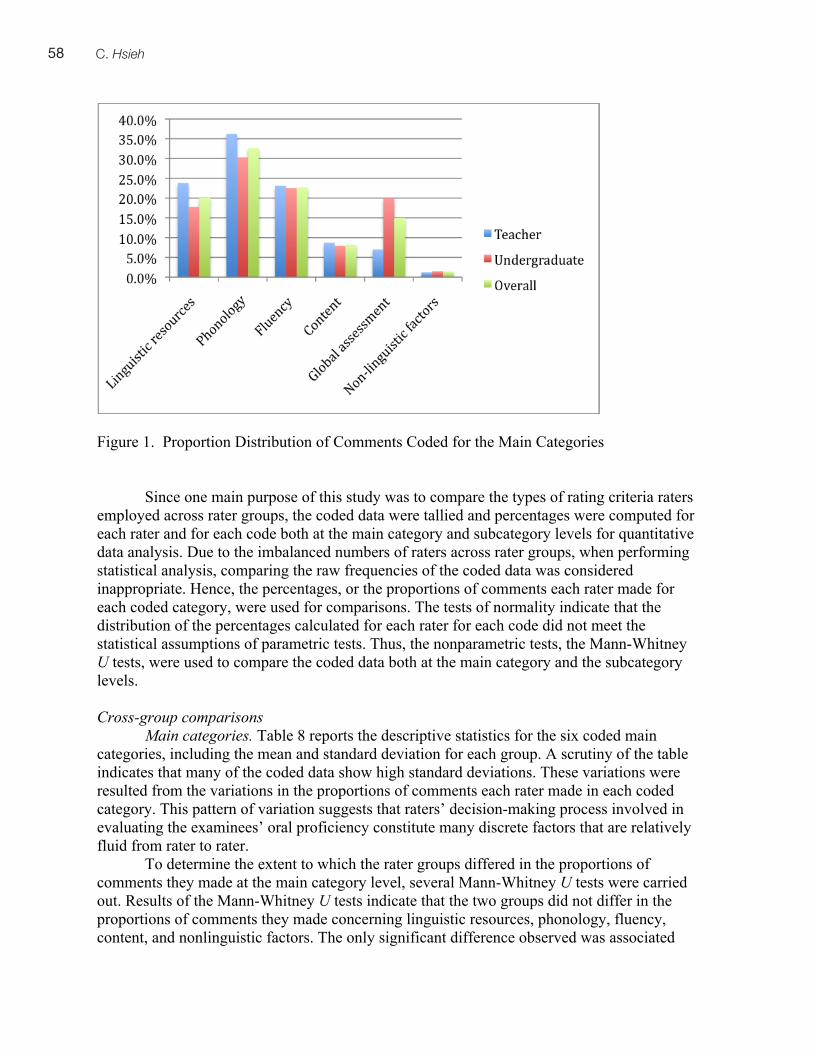
5958 C. Hsieh
with raters’ global assessment of the examinees’ oral proficiency, U(43) = 62.5, Z = -3.65, p = 0.00. This result suggests that the undergraduate raters tended to assess the responses more frequently based on the global quality of the responses than the ESL teachers did.
Table 8. Descriptive Statistics and Mann-Whitney U Tests for the Main Categories Overall (N = 45)
ESL teachers (n = 13)
Undergraduates (n = 32) Main
categories M SD M SD M SD Z-value P
Linguistic resources 18.1 10.7 20.6 10.9 17.1 10.7 -1.03 0.29
Phonology 34.1 16.6 40.6 17.8 31.5 15.7 -1.62 0.10 Fluency 21.4 11.1 23.3 9.5 20.7 11.7 -5.26 0.59 Content 7.1 6.6 8.6 7.7 6.5 6.1 -7.54 0.45 Global assessment 17.6 18.6 5.7 5.1 22.4 20.0 -3.64 0.00**
Nonlinguistic factors 1.7 2.7 1.2 1.4 1.8 3.1 -0.02 0.97
Subcategories. In terms of the subcategories within the main category of linguistic resources, raters as a whole made nearly equal proportions of comments to the grammar (M = 44.3%) and vocabulary (M = 44.0%) aspects of the examinee responses (see Table 9). In contrast, raters commented less frequently on the use of expressions and textualization in the examinee speech. In terms of group difference, results of the Mann-Whitney U tests indicate that the rater groups differed significantly in the proportions of comments they made on expressions, U(43) = -2.87, Z = 121.5, p = 0.00. The ESL teachers appeared to comment more frequently on the expressions used by the examinees than the undergraduates did, although the percentages of comments related to expressions were low for both groups.
The main category of phonology consisted of the largest proportion of the written comments. Raters as a whole commented most frequently to the pronunciation aspect of the speakers’ speech, suggesting that the examinees’ articulations of vowels and consonants were salient features of L2 speech for the raters. Table 10 displays that, within the main category of phonology, more than one third of the comments were related to the examinees’ foreign accent (M = 34.5%), whereas less than 10% of the comments were related to either the intonation or rhythm and stress of the speech samples. Results of the Mann-Whitney U tests indicate that the rater groups differed significantly in the proportions of comments they made for intonation, U(43) = 54.0, Z = -4.23, p = 0.00, rhythm and stress, U(43) = 87.0, Z = -3.42, p = .00, and accent, U(43) = 91.5, Z = -2.91, p = 0.00. The results indicate that the ESL teachers commented more frequently on the intonation and rhythm and stress of the examinees’ speech, whereas the undergraduates attended more frequently to the examinees’ foreign accent. Table 11 reports the results for the main category of fluency, the second largest group of comments raters made. As the table shows, for the entire rater group, the comments coded
Figure 1. Proportion Distribution of Comments Coded for the Main Categories
Since one main purpose of this study was to compare the types of rating criteria raters
employed across rater groups, the coded data were tallied and percentages were computed for each rater and for each code both at the main category and subcategory levels for quantitative data analysis. Due to the imbalanced numbers of raters across rater groups, when performing statistical analysis, comparing the raw frequencies of the coded data was considered inappropriate. Hence, the percentages, or the proportions of comments each rater made for each coded category, were used for comparisons. The tests of normality indicate that the distribution of the percentages calculated for each rater for each code did not meet the statistical assumptions of parametric tests. Thus, the nonparametric tests, the Mann-Whitney U tests, were used to compare the coded data both at the main category and the subcategory levels. Cross-group comparisons
Main categories. Table 8 reports the descriptive statistics for the six coded main categories, including the mean and standard deviation for each group. A scrutiny of the table indicates that many of the coded data show high standard deviations. These variations were resulted from the variations in the proportions of comments each rater made in each coded category. This pattern of variation suggests that raters’ decision-making process involved in evaluating the examinees’ oral proficiency constitute many discrete factors that are relatively fluid from rater to rater.
To determine the extent to which the rater groups differed in the proportions of comments they made at the main category level, several Mann-Whitney U tests were carried out. Results of the Mann-Whitney U tests indicate that the two groups did not differ in the proportions of comments they made concerning linguistic resources, phonology, fluency, content, and nonlinguistic factors. The only significant difference observed was associated
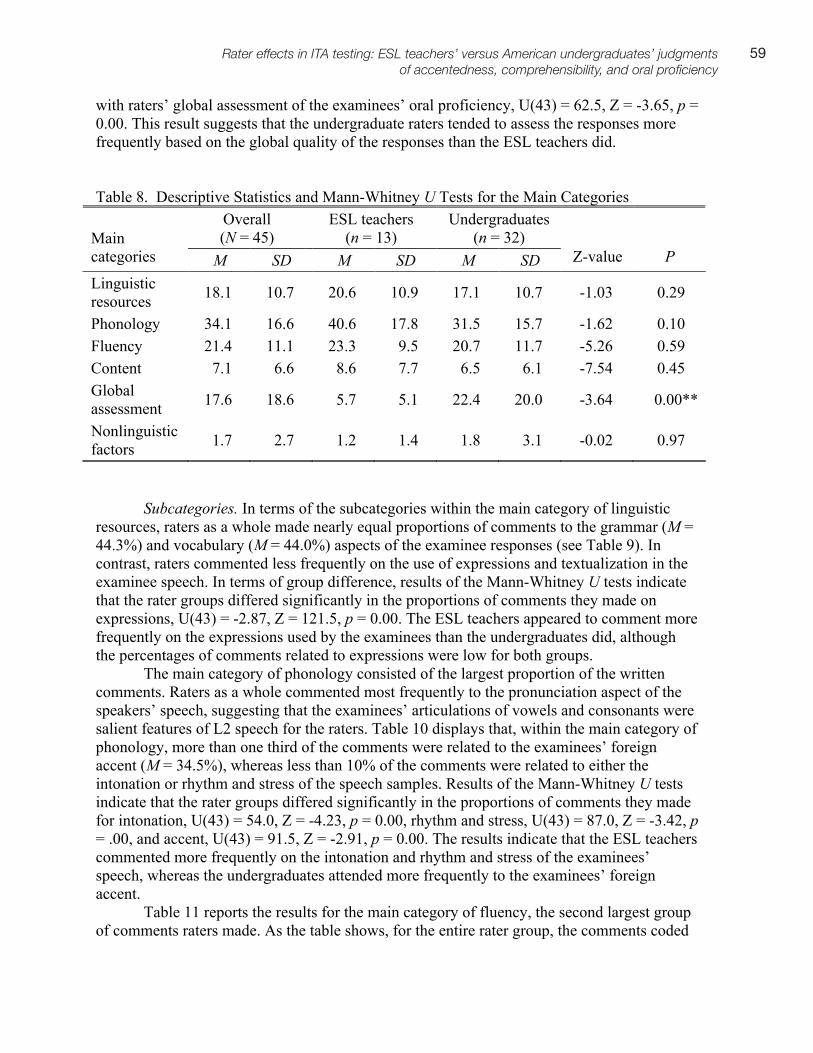
59Rater effects in ITA testing: ESL teachers’ versus American undergraduates’ judgments of accentedness, comprehensibility, and oral proficiency
with raters’ global assessment of the examinees’ oral proficiency, U(43) = 62.5, Z = -3.65, p = 0.00. This result suggests that the undergraduate raters tended to assess the responses more frequently based on the global quality of the responses than the ESL teachers did.
Table 8. Descriptive Statistics and Mann-Whitney U Tests for the Main Categories Overall (N = 45)
ESL teachers (n = 13)
Undergraduates (n = 32) Main
categories M SD M SD M SD Z-value P
Linguistic resources 18.1 10.7 20.6 10.9 17.1 10.7 -1.03 0.29
Phonology 34.1 16.6 40.6 17.8 31.5 15.7 -1.62 0.10 Fluency 21.4 11.1 23.3 9.5 20.7 11.7 -5.26 0.59 Content 7.1 6.6 8.6 7.7 6.5 6.1 -7.54 0.45 Global assessment 17.6 18.6 5.7 5.1 22.4 20.0 -3.64 0.00**
Nonlinguistic factors 1.7 2.7 1.2 1.4 1.8 3.1 -0.02 0.97
Subcategories. In terms of the subcategories within the main category of linguistic resources, raters as a whole made nearly equal proportions of comments to the grammar (M = 44.3%) and vocabulary (M = 44.0%) aspects of the examinee responses (see Table 9). In contrast, raters commented less frequently on the use of expressions and textualization in the examinee speech. In terms of group difference, results of the Mann-Whitney U tests indicate that the rater groups differed significantly in the proportions of comments they made on expressions, U(43) = -2.87, Z = 121.5, p = 0.00. The ESL teachers appeared to comment more frequently on the expressions used by the examinees than the undergraduates did, although the percentages of comments related to expressions were low for both groups.
The main category of phonology consisted of the largest proportion of the written comments. Raters as a whole commented most frequently to the pronunciation aspect of the speakers’ speech, suggesting that the examinees’ articulations of vowels and consonants were salient features of L2 speech for the raters. Table 10 displays that, within the main category of phonology, more than one third of the comments were related to the examinees’ foreign accent (M = 34.5%), whereas less than 10% of the comments were related to either the intonation or rhythm and stress of the speech samples. Results of the Mann-Whitney U tests indicate that the rater groups differed significantly in the proportions of comments they made for intonation, U(43) = 54.0, Z = -4.23, p = 0.00, rhythm and stress, U(43) = 87.0, Z = -3.42, p = .00, and accent, U(43) = 91.5, Z = -2.91, p = 0.00. The results indicate that the ESL teachers commented more frequently on the intonation and rhythm and stress of the examinees’ speech, whereas the undergraduates attended more frequently to the examinees’ foreign accent. Table 11 reports the results for the main category of fluency, the second largest group of comments raters made. As the table shows, for the entire rater group, the comments coded

6160 C. Hsieh
Table 12. Descriptive Statistics and Mann-Whitney U Tests for Content
Overall ESL Teachers Undergraduates Subcategories M SD M SD M SD
Z-value P
Task fulfillment 10.1 21.6 21.5 26.4 5.5 17.8 -2.67 0.00**
Ideas 40.0 43.2 39.7 39.3 40.1 45.3 -0.27 0.78 Organization 28.2 39.5 23.4 35.5 30.2 41.4 -0.05 0.95
To summarize, raters attended to six major conceptual categories when evaluating the examinees’ oral proficiency: linguistic resources, phonology, fluency, content, global assessment, and nonlinguistic factors. Within each major category, they paid attention to different aspects of L2 speech. At the main category level, rater groups differed significantly in the proportion of comments they made on global assessment. The undergraduate raters commented more frequently on the overall quality of the examinees’ responses than the ESL teachers did. At the subcategory level, rater groups differed significantly in the proportions of comments they made on several different performance features. The ESL teachers commented more frequently on expressions, intonation, rhythm and stress, and task fulfillment than the undergraduates did, whereas the undergraduates attended more often to the accent of the examinees than the ESL teachers did.
Discussion
Testing programs that administer high-stakes tests are responsible for delivering tests that are reliable, ethical, and valid. They must do so because their high-stakes tests provide the basis for score interpretations that significantly impact the test takers’ lives. Testing programs that administer ITA screening exams are no exception to this rule. Part and parcel to ITA testing is the assumption that the official raters are acting as de facto representatives of the undergraduate student population at their institution, the population from which any class of students an ITA would teach would be drawn. Underlying this assumption is that if an official rater deems the speech of a potential ITA as insufficient (too low in terms of overall proficiency or comprehensibility), then undergraduates would not be able to learn from this person very well due to explicit speech issues, regardless of the person’s affability, subject-area content knowledge, or teaching style. In turn, it is assumed that any international student a typical undergraduate cannot understand cannot pass the ITA exam. Thus, ITA programs should periodically check that these assumptions ring true, that official ITA exam raters are aligned to the views on ITA comprehensibility that undergraduates possess. It should not be the case that the official raters are harsher in their judgments than undergraduates would be, lest many qualified potential ITAs are not awarded assistantships and the possibility to study at the institution. Nor should the official raters be more lenient than undergraduates would be, lest undergraduates find themselves in classroom situations from which they cannot learn—which could lead toward an adverse impact on the quality of U.S. higher education. In sum, any university with an ITA testing program should periodically check that their official raters judge potential ITAs’ speech on par with how undergraduates would. Discrepancies in how
for fluency were concerned with, in descending order, overall fluency, pauses, repetition and repair, and speech rate. Results of the Mann-Whitney U tests indicate that the rater groups did not differ in the comments they made for any of the four subcategories.
Relatively few comments were coded for the main category of content. Table 12 shows that when raters commented on different aspects of content, they attended most frequently to the ideas the examinees produced in their responses, and followed by comments made about the organization of the responses and task fulfillment. In terms of group difference, results of the Mann-Whitney U tests indicate that the ESL teachers commented significantly more frequently to task fulfillment than the undergraduates did, U(43) = 125.0, Z = -2.67, p = .00. No significant difference was found on the comments concerning the ideas and organization of the responses.
Table 9. Descriptive Statistics and Mann-Whitney U Tests for Linguistic Resources Overall ESL teachers Undergraduates
Subcategories M SD M SD M SD Z-value P
Grammar 44.3 25.5 44.9 16.9 44.1 28.6 -0.20 0.84 Vocabulary 44.0 27.2 38.7 19.4 46.2 29.8 -0.47 0.63 Expressions 2.9 6.2 6.6 7.9 1.4 4.6 -2.87 0.00** Textualization 6.5 13.4 9.7 17.2 5.2 11.6 -1.59 0.11 Table 10. Descriptive Statistics and Mann-Whitney U Tests for Phonology
Overall ESL Teachers Undergraduates Subcategories M SD M SD M SD Z-value P
Pronunciation 52.0 23.7 53.8 15.3 51.2 26.6 -0.25 0.80 Intonation 6.3 10.8 15.2 12.7 2.6 7.4 -4.23 0.00** Rhythm and stress 7.3 14.9 12.9 10.9 5.0 15.8 -3.42 0.00**
Accent 34.5 26.1 17.9 17.4 41.2 26.2 -2.91 0.00** Table 11. Descriptive Statistics and Mann-Whitney U Tests for Fluency
Overall ESL Teachers Undergraduates Subcategories M SD M SD M SD Z-value P
Pauses 28.8 26.4 38.4 24.8 24.9 26.4 -1.88 0.06 Speech rate 13.8 15.3 17.1 16.2 12.4 14.9 -1.11 0.26 Repetition and repair 15.0 14.6 13.5 9.5 15.7 16.4 -0.11 0.90 Overall fluency 37.9 28.9 31.1 27.9 40.8 29.2 -0.96 0.33
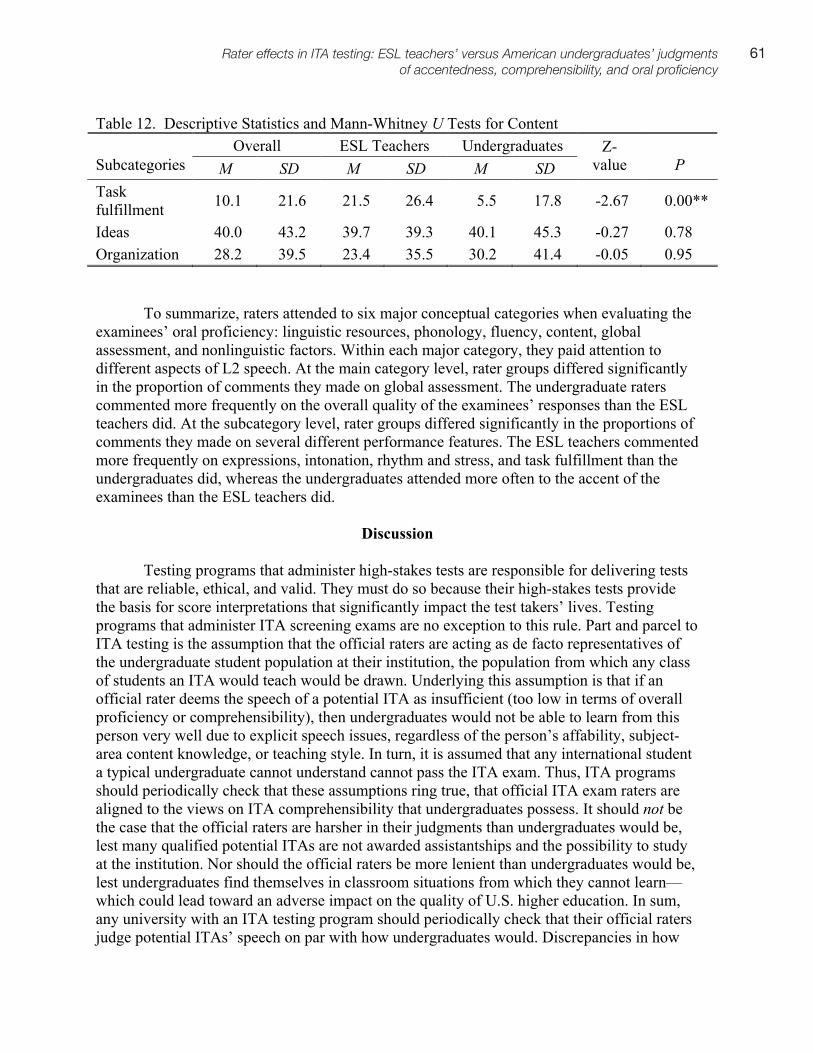
61Rater effects in ITA testing: ESL teachers’ versus American undergraduates’ judgments of accentedness, comprehensibility, and oral proficiency
Table 12. Descriptive Statistics and Mann-Whitney U Tests for Content
Overall ESL Teachers Undergraduates Subcategories M SD M SD M SD
Z-value P
Task fulfillment 10.1 21.6 21.5 26.4 5.5 17.8 -2.67 0.00**
Ideas 40.0 43.2 39.7 39.3 40.1 45.3 -0.27 0.78 Organization 28.2 39.5 23.4 35.5 30.2 41.4 -0.05 0.95
To summarize, raters attended to six major conceptual categories when evaluating the examinees’ oral proficiency: linguistic resources, phonology, fluency, content, global assessment, and nonlinguistic factors. Within each major category, they paid attention to different aspects of L2 speech. At the main category level, rater groups differed significantly in the proportion of comments they made on global assessment. The undergraduate raters commented more frequently on the overall quality of the examinees’ responses than the ESL teachers did. At the subcategory level, rater groups differed significantly in the proportions of comments they made on several different performance features. The ESL teachers commented more frequently on expressions, intonation, rhythm and stress, and task fulfillment than the undergraduates did, whereas the undergraduates attended more often to the accent of the examinees than the ESL teachers did.
Discussion
Testing programs that administer high-stakes tests are responsible for delivering tests that are reliable, ethical, and valid. They must do so because their high-stakes tests provide the basis for score interpretations that significantly impact the test takers’ lives. Testing programs that administer ITA screening exams are no exception to this rule. Part and parcel to ITA testing is the assumption that the official raters are acting as de facto representatives of the undergraduate student population at their institution, the population from which any class of students an ITA would teach would be drawn. Underlying this assumption is that if an official rater deems the speech of a potential ITA as insufficient (too low in terms of overall proficiency or comprehensibility), then undergraduates would not be able to learn from this person very well due to explicit speech issues, regardless of the person’s affability, subject-area content knowledge, or teaching style. In turn, it is assumed that any international student a typical undergraduate cannot understand cannot pass the ITA exam. Thus, ITA programs should periodically check that these assumptions ring true, that official ITA exam raters are aligned to the views on ITA comprehensibility that undergraduates possess. It should not be the case that the official raters are harsher in their judgments than undergraduates would be, lest many qualified potential ITAs are not awarded assistantships and the possibility to study at the institution. Nor should the official raters be more lenient than undergraduates would be, lest undergraduates find themselves in classroom situations from which they cannot learn—which could lead toward an adverse impact on the quality of U.S. higher education. In sum, any university with an ITA testing program should periodically check that their official raters judge potential ITAs’ speech on par with how undergraduates would. Discrepancies in how
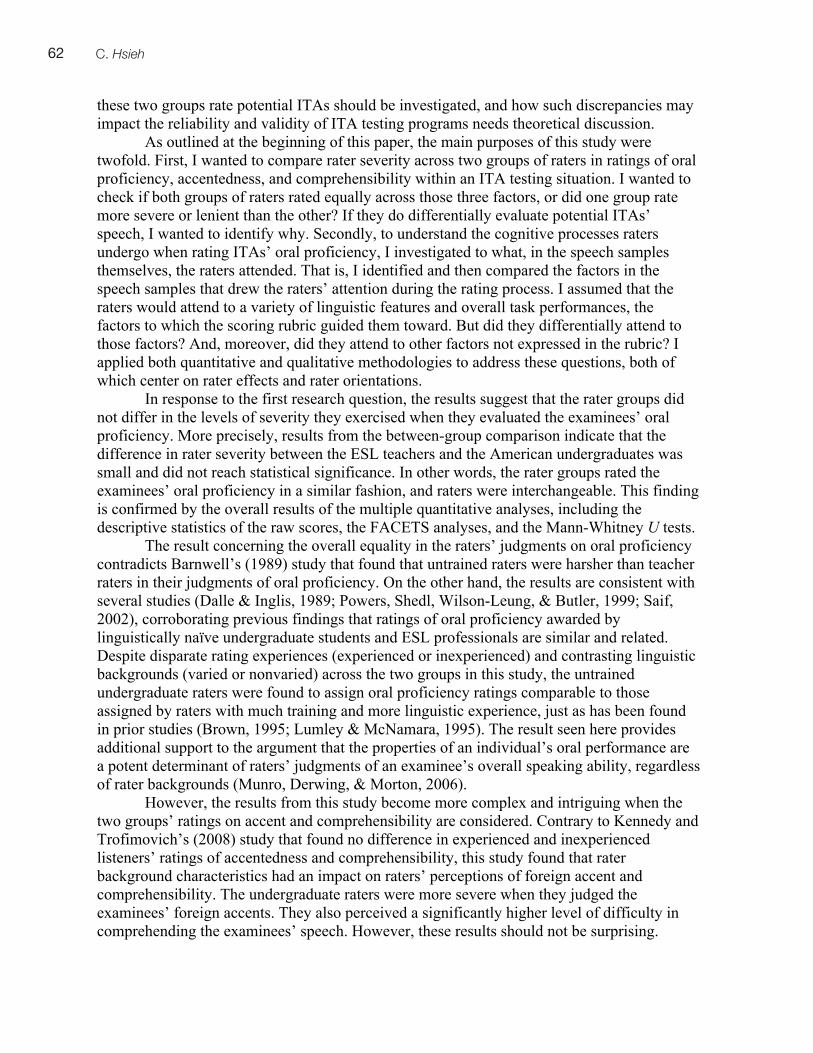
6362 C. Hsieh
Previous work (Bailey, 1984; Fox & Gay, 1994; Hinofotis & Bailey, 1981; Plakans, 1997; Rubin, 1992; Rubin & Smith, 1990) has indicated that American undergraduates tend to evaluate ITAs’ foreign accented speech negatively. Hinofotis and Bailey (1981) and Plakans (1997) both found that poor pronunciation was the most prominent failure (as judged by ESL teachers and undergraduate students) in ITAs’ communicative competence. The FACETS analyses reported here support such a view and extend it with respect to ratings of comprehensibility in cross-group comparisons.
But why do American undergraduates tend to evaluate ITAs’ foreign accented speech negatively and, concomitantly, indicate that they have a hard time comprehending such speech? The qualitative results in this study lend a hand at understanding this. One possible reason for the between-group difference in severity observed in the ratings of accentedness and comprehensibility may pertain to the raters’ amount of exposure to foreign-accented speech. All the undergraduate raters self-reported that they had very limited contact with nonnative English speakers either during their upbringing or in their circles of friends, whereas the ESL teachers all indicated that they had extensive ESL teaching experience, contact with nonnative English speakers, and were familiar with a wide variety of nonnative English. The ESL teachers’ extensive exposure to an array of diverse English pronunciations from learners of various L1 backgrounds may have well fine-tuned their ears to a variety of accents and enhanced their ability to decipher the meaning conveyed by accented, L2 speech. These results corroborate findings from a large body of previous work in speech perception and on the cognitive processing of L2 speech—work that supports the general claim that the amount of exposure to World Englishes and/or interaction with nonnative speakers can enhance the listening comprehension of those English varieties (Derwing & Munro, 1997; Derwing, Rossiter, & Munro, 2002; Gass & Varonis, 1984; Kang, 2008, 2010; Kennedy & Trofimovich, 2008; Munro & Derwing, 1994; Munro, et al., 2006; Powers, et al., 1999).
The second research question in this study delved even further into why raters with different backgrounds may differentially rate the speech of ITAs. In particular, with this second research question, I asked if the rater groups attended to different features (or factors) in the speech of the ITAs, and whether this differential attention could explain the observed differences in score assignments. This second research question also addresses the extent to which the ESL teachers and the undergraduates differed in the rating criteria they employed. This is an important area of investigation because all raters should rate language against the same set of criteria (Bachman, 1990; McNamara, 1996). When raters reliably use a common set of criteria against which to judge language, they are providing and operationalizing a common measurement of the test construct (Bachman, 1990). To not do so (if different raters use different judging criteria) presents theoretical problems and construct-validity issues in terms of score comparability (Messick, 1989).
By analyzing the written comments, I identified six major factors to which the raters attended, including linguistic resources, phonology, fluency, content, global assessment, and other, nonlinguistic factors. Concurring with A. Brown et al. (2005), the raters’ attention to the first four linguistic speech factors were further broken down. For example, within the linguistic resources category, raters made comments on the examinees’ use of grammar, vocabulary, expressions, and textualization. Within the phonology category, the examinees’ pronunciation, intonation, rhythm and stress, and foreign accent were all sources of attention. As far as fluency is concerned, raters judged the responses based on the repetitions or self-repair patterns and the speech rate of the speakers. In terms of content, raters noted whether
these two groups rate potential ITAs should be investigated, and how such discrepancies may impact the reliability and validity of ITA testing programs needs theoretical discussion.
As outlined at the beginning of this paper, the main purposes of this study were twofold. First, I wanted to compare rater severity across two groups of raters in ratings of oral proficiency, accentedness, and comprehensibility within an ITA testing situation. I wanted to check if both groups of raters rated equally across those three factors, or did one group rate more severe or lenient than the other? If they do differentially evaluate potential ITAs’ speech, I wanted to identify why. Secondly, to understand the cognitive processes raters undergo when rating ITAs’ oral proficiency, I investigated to what, in the speech samples themselves, the raters attended. That is, I identified and then compared the factors in the speech samples that drew the raters’ attention during the rating process. I assumed that the raters would attend to a variety of linguistic features and overall task performances, the factors to which the scoring rubric guided them toward. But did they differentially attend to those factors? And, moreover, did they attend to other factors not expressed in the rubric? I applied both quantitative and qualitative methodologies to address these questions, both of which center on rater effects and rater orientations.
In response to the first research question, the results suggest that the rater groups did not differ in the levels of severity they exercised when they evaluated the examinees’ oral proficiency. More precisely, results from the between-group comparison indicate that the difference in rater severity between the ESL teachers and the American undergraduates was small and did not reach statistical significance. In other words, the rater groups rated the examinees’ oral proficiency in a similar fashion, and raters were interchangeable. This finding is confirmed by the overall results of the multiple quantitative analyses, including the descriptive statistics of the raw scores, the FACETS analyses, and the Mann-Whitney U tests.
The result concerning the overall equality in the raters’ judgments on oral proficiency contradicts Barnwell’s (1989) study that found that untrained raters were harsher than teacher raters in their judgments of oral proficiency. On the other hand, the results are consistent with several studies (Dalle & Inglis, 1989; Powers, Shedl, Wilson-Leung, & Butler, 1999; Saif, 2002), corroborating previous findings that ratings of oral proficiency awarded by linguistically naïve undergraduate students and ESL professionals are similar and related. Despite disparate rating experiences (experienced or inexperienced) and contrasting linguistic backgrounds (varied or nonvaried) across the two groups in this study, the untrained undergraduate raters were found to assign oral proficiency ratings comparable to those assigned by raters with much training and more linguistic experience, just as has been found in prior studies (Brown, 1995; Lumley & McNamara, 1995). The result seen here provides additional support to the argument that the properties of an individual’s oral performance are a potent determinant of raters’ judgments of an examinee’s overall speaking ability, regardless of rater backgrounds (Munro, Derwing, & Morton, 2006).
However, the results from this study become more complex and intriguing when the two groups’ ratings on accent and comprehensibility are considered. Contrary to Kennedy and Trofimovich’s (2008) study that found no difference in experienced and inexperienced listeners’ ratings of accentedness and comprehensibility, this study found that rater background characteristics had an impact on raters’ perceptions of foreign accent and comprehensibility. The undergraduate raters were more severe when they judged the examinees’ foreign accents. They also perceived a significantly higher level of difficulty in comprehending the examinees’ speech. However, these results should not be surprising.

63Rater effects in ITA testing: ESL teachers’ versus American undergraduates’ judgments of accentedness, comprehensibility, and oral proficiency
Previous work (Bailey, 1984; Fox & Gay, 1994; Hinofotis & Bailey, 1981; Plakans, 1997; Rubin, 1992; Rubin & Smith, 1990) has indicated that American undergraduates tend to evaluate ITAs’ foreign accented speech negatively. Hinofotis and Bailey (1981) and Plakans (1997) both found that poor pronunciation was the most prominent failure (as judged by ESL teachers and undergraduate students) in ITAs’ communicative competence. The FACETS analyses reported here support such a view and extend it with respect to ratings of comprehensibility in cross-group comparisons.
But why do American undergraduates tend to evaluate ITAs’ foreign accented speech negatively and, concomitantly, indicate that they have a hard time comprehending such speech? The qualitative results in this study lend a hand at understanding this. One possible reason for the between-group difference in severity observed in the ratings of accentedness and comprehensibility may pertain to the raters’ amount of exposure to foreign-accented speech. All the undergraduate raters self-reported that they had very limited contact with nonnative English speakers either during their upbringing or in their circles of friends, whereas the ESL teachers all indicated that they had extensive ESL teaching experience, contact with nonnative English speakers, and were familiar with a wide variety of nonnative English. The ESL teachers’ extensive exposure to an array of diverse English pronunciations from learners of various L1 backgrounds may have well fine-tuned their ears to a variety of accents and enhanced their ability to decipher the meaning conveyed by accented, L2 speech. These results corroborate findings from a large body of previous work in speech perception and on the cognitive processing of L2 speech—work that supports the general claim that the amount of exposure to World Englishes and/or interaction with nonnative speakers can enhance the listening comprehension of those English varieties (Derwing & Munro, 1997; Derwing, Rossiter, & Munro, 2002; Gass & Varonis, 1984; Kang, 2008, 2010; Kennedy & Trofimovich, 2008; Munro & Derwing, 1994; Munro, et al., 2006; Powers, et al., 1999).
The second research question in this study delved even further into why raters with different backgrounds may differentially rate the speech of ITAs. In particular, with this second research question, I asked if the rater groups attended to different features (or factors) in the speech of the ITAs, and whether this differential attention could explain the observed differences in score assignments. This second research question also addresses the extent to which the ESL teachers and the undergraduates differed in the rating criteria they employed. This is an important area of investigation because all raters should rate language against the same set of criteria (Bachman, 1990; McNamara, 1996). When raters reliably use a common set of criteria against which to judge language, they are providing and operationalizing a common measurement of the test construct (Bachman, 1990). To not do so (if different raters use different judging criteria) presents theoretical problems and construct-validity issues in terms of score comparability (Messick, 1989).
By analyzing the written comments, I identified six major factors to which the raters attended, including linguistic resources, phonology, fluency, content, global assessment, and other, nonlinguistic factors. Concurring with A. Brown et al. (2005), the raters’ attention to the first four linguistic speech factors were further broken down. For example, within the linguistic resources category, raters made comments on the examinees’ use of grammar, vocabulary, expressions, and textualization. Within the phonology category, the examinees’ pronunciation, intonation, rhythm and stress, and foreign accent were all sources of attention. As far as fluency is concerned, raters judged the responses based on the repetitions or self-repair patterns and the speech rate of the speakers. In terms of content, raters noted whether
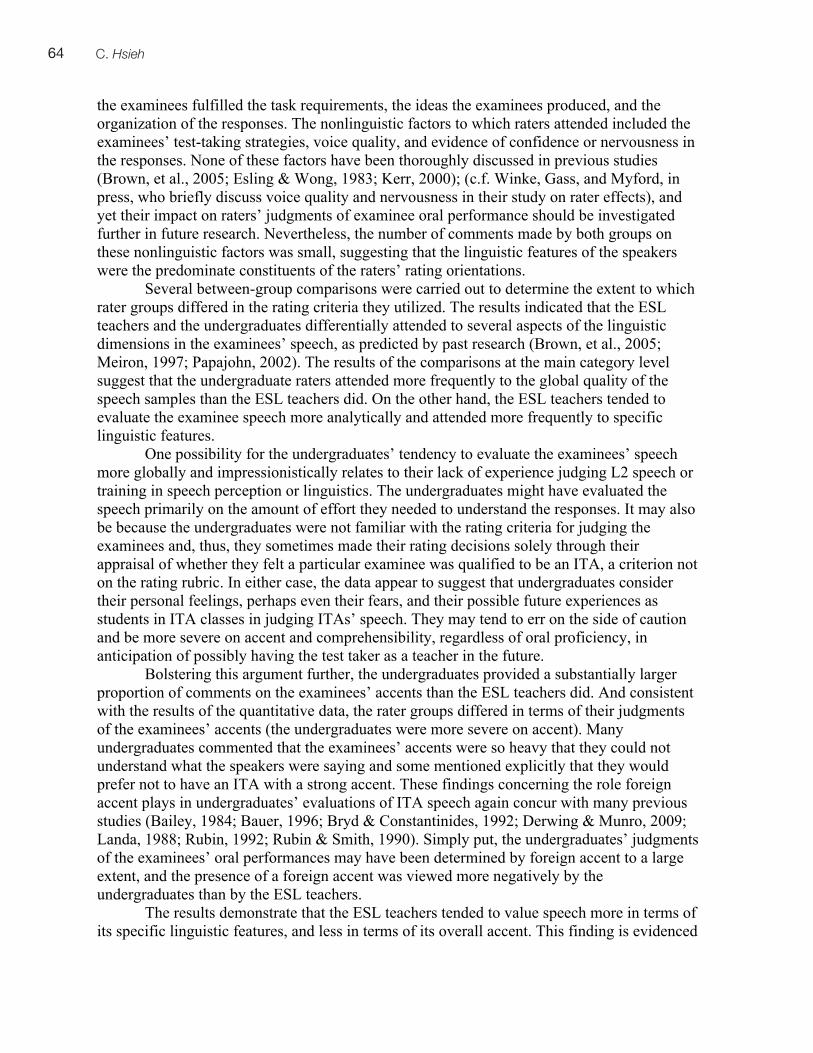
6564 C. Hsieh
by several differences in rater orientations observed between rater groups. The ESL teachers appeared to comment more frequently on the accuracy and complexity of the expressions the examinees produced. Similar to the results of the study by McNamara (1990) that suggested that grammar and expression were the most harshly rated criteria by expert raters, the ESL teachers seemed to consider the ITAs’ ability to use accurate and appropriate expressions as important as the use of grammar, vocabulary, and discourse markers. The ESL teachers’ emphasis on specific linguistic aspects of ITA speech appears to carry over into the raters’ evaluations of the phonological features of the speakers’ speech. The ESL teachers paid more attention to the examinees’ intonation and stress patterns than the undergraduates did, demonstrating again that the experienced ESL teachers rated based on the linguistic aspects of the speech, while the undergraduates rated the speech based more on what one might call feel.
Further evidence of some undergraduates using feel to rate speech in this study stems from some undergraduates’ unintuitive comments on speech rate. Contrary to Kang’s (2010) finding that undergraduate raters considered ITAs’ speech more comprehensible when the ITAs spoke faster (i.e., higher speech rate was associated with higher comprehensibility), many undergraduates in this study commented that faster speech would impair speech intelligibility and increase comprehension difficulties, especially in cases where heavy accents were present. While a fast speech rate is often cited as the cause of listeners’ difficulties in understanding a language learner (as noted in Zhao, 1997), the effect of overall speech rate on perceived comprehensibility and intelligibility by native speakers is complex (Derwing, 1990; Derwing & Munro, 2001). Whereas most undergraduates favored a slower speech rate, there were other undergraduates who considered faster speech better or indicative of higher proficiency, which is in line with most language proficiency scales (i.e., a greater rate of speech evidences greater fluency in the language).
The data in this study suggest that the undergraduates may have lumped many features of the linguistic component under accent, features that the ESL teachers considered separately from a test taker’s accent per se. Previous research has provided evidence showing that L2 speakers may have difficulty producing the characteristic intonation (Kang, 2008, 2010; Pickering, 2001, 2004) and stress patterns (Juffs, 1990; Kang, 2010) of English because of L1 interference. Among the 28 speakers of this study, 10 had an L1 background of Mandarin, 10 Korean, and eight Arabic. The majority of these examinees were expected to have a narrow pitch range (as in Mandarin and Korean) or a tendency to stress each individual word in a sentence regardless of its role in the discourse structure (as in Mandarin and Arabic) which often resulted in choppy speech (see Binghadeed, 2008, for speakers of Arabic; Kang, 2010, for speakers of Korean; Pickering, 2001, for speakers of Chinese). It appears that the ESL teachers picked up on the test takers’ narrow pitch ranges and unnatural stress patterns and raised concerns about their impact on comprehensibility. The undergraduates, however, did not comment as much on intonation or stress patterns, most likely because they are linguistically less sophisticated than the ESL teachers and were less able to describe, metalinguistically, such features. Despite the few undergraduates who commented on these features in the test takers’ speech, the majority of the undergraduates may have attributed their problems in deciphering problematic intonation and stress to the test takers’ accents. And this may explain, in part, why the undergraduates awarded higher accent ratings (more accented)—their “target” of accent was larger than the ESL teachers’ “target” of accent. However, such an interpretation also suggests that the qualitative data have some caveats—
the examinees fulfilled the task requirements, the ideas the examinees produced, and the organization of the responses. The nonlinguistic factors to which raters attended included the examinees’ test-taking strategies, voice quality, and evidence of confidence or nervousness in the responses. None of these factors have been thoroughly discussed in previous studies (Brown, et al., 2005; Esling & Wong, 1983; Kerr, 2000); (c.f. Winke, Gass, and Myford, in press, who briefly discuss voice quality and nervousness in their study on rater effects), and yet their impact on raters’ judgments of examinee oral performance should be investigated further in future research. Nevertheless, the number of comments made by both groups on these nonlinguistic factors was small, suggesting that the linguistic features of the speakers were the predominate constituents of the raters’ rating orientations.
Several between-group comparisons were carried out to determine the extent to which rater groups differed in the rating criteria they utilized. The results indicated that the ESL teachers and the undergraduates differentially attended to several aspects of the linguistic dimensions in the examinees’ speech, as predicted by past research (Brown, et al., 2005; Meiron, 1997; Papajohn, 2002). The results of the comparisons at the main category level suggest that the undergraduate raters attended more frequently to the global quality of the speech samples than the ESL teachers did. On the other hand, the ESL teachers tended to evaluate the examinee speech more analytically and attended more frequently to specific linguistic features.
One possibility for the undergraduates’ tendency to evaluate the examinees’ speech more globally and impressionistically relates to their lack of experience judging L2 speech or training in speech perception or linguistics. The undergraduates might have evaluated the speech primarily on the amount of effort they needed to understand the responses. It may also be because the undergraduates were not familiar with the rating criteria for judging the examinees and, thus, they sometimes made their rating decisions solely through their appraisal of whether they felt a particular examinee was qualified to be an ITA, a criterion not on the rating rubric. In either case, the data appear to suggest that undergraduates consider their personal feelings, perhaps even their fears, and their possible future experiences as students in ITA classes in judging ITAs’ speech. They may tend to err on the side of caution and be more severe on accent and comprehensibility, regardless of oral proficiency, in anticipation of possibly having the test taker as a teacher in the future.
Bolstering this argument further, the undergraduates provided a substantially larger proportion of comments on the examinees’ accents than the ESL teachers did. And consistent with the results of the quantitative data, the rater groups differed in terms of their judgments of the examinees’ accents (the undergraduates were more severe on accent). Many undergraduates commented that the examinees’ accents were so heavy that they could not understand what the speakers were saying and some mentioned explicitly that they would prefer not to have an ITA with a strong accent. These findings concerning the role foreign accent plays in undergraduates’ evaluations of ITA speech again concur with many previous studies (Bailey, 1984; Bauer, 1996; Bryd & Constantinides, 1992; Derwing & Munro, 2009; Landa, 1988; Rubin, 1992; Rubin & Smith, 1990). Simply put, the undergraduates’ judgments of the examinees’ oral performances may have been determined by foreign accent to a large extent, and the presence of a foreign accent was viewed more negatively by the undergraduates than by the ESL teachers.
The results demonstrate that the ESL teachers tended to value speech more in terms of its specific linguistic features, and less in terms of its overall accent. This finding is evidenced
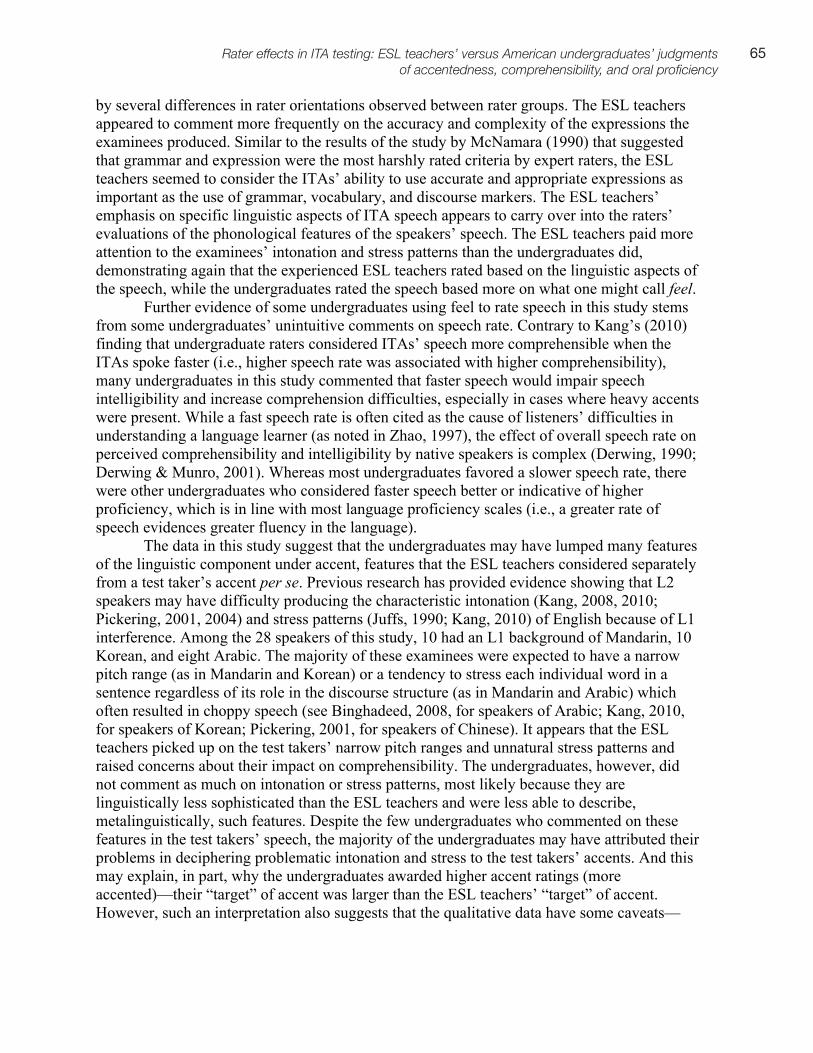
65Rater effects in ITA testing: ESL teachers’ versus American undergraduates’ judgments of accentedness, comprehensibility, and oral proficiency
by several differences in rater orientations observed between rater groups. The ESL teachers appeared to comment more frequently on the accuracy and complexity of the expressions the examinees produced. Similar to the results of the study by McNamara (1990) that suggested that grammar and expression were the most harshly rated criteria by expert raters, the ESL teachers seemed to consider the ITAs’ ability to use accurate and appropriate expressions as important as the use of grammar, vocabulary, and discourse markers. The ESL teachers’ emphasis on specific linguistic aspects of ITA speech appears to carry over into the raters’ evaluations of the phonological features of the speakers’ speech. The ESL teachers paid more attention to the examinees’ intonation and stress patterns than the undergraduates did, demonstrating again that the experienced ESL teachers rated based on the linguistic aspects of the speech, while the undergraduates rated the speech based more on what one might call feel.
Further evidence of some undergraduates using feel to rate speech in this study stems from some undergraduates’ unintuitive comments on speech rate. Contrary to Kang’s (2010) finding that undergraduate raters considered ITAs’ speech more comprehensible when the ITAs spoke faster (i.e., higher speech rate was associated with higher comprehensibility), many undergraduates in this study commented that faster speech would impair speech intelligibility and increase comprehension difficulties, especially in cases where heavy accents were present. While a fast speech rate is often cited as the cause of listeners’ difficulties in understanding a language learner (as noted in Zhao, 1997), the effect of overall speech rate on perceived comprehensibility and intelligibility by native speakers is complex (Derwing, 1990; Derwing & Munro, 2001). Whereas most undergraduates favored a slower speech rate, there were other undergraduates who considered faster speech better or indicative of higher proficiency, which is in line with most language proficiency scales (i.e., a greater rate of speech evidences greater fluency in the language).
The data in this study suggest that the undergraduates may have lumped many features of the linguistic component under accent, features that the ESL teachers considered separately from a test taker’s accent per se. Previous research has provided evidence showing that L2 speakers may have difficulty producing the characteristic intonation (Kang, 2008, 2010; Pickering, 2001, 2004) and stress patterns (Juffs, 1990; Kang, 2010) of English because of L1 interference. Among the 28 speakers of this study, 10 had an L1 background of Mandarin, 10 Korean, and eight Arabic. The majority of these examinees were expected to have a narrow pitch range (as in Mandarin and Korean) or a tendency to stress each individual word in a sentence regardless of its role in the discourse structure (as in Mandarin and Arabic) which often resulted in choppy speech (see Binghadeed, 2008, for speakers of Arabic; Kang, 2010, for speakers of Korean; Pickering, 2001, for speakers of Chinese). It appears that the ESL teachers picked up on the test takers’ narrow pitch ranges and unnatural stress patterns and raised concerns about their impact on comprehensibility. The undergraduates, however, did not comment as much on intonation or stress patterns, most likely because they are linguistically less sophisticated than the ESL teachers and were less able to describe, metalinguistically, such features. Despite the few undergraduates who commented on these features in the test takers’ speech, the majority of the undergraduates may have attributed their problems in deciphering problematic intonation and stress to the test takers’ accents. And this may explain, in part, why the undergraduates awarded higher accent ratings (more accented)—their “target” of accent was larger than the ESL teachers’ “target” of accent. However, such an interpretation also suggests that the qualitative data have some caveats—
6766 C. Hsieh
differed in ratings of accentedness and comprehensibility, it is not necessarily the case that raters from different universities or regions can reach judgments congruent with those found here (e.g., Bailey, 1984, in the southwest; Rubin, 1992, in the southeast).
Another limitation relates to the differences found in the ratings of accentedness and comprehensibility. Since I informed all raters about the purpose of this study that aimed to compare ESL teachers and undergraduate raters’ perceptions of ITA speech, the raters might have been prompted to direct extra attention to the accent feature of the speech samples. Undoubtedly, the undergraduate raters, under some circumstances, might have brought their previous personal experiences with ITAs, either positive or negative, and judged the speech samples differently than they normally would if such experiences were nonexistent. In other words, in this study, personal bias might have been a factor in some raters’ judgments, although its impact might be minor given the general consistencies in ratings across raters and groups. To reduce potential personal bias in the evaluations of accented speech to the highest extent possible, future research should find independent evidence through blind ratings by disinterested listeners and yet those to whom ITAs or L2 speakers must be comprehensible.
One empirical question regarding the impact of the amount of exposure to accented speech on comprehension deserves further investigation. It was assumed that the ESL teachers would be more lenient in their accentedness ratings because they have had extensive exposure to accented L2 speech as compared to the undergraduate raters, which might have enhanced their comprehension of the examinees’ speech or caused them to overlook speech features that were difficult to process for the linguistically naïve undergraduate students. Nonetheless, several studies also show that properties of L2 speech itself is the most powerful factor in determining how L2 speech is perceived, despite listener experience (Flege, 1988; Kennedy & Trofimovich, 2008; Munro, et al., 2006). Thus, to what extent does the amount of exposure to certain accents impact listening comprehension of these accents? What other rater background characteristics play a role in the perceptions and evaluations of accented L2 speech? Answers to these questions all have implications for rater recruitment and training in ITA testing and ITA training in general and are also directions for future research to take.
Conclusion
The study found striking similarities across rater groups in ratings of oral proficiency
but significant differences in ratings of accentedness and comprehensibility. The analyses of the written comments revealed that the ESL teachers and the undergraduates evaluated the examinee speech through a constellation of performance features, all of which emerged to factor into raters’ decision-making processes. The sheer quantity of the linguistic and nonlinguistic factors raters commented on testifies to the complexity and dynamics of human judgements in performance assessment. It also affirms the difficulty of obtaining uniform ratings across raters of different backgrounds, even among experienced ESL teachers.
Results of this study provide evidence that rater background characteristics, particularly rating and linguistic experiences, had a minimal effect on rater severity in oral proficiency ratings, and yet played an important role in raters’ perceptions of accentedness and comprehensibility. The study identifies a wide array of factors that raters paid attention to while evaluating the examinees’ speech. Results also show substantial variations in rating orientations from rater to rater. While there is a notable number of comments sharing the same concerns about the speakers’ performances across the entire rater group, the
that differences in attention paid to various linguistic features may be due to the two rater groups’ differences in being able to qualify to what, exactly, they attended.
It is important to note that although the complete set of written comments could conveniently be coded into the six main coding categories and their corresponding subcategories, the decision-making processes of the raters appear to vary substantially from person to person (Brown, 2007; Brown, et al., 2005; Meiron & Schick, 2000; Orr, 2002; Papajohn, 2002). This variation is made apparent by the high standard deviations observed in the proportions of comments raters made on the different rating categories. For example, the proportion of comments coded for the subcategory of “pauses” within the main category of fluency showed a 13.5% difference across rater groups. This margin was one of the most pronounced quantitative differences between the rater groups although no statistical significant difference was found. It is possible that the frequency of the comments made varied so substantially from person to person that the Mann-Whitney U test did not reach statistical significance. One possibility for the difference observed here could be attributable to just qualitative ones. That is, the wide range of factors raters commented on may stem from individual differences, which corroborate findings of several previous studies on raters orientations (Chalhoub-Deville, 1995; Cumming, 1990; Elder, 1993; Hadden, 1991), suggesting that the rating process is dynamic, complex, and interactive, and varies from individual to individual.
A main finding of this study is that undergraduates may not be able to be truly impartial judges, even with extensive training, because they have something at stake—the possibility to be taught by ITAs who they may difficulty understanding. Undergraduates’ potential fears, natural rating biases, or prejudices may be compounded by their potential stakes in the ITA program and show up in their ratings of the ITAs’ speech. While echoing Isaacs’ (2008) call for the inclusion of undergraduate students in local validation studies and ITA screening process, this study’s results suggests that ITA programs should avoid having undergraduates as official raters, and rather use them to check the threshold of what undergraduates may consider as incomprehensible speech. ITA testing programs should perhaps not be troubled if their official raters are more lenient than the undergraduates are in rating potential ITAs’ speech (as was found in this study) because undergraduates may be self-servingly harsh in their ratings. On the other hand, ITA testing program should not underestimate undergraduates’ abilities to adapt and comprehend ITAs whose speech falls within that “grey” zone (between what undergraduate raters would call incomprehensible, but what expert ESL teachers would call comprehensible). Research has shown that through even very limited training, undergraduate students can increase their ability to comprehend accented speech and willingness to talk with L2 speakers (e.g., Derwing & Munro, 2009; Derwing, et al., 2002). Therefore, ITA testing programs should not fear such a gap. Nevertheless, the potential rating differences between the official ITA testing raters and the undergraduates should still be constantly monitored, carefully evaluated, researched, and controlled.
A few limitations need to be addressed. First of all, admittedly, the number of raters in this study is small, and they come from only one single university in the Midwest. It is unknown whether the findings would hold for raters from other geographical regions such as the West coast where the makeup of the student body and the wider community are much more diverse both ethnically and culturally. While it has been shown that the undergraduate raters and the ESL teachers were comparable in their evaluations of oral proficiency but

67Rater effects in ITA testing: ESL teachers’ versus American undergraduates’ judgments of accentedness, comprehensibility, and oral proficiency
differed in ratings of accentedness and comprehensibility, it is not necessarily the case that raters from different universities or regions can reach judgments congruent with those found here (e.g., Bailey, 1984, in the southwest; Rubin, 1992, in the southeast).
Another limitation relates to the differences found in the ratings of accentedness and comprehensibility. Since I informed all raters about the purpose of this study that aimed to compare ESL teachers and undergraduate raters’ perceptions of ITA speech, the raters might have been prompted to direct extra attention to the accent feature of the speech samples. Undoubtedly, the undergraduate raters, under some circumstances, might have brought their previous personal experiences with ITAs, either positive or negative, and judged the speech samples differently than they normally would if such experiences were nonexistent. In other words, in this study, personal bias might have been a factor in some raters’ judgments, although its impact might be minor given the general consistencies in ratings across raters and groups. To reduce potential personal bias in the evaluations of accented speech to the highest extent possible, future research should find independent evidence through blind ratings by disinterested listeners and yet those to whom ITAs or L2 speakers must be comprehensible.
One empirical question regarding the impact of the amount of exposure to accented speech on comprehension deserves further investigation. It was assumed that the ESL teachers would be more lenient in their accentedness ratings because they have had extensive exposure to accented L2 speech as compared to the undergraduate raters, which might have enhanced their comprehension of the examinees’ speech or caused them to overlook speech features that were difficult to process for the linguistically naïve undergraduate students. Nonetheless, several studies also show that properties of L2 speech itself is the most powerful factor in determining how L2 speech is perceived, despite listener experience (Flege, 1988; Kennedy & Trofimovich, 2008; Munro, et al., 2006). Thus, to what extent does the amount of exposure to certain accents impact listening comprehension of these accents? What other rater background characteristics play a role in the perceptions and evaluations of accented L2 speech? Answers to these questions all have implications for rater recruitment and training in ITA testing and ITA training in general and are also directions for future research to take.
Conclusion
The study found striking similarities across rater groups in ratings of oral proficiency
but significant differences in ratings of accentedness and comprehensibility. The analyses of the written comments revealed that the ESL teachers and the undergraduates evaluated the examinee speech through a constellation of performance features, all of which emerged to factor into raters’ decision-making processes. The sheer quantity of the linguistic and nonlinguistic factors raters commented on testifies to the complexity and dynamics of human judgements in performance assessment. It also affirms the difficulty of obtaining uniform ratings across raters of different backgrounds, even among experienced ESL teachers.
Results of this study provide evidence that rater background characteristics, particularly rating and linguistic experiences, had a minimal effect on rater severity in oral proficiency ratings, and yet played an important role in raters’ perceptions of accentedness and comprehensibility. The study identifies a wide array of factors that raters paid attention to while evaluating the examinees’ speech. Results also show substantial variations in rating orientations from rater to rater. While there is a notable number of comments sharing the same concerns about the speakers’ performances across the entire rater group, the

6968 C. Hsieh
Binghadeed, N. (2008). Acoustic analysis of pitch range in the production of native and nonnative speakers of English. The Asian EFL Journal Quarterly, 10, 96–113.
Briggs, S. L. (1994). Using performance methods to screen ITAs. In C. G. Madden & C. L. Myers (Eds.), Discourse and performance of international teaching assistants (pp. 63–80). Alexandria, VA: TESOL.
Brown, A. (1995). The effect of rater variables in the development of an occupation-specific language performance test. Language Testing, 12(1), 1–15.
Brown, A. (2007). An investigation of the rating process in the IELTS oral interview. In M. Milanovic & C. J. Weir (Eds.), IELTS collected papers: Research in speaking and writing assessment (pp. 98–141). Cambridge: Cambridge University Press.
Brown, A., & Hill, K. (2007). Interviewer style and candidate performance in the IELTS roal interview. In L. Taylor & P. Falvey (Eds.), IELTS collected papers: Research in speaking and writing assessment (pp. 37–61). Cambridge: Cambridge University Press.
Brown, A., Iwashita, N., & McNamara, T. F. (2005). An examination of rater orientations and test-taker performance on English-for-academic-purpose speaking tasks (TOEFL Monograph No. MS-29). Princeton, NJ: Educational Testing Service.
Bryd, P., & Constantinides, J. C. (1992). The language of teaching mathematics: Implications for training ITAs. TESOL Quarterly, 26(1), 163–167.
Chalhoub-Deville, M. (1995). Deriving oral assessment scales across different tests and rater groups. Language Testing, 12, 16–35.
Chiang, S.-Y. (2009). Dealing with communication problems in the instructional interactions between international teaching assistants and American college students. Language and Education, 23(5), 461–478.
Congdon, P., & McQueen, J. (2000). The stability of rater severity in large-scale assessment programs. Journal of Educational Measurement, 37(2), 163–178.
Cumming, A. (1990). Expertise in evaluating second language compositions. Language Testing, 7(1), 31–51.
Cumming, A., Kantor, R., & Powers, D. E. (2002). Decision making while rating ESL/EFL writing tasks: A descriptive framework. The Modern Language Journal, 86(1), 67–96.
Dalle, T. S., & Inglis, M. J. (1989, March). What really affects undergraduates' evaluations of nonnative teaching assistant's teaching? Paper presented at the The Annual Meeting of the Teachers of English to Speakers of Other Languages, San Antonio, TX.
Davies, C., Tyler, A., & Koran, J. (1989). Face-to-face with native speakers: An advanced training class for international teaching assisstants. English for Specific Purposes, 8, 139–153.
Derwing, T. M. (1990). Speech rate is no simple matter: Rate adjustment and NS-NNS communicative success. Studies in Second Language Acquisition, 12, 303–313.
Derwing, T. M., & Munro, M. J. (1997). Accent, intelligibility, and comprehensibility: Evidence from four L1s. Studies in Second Language Acquisition, 20, 1–16.
Derwing, T. M., & Munro, M. J. (2001). What speaking rates do non-native listeners prefer? Applied Linguistics, 22(3), 324–337.
Derwing, T. M., & Munro, M. J. (2009). Putting accent in its place: Rethinking obstacles to communication. Language Teaching, 42(4), 476–490.
undergraduate raters tended to evaluate the examinees’ oral proficiency more globally while the ESL teachers appeared to rate more analytically by attending to different linguistic features of the speech samples.
This study employs a mixed-method design to examine rater effects and rater orientations in an ITA testing context. Through the investigation of three separate aspects of L2 speech: oral proficiency, accentedness, and comprehensibility simultaneously, and systematic between-group comparisons, this study has implications for research in ITA testing, research, and pedagogy. This manifold research design is a step further from the sole comparison of ITAs’ oral proficiency between ESL teachers and American undergraduates as has done in much previous research. Furthermore, the exploration of the factors that figure into raters’ decision-making processes provides insights into ways expert and naïve raters perceive examinee speech and how the differences in perceptions might be addressed. Nonetheless, much more work is called for to further examine the wide range of possible factors that contribute to the perceptions of different aspects of L2 speech through the involvement of raters of various backgrounds and by the expansion of research scope to examine more diverse ITAs’ speech samples from universities across various geographical regions.
Acknowledgements I would like to acknowledge the financial support from the English Language Institute at the University of Michigan and the Russell N. Campbell Doctoral Dissertation Grant from The International Research Foundation. I am heartily thankful to Professor Paula Winke at Michigan State University for her constant help and support throughout this study.
References
Anderson-Hsieh, J., & Koehler, K. (1988). The effect of foreign accent and speaking rate on native speaker comprehension. Language Learning, 38(4), 561–613.
Bachman, L. F. (1990). Fundamental considerations in language testing. Oxford: Oxford University Press.
Bachman, L. F., Lynch, B. K., & Mason, M. (1995). Investigating variability in tasks and rater judgments in a performance test of foreign language speaking. Language Testing, 12(2), 238–257.
Bailey, C. M. (1983). Foreign teaching assistants at U.S. universities: Problems in interaction and communication. TESOL Quarterly, 17(2), 308–310.
Bailey, C. M. (1984). The "Foreign TA Problem". In C. M. Bailey, F. Pialorsi & J. Zukowski/Faust (Eds.), Foreign teaching assistants in US universities (pp. 3–16). Washington, DC: National Association for Foreign Student Affairs.
Barnwell, D. (1989). 'Naive' native speakers and judgments of oral proficiency in Spanish. Language Testing, 6, 152–163.
Barrett, S. (2001). The impact of training on rater variability. International Education Journal, 2(1), 49–58.
Bauer, G. (1996). Addressing special considerations when working with international teaching assistants. In J. D. Nyquist & D. H. Wulff (Eds.), Working effectively with graduate assistants (pp. 85–103). London: Sage Publications.
69Rater effects in ITA testing: ESL teachers’ versus American undergraduates’ judgments of accentedness, comprehensibility, and oral proficiency
Binghadeed, N. (2008). Acoustic analysis of pitch range in the production of native and nonnative speakers of English. The Asian EFL Journal Quarterly, 10, 96–113.
Briggs, S. L. (1994). Using performance methods to screen ITAs. In C. G. Madden & C. L. Myers (Eds.), Discourse and performance of international teaching assistants (pp. 63–80). Alexandria, VA: TESOL.
Brown, A. (1995). The effect of rater variables in the development of an occupation-specific language performance test. Language Testing, 12(1), 1–15.
Brown, A. (2007). An investigation of the rating process in the IELTS oral interview. In M. Milanovic & C. J. Weir (Eds.), IELTS collected papers: Research in speaking and writing assessment (pp. 98–141). Cambridge: Cambridge University Press.
Brown, A., & Hill, K. (2007). Interviewer style and candidate performance in the IELTS roal interview. In L. Taylor & P. Falvey (Eds.), IELTS collected papers: Research in speaking and writing assessment (pp. 37–61). Cambridge: Cambridge University Press.
Brown, A., Iwashita, N., & McNamara, T. F. (2005). An examination of rater orientations and test-taker performance on English-for-academic-purpose speaking tasks (TOEFL Monograph No. MS-29). Princeton, NJ: Educational Testing Service.
Bryd, P., & Constantinides, J. C. (1992). The language of teaching mathematics: Implications for training ITAs. TESOL Quarterly, 26(1), 163–167.
Chalhoub-Deville, M. (1995). Deriving oral assessment scales across different tests and rater groups. Language Testing, 12, 16–35.
Chiang, S.-Y. (2009). Dealing with communication problems in the instructional interactions between international teaching assistants and American college students. Language and Education, 23(5), 461–478.
Congdon, P., & McQueen, J. (2000). The stability of rater severity in large-scale assessment programs. Journal of Educational Measurement, 37(2), 163–178.
Cumming, A. (1990). Expertise in evaluating second language compositions. Language Testing, 7(1), 31–51.
Cumming, A., Kantor, R., & Powers, D. E. (2002). Decision making while rating ESL/EFL writing tasks: A descriptive framework. The Modern Language Journal, 86(1), 67–96.
Dalle, T. S., & Inglis, M. J. (1989, March). What really affects undergraduates' evaluations of nonnative teaching assistant's teaching? Paper presented at the The Annual Meeting of the Teachers of English to Speakers of Other Languages, San Antonio, TX.
Davies, C., Tyler, A., & Koran, J. (1989). Face-to-face with native speakers: An advanced training class for international teaching assisstants. English for Specific Purposes, 8, 139–153.
Derwing, T. M. (1990). Speech rate is no simple matter: Rate adjustment and NS-NNS communicative success. Studies in Second Language Acquisition, 12, 303–313.
Derwing, T. M., & Munro, M. J. (1997). Accent, intelligibility, and comprehensibility: Evidence from four L1s. Studies in Second Language Acquisition, 20, 1–16.
Derwing, T. M., & Munro, M. J. (2001). What speaking rates do non-native listeners prefer? Applied Linguistics, 22(3), 324–337.
Derwing, T. M., & Munro, M. J. (2009). Putting accent in its place: Rethinking obstacles to communication. Language Teaching, 42(4), 476–490.
7170 C. Hsieh
Kang, O. (2008). Ratings of L2 oral performance in English: Relative impact of rater characteristics and acoustic measures of accentedness. Spaan Fellow Working Papers in Second or Foreign Language Assessment, 6, 181–205.
Kang, O. (2010). Relative salience of suprasegmental features on judgments of L2 comprehensibility and accentedness. System, 38, 301–315.
Kennedy, S., & Trofimovich, P. (2008). Intellibigility, comprehensibility, and accentedness of L2 speech: The role of listener experience and semantic context. The Canadian Modern Language Review, 64(3), 459–489.
Kerr, J. (2000). Articulatory setting and voice production: Issues in accent modification. Prospect, 15(2), 4–15.
Kim, Y.-H. (2009). An investigation into native and non-native teachers' judgments of oral English performance: A mixed methods approach. Language Testing, 26(2), 187–217.
Kunnan, A. J. (2000). Fairness and justice for all. In A. J. Kunnan (Ed.), Fairness and validation in language assessment: Selected papers from the 19th Language Testing Research Colloquium, Orlando, Florida (pp. 1–14). Cambridge: Cambridge University Press.
Landa, M. (1988). Training international students as teaching assistants. In J. A. Mestenhauser & G. Marty (Eds.), Culture, learning, and the disciplines: Theory and practice in cross-cultural orientation (pp. 50–57). Washington, DC: National Association for Foreign Student Affairs.
Linacre, J. M. (1989). Many-facet Rasch measurement. Chicago: MESA Press. Linacre, J. M. (2002). What do infit and outfit, mean-square and standardized mean? Rasch
Measurement Transactions, 16(2), 878. Linacre, J. M. (2010). FACETS (Version 3.67) [Computer Software]. Chicago:
WINSTEPS.com. Lumley, T. (2002). Assessment criteria in a large-scale writing test: What do they really mean
to the raters. Language Testing, 19, 246–276. Lumley, T. (2005). Assessing second language writing: The rater's perspective. Frankfurt:
Lang. Lumley, T., & McNamara, T. F. (1995). Rater characteristics and rater bias: Implications for
training. Language Testing, 12, 54–71. McNamara, T. F. (1990). Item response theory and the validation of an ESP test for health
professionals. Language Testing, 7(1), 52–75. McNamara, T. F. (1996). Measuring second language performance. Harlow: Longman. McNamara, T. F., & Lumley, T. (1997). The effect of interlocutor and assessment mode
variables in overseas assessments of speaking skills in occupationtional setting. Language Testing, 14, 140–156.
Meiron, B. E. (1998, April). Rating oral proficiency tests: A triangulated study of rater thought processes. Paper presented at the Language Testing Research Colloquium, Monterey, CA.
Meiron, B. E., & Schick, L. S. (2000). Ratings, raters and test performance: An exploratory study. In A. J. Kunnan (Ed.), Fairness and validation in language assessment: Selected papers from the 19th Language Testing Research Colloquium, Orlando, Florida (pp. 153–176). Cambridge: Cambridge University Press.
Merrylees, B., & McDowell, C. (2007). A survey of examiner attitudes and behavior in the IELTS oral interview. In L. Taylor & P. Falvey (Eds.), IELTS collected papers:
Derwing, T. M., Rossiter, M. J., & Munro, M. J. (2002). Teaching native speakers to listen to foreign-accented speech. Journal of Multilingual and Multicultural Development, 23(4), 245–259.
Douglas, D., & Smith, J. (1997). Theoretical underpinnings of the Test of Spoken English revision project (TOEFL Research Report No. RM-97-2). Princeton, NJ: Educational Testing Service.
Eckes, T. (2005). Examining rater effects in TestDaF writing and speaking performance assessments: A many-facet Rasch analysis. Language Assessment Quarterly, 2, 197–221.
Elder, C. (1993). How do subject specialists construe classroom language proficiency? Language Testing, 10, 235–254.
Engelhard, G. J., & Myford, C. M. (2003). Monitoring faculty consultant performance in the advnaced placement English literature and composition program with a many-faceted Rasch model (College Board Research Report No. 2003-1). Princeton, NJ: Educational Testing Service.
Esling, J. H., & Wong, R. F. (1983). Voice quality settings and the teaching of pronunciation. TESOL Quarterly, 17(1), 89–95.
Field, A. (2009). Discovering statistics using SPSS (3rd ed.). Thousand Oaks, CA: Sage. Flege, J. E. (1988). The production and perception of foreign language speech sounds. In H.
Winitz (Ed.), Human communication and its disorders: A review-1988 (pp. 224–401). Norwood, NJ: Ablex.
Fox, W. S., & Gay, G. (1994). Functions and effects of international teaching assistants. Review of Higher Education, 18, 1–24.
Gass, S. M., & Varonis, E. M. (1984). The effect of familiarity on the comprehensibility of nonnative speech. Language Learning, 34, 65–89.
Ginther, A. (2004). International teaching assistant testing: Policies and methods. In D. Douglas (Ed.), English language testing in U.S. colleges and universities (pp. 57–84). Washington, D.C.: NAFSA.
Hadden, B. L. (1991). Teacher and nonteacher perceptions of second-language communication. Language Learning, 41(1), 1–24.
Hinofotis, F. B., & Bailey, C. M. (1981). American undergraduates' reactions to the communication skills of foreign teaching assistants. In J. C. Fisher, M. A. Clarke & J. Schachter (Eds.), On TESOL '80: Building bridges: Research and practice in teaching English as a second language (pp. 120–133). Washington, DC: TESOL.
Hoekje, B., & Linnell, K. (1994). "Authenticity" in language testing: Evaluating spoken language tests for international teaching assistants. TESOL Quarterly, 28(1), 103–126.
Hoekje, B., & Williams, J. (1992). Communicative competence and the dilemma of international teaching assistant education. TESOL Quarterly, 26(2), 243–269.
Isaacs, T. (2008). Towards defining a valid assessment criterion of pronunciation proficiency in non-native English-speaking graduate students. The Canadian Modern Language Review, 64(4), 555–580.
Johnson, J., & Lim, G. S. (2009). The influence of rater language background on writing performance assessment. Language Testing, 26(4), 485–505.
Juffs, A. (1990). Tone, syllable structure and interlanguage phonology: Chinese learners' stress errors. International Review of Applied Linguistics, 28, 99–117.

71Rater effects in ITA testing: ESL teachers’ versus American undergraduates’ judgments of accentedness, comprehensibility, and oral proficiency
Kang, O. (2008). Ratings of L2 oral performance in English: Relative impact of rater characteristics and acoustic measures of accentedness. Spaan Fellow Working Papers in Second or Foreign Language Assessment, 6, 181–205.
Kang, O. (2010). Relative salience of suprasegmental features on judgments of L2 comprehensibility and accentedness. System, 38, 301–315.
Kennedy, S., & Trofimovich, P. (2008). Intellibigility, comprehensibility, and accentedness of L2 speech: The role of listener experience and semantic context. The Canadian Modern Language Review, 64(3), 459–489.
Kerr, J. (2000). Articulatory setting and voice production: Issues in accent modification. Prospect, 15(2), 4–15.
Kim, Y.-H. (2009). An investigation into native and non-native teachers' judgments of oral English performance: A mixed methods approach. Language Testing, 26(2), 187–217.
Kunnan, A. J. (2000). Fairness and justice for all. In A. J. Kunnan (Ed.), Fairness and validation in language assessment: Selected papers from the 19th Language Testing Research Colloquium, Orlando, Florida (pp. 1–14). Cambridge: Cambridge University Press.
Landa, M. (1988). Training international students as teaching assistants. In J. A. Mestenhauser & G. Marty (Eds.), Culture, learning, and the disciplines: Theory and practice in cross-cultural orientation (pp. 50–57). Washington, DC: National Association for Foreign Student Affairs.
Linacre, J. M. (1989). Many-facet Rasch measurement. Chicago: MESA Press. Linacre, J. M. (2002). What do infit and outfit, mean-square and standardized mean? Rasch
Measurement Transactions, 16(2), 878. Linacre, J. M. (2010). FACETS (Version 3.67) [Computer Software]. Chicago:
WINSTEPS.com. Lumley, T. (2002). Assessment criteria in a large-scale writing test: What do they really mean
to the raters. Language Testing, 19, 246–276. Lumley, T. (2005). Assessing second language writing: The rater's perspective. Frankfurt:
Lang. Lumley, T., & McNamara, T. F. (1995). Rater characteristics and rater bias: Implications for
training. Language Testing, 12, 54–71. McNamara, T. F. (1990). Item response theory and the validation of an ESP test for health
professionals. Language Testing, 7(1), 52–75. McNamara, T. F. (1996). Measuring second language performance. Harlow: Longman. McNamara, T. F., & Lumley, T. (1997). The effect of interlocutor and assessment mode
variables in overseas assessments of speaking skills in occupationtional setting. Language Testing, 14, 140–156.
Meiron, B. E. (1998, April). Rating oral proficiency tests: A triangulated study of rater thought processes. Paper presented at the Language Testing Research Colloquium, Monterey, CA.
Meiron, B. E., & Schick, L. S. (2000). Ratings, raters and test performance: An exploratory study. In A. J. Kunnan (Ed.), Fairness and validation in language assessment: Selected papers from the 19th Language Testing Research Colloquium, Orlando, Florida (pp. 153–176). Cambridge: Cambridge University Press.
Merrylees, B., & McDowell, C. (2007). A survey of examiner attitudes and behavior in the IELTS oral interview. In L. Taylor & P. Falvey (Eds.), IELTS collected papers:

7372 C. Hsieh
Powers, D. E., Shedl, M. A., Wilson-Leung, S., & Butler, F. A. (1999). Validating the revised TSE(R) against a criterion of communicative success (TOEFL Research Report No.RR-85-5). Princeton: Educational Testing Service.
Rounds, P. L. (1987). Characterizing successful classroom discourse for NNS teaching assistant training. TESOL Quarterly, 21(4), 643–672.
Rubin, D. (1992). Nonlanguage factors affecting undergraduates' judgments of nonnative English-speaking teaching assistants. Research in Higher Education, 33(4), 511–531.
Rubin, D., & Smith, K. A. (1990). Effects of accent, ethnicity, and lecture topic on undergraduates' perceptions of nonnative English-speaking teaching assistants. International Journal of Intercultural Relations, 14, 337–353.
Saif, S. (2002). A needs-based approach to the evaluation of the spoken language ability of international teaching assistants. The Canadian Journal of Applied Linguistics, 5, 145–167.
Schaefer, E. (2008). Rater bias patterns in an EFL writing assessment. Language Testing, 25, 465–493.
Tyler, A. (1992). Discourse structure and the perception of incoherence in international teaching assistants' spoken discourse. TESOL Quarterly, 26(4), 713–729.
Weigle, S. C. (1994). Effects of training on raters of ESL compositions. Language Testing, 11, 197–223.
Weigle, S. C. (1998). Using FACETS to model rater training effects. Language Testing, 15(2), 263–287.
Weigle, S. C. (1999). Investigating rater/prompt interactions in writing assessment: Quantitative and qualitative approaches. Assessing Writing, 6(2), 145–178.
Williams, J. (1992). Planning, discourse marking, and the comprehensibility of international teaching assistants. TESOL Quarterly, 26(4), 693–711.
Winke, P., Gass, S. M., & Myford, C. M. (in press). The relationship between raters' prior language study and the evaluation of foreign language speech samples. Princeton: Educational Testing Service.
Xi, X., & Mollaun, P. (2009). How do raters from India perform in scoring the TOEFL iBT speaking section and what kind of training helps? (TOEFL iBT Research Report No. RR-09-31). Princeton, NJ: Educational Testing Service.
Yook, E. L., & Albert, R. D. (1999). Perceptions of international teaching assistants: The interrelatedness of intercultural training, cognition, and emotion. Communication Education, 48, 1–17.
Zhao, Y. (1997). The effects of listener' control of speech rate on second language comprehension. Applied Linguistics, 18, 49–68.
Research in speaking and writing assessment (pp. 142–184). Cambridge: Cambridge University Press.
Messick, S. (1989). Validity. In R. Linn (Ed.), Educational measurement (3rd ed., pp. 13–103). New York: ACE/Macmillan.
Milanovic, M., Saville, N., & Shuhong, S. (1996). A study of the decision-making behavior of composition markers. In M. Milanovic & N. Saville (Eds.), Performance testing, cognition and assessment: Selected papers from the 15th Language Testing Research Colloquium (pp. 92–114). Cambridge: Cambridge University Press.
Miles, M. B., & Huberman, A. M. (1994). Qualitative data analysis: An expanded sourcebook. Thousand Oaks: Sage.
Munro, M. J., & Derwing, T. M. (1994). Evaluations of foreign accent in extemporaneous and read material. Language Testing, 11(3), 253–266.
Munro, M. J., & Derwing, T. M. (1995). Foreign accent, comprehensibility, and intelligibility in the speech of second language learners. Language Learning, 41(1), 73–97.
Munro, M. J., & Derwing, T. M. (1998). The effects of speaking rate on listener evaluations of native and foreign-accented speech. Language Learning, 48, 159–182.
Munro, M. J., Derwing, T. M., & Morton, S. L. (2006). The mutual intelligibility of L2 speech. Studies in Second Language Acquisition, 28, 111–131.
Muthuswamy, N., Smith, R., & Strom, R. B. (2004, May). "Understanding the problem": International teaching assistants and communication. Paper presented at the Annual meeting of the International Communication Association, New Orleans, LA.
Myford, C. M., & Wolfe, E. W. (2000). Monitoring sources of variability within the Test of Spoken English assessment system (TOEFL Monograph No. RR-00-06). Princeton, NJ: Educational Testing Service.
O'Loughlin, K. (2007). An investigation into the role of gender in the IELTS oral interview. In L. Taylor & P. Falvey (Eds.), IELTS collected papers: Research in speaking and writing assessment (pp. 63–95). Cambridge: Cambridge University Press.
Orr, M. (2002). The FCE Speaking test: Using rater reports to help interpret test scores. System, 30, 143–154.
Papajohn, D. (2002). Concept mapping for rater training. TESOL Quarterly, 36(2), 219–233. Pica, T., Barnes, G. A., & Finger, A. G. (1990). Discourse and performance of international
teaching assistants. New York, NY: Newbury House. Pickering, L. (2001). The role of tone choice in improving ITA communication in the
classroom. TESOL Quarterly, 35(2), 233–255. Pickering, L. (2004). The structure and function of intonational paragraphs in native and
nonnative speaker instructional discourse. English for Specific Purposes, 23(1), 19–43. Plakans, B. S. (1997). Undergraduates' experiences with and attitudes toward international
teaching assistants. TESOL Quarterly, 31(1), 95–118. Plakans, B. S., & Abraham, R. G. (1990). The testing and evaluation of international teaching
assistants. In D. Douglas (Ed.), English language testing in U.S. colleges and universities (pp. 68–81). Washington, D. C.: NAFSA.
Plough, I. C., Briggs, S. L., & Van Bonn, S. (2010). A multi-method analysis of evaluation criteria used to assess the speaking proficiency of graduate student instructors. Language Testing, 27(2), 235–260.
73Rater effects in ITA testing: ESL teachers’ versus American undergraduates’ judgments of accentedness, comprehensibility, and oral proficiency
Powers, D. E., Shedl, M. A., Wilson-Leung, S., & Butler, F. A. (1999). Validating the revised TSE(R) against a criterion of communicative success (TOEFL Research Report No.RR-85-5). Princeton: Educational Testing Service.
Rounds, P. L. (1987). Characterizing successful classroom discourse for NNS teaching assistant training. TESOL Quarterly, 21(4), 643–672.
Rubin, D. (1992). Nonlanguage factors affecting undergraduates' judgments of nonnative English-speaking teaching assistants. Research in Higher Education, 33(4), 511–531.
Rubin, D., & Smith, K. A. (1990). Effects of accent, ethnicity, and lecture topic on undergraduates' perceptions of nonnative English-speaking teaching assistants. International Journal of Intercultural Relations, 14, 337–353.
Saif, S. (2002). A needs-based approach to the evaluation of the spoken language ability of international teaching assistants. The Canadian Journal of Applied Linguistics, 5, 145–167.
Schaefer, E. (2008). Rater bias patterns in an EFL writing assessment. Language Testing, 25, 465–493.
Tyler, A. (1992). Discourse structure and the perception of incoherence in international teaching assistants' spoken discourse. TESOL Quarterly, 26(4), 713–729.
Weigle, S. C. (1994). Effects of training on raters of ESL compositions. Language Testing, 11, 197–223.
Weigle, S. C. (1998). Using FACETS to model rater training effects. Language Testing, 15(2), 263–287.
Weigle, S. C. (1999). Investigating rater/prompt interactions in writing assessment: Quantitative and qualitative approaches. Assessing Writing, 6(2), 145–178.
Williams, J. (1992). Planning, discourse marking, and the comprehensibility of international teaching assistants. TESOL Quarterly, 26(4), 693–711.
Winke, P., Gass, S. M., & Myford, C. M. (in press). The relationship between raters' prior language study and the evaluation of foreign language speech samples. Princeton: Educational Testing Service.
Xi, X., & Mollaun, P. (2009). How do raters from India perform in scoring the TOEFL iBT speaking section and what kind of training helps? (TOEFL iBT Research Report No. RR-09-31). Princeton, NJ: Educational Testing Service.
Yook, E. L., & Albert, R. D. (1999). Perceptions of international teaching assistants: The interrelatedness of intercultural training, cognition, and emotion. Communication Education, 48, 1–17.
Zhao, Y. (1997). The effects of listener' control of speech rate on second language comprehension. Applied Linguistics, 18, 49–68.
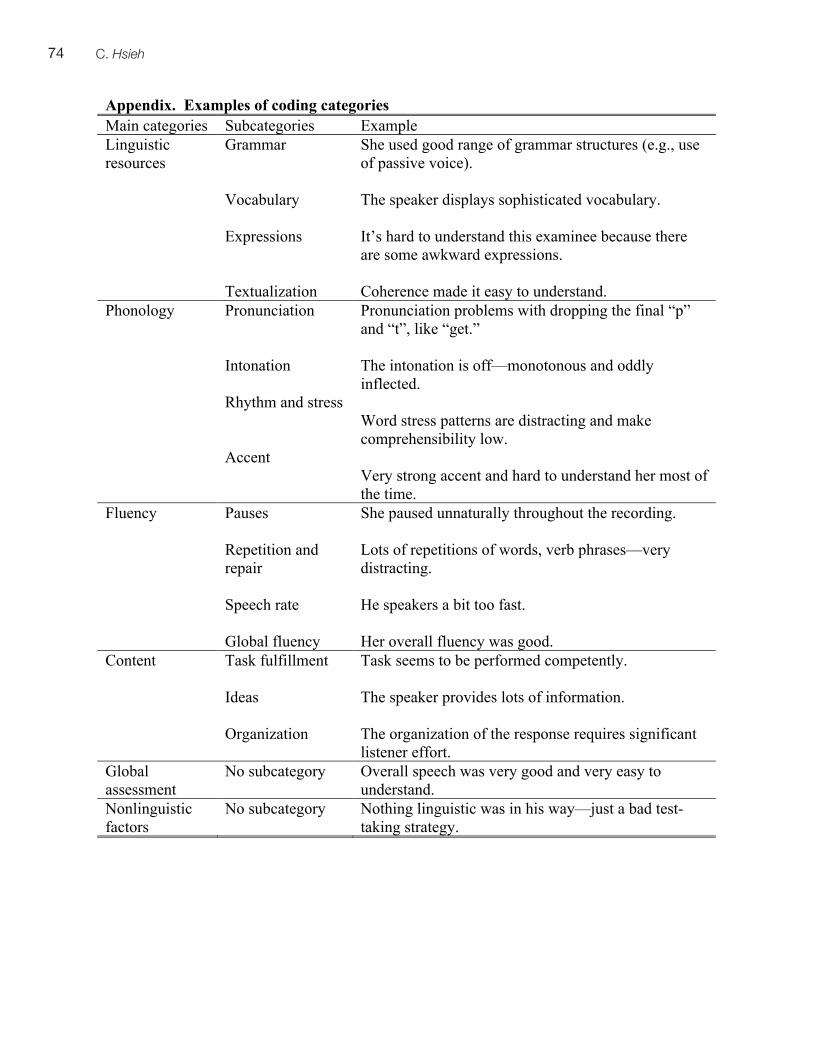
74 C. Hsieh
Appendix. Examples of coding categories
Main categories Subcategories Example Linguistic resources
Grammar Vocabulary Expressions Textualization
She used good range of grammar structures (e.g., use of passive voice). The speaker displays sophisticated vocabulary. It’s hard to understand this examinee because there are some awkward expressions. Coherence made it easy to understand.
Phonology Pronunciation Intonation Rhythm and stress Accent
Pronunciation problems with dropping the final “p” and “t”, like “get.” The intonation is off—monotonous and oddly inflected. Word stress patterns are distracting and make comprehensibility low. Very strong accent and hard to understand her most of the time.
Fluency Pauses Repetition and repair Speech rate Global fluency
She paused unnaturally throughout the recording. Lots of repetitions of words, verb phrases—very distracting. He speakers a bit too fast. Her overall fluency was good.
Content Task fulfillment Ideas Organization
Task seems to be performed competently. The speaker provides lots of information. The organization of the response requires significant listener effort.
Global assessment
No subcategory Overall speech was very good and very easy to understand.
Nonlinguistic factors
No subcategory Nothing linguistic was in his way—just a bad test-taking strategy.