Embed Size (px)
Citation preview

© NIEPA
Journal of Educational Planning and Administration Volume XXXI No. 2 April 2017
National University of Educational Planning and Administration 17-B, Sri Aurobindo Marg, New Delhi 110016

© NIEPA
ISSN 0971-3859
© NATIONAL UNIVERSITY OF EDUCATIONAL PLANNING AND ADMINISTRATION, 2017 (Declared by the Government of India under Section 3 of the UGC Act, 1956)
Annual Subscription
Within India Outside India (By Airmail)
Individuals ` 150 US $ 60
Institutions ` 350 US $ 85
Annual Subscription commences with January and ends with October every year. NUEPA offers 20% discount on subscription for three years and above
Advertisement Tariff (For one issue)
Full Page ` 2000 US $ 100
Half Page ` 1100 US $ 055
Bank draft may be sent to the Deputy Publication Officer, NUEPA in the name of the National University of Educational Planning and Administration payable at New Delhi.
Published by the Registrar, National University of Educational Planning and Administration, 17-B, Sri Aurobindo Marg, New Delhi–110016 and printed by the Publication Unit, NUEPA at M/s. Anil Offset & Packaging, New Delhi–110060.

© NIEPA
Editorial
As I superannuate from NUEPA on 31 May, 2017 after 42 years of teaching and research, including 35 years in NUEPA, this will be the last issue of the Journal that I edit , though I have nearly finalised the July 2017 issue also. Hence, this farewell editorial.
I was given the honour of being the Editor of the Journal in 1990 when it was in its infancy, which I enjoyed all these 27 years. During this period, the Journal went through a major transformation. The first challenge for me was to ensure that we receive a good number of scholarly articles and gradually and fully transform it from its earlier form - the EPA Bulletin into a professional journal of reasonably respectable quality and standard. A letter inviting submissions to the Journal was sent to many institutions and individuals. Scholars from India and abroad began responding to the call for papers and in a short time, we could begin to get good articles in good numbers. In the meanwhile, the Journal was registered with the Registrar General of Newspapers [and periodicals] of India and ISSN was acquired; an external refereeing system has been introduced; and an international editorial advisory board was constituted. The design of the cover, which was made by Jandhyala KunjVihari, and which still continues till today, the periodicity, the dates and the entire publication – all were standardised and every issue was published without a miss, and without making a combined or double issue. Each issue is about 100 pages, with four major articles, one or two Ph.D., M.Phil. and other research abstracts, and 4-5, sometimes nearly ten reviews of books. An annual index of contents of the Journal was included in the last (October) issue of every year. Each issue also includes main contents of the next issue of the Journal, in addition to the contents of the previous issue, which means that we could plan at least an issue ahead. The Journal is published very regularly and almost in the relevant quarter of the year. Authors are happy to receive a few hard copy reprints and an electronic reprint in pdf format, along with a hard copy of the issue of the Journal. The acceptance rate is about 40 per cent, and on an average, it takes about 15-24 months from the date of submission to final publication. The current circulation is nearly one thousand. These small efforts are indeed big achievements for a small academic institution-based journal.
During this period, I could contribute to elevating the Journal to a reasonably high standard, essentially because of the cooperation that I received from the fraternity. Scholars from various parts of the globe not only submitted articles for consideration for publication in the journal, but also waited patiently, sometimes for very long periods for their publication. Almost every expert we approached, has kindly and favourably responded to our request to review the papers, and only for the love of labour, they have reviewed papers and offered very useful comments and suggestions. In return, we only offered a one-year complimentary subscription to the Journal, which many appreciated. Many publishers showed special interest in getting their books reviewed in the Journal. Young as well as experienced scholars enthusiastically reviewed books for the journal. Very rarely I received a negative response from any scholar to any of my requests.
Some of the prominent scholars whose contributions we had the privilege of publishing in the Journal include Malcolm Adiseshiah, Jacob Aikara, Philip G Altbach, M Anandkrishnan, Michael Apple, Akria Arimoto, R. V. V. Ayyar, J. L. Azad, Aparna Basu, Jere Berhman, André Béteille, H. S. Bhola, Mark Bray, Gerald Burke, B. K. Roy Burman, Nicholas Bernett, Martin Carnoy, Karuna Chanana, Barry R. Chiswcik, Hamish Coates, David Crook,

© NIEPA
Ravindra Dholakia, Anita Dighe, Jean Dréze, P. Duraisamy, Birger Frederiksen, S. Gopinathan, N. Jayaram, Jeevan Reddy, Jacques Hallak, Grant Harman, Bruce Johnstone, Cheng Kai-ming, V. N. Kothari, Amitabh Kundu, Daniel C. Levy, Keith Lewin, T. N. Madan, Tapas Majumdar, Simon Marginson, Walter McMahon, Noel McGinn, Simon McGrath, Mrinal Miri, A. M. Nalla Gounden, Wang Libing, Sylvain Lourie, Kuldeep Mathur, Nasafumi Nagao, Martha Nussbaum, T. K. Oommen, P. R. Panchamukhi, K. N. Panikkar, I. G. Patel, Prabhat Patnaik, K. Seeta Prabhu, Mahendra K. Premi, George Psacharopoulos, Furqan Qamar, C. Rangarajan, V. V. Bhanoji Rao, Moonis Raza, Fernando Reimers, Yusuf Sayed, Joel Samoff, Bikas Sanyal, Padma Sarangapani, Anand Sarup, Amartya Sen, Ghanshyam Shah, K. R. Shah, Sresh C. Shukla, R. P. Singh, David Stephens, Nelly Stromquist, K. Sundaram, A. Vaidyanathan, Padma Valeskar, Kapila Vatsyayan, Pravin Visaria, Hans Weiler and Wang Yibing. This short list is only to show that the Journal could attract contributions from eminent scholars from all over the world.
A good number of Indian and international journals are received by NUEPA Library in exchange. Exchange arrangements are also made with many journals for publication of content pages of the journals on a reciprocal basis.
A special 300-page issue containing the 25 years cumulative index of the Journal was brought out in 2012 (January), which has been found to be a good reference volume.
Now the Journal/its articles are included in the Indian Citation Index, Journal of Economic Literature (American Economic Association), and Contents Pages in Education. It also figures in several other social science based databases of the journals. It is also included in the list of India’s UGC-approved journals.
The journal also provided rich reference material for the scholars. Mostly based on contributions to the Journal, National Institute of Educational Planning and Administration produced Education, Society and Development (ed. Jandhyala B G Tilak, APH Publishers, New Delhi, 2003), a volume of 40 articles published , to commemorate the 40-th year of founding of the Institute. Drawing from the Journal, another volume was brought out with 22 articles focusing on literacy and adult education (Literacy, Adult Education and Development, Eds., A Mathew and Jandhyala B G Tilak, Shipra Publications, 2014). Another volume, Gender in Contemporary Education Research (eds., Ratna Sudarshan and Jandhyala B G Tilak, Gyan Publishers 2017, in press) is also based mostly on the contributions to the Journal.
The Journal is now recognised widely as a respectable, high quality journal in the area of educational policy, planning and administration at the national and even global levels– as the only one at all-India level, and one of the top few journals in the world in its specialised area.
All this could be achieved mainly because of the enthusiastic cooperation, advice and assistance received from the members of International Editorial Advisory board -- Professors Philip G Altbach, Karuna Chanana, Jean Dreze, P. Duraisamy, Ratna Ghosh, N. Jayaram, Cheng Kai-ming, A. H. Kalro, V. N. Kothari, A. K. Shiva Kumar, Amitabh Kundu, Keith Lewin, Angela Little, T. N. Madan, Tapas Majumdar, Ashok Mathur, Kuldeep Mathur, V. K. Natraj, P. R. Panchamukhi, George Psacharopoulos, and Bikas C. Sanyal. Though not on the Board, Professors Amrik Singh, Suresh C. Shukla, M. B. Buch, K. B. Powar and many others with immense experience with academic journals, have helped me with sound advice at various stages. The cooperation I received from a large number of expert referees, authors, and reviewers of books has been of a very special kind and order.

© NIEPA
I have also received good backing from a small support staff at NUEPA. The support staff includes Mr Mukesh Kumar and Mr Anil Gupta, who provided excellent secretariat support, Mr Pramod Rawat, Deputy Publication Officer, Mr Amit Singhal, Publication Assistant, Mr M. M. Ajwani, earlier Deputy Publication Officer, Mr S. K. Mallik, Mr Padam Singh, along with Mr Jai Prakash and late Mr Hakim Singh, who worked for a long time with a great sense of devotion. None of them is exclusively designated full time to the Journal. I have also received excellent support from Directors/Vice Chancellors of the Institute – Professors Satya Bhushan, Kuldeep Mathur, B. P. Khandelwal, P. K. Joshi, Ved Prakash, and R. Govinda, who gave me complete academic freedom, having rarely intervened in academic affairs of the Journal.
It is really a long period to spend 27 years with one journal; but I enjoyed working for it and did benefit a lot from my interactions with a variety of scholars and from reading their varied contributions. I would like to place on record my deep sense of gratitude and appreciation of the contributions made by several individuals in helping me in my endeavor in taking the Journal to a respectable level.
I hope all of you will extend the same kind of cooperation to the new Editor/team, yet to be identified for the Journal. All further correspondence regarding the Journal may be mailed to [email protected].
Thank you and goodbye.
Jandhyala B. G. Tilak
Editor

© NIEPA
JOURNAL OF
EDUCATIONAL PLANNING AND ADMINISTRATION Vol. XXXI No. 2 (April 2017)
CONTENTS
ARTICLES
Right-based Approach to Education Justice B. P. Jeevan Reddy
85
A Framework for Education Systems Reform and Planning for Quality Harry Anthony Patrinos, Eduardo Velez and Catherine Yan Wang
93
Demand for Private Tuition — A Quantile Regression Analysis of Household Expenditure on Private Coaching in India T. Lakshmanasamy
115
Transition from Elite to Mass System of Higher Education in India — What does Massification Mean for Equality? S. Srinivasa Rao
141
RESEARCH ABSTRACT
The Impact of Metacognitive Abilities of Teachers and their Ninth Class Students on the Achievement in Biological Sciences Md. Afroz Alam
157
BOOK REVIEWS (See overleaf)

© NIEPA
BOOK REVIEWS
Education and Empowerment in India: Policies and Practices (Avinash Kumar Singh (ed.)) Prakash Sarangi
163
Educating Ex-criminal Tribes – Issues and Concerns (Malli Gandhi) V. Sucharita
167
The Holy Grail: India’s Quest for Universal Elementary Education (R.V. Vaidyanatha Ayyar) A. Mathew
169

© NIEPAJournal of Educational Planning and Administration Volume XXXI, No. 2, April 2017, pp. 85-92
© National University of Educational Planning and Administration, 2017
Rights-based Approach to Education#
Justice B.P. Jeevan Reddy*
The importance of education in a country like ours, especially the importance of school education, is undeniable. The society, including the State, has been well aware of this importance, though in actual fact, there has been an inexplicable failure in achieving the goal of universal education. The judgement of the Supreme Court in Unnikrishnan case (1993), declared for the first time that the right to free education is a fundamental right of all citizens in this country, until they complete the age of 14 years. This was the first occasion when the right to education – no doubt of school education for children until they complete the age of 14 years – as a fundamental right was recognised and declared by the Supreme Court, whose decisions constitute law and are binding upon the entire country.
It may be interesting to note that out of the five judges who constituted the bench that decided the case, only three (including myself) supported the view that the Right to Education of the children in terms of Article 45 constitutes a Fundamental Right. Two other judges observed that since the court cannot create a new Fundamental Right, it would not be proper on the part of the Court to declare such a right. This fundamental right was inferred by the Court from Article 21 of the Constitution read with the Directive Principles of State Policy – in particular Article 45. But it is not, as if this judgement came out of blue. It is not as if one fine morning, the judges woke up and suddenly made this declaration. It was the culmination of a very significant, indeed a radical development, in the constitutional interpretation and in particular, with respect to the interplay of the Fundamental Rights and Directive Principles of State Policy. All of you are aware that while Part III of our Constitution confers certain Fundamental Rights upon the citizens of this country – indeed some of those rights are available even to non-citizens. (For example, Right to equality and Right to personal liberty are not confined to citizens.) However, most of the fundamental rights including Freedom of Association, Freedom of Speech, Freedom to carry on trade, profession and occupation, etc., are confined to citizens.
The Fundamental Rights in Part III of the Constitution are enforceable through a court of law, including by way of a writ petition under Article 226 or under Article 32, as the case may be. Part IV of the Constitution sets out the Directive Principles of State Policy which the Constitution itself declares “shall not be enforceable by any Court, though the said principles
# Inaugural Address delivered in the National Policy Seminar on `Right based Approach to Education -
Policy, Premises and Practices' held at the National University of Educational Planning and Administration on February 15-16, 2016.
* Plot No. 301, Road No. 25, Jubilee Hills, Hyderabad, Telangana. Email: [email protected]

© NIEPA Rights-based Approach to Education
86
are nevertheless fundamental in the governance of the country”. There is a qualitative difference between how the Fundamental Rules in Part III are worded and how the principles in Part IV are worded. While the Fundamental Rules are rights conferred upon individuals – the Directive Principles are directions addressed to the State – which means Central Government, State governments and all organs exercising governing power – to strive, to endeavour and to ensure that the objectives/goals set out in Part-IV are made available to all the people. An example from these two Parts will bear out what I say. Article 19 (1) in Part III says “All citizens shall have the right to freedom of speech and expression”. Article 39, which is the most important Directive Principle, together with Article 38, says “the State shall direct its policy towards securing – (a) that the citizens, men and women equally, have the right to an adequate means of livelihood”. One of the clauses in Article 39 which is relevant to the present topic is in clause (f), which speaks of the States’ obligation to strive to secure “(f) that children are given opportunities and facilities to develop in a healthy manner and in conditions of freedom and dignity and that childhood and youth are protected against exploitation and against moral and material abandonment”. How can this obligation be discharged if the people are not educated and are aware of their rights and duties?
I may now refer to Articles 45 and 41, which too are found in the Chapter relating to Directive Principles of State Policy.
“Article 45: The State shall endeavour to provide, within a period of ten years from the commencement of this Constitution, for free and compulsory education for all children until they complete the age of fourteen years.
Article 41: The State shall, within the limits of its economic capacity development, make effective provision for securing the right to work, to education and to public assistance in cases of unemployment, old age, sickness and disablement, and in other cases of undeserved want.”
To recapitulate, while Fundamental Rules can be enforced by any and every person by directly approaching a court of law, citizens do not have a right to approach the court to direct the State to secure a particular directive principle. You cannot go to a court and say “this is Directive Principle to the State and, therefore, you should direct the State, to implement it”. No, you cannot do this. As a matter of fact, soon after the enforcement of the Constitution in 1950, a case arose in the Supreme Court - State of Madras vs Champakam Dorairajan – in the year 1951, wherein the Court observed that while the Fundamental Rights are preeminent, the Directive Principles are not enforceable and, therefore, cannot prevail over the Fundamental Rights. Within a few years, however, there was a significant change in the thinking of the Supreme Court on the interplay and interrelationship of the Fundamental Rules and the Directive Principles. But, before I refer to this change, let me explain the context in which the case in Champakam Dorairajan arose. It is really interesting and many younger people (who are not students of law) may not know it. Even before Independence there was a government order (GO) called ‘Communal GO’ in force in the then Madras Presidency. This GO distributed the seats, in professional colleges, among the various sections of society in accordance with their proportion to the total population of the Presidency, i.e., among forward castes, backward castes, depressed classes, muslims, minorities, etc. This GO was challenged after the Constitution came into force, as contrary to the constitutional guarantee of equality enshrined in Articles 14 and 15 in the Constitution. The High Court and Supreme Court struck down the GO on that basis. It was while deciding
© NIEPA Justice B. P. Jeevan Reddy
87
the case that for the first time, the question arose whether the Directive Principles can be called in aid for qualifying or to modulate or to interpret in a particular manner any of the Fundamental Rights. The court said, ‘No’, but, that was in 1951. Over the years, a radical change occurred in the Constitutional interpretation. The whole thinking underwent a change consistent with the developing political and economic scenario.
The most important Amendment after the Constitution was adopted was the First Amendment, 1951 which not only enabled radical changes in the land-holding, ushering in the agrarian revolution, it also empowered the State to establish monopolies in the fields of trade and industries. It also empowered the State to take over/administer economic entities. The then Prime Minister, Jawaharlal Nehru declared that as the State was aiming to achieve a more equal and egalitarian society, nobody can complain of violation of his fundamental right to trade being taken away by the creation of a State monopoly. This and the subsequent Constitutional amendments influenced the judicial thinking as well. In 1957-58, the Kerala Education Bill came up for consideration before the Supreme Court. It is a long history how the Kerala State, ruled by the Communist Party, framed the particular enactment to control, by law, the educational institutions in the State, and how it was challenged as impinging upon the rights of the minorities. Article 30 states that religious or linguistic minorities have a right to establish and administer educational institutions of their choice. These are the words which have created a good amount of problems later, i.e., the expressions, `linguistic minorities’, `religious minorities’, and `right to establish and administer educational institutions of their choice’.
In the Kerala Educational Bill case, the Supreme Court held guardedly that “the Court may not entirely ignore these Directive Principles of State Policy but should adopt the principle of harmonious construction and should attempt to give effect to both (i.e., Fundamental Rights and Directive Principles) as much as possible”. This trend gathered pace with the passing of years, influenced, no doubt, by the First, Fourth and the subsequent Amendments to the Constitution, and the State declaring a socialist pattern of society, as its goal. In due course, and case by case, Directive Principles were given more and more importance - ultimately, giving them the same importance as the Fundamental Rights.
While it is not necessary to refer to the various stages of this development, it would be relevant to refer to the decision of the larger Constitution Bench of 13 judges in Kesavananda Bharati vs State of Kerala (1973). The several opinions rendered in this case say that both Parts III and IV have to be balanced and harmonised and that then alone can the dignity of the individual be achieved. It was observed that these two Parts are meant to supplement each other, to achieve the society informed by Justice – social, economic and political and to assure equality in all spheres of life – the goal set out in the Preamble to the Constitution and in Article 38 (1). Then we come to the decision in Bandhua Mukti Morcha (1984), where it was held that the right to life guaranteed by Article 21 does take in “educational facilities” as well. But before I refer to this decision, which provided the basis for the later decisions in Unnikrishnan (1993), it is necessary to point out that Article 21, an article in the Fundamental Rights chapter, declares that “No person shall be deprived of his life or personal liberty, except according to procedure established by law”. Over the years, the Supreme Court, following the same trend as mentioned above, proceeded to hold in a number of decisions that the expression “life” in Article 21 does not mean mere animal life but a life of dignity, as befits a human being, which means that it encompasses all the

© NIEPA Rights-based Approach to Education
88
attributes that are required for a normal human being to lead a life of dignity. This concept was elaborated and expanded in Bandhua Mukti Morcha, to say:
“This right to live with human dignity enshrined in Article 21 derives its life breath from the Directive Principles of State Policy and particularly clauses (e) and (f) of Article 39 and Articles 41 and 42 and at the least, therefore, it must include protection of the health and strength of workers, men and women, and of rather tender age of children against abuse, opportunities and facilities of children to develop in a healthy manner and in conditions of freedom and dignity, educational facilities, just and humane conditions of work and maternity relief. These are the minimum requirements which must exist in order to enable a person to live with human dignity”.
The expression “educational facilities” in the said judgement in the context of the development of law regarding interrelationship of the Fundamental Rights and the Directive Principles, led the bench which decided Unnikrishnan case to say that Article 45 should be read together with Article 21. I will elucidate: Article 45, as already noticed, states “the State shall endeavour to provide within a period of 10 years from the commencement of this Constitution, for free and compulsory education for all children until they complete the age of 14 years”. It is significant that Article 45 is the only article in the Constitution which prescribes a period of 10 years within which a particular constitutional goal has to be achieved – in this case, the free and compulsory education to all the children in the country. This requirement is not qualified by the limits of economic capacity or any other constraint. It is absolute in nature. It was a goal which had to be achieved. Of course, the right to education beyond 14 years is qualified by the limits of economic capacity and development of the State, by Article 41, which says that “the State shall, within the limits of economic capacity and development, make effective provision for securing the right to work, to education and to public assistance in the case of unemployment and in other cases of undeserved want”. The decision in Unnikrishnan pointed out that even though more than 40 years had passed by the date of the said judgement since the enforcement of the Constitution, the obligation placed upon the State by Article 45 remained unfulfilled in a substantial measure. The decision emphasised the importance of education and in particular, the importance of school education for the successful functioning of a democratic society. It was pointed out that from the earliest times, this country attached the greatest importance to education and stressed its necessity for becoming a complete human being. (Fortunately, this decision in so far as it declares that right to free education until the citizens of this country attain the age of 14 years is a fundamental right, has not been departed from, by the Supreme Court, in its subsequent decisions though the said decision in so far as it regulated the admissions into medical and engineering colleges was overruled by a subsequent larger bench).
Once the decision in Unnikrishnan case was announced, a campaign started by several well meaning persons and non-governmental organisations – i.e., all of you - to give a Constitutional status to this right. Several drafts were made from time to time for inserting an article in Part III, guaranteeing this right as a Fundamental Right. The rest is history, the amendment of the Constitution, making the Right to Education, the merits and inadequacies of the Act, you are well aware of all that. I need not speak about it.
Incidentally, I may point out that after my retirement from the Supreme Court and when I was appointed the Chairman of the Law Commission of India, the Law Commission prepared a report on this very issue. Based upon the decision in Unnikrishnan case, the said

© NIEPA Justice B. P. Jeevan Reddy
89
report recommended various steps to be taken by the State to ensure that the goal contemplated by Article 45 becomes a reality.
II
Now I come to the next part of my address. If you ask me to name the two biggest failures of the post-Independence India – they are the education sector and health sector. The State, I mean, the Central Government, State governments and all the organs exercising governing power, has, in the course of time, allowed both these sectors to go to sleep, encouraging, at the same time, the private sector to thrive. It is admitted on all hands that the quality of education imparted in the government schools, whether in urban or rural areas, is deplorable, barring the exception of some institutions of excellence, like Kendriya Vidyalayas. It is to be noted that these Kendriya Vidyalayas are in the nature of special schools and have proved that given the resources, commitment and control, government schools can also deliver – and deliver better than the expensive schools run by private bodies as for-profit institutions. But that is a special category. Lack of discipline on the part of the teachers and an almost total absence of regulation by the higher authorities to ensure that the teachers do their duty properly, has led to a situation where the government schools have become the last priority. The uncontrolled mushrooming of the private schools is continuing to give the government schools a bad name. It is significant to notice that so far as colleges are concerned, they do not conduct their examinations, they do not award their own degrees/certificates. They follow the syllabus of the government colleges and their students appear for the university examinations and degrees are also awarded by the affiliating universities. In other words, these private institutions supplement the governmental effort to impart education. If so, what applies to governmental activity, should also apply to these private colleges. Of course, the present trend in the Supreme Court is to the contrary. Hence, I would not dilate upon this.
Indeed, one aspect of the Unnikrishnan judgement was to regulate the admission to medical and engineering colleges on the basis of merit. However, since you require money, it was directed that they can collect a higher fees from 50 per cent of the students (called payment seats) while the remaining 50 per cent students will be charged the same fees as is charged in government colleges (free seats). Even in the matter of admission to payment seats, merit was directed to be followed. This system worked for about eight years, but then a larger bench of the Supreme Court overruled this part of the judgement in Unnikrishnan case. They said, this system offends the rights of the minorities guaranteed under Article 30 as also the right to carry on occupation/business of one’s choice. It is interesting to note that there was a good amount of controversy regarding the precise ratio of this larger bench judgement (TMA Pai). Several subsequent judgements put their own interpretation upon it – ultimately, it looks as if, this Court is veering to the view that State can regulate the admissions of students into these colleges – the basic thought of Unnikrishnan. Meanwhile, for a few years after TMA Pai decision, there was a full flow of private enterprise in the matter of admission of students, appointment of staff, leading to several abuses. In Andhra Pradesh, private educational institutions (medical and engineering colleges) conducted their own examinations (for admission). They collected whatever they could. These colleges functioned as if they were free from any regulation. In the course of time, however, the Court has come to recognise the State’s right to regulate admissions into these colleges, the latest

© NIEPA Rights-based Approach to Education
90
judgement being the one delivered in a Madhya Pradesh case in the year 2016. So far, so good.
This is in contradiction to what happened in communist countries – and in some of the disciplined societies. We all know that in communist countries the State ensures its citizens the best educational facilities and the best health facilities, including in the matter of sports. A small country like Cuba, despite the harsh sanctions imposed upon it by the US and certain other Western powers, could develop its health sector so as to send umpteen number of doctors to Africa and other South American countries. It achieved the highest standard of health care and serves as an example of how discipline – including self-discipline – makes all the difference. I need not multiply the examples. Let alone communist countries, even some states in South-east Asia and Latin America, have done equally creditably. This shows that it is not the money that counts – what matters is the discipline and a sense of purpose. Whereas, in our country, unionisation, political interference, interference by courts with the day-to-day functioning of schools, colleges and even universities, has bred an atmosphere of indiscipline, lack of respect for the rules and the norms. This has played and is playing havoc with our education system and ultimately with the society itself. This is apart from the fact that the lay-out on education by the government – both centre and states put together – is far below the 6 per cent norm. As a matter of fact, the shifting of ‘education’ from the State List to the Concurrent List, by the 25th Amendment Act has indeed made education an uncared for baby.
Why did such a situation arise? To start with, there were only government or municipal schools. A number of schools were also run by religious and charitable institutions. Indeed, the role of Christian missionary schools in this regard presents a shining example. But with the growing student population, none of them could meet the total demand. Thus, came into picture the private schools which were taking governmental aid, and imparting education more or less on the same level as that of the government schools. But, thereafter came the private schools, which did not want governmental aid but chose to charge high levels of fees, promising to impart high quality education to the students. An example may suffice, people of my generation, including myself, were educated in government schools, but all our children went to missionary schools whereas our grand children are going to expensive private schools. In course of time, a clear class distinction has come about among the schools. The poorest go to the government schools, the next higher income category goes to ordinary run of private schools and above them are the private schools, which provide air-conditioned classes, air-conditioned buses for transport and all kinds of amenities. This is class distinction, even within a class, layers of distinction have come about. It is not correct to think that today there is no recognition of importance of education among the poorer classes. They are aware of the importance of education and of the necessity to educate their children in a proper atmosphere. But, the question is one of affordability. For example, take Class IV employees in the government. They send their children to private schools, undergoing a good amount of financial hardship. They think that by educating their children in a good school, their future will be bright. As Smt Shanta Sinha has observed in one of her articles:
“…There is an emergence of a large variety of private schools to respond to parental demand for education. This has resulted in a differentiated school system reflecting class imbalances. Thus, on the one hand, there are the inefficient wasteful government schools struggling for resources and its students continuing to attend them in full faith that it is only education that can redeem them from the world of deprivation and vulnerability. Their

© NIEPA Justice B. P. Jeevan Reddy
91
survival in the school system under these circumstances is not by design but by a sheer accident. Amidst a huge presence of government schools, there are, on the other hand, fee-charging one-room English medium private schools with untrained school teachers at one end of the spectrum and fully furnished air-conditioned corporate schools at the other end. Private schools guided by the logic of the market have begun to sell their wares ‘to each according to their ability’. Thus there are as many schools as layers in the society. There is a trend in more and more number of such children leaving government schools for the private schools. Such a mushrooming of private schools has a profound impact on the society as it reproduces class inequalities, fractures society into multiple layers, freezes mobility of its citizens to move up, causing divisiveness and disharmony.”
These words, coming from a well accepted authority in this field, depict the stark reality obtained today in our school system. But then, there have been suggestions to integrate the students coming from various strata of society in private schools so that the children across class, region, occupation, caste and other differences gain collective experience, besides providing an opportunity for socialisation in a manner that allows the poor child to be on par with his peers - seizing opportunities with confidence. There is no reason why this practice should not be enforced and that too rigorously. It is well-known that the private educational institutions approach the government for allotment of land at concessional rate, supply of power and water at concessional rates, and also for exemption from the property taxes. Land is allotted to them at a fraction of the market price. The question is why is this being done and for what? Gaining such advantage from the State and from the society imposes a corresponding social obligation upon these schools to render service to the society in return and this they can do by admitting children from the poorer categories into their schools and trying to instill in them a sense of equality and camaraderie, thereby seeking to achieve the principle of universality. I do realise that there are problems in implementing this course of action. There are certain practical problems as well. I have heard that in such situations, the children coming from poor categories are ridiculed by other students, looked down upon by the teaching faculty and their low scores are laughed at. But this is bound to happen in the beginning, but in course of time, these students will overcome their handicaps and will be able to compete with others on an equal footing. The Kendriya Vidyalayas provide an answer.
In fact, somewhere in 1996, there was an occasion for me to say in the Supreme Court that these private educational institutions come to the government for allotting land on concessional rates; they ask for and obtain various types of concessions. But what are they going to do in turn for society?’ It was held that these schools should admit students from the poorer classes to the extent of say 20 per cent. Initially, of course, there will be problems, but in the course of time, they get adjusted.
An example would suffice. Look at the reservation provided in legislatures and in Panchayat bodies. People laughed at these representatives saying: `I know, this SC man has not studied even up to Standard II. He is elected, but in reality, he is a dummy of another powerful man/landlord. He does, what his landlord says.’ Yes, it was true of the first election. But in course of time, second, third elections, they became aware, experienced and wise; they came to know the significance of power.
Let us hope, trust and pray that integration takes place. There ought to be uniform standards of education, not only in government, but also in private schools. We should be trying to integrate students, bring them together so that there is all-round development.

© NIEPA Rights-based Approach to Education
92
III
There is yet another problem afflicting the education sector and that is the problem of “minority institutions” claiming to rely upon Article 30 of the Constitution, which guarantees to the religious and linguistic minorities the right to establish and administer educational institutions of their choice. This right of the minorities is said to be and has been held by courts to be an absolute one, permitting only regulation by the educational authorities to ensure the standard of education: In practice, however, these institutions have come to enjoy an autonomous existence, free of any kind of control or regulation by the State. The problem is not merely with religious minorities but also with linguistic minorities. In India, the situation in this regard is rather curious. As we know there are several linguistic States. Take for example, the State of Andhra Pradesh or Telangana, from which I come. In these States, any and every person whose mother-tongue is not Telugu, is a linguistic minority. To put it more clearly, a Kannada-speaking resident of Andhra Pradesh or Telangana or Karnataka can open a medical college or an engineering college in Andhra Pradesh/Telangana and call it a minority institution because it is established and being administered by the members of a linguistic minority, i.e., Kannada speaking persons. These colleges impart purely secular education, as is done in the government medical colleges and government engineering colleges. No course or subject which is specific to that linguistic minority is being taught in such institutions. Yet they claim to be minority institutions and thus claim to be free to admit students of their choice, free to appoint teaching faculty of their choice, to charge such fee as they think appropriate and that the State or its authorities have no right to question. Similarly, any person from Tamil Nadu, Karnataka, Maharashtra, Gujarat, or for that matter, any other linguistic State, can establish a college or school in Telangana or Andhra Pradesh and call it a linguistic minority institution. Added to the religious minority institutions (which means, in most of the States in India, all persons not professing Hindu religion) claiming similar rights, the scene has become extremely confusing, admitting scope for a good amount of abuse and exploitation of students and the faculty. It is a well-known fact, how these ‘minority’ institutions are mushrooming all over the country, particularly in four southern States and in Maharashtra.
In the case of religious minority institutions, the situation is the same. In Andhra Pradesh, we come across so many Christian “minority” colleges. As a matter of fact, one of the questions referred to for decision in TMA Pai case was, ‘when does an institution become a “minority educational institution” and what are the indicia to determine whether an institution claiming to be a MEI is in truth a MEI or not. But, the larger bench did not choose to answer the said question.
I come to the end of my address. The Right to Education must mean right to quality education, right to education which helps students in their life and career. Imparting of skills and technical education is the need of the hour. Turning out students from mere elementary/higher secondary schools, without imparting them any skill or technical expertise, would give them a mere illusion of being educated – of little practical use to them. They would be joining the multitudes of unemployed young people.
All I say, let us try to build a society where equity and equality prevails. Unless there is a socio-economic equality, rights will be myths. There must be socio-economic equality. The socio-economic equality alone can bring in equality in education, governmental employment and for that matter, in any and every sector of our society.

© NIEPAJournal of Educational Planning and Administration Volume XXXI, No. 2, April 2017, pp. 93-113
© National University of Educational Planning and Administration, 2017
A Framework for Education Systems Reform and Planning for Quality
Harry Anthony Patrinos* Eduardo Velez **
Catherine Yan Wang***
Abstract
The 2030 Social Development Goal to ensure inclusive and equitable quality education and promote lifelong learning opportunities for all was recently set. Despite progress in terms of student enrollment and completion, the quality of learning produced in developing countries remains poor. Existing models of education production are inadequate for informing education reform for the purpose of improving school quality, as measured by student learning. Thus, a broader and more integrated approach of policymaking is put forward. Building on theory and empirical evidence on what works, the paper puts forward a framework for improving the quality of education. The framework includes six factors: (1) Assessment; (2) Autonomy; (3) Accountability; (4) Attention to teachers; (5) Attention to early childhood development; and (6) Attention to culture. Going forward there is a need to develop a system of international quality benchmarks drawing upon a larger body of evidence. Most importantly, more empirical evidence from impact evaluations is needed.
* Harry Anthony Patrinos, Lead Education Economist, World Bank, email: [email protected].
** Eduardo Velez former Education Sector Manager, East Asia Region, World Bank.
*** Catherine Yan Wang, Director, Department for International Exchange, National Institute of Education Sciences of China.
All views expressed here are those of the authors and should not be attributed to their respective organisations.

© NIEPAA Framework for Education Systems Reform and Planning for Quality
94
Introduction
In 2000, the World Education Forum in Dakar, Senegal set the goal that by 2015, all children will have access to, and complete, free, and compulsory primary education of good quality. Despite progress made in terms of enrollment and completion rates, the quality of learning outcomes in developing countries remains a formidable challenge. According to the most recent statistics, there were still 67 million primary school-age children out of school worldwide in 2009 (UNESCO UIS 2011). Moreover, schools in many developing countries are failing to teach foundational cognitive skills and significant numbers of students do not achieve minimum levels of learning expected (World Bank 2010). Likewise, a large number of developed countries are yet to achieve the goal of quality measured by students’ learning outcomes to all the learners (OECD 2010).
Countries instituted structural, curricular and pedagogical reforms to improve the students’ learning outcomes, yet problems persist. Quality is more and more becoming the central topic in education reform and planning in many countries. What are the key quality drivers underpinning the education reform and planning? What aims and measures are pivotal to the institutional development of education? To address an urgent gap in our understanding of the determinants of quality education, we put forward a framework that can help us understand policy making in the education sector. The framework serves as an over-arching guide to policy making. Nevertheless the relevance of it will only be proved when it is applied across a large number of countries. This paper strives to synthesize the major findings on factors contingent upon educational quality and illustrate the patterns and critical pathways towards the goal of quality, shedding light upon the rationale of education reform in both developing and developed countries.
Conventional Quality framework
How is student learning achieved? A common/traditional approach examines the quality of education focusing on particular components of the education system. At the micro-level, studies tend to focus on student characteristics with respect to their endowments and behaviors, as well as characteristics of their parents or families (Coleman et al. 1966), or focus on schools (Sammons, Hillman and Mortimore 1995; Creemers 1997) and/or behaviors of teachers (Bennett et. al 1976; Hanushek 1971; Wayne and Young 2003; Rivkin, Hanushek and Kain 2005). At the macro-level, quality studies often focus on specific policy actions, programs and reforms, as well as the education system and its organization and institutional characteristics (Bishop 1997; USAID/EQUIP2 2006; Woessmann 2003). Ideally, the economic, political and social contexts are taken into account. For example, some studies about student learning performance scrutinize economic and financial factors (Hanushek 1986, 1996; Greenwald, Hedges and Laine 1996; Levacic and Vignoles 2002). Other studies look into the social context relating to educational quality to dig out the social factors that hinge upon student performance (Hallinger and Murphy 1986; Alexander 2000). Figure 1 illustrates a summary of the traditional quality framework.

© NIEPA Harry Anthony Patrinos, Eduardo Velez and Catherine Yan Wang
95
FIGURE 1
Traditional Quality Framework
Source: Vegas and Petrow 2007: 66
Yet, all these approaches are confined by analysis of the segmented education system. The findings and inferences from those studies are largely detached from the realistic complexities of education. When being applied to diagnose educational problems and reforms, these amount to “treating the symptoms rather than the disease” prescriptions,1 and often do not make a difference in student learning achievement.
As an alternative, this paper suggests a systems approach to view the quality of education, echoing the motif of the World Bank Education Strategy 2020 (World Bank 2011). A key assumption is that the analysis of quality of education has to shift from a factor-dependent approach to a more systemic approach, including an increasing engagement of key quality drivers and prioritizing significant quality elements in the delivery of education services.
1 This is a Chinese saying used in Chinese herbal medicine, originally expressed as “zhi biao bu zhi
ben”, which means that the prescribed medicine treats the symptom of the disease while neglecting the cause of the disease.
Students
Endowment and
Behaviors of
Students
Parents
Families
Education
Policy
Policy actions
Specific
programs
Systemic reforms
Schools
Priori knowledge
and behaviors of
Teachers
Schools
The Education
System
Its organization and
institutionality
Learning
Economic, political,
and social context

© NIEPAA Framework for Education Systems Reform and Planning for Quality
96
Redefining the Quality Framework
The approach employed here provides a broader and more inclusive perspective on education planning and reform than is frequently invoked in traditional educational studies. It builds on the theories and findings from related studies on educational quality. By analyzing the lessons and experiences across countries during the last two decades, the paper addresses gaps and hindrances in improving education quality and thus develops a new framework of quality education.
What are the major constraints against achieving the quality goal across countries? Studies suggest that three central institutional incentives affect learning outcomes: (i) choice and competition, (ii) school autonomy and (iii) school accountability (Bruns, Filmer and Patrinos 2011; World Bank 2004). These institutional incentives were reconceptualized as key policy levers of education systems; that is, autonomy, accountability and assessment – or, the ‘three A’s’ (World Bank 2010; Patrinos 2010a). Apart from the above three institutional factors, three structural quality elements are also pivotal to achieving the goal of quality, yet they are often neglected. These are Attention to teachers, Attention to early childhood development, and Attention to culture, each addressing a dimension contingent upon successful education reform. Together, these 6As represent an input-output-outcome approach tackling the issue of quality. In this framework, quality is viewed more than a goal; it also connotes aims, measures and destinations in concrete terms. Moreover, it integrates institutional, structural and contextual considerations. Policy makers may use these quality drivers to guide decisions about important education sub-system to achieve improved learning. Similarly, education projects and programs could be designed following the 6As in line with the vision of the education authorities. The 6As framework is illustrated in Figure 2.
FIGURE 2
The 6As: An Integrated Approach to Quality Education
Attention to teachers
Attention to ECD
Attention to Culture
Other 1, 2, n
Autonomy
Accountability Assessment
Achievement Learning
© NIEPA Harry Anthony Patrinos, Eduardo Velez and Catherine Yan Wang
97
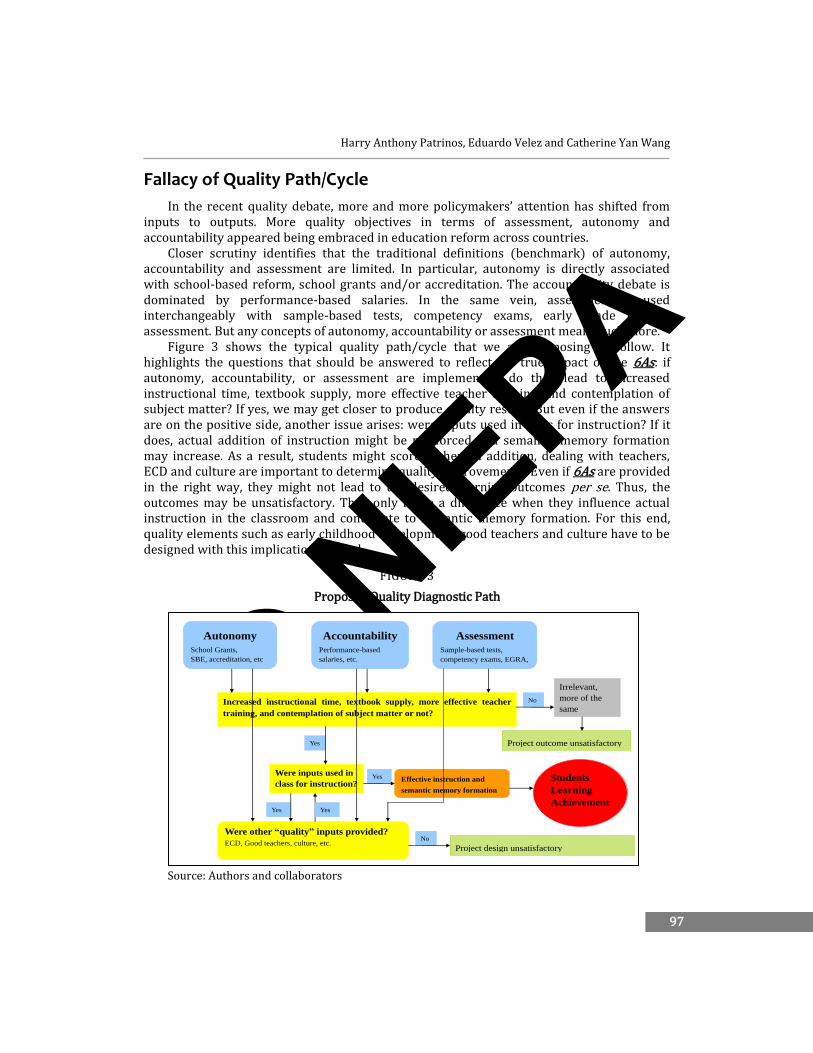
Fallacy of Quality Path/Cycle
In the recent quality debate, more and more policymakers’ attention has shifted from inputs to outputs. More quality objectives in terms of assessment, autonomy and accountability appeared being embraced in education reform across countries.
Closer scrutiny identifies that the traditional definitions (benchmark) of autonomy, accountability and assessment are limited. In particular, autonomy is directly associated with school-based reform, school grants and/or accreditation. The accountability debate is dominated by performance-based salaries. In the same vein, assessment is used interchangeably with sample-based tests, competency exams, early grade reading assessment. But any concepts of autonomy, accountability or assessment mean much more.
Figure 3 shows the typical quality path/cycle that we are proposing to follow. It highlights the questions that should be answered to reflect the true impact of the 6As: if autonomy, accountability, or assessment are implemented, do they lead to increased instructional time, textbook supply, more effective teacher training, and contemplation of subject matter? If yes, we may get closer to produce quality results. But even if the answers are on the positive side, another issue arises: were inputs used in class for instruction? If it does, actual addition of instruction might be reinforced and semantic memory formation may increase. As a result, students might score higher. In addition, dealing with teachers, ECD and culture are important to determine quality improvements. Even if 6As are provided in the right way, they might not lead to the desired learning outcomes per se. Thus, the outcomes may be unsatisfactory. They only make a difference when they influence actual instruction in the classroom and contribute to semantic memory formation. For this end, quality elements such as early childhood development, good teachers and culture have to be designed with this implication in mind.
FIGURE 3
Proposed Quality Diagnostic Path
Source: Authors and collaborators
Were inputs used in
class for instruction?
Autonomy
School Grants,
SBE, accreditation, etc
Accountability
Performance-based
salaries, etc.
Assessment
Sample-based tests,
competency exams, EGRA,
etc
Increased instructional time, textbook supply, more effective teacher
training, and contemplation of subject matter or not?
Were other “quality” inputs provided?
ECD, Good teachers, culture, etc.
Yes
Effective instruction and
semantic memory formation
Yes
Yes
No
Project outcome unsatisfactory
Project design unsatisfactory
Irrelevant,
more of the
same No
Students
Learning
Achievement Yes

© NIEPAA Framework for Education Systems Reform and Planning for Quality
98
Obviously, the fallacy of the quality cycles lies in absence of quality elements in the education system and/or inconsistencies and gaps between these elements. For example, focusing on improving schools as organizations or focusing on improving the performance of individual teachers may be effective, but focusing on improving schools and performance of individual teachers at the same time will be more effective. The interaction of the 6As is more important than the addition of the 6As. Many other examples can be given to illustrate the pivotal difference that is made by pursuing a view of quality as an integrated process of factors that connect with one another. A broad approach of this kind permits simultaneous appreciation of the vital roles, in pursuit of quality education, of many different institutions, including educational institutions, governments and local authorities, market-related organizations and other stakeholders. The relationship between autonomy, accountability and assessment; and attention to teachers, early childhood education and culture is not additive, not even linear; rather, the model is iterative and interactive. In other words, it implies multipliers, not additivity. The following section attempts to elaborate the significance of and the relationship between the proposed quality elements.
Six Quality Elements
Quality Element 1: Assessment
The failure of education reforms in achieving the goal of quality is partly attributable to absence of instruments and procedures that provide information on students’ learning. Take a typical example: studies indicate that students should read a minimum of one word per second, 60 words per minute on the average. If they do not read at this speed, they forget the content as they read, and by the end of the sentence they will not remember what they read at the beginning. So comprehension will not actually occur (Abadzi 2006, 2008). Presumably, the results would be rather different if student’s reading skills were monitored against the corresponding standards, and the pace, content and methods of instruction adjusted accordingly.
Such gaps persist on a larger scale. In developing/low-income countries, ineffective inputs prevail. Developmental delays, minimal instruction time, less practice, unsuitable pedagogy, together with linguistic barriers such as spelling complexities and teaching in non-native languages, lead to low reading skills in grades one to three. It is common that the students cannot process the volume of text and thus cannot understand text used in the follow-up instruction. Typically, they find it difficult to solve math problems in grades three to six. These were eventually translated into low achievement scores in regional and national assessments or international assessments such as PISA, TIMSS in the short term, low basic skills upon graduation, and even low income and low quality of life over the long run. If both students’ and schools’ performance are assessed earlier and the assessment results are used to lever measures and policies to improve education systems, students will end up with different learning and labor market outcomes.
Hence, benchmarks and benchmark-based assessments are the cornerstone of the education planning and reform aiming at quality. Nonetheless, oftentimes assessment is discussed and used interchangeably with tests or examinations; the two de facto are essentially different. While the former serves selection and certifying functions (Hill 2010), the latter collects information on operation of education systems including student

© NIEPA Harry Anthony Patrinos, Eduardo Velez and Catherine Yan Wang
99
achievement levels and contextual information in general. Scores stand at the center of examinations, often to the degree that divert the attention of students and schools to getting good examination results at the expense of learning outcomes, whereas standards and indicators are pivotal to the assessment that benchmarks students’ competencies and assists informed decision making on interventions to improve educational quality. For example, Finland, the best-performing country in PISA, has no national whole age cohort testing in preschool and basic education. The only national examination occurs at the end of upper secondary education (at the age of 18 or 19). Rather it uses national assessment of learning outcomes (which only covers a sample of ten percent of the age group, focusing on grades 3, 5, 7 and 9) and longitudinal assessments to pinpoint areas requiring further improvement in different subjects and within the entire school system (Halinen 2011).
Quality-oriented reform requires a shift from lack of assessment or examination-dominated assessment that test individual students toward assessment to obtain information about the achievements of the education system as a whole for evidence-based planning and reform (Greaney and Kellaghan 2008). It needs both commitment and significant resource and efforts from government and other stakeholders. It is becoming growing priorities of the global development community to rebuild or build the assessment system and to link them with policies, practices, and interventions to improve teaching and learning. Among others, they need to be aligned with autonomy and accountability reform, elaborated below.
Quality Element 2: Autonomy
A growing body of evidence suggests that autonomy-driven reforms could improve students’ learning outcomes (Barrera, Fasih and Patrinos 2009; Bruns, Filmer and Patrinos 2011; Patrinos 2010a). It was documented that most countries whose students perform well in international student achievement tests have instituted autonomy reform by devolving substantial decision-making to local authorities and schools (Patrinos 2010a). The autonomy reform is closely linked with empowering the schools by devolving part or all of decision-making power regarding school management. Nonetheless, the autonomy reforms are not limited to school-based reform. In the autonomy-based structure, the central administration retains responsibility for budgeting and funding, setting policy, and evaluations, decision-making in relation to management and operation of the schools are decentralized to local authority and schools. What counts most is more stakeholders are engaged into the educational process in terms of ownership, resources and voice.
A well-designed autonomy reform features the following characteristics:
To empower a school by giving it ownership To reinforce the school’s resource base by mobilizing social forces To build up relevance of the school education To enhance the school’s competitiveness
The case of Netherlands illustrates how school autonomy yields efficiency gains and improves the quality of learning. Netherlands might be the country with the longest tradition of an autonomy-based education structure. The schooling system is characterized by freedom of education—freedom to establish schools, to organize teaching and to determine the principles which fosters competition among the schools. While all schools are

© NIEPAA Framework for Education Systems Reform and Planning for Quality
100
government-funded, most schools are administered by private school boards. At the same time, school choice is promoted as a means of increasing competition in the system. As a result, the majority of students are enrolled in private schools and the proportion is increasing. This competition eventually led to efficiency gains as both public and private schools try to improve their performance to compete for better students. Studies suggest that the general level of competition in the Dutch system has contributed to the overall high achievement level. Using econometric techniques to identify school choice and control for selection biases, it was found that private school attendance is associated with higher test scores, and the achievement effect of private schools in math, reading and science are 0.2 to 0.3 of a standard deviation over public school attendance (Patrinos 2010a). In addition, the Netherlands does exceptionally well in international academic achievement tests such as PISA and TIMSS. Even when controlling for level of national income and expenditure per student, the Netherlands achieves relatively high scores. It implies that the system is not only high achieving, but also cost-effective, achieving good results at relatively low cost.
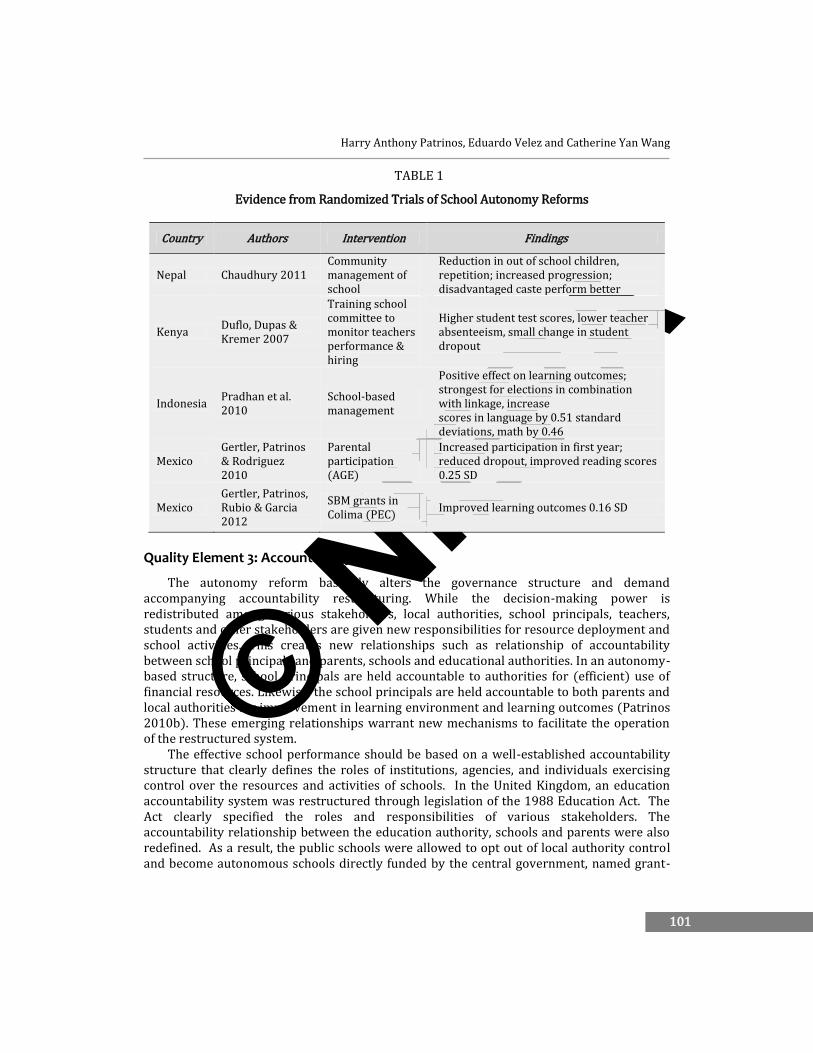
However, specific mechanics of the autonomy reform vary from country to country, so does the scope and degree of devolving the decision-making power to local authorities. The autonomy reform could be materialized in various school forms such as government–dependent private schools, creation of new autonomous public schools, expanded opportunities for homeschooling, along with new funding mechanisms to promote school choice (OECD 2010: 419). These schooling forms suit different context. For instance, while private school attendance increased students learning performance in Netherland, in a top-performing country such as Finland, 97 percent of all students at primary and lower secondary level are enrolled in public schools (OECD 2011). Central to the autonomy reform is allowing schools to tailor instruction settings to particular groups of students with involvement of parents and community. Results from randomized trials of school autonomy and accountability reforms are presented in Table 1.
The evidence suggests that autonomy is instrumental to improving students’ learning. However, its potential for transforming education systems depends on whether the increased autonomy is accompanied by strengthened accountability mechanisms.
© NIEPA Harry Anthony Patrinos, Eduardo Velez and Catherine Yan Wang
101
TABLE 1
Evidence from Randomized Trials of School Autonomy Reforms
Country Authors Intervention Findings
Nepal Chaudhury 2011 Community management of school
Reduction in out of school children, repetition; increased progression; disadvantaged caste perform better
Kenya Duflo, Dupas & Kremer 2007
Training school committee to monitor teachers performance & hiring
Higher student test scores, lower teacher absenteeism, small change in student dropout
Indonesia Pradhan et al. 2010
School-based management
Positive effect on learning outcomes; strongest for elections in combination with linkage, increase scores in language by 0.51 standard deviations, math by 0.46
Mexico Gertler, Patrinos & Rodriguez 2010
Parental participation (AGE)
Increased participation in first year; reduced dropout, improved reading scores 0.25 SD
Mexico Gertler, Patrinos, Rubio & Garcia 2012
SBM grants in Colima (PEC)
Improved learning outcomes 0.16 SD
Quality Element 3: Accountability
The autonomy reform basically alters the governance structure and demand accompanying accountability restructuring. While the decision-making power is redistributed among various stakeholders, local authorities, school principals, teachers, students and other stakeholders are given new responsibilities for resource deployment and school activities. This creates new relationships such as relationship of accountability between school principals and parents, schools and educational authorities. In an autonomy-based structure, school principals are held accountable to authorities for (efficient) use of financial resources. Likewise, the school principals are held accountable to both parents and local authorities for improvement in learning environment and learning outcomes (Patrinos 2010b). These emerging relationships warrant new mechanisms to facilitate the operation of the restructured system.
The effective school performance should be based on a well-established accountability structure that clearly defines the roles of institutions, agencies, and individuals exercising control over the resources and activities of schools. In the United Kingdom, an education accountability system was restructured through legislation of the 1988 Education Act. The Act clearly specified the roles and responsibilities of various stakeholders. The accountability relationship between the education authority, schools and parents were also redefined. As a result, the public schools were allowed to opt out of local authority control and become autonomous schools directly funded by the central government, named grant-

© NIEPAA Framework for Education Systems Reform and Planning for Quality
102
maintained (GM) schools. Schools could acquire autonomy through proposing and wining majority vote among students’ parent. A new agency of the central government was accountable for funding of the GM Schools. Instead of the local school district, the GM Schools have control over all staff contracts and ownership of school buildings and grounds given to GM schools. The schools were owned and managed by the school’s governing body composed of the head teacher and teacher and parent representatives. GM schools were also given power over admissions, so that students could apply to the GM school directly. The Education Act was complemented by other policy reforms such as nationwide open enrollment and the publication of “league tables” of school performance, which ensured that all the schools compete in a highly competitive education market. Study suggests that the new accountability relationships were positively associated with students learning achievement. Almost one in three high schools voted on autonomy between 1988 and 1997. Large achievement gains were found at schools in which the vote barely won compared to schools in which it barely lost (Clark 2009). The success of this program led to major changes in the education system in recent decades, with the Academies in the 1990s and free schools in 2011.
Moreover, an accountability-based system is usually aligned with enhanced social and parental interest. It involves parents and the community into operation and management of schools. In the meanwhile it sets clear standards and goals for the restructured system. It usually entails a shift of locus of decision-making from government to community represented by school governing boards. This approach was recently piloted in China in 2004. A school accountability study implemented by the China National Institute for Educational Research was undertaken in Qingyang District, Chengdu City. The pilot reform introduced a school governance board into several public schools. The board consists of representatives of teachers, students, parents, communities and educational authorities. It had power of operation and management of the schools. One key function of the board is to elect school principals who could be appointed after local authority’s endorsement. It was reported that the pilot school reform reduced government intervention in the school’s operations and enhanced school effectiveness (China National Institute of Educational Research 2010). Schools are held accountable for learning outcomes to students, teachers and parents. The role of government shifted from director and actor to facilitator and promoter of quality education. Although there are no quantitative findings of the effectiveness of the reform, the pilot has been well-received and is being extended into other areas.
Accountability reform also involves developing corresponding incentives and disincentives. The incentive schemes, when appropriately designed, ensure the fulfillment of the rearranged roles and responsibilities. Central to such schemes are incentives that link pay and/or tenure directly with performance. For example, teachers’ compensation is linked with factors that influence student achievement such as teacher attendance and working at low-performing school, or teachers’ compensation is directly linked with students’ achievement gains. In recent years both OECD and developing countries have introduced two particular teacher incentive policy reforms, contract tenure reforms and pay for performance reforms to strengthen teachers’ accountability for performance. Such incentive reforms, either offering positive rewards or strengthening the threat of sanctions, built up the existing policy framework (Bruns, Filmer and Patrinos 2011).

© NIEPA Harry Anthony Patrinos, Eduardo Velez and Catherine Yan Wang
103
Typically, experiments in India and Kenya found that the contract teachers were strongly associated with decrease of teachers’ absenteeism and increase of students’ test scores. A study in West Africa where contract teachers are widely used shows that the presence of a contract teacher was positively correlated with the learning performance of low ability students in the early grades (Bruns, Filmer and Patrinos 2011). In addition, eight rigorous evaluation programs in India, Israel, Brazil and Kenya observed significant improvement in students’ achievement in schools implementing pay for perform (Bruns, Filmer and Patrinos 2011).
The pay for performance reform has been introduced into many developed countries as well, though there were very few rigorously evaluated programs or research results yet. In Australia, under the recent Teacher Quality National Partnership Agreement aiming at quality of teaching, teacher pay was restructured to reward quality teaching as well as those teachers and leaders who work in disadvantaged indigenous, rural/remote and hard-to-staff schools. Likewise, Finland instituted a new salary system since 2007, which linked teacher’s salaries with the tasks, requirements and the results of the work, the professionalism of the staff and work experiences (OECD 2010: 285-286).
Quality Element 4: Attention to Teachers
The quality of an education system cannot exceed the quality of its teachers. A survey of the top-performing school systems suggests that the main driver of the variation in student learning at schools is the quality of teachers. It was articulated that the success of these school systems are largely attributable to: (a) selecting the right people into the profession and (b) teachers’ salary structure (c) developing them into effective instructors (McKinsey & Company 2007; Hanushek and Rivkin 2003).
First, these systems all develop effective mechanism for selecting teachers. According to the survey, the top-performing school systems recruit their teachers from the top third of each graduate cohort of their systems: the top 5 percent in South Korea, the top 10 percent in Finland, and the top 30 percent in Singapore and Hong Kong. These countries usually established rigorous selection procedures to admit the most suitable people into teaching profession. There are essentially two models of selection. One is to select the people before the teacher training starts and limit the places in the training program; the other is to leave the training process until the prospective teachers have graduated and then select the best graduates to become teachers. Most top-performing systems follow the first selective-entry approach, as the second may lead to over-supply of potential teachers and make teaching profession less attractive. Figure 4 shows the procedure used in Finland.

© NIEPAA Framework for Education Systems Reform and Planning for Quality
104
FIGURE 4
Procedure of Teacher Selection in Finland
Source: McKinsey & Company 2007
Second, apart from the selection mechanism, these successful systems entail good starting compensation and salary structure. The top performing systems all pay higher than OECD average starting salary, relative to GDP per capita. As Figure 5 shows, among the countries with available data that ranked highest in PISA 2008, the ratio of salary after 15 years of experience (minimum training) to GDP per capita is most higher than 1. Not only is compensation a critical factor for maintaining the quality of teaching, but also improvement of salary structure can lead to higher student learning outcomes (OECD 2010: 392; Vegas 2005). Good salary structure can provide salary incentives and rewards to attract high-quality teachers, and increase their job satisfaction and performance. Salary increases can be concentrated at different points in the salary structure, for example, early in the career or for more experienced employees, or a more linear structure with gradual salary increases throughout a teacher’s career (OECD 2010).
National Screening
Assessment Tests
(University)
Interview
(University)
Group Work
(University)
Recruitment by
School
Check for strong intrinsics: 300 question multiple choice assessment testing numeracy, literacy and problem solving
Top 20% of the cohort from last round. Check overall academic ability and literacy: tests evaluate ability to process information, think critically, and synthesize data
Check suitability for teaching: interview look for motivation to teach, motivation to learn, communication skills and emotional intelligence
Check suitability for teaching group exercise and teaching demonstrations test communications and interpersonal skills.
On completion of their teacher training, candidates are recruited by individual schools.

© NIEPA Harry Anthony Patrinos, Eduardo Velez and Catherine Yan Wang
105
FIGURE 5
Trends in the ratio of salaries after 15 years of experience/minimum training to GDP per capita (2009)
Source: OECD 2011 Notes: 1. Figures refer to annual statutory teachers’ salaries in public institutions after 15 years of experience at primary level, in equivalent $US converted using PPPs; 2. Belgium (Fl.) is used as proxy for Belgium
Furthermore, designing and implementing effective teacher development for better teaching is instrumental for raising student learning outcomes. In fact, many measures instituted by governments seem not to work in many countries. Pre-service credentials do not predict teaching effectiveness well; Conventional in-service professional development in many cases turned not useful in altering teachers’ instructional methods or children’s experiences, just to name a few.. Teacher development might well be a policy area requiring perhaps the greatest degree of innovation. Effective teacher professional development arms teachers with state-of-art subject content knowledge and adequate skills. Empirical studies identified the following alternatives as components of effective professional development:
Method-centered rather than theory-centered training that correspond to prospective teachers’ future tasks;
Updated curriculum for professional development such as synthetic phonics including phonemic awareness, fluency, vocabulary, and comprehension;
Focus on activities that are more relevant to classroom-based teaching and school-based activities;
Active pedagogy that integrates real life knowledge and skills with students’ learning; and
0.0 0.5 1.0 1.5 2.0 2.5
Hungary
Poland
Sweden
France
Austria
Finland
Netherlands
Belgium
Switzerland
Spain
Japan
Portugal

© NIEPAA Framework for Education Systems Reform and Planning for Quality
106
Coherency between pedagogy for teacher training and taught pedagogy for teaching students (Vegas 2005).
Teachers’ professional development is essentially a process, not an event. There is no once-for all therapy for any problem that a teacher might encounter in his/her career. It basically starts from teachers’ pre-service training and continues through various forms of non-formal and informal learning that build up and consolidate their knowledge base and skills continuously. Other aspects of education reform, even those not specifically designed to affect teachers could also have significant effect on teachers, such as afore-mentioned accountability. An interesting example comes from Shanghai, the top-performer in 2009 PISA. Shanghai’s success may be partly due to upgrading teaching standards and raising teacher pay (Cheng 2010).
Quality Element 5: Attention to Early Childhood Development
Early Childhood Development (ECD) constitutes another structural quality element in education planning and reform. Early childhood development is the foundation of a person’s learning and well-being (Heckman 2004). Recent scientific research established that a tremendous burst of synapse formation occurred early in life, whereas the synapse number declined when a child grew up to primary school age, and apparently the decline extends into adolescence in some areas of the brain, as shown in Figure 6. It implies that the best time for nurturing sensing pathways, language abilities and higher cognitive function is the early years of childhood. That could explain why early childhood care and development during these early years strongly influence the extent to which a child’s cognitive and socio-emotional abilities may develop to their fullest potential. A plethora of evidence also suggests that experience-based brain development in utero and during the early years of life can set brain and biological pathways that affect an individual’s health, behavior, and learning for a lifetime (Mustart 2007: 39).
FIGURE 6
Human Brain Development: Synapse Formation
Source: Shonkoff and Phillips 2010
0 1 4 8 12 16
AGE
SensingPathways
(vision, hearing)
LanguageHigherCognitive Function
3 6 9-3-6
Months Years
Conce
ption

© NIEPA Harry Anthony Patrinos, Eduardo Velez and Catherine Yan Wang
107
Effective ECD programs can have a very high payoff by improving school readiness, and nurturing positive self-image and learning dispositions (World Bank 2010). The longitudinal study of the Perry Pre-school program indicates that those who had the preschool program had higher earnings, were more likely to hold a job, had committed fewer crimes, and were more likely to have graduated from high school than adults who did not preschool programs (Schweinhart 2003). Recent studies show that ECD is positively associated with enrolment in the first grade of primary education and potentially increases retention, completion and achievement (UNESCO 2010). It was shown that in the United Kingdom children’s preschool participation contributed substantially to their intellectual development, independence, concentration and sociability in the initial three years of primary school (Sylva et. al. 2004, cited in UNESCO 2006). The gains were even higher when children participated longer in preschool education. Similarly, children in Bangladesh who received center-based preschool education outperformed their peers in the control group by 58 percent on a standardized test of school readiness (World Bank 2010). In contrast, a 33-African-country research indicates that the absence of preschool experience correlated with a repetition rate of 25 percent and a completion rate of 50 percent or less in primary school (Mingat and Jamarillo 2003, cited in UNESCO 2010).
In reality, the ECD remains lagging in many developing countries. The 2010 EFA Global Monitoring Report pinpoints that the gross enrollment rate of pre-primary education in developing countries is merely 36 percent in comparison to 80 percent in developed countries (2007 school year) (UNESCO 2010b). What’s worse, few countries have established national frameworks for the financing, coordination and supervision of ECCE programs for children aged 0-3 years. In terms of resources, OECD countries spent nine percent of their educational budget on pre-primary education (OECD 2010: 218), while most developing countries allocated less than one percent of the total education budget to early childhood programs (even including health expenditures), the figure is even lower in most African countries, less than 0.1 percent of the education budget (UNESCO 2010a).
The absence of appropriate ECD policy and program largely undermines the effectiveness of basic education and education as a whole. By the time a child is old enough to attend school, there is already a wide disparity in cognitive skills and in emotional and behavioral development among children from households of different socioeconomic backgrounds. Low levels of cognitive development in early childhood strongly correlate with low socio-economic status as measured by wealth and parental education as well as malnutrition (Alderman 2011). Scarcity of investment in ECD could be a major barrier to the quality and cost-efficiency of overall educational delivery. An empirical study posits that lowering the parents’ price of schooling could stimulate increased enrollments and this proved effective in a wide variety of developing country settings. It was estimated that an investment of $7.5 billion per year would help 15 million children complete schooling that would drop out otherwise (Orazem, Glewwe and Patrinos 2009).
In short, in developing countries, there is a strong demand for ECD programs that provide the positive physical, social and psychological support for young children beginning at birth and even earlier in utero. More attention is urgently needed on the part of resources and institutions for effective ECD programs and services. The countries that invest earlier would gain an advantage in developing different sets of skills for their citizens and resulting economic progress (Young 2007).

© NIEPAA Framework for Education Systems Reform and Planning for Quality
108
Quality Element 6: Attention to Culture
Last but not least, education reform is likely to fail without taking into account the cultural context. Education reform is more than curricular change; rather it implies reformation of culture represented by values and mores in various institutions. The paradigm change underpinning education reform involves bringing in new values that may clash with existing cultural patterns of values, thought and action already in place (Argyris 1992, cited in Dooley 1995). As any other organizational change, education planning and reform has to recognize the extent to which the change process is vulnerable to powerful cultural influences (Dooley 1995). Education planning and reform could hardly succeed without adapting to deeply-rooted cultural influence upon institutions. This section builds upon several dimensions of cultures identified in Hofstede’s (2001) seminal work on cultural consequences to illustrate the implication of culture for educational reform aiming at quality.
A significant dimension of national culture relating to education reform is uncertainty avoidance, which policymakers and education practitioners oftentimes encounter in designing and implementing education reform. Reform always entails changes and transitions into new stage full of uncertainties. And the political nature of education compound the complexities engendered by the uncertainties. The people’s anxiety and resistance against reform rising from uncertainty avoidance (Hofstede 2001) could become a major barrier in education reform. It is then the responsibility of the reformers to create clear vision and build up the conviction toward the success of the reform. In the case of the United States, Bruner (1996) illustrates the importance of culture for school reform. What counts most is a school reform movement "with a better sense of where we are going, with deeper convictions about what kind of people we want to be” before the technical (assessment) instruments, he argues, only then can the nation "mount the kind of community effort that can truly address the future of our educational process” (Bruner 1996). Furthermore, different societies developed different ways to adapt to uncertainty. These ways belong to the cultural heritages of societies and are reflected in collectively held values of the members of a particular society (Hofstede 2001: 146). It is important for the reformers to recognize and mobilize those values to engage the intended changes for the purpose of improving education quality. For example, China has capitalized on the experiences from opening up reform started by experimentation of special economic zones and thus instituted curriculum reform by starting with small-scale experimentation, which accumulated valuable experiences for nationwide extension.
Education reform should attend to the influence of individualism and collectivism. Ideal education caters to each individual student’s capabilities and interests (Aristotle, cited in Ornstein and Levine 1981). Nonetheless, individualism and collectivism featuring different societies (Hofstede, 2001) largely affect the ways of organizing educational provisions, to the extent of impacting the effectiveness of instruction. Typically in the collectivist society such as China and Japan, students are organized into administrative classes that follow the same schedule of lessons regardless of students’ interests, while in the individualist society such as the United States, students’ lessons are organized by subject and each student has his or her own schedule that fit into their own interests and capabilities. The former are prone to negligence of students’ individual characteristics. Without suitable consulting service in place, the students in those cultures often resort to off-campus tutoring to develop their own

© NIEPA Harry Anthony Patrinos, Eduardo Velez and Catherine Yan Wang
109
interests and subject-based knowledge. It is not strange to see that tutoring service developed rampantly in these societies and lead to heavy burden homework load of students (Bray 2007).
Last but not least, care should be given to handle short-term and long-term orientation of intended reform. While long-term oriented cultures are accustomed to working toward building up strong position, short-term oriented cultures tend to expect immediate results identified by studies (Hofstede 2001: 361). Given the nature of education, education policy reform is characterized by effect lag, that is, endeavors for changing the education system produce lagging effects long after the action is taken. Hence, in both cultures, education reform should take into account the immediate results as well as long-term impact. Specifically, education reformers should be cautious about the policy action intended for quick benefits, which might sacrifice the quality on the long-term basis. Education reform aiming at quality need be prepared for long-term efforts and commensurate resources and structural transformation. Expedient education reform measures can achieve great leaps in enrollments but perhaps at the cost of quality over the long run. For instance, China expanded higher education rapidly since the end of the 1990s. As a result, tertiary enrollment rose 47 percent in one year. The gross enrollment rate in higher education increased from 10 percent in 1998 to 23 percent in 2009. The reform achieved immediate results of tertiary education expansion and stimulating economic growth, yet contributed to deteriorating quality over the long run. Among other things, public investment in education has not kept up with enrollment. While governmental allocation accounted for 60 percent of total higher education expenditure in 1998, it decreased to 53 percent in 2001 and further dropped to 43 percent in 2006. The universities rely on cost-sharing (charging tuitions and fees) as well as income generated through commercial activities. This not only increased the financial burdens on students, but also diverted the university's attention from teaching and research to income-generating activities. The quality of higher education was reported deteriorating. An obvious measure is that a large number of graduates from expanded enrollment faced difficulties in finding a job (Yuan 2006).
While there are many other culture-specific issues affecting education reform. Those who are alert and sensitive to cultural issues are more likely to succeed. One important area of culture that needs attention is language of instruction, especially as it relates to minorities and ethnic groups. Studies have found that bilingual education for a disadvantaged can produce significant human capital benefits. In the case of indigenous peoples in Guatemala, students of bilingual schools have higher attendance and promotion rates, and lower repetition and dropout rates. The program was successful not only because children were taught at first in their own native language, but that the program took local culture into account. Drawing on the success of a program employing bilingual promoters in 1965 during the campaign to make Spanish the dominant language throughout Guatemala, a national bilingual education program was established (Patrinos and Velez 2009).
Conclusions
In conclusion, six factors, including three institutional factors and three structural quality elements, are pivotal for improving the quality of education. On the institutional level, quality-oriented reform requires a shift from lack of assessment or examination-dominated assessment toward assessment for evidence-based planning and reform;

© NIEPAA Framework for Education Systems Reform and Planning for Quality
110
autonomy-driven reforms could also improve students’ learning outcomes by allowing schools to tailor instructional settings to particular groups of students with the involvement of parents and the community; and the assessment and autonomy reform warrant accompanying accountability restructuring that redefines the roles and responsibilities of various stakeholders and developing corresponding incentives. On the structural level, a first driver is the quality of teachers which largely depends upon effective recruitment, competitive starting salary as well as effective professional development. Second, investment in early childhood development could largely improve the quality and cost-efficiency of overall educational delivery. Last but not least, culture counts; that is, successful education planning and reform should recognize and adapt to deeply-rooted cultural influences on institutions.
The 6As essentially provide a reference framework for policymaking aimed at improving education quality. The framework represents a holistic and inclusive approach to addressing education reform. Drawing on experiences and lessons of education reform during last two decades, it highlights the potential strategies that could help overcome the challenges to effective education planning and reform. It also offers a typology of examples that might inspire quality reform initiatives in developing countries. Presumably the quality elements could be used for the development of reliable and valid indicators (inputs, outputs and outcomes) that facilitate monitoring the performance levels of the related stakeholders.
We have to acknowledge that the six quality drivers and/or elements are not silver bullets or universally applicable recipes for education planning and reform across countries; especially when sophistication in the engineering of educating a child and variety of political, social and cultural contexts across countries is taken into account. Also, the evidence base needs to be expanded. Two priority areas for future research emerge from foregoing analysis.
First, there is a need to develop a system of international quality benchmarks drawing upon a larger body of evidence. It involves developing indicators and building a corresponding data base. Such a framework could be a useful reference for developing national education benchmarks.
Second, more empirical studies on impact evaluation are needed. This is a critical challenge as it is also necessary to convince policymakers of the importance of rigorous evaluation, especially on the part of activities that consume a large amount of resources, such as in-service teacher training. To complement the implementation of 6As or a more systematic of quality framework, more profound empirical studies on evaluation of related policy interventions are needed. Both require concerted efforts of interest among countries and international organizations.
© NIEPA Harry Anthony Patrinos, Eduardo Velez and Catherine Yan Wang
111
References
Abadzi, H. (2006). Efficient Learning for the Poor: Insights from the Frontier of Cognitive Neuroscience. (Directions in Development). Washington D.C.: World Bank.
Abadzi, H. (2008). Efficient Learning for the Poor: New Insights into Literacy Acquisition for Children. International Review of Education 54(5-6): 581-604.
Alderman, H. (2011). (Ed) No Small Matter: The Impact of Poverty, Shocks, and Human Capital Investments in Early Childhood Development. Washington D.C.: World Bank.
Alexander, Robin. (2000). Culture and Pedagogy. Malden, MA: Blackwell Publishing. Awbrey, S. M. (2005). General Education Reform as Organizational Change: Integrating Cultural and
Structural Change. The Journal of General Education, Vol. 54, No. 1, 2005. The Pennsylvania State University, University Park, PA.
Barrera, F., T. Fasih and H. A. Patrinos. (2009). Decentralized Decision-Making. Washington DC: World Bank.
Bennett, S. N. et. al. (1976). Teaching Styles and Pupil Progress. London: Open Books. Bishop, J. H. (1997). ‘The effect of national standards and curriculum-based exams on Achievement.’
American Economic Review, Papers and Proceedings 87: 260-264. Bray, M. (2007). The Shadow Education System: private tutoring and its implications for planners.
2nd edition. Paris: UNESCO International Institute for Educational Planning Bruner, J. (1996). The Culture of Education. Boston: Harvard University Press. Bruns, B., D. Filmer and H. A. Patrinos. (2011). Making Schools Work: New Evidence on Accountability
Reforms. Washington DC: World Bank. Cheng, Kai-Ming (2010). Shanghai and Hong Kong: Two Distinct Examples of Education Reform in
China. In OECD( 2010) Strong Performers and Successful Reformers in Education: Lessons from PISA for the United States. Paris: OECD.
China National Institute for Educational Research (CNIER) (2011). Zhongguo jiaoshi fazhan baogao 2010 (China Teacher Development Report 2010). Beijing: Education Science Publishing House.
China National Institute of Educational Research (CNIER) (2010). Report of “Quanguo xiandai xuexiao zhidu lilun yu shijian yanjiu” (A study on theories and practices of modern school institutions in China). Unpublished manuscript. CNIER project team.
Clark, D. (2009). The Performance and Competitive Effects of School Autonomy. The Journal of Political Economy, Vol. 117, No. 4 (August 2009), pp. 745-783. The University of Chicago Press.
Coleman, J.S., E.Q. Campbell, C.J. Hobson, J. Mcpartland, A.M. Mood, F.D. Weinfield and R.L. York (1966). Equality of educational opportunity. Washington, D.C.: US Office of Education.
Creemers, B. (1997). Effective Schools and Effective Teachers. Warwick: Warwick University Centre for Research in Elementary and Primary Education.
Di Gropello, E. D. and J. H. Marshall (2005). Teacher Effort and Schooling Outcomes in Rural Honduras. In Vegas, E. (Ed.) Incentives to Improve Teaching: Lessons from Latin America. Washington D.C.: World Bank, pages 307-353.
Dooley, J. (1995). Cultural aspects of systemic change management. Retrieved December 22, 2010, from http://www.well.com/user/dooley/culture.pdf.
Finish Board of Education (2010). Finland and PISA. Retrieved Jan. 30, 2011 from http://www.oph.fi/english/sources_of_information/pisa.
Fuller, B. (1986). Raising School Quality in Developing Countries: What Investments Boost Learning. Washington, DC: The World Bank.
Gertler, P., H.A. Patrinos and M. Rubio-Codina. 2012. “Empowering Parents to Improve Education: Evidence from Rural Mexico.” Journal of Development Economics 99(1): 68-79.
Greaney, V. & T. Kellaghan (2008). Assessing National Achievement Levels in Education. National Assessment of Educational Achievements Vol. 1. Washington D.C.: World Bank.

© NIEPAA Framework for Education Systems Reform and Planning for Quality
112
Greenwald, R., L. V. Hedges, and R.D. Laine (1996). “The Effect of School Resources on Student Achievement,” Review of Educational Research, 66, 361–396.
Halinen, Irmeli (2011). Systemic Quality Development in Finland. Presented at “the UNESCO High Level Forum on the Improvement of the Quality of General Education” held at Beijing, sponsored by UNESCO. January 24, 2011.
Hallinger P. & J. F. Murhpy. (1986). The social context of effective schools. American Journal of Education. Vol. 94, No. 3 (May, 1986), pp. 328-355 Chicago: The University of Chicago Press.
Hanushek, E. A. & S. G. Rivkin. (2003). How to Improve the Supply of High Quality Teachers. Paper Prepared for the Brookings Papers on Education Policy. Retrieved June 30, 2011 from edpro.stanford.edu/Hanushek/admin/.../Teacher%20quality.Brookings.pdf.
Hanushek, E. A. (1971). “Teacher Characteristics and Gains in Student Achievement: Estimation Using Micro Data,” American Economic Review, 60, 280–288.
Hanushek, E. A. (1986). “The Economics of Schooling: Production and Efficiency in Public Schools,” Journal of Economic Literature 24: 1141–1177.
Hanushek, E. A. (1996). “A More Complete Picture of School Resource Policies,” Review of Educational Research, 66, 397–409.
Hanushek, E. A. and L. Woessmann (2008). ―The Role of Cognitive Skills in Economic Development, Journal of Economic Literature, 46(3), pp. 607-668.
Heckman J. J. (2004). Invest in the very young. In: Tremblay R. E., Barr R. G., Peters R. De. V. (Eds). Encyclopedia on Early Childhood Development [online]. Montreal, Quebec: Centre of Excellence for Early Childhood Development; 2004:1-2. Retrieved June 30, 2011 from http://www.child-encyclopedia.com/documents/HeckmanANGxp.pdf. Accessed.
Heder, Eivind (2011). Experiences from Norway. Presented at “the UNESCO High Level Forum on the Improvement of the Quality of General Education” held at Beijing, sponsored by UNESCO. January 24, 2011.
Hill, P. (2010). Examination Systems: Asia-Pacific Secondary Education System Review Series. UNESCO Bangkok: Asia and Pacific Regional Bureau for Education.
Hofstede, G. (2001). Culture’s Consequences: Comparing Values, Behaviors, Institutions, and Organizations across Nations. 2nd edition. Thousand Oaks, London and New Delhi: Sage Publications.
Levacic, R., and A. Vignoles (2002). “Researching the Links Between School Resources and Student Outcomes in the UK: A Review of Issues and Evidence,” Education Economics, 10, 313–331.
McKinsey & Company (2007) How the World’s Best-Performing School Systems Come on the Top. Retrieved February 8, 2011 from http://www.mckinsey.com/clientservice/Social_Sector/our_practices/Education/Knowledge_Highlights/How%20School%20Systems%20Get%20Better.aspx.
Mustard J. F. (2007). Experience-based Brain Development: Scientific Underpinnings of the Importance of Early Child Development in a Global World. In Young, M. E. (Ed) Early Child Development From Measurement to Action: A Priority for Growth and Equity. Pp.35-64. Washington D.C.: World Bank.
OECD (2011). Education at a Glance 2011: OECD Indicators. Paris: OECD. OECD (2010). PISA 2009 Results. Retrieved February 9, 2011 from
http://www.oecd.org/document/61/0,3343,en_2649_35845621_46567613_1_1_1_1,00.html. Orazem, P. F., P. Glewwe & H Patrinos. (2009). The Benefits and Costs of Lowering Parental Schooling
Costs to Improve Educational Outcomes. Copenhagen Consensus center best practice paper: new advice from cc08. Denmark: Copenhagen Consensus Center.
Ornstein, Allan C. & Levine, Daniel U. (1981). An introduction to the foundations of education (2nd ed.) (pp. 112-113). Boston: Houghton Mifflin.
Patrinos, H. A. (2010a). “Reforming School Systems for Quality Improvement: How Countries can improve their Results in International Tests.” Unpublished manuscript.

© NIEPA Harry Anthony Patrinos, Eduardo Velez and Catherine Yan Wang
113
Patrinos, H. A. (2010b). “Towards Greater Accountability: Challenges and Policy Recommendations”. Presented at Round-table Discussion on Achievements and Challenges of the Bulgaria School Autonomy Reforms held at Sofia, September 13, 2010.
Patrinos, H.A. and E. Velez (2009). “Costs and benefits of bilingual education in Guatemala: A partial analysis.” International Journal of Educational Development 29: 594-598.
Rivkin, S. G., E. A. Hanushek and J. F. Kain (2005). Teachers, Schools and Academic Achievement. Econometrica 73(2): 417-458.
Sammons, P., J. Hillman and Mortimore, P. (1995). Key Characteristics of Effective Schools: A Review of School Effectiveness Research. London: OFSTED.
Schweinhart, L. J. (2003). Benefits, Costs, and Explanation of the High/Scope Perry Preschool Program. Paper presented at the Meeting of the Society for Research in Child Development, Tampa, Florida, April 26, 2003.Retrieved June 30, 2011 from http://www.highscope.org/content.asp?contentid=219.
Schwille, J. (2007). Global Perspectives on Teacher Learning: Improving Policy and Practice. Paris: UNESCO International Institute for Educational Planning.
Shonkoff, J. P. & D. A. Phillips (2010). (Eds). From Neurons to Neighborhoods: The Science of Early Childhood Development. Washington D.C.: National Academy Press.
UNESCO (2006). Education for All global monitoring report 2007: Strong Foundations. Paris: UNESCO. UNESCO UIS (2011). Out-of-school children: new data reveal persistent challenges. Retrieved June 30,
2011 from http://www.uis.unesco.org/Education/Pages/out-of-school-children-data-release.aspx UNESCO (2010a). Concept Paper: The World Conference on Early Childhood Care and Education
(ECCE): Building the Wealth of Nations. Paris: UNESCO. UNESCO (2010b). EFA Global Monitoring Report 2010. Paris: UNESCO. USAID/EQUIP2. (2006). “Stakeholder Collaboration: An Imperative for Education Quality.”
Washington, DC: EQUIP2 Program. Vegas, E. (2005). (Ed) Incentives to Improve Teaching Lessons from Latin America. Washington D.C.:
World Bank. Vegas. E. & J. Petrow. (2007). Raising Student Learning in Latin America. Washington D.C.: World Bank. Wayne, A. J., and P. Young. (2003). "Teacher characteristics and student achievement gains: A review."
Review of Educational Research 73(1): 89-122. Woessmann, L. (2000). Schooling Resources, Educational Institutions, and Student Performance: The
International Evidence, Kiel Working Paper No. 983, Kiel: Kiel Institute of World Economics. World Bank (2004). World Development Report 2004: Making services work for poor people.
Washington DC: World Bank. World Bank (2008). What is School-based Reform? Washington D.C.: World Bank. World Bank (2010). Stepping up Skills: For more jobs and higher productivity. Washington D.C.: World
Bank. World Bank (2011). Learning for All: Investing in People’s Knowledge and Skills to Promote
Development. World Bank Group Education Strategy 2020. Washington D.C.: World Bank. Young, M. E. (2007). The ECD Agenda: Closing the Gap. In Yong, M. E. with Richardson, L. M. (Eds) Early
Child Development From Measurement to Action: A Priority for Growth and Equity. Washington D.C.: World Bank. pp. 3-12.
Yuan, Z. G. (2006). China Education Review 2006. Beijing: Education Science Publishing House.

© NIEPAA Framework for Education Systems Reform and Planning for Quality
114
Journal of Educational Planning and Administration Volume XXXI, No. 2, April 2017

© NIEPAJournal of Educational Planning and Administration Volume XXXI, No. 2, April 2017, pp. 115-139
© National University of Educational Planning and Administration, 2017
Demand for Private Tuition
— A Quantile Regression Analysis of Household Expenditure on Private Coaching in India
T. Lakshmanasamy*
Abstract
This paper analyses the demand for private coaching in India at the school level by investigating the household level determinants of private tuition expenditure using the 2011-2012 IDHS-II household survey data and the Tobit and quantile regression methods. While the OLS and Tobit estimates give only the average effects, the differential impact of the determining variables on private tuition expenditure across the distribution is captured by the quantile regression estimates. The QR results provide robust evidence on the differential patterns of the factors that influence the household private tuition expenditure. The empirical results show that the important determinants that have a positive significant impact on household private tuition expenditure are income (measured by consumption expenditure), urban residence, forward community, education of household head, private school enrolment and school fee, while the size of the household has a consistent negative effect. The household income effect on private tuition expenditure increases from 41 per cent to 73 per cent at 10th to 90th quantiles clearly showing that better off households that value education more incur higher on the private coaching of their children. Enrolment in private school monotonically increases household private tuition expenditure from 21 per cent to 35 per cent at the 10th to 75th quantiles of the distribution.
* Department of Econometrics, University of Madras, Chennai-600005. Email: [email protected];
The research assistance of Ajay is highly acknowledged

© NIEPADemand for Private Tuition
116
Introduction
According to the 2013-14 educational statistics by the Ministry of Human Resources and Development (MHRD), the number of recognised schools stands at 7,90,640, 4,01,079, 1,31,287, and 1,02,558 at the Primary, Upper Primary, Secondary and Senior Secondary levels in India. The Gross Enrolment Ratio (GER) for primary, upper primary, secondary and senior secondary education is 99.3 per cent, 87.4 per cent, 73.6 per cent and 49.1 per cent respectively. The near-universal enrolment in the primary school is due to the implementation of the Right to Education Act, 2010. However, a significant push is followed in the upper primary to meet the compulsory enrolment of children between the ages of 6-14, as pointed by the Act. From the public finance perspective, the budgetary allocation (Central and State levels) for the year 2007-08 was 68,853 crore (in Rs); the same for the year 2012-13 was Rs. 1,47,059 crore, which shows a significant increase in the expenditure on education. Yet, the Indian educational system continues to be plagued by two important issues: the declining quality of education and the growth of private tuition or coaching industry – a possible result of the declining standards of education in the formal educational sector.
To illustrate the problem of educational quality, the Annual Status of Education Report points out that only 48.1 per cent of the Grade V students can read a Grade II text, similarly only 74.6 per cent of students belonging to the Grade VIII can read a Grade II text (ASER, 2014). The report further shows that statistics pertaining to mathematical abilities like subtraction and division are worse compared to reading abilities. To illustrate, only 25.3 per cent of Grade III students can perform simple subtraction. For the same subtraction tests administered to Grader V students, only 50.5 per cent of them could perform the simple subtraction test. These are just illustrative cases of the quality of education in India. ASER (2014) also points out two major trends: an increase in the private school enrolment and stagnation in learning levels. With regard to private school enrolment, it shows that in the year 2006, private school enrolment stood at 18.7 per cent, whereas, for the year 2014, the enrolment is 30.8 per cent.
Thus, increasing public expenditure on education and rising enrolment in schools are coupled with poor quality of education in formal public schools and rise in enrolment in private schools. A pertinent point to be noted is that despite massive investments in both school quality and teacher improvements and the widespread availability of better equipped private schools, there is a sizeable increase in tutoring outside the schools. There is a growing demand for private coaching, as can be gauged from the ever increasing number of such coaching institutions catering to different aspirations of the pupils. The proportion of students taking tuition is about 27 per cent at the primary and about 40 per cent at the higher-secondary levels. A study by ASSOCHAM shows that around 87 per cent of primary school children and 95 per cent of students in high school receive private coaching in metro areas. ASER (2014) also reports that about one-fourth of all children in rural India pay for private tutors. It is found that the proportion of students attending private tuition have increased by 100 per cent and 92 per cent respectively for primary and high school students between 2006-2013 (ASSOCHAM, 2013). The expenditure on such private tutoring is also sizeable. The second India Human Development Survey shows that about 32.17 per cent of school students attend private tuition and the household expenditure on such private

© NIEPA T. Lakshmanasamy
117
coaching is an average Rs. 8,542 per annum, which is almost half the average amount incurred on school fees.
What are the plausible causes for such demands and expenditures on private tutoring? Reasons for such a phenomenon can be attributed to a multitude of factors like parental-pressure on enrolment to premier institutes, career/life defining examinations at the matriculation and senior-secondary level, prevalence of mediocrity/inefficiency in the school system (ASER, 2014). For the emerging and aspirational middle-class which seeks better opportunities and an increase in their standards of living, education of their children is the only way out. To increase the performance of their wards in academics and score well in entrance and competitive examinations, parents resort to engaging their wards in private tuition. As a result of the high-stakes involved in entrance examinations to the high quality institutions, private coaching has been adopted by parents and students as a strategic investment. Moreover, private tutoring seems to fill the gap caused by the inadequacies of the formal schooling. There could be other reasons like peer pressure, admission to prestigious institutions, etc., which also determine the amount of private coaching and the expenditure on private tuition. These factors play out not only in the urban households, but also in semi-urban and rural areas, though with varying intensities. These factors have led to a rapid growth in the ‘coaching’ industry in India.
With rising educational aspirations in all sections of the population and the growing opportunities for higher levels of education made possible by the growing private sector educational institutions, private coaching has permeated into all levels of education. However, the moot questions are: what are the socio-economic characteristics of households that spend on private tuition? Do households having different socio-economic characteristics spend differently on private tuition? What are the factors that determine private tuition expenditure? Are there differential impacts of the determinants across the spectrum of private tuition expenditure? In an attempt to unravel these questions, this paper aims to identify and estimate the determinants of, and their differential impacts on, household private tuition expenditure in India, using the 2011-2012 IDHS-II household survey data and the quantile regression method. By implementing the QR methodology, along with OLS and Tobit, the objective of the paper is to see how household characteristics influence the individual household expenditure at different quantiles of the distribution of household private tuition expenditure. This paper is the first to use a QR approach to examine the determinants of household private tuition expenditure in India, conducted with a large micro data set. It will be worthwhile to see the different impacts of various factors on household tuition expenditures at different quantiles of private tuition expenditure for the policy purposes.
Some Evidence from the Past Literature
Investment pertaining to education is incurred in two domains, first by the individuals or the parents on education; second, on an institutional sense made by the public/government sector. The human capital literature treats educational expenditures as investments; households invest both on the quantity and quality of education of children anticipating economic and non-economic benefits (Tilak, 2011). Accordingly, there are economic and non-economic factors driving investments on education. While there is an extensive literature on the expenditure of formal schooling, the topic of private tuition

© NIEPADemand for Private Tuition
118
expenditure has received scanty attention, may be due to the paucity of reliable household data and the unavailability of official statistics.
The private tutoring sector has been expanding in many countries, so much so that it can be considered the third emerging education sector, in addition to public and private school sectors (Dang and Rogers, 2008). Terming the private tutoring as the shadow education system, Bray (2007) identifies (the nature of) private tutoring on the criterion of supplementation, privateness and academicness. Tansel and Bircan (2006) define private tutoring as the education outside the formal schooling system where the tutor teaches particular subject(s) in exchange for a financial gain. Dang and Rogers (2008) define private tutoring as fee-based tutoring that provides supplementary instruction to children in academic subjects that they study in the mainstream education system. Building on the previous empirical research on the factors that drive private tutoring in Egypt, Japan, Korea, Turkey and Vietnam, Dang and Rogers (2008) conclude that the demand for private tutoring is influenced by characteristics of individuals, families, schools and communities. Berberoglu and Tansel (2014) consider private tutoring as an out-of-school academic enterprise to enhance students’ learning. Mark Bray (2006; 2007; 2011) reviews the current state of affairs of the literature on the effect of private tutoring, on students’ academic performance.
Tansel and Bircan (2006) in Turkey using 1994 household expenditure survey finds that households with higher income and higher parental educational levels spend more on private tuition. They reported total expenditure elasticity is 1.21 for households reporting a positive value of private tuition expenditure. The study also finds that mother’s education coefficient is statistically significant compared to father’s education. A year’s increase in education of the mother is likely to increase the private tuition expenditure by 8 per cent, whereas, it is 5 per cent in the case of fathers. It is also found that households residing in urban areas spend more on private tuition than households in rural areas. However, spatial differences, coefficients for developed street and squatter settlements, across the urban areas are not statistically significant. For Greece, Papakonstantinou (2004) reports the income-elasticity demand for private tuition while preparing for university entry preparation as 0.3. Similarly, Dang (2007) reports for Vietnam, that the private tuition is a necessity in the household budget for primary and lower secondary students. In Sri Lanka, Pallangedera (2011), using the nationwide household income and expenditure survey 1995-96 and 2006-07, has found that demand for private tuition for school education has increased over time. The reported income elasticity is 0.10 for 2006-07. It is also found that household head’s age has a positive impact on private tuition expenditure at a declining rate. Father’s level of education is found to have a positive impact (statistically significant) on private tuition expenditure. Seema Jayachandran (2014), using the nationwide survey of Grade X students in Nepal for 2004-2005, finds that the school provided tutoring has not only a negative effect on the amount of teaching in schools, but also causes students to do worse in school examinations. Also Gurun and Millimet (2008), examining the determinants and the impact of private tutoring in Turkey using the 2002 Turkish Higher Education survey, find that not only private tutoring, but also the expenditure on private tutoring increases the probability of placement in a university.
For India, Azam (2016) using three rounds of NSSO’s “participation and expenditure on education” surveys (July 1986-June 1987, July 1995-June 1996, July 2007-June 2008) reports that students from urban areas are more likely to attend private tutoring compared to students from rural areas. The study also observes that the prevalence of private tuition is
© NIEPA T. Lakshmanasamy
119
much higher at the secondary and senior secondary levels compared to lower levels. Importantly, students from private schools are more likely to attend private tuition than their counterparts at the government schools. The probability of private tutoring increases with the economic status and education of parents, enrolment in private schools, English medium schools, and at higher stages of schooling (Azam, 2016). Dongre and Tewary (2015), using the 2011 and 2012 waves of the ASER survey, finds a positive and significant effect of private tutoring on learning outcomes among the students in Classes 1-8 in rural India. Exploring the widespread nature of private coaching as a parallel system of education, Snehi (2014) finds that 83 per cent of students take private tutoring and spend between Rs 750 to Rs 1,000 per month on private tuitions in Delhi schools. Also Banerjee et al. (2007), using survey data from two schools in Mumbai and Vadodara that conducted supplementary and remedial educational programme during 2001-2003, observe a positive impact of remedial education (extra tutoring) on learning levels measured by basic competencies among the students taught in Grades I to IV.
The literature pertaining to expenditure on private tuition shows that income, measured by consumption expenditure, is one of the most important determinants of private tutoring. Apart from income, another important variable is area of residence. It is found that households belonging to urban areas spend more on private tuition than households belonging to rural areas. In rural areas, this might be due to the prevalence of dropouts as we go across different levels of schooling. Also, as pointed out earlier, lack of access to specialised coaching centres for college entrance examinations could be an important factor as to why households in rural areas do not spend more on private tuition. Also, the household head’s education is found to be an important determinant for private tuition expenditure.
Data and Methodology
In order to analyse the differential impact of the socio-economic characteristics of households on the private tuition expenditure in India, this paper utilises the 2011-2012 Indian Human Development Survey (IHDS-II) data. The IHDS-II is a nationally representative survey consisting of 42,152 households spread across 1,503 villages and 971 urban neighbourhoods. The IHDS-II is mostly re-interviews of households interviewed for IHDS-I in 2004-05. The IHDS-II survey, assembled under 14 heads, contains a wealth of information on income source, employment and wages, remittances, quantity and quality of education, educational expenditure, household consumption expenditure, and household characteristics such as residence, household size, caste, religion, medical expenditure, social networks and organisational memberships, etc. Since all households do not incur expenditure on private tuition, only the sample households that reported private tuition expenditure are considered for empirical analysis. From the total sample of 42,152 households, the final sample contains 6,288 households.
The data shows that students who attend private tuition spend on an average 6.2 hours per week, which translates almost into an additional school day. This is a considerable amount of time spent in addition to regular school hours. It is observed that the average school fee paid by those who attend tuition is Rs 4,062.19 (per annum) compared to Rs 2,928.30 (per annum) by those who do not attend private tuition. Thus, students who are going to private tuition also spend more on formal schooling. It is also found that, on an

© NIEPADemand for Private Tuition
120
average, the private tuition expenditure in urban areas is Rs 6,173.38 (per annum), whereas the average private tuition expenditure in rural areas is Rs 3,733.97 (per annum). The average expenditure on private tuition (Rs per annum) for different levels of schooling is presented in Figure 1. It is observed that the average expenditure is higher at the secondary and senior secondary levels due to the reason that students at these levels will have to take public examinations, which play a major role in their college education and are often dubbed as ‘life-defining’ examinations. It is also important to note that households incur private tutoring expenditure even for primary schooling, signifying the growing private coaching culture and the declining quality of education in the formal schooling system. Even surprising is the amount spent on private tutoring, not only at the higher levels but also the growing proportions across the levels of school education.
FIGURE 1
Average private tuition expenditure by levels of schooling
Empirical Methodology
The OLS estimation of the effects of household characteristics on private tuition expenditure provides only the average impact across households – the conditional mean value throughout the distribution. However, the impact of the household characteristics may not be the same across the distribution of private tuition expenditure for all households – that is, the estimates may vary at different points of the distribution, especially at the tails of the distribution as shown in Figure 2. The graph shows that across the distribution of quantiles, private tuition expenditure varies at the tails of the distribution – at the bottom 10th percentile and at the 90th percentile, the expenditure is at extremes. In order to capture the differential impacts, the quantile regression (QR) method is used to estimate the

© NIEPA T. Lakshmanasamy
121
effect of the determining variables on private tuition expenditure at different quantiles. Apart from providing more general results, QR has other advantages over OLS. For instance, QR is more robust to outliers than OLS. In addition, unlike OLS, we do not need to make strong stochastic assumptions in QRs. Hence, the QR provides a comprehensive strategy to study the impact throughout the distribution of the dependent variable (Dahiya and Vishwanathan, 2015).
FIGURE 2
Quantile plot of household private tuition expenditure
Studies on private tuition expenditure generally use the Tobit method, as the dependent
variable is censored at zero for the households that incur no private tuition expenditure. The same is also implemented in this paper, taking into account the zero private coaching expenditure. In order to capture the differential impacts through the distribution, QRis estimated for households with positive-private tuition expenditure. While the use of OLS or Tobit to estimate the causal effects of household characteristics on private tuition expenditure produces only the average marginal effect that is the same for all households, the QR methodology estimates the differential effect at the different points of the distribution. In effect, the QR estimates the marginal effects for each of the quantiles, thereby revealing the differential effects of the characteristics for different groups, including the tails of the distribution. As a result, we can see an extensive view of the effects of the determinants of household private tuition expenditure. As pointed by Dang (2007), to reduce heteroscedasticity, private tuition expenditure and household consumption

© NIEPADemand for Private Tuition
122
expenditure are converted to logarithmic values. Also, to encounter the zero values reported, they are replaced with the value of one to enable ease in econometric analysis.1
Quantiles are order statistics which divide the sample of observations on a variable into many sub-groups; the 50th quantile is also the median value. Let the OLS specification is:
where Y is the household private tuition expenditure and X is a vector of household,
characteristics. The effect of the household characteristics on the private tuition expenditure
is given by the respective slope coefficients, YXXX 1̂ , the conditional mean value,
which is the same across the distribution of the dependent variable. However, the OLS estimate shows only the average private tuition expenditure for all households, thus unable to capture the differential impact of the determinants across different levels of private tuition expenditure. From the distribution of a log of private tuition expenditure, it is found that the distribution varies across the tails. There is variation among the households that incur expenditure on private tuition. Therefore, to capture this variation, a QR model is used, which provides estimates across the quantiles.
The QR model is specified as:
90.0,75.0,50.0,25.0,1.0 ),( i
iXy
Consider a real-valued random variable Y characterised by the following distribution
function: )Pr()( yYyF
Then for any )1,0( the θth quantile of y is defined as follows:
})(:inf{)( yFyQ
Consider a sample nixy ii ,....1 ),( , from a population where ix is a K x 1 vector of
regressors. We can write the equivalent of )Pr()( yYyF as:
)|Pr()( iiiu XyXF
Essentially a different form derived from:
i
uXy ii
where, the only constraint being 0)|( iXuQi .
Note that the conditional mean function of the OLS is specified as:
2
1
)(minarg i
n
i
i XyK
Following the OLS analogy, the case of conditional quantile function:
iY XxXQ )|(
1 After replacing zero values with one, a logarithmic transformation is made to enable econometric
analysis, as QR now be estimated for a sub-sample of households reporting positive expenditure only. In the Tobit analysis, the zero values can be explicitly censored to account only for households with positive tuition expenditure.
ii uXY
© NIEPA T. Lakshmanasamy
123
The estimate of QR can be solved as the equivalent of conditional mean function’s expression, which will lead to the following result:
)(minarg1
i
n
i
i XyK
This is the QR coefficient which is to be interpreted in the same manner as that of the OLS coefficients, albeit at the quantiles (Buhai, 2005).
A Tobit model is also estimated for studying the private-tuition expenditure by the households as there exists zero-expenditure. The Tobit estimator is generally defined as an index function:
ii Xy *
The observed value of y:
0 if * iii yyy
0 if 0 * ii yy
For the index variable:
]|E[ *
ii Xy is X
For an observation randomly drawn from the population which may or may not be
censored: iii
ii XX
xyE
]|[
where
)/(
)/(
]/)0[(1
]/)0[(
i
i
i
ii
X
X
X
X
In the censored regression model with latent regression Xy* and
observed dependent variable, ay if *** and , if yybyay otherwise, where
ba and are constants, let )( and )( Ff denote the density and cdf of . Assume that
is a continuous random variable with mean 0 and variance2 , and ).()|( fXf
Then,
][Prob ]|[ * bya
X
XyE
For the case where the dependent variable is censored at zero and normally distributed disturbances, the above result specialises to:
i
i
ii X
X
XyE ]|[
(McDonald & Moffit, 1980) suggest a method to decompose the above marginal effect as:
)}()](1[{]|[
iiiiiii
i
ii
X
XyE
,

© NIEPADemand for Private Tuition
124
Where . and )( ,/ iiiiiii X Thus the slope vector can be
decomposed into:
i
iiii
i
iiii
i
ii
X
yyXyE
X
yXyEy
X
XyE
]0Prob[]0,|[
]0,|[]0[Prob
]|[
Thus, the marginal effect conditional on positive observations is:
i
iii
i
iii
X
yXyE
)(]0,|[
)]}()[(1{ iiii .
Tobit coefficients are interpreted the same way as coefficients from the OLS estimates are interpreted. However, in Tobit, the linear effect of the determining variables is on the latent variable and not on the observed outcome like OLS estimates. The reason as to why marginal effect conditional on positive observations is lower than the Tobit estimates is that the Tobit coefficients are adjusted with their respective probability distribution functions, thereby leading to better estimates, while the OLS estimates are average mean values estimated for the entire sample, not taking into account the probability associated with the dependent variable.
Empirical Results
Table 1 shows the proportion of students attending for private tuition in India (school-attending children). It is found that the proportion of students attending private tuition in urban areas is higher than that of students from rural areas, and the same for male students in urban locality is higher than that of students from rural backgrounds. In urban areas, the proportion of students attending tuition with respect to the total number of students enrolled at different education levels is above 40 per cent for male students. For female students, except at the primary level, the other levels also show that more than 40 per cent of students are attending private coaching. In rural areas, the proportion of students attending tuition with respect to the total number of students enrolled at different education levels is above 20 per cent for male students. For female students, except at the primary level, the other levels also show that more than 30 per cent of students are attending private tuition. Further, the attendance of private coaching at the higher levels of school education is increasing, more than 50 per cent in urban and 30 per cent in rural areas. This shows the pressure for students to secure good marks to enter the preferred course and institution in higher education.

© NIEPA T. Lakshmanasamy
125
TABLE 1
Proportion of students attending private tuition by sex and location
Education level
Urban Rural
Male Female Male Female
Total
students
Attending tuition
Per cent
Total
students
Attending tuition
Per cent
Total
students
Attending tuition
Per cent
Total
students
Attending tuition
Per cent
Primary 2,636 1,136 42.00 2,273 878 38.62 6,176 1,357 21.97 5,652 1,119 19.79
Upper-primary
2,421 1,120 46.26 2,197 973 44.28 5,536 1,428 25.79 5,022 1,274 25.36
Secondary 1,399 738 52.75 1,301 651 50.03 2,750 1,008 36.65 2,426 777 32.62
Higher-secondary
1,231 637 51.74 1,005 504 50.14 1,837 701 38.16 1,414 481 34.01
Source: IHDS-II 2011-12.
From Table 2, it can also be observed that the pattern of the average amount incurred on private tuition at all levels of schooling, though different for urban and rural areas, is quite similar. Even at the primary level, the average amount of private tuition expenditure for male students in urban areas is Rs 4,790 compared to Rs 2,904 in rural areas. As the level of education increases, the expenses on private tuition increase by nearly two times for both the sexes. The difference is glaring at the higher-secondary level. While the average amount incurred on private tuition is Rs 9,268 and Rs 8,755 for male and female students in urban areas, the average private tuition expenditure is Rs 5,481 and Rs 5,812 in rural areas. The rural-urban difference can be due to a host of factors like lack of access to specialised private tuition centres for college entrance examinations, distance to the nearby town, etc. Though fewer females attend private tutoring compared to male students, when female students attend coaching, parents incur a substantial amount on private tutoring of female children.
TABLE 2
Average private tuition expenditure by sex and location
Education level Urban Rural
Male Female Male Female
Primary 4,790 4,555 2,904 2,422
Upper primary 5,804 5,448 3,390 3,427
Secondary 7,040 6,825 3,843 3,808
Higher secondary 9,268 8,755 5,481 5,812
Source: IHDS-II 2011-12.
From Table 3, it is found that students attending private tuition pay more school fee than their counterparts who do not attend private tuitions. It is to be noted that the average school fees are higher for private tutoring students as they are generally from private schools that charge higher fees for pupils. At the higher secondary level, the school fee paid

© NIEPADemand for Private Tuition
126
by those students who attend private tuition is Rs 13,744 (per annum) compared to Rs 10,057 (per annum). That is, students attending private tuitions effectively pay on an average, Rs 21,092 for additional coaching. In other words, students at the higher secondary spend about 53 per cent more than their school fee on private tuition to secure high ranks and admission in higher education institutions.
TABLE 3
School fees and private tuition expenditure (Rs per annum)
Education level
Average School fee
School fee (not
attending tuition)
School fee (attending
tuition)
Average tuition
expenditure
Per cent of tuition
expenditure to school fee
Primary 4,270 3,505 6,367 3,578 56.19
Upper-primary
5,347 4,227 7,766 4,333 55.79
Secondary 6,724 5,641 8,326 5,189 62.32
Higher Secondary
11,619 10,057 13,744 7,298 53.09
Source: IHDS-II 2011-12.
From descriptive statistics presented in Table 4, it can be observed that about 36.4 per cent of the households that pay for private tuition belong to the higher communities. It is also found that 14 per cent of households that incur expenditure on private tuition have household head who has studied above Grade X. Similarly, the households with higher income (consumption expenditure), more family members and residing in urban areas, spend more on private tutoring of their children. Household consumption expenditure, instead of household income, it is generally argued, is a more accurate measure to gauge the socio-economic status of the household, as households generally tend to under-report income. Almost 50 per cent of the households which incur expenditure on private tuition belong to urban areas. Though a high proportion of parents own house, where probably the space for children to read is available, they also spent on private tuition of children (90 per cent). Similarly, a sizeable number of students from private schools (27 per cent), where the education provided is somewhat good compared to public schools, also attend private tuition.

© NIEPA T. Lakshmanasamy
127
TABLE 4
Descriptive statistics of variables
Variable Description
Mean (SD)
households not reporting
private tuition expenditure
Mean (SD)
households reporting
private tuition expenditure
PT Exp Household private tuition expenditure (Rs Per annum)
- 5099.50
(1606.64)
Ln (PT Exp) Log of household private tuition expenditure (Rs Per annum)
- 3.71 (3.21)
Ln (TCE) Log of total household consumption expenditure (proxy for income) (Rs per annum)
11.40 (0.730) 11.71 (0.664)
Ln (HH Size) Log of household size 1.465 (0.497) 1.641 (0.372)
Ln(SCH Fee)
Log of school fees (Rs.pa) 7.774 (1.820) 7.95 (1.757)
Community If OC/FC/GEN household = 1
0 = Otherwise
0.282 (0.450) 0.364 (0.481)
HH Education If household head/father education 10th and above = 1
0 = Otherwise
0.0937 (0.291) 0.142 (0.349)
FH Age Age of female head (years) 44.62 (13.06) 42.82 (11.4)
FH Age2 Age of female head squared (years) 2,161 (1,245) 1,963 (1,102)
MH Age Age of male head (years) 49.15 (13.51) 48.25 (11.81)
MH Age 2 Age of male head squared (years) 2,599 (1,405) 2,468 (1,267)
Own house If own house = 1
0 = Otherwise
0.920 (0.272) 0.889 (0.315)
Urban If urban residence = 1
0 = rural residence
0.346 (0.476) 0.492 (0.5)
School Type If private school = 1
0 = Otherwise
0.189 (0.392) 0.276 (0.447)
N Sample size 11,930 6,288 Source: IHDS-II 2011-12. Note: standard deviation in parenthesis.
The empirical quantile model can be specified as:
QPTE,θ = β0 + βi(θ)Xi + ui
where θ corresponds to the θth quantile of household private tuition expenditure distribution. Hence, QPTE, θ refers to the household’s private tuition expenditure in the θth quantile. The vector X includes covariates and therefore βi (θ) shows the effect of these covariates on the household’s private tuition expenditure on the θth quantile. Finally, u𝑖

© NIEPADemand for Private Tuition
128
refers to the error term. The empirical specification of the estimating equation for the determinants of household private tuition expenditure is:
Ln (PT Exp) = β0 + β1 Ln (TCE) + β2 Ln (HH Size) + β3 (Community)
+ β4 (HH Edu) + β5 (FHAGE) + β6 (FHAGE2) + β7 (MHAGE) + β8 (MHAGE2)
+ β9 (Own House) + β10 (Urban) + β11 (SCH Type) + β12 Ln (SCH Fee) + ui
Table 5 presents the estimated OLS coefficients and the Tobit estimates along with the marginal effect conditional on being censored. The OLS estimates show that the household income, higher community, own house, urban residence and private school enrolment of children have positive and statistically significant effects on private tuition expenditure in India, while household size and age of the parents have negative effect on private tuition expenditure. The average effect of an increase in household income on private tuition expenditure is 0.51 per cent. While the income elasticity of private tuition expenditure is a positive half a point, the household size effect is a negative half a point. Further, belonging to higher community increases household expenditure on education by 15 per cent on average, which is statistically significant, household head’s education has no significant impact on private tuition expenditure. Similarly, though the contribution of parental age towards children’s private tuition expenditure is only marginally negative, father’s age is significant, mother’s age has no statistical significance. The private school enrolment effect is stronger (24 per cent) than urban and own house effects.
As regards the Tobit analysis, though broadly the sign of the effects is the same as that of OLS estimates, the size of the effects markedly differs. While household income significantly increases the private tuition expenditure, the effect of household size, even though negative, is insignificant. The marginal effect of income conditional on being censored (for households reporting positive tuition expenditure) on private tuition expenditure is a significant 56 per cent. The effects of the community, head’s education, private school enrolment, urban residence and mother’s age have become more positively stronger than the OLS estimates. However, the effect of own house has become negative, but is not statistically significant. The household head’s education is positive and statistically significant; this implies that if the head is educated above secondary level, the household is likely to spend 24 per cent more on private tuition. Age of male head and its squared value are found to be statistically significant with positive and negative signs indicating that private tutoring expenditure increases with male head’s age at a decreasing rate, similar to Tansel and Bircan (2006) and Kim and Lee (2001), who too report that household head’s age has a positive impact and that private tutoring expenditure increases at a decreasing rate. As pointed out by Pallegadera (2011), who also finds a similar result, this might possibly indicate that middle-aged households are more likely to spend on private tuition for their school-going children than their elder counterparts, who may not have more school-going children. Surprisingly, school fee paid, though positively influences private coaching expenses, is not statistically significant in either specifications.

© NIEPA T. Lakshmanasamy
129
TABLE 5
OLS and Tobit estimates of the determinants of private tuition expenditure
Dependent variable: Ln (PT Exp)
Variable OLS coefficient Tobit coefficient Marginal effects (conditional on being uncensored)
Ln (TCE) 0.517***
(0.0261)
1.882***
(0.160)
0.564***
(0.0481)
Ln (HH Size) -0.460***
(0.0401)
-0.170
(0.246)
-0.0509
(0.0736)
Community 0.152***
(0.0378)
1.383***
(0.173)
0.422***
(0.0517)
HH Edu 0.00596
(0.0160)
0.785***
(0.252)
0.240***
(0.0755)
FH Age -0.000291*
(0.000173)
-0.461***
(0.0988)
-0.138***
(0.0296)
FH Age 2 0.0369**
(0.0167)
0.00363***
(0.00107)
0.00109***
(0.000321)
MH Age -9.74e-05
(0.000162)
0.654***
(0.102)
0.196***
(0.0305)
MH Age 2 -0.0578
(0.0419)
-0.00519***
(0.000988)
-0.00156***
(0.000296)
Own House 0.225***
(0.0284)
-0.0209
(0.275)
-0.00626
(0.0824)
Urban 0.264***
(0.0309)
3.067***
(0.179)
0.941***
(0.0537)
SCH Type 0.135***
(0.00937)
1.840***
(0.194)
0.569***
(0.0582)
Ln (SCH Fee) 0.127
(0.323)
0.0345
(0.0558)
0.0103
(0.0167)
Constant 0.127
(0.323)
-33.07***
(1.972)
-9.911***
(0.591)
R-square 0.241
Source: IHDS-II 2011-12. Note: Standard errors in parentheses. *** p<0.01, ** p<0.05, * p<0.1

© NIEPADemand for Private Tuition
130
As pointed our earlier, the OLS and Tobit estimates are point estimates, providing only the average effects. The effect of household income on household expenditure on private tuition is positive in both OLS and Tobit methods and are also statistically significant. On an average, the income elasticity of household expenditure on private tuition is around 0.51 to 0.56. The other variables can also be interpreted similarly. Importantly, forward community, more than secondary educated head, urban residence and private school enrolment significantly increase the household private tuition expenditure. However, increase in household size and the age of the household head impacts tuition expenditures significantly negatively. Surprisingly, the effect of school fees on private tuition expenditure is, though positive, statistically insignificant. This implies that irrespective of school attendance, households want their children to take up private coaching. It is to be noted that the effects of the explanatory variables may not be the same across the entire distribution; it may change the sign and size at the two tails of the distribution. In order to consider the differential effects in the range of the distribution, the QR is estimated for five quantiles, viz. 10th, 25th, 50th, 75th and 90th quantiles. The QR estimates are presented in Table 6.
It can be observed from Table 6 that the QR estimates are quite different from the OLS and Tobit estimates. Especially the range of the effects of the household characteristics on the private tuition expenditure is rather different for different quantiles. In some instances the sign also changes when moving from the lower to higher quantiles. The consumption expenditure of the household (a proxy for household income) has a positive and statistically significant impact throughout the quantiles. Further, the impact increases from lower to higher quantiles. That is, households with higher total consumption (as a proxy to higher income level) spend more on private tuition than households with lower consumption expenditure, a result also observed by Tansel and Bircan (2006) for Turkey. The private tuition expenditure elasticity with respect to household income is almost double at the 90th quantile compared to the 10th quantile. Household size (in logarithmic form) has a significant and negative impact on private-tuition expenditure in all quantiles. That is, an increase in the household size (mainly children) has a depressing effect on the household’s private tuition expenditure. At the 25th and 90th percentiles, an additional member in the household has a larger negative impact compared to the middle quantiles; an additional member in the household will decrease the private tuition expenditure by 0.49 per cent and 0.53 per cent respectively.
The effect of community variable (OC and General category) is significantly positive, with a decreasing impact across the quantiles. That is, at the lower quantiles, the private tuition expenditure by developed communities increases by 23 per cent, compared to 9 per cent at higher quantiles. Probably there is a wealth effect – wealthier households belonging to upper communities may send children to better schools or they may put children in business for which no additional coaching may be required and hence, spend little on private tutoring. To further investigate the community-dimension of private tuition expenditure in India, QR is estimated for different communities. The estimated results are reported in the appendix. It can be observed that the total consumption expenditure (proxy for income) has a positive and statistically significant effect on private tuition expenditure across all the groups. Further, in the SC and ST households, spending on private coaching even at the lower quantiles is higher, compared to the same with other communities. Also, at the higher quantiles, the coefficients reported for ST households are the highest among the communities.

© NIEPA T. Lakshmanasamy
131
TABLE 6
Quantile estimates of the determinants of private tuition expenditure Dependent variable: Ln (PT Exp)
Variable q10 q25 q50 q75 q90
Ln (TCE) 0.406***
(0.0343)
0.395***
(0.0407)
0.448***
(0.0414)
0.569***
(0.0385)
0.729***
(0.0572)
Ln (HH Size) -0.405***
(0.118)
-0.490***
(0.0677)
-0.422***
(0.0528)
-0.435***
(0.0485)
-0.513***
(0.0566)
Community 0.238***
(0.0554)
0.182***
(0.0417)
0.166***
(0.0368)
0.145***
(0.0313)
0.0986**
(0.0408)
HH Edu 0.103*
(0.0620)
0.139*
(0.0755)
0.150***
(0.0240)
0.119***
(0.0431)
0.0697
(0.0757)
FH Age -0.00940
(0.0366)
-0.00119
(0.0132)
0.0164
(0.0184)
0.0385***
(0.0148)
0.00416
(0.0214)
FH Age 2 -0.000224
(0.000380)
-0.000243
(0.000152)
-0.000363*
(0.000195)
-0.000593***
(0.000174)
-0.000236
(0.000231)
MH Age 0.0494
(0.0367)
0.0394**
(0.0179)
0.0309
(0.0232)
0.0196
(0.0158)
0.0423**
(0.0188)
MH Age 2 -0.000123
(0.000345)
-0.000100
(0.000177)
-9.40e-05
(0.000223)
1.99e-05
(0.000175)
-0.000172
(0.000197)
Own House -0.118
(0.0727)
-0.0993
(0.0639)
-0.0669
(0.0478)
-0.0625
(0.0406)
-0.00781
(0.0567)
URBAN 0.243***
(0.0450)
0.261***
(0.0402)
0.225***
(0.0312)
0.207***
(0.0450)
0.131***
(0.0429)
SCH Type 0.213***
(0.0583)
0.251***
(0.0612)
0.297***
(0.0369)
0.347***
(0.0487)
0.311***
(0.0420)
Ln (SCH Fee) 0.147***
(0.0257)
0.119***
(0.0130)
0.131***
(0.0152)
0.141***
(0.00910)
0.129***
(0.0192)
Constant -0.0957
(0.433)
1.167**
(0.489)
0.886*
(0.533)
-0.208
(0.383)
-1.181**
(0.581)
R-square 0.0926 0.0936 0.1330 0.1728 0.2003
Source: IHDS-II 2011-12. Note: Standard errors in parentheses. *** p<0.01, ** p<0.05, * p<0.1
As observed in the literature on private tuition expenditure, it can be seen that education of the household head has a positive and significant impact across the quantiles. A household head whose education is above 10th standard increases private tuition expenditure by 10 per cent and 13 per cent at the 10th and 25th quantiles with the median value of 15 per cent; however, at the higher quantiles, the results show an insignificant 9 per cent. As per quantile regression results, the effect of the age of female head changes from negative to positive when moving from lowest to highest quantiles; it is statistically

© NIEPADemand for Private Tuition
132
significant only at the 75th quantile, where the private tuition expenditure increases by 3 per cent for female headed households. Also, the effect of the age of male head is about 4 per cent. An interesting observation that can be made pertains to the school fee paid by the households: the impact of school fee is positive and statistically significant across the quantiles. Tansel and Bircan (2006) point out that home ownership captures the wealth effect on private tuition expenditure. However, households’ ownership status of a house does not have any significant impact on private tuition expenditure in India. It is to be, however, noted that the values of the coefficients are mostly negative. This is in tandem with (Tansel and Bircan, 2006), where they show that ownership of house does not have a significant impact on private tuition expenditure. There is an urban bias in private tuition expenditure; the urban coefficients are statistically significant for all quantiles. The impact is decreasing across the quantiles; at the lower quantiles households are more likely to spend if they belong to an urban area of residence.
At the 10th quantile, a one per cent increase in the school fee is likely to see the households increase private tuition expenditure by 14 per cent; subsequently, at the 25th quantile, the households are likely to increase by 11 per cent; at the 50th quantile, the households are likely to increase their expenditure by 13 per cent; between the 75th and the 90th quantile, there is a decreasing trend with the impact ranging from 14 per cent to 12 per cent respectively. While the effect of school fee on private tuition expenditure is low and statistically insignificant in both OLS and Tobit estimates, the effect at all quantiles are higher and significant at 1 per cent level, showing the efficacy of QR. From the quantile results, it can be seen that type of school is also an important determinant of private tuition expenditure. This significance is observed both in QR and Tobit analysis. The private tuition expenditure increases from 21 per cent to 35 per cent at 10th to 75th quantiles.
From Figure 3, which plots the QR coefficients as a graph, the impact of the determinants across the distribution of household private tuition expenditure can be observed. The dotted lines in the graphs represent the OLS coefficients, which is constant across the distribution of private tuition expenditure. However, QR coefficients plotted give a picture that the impact of the determinants is not the same across the distribution of private tuition expenditure. As pointed in the discussion of the empirical results, glaring differences can be found for the coefficients of total consumption expenditure, area of residence and community. Thus, the QR plot of the household private tuition expenditure reveals a specific pattern of statistical significance for the determining variables. It can be noted that the important drivers of private tuition expenditure are total consumption expenditure (used as a proxy to income), education of family head, urban residence, forward community, private school enrolment and school fee.

© NIEPA T. Lakshmanasamy
133
FIGURE 3
Plot of OLS and Quantile Estimates
Conclusion
This paper has analysed the demand for private tutoring in India at the school level by investigating the household level determinants of private tuition expenditure, using the 2011-2012 IDHS-II household survey data and the Tobit and QR methods. While the OLS and Tobit estimates are only average effects, the differential impact of the determining variables on private tuition expenditure across the distribution is captured by the QR estimates. The empirical results show that the important determinants, which have a significant impact on private tuition expenditure, are income (measured by consumption expenditure), area of residence, community and type of school that the ward of the household attends. Further, the QR analysis of the household private tuition expenditure reveals a specific household private tuition expenditure pattern in India. The household income effect on private tuition expenditure increases from 41 per cent to 73 per cent at the 10th to 90th quantiles, clearly showing that the better off households that value education more incur higher on the private coaching of their children. Enrolment in private school monotonically increases household

© NIEPADemand for Private Tuition
134
private tuition expenditure from 21 per cent to 35 per cent at the 10th to 75th quantiles of the distribution.
A possible reason for the emergence of private tuition is the decline in quality of education provided by the formal schooling systems. Also the rising aspirations of households to see their wards in preferred streams and institutions, which are highly competitive, necessitate acquiring additional coaching. Thus, households incur high expenditure on private tuition to supplement formal education. To tackle this growing private coaching phenomenon, the quality of education needs to be improved in the formal schools. An important concern regarding private coaching in India is the fact it is an unregulated industry, with no regulatory body to govern the same. Therefore, the primary focus has to be given to bring in a regulatory mechanism for private coaching institutions.
References
ASSOCHAM. (2013). Business of Private Coaching Centres in India, New Delhi: ASSOCHAM. Azam, M. (2016). “Private Tutoring: Evidence from India”, Review of Development Economics, 20, pp.
739-761. Banerjee, A.V., S. Cole, E. Duflo and L. Linden (2007). “Remedying education: Evidence from two
randomised experiments in India”, Quarterly Journal of Economics, 122, pp. 1235-1264. Berberroglu, G. and A. Tansel (2014). “Does private tutoring increase students’ academic performance?
Evidence from Turkey”, International Review of Education, 60, pp. 683-701. Bray, M. (2006). “Private supplementary tutoring: Comparative perspectives on patterns and
implications”, Compare: A Journal of Comparative Education, 36, pp. 515-530. Bray, M. (2007). The Shadow Education System: Private Tutoring and its Implications for Planners,
Paris: UNESCO-IIEP. Bray, M. (2011). “Does tutoring work?” in M. Bray: The challenge of shadow education: Private tutoring
and its implications for policy makers in the European Union, Brussels: European Commission, pp. 47-51.
Bray, M. and P. Kwok (2003). “Demand for private supplementary tutoring: Conceptual considerations, and socio-economic patterns in Hong Kong”, Economics of Education Review, 22, pp. 611-620.
Buhai, I.S. (2005). “Quantile rRgression: Overview and selected applications”, Ad-Astra-The Young Romanian Scientists’ Journal, 4.
Dahiya, S. and B. Vishwanathan, (2015) “Women's malnutrition in India: The role of economic and social status”, Margin: The Journal of Applied Economic Research, 9, pp. 306-332.
Dang, H.A. (2007). “The determinants and impact of private tutoring classes in Vietnam”, Economics of Education Review, 26, pp. 684-689.
Dang, H._A. and F.H. Rogers (2008). “How to interpret the growing phenomenon of private tutoring: Human capital deepening, inequality increasing, or waste of resources?” ,World Bank Research Observer, 23, pp. 161-200.
Dongre, A. and V. Tewary (2015) “Impact of private tutoring on learning levels”, Economic and Political Weekly, 50, pp. 72-80.
Gurun, A. and D.L. Millimet (2008). “Does private tutoring payoff?”, Bonn, Germany: IZA Discussion Paper No. 3738.
McDonald, J. F. and R.A. Moffit (1980). “The uses of Tobit analysis”, Review of Economics and Statistics, 62, pp. 318-321.
Pallangedera, A. (2011). “Demand for private tuition classes under the free education policy. Evidence based on Sri Lanka”, MPRA Paper No. 31960.
Papakonstantinou, G. P. (2004). “The real university cost in a ‘free’ higher education country”, Economics of Education Review, 24, pp. 103-108.

© NIEPA T. Lakshmanasamy
135
Seema Jayachandran (2014) “Incentives to teach badly: After-school tutoring in developing countries”, Journal of Development Economics, 108, pp. 190-205.
Snehi, N. (2014) “Private tuition and its implications on quality secondary education”, Journal of Indian Education, 36, pp. 61-75.
Tansel, A. and F. Bircan (2006). “Demand for education in Turkey: A Tobit analysis of private tutoring expeditures”, Economics of Education Review, 25, pp. 303-313.
Tilak, J.B.G. (2011). “Determinants of household expenditure on education in rural India”, Working Paper No. 88, New Delhi: NCAER.

© NIEPADemand for Private Tuition
136
APPENDICES
TABLE A1
Proportion of students attending private tuition and average private tuition expenditure by community
Level
OC OBC SC ST
Pro- portion
Ex-penditure
Pro- portion
Ex- penditure
Pro- portion
Ex- penditure
Pro- portion
Ex- penditure
Primary 36.8 4,993 26.77 3,159 24.15 2,862 13.36 4,538
Upper- Primary
45.1 6,318 30.18 3,625 29.10 3,381 16.93 5,983
Secondary 52.7 6,942 39.84 4,365 36.17 4,544 22.05 7,949
Higher- Secondary
52.7 8,409 41.77 6,050 37.07 5,757 32.93 9,705
Source: IHDS-II 2011-12.
TABLE A2
Quantile Regression estimates of private tuition Expenditure for OC Community
Dependent variable: Ln (PT Exp)
Variable q10 q25 q50 q75 q90
Ln (TCE) 0.445** (0.175)
0.317** (0.141)
0.412*** (0.156)
0.320*** (0.123)
0.592*** (0.172)
Ln (HH Size) -0.112
(0.302) -0.425* (0.235)
-0.304 (0.202)
-0.121 (0.148)
-0.380* (0.214)
HH Edu 0.367* (0.188)
0.174 (0.191)
0.345** (0.161)
0.286*** (0.0868)
0.132 (0.103)
FH Age -0.152
(0.0983) -0.152** (0.0681)
-0.0848 (0.0644)
0.0379 (0.0590)
0.0539 (0.0984)
FH Agev2 0.00085
(0.00094) 0.00102
(0.00070) 0.00049
(0.00065) -0.00064
(0.00062) -0.00070 (0.0012)
MH Age 0.212* (0.123)
0.210*** (0.0808)
0.168** (0.0675)
0.0755 (0.0718)
0.0528 (0.110)
MH Age 2 -0.00134
(0.00098) -0.00146* (0.00077)
-0.00117* (0.00063)
-0.00040 (0.00069)
-0.00035 (0.0012)
Contd…

© NIEPA T. Lakshmanasamy
137
Own House -0.227
(0.186) -0.203* (0.118)
-0.250 (0.172)
-0.210*** (0.0753)
0.0981 (0.160)
Urban 0.603** (0.242)
0.443*** (0.119)
0.485*** (0.135)
0.366*** (0.130)
0.394*** (0.135)
SCH Type 0.356* (0.199)
0.328* (0.183)
0.407* (0.241)
0.452** (0.176)
0.556*** (0.213)
Ln (SCH Fee) 0.321*** (0.0624)
0.227*** (0.0526)
0.176*** (0.0455)
0.181*** (0.0423)
0.129 (0.0820)
Constant -3.377
(2.706) 0.184
(1.844) -0.588
(1.586) 0.404
(1.187) -1.387
(1.393)
N 475
Note: Standard errors in parentheses. Sig: *** p<0.01, ** p<0.05, * p<0.1
TABLE A3
Quantile regression estimates of private tuition Expenditure for OBC community Dependent variable: Ln (PT Exp)
Variable q10 q25 q50 q75 q90
Ln (TCE) 0.363*** 0.399*** 0.379*** 0.542*** 0.722***
(0.0823) (0.0685) (0.0559) (0.0336) (0.0798)
Ln (HH Size) -0.445*** -0.407*** -0.375*** -0.323*** -0.272***
(0.142) (0.117) (0.0398) (0.0639) (0.0921)
HH Edu 0.0762 0.186 0.150** 0.207** 0.244**
(0.148) (0.138) (0.0736) (0.0908) (0.123)
FH Age 0.00104 -0.00710 0.0421 0.0259 0.0367
(0.0898) (0.0400) (0.0401) (0.0349) (0.0424)
FH Age 2 -0.000300 -0.000235 -0.000561 -0.000325 -0.000559
(0.000998) (0.000443) (0.000427) (0.000383) (0.000513)
MH Age -0.0283 0.00788 -0.00362 0.0251 -0.00345
(0.108) (0.0368) (0.0445) (0.0316) (0.0529)
MH Age2 0.000597 0.000254 0.000162 -0.000172 0.000162
(0.00108) (0.000394) (0.000427) (0.000301) (0.000546)
Own House 0.0245 -0.00643 -0.0564 -0.0613 -0.0309
(0.174) (0.107) (0.0720) (0.0534) (0.152)
Urban 0.210* 0.229*** 0.214*** 0.174*** 0.0385
(0.113) (0.0664) (0.0516) (0.0481) (0.0456)
Contd…

© NIEPADemand for Private Tuition
138
SCH Type 0.137 0.227*** 0.203*** 0.213*** 0.126**
(0.148) (0.0828) (0.0633) (0.0602) (0.0573)
Ln (SCH Fee) 0.174*** 0.142*** 0.162*** 0.156*** 0.146***
(0.0438) (0.0285) (0.0201) (0.0214) (0.0180)
Constant 1.789 1.541 1.652*** -0.0124 -1.009
(1.403) (0.961) (0.634) (0.444) (1.199)
N 2,393
Note: Standard errors in parentheses. *** p<0.01, ** p<0.05, * p<0.1
TABLE A4
Quantile regression estimates of private tuition expenditure for SC community
Dependent variable: Ln (PT Exp)
Variable q10 q25 q50 q75 q90
Ln (TCE) 0.557*** 0.503*** 0.522*** 0.666*** 0.903***
(0.127) (0.0794) (0.0716) (0.0766) (0.0932)
Ln (HH Size) -0.897*** -0.660*** -0.653*** -0.603*** -0.783***
(0.214) (0.149) (0.112) (0.141) (0.121)
HH Edu 0.101 -0.189 -0.178 -0.0554 -0.114
(0.221) (0.121) (0.166) (0.103) (0.143)
FH Age -0.0367 -0.0353 -0.0720 -0.0317 0.0285
(0.0722) (0.0428) (0.0681) (0.0397) (0.0688)
FH Age 2 -0.000295 -5.02e-05 0.000406 8.70e-05 -0.000336
(0.000900) (0.000516) (0.000907) (0.000456) (0.000796)
MH Age 0.0326 0.0853* 0.115* 0.0554* 0.0517
(0.0718) (0.0442) (0.0642) (0.0299) (0.0631)
MH Age 2 0.000312 -0.000392 -0.000688 -0.000165 -0.000331
(0.000738) (0.000395) (0.000748) (0.000319) (0.000667)
Own House 0.0982 0.108 -0.0816 -0.0765 -0.0489
(0.143) (0.194) (0.117) (0.0813) (0.109)
Urban 0.285** 0.205*** 0.186 0.285*** 0.143**
(0.127) (0.0767) (0.120) (0.0766) (0.0651)
SCH Type 0.295** 0.217** 0.314*** 0.453*** 0.398***
(0.135) (0.0960) (0.0834) (0.0868) (0.0732)
Ln (SCH Fee) 0.0828* 0.0526* 0.0887*** 0.0926*** 0.0722
(0.0493) (0.0296) (0.0187) (0.0187) (0.0475)
Constant 0.380 0.301 0.554 -0.256 -3.166***
(1.476) (1.135) (1.071) (0.956) (0.996) N 1,177 Note: Standard errors in parentheses. *** p<0.01, ** p<0.05, * p<0.1

© NIEPA T. Lakshmanasamy
139
TABLE A5
Quantile regression estimates of private tuition expenditure for ST community Dependent variable: Ln (PT Exp)
Variable q10 q25 q50 q75 q90
Ln (TCE) 0.312* 0.466* 0.638*** 0.538*** 0.911***
(0.179) (0.257) (0.130) (0.163) (0.183)
Ln(HH Size) -0.307 -0.690* -0.650*** -0.538*** -0.550***
(0.258) (0.360) (0.219) (0.173) (0.168)
HH Edu 0.00915 0.0467 -0.250 -0.371 -0.430
(0.445) (0.360) (0.204) (0.259) (0.506)
FH Age 0.00767 0.176 0.0680 0.143* 0.141
(0.139) (0.141) (0.0959) (0.0782) (0.0947)
FH Age 2 6.51e-05 -0.00176 -0.000467 -0.00139 -0.00153
(0.00170) (0.00152) (0.000945) (0.000905) (0.00109)
MH Ag 0.0114 -0.189* -0.00874 -0.0726 -0.0654
(0.180) (0.114) (0.109) (0.0843) (0.110)
MH Age 2 -0.000169 0.00171 -9.06e-05 0.000601 0.000621
(0.00182) (0.00107) (0.000986) (0.000877) (0.00116)
OWNHOUSE -0.524* -0.235 0.0876 -0.0402 0.255
(0.281) (0.275) (0.264) (0.260) (0.155)
Urban 0.207 -0.0454 -0.0850 -0.268 -0.344**
(0.334) (0.269) (0.175) (0.171) (0.166)
SCH Type 0.522** 0.429* 0.460** 0.369** 0.0336
(0.203) (0.226) (0.216) (0.157) (0.179)
Ln (SCH Fee) 0.375*** 0.306* 0.239*** 0.313*** 0.171**
(0.0855) (0.179) (0.0572) (0.0517) (0.0781)
Constant 0.0631 1.399 -1.684 -0.567 -3.391
(2.572) (2.075) (1.562) (1.837) (2.533)
N 298
Note: Standard errors in parentheses. *** p<0.01, ** p<0.05, * p<0.1

© NIEPADemand for Private Tuition
140
Journal of Educational Planning and Administration Volume XXXI, No. 2, April 2017

© NIEPAJournal of Educational Planning and Administration Volume XXXI, No. 2, April 2017, pp. 141-156
© National University of Educational Planning and Administration, 2017
Transition from Elite to Mass System of Higher Education in India
— What does Massification Mean for Equality?#
S. Srinivasa Rao *
Abstract
The post-1990s marked a significant shift in the way higher education had expanded in many countries including India. Expansion in general had widened access and allowed transition of the Indian higher education to transcend from an elite to a mass system of higher education, in the shortest possible time, between 2000-2015. However, it actually remained limited to socially privileged groups as expansion during this period mostly took place in the private sector, access to which continues to be a class privilege. Thus, higher education expansion, instead of bridging inequalities among the privileged and disadvantaged social groups, seems to have exacerbated the existing inequalities, making expansion of and access to higher education unequal. Under such a scenario, the paper seeks to address the question: What does expansion mean for equality in neoliberal times? Using sociological lens, the paper mainly highlights a few debates that have
emerged in the Indian higher education scene.
# Earlier draft of the paper was presented at the Department of Sociology, University of Hyderabad
on March 20, 2015. The author thanks the Department for inviting him as a Visiting Fellow under its UGC-SAP and for providing an opportunity to share some of his current work.
* Zakir Husain Centre for Educational Studies, School of Social Sciences, Jawaharlal Nehru University, New Delhi-110067, Email: [email protected]; [email protected]

© NIEPA Transition from Elite to Mass System of Higher Education in India
142
Introduction
Expansion of higher education (HE) has been the hallmark of the times we live in today. Systems of HE across the world have been expanding at a much faster pace than before. However, the patterns of expansion are not similar (Trow 1972) as it is obvious due to the differential levels of development that each country has been undergoing, the social and structural contexts of the societies and, most importantly, the prevalence of disparities among various social groups within those social contexts. Notwithstanding such constraints, nations all over the world have sought to expand and renew their HE systems as the process of globalisation seems to have promised opportunities for college goers in the labour market. In India too, there has been a sudden revolution in just one and a half decades (2000 to 2015) in terms of expansion of HE and as a result, there has been a tremendous influx of students into the portals of HE institutions (HEIs). Large numbers of first generation learners continued to enter HEIs, though at the same time, there has been restructuring of HE delivery, which favoured the second generation middle class students mostly. The first generation learners, mostly from the disadvantaged social backgrounds such as Scheduled Castes (SCs), Scheduled Tribes (STs), minorities, Other Backward Classes (OBCs), women and populations living in remote and rural hinterlands, were mainly accessing low quality provincial public institutions of general HE , while the second generation learners, mostly from socially and economically privileged backgrounds, the so called upper and intermediary dominant castes, were occupying major chunks of elite public institutions (centrally funded universities and professional institutions), and there was burgeoning of private professional colleges and universities.
Further, importantly, the post-2000 HE expansion has been mostly in the private sector and in professional education arena, which are said to be in demand in the globalised employment market. This expansion has also made India break the barrier of being an ‘elite’ system of HE to enter into a ‘mass’ system, to use the classification of Martin Trow (1973), a Professor of Sociology at the University of California1. Trow’s ideal typical classification of the world HE systems in terms of Gross Enrolment Ratios (GERs) distinguishes between the elite, mass and universal systems of HE. According to him, the elite systems are defined as those which enrol up to 15 per cent of the age cohort, namely, 18-23 years of age; mass systems as those enrolling between 15 per cent and 40 per cent; and the universal systems are those which enrol more than 40 per cent. Going by this classification, with a GER of 21.1, India has now moved into what Varghese (2015) calls as the ‘initial’ phase of massification of its HE system2.
1 The classification still has some analytical usefulness while analysing HE transitions across the
world, though these notions are often contested. 2 To be more specific, in 2002-03, India had a GER of 9 (MHRD, 2014). What is clearly visible is that
the ten year period between 2002-03 and 2012-13 witnessed a miraculous more than doubling of GER, which the nation could not achieve in almost 60 years of post-independence period. The Government of India promised to expand higher education sector ‘in all its modes of delivery’ to increase the GER to 21
by 2016-17 and to 30 by the year 2020 (MHRD 2014) (emphasis added).
What is important to note here is the phrase that is used, ‘in all its modes of delivery’ as it signals clearly that the government aims to adopt more than one mode of delivery, namely, the ‘public’ mode of delivery of higher education.

© NIEPA S. Srinivasa Rao
143
Several factors are attributed for such transition into mass system of HE in India. First, HE expansion in India is largely due to the demographic transition that the country is currently witnessing (Varghese 2015; Kapur and Mehta 2017). As the country is witnessing increase in the population of the young, with more than 30 per cent of the population in the category of below 15 years of age and about 5 million people entering into the age group of 15-24, the number of aspirants seeking HE is also correspondingly increasing (Kapur and Mehta 2017: p.4). Second, there have been factors that have generated demand for HE as the feeder streams such as elementary and secondary education systems got a fillip through massive governmental attention to restricting drop-outs and enhancing retention and completion. Third, the burgeoning middle class composition in the post-reform period created a class of HE seekers, who realised the value of HE in the global economy and employment market. All these factors in tandem seem to have triggered the journey of India from elite to mass system of HE. In this context, the paper seeks to address the question: Has the expansion of HE been equitable for all social groups?
Understanding Higher Education Transitions: A Neo-Weberian Perspective
As mentioned earlier, Martin Trow (1970, 1972, and 1973) presents a detailed analysis of transitions that have taken place in HE in most advanced societies of the West. His Weberian perspective of HEal systems has been widely accepted as the basis for any understanding of transitions in comparative contexts3. However, Trow recognises that such classification does have some limitations and thus he applies the following qualifiers: First, according to Trow, the three phases – elite, mass and universal – are, in Max Weber’s sense, ideal types. That means, they are abstracted from empirical reality and they merely emphasise functional relationships among several components of an institutional system common to most societies. Trow rightly cautions that the description of any phase cannot be taken as a full or adequate description of any single national system.
Second, the movement of a system from elite to mass HE or from mass to universal HE does not necessarily mean that the forms and patterns of the prior phase or phases disappear or are transformed. In fact, on the contrary, each phase survives in some institutions and in parts, while the system as a whole evolves to carry out functions of the next phase (Trow 1973). In other words, what Trow suggests is that “in a mass system, elite institutions may not only survive, but flourish; and elite functions continue to be performed” (1973: p.19). Further, the newest institutions of HE have characteristics of the next phase. Thirdly, Trow argues that the phases of development of HE should not be taken to imply that the elements and components of a system of HE change at equal rates and that a system moves evenly towards the characteristic forms of the next phase. In fact, the “development is uneven” (Trow 1973: p. 20).
3 We must, however, keep in mind that the kind of transitions Trow was writing in the early 1970s
may be very different from what countries such as ours has been experiencing over the past decade or so. The nature and character of transitions of Indian higher education presents a unique case in comparison to the transitions of other western advanced countries.

© NIEPA Transition from Elite to Mass System of Higher Education in India
144
Trow (1970, 1973) argues that when access is highly limited as in the case of elite HE, it is generally seen as a privilege, either of birth or talent or both. But, when it moves into the mass system, people increasingly begin to see entry to HE as a right for those who are endowed with certain formal qualifications. And “when it moves into the universal level, attendance in HE is seen as highly obligatory” (Trow 1973: p. 7). Further, elite HE is concerned primarily with shaping the mind and character of the ruling class, as it prepares students for broad elite roles in government and learned professions4.
In mass HE, Trow (1973) notes that the institutions still prepare elites, but a much broader range of elites that includes the leading strata of all the technical and economic organisations of the society and the emphasis shifts from the shaping of character to the transmission of skills for a more specific technical elite. In the systems marked by universal access, students are prepared not primarily for elites, but to prepare and adapt the population to rapid social and technological change (Trow 1970, 1973). In this stage, it is often said that the entrants to HE have a certain deficit of cultural capital and thus it becomes the primary responsibility of HE to teach them the traits of a college or a university graduate.
For Trow, “elite systems tend to be highly homogenous, the component institutions are very much like one another” (1973: p.10). Mass systems are more comprehensive with diverse standards and the universal systems are more diverse with no common standards among them. If we consider the Indian scenario, we have certain institutions that are fairly elitist such as IITs (Indian Institutes of Technology) and Central Universities, certain others are comprehensive and affiliating institutions with larger numbers of student enrolments making them student townships.
Trow also highlights the principles of selectivity in different phases and the way these principles affect equity and equality in times of expansion5. In the elite system, admission is strictly based on meritocratic principles. This process, however, rested heavily on very marked social inequalities in the opportunities to gain qualifications. The demand for abolition of inequality was in the first instance met solely by an emphasis on meritocratic procedures and criteria, without much regard for the role of social inequality in affecting chances of meeting that criterion (Trow 1973). Secondly, the phase of mass HE is marked by a growing concern for an increase in educational opportunities that would enable ‘able’ students from lower social strata to enter HE. However, during this phase, growth in student numbers is largely made up of an increase in the proportion of middle class students, who almost everywhere are the first to take advantage of increases in educational opportunities of every kind and at every level.
This has been precisely the situation in the post 2000s in the Indian context when HE had moved from elite to mass system and it is evident from the calls for widening the framework of the state policy of affirmative action to include Other Backward Classes
4 Max Weber calls these individuals as ‘experts’ in his writings on ‘Chinese Literati’. 5 Trow discusses distinctive features of three phases in terms of other dimensions such as curriculum,
student careers, institutional boundaries, locus of power and decision making, academic standards, access and student selection, forms of academic administration and internal governance. But, these may not be relevant for the present paper. A significant point Trow makes is that the expansion of student numbers precede institutional changes and not vice versa. In other words, the institutions do not change in anticipation of the expansion or growth. This however, may be debatable.

© NIEPA S. Srinivasa Rao
145
(OBCs) through a legal provision in 2008, which sought to reserve 27 per cent of seats in all centrally funded institutions and that had also called for widening the spaces available in HE in general. That means, it was not merely reserving the 27 per cent of those that were actually available, but an overall addition of 27 per cent more to the actual available seats so that the other students who do not belong to any labelled categories are made to suffer as a result of this new quota introduced6. Some would argue that this has also triggered the growth of private sector to make spaces for those from non-labelled categories to avail HE as access to public education is perceived to be limited. Concerns such as this continue to play out in the third stage as well. According to Trow (1973), as a result of partly the work of sociologists and partly the political pressures, there emerges a clear and more widespread recognition of the effect of social inequalities on educational achievement. In this phase there is an effort to compensate for the disadvantageous effects of the lower class origins. For the purpose of this paper, we shall focus mainly on the implications of persisting inequalities in the initial phase of massification of Indian HE and the continuing debates and dilemmas that it has been invoking in terms of access and equality.
Phases of HE Expansion in India
Tilak (2008) identifies different nodes in the expansion of HE in India after Independence. First, according to him, “expansion of system capacity was most impressive during the first two and a half decades of Independence, that is, until the mid-1970s, as the state somewhat liberally funded HE” (Tilak 2008: p. 223). This was the period, Tilak argues, which was characterised by a rapid growth of public and state-supported public institutions. This was also the period when the state set up new institutions at the central level, but had not opened them up ‘sufficiently’ to the socially disadvantaged and historically deprived. In other words, though there is a Constitutional goal of achieving equality in recruitment to jobs and in HE through affirmative action, such policy was not accepted by these institutions in the initial years, thereby restricting access.
The situation changed, Tilak claims, since the mid-1970s. This was the period when the country was experiencing uncertain political, economic and social situation, when there was social churning and movements all over the country, of one kind or the other. This was also the period when Nehruvian idealism and elitism have begun to wane. HE in this scheme of things did not immediately figure in the priorities of the political elite. The voluntarism and philanthropic streak of HE in Nehruvian period also began to wane. This phase had marked the emergence of private colleges in different parts of the country. However, the problems of mismanagement of the private sector forced the state to bring those private institutions into its fold through grants-in-aid scheme, adding to the overall commitment of the state7.
Moreover, as the state was not in a position to set up new colleges, it gave into attempts to set up colleges by private individuals and groups ever since the early 1980s. This has set in massive expansion in the name of capitation fee colleges in professional education, mainly in the three states of Karnataka, Tamil Nadu and Maharashtra. Kaul (1993) suggests that
6 The affirmative policy of reservation of 27 per cent seats in HE actually expanded intake in centrally
funded institutions of HE by 54 per cent effectively. 7 Most of the private colleges established before the 1980s got more than 95 per cent of their financial
support from the government (Stella 2002).

© NIEPA Transition from Elite to Mass System of Higher Education in India
146
these colleges were set up to boost HE opportunities of certain dominant castes and classes and were accessible only to those who could pay exorbitant fees. These capitation fee colleges, however, have made inter-state movements of students who can afford to seek scarce professional education possible. The number of colleges of this kind were only a few in the 1980s, but have increased with the rising demand from students and also other states began to emulate this model of privatisation of HE.
The erstwhile state of the united Andhra Pradesh8 was one of the states which began establishing new colleges under the capitation fee regime in the early years of 1990s. The argument of the state government was that the private capital of families in the state shall remain circulated within the state, rather than migrate to the neighbouring states such as Karnataka, Tamil Nadu and Maharashtra. This phase of expansion marks a distinct character of social and economic elitism, which Trow (1973) did not capture in his analysis and is specific to Indian HE system.
The next phase of expansion of HE began on this note of emerging private capitation colleges in the 1980s. The early 1990s clearly marked a further departure, showing a further decline of the public HE expansion. Tilak (2003, 2008, 2009, 2014) very elaborately discusses the story of the steady disappearance of ‘publicness’ of the public HE. He explains the reasons for the growth of private HE in the 1990s and the slow death of public HE (Tilak 2003). According to him, the social demand for HE exceeded the public supply and the private market sought to meet the unsatisfied demand in this phase of HE evolution (Tilak 2003: p. 557).
While much of the expansion before the mid-1990s was in the public HE system, the post-mid-1990s expansion of HE was mainly due to the private/self-financing/unaided/for-profit (though it is mainly through re-investment mode) HE. It may, however, be important to note that the public HE system is not uniform, but is diverse and varied in its nature, type of institutions and the kind of student composition in each of these institutions, clearly suggesting a hierarchical pyramid. For example, there are elite institutions of national importance like IITs and IIMs and Central Universities at the top, entry into which is hugely selective for the limited places available to occupy. The competition for entry into these institutions had stringent yardsticks, making only 2-3 per cent of those who aspire and apply to make it to these institutions. This leaves the rest of those who are not able to make it, to aspire to get into the second rung institutions of the state supported deemed-to-be universities, central institutions of research and teaching, regional institutes of engineering and professional education and other universities of repute, run by the provincial/state governments. This segment is also not uniform or homogenous, as it contains a wide variety within itself. Even further down, at the bottom rung of the state supported institutions, are the colleges which neither have enough financial resources nor have the right kind of teaching staff to make them actually realise any quality.
On the other hand, the private HE is also characterised by a wide diversity. At the top of the hierarchy are the old and philanthropic private institutes and universities which “have achieved considerable respect” (Altbach 2009: p.49) such as Manipal University, TISS, TIFR, BITs Pilani, Symbiosis, Narsee Monjee, etc., now most of them rechristened as deemed-to-be
8 References to the state of Andhra Pradesh are mainly to the pre 2014 united state. In 2014, the state
was bifurcated into Telangana and Andhra Pradesh after a protracted movement and struggle for separate statehood for Telangana.

© NIEPA S. Srinivasa Rao
147
universities, that were set up prior to the onset of the wave of private institutions in the neoliberal regime. Of late, change in the norms to set up private universities led to a large scale establishment of private universities which are unaided, deemed to be universities under various state legislations as well as the UGC. They in turn are different from those of the big corporates, such as Azim Premji University (of Wipro, a multi-product corporate giant), Shiv Nadar University (HP, a computer hardware major), OP Jindal University (of Jindal Steel and Power Limited), etc. There are many other universities whose sole purpose is to generate profits and make capital out of provision of education delivery. Some such institutions are Lovely Professional University, Amity University, SRM University, G D Goenka University, Sharda University, etc., to mention a few.
If the choices made by students are any indicator of popularity of HE, one may find that those who do not make a cut in the public and public aided institutions of HE end up going to these private, unaided institutions. The fees charged in these private institutions widely vary, making selection to these institutions largely a matter of social class. The recent expansion, namely, post-2000 in particular, is thus largely driven by this kind of a social context.
Exclusionary Nature of Private Sector Led Massification
In any discussion of HE expansion in the neoliberal times, we often tend to ignore a very important distinction between two different phases in terms of the role the state played in stimulating privatisation agenda - the phase of privatisation of the period from 1995 to 2007-08 and the phase after 2008-09. While the period between 1995 and 2007-08 marked the process of withdrawal of the state from provisioning of public HE, the period after 2008-09 marked a clear engagement of the state in pushing privatisation hard by even pumping the public money in the name of vouchers and fee reimbursement schemes. While the pre-2008 period led to a substantial reduction in the public funding for HE, for example, from 92 per cent in 1990-91 to 61per cent in 2006 (Tilak 2009), the post 2008 scenario allowed pumping of millions of rupees into private colleges by way of a large number of concessions. The transfer of funds from the state exchequer to the private institutions of HE took the form of PPs, vouchers, tuition and maintenance fee reimbursements. Most of this money does not come from the education budgets, rather it is rooted through the social welfare budgets. The usual social welfare activities are now either entirely halted or have received minimal state support as a result of transferring of funds to the private colleges, which then helped stimulate and sustain the private sector in HE. This has happened on a larger scale in states like Tamil Nadu, Andhra Pradesh, Karnataka, Maharashtra, and in some states in the North as well. While this step may have increased the access of the socially and economically disadvantaged into professional and technical HE, it had actually served a limited purpose.
On the other hand, another development that is worth noting is the ‘financial privatisation’ of public universities9 (Tilak 2008). As a result of cut in the funds to the public institutions, they are forced to adopt models of part-privatisation by introducing self-financing courses. These courses, like the unaided private HE, are not open for the socially deprived sections of the population and are mainly guided by the principle of affordability.
9 Tilak (2008) provides an interesting analysis of the growth of varieties of privatisation.

© NIEPA Transition from Elite to Mass System of Higher Education in India
148
That means, the very process of privatisation subverts the inclusive nature of HE expansion and therefore, it excludes those who are disadvantaged in terms of caste, religion, gender and class. Moreover, the language of the neo-liberal regime excludes or is meant to exclude historically deprived groups.
As Chattopadhyay (2010) remarks, “we have to traverse miles before we can make HE truly inclusive in terms of socio-economic strata, gender and region” (p. 15). Further, he observes that though the expansion of private sector in HE has been able to cater to the demand for skilled workforce in the face of stagnation in the public HE, it came with a heavy price (Chattopadhyay 2010). He contends, “not only has the access suffered because of the rise in the cost of education and dilution of quota principle, broadly speaking, excellence has not been achieved” (Chattopadhyay 2010: p.15). Chattopadhyay indeed makes a very profound statement that “if pricing of HE is subject to the market, while access is determined by the ability to pay principle, not only are we excluding people from the lower income strata of the society, we are merely expediting the process of further fragmentation of the society” (2010: p.17).
The language of the neoliberal policy framework has been quite intimidating for the marginalised. The calls for moving from access to excellence, meritocracy, industry-driven courses, stress on soft skills and English, creation of world class universities, enhancing competition through invitation to foreign universities to set up campuses, and making India a hub for educational excellence, make the intentions and articulations of exclusion very clear. In a way, the XI Plan slogan represents the essence of what neo-liberal saga envisages, “Excellence, Expansion and Inclusion”. It is not clear what it meant by ‘inclusion’. Expansion is defined as “providing access to all eligible candidates”, which is vague and devoid of Indian social reality. The vagueness and confusion continues even in the XII Plan which declares that its goal is to realise “Inclusive and Qualitative Expansion of HE”. The vagueness also leads to various questions of equality and fairness in access to HE.
Persisting Social Inequalities
It is an undeniable fact that social and economic exploitation continues to pervade the life condition of the historically deprived and disadvantaged like Scheduled Castes (SCs), Scheduled Tribes (STs) and Other Backward Classes (OBCs). There is evidence to show that the neo-liberal reforms have adversely affected the SCs and STs more than the OBCs and other non-labelled castes. Among the SCs, there is evidence of growing incidence of poverty, rising levels of mortality and illness, rising levels of rural unemployment and wage squeeze. There are also declining levels of consumption shares, real wages, and consumer monthly per capita expenditure among SCs (Thorat and Deshpande 2001; Thorat 2002). We have studies that have shown clearly the practice of untouchability even today in the villages (Mukul 1999) and in the modern formal organisations such as schools (Nambissan 2012); HE institutions (Rao 2013), corporate organisations (Jodhka and Newman 2007) and urban contexts (Velaskar and Wankhede 1996).
The tribes also continue to experience large scale exploitation due to capitalist developmental onslaught by the state and non-state actors in the tribal areas. Displacement due to mega projects such as big dams, power plants, mining, etc., complicates their struggle for life. Prasad et. al. (2012) documented the ‘tragedy of the commons’ in the tribal habitats of Araku valley near Visakhapatnam. Stark reality today is that 55.16 per cent of those

© NIEPA S. Srinivasa Rao
149
displaced persons in the country are tribal people. Since 1990, 8.5 million tribals are displaced (TOI, November 26, 2004), due to which tribes are alienated and dispossessed of land and natural resources in their own home land.
The relative educational disadvantage in terms of diverse social groups is clearly evident. For instance, one can find that the differences in literacy rates between the SCs/STs and non-SC/STs are graded depending on their relative position in the social structure (Lall and Rao 2011). One striking fact is that the literacy levels of the labelled categories remain far behind the literacy levels of the non-labelled categories indicating uneven access and opportunities to education. The single most important factor for the uneven distribution of educational achievements is the absence of schools; even if schools are available, acute shortage of teachers and the basic amenities pervade areas where the SCs and STs live.
If we look at the expansion of the Indian HE system in real terms, we find a very interesting scenario. From around 25 universities, 700 colleges, and around 0.1 million students in 1950 (Thorat 2008: p.2), HE system has expanded to 712 universities, 36,671 colleges (plus another 11,445 institutions which are designated as ‘Stand Alone Institutions’ offering various diploma programmes), and 29.63 million students in 201410.
In terms of the colleges, almost 90-95 per cent of them are run by the private managements and only 5-10 per cent are in the public sector11. Another important aspect of HEHE expansion is that the bulk of the institutions and enrolments are in the undergraduate education. In 2014, the proportion of undergraduate enrolments comprised 79.5 per cent of the total enrolments in HE12.
The ceiling of Gross Enrolment Ratio (GER) of 15 to cross into the stage of massification of HE is achieved only in 2009-10. No matter what the source is, the GER of India is far below the GER of many countries including the USA (94.3), the UK (61.9), Russia (76.6), and China (26.7) (MHRD 2014). This is what makes the HE expansion in India skewed and much to be desired. If we look at the data in terms of caste and tribe (Table 1), it is even more appalling and makes us believe that the transition is clearly not egalitarian and it continues in some parts as elitist. Rao (2002) establishes that many institutions continue to be elitist too, leaving the contention of the state, that it had achieved a significant milestone as far as access and reach of HE is concerned, unsubstantiated.
10 Among the 712 universities, 42 are central universities, 310 are state/provincial level universities,
127 are deemed to be universities, five state level institutions of Importance, 68 central institutions of national importance and 143 are private universities. In addition, there is one national level Open University and about 13 state level open universities, along with many departments of distance learning within the Public Universities, which are run on self-financing mode, nevertheless add to the overall strength of expansion of HE enrolments.
11 The MHRD does not offer clear information of distribution of private and public institutions in the college education segment.
12 Calculated from the data given in MHRD (2014: p.4)

© NIEPA Transition from Elite to Mass System of Higher Education in India
150
TABLE 1
GER in Terms of Caste/Tribe
Caste/tribe 1999 – 2000 2009-10 2012-13
(provisional)
SC 5.09 11.1 15.1
ST 6.43 9.2 11.0
OBC 6.99 NA NA
General 16.74 15 21.1
Note: The data for the year 1999-2000 pertains to the general (non- labelled populations and the data for the years 2009-10 and 2012-13 pertains to the overall population and not segregated.
Sources: 1. Srivastava and Sinha (2008) 2. MHRD (2014)
One of the serious problems that can be cited as a cause of such low GER is that the
access to HE in India is socially selective and that it is not accessible to all equally. While the GER of SCs has just touched the glass ceiling of 15, acquiring some mass characteristics, there is persistence of differentials between SCs and STs; SC/STs and non-SC/STs. It also reflects the slow pace of improvement of GER among SCs and STs, in comparison to the non-SC/STs. Whatever meager gains SCs and STs have accrued in access to HE is undoubtedly due to the affirmative policy of seat reservations, without which the numbers would have been far more negligible (Rao 2002).
Further, Sinha and Srivastava (2008) point out that the GER varies across religions and also in terms of caste/tribe within the religious groups. Interestingly, while in some cases, particularly in the case of Christians, religion seems to have had a positive effect on the HE participation, and in others, such as Hindus, Muslims and Sikhs, it seems to have had a negative impact. Thus, it cannot be said that the educational deprivation cuts across all religions, but certainly one can assume that the castes within each religious group may have unequal access to HE.
Another feature of the unequal massification process is that it favours urban well to do sections of the populations, rather than the rural people. Furthermore, Srivastava and Sinha (2008) establish that the poorest of the poor among all the social categories, namely, labelled (STs, SCs, OBCs) and the non-labelled categories, are deprived of HE, more so among the labelled categories. This is significant as much of the expansion in HE in the post-2000 is in the private sector, so in terms of social class, the massification tends to be preferring middle and upper classes of the society rather than the lower classes.
Two other important axes along which inequalities in massification are glaring are region and gender. Sinha (2008) brings out a clear cut spatial pattern of disparity across the districts. He reveals that about 374 districts out of the total 593 districts in India have a GER of less than the national average in 2001. Similarly, Raju (2008) reveals the space-gender divide. According to her, “rural women, almost without exception, have the lowest access to HE. Amongst the rural women, it is essentially those from the lower rungs of socio-religious communities who have the lowest access in particular” (Raju 2008: p.101).
In addition, Shariff and Sharma (2013) contend that over 72 per cent of all socio-religious groups except SCs/STs, have attended HE in a private (either purely private or

© NIEPA S. Srinivasa Rao
151
private aided) institutions in South India. Interestingly, SC/STs in South India are better off than those from other regions of India in terms of their participation in private HE. In professional education, the enrolments of SCs and STs are skewed largely as there are no affirmative policies applied in the private sector HE (Rao 2006).
If we look at the actual enrolments, we find that SCs and STs are found mainly in the liberal public HE institutions, whereas bulk of the non-SC/STs are enrolled in technical and professional, in both public and private institutions. The SC/ST proportion in Science and Commerce streams is far below their representation in the liberal arts. In the professional courses such as engineering, medicine and education, the proportion of SCs and STs, though improving over time, continues to be abysmally low in comparison to the other groups. Thus, SCs and STs largely enter into areas which are not labour market friendly and therefore, transition into a mass system does not translate into a benefit for them in any significant ways. Further, if we look at the representation of SC/ST women in HE, the proportions are even more negligible (Rao 2007). Hence, it may be safe to argue that massification has not percolated across social groups, leaving HE an unequal level playing field in the neoliberal times.
Debates on Equality of Access in the Period of Transition
The foregoing discussion shows that there is no validity in the recent claims of need to look ‘beyond inclusion’ by some scholars (Deshpande 2013), who seek to shift the boundaries of debate from mere access to more substantive concerns of equity and fairness post-access. It may be argued that the debates surrounding access would continue to be relevant even while there are cries of lack of fairness in the post-access scenario. While stressing on this argument, it is, however, important to note that while substantive issues indeed are a concern for a sociologist, but at the same time, the concerns of access as well as the nature of access must continue to be the focus of discourses on HE expansion13.
First, there have been demands for defining equality in terms of individual orientation rather than group orientation in neoliberal times from those who oppose reservations on the basis of caste. This contention manifests in two ways. One, by asking for individual based criterion of equality, the group based affirmative policies of reservation are rubbished. This means that the benefits of reservation in access to HE accrued by SCs and STs will then be in question. Such a demand for abolition of group based egalitarian principle is not tenable given the nature of social hierarchies that continue to persist and manifest even today14.
13 Access certainly does not and shall not limit to an individual’s entry into HE institution alone. It shall
carry forward a condition of fairness for a disadvantaged student to remain in and do well within the HEIs. Such a concern can be the focus of another paper, therefore, we do not enter into such discourses here.
14 Several instances of persisting discrimination in both rural and urban contexts are reported everyday in the popular media as well as the academic research.

© NIEPA Transition from Elite to Mass System of Higher Education in India
152
Secondly, there is a debate in terms of exclusion of individuals within a labelled group, namely, the creamy layer, in terms of their class position and advantage accrued already. The creamy layers within a group are said to have advanced and have achieved a higher level of mobility compared to others in the group. Thus, the idea of creamy layer, in other words, indicates elimination of reproduction within beneficiary class the same kind of clustering the reservation policy is meant to remedy (Rao 2002; Lall and Rao 2011). The notion of ‘creamy layer’, therefore, does not identify caste as a whole as the unit for judging the social and educational advancement or backwardness. Instead, it takes into account the individual attributes of occupation and income, which are nothing but markers of an individual’s social class status. In this sense, caste and class intersections are duly recognised in identifying the potential beneficiary group and non-beneficiary group. The creamy layer principle is applicable only to the OBC category, but not to the SC and ST categories, the reason being that the nature and extent of disadvantages and stigma among SCs, STs and OBCs differ.
Third, another serious debate that is taking place today in India with regard to HE is with reference to the access of groups within the groups or, in other words, intra-caste category inequalities and exclusions. So far, inter-group inequalities such as SC, ST, OBC and the others are given more prominence leaving out the intra-group inequalities. But, in the context of globalisation and, with the shrinking of spaces for access into the state sector of HE, the competition has been growing within the labelled categories. As a result, new demands for inclusion within the labelled categories are emerging. Inequalities are allowed to persist between sub-groups within each of the categories giving rise to demands for sub-classification within the labelled groups. If one looks at the beneficiary groups within these categories, one finds that some sub-castes or tribes are more advanced than the other castes in the same category. For instance, there have been instances where such contestation has come to the fore - Malas and Madigas (SCs) of Andhra Pradesh; Mahars and Mangs (SCs) of Maharashtra; Meenas and Bhils (STs) of Rajasthan; Yadavs and other backward castes (OBCs) of Bihar and Uttar Pradesh. Within the labelled categories, certain castes have achieved vertical mobility more than others in the same category and were able to achieve higher occupational, economic and educational status, which led to the creation of a middle class as well as the political and entrepreneurial elite among labelled communities. In a way the neo-elite among these groups could access HE, and hence white collar employment, better than their counterparts within the same labelled category.
Fourth, there are newer demands for inclusion into more coveted categories of SC/ST from the OBC category, as in the case of Gujjars of Rajasthan, and for even inclusion into the OBC category from those who are now not labelled (Kapus in Andhra Pradesh, Jats in some parts of North India, Marathas in Maharashtra, Patidars in Gujarat). Included within the latter category are Muslims who want affirmative quota policies for improving their educational arenas. However, this has been a serious contention as the Constitution does not permit labelling of non-Hindu groups for the benefits of reservations. The pre-eminent argument is that they are not represented enough in the HE edifice and thus in higher government services and professional occupations, thus they justify their agitations for reservations in higher educational institutions.
All these debates make understanding of massification a highly complex endeavour. On the one hand, the old beneficiary groups demand correction of discrepancies in the way the inclusive policies are implemented and, on the other, new groups demand for a provision of inclusion. The contestation is interestingly restricted to the public HE sector, expansion of

© NIEPA S. Srinivasa Rao
153
which is not commensurate with the demand for HE. The bulk of expansion of HE, as discussed earlier, is taking place in the private sector which is not covered under the inclusive policy regime. In a way, while the terrain of upper caste and class dominance is diversified into the private sector, the contestations among the old and new disadvantaged groups have become intense within the shrunken public HE. It means, while the interests of the upper caste and class groups are intact in the context of private sector led massification, the interests of the lower caste and class groups continue to be under severe stress.
Conclusion: What does Massification Mean?
The transition from elite to the mass HE system within a span of just one decade and through the privatisation route brings with it what Trow (1973) called a ‘crisis’. This crisis is mainly due to the fact that widened access to HE is taken advantage of by the elite and the middle class populations as they have done always. Even if one looks at the disadvantaged segments, it is the middle classes from among them who have taken advantage of the expansion of HE, leaving a mass of aspirants to occupy HE spaces in the lurch. The middle classes could take advantage of expansion as they had better preparation in terms of schooling and were endowed with economic affordability that sustained them to enter into the private institutions of HE even when they could not make a cut, to get into the highly elite, competitive and selective public HE institutions.
The crisis is going to be even more complex when a mass of school leavers continue to make their way into HE as a result of some of the initiatives such as the newly enacted Right to Education (RTE) and the Rashtriya Madhyamik Shiksha Abhiyan (RMSA). As the country had already achieved significant levels of retention in school education across categories, it will pass on the stress to HE. Under such circumstances, the pressure will be on the state to provide more avenues for access to HE as these ‘mostly’ first generation working class and lower caste student aspirants do not have adequate economic as well as cultural capital to enter into private HE and the spaces in public institutions are far more meagre. Even if they enter into private HE institutions, they would only be able to enter into lower rung private institutions, which are already witnessing a steady decline in terms of quality of education provided. This would even reflect the nature and quality of employment that the lower classes and lower castes would eventually aspire for and are able to succeed in. In order to make HE expansion a win-win situation, it is, therefore, important to monitor and practise equality in the private sector as well. It is of course not to say that the public sector does not need reform, it does require attention manifold.
Secondly, the access must continue to have some consideration of affirmative action based on group inequalities. The study by Rajeshwari Deshpande and Suhas Palshikar (2008) clearly indicates that caste is the most important factor for upward mobility in the occupational hierarchy. They argue that the middle peasant and dalit castes are indeed making progress in real terms and this is due to resources, opportunities and power structure, affirmative action and urban location combined with the background of social awakening. However, they point out that their study will disappoint those who want to see the conclusions in a decisive manner - that the caste is disappearing and becoming irrelevant in our modern capitalist universe. They categorically suggest that their study leads to the conclusion that, in the case of upward mobility, caste still matters. Therefore, the expansion of HE must have certain focus on the castes and tribes that are historically and educationally

© NIEPA Transition from Elite to Mass System of Higher Education in India
154
deprived. However, there can be debates as to how to eliminate reproduction of beneficiaries for more than one generation within the same category in order to bring newer and first generation beneficiaries into the ambit of equal access to HE. This is an essential pre-condition for social change among the socially, economically and educationally marginalised.
Thirdly, there has been a serious concern of over-production of under-prepared students into the labour or credential market. To support this argument, we have reports of employers claiming that the graduates of Indian institutions of HE are not worthy of recruitment for the industry. News reports also suggest that only a few of the professionals with requisite degrees have competence to work for multinational corporations. Thus, what we have as a result is a situation of redundancy under conditions of what we may call as ‘indiscriminate’ privatisation, products of which are substandard graduates unable to be employed at the level he/ she is expected to be employed. Or, the graduate from an engineering college who will have to attend some courses outside the regular degree programme in order to get employed. Way back, Suma Chitins (1993) and Philip Altbach (1993) have raised this concern, which is still relevant today. These issues are relevant not just in India, but elsewhere as well (Wang 2003).
This lack of employability, in turn, had given rise to the supplementary, unorganised and non-formal training centres which become parallel/shadow providers of HE. Without these additional trainings, the educated labour market cannot hire a large number of graduates produced on mass scale. Or these graduates would have to get into employment much lower than the jobs they could actually be aspiring for. Under these circumstances, as Saumen Chattopadhyay suggests, “...it is an imperative that …market fails in HE” (2009: p.60).
Michael Apple (2001) presented a similar kind of situation of accentuating inequalities in the case of the USA. He says that a large push towards neoliberalism created “more cashier jobs……than jobs for computer scientists, system analysts, physical therapists, operational analysts, and radiological technicians combined” (2001: p.43). In India too, we have already seen that the jobs currently available in the service industry are mostly as retail salespersons, cashiers, official clerks, truck drivers and transportation personnel, waiters and waitresses, call centre employees, social service personnel, etc. And none of these jobs indeed require the HE credentials that are available in excess in the education market. Apple argues, “Many of these are low paid, non-unionised, temporary and part time, with low or no benefits. And many are dramatically linked to, and often exacerbate the existing race, class and gender divisions of labour” (2001: p. 43-44). Apple is right when he says that this is not the picture we romantically built around the neoliberal project of privatisation, that we thought will benefit the class we come from – the middle classes. Therefore, the benefits of HE expansion and transition not only percolate to the vulnerable and disadvantaged sections of population, but also to the middle classes themselves. For the poor, the opportunities for social mobility and overall well being will either be limited or skewed, making the process of HE expansion unequal and unfair. For the middle classes, it is a sort of shattering of a dream. As McCowan (2007) observes in the case of Brazil, ‘expansion without equity’ will not be fair and just. Achieving equality and equity must be the central objective for any society to progress from elite to mass and mass to universal systems of HE.

© NIEPA S. Srinivasa Rao
155
References
Altbach, Philip. (1993). “The Dilemma of Change in Indian Higher Education”, Higher Education, 26, pp.3-20.
Altbach, Philip G. (2009). “The Giants Awake: Higher Education Systems in China and India,” Economic and Political Weekly, vol. XLIV, no.23, pp. 39-51.
Apple, Michael. (2001). Educating the Right Way: Markets, Standards, God and Inequality, Routledge: New York.
Chattopadhyay, Saumen. (2009). “The Market in Higher Education: Equity and Quality,” Economic and Political Weekly, vol. XLIV, no. 29, pp. 53-61.
Chattopadhyay, Saumen. (2010). “An Elitist and Flawed Approach towards Higher Education,” Economic and Political Weekly, vol. XLV, no.18, pp. 15-17.
Chitnis, Suma. (1993). “Gearing a Colonial System of Education to take Independent India towards Development”, Higher Education, 26, pp. 21-41.
Deshpande, Rajeshwari and Suhas. Palshikar (2008). “Occupational Mobility: How Much Does Caste Matter?” Economic and Political Weekly, Vol. 43, No. 34, pp. 61-70.
Deshpande, Satish. (2013). “Introduction: Beyond Inclusion”, in Deshpande, Satish and Usha Zacharias (Eds.). Beyond Inclusion: The Practice of Equal Access in Indian Higher Education, New Delhi: Routledge, pp. 1-12.
Jodhka, Surinder S. and Katherine Newman. (2007). “In the Name of Globalisation: Meritocracy, Productivity and the Hidden Language of Caste,” Economic and Political Weekly, vol. XXXV, pp. 4125–4124.
Kapur, Devesh. and Mehta, Pratap Bhanu (Eds.). (2017). Navigating the Labyrinth: Perspectives on India's Higher Education, New Delhi: Orient Blackswan.
Kaul, Rekha. (1993). Caste, Class and Education: Politics of the Capitation Fee Phenomenon in Karnataka, New Delhi: Sage Publications.
Lall, Marie. and S. Srinivasa Rao. (2011). Revisiting the Equality Debate in India and the UK: Caste, Race and Class Intersections in Education, in Marie Lall and Geetha B. Nambissan (Eds.). Education and Social Justice in the Era of Globalisation: Perspectives from India and the UK, London, New Delhi and New York: Routledge, pp. 25-55.
McCowan, Tristan. (2007). “Expansion without Equity: An Analysis of Current Policy on Access to Higher Education,” Higher Education, vol. 53, no.5, pp. 579-598.
Ministry of Human Resources Development (MHRD). (2014). Educational Statistics at a Glance, New Delhi: Bureau of Planning, Monitoring and Statistics, Government of India.
Mukul. (1999). “The Untouchable Present: Everyday Life of Musahars in North Bihar,” Economic and Political Weekly, vol. XXXIV, no. 49, pp. 3465-3470.
Nambissan, Geetha B. (2012). “Exclusion and Discrimination in Schools: Experiences of Dalit Children,” in Sukhadeo Thorat and Katherine S. Neuman (Eds). Blocked by Caste: Economic Discrimination in Modern India, New Delhi: OUP India, pp. 253 -286.
Prasad, Purendra. et.al. (2012). “Tragedy of the Commons (II): Mining in the Tribal Habitats of Araku Valley,” Economic and Political Weekly, vol. XLVII, no. 42, pp. 14-17.
Raju, Saraswati. (2008). Gender Differentials in Access to Higher Education, in UGC. Higher Education in India: Issues related to Expansion, Inclusiveness, Quality and Finance, New Delhi: UGC, pp. 79-102.
Rao, Srinivasa S. (2002). “Equality in Higher Education: The Impact of Affirmative Action Policies in India,” in Edgar Beckham (ed.). Global Collaborations: The Role of Higher Education in Diverse Democracies, Washington D C: Association of American Colleges and Universities, pp. 41-62.
Rao, Srinivasa S. (2006). “Engineering and Technology Education in India: Uneven Spread, Quality and Social Coverage,” Journal of Educational Planning and Administration, Vol.20, no. 2, pp.205-225

© NIEPA Transition from Elite to Mass System of Higher Education in India
156
Rao Srinivasa S. (2007). “Neglected Terrain in the Quest for Equality: Women in Elite Engineering and Technology Education,” in Tilak, J.B.G. (Ed.). Women's Education and Development, New Delhi: Gyan Publishing House, pp. 187-212.
Rao, Srinivasa S. (2013). “Structural Exclusion in Everyday Institutional Life: Labelling of Stigmatised Groups in an IIT,” in Geetha B. Nambissan and S. Srinivasa Rao (Eds.). Sociology of Education in India: Changing Contours and Emerging Concerns, New Delhi: OUP, pp. 199-223.
Shariff, Abusaleh and Sharma, Amit. (2013). Inter-generational and Regional Differentials in Higher level Education in India, USIPI Occasional Paper No.4, Washington D C: US-India Policy Institute.
Sinha, Sachidanand. (2008). “Identification of Educationally Backward Districts”, in UGC. Higher Education in India: Issues related to Expansion, Inclusiveness, Quality and Finance, New Delhi: UGC, pp.56-78
Sinha, Sachidanand. and Ravi S. Srivastava. (2008). “Inclusiveness and Access of Social Groups to Higher Education,” in UGC. Higher Education in India: Issues related to Expansion, Inclusiveness, Quality and Finance, New Delhi: UGC, pp. 111-138.
Srivastava, Ravi S. and Sachidanand Sinha. (2008). “Inter Social Group Disparities in Access to Higher Education,” in UGC. Higher Education in India: Issues related to Expansion, Inclusiveness, Quality and Finance, New Delhi: UGC, pp. 103-110.
Stella, Anthony. (2002). Institutional Accreditation in India, International Higher Education, Spring Issue, Boston College.
Thorat, Sukhadeo. (2002). “Oppression and Denial: Dalit Discrimination in 1990s,” Economic and Political Weekly, vol.37, no.6, pp. 572-78.
Thorat, Sukhadeo. 2008. “Emerging Issues in Higher Education: Approach and Strategy of the XI Plan,” in UGC. Higher Education in India: Issues related to Expansion, Inclusiveness, Quality and Finance, New Delhi: UGC.
Thorat, Sukhadeo and R. S. Deshpande. (2001). “Caste System and Economic Inequality: Economic theory and Evidence,” in Ghanshyam Shah (Ed.). Dalit Identity and Politics, New Delhi: Sage Publications.
Tilak, J.B.G.(2003). Privatisation of Higher Education, in Tilak, J. B. G. (ed.). Education, Society and Development: National and International Perspectives, New Delhi: NUEPA, pp. 557-571.
Tilak, J.B.G. (2008). Transition from Higher Education as a Public Good to Higher Education as a Private Good: The Saga of Indian Experience, Journal of Asian Public Policy, Vol. 1, no.2, pp. 220-234.
Tilak, J.B.G. (2009). “Higher Education: A Public Good or a Commodity for Trade? Commitment to Higher Education or Commitment of Higher Education to Trade,” Prospects, UNESCO.
Tilak, J.B.G. (2014). “Private Higher Education in India,” Economic and Political Weekly, vol. XLIX, no. 40, pp. 32-38.
Trow, Marin. (1970). “Reflections on the Transition from Mass to Universal Higher Education,” Daedalus, vol. 99, no. 1, pp. 1-42.
Trow, Martin. (1972). The Expansion and Transformation of Higher Education, International Review of Education, vol. 18, no.1, pp. 61-84.
Trow, Martin. (1973). Problems in the Transition from Elite to Mass Higher Education, Berkeley, California: Carnegie Commission on Higher Education.
Varghese, N. V. (2015). Challenges of Massification of Higher Education in India, CPRHE Research Paper 1, New Delhi: NUEPA.
Velaskar, Padma. and G.G Wankhede. (1996). “From Old Stigma to New…Exploring the Changing Identity of Urban Educated Dalits,” Indian Journal of Social Work, 57(1), pp. 115-134.
Wang, Ru-Jer. (2003). “From Elitism to Mass Higher Education in Taiwan: The Problems Faced,” Higher Education, 46, pp. 261-287.

© NIEPAJournal of Educational Planning and Administration Volume XXXI, No. 2, April 2017, pp. 157-162
© National University of Educational Planning and Administration, 2017
RESEARCH ABSTRACT
The Impact of Metacognitive Abilities of Teachers and their Ninth Class Students on the Achievement in Biological Sciences
Md. Afroz Alam *
Title The Impact of Metacognitive Abilities of Teachers and their Ninth Class Students on the Achievement in Biological Sciences
Research Scholar Md. Afroz Alam
Supervisor Prof. H. Khatija Begum
Department/University Department of Education & Training, Maulana Azad National Urdu University (MANUU), Gachibowli, Hyderabad – 500032, Telangana
Date of Submission 13th October, 2014
Degree Awarded Ph.D. in Education
Date of Award of Degree 1st June 2016
Availability of Thesis Library – Department of Education & Training, MANUU, Central Library, MANUU, Hyderabad.
Number of Pages 241
* Department of Education and Training, Maulana Azad National Urdu University, Gachibowli,
Hyderabad – 500032. Telangana, India. E-mail: [email protected]; [email protected]

© NIEPA The Impact of Metacognitive Abilities of Teachers and their Ninth Class Students
158
Abstract
The present study examines the metacognitive abilities of secondary school students and teachers. A total of 840 students and 120 Biology Science teachers were chosen as a sample for the study. An inventory of metacognition has been adapted for local use. Metacognitive Inventory for Biological Science Teachers, Metacognitive Inventory for Biological Science Students and Achievement Test in Biology (Self constructed) used for the collection of data. The impact of student metacognition and other factors such as gender, age, locality, social factors, and internet use, watching TV, library habits, parent education, tuition availability, and parent guidance were examined. Some teacher related factors such as academic and professional qualifications, teaching experience and in-service training were also taken into account. Data analysis involved the use of mean, standard deviation, t-test, multiple analysis of variance, chi-square, Pearson product-moment and Kendall’s Tau-b correlation coefficient. The results revealed that there was no significant difference between Metacognitive Ability Inventory (MAI) score of male and female, rural and urban Biological Science teachers. Students of more highly metacognitively aware Biological Science teachers have a higher mean score both on the achievement test and inventory. Similarly, there was no significant difference between MAI score of male and female students. The scores in the MAI test of urban students are very much higher than the scores of rural students. Internet use has a significant impact on the MAI and test score of students. The students who always consulted library books have higher mean score on MAI and achievement test.
Introduction
Qualitative education plays an important role in science and biological advancement. When we talk about qualitative education, we must think of competent teachers. It is now a widely accepted notion that teaching is an art with a well-defined scientific process. By using various skills and activities, a teacher can be made effective. There are some common skills that all efficient teachers need, but some specific skills and abilities are required by Science and Biology teachers for successful functioning. There is scope for research in teaching in order to discover the specific skills and abilities which the teacher should develop.
The National Curriculum Framework (NCF) developed by the National Council of Educational Research and Training (NCERT) in 2005, recommends a paradigm shift from rote memory to learning by understanding. It suggests that schools should facilitate the process of knowledge construction and help them to become independent thinkers capable of solving their everyday problems. In the new curriculum, teachers are seen as the main agents of change. The existing teaching practice is of “information loaded” education, which puts a lot of stress on students. In accordance with the postulates put forth by NCF 2005, school should avoid filling students’ minds with mere facts; rather they should facilitate the process of knowledge of metacognition.
The review of related literature revealed that Metacognitive Skills can be developed in the classroom. A good number of reviews of studies such as Schofield, Linda (2012),
© NIEPA Md. Afroz Alam
159
Devaki, V. and Pushpam, M. (2011), Santhi, S. et al (2011), Efklides, A. (2011), Iiskala, T. et al. (2011), Akyol, G. (2010), Papantoniou, G. et al. (2010), Wilson, N. S. and Bai, H. (2010), Joseph, N. (2009), Haider, A. (2008), Schraw, G. et al (2006) revealed that Metacognitive ability is appropriate for the improvement in the academic achievement, especially achievement in Science. Research literature on metacognition indicated that much work has been done abroad. However, research on students’ and teachers’ metacognition has been a neglected area in our country. Due to its importance, this research study has been conducted to examine “The Impact of Metacognitive Abilities of Teachers and their Ninth Class Students on the Achievement in Biological Sciences”. Thus, the present study attempted to fill this gap.
The study is significant as it deals with questions like what do teachers consider when selecting teaching strategies for the learners? To what level do teachers know how to manage their instruction metacognitively? To what extent metacognitive teaching may or may not acquire? The study described the concept of metacognition and different metacognitive skills and strategies in detail. The study examined teachers thinking about teaching processes and products so that they can use their metacognition to become more effective. The study also examined different empirical studies related to metacognition and its impact on teaching- learning process. Thus it will help the teachers and students in applying metacognitive skills to the teaching and learning process.
Research Questions
An analysis of metacognitive theories revealed that metacognition is affected by personal, social and biological influences. The present study developed around the following broad research questions:
Do teachers with high MAI make any difference in the academic performance of students?
What is the effect of pre-service training and teaching experience on metacognitive abilities of teachers?
Are there any gender differences in metacognitive abilities and academic achievement?
Are there any locality differences in metacognitive ability? Is parents’ education and guidance making any contribution in the metacognitive
ability and academic achievement of students? Is there any effect of internet use and library habits on metacognitive ability and
academic achievement of students?
Population and Sampling Methodology
Looking at the nature of the study and variables, descriptive survey method was adopted in this study. It is a correlational study. As per the objective of the study, a report of Educational Statistics: 2012-13 was obtained from the official website of Commissioner and Director of School Education, Andhra Pradesh, Hyderabad. Out of all the schools, only 30 secondary schools from urban and rural areas of Rangareddy district (15 schools from urban and 15 from rural area) were selected through stratified random sampling method for the purpose of enlisting the population of secondary school teachers and students. For the
© NIEPA The Impact of Metacognitive Abilities of Teachers and their Ninth Class Students
160
selection of sample, a multistage sampling technique was used. Thus, a total of 840 students and 120 Biological Science teachers were chosen as a sample for the study, this being highly representative of the population.
Tools Used
After an extensive literature review, the researcher adapted Schraw and Dennison (1994) Metacognitive Inventory. based on Schraw and Dennison inventory, the researcher constructed separate inventory for teachers and students. Also, the researcher constructed an Achievement Test in Biology for Ninth Class students.
Metacognitive Inventory for Biological Science Teachers Metacognitive Inventory for Biological Science Students Achievement Test in Biology
Procedure for Data Collection
For the collection of data, formal approval was obtained from the Commissioner and Director of School Education, the State Project Director, Rajiv Vidya Mission (SSA), Andhra Pradesh, Hyderabad and School Principals, explaining the purpose and requirements of the study through a letter. Then, in a meeting with school Science teachers, the objectives of the study and application procedure were discussed. The researcher personally administered the inventories in all schools. Before giving inventories, a brief introduction about the research was provided to the teachers and students. The teachers and students were mentioned and persuaded to give honest and frank responses and were ensured that the data will only be used for research purposes.
Analysis and Interpretation
The scores obtained from the test were analysed statistically. Mean and standard deviation was done for assessing the metacognitive abilities of Biological Science teachers and students. T-test and multiple analysis of variance were used for testing the hypotheses of mean differences of male vs female and urban vs rural Biological Science teachers and students. Hypotheses were tested at 0.01 and 0.05 levels. SPSS was used for the analysis of data. Pearson product-moment and Kendall’s Tau-b correlation coefficient were applied for the measurement of correlation between the variables. Chi-squares were also used in the data analysis.
Major Findings of the Study
On the basis of hypotheses testing the results and analysis of result discussion, the study revealed the following major findings:
There was no significant difference between MAI score of male and female Biological Science teachers.
There was no significant difference between MAI score of urban and rural Biological Science teachers.

© NIEPA Md. Afroz Alam
161
Students of more highly metacognitively aware Biological Science teachers have a higher mean score both on the achievement test and inventory.
There was no significant difference between MAI score of male and female students. The scores in the MAI test of urban students are much higher than the scores of rural
students. Performance of highly metacognitively aware students was better on the test than low
metacognitively aware students. It was found that teachers with more than 15 years’ experience possessed higher scores
on the metacognitive inventory. Furthermore, in-service training made no difference in the MAI score of teachers.
It was revealed that teachers who always consulted library books and used the internet achieved higher mean score on the inventory. Similarly, the teachers having higher academic and professional qualification and computer training achieved higher score on the inventory.
It is revealed that children of highly educated mothers performed better on the MAI. Similarly, students of high metacognitive aware teachers performed slightly better on the test.
Internet use has a significant impact on the MAI and achievement test scores of students. It is reported that students who always consulted library books have higher mean score
on MAI and achievement test.
Educational Implications
On the basis of analysis and findings of the study, the following implications of the study results are suggested.
Implications to Secondary Education
The study has revealed that with respect to Ninth Class students, achievement in Biology taught through metacognitive strategies has become more effective. This result implies that teacher could make use of the metacognitive strategy of teaching Biology to students of secondary schools to promote achievement in Biology. This finding also implies that the metacognitive strategy of teaching needs to become an integral part of the pedagogy of Biological Sciences or the methodology of teaching Biology at secondary level.
Teachers should make an earnest effort to enhance the metacognitive ability of the students by providing ample opportunities to them to think divergently and to explore their unique potentials. For this, teachers can arrange Science fairs, conduct Science projects etc., so that the students’ achievement also increases.
Teachers should encourage students to take up investigatory projects so that they can create their own knowledge which will lead them to metaconitively aware individuals.
As per the suggestion by NCF 2005, Science teaching requires change throughout the entire system. By teaching with metacognitive strategies, students will be greatly influenced by the methods of teaching. By these methods students’ understanding is actually constructed through individual and social processes.

© NIEPA The Impact of Metacognitive Abilities of Teachers and their Ninth Class Students
162
Mother’s education has a positive impact on metacognition of children. This highlights the importance of girls’ education. What has happened is that the education of girls has been under-supported in the past in India. The results of this study suggested that the role of the mother is far more than simply bringing children into the world. There is a vast influence in very early childhood between the key care-giver and the child. Thus, educating girls is critical, for this brings a powerful future influence to future children of these girls, a role which males have great difficulty in performing. Therefore, encourage the education of girls, as it brings great benefit to future generations of young folks.
Similarly, parental guidance has a key role in the performance of students. The parents may give attention to this aspect for the betterment of their kids.
Implications to Teacher Education
The study revealed that there were some metacognitive areas in which the teachers and students need support and training. These areas may be focused in the training programmes of teachers. These included: Self-motivation, self-abilities about intellectual strengths and weaknesses, abilities about learners’ expectations, analysing usefulness of teaching strategies, help in thinking strategies, learning strategies, computer training, setting teaching and learning goals and summarising lessons.
The findings of the study also suggested that internet surfing, TV watching and reading library books have a good impact on metacognitive abilities. Therefore, the teachers and students may be encouraged to use these. For this purpose computers with internet connectivity may be provided to all schools. However, this involves huge financing, which is quite a difficult task for a country like India. At least it may implement in all teacher-education institutions.
Seminars and workshops should be organised for the teacher educators on different strategies in metacognition.
Detailed theory on metacognition should be included in the D.El.Ed, B.Ed. and M.Ed. programme and metacognitive strategy of instruction should be incorporated in the pedagogic analysis of education.
Refresher courses need to be organised by the government agencies to the in-service teachers on metacognitive strategy.
Lack of retention is the basic problem in a Science classroom. By using metacognitive strategy in the instruction of Biological Science, the teachers can improve the retention ability of the students.

© NIEPAJournal of Educational Planning and Administration Volume XXXI, No. 2, April 2017, pp. 163-173
© National University of Educational Planning and Administration, 2017
Book Reviews
SINGH, Avinash Kumar (ed.) (2016): Education and Empowerment in India: Policies and Practices, Routledge, London and New York: South Asian Edition, Rs.1,050
This volume is the outcome of a seminar held in December 2013 at NUEPA in memory of late Anil K Bordia, IAS, ex-Secretary of Education, Government of India, who had immensely contributed to the cause of education of the disadvantaged. It “explores the critical linkages between education and empowerment of women, marginalised groups and other disadvantaged groups in society.”
Apart from a well written introduction by the editor, the volume is divided into five parts. The first part is devoted to theoretical discussions on the relationship between education and empowerment. The second part has essays on the education of the disadvantaged groups like Scheduled Castes, Scheduled Tribes, minorities and girls. Various educational policies and programmes are outlined in the third part. Papers on school and higher education are in the fourth and fifth parts respectively.
Theoretical Debates
Empowerment theories include both processes and outcomes. Empowering process may include participation in decision-making and delivery of a policy with a specific disadvantaged group in mind. Empowering outcomes allow us to study the consequences of empowerment process. Evidence of social pluralism and active citizenship is required. The editor outlines a process-oriented definition of empowerment: “The idea of ‘empowerment’ implies the process of handing over power to the powerless or the unempowered ……. ‘Empowerment’ is the process by which the powerless gain greater control over the circumstances of their lives.” [p.2; emphasis mine] He hastens to add that a capabilities approach can be followed to assess the empowerment through education. However, only one paper in this volume follows this approach. While most of the authors have confined themselves to the processes, the scope of the papers is not limited to the processes. According to the editor, the volume presents an “evaluative accounts of policies and programmes implemented in recent decades and reviews them in terms of their implications for social empowerment.” [p.2]
Dipankar Gupta’s paper, “Education and Citizenship: Beyond the Rights-based Approach” was the keynote paper at the conference. Taking clues from T.H. Marshall’s understanding of citizenship that confers equality of status, he emphasises on universal access to education, rather than a right to education. The latter suffers from inefficiency, since it aims at a target population. Democracy confers an equality of status on everybody. Education is expected to provide equality of status on everybody by imparting skills and should not aim at achieving absolute equality. This debate is supplemented by Ravi Kumar (Ch-3) by questioning the framework of community-education linkages. While community

© NIEPABook Reviews
164
participation is expected to empower the masses by allowing their voices in decision-making, the purpose is defeated since the local community is defined by the existing socio-economic hierarchies. “The community’s relationship with schooling in India has been that of a differential inclusion. Certain classes, castes and gender have always had an upper hand in terms of participation and schooling.” [p.65]
Education of the Disadvantaged
Virginius Xaxa, in his paper, “State Policy, Education and Tribes” (Ch-5), argues that education has empowered the tribes to a limited extent, so far as it has allowed their entry into new and modern occupations. But effective empowerment has been hampered by the state policy to integrate/assimilate them in the mainstream society. There has been a process of rejection of aspects of tradition and customs, while education has allowed them to assert their identities. Xaxa’s arguments have been confirmed in the next chapter by Asoka Kumar Sen in his case study of the Ho Adivasis in Jharkhand district. Education has not been able to empower these tribes due to “deep-rooted discordance between oral and literate pedagogic traditions” [p.105] and the consequent lack of faith in the state policies on education. Zoya Hasan (Ch.-7) finds substantial deficit in Muslims’ access to higher education and the consequent deprivations in employment. She recommends affirmative action as “an important way of reducing disadvantages that stand in the way of inclusion of minority communities. In case of Muslims, this can be justified on grounds of persistent disparities and inequalities in educational levels.”[p.137] Ratna M. Sudarshan, in her paper titled, “Enabling Equality: Girls’ Education, Social Norms and Community Interventions” reviews the state policy in trying to achieve gender equality through the empowering objectives of education. She argues that these objectives have been attempted largely through a focus on “within-school processes”. However, she goes on to lament that “there is little evidence so far that the experience of formal schooling allows questioning of, and change in, unequal roles outside of school.” (p.141) She goes on to say that “community initiative that attempts to change everyday normative practices through processes of negotiation and community learning need to be equally valued and supported as an intrinsic part of education.” (ibid.)
Experiments with Innovative Policies
Manisha Priyam (Ch.-9) analyses an important experiment in the policy of externally aided school reform programmes in states, with support from the Union government, called Bihar Education Project, which the author calls as the Bordia model. “One of the flagship programmes for educational reform in an Indian state, rolled out with external assistance, it took head on the issue of educational underdevelopment in one of the poorest states in the country” (p.160). Apart from the roles of state and Union governments, UNICEF and World Bank provided policy inputs and NGOs and Village Education Committees ensured community participation at the policy delivery stage. The author concluded that though inequities in school participation were narrowed down, road blocks were caused by social inequities, mainly of gender and caste. Vimla Ramachandran (Ch.-10) wrote on three new institutions which helped in decentralisation of education: Shiksha Karmi, Lok Jumbish and

© NIEPABook Reviews
165
Mahila Samakhya. But, as the editor writes, “… though innovative in nature, these strategies were geared towards improving the efficiency of the delivery of supply of programme inputs and had little impact on the empowerment process ….”(p.10) A. Mathew (Ch.-12) analyses the contribution of adult education to social empowerment. He argues that social equity was built into the National Literacy Mission, which had a special focus on the socially disadvantaged like the SCs, STs and women.
School Education and Empowerment
Padma Velaskar (Ch.-13) analyses the impact of neo-liberal reforms in state education policy on the structure and functioning of school education. Her conclusion is very categorical, “… There is a selective and gradual dismantling of the state’s educational responsibilities.… There is little concern left in the state machinery for imparting a meaningful education of the poor ….” (p. 267) Velaskar laments that there is neglect and decline of education as a social institution. Gunjan Sharma’s case study (Ch.-14) of a slum school in Delhi is very revealing. She was blunt in saying that “the school was not performing its educational function but continued to operate in a legitimate fashion – as if this was the way in which a government school would be ‘normally’ expected to function.” (p.289) School has become a site for distribution of various populist schemes of the state, which may have contributed to increase in enrolment, but not to any pedagogic improvement. Shantha Sinha (Ch.-15) believes that processes of retention of children in school and arresting school dropouts as indispensable for improving the quality of education. “There is a need to take the support of civil society as equal partners to bridge the gap between the parents and the school and ensure that there is mutual respect of the school and the community.” (p.304) Responsibility of the school in meeting the needs and challenges of adolescents and preparing them to be confident youth is presented by Sharada Jain (Ch.-16).
Higher Education and Empowerment
Sudhansu Bhusan (Ch.-17) advocates the use of the justice framework based on a comprehensive outcome approach that aims at developing capabilities of students and teachers. He uses Amartya Sen’s capability approach to examine the injustices in policies in higher education. The assumption seems to be that enhancement of capabilities through higher education would lead to empowerment. He laments that the higher education in India is not able to provide such a trajectory. Kumar Suresh (Ch.-18) examines the role of affirmative action in promoting participation in higher education. In his opinion, though the affirmative action policy helps in overcoming the initial disadvantages of socio-cultural location, institutional practices need to ensure parity of participation while implementing this policy. The principle of equality of opportunity needs to be grounded in its actual operational context. Abraham George (Ch.-19) pleads for community colleges as an alternative system for social and economic empowerment by providing skill-based education system with greater employability and relevance. Ranabir Samaddar (Ch.-20) argues the neo-liberal educational policies have accentuated social inequalities rather than empowering the disadvantaged.

© NIEPABook Reviews
166
The editor of the volume, Avinash Kumar Singh, very nicely sums up the discussions: “The hierarchies of social and gender inequities in participation and quality of learning achievements continue to be a critical challenge in achieving social empowerment. Policy level challenges need a paradigm shift in terms of theoretical insights for prioritising issues and formulating appropriate strategies to ensure social equality and empowerment. Empowerment through education is more about pedagogy than participation in education.” [p.17]
An Evaluation
An implicit assumption of this volume is that education empowers individuals. But there seems to be no consensus among the authors on the meaning of empowerment. No specific indicator of empowerment is used to test a hypothesis. Perhaps it is not easy to agree on any meaning of empowerment and, therefore, it was deliberately left open-ended. While Dipankar Gupta linked education to the creation of right citizens, Sudhansu Bhusan expected education to secure justice by enhancing capabilities and several others emphasised on the reduction of socio-economic inequalities. No author thought of broadening the meaning of empowerment that allows one to take decisions about self and society. Nor any author explains how acquiring knowledge and skill would strengthen innate ability of an individual. Ultimate empowerment is achieved when an individual is allowed to think and take action as an autonomous self.
Almost all the authors of this volume are educators, who have direct experience in formulation and/or implementation of education policy in India. One is surprised that virtually no one among the authors gives a categorical ‘yes’ answer to education’s transformative potential in reality at the grassroot level. It is a pity that after our attempts to have ‘inclusive’ education during the past several decades, no one is even close to saying that we have created highly motivated citizens, giving up their narrow identities based on caste, religion and region. Blaming the ‘state’ or the ‘neo-liberal policy’ – as Ranabir Samaddar does – is very much like seeing the emperor’s new clothes. We praise it loudly in public, may even have a hand in designing it; but ask ourselves in private why we cannot see it.
Are we really serious about empowerment, through education or otherwise? If we were, why did we have to wait till there was a Right to Education? Even with this, are we not ambivalent enough regarding our goals? It is not simply a policy issue related to education. It is fundamental to our thinking of social hierarchies, economic deprivations and relationship among human beings. Transformation of human beings can happen in two different ways: externally and internally. Both are valuable. Education can take care of only the external part. But only the internal transformation can ensure empowerment. Perhaps further probe into the relationship between these two aspects – using ethnic approaches and case study methods – could clarify some of the ambivalent conclusions of this volume.
Ravenshaw University Cuttack – 753003, Odisha
Prakash Sarangi [email protected]

© NIEPABook Reviews
167
GANDHI, Malli (2017): Educating Ex-criminal Tribes – Issues and Concerns, Jaipur: Rawat Publications, Pages 227, Hardbound, ISBN 978-81-316-0788-6, Price: ` 995
Introduction
The social and economic marginalisation of denotified tribes (DNTs) continues to be a reality since the colonial period. Despite laws and welfare schemes, these communities remain vulnerable and subjugated. Several factors - social, economic, political and cultural - interplay and become an obstacle in their development process. As a result, they always remained at the periphery of the society with a poor quality of life. In particular, the educational problems of denotified tribal communities remain unaddressed and neglected. Against this backdrop, Malli Gandhi’s book, Educating Ex-criminal Tribes – Issues and Concerns, critically examines the character, education level and dimensions of educational problems faced by the denotified tribal communities.
The book provides a rich historical background of the status of denotified tribal communities during colonial times. In order to do this, the author has meticulously reviewed government records collected from the state archives of Hyderabad, Chennai and New Delhi, apart from several other archival sources. Thus, the historical survey of denotified tribal communities is not only comprehensive, but gives the readers an in-depth understanding of the changes in the status of denotified tribal communities chronologically. Taking up such a Herculean task deserves enormous appreciation. In addition to this, the contents of the book are also based on primary data collected through extensive field work conducted among the denotified tribal communities of Andhra Pradesh, India. Thus, the book gives the readers a detailed and complete account of the educational problems and social stigma faced by the DNT communities right from their historical trajectory to the present day challenges. In particular, it aims to study the factors affecting school participation, problems relating to provisions, teaching transaction and the overall status of education of denotified tribal communities of Andhra Pradesh. The profiling of the denotified tribes of Andhra Pradesh towards the end of the book has been succinctly put forth by the author, which is commendable.
The book is systematically divided into six chapters and each chapter gives a comprehensive understanding about the denotified tribal communities. The first chapter, “From Criminal Tribes to Denotified Tribes: A Historical Survey” deals with the establishment of settlements of criminal tribes in Andhra Pradesh and the initiatives taken for education of the children belonging to the criminal tribes in a historical perspective. It gives a brief historical background of the denotified tribal communities and the progress made in their settlements in Andhra Pradesh over a period of time. For instance, the author writes about Lingala settlement (p. 39) wherein three tribal groups – Yerukulas, Chenchus and Lambadas live together. The author gives details about the occupational and educational status of these tribes and how the benefits of the welfare schemes are cornered by the well-to-do sections in the village. A stunning paradox, the author mentions, is that till today no anthropologist or sociologist has done a complete survey of these communities (p.43).
The second chapter, “Reformatory Education for the Children of ‘Criminal Tribes’in Madras Presidency” is again a historical account of the development of the denotified tribal
Journal of Educational Planning and Administration Volume XXXI, No. 2, April 2017

© NIEPABook Reviews
168
communities in the Madras Province. The author raises pertinent questions like why the colonial government planned reformatory education for the children of criminal tribes and why they were detached from general education that was imparted to the children in the state-run schools (p.59). The author argues that reformatory schools did not help in their education and development, due to which they remained backward in the colonial society.
The third chapter, “Vocational Education for the Children of Criminal Tribes” focuses on the role of the missionaries and the government in introducing vocational training for the children living in the settlements. Taking a diachronic view, the author notes that industrial settlements in 1914 in the Madras Presidency led to many members of criminal tribes settle down in these industrial settlements. Industrial schools were opened for such children and different training programmes were designed like blacksmithing, carpentry, weaving, gardening, silk worm rearing, etc. However, the author argues that the research studies and field experiences show that the children of the denotified tribal communities were subjugated to various types of harassment in the schools resulting in disinclination among the denotified tribal communities towards formal education. The author classifies the problems faced by such tribal children in receiving education into five crucial areas – economic factors, social factors, cultural factors, school factors and administrative factors. The author rightly points out that in order to strengthen their education, there is a need to involve the DNTs in the process of planning and implementation of education, health initiatives, curriculum development, and so on (p. 91).
The fourth chapter, “Educational Status of the Denotified Tribes in Andhra Pradesh: Attainments and Challenges” elaborates on educational status of the children in the existing colonies of the denotified tribal communities. It is pointed out that the social conditions, living standards, income and educational levels of tribal people are much lower than the conditions of the non-tribal people living in Andhra Pradesh. Lack of census data and the absence of policy level discussions exclusively on denotified tribal communities further accentuate the problem. Thus, the author advocates for sample surveys to know about their present position. Apart from this, better educational facilities and employment opportunities are undoubtedly the need of the hour.
The subsequent chapter deals exclusively with primary data related to the performance of the children of the denotified tribal communities in primary schools. Although the chapter is entitled “Factors Affecting Literacy of Denotified Tribes’ Children in the Settlement Schools of Andhra Pradesh”, there is an in-depth analysis on the performance of the children. A total of five schools were taken for the study and the entire population of 452 students in these five schools was included in the study. The author elaborates on grade-wise performance of the children at the primary level. It is argued that the attitude and behaviour of the students in the schools of the denotified tribal communities are more positive towards education, which mandates better education facilities in such settlements.
The concluding chapter provides broad hints based on the contents covered earlier and also makes certain suggestions, and action points relating to the improvement of educational programmes in the denotified tribal communities’ schools. The author argues that due to perceived lack of opportunities, parents do not have enthusiasm in enrolling their children in schools (p. 175). Moreover, on all the three fronts, i.e., the home, community and school, there are inherent drawbacks to be tackled urgently for ensuring effective linkage between them.

© NIEPABook Reviews
169
The book is undoubtedly a significant contribution to the field of education and more specifically within the context of tribes. Inclusion of voices of parents, children and teachers in denotified tribal communities’ settlements regarding the issues and challenges they face on a day-to-day basis could have added more value to the entire reading. Furthermore, the dynamics between tribal and non-tribal children in accessing quality education and the classroom processes would have given a holistic view of the entire scenario. Nevertheless, these minor limitations do not diminish the overall impact of the book. The aim of the book, i.e., to examine the education prevailing among the denotified tribal community children from colonial times to the present has been achieved completely. The author has painstakingly collected rich data from both primary as well as secondary sources and has done full justice to it. Very recently, the Government of India has constituted a National Commission for Denotifed, Nomadic and Semi-nomadic Tribes with a mandate to identify and prepare state-wise lists of denotified tribal communities, apart from reviewing and evaluating the status of their progress and suggesting appropriate measures for their development. If the recommendations outlined by the author towards the end are taken into account, it will definitely play a key role in the empowerment of denotified tribal communities.
On the whole, Educating Ex-criminal Tribes – Issues and Concerns is a welcome contribution in the fields of education, anthropology, sociology, and so on. The journey of the denotified tribal communities from ‘criminal’ and ‘habitual offender’ to their prevailing conditions has been well captured. It is indeed a rich repository of valuable data and an outstanding source for future research among denotified tribal communities. The book will be immensely useful for scholars, academicians and policy makers working in the area of tribal development. Apart from these, anyone who wants to bring change in the lives of
denotified tribal community children will find the book extremely intriguing.
National University of Educational Planning and Administration (NUEPA), New Delhi - 110016
V. Sucharita [email protected]
AYYAR, R. V. Vaidyanatha (2016): The Holy Grail: India’s Quest for Universal Elementary Education, Oxford University Press, New Delhi. Hardcover: Pages 712, ISBN-10:0199463476 and ISBN-13: 978-0199463473
This book is an account of India’s efforts at the Universalisation of Elementary Education (UEE) especially after the National Policy on Education (NPE), 1986, until its culmination in the Right to Education (RTE), 2009. As the 1990s witnessed a large number of externally funded programmes on primary schooling and basic education, especially the District Primary Education Programme (DPEP), this book is more like an account of a participant observer and an action researcher as the author headed the UEE related programmes at the national level through the 1990s. As the programme hinged on the states’ involvement and partnership in the UEE journey, this work, in some respects, is also about the centre-state relations in education.
Journal of Educational Planning and Administration Volume XXXI, No. 2, April 2017

© NIEPABook Reviews
170
The first project funded by an external agency was the Andhra Pradesh Primary Education Project (APPEP) funded by the UR’s Overseas Development Administration during 1989-94 with a focus on activity-based, child-centred learning commonly known as Activity-Based Learning (ABL). This method was the inspiration for subsequent major schemes like the DPEP and Sarva Shiksha Abhiyan (SSA), especially with respect to the creation of teacher training resource centres at the Block (Mandal in AP) and Cluster levels, BRCs and CRCs. The role and contribution of British experts to APPEP and DIETs (District Institutes of Education and Training) in AP was seminal. But, there was no role played by the locals and local institutions or the national resource centres like NCERT and state education departments. This lack of space in the design and implementation and also the lack of capacity development of department personnel was due to the ‘mothering’ approach of the agency’s local branch, where only the expatriate consultants and officials were associated with the appraisal, planning, detailing, monitoring and project evaluation. This lesson was used in designing DPEP, where the agency functionaries or their consultants were kept away from planning and implementation of the programme with minimal role of visiting states for interaction and appraisal as part of Joint Review Missions (JRMs).
As a foundation for his professional skills and grounding on education, the author’s account of the Great Master (Ch-II) provides an extensive account of the views and role at the highest policy-making level like Central MOE/MHRD of educationists of the second half of the 20th century like J.P. Naik and Anil Bordia, especially in the last quarter, on the UEE movement after the National Policy on Education (NPE) 1986. For Anil Bordia, education was not a job but a mission, and achieving UEE is not like a sprint but a marathon, a long and hard journey. In the Jomtien Conference, Bordia was one of the three delegates chosen to offer ‘call to action’, ‘for a decisive shift in favour of change… so that basic education receives the priority it deserves (p. 172). This, in part, resulted in the Jomtien Declaration on Education for All (EFA) 1990. The author is candid in admitting that working with Bordia had helped him enormously in gaining an understanding of the education in its historical and social context, in the national and international perspectives as well as in acquiring administrative skills, particularly of articulation, negotiation and more importantly, in the grand design and execution of EFA projects.
As with other countries, it was felt that in the Indian context, UEE is possible through two methods, formal and non-formal for which the Centre has to play a major role in strategising and funding a national programme of UEE, along with NFE, in partnership with states and NGOs (p.51). One finds a complete historical, international and comparative perspective of both the conceptual dimensions as well as about every detail of the programme design, planning and implementation of UEE related programmes. Classic cases, of which he was perhaps not directly in charge, include the NFE programme and the Total Literacy Campaigns (TLCs) [Akshara Kerelam to Akshara Bharat] (Ch. V-VI). The author recognises that a major contribution of TLCs was to impart a sense of urgency to the pursuit of UEE and pave the way for DPEP and SSA.
At the international front, the concept of basic education as visualised by Jomtien Declaration, included formal primary schooling, NFE and adult education (pp. 150-151). This ushered in a new definition to basic education that learners should achieve a minimum and acceptable level of learning. This marked a difference to the old debate in India about a minimum number of years of schooling to achieve irrelapsable level of literacy – four or five

© NIEPABook Reviews
171
years (p. 176). The Indian model of EFA as Jomtien Declaration envisaged was the Bihar Education Project (BEP) launched in 1990 to systematically revamp the entire context and process of education (p. 207). External funding agencies as well as the concerned sections within Directorate of Education (DoE) were not very comfortable in funding all the five focus areas of Basic Education Project (BEP), viz., ECCE, Primary Education, Non-Formal Education (NFE), adult education, etc. This was the reason for many of the EFA projects other than primary schooling going off and remaining as separate projects with external funding such as Lok Jumbish, NFE, Shiksha Karmi projects. The author’s assessment of BEP’s contribution to India’s UEE quest is incisive as it influenced the design, development and implementation of DPEP and its successor SSA. Many invaluable lessons from the BEP were drawn and incorporated in DPEP design (pp. 242-243). Both APPEP and BEP demonstrated the criticality of planning for systematic capacity building of implementation agencies, by placing the responsibility of planning and management of the project squarely on the state government. (pg. 244). Thus, the State Societies model was borrowed by DPEP, especially for free flow of finances. This society model was extended to Lok Jumbish, UP Basic Education Project and DPEP and later on even to SSA.
The studies about development cooperation miss out the challenge of getting everyone on board, the funding agencies, the UN agencies, other bilateral and multilateral agencies, Central Departments such Department of External Affairs (DEA), ministries and their organisations like the Finance Commission, the Planning Commission, NCERT, NIEPA and MHRD. While bridging the gap, this book captures the politics and process of policy and programme development, of engagement between the Centre and the States, between a country and funding agencies. It is also about the role of a pointsman, as in the case of this author, for managing interface between DOE and external agencies like the World Bank, the European Commission, ODA and later DFID, SIDA, UNDP, UNICEF, UNESCO, and negotiations with them to the get the best deal on funding and its terms without compromising on India’s autonomy. These challenges, and the way they were surmounted, run through more than two-thirds of this book, Chapters 7 to 19 starting with India and Jomtien to the launching of the DPEP in different states, funded by different agencies agreeing to the DPEP project design.
The journey towards reaching the goal of UEE in the states of Madhya Pradesh and Uttar Pradesh are exemplars of a lack of agreement between officials of donor agencies and the state education department officials, as also with DOE. The MP government’s stand of no ceiling on civil construction and that financial and other parameters of the project should be left to the local community in the spirit of decentralised planning was like turning the project as civil construction programme, making a mockery of educational planning (pg. 371). Even though the World Bank was on board with the perspective and strategy of DPEP, it began to have apprehensions that the society model would undercut the state’s role. It was clarified that the DPEP would keep the state government fully in the picture – free to choose the districts that fulfilled the programme criteria; funds from the Central government would be released to a state level society created by the state government, whose governing organs were presided over by the state government functionaries, with representatives from all departments and the state would have all the flexibility. A major issue of contest was also that there was no need and rationale for external funding for UEE - a Fundamental Right

© NIEPABook Reviews
172
(p. 383). The author refutes these criticisms and the subsequent sequence of the DPEP course with the credit and assistance from multiple agencies were on India’s terms.
The DPEP project ushered in, the author points out, a new culture of outcome orientation and accountability, by laying down targets and specifying processes to assess the implementation and putting in place a strong MIS and periodic as well as terminal evaluation. Ayyar also tracks another legacy of DPEP, viz., the creation of educational database, especially District Information System for Education (DISE) developed by NUEPA, that now also covers the entire elementary as well as the secondary levels as U-DISE (pp. 612-613). The DPEP was a decentralised strategy but with certain standardisation, uniformity and rigour to ensure outcomes to satisfy the funding agencies. What DPEP attempted to establish was an organised decentralisation rather than decentralisation without a national framework and without the programme being steered at the national level by DoE. It was a case of initial centralisation for gradual decentralisation as without it, the decentralisation would have been disorganised decentralisation and reduced it to a conventional CSS. To demonstrate that DOE could professionally organise the design and implement the project satisfactorily to the funding agencies, it constituted a National Core Group (NCG) comprising 50 odd faculty of NIEPA and NCERT to assist the states in the project design and implementation and build the capacity of state and district functionaries. As NSG (Technical Support Group) could not meet the vast capacity building requirement, the plan of a DPEP-TSG of Indian consultants, putting in place a network of academic and training institutions for various tasks such as training, pedagogy, appraisals and supervisory missions was firmed up and the institution was born to meet the concerns of the funding agencies like the World Bank, EC and ODA (p.434). DPEP always expected that once the programme got a good grasp of the primary stage, it could be extended to Upper Primary stage and this trajectory was followed by DPEP and its successor, the SSA (pp. 437-438).
Building Jerusalem (Chapter XV) dwells in detail on the DPEP in all its details, as assiduously worked out by the author and his team. DPEP was not a standalone programme as it coexisted with TLCs and NFE programmes, and it was felt that while TLCs experimentation in advancing and achieving the goal of UEE was welcome, the two should be separate. The roll-out of the DPEP was not without the unexpected and unsuspected obstacles created by the World Bank on the implementation and funding of DPEP from mid-1994 onwards. However, with giving total clearance in a crucial meeting in mid-1994, things changed dramatically and even the Planning Commission agreed to treat DPEP as a CSS and external funds only as additionality to DOE’s plan provision (p. 501).
The Crucible of Fire (Ch. XVIII) is an extremely touching account of the overbearing nature of the MP education bureaucracy and politician nexus, one feeding on the other, in not wanting to follow honestly and rigorously the planning processes involved in the DPEP guidelines. Caterpillar to Butterfly (Ch. XIX) portrays the transition and transformation of DPEP to SSA in the UEE journey. All in all, DPEP covered 272 out of 593 odd districts in 18 of the states. The SSA is a new avatar of the DPEP, expected to cover all states and districts and also the entire elementary education stage unlike the primary stage covered by DPEP. But for the groundwork done for the DPEP, the author contends, SSA could not have taken off so smoothly. With the transition from DPEP to SSA, the author also surveys the many accompanying processes such as the NFE programmes, its design in the system of primary education, the para teachers, the massive controversies about the system–

© NIEPABook Reviews
173
deinstitutionalisation and ‘a foreign hand towards privatisation of primary education system’, the damage done to teachers, etc (pp. 609-12).
Seeing the differential performance of DPEP across different states, Ayyar infers that setting uniform goal posts across all districts was a mistake and it would have been better if districts with lower level of educational development and more difficult environment were permitted to set a more realistic and credible target rather than compelled to strive for all India goals (p.622). Ayyar also notes that DPEP sought to uproot a deeply entrenched but dysfunctional system and ushered in a period of hectic experimentation and also institution building in a big way: 6,300 BRCs, and 17,600 CRCs, deepening the academic support and guidance (pp 624-625). He also documents the surveys and the controversies over Minimum Levels of Learning (MLL), marking a departure from the tradition of top-down process of revising curriculum to the child-centred approach that radically changed the manner in which teachers organised teaching-learning activities (pp. 632-633).
This book covers all the aspects of primary/elementary education – curriculum, pedagogy, teaching-learning processes, teacher training, educational data base, baseline and evaluation studies of the DPEP, outcome and impact studies and studies criticising external funding on elementary education. This work is a window to the author’s depth of knowledge of the literature about all other educational programmes like NFE, EGS, para teachers, and the Total Literacy Campaigns. It is an account of the person in the thick of things heading the design, planning and execution of a nationwide programme on UEE in all its dimensions. It is also an account of the experience of interaction, negotiation and working with groups, individuals, at the national and state government levels, in meetings and conferences and negotiation with lending aid agencies. It is a brutally frank opinion and assessment of people, their expertise, its contribution to the programmes – liberally appreciative of positive contribution, incisive in assessment of criticisms voiced against programmes and policies and not shying away from what he felt was wrong about views and dealings. There is no comprehensive narrative, comparable to this work, about India’s quest for UEE that covers all major developments and places them against the backdrop of the national and the global political, economic and educational developments. This work will remain a masterpiece of
recent history as told by a person involved in shaping it.
National University of Educational Planning and Administration (NUEPA), New Delhi - 110016
A. Mathew [email protected]
© NIEPABook Reviews
174
Journal of Educational Planning and Administration Volume XXXI, No. 2, April 2017

© NIEPABook Reviews
175
INDIAN JOURNAL OF AGRICULTURAL ECONOMICS
(Organ of the Indian Society of Agricultural Economics)
Vol. 72 April-June 2017 No.2
CONTENTS
ARTICLES
Crossbred Cattle Adoption and Its Impact on Income and Household
Milk Consumption among Dairy Farmers: Empirical Evidence
from Assam
Baban Bayan and
Mrinal Kanti Dutta
Economics and Factors Affecting Rainbow Trout (Oncorhynchus
mykiss) Production in Kashmir
Stanzin Gawa and
Nalini Ranjan Kumar
What Constrains Agriculture Credit in India? How to Improve the
Outreach? An Essay on Current Approach and Practices
R. Bhaskaran
BOOK REVIEWS* PUBLICATIONS RECEIVED* ANNOUNCEMENT*
Annual Subscription Rates
Individual Membership Fee : 1,000.00; £ 50.00; $100.00.
Life Membership Fee : 10,000.00; £ 500.00; $1000.00.
Institutional Subscription : 3,000.00; £ 75.00; $350.00.
Please address correspondence to the Hon. Secretary and Treasurer, The Indian Society of
Agricultural Economics, C-104, First Floor, Sadguru Complex I, Near Vagheshwari, Gen. A.K.
Vaidya Marg, Goregaon (East), Mumbai - 400 063 (India).
Telephone : 022-28493723; Fax : 091-022-28493724; email : [email protected];
[email protected]; website: www.isaeindia.org
Journal of Educational Planning and Administration Volume XXXI, No. 2, April 2017

© NIEPA
Journal of
Educational Planning and Administration
Regarding subscriptions, advertisement, circulation, missing issues, etc., please contact
Deputy Publication Officer National University of Educational Planning and Administration 17 B Sri Aurobindo Marg, New Delhi 110016 Tel: 26544875 E‐mail: [email protected]
Regarding exchange of the Journal and missing issues, please contact
Librarian National University of Educational Planning and Administration 17 B Sri Aurobindo Marg, New Delhi 110016 Tel: 26544811 E‐mail: [email protected]
Only editorial matters be addressed to the Editor, JEPA
Tel: 26544807 or 26544800 E‐mail: [email protected]
For more details please log on to our website www.nuepa.org

© NIEPASubscription Form for the
Journal of Educational Planning and Administration
Please enroll me for the subscription of the JOURNAL OF EDUCATIONAL PLANNING AND ADMINISTRATION
Name and Address (in Capital Letters) ____________________________________________
____________________________________________
____________________________________________
________________________PIN_________________
Subscription for the calendar year ______________. Annual Subscription for the Quarterly journal commences with January and ends with October every year. [Please tick mark ( ) the appropriate one] ` 150/- Subscription for individuals in India ` 350/- Subscription for Institutions in India US$ 60 Subscription for individuals (By Air Mail) outside India US$ 85 Subscription for Institutions (By Air Mail) outside India NUEPA offers 20% discount on subscription for three years and above. Please make the payment by Bank Draft in favour of National University of Educational Planning and Administration payable at New Delhi.
Details of the Enclosed Bank Draft: Bank Draft No. …………….………. Dated…….…………… Drawn on …………………..………… Date______________________ Signature _________________________
- - - - - - - - - - - - - - - - - - - - - - - - - - - - - - - - - - - - - - - - - - - - - - - - - - - - - - - - - - - - - - - - Please mail this subscription order form along with the Bank Draft to: The Deputy Publication Officer National University of Educational Planning and Administration 17-B, Sri Aurobindo Marg, New Delhi-110016 (INDIA)
Tel: 91-11-26544875, 26544800 Fax: 91-11-26853041 E-mail: [email protected]