Embed Size (px)
Citation preview
VOLUNTARY TEETH CLENCHING DURING PHYSICAL EXERCISE IN NATURAL
ENVIRONMENT: PREVALENCE AND GENDER DIFFERENCES
A THESIS IN
Oral and Craniofacial Sciences
Presented to the Faculty of the University
Of Missouri-Kansas City in partial fulfillment
of the requirements for the degree
MASTER OF SCIENCE
by
ADAM REYNOLDS
B.S., Brigham Young University, 2007
D.M.D., University of Kentucky, 2011
Kansas City, Missouri
2013

iii
VOLUNTARY TEETH CLENCHING DURING PHYSICAL EXERCISE IN NATURAL
ENVIRONMENT: PREVALENCE AND GENDER DIFFERENCES
Adam Reynolds, Candidate for the Master of Science Degree
University of Missouri-Kansas City, 2103
ABSTRACT
Background/Objectives: Voluntary teeth clenching (VTC) has been researched with
respect to performance enhancement, but little evidence has verified its prevalence. This
study’s objective was to determine if VTC occurred during exercise in a natural environment.
Secondarily, if differences in VTC existed based on gender and exercise type were
investigated. Methods: Ambulatory surface electromyography (EMG) recorders were used to
measure activities in the masseter and temporalis muscles and detect VTC during leg
extension and general weight-lifting exercises in 7 male and 10 female subjects recruited
from UMKC soccer teams. All subjects gave informed consent to participate in IRB-
approved study protocols. Laboratory surface EMG recording during static and dynamic
biting tasks established linear regression relations between EMG:bite-force for each subject.
Then subject-specific thresholds for VTC ranging from 5-80% of a 20 N bite-force (T20N)
were applied to detect and measure VTC in ambulatory data. Duty factors (DF=time
clenching/total recording time, %) were compared for each VTC threshold and
gender/exercise/muscle combination by simple test effect. Statistical significance was set at
p<.05 with a Bonferroni correction. Results: VTC was shown by all subjects at a threshold of
≤5%T20N, by 47% of subjects at a threshold of 50%T20N, and by 29% of subjects at a
iv
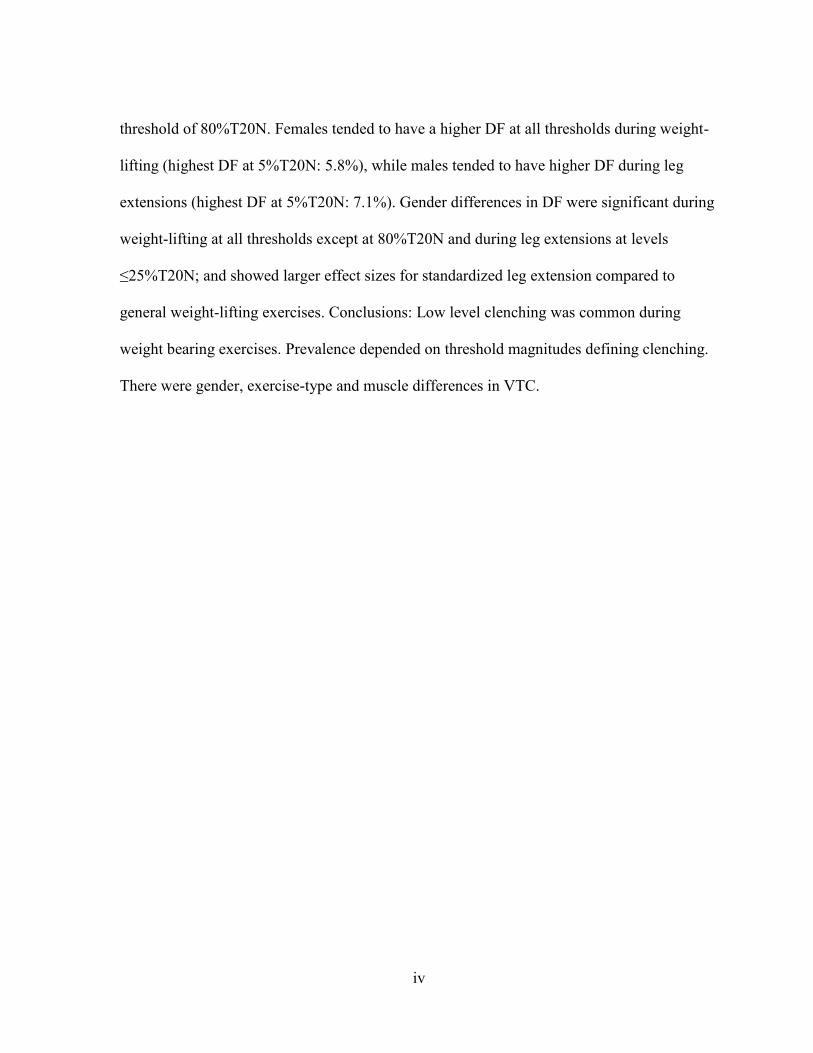
threshold of 80%T20N. Females tended to have a higher DF at all thresholds during weight-
lifting (highest DF at 5%T20N: 5.8%), while males tended to have higher DF during leg
extensions (highest DF at 5%T20N: 7.1%). Gender differences in DF were significant during
weight-lifting at all thresholds except at 80%T20N and during leg extensions at levels
≤25%T20N; and showed larger effect sizes for standardized leg extension compared to
general weight-lifting exercises. Conclusions: Low level clenching was common during
weight bearing exercises. Prevalence depended on threshold magnitudes defining clenching.
There were gender, exercise-type and muscle differences in VTC.
v
APPROVAL PAGE
The faculty below, appointed by the Dean of the School of Dentistry have examined a
thesis titled “Voluntary Teeth Clenching during Exercise in a Natural Environment:
Prevalence and Gender Differences,” presented by Adam K. Reynolds, candidate for the
Master of Science degree, and certify that in their opinion it is worthy of acceptance.
Supervisory Committee
Laura Iwasaki, B.S., D.D.S., M.Sc., Ph.D., Committee Chair
Departments of Orthodontics and Dentofacial Orthopedics and
Oral and Craniofacial Sciences
Jeffrey Nickel, D.D.S., M.Sc., Ph.D., Committee Chair
Departments of Orthodontics and Dentofacial Orthopedics and
Oral and Craniofacial Sciences
Ying Liu, Ph. D.
Research and Graduate Programs Office
Mary P. Walker, D.D.S., Ph.D.
Department of Oral and Craniofacial Sciences
vi
CONTENTS
ABSTRACT ............................................................................................................................ iii
LIST OF ILLUSTRATIONS .................................................................................................. ix
LIST OF TABLES .................................................................................................................. xi
ACKNOWLEDGMENTS ..................................................................................................... xii
Chapter
1. INTRODUCTION ............................................................................................................ 1
Voluntary Teeth Clenching .......................................................................................... 1
Teeth Clenching as a Parafunctional Habit ...................................................... 1
Voluntary Teeth Clenching as a Non-Parafunctional Habit ............................ 3
Voluntary teeth clenching and performance enhancement .................. 4
Relation of voluntary teeth clenching and
neurophysiological performance ........................................... 4
Relation of voluntary teeth clenching and
biomechanical performance ................................................ 10
Relation between Mouth Guards and VTC ................................................................ 15
EMG ........................................................................................................................... 16
Duty Factor ................................................................................................................ 20
Gender Differences .................................................................................................... 20
Problem Statement ..................................................................................................... 22
Hypotheses ................................................................................................................. 23
2. MATERIALS AND METHODS .................................................................................... 24
Experimental Design .................................................................................................. 24
Subjects ...................................................................................................................... 24
vii
Experimental Protocol ............................................................................................... 25
Laboratory Visit #1 ........................................................................................ 26
EMG recording during standardized biting tasks .............................. 26
Leg extension exercise tasks .............................................................. 29
Preparation and instruction for field recordings ................................ 30
Laboratory Visit #2 ........................................................................................ 30
Data Analysis ............................................................................................................. 33
Behavioral Data Analysis (EMG Recordings) ............................................... 33
Determination of T20NAve ................................................................................................. 34
Processing of field EMG recordings35
Calculation of duty factors ................................................................. 35
Statistical Analysis ......................................................................................... 36
3. RESULTS ....................................................................................................................... 37
Summary .................................................................................................................... 37
Laboratory EMG Recordings ..................................................................................... 37
Results from Determination of T20NAve ..................................................................................................... 39
Results from Processing of Ambulatory EMG Recordings ....................................... 42
Results from Calculation of Duty Factors ................................................................. 44
Duty Factor and Comparing Gender .............................................................. 45
Duty Factor and Comparing Type of Exercise .............................................. 48
Duty Factor and Comparing Muscles ............................................................ 50
Duty Factor and Effect Size ........................................................................... 50
viii
4. DISCUSSION ................................................................................................................. 54
5. CONCLUSION ............................................................................................................... 63
LITERATURE CITED .......................................................................................................... 64
Appendix
1. IRB APPROVAL ................................................................................................... 72
2. CLINICAL EXAM FORM .................................................................................... 75
3. HIPPA FORM ........................................................................................................ 77
4. INFORMED CONSENT FORM ........................................................................... 80
5. BITING EMG LOG SHEET ................................................................................. 87
6. LABORATORY EXERCISE LOG ....................................................................... 89
7. DIARY SHEET EXERCISE LOG ........................................................................ 91
VITA ...................................................................................................................................... 93
ix
ILLUSTRATIONS
Figure Page
1. Subject Performing Laboratory EMG Calibration Tasks Involved in
Laboratory Visits #1 and #2 ....................................................................................... 27
2. EMG Surface Electrodes on Anterior Thigh ................................................................. 27
3. Bite-Force Transducer Used to Measure the Force Applied During the
Various Biting Tasks for Calibration of EMG ........................................................... 28
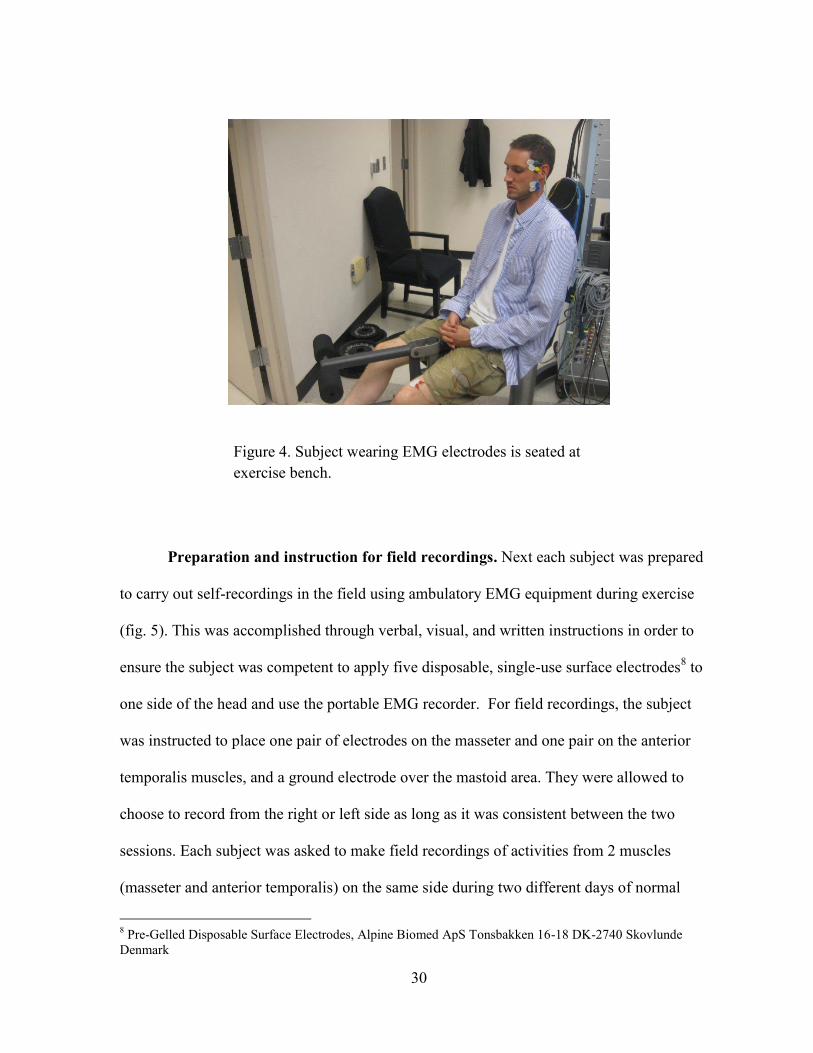
4. Subject Wearing EMG Electrodes is Seated at Exercise Bench .................................... 30
5. The Ambulatory EMG Recorder Used by Subjects in the Field During
Leg Extension and Weight-Lifting Exercises is Shown with Four
Surface Electrodes for Unilateral Recording of Masseter and
Temporalis EMG ....................................................................................................... 32
6. Amplified EMG (mV) and Bite-Force Transducer Output Versus
Time from Subject Number 3 During Five Static Bites on Left Molars
During the Laboratory Visit #1 .................................................................................. 38
7. Amplified EMG (mV) and Bite-Force Transducer Output Versus
Time from Subject Number 5 During a Dynamic Biting Task at Different
Frequencies on Left Molars During the Laboratory Visit #1 .................................... 39
8. Examples of Four Linear Regression Relations from Subject Number 6
During Static and Dynamic Biting on the Left Molars at Laboratory
Visit #1 ....................................................................................................................... 40
9. An Example of Unfiltered Ambulatory Recording during Leg Extension
Of Subject Number 4 from the Masseter Muscle ...................................................... 42
10. The Same Ambulatory Data as Figure #9 that has been Filtered at 30 db.................... 43
11. An Example of Noise that Would either be Cut Out or Excluded Entirely .................. 43
12. An Example from Subject Number 8 where the Masseter Channel
on the Bottom has No Recording so it was Excluded ................................................ 43
13. Weight-Lifting: Gender Comparison of Duty Factor Versus Magnitude
Threshold ................................................................................................................... 47
14. Leg Extensions: Gender Comparison of Duty Factor Versus Magnitude
x
Threshold ................................................................................................................... 48
15. Males: Exercise Comparison ........................................................................................ 49
16. Females: Exercise Comparison ..................................................................................... 50
xi
TABLES
Table Page
1. A Modified Version of Ueno’s Table Detailing Studies that have Looked
Into VTC and Performance Enhancement ................................................................. 13
2. Calculated T20NAve Values............................................................................................ 41
3. Excluded Ambulatory Recordings for Subject, Exercise, and Reason .......................... 44
4. Effect Size for Gender ................................................................................................... 52
5. Effect Size for Exercise Type ........................................................................................ 53
xii
ACKNOWLEDGMENTS
I would like to express my appreciation and give thanks to:
Dr. Laura Iwasaki, for her patience, guidance, expertise and time.
Dr. Mary Walker, for her support and mentorship
Dr. Jeff Nickel, for his expertise, feedback, encouragement
Dr. Ying Liu, for her input, expertise and time.
Dr. Hongzeng Liu for his expertise and support
John Fife, for his support and administrative assistance.
Roy J. Rinehart Memorial Foundation and UMKC School of Dentistry, for RSC funding
My wife, Jennilyn, and my three children, Jackson, Drew, and Makenzie, for their
unconditional love and support and for always welcoming me home with smiles and hugs.
They always helped me keep things in perspective.
1
CHAPTER 1
INTRODUCTION
In 1977, Stenger was the first to investigate how the bite affected strength (Stenger
1977). Since Stenger’s report many authors have published articles on athletic performance
enhancement with relation to mouth guards, jaw position or voluntary teeth clenching (VTC).
While much of the early research focused on mouth guards and jaw position, recently there
has been a greater interest in the effect that VTC has on strength and performance
enhancement. One of the difficulties in reviewing the literature about performance
enhancement related to VTC is that researchers have used so many different tests for strength
and performance that it is necessary to understand the differences between them.
Voluntary Teeth Clenching
While the sustained act of teeth clenching is generally thought of as a parafunctional
habit, Okeson (Okeson 1993) has noted that it also can occur in a moment of intense
concentration or strenuous exertion. Therefore, it appears that there is an acceptable
occurrence of VTC that may have some benefits as well as parafunctional occurrence of VTC
that may result in pathologic symptoms of temporomandibular disorder (TMD). Both
pathologic and non-pathologic consequences of VTC will be elaborated in the following sub-
sections.
Teeth Clenching as a Parafunctional Habit
It is understood that in the normal rest position of the mandible, the maxillary and
mandibular teeth do not contact. Contact usually is limited to the relatively brief moments of
chewing and swallowing. However, clenching or bruxism can also occur as an unconscious
habit with possible detrimental effects including TMD, muscle pain, and could even be
2
associated with depression (Barbosa Tde et al. 2008; Farella et al. 2010; Manfredini and
Lobbezoo 2010). The researchers at the University of Montreal collected data on clenching
and sleep bruxism from 7 to 17 year old orthodontic patients through a questionnaire (Carra
et al. 2011). While sleep bruxism is often identified when parafunctional habits are spoken
of, the results showed that daytime clenching may be just as prevalent. Sleep-related
bruxism was reported in 15% of the population and wake-time tooth clenching by 12.4%.
Interestingly 67.3% of those who reported sleep bruxism were 12 years old or less.
Conversely, over 78% of the group who reported teeth clenching during the day were 13
years old or older. Furthermore, compared to controls, subjects who reported wake-time teeth
clenching also reported more temporomandibular joint (TMJ) clicking, jaw muscle fatigue
and sleep and behavior complaints. This was different from those subjects who reported
sleep-related bruxism who were more at risk of experiencing jaw muscle fatigue, headache,
and loud breathing during sleep compared to controls.
Other studies have also investigated the pathologic effects of jaw clenching.
Christensen reported (Christensen 1981, 1989) that a subjective sensation of muscle fatigue
appeared after about 30 seconds of maximum VTC. After about 60 seconds VTC elicited a
mild pain in the masseter and temporalis muscles and by 120 seconds mild pain and complete
exhaustion of these elevator muscles were reported. Glaros et al. (Glaros et al. 2000)
hypothesized that clenching could lead to TMD pain. Subjects were divided into two groups.
One group maintained a clenching state for 20 minutes 5 days/week while the other group
maintained a low level of masseteric activity. At the end of the study three of the ten subjects
in the clenching group were diagnosed with TMD pain. In a repeat study with similar
protocols, similar results were found when two of 14 subjects developed TMD pain due to
3
increased clenching. Self-reported pain was significantly higher for the clenching group and
electromyography (EMG) from the masseter was strongly correlated with pain (Glaros and
Burton 2004). At the University of Witwatersrand, researchers enrolled twelve children ages
9-14 years to understand more about clenching and pain. The children were instructed to
maintain maximum voluntary clenching until facial pains could no longer be endured. On
average, pain onset occurred at 49 seconds and could be endured until 118 seconds. The
pains were typically localized in the masseter and temporalis muscles. The authors reported
that the pain threshold varied between individuals, but not within individuals (Christensen
1980).
There is also a reported gender difference in jaw pain induced by jaw clenching.
Plesh et al. (Plesh et al. 1998) instructed seven male and seven female subjects to perform
various clenching tasks. The next day they found that only females presented with an
increased overall pain level and significant decrease in pain-free jaw opening. It is therefore
evident from a review of the literature that a habit of frequent or prolonged clenching truly
can produce unfavorable conditions that lead to pain in children and adults. It is possible
female adults may be more prone to developing pain due to clenching habits.
Voluntary Teeth Clenching as a Non-Parafunctional Habit
While voluntary teeth clenching has been well researched as a possible mechanism
for performance enhancement, there is very little research about its actual prevalence or
occurrence during sports and physical activities. Ohkawa et al. (Ohkawa 1994; Ohkawa et al.
1994) performed two similar studies looking at athletes performing common tasks in their
respective sports and found clear masticatory muscle EMG occurred in two of the six soccer
4
players and all 20 of the volleyball and handball players during kicking, spiking and shooting
respectively. In a larger study (Ishijima et al. 1991), researchers investigated the prevalence
of clenching in 100 young adults during a measurement of back strength. They found that
centric clenching occurred in 58% while 11% exhibited eccentric tooth contacts and 31% did
not have any tooth contact during strenuous physical exertion.
Voluntary teeth clenching and performance enhancement. There are certain
advantages in researching the effect of VTC, instead of the effect of mouthguards, on
performance enhancement. One of those inherent advantages is that the variable of the design
of the mouth guard is removed. There are many different methods to construct a mouth
guard. However, jaw clenching is a fairly simple maneuver. The only variables are the
amount of clenching itself and the position of the lower jaw during clenching. When patients
are instructed to clench their teeth at maximum clenching according to their own definition
there is a large variability from person to person in the force of clenching measured by EMG
of the masseter muscle. This shows that each person’s definition of clenching is different
quantitatively as shown by Glaros and Waghela (Glaros and Waghela 2006). However, these
authors did report that there was significant consistency individually for maximum clenching.
Below it will be shown that other researchers have also chosen to look beyond strength as a
measurement of performance and have also looked at neurological performance as well as
biomechanical performance.
Relation of voluntary teeth clenching and neurophysiological performance. One of
the ways to measure neurological performance is to look at a nerve’s reflex; for example, a
monosynaptic reflex. One commonly assessed monosynaptic reflex is the knee-jerk reflex.
By tapping on the tendon of the knee a stretch reflex is induced in the muscle spindle
5
afferents activating sensory fibers called Ia afferent fibers. These Ia afferents run to the spinal
cord where they synapse on a motor neuron efferent. If the afferent sensory fiber is
successful at activating the efferent motor neuron then the action potential will be carried
down the motor neuron to the motor plate and cause a contraction of the muscle. This process
is called monosynaptic because there is only one synapse in the reflex: the synapse between
the sensory afferent and the motor efferent.
The H-reflex described by Hoffman in the early twentieth century is the same reflex.
The only difference is that the muscle spindle is not activated but is bypassed by using a
cutaneous stimulation of a mixed peripheral nerve. The sensory afferent is still activated but
it is done through electrical stimulation instead of physically perturbing the muscle. The
result is still the same monosynaptic reflex and muscle contraction or twitch. When this is
measured by EMG this is called an H-reflex. There are certain aspects of the H-reflex that are
crucial to understand in order to understand its use in research.
Using electrical stimulation it is possible to activate the efferent motor neuron
through two pathways. The first one is the H-reflex, the monosynaptic reflex through
stimulation of the afferent sensory neuron that was described above. The second way is that
the efferent motor neuron may be excited directly by surface electrical stimulation. When this
is measured by EMG this is called the M-wave or muscle wave. It is not a reflex because it is
just a direct activation of the motor efferent nerve. In many muscles it is possible to increase
slowly the electrical stimulation to get a selective reading for just the H-wave or H-reflex. If
the stimulation is increased further the M-wave will also appear. It is also possible to
differentiate between the two because after an electrical stimulation if there are two waves
then the first wave will be the M-wave. The second wave is the H-wave since there is a
6
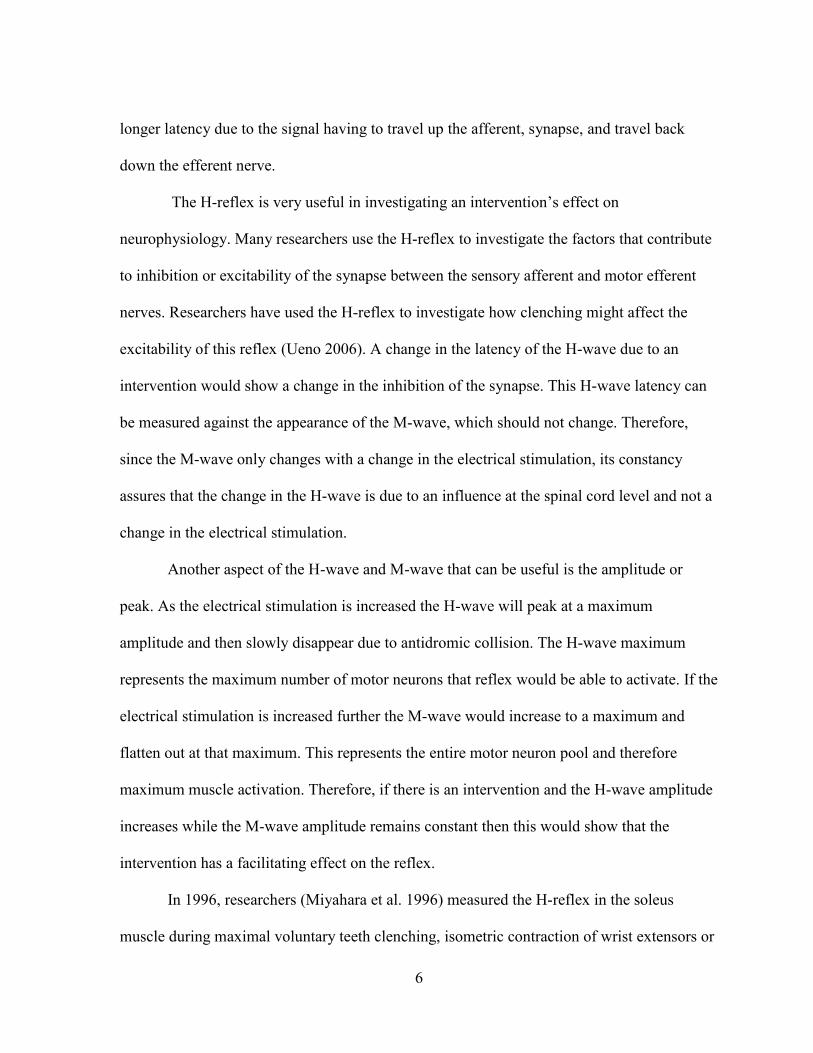
longer latency due to the signal having to travel up the afferent, synapse, and travel back
down the efferent nerve.
The H-reflex is very useful in investigating an intervention’s effect on
neurophysiology. Many researchers use the H-reflex to investigate the factors that contribute
to inhibition or excitability of the synapse between the sensory afferent and motor efferent
nerves. Researchers have used the H-reflex to investigate how clenching might affect the
excitability of this reflex (Ueno 2006). A change in the latency of the H-wave due to an
intervention would show a change in the inhibition of the synapse. This H-wave latency can
be measured against the appearance of the M-wave, which should not change. Therefore,
since the M-wave only changes with a change in the electrical stimulation, its constancy
assures that the change in the H-wave is due to an influence at the spinal cord level and not a
change in the electrical stimulation.
Another aspect of the H-wave and M-wave that can be useful is the amplitude or
peak. As the electrical stimulation is increased the H-wave will peak at a maximum
amplitude and then slowly disappear due to antidromic collision. The H-wave maximum
represents the maximum number of motor neurons that reflex would be able to activate. If the
electrical stimulation is increased further the M-wave would increase to a maximum and
flatten out at that maximum. This represents the entire motor neuron pool and therefore
maximum muscle activation. Therefore, if there is an intervention and the H-wave amplitude
increases while the M-wave amplitude remains constant then this would show that the
intervention has a facilitating effect on the reflex.
In 1996, researchers (Miyahara et al. 1996) measured the H-reflex in the soleus
muscle during maximal voluntary teeth clenching, isometric contraction of wrist extensors or
7
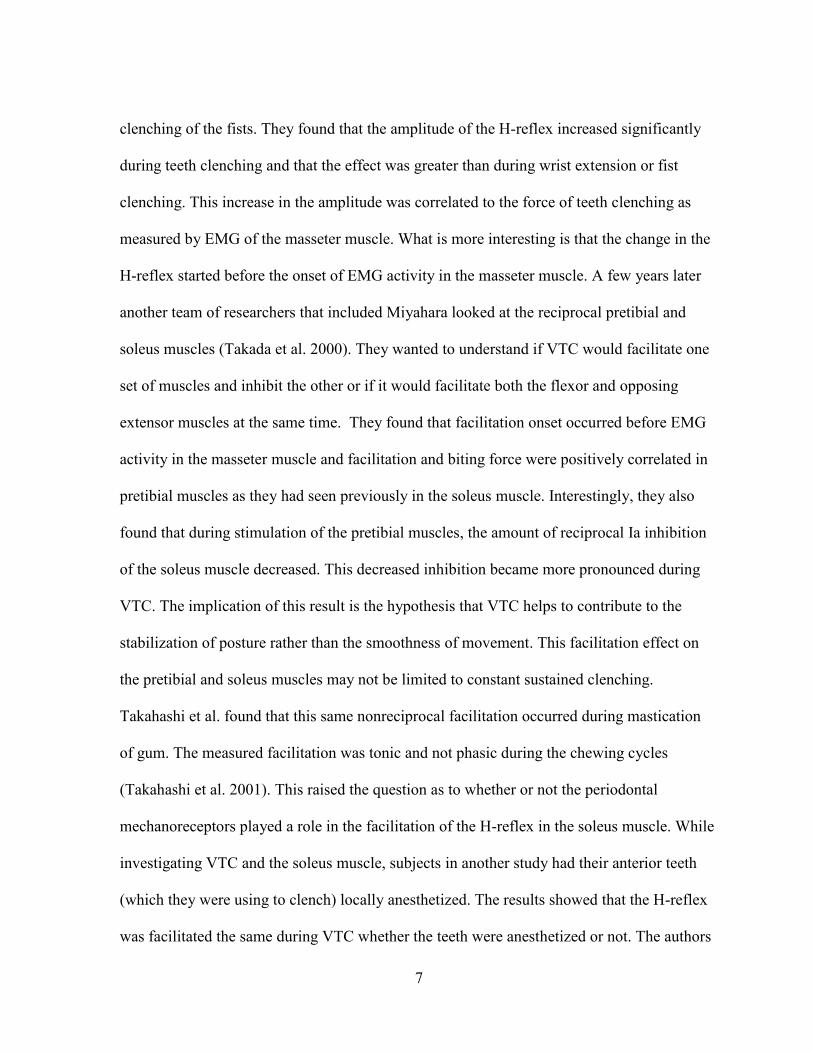
clenching of the fists. They found that the amplitude of the H-reflex increased significantly
during teeth clenching and that the effect was greater than during wrist extension or fist
clenching. This increase in the amplitude was correlated to the force of teeth clenching as
measured by EMG of the masseter muscle. What is more interesting is that the change in the
H-reflex started before the onset of EMG activity in the masseter muscle. A few years later
another team of researchers that included Miyahara looked at the reciprocal pretibial and
soleus muscles (Takada et al. 2000). They wanted to understand if VTC would facilitate one
set of muscles and inhibit the other or if it would facilitate both the flexor and opposing
extensor muscles at the same time. They found that facilitation onset occurred before EMG
activity in the masseter muscle and facilitation and biting force were positively correlated in
pretibial muscles as they had seen previously in the soleus muscle. Interestingly, they also
found that during stimulation of the pretibial muscles, the amount of reciprocal Ia inhibition
of the soleus muscle decreased. This decreased inhibition became more pronounced during
VTC. The implication of this result is the hypothesis that VTC helps to contribute to the
stabilization of posture rather than the smoothness of movement. This facilitation effect on
the pretibial and soleus muscles may not be limited to constant sustained clenching.
Takahashi et al. found that this same nonreciprocal facilitation occurred during mastication
of gum. The measured facilitation was tonic and not phasic during the chewing cycles
(Takahashi et al. 2001). This raised the question as to whether or not the periodontal
mechanoreceptors played a role in the facilitation of the H-reflex in the soleus muscle. While
investigating VTC and the soleus muscle, subjects in another study had their anterior teeth
(which they were using to clench) locally anesthetized. The results showed that the H-reflex
was facilitated the same during VTC whether the teeth were anesthetized or not. The authors
8
concluded that the periodontal mechanoreceptors did not play a major role in the facilitation
of the soleus muscle (Tuncer et al. 2007).
The muscles in the leg are not the only place where VTC has been shown to have a
facilitating effect. Takahashi et al. also investigated the flexor and extensor carpi radialis
muscles. In line with findings in the leg, they found that the H-reflexes of these muscles in
the arm were also facilitated by VTC in a force-dependent manner (Takahashi et al. 2003).
There have also been several studies that have looked at H-reflexes in the hand. Many
of these studies have also used transcranial magnetic stimulation or brainstem magnetic
stimulation in an attempt to determine if VTC not only has an effect on the excitability of
motor neurons at the spinal level, but also could affect neuron pathways at a higher level.
Transcranial magnetic stimulation (TMS) can run either an anterior medial (AM) or posterior
lateral (PL) current to elicit what is called motor evoked potentials (MEPs) that can be
measured at a muscle. A similar technique can be used to make MEPs at the brainstem that
also can be measured in a muscle. In an effort to determine where along the neural axis that
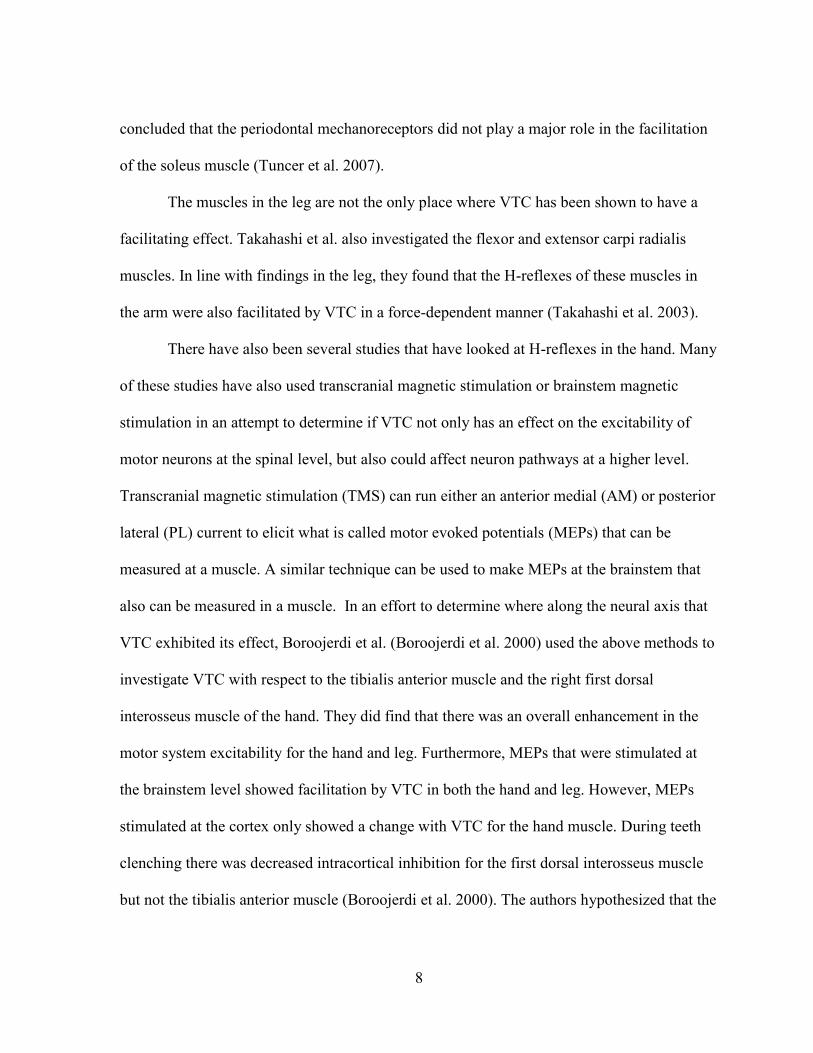
VTC exhibited its effect, Boroojerdi et al. (Boroojerdi et al. 2000) used the above methods to
investigate VTC with respect to the tibialis anterior muscle and the right first dorsal
interosseus muscle of the hand. They did find that there was an overall enhancement in the
motor system excitability for the hand and leg. Furthermore, MEPs that were stimulated at
the brainstem level showed facilitation by VTC in both the hand and leg. However, MEPs
stimulated at the cortex only showed a change with VTC for the hand muscle. During teeth
clenching there was decreased intracortical inhibition for the first dorsal interosseus muscle
but not the tibialis anterior muscle (Boroojerdi et al. 2000). The authors hypothesized that the
9
effect that VTC seems to have at the cortical level could be due to spill over from the face
area to the hand area of the motor cortex homunculus.
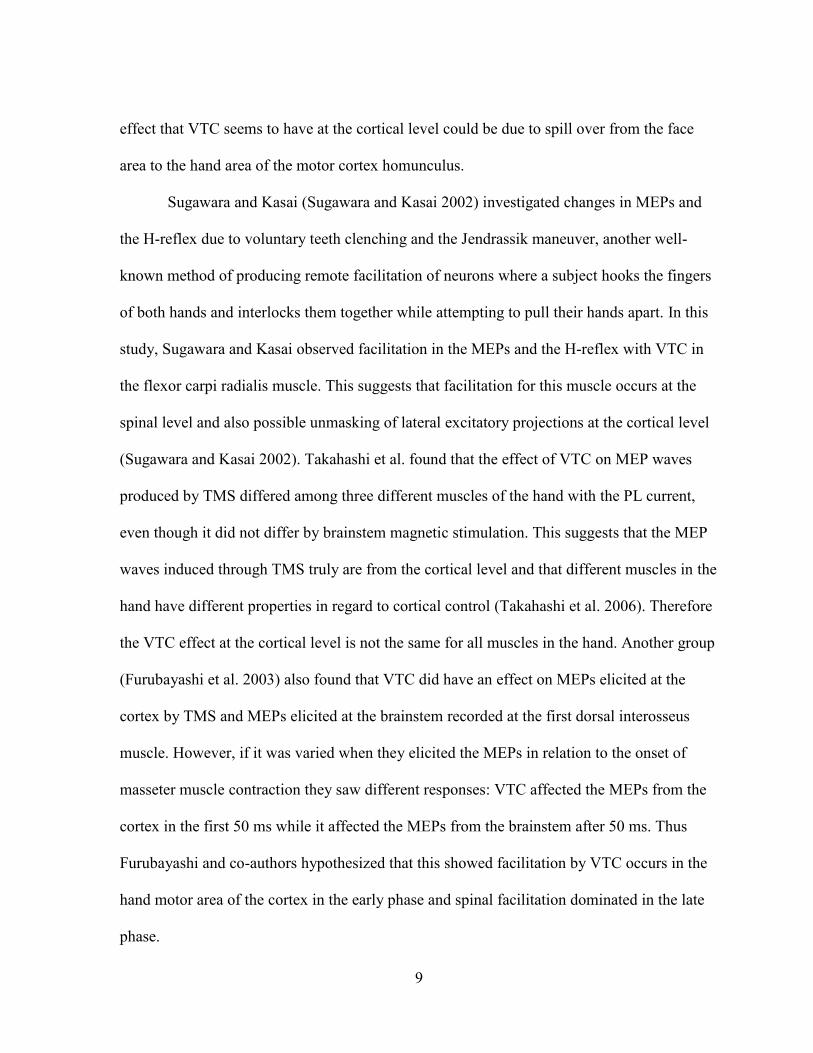
Sugawara and Kasai (Sugawara and Kasai 2002) investigated changes in MEPs and
the H-reflex due to voluntary teeth clenching and the Jendrassik maneuver, another well-
known method of producing remote facilitation of neurons where a subject hooks the fingers
of both hands and interlocks them together while attempting to pull their hands apart. In this
study, Sugawara and Kasai observed facilitation in the MEPs and the H-reflex with VTC in
the flexor carpi radialis muscle. This suggests that facilitation for this muscle occurs at the
spinal level and also possible unmasking of lateral excitatory projections at the cortical level
(Sugawara and Kasai 2002). Takahashi et al. found that the effect of VTC on MEP waves
produced by TMS differed among three different muscles of the hand with the PL current,
even though it did not differ by brainstem magnetic stimulation. This suggests that the MEP
waves induced through TMS truly are from the cortical level and that different muscles in the
hand have different properties in regard to cortical control (Takahashi et al. 2006). Therefore
the VTC effect at the cortical level is not the same for all muscles in the hand. Another group
(Furubayashi et al. 2003) also found that VTC did have an effect on MEPs elicited at the
cortex by TMS and MEPs elicited at the brainstem recorded at the first dorsal interosseus
muscle. However, if it was varied when they elicited the MEPs in relation to the onset of
masseter muscle contraction they saw different responses: VTC affected the MEPs from the
cortex in the first 50 ms while it affected the MEPs from the brainstem after 50 ms. Thus
Furubayashi and co-authors hypothesized that this showed facilitation by VTC occurs in the
hand motor area of the cortex in the early phase and spinal facilitation dominated in the late
phase.
10
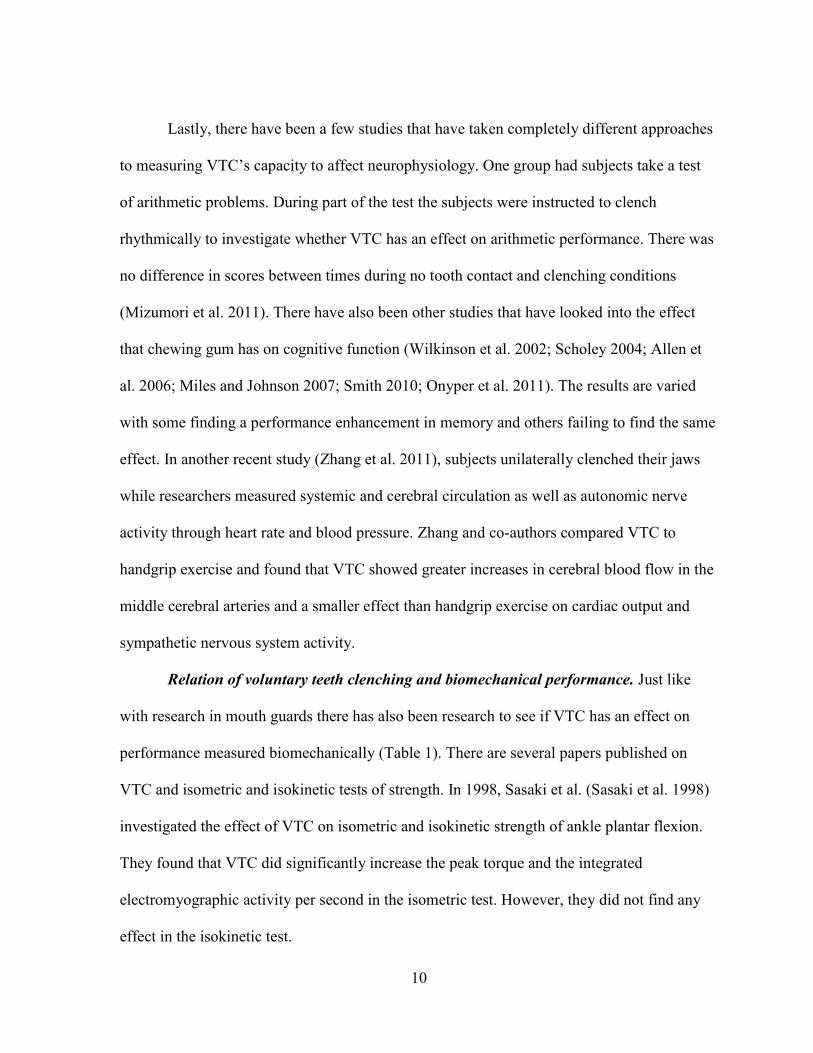
Lastly, there have been a few studies that have taken completely different approaches
to measuring VTC’s capacity to affect neurophysiology. One group had subjects take a test
of arithmetic problems. During part of the test the subjects were instructed to clench
rhythmically to investigate whether VTC has an effect on arithmetic performance. There was
no difference in scores between times during no tooth contact and clenching conditions
(Mizumori et al. 2011). There have also been other studies that have looked into the effect
that chewing gum has on cognitive function (Wilkinson et al. 2002; Scholey 2004; Allen et
al. 2006; Miles and Johnson 2007; Smith 2010; Onyper et al. 2011). The results are varied
with some finding a performance enhancement in memory and others failing to find the same
effect. In another recent study (Zhang et al. 2011), subjects unilaterally clenched their jaws
while researchers measured systemic and cerebral circulation as well as autonomic nerve
activity through heart rate and blood pressure. Zhang and co-authors compared VTC to
handgrip exercise and found that VTC showed greater increases in cerebral blood flow in the
middle cerebral arteries and a smaller effect than handgrip exercise on cardiac output and
sympathetic nervous system activity.
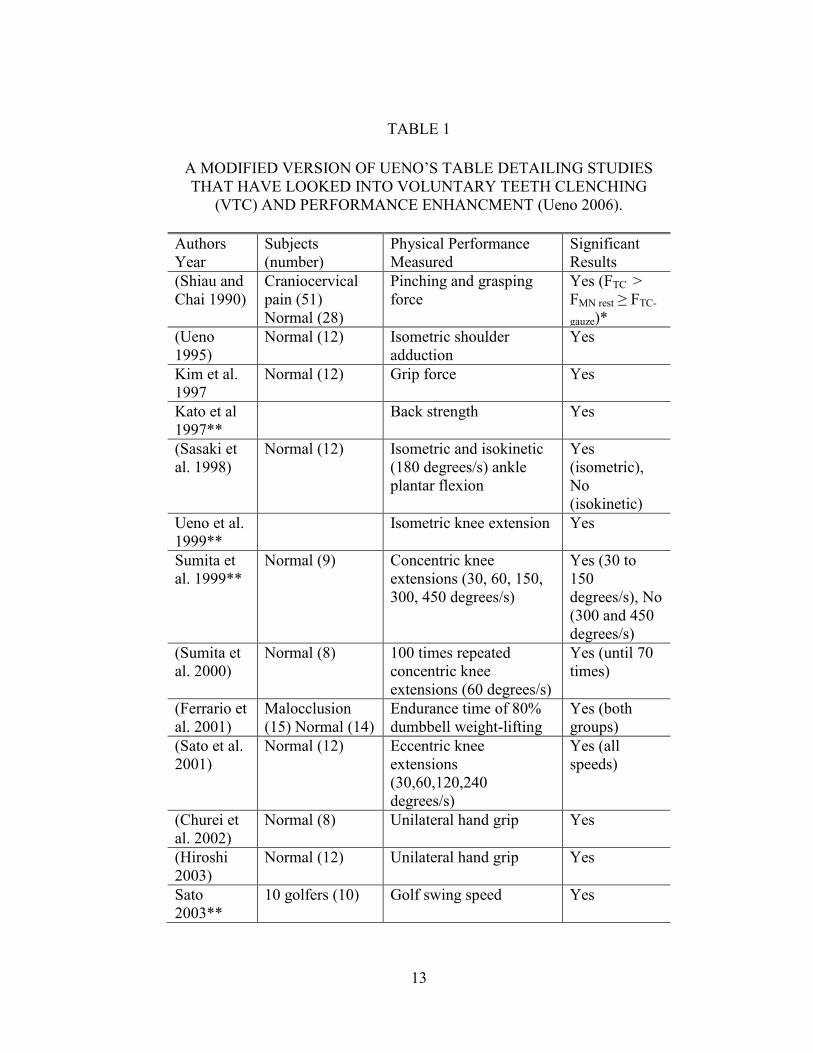
Relation of voluntary teeth clenching and biomechanical performance. Just like
with research in mouth guards there has also been research to see if VTC has an effect on
performance measured biomechanically (Table 1). There are several papers published on
VTC and isometric and isokinetic tests of strength. In 1998, Sasaki et al. (Sasaki et al. 1998)
investigated the effect of VTC on isometric and isokinetic strength of ankle plantar flexion.
They found that VTC did significantly increase the peak torque and the integrated
electromyographic activity per second in the isometric test. However, they did not find any
effect in the isokinetic test.
11
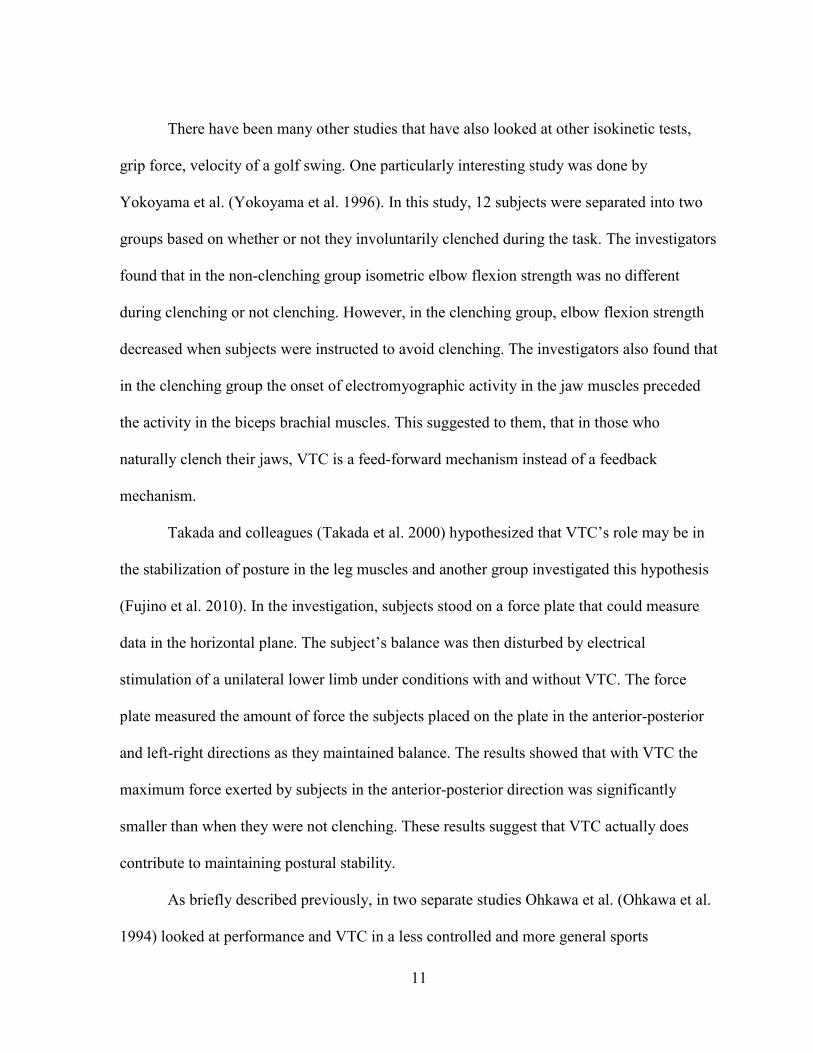
There have been many other studies that have also looked at other isokinetic tests,
grip force, velocity of a golf swing. One particularly interesting study was done by
Yokoyama et al. (Yokoyama et al. 1996). In this study, 12 subjects were separated into two
groups based on whether or not they involuntarily clenched during the task. The investigators
found that in the non-clenching group isometric elbow flexion strength was no different
during clenching or not clenching. However, in the clenching group, elbow flexion strength
decreased when subjects were instructed to avoid clenching. The investigators also found that
in the clenching group the onset of electromyographic activity in the jaw muscles preceded
the activity in the biceps brachial muscles. This suggested to them, that in those who
naturally clench their jaws, VTC is a feed-forward mechanism instead of a feedback
mechanism.
Takada and colleagues (Takada et al. 2000) hypothesized that VTC’s role may be in
the stabilization of posture in the leg muscles and another group investigated this hypothesis
(Fujino et al. 2010). In the investigation, subjects stood on a force plate that could measure
data in the horizontal plane. The subject’s balance was then disturbed by electrical
stimulation of a unilateral lower limb under conditions with and without VTC. The force
plate measured the amount of force the subjects placed on the plate in the anterior-posterior
and left-right directions as they maintained balance. The results showed that with VTC the
maximum force exerted by subjects in the anterior-posterior direction was significantly
smaller than when they were not clenching. These results suggest that VTC actually does
contribute to maintaining postural stability.
As briefly described previously, in two separate studies Ohkawa et al. (Ohkawa et al.
1994) looked at performance and VTC in a less controlled and more general sports
12
environment. In the first study they looked at kicking in six soccer players and found that
marked activity of four masticatory muscles (bilateral masseter and anterior temporalis
muscles) was shown in two of the subjects. In the second study when they looked at
volleyball and handball players (20 subjects total) they found marked EMG activity in these
same four masticatory muscles during spiking volleyballs and shooting handballs
respectively. In both studies the authors reported a positive correlation between masticatory
muscle activity and the strength and form of the kick, spike, or shot respectively.
13
TABLE 1
A MODIFIED VERSION OF UENO’S TABLE DETAILING STUDIES
THAT HAVE LOOKED INTO VOLUNTARY TEETH CLENCHING
(VTC) AND PERFORMANCE ENHANCMENT (Ueno 2006).
Authors
Year
Subjects
(number)
Physical Performance
Measured
Significant
Results
(Shiau and
Chai 1990)
Craniocervical
pain (51)
Normal (28)
Pinching and grasping
force
Yes (FTC >
FMN rest ≥ FTC-
gauze)*
(Ueno
1995)
Normal (12) Isometric shoulder
adduction
Yes
Kim et al.
1997
Normal (12) Grip force Yes
Kato et al
1997**
Back strength Yes
(Sasaki et
al. 1998)
Normal (12) Isometric and isokinetic
(180 degrees/s) ankle
plantar flexion
Yes
(isometric),
No
(isokinetic)
Ueno et al.
1999**
Isometric knee extension Yes
Sumita et
al. 1999**
Normal (9) Concentric knee
extensions (30, 60, 150,
300, 450 degrees/s)
Yes (30 to
150
degrees/s), No
(300 and 450
degrees/s)
(Sumita et
al. 2000)
Normal (8) 100 times repeated
concentric knee
extensions (60 degrees/s)
Yes (until 70
times)
(Ferrario et
al. 2001)
Malocclusion
(15) Normal (14)
Endurance time of 80%
dumbbell weight-lifting
Yes (both
groups)
(Sato et al.
2001)
Normal (12) Eccentric knee
extensions
(30,60,120,240
degrees/s)
Yes (all
speeds)
(Churei et
al. 2002)
Normal (8) Unilateral hand grip Yes
(Hiroshi
2003)
Normal (12) Unilateral hand grip Yes
Sato
2003**
10 golfers (10) Golf swing speed Yes
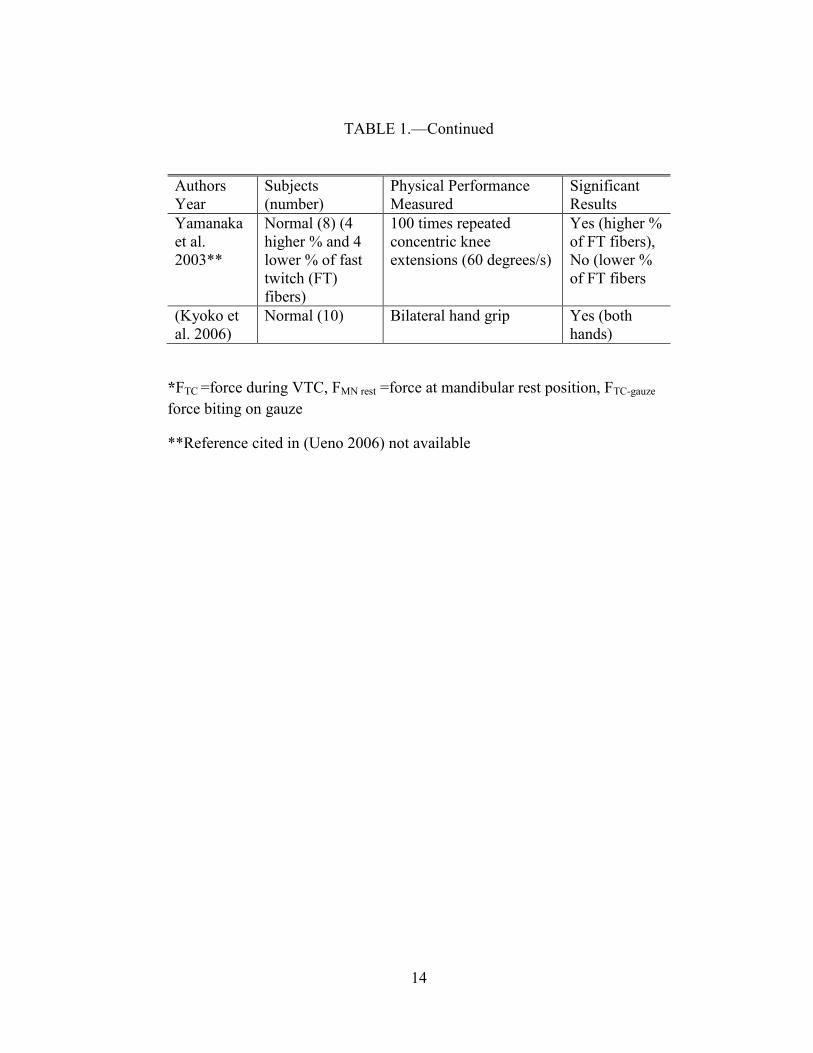
14
TABLE 1.—Continued
Authors
Year
Subjects
(number)
Physical Performance
Measured
Significant
Results
Yamanaka
et al.
2003**
Normal (8) (4
higher % and 4
lower % of fast
twitch (FT)
fibers)
100 times repeated
concentric knee
extensions (60 degrees/s)
Yes (higher %
of FT fibers),
No (lower %
of FT fibers
(Kyoko et
al. 2006)
Normal (10) Bilateral hand grip Yes (both
hands)
*FTC =force during VTC, FMN rest =force at mandibular rest position, FTC-gauze
force biting on gauze
**Reference cited in (Ueno 2006) not available
15
Relation between Mouth Guards and VTC
While some research has been devoted to understanding mouth guards and voluntary
teeth clenching in sports dentistry, there has been very little research to address the two
factors together. Is it possible that they could have an additive effect? Could VTC have a
confounding effect on mouth guard research? None of the studies on mouth guards and
performance enhancement reported whether there were instructions to clench or avoid
clenching. None of them reported if subjects clenched. Therefore it is difficult to know what,
if any, relationship clenching and performance enhancing mouth guards might have. As has
already been described above, during back strength tests a significant portion of the subjects
clenched while others did not have any teeth contact (Ishijima et al. 1991). Interestingly, in
the study previously described by Yokoyama and colleagues, significant differences in
strength were only found between clenching and not for those who were initially classified as
involuntary clenchers (Yokoyama et al. 1996). Another study investigated the soleus H-
reflex during maximum VTC in subjects who wore custom maxillary stabilization appliances
(or in other words, mouth guards) of differing materials. These researchers compared the H-
reflex of the soleus muscle in five subjects when the mandible was in a rest state, when
maximum VTC was performed, and when maximum VTC on hard and soft stabilization
appliances were performed. The results showed that there was were no significant differences
in soleus H-reflexes in subjects during maximum VTC without an appliance compared to
maximum VTC with a hard acrylic occlusal appliance. However, there were significant
differences in soleus H reflexes in subjects during maximum VTC compared to during
maximum VTC on a soft or very soft stabilization appliance. Clenching on soft and very soft
16
appliances increased the facilitation of the soleus H-reflex. There was also a positive
correlation (r= 0.67-0.86) between the soleus H-reflex amplitude and the amount of
masseteric EMG activity (Naka et al. 2004). One possibility to explain this relationship could
be that the softer appliances allowed the masseter muscle to increase its maximum clenching
activity which further affected the H-reflex. Other researchers have also looked at the use of
an interocclusal appliance and the activity of muscles via EMG (Visser et al. 1992; Roark et
al. 2003). While they did not compare the stiffness of the appliances used, they also found
that the activities of the masseter muscle during VTC with the appliance either remained the
same or increased compared to VTC without an interocclusal appliance. On the other hand, a
different study (Chandu et al. 2004) showed that an interocclusal appliance decreased EMG
activity of the master muscles during VTC, however these authors also reported that the use
of the appliance increased the measured biting force.
EMG
Moyers published the first study describing the use of EMG to study masticatory
muscles in 1949 (Moyers 1949). Since then EMG has become a common tool to study the
activities of head and neck muscles. Surface EMG has become particularly popular due to
the ease of use for the investigator and comfort for the subject. In fact, surface EMG is
actually preferred to indwelling electrodes since it has been shown to be more reliable
(Soderberg and Knutson 2000).
When investigating clenching and jaw muscle activity it is important to understand
which muscles are active during clenching. Rues et al. (Rues et al. 2008) investigated the
activities of several jaw muscles during directionally controlled pure vertical clenching and
during directionally uncontrolled clenching at different force levels. They compared EMG
17
activities of several muscles (masseter, anterior temporalis, posterior temporalis, anterior
digastric, medial pterygoid and lateral pterygoid) by normalizing the EMG activity as a
percentage of the activity from the same muscle during maximum voluntary clenching
(MVC%). They reported that during vertical clenching the most active muscles were the
anterior temporalis followed, in descending order, by the posterior temporalis, the masseter,
and the medial pterygoid. The other muscles showed only weak co-contractions. However,
during directionally uncontrolled clenching, which is how a subject clenches without specific
instructions, the anterior temporalis, posterior temporalis, masseter, medial pterygoid and
digastric muscles showed about the same amount of MVC%. Therefore, according to this
research any of these latter muscles of mastication could be considered candidates to use to
measure jaw muscle activity during clenching. Farella et al. (Farella et al. 2008) examined
masticatory muscle activities in 30 different computer guided oral tasks. They specifically
looked at the masseter, anterior temporalis, and suprahyoid muscles. Of these three muscle
groups they found that during maximum voluntary clenching the anterior temporalis and
masseter showed more activity than the suprahyoid muscles. The authors reported that the
maximum EMG amplitudes for the masseter and anterior temporalis muscles were more
often found during hard chewing tasks then during maximum clenching tasks. The relative
masseter and temporalis activities changed depending on the type of tasks. The masseter
muscles were significantly more active than the anterior temporalis muscles during tasks that
involved incisal biting, jaw protrusion, laterotrusion, and jaw cupping. On the other hand, the
anterior temporalis muscles were significantly more active than the masseter muscles during
tasks performed in intercuspal position, during tooth grinding, and during hard chewing on
the working side. Venegas et al. (Venegas et al. 2009) showed that there was significantly
18
more masseter activity during intercuspal clenching than during various eccentric jaw
grinding movements. Sternocleidomastoid activity was also apparent during intercuspal
clenching and was also significantly less during eccentric movements. Another group
(Ciuffolo et al. 2005) investigated maximum voluntary clenching and broadened their
protocol to include not only the anterior temporalis, masseter and digastric,
sternocleidomastoid, but the cervical, upper trapezius and lower trapezius muscles activities
as well. As expected the highest levels of EMG were in the masseter and anterior temporalis
muscles. Ciuffolo and co-workers showed that while there were significant increases in the
root mean squared (RMS) amplitudes of EMG from the sternocleidomastoid and digastric
muscles during clenching compared to a rest state, there were no significant differences
between rest and clenching states for RMS amplitudes from the cervical, upper trapezius and
lower trapezius muscles. In another study (Naeije et al. 1989), anterior temporalis and
masseter EMG were studied at 10, 20, 30, 40, and 50% of maximum clenching. At low levels
of clenching the temporalis muscle tended to dominate, but at higher levels the masseter
muscle activity was relatively higher.
There are also several factors that can affect EMG from the muscles of mastication
during VTC. Some of these factors are based on jaw position during clenching. For example,
it has been reported that temporalis muscle activity decreases with increased vertical
dimension (Visser et al. 1992). A decrease in muscle activity with increased vertical
dimension has been shown to occur for the masseter muscle as well (Wang et al. 2007).
Clenching at different positions in a lateral eccentric position can also affect EMG from the
masseter and temporalis muscles (Uchida et al. 2008; Gutierrez et al. 2010). Lobbezoo et al.
(Lobbezoo and Huddleston Slater 2002) hypothesized that some of the variability in seen in
19
EMG during subsequent submaximal clenching could be due to differences in mandibular
positioning. They found that up to 25% of the variance in the indices that quantify the
relative contribution of the jaw closing muscles to the total clenching effort was attributable
to mandibular positioning.
Mandibular positioning during clenching is not the only factor that affects EMG from
the masticatory muscles. Several other things can affect an EMG reading including, electrode
placement over the muscle, subject’s body posture, psychological factors, the training of the
operator and interelectrode distance (Castroflorio et al. 2008). Lobbezoo et al. also reported
that visual feedback of the EMG activity can also affect muscle activity and which muscles
contribute more or less to the clenching (Lobbezoo et al. 1993). However Castroflorio and
co-authors have shown that with attention to detail in protocols, surface EMG reproducibility
is acceptable and also suggest that increasing the distance between electrodes from the
standard 20 to 30 mm may help increase reliability (Castroflorio et al. 2005; Castroflorio et
al. 2006). Gonzalez et al. (Gonzalez et al. 2011) investigated the reliability of surface
electromyography of the masticatory muscles versus bite force relations using intraclass
coefficients (ICCs) ≥0.60 as an indicator to see if these relations could be used as acceptable
research tools. They found that for a range of incisor and molar biting positions the ICCs for
the ipsilateral and contralateral temporalis muscles were 0.56-0.93 and 0.34-0.91
respectively, while for the masseter muscle were 0.65-0.86 and 0.59-0.88, respectively, and
for the suprahyoid muscles were 0.07-0.60 and -0.33-0.67, respectively . They concluded that
slopes of the EMG activity versus bite force for a given situation were mostly reliable for the
temporalis and masseter but not the suprahyoid muscles.
20
Duty Factor
One method to compare muscle activities measured by EMG is by comparing the
duty time or duty factor. The duty factor of a muscle is defined as the amount of time a
muscle is active divided by the total amount of recording time. Therefore, if an EMG
threshold is set to define what constitutes an active muscle then duty factor (duration of
muscle activity/total recording time, %) can be defined for that threshold. This method for
quantifying and comparing muscle activity has been used in research successfully in rats,
rabbits and most recently in human subjects investigating jaw muscle activities (Kawai et al.
2007; Grunheid et al. 2010; Nickel et al. 2013).
Gender Differences
Women and men exhibit a few differences in muscle characteristics and strength. For
example, it has been reported in two separate studies that the absolute strength of
appendicular extremities of women is about 52-66% and 42.2 to 62.8% that of men (Frontera
et al. 1991; Miller et al. 1993). However, it has also been shown that the muscles in the arms
and legs in women tend to have a smaller cross sectional area than in men (Kanehisa et al.
1994). Therefore when generally speaking of the appendicular musculature the difference in
strength between men and women is usually attributed to an increased muscle mass or to
increased muscle fiber size in men compared to women (Frontera et al. 1991; Miller et al.
1993). When strength was adjusted for the cross sectional area of a muscle, a person’s fat-
free mass (estimated by hydrostatic weighing), or a person’s muscle mass (estimated by
creatine excretion), the gender differences in strength got much smaller or disappeared
(Frontera et al. 1991; Miller et al. 1993).
21
Some of these same gender differences seem to apply to the masseter muscle as well.
Waltimo and Kononen (Waltimo and Kononen 1993) reported that the mean maximal bite
force in the molar region for men was 847 Newtons and 597 Newtons for women. Tuxen et
al. reported (Tuxen et al. 1999) that the greater bite force in men than women was related to
the greater diameter and cross sectional area of type II fibers in the masseter muscle. There
are also gender differences in clenching. It was reported that at all clenching levels
temporalis muscle activity dominated in women while in men it was the opposite with
masseter muscle activity being stronger during clenching (Ferrario et al. 1993).
Research on general skeletal muscle fatigue has suggested that there may be evidence
that women may have greater fatigue resistance (Hicks et al. 2001). There is further research
that extends this thinking to the masticatory muscles as well. In an experiment (Torisu et al.
2006) men and women were asked to sustain low-level clenching for 30 minutes. After this
period the visual analog scores for fatigue were significantly higher for men than women.
This is interesting considering that after the clenching period the resting masseter EMG
appeared to be higher in women than men.
Even though women may exhibit some resistance to muscle fatigue compared to men,
as a group they still have more than their fair share of the burden when it comes to
temporomandibular disorders (TMDs). Women are 1.5-2 times more likely to be affected by
a temporomandibular disorder than men (Maixner et al. 2011) and may be 3 times more
likely to experience myofacial pain (MFP)(Velly et al. 2003) Some studies which identify
gender as a contributing factor to TMD or MFP also identify self-reported bruxism (Mundt et
al. 2005; Casanova-Rosado et al. 2006; Winocur et al. 2006; Nekora-Azak et al. 2010) and
self-reported clenching (Velly et al. 2003; Aydin et al. 2004) as increased risk factors.
22
Comparatively, much of the data on bruxism and TMD are self-reported and actual
quantitative studies showed a much lower association between bruxism and TMD
(Manfredini and Lobbezoo 2010). One study that did have quantitative data even reported
that men had higher mean levels of bruxism (Watanabe et al. 2003). There are no quantitative
data that were not self-reported which could be found on clenching habits and gender
differences.
As was mentioned earlier, Plesh et al. (Plesh et al. 1998) reported a possible gender
difference in jaw pain induced by jaw clenching. As a part of this study protocol seven male
and seven female subjects were instructed to perform various clenching tasks. The next day
they found that only females presented with an increased overall pain level and significant
decrease in pain-free jaw opening compared to their own baseline before clenching tasks.
This may be due to gender differences in clenching or pain perception. In a study that tested
pain and touch perception after voluntary clenching for 1 minute the results showed several
gender differences (Okayasu et al. 2009). Women had higher pain sensitivity after clenching
and exhibited a larger increase in the tactile detection threshold.
Problem Statement
The objective of this research was to understand jaw musculature function during
strenuous exercise in males and females. The main focus will be jaw clenching during
exercise measured by activities of the masseter and anterior temporalis muscles through
EMG. The primary goal is to establish that VTC does occur during exercise in a subject’s
natural environment. Furthermore, the aim is to investigate the prevalence of jaw clenching
in males compared to females during exercise both in the laboratory and in a natural
environment.
23
Hypotheses
1. All athletes will exhibit VTC during physical exercise.
2. There will be significant differences in duty factor of VTC between male and female
athletes during strenuous physical exercise.
24
CHAPTER 2
MATERIALS AND METHODS
The protocol for this study was submitted to and approved by the University of
Missouri at Kansas City (UMKC) Adult Health Sciences Institutional Review Board
(Appendix 1). The study was a pilot study with a convenience sample of subjects comprised
of volunteers from the general UMKC student body.
Experimental Design
The study was a multifactorial, parallel group, non-blinded, non-therapeutic
prospective study. Gender was the primary independent factor in this study. Besides gender
the other independent factors were the muscle group (masseter or temporalis), the activity
(leg extensions or general weight-lifting exercises), and the threshold values for clenching
magnitude. The dependent variable in the study was the duty factor (time of muscle
activity/time of recording) of the masseter and temporalis muscles during exercise.
Subjects
Subjects were recruited from the UMKC student body and specifically from the
UMKC men’s and women’s soccer programs. Invitees were individuals who met the
following criteria: 1) were willing to complete all aspects of the study, 2) were relatively
symmetrical in terms of the bilateral positions of the dentition and muscles of mastication, 3)
anatomy could accommodate the research devices and materials used, 4) all first molar,
canine, and incisor teeth were present and 5) no aspect of the medical history contraindicated
routine dental procedures. Individuals with: a history of diagnosed musculoskeletal disease
(e.g. fibromyalgia, muscular dystrophy) or frank trauma to the TMJ; inability to read;
25
inability to follow auditory and visual commands; or were not able to meet the inclusion
criteria were not included in the study.
Experimental Protocol
All subjects participated in a screening visit and two laboratory visits to complete the
study before and after ambulatory EMG self- recordings. At the screening visit subjects were
recruited and given a written informed consent along with verbal explanations of what was
expected to participate in the study. They were also screened for participation by use of the
Clinical Exam Form (Appendix 2). If subjects agreed to participate they began by signing the
Informed Consent Form (Appendix 3) and Health Insurance and Portability and
Accountability Act (HIPAA) form (Appendix 4).
There were two laboratory visits and two field recording sessions. The first laboratory
visit was used to perform biting tasks to calibrate EMG recordings for each individual,
perform leg exercise tasks while recording EMG data, and instruct the subjects on the use of
ambulatory EMG recorders for field recordings. This first visit generally took about an hour
and a half. The subject then used the ambulatory EMG recorder to record during two
different field sessions on different days. Each of the field sessions had two parts. The first
part was for the subject to repeat the leg extension exercises performed in the laboratory and
the second part was to record during their usual weight-lifting exercise routine of their
choice. The only restriction was no gum chewing. There were no restrictions as to the type of
weight-lifting exercises for the second part of the recording session. After the field
recordings were completed the subject returned for the second laboratory visit to repeat the
26
standard biting tasks and leg exercise tasks and return the ambulatory EMG recorder and
data. This second laboratory visit took about one hour to complete.
Laboratory Visit #1
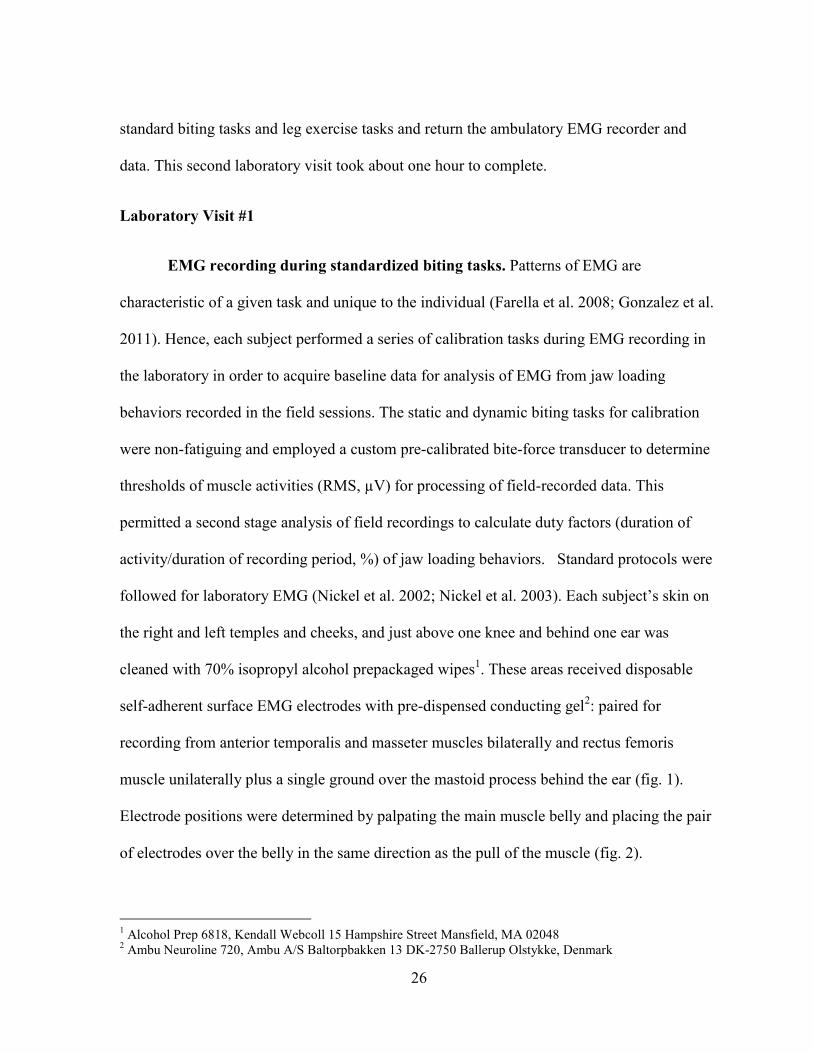
EMG recording during standardized biting tasks. Patterns of EMG are
characteristic of a given task and unique to the individual (Farella et al. 2008; Gonzalez et al.
2011). Hence, each subject performed a series of calibration tasks during EMG recording in
the laboratory in order to acquire baseline data for analysis of EMG from jaw loading
behaviors recorded in the field sessions. The static and dynamic biting tasks for calibration
were non-fatiguing and employed a custom pre-calibrated bite-force transducer to determine
thresholds of muscle activities (RMS, µV) for processing of field-recorded data. This
permitted a second stage analysis of field recordings to calculate duty factors (duration of
activity/duration of recording period, %) of jaw loading behaviors. Standard protocols were
followed for laboratory EMG (Nickel et al. 2002; Nickel et al. 2003). Each subject’s skin on
the right and left temples and cheeks, and just above one knee and behind one ear was
cleaned with 70% isopropyl alcohol prepackaged wipes1. These areas received disposable
self-adherent surface EMG electrodes with pre-dispensed conducting gel2: paired for
recording from anterior temporalis and masseter muscles bilaterally and rectus femoris
muscle unilaterally plus a single ground over the mastoid process behind the ear (fig. 1).
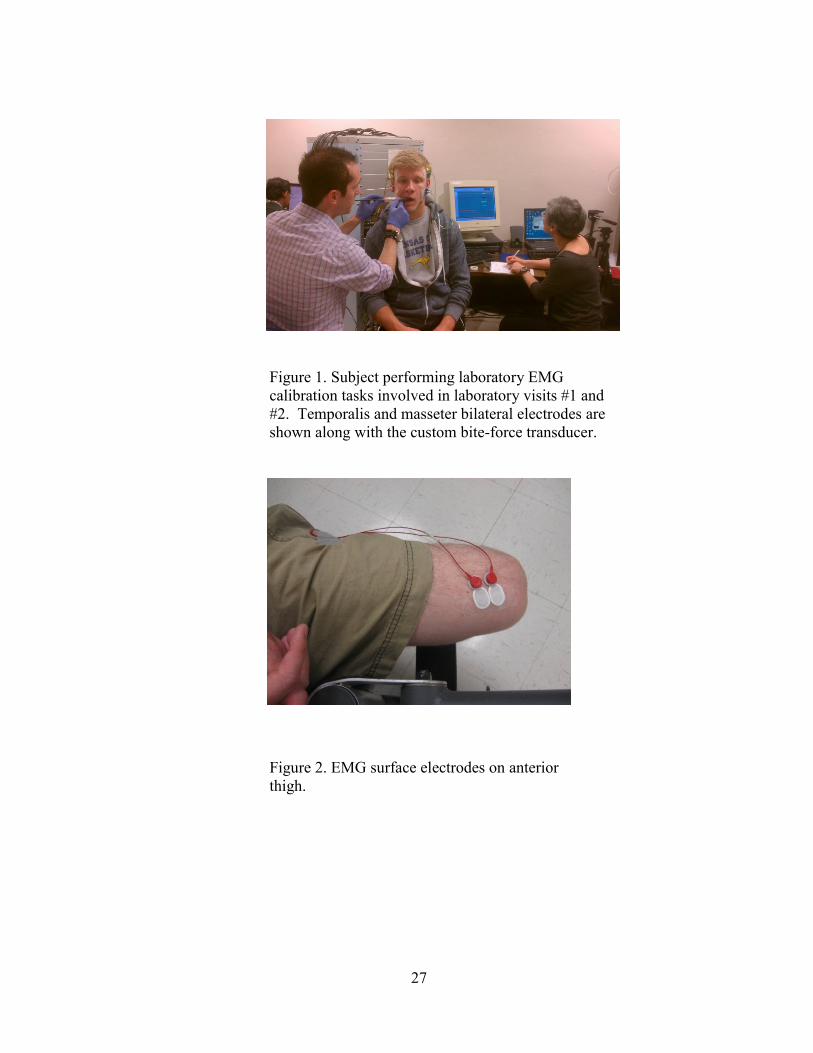
Electrode positions were determined by palpating the main muscle belly and placing the pair
of electrodes over the belly in the same direction as the pull of the muscle (fig. 2).
1 Alcohol Prep 6818, Kendall Webcoll 15 Hampshire Street Mansfield, MA 02048
2 Ambu Neuroline 720, Ambu A/S Baltorpbakken 13 DK-2750 Ballerup Olstykke, Denmark
27
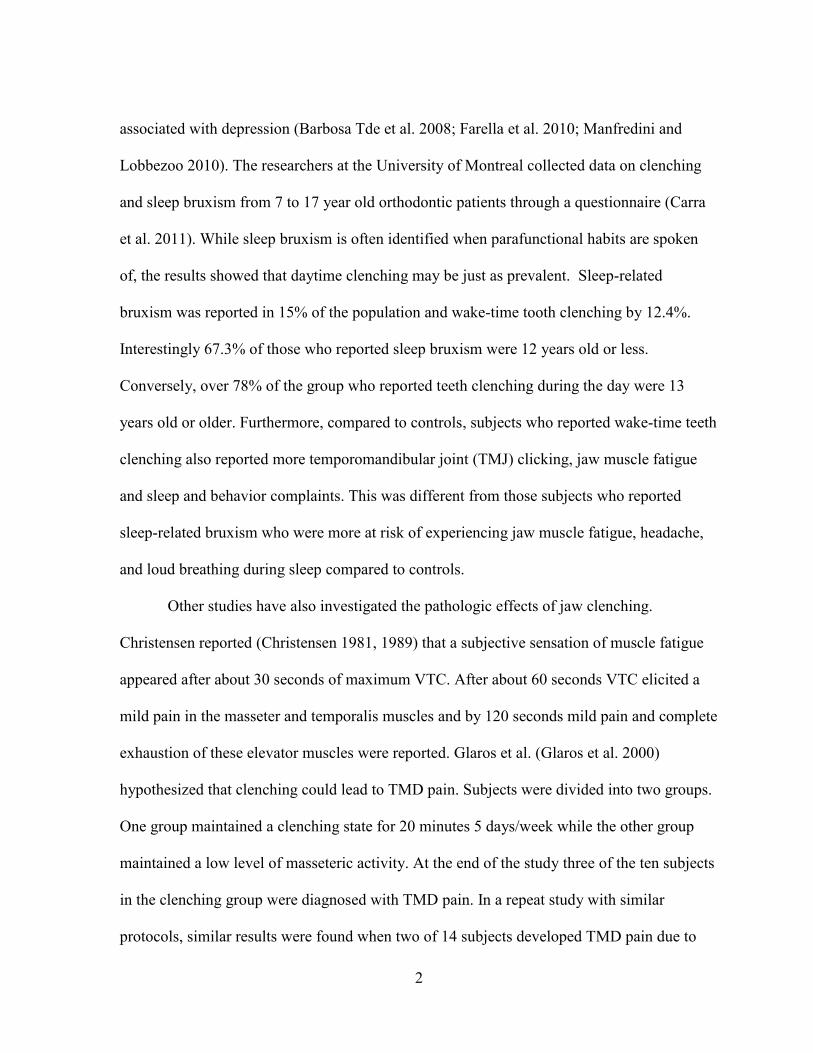
Figure 1. Subject performing laboratory EMG
calibration tasks involved in laboratory visits #1 and
#2. Temporalis and masseter bilateral electrodes are
shown along with the custom bite-force transducer.
Figure 2. EMG surface electrodes on anterior
thigh.
28
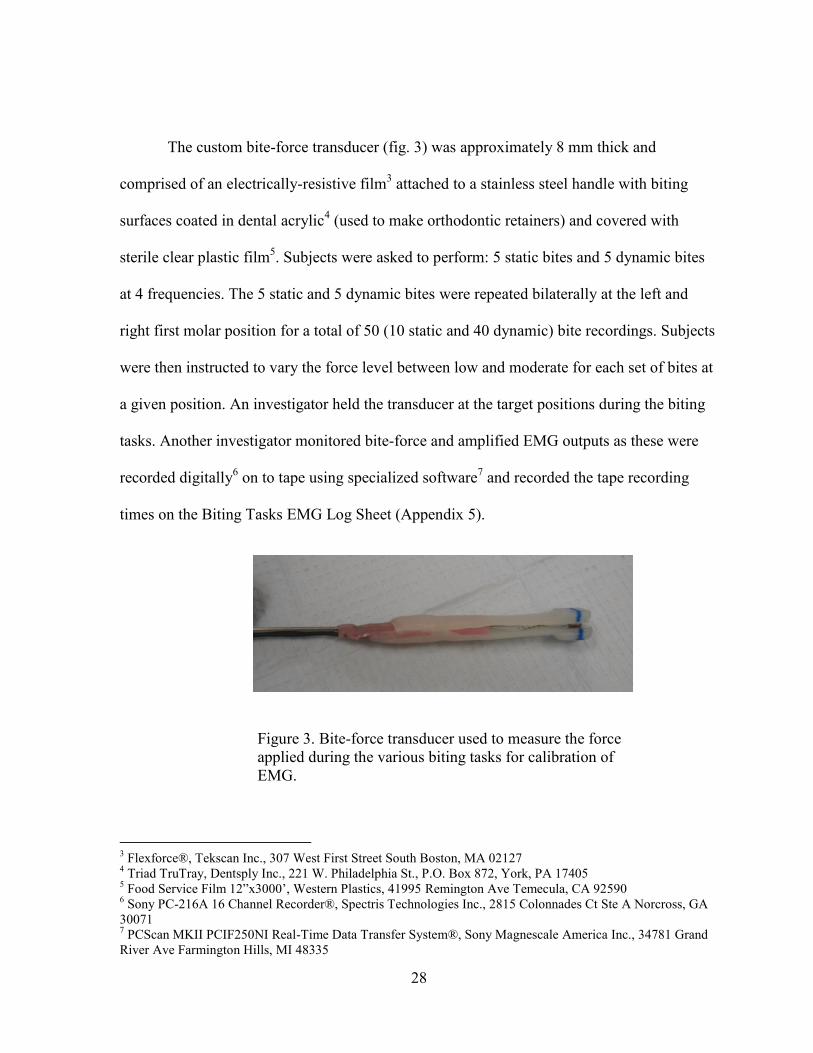
The custom bite-force transducer (fig. 3) was approximately 8 mm thick and
comprised of an electrically-resistive film3 attached to a stainless steel handle with biting
surfaces coated in dental acrylic4 (used to make orthodontic retainers) and covered with
sterile clear plastic film5. Subjects were asked to perform: 5 static bites and 5 dynamic bites
at 4 frequencies. The 5 static and 5 dynamic bites were repeated bilaterally at the left and
right first molar position for a total of 50 (10 static and 40 dynamic) bite recordings. Subjects
were then instructed to vary the force level between low and moderate for each set of bites at
a given position. An investigator held the transducer at the target positions during the biting
tasks. Another investigator monitored bite-force and amplified EMG outputs as these were
recorded digitally6 on to tape using specialized software
7 and recorded the tape recording
times on the Biting Tasks EMG Log Sheet (Appendix 5).
Figure 3. Bite-force transducer used to measure the force
applied during the various biting tasks for calibration of
EMG.
3 Flexforce®, Tekscan Inc., 307 West First Street South Boston, MA 02127
4 Triad TruTray, Dentsply Inc., 221 W. Philadelphia St., P.O. Box 872, York, PA 17405
5 Food Service Film 12”x3000’, Western Plastics, 41995 Remington Ave Temecula, CA 92590
6 Sony PC-216A 16 Channel Recorder®, Spectris Technologies Inc., 2815 Colonnades Ct Ste A Norcross, GA
30071 7 PCScan MKII PCIF250NI Real-Time Data Transfer System®, Sony Magnescale America Inc., 34781 Grand
River Ave Farmington Hills, MI 48335
29
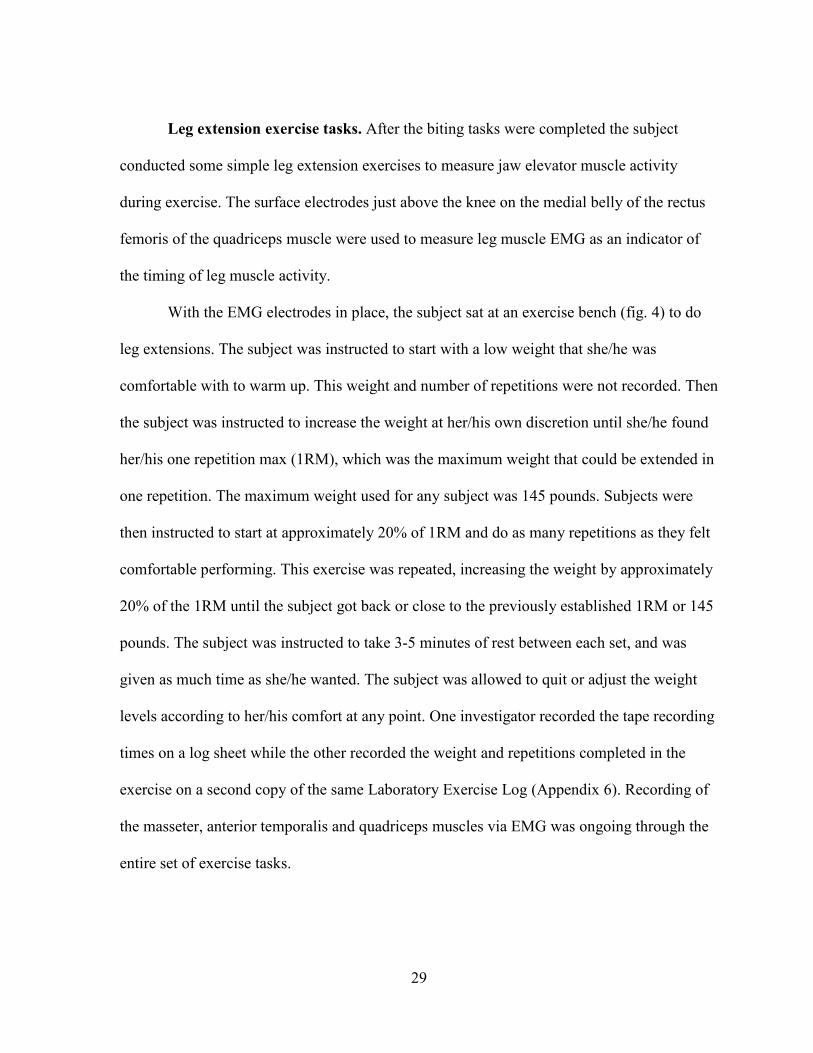
Leg extension exercise tasks. After the biting tasks were completed the subject
conducted some simple leg extension exercises to measure jaw elevator muscle activity
during exercise. The surface electrodes just above the knee on the medial belly of the rectus
femoris of the quadriceps muscle were used to measure leg muscle EMG as an indicator of
the timing of leg muscle activity.
With the EMG electrodes in place, the subject sat at an exercise bench (fig. 4) to do
leg extensions. The subject was instructed to start with a low weight that she/he was
comfortable with to warm up. This weight and number of repetitions were not recorded. Then
the subject was instructed to increase the weight at her/his own discretion until she/he found
her/his one repetition max (1RM), which was the maximum weight that could be extended in
one repetition. The maximum weight used for any subject was 145 pounds. Subjects were
then instructed to start at approximately 20% of 1RM and do as many repetitions as they felt
comfortable performing. This exercise was repeated, increasing the weight by approximately
20% of the 1RM until the subject got back or close to the previously established 1RM or 145
pounds. The subject was instructed to take 3-5 minutes of rest between each set, and was
given as much time as she/he wanted. The subject was allowed to quit or adjust the weight
levels according to her/his comfort at any point. One investigator recorded the tape recording
times on a log sheet while the other recorded the weight and repetitions completed in the
exercise on a second copy of the same Laboratory Exercise Log (Appendix 6). Recording of
the masseter, anterior temporalis and quadriceps muscles via EMG was ongoing through the
entire set of exercise tasks.
30
Figure 4. Subject wearing EMG electrodes is seated at
exercise bench.
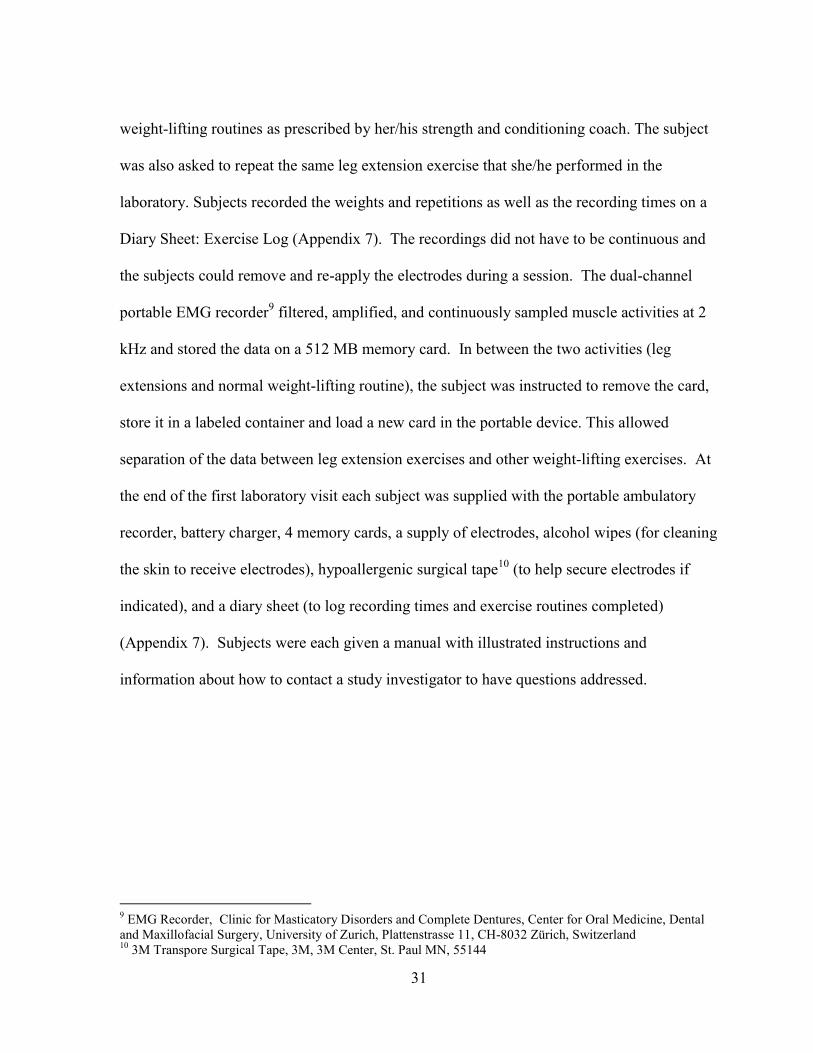
Preparation and instruction for field recordings. Next each subject was prepared
to carry out self-recordings in the field using ambulatory EMG equipment during exercise
(fig. 5). This was accomplished through verbal, visual, and written instructions in order to
ensure the subject was competent to apply five disposable, single-use surface electrodes8 to
one side of the head and use the portable EMG recorder. For field recordings, the subject
was instructed to place one pair of electrodes on the masseter and one pair on the anterior
temporalis muscles, and a ground electrode over the mastoid area. They were allowed to
choose to record from the right or left side as long as it was consistent between the two
sessions. Each subject was asked to make field recordings of activities from 2 muscles
(masseter and anterior temporalis) on the same side during two different days of normal
8 Pre-Gelled Disposable Surface Electrodes, Alpine Biomed ApS Tonsbakken 16-18 DK-2740 Skovlunde
Denmark
31
weight-lifting routines as prescribed by her/his strength and conditioning coach. The subject
was also asked to repeat the same leg extension exercise that she/he performed in the
laboratory. Subjects recorded the weights and repetitions as well as the recording times on a
Diary Sheet: Exercise Log (Appendix 7). The recordings did not have to be continuous and
the subjects could remove and re-apply the electrodes during a session. The dual-channel
portable EMG recorder9 filtered, amplified, and continuously sampled muscle activities at 2
kHz and stored the data on a 512 MB memory card. In between the two activities (leg
extensions and normal weight-lifting routine), the subject was instructed to remove the card,
store it in a labeled container and load a new card in the portable device. This allowed
separation of the data between leg extension exercises and other weight-lifting exercises. At
the end of the first laboratory visit each subject was supplied with the portable ambulatory
recorder, battery charger, 4 memory cards, a supply of electrodes, alcohol wipes (for cleaning
the skin to receive electrodes), hypoallergenic surgical tape10
(to help secure electrodes if
indicated), and a diary sheet (to log recording times and exercise routines completed)
(Appendix 7). Subjects were each given a manual with illustrated instructions and
information about how to contact a study investigator to have questions addressed.
9 EMG Recorder, Clinic for Masticatory Disorders and Complete Dentures, Center for Oral Medicine, Dental
and Maxillofacial Surgery, University of Zurich, Plattenstrasse 11, CH-8032 Zürich, Switzerland 10
3M Transpore Surgical Tape, 3M, 3M Center, St. Paul MN, 55144
32
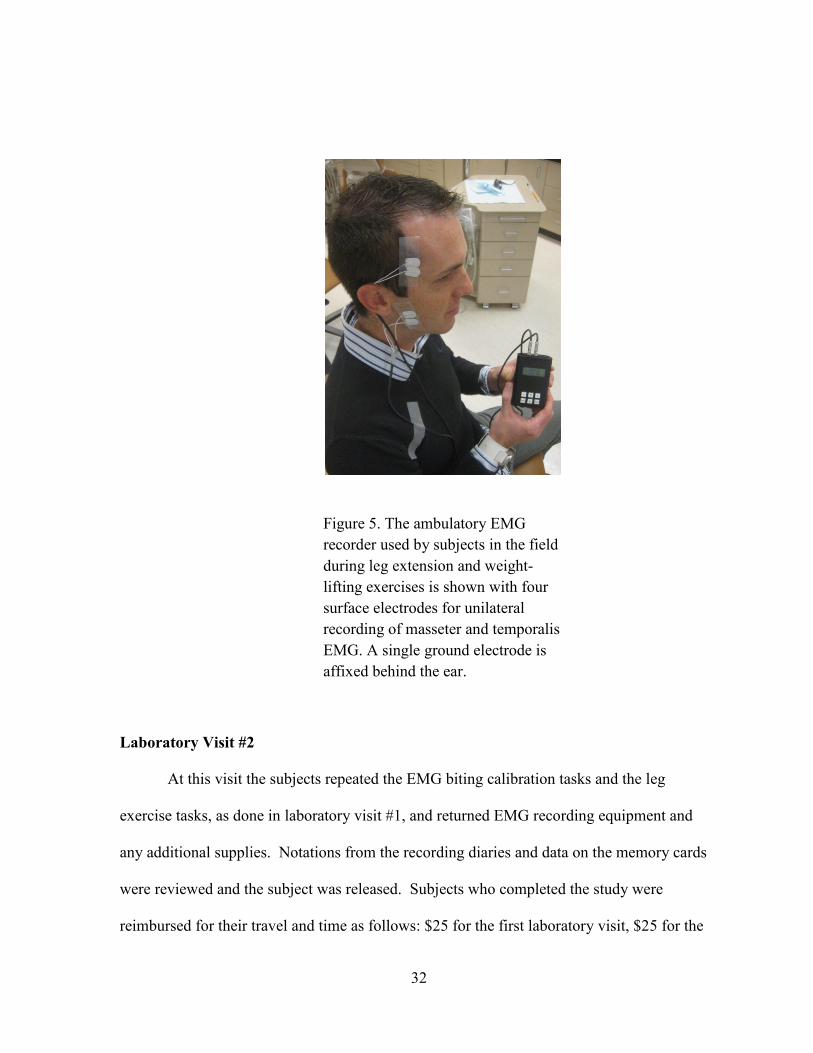
Figure 5. The ambulatory EMG
recorder used by subjects in the field
during leg extension and weight-
lifting exercises is shown with four
surface electrodes for unilateral
recording of masseter and temporalis
EMG. A single ground electrode is
affixed behind the ear.
Laboratory Visit #2
At this visit the subjects repeated the EMG biting calibration tasks and the leg
exercise tasks, as done in laboratory visit #1, and returned EMG recording equipment and
any additional supplies. Notations from the recording diaries and data on the memory cards
were reviewed and the subject was released. Subjects who completed the study were
reimbursed for their travel and time as follows: $25 for the first laboratory visit, $25 for the
33
second laboratory visit, and $100 for returning usable data from the two self-recording field
sessions.
Data Analysis
Behavioral Data Analysis (EMG Recordings)
The objective of recording and analyzing laboratory behaviors in subjects was to
quantify the duty factor (duration of muscle activity/duration of recording period, %) of
loading of the mandible by the masseter and temporalis muscles. The occurrence of static
and rhythmic masticatory muscle loading of the mandible in the natural environment was
quantified with respect to duration and magnitude using portable ambulatory EMG
equipment, custom programs in commercial software packages, and subject-specific data
from laboratory EMG recorded during the calibration tasks performed at Visits 1 and 2. The
behavioral data analysis to quantify duty factors for two jaw muscles (masseter and
temporalis) and two field activities (leg extensions and normal weight-lifting exercises)
consisted of 3 components:
Determination of average RMS EMG for a 20 N occlusal force (T20NAve, µV)
for each subject using laboratory EMG from calibration biting tasks.
Processing of field EMG recordings to filter out noise and to identify poor
recordings to be excluded.
Calculation of muscle duty factors during field recordings for thresholds of
magnitude.
34
Determination of T20NAve. The raw data from the laboratory visits were processed
by use of a customized software program11
that required several steps. Since each bite-force
transducer had unique sensitivity, the program first required the input of the previously
determined equation for the specific bite-force transducer (transducer specific calibration
curve) which was used during the biting tasks. The raw laboratory data were then sectioned
into the static biting tasks and the four dynamic biting tasks at each of the four different
frequencies. Next the program asked for the user to define five individual points on the bite-
force transducer line in each of the five sections for a total of 25 total data points. The
program then used the equation given for the transducer to calculate the biting force in
Newtons (N) for the 25 points and gave the four RMS microvolt values (one for each of the
masticatory muscles) that corresponded to each of the 25 points. This comma separated value
file was then placed in an excel spreadsheet template that created the linear regression for
each masticatory muscle for that specific lab visit and right or left side. These linear
regressions related the RMS EMG (μV) output from a muscle to biting force (N).
Repeating this sequence to process the raw data yielded 16 linear regression relations
for each subject. Specifically this was due to data plotted for four muscles (right and left
masseter, right and left temporalis) while biting on each of two sides (left and right), for each
of two lab visits.
For each subject the linear regressions were used to calculate the RMS EMG (μV)
output for biting at a force of 20 N. These values were defined as the T20N values. Then for
each subject the 16 T20N values were split into temporalis and masseter groups. The average
for each group was calculated from the eight T20N values. This created a T20NAve for the
11
MATLAB version 7.9.0.529 (R2009b) by The MathWorks, Inc.
35
temporalis muscle and for the masseter muscle for each subject. The data could have been
further split up into a T20NAve for the left and right side, but it was decided to average the
two sides since clenching is most often in a centric position and not unilateral as were the
bite tests. It was these T20NAve values that were then used to set the five thresholds for
magnitude of EMG activity (5%, 10%, 25%, 50% and 80%●T20NAve) that were muscle- and
individual-specific for analyzing the ambulatory data.
Processing of field EMG recordings. Commercial signal editing software12
was
used to first view the EMG field recordings completed by subjects during leg extension and
weight-lifting exercises. A recording was excluded for one of two reasons. First if a
recording had too much noise throughout the recording it was excluded. Secondly, if a
muscle recording had absolutely no evidence of electrical activity from muscles it was also
excluded. The same signal editing software was then used to filter out any low level noise, in
the range of 40 to 20 db.The multiband noise gate function was employed and could be
applied to the whole recording if there was a consistent low level noise throughout both
channels. Alternatively, the software had the capability to apply a different level of filtration
to the separate masseter and temporalis muscle channels or to filter a specific portion of a
recording. All recordings were filtered to at least the minimum of 40 db to remove any
possible low level noise.
Calculation of duty factors. Software task definers were set-up using the
customizable software programs13
to calculate duty factors for the selected EMG thresholds
of magnitude (5%, 10%, 25%, 50% and 80%%●T20NAve) and duration greater than one
12
WavePad Sound Editor Masters Edition version 5.48 by NCH Software 13
MATLAB version 7.9.0.529 (R2009b) by The MathWorks, Inc.
36
second from the processed ambulatory EMG recorded by the subject in the field. That is, the
subject- and muscle-specific T20NAve was applied to calculate duty factors for the magnitude
thresholds for the two types of EMG field recordings, during leg extensions and during
weight-lifting exercises. The calculated duty factors were used to test for significant
differences between the independent factors muscle (masseter, temporalis), gender (male,
female), and exercise (leg extension, weight-lifting).
Statistical Analysis
Three two-way ANOVAs were used to investigate the interaction between exercise
and muscle, between gender and muscle, and between gender and exercise by holding
constant gender, exercise and muscle respectively. This was followed-up with a simple T-test
to detect whether gender was significant or not by keeping other factors (threshold, exercise
and muscle) constant. Similar T-tests were applied to detect if there were significant
differences between muscles for a given threshold, gender and exercise and between
exercises for a given threshold, gender and muscle. As a next step, a Bonferroni correction
was applied (0.05/4). The new significance level, α, was set at 0.0125.
Effect sizes (using partial Eta squared) and statistical power were also calculated for
duty factor with regard to the effect of gender and type of exercise. Lastly, the combination
of gender, threshold and exercise that resulted in the smallest effect size was used to calculate
the minimum number of subjects that would be required in a future study to find a significant
difference with reasonable confidence.
37
CHAPTER 3
RESULTS
Summary
A total of 17 student athletes were recruited from the women’s and men’s soccer
programs at the University of Missouri at Kansas City. There were ten females (subject
numbers: 1-5, 10-12, 15) and seven males (subject numbers: 6-9, 13, 14, 17) who
participated in the study. The females were all between the ages of 19 to 20 years old and had
a mean age of 19 years with a standard deviation of 0 years. The male subjects ranged from
18 to 23 years old and had a mean age of 20 years with a standard deviation of 2 years.
Laboratory EMG Recordings
All of the subjects except subject number 17 completed the two laboratory sessions of
standardized biting (figs. 6 and 7) and leg exercise tasks. All subjects, including subject
number 17, completed field recordings of the EMG activities of a temporalis and masseter
muscle on one side during two sessions of leg extension and weight-lifting exercises. Subject
number 17 completed all study protocols except Laboratory Visit #2.
38
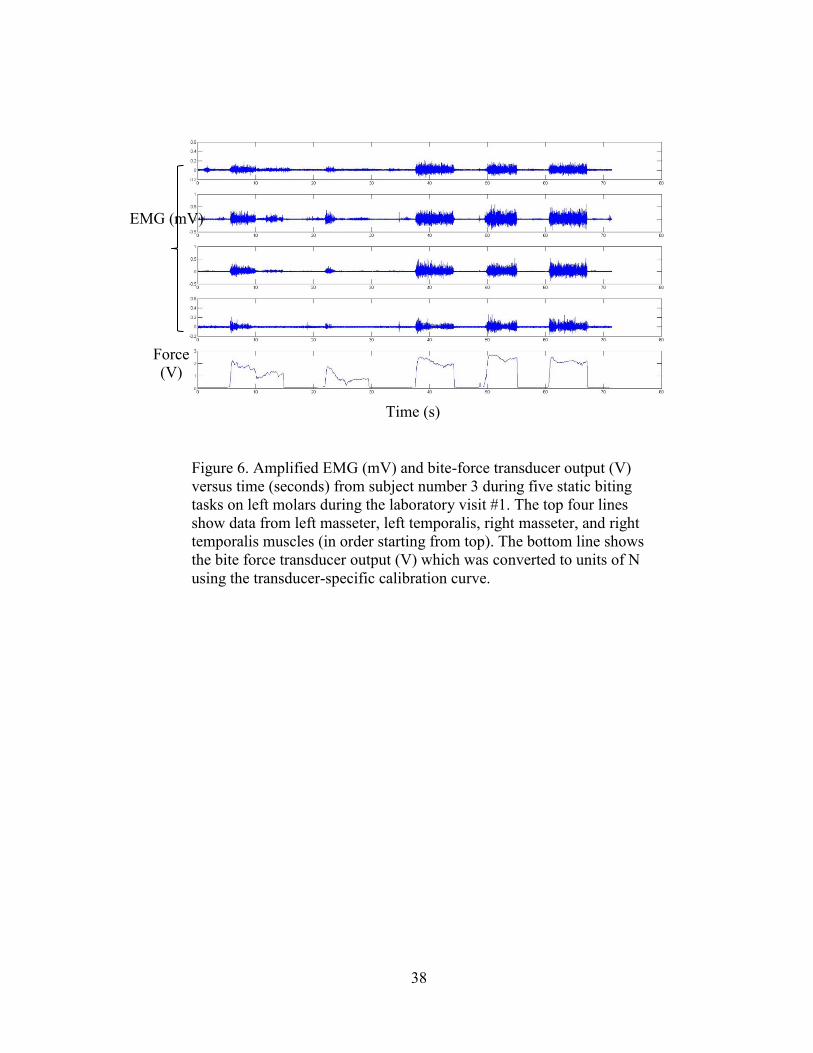
Figure 6. Amplified EMG (mV) and bite-force transducer output (V)
versus time (seconds) from subject number 3 during five static biting
tasks on left molars during the laboratory visit #1. The top four lines
show data from left masseter, left temporalis, right masseter, and right
temporalis muscles (in order starting from top). The bottom line shows
the bite force transducer output (V) which was converted to units of N
using the transducer-specific calibration curve.
EMG (mV)
Force
(V)
Time (s)
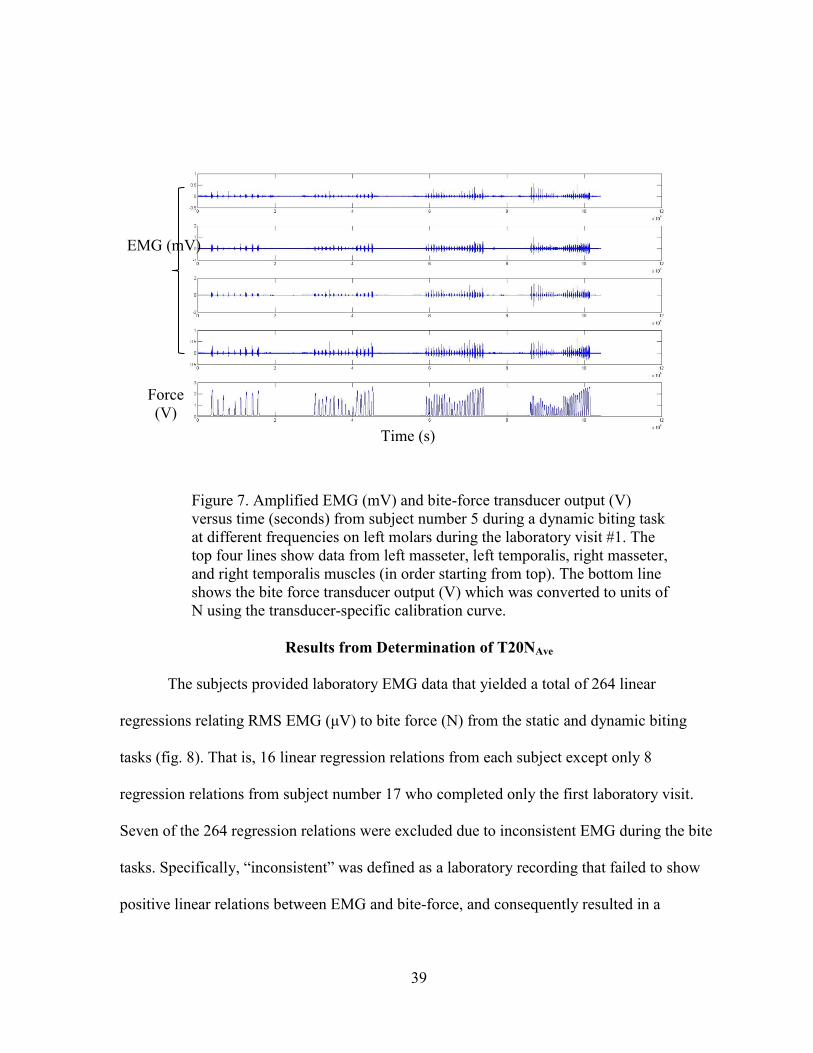
39
Figure 7. Amplified EMG (mV) and bite-force transducer output (V)
versus time (seconds) from subject number 5 during a dynamic biting task
at different frequencies on left molars during the laboratory visit #1. The
top four lines show data from left masseter, left temporalis, right masseter,
and right temporalis muscles (in order starting from top). The bottom line
shows the bite force transducer output (V) which was converted to units of
N using the transducer-specific calibration curve.
Results from Determination of T20NAve
The subjects provided laboratory EMG data that yielded a total of 264 linear
regressions relating RMS EMG (μV) to bite force (N) from the static and dynamic biting
tasks (fig. 8). That is, 16 linear regression relations from each subject except only 8
regression relations from subject number 17 who completed only the first laboratory visit.
Seven of the 264 regression relations were excluded due to inconsistent EMG during the bite
tasks. Specifically, “inconsistent” was defined as a laboratory recording that failed to show
positive linear relations between EMG and bite-force, and consequently resulted in a
EMG (mV)
Force
(V)
Time (s)
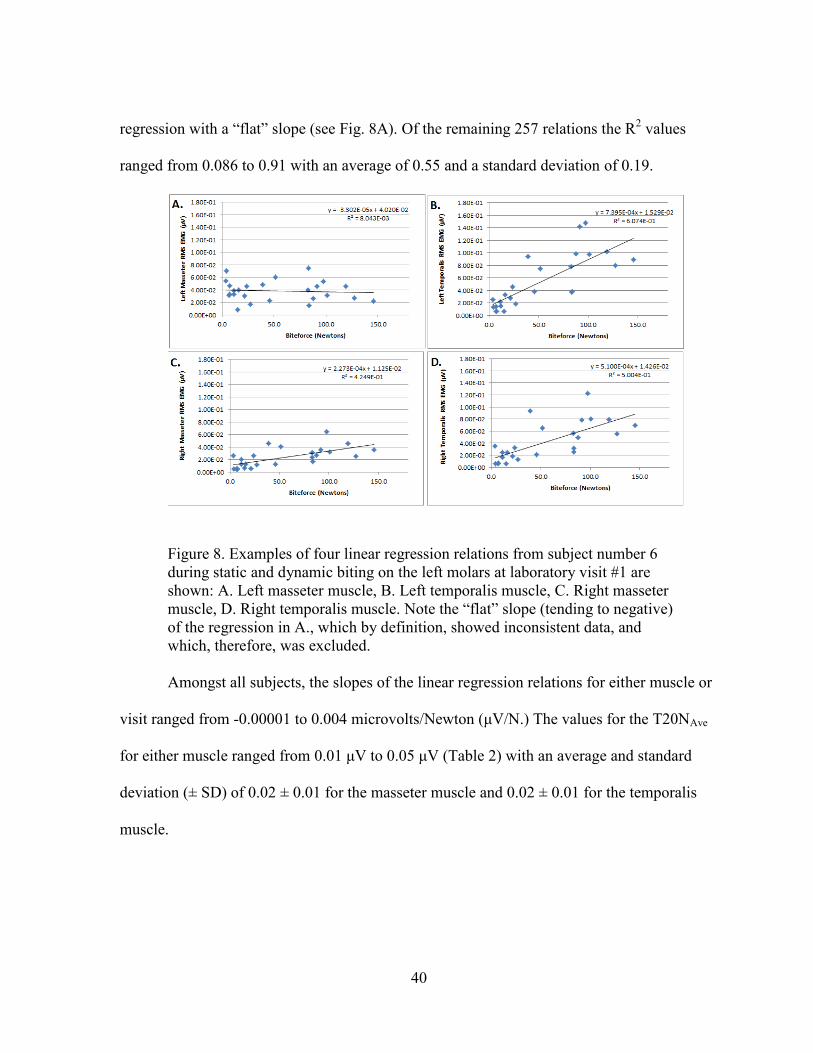
40
regression with a “flat” slope (see Fig. 8A). Of the remaining 257 relations the R2 values
ranged from 0.086 to 0.91 with an average of 0.55 and a standard deviation of 0.19.
Figure 8. Examples of four linear regression relations from subject number 6
during static and dynamic biting on the left molars at laboratory visit #1 are
shown: A. Left masseter muscle, B. Left temporalis muscle, C. Right masseter
muscle, D. Right temporalis muscle. Note the “flat” slope (tending to negative)
of the regression in A., which by definition, showed inconsistent data, and
which, therefore, was excluded.
Amongst all subjects, the slopes of the linear regression relations for either muscle or
visit ranged from -0.00001 to 0.004 microvolts/Newton (μV/N.) The values for the T20NAve
for either muscle ranged from 0.01 μV to 0.05 μV (Table 2) with an average and standard
deviation (± SD) of 0.02 ± 0.01 for the masseter muscle and 0.02 ± 0.01 for the temporalis
muscle.
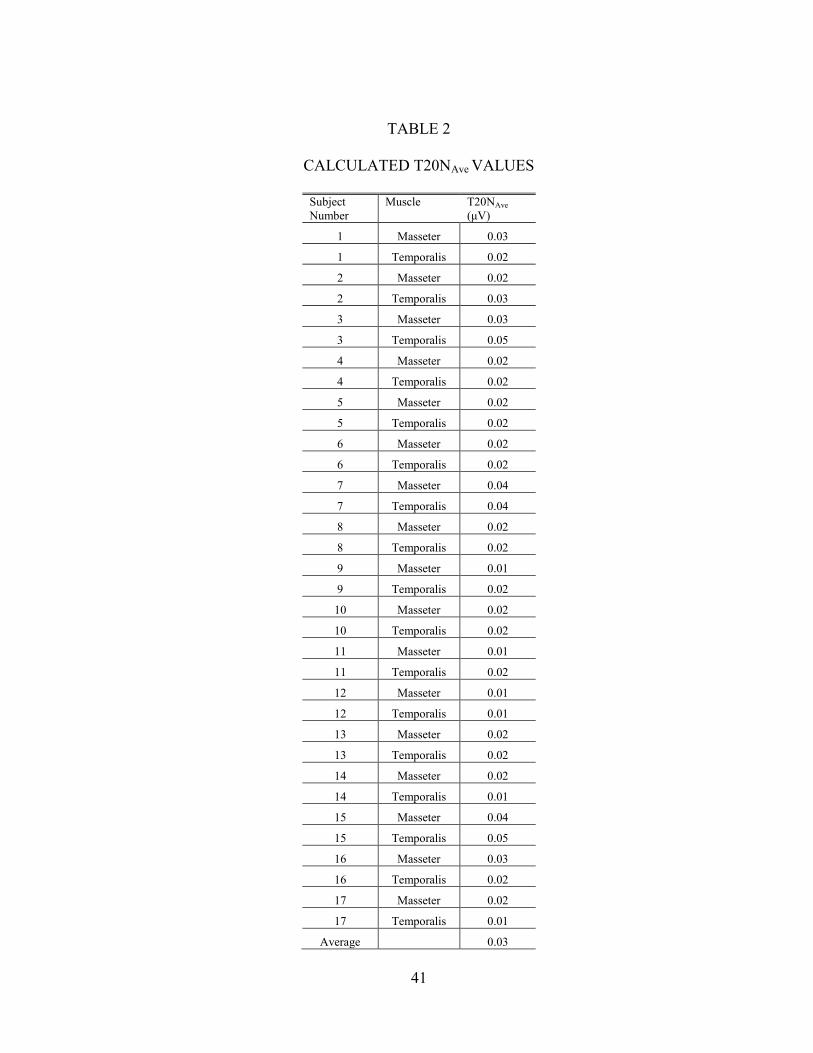
41
TABLE 2
CALCULATED T20NAve VALUES
Subject
Number
Muscle
T20NAve
(μV)
1 Masseter 0.03
1 Temporalis 0.02
2 Masseter 0.02
2 Temporalis 0.03
3 Masseter 0.03
3 Temporalis 0.05
4 Masseter 0.02
4 Temporalis 0.02
5 Masseter 0.02
5 Temporalis 0.02
6 Masseter 0.02
6 Temporalis 0.02
7 Masseter 0.04
7 Temporalis 0.04
8 Masseter 0.02
8 Temporalis 0.02
9 Masseter 0.01
9 Temporalis 0.02
10 Masseter 0.02
10 Temporalis 0.02
11 Masseter 0.01
11 Temporalis 0.02
12 Masseter 0.01
12 Temporalis 0.01
13 Masseter 0.02
13 Temporalis 0.02
14 Masseter 0.02
14 Temporalis 0.01
15 Masseter 0.04
15 Temporalis 0.05
16 Masseter 0.03
16 Temporalis 0.02
17 Masseter 0.02
17 Temporalis 0.01
Average
0.03
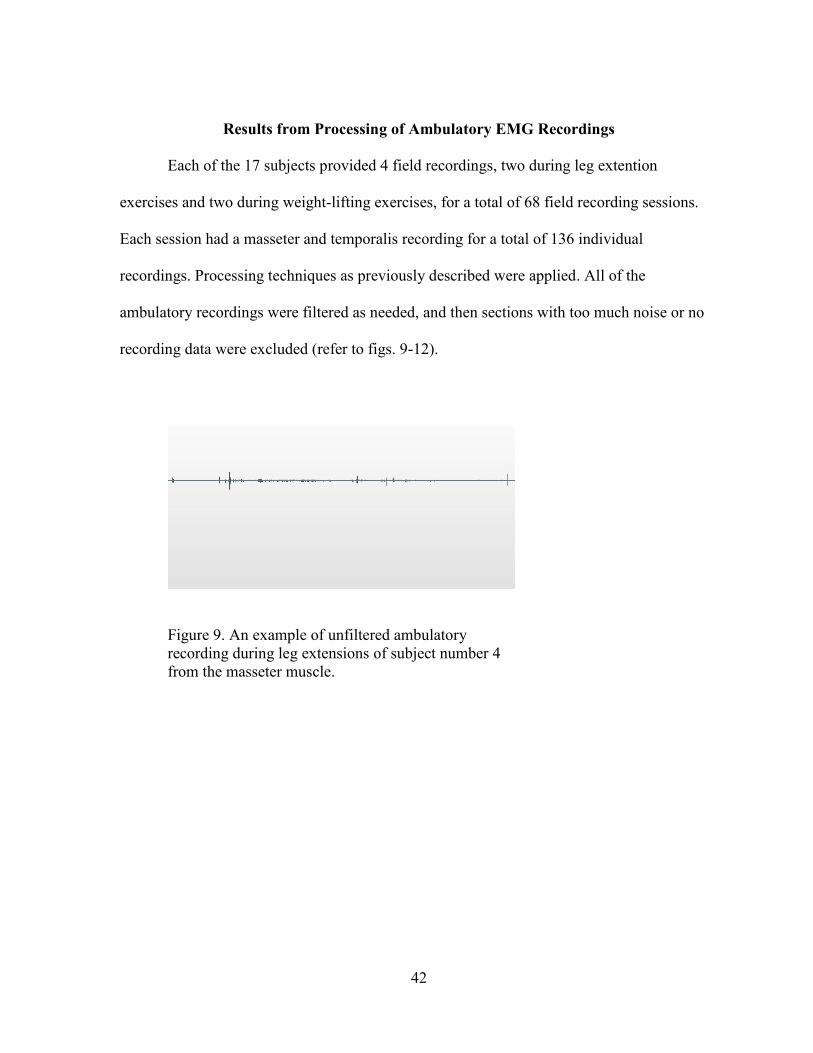
42
Results from Processing of Ambulatory EMG Recordings
Each of the 17 subjects provided 4 field recordings, two during leg extention
exercises and two during weight-lifting exercises, for a total of 68 field recording sessions.
Each session had a masseter and temporalis recording for a total of 136 individual
recordings. Processing techniques as previously described were applied. All of the
ambulatory recordings were filtered as needed, and then sections with too much noise or no
recording data were excluded (refer to figs. 9-12).
Figure 9. An example of unfiltered ambulatory
recording during leg extensions of subject number 4
from the masseter muscle.
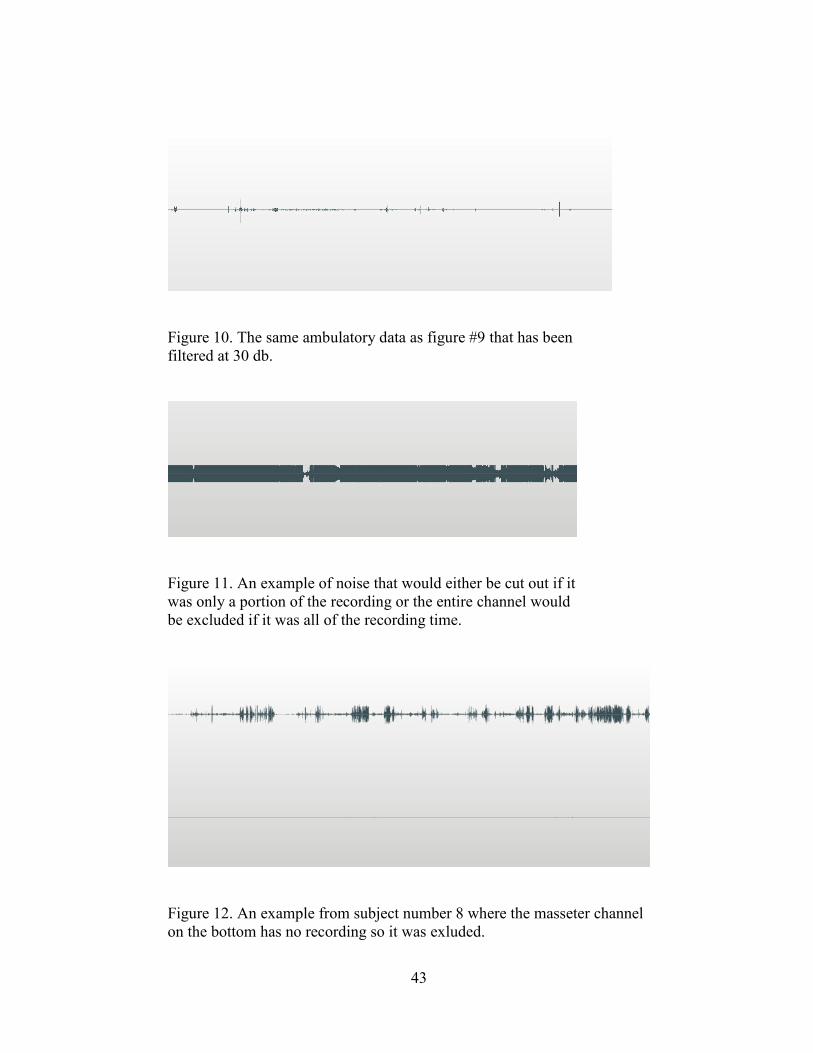
43
Figure 10. The same ambulatory data as figure #9 that has been
filtered at 30 db.
Figure 11. An example of noise that would either be cut out if it
was only a portion of the recording or the entire channel would
be excluded if it was all of the recording time.
Figure 12. An example from subject number 8 where the masseter channel
on the bottom has no recording so it was exluded.
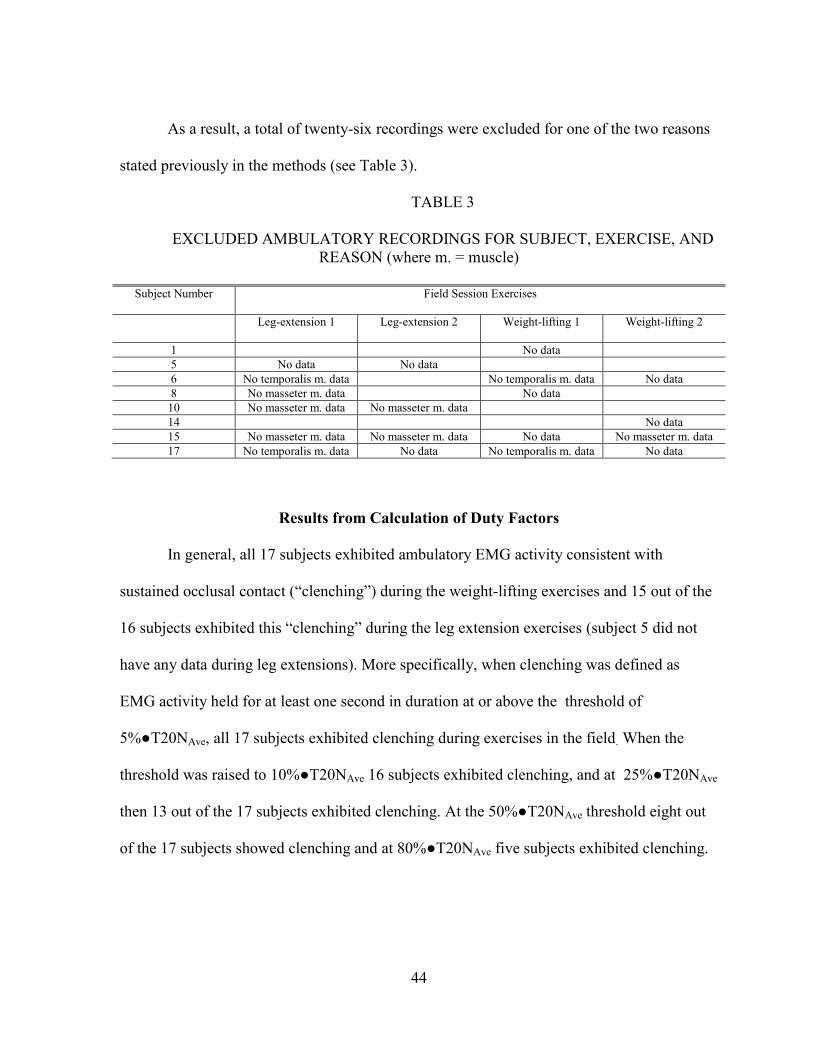
44
As a result, a total of twenty-six recordings were excluded for one of the two reasons
stated previously in the methods (see Table 3).
TABLE 3
EXCLUDED AMBULATORY RECORDINGS FOR SUBJECT, EXERCISE, AND
REASON (where m. = muscle)
Subject Number Field Session Exercises
Leg-extension 1 Leg-extension 2 Weight-lifting 1 Weight-lifting 2
1 No data
5 No data No data
6 No temporalis m. data No temporalis m. data No data
8 No masseter m. data No data
10 No masseter m. data No masseter m. data
14 No data
15 No masseter m. data No masseter m. data No data No masseter m. data
17 No temporalis m. data No data No temporalis m. data No data
Results from Calculation of Duty Factors
In general, all 17 subjects exhibited ambulatory EMG activity consistent with
sustained occlusal contact (“clenching”) during the weight-lifting exercises and 15 out of the
16 subjects exhibited this “clenching” during the leg extension exercises (subject 5 did not
have any data during leg extensions). More specifically, when clenching was defined as
EMG activity held for at least one second in duration at or above the threshold of
5%●T20NAve, all 17 subjects exhibited clenching during exercises in the field. When the
threshold was raised to 10%●T20NAve 16 subjects exhibited clenching, and at 25%●T20NAve
then 13 out of the 17 subjects exhibited clenching. At the 50%●T20NAve threshold eight out
of the 17 subjects showed clenching and at 80%●T20NAve five subjects exhibited clenching.
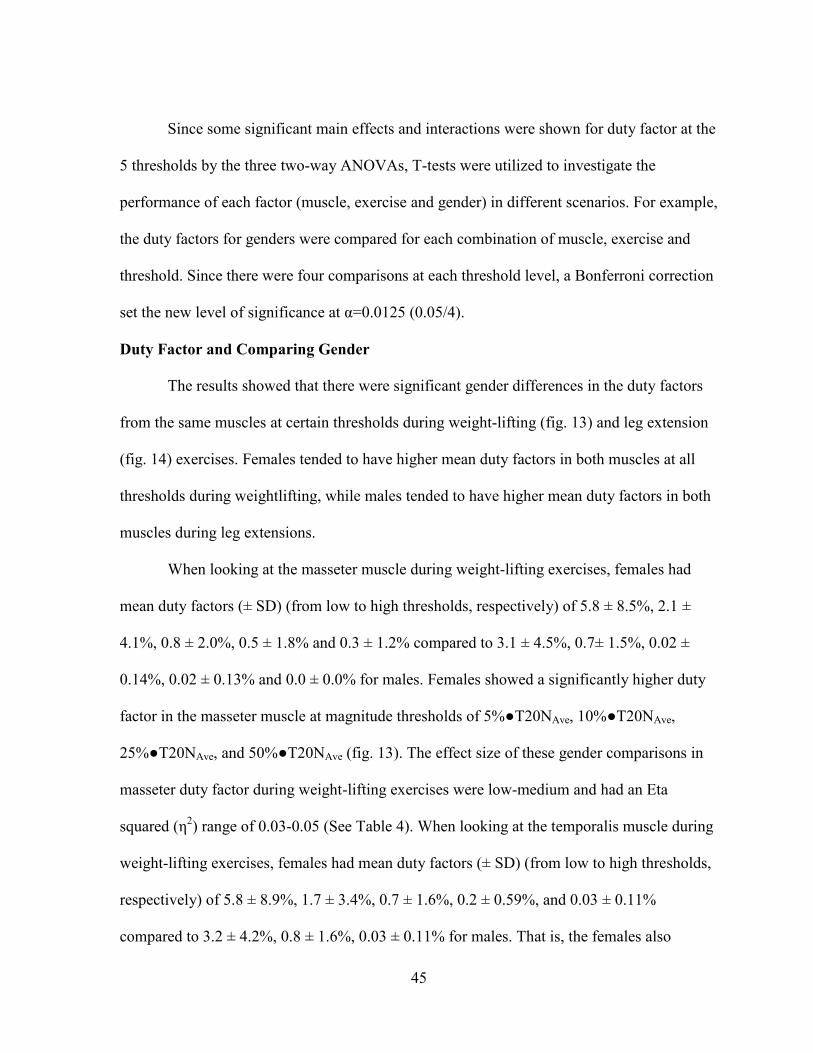
45
Since some significant main effects and interactions were shown for duty factor at the
5 thresholds by the three two-way ANOVAs, T-tests were utilized to investigate the
performance of each factor (muscle, exercise and gender) in different scenarios. For example,
the duty factors for genders were compared for each combination of muscle, exercise and
threshold. Since there were four comparisons at each threshold level, a Bonferroni correction
set the new level of significance at α=0.0125 (0.05/4).
Duty Factor and Comparing Gender
The results showed that there were significant gender differences in the duty factors
from the same muscles at certain thresholds during weight-lifting (fig. 13) and leg extension
(fig. 14) exercises. Females tended to have higher mean duty factors in both muscles at all
thresholds during weightlifting, while males tended to have higher mean duty factors in both
muscles during leg extensions.
When looking at the masseter muscle during weight-lifting exercises, females had
mean duty factors (± SD) (from low to high thresholds, respectively) of 5.8 ± 8.5%, 2.1 ±
4.1%, 0.8 ± 2.0%, 0.5 ± 1.8% and 0.3 ± 1.2% compared to 3.1 ± 4.5%, 0.7± 1.5%, 0.02 ±
0.14%, 0.02 ± 0.13% and 0.0 ± 0.0% for males. Females showed a significantly higher duty
factor in the masseter muscle at magnitude thresholds of 5%●T20NAve, 10%●T20NAve,
25%●T20NAve, and 50%●T20NAve (fig. 13). The effect size of these gender comparisons in
masseter duty factor during weight-lifting exercises were low-medium and had an Eta
squared (η2) range of 0.03-0.05 (See Table 4). When looking at the temporalis muscle during
weight-lifting exercises, females had mean duty factors (± SD) (from low to high thresholds,
respectively) of 5.8 ± 8.9%, 1.7 ± 3.4%, 0.7 ± 1.6%, 0.2 ± 0.59%, and 0.03 ± 0.11%
compared to 3.2 ± 4.2%, 0.8 ± 1.6%, 0.03 ± 0.11% for males. That is, the females also
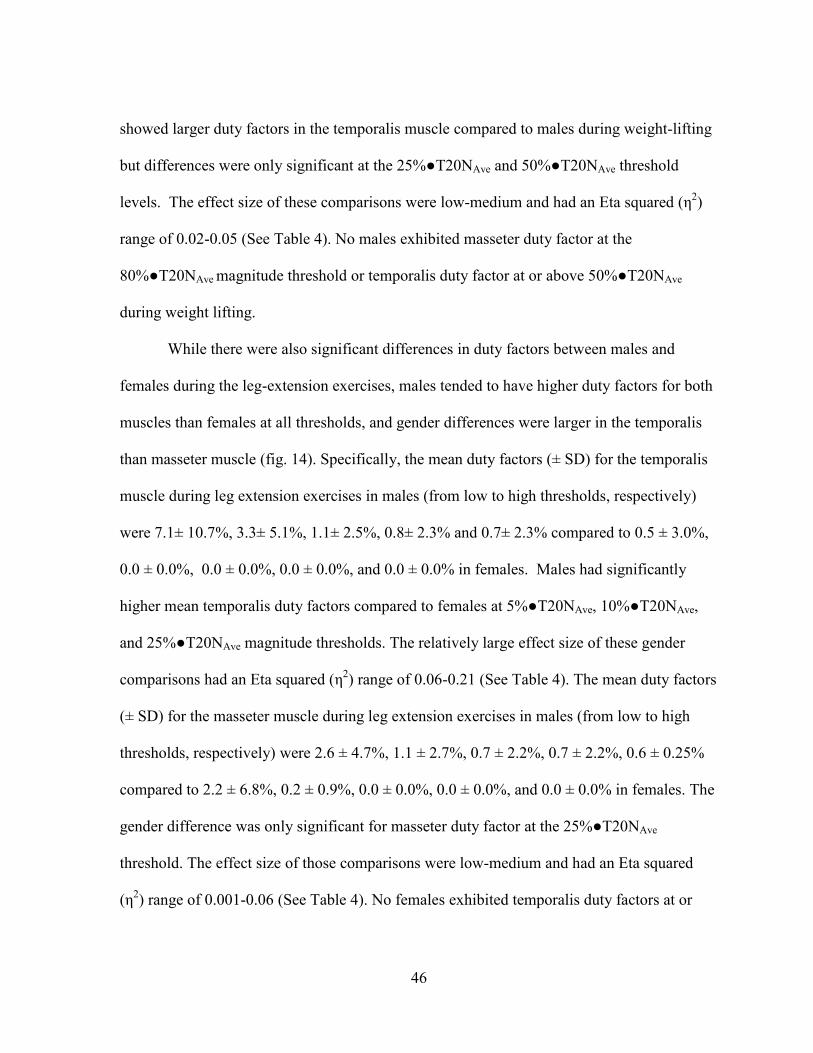
46
showed larger duty factors in the temporalis muscle compared to males during weight-lifting
but differences were only significant at the 25%●T20NAve and 50%●T20NAve threshold
levels. The effect size of these comparisons were low-medium and had an Eta squared (η2)
range of 0.02-0.05 (See Table 4). No males exhibited masseter duty factor at the
80%●T20NAve magnitude threshold or temporalis duty factor at or above 50%●T20NAve
during weight lifting.
While there were also significant differences in duty factors between males and
females during the leg-extension exercises, males tended to have higher duty factors for both
muscles than females at all thresholds, and gender differences were larger in the temporalis
than masseter muscle (fig. 14). Specifically, the mean duty factors (± SD) for the temporalis
muscle during leg extension exercises in males (from low to high thresholds, respectively)
were 7.1± 10.7%, 3.3± 5.1%, 1.1± 2.5%, 0.8± 2.3% and 0.7± 2.3% compared to 0.5 ± 3.0%,
0.0 ± 0.0%, 0.0 ± 0.0%, 0.0 ± 0.0%, and 0.0 ± 0.0% in females. Males had significantly
higher mean temporalis duty factors compared to females at 5%●T20NAve, 10%●T20NAve,
and 25%●T20NAve magnitude thresholds. The relatively large effect size of these gender
comparisons had an Eta squared (η2) range of 0.06-0.21 (See Table 4). The mean duty factors
(± SD) for the masseter muscle during leg extension exercises in males (from low to high
thresholds, respectively) were 2.6 ± 4.7%, 1.1 ± 2.7%, 0.7 ± 2.2%, 0.7 ± 2.2%, 0.6 ± 0.25%
compared to 2.2 ± 6.8%, 0.2 ± 0.9%, 0.0 ± 0.0%, 0.0 ± 0.0%, and 0.0 ± 0.0% in females. The
gender difference was only significant for masseter duty factor at the 25%●T20NAve
threshold. The effect size of those comparisons were low-medium and had an Eta squared
(η2) range of 0.001-0.06 (See Table 4). No females exhibited temporalis duty factors at or
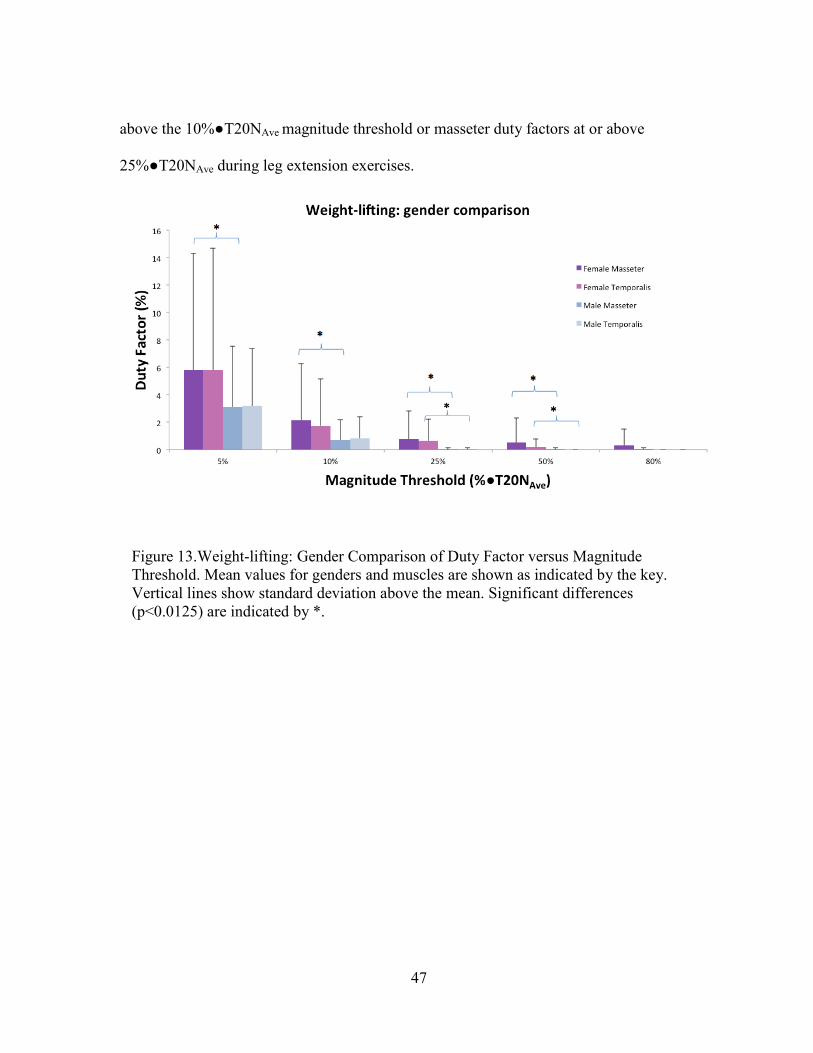
47
above the 10%●T20NAve magnitude threshold or masseter duty factors at or above
25%●T20NAve during leg extension exercises.
Figure 13.Weight-lifting: Gender Comparison of Duty Factor versus Magnitude
Threshold. Mean values for genders and muscles are shown as indicated by the key.
Vertical lines show standard deviation above the mean. Significant differences
(p<0.0125) are indicated by *.
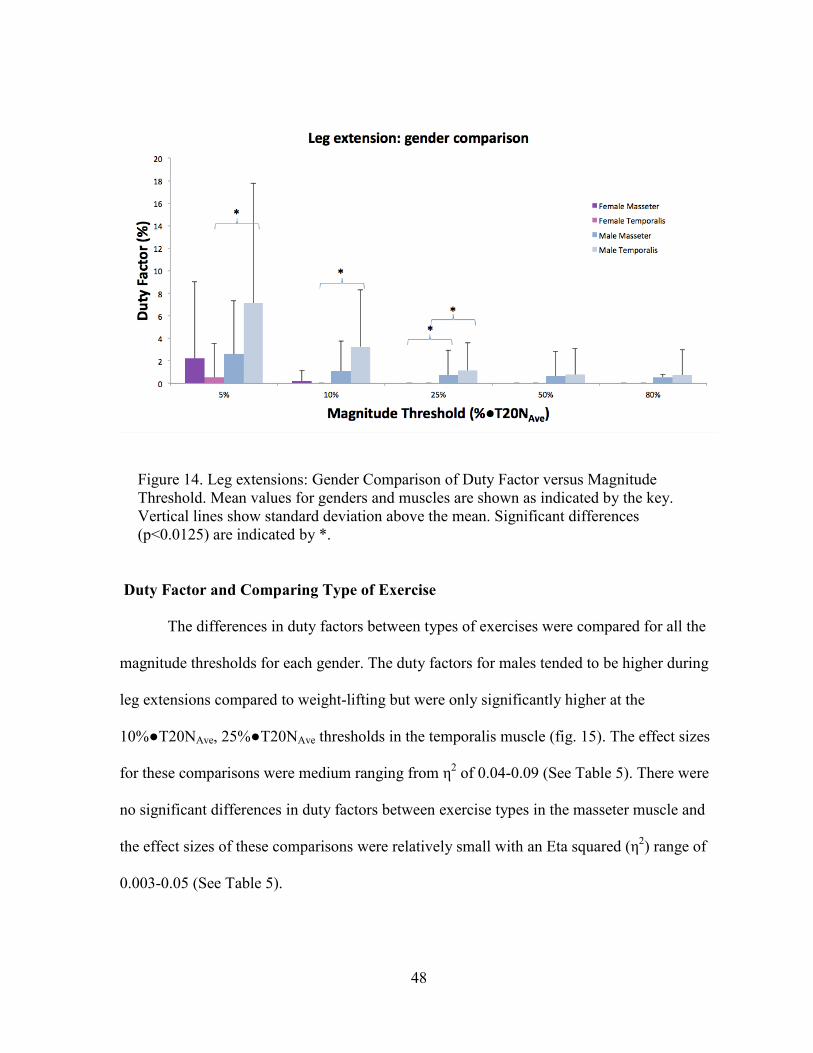
48
Figure 14. Leg extensions: Gender Comparison of Duty Factor versus Magnitude
Threshold. Mean values for genders and muscles are shown as indicated by the key.
Vertical lines show standard deviation above the mean. Significant differences
(p<0.0125) are indicated by *.
Duty Factor and Comparing Type of Exercise
The differences in duty factors between types of exercises were compared for all the
magnitude thresholds for each gender. The duty factors for males tended to be higher during
leg extensions compared to weight-lifting but were only significantly higher at the
10%●T20NAve, 25%●T20NAve thresholds in the temporalis muscle (fig. 15). The effect sizes
for these comparisons were medium ranging from η2 of 0.04-0.09 (See Table 5). There were
no significant differences in duty factors between exercise types in the masseter muscle and
the effect sizes of these comparisons were relatively small with an Eta squared (η2) range of
0.003-0.05 (See Table 5).
49
For the females in the study, there were significantly higher duty factors at all
magnitude thresholds except for >80%●T20NAve for the weight-lifting exercises compared to
the leg extension exercises in both muscles (fig. 16). Particularly large effect sizes were
shown for temporalis duty factors in females at magnitude thresholds ≤10%●T20NAve where
Eta squared (η2) was 0.12-0.14 (See Table 5).
Figure 15. Males: exercise comparison. Mean values for exercises and muscles are shown
as indicated by the key. Vertical lines show standard deviation above the mean.
Significant differences (p<0.0125) are indicated by *.
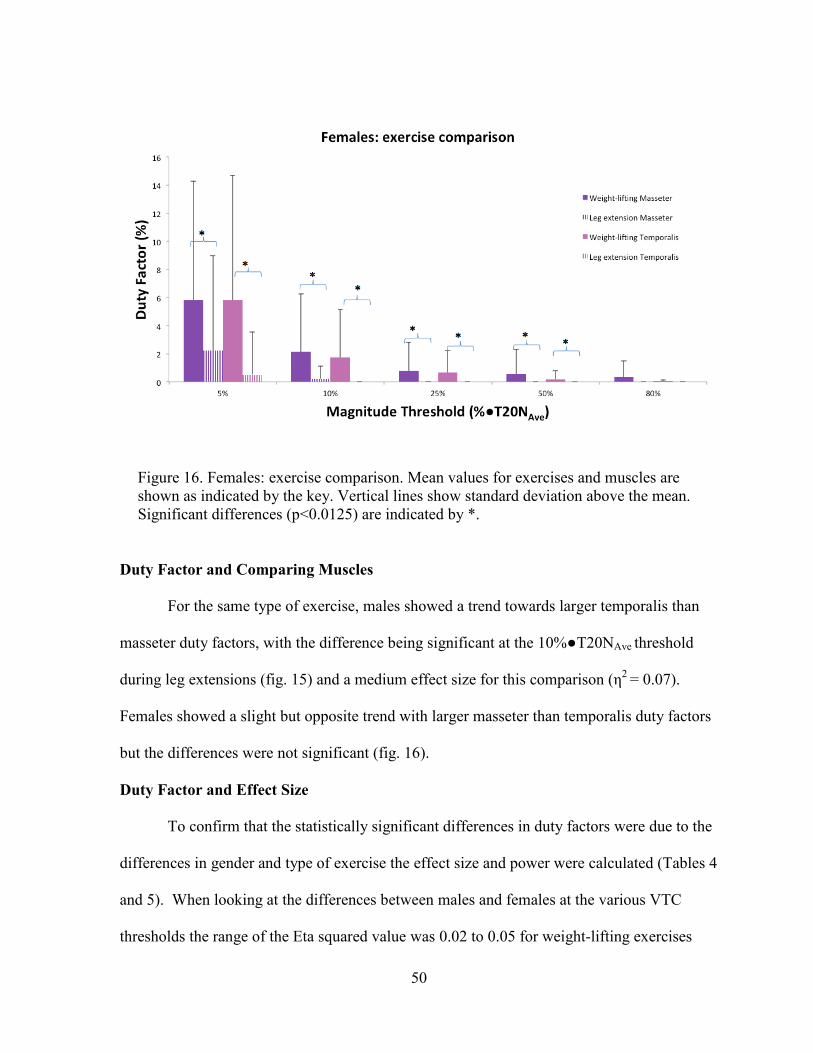
50
Figure 16. Females: exercise comparison. Mean values for exercises and muscles are
shown as indicated by the key. Vertical lines show standard deviation above the mean.
Significant differences (p<0.0125) are indicated by *.
Duty Factor and Comparing Muscles
For the same type of exercise, males showed a trend towards larger temporalis than
masseter duty factors, with the difference being significant at the 10%●T20NAve threshold
during leg extensions (fig. 15) and a medium effect size for this comparison (η2
= 0.07).
Females showed a slight but opposite trend with larger masseter than temporalis duty factors
but the differences were not significant (fig. 16).
Duty Factor and Effect Size
To confirm that the statistically significant differences in duty factors were due to the
differences in gender and type of exercise the effect size and power were calculated (Tables 4
and 5). When looking at the differences between males and females at the various VTC
thresholds the range of the Eta squared value was 0.02 to 0.05 for weight-lifting exercises
51
and 0.00 to 0.21 for leg exercises (see Table 4). At every threshold level the effect size is
larger in leg extensions compared to weight lifting except for the masseter duty factor at the
5% ●T20NAve threshold. The effect sizes are medium to large for both muscles at the
threshold levels of 25%●T20NAve and 50%●T20NAve as well as for the temporalis at the
5%●T20NAve threshold.
The effect size for comparing exercise types for masseter and temporalis duty factors
at the various VTC thresholds ranged from 0.032 to 0.14 for females and 0.00 to 0.08 for
males (see Table 5). The effect sizes were medium to large at thresholds from 10%●T20NAve
-50%●T20NAve with the exception of at the 10%●T20NAve threshold in the masseter muscle
in males (η2=0.00).
Power analyses were done using the smallest effect size and observed power for
comparisons of gender and exercise type (See Tables 4 and 5). The results showed that the
minimum necessary number of subjects per group to achieve a power of ≥0.80 was 17
subjects to investigate the effects of gender and 13 subjects to investigate the effects of
exercise type.
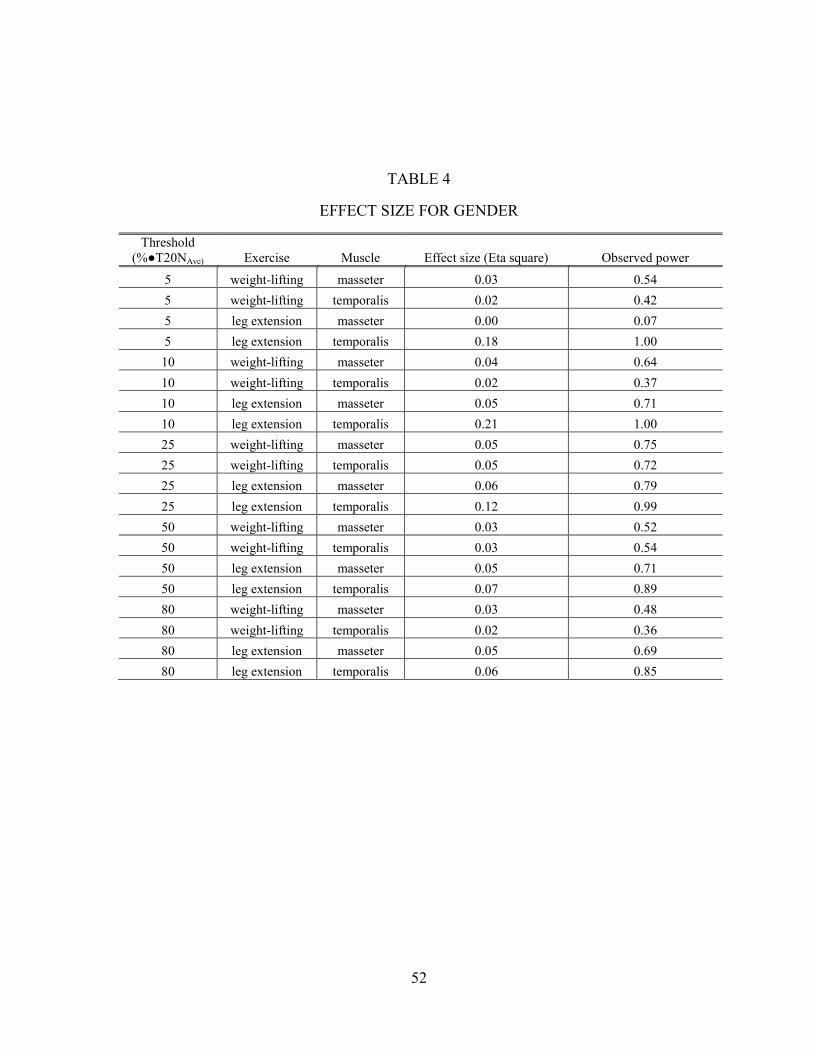
52
TABLE 4
EFFECT SIZE FOR GENDER
Threshold
(%●T20NAve) Exercise Muscle Effect size (Eta square) Observed power
5 weight-lifting masseter 0.03 0.54
5 weight-lifting temporalis 0.02 0.42
5 leg extension masseter 0.00 0.07
5 leg extension temporalis 0.18 1.00
10 weight-lifting masseter 0.04 0.64
10 weight-lifting temporalis 0.02 0.37
10 leg extension masseter 0.05 0.71
10 leg extension temporalis 0.21 1.00
25 weight-lifting masseter 0.05 0.75
25 weight-lifting temporalis 0.05 0.72
25 leg extension masseter 0.06 0.79
25 leg extension temporalis 0.12 0.99
50 weight-lifting masseter 0.03 0.52
50 weight-lifting temporalis 0.03 0.54
50 leg extension masseter 0.05 0.71
50 leg extension temporalis 0.07 0.89
80 weight-lifting masseter 0.03 0.48
80 weight-lifting temporalis 0.02 0.36
80 leg extension masseter 0.05 0.69
80 leg extension temporalis 0.06 0.85
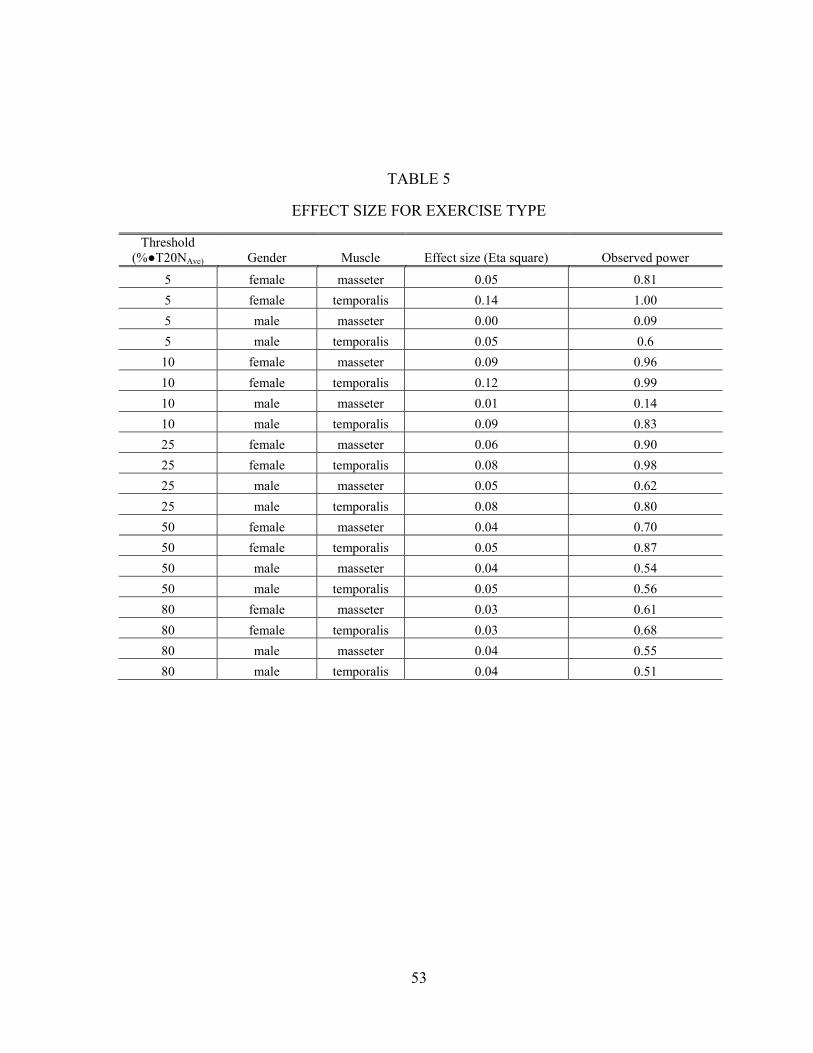
53
TABLE 5
EFFECT SIZE FOR EXERCISE TYPE
Threshold
(%●T20NAve) Gender Muscle Effect size (Eta square) Observed power
5 female masseter 0.05 0.81
5 female temporalis 0.14 1.00
5 male masseter 0.00 0.09
5 male temporalis 0.05 0.6
10 female masseter 0.09 0.96
10 female temporalis 0.12 0.99
10 male masseter 0.01 0.14
10 male temporalis 0.09 0.83
25 female masseter 0.06 0.90
25 female temporalis 0.08 0.98
25 male masseter 0.05 0.62
25 male temporalis 0.08 0.80
50 female masseter 0.04 0.70
50 female temporalis 0.05 0.87
50 male masseter 0.04 0.54
50 male temporalis 0.05 0.56
80 female masseter 0.03 0.61
80 female temporalis 0.03 0.68
80 male masseter 0.04 0.55
80 male temporalis 0.04 0.51
54
CHAPTER 4
DISCUSSION
The results from this study demonstrate that clenching during exercise may be a
common occurrence. Specifically, low level clenching is very common. When the threshold
to define clenching is increased to 50%●T20NAve threshold the prevalence of clenching
decreased to 47%. It would seem that Okeson may be correct in his assumption that non-
parafunctional clenching can and does occur during moments of exertion such as during
weight bearing exercises (Okeson 1993). This study also shows that a gender difference may
exist in clenching during exercise. However, according to this study the expression of this
gender difference may be different depending on the type of activity. The effect sizes showed
that up to 21% of the differences in duty factors of clenching could be attributed to gender
differences and up to 14% could be due to the type of exercise.
Clenching for this study was defined at multiple different EMG magnitude thresholds.
This allowed for the comparison of various levels of clenching during exercise across
genders. While other researchers have used a percentage of maximum voluntary clenching,
the current method may be more applicable to true clenching practices. It has been reported
that a 20 N force is the average load produced when biting through a single cube of
unprepared gum on the molar teeth (Iwasaki 1992). Therefore, clenching loads based around
20 N may be more relevant to clenching than a percentage of maximum voluntary clenching
since chewing is a more frequent physiologic occurrence compared to maximum clenching.
This is a relatively low force when compared to the 133 N required to bite through a 10 mm
thick section of a raw carrot (Iwasaki 1992) or the reported mean maximum biting forces in
55
the molar region for men and women which were 847 N (standard deviation 131 N) and 597
N (standard deviation 94 N) respectively (Waltimo and Kononen 1993).
It has been shown that when both position and angle of biting forces are controlled
during biting tasks a very reliable linear regression between RMS EMG and bite force results
(Gonzalez et al. 2011). However, unlike the methods employed by Gonzalez et al., the
method employed in this study of static and dynamic biting tasks did not control for the angle
of tooth tipping moments. Therefore, the methods used in this study have not yet been
verified as reproducible and reliable. Although bite-force position was targeted to molar
biting, some inconsistency in positioning of the transducer was possible, especially if the
subject’s occlusion resulted in non-vertical bite-forces that caused tooth tipping moments.
This likely could result in lower coefficients of determination (R2 values) found in the current
study compared to other studies where both position and angle of bite-forces were controlled
for molar biting (Uchida et al. 2008; Gonzalez et al. 2011). Gonzalez et al. showed that
various slopes resulted when biting position was controlled but direction of the force was
varied at several different buccal and lingual angles to the long axis of a molar. Nevertheless,
the current methods demonstrated generally well-behaved linear regression relations where
only 7/264 relations were excluded as “inconsistent”. The data to compare the linear
regressions created from the first and second laboratory biting tasks exist from this study.
These data have not been analyzed yet to determine reproducibility and reliability from visit
to visit.
It is difficult to know how helpful controlling position of the mandible during the
biting tasks would be. This is because in a study that attempts to “monitor” clenching in a
natural environment it is almost impossible to know the mandibular position during
56
clenching, unless a customized intraoral appliance was made and used by subjects during
exercise to ensure clenching to a desired occlusal relationship. Even such an appliance could
affect “natural” clenching. As mentioned above it has been reported that during exercise 58%
of subjects clenched in centric occlusion and 11% exhibited eccentric tooth contacts (Ishijima
et al. 1998). This is one of the challenges innate to the study of “monitoring” clenching in a
natural environment.
There are just a few studies that have explored whether or not clenching occurs
during exercise naturally. Ohkawa et al. (Ohkawa 1994; Ohkawa et al. 1994) looked at
common activities in soccer, volleyball and handball. They reported clear masticatory muscle
EMG signals during these activities in 22 of the total 26 subjects (or 85%). Ishijima et al.
(Ishijima et al. 1991) found that 69% of their subjects exhibited clenching during a back
weight lifting exercise. Lastly, Yokoyama et al. reported that in a group of 12 male subjects
only eight (67%) showed clenching during exercise (Yokoyama et al. 1996). It was shown in
this study that at very low levels clenching is a very common phenomenon with 100% of the
subjects exhibiting clenching at some point in either type of exercise activity. However, at
higher magnitude thresholds the percentage of those who showed clenching decreased to
29%. Therefore the range shown in this study of 29% to 100% encompasses all the reported
results from the previous studies cited above. It seems that the prevalence of clenching may
be highly dependent on the definition of clenching and that people who clench may vary in
intensity. Unfortunately, it is difficult to further compare this study to the studies done by
Okhawa et al., Ishijima et al., or Yokoyama et al. since the reports of their work are written
in Japanese with English abstracts. Even though surface EMG was used in each of these
studies it is not clear exactly how clenching was defined.
57
There have been several studies to look at gender differences in pain perception,
maximum force during voluntary clenching, and self-reported bruxism (Waltimo and
Kononen 1993; Plesh et al. 1998; Tuxen et al. 1999; Mundt et al. 2005; Casanova-Rosado et
al. 2006; Okayasu et al. 2009; Nekora-Azak et al. 2010). However, no study could be found
that has quantifiable data on gender differences in clenching. Therefore, this is the first
known study that has attempted to explore the possible gender differences in clenching with
quantifiable data. In addition, it is the first study to look at gender differences in clenching
during exercise. There are known gender differences in biomechanical physiology (Swedan
2001). According to Swedan, (Swedan 2001) females generally have less absolute strength
and typically smaller muscle fiber size than men. However, research is split between whether
or not there is a difference in the number of muscle fibers in men and women. However, in
males individual muscle fibers are larger. When strength is divided by muscle mass females
and males have a similar relative strength. Males typically have larger shoulder girdles and
females typically have a wider pelvis which results in a lower center of gravity in females.
This lower center of gravity in females could help in certain exercises making it easier to
maintain balance. This could be a factor in the gender difference in VTC since it has been
hypothesized that VTC may help contribute to stabilization and balance (Takada et al. 2000).
There was not a lot of research found on gender differences in stabilization and balance but a
few articles do report a possible gender difference (Wolfson et al. 1994; Golomer et al. 1997;
Schultz et al. 1997). It has also been reported that females have greater flexibility than males
(Swedan 2001) which, depending on the exercise, could also contribute to a gender
difference in stabilization and balance during an exercise motion.
58
This is also the first study to explore the possibility that there may be differences in
clenching based on the type of activity. Previous research suggests possible theories about
why results from this study show that the activity could affect clenching measured by duty
factor or clenching intensity. One theory is that since VTC helps to facilitate reciprocal
muscles in the leg VTC may help contribute to stabilization and balance (Takada et al. 2000).
This theory seems to have been supported when subjects who clenched were able to maintain
posture and balance better than “non-clenchers” as measured by a force plate they were
standing on after having their balance disturbed (Fujino et al. 2010). It is possible that
different exercises may require differing levels of stabilization or balance which could elicit
varying expression of VTC. Also it appears that VTC can have varying effects on different
muscles due to the properties of the muscle (Boroojerdi et al. 2000; Takahashi et al. 2006). If
the type of exercise truly does have an effect on the amount or level of clenching then it
would have to be a consideration in any future study and may be a factor that needs to be
controlled. As part of this study a more standardized leg extension exercise was done after
the biting tasks in the laboratory and these data have yet to be analyzed but may help to
further investigate this question. That is, it would be possible with the data collected through
this study to explore the question of whether or not the amount of load in the exercise is
related to the duty factor or the magnitude of clenching. The data gathered during the
laboratory leg extension exercises included the amount of weight and the number of
repetitions completed. In the future these data should be processed and analyzed.
In the current study, to allow for the most natural environment to monitor clenching,
very little restraints were put on the field recording sessions during weight-lifting exercises.
Subjects were told they could do weight-lifting exercises of upper body or lower body or a
59
combination of both. The only restriction was to avoid chewing gum. Obviously, this
introduces possible confounding factors due to individual choice of exercises. Anecdotally,
most subjects did a combination of both upper and lower body exercises; however this was
not true for all. The other type of the ambulatory recording session was the more
standardized leg extension exercises, and this also showed a gender difference in clenching.
When comparing gender the effect size for the more standardized leg extensions were greater
than the effect size for weight-lifting exercises at each muscle and threshold except for at the
5% threshold in the masseter muscle.
There were a few advantages to having all the subjects be collegiate-level soccer
players from the UMKC men’s and women’s soccer teams. All the subjects were
concurrently participating in a regular strength and conditioning program. The hope was that
this would decrease the possible confounding factor of having volunteers who did not
exercise with weights regularly and who might consequently experience stress or
nervousness in the protocol. It was also hoped that recruiting subjects from the same sport
meant that both subject groups would be involved with similar training regimens, exercises,
and environments within and between gender groups. All subjects did use the same exercise
facility for their field recordings. However, it is possible that this could also have been a
confounding factor. For example, in this study females had permission from their coach to do
the weight-lifting field recording during their scheduled workouts (which some of them did)
while the males had to do all of their weight-lifting recordings outside of regular workouts on
their own time (all subjects did the leg extension field recordings outside of regular
workouts).
60
The relatively small sample sizes may appear to have magnified some of the above-
mentioned factors. When a power analysis was done using the smallest effect size of 0.001,
that resulted from the comparison of masseter duty factor between genders during leg
extensions, the necessary number of subjects per group to achieve a power of 0.828 was 17
subjects. Therefore, this pilot study could potentially be improved by increasing the number
of subjects.
There are several limitations to this study, some of which have already been
mentioned, such as controlling for jaw position and standardizing exercises. Another
limitation with this type of study is the inability to control for “how strenuous” the exercise is
for the individual. In other words, it is almost impossible to control how much a subject is
“pushing themselves” in the activity. The leg extension exercise instruction was to continue
doing repetitions until the subject could not do any more. This instruction was subjective and
may have been influenced by other factors such as external distractions, emotional stress,
fatigue or depression. There was no instruction given on how strenuous the exercise should
be in the weight-lifting exercise. The only instruction was to perform a session like the
subjects were already accustomed to doing with their strength and conditioning coaches.
Another possible confounding factor that was not addressed in this study is the possibility of
varying degrees of external or internal psychological stress or depression. For example, if
several of the females or males in the study were in the middle of midterms during the course
of this study this could contribute to increased stress and clenching and possibly bias results.
Another challenge with the current study is the possibility that EMG activity may be due to
noise or include crosstalk from nearby facial expression muscles. As described it was
attempted to clean up the data by filtering or excluding data that had noise. However, there is
61
still the possibility that some noise persisted or that EMG data were from muscles other than
the masticatory muscles of interest. Also there is the possibility that a learning or
accommodation effect exists between the first laboratory or field recording to the second
sessions. Lastly, ideally it would be important to verify that the EMG activity measured was
a result of tooth contact during clenching. Verifying this was not attempted in this study.
However, during the leg extensions during the laboratory visits (these data were not analyzed
in this report) visual confirmation of tooth contact was seen in some of the subjects.
Therefore, this study could be improved upon if the limitations could be addressed by:
1. Controlling for jaw position during biting tasks and during exercise.
2. Attempting to better standardize the exercise and its “intensity.”
3. Accounting for other external and internal stress and psychological states during the
study through a concurrent survey.
4. Verifying that EMG activity was due to tooth contact during clenching.
One possible confounding factor for this study that was addressed is that during
swallowing teeth may contact with concurrent EMG muscle activity. However, we defined
duty factor as any EMG activity over a certain threshold that was sustained continuously for
at least one second. It has been reported that swallows typically last about one second. Also,
an average human swallows about 1000 times a day. If each of those swallows lasts a second
that would result in a duty factor of about 1% due to swallowing (Proffit et al. 2007). The
duty factors in this study at low levels of clenching were much higher than this. Furthermore,
it would be feasible to guess that swallowing might occur less during exercise than at rest.
Therefore, even though swallowing is still a potential confounder, the methodologies of this
research have attempted to account for that confounder.
62
Since this study was a pilot study in a novel area of research there are many questions
still to be answered. One of those questions is investigating clenching events at different
duration thresholds. In this study results have been divided into thresholds of intensity
described by bite-force. A duration threshold could also be applied to the data which could
divide the factor into clenching events that were sustained over 1, 2, 5, or 10 seconds. These
data have been collected but have not been analyzed. For example, further investigation of
the laboratory visit data to determine when clenching occurs relative to the exercise is
indicated. There is a report that suggests that masticatory muscle EMG activity begins before
EMG activity in the muscle performing exercise (Yokoyama et al. 1996). If this is the case, a
feed-forward mechanism is suggested as opposed to a feed-back mechanism for clenching.
Looking further into VTC phenomena and exercise, it could be useful to standardize the
exercise activities and control for how strenuous the activity is to determine if the gender
differences in clenching still occur.
63
CHAPTER 5
CONCLUSION
This pilot study has explored a novel area of research investigating possible gender
differences of voluntary teeth clenching during exercise. The first hypothesis that clenching
does occur during exercise was confirmed because all of the 17 subjects exhibited low level
clenching during exercise and around half of the subjects exhibited moderate level clenching
at or over 50%●T20NAve.
The second hypothesis that there would be a gender difference in clenching was also
verified. For each of the exercise types there was a significant difference in the clenching
defined by a difference in the duty factor for the genders. The females showed higher duty
factors at four out of five clenching magnitudes for weight-lifting exercises in at least one of
the muscles. Males showed higher duty factors at lower magnitudes of clenching for leg
extensions in at least one of the muscles investigated
An unexpected finding was that there was also significant differences within gender
groups when the types of exercises were compared. Females had higher duty factors in
weight-lifting exercises than leg extensions at all but the highest clenching magnitude. On the
other hand, males had higer duty factors during leg extensions than during weight-lifting
exercises the 10%●T20NAve and 25%●T20NAve magnitudes of clenching.
64
LITERATURE CITED
Allen KL, Galvis D, Katz RV. Evaluation of cds and chewing gum in teaching dental anatomy. N Y State Dent J 2006;72:30-3.
Aydin G, Keles I, Zog G, Orkun S. [how does the habit of teeth clenching affect the symptoms and
signs of patients with temporomandibular disorders?]. Kulak Burun Bogaz Ihtis Derg 2004;13:19-24.
Barbosa Tde S, Miyakoda LS, Pocztaruk Rde L, Rocha CP, Gaviao MB. Temporomandibular disorders
and bruxism in childhood and adolescence: Review of the literature. Int J Pediatr Otorhinolaryngol 2008;72:299-314.
Boroojerdi B, Battaglia F, Muellbacher W, Cohen LG. Voluntary teeth clenching facilitates human
motor system excitability. Clin Neurophysiol 2000;111:988-93.
Carra MC, Huynh N, Morton P, Rompre PH, Papadakis A, Remise C, Lavigne GJ. Prevalence and risk
factors of sleep bruxism and wake-time tooth clenching in a 7- to 17-yr-old population. Eur J Oral Sci 2011;119:386-94.
Casanova-Rosado JF, Medina-Solis CE, Vallejos-Sanchez AA, Casanova-Rosado AJ, Hernandez-Prado
B, Avila-Burgos L. Prevalence and associated factors for temporomandibular disorders in a group of mexican adolescents and youth adults. Clin Oral Investig 2006;10:42-9.
Castroflorio T, Icardi K, Torsello F, Deregibus A, Debernardi C, Bracco P. Reproducibility of surface
emg in the human masseter and anterior temporalis muscle areas. Cranio 2005;23:130-7.
Castroflorio T, Icardi K, Becchino B, Merlo E, Debernardi C, Bracco P, Farina D. Reproducibility of
surface emg variables in isometric sub-maximal contractions of jaw elevator muscles. J Electromyogr Kinesiol 2006;16:498-505.
Castroflorio T, Bracco P, Farina D. Surface electromyography in the assessment of jaw elevator
muscles. J Oral Rehabil 2008;35:638-45.
Chandu A, Suvinen TI, Reade PC, Borromeo GL. The effect of an interocclusal appliance on bite force
and masseter electromyography in asymptomatic subjects and patients with temporomandibular pain and dysfunction. J Oral Rehabil 2004;31:530-7.
65
Christensen LV. Some subjective-experiential parameters of experimental tooth clenching in children. J Oral Rehabil 1980;7:205-13.
Christensen LV. Jaw muscle fatigue and pains induced by experimental tooth clenching: A review. J
Oral Rehabil 1981;8:27-36.
Christensen LV. Experimental teeth clenching in man. Swed Dent J Suppl 1989;60:1-66.
Churei H, Sasaki Y, Ueno T, Taniguchi H, Takashi O. Change of grip force production characteristics by
teeth clenching. Journal of Japan Prosthodontic Society 2002;46:732-7.
Ciuffolo F, Manzoli L, Ferritto AL, Tecco S, D'Attilio M, Festa F. Surface electromyographic response
of the neck muscles to maximal voluntary clenching of the teeth. J Oral Rehabil 2005;32:79-84.
Farella M, Palla S, Erni S, Michelotti A, Gallo LM. Masticatory muscle activity during deliberately
performed oral tasks. Physiol Meas 2008;29:1397-410.
Farella M, Soneda K, Vilmann A, Thomsen CE, Bakke M. Jaw muscle soreness after tooth-clenching
depends on force level. J Dent Res 2010;89:717-21.
Ferrario VF, Sforza C, Jr AM, D'Addona A, Barbini E. Electromyographic activity of human masticatory
muscles in normal young people. Statistical evaluation of reference values for clinical applications. Journal of Oral Rehabilitation 1993;20:271-80.
Ferrario VF, Sforza C, Serrao G, Fragnito N, Grassi G. The influence of different jaw positions on the
endurance and electromyographic pattern of the biceps brachii muscle in young adults with different occlusal characteristics. J Oral Rehabil 2001;28:732-9.
Frontera WR, Hughes VA, Lutz KJ, Evans WJ. A cross-sectional study of muscle strength and mass in
45- to 78-yr-old men and women. J Appl Physiol 1991;71:644-50.
Fujino S, Takahashi T, Ueno T. Influence of voluntary teeth clenching on the stabilization of postural
stance disturbed by electrical stimulation of unilateral lower limb. Gait Posture 2010;31:122-5.
66
Furubayashi T, Sugawara K, Kasai T, Hayashi A, Hanajima R, Shiio Y, Iwata NK, Ugawa Y. Remote effects of self-paced teeth clenching on the excitability of hand motor area. Exp Brain Res 2003;148:261-5.
Glaros AG, Forbes M, Shanker J, Glass EG. Effect of parafunctional clenching on temporomandibular
disorder pain and proprioceptive awareness. Cranio 2000;18:198-204.
Glaros AG, Burton E. Parafunctional clenching, pain, and effort in temporomandibular disorders. J
Behav Med 2004;27:91-100.
Glaros AG, Waghela R. Psychophysiological definitions of clenching. Cranio 2006;24:252-7.
Golomer E, Dupui P, Monod H. Sex-linked differences in equilibrium reactions among adolescents
performing complex sensorimotor tasks. J Physiol Paris 1997;91:49-55.
Gonzalez Y, Iwasaki LR, McCall WD, Jr., Ohrbach R, Lozier E, Nickel JC. Reliability of
electromyographic activity vs. Bite-force from human masticatory muscles. Eur J Oral Sci 2011;119:219-24.
Grunheid T, Brugman P, Zentner A, Langenbach GE. Changes in rabbit jaw-muscle activity
parameters in response to reduced masticatory load. J Exp Biol 2010;213:775-81.
Gutierrez MF, Miralles R, Fuentes A, Cavada G, Valenzuela S, Santander H, Fresno MJ. The effect of
tooth clenching and grinding on anterior temporalis electromyographic activity in healthy subjects. Cranio 2010;28:43-9.
Hicks AL, Kent-Braun J, Ditor DS. Sex differences in human skeletal muscle fatigue. Exercise and
Sport Sciences Reviews 2001;29:109-12.
Hiroshi C. [relation between teeth clenching and grip force production characteristics]. Kokubyo
Gakkai Zasshi 2003;70:82-8.
Ishijima, Hirai, Koshino, Konishi, Yokoyama. The relationship between occlusal support and physical
exercise ability. Journal of Oral Rehabilitation 1998;25:468-71.
Ishijima T, Hirai T, Imanura M. The frequency of clenching during physical exertion [in japanese-
abstract in english]. The Journal of the Japan Prosthodontic Society 1991;35:193-9.
67
Iwasaki LR. The effect of dentofacial form on chewing efficiency in humans (PhD), Manitoba; 1992.
Kanehisa H, Ikegawa S, Tsunoda N, Fukunaga T. Cross-sectional areas of fat and muscle in limbs
during growth and middle age. Int J Sports Med 1994;15:420-5.
Kawai N, Tanaka E, Langenbach GE, van Wessel T, Brugman P, Sano R, van Eijden TM, Tanne K. Daily
jaw muscle activity in freely moving rats measured with radio-telemetry. Eur J Oral Sci 2007;115:15-20.
Kyoko M, Hiroshi C, Toshiaki U. Remote effect of teeth clenching on unilateral and bilateral grip
force productions. J. Sports Dent. 2006;10:21-9.
Lobbezoo F, van der Glas HW, van Kampen FM, Bosman F. The effect of an occlusal stabilization
splint and the mode of visual feedback on the activity balance between jaw-elevator muscles during isometric contraction. J Dent Res 1993;72:876-82.
Lobbezoo F, Huddleston Slater JJ. Variation in masticatory muscle activity during subsequent,
submaximal clenching efforts. J Oral Rehabil 2002;29:504-9.
Maixner W, Diatchenko L, Dubner R, Fillingim RB, Greenspan JD, Knott C, Ohrbach R, Weir B, Slade
GD. Orofacial pain prospective evaluation and risk assessment study – the oppera study. The journal of pain : official journal of the American Pain Society 2011;12:T4-T11.e2.
Manfredini D, Lobbezoo F. Relationship between bruxism and temporomandibular disorders: A
systematic review of literature from 1998 to 2008. Oral Surg Oral Med Oral Pathol Oral Radiol Endod 2010;109:e26-50.
Miles C, Johnson AJ. Chewing gum and context-dependent memory effects: A re-examination.
Appetite 2007;48:154-8.
Miller AE, MacDougall JD, Tarnopolsky MA, Sale DG. Gender differences in strength and muscle fiber
characteristics. Eur J Appl Physiol Occup Physiol 1993;66:254-62.
Miyahara T, Hagiya N, Ohyama T, Nakamura Y. Modulation of human soleus h reflex in association
with voluntary clenching of the teeth. J Neurophysiol 1996;76:2033-41.
68
Mizumori T, Kobayashi Y, Inano S, Sumiya M, Murashima F, Yatani H. No effect of conscious clenching on simple arithmetic task in healthy participants. J Prosthodont Res 2011;55:189-92.
Moyers RE. Temporomandibular muscle contraction patterns in angle class ii, division 1
malocclusions; an electromyographic analysis. Am J Orthod 1949;35:837-57, illust.
Mundt T, Mack F, Schwahn C, Bernhardt O, Kocher T, John U, Biffar R. Gender differences in
associations between occlusal support and signs of temporomandibular disorders: Results of the population-based study of health in pomerania (ship). Int J Prosthodont 2005;18:232-9.
Naeije M, McCarroll RS, Weijs WA. Electromyographic activity of the human masticatory muscles
during submaximal clenching in the inter-cuspal position. J Oral Rehabil 1989;16:63-70.
Naka S, Takahahi T, Sumita Y, Ueno T, Ohyama T. Remote facilitation of soleus h-reflex induced by
clenching on occlusal stabilization appliances. Prosthodontic Reserach & Practice 2004;3:15-24.
Nekora-Azak A, Yengin E, Evlioglu G, Ceyhan A, Ocak O, Issever H. Prevalence of bruxism awareness
in istanbul, turkey. Cranio 2010;28:122-7.
Nickel JC, Yao P, Spalding PM, Iwasaki LR. Validated numerical modeling of the effects of combined
orthodontic and orthognathic surgical treatment on tmj loads and muscle forces. Am J Orthod Dentofacial Orthop 2002;121:73-83.
Nickel JC, Iwasaki LR, Walker RD, McLachlan KR, McCall WD, Jr. Human masticatory muscle forces
during static biting. J Dent Res 2003;82:212-7.
Nickel JC, Gonzalez Y, Iwasaki LR, McCall WD, Jr., Gallo LM, Marx DB. Masticatory muscle duty
factors in subjects with and without pain. J Dent Res 2013;92.
Ohkawa S. Sports medical analysis on masticatory muscles fuction in volleyball and handball players.
The Journal of the Japanese Society of Stomatognathic Function 1994;1:33-44.
Ohkawa S, Shinohara K, Hashihara M. Sports medical analysis on masticatory muscles function in
professional soccer players. Journal of Japanese Society of Stomatognathic Function 1994:165-73.
69
Okayasu I, Oi K, De Laat A. The effect of tooth clenching on the sensory and pain perception in the oro-facial region of symptom-free men and women. J Oral Rehabil 2009;36:476-82.
Okeson JP. Management of temporomandibular disorders and occlusion. 3rd ed. St. Louis, Mo.:
Mosby Year Book Inc.; 1993.
Onyper SV, Carr TL, Farrar JS, Floyd BR. Cognitive advantages of chewing gum. Now you see them,
now you don't. Appetite 2011;57:321-8.
Plesh O, Curtis DA, Hall LJ, Miller A. Gender difference in jaw pain induced by clenching. J Oral
Rehabil 1998;25:258-63.
Proffit WR, Fields J, Henry W., Sarver DM. Contemporary orthodontics. Fourth Edition ed.: Mosby;
2007.
Roark AL, Glaros AG, O'Mahony AM. Effects of interocclusal appliances on emg activity during
parafunctional tooth contact. J Oral Rehabil 2003;30:573-7.
Rues S, Schindler HJ, Turp JC, Schweizerhof K, Lenz J. Motor behavior of the jaw muscles during
different clenching levels. Eur J Oral Sci 2008;116:223-8.
Sasaki Y, Ueno T, Taniguchi H, Ohyama T. Effect of teeth clenching on isometric and isokinetic
strength of ankle plantar flexion. J Med Dent Sci 1998;45:29-37.
Sato R, Yamanaka T, Sumita Y, Sasaki Y, Ueno T, Taniguchi H, Ohyama T. Augmentation of eccentric
strength of knee extensors with teeth clenching. Japanese Journal of Physical Fitness and Sports Medicine 2001;50:339-46.
Scholey A. Chewing gum and cognitive performance: A case of a functional food with function but
no food? Appetite 2004;43:215-6.
Schultz AB, Ashton-Miller JA, Alexander NB. What leads to age and gender differences in balance
maintenance and recovery? Muscle Nerve Suppl 1997;5:S60-4.
Shiau YY, Chai HM. Body posture and hand strength of patients with temporomandibular disorder.
Cranio 1990;8:244-51.
70
Smith A. Effects of chewing gum on cognitive function, mood and physiology in stressed and non-stressed volunteers. Nutr Neurosci 2010;13:7-16.
Soderberg GL, Knutson LM. A guide for use and interpretation of kinesiologic electromyographic
data. Phys Ther 2000;80:485-98.
Stenger JM. Physiologic dentistry with notre dame athletes. Basal Facts 1977;2:8-18.
Sugawara K, Kasai T. Facilitation of motor evoked potentials and h-reflexes of flexor carpi radialis
muscle induced by voluntary teeth clenching. Hum Mov Sci 2002;21:203-12.
Sumita Y, Sasaki Y, Ueno T, Yamanaka T, Ohyama T, Taniguchi H. Effect of teeth clenching on muscle
strength during repeated isokinetic knee extensions. Japanese Journal of Physical Fitness and Sports Medicine 2000;49:419-32.
Swedan N. Women's sports medicine and rehabilitation. Gaithesburg, Maryland: Aspen Publishers,
Inc.; 2001.
Takada Y, Miyahara T, Tanaka T, Ohyama T, Nakamura Y. Modulation of h reflex of pretibial muscles
and reciprocal ia inhibition of soleus muscle during voluntary teeth clenching in humans. J Neurophysiol 2000;83:2063-70.
Takahashi M, Ni Z, Yamashita T, Liang N, Sugawara K, Yahagi S, Kasai T. Excitability changes in human
hand motor area induced by voluntary teeth clenching are dependent on muscle properties. Exp Brain Res 2006;171:272-7.
Takahashi T, Ueno T, Taniguchi H, Ohyama T, Nakamura Y. Modulation of h reflex of pretibial and
soleus muscles during mastication in humans. Muscle Nerve 2001;24:1142-8.
Takahashi T, Ueno T, Ohyama T. Modulation of h reflexes in the forearm during voluntary teeth
clenching in humans. Eur J Appl Physiol 2003;90:651-3.
Torisu T, Wang K, Svensson P, De Laat A, Fujii H, Arendt-Nielsen L. Effects of muscle fatigue induced
by low-level clenching on experimental muscle pain and resting jaw muscle activity: Gender differences. Exp Brain Res 2006;174:566-74.
Tuncer M, Tucker KJ, Türker KS. Influence of tooth clench on the soleus h-reflex. Archives of Oral
Biology 2007;52:374-6.
71
Tuxen A, Bakke M, Pinholt EM. Comparative data from young men and women on masseter muscle
fibres, function and facial morphology. Arch Oral Biol 1999;44:509-18.
Uchida S, Iwasaki LR, Marx DB, Yotsui Y, Inoue H, Nickel JC. Variations in activities of human jaw
muscles depend on tooth-tipping moments. Arch Oral Biol 2008;53:199-205.
Ueno T. [study on relationship between teeth clenching in intercuspal position and isometric
movement of upper limbs]. Kokubyo Gakkai Zasshi 1995;62:212-53.
Ueno T. Sports dentistry through physiological approach-its past and present. International Journal
of Sports Densitry 2006;1:031-45.
Velly AM, Gornitsky M, Philippe P. Contributing factors to chronic myofascial pain: A case–control
study. Pain 2003;104:491-9.
Venegas M, Valdivia J, Fresno MJ, Miralles R, Gutierrez MF, Valenzuela S, Fuentes A. Clenching and
grinding: Effect on masseter and sternocleidomastoid electromyographic activity in healthy subjects. Cranio 2009;27:159-66.
Visser A, McCarroll RS, Naeije M. Masticatory muscle activity in different jaw relations during
submaximal clenching efforts. J Dent Res 1992;71:372-9.
Waltimo A, Kononen M. A novel bite force recorder and maximal isometric bite force values for
healthy young adults. Scand J Dent Res 1993;101:171-5.
Wang K, Lobbezoo F, Svensson P, Arendt-Nielsen L. Influence of jaw gape on emg of jaw muscles and
jaw-stretch reflexes. Arch Oral Biol 2007;52:562-70.
Watanabe T, Ichikawa K, Clark GT. Bruxism levels and daily behaviors: 3 weeks of measurement and
correlation. J Orofac Pain 2003;17:65-73.
Wilkinson L, Scholey A, Wesnes K. Chewing gum selectively improves aspects of memory in healthy
volunteers. Appetite 2002;38:235-6.
Winocur E, Littner D, Adams I, Gavish A. Oral habits and their association with signs and symptoms
of temporomandibular disorders in adolescents: A gender comparison. Oral Surg Oral Med Oral Pathol Oral Radiol Endod 2006;102:482-7.
72
Wolfson L, Whipple R, Derby CA, Amerman P, Nashner L. Gender differences in the balance of
healthy elderly as demonstrated by dynamic posturography. J Gerontol 1994;49:M160-7.
Yokoyama Y, Tsutomu I, Toshihiro H. Involuntary teeth clenching during elbow flexion exercise.
Journal of Japanese Society Stomatognathic Function 1996:67-72.
Zhang M, Hasegawa Y, Sakagami J, Ono T, Hori K, Maeda Y, Chen YJ. Effects of unilateral jaw
clenching on cerebral/systemic circulation and related autonomic nerve activity. Physiol Behav 2011;105:292-7.

73
APPENDIX 1
IRB APPROVAL
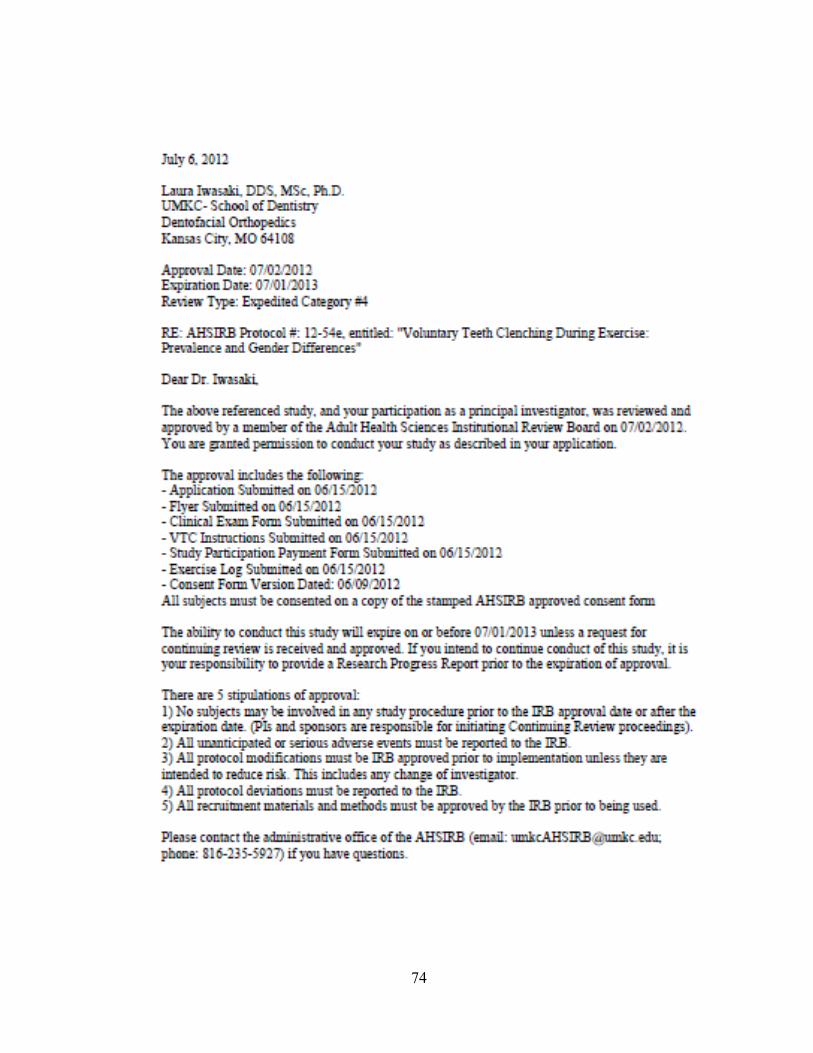
74
75

76
APPENDIX 2
CLINICAL EXAM FORM
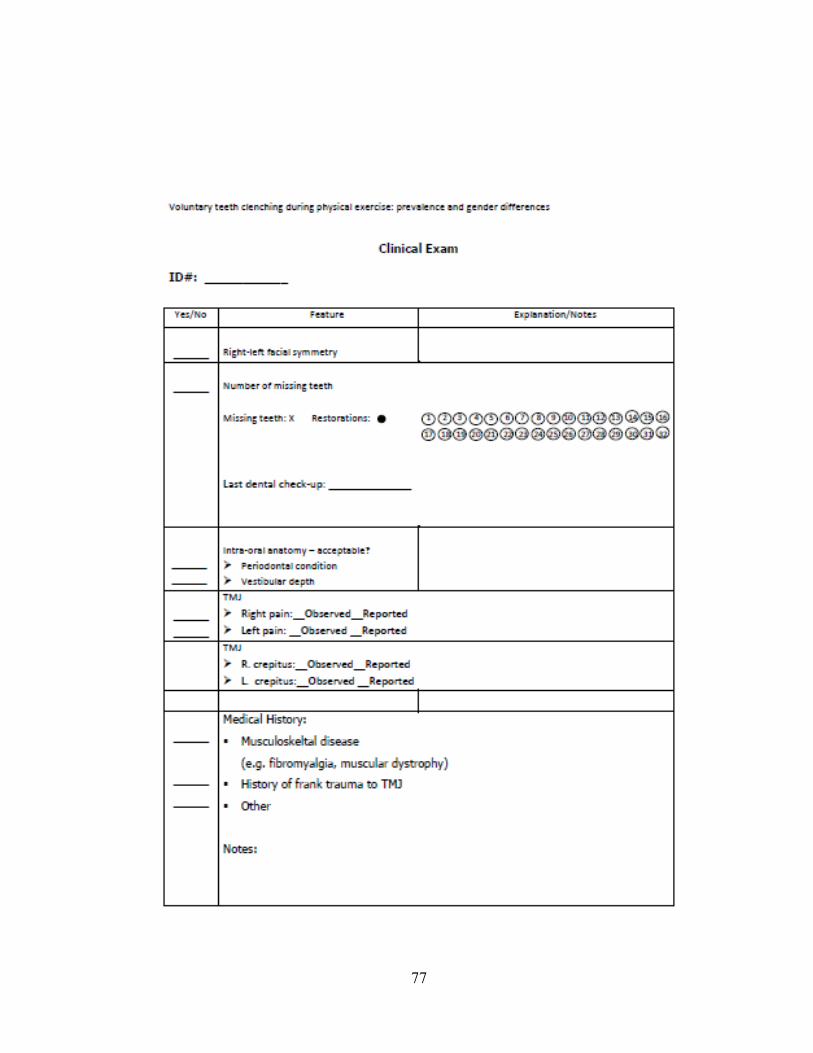
77

78
APPENDIX 3
HIPAA FORM
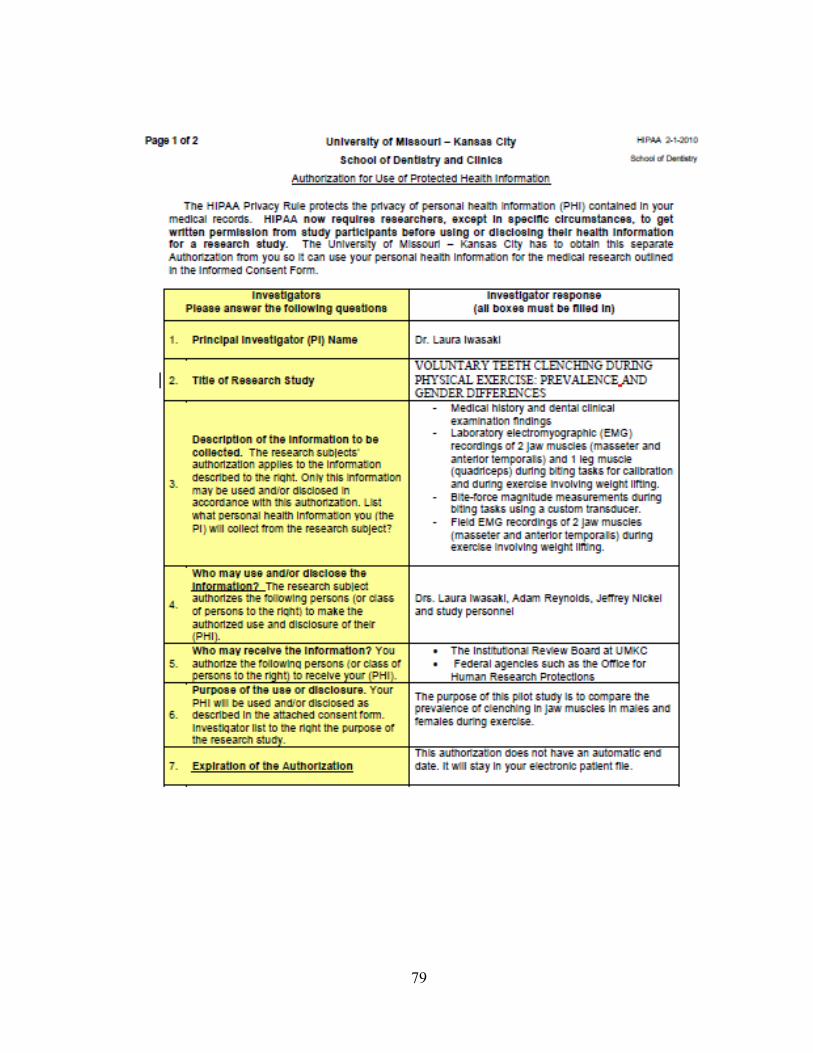
79
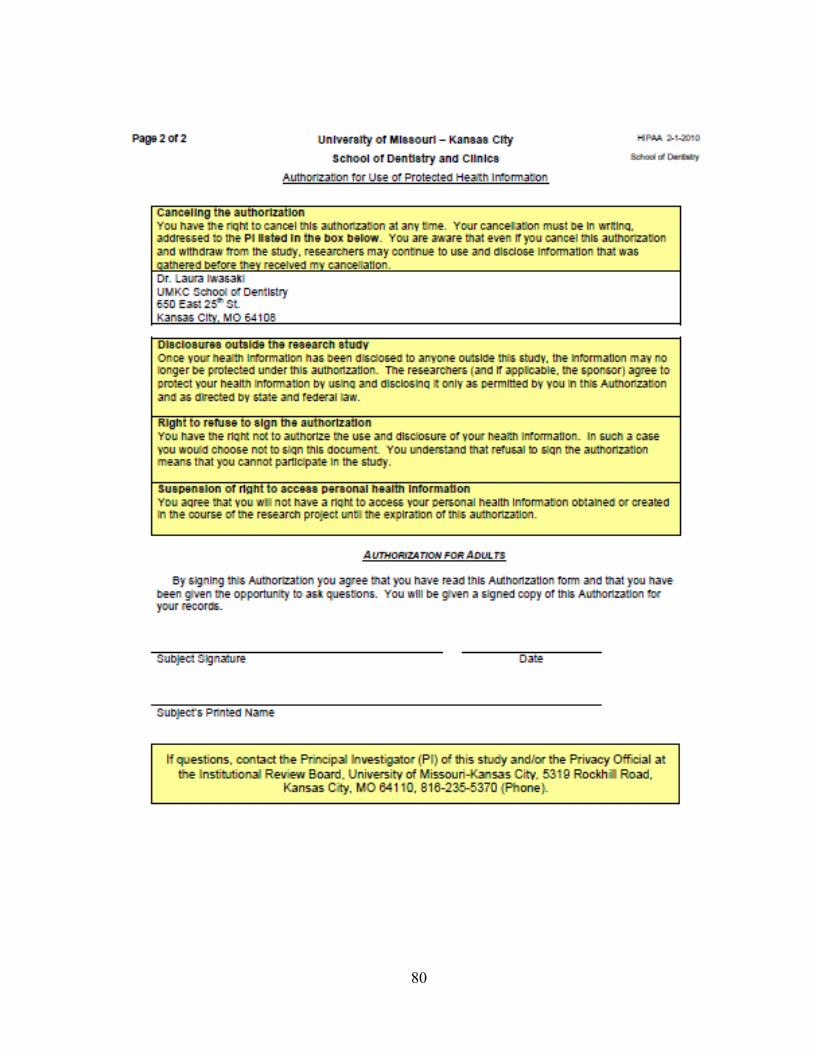
80

81
APPENDIX 4
INFORMED CONSENT FORM
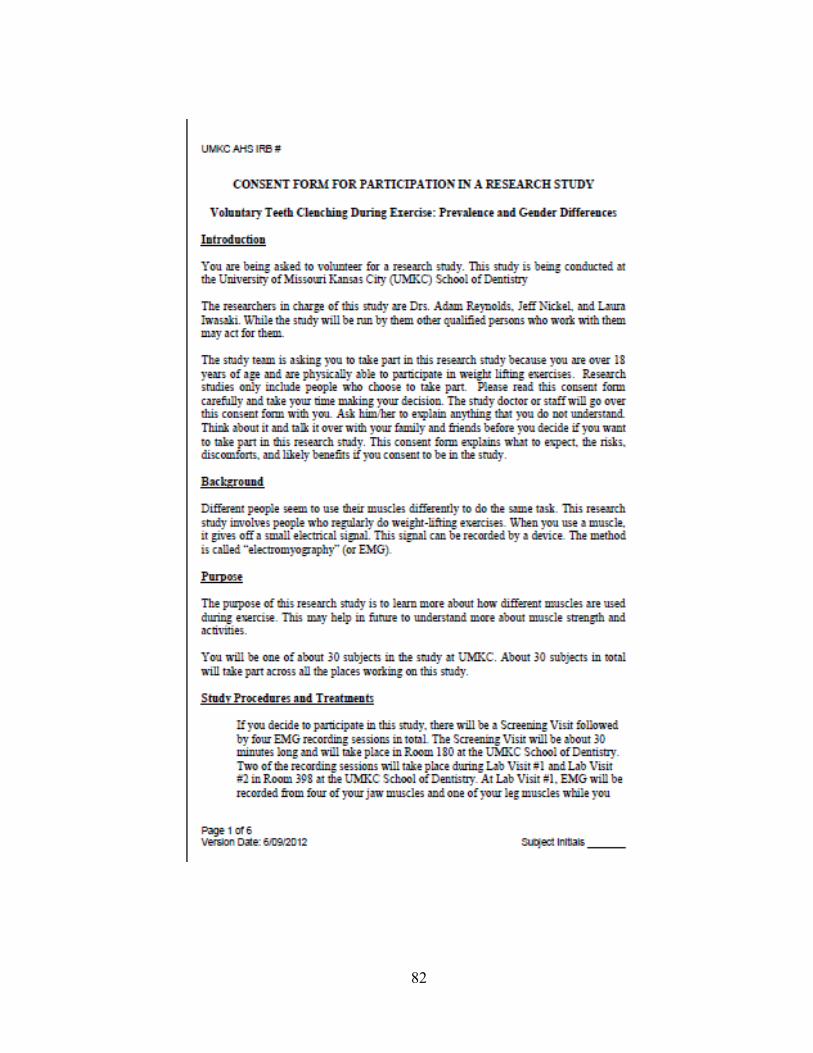
82
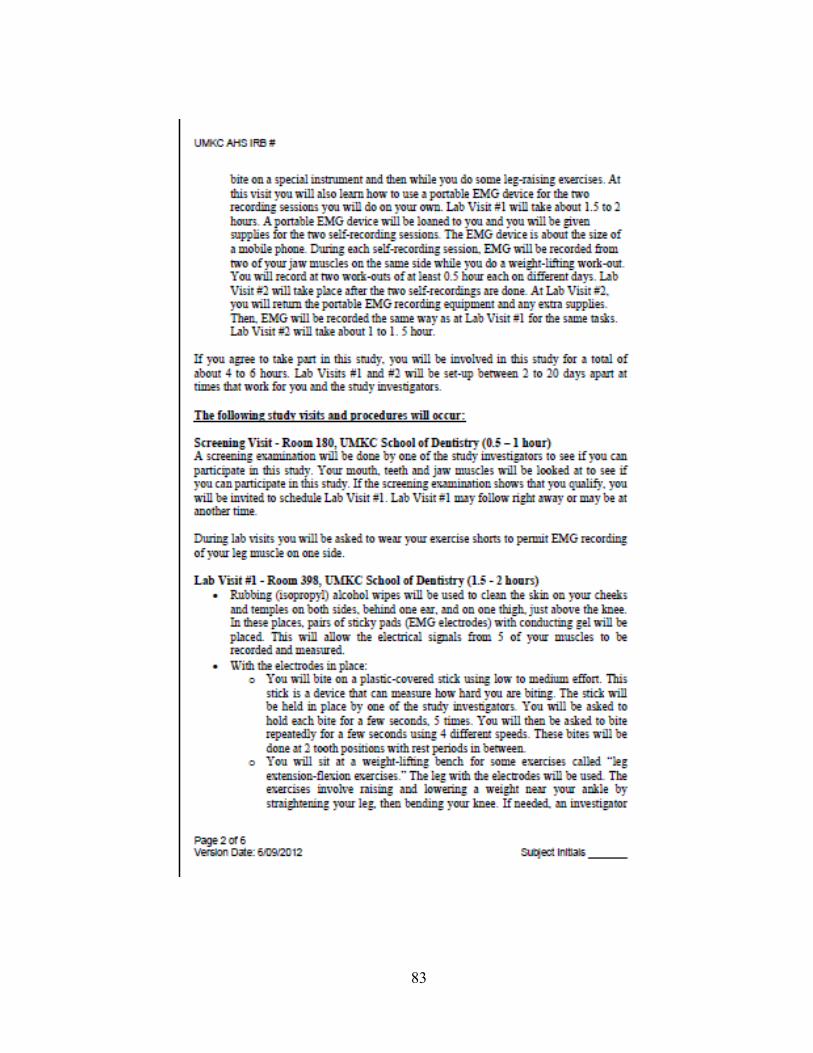
83
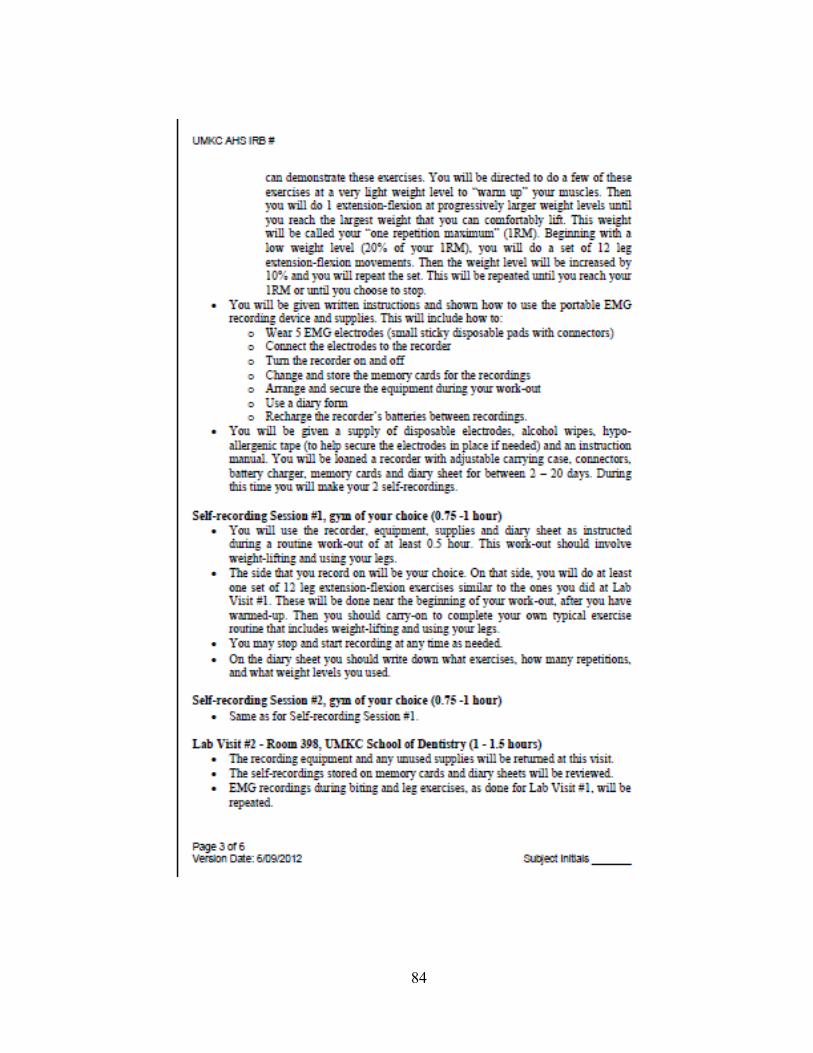
84
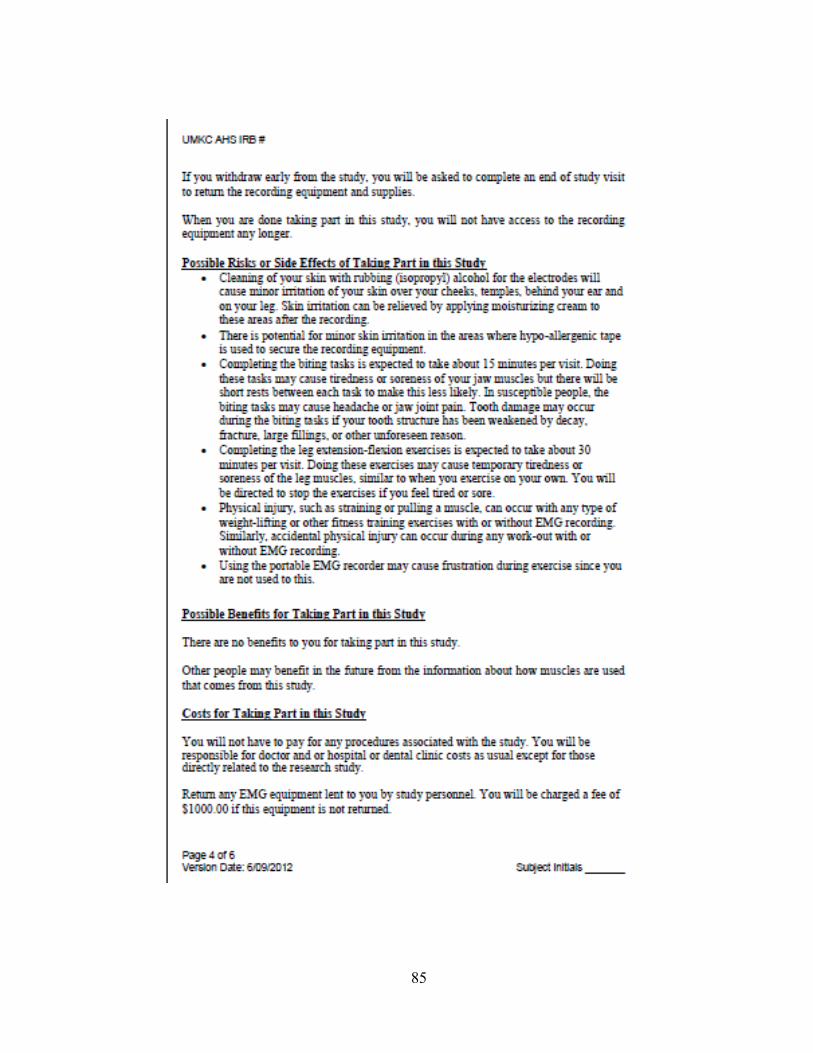
85
86
87

88
APPENDIX 5
BITING TASKS EMG LOG SHEET
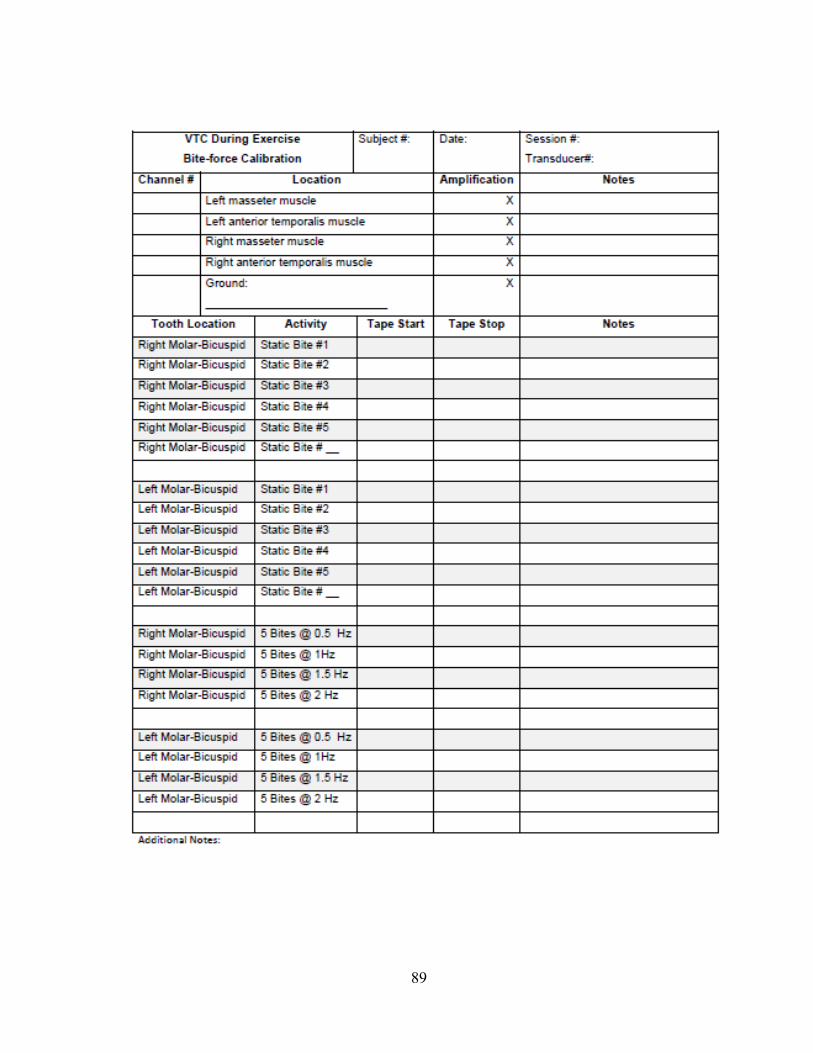
89

90
APPENDIX 6
LABORATORY EXERCISE LOG
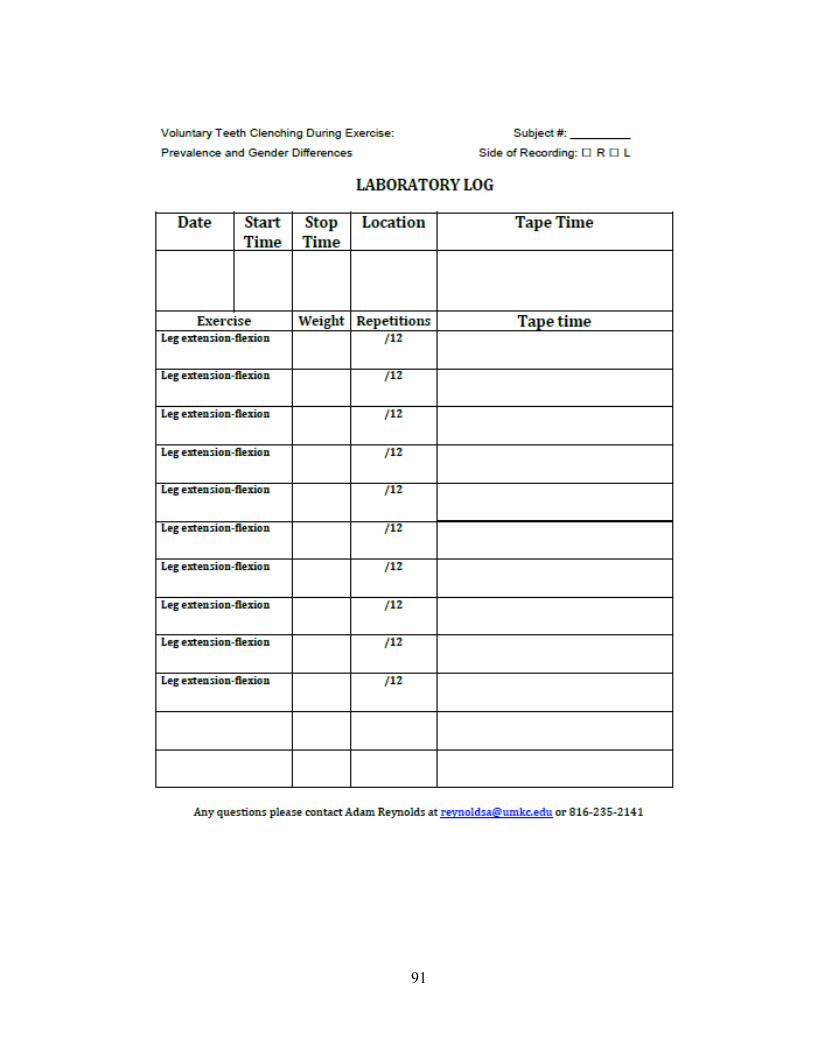
91
92
APPENDIX 7
DIARY SHEET: EXERCISE LOG
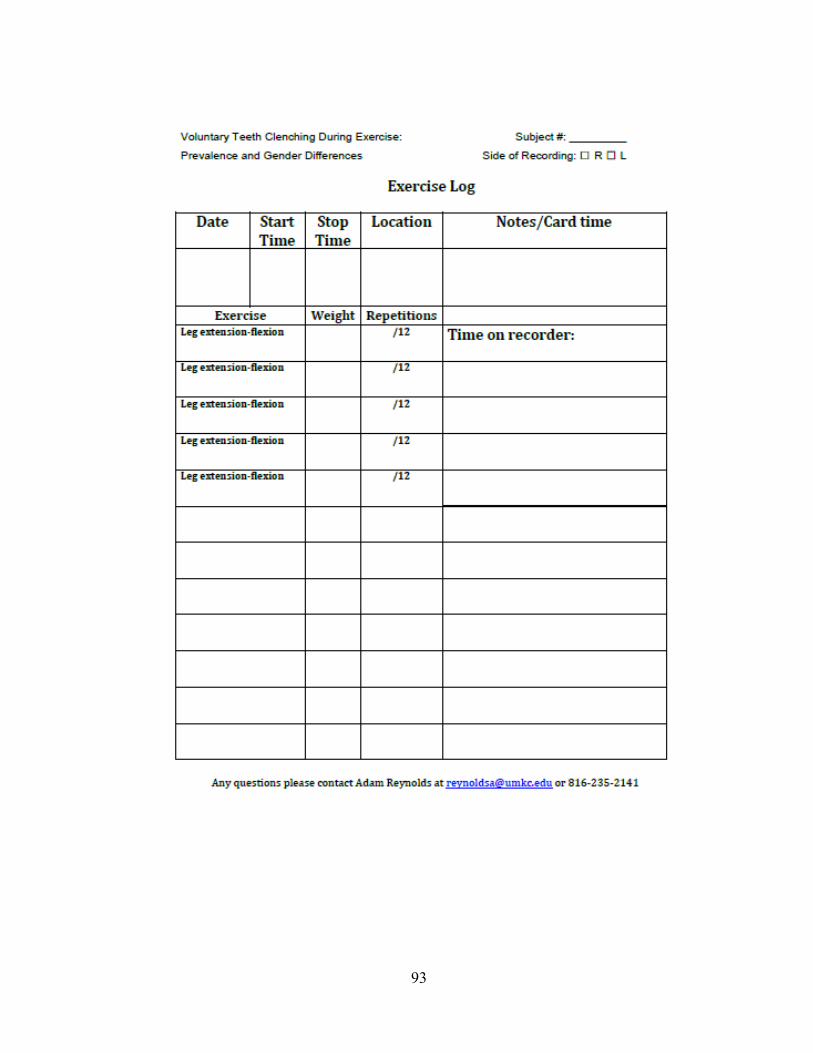
93
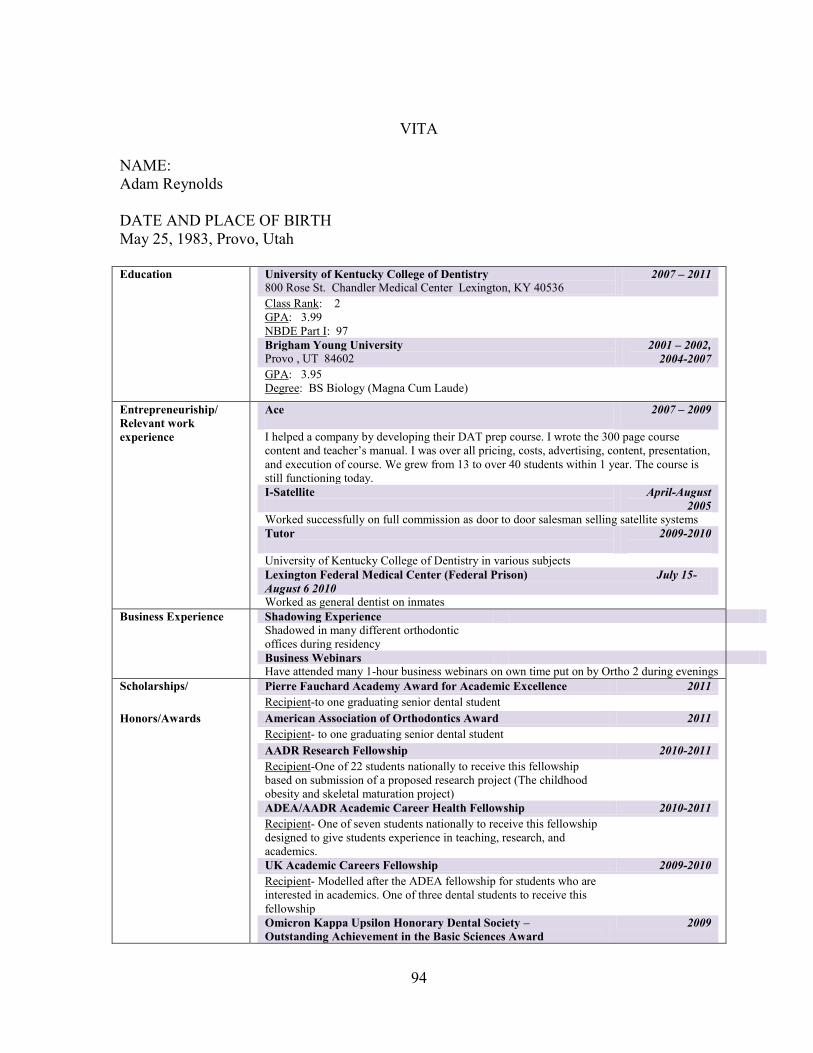
94
VITA
NAME:
Adam Reynolds
DATE AND PLACE OF BIRTH
May 25, 1983, Provo, Utah
Education University of Kentucky College of Dentistry
800 Rose St. Chandler Medical Center Lexington, KY 40536 2007 – 2011
Class Rank: 2
GPA: 3.99
NBDE Part I: 97
Brigham Young University
Provo , UT 84602 2001 – 2002,
2004-2007
GPA: 3.95
Degree: BS Biology (Magna Cum Laude)
Entrepreneuriship/
Relevant work
experience
Ace
2007 – 2009
I helped a company by developing their DAT prep course. I wrote the 300 page course
content and teacher’s manual. I was over all pricing, costs, advertising, content, presentation,
and execution of course. We grew from 13 to over 40 students within 1 year. The course is
still functioning today.
I-Satellite
April-August
2005
Worked successfully on full commission as door to door salesman selling satellite systems
Tutor
2009-2010
University of Kentucky College of Dentistry in various subjects
Lexington Federal Medical Center (Federal Prison) July 15-
August 6 2010 Worked as general dentist on inmates
Business Experience Shadowing Experience
Shadowed in many different orthodontic
offices during residency
Business Webinars
Have attended many 1-hour business webinars on own time put on by Ortho 2 during evenings
Scholarships/
Honors/Awards
Pierre Fauchard Academy Award for Academic Excellence 2011
Recipient-to one graduating senior dental student
American Association of Orthodontics Award 2011
Recipient- to one graduating senior dental student
AADR Research Fellowship 2010-2011
Recipient-One of 22 students nationally to receive this fellowship
based on submission of a proposed research project (The childhood
obesity and skeletal maturation project)
ADEA/AADR Academic Career Health Fellowship 2010-2011
Recipient- One of seven students nationally to receive this fellowship
designed to give students experience in teaching, research, and
academics.
UK Academic Careers Fellowship 2009-2010
Recipient- Modelled after the ADEA fellowship for students who are
interested in academics. One of three dental students to receive this
fellowship
Omicron Kappa Upsilon Honorary Dental Society –
Outstanding Achievement in the Basic Sciences Award
2009
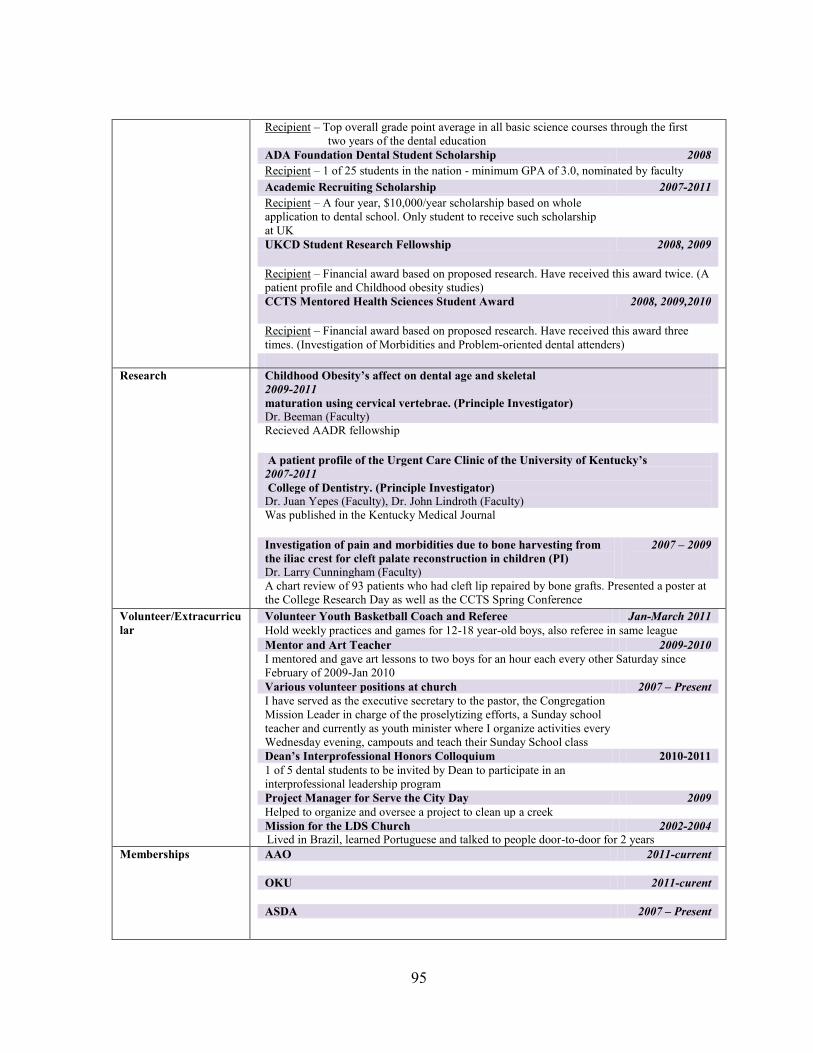
95
Recipient – Top overall grade point average in all basic science courses through the first
two years of the dental education
ADA Foundation Dental Student Scholarship 2008
Recipient – 1 of 25 students in the nation - minimum GPA of 3.0, nominated by faculty
Academic Recruiting Scholarship 2007-2011
Recipient – A four year, $10,000/year scholarship based on whole
application to dental school. Only student to receive such scholarship
at UK
UKCD Student Research Fellowship 2008, 2009
Recipient – Financial award based on proposed research. Have received this award twice. (A
patient profile and Childhood obesity studies)
CCTS Mentored Health Sciences Student Award 2008, 2009,2010
Recipient – Financial award based on proposed research. Have received this award three
times. (Investigation of Morbidities and Problem-oriented dental attenders)
Research Childhood Obesity’s affect on dental age and skeletal
2009-2011
maturation using cervical vertebrae. (Principle Investigator)
Dr. Beeman (Faculty)
Recieved AADR fellowship
A patient profile of the Urgent Care Clinic of the University of Kentucky’s
2007-2011
College of Dentistry. (Principle Investigator)
Dr. Juan Yepes (Faculty), Dr. John Lindroth (Faculty)
Was published in the Kentucky Medical Journal
Investigation of pain and morbidities due to bone harvesting from
the iliac crest for cleft palate reconstruction in children (PI)
Dr. Larry Cunningham (Faculty)
2007 – 2009
A chart review of 93 patients who had cleft lip repaired by bone grafts. Presented a poster at
the College Research Day as well as the CCTS Spring Conference
Volunteer/Extracurricu
lar
Volunteer Youth Basketball Coach and Referee Jan-March 2011
Hold weekly practices and games for 12-18 year-old boys, also referee in same league
Mentor and Art Teacher 2009-2010
I mentored and gave art lessons to two boys for an hour each every other Saturday since
February of 2009-Jan 2010
Various volunteer positions at church 2007 – Present
I have served as the executive secretary to the pastor, the Congregation
Mission Leader in charge of the proselytizing efforts, a Sunday school
teacher and currently as youth minister where I organize activities every
Wednesday evening, campouts and teach their Sunday School class
Dean’s Interprofessional Honors Colloquium 2010-2011
1 of 5 dental students to be invited by Dean to participate in an
interprofessional leadership program
Project Manager for Serve the City Day 2009
Helped to organize and oversee a project to clean up a creek
Mission for the LDS Church 2002-2004
Lived in Brazil, learned Portuguese and talked to people door-to-door for 2 years
Memberships AAO 2011-current
OKU 2011-curent
ASDA 2007 – Present
96
Extracurricular/
Hobbies
Spending time with my wife and 2 sons
Louisville marathon- completed my first marathon in April, missed qualifying for Boston by
11min. Finished 60th overall out of 1800
Sports – Playing soccer weekly, as well as basketball and tennis
Adventure Race- (did it in November 2009-60 mile race of hiking/biking/canoeing).
Reading-I have read over 80 books since dental school started for pleasure and leisure.


![WELCOME! [] · Clenching or grinding your teeth Teeth sensitive to cold, heat, pressure or sweets ... Whitening YES YES YES YES NO NO NO NO ... 8505 Arlington Blvd., Suite 260. Fairfax,](https://img.pdfslide.net/doc/110x75/5f93d6bf7451bd03964e7bcc/welcome-clenching-or-grinding-your-teeth-teeth-sensitive-to-cold-heat-pressure.jpg)