Embed Size (px)
Citation preview

449
Vote 24 Agriculture, Forestry and Fisheries Budget summary
2017/18 2018/19 2019/20
R million Total Current
payments Transfers and
subsidies Payments for capital assets Total Total
MTEF allocation Administration 902.5 848.9 19.1 34.5 945.7 954.3Agricultural Production, Health and Food Safety 2 197.2 683.5 1 511.4 2.3 2 305.9 2 446.4Food Security and Agrarian Reform 1 946.8 272.2 1 638.1 36.5 2 035.8 2 302.8Trade Promotion and Market Access 261.7 138.6 122.8 0.3 274.2 291.7Forestry and Natural Resources Management 1 016.7 758.0 221.3 37.4 1 073.4 1 044.2Fisheries 482.2 220.2 262.0 – 504.5 537.3Total expenditure estimates 6 807.0 2 921.5 3 774.6 111.0 7 139.4 7 576.8Executive authority Minister of Agriculture, Forestry and Fisheries Accounting officer Director General of Agriculture, Forestry and Fisheries Website address www.daff.gov.za The Estimates of National Expenditure e-publications for individual votes are available on www.treasury.gov.za. These publications provide more comprehensive coverage of vote specific information, particularly about goods and services, transfers and subsidies, personnel, entities, donor funding, public private partnerships, conditional grants to provinces and municipalities, and expenditure information at the level of site service delivery, where appropriate.
Vote purpose Lead, support and promote agricultural, forestry and fisheries resources management through policies, strategies and programmes to enhance sustainable use, and achieve economic growth, job creation, food security, rural development and transformation.
Mandate The mandate of the Department of Agriculture, Forestry and Fisheries includes value chains, inputs, production and consumption in the agriculture, forestry and fishery sectors. The department’s mandate is derived from a range of legislation, including the Sea Fisheries Act (1988), the National Forests Act (1988), the Agricultural Products Standards Act (1990), and the Conservation of Agricultural Resources Act (1993).
Selected performance indicators Table 24.1 Performance indicators by programme and related outcome Indicator Programme Outcome Past Current Projections
2013/14 2014/15 2015/16 2016/17 2017/18 2018/19 2019/20 Number of animal and plant improvement schemes for prioritised value-chain commodities monitored per year
Agricultural Production, Health and Food Safety
Outcome 7: Comprehensive rural development and land reform
–1 4 4 4 4 4 4
Number of surveillances on plant diseases conducted per year
Agricultural Production, Health and Food Safety
1 1 1 1 1 1 1
Number of surveillances on animal diseases conducted per year
Agricultural Production, Health and Food Safety
2 2 2 2 2 2 1
Number of mobile veterinary clinics provided to improve animal health in rural areas per year
Agricultural Production, Health and Food Safety
27 41 18 32 –2 –2 –2
Number of veterinary graduates deployed for the compulsory veterinary services programme per year
Agricultural Production, Health and Food Safety
–1 –1 126 140 150 150 170
Number of subsistence and smallholder producers supported per year
Food Security and Agrarian Reform
56 0003 156 500 145 000 145 000 145 000 145 000 145 000

2017 Estimates of National Expenditure
450
Table 24.1 Performance indicators by programme and related outcome Indicator Programme Outcome Past Current Projections
2013/14 2014/15 2015/16 2016/17 2017/18 2018/19 2019/20 Number of hectares in underutilised areas cultivated in communal areas per year
Food Security and Agrarian Reform
Outcome 7: Comprehensive rural development and land reform
154 211 ha 107 151 ha 120 000 ha 120 000 ha 120 000 ha 120 000 ha 120 000 ha
Number of jobs created through the comprehensive agricultural support programme and Ilima/Letsema funded projects per year
Food Security and Agrarian Reform
Outcome 4: Decent employment through inclusive growth
–1 10 000 10 000 15 000 20 000 20 000 20 000
Number of agro-processing entrepreneurs trained in processing norms and standards per year
Trade Promotion and Market Access
Outcome 7: Comprehensive rural development and land reform
–1 –1 –1 12 14 18 18
Number of hectares of land restored through reforestation and land rehabilitation per year
Forestry and Natural Resources Management
Outcome 10: Protect and enhance our environmental assets and natural resources
40 941 ha 30 500 ha 30 500 ha 16 300 ha 16 300 ha 16 300 ha 16 300 ha
Number of jobs created through the refurbishment of category B and C plantations in the expanded public works programme per year
Forestry and Natural Resources Management
Outcome 4: Decent employment through inclusive growth
1 987 2 400 2 400 1 575 1 575 1 575 1 575
Number of hectares of temporary unplanted areas planted per year
Forestry and Natural Resources Management
Outcome 10: Protect and enhance our environmental assets and natural resources
12 925 ha 2 300 ha 2 300 ha 1 725 ha 1 725 ha 1 725 ha 1 725 ha
Number of full-time-equivalent LandCare jobs created per year
Forestry and Natural Resources Management
Outcome 4: Decent employment through inclusive economic growth
1 431 9005 800 800 800 800 800
Number of job opportunities created in the Working for Fisheries programme per year4
Fisheries 1 431 1 250 5355 600 558 558 558
1. No historical data available. 2. No target for 2017/18 to 2019/20 as no more mobile clinics will be procured since rural areas have been fully capacitated with animal clinics. 3. In 2013/14 it was measured as number of households. 4. Previously reported by the Marine Living Resources Fund. 5. The decrease is a result of budget reprioritisation and less allocations for the programme.
Expenditure analysis Over the medium term, the Department of Agriculture, Forestry and Fisheries will focus on improving food security, creating decent jobs, and sustainably increasing the contribution of the agriculture, forestry and fisheries sectors to GDP. Through pursuing these objectives, the department contributes to the realisation of the goal of the National Development Plan (NDP) to eliminate poverty and reduce inequality by 2030, and outcome 4 (decent employment through inclusive growth), outcome 7 (comprehensive rural development and land reform) and outcome 10 (protect and enhance our environmental assets and natural resources) of government’s 2014-2019 medium-term strategic framework.
Improving food security Over the medium term, the department plans to support around 435 000 subsistence and smallholder farmers through: providing farm equipment, fencing, fertilisers, seedlings and other essentials; disbursing a grant through the comprehensive agricultural support programme; and repairing flood-damaged infrastructure. The department will support the agri-park initiative, in collaboration with the Department of Rural Development and Land Reform. The initiative aims to establish and maintain producer support infrastructure such as markets and agro-processing facilities; create networks and provide logistical services for producers and input suppliers; and coordinate activities for producer support and development to create jobs and develop rural economies. Through the R5.3 billion comprehensive agriculture support programme grant, the department will play a crucial role in supporting smallholder farmers who will supply produce to agri-park initiatives across South Africa. The department will also provide support to farmers by putting 1 million hectares of land into production, and provide farmers with advisory services and training on the basic components of food security.

Vote 24: Agriculture, Forestry and Fisheries
451
The department plans to increase financial support to emerging producers by R370 million over the medium term, which will be accessed through the Land and Agricultural Development Bank of South Africa.
This amount has been reprioritised from funding for provincial conditional grants, and will provide loans to qualifying producers. The loans will improve producers’ access to production inputs (such as fertilisers, seeds, seedlings and chemicals) and farm infrastructure, to increase the participation of emerging producers in the agriculture, forestry and fisheries sectors.
The department plans to spend R241 million on an agricultural census in collaboration with Statistics South Africa. The census will create a registry of subsistence, smallholder and commercial farmers, and gather baseline information. The gathered information will be used to properly target support to farmers, avoid duplicating support to emerging farmers, and allow for a proper ratio of extension officers to ensure the productivity of emerging farmers.
The department aims to deploy at least 150 veterinarians each year over the medium term, to strengthen primary animal health care, support smallholder animal production, and contribute to productivity and food security. This initiative will be supported by an allocation of R403 million over the medium term, in the Agricultural Production, Health and Food Safety programme.
Creating decent employment The department plans to support the production of commodities such as red meat, poultry, fruit, vegetables, wine and wheat. This is expected to contribute to job creation, food security, growth and the export-import trade balance. To contribute to the creation of 60 000 job opportunities over the medium term, the department plans to spend more than R1.7 billion on the Ilima/Letsema projects grant, which is transferred to provinces for food production initiatives.
The department’s LandCare programme grant promotes sustainable land and soil management practices, and the prevention of land degradation and desertification in rural areas, thereby contributing to job creation through the establishment of more arable farmland. Over the medium term, the programme is projected to create 4 725 local jobs through refurbishing forested and deforested plantations; and 2 400 full-time-equivalent local jobs through rehabilitating 48 900 hectares of land by reducing the spread of invasive alien plants, erecting fencing and protecting agricultural land from degradation. About R233.7 million will be allocated towards the LandCare programme grant over the medium term.
The ocean economy Operation Phakisa is expected to increase the production of fish from 4 000 tonnes per year to 20 000 tonnes per year, over the medium term. This is expected to create 2 500 direct new jobs and 15 000 jobs in the fisheries value chain by 2020. Over the medium term the department will spend R121 million in the Aquaculture subprogramme in the Fisheries programme to support Operation Phakisa initiatives. An additional 1 674 jobs in the fisheries sector are expected to be created over the medium term, in the expanded public works programme through the Working for Fisheries project, which is implemented by the Marine Living Resources Fund. An additional amount of R29.7 million over the period has been allocated to support this.
Contributing to GDP The impact of the nationwide drought has had a devastating effect on the agriculture sector and its value chain. The Minister of Finance, in collaboration with the department and the private sector, is working on initiatives to ensure higher agricultural production, efficient water licensing, the facilitation of agricultural exports, and increased efficiency to increase agriculture’s contribution to GDP. Crop and livestock production decreased sharply in 2016/17. Maize production, for example, decreased by 24 per cent, from 7.54 million tonnes in 2015/16 to 5.7 million tonnes in 2016/17. Higher yields are expected in 2017/18 as the drought is predicted to end.
The department expects to spend R644 million on infrastructure projects over the medium term, R75.4 million of which is allocated for the maintenance and erection of fences along the borders of the Kruger National Park. The erection of these fences plays a critical role in the management of the incidence and the spread of foot-and-mouth disease, which has a negative impact on the export of red meat products.

2017 Estimates of National Expenditure
452
Expenditure trends Table 24.2 Vote expenditure trends by programme and economic classification Programmes 1. Administration 2. Agricultural Production, Health and Food Safety 3. Food Security and Agrarian Reform 4. Trade Promotion and Market Access 5. Forestry and Natural Resources Management 6. Fisheries Programme
Ann
ual b
udge
t
Adj
uste
d
appr
opria
tion
Aud
ited
ou
tcom
e
Ann
ual b
udge
t
Adj
uste
d
appr
opria
tion
Aud
ited
ou
tcom
e
Ann
ual b
udge
t
Adj
uste
d
appr
opria
tion
Aud
ited
ou
tcom
e
Ann
ual b
udge
t
Adj
uste
d
appr
opria
tion
Rev
ised
es
timat
e
Aver
age:
Ou
tcom
e/Ann
ual
budg
et
(%)
Aver
age:
Ou
tcom
e/Adj
uste
d
appr
opria
tion
(%)
R million 2013/14 2014/15 2015/16 2016/17 2013/14 - 2016/17 Programme 1 663.9 670.9 681.6 694.6 718.9 738.4 729.9 739.4 785.8 788.1 781.4 781.4 103.8% 102.6%Programme 2 2 066.1 2 036.5 2 000.9 2 199.8 2 187.1 2 183.7 2 134.8 2 144.5 2 143.0 1 953.4 1 944.6 1 944.6 99.0% 99.5%Programme 3 1 597.7 1 599.3 1 590.1 1 711.1 1 711.7 1 656.3 1 930.3 1 919.4 1 906.8 1 889.7 1 888.7 1 888.7 98.8% 98.9%Programme 4 231.6 258.2 256.3 294.2 298.3 307.0 238.2 233.9 236.8 297.6 304.0 304.0 104.0% 100.9%Programme 5 1 184.5 1 183.6 1 144.7 1 364.9 1 348.7 1 303.6 906.6 906.2 862.3 945.6 1 137.7 1 137.7 101.1% 97.2%Programme 6 434.0 433.7 437.7 427.8 427.8 439.8 443.3 465.3 465.9 458.6 458.6 458.6 102.2% 100.9%Total 6 178.0 6 182.3 6 111.3 6 692.4 6 692.4 6 628.9 6 383.0 6 408.8 6 400.5 6 333.0 6 515.0 6 515.0 100.3% 99.4%Change to 2016 Budget estimate
182.0
Economic classification Current payments 2 428.4 2 401.6 2 274.6 2 562.4 2 516.3 2 397.0 2 594.1 2 540.2 2 479.2 2 724.6 2 846.2 2 846.2 97.0% 97.0%Compensation of employees 1 656.0 1 603.3 1 525.0 1 697.9 1 698.4 1 661.6 1 737.8 1 763.0 1 761.1 2 055.4 1 992.6 1 992.6 97.1% 98.3%Goods and services 770.4 797.2 749.2 863.3 816.5 735.1 854.8 775.6 718.1 668.2 852.5 852.5 96.8% 94.2%Interest and rent on land 2.1 1.2 0.4 1.2 1.4 0.3 1.5 1.5 – 1.0 1.1 1.1 29.6% 33.4%Transfers and subsidies 3 651.1 3 633.5 3 635.1 4 028.4 4 040.7 4 025.7 3 692.7 3 691.6 3 701.5 3 487.6 3 501.7 3 501.7 100.0% 100.0%Provinces and municipalities 2 148.5 2 152.9 2 149.7 2 390.1 2 390.1 2 363.3 2 189.2 2 172.6 2 172.7 2 203.5 2 203.7 2 203.7 99.5% 99.7%Departmental agencies and accounts
1 313.1 1 269.6 1 251.9 1 354.6 1 354.6 1 338.3 1 132.5 1 138.1 1 125.4 1 113.7 1 110.2 1 110.2 – –
Foreign governments and international organisations
33.7 45.9 46.4 34.7 38.7 38.8 29.5 32.4 31.9 34.5 42.4 42.4 120.5% 100.1%
Public corporations and private enterprises
137.8 139.4 140.1 220.2 222.0 222.3 312.9 314.7 314.8 98.3 98.3 98.3 100.8% 100.1%
Non-profit institutions 16.2 20.3 17.5 26.9 26.8 24.4 26.7 25.9 23.7 17.2 17.0 17.0 94.9% 91.7%Households 1.8 5.4 29.5 1.9 8.4 38.6 1.9 7.9 33.0 20.2 30.0 30.0 506.9% 253.4%Payments for capital assets 98.5 147.1 200.2 101.6 135.4 206.0 96.2 176.9 218.5 120.8 167.2 167.2 189.8% 126.4%Buildings and other fixed structures
38.4 37.7 55.7 42.7 41.3 48.0 42.5 48.6 40.3 67.4 78.3 78.3 116.4% 108.0%
Machinery and equipment 59.2 107.6 143.0 58.2 93.9 157.5 53.2 128.2 178.0 53.3 88.5 88.5 253.4% 135.6%Biological assets 0.7 0.5 0.1 0.8 0.2 – 0.5 0.2 – 0.1 0.1 0.1 8.5% 18.6%Software and other intangible assets
0.2 1.3 1.4 – 0.1 0.4 – – 0.2 0.1 0.3 0.3 778.6% 142.2%
Payments for financial assets – – 1.4 – – 0.2 – – 1.4 – – – – –Total 6 178.0 6 182.3 6 111.3 6 692.4 6 692.4 6 628.9 6 383.0 6 408.8 6 400.5 6 333.0 6 515.0 6 515.0 100.3% 99.4%
Expenditure estimates Table 24.3 Vote expenditure estimates by programme and economic classificationProgrammes 1. Administration 2. Agricultural Production, Health and Food Safety 3. Food Security and Agrarian Reform 4. Trade Promotion and Market Access 5. Forestry and Natural Resources Management 6. Fisheries Programme
Revised estimate
Averagegrowth
rate(%)
Average:Expenditure/
Total(%)
Medium-term expenditure estimate
Averagegrowth
rate(%)
Average:Expenditure/
Total(%)
R million 2016/17 2013/14 - 2016/17 2017/18 2018/19 2019/20 2016/17 - 2019/20 Programme 1 781.4 5.2% 11.6% 902.5 945.7 954.3 6.9% 12.8%Programme 2 1 944.6 -1.5% 32.2% 2 197.2 2 305.9 2 446.4 8.0% 31.7%Programme 3 1 888.7 5.7% 27.4% 1 946.8 2 035.8 2 302.8 6.8% 29.2%Programme 4 304.0 5.6% 4.3% 261.7 274.2 291.7 -1.4% 4.0%Programme 5 1 137.7 -1.3% 17.3% 1 016.7 1 073.4 1 044.2 -2.8% 15.2%Programme 6 458.6 1.9% 7.0% 482.2 504.5 537.3 5.4% 7.1%Total 6 515.0 1.8% 100.0% 6 807.0 7 139.4 7 576.8 5.2% 100.0%Change to 2016 Budget estimate
100.8 140.4 141.7

Vote 24: Agriculture, Forestry and Fisheries
453
Table 24.3 Vote expenditure estimates by programme and economic classificationEconomic classification
Revised estimate
Averagegrowth
rate(%)
Average:Expenditure/
Total(%)
Medium-term expenditure estimate
Averagegrowth
rate(%)
Average:Expenditure/
Total(%)
R million 2016/17 2013/14 - 2016/17 2017/18 2018/19 2019/20 2016/17 - 2019/20 Current payments 2 846.2 5.8% 39.0% 2 920.1 3 002.4 3 159.3 3.5% 42.5%Compensation of employees 1 992.6 7.5% 27.1% 2 105.8 2 177.3 2 343.2 5.6% 30.7%Goods and services 852.5 2.3% 11.9% 814.4 825.2 816.1 -1.4% 11.8%Interest and rent on land 1.1 -2.7% – – – – -100.0% –Transfers and subsidies 3 501.7 -1.2% 57.9% 3 774.6 4 014.0 4 288.0 7.0% 55.6%Provinces and municipalities 2 203.7 0.8% 34.6% 2 242.8 2 382.2 2 542.8 4.9% 33.4%Departmental agencies and accounts 1 110.2 -4.4% 18.8% 1 300.3 1 375.0 1 451.9 9.4% 18.7%Foreign governments and international organisations 42.4 -2.6% 0.6% 36.3 37.6 39.7 -2.2% 0.6%Public corporations and private enterprises 98.3 -11.0% 3.0% 150.8 173.8 206.8 28.1% 2.2%Non-profit institutions 17.0 -5.8% 0.3% 19.8 20.1 20.4 6.2% 0.3%Households 30.0 77.4% 0.5% 24.6 25.3 26.5 -4.0% 0.4%Payments for capital assets 167.2 4.3% 3.1% 111.0 121.6 127.9 -8.5% 1.9%Buildings and other fixed structures 78.3 27.6% 0.9% 63.8 72.1 76.0 -1.0% 1.0%Machinery and equipment 88.5 -6.3% 2.2% 47.0 49.3 51.7 -16.4% 0.8%Biological assets 0.1 -41.7% – 0.1 0.1 0.1 8.9% –Software and other intangible assets 0.3 -41.3% – 0.1 0.1 0.1 -41.1% –Total 6 515.0 1.8% 100.0% 6 805.7 7 138.0 7 575.3 5.2% 100.0%
Goods and services expenditure trends and estimates Table 24.4 Vote goods and services expenditure trends and estimates
Audited outcome Adjusted
appropriation
Averagegrowth
rate(%)
Average: Expen-diture/
Total(%)
Medium-term expenditure estimate
Averagegrowth
rate(%)
Average:Expen-diture/
Total(%)
R thousand 2013/14 2014/15 2015/16 2016/17 2013/14 - 2016/17 2017/18 2018/19 2019/20 2016/17 - 2019/20 Administrative fees 3 247 3 547 10 647 7 153 30.1% 0.8% 5 665 6 178 6 521 -3.0% 0.8%Advertising 22 189 26 480 8 104 9 807 -23.8% 2.2% 11 234 14 962 12 418 8.2% 1.5%Minor assets 6 676 6 851 7 178 9 552 12.7% 1.0% 13 726 7 730 8 160 -5.1% 1.2%Audit costs: External 9 918 10 362 10 816 12 044 6.7% 1.4% 14 303 14 181 16 031 10.0% 1.7%Bursaries: Employees 2 678 2 724 2 417 4 884 22.2% 0.4% 6 571 5 666 5 986 7.0% 0.7%Catering: Departmental activities 1 297 813 740 942 -10.1% 0.1% 344 362 382 -26.0% 0.1%Communication 26 559 27 791 29 115 23 531 -4.0% 3.5% 25 032 24 872 25 705 3.0% 3.0%Computer services 43 298 35 424 11 530 22 099 -20.1% 3.7% 43 823 44 555 45 557 27.3% 4.7%Consultants: Business and advisory services 33 953 20 540 22 985 12 547 -28.2% 2.9% 8 201 8 146 8 598 -11.8% 1.1%Infrastructure and planning services 13 045 6 957 3 708 11 455 -4.2% 1.2% – – – -100.0% 0.3%Laboratory services 568 232 219 2 756 69.3% 0.1% 209 217 229 -56.4% 0.1%Legal services 3 739 8 519 5 334 3 770 0.3% 0.7% 1 931 2 016 2 129 -17.3% 0.3%Contractors 23 610 24 249 9 505 27 415 5.1% 2.8% 21 914 18 997 19 887 -10.1% 2.7%Agency and support/outsourced services 53 348 30 695 24 636 32 193 -15.5% 4.6% 150 163 163 348 115 846 53.2% 14.0%Entertainment 503 776 306 370 -9.7% 0.1% 428 461 477 8.8% 0.1%Fleet services (including government motor transport)
18 507 18 459 21 936 15 931 -4.9% 2.4% 21 047 18 931 22 014 11.4% 2.4%
Inventory: Clothing material and accessories – – 823 891 – 0.1% 3 160 3 377 3 600 59.3% 0.3%Inventory: Farming supplies 14 607 7 708 17 959 231 046 151.0% 8.9% 14 921 15 681 16 940 -58.1% 8.4%Inventory: Food and food supplies 389 474 1 132 1 530 57.9% 0.1% 2 750 2 300 2 500 17.8% 0.3%Inventory: Fuel, oil and gas 54 266 952 826 148.2% 0.1% 1 882 2 209 2 581 46.2% 0.2%Inventory: Learner and teacher support material 51 – – – -100.0% – – – – – – Inventory: Materials and supplies – 36 922 254 – – 1 654 871 918 53.5% 0.1%Inventory: Medical supplies – – 31 1 352 – – 1 501 1 501 1 585 5.4% 0.2%Inventory: Medicine 6 142 970 49 2 053 -30.6% 0.3% 4 463 4 834 5 267 36.9% 0.5%Inventory: Other supplies 1 121 1 123 612 749.0% 0.1% 3 105 2 910 3 022 70.3% 0.3%Consumable supplies 41 620 42 602 20 814 25 022 -15.6% 4.3% 40 572 32 361 33 793 10.5% 4.0%Consumables: Stationery, printing and office supplies
12 601 10 707 8 826 16 779 10.0% 1.6% 22 458 20 844 23 979 12.6% 2.5%
Operating leases 85 732 84 510 90 460 51 038 -15.9% 10.2% 39 670 29 068 29 153 -17.0% 4.5%Rental and hiring 5 027 69 10 886 -43.9% 0.2% 1 908 2 019 2 133 34.0% 0.2%Property payments 112 589 144 315 155 660 145 766 9.0% 18.3% 165 837 178 624 188 627 9.0% 20.5%Transport provided: Departmental activity – – – 8 – – 15 20 21 37.9% – Travel and subsistence 119 279 128 554 131 940 113 078 -1.8% 16.1% 114 496 127 310 137 030 6.6% 14.9%Training and development 34 675 39 370 30 372 34 523 -0.1% 4.5% 43 396 44 609 47 653 11.3% 5.1%Operating payments 15 500 20 289 18 420 19 924 8.7% 2.4% 18 689 16 136 17 025 -5.1% 2.2%Venues and facilities 37 831 30 685 69 393 10 458 -34.9% 4.9% 9 307 9 869 10 338 -0.4% 1.2%Total 749 233 735 095 718 062 852 495 4.4% 100.0% 814 375 825 165 816 105 -1.4% 100.0%

2017 Estimates of National Expenditure
454
Transfers and subsidies expenditure trends and estimates Table 24.5 Vote transfers and subsidies trends and estimates
Audited outcome Adjusted
appropriation
Averagegrowth
rate(%)
Average: Expen-diture/
Total(%)
Medium-term expenditure estimate
Averagegrowth
rate(%)
Average: Expen-diture/
Total(%)
R thousand 2013/14 2014/15 2015/16 2016/17 2013/14 - 2016/17 2017/18 2018/19 2019/20 2016/17 - 2019/20 Provinces and municipalities Provincial revenue funds Current 2 148 594 2 362 161 2 171 450 2 202 452 0.8% 59.8% 2 241 689 2 381 106 2 541 649 4.9% 60.1%Ilima/Letsema projects grant 438 456 460 625 466 713 491 363 3.9% 12.5% 522 139 552 423 583 359 5.9% 13.8%Comprehensive agricultural support programme grant: Infrastructure
905 746 929 529 1 167 779 1 148 115 8.2% 27.9% 1 112 138 1 164 764 1 350 208 5.6% 30.7%
Comprehensive agricultural support programme grant: Extension recovery planning service
339 927 352 708 343 873 346 149 0.6% 9.3% 337 906 355 649 380 544 3.2% 9.1%
Comprehensive agricultural support programme grant: Upgrading of provincial agricultural colleges
55 388 57 701 69 473 70 826 8.5% 1.7% 56 831 74 461 79 673 4.0% 1.8%
Land care programme grant: Poverty relief and infrastructure development
105 823 67 837 65 011 69 265 -13.2% 2.1% 73 604 77 873 82 234 5.9% 1.9%
Comprehensive agricultural support programme grant: Disasters (flood damaged infrastructure)
303 254 493 761 58 601 76 734 -36.8% 6.3% 139 071 155 936 65 631 -5.1% 2.8%
Provinces and municipalities Municipal bank accounts Current 1 107 1 188 1 273 1 233 3.7% – 1 104 1 130 1 157 -2.1% – Vehicle licences 607 688 773 633 1.4% – 504 530 557 -4.2% – National Arbor City Awards 500 500 500 600 6.3% – 600 600 600 – – Departmental agencies and accounts Departmental agencies (non-business entities) Current 1 150 318 1 230 590 1 012 771 991 601 -4.8% 29.5% 1 175 725 1 243 263 1 312 763 9.8% 30.3%Communication 27 26 27 28 1.2% – 29 30 32 4.6% – Public Service Sector Education and Training Authority
– – 370 – – – – – – – –
Primary Agriculture Sector Education and Training Authority
1 672 901 937 1 175 -11.1% – 1 207 1 248 1 343 4.6% –
National Research Foundation 7 000 15 000 20 841 15 697 30.9% 0.4% 17 310 18 647 19 691 7.8% 0.5%Fibre Processing and Manufacturing Sector Education and Training Authority
– 446 429 462 – – 464 480 517 3.8% –
Agricultural Research Council 848 655 921 456 691 484 694 570 -6.5% 21.2% 850 232 899 534 949 896 11.0% 21.8%Perishable Products Export Control Board 600 600 600 600 – – 600 600 600 – – National Agricultural Marketing Council 33 819 36 005 34 635 35 005 1.2% 0.9% 41 917 44 348 46 831 10.2% 1.1%Small Enterprise Development Agency 2 000 1 825 1 825 305 -46.6% – – – – -100.0% – Water Research Commission 3 000 3 000 3 000 2 000 -12.6% 0.1% 2 000 2 000 2 000 – 0.1%Marine Living Resources Fund 253 545 251 331 258 623 241 759 -1.6% 6.8% 261 966 276 376 291 853 6.5% 6.9%Capital 101 599 107 695 112 649 118 619 5.3% 3.0% 124 551 131 775 139 155 5.5% 3.3%Agricultural Research Council 101 599 107 695 112 649 118 619 5.3% 3.0% 124 551 131 775 139 155 5.5% 3.3%Foreign governments and international organisations
Current 46 445 38 784 31 911 42 445 -3.0% 1.1% 36 276 37 575 39 679 -2.2% 1.0%Consultative Group on International Agricultural Research
3 971 7 140 6 375 7 146 21.6% 0.2% 7 000 7 100 7 498 1.6% 0.2%
International Union for the Protection of New Varieties of Plants
524 638 677 794 14.9% – 745 750 792 -0.1% –
Commonwealth Agricultural Bureau International
209 263 276 337 17.3% – 300 310 327 -1.0% –
International Commission of Agricultural Engineering
– 32 – 20 – – 20 20 21 1.6% –
Food and Agriculture Organisation of the United Nations
30 999 24 600 21 029 30 267 -0.8% 0.7% 24 640 25 800 27 245 -3.4% 0.7%
Foreign rates and taxes 304 329 306 273 -3.5% – 411 418 441 17.3% – International Fund for Agricultural Development
3 000 2 163 – – -100.0% – – – – – –
International Cotton Advisory Council 223 769 301 389 20.4% – 285 290 306 -7.7% – International Dairy Federation 50 50 50 50 – – 50 50 53 2.0% – International Grains Council 188 200 215 199 1.9% – 230 235 248 7.6% – International Seed Testing Association 76 94 97 120 16.4% – 175 160 169 12.1% – International Organisation of Vine and Wine 642 807 789 978 15.1% – 800 810 855 -4.4% – World Organisation for Animal Health 1 222 1 349 1 624 1 667 10.9% – 1 425 1 430 1 510 -3.2% – Organisation for Economic Cooperation and Development
58 342 161 194 49.6% – 185 190 201 1.2% –
Food and Agriculture Organisation of the United Nations: African Solidarity Trust Fund
2 000 – – – -100.0% – – – – – –
International Union of Forestry Research Organisations
21 8 11 11 -19.4% – 10 12 13 5.7% –
Centre for Coordination of Agricultural Research and Development for Southern Africa
2 958 – – – -100.0% – – – – – –

Vote 24: Agriculture, Forestry and Fisheries
455
Table 24.5 Vote transfers and subsidies trends and estimates
Audited outcome Adjusted
appropriation
Averagegrowth
rate(%)
Average: Expen-diture/
Total(%)
Medium-term expenditure estimate
Averagegrowth
rate(%)
Average: Expen-diture/
Total(%)
R thousand 2013/14 2014/15 2015/16 2016/17 2013/14 - 2016/17 2017/18 2018/19 2019/20 2016/17 - 2019/20 Public corporations and private enterprises Other transfers to public corporations Current 138 398 221 976 314 714 98 333 -10.8% 5.2% 150 828 173 776 206 789 28.1% 4.0%Onderstepoort Biological Products 96 500 127 500 268 400 – -100.0% 3.3% – – – – – Ncera Farms 5 020 5 420 5 622 5 935 5.7% 0.1% 6 246 6 608 6 978 5.5% 0.2%Land and Agricultural Development Bank of South Africa
33 347 85 348 36 762 88 232 38.3% 1.6% 140 166 162 496 194 876 30.2% 3.8%
Forest Sector Charter Council 3 531 3 708 3 930 4 166 5.7% 0.1% 4 416 4 672 4 935 5.8% 0.1%Public corporations and private enterprises Other transfers to private enterprises Current 1 713 322 86 1 -91.6% – 1 1 1 – – Claims against the state 713 322 85 – -100.0% – – – – – – National Woolgrowers’ Association 1 000 – – – -100.0% – – – – – – Red Meat Industry Forum – – 1 1 – – 1 1 1 – – Non-profit institutions Current 17 518 24 362 23 685 16 984 -1.0% 0.6% 19 775 20 056 20 350 6.2% 0.5%Deciduous Fruit Producers’ Trust 7 649 10 000 10 000 12 100 16.5% 0.3% 14 410 14 410 14 410 6.0% 0.4%Annual Beef Cattle Improvement Scheme Awards
– 200 – – – – – – – – –
Citrus Growers’ Association of Southern Africa
– – 986 – – – – – – – –
Forestry South Africa 5 788 6 024 4 418 4 684 -6.8% 0.1% 4 965 5 246 5 540 5.8% 0.1%Centre for International Forestry Research – 100 – – – – – – – – – Food and Trees for Africa – 200 200 200 – – 400 400 400 26.0% – Lima Rural Development Foundation 4 081 7 838 8 081 – -100.0% 0.1% – – – – – Households Social benefits Current 10 776 19 268 14 131 8 120 -9.0% 0.4% 686 758 801 -53.8% 0.1%Employee social benefits 10 776 19 268 14 131 8 120 -9.0% 0.4% 686 758 801 -53.8% 0.1%Households Other transfers to households Current 18 674 19 332 18 852 21 862 5.4% 0.5% 23 955 24 521 25 698 5.5% 0.6%Bursaries for non-employees 1 325 1 391 1 391 1 400 1.9% – 1 500 1 600 1 690 6.5% – Claims against the state 64 626 511 – -100.0% – – – – – – Agricultural colleges 1 508 788 1 905 1 500 -0.2% – 1 800 1 800 1 900 8.2% – Female entrepreneur of the year awards 1 050 600 550 100 -54.3% – 1 000 500 500 71.0% – National Student Financial Aid Scheme 14 727 15 927 14 495 18 862 8.6% 0.4% 19 655 20 621 21 608 4.6% 0.5%Total 3 635 142 4 025 678 3 701 522 3 501 650 -1.2% 100.0% 3 774 590 4 013 961 4 288 042 7.0% 100.0%
Personnel information Table 24.6 Vote personnel numbers and cost by salary level and programme¹Programmes 1. Administration 2. Agricultural Production, Health and Food Safety3. Food Security and Agrarian Reform 4. Trade Promotion and Market Access 5. Forestry and Natural Resources Management 6. Fisheries
Number of posts estimated for 31 March 2017 Number and cost2 of personnel posts filled / planned for on funded establishment Number
Number of
funded posts
Number of posts
additional to the
establishment Actual Revised estimate Medium-term expenditure estimate
Average growth
rate(%)
Average: Salary
level/Total(%)
2015/16 2016/17 2017/18 2018/19 2019/20 2016/17 - 2019/20
Agriculture, Forestry and Fisheries Number Cost Unit cost Number Cost
Unit cost Number Cost
Unit cost Number Cost
Unit cost Number Cost
Unit cost
Programme – – – 1 776.5 – – 2 008.1 – – 2 121.8 – – 2 193.8 – – 2 360.7 – – –Programme 1 – – – 380.5 – – 427.4 – – 452.1 – – 467.0 – – 502.5 – – –Programme 2 – – – 444.4 – – 563.9 – – 607.0 – – 626.9 – – 674.6 – – –Programme 3 – – – 146.5 – – 168.2 – – 178.7 – – 185.1 – – 199.2 – – –Programme 4 – – – 94.4 – – 101.4 – – 106.0 – – 109.2 – – 117.5 – – –Programme 5 – – – 503.7 – – 530.5 – – 557.7 – – 577.6 – – 621.5 – – –Programme 6 – – – 207.0 – – 216.7 – – 220.2 – – 228.1 – – 245.4 – – –1. The department did not provide the relevant personnel data. 2. Rand million.

2017 Estimates of National Expenditure
456
Departmental receipts Table 24.7 Departmental receipts by economic classification
Audited outcome Adjusted estimate
Revised estimate
Averagegrowth
rate (%)
Average: Receipt
item/Total
(%) Medium-term receipts estimate
Averagegrowth
rate (%)
Average: Receipt
item/Total
(%) R thousand 2013/14 2014/15 2015/16 2016/17 2013/14 - 2016/17 2017/18 2018/19 2019/20 2016/17 - 2019/20 Departmental receipts 809 584 191 652 212 414 227 198 227 198 -34.5% 100.0% 241 533 256 749 272 923 6.3% 100.0%Sales of goods and services produced by department
153 690 163 186 185 974 212 403 212 403 11.4% 49.6% 225 793 240 018 255 139 6.3% 93.5%
Sales by market establishments 2 953 2 370 2 347 2 047 2 047 -11.5% 0.7% 2 185 2 322 2 468 6.4% 0.9%of which: Dwellings 2 452 1 959 1 748 1 719 1 719 -11.2% 0.5% 1 827 1 942 2 064 6.3% 0.8%Rental parking: Covered and open 289 313 322 319 319 3.3% 0.1% 339 360 383 6.3% 0.1%Wool and skin 212 98 277 9 9 -65.1% – 19 20 21 32.6% – Administrative fees 114 491 129 749 149 966 153 464 153 464 10.3% 38.0% 163 132 173 410 184 334 6.3% 67.5%of which: Farm feeds registration 6 295 6 485 12 600 10 047 10 047 16.9% 2.5% 10 680 11 353 12 068 6.3% 4.4%Plant breeders right 2 543 2 834 3 713 5 530 5 530 29.6% 1.0% 5 878 6 249 6 642 6.3% 2.4%Stock remedy 1 020 8 045 1 260 1 048 1 048 0.9% 0.8% 1 114 1 184 1 259 6.3% 0.5%Inspection fees: Statutory services 70 245 73 190 85 216 92 511 92 511 9.6% 22.3% 98 339 104 535 111 120 6.3% 40.7%Other 34 388 39 195 47 177 44 328 44 328 8.8% 11.5% 47 121 50 089 53 245 6.3% 19.5%Other sales 36 246 31 067 33 661 56 892 56 892 16.2% 11.0% 60 476 64 286 68 337 6.3% 25.0%of which: Service rendered: Boarding services (private) 1 687 1 736 1 285 1 852 1 852 3.2% 0.5% 1 969 2 093 2 225 6.3% 0.8%Service rendered: Commission insurance 1 368 1 425 1 432 1 446 1 446 1.9% 0.4% 1 537 1 634 1 737 6.3% 0.6%Service rendered: Course fees 1 079 1 036 1 823 1 879 1 879 20.3% 0.4% 1 997 2 123 2 257 6.3% 0.8%Laboratory services: Plant 963 629 905 955 955 -0.3% 0.2% 1 015 1 079 1 147 6.3% 0.4%Other 31 149 26 241 28 216 50 760 50 760 17.7% 9.5% 53 958 57 357 60 971 6.3% 22.3%Sales of scrap, waste, arms and other used current goods
28 44 53 659 659 186.6% 0.1% 713 758 805 6.9% 0.3%
of which: Waste paper 28 44 53 12 12 -24.6% – 25 27 28 32.6% – Sales scrap – – – 647 647 – – 688 731 777 6.3% 0.3%Transfers received 173 727 355 420 420 34.4% 0.1% 446 475 504 6.3% 0.2%Fines, penalties and forfeits 49 33 270 46 46 -2.1% – 49 52 55 6.1% – Interest, dividends and rent on land 8 236 6 727 5 143 4 634 4 634 -17.4% 1.7% 4 926 5 236 5 566 6.3% 2.0%Interest 6 992 5 565 4 111 3 600 3 600 -19.9% 1.4% 3 827 4 068 4 324 6.3% 1.6%Rent on land 1 244 1 162 1 032 1 034 1 034 -6.0% 0.3% 1 099 1 168 1 242 6.3% 0.5%Sales of capital assets 757 1 034 1 720 1 348 1 348 21.2% 0.3% 1 433 1 523 1 619 6.3% 0.6%Transactions in financial assets and liabilities
646 651 19 901 18 899 7 688 7 688 -77.2% 48.1% 8 173 8 687 9 235 6.3% 3.4%
Total 809 584 191 652 212 414 227 198 227 198 -34.5% 100.0% 241 533 256 749 272 923 6.3% 100.0%
Programme 1: Administration Programme purpose Provide strategic leadership, management and support services to the department.
Expenditure trends and estimates Table 24.8 Administration expenditure trends and estimates by subprogramme and economic classification Subprogramme
Audited outcome Adjusted
appropriation
Averagegrowth
rate(%)
Average: Expen-diture/
Total(%)
Medium-term expenditure estimate
Averagegrowth
rate(%)
Average:Expen-diture/
Total(%)
R million 2013/14 2014/15 2015/16 2016/17 2013/14 - 2016/17 2017/18 2018/19 2019/20 2016/17 - 2019/20 Ministry 28.6 38.0 39.6 39.5 11.4% 4.9% 42.5 44.3 47.3 6.2% 4.8%Department Management 18.9 22.9 19.2 27.7 13.6% 3.0% 28.9 30.0 32.2 5.2% 3.3%Financial Administration 133.1 158.6 163.1 187.7 12.1% 21.5% 195.6 204.0 221.2 5.6% 22.6%Internal Audit 5.0 4.0 5.0 8.5 19.6% 0.8% 9.6 10.0 10.7 8.1% 1.1%Corporate Services 170.3 170.0 162.9 173.1 0.6% 22.6% 179.8 186.3 199.5 4.8% 20.6%Stakeholder Relations, Communication and Legal Services
92.8 90.4 117.5 75.6 -6.6% 12.6% 77.9 80.9 86.7 4.7% 9.0%
Policy, Planning, Monitoring and Evaluation 65.9 72.1 79.5 81.7 7.4% 10.0% 173.8 187.3 144.4 20.9% 16.4%Office Accommodation 167.1 182.4 199.0 187.5 3.9% 24.6% 194.3 202.8 212.4 4.2% 22.2%Total 681.6 738.4 785.8 781.4 4.7% 100.0% 902.5 945.7 954.3 6.9% 100.0%Change to 2016 Budget estimate
(6.7) 99.3 105.9 58.1

Vote 24: Agriculture, Forestry and Fisheries
457
Table 24.8 Administration expenditure trends and estimates by subprogramme and economic classification Economic classification
Audited outcome Adjusted
appropriation
Averagegrowth
rate(%)
Average: Expen-diture/
Total(%)
Medium-term expenditure estimate
Averagegrowth
rate(%)
Average:Expen-diture/
Total(%)
R million 2013/14 2014/15 2015/16 2016/17 2013/14 - 2016/17 2017/18 2018/19 2019/20 2016/17 - 2019/20 Current payments 657.2 701.2 743.1 719.5 3.1% 94.4% 848.9 884.3 889.8 7.3% 93.3%Compensation of employees 311.6 362.0 380.5 427.4 11.1% 49.6% 452.1 467.0 502.5 5.5% 51.6%Goods and services1 345.7 339.2 362.6 292.1 -5.5% 44.8% 396.8 417.3 387.3 9.9% 41.7%of which: Audit costs: External 9.9 9.8 9.9 12.0 6.7% 1.4% 14.3 14.2 16.0 10.0% 1.6%Computer services 42.7 30.2 9.8 18.2 -24.7% 3.4% 16.3 17.1 18.0 -0.5% 1.9%Agency and support/outsourced services 8.0 3.4 2.7 4.8 -16.0% 0.6% 98.3 108.7 60.0 132.7% 7.6%Operating leases 76.8 74.9 84.3 46.4 -15.5% 9.5% 36.2 25.6 25.5 -18.1% 3.7%Property payments 92.7 111.0 117.0 113.5 7.0% 14.5% 139.8 152.7 161.2 12.4% 15.8%Travel and subsistence 26.7 32.1 39.2 40.7 15.0% 4.6% 34.5 37.9 40.6 -0.1% 4.3%Transfers and subsidies1 9.2 18.8 24.2 18.8 26.8% 2.4% 19.1 20.4 21.6 4.8% 2.2%Provinces and municipalities 0.1 – – – -1.4% – – – – -4.4% – Departmental agencies and accounts 8.7 16.4 22.6 17.4 25.9% 2.2% 19.0 20.4 21.6 7.5% 2.2%Public corporations and private enterprises 0.2 0.1 0.1 – -100.0% – – – – – – Households 0.3 2.3 1.5 1.4 67.8% 0.2% – – – -100.0% – Payments for capital assets 15.0 18.5 18.1 43.1 42.1% 3.2% 34.5 41.0 42.9 -0.2% 4.5%Buildings and other fixed structures 3.5 6.4 6.0 34.4 115.2% 1.7% 30.8 37.3 39.2 4.5% 4.0%Machinery and equipment 10.5 12.1 12.2 8.6 -6.6% 1.4% 3.7 3.6 3.7 -24.7% 0.5%Software and other intangible assets 1.1 – – 0.2 -44.5% – 0.1 0.1 0.1 -34.1% – Payments for financial assets 0.1 – 0.3 – -100.0% – – – – – – Total 681.6 738.4 785.8 781.4 4.7% 100.0% 902.5 945.7 954.3 6.9% 100.0%Proportion of total programme expenditure to vote expenditure
11.2% 11.1% 12.3% 12.0% – – 13.3% 13.2% 12.6% – –
Details of selected transfers and subsidies Departmental agencies and accounts Departmental agencies (non-business entities)
Current 8.7 16.3 22.2 17.3 26.0% 2.2% 19.0 20.4 21.6 7.5% 2.2%Primary Agriculture Sector Education and Training Authority
1.7 0.9 0.9 1.2 -11.1% 0.2% 1.2 1.2 1.3 4.6% 0.1%
National Research Foundation 7.0 15.0 20.8 15.7 30.9% 2.0% 17.3 18.6 19.7 7.8% 2.0%Fibre Processing and Manufacturing Sector Education and Training Authority
– 0.4 0.4 0.5 – – 0.5 0.5 0.5 3.8% 0.1%
1. Estimates of National Expenditure data tables are available and can be downloaded from www.treasury.gov.za. These data tables contain detailed information by goods and services, and transfers and subsidies item by programme.
Programme 2: Agricultural Production, Health and Food Safety Programme purpose Manage the risks associated with animal diseases, plant pests and genetically modified organisms. Register products used in agriculture. Promote food safety and create an enabling environment for increased and sustainable agricultural production.
Objectives • Promote productivity for prioritised value chains by:
– implementing six animal improvement schemes, such as Kaonafatso ya Dikgomo, a programme that assists resource-poor farmers; and the poultry scheme, which assists resource poor poultry farmers to identify and manage risks associated with poultry diseases, by 2019/20
– implementing six plant improvement schemes and three seed schemes, which encourage smallholder farmers to work together in the conservation of heat-resistant cultivars, and in managing and eradicating plant pests such as fruit flies by 2019/20.
• Enforce an agricultural animal disease regulatory framework to reduce the level of disease outbreaks, and reduce interception at export channels in production areas to a minimum level by: – conducting two planned animal risk surveillance exercises on peste des petits ruminants (goat plague),
African horse sickness and avian influenza per year over the medium term – conducting three planned disease risk surveillances on the exotic fruit fly by 2019/20.

2017 Estimates of National Expenditure
458
• Implement regulatory compliance and monitoring interventions to prevent plant and animal pest and disease outbreaks through quarantine inspections, surveillance and testing by 2019/20.
• Ensure access to primary animal health care services through the implementation of the animal diseases and management plan, and compulsory community services, by deploying 470 veterinary graduates to rural areas by 2019/20.
• Promote animal and plant conservation by implementing national plans to conserve the diversity of the genetic resources of plants and animals for food and agricultural production, through the conservation of two on-site genetic resources in the natural populations of plant and animal species (one animal, one plant) per year over the medium term.
Subprogrammes • Management oversees and manages the programme. • Inspection and Laboratory Services provides leadership, guidance and support to ensure compliance with
agricultural legislation and regulatory frameworks; and oversees the effective implementation of risk management strategies and plans for regulated agricultural products.
• Plant Production and Health focuses on increasing agricultural productivity with the emphasis on a sustainable plant production system, the efficient use of genetic resources for food and agriculture, and the management of risks associated with plant pests, diseases and genetically modified organisms.
• Animal Production and Health improves livestock production, and the health and safety of animal products. This entails implementing strategies, projects and programmes for animal production, health and public health that are founded on effective animal health and production management principles, an informed extension service and sustainable natural resources management.
• Agriculture Research manages monthly transfers to the Agricultural Research Council.
Expenditure trends and estimates Table 24.9 Agricultural Production, Health and Food Safety expenditure trends and estimates by subprogramme and economic classification Subprogramme
Audited outcome Adjusted
appropriation
Averagegrowth
rate(%)
Average: Expen-diture/
Total(%)
Medium-term expenditure estimate
Averagegrowth
rate(%)
Average:Expen-diture/
Total(%)
R million 2013/14 2014/15 2015/16 2016/17 2013/14 - 2016/17 2017/18 2018/19 2019/20 2016/17 - 2019/20 Management 2.4 1.6 2.2 2.8 5.3% 0.1% 2.9 3.0 3.2 4.9% 0.1%Inspection and Laboratory Services 296.6 317.5 322.5 332.9 3.9% 15.3% 372.7 384.8 412.4 7.4% 16.9%Plant Production and Health 507.0 536.4 543.9 575.4 4.3% 26.1% 610.8 644.3 681.0 5.8% 28.2%Animal Production and Health 244.7 299.1 470.5 220.5 -3.4% 14.9% 236.2 242.7 260.9 5.8% 10.8%Agriculture Research 950.3 1 029.2 803.9 813.0 -5.1% 43.5% 974.6 1 031.1 1 088.9 10.2% 43.9%Total 2 000.9 2 183.7 2 143.0 1 944.6 -0.9% 100.0% 2 197.2 2 305.9 2 446.4 8.0% 100.0%Change to 2016 Budget estimate
(8.8) 14.0 13.3 12.7
Economic classification Current payments 461.3 490.6 509.0 614.1 10.0% 25.1% 683.5 705.4 757.3 7.2% 31.0%Compensation of employees 361.3 401.7 444.4 563.9 16.0% 21.4% 607.0 626.9 674.6 6.2% 27.8%Goods and services1 100.0 88.9 64.6 50.1 -20.6% 3.7% 76.6 78.5 82.7 18.1% 3.2%of which: Communication 3.9 4.0 4.0 3.7 -1.5% 0.2% 4.2 4.3 4.5 6.8% 0.2%Computer services 0.1 0.4 0.2 0.5 101.2% – 25.1 25.1 25.1 278.4% 0.9%Inventory: Medicine 6.1 0.9 – 2.0 -31.1% 0.1% 3.9 4.8 5.2 37.7% 0.2%Property payments 2.6 3.8 3.3 4.2 17.6% 0.2% 5.1 5.2 5.5 9.5% 0.2%Travel and subsistence 27.7 29.4 25.5 14.6 -19.3% 1.2% 16.6 17.1 19.0 9.3% 0.8%Operating payments 4.5 5.1 3.8 4.2 -2.7% 0.2% 4.0 4.1 4.3 1.1% 0.2%Transfers and subsidies1 1 494.9 1 629.2 1 551.3 1 317.3 -4.1% 72.4% 1 511.4 1 598.2 1 686.9 8.6% 68.7%Provinces and municipalities 438.6 460.7 466.9 491.4 3.9% 22.5% 522.1 552.4 583.4 5.9% 24.2%Departmental agencies and accounts 950.3 1 029.2 804.1 813.2 -5.1% 43.5% 974.8 1 031.3 1 089.1 10.2% 43.9%Public corporations and private enterprises 97.6 127.7 268.4 – -100.0% 6.0% – – – – – Non-profit institutions 7.6 10.2 10.0 12.1 16.5% 0.5% 14.4 14.4 14.4 6.0% 0.6%Households 0.8 1.4 1.9 0.6 -8.8% 0.1% 0.1 0.1 0.1 -47.9% – Payments for capital assets 43.5 63.8 82.4 13.2 -32.8% 2.5% 2.3 2.2 2.2 -44.7% 0.2%Machinery and equipment 43.4 63.8 82.4 13.2 -32.8% 2.5% 2.3 2.2 2.2 -44.7% 0.2%Software and other intangible assets 0.1 – – – -100.0% – – – – – – Payments for financial assets 1.2 0.1 0.4 – -100.0% – – – – – – Total 2 000.9 2 183.7 2 143.0 1 944.6 -0.9% 100.0% 2 197.2 2 305.9 2 446.4 8.0% 100.0%Proportion of total programme expenditure to vote expenditure
32.7% 32.9% 33.5% 29.8% – – 32.3% 32.3% 32.3% – –

Vote 24: Agriculture, Forestry and Fisheries
459
Table 24.9 Agricultural Production, Health and Food Safety expenditure trends and estimates by subprogramme and economic classificationDetails of selected transfers and subsidies
Audited outcome Adjusted
appropriation
Averagegrowth
rate(%)
Average: Expen-diture/
Total(%)
Medium-term expenditure estimate
Averagegrowth
rate(%)
Average:
Expen-diture/
Total(%)
R million 2013/14 2014/15 2015/16 2016/17 2013/14 - 2016/17 2017/18 2018/19 2019/20 2016/17 - 2019/20 Departmental agencies and accounts Departmental agencies (non-business entities) Current 848.7 921.5 691.5 694.6 -6.5% 38.2% 850.2 899.5 949.9 11.0% 38.2%Agricultural Research Council 848.7 921.5 691.5 694.6 -6.5% 38.2% 850.2 899.5 949.9 11.0% 38.2%Capital 101.6 107.7 112.6 118.6 5.3% 5.3% 124.6 131.8 139.2 5.5% 5.8%Agricultural Research Council 101.6 107.7 112.6 118.6 5.3% 5.3% 124.6 131.8 139.2 5.5% 5.8%Non-profit institutions Current 7.6 10.0 10.0 12.1 16.5% 0.5% 14.4 14.4 14.4 6.0% 0.6%Deciduous Fruit Producers’ Trust 7.6 10.0 10.0 12.1 16.5% 0.5% 14.4 14.4 14.4 6.0% 0.6%Public corporations and private enterprises Public corporations Other transfers to public corporations Current 96.5 127.5 268.4 – -100.0% 6.0% – – – – – Onderstepoort Biological Products 96.5 127.5 268.4 – -100.0% 6.0% – – – – – Provinces and municipalities Provinces Provincial revenue funds Current 438.5 460.6 466.7 491.4 3.9% 22.5% 522.1 552.4 583.4 5.9% 24.2%Ilima/Letsema projects grant 438.5 460.6 466.7 491.4 3.9% 22.5% 522.1 552.4 583.4 5.9% 24.2%1. Estimates of National Expenditure data tables are available and can be downloaded from www.treasury.gov.za. These data tables contain detailed information by goods and services, and
transfers and subsidies item by programme.
Programme 3: Food Security and Agrarian Reform Programme purpose Facilitate and promote food security and agrarian reform programmes and initiatives.
Objectives • Coordinate the implementation of the national policy on food and nutrition security by:
– providing production inputs such as seeds and fertilisers to increase the number of households benefiting from food production initiatives to 200 000 by 2019/20
– cultivating 600 000 hectares of underutilised land in communal areas and land reform projects for food production by 2019/20.
• Improve delivery capacity in support of sustainable growth in the sector by: – implementing sector capacity-development policies such as the national agriculture, forestry and fisheries
training and education strategy, and national policy on extension and advisory services – placing 150 graduates and 100 extension support practitioners in prioritised value-chain commodities
such as maize and soya beans by 2019/20 – provide strategic leadership and support, such as research, training and extension services, to targeted
subsistence and smallholder producers in the agriculture, forestry and fisheries sectors by transforming all agricultural colleges into agricultural training institutions by 2019/20.
• Coordinate comprehensive support systems and programmes provided to producers by: – developing and implementing the national policy on comprehensive producer development support over
the medium term – providing support to 145 000 smallholder producers per year until 2019/20.
Subprogrammes • Management oversees and manages the programme • Food Security provides national frameworks to promote the sustainable household food security programme
by improving the production systems of subsistence and smallholder producers in the agriculture, forestry and fishery sectors; and facilitates the provision of inputs, implements and infrastructure support.

2017 Estimates of National Expenditure
460
• Sector Capacity Development provides education and training to promote the transformation of colleges of agriculture into centres of excellence. This is achieved by the implementation of the agriculture, forestry and fisheries national education and training strategy; the development of agriculture training institutes as centres of excellence; and the implementation of a coordinated plan to track sector transformation in line with government objectives.
• National Extension Support Services develops and coordinates the implementation of national extension policies, and norms and standards on the transfer of technology. This subprogramme also provides strategic leadership and guidance for the planning, coordination and implementation of extension and advisory services in the sector.
Expenditure trends and estimates Table 24.10 Food Security and Agrarian Reform expenditure trends and estimates by subprogramme and economic classificationSubprogramme
Audited outcome Adjusted
appropriation
Averagegrowth
rate(%)
Average: Expen-diture/
Total(%)
Medium-term expenditure estimate
Averagegrowth
rate(%)
Average:Expen-diture/
Total(%)
R million 2013/14 2014/15 2015/16 2016/17 2013/14 - 2016/17 2017/18 2018/19 2019/20 2016/17 - 2019/20 Management 4.8 2.5 4.0 2.9 -15.8% 0.2% 3.3 3.4 3.7 8.6% 0.2%Food Security 1 025.4 1 037.5 1 270.8 1 269.3 7.4% 65.4% 1 348.2 1 435.3 1 660.9 9.4% 69.9%Sector Capacity Development 191.0 232.8 260.2 247.2 9.0% 13.2% 227.8 210.5 224.8 -3.1% 11.1%National Extension Support Services 368.8 383.5 371.8 369.3 – 21.2% 367.4 386.6 413.4 3.8% 18.8%Total 1 590.1 1 656.3 1 906.8 1 888.7 5.9% 100.0% 1 946.8 2 035.8 2 302.8 6.8% 100.0%Change to 2016 Budget estimate
(1.0) (71.2) (54.8) 91.7
Economic classification Current payments 200.0 214.1 229.3 237.0 5.8% 12.5% 272.2 250.1 267.8 4.2% 12.6%Compensation of employees 112.3 120.9 131.1 152.7 10.8% 7.3% 162.7 168.5 181.6 6.0% 8.1%Goods and services1 87.7 93.3 98.1 84.4 -1.3% 5.2% 109.4 81.6 86.2 0.7% 4.4%of which: Communication 1.6 1.8 2.0 2.1 10.0% 0.1% 2.8 2.0 2.1 0.4% 0.1%Consumable supplies 4.8 6.3 4.2 5.7 6.2% 0.3% 12.9 0.6 0.7 -50.1% 0.2%Consumables: Stationery, printing and office supplies 0.6 1.1 0.8 2.6 65.9% 0.1% 7.2 1.7 1.8 -12.0% 0.2%Travel and subsistence 18.3 16.9 18.8 17.3 -1.9% 1.0% 23.5 30.1 31.2 21.8% 1.2%Training and development 24.5 26.7 22.8 24.2 -0.4% 1.4% 32.5 33.0 35.4 13.5% 1.5%Operating payments 1.4 2.7 1.6 3.8 40.1% 0.1% 3.8 1.4 1.5 -27.1% 0.1%Transfers and subsidies1 1 326.3 1 366.0 1 606.9 1 594.3 6.3% 83.7% 1 638.1 1 747.0 1 994.2 7.7% 85.3%Provinces and municipalities 1 301.4 1 340.3 1 581.4 1 565.3 6.3% 82.2% 1 507.1 1 595.1 1 810.7 5.0% 79.3%Departmental agencies and accounts 0.6 0.6 0.6 0.6 -0.1% – 0.6 0.6 0.6 – – Public corporations and private enterprises 5.3 5.5 5.6 5.9 3.6% 0.3% 106.2 126.6 157.0 197.9% 4.8%Households 18.9 19.7 19.2 22.4 5.8% 1.1% 24.1 24.7 25.9 4.9% 1.2%Payments for capital assets 63.9 76.2 70.3 57.4 -3.5% 3.8% 36.5 38.7 40.8 -10.7% 2.1%Buildings and other fixed structures 46.6 41.6 34.3 35.4 -8.7% 2.2% 33.0 34.8 36.8 1.3% 1.7%Machinery and equipment 17.0 34.2 35.9 22.0 9.0% 1.5% 3.5 3.8 4.0 -43.1% 0.4%Biological assets 0.1 – – – -100.0% – – – – – – Software and other intangible assets 0.3 0.4 0.1 – -61.8% – – – – -100.0% – Payments for financial assets – – 0.3 – – – – – – – – Total 1 590.1 1 656.3 1 906.8 1 888.7 5.9% 100.0% 1 946.8 2 035.8 2 302.8 6.8% 100.0%Proportion of total programme expenditure to vote expenditure
26.0% 25.0% 29.8% 29.0% – – 28.6% 28.5% 30.4% – –
Details of selected transfers and subsidies Households Other transfers to households Current 18.6 18.7 18.3 21.9 5.5% 1.1% 24.0 24.5 25.7 5.5% 1.2%Bursaries for non-employees 1.3 1.4 1.4 1.4 1.9% 0.1% 1.5 1.6 1.7 6.5% 0.1%Agricultural colleges 1.5 0.8 1.9 1.5 -0.2% 0.1% 1.8 1.8 1.9 8.2% 0.1%Female entrepreneur of the year awards 1.1 0.6 0.6 0.1 -54.3% – 1.0 0.5 0.5 71.0% – National Student Financial Aid Scheme 14.7 15.9 14.5 18.9 8.6% 0.9% 19.7 20.6 21.6 4.6% 1.0%Public corporations and private enterprises Public corporations Other transfers to public corporations Current 5.0 5.4 5.6 5.9 5.7% 0.3% 106.2 126.6 157.0 197.9% 4.8%Ncera Farms 5.0 5.4 5.6 5.9 5.7% 0.3% 6.2 6.6 7.0 5.5% 0.3%Land and Agricultural Development Bank of South Africa
– – – – – – 100.0 120.0 150.0 – 4.5%
Provinces and municipalities Provinces Provincial revenue funds Current 1 301.1 1 339.9 1 581.1 1 565.1 6.4% 82.2% 1 506.9 1 594.9 1 810.4 5.0% 79.2%Comprehensive agricultural support programme grant: Infrastructure
905.7 929.5 1 167.8 1 148.1 8.2% 58.9% 1 112.1 1 164.8 1 350.2 5.6% 58.4%
Comprehensive agricultural support programme grant: Extension recovery planning service
339.9 352.7 343.9 346.1 0.6% 19.6% 337.9 355.6 380.5 3.2% 17.4%
Comprehensive agricultural support programme grant: Upgrading of provincial agricultural colleges
55.4 57.7 69.5 70.8 8.5% 3.6% 56.8 74.5 79.7 4.0% 3.4%
1. Estimates of National Expenditure data tables are available and can be downloaded from www.treasury.gov.za. These data tables contain detailed information by goods and services, and transfers and subsidies item by programme.

Vote 24: Agriculture, Forestry and Fisheries
461
Programme 4: Trade Promotion and Market Access Programme purpose Promote economic development, trade and market access for agricultural, forestry and fisheries products; and foster international relations for the sector.
Objectives • Increase market access to the processing of agriculture, forestry and fisheries by 2019/20 by:
– certifying and accrediting 50 smallholder producers’ access to markets by 2019/20 – providing training to 50 agro-processing entrepreneurs on norms and standards for agro-processing by 2020 – monitoring the implementation of the AgriBEE Sector Charter and Forestry Sector Transformation Charter
over the medium term. • Provide technical sector leadership in trade negotiations and implement trade agreements to improve market
access to high value markets by 2019/20. • Implement the building of national skills capabilities in international market research by providing marketing
skills transfers to small and medium agro-processing entrepreneurs by 2019/20.
Subprogrammes • Management oversees and manages the programme. • International Relations and Trade facilitates and coordinates international relations and trade through
negotiations, and the development and implementation of appropriate policies and programmes. • Cooperatives and Rural Enterprise Development facilitates and supports the development of businesses to
ensure the transformation of the agriculture, forestry and fisheries sector. • Agro-processing and Marketing develops and implements support programmes to promote market access
and value addition for agriculture, forestry and fisheries products.
Expenditure trends and estimates Table 24.11 Trade Promotion and Market Access expenditure trends and estimates by subprogramme and economic classification Subprogramme
Audited outcome Adjusted
appropriation
Averagegrowth
rate(%)
Average: Expen-diture/
Total(%)
Medium-term expenditure estimate
Averagegrowth
rate(%)
Average:Expen-diture/
Total(%)
R million 2013/14 2014/15 2015/16 2016/17 2013/14 - 2016/17 2017/18 2018/19 2019/20 2016/17 - 2019/20 Management 1.4 2.6 3.1 5.1 54.9% 1.1% 5.1 5.3 5.7 3.5% 1.9%International Relations and Trade 134.5 133.8 114.0 123.3 -2.9% 45.8% 121.8 127.2 135.6 3.2% 44.9%Cooperatives and Rural Enterprise Development 60.5 112.6 64.3 118.8 25.2% 32.3% 70.9 74.5 79.1 -12.7% 30.3%Agro-processing and Marketing 60.0 57.9 55.3 56.8 -1.8% 20.8% 63.9 67.2 71.3 7.9% 22.9%Total 256.3 307.0 236.8 304.0 5.8% 100.0% 261.7 274.2 291.7 -1.4% 100.0%Change to 2016 Budget estimate
6.4 (3.1) (1.2) (1.3)
Economic classification Current payments 135.3 139.4 125.8 132.8 -0.6% 48.3% 138.6 144.8 155.0 5.3% 50.5%Compensation of employees 79.5 97.8 94.4 101.4 8.5% 33.8% 106.0 109.2 117.5 5.0% 38.4%Goods and services1 55.8 41.6 31.5 31.3 -17.5% 14.5% 32.6 35.6 37.5 6.1% 12.1%of which: Communication 0.9 1.1 1.0 1.3 12.2% 0.4% 1.2 1.3 1.4 1.8% 0.5%Agency and support/outsourced services 12.7 4.7 1.7 0.9 -58.4% 1.8% 10.8 11.3 12.0 135.4% 3.1%Consumables: Stationery, printing and office supplies
1.0 0.5 0.6 1.0 -0.4% 0.3% 1.0 1.1 1.2 6.3% 0.4%
Operating leases 8.7 9.4 6.0 1.9 -39.7% 2.4% 2.6 2.6 2.7 12.9% 0.9%Travel and subsistence 10.9 11.5 11.4 11.5 1.9% 4.1% 11.6 13.2 13.8 6.3% 4.4%Operating payments 2.7 5.0 6.8 3.0 3.4% 1.6% 2.0 2.2 2.3 -8.9% 0.8%Transfers and subsidies1 119.2 166.7 110.3 170.4 12.6% 51.3% 122.8 129.1 136.3 -7.2% 49.4%Departmental agencies and accounts 35.8 37.8 36.5 35.3 -0.5% 13.2% 41.9 44.3 46.8 9.9% 14.9%Foreign governments and international organisations
46.4 38.8 31.9 42.4 -3.0% 14.5% 36.3 37.6 39.7 -2.2% 13.8%
Public corporations and private enterprises 36.9 89.1 40.7 92.4 35.8% 23.5% 44.6 47.2 49.8 -18.6% 20.7%Non-profit institutions – – 1.0 – – 0.1% – – – – – Households – 1.0 0.3 0.2 62.7% 0.1% – – – -100.0% –

2017 Estimates of National Expenditure
462
Table 24.11 Trade Promotion and Market Access expenditure trends and estimates by subprogramme and economic classification
Audited outcome Adjusted
appropriation
Averagegrowth
rate(%)
Average: Expen-diture/
Total(%)
Medium-term expenditure estimate
Averagegrowth
rate(%)
Average:Expen-diture/
Total(%)
R million 2013/14 2014/15 2015/16 2016/17 2013/14 - 2016/17 2017/18 2018/19 2019/20 2016/17 - 2019/20 Payments for capital assets 1.8 0.9 0.6 0.9 -21.7% 0.4% 0.3 0.3 0.3 -26.4% 0.2%Machinery and equipment 1.8 0.9 0.6 0.9 -21.7% 0.4% 0.3 0.3 0.3 -26.4% 0.2%Payments for financial assets – – – – – – – – – – – Total 256.3 307.0 236.8 304.0 5.8% 100.0% 261.7 274.2 291.7 -1.4% 100.0%Proportion of total programme expenditure to vote expenditure
4.2% 4.6% 3.7% 4.7% – – 3.8% 3.8% 3.8% – –
Details of selected transfers and subsidies Departmental agencies and accounts Departmental agencies (non-business entities)
Current 35.8 37.8 36.5 35.3 -0.5% 13.2% 41.9 44.3 46.8 9.9% 14.9%National Agricultural Marketing Council 33.8 36.0 34.6 35.0 1.2% 12.6% 41.9 44.3 46.8 10.2% 14.9%Small Enterprise Development Agency 2.0 1.8 1.8 0.3 -46.6% 0.5% – – – -100.0% – Foreign governments and international organisations Current 46.4 38.7 31.9 42.4 -3.0% 14.4% 36.2 37.5 39.6 -2.2% 13.8%Consultative Group on International Agricultural Research
4.0 7.1 6.4 7.1 21.6% 2.2% 7.0 7.1 7.5 1.6% 2.5%
International Union for the Protection of New Varieties of Plants
0.5 0.6 0.7 0.8 14.9% 0.2% 0.7 0.8 0.8 -0.1% 0.3%
Commonwealth Agricultural Bureau International 0.2 0.3 0.3 0.3 17.3% 0.1% 0.3 0.3 0.3 -1.0% 0.1%Food and Agriculture Organisation of the United Nations
31.0 24.6 21.0 30.3 -0.8% 9.7% 24.6 25.8 27.2 -3.4% 9.5%
Foreign rates and taxes 0.3 0.3 0.3 0.3 -3.5% 0.1% 0.4 0.4 0.4 17.3% 0.1%International Fund for Agricultural Development 3.0 2.2 – – -100.0% 0.5% – – – – – International Cotton Advisory Council 0.2 0.8 0.3 0.4 20.4% 0.2% 0.3 0.3 0.3 -7.7% 0.1%International Grains Council 0.2 0.2 0.2 0.2 1.9% 0.1% 0.2 0.2 0.2 7.6% 0.1%International Seed Testing Association 0.1 0.1 0.1 0.1 16.4% – 0.2 0.2 0.2 12.1% 0.1%International Organisation of Vine and Wine 0.6 0.8 0.8 1.0 15.1% 0.3% 0.8 0.8 0.9 -4.4% 0.3%World Organisation for Animal Health 1.2 1.3 1.6 1.7 10.9% 0.5% 1.4 1.4 1.5 -3.2% 0.5%Organisation for Economic Cooperation and Development
0.1 0.3 0.2 0.2 49.6% 0.1% 0.2 0.2 0.2 1.2% 0.1%
Food and Agriculture Organisation of the United Nations: African Solidarity Trust Fund
2.0 – – – -100.0% 0.2% – – – – –
Centre for Coordination of Agricultural Research and Development for Southern Africa
3.0 – – – -100.0% 0.3% – – – – –
Public corporations and private enterprises Public corporations Other transfers to public corporations Current 36.9 89.1 40.7 92.4 35.8% 23.5% 44.6 47.2 49.8 -18.6% 20.7%Land and Agricultural Development Bank of South Africa
33.3 85.3 36.8 88.2 38.3% 22.1% 40.2 42.5 44.9 -20.2% 19.1%
Forest Sector Charter Council 3.5 3.7 3.9 4.2 5.7% 1.4% 4.4 4.7 4.9 5.8% 1.6%1. Estimates of National Expenditure data tables are available and can be downloaded from www.treasury.gov.za. These data tables contain detailed information by goods and services, and
transfers and subsidies item by programme.
Programme 5: Forestry and Natural Resources Management Programme purpose Develop and facilitate the implementation of policies and targeted programmes to ensure proper management of forests, and the sustainable use and protection of land and water. Manage agricultural risks and disasters.
Objectives • Ensure the conservation, protection, rehabilitation and sustainable management of forests by:
– replanting 5 175 hectares in temporary unplanted areas by 2019/20 – obtaining certification for three plantations from the Forestry Stewardship Council, which is responsible
for monitoring and evaluating the standard of state plantations, by 2019/20 – conducting environmental impact assessments to enable small, medium and micro enterprises to obtain
afforestation licences by 2019/20 – implementing the agro-forestry strategy by 2019/20 – revitalising 1 250 hectares on irrigation schemes per year

Vote 24: Agriculture, Forestry and Fisheries
463
– restoring and rehabilitating 48 900 hectares of agricultural land, and 1 500 hectares of state indigenous forests and woodlands by 2019/20.
• Ensure adaptation to climate change through the implementation of an effective climate change mitigation plan to improve the adaptability and productivity of livestock and plant species by 2019/20 by: – implementing and reviewing the climate change mitigation and adaptation plan for agriculture, forestry
and fisheries – reducing emissions nationally from the forests degradation and deforestation strategy.
Subprogrammes • Management oversees and manages the programme. • Forestry Operations ensures sustainable management of state forests and other assets, such as state nurseries,
in order to optimise social and economic benefits in rural areas and to promote sector growth throughout South Africa.
• Forestry Oversight and Regulation provides leadership, advice and direction in the formulation of forestry development and regulation policies, strategies and frameworks; and ensures the effective promotion and development of small scale and commercial forestry.
• Natural Resources Management facilitates the development of infrastructure and the sustainable use of natural resources through an enabling framework for the sustainable management of woodlands and indigenous forests, and the efficient development and revitalisation of irrigation schemes and water use. This subprogramme also facilitates climate change mitigation and adaptation, risk and disaster management; and promotes, regulates and coordinates the sustainable use of natural resources (land and water).
Expenditure trends and estimates Table 24.12 Forestry and Natural Resources Management expenditure trends and estimates by subprogramme and economic classification Subprogramme
Audited outcome Adjusted
appropriation
Averagegrowth
rate(%)
Average: Expen-diture/
Total(%)
Medium-term expenditure estimate
Averagegrowth
rate(%)
Average:Expen-diture/
Total(%)
R million 2013/14 2014/15 2015/16 2016/17 2013/14 - 2016/17 2017/18 2018/19 2019/20 2016/17 - 2019/20 Management 4.3 6.0 25.4 4.1 -1.5% 0.9% 3.6 3.8 4.1 -0.4% 0.4%Forestry Operations 468.2 454.8 440.2 464.1 -0.3% 41.1% 479.5 499.9 535.7 4.9% 46.3%Forestry Oversight and Regulation 48.4 49.3 52.9 56.1 5.1% 4.6% 61.7 64.5 68.7 7.0% 5.9%Natural Resources Management 623.8 793.5 343.7 613.4 -0.6% 53.4% 471.9 505.2 435.7 -10.8% 47.4%Total 1 144.7 1 303.6 862.3 1 137.7 -0.2% 100.0% 1 016.7 1 073.4 1 044.2 -2.8% 100.0%Change to 2016 Budget estimate
192.1 55.4 70.8 (26.2)
Economic classification Current payments 642.9 663.7 664.9 926.1 12.9% 65.1% 758.0 791.1 845.5 -3.0% 77.7%Compensation of employees 482.5 491.2 503.7 530.5 3.2% 45.1% 557.7 577.6 621.5 5.4% 53.5%Goods and services1 160.0 172.2 161.3 394.6 35.1% 20.0% 198.9 212.2 222.5 -17.4% 24.1%of which: Contractors 19.0 19.5 6.0 20.2 2.1% 1.5% 15.8 16.4 17.4 -4.9% 1.6%Agency and support/outsourced services 15.7 19.8 17.7 23.6 14.6% 1.7% 38.0 41.6 41.9 21.1% 3.4%Inventory: Farming supplies 9.8 6.5 16.2 229.5 185.6% 5.9% 12.7 14.1 15.3 -59.4% 6.4%Consumable supplies 28.0 25.4 10.9 14.8 -19.2% 1.8% 23.7 29.0 29.9 26.5% 2.3%Property payments 15.4 20.7 13.5 22.2 12.9% 1.6% 20.2 20.1 21.2 -1.6% 2.0%Travel and subsistence 35.6 38.7 37.0 29.0 -6.6% 3.2% 28.2 29.1 32.3 3.7% 2.8%Interest and rent on land 0.4 0.3 – 1.1 44.0% – 1.3 1.4 1.5 12.4% 0.1%Transfers and subsidies1 431.4 593.3 150.0 159.0 -28.3% 30.0% 221.3 242.8 157.2 -0.4% 18.3%Provinces and municipalities 409.7 562.3 124.3 146.9 -29.0% 27.9% 213.5 234.6 148.7 0.4% 17.4%Departmental agencies and accounts 3.0 3.0 3.0 2.0 -12.6% 0.2% 2.0 2.0 2.0 – 0.2%Public corporations and private enterprises 0.1 – – – -100.0% – – – – – – Non-profit institutions 9.9 14.2 12.7 4.9 -20.9% 0.9% 5.4 5.6 5.9 6.7% 0.5%Households 8.8 13.8 9.9 5.3 -15.5% 0.8% 0.5 0.5 0.5 -53.2% 0.2%Payments for capital assets 70.3 46.7 47.0 52.6 -9.3% 4.9% 37.4 39.5 41.6 -7.5% 4.0%Buildings and other fixed structures – 0.1 – 8.5 728.2% 0.2% – – – -100.0% 0.2%Machinery and equipment 70.3 46.6 47.0 43.9 -14.5% 4.7% 37.3 39.3 41.4 -1.9% 3.8%Biological assets – – – 0.1 – – 0.1 0.1 0.1 8.9% – Software and other intangible assets – – – 0.1 – – – – – -100.0% – Payments for financial assets 0.1 – 0.4 – -100.0% – – – – – – Total 1 144.7 1 303.6 862.3 1 137.7 -0.2% 100.0% 1 016.7 1 073.4 1 044.2 -2.8% 100.0%Proportion of total programme expenditure to vote expenditure
18.7% 19.7% 13.5% 17.5% – – 14.9% 15.0% 13.8% – –

2017 Estimates of National Expenditure
464
Table 24.12 Forestry and Natural Resources Management expenditure trends and estimates by subprogramme and economic classification Details of selected transfers and subsidies
Audited outcome Adjusted
appropriation
Averagegrowth
rate(%)
Average: Expen-diture/
Total(%)
Medium-term expenditure estimate
Averagegrowth
rate(%)
Average:Expen-diture/
Total(%)
R million 2013/14 2014/15 2015/16 2016/17 2013/14 - 2016/17 2017/18 2018/19 2019/20 2016/17 - 2019/20 Departmental agencies and accounts Departmental agencies (non-business entities)
Current 3.0 3.0 3.0 2.0 -12.6% 0.2% 2.0 2.0 2.0 – 0.2%Water Research Commission 3.0 3.0 3.0 2.0 -12.6% 0.2% 2.0 2.0 2.0 – 0.2%Non-profit institutions Current 9.9 14.1 12.7 4.9 -20.9% 0.9% 5.4 5.6 5.9 6.7% 0.5%Forestry South Africa 5.8 6.0 4.4 4.7 -6.8% 0.5% 5.0 5.2 5.5 5.8% 0.5%Food and Trees for Africa – 0.2 0.2 0.2 – – 0.4 0.4 0.4 26.0% – Lima Rural Development Foundation 4.1 7.8 8.1 – -100.0% 0.4% – – – – – Provinces and municipalities Provinces Provincial revenue funds Current 409.1 561.6 123.6 146.0 -29.1% 27.9% 212.7 233.8 147.9 0.4% 17.3%Land care programme grant: Poverty relief and infrastructure development
105.8 67.8 65.0 69.3 -13.2% 6.9% 73.6 77.9 82.2 5.9% 7.1%
Comprehensive agricultural support programme grant: Disasters (flood damaged infrastructure)
303.3 493.8 58.6 76.7 -36.8% 21.0% 139.1 155.9 65.6 -5.1% 10.2%
1. Estimates of National Expenditure data tables are available and can be downloaded from www.treasury.gov.za. These data tables contain detailed information by goods and services, and transfers and subsidies item by programme.
Programme 6: Fisheries Programme purpose Promote the development, management, monitoring and sustainable use of marine living resources and the development of the fisheries sector.
Objectives • Ensure increased production and productivity in prioritised areas, and value chains by:
– supporting 24 Operation Phakisa aquaculture projects by 2019/20 – conducting two new research studies on genetics and nutrition for aquaculture species by 2019/20.
• Lead and coordinate government food security initiatives by: – developing sector-specific policies and allocating rights to nine fishing sectors by 2019/20 – allocating rights to registered small-scale fisheries cooperatives by 2019/20 – implementing the cooperative development and support programme by 2019/20.
• Ensure the conservation, protection, rehabilitation and recovery of depleted and degraded natural resources by: – developing recovery plans in prioritised areas of fish stocks such as abalone, west coast rock lobsters and
deep water hake by 2019/20 – compiling one research report to indicate the levels of fish stock to ensure the sustainability of resources
and the industry by 2019/20 – conducting 4 548 compliance and enforcement measures in the four prioritised fisheries sectors (abalone,
west coast rock lobster, line fish and deep water hake) over the medium term.
Subprogrammes • Management oversees and manages the programme. • Aquaculture ensures growth and economic development of the aquaculture and fisheries industries for
sustainable livelihoods by providing public support and an integrated platform for the management of aquaculture.
• Monitoring Control and Surveillance ensures the protection and promotion of sustainable use of marine living resources by intensifying enforcement and compliance.
Vote 24: Agriculture, Forestry and Fisheries
465
• Marine Resources Management ensures the sustainable, equitable and orderly utilisation of and access to marine living resources through improved management and regulation.
• Fisheries Research and Development ensures the promotion of the sustainable development of fisheries resources and ecosystems by conducting and supporting appropriate research.
• Marine Living Resources Fund receives transfers for the management and sustainable use of marine living resources to supplement the revenue received from levies on fish and fish products, permits, licences and application fees, and proceeds from the sale of confiscated fish and fish products.
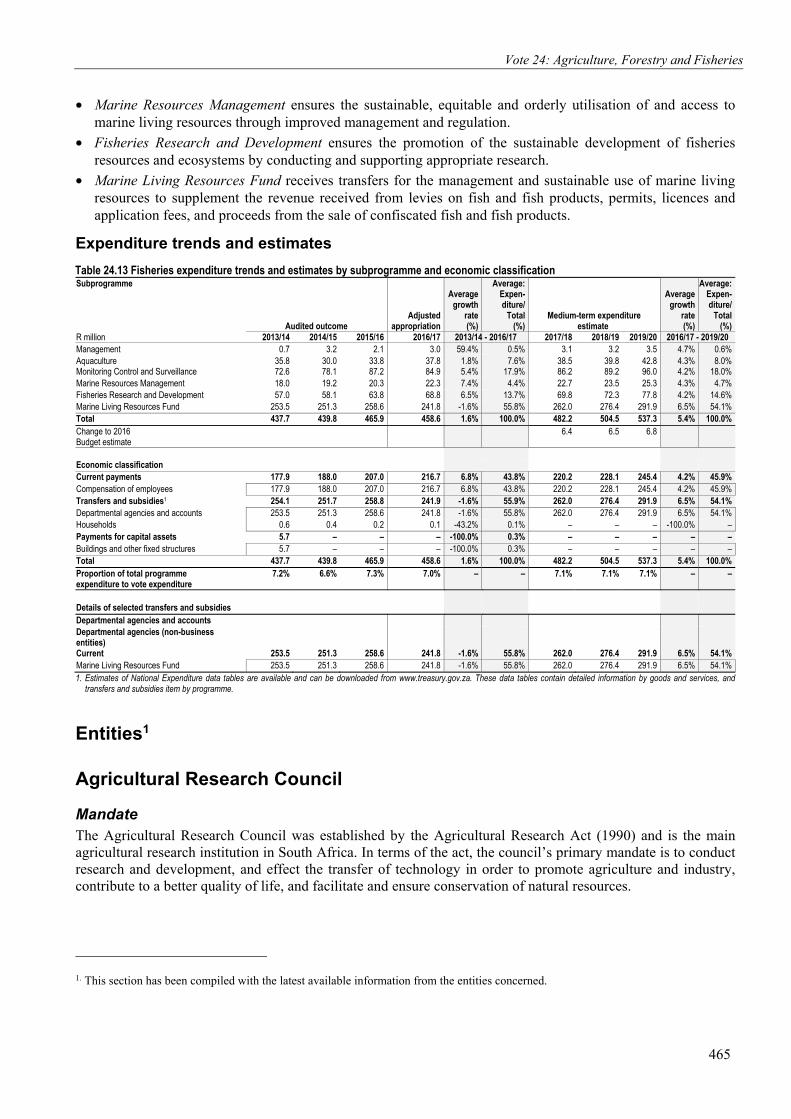
Expenditure trends and estimates Table 24.13 Fisheries expenditure trends and estimates by subprogramme and economic classification Subprogramme
Audited outcome Adjusted
appropriation
Averagegrowth
rate(%)
Average: Expen-diture/
Total(%)
Medium-term expenditure estimate
Averagegrowth
rate(%)
Average:Expen-diture/
Total(%)
R million 2013/14 2014/15 2015/16 2016/17 2013/14 - 2016/17 2017/18 2018/19 2019/20 2016/17 - 2019/20 Management 0.7 3.2 2.1 3.0 59.4% 0.5% 3.1 3.2 3.5 4.7% 0.6%Aquaculture 35.8 30.0 33.8 37.8 1.8% 7.6% 38.5 39.8 42.8 4.3% 8.0%Monitoring Control and Surveillance 72.6 78.1 87.2 84.9 5.4% 17.9% 86.2 89.2 96.0 4.2% 18.0%Marine Resources Management 18.0 19.2 20.3 22.3 7.4% 4.4% 22.7 23.5 25.3 4.3% 4.7%Fisheries Research and Development 57.0 58.1 63.8 68.8 6.5% 13.7% 69.8 72.3 77.8 4.2% 14.6%Marine Living Resources Fund 253.5 251.3 258.6 241.8 -1.6% 55.8% 262.0 276.4 291.9 6.5% 54.1%Total 437.7 439.8 465.9 458.6 1.6% 100.0% 482.2 504.5 537.3 5.4% 100.0%Change to 2016 Budget estimate
6.4 6.5 6.8
Economic classification Current payments 177.9 188.0 207.0 216.7 6.8% 43.8% 220.2 228.1 245.4 4.2% 45.9%Compensation of employees 177.9 188.0 207.0 216.7 6.8% 43.8% 220.2 228.1 245.4 4.2% 45.9%Transfers and subsidies1 254.1 251.7 258.8 241.9 -1.6% 55.9% 262.0 276.4 291.9 6.5% 54.1%Departmental agencies and accounts 253.5 251.3 258.6 241.8 -1.6% 55.8% 262.0 276.4 291.9 6.5% 54.1%Households 0.6 0.4 0.2 0.1 -43.2% 0.1% – – – -100.0% – Payments for capital assets 5.7 – – – -100.0% 0.3% – – – – – Buildings and other fixed structures 5.7 – – – -100.0% 0.3% – – – – – Total 437.7 439.8 465.9 458.6 1.6% 100.0% 482.2 504.5 537.3 5.4% 100.0%Proportion of total programme expenditure to vote expenditure
7.2% 6.6% 7.3% 7.0% – – 7.1% 7.1% 7.1% – –
Details of selected transfers and subsidies Departmental agencies and accounts Departmental agencies (non-business entities)
Current 253.5 251.3 258.6 241.8 -1.6% 55.8% 262.0 276.4 291.9 6.5% 54.1%Marine Living Resources Fund 253.5 251.3 258.6 241.8 -1.6% 55.8% 262.0 276.4 291.9 6.5% 54.1%1. Estimates of National Expenditure data tables are available and can be downloaded from www.treasury.gov.za. These data tables contain detailed information by goods and services, and
transfers and subsidies item by programme.
Entities1
Agricultural Research Council
Mandate The Agricultural Research Council was established by the Agricultural Research Act (1990) and is the main agricultural research institution in South Africa. In terms of the act, the council’s primary mandate is to conduct research and development, and effect the transfer of technology in order to promote agriculture and industry, contribute to a better quality of life, and facilitate and ensure conservation of natural resources.
1. This section has been compiled with the latest available information from the entities concerned.

2017 Estimates of National Expenditure
466
Selected performance indicators Table 24.14 Agricultural Research Council performance indicators by programme/objective/activity and related outcome Indicator Programme/Objective/Activity Outcome Past Current Projections
2013/14 2014/15 2015/16 2016/17 2017/18 2018/19 2019/20Number of peer reviewed scientific publications in crop production per year
Crop production, improvement and protection
Outcome 7: Comprehensive rural development and land reform
90 110 94 97 87 90 90
Number of cultivars registered per year
Crop production, improvement and protection
13 12 12 16 13 6 6
Number of diagnostic and analytical services rendered per year
Crop production, improvement and protection
833 922 664 587 589 594 594
Number of peer reviewed scientific publications in animal health per year
Animal health, improvement and protection
75 92 90 91 95 100 100
Number of farmers participating in animal improvement schemes per year
Animal health, improvement and protection
–1 –1 400 350 370 380 380
Number of peer reviewed scientific publications in natural resource management per year
Natural resource management Outcome 10: Protect and enhance our environmental assets and natural resources
54 109 79 85 78 80 80
Number of peer reviewed scientific publications in mechanisations and engineering per year
Mechanisation and engineering
Outcome 7: Comprehensive rural development and land reform
–1 3 7 8 9 10 10
Number of peer reviewed scientific publications in agro-processing per year
Agro-processing, food technology and safety
22 15 35 45 47 45 45
Number of food technologies registered per year
Agro-processing, food technology and safety
–1 1 02 3 6 3 02
Number of peer reviewed scientific publications in smallholder agricultural development per year
Smallholder agricultural development 1 02 4 9 8 8 8
Number of smallholder farmers participating in the Kaonafatso ya Dikgomo training scheme per year
Smallholder agricultural development –1 –1 7 500 8 000 8 500 9 000 9 000
1. No historical data available. 2. Target was not achieved in these years because of no new discoveries.
Expenditure analysis The Agricultural Research Council’s spending focus over the medium term will be on generating knowledge and technologies that will enhance the efficiencies of crop production, animal production and health, the management of natural resources, and research and development. The council will also focus on maintaining national assets and providing diagnostic and analytical services on behalf of the Department of Agriculture, Forestry and Fisheries and industry stakeholders. This focus is linked to outcome 4 (decent employment through inclusive economic growth) and outcome 10 (protect and enhance our environmental assets and natural resources) of government’s 2014-2019 medium-term strategic framework.
Over the medium term, the council will spend its total budget of R4 billion on supporting 1 130 farmers participating in animal health improvement schemes, conducting 1 777 diagnostic and analytical services, and producing 238 peer-reviewed scientific publications in natural resource management. In response to climate change the council is working on 25 research studies into new crop cultivars that will be registered. The new cultivars are expected to benefit rural South Africa and the Southern African Development Community region. The council’s staff complement will remain constant at 3 297 over the medium term in order to contain growth in expenditure on compensation of employees, which constitutes R2.7 billion or 68.3 per cent of total expenditure.
The council’s main revenue stream over the medium term will be transfers of R2.8 billion received from the Department of Agriculture, Forestry and Fisheries, and the Department of Science and Technology, constituting about 66 percent of total revenue. Other income, of R1.5 billion, will be generated by sales of publications, research material and technology to supplement transfers received.

Vote 24: Agriculture, Forestry and Fisheries
467
Programmes/objectives/activities Table 24.15 Agricultural Research Council expenditure trends and estimates by programme/objective/activity
Audited outcome Revisedestimate
Averagegrowth
rate(%)
Average:Expen-diture/
Total(%)
Medium-term expenditure estimate
Averagegrowth
rate(%)
Average:
Expen-diture/
Total(%)
R million 2013/14 2014/15 2015/16 2016/17 2013/14 - 2016/17 2017/18 2018/19 2019/20 2016/17 - 2019/20 Administration 165.1 172.5 171.0 172.2 1.4% 13.2% 189.3 197.7 208.7 6.6% 14.6%Crop production, improvement and protection 287.2 292.9 360.5 337.0 5.5% 24.7% 319.7 337.2 351.6 1.4% 25.6%Animal health, improvement and protection 283.9 288.9 299.0 301.5 2.0% 22.8% 284.4 300.1 316.9 1.7% 22.8%Natural resource management 213.0 175.7 160.3 181.6 -5.2% 14.2% 159.7 171.0 180.6 -0.2% 13.2%Mechanisation and engineering 14.9 14.3 15.9 20.2 10.7% 1.3% 18.8 19.9 21.0 1.2% 1.5%Agro-processing, food technology and safety 60.6 59.7 53.8 65.6 2.7% 4.7% 56.5 59.9 63.3 -1.2% 4.7%Smallholder agricultural development 59.2 137.2 145.1 125.4 28.4% 9.0% 145.1 155.4 164.1 9.4% 11.2%Agricultural economics and commercialisation 32.4 31.1 48.6 60.7 23.2% 3.3% 52.7 55.8 59.0 -0.9% 4.3%Training and extension 18.5 17.7 25.3 26.4 12.6% 1.7% 27.5 29.0 30.7 5.1% 2.2%Other projects 92.2 135.0 37.6 – -100.0% 5.1% – – – – – Total 1 226.9 1 325.0 1 317.2 1 290.5 1.7% 100.0% 1 253.7 1 326.0 1 395.7 2.6% 100.0%
Statements of historical financial performance and position Table 24.16 Agricultural Research Council statements of historical financial performance and position Statement of financial performance
Budget Audited outcome Budget
Audited outcome Budget
Audited outcome
Budget estimate
Revisedestimate
Average:Outcome/
Budget (%)
R million 2013/14 2014/15 2015/16 2016/17 2013/14 - 2016/17 Revenue Non-tax revenue 356.8 496.9 391.2 439.1 413.6 461.5 437.4 445.3 115.2%Sale of goods and services other than capital assets 332.0 447.3 364.8 386.5 386.7 411.7 409.9 409.9 110.8%of which: Sales by market establishment 332.0 447.3 364.8 386.5 386.7 411.7 409.9 409.9 110.8%Other non-tax revenue 24.8 49.5 26.4 52.6 27.0 49.8 27.5 35.4 177.3%Transfers received 888.4 865.8 956.8 919.3 744.7 782.3 752.6 739.5 98.9%Total revenue 1 245.3 1 362.6 1 348.0 1 358.4 1 158.3 1 243.7 1 190.0 1 184.7 104.2%Expenses Current expenses 1 128.6 1 226.9 1 269.1 1 325.0 1 075.7 1 317.2 1 103.0 1 290.5 112.7%Compensation of employees 663.5 685.2 738.9 760.4 779.3 766.9 818.3 818.3 101.0%Goods and services 431.6 511.2 496.7 517.7 261.4 509.8 247.7 432.0 137.1%Depreciation 33.5 30.4 33.5 47.0 35.0 40.4 37.0 40.2 113.6%Interest, dividends and rent on land – 0.1 – – – – – – 1 234.2%Total expenses 1 128.6 1 226.9 1 269.1 1 325.0 1 075.7 1 317.2 1 103.0 1 290.5 112.7%Surplus/(Deficit) 117.0 136.0 79.0 33.0 83.0 (73.0) 87.0 (106.0) Statement of financial position Carrying value of assets 1 116.0 880.1 992.3 944.3 991.8 1 006.4 1 104.0 1 104.0 93.6%of which: Acquisition of assets (109.1) (146.4) (150.4) (111.1) (141.0) (103.3) (87.0) (87.0) 91.9%Investments 2.0 4.3 2.0 5.3 4.3 5.0 4.3 4.3 148.9%Inventory 13.2 18.9 13.9 12.4 14.7 7.5 15.4 15.4 94.8%Receivables and prepayments 86.8 122.2 93.6 121.4 98.8 213.7 103.3 151.5 159.2%Cash and cash equivalents 128.0 480.2 401.5 508.2 316.9 301.5 285.7 187.6 130.5%Total assets 1 346.1 1 505.8 1 503.4 1 591.6 1 426.4 1 534.1 1 512.8 1 462.8 105.3%Accumulated surplus/(deficit) 917.2 855.6 875.8 870.0 888.9 796.6 975.9 739.0 89.2%Capital and reserves 111.3 2.4 2.4 2.6 2.4 2.6 2.4 2.4 8.4%Capital reserve fund – 109.6 109.6 112.0 109.6 112.0 109.6 112.0 135.5%Deferred income 74.3 192.6 192.6 192.6 192.6 192.6 192.6 192.6 118.1%Trade and other payables 174.1 228.6 248.0 275.2 163.9 316.2 164.2 348.8 155.8%Taxation – 7.8 – 12.8 – 5.7 – – – Provisions 69.1 109.1 75.0 126.4 69.1 108.4 68.1 68.1 146.5%Total equity and liabilities 1 346.1 1 505.8 1 503.4 1 591.6 1 426.4 1 534.1 1 512.8 1 462.8 105.3%

2017 Estimates of National Expenditure
468
Statements of estimates of financial performance and position Table 24.17 Agricultural Research Council statements of estimates of financial performance and position Statement of financial performance
Revised estimate
Averagegrowth
rate(%)
Average:Expen-diture/
Total(%) Medium-term estimate
Averagegrowth
rate(%)
Average:Expen-diture/
Total(%)
R million 2016/17 2013/14 - 2016/17 2017/18 2018/19 2019/20 2016/17 - 2019/20 Revenue Non-tax revenue 445.3 -3.6% 35.9% 462.5 489.1 512.2 4.8% 35.1%Sale of goods and services other than capital assets
409.9 -2.9% 32.2% 434.5 460.5 481.8 5.5% 32.9%
of which: Sales by market establishment 409.9 -2.9% 32.2% 434.5 460.5 481.8 5.5% 32.9%Other non-tax revenue 35.4 -10.6% 3.6% 28.0 28.6 30.3 -5.0% 2.3%Transfers received 739.5 -5.1% 64.1% 882.5 933.5 985.6 10.1% 64.9%Total revenue 1 184.7 -4.6% 100.0% 1 345.0 1 422.6 1 497.8 8.1% 100.0%Expenses Current expenses 1 290.5 1.7% 100.0% 1 253.7 1 326.0 1 395.7 2.6% 109.5%Compensation of employees 818.3 6.1% 58.7% 859.2 902.1 952.7 5.2% 67.1%Goods and services 432.0 -5.5% 38.2% 353.5 380.7 397.6 -2.7% 29.7%Depreciation 40.2 9.8% 3.1% 41.0 43.1 45.4 4.1% 3.2%Total expenses 1 290.5 1.7% 100.0% 1 253.7 1 326.0 1 395.7 2.6% 100.0%Surplus/(Deficit) (106.0) (2) 91.0 97.0 102.0 -198.7% Statement of financial position Carrying value of assets 1 104.0 7.8% 64.7% 1 155.7 1 210.5 1 278.3 5.0% 74.0%of which: Acquisition of assets (87.0) -15.9% -7.3% (91.3) (95.9) (101.3) 5.2% -5.9%Investments 4.3 0.0% 0.3% 4.3 4.3 4.6 1.8% 0.3%Inventory 15.4 -6.5% 0.9% 16.5 16.5 17.4 4.2% 1.0%Receivables and prepayments 151.5 7.4% 10.0% 176.0 104.0 109.8 -10.2% 8.5%Cash and cash equivalents 187.6 -26.9% 24.1% 235.8 286.9 333.7 21.2% 16.1%Total assets 1 462.8 -1.0% 100.0% 1 588.2 1 622.2 1 743.7 6.0% 100.0%Accumulated surplus/(deficit) 739.0 -4.8% 53.5% 830.3 926.9 1 029.0 11.7% 54.7%Capital and reserves 2.4 – 0.2% 2.4 2.4 2.5 1.8% 0.2%Capital reserve fund 112.0 0.7% 7.3% 112.0 112.0 112.0 – 7.0%Deferred income 192.6 – 12.7% 192.6 192.6 203.4 1.8% 12.2%Trade and other payables 348.8 15.1% 19.2% 379.0 316.3 320.9 -2.7% 21.4%Provisions 68.1 -14.6% 6.7% 71.9 71.9 76.0 3.7% 4.5%Total equity and liabilities 1 462.8 -1.0% 100.0% 1 588.2 1 622.2 1 743.7 6.0% 100.0%
Personnel information Table 24.18 Agricultural Research Council personnel numbers and cost by salary level
Number of posts estimated for 31 March 2017 Number and cost1 of personnel posts filled / planned for on funded establishment Number
Number of
funded posts
Number of
posts on approved
establishment Actual Revised estimate
Medium-term expenditure estimate
Averagegrowth
rate(%)
Average:Salary
level/Total(%)
2015/16 2016/17 2017/18 2018/19 2019/20 2016/17 - 2019/20
Agricultural Research Council Number Cost Unit cost Number Cost
Unit cost Number Cost
Unit cost Number Cost
Unit cost Number Cost
Unit cost
Salary level
3 297 3 297 3 297 766.9 0.2 3 297 818.3 0.2 3 297 859.2 0.3 3 297 902.1 0.3 3 297 952.7 0.3 5.2% 100.0%
1 – 6 1 974 1 974 1 974 210.6 0.1 1 974 225.4 0.1 1 974 236.6 0.1 1 974 248.5 0.1 1 974 262.4 0.1 5.2% 59.9%7 – 10 1 061 1 061 1 061 360.2 0.3 1 061 387.0 0.4 1 061 406.4 0.4 1 061 426.7 0.4 1 061 450.6 0.4 5.2% 32.2%11 – 12 182 182 182 111.7 0.6 182 117.2 0.6 182 123.1 0.7 182 129.3 0.7 182 136.5 0.7 5.2% 5.5%13 – 16 77 77 77 77.6 1.0 77 81.5 1.1 77 85.6 1.1 77 89.9 1.2 77 94.9 1.2 5.2% 2.3%17 – 22 3 3 3 6.8 2.3 3 7.1 2.4 3 7.5 2.5 3 7.8 2.6 3 8.3 2.8 5.2% 0.1%1. Rand million.
Other entities Comprehensive coverage of the following public entities is provided with the more detailed information for the vote at www.treasury.gov.za under the budget information link.
• The Marine Living Resources Fund was established in terms of the Marine Living Resources Act (1998). The fund’s mandate is to manage the development and sustainable use of South Africa’s marine resources, and to protect the integrity and quality of the marine ecosystem. The fund’s total budget for 2017/18 is R450.7 million.
• The National Agricultural Marketing Council was established in terms of sections 3 and 4 of the Marketing of Agricultural Products Act (1996). The council is mandated to investigate the establishment,

Vote 24: Agriculture, Forestry and Fisheries
469
continuation, amendment or revocation of statutory measures affecting the marketing of agricultural products; and evaluate the desirability, necessity or efficiency of these statutory measures. It is also mandated to, if necessary, propose alternatives to the establishment, continuation, amendment or repeal of a statutory measure, and to report to and advise the minister accordingly. The entity’s total budget for 2017/18 is R41.9 million.
• Ncera Farms is a schedule 3B public company, with the Department of Agriculture, Forestry and Fisheries as the sole shareholder. The company’s mandate is to provide extension, mechanical, and training and agricultural support services to the farmers settled on Ncera farmland and neighbouring communities. The entity’s total budget for 2017/18 is R6.4 million.
• Onderstepoort Biological Products was established as a public company in terms of the Onderstepoort Biological Products Incorporation Act (1999), with government as the sole shareholder. The company’s mandate is to prevent and control animal diseases that impact on food security, human health and livelihoods through the continued development and efficient manufacturing of innovative animal related pharmaceuticals (including vaccines) and related products. The entity’s total budget for 2017/18 is R140.2 million.
• The Perishable Products Export Control Board is an independent service provider of quality assurance, food safety, and cold chain management services, for producers and exporters of perishable food products. It is mandated by government in terms of the Perishable Products Export Control Act (1983), which broadly requires the board to ensure the orderly export of perishables and monitor the proper maintenance of a continuous cold chain for exports. It also derives its mandate from the Agricultural Products Standards Act (1990), which broadly requires the board to monitor the minimum quality standards of perishable exports, as required by government and bilateral agreements with importing countries. The entity’s total budget for 2017/18 is R350.6 million.

470
2017 Estimates of National Expenditure
Additional table: Summary of expenditure on infrastructure Project name Service delivery
outputs Current project stage
Total project cost Audited outcome
Adjustedappropriation Medium-term expenditure estimate
R million 2013/14 2014/15 2015/16 2016/17 2017/18 2018/19 2019/20 Departmental infrastructure Small projects (total project cost of less than R250 million over the project life cycle) Drilling of boreholes Siting, drilling and testing of boreholes for small-scale farmers identified in
priority projects by provinces Various 200.0 10.4 10.6 8.9 9.4 9.2 9.7 10.3
Foot-and-mouth disease border fence Repairs and construction of foot-and-mouth disease fences in priority areas identified by the animal health directorate
Various 250.0 23.7 29.5 25.4 25.6 23.8 25.1 26.5
KwaZulu-Natal: Durban Site-clearance Feasibility 17.7 0.1 0.1 – – – – – Upington Upgrade of offices and storerooms and construction of evaporation pan and
laboratory Feasibility 8.4 0.4 – – – 1.9 2.8 2.9
Grootfontein Agricultural Development Institute
Minor upgrade and repairs of institute Handed over 1.9 0.9 0.1 – – – – –
Western Cape: Cape Town Building of sniffer dog kennels Feasibility 7.7 – – – 2.6 1.0 2.0 2.1 Gauteng: Pretoria reception Upgrade of reception areas at: Agriculture Place, Harvest House and Sefala Design 2.1 0.8 – 0.1 0.4 – – – Limpopo: Mutale municipal district Construction of a seed bank: Mutale (Project on-hold pending the finalisation of
site-clearance for construction) On hold 4.4 – 0.2 – 0.7 1.3 1.1 1.1
Eastern Cape: Sterkspruit Construction of a seed bank: Mthatha (Project on-hold pending the finalisation of site -clearance for construction)
On hold 4.4 – 0.1 – 0.5 0.5 3.0 0.3
Western Cape: Stellenbosch (plant health laboratory)
Alterations of Polka Draai Road entrance in terms of traffic regulations On hold 1.0 – – – 0.2 0.4 0.4 –
Mpumalanga: Skukuza alterations Upgrade of existing buildings and laboratories Design 6.7 0.3 0.1 2.3 3.7 – 0.3 – Western Cape: Stellenbosch Upgrade of electrical substation Construction 0.4 – – 0.4 – – – – Gauteng: Harvest House Revamping of the parking area at Harvest House Design 2.6 – 0.4 0.1 0.2 1.9 – – Western Cape: Cape Town Design and construction of minor capital projects along South Africa’s coastline Design 1.2 – 0.4 0.3 0.5 – – – KwaZulu-Natal: Durban Construction of an animal quarantine station Design 48.7 – 3.0 2.0 7.3 9.5 13.5 13.1 Western Cape: Stellenbosch Lab Upgrade and maintenance of building and laboratory facility (glasshouses and
tunnels) Design 24.4 – 2.6 0.1 15.3 3.0 3.4 –
Gauteng: Roodeplaat stop sea line Repairs and installation of the infrastructure at the Plant Genetic Resources Centre
Design 0.3 0.3 – – – – – –
Western Cape: Cape Town Coastline Repairs and maintenance of fisheries harbours along the coastline Design 2.3 – – – 1.3 1.0 – – Western Cape: Cape Town Upgrade of student centre and laboratories at Sea Point Pre-feasibility 5.8 – – – – – – – Western Cape: Stelllenbosch Rehabilitation of two irrigation dams including repairs of dam wall Identification 0.2 – – – – 0.1 0.1 0.1 Western Cape: Stellebosch sewerage Upgrade of sewerage system Pre-feasibility 0.3 – – – – 0.3 – – Gauteng: Maizeboard Maizeboard: Repairs and maintenance Construction 0.1 – – 0.1 – 0.0 – – Various maintenance and repair projects
Maintenance and repairs Identification 11.5 1.9 – – 3.1 4.5 1.0 1.0
Spitskop Conservation Area Maintenance and repair of existing soil conservation structures Various 8.4 8.4 – – – – – – Gauteng: Roodeplaat plant genetic centre
Upgrade of Plant Genetic Centre: Roodeplaat Complete 3.5 – 0.1 0.1 0.3 3.0 – –
Gauteng Kempton Park Animal quarantine station
Repairs and maintenance of animal quarantine station Feasibility 8.1 – – – – 3.1 2.4 2.6
Western Cape: Milnerton Upgrade of animal quarantine station Complete 4.7 – – – 0.5 0.2 4.0 –

471
Vote 24: Agriculture, Forestry and Fisheries
Additional table: Summary of expenditure on infrastructure Project name Service delivery
outputs Current project stage
Total project cost Audited outcome
Adjustedappropriation Medium-term expenditure estimate
R million 2013/14 2014/15 2015/16 2016/17 2017/18 2018/19 2019/20 Eastern Cape: Gauteng Agricultural Development Institute
Upgrade of Infrastructure at Grootfontein Agriculture Development Institute Feasibility 29.8 – – 0.6 0.7 3.0 6.3 19.2
Eastern Cape: Sterkspruit Site clearance of seed bank at Sterkspriut Feasibility 0.6 – – – 0.1 – 0.3 0.2 Gauteng: Sefala Roof Sefala building replacement of roof water proofing structures Construction 3.4 – – – – 3.4 – – Gauteng: Maizeboard Maizeboard: Repairs and maintenance Hand over 0.7 – – – – 0.3 0.2 0.2 Sectoral Colleges Upgrading Identification 0.4 – – – 0.4 – – – Woodlands Upgrading Identification 0.1 – – – 0.1 – – – Prevention and mitigation of disasters Upgrading Identification 8.4 – – – 8.4 – – – Large projects (total project cost of at least R250 million but less than R1 billion over the project life cycle) Animal production, health and improvement
Facilitation of vaccine for foot-and-mouth disease Complete 149.1 – – – – – – –
Comprehensive agricultural support programme grant: Flood damaged infrastructure
Repairs of damaged infrastructure and soil rehabilitation Various 1 845.0 303.3 493.8 58.6 76.7 139.1 155.9 65.6
Onderstepoort Biological Products Building and facilitation of vaccine production Various 492.4 96.5 127.5 268.4 – – – – Small projects (total project cost of less than R250 million over the project life cycle) Agriculture Research Council: Maintenance of infrastructure
Maintenance of building (for research and development) Various 120.3 14.6 15.5 16.2 17.1 17.9 19.0 20.0
Total 3 276.6 461.5 684.0 383.5 175.2 228.4 250.4 165.2

472 2017 Estimates of National Expenditure