Embed Size (px)
Citation preview

Estimates of Provincial Expenditure 2007 Vote 3: Provincial Treasury
65
Vote 3 Provincial Treasury
2007/08 2008/09 2009/10To be appropriated
R119 001 000 R126 053 000 R138 576 000
Accounting Officer
Administering Department Provincial Treasury
Head Official: Provincial Treasury
MTEF allocations
Responsible MEC Provincial Minister of Finance and Tourism
1. Overview
Core functions and responsibilities To provide and maintain office support to the Minister, ensure sound financial and human resource management and administration.
Improve the financial resources available to the Province, better target these to achieve desired socio-economic outcomes and to achieve better alignment with municipal budgetary processes.
Promote the effective and efficient management of physical and financial assets, liabilities and public-private partnerships, both within the Province and municipalities.
Promote accountability and performance oriented financial management through accurate and full reflection of the Province’s financial activities, systems and processes, as well as compliance with financial norms and standards.
Vision To systematically try and improve social and economic equity in the Province via our change agent role in financial resource allocation, guidance of expenditures and promotion of better financial management in both the provincial and municipal spheres.
Mission To obtain the required financial and other supportive means and utilise these optimally in pursuit of its vision and supporting strategic goals.
Main services Describing socio-economic conditions and introduction of appropriate fiscal (revenue and expenditure) and associated policies to address these.
Fostering the attainment of value for money spending, inclusive of new financial management practices to enhance efficiency and risk governance.
Promoting the effective utilisation and safeguarding of provincial assets.
Facilitating the full disclosure of provincial transactions and attainments.

Estimates of Provincial Expenditure 2007 Vote 3: Provincial Treasury
66
Demands and changes in service Major responsibilities have been placed on provincial treasuries to drive the national and provincial agenda with respect to enhanced fiscal performance by the state in collaboration with its partners, the National Treasury and the Departments of the Premier and Local Government and Housing across both provincial and local government spheres.
Improve financial governance to maximise returns on resources deployed using its guidance, supporting, monitoring and evaluating roles more effectively and promoting the evolvement and integration of strategies and service delivery outputs between departments and municipalities.
Sharpening of the Provincial Treasury’s policy objectives, namely the formulation and implementation of fiscal policy, improving spending efficacy, better fiscal discipline, efficient acquisition and application of assets and resources, capacity building and fostering of intergovernmental relations have also become necessary, inclusive of further internal structural adjustments to achieve greater and more constructive impact on its clients.
Acts, rules and regulations Annual Division of Revenue Act
To provide for the equitable division of revenue raised nationally, inclusive of conditional grants, amongst the three spheres of government and matters incidental thereto.
Basic Conditions of Employment Act, 1997 (Act 75 of 1997) To provide regulatory prescripts, in addition to the Public Service Act, 1994 and the Public Service Regulations,
2001, regarding the conditions of employment of staff in the Treasury.
Borrowing Powers of Provincial Government Act, 1996 (Act 48 of 1996) To provide norms and conditions which the Treasury must adhere to in negotiating loans for the Provincial
Government.
Employment Equity Act, 1998 (Act 55 of 1998) To regulate the processes and procedures of the Treasury in achieving a diverse and competent workforce broadly
representative of the demographics of the Western Cape and eliminating unfair discrimination in employment towards implementing employment equity.
Intergovernmental Fiscal Relations Act, 1997 (Act 97 of 1997) To define the role of the Minister of Finance and Tourism and that of the Treasury, as representatives of the
Provincial Government, in promoting co-operation between other spheres of government on fiscal, budgetary and financial matters; to provide insight into the prescribed processes for the determination of the equitable share and allocation of revenue raised nationally and for matters in connection therewith.
Labour Relations Act, 1995 (Act 66 of 1995) To regulate and guide the Treasury in recognising and fulfilling its role in effecting labour harmony and the
democratisation of the workplace.
Local Government: Municipal Finance Management Act, 2003 (Act 56 of 2003) (MFMA) To secure sound and sustainable management of the financial affairs of municipalities and other institutions in the
local sphere of government; to establish treasury norms and standards for the local sphere of government; and to provide for matters connected therewith.
Occupational Health and Safety Act, 1993 (Act 85 of 1993) To provide for the health and safety of persons at work and for the health and safety of persons in connection with
the use of plant and machinery; the protection of persons other than persons at work against hazards to health and safety arising out of or in connection with the activities of persons at work; to establish an advisory council for occupational health and safety; and to provide for matters connected therewith.
Preferential Procurement Policy Framework Act, 2000 (Act 5 of 2000) To provide the Treasury with a regulatory framework enabling and assisting departments and potential historically
disadvantaged individuals (HDIs) in the sustainable development and implementation of a preferential procurement system.
Promotion of Access to Information Act, 2000 (Act 2 of 2000) To give effect to the constitutional right of access to any information held by the state and any information that is
held by another person and that is required for the exercise or protection of any rights; and to provide for matters connected therewith.

Estimates of Provincial Expenditure 2007 Vote 3: Provincial Treasury
67
Promotion of Administrative Justice Act, 2000 (Act 3 of 2000) To give effect to the right to administrative action that is lawful, reasonable and procedurally fair and to the right to
request written reasons for administrative action as contemplated in section 33 of the Constitution of the Republic of South Africa, 1996; and to provide for matters incidental thereto.
Provincial Tax Regulation Process Act, 2001 (Act 53 of 2001) To regulate the intergovernmental process that must be followed by provinces in the exercise of their power in
terms of section 228 of the Constitution to impose taxes, levies and duties, and flat-rate surcharges on the tax bases of any tax, levy or duty imposed by national legislation; and to provide for matters connected therewith.
Public Finance Management Act, 1999 (Act 1 of 1999) (PFMA) To regulate financial management in the Treasury to ensure that all revenue, expenditure, assets and liabilities of
the Treasury are managed efficiently and effectively; to provide for the responsibilities of persons entrusted with financial management in the Treasury and to provide for matters connected therewith. To fulfil all Treasury responsibilities with respect to other departments and public entities.
Public Service Act, 1994 (Act 103 of 1994) To provide for the organisation and administration of the Treasury and for human resource management which
includes the regulation of conditions of employment, terms of office, discipline, retirement and discharge of staff members of the Treasury and matters connected therewith.
Skills Development Act, 1998 (Act 97 of 1998) To provide an institutional framework to devise and implement national, sector and workplace strategies to develop
and improve the skills of the South African workforce; to integrate those strategies within the National Qualification Framework contemplated in the South African Qualification Authority Act, 1995; to provide for learnerships that lead to recognised occupational qualifications; to provide for the financing of skills development by means of a levy-grant scheme and a national skills fund; to provide for and regulate employment services; and to provide for matters connected therewith.
Skills Development Levy Act, 1999 (Act 9 of 1999) To provide for the imposition of a skills development levy; and for matters connected therewith.
Western Cape Direct Charges Act, 2000 (Act 6 of 2000) To provide for the withdrawal of State moneys from the Western Cape provincial revenue fund, as a direct charge,
in accordance with the Constitution of the Republic of South Africa, 1996 (Act 108 of 1996), the Constitution of the Western Cape, 1998 (Act 1 of 1998) and the Public Finance Management Act, 1999 (Act 1 of 1999), and for matters incidental thereof.
Western Cape Gambling and Racing Law, 1996 (Law 4 of 1996) To provide regulatory prescripts to support the responsible Minister in ensuring sound financial administration and
matters incidental thereto by the Western Cape Gambling and Racing Board.
Western Cape Law on the Powers and Privileges of the Provincial Legislature Amendment Act, 1998 (Law 3 of 1998)
To provide the Treasury with regulatory prescripts in assisting the Legislature when necessary, in meeting their financial responsibilities as set out in legislation.
Western Cape Provincial Tender Board Law, 1994 (Law 8 of 1994) Although this Law has been revoked, a number of period contracts concluded under this Law and its regulations,
are still valid and have to be administered in terms of this legislation.
Budget decisions The distribution of financial allocations across the various programmes has been amended to take account of the further evolvement of its transformational structural processes begun 4 years ago, as well as changes in functional demands and shifts of SITA payments to all other votes in the Province. The latter have now been stabilised and the shifts have been made to foster proper accountability.
2. Review 2006/07 Phases 1 and 2 of the restructuring process of the Provincial Treasury have been completed and the vacancy rate brought down from roundabout 40 per cent to 20 per cent. Currently there are some 250 staff members employed in Treasury, collectively bringing some unique skills into the work place. This has significantly enhanced our ability to

Estimates of Provincial Expenditure 2007 Vote 3: Provincial Treasury
68
deliver on our mandate. Nonetheless, the retention and recruitment of appropriate qualified staff remains a challenge to the Provincial Treasury, albeit less than in the earlier transformational years. It’s important to be able to nurture the build-up of skills over at least two to three years so that staff leaves Provincial Treasury for other pastures with the requisite competencies.
As has become customary, the Medium Term Budget Policy Statement (MTBPS) 2008 – 2011 again provided an advance indication for what could be expected in the Province’s 2007/08 Budget and provided a useful vehicle to elicit comment thereon. During 2006/07, great strides were made to further strengthen relationships with municipalities and improve on the current knowledge base. The interaction with municipalities has taken place in close cooperation with the Departments of Local Government and Housing and Economic Development and Tourism. Overall the cooperative approach holds the promise of bringing the two spheres closer together and enhances value for money spending and greater efficiency.
Accommodation pressures within the Provincial Treasury necessitated the Treasury to obtain new office space in the Southern Life Building in the lower City Bowl of Cape Town. The new accommodation needed is a direct result of the transformational processes drawing to a close and will imply that the Asset Management Component be moved to the new offices. Furthermore, additional office space is needed for the evolving in-house Internal Audit Unit, which will be phased in over the next three financial years.
3. Outlook for 2007/08 It is the intention of the Provincial Treasury to maintain and enhance a credible medium term fiscal framework, further socio-economic analysis and good financial governance that will lead to sustainable and efficient spending patterns for all twelve departments. Ultimately this supports the attainment of shared growth and development within the Province.
In tandem with a credible fiscal framework, the Provincial Treasury will promote substantive compliance of all financial transactions for the Provincial Government via its Financial Management, Norms and Standards, Provincial Risk Management units and enhancement of Provincial Internal Audit services. Furthermore, it will be a priority to foster better management of the Provincial Government’s physical and financial assets, financial systems and liabilities. Key deliverables would also be to improve in-year expenditure management practices and analyses and similarly intergovernmental financial management, municipal oversight and capacity building.

Estimates of Provincial Expenditure 2007 Vote 3: Provincial Treasury
69
4. Receipts and financing
Summary of receipts Table 4.1 below depicts the sources of funding for the vote.
Table 4.1 Summary of receipts
Audited Audited Audited
% Change from
Revised estimate
2003/04 2004/05 2005/06 2006/07 2006/07 2006/07 2007/08 2006/07 2008/09 2009/10
( 323 513 ) ( 282 979 ) ( 353 103 ) ( 5 831 ) ( 5 831 ) ( 5 831 ) 664 ( 111.39) 8 486 22 220
( 2 300 ) ( 43 113 ) ( 100.00)
( 149 923 ) ( 149 923 ) ( 149 923 ) ( 218 280 ) 45.59 ( 242 852 ) ( 263 692 )
( 323 513 ) ( 282 979 ) ( 353 103 ) ( 155 754 ) ( 158 054 ) ( 198 867 ) 119 001 ( 159.84) 126 053 138 576
Tax receipts 146 349 172 745 221 972 234 860 237 160 265 599 288 418 8.59 306 401 324 997 23 896 7 233 1 008 1 008 1 197 1 022 ( 14.62) 1 022 1 022
Transfers received 1 627 4 1 1 1 1 1 1 314 231 290 215 ( 100.00)
240 621 211 333 233 361 54 131 54 131 54 588 47 128 ( 13.67) 52 947 53 980
103 4 522 9 769 48 ( 99.51) 48 48
388 934 385 312 467 378 290 000 292 300 331 369 336 617 1.58 360 419 380 048
65 421 102 333 114 275 134 246 134 246 132 502 119 001 ( 10.19) 126 053 138 576
Interest, dividends andrent on land
Financial transactions in assets and liabilities
Total departmental receipts
Total receipts
Total Treasury funding
Departmental receipts
Sales of goods andservices other thancapital assets
Fines, penalties andforfeits
Financing
Own receipts (Provincial Treasury)
Revised estimate
Medium-term estimate
Treasury funding
Equitable share
ReceiptsR'000
Outcome
Main appro-priation
Adjusted appro-priation
Summary of receipts:
Total receipts decrease by R13,501 million or 10,19 per cent from R132,502 million in 2006/07 to R119,001 million in 2007/08. Included in the R119,000 million is an earmarked allocation for Internal Audit Capacity in 2007/08 of R4,600 million.
Treasury funding of which:
Equitable share amounts to R664 000 in 2007/08; R8,486 million in 2008/09 and R22,220 million in 2009/10 over the MTEF.
Financing from Provincial own receipts of R218,280 million in 2007/08; R242,852 million in 2008/09 and R263,692 million in 2009/10 are allocated to other departments.
Details of Departmental receipts:
Total departmental own receipts increase by R5,248 million or 1,58 per cent from R331,369 million in 2006/07 to R336,617 million in 2007/08. The main sources of income are in respect of tax receipts and interest, dividends and rent on land. Tax receipts, of which casino taxes and horseracing are the main contributors, increase by R22,819 million or 8,59 per cent from R265,599 million in 2006/07 to R288,418 million in 2007/08. The estimated increase in tax receipts is mainly due to the expansion of the gambling industry.

Estimates of Provincial Expenditure 2007 Vote 3: Provincial Treasury
70
Interest, dividends and rent on land, of which interest is the main contributor, decreases by R7,460 million or 13,67 per cent from R54,588 million in 2006/07 to R47,128 million in 2007/08. This estimated decrease is mainly due to the reduction in the balances of the Asset Finance Reserve Fund in the Western Cape Province.
5. Payment summary
Key assumptions Year-on-year adjustments for salary increases are based on the assumption that wage agreements will result in salary increases of 7 per cent from 2006/07 to 2007/08, 6 per cent from 2007/08 to 2008/09 and 6 per cent from 2008/09 to 2009/10 inclusive of the 1 per cent pay progression. Adjustments for the majority of the non-personnel expenditure items classified under Goods and Services are based on the assumption that the CPIX will be 5,1 per cent from 2006/07 to 2007/08, 4,3 per cent from 2007/08 to 2008/09 and 4,5 per cent from 2008/09 to 2009/10.
Programme summary Table 5.1 below indicates the budget or estimated expenditure per programme and Table 5.2 per economic classification. Details of the Government Financial Statistics (GFS) economic classifications are attached as an annexure to this vote.
Table 5.1 Summary of payments and estimates
Audited Audited Audited
% Change from
Revised estimate
2003/04 2004/05 2005/06 2006/07 2006/07 2006/07 2007/08 2006/07 2008/09 2009/10
Administration a 20 187 21 318 23 220 27 605 29 337 28 505 30 328 6.40 31 329 32 994 Sustainable resource management
14 437 11 067 16 513 24 130 22 417 21 675 28 233 30.26 30 695 32 407
Asset and liabilities management b
21 934 43 108 46 699 49 677 48 691 48 243 20 738 ( 57.01) 22 088 23 301
Financial governance 8 863 26 840 27 843 32 834 33 801 34 079 39 702 16.50 41 941 49 874
65 421 102 333 114 275 134 246 134 246 132 502 119 001 ( 10.19) 126 053 138 576
4.
Total payments and estimates
Medium-term estimate
ProgrammeR'000
Outcome
Main appro-priation
Adjusted appro-priation
1.
2.
3.
Revised estimate
a
b
MEC remuneration payable: Salary R575 410, Car allowance R143 852, with effect from 1 April 2006.
The amounts at Asset and Liabilities Management for 2003/04 include expenditure (R313 000) pertaining to the Western Cape Provincial TenderBoard, which was abolished on 31 December 2003.

Estimates of Provincial Expenditure 2007 Vote 3: Provincial Treasury
71
Summary by economic classification Table 5.2 Summary of provincial payments and estimates by economic classification
Audited Audited Audited
% Change from Revised
estimate
2003/04 2004/05 2005/06 2006/07 2006/07 2006/07 2007/08 2006/07 2008/09 2009/10
Current payments 50 354 99 614 112 495 133 064 132 739 130 077 117 892 ( 9.37) 124 831 137 418
29 974 33 590 41 941 60 814 55 847 54 553 76 550 40.32 85 847 99 755
Goods and services 20 380 65 930 70 381 72 250 76 892 74 520 41 342 ( 44.52) 38 984 37 663
94 173 1 004 ( 100.00)
4 915 723 348 184 481 482 ( 100.00) 67 81 152 94 29 29 ( 100.00)
4 700 27 37 37 37 ( 100.00)
50 53 53 54 ( 100.00)
Households 148 565 196 362 362 ( 100.00)
10 152 1 996 1 432 998 1 026 1 943 1 109 ( 42.92) 1 222 1 158 Machinery and equipment 10 152 1 391 1 029 982 886 1 803 989 ( 45.15) 1 096 1 026
605 403 16 140 140 120 ( 14.29) 126 132
65 421 102 333 114 275 134 246 134 246 132 502 119 001 ( 10.19) 126 053 138 576
Software and other intangible assets
Total economic classification
Foreign governments and international organisations
Payments for capital assets
Transfers and subsidies toProvinces and municipalities
Departmental agenciesand accounts
Revised estimate
Medium-term estimate
Compensation ofemployees
Financial transactions inassets and liabilities
Economic classificationR'000
Outcome
Main appro-priation
Adjusted appro-priation
Transfers to public entities Table 5.3 Summary of departmental transfers to public entities
Audited Audited Audited
% Change from
Revised estimate
2003/04 2004/05 2005/06 2006/07 2006/07 2006/07 2007/08 2006/07 2008/09 2009/10
4 700
4 700 Total departmental transfers to public entities
Revised estimate
Medium-term estimate
Public entitiesR'000
Outcome
Main appro-priation
Adjusted appro-priation
Western Cape Gambling and Racing Board
Transfers to development corporations Table 5.4 Summary of departmental transfers to development corporations by entity - None
Transfers to local government Table 5.5 Summary of departmental transfers to local government by category - None

Estimates of Provincial Expenditure 2007 Vote 3: Provincial Treasury
72
Departmental Public-Private Partnership (PPP) projects Table 5.6 Summary of departmental Public-Private Partnership projects – None
6. Programme description
Programme 1: Administration
Purpose: To provide and maintain high quality support services to the Minister and the Provincial Treasury pertaining to sound financial administration, supply chain management, auxiliary services, human resource management and administration.
Analysis per sub-programme: Sub-programme 1.1: Office of the minister
to render secretarial, administrative and office support services and acts as linkage with the Treasury, the Department of Economic Development and Tourism and the Provincial Parliament enabling the Minister to realise her Treasury and Tourism responsibilities
Sub-programme 1.2: Management services to render strategic support and conduct overall planning
Sub-programme 1.3: Corporate services to provide an internal enabling function and support service to the other programmes and sub-programmes with regard to human resource management and development
Sub-programme 1.4: Financial management
to deliver financial management (inclusive of risk management and internal control), supply chain management and specialised auxiliary services for the Treasury
This Programme concerns the staff function of the Treasury ("internal services") and is, therefore, not discussed in further detail. However, the budgetary figures of the Programme are reflected in the tables below.
Table 6.1 Summary of payments and estimates – Programme 1: Administration
Audited Audited Audited
% Change from
Revised estimate
2003/04 2004/05 2005/06 2006/07 2006/07 2006/07 2007/08 2006/07 2008/09 2009/10
Office of the Minister a 3 015 2 919 3 559 3 874 3 711 3 409 3 759 10.27 4 050 4 278 Management services 1 747 2 209 2 493 2 338 2 122 (9.24) 2 319 2 455 Corporate services 4 681 5 474 6 999 8 362 8 931 8 740 9 804 12.17 10 405 10 972 Financial management 12 491 12 925 10 915 13 160 14 202 14 018 14 643 4.46 14 555 15 289
20 187 21 318 23 220 27 605 29 337 28 505 30 328 6.40 31 329 32 994 Total payments and estimates
a MEC remuneration payable: Salary R575 410, Car allowance R143 852, with effect from 1 April 2006.
2.
3. 4.
Medium-term estimate
Sub-programmeR'000
Outcome
Main appro-priation
Adjusted appro-priation
Revised estimate
1.

Estimates of Provincial Expenditure 2007 Vote 3: Provincial Treasury
73
Table 6.1.1 Summary of provincial payments and estimates by economic classification – Programme 1: Administration
Audited Audited Audited
% Change from
Revised estimate
2003/04 2004/05 2005/06 2006/07 2006/07 2006/07 2007/08 2006/07 2008/09 2009/10
Current payments 17 614 20 133 22 541 26 792 28 538 27 205 29 786 9.49 30 672 32 308
11 338 11 397 12 111 14 832 13 769 13 440 17 811 32.52 19 356 20 483
Goods and services 6 276 8 642 10 257 11 960 14 769 12 761 11 975 ( 6.16 ) 11 316 11 825
94 173 1 004 ( 100.00 )
176 185 191 112 233 233 ( 100.00 ) 28 28 80 22 8 8 ( 100.00 )
27 37 37 37 ( 100.00 )
50 53 53 53 ( 100.00 )
Households 148 80 111 135 135 ( 100.00 )
2 397 1 000 488 701 566 1 067 542 ( 49.20 ) 657 686 Machinery and equipment 2 397 995 475 701 566 1 067 542 ( 49.20 ) 657 686
5 13
20 187 21 318 23 220 27 605 29 337 28 505 30 328 6.40 31 329 32 994
Software and other intangible assets
Total economic classification
Foreign governments and international organisations
Payments for capital assets
Transfers and subsidies toProvinces and municipalities
Departmental agenciesand accounts
Revised estimate
Medium-term estimate
Compensation ofemployees
Financial transactions inassets and liabilities
Economic classificationR'000
Outcome
Main appro-priation
Adjusted appro-priation
Details of transfers and subsidies:
Audited Audited Audited
% Change from
Revised estimate
2003/04 2004/05 2005/06 2006/07 2006/07 2006/07 2007/08 2006/07 2008/09 2009/10
176 185 191 112 233 233 (100.00)
Provinces and municipalities 28 28 80 22 8 8 (100.00) Provinces 50
Provincial agencies and funds 50 Municipalities 28 28 30 22 8 8 (100.00)
Municipalities 28 28 30 22 8 8 (100.00) 28 28 30 22 8 8
Departmental agencies and accounts 27 37 37 37 (100.00) 27 37 37 37 (100.00) 27 37 37 37 (100.00) 50 53 53 53 (100.00)
Households 148 80 111 135 135 (100.00) Other transfers to households 148 80 111 135 135 (100.00)
Transfers and subsidies to (Current)
of whichRegional services council levies
Entities receiving transfers
Revised estimate
Medium-term estimate
Economic classificationR'000
Outcome
Main appro-priation
Adjusted appro-priation
SETA
Foreign governments and international organisations

Estimates of Provincial Expenditure 2007 Vote 3: Provincial Treasury
74
Programme 2: Sustainable Resource Management
Purpose: To provide professional advice and support on Provincial and Local Government economic analysis, fiscal policy, public finance development and management of the annual Provincial budget process and assist and monitor Local Government budgets.
Analysis per sub-programme: Sub-programme 2.1: Programme support: Resource management
to render an administrative support service to the sub-programmes: Economic analysis and Fiscal policy (Provincial and Local Government)
Sub-programme 2.2: Economic analysis to provide for provincial and local government economic analysis and advice that informs fiscal policy development, and the annual budget process, thereby contributing to the achievement of iKapa Elihlumayo
Sub-programme 2.3: Fiscal policy: Provincial government to enable the provincial government to finance its service delivery obligations, determine the overall financing
envelope for the Medium Term Expenditure Framework (MTEF), including administering the medium term revenue planning process, assessing and optimising national revenue, ensure effective and efficient development of provincial revenue and the assessment of revenue trends and the compilation and submission of revenue reports
to advise the responsible minister on gambling and racing related matters and provide and administer the required financial support functions, inclusive of management of transfer payments to the Western Cape Gambling and Racing Board
Sub-programme 2.4: Fiscal policy: Local government assess the overall financing envelope for the Medium Term Income and Expenditure Framework (MTIEF), and provide support with the medium term revenue planning process, and efficient development of municipal revenue, including the assessment of revenue trends and the compilation and submission of revenue reports, and to assess the viability of municipal revenue budgets
Sub-programme 2.5: Budget management to manage the annual fiscal policy process, i.e. consolidate, prepare and compile the annual Western Cape Medium-term Budget Policy Statement (WC-MTBPS) and drive the MTEF and annual budget process
to provide analysis and support to municipalities in the drafting of their budgets in order to improve quality and assure alignment between municipal and provincial budgets
Sub-programme 2.6: Programme support: Public finance
to render an administrative support service to the sub-programmes: Provincial government finance and Local government finance
Sub-programme 2.7: Provincial government finance to technically prepare the annual budget for tabling, inclusive of database, formats, programme structures, consolidation and publication
to ensure budget implementation, inclusive of monitoring, trend analysis, interpretation, reporting, intervention, exercising fiscal discipline as well as promoting and enforcing effective management of expenditure
to manage the adjustments budget, inclusive of process, database, formats, programme structures, allocations, consolidation and publication
to promote improved service delivery and customer care
to provide policy advice
Sub-programme 2.8: Local government finance to monitor the municipal adjustment budget preparation processes
to assist, assess and advise on the municipal expenditure budgets, including entities (technical)
to monitor and report on the outcome of the municipal expenditure budgets (IYM) and to assist municipalities in resolving financial problems through intervention mechanisms
to advise municipalities on the establishment of municipal entities and municipal police services
to facilitate the implementation of the Local Government: Municipal Finance Management Act, 2003 (Act 56 of 2003)

Estimates of Provincial Expenditure 2007 Vote 3: Provincial Treasury
75
to promote improved service delivery and intergovernmental relations
to provide policy advice, inclusive of technical assistance and financial training
Policy developments: Policy developments that will receive attention are:
Better assessment of provincial departments and municipalities’ measurable information to improve alignment of their stated objectives towards the desired provincial socio-economic outcomes in moving towards a long term outcomes based budget management process.
In a similar vein, the design of analytical instruments to assess the qualitative impact of service delivery on provincial socio-economic variables have remained in the doldrums and needs to be picked up on in 2007/08.
The new financial year accords the opportunity for a revision to the provincial equitable share formula, in addition to further research and development of additional sources of provincial own revenue options.
Changes: policy, structure, service establishment, etc. Geographic distribution of services: With respect to this programme the final phase of the Provincial Treasury’s structural transformation design is due be completed during the 2007/08 financial year.
Expenditure trends analysis: Since 2004/05 no transfers have been made to the Western Cape Gambling and Racing Board although this might change in years to come. However, no funds will be transferred during the 2007/08 MTEF period. Over the period of 2003/04 to 2006/07 the programme increased from a base of R14,437 million to R21,675 million in 2006/07 (revised estimate) indicating an average nominal growth of 16,7 per cent per annum for the stated years. From 2006/07 and over the new MTEF period the allocations will increase from a base of R21,675 million in 2006/07 (revised estimate) to R32,407 million in 2009/10 with an average annual nominal growth of 14,4 per cent. The higher level of funding for this programme from 2006/07 onwards is meant to ensure a greater focus on resource acquisition and disbursement of provincial funds in the interests of promoting better service delivery across the provincial and local government spheres.
Service delivery measures:
Programme 2: Sustainable resource management
Sub-programme Measurable objective Performance measure Output Target (2007/08)
2.2 Economic analysis Describe the provincial economy.
Timely published Provincial Economic Review and Outlook (PER&O).
Publication of PER&O. PER&O published timeously.
2.3 Fiscal policy: Provincial government
Participate in various Intergovernmental Forums to discuss and agree on Provincial Equitable Share and Conditional Grant Allocations to the Western Cape.
Position papers, policy briefs, reports and memos compiled.
Optimised transfers from National government.
Inform debate on the use of data and other related issues.
Optimised transfers from National government.
Analytical position paper Analytical PES and CG transfers.
Timeous submission of informative and accurate Reports to HoPT and MEC.
Quarterly reports.
Memos.
MTBPS and Main Budget.
Adequate policy frameworks in place to govern revenue raising processes and powers.
Timeous submission of informative and accurate reports.
Quarterly reports.
Memos.
Quarterly reports.

Estimates of Provincial Expenditure 2007 Vote 3: Provincial Treasury
76
Sub-programme Measurable objective Performance measure Output Target (2007/08)
2.4 Fiscal policy: Local government
Assess viability of municipal revenue budgets to ensure sustainability.
Position papers, policy briefs, reports and memos compiled.
Optimised transfers from Provincial and National government.
Optimised Provincial and National government transfers to municipalities.
Contribute to improving system of local government finance to enhance revenue adequacy and service delivery.
Position papers, policy briefs, reports and memos compiled.
Optimised own revenue. Monthly
Improve capacity of municipalities through technical assistance and policy advice.
Policy advice and training. Policy advice and training. Ongoing.
Executive approval and tabling of MTBPS.
Executive approval of preliminary and final allocations for Main Budget.
MTBPS 2008-2011. MTBPS tabled (Nov 07). 2.5 Budget management
Tabling of Annual Budget. Annual Budget 2008/09. Annual Budget (Feb 08).
To manage the annual fiscal policy process, i.e. consolidate, prepare and compile the annual Western Cape Medium-term Budget Policy Statement (WC-MTBPS) and drive the MTEF and annual budget process.
Regular analysis of and submission to NT of provincial departments’ quarterly performance reports.
Assessment of non-financial quarterly IYM reports.
Impact assessments and policy analysis of departmental programmes.
Submission of non-financial quarterly IYM reports to NT on deadline.
To support municipalities in improving quality and ensuring alignment between municipal and provincial budgets.
to provide analysis and support to municipalities in the drafting of their budgets.
Consultation increased between provincial treasury, provincial departments and municipalities via MTEC engagements, municipal visits and other initiatives.
Increased alignment between municipal budgets and provincial priorities.
Reviews conducted of draft budget of each municipality against completed budget evaluation checklist and comments provided to municipalities.
2.7 Provincial government finance
Improved departmental spending performance through the enhancement of budget credibility, implementation of least cost alternatives and enforcement of budgetary and legislative limits.
Technically sound MTEF budget supported by proper database.
National Treasury deems Budget 2008 credible.
Credible Main Budget. End August 2007 (1st draft of Budget 2008 assessed).
1st week December 2007 (2nd draft assessed).
January 2008 (Provincial benchmark exercise).
February 2008 (final assessment).
Adjustments budget documentation in line with prescribed formats and timelines.
Credible Adjustments Budget.
Adjustments Budget and Bill tabled November 2007.
Lower levels of underspending, spending in line with budget and projected cashflow.
Provincial budget spending performance between 99% and 100%.
No overspending and underspending limited to 1% overall.
Compliance with PFMA and NTR’s.
Ameliorated March Spike. IYM reports monthly by 22nd and quarterly.
Quarterly trend analysis reports.

Estimates of Provincial Expenditure 2007 Vote 3: Provincial Treasury
77
Sub-programme Measurable objective Performance measure Output Target (2007/08)
Quarterly reports to Cabinet and Budget Committee.
Improved efficiency. Efficiency initiatives implemented on major spending items.
Goods and Services 30 June 2007.
Transfers payments 30 November 2007.
Nominal and substantive compliance as well as the execution of MFMA responsibilities.
MFMA compliance assessments.
Executed roles and responsibilities.
30 compliance assessment reports.
Co-ordination of MFMA matters.
Effective functional co-ordinating structures.
Monthly: sub-committee meetings.
Quarterly: MFMA CFO Forum.
2.8 Local government finance
Implementation of the Local government: Municipal Finance Management Act, 2003 (Act No. 56 of 2003).
30 IYM assessment reports and consolidated reports.
Monthly by 22nd.
Effective monitoring of outcome of municipal budgets (In-year-monitoring).
4 Consolidated reports to the Provincial Legislature.
Quarterly.
4 Consolidated Publications.
Quarterly.
Table 6.2 Summary of payments and estimates – Programme 2: Sustainable resource management
Audited Audited Audited
% Change from
Revised estimate
2003/04 2004/05 2005/06 2006/07 2006/07 2006/07 2007/08 2006/07 2008/09 2009/10
Programme support: Resource management
841 830 690 687 728 5.97 786 832
Economic analysis 1 755 1 127 2 437 3 598 3 550 3 260 3 625 11.20 3 788 3 996 Fiscal policy: Provincial government
6 942 2 701 2 337 2 592 2 542 2 683 3 039 13.27 3 367 3 556
Fiscal policy: Local government
193 2 342 1 796 1 641 3 460 110.85 3 880 4 099
Budget management 1 725 2 177 6 151 7 559 6 797 6 754 8 542 26.47 9 283 9 783 Programme support: Public finance
301 1 080 1 003 1 034 865 (16.34) 944 999
Provincial government finance 4 015 3 072 2 487 2 963 2 918 2 749 3 255 18.41 3 456 3 650 Local government finance 1 990 1 766 3 166 3 121 2 867 4 719 64.60 5 191 5 492
14 437 11 067 16 513 24 130 22 417 21 675 28 233 30.26 30 695 32 407 Total payments and estimates
Outcome
5. 6.
2. 3.
1.
4.
Revised estimate
Medium-term estimate
Main appro-priation
Adjusted appro-priation
7. 8.
Sub-programmeR'000

Estimates of Provincial Expenditure 2007 Vote 3: Provincial Treasury
78
Table 6.2.1 Summary of provincial payments and estimates by economic classification – Programme 2: Sustainable resource management
Audited Audited Audited
% Change from
Revised estimate
2003/04 2004/05 2005/06 2006/07 2006/07 2006/07 2007/08 2006/07 2008/09 2009/10
Current payments 9 725 10 565 16 100 24 033 22 306 21 520 28 208 31.08 30 680 32 392
4 852 7 351 9 332 17 508 16 077 15 615 22 942 46.92 25 239 26 706
Goods and services 4 873 3 214 6 768 6 525 6 229 5 905 5 266 ( 10.82) 5 441 5 686
4 712 502 22 31 8 8 ( 100.00) 12 17 22 31 8 8 ( 100.00)
4 700
Households 485
391 66 103 147 25 ( 82.99) 15 15 Machinery and equipment 391 50 66 110 25 ( 77.27) 15 15
16 37 37 ( 100.00)
14 437 11 067 16 513 24 130 22 417 21 675 28 233 30.26 30 695 32 407
Revised estimate
Medium-term estimate
Compensation ofemployees
Economic classificationR'000
Outcome
Main appro-priation
Adjusted appro-
priation
Transfers and subsidies toProvinces and municipalities
Departmental agenciesand accounts
Software and other intangible assets
Total economic classification
Payments for capital assets
Details of transfers and subsidies:
Audited Audited Audited
% Change from
Revised estimate
2003/04 2004/05 2005/06 2006/07 2006/07 2006/07 2007/08 2006/07 2008/09 2009/10
4 712 502 22 31 8 8 (100.00) Provinces and municipalities 12 17 22 31 8 8 (100.00)
Municipalities 12 17 22 31 8 8 (100.00) Municipalities 12 17 22 31 8 8 (100.00)
12 17 22 31 8 8
Departmental agencies and accounts 4 700 4 700 4 700
Households 485 Other transfers to households 485
Revised estimate
Medium-term estimate
Economic classificationR'000
Outcome
Main appro-priation
Adjusted appro-priation
Transfers and subsidies to (Current)
of whichRegional services council levies
Entities receiving transfersWestern Cape Gambling and Racing Board
Estimates of Provincial Expenditure 2007 Vote 3: Provincial Treasury
79
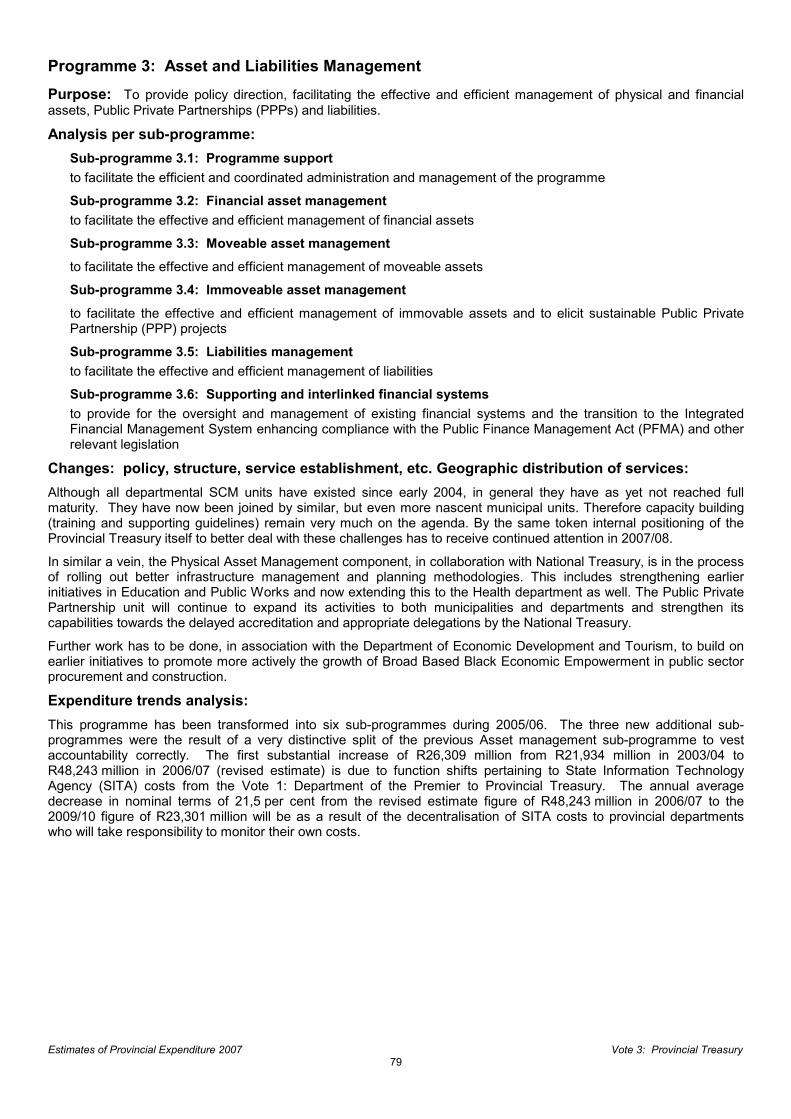
Programme 3: Asset and Liabilities Management
Purpose: To provide policy direction, facilitating the effective and efficient management of physical and financial assets, Public Private Partnerships (PPPs) and liabilities.
Analysis per sub-programme: Sub-programme 3.1: Programme support to facilitate the efficient and coordinated administration and management of the programme
Sub-programme 3.2: Financial asset management to facilitate the effective and efficient management of financial assets
Sub-programme 3.3: Moveable asset management
to facilitate the effective and efficient management of moveable assets
Sub-programme 3.4: Immoveable asset management
to facilitate the effective and efficient management of immovable assets and to elicit sustainable Public Private Partnership (PPP) projects
Sub-programme 3.5: Liabilities management to facilitate the effective and efficient management of liabilities
Sub-programme 3.6: Supporting and interlinked financial systems to provide for the oversight and management of existing financial systems and the transition to the Integrated
Financial Management System enhancing compliance with the Public Finance Management Act (PFMA) and other relevant legislation
Changes: policy, structure, service establishment, etc. Geographic distribution of services: Although all departmental SCM units have existed since early 2004, in general they have as yet not reached full maturity. They have now been joined by similar, but even more nascent municipal units. Therefore capacity building (training and supporting guidelines) remain very much on the agenda. By the same token internal positioning of the Provincial Treasury itself to better deal with these challenges has to receive continued attention in 2007/08.
In similar a vein, the Physical Asset Management component, in collaboration with National Treasury, is in the process of rolling out better infrastructure management and planning methodologies. This includes strengthening earlier initiatives in Education and Public Works and now extending this to the Health department as well. The Public Private Partnership unit will continue to expand its activities to both municipalities and departments and strengthen its capabilities towards the delayed accreditation and appropriate delegations by the National Treasury.
Further work has to be done, in association with the Department of Economic Development and Tourism, to build on earlier initiatives to promote more actively the growth of Broad Based Black Economic Empowerment in public sector procurement and construction.
Expenditure trends analysis: This programme has been transformed into six sub-programmes during 2005/06. The three new additional sub-programmes were the result of a very distinctive split of the previous Asset management sub-programme to vest accountability correctly. The first substantial increase of R26,309 million from R21,934 million in 2003/04 to R48,243 million in 2006/07 (revised estimate) is due to function shifts pertaining to State Information Technology Agency (SITA) costs from the Vote 1: Department of the Premier to Provincial Treasury. The annual average decrease in nominal terms of 21,5 per cent from the revised estimate figure of R48,243 million in 2006/07 to the 2009/10 figure of R23,301 million will be as a result of the decentralisation of SITA costs to provincial departments who will take responsibility to monitor their own costs.

Estimates of Provincial Expenditure 2007 Vote 3: Provincial Treasury
80
Service delivery measures: Programme 3: Asset and liabilities management
Sub-programme Measurable objective Performance measure Output Target (2007/08)
3.2 Financial asset management
To facilitate the effective management of both the Provincial Revenue Fund and the Asset Financing Reserve.
The daily monitoring and funding of all banking accounts to ensure an acceptable deviation between transfers and actual expenditure with investment of surplus funds at reputable. financial institutions.
Effective cash flow management of all departmental bank accounts.
100% achieved.
3.3 Moveable asset management
Number of transversal contracts arranged.
Facilitation and management of transversal contracts.
Facilitation and manage-ment of 2 transversal contracts.
To facilitate the effective and efficient management of moveable assets.
Number of departments/ municipalities assessed.
Value for Money analysis undertaken within departments.
Value for Money analysis:
- 6 departments.
Supply Chain Management (SCM) compliance checks within municipalities.
SCM compliance checks:
- 10 municipalities.
Introduction of strategic sourcing principals to enhance value for money.
Training manuals and workshops for Provincial Departments.
5 workshops to be held.
Assessment report on renewal of Electronic Purchasing System (EPS) and Western Cape Supplier Database (WCSD).
Assessment report benchmarking existing systems and other new systems/options.
Extended or Renewed contract by May 2006.
3.4 Immovable asset management
Number of departments participating in the Infrastructure Delivery Improvement Programme (IDIP).
3 departments. Facilitate and monitor the implementation of the approved business case in Education and Transport and Public Works.
Facilitate and monitor the assessment and design phase in Health.
To provide policy direction, facilitate effective and efficient management of the built environment and physical assets, and promotion of an enabling environment for Public Private Partnerships (PPPs).
Number of closed deals monitored and the number of departments and municipalities targeted for promotion.
The effective monitoring of closed deals.
Successful promotion of PPPs.
2 deals.
3 departments.
2 municipalities.
3.5 Liabilities management
Effective managed Provincial Revenue Fund (loan book).
Percentage achieved. Provide for necessary funds to service loan agreements and/or guarantees.
Not applicable.
Percentage achieved. Meeting of all due dates for repayment of loans and/or guarantees.
Not applicable.
Percentage achieved. Refine cash flow to include such loan and/or guarantee repayments.
Not applicable.
3.6 Supporting and interlinked financial systems
To provide for the effectively, efficiently and economically implemented and managed financial systems with appropriately skilled and capacitated system users.
The daily monitoring of existing systems to ensure proper interface between sub-systems and BAS.
Well-managed financial systems and implementation of financial systems to ensure sound financial management with skilled and capacitated financial system users.
100% compliance.

Estimates of Provincial Expenditure 2007 Vote 3: Provincial Treasury
81
Table 6.3 Summary of payments and estimates – Programme 3: Asset and liabilities management
Audited Audited Audited
% Change from
Revised estimate
2003/04 2004/05 2005/06 2006/07 2006/07 2006/07 2007/08 2006/07 2008/09 2009/10
Programme support 699 1 131 889 882 858 (2.72) 923 975 Financial asset management 973 1 071 920 1 284 1 128 1 121 1 613 43.89 1 736 1 834 Moveable asset management 4 422 4 071 4 458 4 676 4 922 4 738 5 246 10.72 5 563 5 867 Immovable asset management 204 285 1 626 2 733 2 605 2 631 2 854 8.48 3 036 3 209 Liabilities management 1 1 1 1 1 1 Supporting and interlinked financial systems
16 335 37 681 38 996 39 852 39 146 38 870 10 166 (73.85) 10 829 11 415
21 934 43 108 46 699 49 677 48 691 48 243 20 738 (57.01) 22 088 23 301
Revised estimate
Medium-term estimate
Main appro-priation
Adjusted appro-priation
1.
4.
Sub-programmeR'000
Outcome
2. 3.
5. 6.
Total payments and estimates
Table 6.3.1 Summary of provincial payments and estimates by economic classification – Programme 3: Asset and liabilities management
Audited Audited Audited
% Change from
Revised estimate
2003/04 2004/05 2005/06 2006/07 2006/07 2006/07 2007/08 2006/07 2008/09 2009/10
Current payments 14 167 42 691 46 631 49 454 48 257 47 775 20 716 ( 56.64) 22 064 23 276
8 940 8 498 11 725 14 351 13 257 13 192 16 031 21.52 17 145 18 136
Goods and services 5 227 34 193 34 906 35 103 35 000 34 583 4 685 ( 86.45) 4 919 5 140
21 21 29 22 233 234 ( 100.00) 21 21 29 22 6 6 ( 100.00)
1 ( 100.00)
Households 227 227 ( 100.00)
7 746 396 39 201 201 234 22 ( 90.60) 24 25 Machinery and equipment 7 746 396 39 201 201 234 22 ( 90.60) 24 25
21 934 43 108 46 699 49 677 48 691 48 243 20 738 ( 57.01) 22 088 23 301
Total economic classification
Foreign governments and international organisations
Payments for capital assets
Transfers and subsidies toProvinces and municipalities
Revised estimate
Medium-term estimate
Compensation ofemployees
Economic classificationR'000
Outcome
Main appro-priation
Adjusted appro-
priation

Estimates of Provincial Expenditure 2007 Vote 3: Provincial Treasury
82
Details of transfers and subsidies:
Audited Audited Audited
% Change from
Revised estimate
2003/04 2004/05 2005/06 2006/07 2006/07 2006/07 2007/08 2006/07 2008/09 2009/10
21 21 29 22 233 234 (100.00) Provinces and municipalities 21 21 29 22 6 6 (100.00)
Municipalities 21 21 29 22 6 6 (100.00) Municipalities 21 21 29 22 6 6 (100.00)
21 21 29 22 6 6 1 (100.00)
Households 227 227 (100.00) Other transfers to households 227 227 (100.00)
Transfers and subsidies to (Current)
of whichRegional services council levies
Revised estimate
Medium-term estimate
Economic classificationR'000
Outcome
Main appro-priation
Adjusted appro-priation
Foreign governments and international organisations
Programme 4: Financial Governance Purpose: To promote accountability through substantive reflection of financial activities of the Province as well as compliance with financial norms and standards. Analysis per sub-programme:
Sub-programme 4.1: Programme support facilitate the efficient and coordinated administration and management of the programme
Sub-programme 4.2: Accounting services accounting practices that will promote the accurate reporting of revenue, expenditure, assets and liabilities
Sub-programme 4.3: Norms and standards develop, implement and monitor compliance with financial norms and standards
Sub-programme 4.4: Risk management
establishment of risk management capacity and financial governance systems in the Provincial Government
Sub-programme 4.5: Provincial internal audit Internal Audit work performed to evaluate the effectiveness of risk management, control and governance processes
Policy developments: The development of assessment parameters and supporting measures that would take the Province to a level four (financial capability model of the Auditor-General) auditable organisation and municipalities to a level three by the end of the respective 2007/08 financial years has to be given undivided attention.
Changes: policy, structure, service establishment, etc. Geographic distribution of services: Major changes are planned to lessen the Province’s over-dependence on the current co-sourced internal audit private service provider that has been in place as a stop-gap and emergency measure since the 2005/06 financial year. In 2007/08 a five-step programme is to be rolled out that would move the current 7 year-old internal audit structural model to one that could meet to much greater extent in the internal audit needs of the Province and also allow for support to municipalities. This process would at the same time allow for selected decentralisation to provincial departments and review of the remaining shared services model over the next four years.

Estimates of Provincial Expenditure 2007 Vote 3: Provincial Treasury
83
Expenditure trends analysis: The substantial increase of R25,216 million from R8,863 million in 2003/04 to R34,079 million in 2006/07 (revised estimate figure) is due to the build-up of the internal audit function. This is the result of an increase in expenditure under consulting and specialised services (accounting and auditors) and the appointment of staff to focus on municipalities. This trend is sustained over the MTEF with an nominal average annual increase of 13,5 per cent from the revised estimate figure of R34,079 million in 2006/07 to the 2009/10 MTEF figure of R49,874 million. Included in the 2007/08 – 2009/10 MTEF figure is the Earmarked allocation of R4,600 million in 2007/08, R5,260 million in 2008/09, and R5,400 million in 2009/10 for the upgrade of the Internal Audit capacity as referred to in the previous paragraph.
Service delivery measures:
Programme 4: Financial governance
Sub-programme Measurable objective Performance measure Output Target (2007/08)
4.2 Accounting services All recorded transactions are fairly presented in the financial statements in terms of prescripts and guidelines to reflect the true financial position of the Province.
Departments checked for compliance with prescripts and guidelines.
Unqualified AG report relating to accounting issues.
31 October 2007.
24 out of 26 Departments/Entities unqualified AG report relating to accounting issues.
4.3 Norms and standards
Monitor compliance of financial management norms and standards implemented.
Number of departments and entities checked for compliance of financial prescripts by the end of the financial year.
Compliance with financial prescripts by departments and entities.
12 Departments
14 Entities
Number of departments and entities checked for compliance with annual report guidelines.
Compliance with annual report guidelines by departments and entities.
12 Departments
14 Entities
4.4 Risk management Number of practice notes issued to departments for implementation.
Practice notes on elements of risks management issued to CRO in departments.
5 Practice notes issued.
Risk management methodologies implemented to enhance internal control and risk management culture in the PGWC. Number of forums held. Chief Risk Officer forums
held.
Risk Management software and level 1 data made available to risk management practitioners.
10 forums held.
Number of trainings responding to the needs identified.
Training provided to Chief Risk Officers on risk management.
All 12 departments CRO training needs met.
4.5 Provincial internal audit
Number of internal audit plans executed by the end of the financial year.
Audit work performed as approved by the audit committee.
12 departments and Provincial Parliament.
Risk-based internal audit work performed in provincial departments and Provincial Parliament to improve the effectiveness of risk management, control and governance processes.
Number of prior year audit findings followed up in subsequent audit cycle.
Follow Up audit reports. All critical and significant audit findings of prior year audits followed up in the subsequent audit cycle.

Estimates of Provincial Expenditure 2007 Vote 3: Provincial Treasury
84
Table 6.4 Summary of payments and estimates – Programme 4: Financial governance
Audited Audited Audited
% Change from
Revised estimate
2003/04 2004/05 2005/06 2006/07 2006/07 2006/07 2007/08 2006/07 2008/09 2009/10
Programme support 1 039 1 280 1 201 1 193 1 333 11.74 1 431 1 513 Accounting services 1 815 2 005 2 721 3 979 3 866 3 794 4 200 10.70 4 413 4 660 Norms and standards 1 183 5 717 2 375 3 783 3 439 3 226 3 893 20.68 4 220 4 459 Risk management 1 704 2 779 2 630 3 484 2 750 (21.07) 2 890 3 045 Provincial internal audit 5 865 19 118 20 004 21 013 22 665 22 382 27 526 22.98 28 987 36 197
8 863 26 840 27 843 32 834 33 801 34 079 39 702 16.50 41 941 49 874
Revised estimate
Medium-term estimate
Main appro-priation
Adjusted appro-priation
1.
4.
Sub-programmeR'000
Outcome
2.
3.
5.
Total payments and estimates
Earmarked allocations: Included in sub-programme 4.5: Provincial internal audit is an earmarked allocation amounting to R4 600 000 (2007/08), R5 260 000 (2008/09) and R5 400 000 (2009/10) for the purpose of Internal Audit capacity.
Table 6.4.1 Summary of provincial payments and estimates by economic classification – Programme 4: Financial governance
Audited Audited Audited
% Change from
Revised estimate
2003/04 2004/05 2005/06 2006/07 2006/07 2006/07 2007/08 2006/07 2008/09 2009/10
Current payments 8 848 26 225 27 223 32 785 33 638 33 577 39 182 16.69 41 415 49 442
4 844 6 344 8 773 14 123 12 744 12 306 19 766 60.62 24 107 34 430
Goods and services 4 004 19 881 18 450 18 662 20 894 21 271 19 416 ( 8.72) 17 308 15 012
6 15 106 19 7 7 ( 100.00) 6 15 21 19 7 7 ( 100.00)
Households 85
9 600 514 30 156 495 520 5.05 526 432 Machinery and equipment 9 124 30 53 392 400 2.04 400 300
600 390 103 103 120 16.50 126 132
8 863 26 840 27 843 32 834 33 801 34 079 39 702 16.50 41 941 49 874
Revised estimate
Medium-term estimate
Compensation ofemployees
Economic classificationR'000
Outcome
Main appro-priation
Adjusted appro-
priation
Transfers and subsidies toProvinces and municipalities
Software and other intangible t
Total economic classification
Payments for capital assets

Estimates of Provincial Expenditure 2007 Vote 3: Provincial Treasury
85
Details of transfers and subsidies:
Audited Audited Audited
% Change from
Revised estimate
2003/04 2004/05 2005/06 2006/07 2006/07 2006/07 2007/08 2006/07 2008/09 2009/10
6 15 106 19 7 7 (100.00) Provinces and municipalities 6 15 21 19 7 7 (100.00)
Municipalities 6 15 21 19 7 7 (100.00) Municipalities 6 15 21 19 7 7 (100.00)
6 15 21 19 7 7
Households 85 Other transfers to households 85
Transfers and subsidies to (Current)
of whichRegional services council levies
Revised estimate
Medium-term estimate
Economic classificationR'000
Outcome
Main appro-priation
Adjusted appro-priation
7. Other programme information
Personnel numbers and costs
Table 7.1 Personnel numbers and costs
As at 31 March
2004
As at31 March
2005
As at31 March
2006
As at31 March
2007
As at31 March
2008
As at31 March
2009
As at31 March
2010
Administration 67 58 61 73 81 81 81 Sustainable resource management 24 33 45 75 89 89 89 Asset and liabilities management 55 49 50 65 67 67 67 Financial governance 25 34 54 60 95 121 138
Total personnel numbers 171 174 210 273 332 358 375 Total personnel cost (R'000) 29 974 33 590 41 941 54 553 76 550 85 847 99 754 Unit cost (R'000) 175 193 200 200 231 240 266
4.
1. 2.
ProgrammeR'000
3.

Estimates of Provincial Expenditure 2007 Vote 3: Provincial Treasury
86
Table 7.2 Departmental personnel number and cost
Audited Audited Audited
% Change from
Revised estimate
2003/04 2004/05 2005/06 2006/07 2006/07 2006/07 2007/08 2006/07 2008/09 2009/10Total for department
171 174 210 278 285 273 332 21.61 358 375
29 974 33 590 41 941 60 814 55 847 54 554 76 550 40.32 85 847 99 754
21 26 28 27 26 24 29 20.83 29 29
2 840 3 343 3 980 4 632 4 432 4 275 4 997 16.89 5 432 5 752 12.28 14.94 13.33 9.71 9.12 8.79 8.73 8.10 7.73
9.47 9.95 9.49 7.62 7.94 7.84 6.53 6.33 5.77
32 28 36 37 40 38 40 5.26 40 40
4 321 4 115 4 359 5 448 5 068 4 987 6 376 27.85 6 915 7 305 18.71 16.09 17.14 13.31 14.04 13.92 12.05 11.17 10.67
14.42 12.25 10.39 8.96 9.07 9.14 8.33 8.06 7.32
141 159 221 272 279 267 326 22.10 352 369
25 795 31 149 42 816 58 758 54 452 53 159 74 391 39.94 83 558 97 328 82.46 91.38 105.24 97.84 97.89 97.80 98.19 98.32 98.40
86.06 92.73 102.09 96.62 97.50 97.44 97.18 97.33 97.57
30 21 18 6 6 6 6 6 6
3 537 2 441 2 537 2 056 1 395 1 395 2 159 54.77 2 289 2 426 17.54 12.07 8.57 2.16 2.11 2.20 1.81 1.68 1.60
11.80 7.27 6.05 3.38 2.50 2.56 2.82 2.67 2.43
Revised estimate
Medium-term estimate
Description
Outcome
Main appro-priation
Adjusted appro-
priation
Personnel numbers(head count)Personnel cost (R'000)
Personnel cost (R'000)
Part-time workers
Personnel numbers(head count)Personnel cost (R'000)
Head count as % of totalfor departmentPersonnel cost as % oftotal for department
Personnel cost as % oftotal for department
Human resourcescomponentPersonnel numbers(head count)Personnel cost (R'000)
Full time workers
Personnel cost as % oftotal for department
Finance component
Personnel numbers(head count)Personnel cost (R'000)
Head count as % of totalfor department
of which
Head count as % of totalfor departmentPersonnel cost as % oftotal for department
Head count as % of totalfor departmentPersonnel cost as % oftotal for department
Contract workers
Personnel numbers(head count)
Personnel numbers(head count)Personnel cost (R'000)
Head count as % of totalfor department

Estimates of Provincial Expenditure 2007 Vote 3: Provincial Treasury
87
Training Table 7.3 Payments on training
Audited Audited Audited
% Change from
Revised estimate
2003/04 2004/05 2005/06 2006/07 2006/07 2006/07 2007/08 2006/07 2008/09 2009/10Administration 571 296 333 573 1 309 998 700 (29.86) 735 768
of which Payments on tuition 571 296 333 573 1 309 998 700 (29.86) 735 768
Sustainable resource management
186 198
of which Payments on tuition 186 198
Asset and liabilities management
17 163
of which Payments on tuition 17 163
Financial governance 92 150 of which
Payments on tuition 92 150 571 296 628 1 084 1 309 998 700 (29.86) 735 768
Revised estimate
Medium-term estimate
1.
ProgrammeR'000
Outcome
Main appro-priation
Adjusted appro-priation
2.
3.
4.
Total payments on training
Note: Human resource development was centralised under programme 1 from 2006/07. The amounts under programme 1 for 2004/05 and beyond include bursaries.
Table 7.4 Information on training
% Change from
Revised estimate
2003/04 2004/05 2005/06 2006/07 2006/07 2006/07 2007/08 2006/07 2008/09 2009/10
171 174 210 278 284 273 332 21.61 358 375
141 165 205 237 237 237 237 237 237
78 86 106 124 124 124 124 124 124
63 79 99 113 113 113 113 113 113
104 115 144 166 166 166 166 166 166
46 50 62 85 85 85 95 11.76 95 95
18 21 45 29 29 29 20 (31.03) 20 20
15 20 22 27 27 27 26 (3.70) 26 26
25 24 15 25 25 25 25 25 25
54 70 91 121 121 121 105 (13.22) 105 105
6 6 6 6 6 12 21 75.00 21 21
22 10 10 10 10 10 10
431 412 550 620 620 620 680 9.68 680 680
Number of staff
Revised estimate
Medium-term estimate
Description
Outcome
Main appro-priation
Adjusted appro-
priation
Number of personnel trained
of which
Male
Female
Number of training opportunities
of which
Tertiary
Workshops
Number of learnerships appointed
Number of days spent on training
Seminars
Other
Number of bursaries offered
Number of interns appointed
Reconciliation of structural changes
Table 7.5 Reconciliation of structural changes - None
Estimates of Provincial Expenditure 2007 Vote 3: Provincial Treasury
88
Annexure B to Vote 3
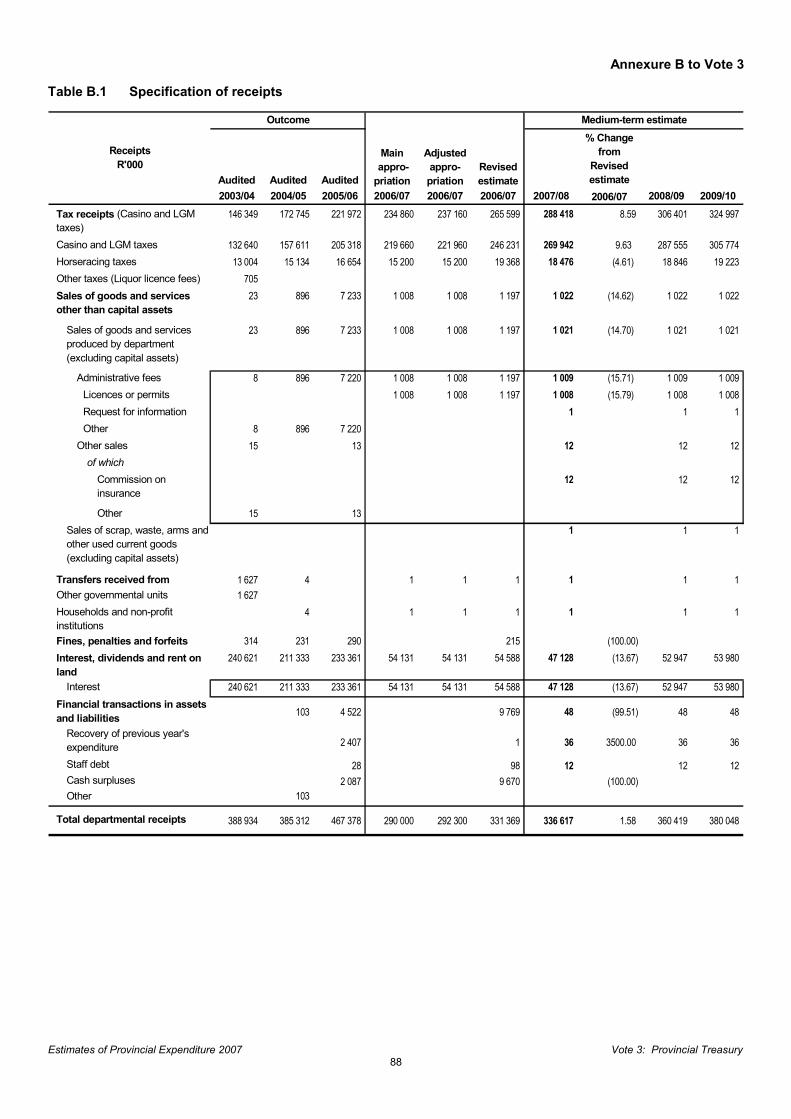
Table B.1 Specification of receipts
Audited Audited Audited
% Change from
Revised estimate
2003/04 2004/05 2005/06 2006/07 2006/07 2006/07 2007/08 2006/07 2008/09 2009/10 146 349 172 745 221 972 234 860 237 160 265 599 288 418 8.59 306 401 324 997
Casino and LGM taxes 132 640 157 611 205 318 219 660 221 960 246 231 269 942 9.63 287 555 305 774 Horseracing taxes 13 004 15 134 16 654 15 200 15 200 19 368 18 476 (4.61) 18 846 19 223 Other taxes (Liquor licence fees) 705
23 896 7 233 1 008 1 008 1 197 1 022 (14.62) 1 022 1 022
23 896 7 233 1 008 1 008 1 197 1 021 (14.70) 1 021 1 021
8 896 7 220 1 008 1 008 1 197 1 009 (15.71) 1 009 1 009 Licences or permits 1 008 1 008 1 197 1 008 (15.79) 1 008 1 008 Request for information 1 1 1 Other 8 896 7 220
15 13 12 12 12 12 12 12
15 13 1 1 1
Transfers received from 1 627 4 1 1 1 1 1 1 Other governmental units 1 627
4 1 1 1 1 1 1
Fines, penalties and forfeits 314 231 290 215 (100.00) 240 621 211 333 233 361 54 131 54 131 54 588 47 128 (13.67) 52 947 53 980
Interest 240 621 211 333 233 361 54 131 54 131 54 588 47 128 (13.67) 52 947 53 980
103 4 522 9 769 48 (99.51) 48 48
2 407 1 36 3500.00 36 36
Staff debt 28 98 12 12 12 2 087 9 670 (100.00)
Other 103
388 934 385 312 467 378 290 000 292 300 331 369 336 617 1.58 360 419 380 048
Other
of whichCommission on insurance
Administrative fees
Revised estimate
Medium-term estimate
Sales of goods and services other than capital assets
Sales of goods and services produced by department (excluding capital assets)
ReceiptsR'000
Outcome
Main appro-priation
Adjusted appro-priation
Tax receipts (Casino and LGM taxes)
Other sales
Financial transactions in assets and liabilities
Total departmental receipts
Sales of scrap, waste, arms and other used current goods (excluding capital assets)
Households and non-profit institutions
Interest, dividends and rent on land
Recovery of previous year's expenditure
Cash surpluses

Estimates of Provincial Expenditure 2007 Vote 3: Provincial Treasury
89
Annexure B to Vote 3
Table B.2 Summary of payments and estimates by economic classification
Audited Audited Audited
% Change from
Revised estimate
2003/04 2004/05 2005/06 2006/07 2006/07 2006/07 2007/08 2006/07 2008/09 2009/10Current payments 50 354 99 614 112 495 133 064 132 739 130 077 117 892 (9.37) 124 831 137 418 Compensation of employees 29 974 33 590 41 941 60 814 55 847 54 553 76 550 40.32 85 847 99 755
Salaries and wages 24 373 29 101 36 738 52 906 48 794 47 782 66 870 39.95 74 816 87 206 Social contributions 5 601 4 489 5 203 7 908 7 053 6 771 9 680 42.96 11 031 12 549
Goods and services 20 380 65 930 70 381 72 250 76 892 74 520 41 342 (44.52) 38 984 37 663 of which
1 340 443 133 185 185 185 194 4.86 204 213 1 260 1 976 2 433 2 830 2 830 2 351 1 800 (23.44) 1 789 1 870
10 232 26 258 28 335 27 832 29 470 29 822 24 730 (17.07) 21 634 19 740
25 223 26 427 28 585 28 585 28 585 (100.00) 264 271 436 477 475 456 480 5.26 504 527 300 308 958 902 1 230 1 381 1 226 (11.22) 1 288 1 346 423 126 628 531 918 998 700 (29.86) 735 768
2 142 2 483 2 961 2 716 3 668 3 605 3 831 6.27 4 024 4 204 94 173 1 004 (100.00)
Transfers and subsidies to 4 915 723 348 184 481 482 (100.00) Provinces and municipalities 67 81 152 94 29 29 (100.00)
Provinces 50 Provincial agencies and funds 50
Municipalities 67 81 102 94 29 29 (100.00) Municipalities 67 81 102 94 29 29 (100.00)
67 81 102 94 29 29 (100.00)
Departmental agencies and accounts 4 700 27 37 37 37 (100.00) 4 700 27 37 37 37 (100.00) 4 700
27 37 37 37 (100.00) 50 53 53 54 (100.00)
Households 148 565 196 362 362 (100.00) Other transfers to households 148 565 196 362 362 (100.00)
Payments for capital assets 10 152 1 996 1 432 998 1 026 1 943 1 109 (42.92) 1 222 1 158 Machinery and equipment 10 152 1 391 1 029 982 886 1 803 989 (45.15) 1 096 1 026
Other machinery and equipment 10 152 1 391 1 029 982 886 1 803 989 (45.15) 1 096 1 026 605 403 16 140 140 120 (14.29) 126 132
Total economic classification 65 421 102 333 114 275 134 246 134 246 132 502 119 001 (10.19) 126 053 138 576
Financial transactions in assets and liabilities
Revised estimate
Medium-term estimate
Consultants and specialised services
Economic classificationR'000
Outcome
Main appro-priation
Adjusted appro-
priation
of whichRegional services council levies
Entities receiving transfersWestern Cape Gambling and Racing Board
SETA
Foreign governments and international organisations
Software and other intangibleassets
Audit feesAudit fees: external
Information Technology expensesOperating LeasesPrinting and publicationsTrainingTravel and subsistence

Estimates of Provincial Expenditure 2007 Vote 3: Provincial Treasury
90
Annexure B to Vote 3
Table B.2.1 Payments and estimates by economic classification – Programme 1: Administration
Audited Audited Audited
% Change from
Revised estimate
2003/04 2004/05 2005/06 2006/07 2006/07 2006/07 2007/08 2006/07 2008/09 2009/10Current payments 17 614 20 133 22 541 26 792 28 538 27 205 29 786 9.49 30 672 32 308 Compensation of employees 11 338 11 397 12 111 14 832 13 769 13 440 17 811 32.52 19 356 20 483
Salaries and wages 9 819 9 949 10 718 12 982 12 111 11 819 15 668 32.57 16 994 18 035 Social contributions 1 519 1 448 1 393 1 850 1 658 1 621 2 143 32.20 2 362 2 448
Goods and services 6 276 8 642 10 257 11 960 14 769 12 761 11 975 (6.16) 11 316 11 825 of which
1 260 1 976 2 433 2 830 2 830 2 351 1 800 (23.44) 1 789 1 870 676 181 764 1 384 2 471 1 951 2 156 10.51 1 164 1 217
264 271 436 477 475 456 480 5.26 504 527 300 308 958 902 1 230 1 381 1 226 (11.22) 1 288 1 346 423 126 333 183 918 998 700 (29.86) 735 768 715 1 004 1 228 1 120 1 301 1 058 1 127 6.52 1 184 1 237 94 173 1 004 (100.00)
Transfers and subsidies to 176 185 191 112 233 233 (100.00) Provinces and municipalities 28 28 80 22 8 8 (100.00)
Provinces 50 Provincial agencies and funds 50
Municipalities 28 28 30 22 8 8 (100.00) Municipalities 28 28 30 22 8 8 (100.00)
28 28 30 22 8 8
Departmental agencies and accounts 27 37 37 37 (100.00) 27 37 37 37 (100.00) 27 37 37 37 (100.00) 50 53 53 53 (100.00)
Households 148 80 111 135 135 (100.00) Other transfers to households 148 80 111 135 135 (100.00)
Payments for capital assets 2 397 1 000 488 701 566 1 067 542 (49.20) 657 686 Machinery and equipment 2 397 995 475 701 566 1 067 542 (49.20) 657 686
Other machinery and equipment 2 397 995 475 701 566 1 067 542 (49.20) 657 686 5 13
Total economic classification 20 187 21 318 23 220 27 605 29 337 28 505 30 328 6.40 31 329 32 994
TrainingTravel and subsistence
Printing and publicationsOperating Leases
Audit fees: external
Foreign governments and international organisations
Software and other intangibleassets
SETA
of whichRegional services council levies
Entities receiving transfers
Financial transactions in assets and liabilities
Revised estimate
Medium-term estimate
Consultants and specialised services
Economic classificationR'000
Outcome
Main appro-priation
Adjusted appro-priation

Estimates of Provincial Expenditure 2007 Vote 3: Provincial Treasury
91
Annexure B to Vote 3
Table B.2.2 Payments and estimates by economic classification – Programme 2: Sustainable resource management
Audited Audited Audited
% Change from
Revised estimate
2003/04 2004/05 2005/06 2006/07 2006/07 2006/07 2007/08 2006/07 2008/09 2009/10Current payments 9 725 10 565 16 100 24 033 22 306 21 520 28 208 31.08 30 680 32 392 Compensation of employees 4 852 7 351 9 332 17 508 16 077 15 615 22 942 46.92 25 239 26 706
Salaries and wages 3 890 6 365 8 245 15 383 14 173 13 823 20 171 45.92 22 015 23 337 Social contributions 962 986 1 087 2 125 1 904 1 792 2 771 54.63 3 224 3 369
Goods and services 4 873 3 214 6 768 6 525 6 229 5 905 5 266 (10.82) 5 441 5 686 of which
4 101 2 517 2 818 3 654 2 454 2 830 2 286 (19.22) 2 402 2 510
186 198 436 671 798 737 1 115 1 144 852 (25.52) 895 935
Transfers and subsidies to 4 712 502 22 31 8 8 (100.00) Provinces and municipalities 12 17 22 31 8 8 (100.00)
Municipalities 12 17 22 31 8 8 (100.00) Municipalities 12 17 22 31 8 8 (100.00)
12 17 22 31 8 8
Departmental agencies and accounts 4 700 4 700 4 700
Households 485 Other transfers to households 485
Payments for capital assets 391 66 103 147 25 (82.99) 15 15 Machinery and equipment 391 50 66 110 25 (77.27) 15 15
Other machinery and equipment 391 50 66 110 25 (77.27) 15 15 16 37 37 (100.00)
Total economic classification 14 437 11 067 16 513 24 130 22 417 21 675 28 233 30.26 30 695 32 407
TrainingTravel and subsistence
Revised estimate
Medium-term estimate
Consultants and specialised services
Economic classificationR'000
Outcome
Main appro-priation
Adjusted appro-priation
of whichRegional services council levies
Entities receiving transfersWestern Cape Gambling and Racing Board
Software and other intangibleassets

Estimates of Provincial Expenditure 2007 Vote 3: Provincial Treasury
92
Annexure B to Vote 3
Table B.2.3 Payments and estimates by economic classification – Programme 3: Asset and liabilities management
Audited Audited Audited
% Change from
Revised estimate
2003/04 2004/05 2005/06 2006/07 2006/07 2006/07 2007/08 2006/07 2008/09 2009/10Current payments 14 167 42 691 46 631 49 454 48 257 47 775 20 716 (56.64) 22 064 23 276 Compensation of employees 8 940 8 498 11 725 14 351 13 257 13 192 16 031 21.52 17 145 18 136
Salaries and wages 6 828 7 321 10 139 12 361 11 406 11 386 13 829 21.46 14 831 15 724 Social contributions 2 112 1 177 1 586 1 990 1 851 1 806 2 202 21.93 2 314 2 412
Goods and services 5 227 34 193 34 906 35 103 35 000 34 583 4 685 (86.45) 4 919 5 140 of which
3 234 7 631 7 399 5 196 5 191 5 230 3 751 (28.28) 3 939 4 116
25 223 26 427 28 585 28 585 28 585 (100.00) 17
855 576 588 519 729 840 741 (11.79) 778 813
Transfers and subsidies to 21 21 29 22 233 234 (100.00) Provinces and municipalities 21 21 29 22 6 6 (100.00)
Municipalities 21 21 29 22 6 6 (100.00) Municipalities 21 21 29 22 6 6 (100.00)
21 21 29 22 6 6 1 (100.00)
Households 227 227 (100.00) Other transfers to households 227 227 (100.00)
Payments for capital assets 7 746 396 39 201 201 234 22 (90.60) 24 25 Machinery and equipment 7 746 396 39 201 201 234 22 (90.60) 24 25
Other machinery and equipment 7 746 396 39 201 201 234 22 (90.60) 24 25 Total economic classification 21 934 43 108 46 699 49 677 48 691 48 243 20 738 (57.01) 22 088 23 301
TrainingTravel and subsistence
Information Technology expenses
Revised estimate
Medium-term estimate
Consultants and specialised services
Economic classificationR'000
Outcome
Main appro-priation
Adjusted appro-priation
of whichRegional services council levies
Foreign governments and international organisations

Estimates of Provincial Expenditure 2007 Vote 3: Provincial Treasury
93
Annexure B to Vote 3
Table B.2.4 Payments and estimates by economic classification – Programme 4: Financial governance
Audited Audited Audited
% Change from
Revised estimate
2003/04 2004/05 2005/06 2006/07 2006/07 2006/07 2007/08 2006/07 2008/09 2009/10Current payments 8 848 26 225 27 223 32 785 33 638 33 577 39 182 16.69 41 415 49 442 Compensation of employees 4 844 6 344 8 773 14 123 12 744 12 306 19 766 60.62 24 107 34 430
Salaries and wages 3 836 5 466 7 636 12 180 11 104 10 754 17 202 59.96 20 976 30 110 Social contributions 1 008 878 1 137 1 943 1 640 1 552 2 564 65.21 3 131 4 320
Goods and services 4 004 19 881 18 450 18 662 20 894 21 271 19 416 (8.72) 17 308 15 012 of which
1 340 443 133 185 185 185 194 4.86 204 213 2 221 15 929 17 354 17 598 19 354 19 811 16 537 (16.53) 14 129 11 897
92 150 136 232 347 340 523 563 1 111 97.34 1 167 1 219
Transfers and subsidies to 6 15 106 19 7 7 (100.00) Provinces and municipalities 6 15 21 19 7 7 (100.00)
Municipalities 6 15 21 19 7 7 (100.00) Municipalities 6 15 21 19 7 7 (100.00)
6 15 21 19 7 7
Households 85 Other transfers to households 85
Payments for capital assets 9 600 514 30 156 495 520 5.05 526 432 Machinery and equipment 9 124 30 53 392 400 2.04 400 300
Other machinery and equipment 9 124 30 53 392 400 2.04 400 300 600 390 103 103 120 16.50 126 132
Total economic classification 8 863 26 840 27 843 32 834 33 801 34 079 39 702 16.50 41 941 49 874
Revised estimate
Medium-term estimate
Consultants and specialised services
Economic classificationR'000
Outcome
Main appro-priation
Adjusted appro-priation
of whichRegional services council levies
Software and other intangibleassets
Audit fees
TrainingTravel and subsistence

Estimates of Provincial Expenditure 2007 Vote 3: Provincial Treasury
94
Annexure B to Vote 3
Table B.3 Details on public entities – Name of Public Entity: Western Cape Gambling and Racing Board
Estimatedoutcome
2003/04 2004/05 2005/06 2006/07 2007/08 2008/09 2009/10 Revenue
Non-tax revenue 14 304 20 966 26 070 28 681 25 487 26 256 26 934Sale of goods and services other than capital assets 13 534 20 143 25 229 27 614 24 978 25 717 26 395Of which:
Admin fees 13 534 20 143 25 229 27 614 24 978 25 717 26 395Other non-tax revenue 770 823 841 1 067 509 539 539
Transfers received 4 738 ( 1 557) 762 Total revenue 19 042 19 409 26 832 28 681 25 487 26 256 26 934Expenses
Current expense 16 463 18 159 16 947 20 064 25 251 25 457 26 689Compensation of employees 9 667 10 518 10 850 11 910 15 820 16 107 17 152Goods and services 6 248 7 077 5 296 7 335 8 674 8 664 8 851Depreciation 548 564 801 819 757 686 686
Transfers and subsidies 160 258 218 183 236 180 185Total expenses 16 623 18 417 17 165 20 247 25 487 25 637 26 874Surplus/(Deficit) 2 419 992 9 667 8 434 619 60
Cash flow summary Adjust surplus/(deficit) for accrual transactions ( 32) ( 153) 71 ( 198) 248 147 147
Adjustments for: Depreciation 548 564 801 819 757 686 686Interest ( 561) ( 707) ( 730) ( 1 017) ( 509) ( 539) ( 539)Net (profit)/loss on disposal of fixed assets ( 19) ( 10)
Operating surplus/ deficit) before changes in working capital
2 387 839 9 738 8 236 248 766 207
Changes in working capital 26 1 719 ( 2 167) 1 227 1 279 241 241(Decrease)/increase in accounts payable ( 129) 2 932 ( 2 597) 630 1 259 221 221Decrease/(increase) in accounts receivable 350 ( 1 080) 299 588 Decrease/(increase) in inventory ( 74) ( 167) 145 (Decrease)/increase in provisions ( 121) 34 ( 14) 9 20 20 20
Cash flow from operating activities 2 413 2 558 7 571 9 463 1 527 1 007 448Cash flow from investing activities 70 ( 1 430) 1 254 168 177 74 74
Acquisition of Assets ( 520) ( 2 211) ( 339) ( 312) ( 332) ( 465) ( 465)Other flows from Investing Activities 590 781 1 593 480 509 539 539
Cash flow from financing activities ( 1 175) ( 1 378) ( 2 272) ( 8 703) ( 2 335) ( 791) ( 791)
Net increase/decrease) in cash and cash equivalents 1 308 ( 250) 6 553 928 ( 631) 290 ( 269)
Balance Sheet Data Carrying Value of Assets 1 002 2 561 2 097 1 333 641 690 690Cash and Cash Equivalents 5 541 7 505 13 198 11 803 6 003 6 003 6 003Receivables and Prepayments 366 1 613 1 168 1 293 803 1 203 803Total Assets 6 909 11 679 16 463 14 429 7 447 7 896 7 496Capital & Reserves 3 421 4 649 11 465 9 899 1 200 1 619 860Trade and Other Payables 1 012 3 940 1 345 1 200 2 800 2 800 2 986Provisions 637 671 657 530 647 530 650Managed Funds 1 839 2 419 2 996 2 800 2 800 2 947 3 000Total Equity and Liabilities 6 909 11 679 16 463 14 429 7 447 7 896 7 496
R'000
Medium-term estimate
Audited Audited Audited
Outcome

Estimates of Provincial Expenditure 2007 Vote 3: Provincial Treasury
95
Annexure B to Vote 3
Table B.4 Transfers to local government by transfers/grant type, category and municipality - None
Table B.5 Provincial payments and estimates by district and local municipality
Audited Audited Audited
% Change from
Revised estimate
2003/04 2004/05 2005/06 2006/07 2006/07 2006/07 2007/08 2006/07 2008/09 2009/10Cape Town Metro 65 421 102 333 114 275 134 246 134 246 132 502 119 001 (10.19) 126 053 138 576
65 421 102 333 114 275 134 246 134 246 132 502 119 001 (10.19) 126 053 138 576 Total provincialexpenditure by districtand local municipality
Revised estimate
Medium-term estimate
MunicipalitiesR'000
Outcome
Main appro-priation
Adjusted appro-priation