Embed Size (px)
Citation preview

vRealize Operations Management Packfor OpenStack
This document supports the version of each product listed andsupports all subsequent versions until the document isreplaced by a new edition. To check for more recent editionsof this document, see http://www.vmware.com/support/pubs.
EN-001607-00

vRealize Operations Management Pack for OpenStack
2 VMware, Inc.
You can find the most up-to-date technical documentation on the VMware Web site at:
http://www.vmware.com/support/
The VMware Web site also provides the latest product updates.
If you have comments about this documentation, submit your feedback to:
Copyright © 2014 VMware, Inc. All rights reserved. Copyright and trademark information.
VMware, Inc.3401 Hillview Ave.Palo Alto, CA 94304www.vmware.com

Contents
About This Book 5
1 Introduction to the vRealize Operations Management Pack for OpenStack 7
2 Installing and Configuring the Management Pack for OpenStack 9
Integrate the Management Pack for Openstack with vRealize Management Packs 9Install the Management Pack 10Configure the OpenStack Instance 11View Management Pack for OpenStack Objects 12
3 Prerequisites forInstalling and Configuring the Hyperic Agent and Hyperic
Plug-Ins for OpenStack 15Install the Hyperic Agent in OpenStack 16Configure the MySQL Plug-In 16Configure the Apache Web Server Plug-In 16Configure the RabbitMQ Plug-In 17Install the Memcached Plug-In 17
4 Management Pack for OpenStack Dashboards 19
Displaying OpenStack Dashboards 19OpenStack Controllers Dashboard 20OpenStack Compute Infrastructure Dashboard 20OpenStack Network Infrastructure Dashboard 21OpenStack vCenter Storage Infrastructure Dashboard 22OpenStack Tenants Dashboard 23
5 Working with the Management Pack for OpenStack 25
Open an External Application 26Configuring OpenStack with Log Insight 26
6 Management Pack for OpenStack Alert Definitions 29
7 Management Pack for OpenStack Capacity Models 45
8 Management Pack for OpenStack Object Model 49
OpenStack Objects and Metrics 49
9 Management Pack for OpenStack Reports 71
Generate a Report 71
VMware, Inc. 3

Index 73
vRealize Operations Management Pack for OpenStack
4 VMware, Inc.
About This Book
The vRealize Operations Management Pack for OpenStack takes you through the process of deploying aworking instance of Management Pack for OpenStack within your vCenter environment. It also describesthe prerequisites for OpenStack, plug-in installation and configuration, and how to work in theManagement Pack for OpenStack environment.
Intended AudienceThis information is intended for any network engineer, network administrator, network manager, ornetwork operations manager who is involved with the daily operations related to deployment,configuration, change management, troubleshooting, and capacity management of OpenStack networkingtechnologies. In addition, it is intended for any cloud operations manager, cloud infrastructure manager, orvirtual administrator who has operation responsibility for troubleshooting virtual infrastructure problems,and within this infrastructure OpenStack has been deployed.
VMware Technical Publications GlossaryVMware Technical Publications provides a glossary of terms that might be unfamiliar to you. For definitionsof terms as they are used in VMware technical documentation, go to http://www.vmware.com/support/pubs.
VMware, Inc. 5

vRealize Operations Management Pack for OpenStack
6 VMware, Inc.
Introduction to thevRealize Operations ManagementPack for OpenStack 1
The Management Pack for OpenStack extends the operational management capabilities of the vRealizeOperations platform to provide operational control of OpenStack environments.
This management pack is intended for administrators who are operating an OpenStack cloud. It includes thefollowing key features:n Performance and availability monitoring of OpenStack infrastructure and services.
n Pre-defined dashboards for:n Cloud Controllers Health
n Compute Infrastructure
n vCenter Storage Infrastructure
n Network Infrastructure
n Tenants Inventory, Health and Quota usage
n Visibility into cloud resources running on any VMware ESX, KVM, XEN, or Hyper-v technologies.
n Advanced performance and capacity analytics for OpenStack inventory running on any VMware ESXand NSX technologies.
n Pre-defined alerts for several common OpenStack operational problems.
n Report templates for the following objects.n OpenStack Tenant Inventory
n OpenStack Infrastructure Capacity
n OpenStack Alerts
VMware, Inc. 7

vRealize Operations Management Pack for OpenStack
8 VMware, Inc.

Installing and Configuring theManagement Pack for OpenStack 2
Using the Management Pack for OpenStack, you can collect inventory and capacity information of computenodes registered with OpenStack, and inventory and availability of tenants and provisioned virtualmachines or networks.
This chapter includes the following topics:
n “Integrate the Management Pack for Openstack with vRealize Management Packs,” on page 9
n “Install the Management Pack,” on page 10
n “Configure the OpenStack Instance,” on page 11
n “View Management Pack for OpenStack Objects,” on page 12
Integrate the Management Pack for Openstack with vRealizeManagement Packs
To enhance monitoring and data collection capabilities, you can integrate theManagement Pack for OpenStack with the vRealize Operations Management Pack for vCenter,vRealize Operations Management Pack for vRealize Hyperic, and thevRealize Operations Management Pack for NSX for Multi-Hypervisor.
If you intend to work with all four management packs, for the most efficient use of resources, configure theadapters of the management pack in the following order.
1 Management Pack for vCenter.
2 Management Pack for NSX for Multi-Hypervisor and Management Pack for vRealize Hyperic. Theorder of these two management packs is not important.
3 Management Pack for OpenStack.
NOTE Each management pack populates a particular area of the user interface with specific data. If youchoose not to integrate the Management Pack for OpenStack with these management packs, some areas ofthe OpenStack user interface will not be populated with data.
VMware, Inc. 9

Table 2‑1. OpenStack Integration with vRealize Management Packs
Management Pack Required by Description
vRealize Management Pack forvCenter
Openstack vCenter Storage Infrastructuredashboard
If the OpenStack deployment isusing vCenter for the computecomponent, vRealizeManagement Pack for vCenterprovides integration with thedata that the management packcollects for vCenter, such asadditional metrics and capacitycalculations.
vRealize OperationsManagement Pack for vRealizeHyperic
n OpenStack Controllers dashboardn OpenStack Controllers navigation tree
TheManagement Pack for OpenStacktakes advantage of the plug-infor vRealize Hyperic formonitoring the availability andresource use of OpenStackcontroller services, such as nova-compute, neutron-server, andcinder-volume. The plug-in isavailable on the SolutionExchange and is also providedwith vRealize Hyperic 5.8.4. Inaddition, by integrating withvRealize Hyperic, you canmonitor the availability andresource use of OpenStack web,database and messagingapplications, including MySQL,Apache, RabbitMQ, andMemcached.
vRealize OperationsManagement Pack for NSX forMulti-Hypervisor
OpenStack Network Infrastructure dashboard If the OpenStack deployment isusing NSX for Multi-Hypervisorfor the networking component,vRealize OperationsManagement Pack for NSX forMulti-Hypervisor providesintegration with the data that themanagement pack collects forNSX for Multi-Hypervisor, suchas additional metrics, andmonitoring of the networkinginfrastructure.
Install the Management PackA management pack is the part of the solution that you install.
Prerequisites
The solution that you downloaded includes a PAK file. Save that PAK file to a temporary folder on yourlocal system.
Procedure
1 Log in to the vRealize Operations Manager user interface with admin privileges.
2 In the left pane of vRealize Operations Manager, click the Administration icon and click Solutions.
3 On the Solutions tab, click the plus sign.
vRealize Operations Management Pack for OpenStack
10 VMware, Inc.

4 Browse to locate the temporary folder and select the PAK file.
For example, managementpack_name-buildnumber.pak.
5 Click Upload.
The upload might take several minutes.
6 Read and accept the EULA, and click Next.
Installation details appear in the window during the process.
7 Ensure that you install the PAK file on the master node.
8 When the installation is complete, click Finish.
What to do next
Configure an adapter instance for the management pack.
Configure the OpenStack InstanceAfter you install the management pack, add and configure an instance to start collecting data.
Procedure
1 In the left pane of vRealize Operations Manager, click the Administration icon and click Solutions.
2 On the Solutions tab, click Management Pack for OpenStack, and click the Configure icon.
3 Configure the instance settings.
Option Description
Name Enter a name for the adapter instance.
Description Enter a description for the adapter instance.
OpenStack API Host Enter the host name or IP address where the KeyStone service is running.This service provides an entry point to the OpenStack API.
Port Enter the port number where the KeyStone service is running. The defaultport number is 5000.
Connection Type Select the connection type with which the management pack shouldcommunicate with OpenStack. The option set by default is HTTPS.
Endpoint Type Endpoints are the APIs used to call the different OpenStack services. Selectthe set of endpoints which vRealize Operations Manager uses whenconnecting with the OpenStack API.n Detect Automatically. This option is selected by default, and can be
used if you do not know where vRealize Operations Manager isinstalled.
n Public Only. Select if vRealize Operations Manager is installed outsidethe management network.
n Admin Only. Select if vRealize Operations Manager is installed insidethe management network.
n Internal Only. Select if you want to use the Internal service endpointsthat are registered with OpenStack
Support Auto Discovery Auto discovery enables the management pack to discover resources andmonitor the OpenStack deployment. This option is set to True by default,and should not be changed.
Chapter 2 Installing and Configuring the Management Pack for OpenStack
VMware, Inc. 11

4 To add the credentials used to access OpenStack and optionally vCenter Server, click the plus sign.
Option Description
Credential name Enter the name by which you are identifying the configured credentials.
OpenStack Username Enter the username with which you connect to OpenStack.
OpenStack Password Enter the password with which you connect to OpenStack.
Admin Tenant Enter the name of a tenant for which you have an admin role. For the mostcomplete discovery possible, you should have the admin role on alltenants.
5 Click Test Connection to validate the connection.
6 The Advanced Settings area includes the Collector drop-down box, in which you can select thecollector upon which you want to run the adapter instance. A collector gathers objects into its inventoryfor monitoring. The collector specified by default has been selected for optimal data collecting.
7 Click Save Settings.
The adapter instance is added to the list.
What to do next
Verify that the adapter is configured and collecting data by viewing application-related data.
Table 2‑2. Successful Configuration Indicators
Where to View the Information Information to View
Collection Status and Collection State columns in theManagement Pack for OpenStack Solutions Details pane onthe Solutions tab.
The strings Collecting or Data receiving appearapproximately ten minutes after you have configured theadapter.
Environment Overview The objects related to OpenStack are added to theinventory trees.
Dashboards Management Pack for OpenStack dashboards are added tothe vRealize Operations Manager dashboards.n OpenStack Controllersn OpenStack Compute Infrastructuren OpenStack Network Infrastructuren OpenStack vCenter Storage Infrastructuren OpenStack TenantsClick the Home icon in the left pane ofvRealize Operations Manager to view dashboards.
View Management Pack for OpenStack ObjectsWhen the Management Pack for OpenStack has been installed and configured, the following objects areadded to the Inventory trees in the vRealize Operations Manager Environment.
Check that the OpenStack environment is configured correctly by viewing OpenStack objects.
Procedure
1 In the left pane of vRealize Operations Manager, click the Environment icon.
2 In the Environment Overview, scroll down the list, and under the Inventory Trees list, click AllObjects.
3 In the All Objects list, click the arrow next to MP for OpenStack.
OpenStack objects are displayed in the expanded list.
vRealize Operations Management Pack for OpenStack
12 VMware, Inc.

Table 2‑3. Management Pack for OpenStack Objects
Object Description
MP for OpenStack Instance Represents an instance of the OpenStack adapter.
Non-ESX Host System Represents a non-ESX hypervisor that is registered withOpenStack.
Non-ESX Virtual Machine Represents a virtual machine that has been provisioned bya user and is running on a non-ESX hypervisor.
OpenStack Compute Infrastructure Represents an aggregation of all hosts and clusters that areregistered with OpenStack.
OpenStack Compute Services Represents an aggregation of all Nova services in theOpenStack environment.
OpenStack External Logical Switch Represents an external logical switch that has beenprovisioned by a tenant. If NSX for Multi-Hypervisor isbeing used, this object type is not used.
OpenStack Group Internal object that is used by theManagement Pack for OpenStack for grouping certainobjects together in order to show them on the dashboards.
OpenStack Logical Router Represents an logical router that has been provisioned by atenant. If NSX for Multi-Hypervisor is being used, thisobject type is not used.
OpenStack Logical Switch Represents an logical switch that has been provisioned by atenant. If NSX for Multi-Hypervisor is being used, thisobject type is not used.
OpenStack Management Services Represents an aggregation of all KeyStone, Ceilometer, andsupport services in the OpenStack environment.
OpenStack Network Infrastructure Represents an aggregation of all NSX for Multi-Hypervisorcontrollers, gateway services, and transport zones that areregistered with OpenStack.
OpenStack Network Services Represents an aggregation of all Neutron services in theOpenStack environment.
OpenStack Storage Infrastructure Represents an aggregation of all vCenter datastores that areregistered with OpenStack. This is only applicable whenusing OpenStack with vCenter.
OpenStack Storage Services Represents an aggregation of all Cinder, Glance, and Swiftservices in the OpenStack environment.
OpenStack Tenant Represents a project in OpenStack, along with allprovisioned instances, networks, and routers.
Chapter 2 Installing and Configuring the Management Pack for OpenStack
VMware, Inc. 13

vRealize Operations Management Pack for OpenStack
14 VMware, Inc.
Prerequisites forInstalling andConfiguring the Hyperic Agent andHyperic Plug-Ins for OpenStack 3
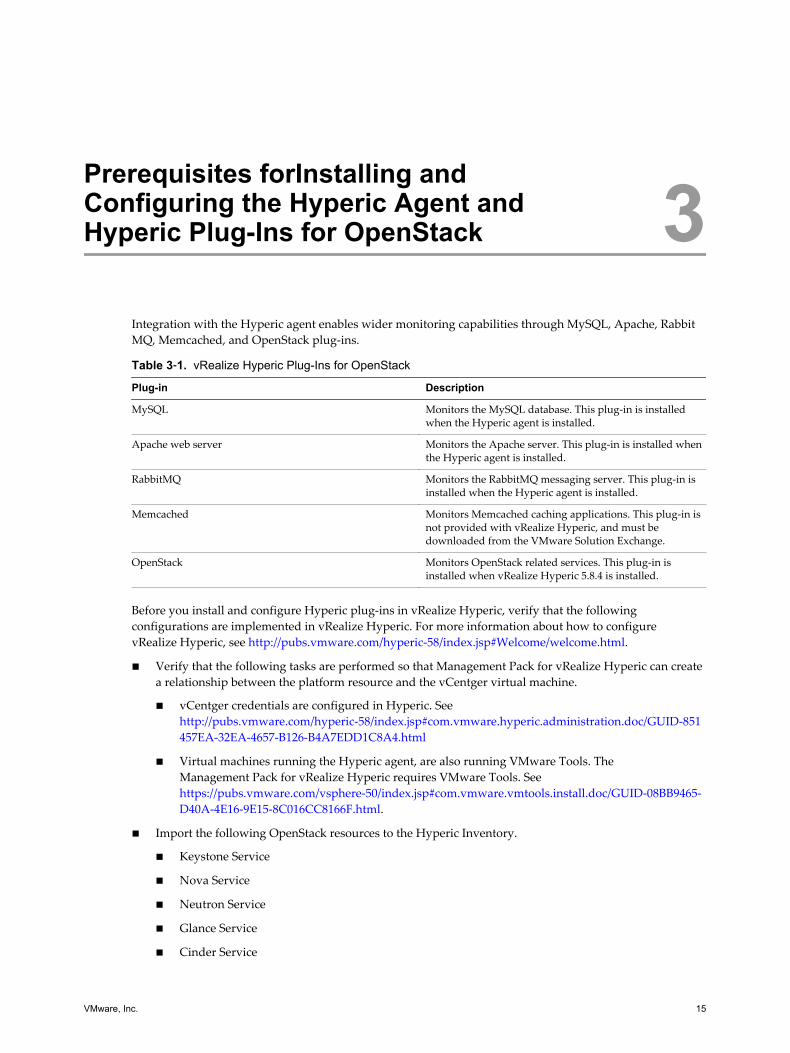
Integration with the Hyperic agent enables wider monitoring capabilities through MySQL, Apache, RabbitMQ, Memcached, and OpenStack plug-ins.
Table 3‑1. vRealize Hyperic Plug-Ins for OpenStack
Plug-in Description
MySQL Monitors the MySQL database. This plug-in is installedwhen the Hyperic agent is installed.
Apache web server Monitors the Apache server. This plug-in is installed whenthe Hyperic agent is installed.
RabbitMQ Monitors the RabbitMQ messaging server. This plug-in isinstalled when the Hyperic agent is installed.
Memcached Monitors Memcached caching applications. This plug-in isnot provided with vRealize Hyperic, and must bedownloaded from the VMware Solution Exchange.
OpenStack Monitors OpenStack related services. This plug-in isinstalled when vRealize Hyperic 5.8.4 is installed.
Before you install and configure Hyperic plug-ins in vRealize Hyperic, verify that the followingconfigurations are implemented in vRealize Hyperic. For more information about how to configurevRealize Hyperic, see http://pubs.vmware.com/hyperic-58/index.jsp#Welcome/welcome.html.
n Verify that the following tasks are performed so that Management Pack for vRealize Hyperic can createa relationship between the platform resource and the vCentger virtual machine.
n vCentger credentials are configured in Hyperic. See http://pubs.vmware.com/hyperic-58/index.jsp#com.vmware.hyperic.administration.doc/GUID-851457EA-32EA-4657-B126-B4A7EDD1C8A4.html
n Virtual machines running the Hyperic agent, are also running VMware Tools. TheManagement Pack for vRealize Hyperic requires VMware Tools. See https://pubs.vmware.com/vsphere-50/index.jsp#com.vmware.vmtools.install.doc/GUID-08BB9465-D40A-4E16-9E15-8C016CC8166F.html.
n Import the following OpenStack resources to the Hyperic Inventory.
n Keystone Service
n Nova Service
n Neutron Service
n Glance Service
n Cinder Service
VMware, Inc. 15

n Swift Service
n Ceilometer Service
n RabbitMQ
n MySQL
n Apache
n Memcached
This chapter includes the following topics:
n “Install the Hyperic Agent in OpenStack,” on page 16
n “Configure the MySQL Plug-In,” on page 16
n “Configure the Apache Web Server Plug-In,” on page 16
n “Configure the RabbitMQ Plug-In,” on page 17
n “Install the Memcached Plug-In,” on page 17
Install the Hyperic Agent in OpenStackDownload a Hyperic agent for each virtual machine that is running OpenStack services.
Prerequisites
Ensure that the Hyperic agent corresponds with your Hyperic server. For example, if you are runningHyperic server 5.8.4, download the Hyperic agent for Hyperic 5.8.4.
Procedure
1 Run tar -xvf <downloaded_hyperic_agent> to extract the file.
2 Run cd <hyperic_extracted>/bin to extract the files.
3 Run ./hq-agent start and follow the instructions to complete agent setup.
Configure the MySQL Plug-InThe MySQL plug-in is installed when the Hyperic agent is installed.
Procedure
1 In the Hyperic server, access the Configuration page.
2 Configure the jdbcUrl, username, password, and port options.
Configure the Apache Web Server Plug-InThe Apache Web Server plug-in is installed when the Hyperic agent is installed.
Procedure
1 In the Hyperic server, access the Configuration page.
2 Configure the hostname, port, and ssl connection options.
3 Enter the URL of the server status path to be monitored: <path<a="><path<>. For example,http://<apache-server-ip>:80/<path.
vRealize Operations Management Pack for OpenStack
16 VMware, Inc.

Configure the RabbitMQ Plug-InThe RabbitMQ plug-in is installed when the Hyperic agent is installed.
Procedure
1 On the host where the Rabbit MQ server is installed, enter rabbitmq-plugins enablerabbitmq_management.
This enables plug-in management.
2 Restart the RabbitMQ Server.
3 Access http://server-name:55672 to verify that the server is enabled.
4 In the Hyperic server, access the Configuration page, and configure the management port, username,and password options.
Install the Memcached Plug-InThe Memcached plug-in is not provided with Hyperic, and must be downloaded from the VMware SolutionExchange.
Prerequisites
Download the Memcached plug-in at https://solutionexchange.vmware.com/store/products/memcached-plugin-for-hyperic#.VEAtO_ldU1I
Procedure
1 In the Hyperic server, click the Administration tab.
2 Access the Plugin Manager, and click Add/Update Plugins.
3 Follow the instructions to install the plug-in.
You do not need to configure any options. When Memcached is running, the resource is detected.
Chapter 3 Prerequisites forInstalling and Configuring the Hyperic Agent and Hyperic Plug-Ins for OpenStack
VMware, Inc. 17

vRealize Operations Management Pack for OpenStack
18 VMware, Inc.

Management Pack for OpenStackDashboards 4
The Management Pack for OpenStack dashboards enable you to diagnose and troubleshoot problems inyour OpenStack environment.
For information about how to configure the options on the dashboard widgets, see thevRealize Operations Manager documentation, at https://www.vmware.com/support/pubs/.
This chapter includes the following topics:
n “Displaying OpenStack Dashboards,” on page 19
n “OpenStack Controllers Dashboard,” on page 20
n “OpenStack Compute Infrastructure Dashboard,” on page 20
n “OpenStack Network Infrastructure Dashboard,” on page 21
n “OpenStack vCenter Storage Infrastructure Dashboard,” on page 22
n “OpenStack Tenants Dashboard,” on page 23
Displaying OpenStack DashboardsManagement Pack for OpenStack dashboards are displayed in the vRealize Operations Manager Home pageafter the management pack is installed. If you have numerous dashboards open invRealize Operations Manager, the OpenStack dashboards may not be visible. Instead of scrolling throughyour available dashboards, you can select them from the dashboard list.
Procedure
1 In the left pane of vRealize Operations Manager click the Home icon.
2 In the right pane, click Dashboard List, and from the drop-down menu point to OpenStack, and selectthe OpenStack dashboard you want to work with.
The selected dashboard is displayed in the vRealize Operations Manager Home page.
3 To ensure that Management Pack for OpenStack dashboards are always available in the Home page,click Dashboard List, and make sure that the OpenStack check box is selected.
VMware, Inc. 19

OpenStack Controllers DashboardThe OpenStack Controllers dashboard provides a high level view of the compute, network, storage, andmanagement services. This dashboard enables you to detect health-related problems at the service level, andthen drill-down to the individual processes by viewing the topology and alerts.
To view service-related information in the Controller Service Topology widget, theManagement Pack for vRealize Hyperic must be installed and configured in vRealize Operations Manager.In addition, the OpenStack plug-in must be installed in vRealize Hyperic.
Table 4‑1. OpenStack Controllers Dashboard Widgets
Widget Description
Controller Service Inventory Provides a high level view of the compute, network,storage, and management services in your environment.Select an object to show detailed information about thecontroller service in the dashboard.Hover over an object to display capacity-related details.
Controller Service Topology Displays the individual services running on the controllers.The health of the services impacts the controller serviceobject in the Controller Service Inventory widget. Forexample, if 50% of the services of a particular type aredown, the object is orange.To display an extended view that includes other connectedobjects, right-click an object, select Expand Node, andselect the objects you want to include in the expandedview.
Controller Service Metrics When you select a controller in the Controller ServiceInventory, this widget displays the number of services thathave been configured and running. When you select aservice in the Controller Service Topology widget, thiswidget provides related resource usage data.
Controller Service Alerts Displays alerts for objects selected in the Controller ServiceTopology widget.
OpenStack Compute Infrastructure DashboardThe OpenStack Compute Infrastructure dashboard displays top level objects that show the correlationbetween the environment and the infrastructure components of that type. This top level view provides youwith enough information to determine if there is sufficient capacity for users to provision virtual machines.
Table 4‑2. OpenStack Compute Infrastructure Dashboard Widgets
Widget Description
Compute Inventory Displays a high level view of the components in thecompute infrastructure. Each component is represented bya box. Select an object to view related components in thedashboard.Hover over an object to display capacity-related details.
Compute Infrastructure Displays related components of the object selected in theCompute Inventory widget.Hover over an object to view health and capacity relateddetails.To display an extended view that includes other connectedobjects, right-click the object, select Expand Node, andselect the objects you want to include in the expandedview.
vRealize Operations Management Pack for OpenStack
20 VMware, Inc.

Table 4‑2. OpenStack Compute Infrastructure Dashboard Widgets (Continued)
Widget Description
Compute Resource Utilization Displays a heatmap of the workloads of the differentobjects registered with OpenStack. The workloads arebroken down by cluster. A threshold is set at 80% of theworkload. The heatmap remains green and healthy as longas the workload remains below 80% of the capacity. Youcan view heatmaps for the cluster CPU, ESX Host CPU,cluster memory, and ESX Host memory workloads, andNon-ESX Host memory usage by selecting the requiredoption from the Configurations drop-down menu.
Compute Alerts Displays alerts for selected objects. Also displays risk-based alerts that are opened if the infrastructure isapproaching capacity. Risk alerts are opened whencapacity has reached a threshold of 85%, 90% and 95%.
OpenStack Network Infrastructure DashboardThe OpenStack Network Infrastructure dashboard provides you with a high level view of the networkinginfrastructure.
The networking infrastructure is only available if you are using NSX for Multi-Hypervisor as yournetworking component, and you have configured the NSX for Multi-Hypervisor adapter. If you are notusing NSX for Multi-Hypervisor as your networking component, this dashboard will not display anyinformation.
Table 4‑3. OpenStack Network Infrastructure Dashboard Widgets
Widget Description
Network Inventory Provides a high level view of your networkinginfrastructure: NSX-MH Controllers, NSX-MH TransportZone, and NSX-MH Gateway Service. Select an object toview related components and information in thedashboard.Hover over an object to display health and configurationrelated details.
Network Infrastructure Displays related components of the object selected in theNetwork Inventory widget.Hover over an object to view health and capacity relateddetails.To display an extended view that includes other connectedobjects, right-click an object, select Expand Node, andselect the objects you want to include in the expandedview.
Network Infrastructure Resource Utilization Displays a heatmap of the workloads of the differentnetwork objects. A threshold is set at 80% of the workload.The heatmap remains green and healthy as long as theworkload remains below 80% of the capacity. You can viewheatmap for the Controller memory, Controller filesystem,Gateway CPU, Gateway memory, Gateway swap memory,and Gateway filesystem workloads by selecting therequired option from the Configurations drop-downmenu.
Network Alerts Displays alerts for objects selected in the NetworkInfrastructure widget.
Chapter 4 Management Pack for OpenStack Dashboards
VMware, Inc. 21

OpenStack vCenter Storage Infrastructure DashboardIf you are using VMware vCenter host as your computing infrastructure, the OpenStack vCenter StorageInfrastructure dashboard displays the data stores in your environment.
If you are not using vCenter as your computing infrastructure, vRealize Operations Manager can not accessdata about the storage devices registered with OpenStack, and the OpenStack vCenter StorageInfrastructure dashboard does not display data.
Table 4‑4. OpenStack vCenter Storage Infrastructure Dashboard Widgets
Widget Description
vCenter Storage Inventory Displays the data stores available in your environment.Hover over an object to display capacity-related details.
vCenter Storage Infrastructure Displays related components of the object selected in thevCenter Storage Inventory widget.Hover over an object to view health and capacity relateddetails.To display an extended view that includes other connectedobjects, right-click an object, select Expand Node, andselect the objects you want to include in the expandedview.
vCenter Storage Resource Utilization Displays a heatmap representing capacity of the datastores. The configurations are broken down by cluster. Athreshold is set at 80% of the capacity. The heatmapremains green and healthy as long as the usage remainsbelow 80% of the capacity. You can view heatmaps for thedatastore diskspace usage, IOPs, and average latency byselecting the required option from the Configurationsdrop-down menu.
vCenter Storage Alerts Displays alerts for objects selected in the vCenter StorageInfrastructure widget.
vRealize Operations Management Pack for OpenStack
22 VMware, Inc.

OpenStack Tenants DashboardThe OpenStack Tenants dashboard provides you with a list of all OpenStack tenants, and the ability to viewquota usage, provisioned objects, and alerts for each tenant.
Table 4‑5. OpenStack Tenants Dashboard Widgets
Widget Description
Tenant Quota Usage Displays the current quota usage of each tenant in theenvironment, and enables you to see if a tenant is close toreaching one of its quota limits. Each tenant is representedby a box. Each box is proportionate to the size of the tenantquota. In addition, a threshold is defined at 80% of thequota, at which point the box starts to turn red.You can view the Tenants instance, vCPU, and vRAM, byselecting the required configuration from theConfigurations drop-down menu.
Tenant Inventory Provides a view of the objects that the tenant hasprovisioned and how they are connected together. Theview expands from Tenant, to virtual machine to switch.To display an extended view that includes other connectedobjects, right-click an object, select Expand Node, andselect the objects you want to include in the expandedview. For example, you can expand the view of a logicalswitch and display the logical router that it is connected to.Hover over any object to see more information about theobject such as its name and its health.
Tenant List Displays a list of all the tenants in the environment. Click atenant in this list to display the tenant in the TenantInventory widget.
Tenant Alerts Displays alerts for objects selected in the Tenant Inventorywidget. Alerts are displayed from both an objectperspective, and from a tenant perspective. For example, ifyou tried to provision a virtual machine and it failed, analert would be displayed on the object that failed toprovision and also on its tenant. This enables you todiagnose problems on both the object and the tenant.
Chapter 4 Management Pack for OpenStack Dashboards
VMware, Inc. 23

vRealize Operations Management Pack for OpenStack
24 VMware, Inc.

Working with theManagement Pack for OpenStack 5
The Management Pack for OpenStack provides you with a high level view of your OpenStack environmentand enables you to drill down to more object-specific information by opening selected objects in externalapplications. You can investigate problems and better analyze the provided information. You can also makeconfiguration changes, as required.
Table 5‑1. Examples of Use
Application Example of Use
View logging information in Log Insight. Informationincludes, component logs, neutron logs, nova logs, and APIrequest logs.NOTE To view logging information in Log Insight, youmust first integrate Log Insight with theManagement Pack for OpenStack.
If a provisioning attempt fails, view the Nova logs inLog Insight to determine any errors that occurred.
Open tenant-related objects in OpenStack Horizon. If a tenant is approaching their quota, open the tenant inOpenStack Horizon and its quota.
This chapter includes the following topics:
n “Open an External Application,” on page 26
n “Configuring OpenStack with Log Insight,” on page 26
VMware, Inc. 25

Open an External ApplicationOpen selected objects in an external application to make configuration changes or to view application-related information.
Table 5‑2. Applications and objects
Application Available on these objects
Log Insight n Compute Infrastructuren Compute Servicesn Host Systemn Non-ESX Host Systemn Virtual Machinen Non-ESX Virtual Machinen Network Servicesn Logical Routern Storage Servicesn Management Servicesn Logical Switch
OpenStack Horizon n Tenantn Non-ESX Host Systemn Non-ESX Virtual Machinen Logical Switchn External Logical Switchn Logical Routern Virtual Machine
vSphere Web Client n Virtual Machinen Host System
NSX Manager n Controllern Transport Zonen Gateway Servicen Logical Switchn Logical Router
Procedure
1 Select the required object in a widget.
2 In the widget toolbar, click the Dashboard Navigation icon, and from the drop-down menu, select theapplication you want to open.
The external application is opened and you can view application-related information about the object.
What to do next
Analyze the information in the application. Make any configuration changes. Continue to monitor the objectin vRealize Operations Manager
Configuring OpenStack with Log InsightThe Management Pack for OpenStack enables you to open selected objects in Log Insight, and view logginginformation for the object. OpenStack does not support automatic configuration of logging information, andif you want to forward logging information to Log Insight, you must configure the OpenStack hostmanually.
vRealize Operations Management Pack for OpenStack
26 VMware, Inc.
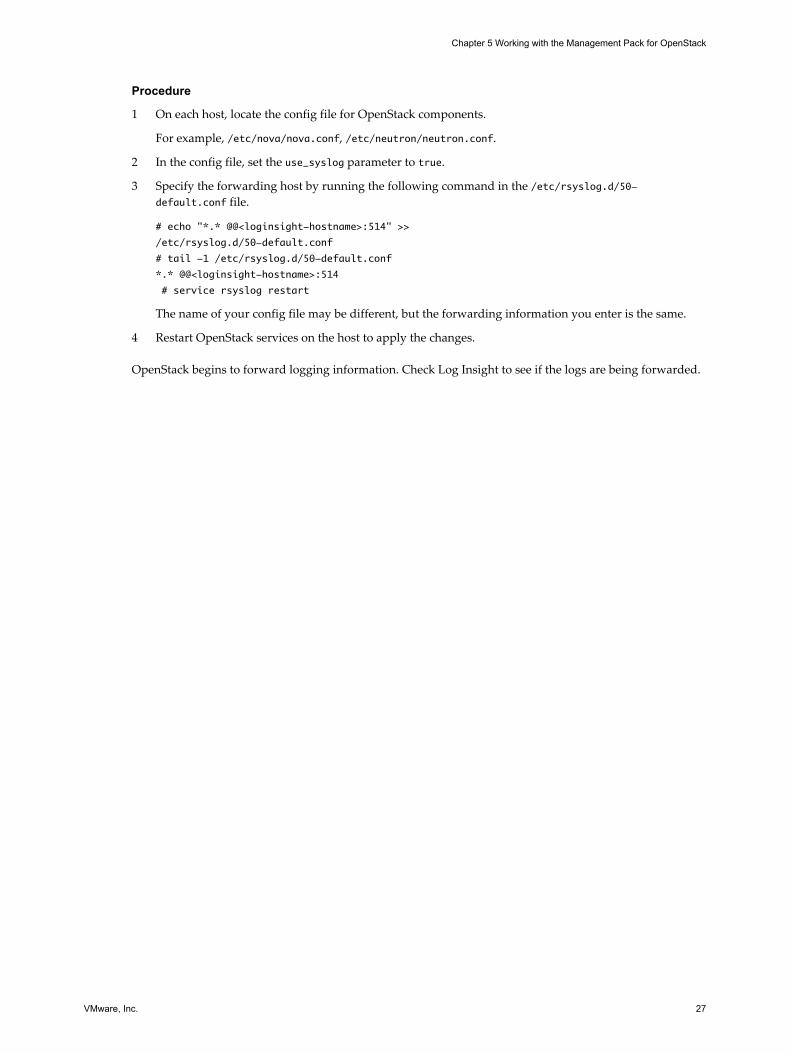
Procedure
1 On each host, locate the config file for OpenStack components.
For example, /etc/nova/nova.conf, /etc/neutron/neutron.conf.
2 In the config file, set the use_syslog parameter to true.
3 Specify the forwarding host by running the following command in the /etc/rsyslog.d/50-default.conf file.
# echo "*.* @@<loginsight-hostname>:514" >>
/etc/rsyslog.d/50-default.conf
# tail -1 /etc/rsyslog.d/50-default.conf
*.* @@<loginsight-hostname>:514
# service rsyslog restart
The name of your config file may be different, but the forwarding information you enter is the same.
4 Restart OpenStack services on the host to apply the changes.
OpenStack begins to forward logging information. Check Log Insight to see if the logs are being forwarded.
Chapter 5 Working with the Management Pack for OpenStack
VMware, Inc. 27

vRealize Operations Management Pack for OpenStack
28 VMware, Inc.
Management Pack for OpenStackAlert Definitions 6
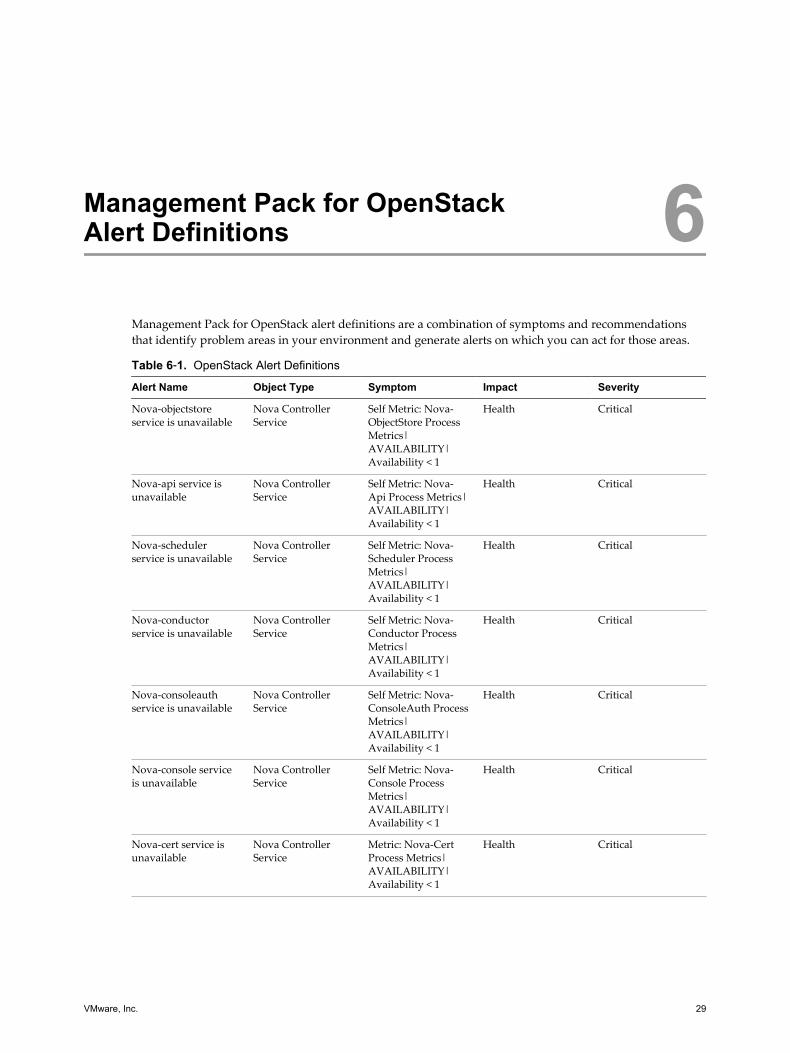
Management Pack for OpenStack alert definitions are a combination of symptoms and recommendationsthat identify problem areas in your environment and generate alerts on which you can act for those areas.
Table 6‑1. OpenStack Alert Definitions
Alert Name Object Type Symptom Impact Severity
Nova-objectstoreservice is unavailable
Nova ControllerService
Self Metric: Nova-ObjectStore ProcessMetrics|AVAILABILITY|Availability < 1
Health Critical
Nova-api service isunavailable
Nova ControllerService
Self Metric: Nova-Api Process Metrics|AVAILABILITY|Availability < 1
Health Critical
Nova-schedulerservice is unavailable
Nova ControllerService
Self Metric: Nova-Scheduler ProcessMetrics|AVAILABILITY|Availability < 1
Health Critical
Nova-conductorservice is unavailable
Nova ControllerService
Self Metric: Nova-Conductor ProcessMetrics|AVAILABILITY|Availability < 1
Health Critical
Nova-consoleauthservice is unavailable
Nova ControllerService
Self Metric: Nova-ConsoleAuth ProcessMetrics|AVAILABILITY|Availability < 1
Health Critical
Nova-console serviceis unavailable
Nova ControllerService
Self Metric: Nova-Console ProcessMetrics|AVAILABILITY|Availability < 1
Health Critical
Nova-cert service isunavailable
Nova ControllerService
Metric: Nova-CertProcess Metrics|AVAILABILITY|Availability < 1
Health Critical
VMware, Inc. 29

Table 6‑1. OpenStack Alert Definitions (Continued)
Alert Name Object Type Symptom Impact Severity
Nova-compute serviceis unavailable
Nova ControllerService
Self Metric: Nova-Compute ProcessMetrics|AVAILABILITY|Availability < 1
Health Critical
Nova-xvpvnc-proxyservice is unavailable
Nova ControllerService
Self Metric: Nova-XvpvncProxyProcess Metrics|AVAILABILITY|Availability < 1
Health Critical
Nova-novnc-proxyservice is unavailable
Nova ControllerService
Self Metric: Nova-NoVncProxy ProcessMetrics|AVAILABILITY|Availability < 1
Health Critical
Nova-network serviceis unavailable
Nova ControllerService
Self Metric: Nova-Network ProcessMetrics|AVAILABILITY|Availability < 1
Health Critical
One or more nova-apiservices areunavailable
OpenStack ComputeServices
Self Metric: Service|Nova:Nova-ApiRunning (%) <100
Health Warning
The majority of nova-api services areunavailable
OpenStack ComputeServices
Self Metric: Service|Nova:Nova-ApiRunning (%) <=50
Health Immediate
All nova-api servicesare unavailable
OpenStack ComputeServices
Self Metric:Service|Nova:Nova-ApiRunning (%) =0
Health Critical
One or more nova-certservices areunavailable
OpenStack ComputeServices
Self Metric:Service|Nova:Nova-Cert|Running (%) < 100
Health Warning
The majority of nova-cert services areunavailable
OpenStack ComputeServices
Self Metric:Service|Nova:Nova-Cert|Running (%) <= 50
Health Immediate
All nova-cert servicesare unavailable
OpenStack ComputeServices
Self Metric:Service|Nova:Nova-Cert|Running (%) = 0
Health Critical
One or more novacompute services areunavailable
OpenStack ComputeServices
Self Metric: Service|Nova:Nova-Compute|Running(%) < 100
Health Warning
The majority of nova-compute services areunavailable
OpenStack ComputeServices
Self Metric:Service|Nova:Nova-Compute|Running(%) <= 50
Health Immediate
All nova-computeservices areunavailable
OpenStack ComputeServices
Self Metric:Service|Nova:Nova-Compute|Running(%) = 0
Health Critical
vRealize Operations Management Pack for OpenStack
30 VMware, Inc.

Table 6‑1. OpenStack Alert Definitions (Continued)
Alert Name Object Type Symptom Impact Severity
One or more nova-conductor services areunavailable
OpenStack ComputeServices
Self Metric: Service|Nova:Nova-Conductor|Running(%) < 100
Health Warning
The majority of nova-conductor services areunavailable
OpenStack ComputeServices
Self Metric: Service|Nova:Nova-Conductor|Running(%) <= 50
Health Immediate
All nova-conductorservices areunavailable
OpenStack ComputeServices
Self Metric: Service|Nova:Nova-Conductor|Running(%) = 0
Health Critical
One or more nova-console services areunavailable
OpenStack ComputeServices
Self Metric: Service|Nova:Nova-Console|Running (%) < 100
Health Warning
The majority of nova-console services areunavailable
OpenStack ComputeServices
Self Metric: Service|Nova:Nova-Console|Running(%) <= 50
Health Immediate
All nova-consoleservices areunavailable
OpenStack ComputeServices
Self Metric:Service|Nova:Nova-ConsoleRunning (%)= 0
Health Critical
One or more nova-consoleauth servicesare unavailable
OpenStack ComputeServices
Self Metric: Service|Nova:Nova-ConsoleAuth|Running (%) < 100
Health Warning
The majority of nova-consoleauth servicesare unavailable
OpenStack ComputeServices
Self Metric:Service|Nova:Nova-ConsoleAuth|Running (%)<= 50
Health Immediate
All nova-consoleauthservices areunavailable
OpenStack ComputeServices
Self Metric: Service|Nova:Nova-ConsoleAuth|Running (%) =0
Health Critical
One or more nova-network services areunavailable
OpenStack ComputeServices
Self Metric: Service|Nova:Nova-Network|Running(%) < 100
Health Warning
The majority of nova-network services areunavailable
OpenStack ComputeServices
Self Metric: Service|Nova:Nova-Network|Running(%) <= 50
Health Immediate
All nova-networkservices areunavailable
OpenStack ComputeServices
Self Metric: Service|Nova:Nova-NetworkRunning(%) = 0
Health Critical
One or more nova-novnc-proxy servicesare unavailable
OpenStack ComputeServices
Self Metric: Service|Nova:Nova-NoVncProxy|Running (%) < 100
Health Warning
Chapter 6 Management Pack for OpenStack Alert Definitions
VMware, Inc. 31
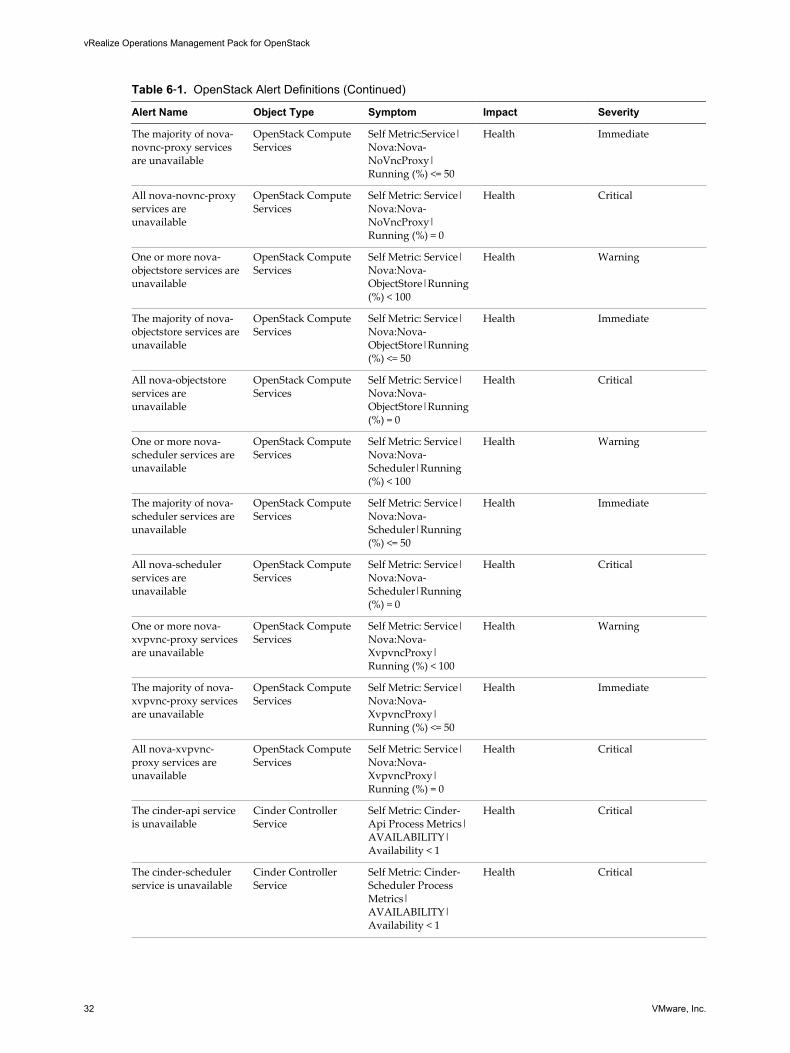
Table 6‑1. OpenStack Alert Definitions (Continued)
Alert Name Object Type Symptom Impact Severity
The majority of nova-novnc-proxy servicesare unavailable
OpenStack ComputeServices
Self Metric:Service|Nova:Nova-NoVncProxy|Running (%) <= 50
Health Immediate
All nova-novnc-proxyservices areunavailable
OpenStack ComputeServices
Self Metric: Service|Nova:Nova-NoVncProxy|Running (%) = 0
Health Critical
One or more nova-objectstore services areunavailable
OpenStack ComputeServices
Self Metric: Service|Nova:Nova-ObjectStore|Running(%) < 100
Health Warning
The majority of nova-objectstore services areunavailable
OpenStack ComputeServices
Self Metric: Service|Nova:Nova-ObjectStore|Running(%) <= 50
Health Immediate
All nova-objectstoreservices areunavailable
OpenStack ComputeServices
Self Metric: Service|Nova:Nova-ObjectStore|Running(%) = 0
Health Critical
One or more nova-scheduler services areunavailable
OpenStack ComputeServices
Self Metric: Service|Nova:Nova-Scheduler|Running(%) < 100
Health Warning
The majority of nova-scheduler services areunavailable
OpenStack ComputeServices
Self Metric: Service|Nova:Nova-Scheduler|Running(%) <= 50
Health Immediate
All nova-schedulerservices areunavailable
OpenStack ComputeServices
Self Metric: Service|Nova:Nova-Scheduler|Running(%) = 0
Health Critical
One or more nova-xvpvnc-proxy servicesare unavailable
OpenStack ComputeServices
Self Metric: Service|Nova:Nova-XvpvncProxy|Running (%) < 100
Health Warning
The majority of nova-xvpvnc-proxy servicesare unavailable
OpenStack ComputeServices
Self Metric: Service|Nova:Nova-XvpvncProxy|Running (%) <= 50
Health Immediate
All nova-xvpvnc-proxy services areunavailable
OpenStack ComputeServices
Self Metric: Service|Nova:Nova-XvpvncProxy|Running (%) = 0
Health Critical
The cinder-api serviceis unavailable
Cinder ControllerService
Self Metric: Cinder-Api Process Metrics|AVAILABILITY|Availability < 1
Health Critical
The cinder-schedulerservice is unavailable
Cinder ControllerService
Self Metric: Cinder-Scheduler ProcessMetrics|AVAILABILITY|Availability < 1
Health Critical
vRealize Operations Management Pack for OpenStack
32 VMware, Inc.

Table 6‑1. OpenStack Alert Definitions (Continued)
Alert Name Object Type Symptom Impact Severity
The cinder-volumeservice is unavailable
Cinder ControllerService
Self Metric: Cinder-Volume ProcessMetrics|AVAILABILITY|Availability < 1
Health Critical
The glance-api serviceis unavailable
Glance ControllerService
Self Metric: Glance-Api Process Metrics|AVAILABILITY|Availability < 1
Health Critical
The glance-registryservice is unavailable
Glance ControllerService
Self Metric: Glance-Registry ProcessMetrics|AVAILABILITY|Availability < 1
Health Critical
The swift-proxy-serverservice is unavailable
Swift ControllerService
Self Metric: Swift-Proxy-Server ProcessMetrics|AVAILABILITY|Availability < 1
Health Critical
The swift-account-server service isunavailable
Swift ControllerService
Self Metric: Swift-Account-ServerProcess Metrics|AVAILABILITYAvailability < 1
Health Critical
The swift-container-server service isunavailable
Swift ControllerService
Self Metric: Swift-Container-ServerProcess Metrics|AVAILABILITYAvailability < 1
Health Critical
The swift-object-serverservice is unavailable
Swift ControllerService
Self Metric: Swift-Object-ServerProcess Metrics|AVAILABILITY|Availability < 1
Health Critical
One or more cinder-api services areunavailable
OpenStack StorageServices
Self Metric: Service|Cinder:Cinder-Api|Running (%) < 100
Health Warning
The majority of cinder-api services areunavailable
OpenStack StorageServices
Self Metric: Service|Cinder:Cinder-Api|Running (%) <= 50
Health Immediate
All cinder-api servicesare unavailable
OpenStack StorageServices
Self Metric: Service|Cinder:Cinder-Api|Running (%) = 0
Health Critical
One or more cinder-scheduler services areunavailable
OpenStack StorageServices
Self Metric: Service|Cinder:Cinder-Scheduler|Running(%) < 100
Health Warning
The majority of cinder-scheduler services areunavailable
OpenStack StorageServices
Self Metric: Service|Cinder:Cinder-Scheduler|Running(%) <= 50
Health Immediate
All cinder-schedulerservices areunavailable
OpenStack StorageServices
Self Metric: Service|Cinder:Cinder-Scheduler|Running(%) = 0
Health Critical
Chapter 6 Management Pack for OpenStack Alert Definitions
VMware, Inc. 33

Table 6‑1. OpenStack Alert Definitions (Continued)
Alert Name Object Type Symptom Impact Severity
One or more cinder-volume services areunavailable
OpenStack StorageServices
Self Metric: Service|Cinder:Cinder-Volume|Running(%) < 100
Health Warning
The majority of cinder-volume services areunavailable
OpenStack StorageServices
Self Metric: Service|Cinder:Cinder-Volume|Running(%) <= 50
Health Immediate
All cinder-volumeservices areunavailable
OpenStack StorageServices
Self Metric: Service|Cinder:Cinder-Volume|Running(%) = 0
Health Critical
One or more glance-api services areunavailable
OpenStack StorageServices
Self Metric: Service|Glance:Glance-Api|Running (%) < 100
Health Warning
The majority ofglance-api services areunavailable
OpenStack StorageServices
Self Metric: Service|Glance:Glance-Api|Running (%) <= 50
Health Immediate
All glance-api servicesare unavailable
OpenStack StorageServices
Self Metric: Service|Glance:Glance-Api|Running (%) = 0
Health Critical
One or more glance-registry services areunavailable
OpenStack StorageServices
Self Metric: Service|Glance:Glance-Registry|Running(%) < 100
Health Warning
The majority ofglance-registryservices areunavailable
OpenStack StorageServices
Self Metric: Service|Glance:Glance-Registry|Running(%) <= 50
Health Immediate
All glance-registryservices areunavailable
OpenStack StorageServices
Self Metric: Service|Glance:Glance-Registry|Running(%) = 0
Health Critical
One or more swift-account-serverservices areunavailable
OpenStack StorageServices
Self Metric: Service|Swift:Swift-Account-Server|Running (%)< 100
Health Warning
The majority of swift-account-serverservices areunavailable
OpenStack StorageServices
Self Metric: Service|Swift:Swift-Account-Server|Running (%)<= 50
Health Immediate
All swift-account-server services areunavailable
OpenStack StorageServices
Self Metric: Service|Swift:Swift-Account-Server|Running (%)= 0
Health Critical
One or more swift-container-serverservices areunavailable
OpenStack StorageServices
Self Metric: Service|Swift:Swift-Container-Server|Running (%) < 100
Health Warning
The majority of swift-container-serverservices areunavailable
OpenStack StorageServices
Self Metric: Service|Swift:Swift-Container-Server|Running (%) <= 50
Health Immediate
vRealize Operations Management Pack for OpenStack
34 VMware, Inc.

Table 6‑1. OpenStack Alert Definitions (Continued)
Alert Name Object Type Symptom Impact Severity
All swift-container-server services areunavailable
OpenStack StorageServices
Self Metric: Service|Swift:Swift-Container-Server|Running (%) = 0
Health Critical
One or more swift-object-server servicesare unavailable
OpenStack StorageServices
Self Metric: Service|Swift:Swift-Object-Server|Running (%)< 100
Health Warning
The majority of swift-object-server servicesare unavailable
OpenStack StorageServices
Self Metric: Service|Swift:Swift-Object-Server|Running (%)<= 50
Health Immediate
All swift-object-serverservices areunavailable
OpenStack StorageServices
Self Metric: Service|Swift:Swift-Object-Server|Running (%)= 0
Health Critical
One or more swift-proxy-server servicesare unavailable
OpenStack StorageServices
Self Metric: Service|Swift:Swift-Proxy-Server|Running (%)< 100
Health Warning
The majority of swift-proxy-server servicesare unavailable
OpenStack StorageServices
Self Metric: Service|Swift:Swift-Proxy-Server|Running (%)<= 50
Health Immediate
All swift-proxy-serverservices areunavailable
OpenStack StorageServices
Self Metric: Service|Swift:Swift-Proxy-Server|Running (%)= 0
Health Critical
The neutron-serverservice is unavailable
Neutron ControllerService
Self Metric: Neutron-Server ProcessMetrics|AVAILABILITY|Availability < 1
Health Critical
One or more neutron-server services areunavailable
OpenStack NetworkServices
Self Metric: Service|Neutron:Neutron-Server|Running (%)< 100
Health Warning
The majority ofneturon-serverservices areunavailable
OpenStack NetworkServices
Self Metric: Service|Neutron:Neutron-Server|Running (%)<= 50
Health Immediate
All neutron-serverservices areunavailable
OpenStack NetworkServices
Self Metric: Service|Neutron:Neutron-Server|Running (%)= 0
Health Critical
The keystone-all-service is unavailable
KeyStone ControllerService
Self Metric:Keystone-All ProcessMetrics|AVAILABILITY|Availability < 1
Health Critical
The mySQL databaseservice is unavailable
mySQL Self Metric:AVAILABILITY|Availability< 1
Health Critical
Chapter 6 Management Pack for OpenStack Alert Definitions
VMware, Inc. 35

Table 6‑1. OpenStack Alert Definitions (Continued)
Alert Name Object Type Symptom Impact Severity
The Apache server isunavailable
Apache Self Metric:AVAILABILITY|Availability< 1
Health Critical
The Rabbit Messagingservice is unavailable
RabbitMQ SelfMetric:AVAILABILITY|Availability< 1
Health Critical
The memcachedservice is unavailable
Memcached Self Metric:AVAILABILITY|Availability< 1
Health Critical
One or more keystone-all services areunavailable
OpenStackManagementServices
Self Metric: Service|Keystone:Keystone-All|Running (%) <100
Health Warning
The majority ofkeystone-all servicesare unavailable
OpenStackManagementServices
Self Metric: Service|Keystone:Keystone-All|Running (%) <=50
Health Immediate
All keystone-allservices areunavailable
OpenStackManagementServices
Self Metric: Service|Keystone:Keystone-All|Running (%) = 0
Health Critical
One or more mySQLservices areunavailable
OpenStackManagementServices
Self Metric: Service|MySQL|Running (%)< 100
Health Warning
The majority ofmySQL services areunavailable
OpenStackManagementServices
Self Metric: Service|MySQL|Running (%)<= 50
Health Immediate
All mySQL servicesare unavailable
OpenStackManagementServices
Self Metric: Service|MySQL|Running (%)= 0
Health Critical
One or more Apacheservices areunavailable
OpenStackManagementServices
Self Metric: Service|Apache|Running (%)< 100
Health Warning
The majority ofApache services areunavailable
OpenStackManagementServices
Self Metric: Service|Apache|Running (%)<= 50
Health Immediate
All Apache servicesare unavailable
OpenStackManagementServices
Self Metric: Service|Apache|Running (%)= 0
Health Critical
One or moreRabbitMQ services areunavailable
OpenStackManagementServices
Self Metric: Service|RabbitMQ|Running(%) < 100
Health Warning
The majority ofRabbitMQ services areunavailable
OpenStackManagementServices
Self Metric: Service|RabbitMQ|Running(%) <= 50
Health Immediate
All RabbitMQ servicesare unavailable
OpenStackManagementServices
Self Metric: Service|RabbitMQ|Running(%) = 0
Health Critical
One or moreMemcached servicesare unavailable
OpenStackManagementServices
Self Metric: Service|Memcached|Running (%) < 100
Health Warning
vRealize Operations Management Pack for OpenStack
36 VMware, Inc.

Table 6‑1. OpenStack Alert Definitions (Continued)
Alert Name Object Type Symptom Impact Severity
The majority ofMemcached servicesare unavailable
OpenStackManagementServices
Self Metric: Service|Memcached|Running (%) <= 50
Health Immediate
All Memcachedservices areunavailable
OpenStackManagementServices
Self Metric: Service|Memcached|Running (%) = 0
Health Critical
Virtual Machine isreporting an errorstatus
Non-ESX VirtualMachine
Self Metric: Status|Availability < 1
Health Critical
Logical Switch isreporting an errorstatus
OpenStack LogicalSwitch
Self Metric: Status|Availability < 1
Health Critical
One or more ports onthe Logical Switch aredown
OpenStack LogicalSwitch
Self Metric: Port|Status = DOWN
Health Critical
External LogicalSwitch is reporting anerror status
OpenStack ExternalLogical Switch
Self Metric: Status|Availability < 1
Health Critical
One or more ports onthe external LogicalSwitch are down
OpenStack ExternalLogical Switch
Self Metric: Port|Status = DOWN
Health Critical
Logical Router isreporting an errorstatus
OpenStack LogicalRouter
Self Metric: Status|Availability < 1
Health Critical
One or more ports onthe Logical Router aredown
OpenStack LogicalRouter
Self Metric: Port|Status = DOWN
Health Critical
One or moreprovisioned resourcesare reporting an errorstatus
OpenStack Tenant Child (VirtualMachine) Metric:Status|Availability <1Child (LogicalSwitch) Metric:Status|Availability <1Child (ExternalLogical Switch)Metric: Status|Availability < 1Child (LogicalRouter) Metric:Status|Availability <1
Health Critical
Tenant is currentlydisabled
OpenStack Tenant Self Metric: Status|Availability < 1
Health Warning
Chapter 6 Management Pack for OpenStack Alert Definitions
VMware, Inc. 37
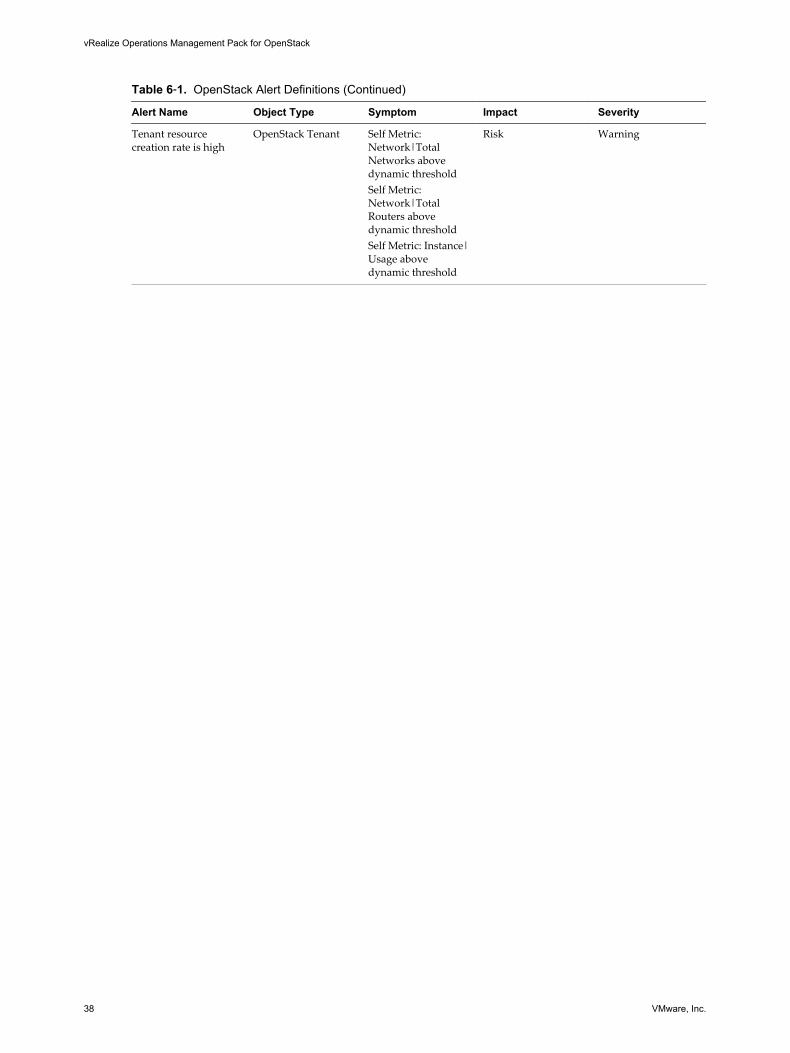
Table 6‑1. OpenStack Alert Definitions (Continued)
Alert Name Object Type Symptom Impact Severity
Tenant resourcecreation rate is high
OpenStack Tenant Self Metric:Network|TotalNetworks abovedynamic thresholdSelf Metric:Network|TotalRouters abovedynamic thresholdSelf Metric: Instance|Usage abovedynamic threshold
Risk Warning
vRealize Operations Management Pack for OpenStack
38 VMware, Inc.

Table 6‑1. OpenStack Alert Definitions (Continued)
Alert Name Object Type Symptom Impact Severity
Tenant is approachingtheir quota
OpenStack Tenant 1 Warninga Self Metric:
Instance|Usage (%)>=85
b Self Metric:CPU|Usage(%)>= 85
c Self Metric:Memory|Usage (%)>=85
d Self Metric:Floating IP|Usage (%)>=85
e Self Metric:SecurityGroup|Usage (%)>=85
2 Immediatea Self Metric:
Instance|Usage (%)>=90
b Self Metric:CPU|Usage(%)>= 90
c Self Metric:Memory|Usage (%)>=90
d Self Metric:Floating IP|Usage (%)>=90
e Self Metric:SecurityGroup|Usage (%)>=90
3 Criticala Self Metric:
Instance|Usage (%)>=95
b Self Metric:CPU|Usage(%)>= 95
c Self Metric:Memory|Usage (%) >=95
d Self Metric:Floating IP|Usage (%)>=95
Risk 1 Warning2 Immediate3 Critical
Chapter 6 Management Pack for OpenStack Alert Definitions
VMware, Inc. 39

Table 6‑1. OpenStack Alert Definitions (Continued)
Alert Name Object Type Symptom Impact Severity
e Self Metric:SecurityGroup|Usage (%)>=95
Computeinfrastructure isapproaching capacity
OpenStack ComputeInfrastructure
1 Warninga Self Metric:
Memory|Demand(%)<= 70
b SelfMetric :DiskSpace|Usage(%)<= 70
2 Immediatea Self Metric:
Memory|Demand(%)<= 80
b Self Metric:Disk Space|Usage (%)<=80
3 Criticala Self Metric:
Memory|Demand(%)<= 90
b Self Metric:Disk Space|Usage (%)<=90
Risk 1 Warning2 Immediate3 Critical
vRealize Operations Management Pack for OpenStack
40 VMware, Inc.

Table 6‑1. OpenStack Alert Definitions (Continued)
Alert Name Object Type Symptom Impact Severity
Host is approachingcapacity
Host System 1 Warninga Self Metric:
Memory|Usage (%)<=85
b SelfMetric :DiskSpace|Demand|Workload(%)<= 85
2 Immediatea Self Metric:
Memory|Usage (%)<=90
b Self Metric:Disk Space|Demand|Workload(%)<= 90
3 Criticala Self Metric:
Memory|Usage (%)<=95
b Self Metric:Disk Space|Demand|Workload(%)<= 95
Risk 1 Warning2 Immediate3 Critical
Host is approachingcapacity
Non-ESX HostSystem
1 Warninga Self Metric:
Memory|Usage (%)<=85
b SelfMetric :Disk|Usage (%)<=85
2 Immediatea Self Metric:
Memory|Usage (%)<=90
b Self Metric:Disk|Usage(%)<= 90
3 Criticala Self Metric:
Memory|Usage (%)<=95
b Self Metric:Disk|Usage(%)<= 95
Risk 1 Warning2 Immediate3 Critical
Chapter 6 Management Pack for OpenStack Alert Definitions
VMware, Inc. 41

Table 6‑1. OpenStack Alert Definitions (Continued)
Alert Name Object Type Symptom Impact Severity
Storage infrastructureis approachingcapacity
OpenStack StorageInfrastructure
1 Warninga Self Metric:
Capacity|Usage (%)<=70
2 Immediatea Self Metric:
Capacity|Usage (%)<=80
3 Criticala Self Metric:
Capacity|Usage (%)<=90
Risk 1 Warning2 Immediate3 Critical
Neutron-DHCP-agentservice is unavailable
Neutron ControllerService
Self Metric: Neutron-Dhcp-Agent ProcessMetrics|AVAILABILITY|Availability <
Health Critical
Neutron-l3-agentservice is unavailable
Neutron ControllerService
Self Metric: Neutron-L3-Agent ProcessMetrics|AVAILABILITY|Availability < 1
Health Critical
Neutron-metadata-agent service isunavailable
Neutron ControllerService
Self Metric: Neutron-Metadata-AgentProcess Metrics|AVAILABILITY|Availability < 1
Health Critical
Neutron-lbaas-agentservice is unavailable
Neutron ControllerService
Self Metric: Neutron-Lbaas-Agent ProcessMetrics|AVAILABILITY|Availability < 1
Health Critical
Neutron-openvswitch-agent service isunavailable
Neutron ControllerService
Self Metric: Neutron-Openvswitch-AgentProcess Metrics|AVAILABILITY|Availability < 1
Health Critical
One or more neutron-DHCP-agent servicesare unavailable
OpenStack NetworkServices
Self Metric: Service|Neutron:Neutron-Dhcp-Agent|Running (%) < 100
Health Warning
The majority ofneutron-dhcp-agentservices areunavailable
OpenStack NetworkServices
Self Metric: Service|Neutron:Neutron-Dhcp-Agent|Running (%) <= 50
Health Immediate
All neutron-dhcp-agent services areunavailable
OpenStack NetworkServices
Self Metric: Service|Neutron:Neutron-Dhcp-Agent|Running (%) = 0
Health Critical
One or more neutron-l3-agent services areunavailable
OpenStack NetworkServices
Self Metric: Service|Neutron:Neutron-L3-Agent|Running(%) < 100
Health Warning
vRealize Operations Management Pack for OpenStack
42 VMware, Inc.

Table 6‑1. OpenStack Alert Definitions (Continued)
Alert Name Object Type Symptom Impact Severity
The majority ofneutron-l3-agentservices areunavailable
OpenStack NetworkServices
Self Metric: Service|Neutron:Neutron-L3-Agent|Running(%) <= 50
Health Immediate
All neutron-l3-agentservices areunavailable
OpenStack NetworkServices
Self Metric: Service|Neutron:Neutron-L3-Agent|Running(%) = 0
Health Critical
One or more neutron-metadata-agentservices areunavailable
OpenStack NetworkServices
Self Metric: Service|Neutron:Neutron-Metadata-Agent|Running (%) < 100
Health Warning
The majority ofneutron-metadata-agent services areunavailable
OpenStack NetworkServices
Self Metric: Service|Neutron:Neutron-Metadata-Agent|Running (%) <= 50
Health Immediate
All neutron-metadata-agent services areunavailable
OpenStack NetworkServices
Self Metric: Service|Neutron:Neutron-Metadata-Agent|Running (%) = 0
Health Critical
One or more neutron-lbaas-agent servicesare unavailable
OpenStack NetworkServices
Self Metric: Service|Neutron:Neutron-Lbaas-Agent|Running (%) < 100
Health Warning
The majority ofneutron-lbaas-agentservices areunavailable
OpenStack NetworkServices
Self Metric: Service|Neutron:Neutron-Lbaas-Agent|Running (%) <= 50
Health Immediate
All neutron-lbaas-agent services areunavailable
OpenStack NetworkServices
Self Metric: Service|Neutron:Neutron-Lbaas-Agent|Running (%) = 0
Health Critical
One or more neutron-openvswitch-agentservices areunavailable
OpenStack NetworkServices
Self Metric: Service|Neutron:Neutron-Openvswitch-Agent|Running (%) < 100
Health Warning
The majority ofneutron-openvswitch-agent services areunavailable
OpenStack NetworkServices
Self Metric: Service|Neutron:Neutron-Openvswitch-Agent|Running (%) <= 50
Health Immediate
All neutron-openvswitch-agentservices areunavailable
OpenStack NetworkServices
Self Metric: Service|Neutron:Neutron-Openvswitch-Agent|Running (%) = 0
Health Critical
Chapter 6 Management Pack for OpenStack Alert Definitions
VMware, Inc. 43

vRealize Operations Management Pack for OpenStack
44 VMware, Inc.

Management Pack for OpenStackCapacity Models 7
An object's capacity model, combined with policy settings, is used to determine the value of all badges andsub-badges aside from Health.
The Management Pack for OpenStack capacity model tables describe the capacity models that have beendefined for each object type.
OpenStack Compute InfrastructureThe capacity of the Compute Infrastructure is represented by the aggregated capacity of all hosts andclusters registered with OpenStack
Table 7‑1. OpenStack Compute Infrastructure Capacity Model
Container Description Use in Workload
Memory Aggregate amount of physical memory usedacross all hosts and clusters that are registeredwith OpenStack.
Yes
Disk Space Aggregate amount of local disk space usedacross all hosts and clusters that are registeredwith OpenStack.
Yes
OpenStack Storage InfrastructureThe capacity of the Storage Infrastructure is represented by the aggregated capacity of all vCenter datastoreswith OpenStack.
Table 7‑2. OpenStack Storage Infrastructure Capacity Model
Container Description Use in Workload
Datastore|Outstanding IORequests
Aggregate number of outstanding I/O requestsacross all vCenter datatores that are registeredwith OpenStack. The capacity for this containeruses a maximum observed value approach.
Yes
Datastore|Reads per second Aggregate rate of reads across all vCenterdatastore that are registered with OpenStack.The capacity for this container uses a maximumobserved value approach.
Yes
Datastore|Writes per second Aggregate rate of writes across all vCenterdatastores that are registered with OpenStack.The capacity for this container uses a maximumobserved value approach.
Yes
VMware, Inc. 45

Table 7‑2. OpenStack Storage Infrastructure Capacity Model (Continued)
Container Description Use in Workload
Datastore|Read Rate Aggregate rate of data read across all vCenterdatastores that are registered with OpenStack.The capacity for this container uses a maximumobserved value approach.
Yes
Datastore|Write Rate Aggregate rate of data written across all vCenterdatastores that are registered with OpenStack.The capacity for this container uses a maximumobserved value approach.
Yes
Disk Space|Usage Aggregate amount of local disk space usedacross all hosts and clusters that are registeredwith OpenStack.
Yes
OpenStack TenantThe capacity of a Tenant represents the number of provisioned objects relative to the configured quota.
Table 7‑3. OpenStack Tenant Capacity Model
Container Description Use in Workload
Instance Number of virtual machines provisioned by thetenant compared to the quota.
No
CPU Number of virtual CPUs provisioned across allvirtual machines by the tenant compared to thequota.
No
Memory Amount of vRAM provisioned across all virtualmachines by the tenant compared to the quota.
No
Floating IP Number of floating IPs provisioned by the tenantcompared to the quota.
No
Security Group Number of security groups provisioned by thetenant compared to the quota.
No
Non-ESX Host
Table 7‑4. Non-ESX Host Capacity Model
Container Description Use in Workload
Memory Amount of physical memory used by the host. Yes
Disk Amount of local disk space used by the host. Yes
Capacity ModelsCapacity models have not been defined for the following objects.
n OpenStack Network Infrastructure
n OpenStack Compute Services
n OpenStack Network Services
n OpenStack Storage Services
n OpenStack Management Services
vRealize Operations Management Pack for OpenStack
46 VMware, Inc.

n OpenStack Logical Switch
n OpenStack External Logical Switch
n OpenStack Logical Router
n Non-ESX Virtual Machine
Chapter 7 Management Pack for OpenStack Capacity Models
VMware, Inc. 47

vRealize Operations Management Pack for OpenStack
48 VMware, Inc.

Management Pack for OpenStackObject Model 8OpenStack Objects and Metrics
Metrics have not been defined for the following objects.
n OpenStackNetwork Infrastructure
OpenStack Compute Infrastructure
Table 8‑1. OpenStack Compute Infrastructure Metrics
Name Category Type Unit Description Instanced
ProvisionedCapacity
Memory Metric GB Total physicalmemory capacityof all Hostsregistered withOpenStack.
No
Usable Capacity Memory Metric GB Total physicalmemory capacityof all Hostsregistered withOpenStack,minus thememoryoverhead.
No
Usage Memory Metric GB Total amount ofphysical memorybeing usedacross all Hostsregistered withOpenStack.
No
Usage Memory Metric % Percentage ofphysical memorybeing usedacross all Hostsregistered withOpenStack
No
Demand Memory Metric GB Total amount ofphysical memorybeing demandedacross all Hostsregistered withOpenStack
No
VMware, Inc. 49

Table 8‑1. OpenStack Compute Infrastructure Metrics (Continued)
Name Category Type Unit Description Instanced
Demand Memory Metric % Percentage ofphysical memorybeing demandedacross all Hostsregistered withOpenStack
No
OpenStackInstance Usage
Memory Metric GB Total amount ofphysical amountmemory beingused byOpenStackinstances acrossall hostsregistered withOpenStack.
No
OpenStackInstance Usage
Memory Metric % Percentage ofphysical memorybeing used byOpenStackinstances acrossall hostsregistered withOpenStack.
No
ProvisionedCapacity
Disk Space Metric GB Total disk spacecapacity of allHosts registeredwith OpenStack
No
Usage Disk Space Metric GB Total amount ofdisk space beingused across allHosts registeredwith OpenStack
No
Usage Disk Space Metric % Percentage ofdisk space beingused across allHosts registeredwith OpenStack
No
OpenStackInstance Usage
Disk Space Metric GB Total amount ofdisk space beingused byOpenStackinstances acrossall hostsregistered withOpenStack
No
OpenStackinstance Usage
Disk Space Metric % Percentage ofdisk space beingused byOpenStackinstances acrossall Hostsregistered withOpenStack
No
vRealize Operations Management Pack for OpenStack
50 VMware, Inc.
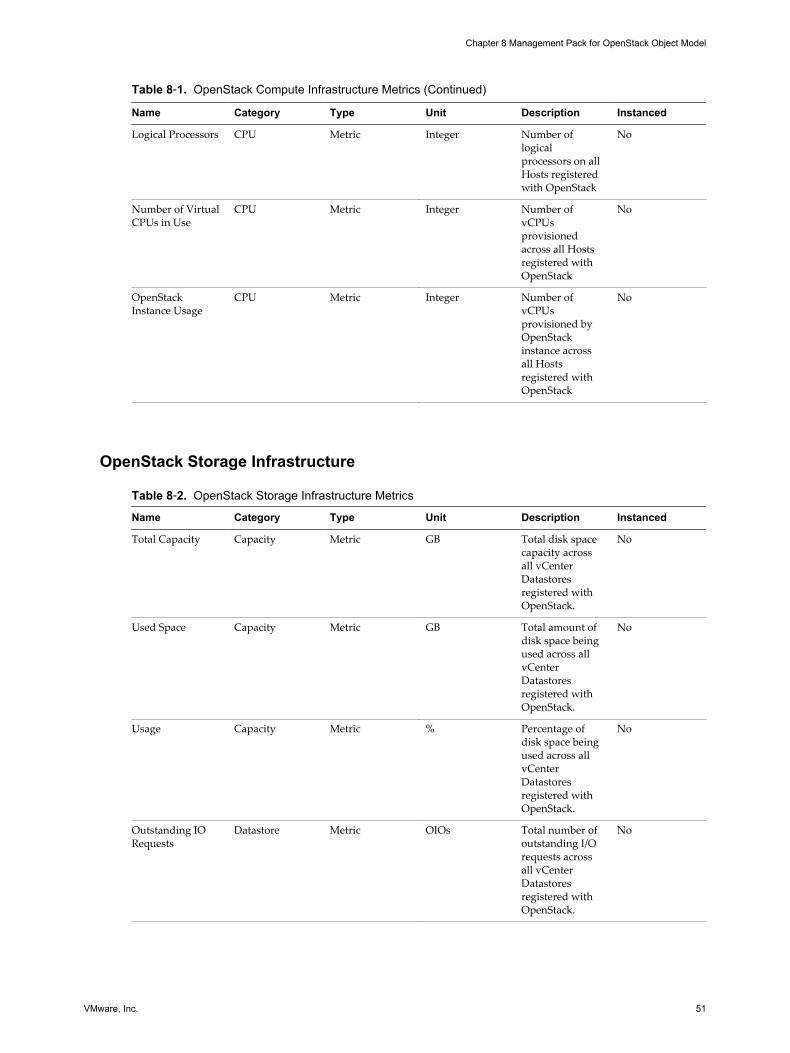
Table 8‑1. OpenStack Compute Infrastructure Metrics (Continued)
Name Category Type Unit Description Instanced
Logical Processors CPU Metric Integer Number oflogicalprocessors on allHosts registeredwith OpenStack
No
Number of VirtualCPUs in Use
CPU Metric Integer Number ofvCPUsprovisionedacross all Hostsregistered withOpenStack
No
OpenStackInstance Usage
CPU Metric Integer Number ofvCPUsprovisioned byOpenStackinstance acrossall Hostsregistered withOpenStack
No
OpenStack Storage Infrastructure
Table 8‑2. OpenStack Storage Infrastructure Metrics
Name Category Type Unit Description Instanced
Total Capacity Capacity Metric GB Total disk spacecapacity acrossall vCenterDatastoresregistered withOpenStack.
No
Used Space Capacity Metric GB Total amount ofdisk space beingused across allvCenterDatastoresregistered withOpenStack.
No
Usage Capacity Metric % Percentage ofdisk space beingused across allvCenterDatastoresregistered withOpenStack.
No
Outstanding IORequests
Datastore Metric OIOs Total number ofoutstanding I/Orequests acrossall vCenterDatastoresregistered withOpenStack.
No
Chapter 8 Management Pack for OpenStack Object Model
VMware, Inc. 51

Table 8‑2. OpenStack Storage Infrastructure Metrics (Continued)
Name Category Type Unit Description Instanced
Max ObservedNumber ofOutstanding IOOperations
Datastore Metric OIOs Maximumobservednumber of I/Orequests acrossall vCenterDatastoresregistered withOpenStack.
No
Reads per Second Datastore Metric IOPs Total rate of readcommandsissued across allvCenterDatastoresregistered withOpenStack.
No
Max ObservedReads per Second
Datastore Metric IOPS Maximumobserved rate ofread commandsissued across allvCenterDatastoresregistered withOpenStack.
No
Writes per Second Datastore Metric IOPS Total rate ofwrite commandsissued across allvCenterDatastoresregistered withOpenStack.
No
Max ObservedWrites per Second
Datastore Metric IOPS Maximumobserved rate ofwrite commandsissued across allvCenterDatastoresregistered withOpenStack.
No
Read Rate Datastore Metric KBps Total rate of dataread across allvCenterDatastoresregistered withOpenStack.
No
Max ObservedRead Rate
Datastore Metric KBps Maximumobserved rate ofdata read acrossall vCenterDatastoresregistered withOpenStack.
No
vRealize Operations Management Pack for OpenStack
52 VMware, Inc.

Table 8‑2. OpenStack Storage Infrastructure Metrics (Continued)
Name Category Type Unit Description Instanced
Write Rate Datastore Metric KBps Total rate of datawritten across allvCenterDatastoresregistered withOpenStack.
No
Max ObservedWrite Rate
Datastore Metric KBps Maximumobserved rate ofdata writtenacross allvCenterDatastoresregistered withOpenStack.
No
OpenStack Compute Services
Table 8‑3. OpenStack Compute Services Metrics
Name Category Type Unit Description Instanced
Configured Service Metric Integer Total number ofNova servicesconfigured in theOpenStackdeployment.
No
Running Service Metric Integer Number of Novaservices that arecurrentlyrunning in theOpenStackdeployment.
No
Running Service Metric % Percentage ofNova servicesthat are currentlyrunning in theOpenStackdeployment.
No
Configured Service|Nova Metric Integer Number ofinstances of eachNova serviceconfigured in theOpenStackdeployment.
Yes
Chapter 8 Management Pack for OpenStack Object Model
VMware, Inc. 53

Table 8‑3. OpenStack Compute Services Metrics (Continued)
Name Category Type Unit Description Instanced
Running Service|Nova Metric Integer Number ofinstances of eachNova servicecurrentlyrunning in theOpenStackdeployment.
Yes
Running Service|Nova Metric % Percentage ofinstances of eachNova servicecurrentlyrunning in theOpenStackdeployment.
Yes
OpenStack Network Services
Table 8‑4. OpenStack Network Services Metrics
Name Category Type Unit Description Instanced
Configured Service Metric Integer Total number ofNeutron servicesconfigured in theOpenStackdeployment.
No
Running Service Metric Integer Number ofNeutron servicesthat are currentlyrunning in theOpenStackdeployment.
No
Running Service Metric % Percentage ofNeutron servicesthat are currentlyrunning in theOpenStackdeployment.
No
Configured Service|Neutron Metric Integer Number ofinstances of eachNeutron serviceconfigured in theOpenStackdeployment.
Yes
vRealize Operations Management Pack for OpenStack
54 VMware, Inc.

Table 8‑4. OpenStack Network Services Metrics (Continued)
Name Category Type Unit Description Instanced
Running Service|Neutron Metric Integer Number ofinstances of eachNeutron servicecurrentlyrunning in theOpenStackdeployment.
Yes
Running Service|Neutron Metric % Percentage ofinstances of eachNeutron servicecurrentlyrunning in theOpenStackdeployment.
Yes
OpenStack Storage Services
Table 8‑5. OpenStack Storage Services Metrics
Name Category Type Unit Description Instanced
Configured Service Metric Integer Total number ofCinder, Glance,and Swiftservicesconfigured in theOpenStackdeployment.
No
Running Service Metric Integer Number ofCinder, Glance,and Swiftservices that arecurrentlyrunning in theOpenStackdeployment.
No
Running Service Metric % Percentage ofCinder, Glance,and Swiftservices that arecurrentlyrunning in theOpenStackdeployment..
No
Configured Service|Cinder Metric Integer Number ofinstances of eachCinder serviceconfigured in theOpenStackdeployment.
Yes
Running Service|Cinder Metric Integer Number ofinstances of eachCinder servicecurrentlyrunning in theOpenStackdeployment.
Yes
Chapter 8 Management Pack for OpenStack Object Model
VMware, Inc. 55

Table 8‑5. OpenStack Storage Services Metrics (Continued)
Name Category Type Unit Description Instanced
Running Service|Cinder Metric % Percentage ofinstances of eachCinder servicecurrentlyrunning in theOpenStackdeployment.
Yes
Configured Service|Glance Metric Integer Number ofinstances of eachGlance serviceconfigured in theOpenStackdeployment.
Yes
Running Service|Glance Metric Integer Number ofinstances of eachGlance servicecurrentlyrunning in theOpenStackdeployment.
Yes
Running Service|Glance Metric % Percentage ofinstances of eachGlance servicecurrentlyrunning in theOpenStackdeployment.
Yes
Configured Service|Swift Metric Integer Number ofinstances of eachSwift serviceconfigured in theOpenStackdeployment.
Yes
Running Service|Swift Metric Integer Number ofinstances of eachSwift servicecurrentlyrunning in theOpenStackdeployment.
Yes
Running Service|Swift Metric % Percentage ofinstances of eachSwift servicecurrentlyrunning in theOpenStackdeployment.
Yes
vRealize Operations Management Pack for OpenStack
56 VMware, Inc.

OpenStack Management Services
Table 8‑6. OpenStack Management Services Metrics
Name Category Type Unit Description Integer
Configured Service Metric Integer Total number ofmanagementservicesconfigured in theOpenStackdeployment.
No
Running Service Metric Integer Number ofmanagementservices that arecurrentlyrunning in theOpenStackdeployment.
No
Running Service Metric % Percentage ofmanagementservices that arecurrentlyrunning in theOpenStackdeployment.
No
Configured Service|KeyStone
Metric Integer Number ofinstances of eachKeyStone serviceconfigured in theOpenStackdeployment.
Yes
Running Service|KeyStone
Metric Integer Number ofinstances of eachKeyStone servicecurrentlyrunning in theOpenStackdeployment.
Yes
Running Service|KeyStone
Metric % Percentage ofinstances of eachKeyStone servicecurrentlyrunning in theOpenStackdeployment.
Yes
Configured Service|Ceilometer
Metric Integer Number ofinstances of eachCeilometerserviceconfigured in theOpenStackdeployment.
Yes
Running Service|Ceilometer
Metric Integer Number ofinstances of eachCeilometerservice currentlyrunning in theOpenStackdeployment.
Yes
Chapter 8 Management Pack for OpenStack Object Model
VMware, Inc. 57

Table 8‑6. OpenStack Management Services Metrics (Continued)
Name Category Type Unit Description Integer
Running Service|Ceilometer
Metric % Percentage ofinstances of eachCeilometerserviceconfigured in theOpenStackdeployment.
Yes
Configured Service|MySQL Metric Integer Number ofMySQL servicesconfigured in theOpenStackdeployment.
Yes
Running Service|MySQL Metric Integer Number ofMySQL servicesthat are currentlyrunning in theOpenStackdeployment.
Yes
Running Service|MySQL Metric % Percentage ofMySQL servicesthat are currentlyrunning in theOpenStackdeployment.
Yes
Configured Service|Apache Metric Integer Number ofApache servicesconfigured in theOpenStackdeployment.
Yes
Running Service|Apache Metric Integer Number ofApache servicesthat are currentlyrunning in theOpenStackdeployment.
Yes
Running Service|Apache Metric % Percentage ofApache servicesthat are currentlyrunning in theOpenStackdeployment.
Yes
Configured Service|RabbitMQ
Metric Integer Number ofRabbitMQservicesconfigured in theOpenStackdeployment.
Yes
Running Service|RabbitMQ
Metric Integer Number ofRabbitMQservices that arecurrentlyrunning in theOpenStackdeployment.
Yes
vRealize Operations Management Pack for OpenStack
58 VMware, Inc.
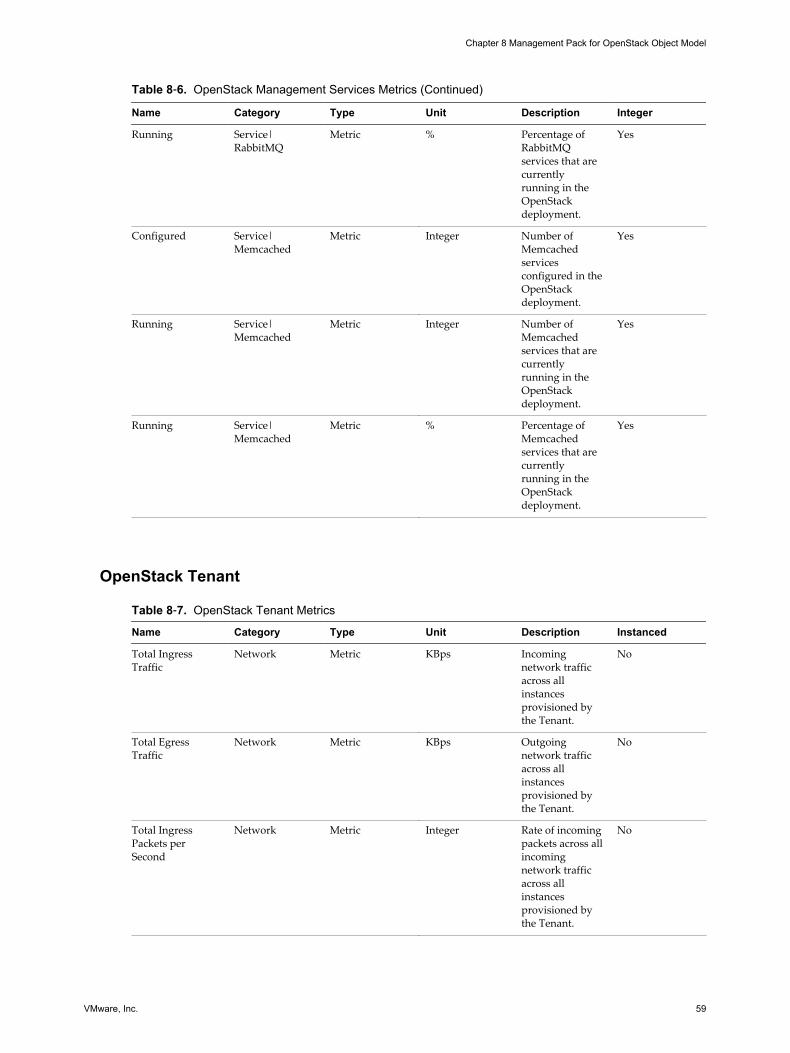
Table 8‑6. OpenStack Management Services Metrics (Continued)
Name Category Type Unit Description Integer
Running Service|RabbitMQ
Metric % Percentage ofRabbitMQservices that arecurrentlyrunning in theOpenStackdeployment.
Yes
Configured Service|Memcached
Metric Integer Number ofMemcachedservicesconfigured in theOpenStackdeployment.
Yes
Running Service|Memcached
Metric Integer Number ofMemcachedservices that arecurrentlyrunning in theOpenStackdeployment.
Yes
Running Service|Memcached
Metric % Percentage ofMemcachedservices that arecurrentlyrunning in theOpenStackdeployment.
Yes
OpenStack Tenant
Table 8‑7. OpenStack Tenant Metrics
Name Category Type Unit Description Instanced
Total IngressTraffic
Network Metric KBps Incomingnetwork trafficacross allinstancesprovisioned bythe Tenant.
No
Total EgressTraffic
Network Metric KBps Outgoingnetwork trafficacross allinstancesprovisioned bythe Tenant.
No
Total IngressPackets perSecond
Network Metric Integer Rate of incomingpackets across allincomingnetwork trafficacross allinstancesprovisioned bythe Tenant.
No
Chapter 8 Management Pack for OpenStack Object Model
VMware, Inc. 59

Table 8‑7. OpenStack Tenant Metrics (Continued)
Name Category Type Unit Description Instanced
Total EgressPackets perSecond
Network Metric Integer Rate of outgoingpackets across allincomingnetwork trafficacross allinstancesprovisioned bythe Tenant.
No
Total Networks Network Metric Integer Number oflogical switchesthat have beenprovisioned bythe Tenant.
No
Total Routers Network Metric Integer Number oflogical routersthat have beenprovisioned bythe Tenant.
No
Quota Instance Metric Integer Maximumnumber ofinstances thatcan beprovisioned bythe Tenant.
No
Usage Instance Metric Integer Number ofinstances thathave beenprovisioned bythe Tenant.
No
Usage Instance Metric % Percentage ofinstances thathave beenprovisioned bythe Tenant.
No
Quota Memory Metric MB Maximumamount ofvRAM that canbe provisionedby the Tenant.
No
Usage Memory Metric MB Amount ofvRAMprovisioned bythe Tenant.
No
Usage Memory Metric % Percentage ofvRAM that hasbeen provisionedby the Tenant.
No
Quota CPU Metric Integer Maximumnumber ofvCPUs that canbe provisionedby the Tenant
No
Usage CPU Metric Integer Number ofvCPUS that havebeen provisionedby the Tenant.
No
vRealize Operations Management Pack for OpenStack
60 VMware, Inc.
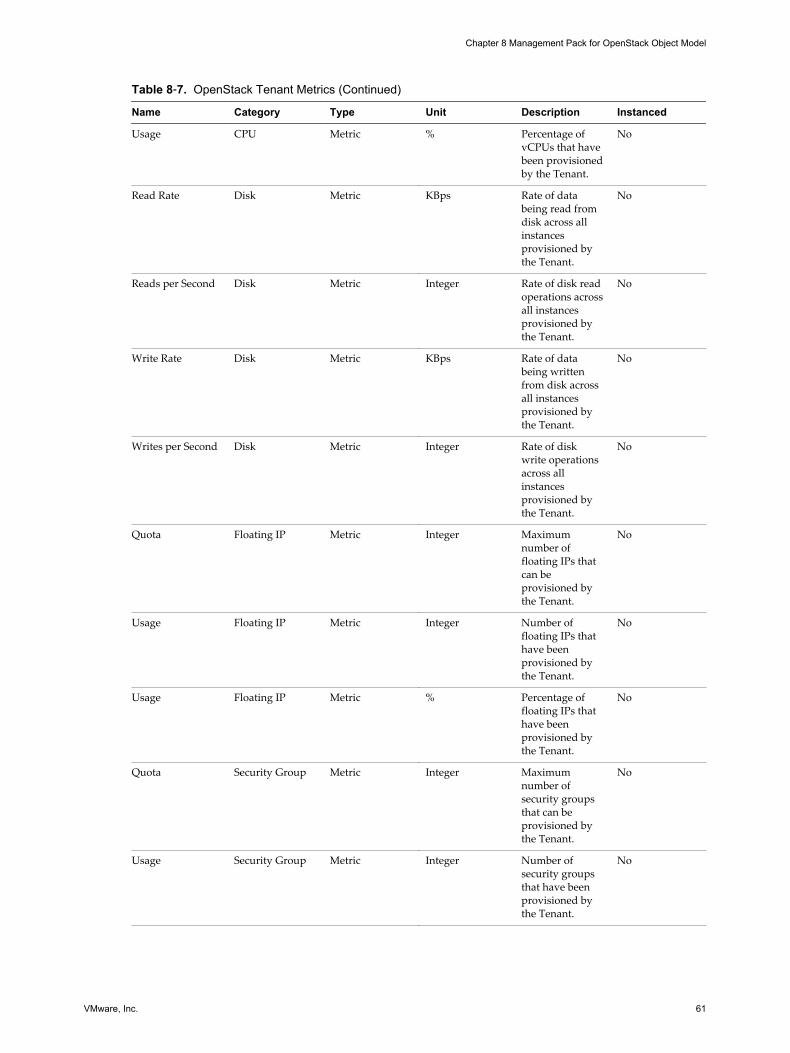
Table 8‑7. OpenStack Tenant Metrics (Continued)
Name Category Type Unit Description Instanced
Usage CPU Metric % Percentage ofvCPUs that havebeen provisionedby the Tenant.
No
Read Rate Disk Metric KBps Rate of databeing read fromdisk across allinstancesprovisioned bythe Tenant.
No
Reads per Second Disk Metric Integer Rate of disk readoperations acrossall instancesprovisioned bythe Tenant.
No
Write Rate Disk Metric KBps Rate of databeing writtenfrom disk acrossall instancesprovisioned bythe Tenant.
No
Writes per Second Disk Metric Integer Rate of diskwrite operationsacross allinstancesprovisioned bythe Tenant.
No
Quota Floating IP Metric Integer Maximumnumber offloating IPs thatcan beprovisioned bythe Tenant.
No
Usage Floating IP Metric Integer Number offloating IPs thathave beenprovisioned bythe Tenant.
No
Usage Floating IP Metric % Percentage offloating IPs thathave beenprovisioned bythe Tenant.
No
Quota Security Group Metric Integer Maximumnumber ofsecurity groupsthat can beprovisioned bythe Tenant.
No
Usage Security Group Metric Integer Number ofsecurity groupsthat have beenprovisioned bythe Tenant.
No
Chapter 8 Management Pack for OpenStack Object Model
VMware, Inc. 61

Table 8‑7. OpenStack Tenant Metrics (Continued)
Name Category Type Unit Description Instanced
Usage Security Group Metric % Percentage ofsecurity groupsthat have beenprovisioned bythe Tenant
Availability Status Metric Boolean 1 if the Tenant isenabled, 0 if theTenant isdisabled.
No
OpenStack Logical Switch
Table 8‑8. OpenStack Logical Switch Metrics
Name Category Type Unit Description Instanced
Total IngressTraffic
Network Metric KBps Incomingnetwork trafficacross allinstancesattached to theLogical Switch.
No
Total EgressTraffic
Network Metric KBps Outgoingnetwork trafficacross allinstancesattached to theLogical Switch.
No
Total IngressPackets perSecond
Network Metric Integer Rate of incomingpackets across allincomingnetwork trafficattached to theLogical Switch.
No
Total EgressPackets perSecond
Network Metric Integer Rate of outgoingpackets across allincomingnetwork trafficattached to theLogical Switch.
No
Total Port Metric Integer Total number ofports configuredon the LogicalSwitch.
No
Active Port Metric Integer Number of portsthat are currentlyactive on theLogical Switch.
No
Active Port Metric % Percentage ofports on theLogical Switchthat are active.
No
vRealize Operations Management Pack for OpenStack
62 VMware, Inc.

Table 8‑8. OpenStack Logical Switch Metrics (Continued)
Name Category Type Unit Description Instanced
Status Port Metric String Current linkstatus of eachport on theLogical Switch.
Yes
Admin State Port Metric String Current adminstate of each porton the LogicalSwitch.
Yes
Availability Status Metric Boolean 1 if the LogicalSwitch is active.0 if the LogicalSwitch is notactive
No
Tenant Summary|OpenStack
Property String Name of theTenant thatprovisioned theLogical Switch.
No
Status Summary|OpenStack
Property String Current linkstatus of theLogical Switch.
No
Admin State Summary|OpenStack
Property String Current adminstate of theLogical Switch.
No
Shared Summary|OpenStack
Property String True if theLogical Switch ifshared by otherTenants. False ifthe LogicalSwitch is privateto the Tenantthat provisionedit.
No
OpenStack Logical Router
Table 8‑9. OpenStack Logical Router Metrics
Name Category Type Unit Description Instanced
Total IngressTraffic
Network Metric KBps Incomingnetwork trafficacross allinstancesattached to theLogical Router.
No
Total EgressTraffic
Network Metric KBps Outgoingnetwork trafficacross allinstancesattached to theLogical Router.
No
Chapter 8 Management Pack for OpenStack Object Model
VMware, Inc. 63

Table 8‑9. OpenStack Logical Router Metrics (Continued)
Name Category Type Unit Description Instanced
Total IngressPackets perSecond
Network Metric Integer Rate of incomingpackets across allincomingnetwork trafficattached to theLogical Router.
No
Total EgressPackets perSecond
Network Metric Integer Rate of outgoingpackets across allincomingnetwork trafficattached to theLogical Router.
No
Total Port Metric Integer Total number ofports configuredon the LogicalRouter.
No
Active Port Metric Integer Number of portsthat are currentlyactive on theLogical Router.
No
Active Port Metric % Percentage ofports on theLogical Routerthat are active.
No
Status Port Metric String Current linkstatus of eachport on theLogical Router.
Yes
Admin State Port Metric String Current adminstate of each porton the LogicalRouter.
Yes
Availability Status Metric Boolean 1 if the LogicalSwitch is active.0 if the LogicalRouter is notactive.
No
Tenant Summary|OpenStack
Property String Name of theTenant thatprovisioned theLogical Router.
No
Status Summary|OpenStack
Property String Current linkstatus of theLogical Routers.
No
Admin State Summary|OpenStack
Property String Current adminstate of theLogical Router.
vRealize Operations Management Pack for OpenStack
64 VMware, Inc.
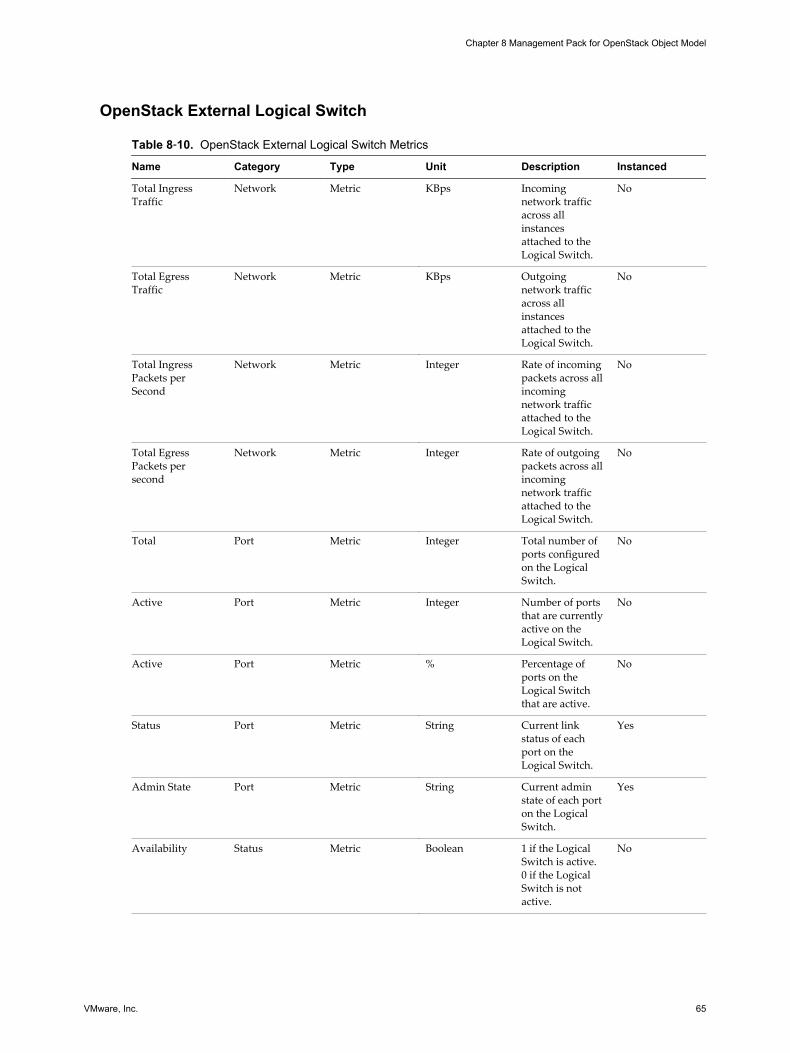
OpenStack External Logical Switch
Table 8‑10. OpenStack External Logical Switch Metrics
Name Category Type Unit Description Instanced
Total IngressTraffic
Network Metric KBps Incomingnetwork trafficacross allinstancesattached to theLogical Switch.
No
Total EgressTraffic
Network Metric KBps Outgoingnetwork trafficacross allinstancesattached to theLogical Switch.
No
Total IngressPackets perSecond
Network Metric Integer Rate of incomingpackets across allincomingnetwork trafficattached to theLogical Switch.
No
Total EgressPackets persecond
Network Metric Integer Rate of outgoingpackets across allincomingnetwork trafficattached to theLogical Switch.
No
Total Port Metric Integer Total number ofports configuredon the LogicalSwitch.
No
Active Port Metric Integer Number of portsthat are currentlyactive on theLogical Switch.
No
Active Port Metric % Percentage ofports on theLogical Switchthat are active.
No
Status Port Metric String Current linkstatus of eachport on theLogical Switch.
Yes
Admin State Port Metric String Current adminstate of each porton the LogicalSwitch.
Yes
Availability Status Metric Boolean 1 if the LogicalSwitch is active.0 if the LogicalSwitch is notactive.
No
Chapter 8 Management Pack for OpenStack Object Model
VMware, Inc. 65
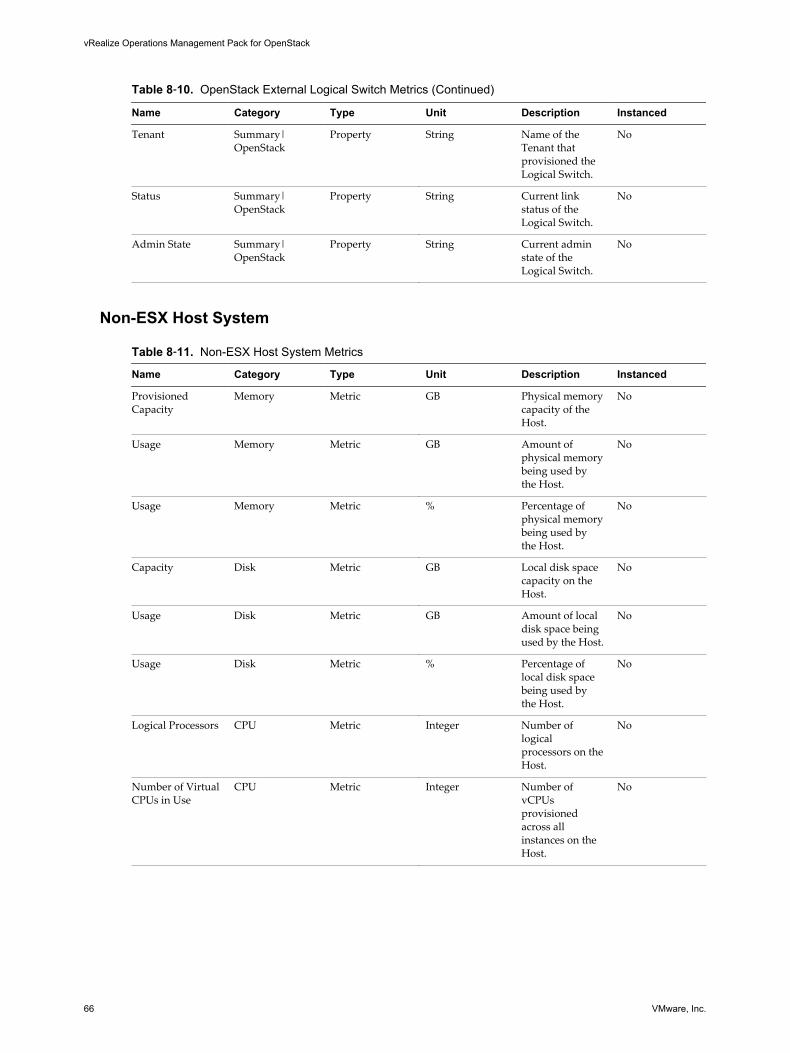
Table 8‑10. OpenStack External Logical Switch Metrics (Continued)
Name Category Type Unit Description Instanced
Tenant Summary|OpenStack
Property String Name of theTenant thatprovisioned theLogical Switch.
No
Status Summary|OpenStack
Property String Current linkstatus of theLogical Switch.
No
Admin State Summary|OpenStack
Property String Current adminstate of theLogical Switch.
No
Non-ESX Host System
Table 8‑11. Non-ESX Host System Metrics
Name Category Type Unit Description Instanced
ProvisionedCapacity
Memory Metric GB Physical memorycapacity of theHost.
No
Usage Memory Metric GB Amount ofphysical memorybeing used bythe Host.
No
Usage Memory Metric % Percentage ofphysical memorybeing used bythe Host.
No
Capacity Disk Metric GB Local disk spacecapacity on theHost.
No
Usage Disk Metric GB Amount of localdisk space beingused by the Host.
No
Usage Disk Metric % Percentage oflocal disk spacebeing used bythe Host.
No
Logical Processors CPU Metric Integer Number oflogicalprocessors on theHost.
No
Number of VirtualCPUs in Use
CPU Metric Integer Number ofvCPUsprovisionedacross allinstances on theHost.
No
vRealize Operations Management Pack for OpenStack
66 VMware, Inc.

Non-ESX Virtual Machine
Table 8‑12. Non-ESX Virtual Machine Metrics
Name Category Type Unit Description Instanced
Capacity Disk Property GB Amount of diskspaceprovisioned bythe virtualmachine.
No
Read Rate Disk Metric KBps Rate of databeing read fromall disks on thevirtual machine.
No
Reads per Second Disk Metric Integer Rate of disk readoperations on thevirtual machine.
No
Write Rate Disk Metric KBps Rate of databeing writtenfrom all disks onthe virtualmachine.
No
Writes per Second Disk Metric Integer Rate of diskwrite operationson the virtualmachine.
No
ProvisionedvCPUs
CPU Property Integer Number ofvCPUsprovisioned bythe virtualmachine.
No
CPU Utilization CPU Metric % Percentage ofCPU time beingused by thevirtual machine.
No
ProvisionedCapacity
Memory Property GB Amount ofvRAMprovisioned bythe virtualmachine.
No
Uptime System Metric Integer Number ofseconds thathave elapsedsince the virtualmachine wasstarted.
No
IP Addresses Network Property String IP Addressesassigned to thevirtual machine.
No
Total IngressTraffic
Network Metric KBps Incomingnetwork trafficon the virtualmachine.
No
Chapter 8 Management Pack for OpenStack Object Model
VMware, Inc. 67

Table 8‑12. Non-ESX Virtual Machine Metrics (Continued)
Name Category Type Unit Description Instanced
Total EgressTraffic
Network Metric KBps Outgoingnetwork trafficon the virtualmachine.
No
Total IngressPackets perSecond
Network Metric Integer Rate of incomingpackets on thevirtual machine.
No
Total EgressPackets perSecond
Network Metric Integer Rate of outgoingpackets on theVirtual Machine.
No
Availability Status Metric Boolean 1 if the virtualmachine iscurrentlyavailable. 0 if thevirtual machineis not available.
No
VM Error Code Status Property String Error code thatwas returnedfrom OpenStackfor the lastconfigurationoperation on thevirtual machine.
No
VM Error Message Status Property String Error messagethat wasreturned fromOpenStack forthe lastconfigurationoperations on thevirtual machine.
No
Tenant Summary|OpenStack
Property String Name of theTenant thatprovisioned thevirtual machine.
No
Instance Name Summary|OpenStack
Property String Name of theOpenStackinstance thatcorresponds tothe virtualmachine.
No
Image Summary|OpenStack
Property String Name of theOpenStackimage that thevirtual machinewas provisionedfrom.
No
Flavor Summary|OpenStack
Property String Name of theOpenStack flavorthat was used forconfiguring thevirtual machine.
No
vRealize Operations Management Pack for OpenStack
68 VMware, Inc.

Table 8‑12. Non-ESX Virtual Machine Metrics (Continued)
Name Category Type Unit Description Instanced
Status Summary|OpenStack
Property String Current status ofthe virtualmachine asreported byOpenStack
No
Power state Summary|OpenStack
Property String Whether thevirtual machineis running or not.
No
Chapter 8 Management Pack for OpenStack Object Model
VMware, Inc. 69

vRealize Operations Management Pack for OpenStack
70 VMware, Inc.

Management Pack for OpenStackReports 9
A report is a scheduled snapshot of views. The Management Pack for OpenStack provides a variety ofreport templates to enable you to generate reports for OpenStack objects.
Table 9‑1. Management Pack for OpenStack Reports
Name Applies to Content
OpenStack Compute InfrastructureCapacity
Cluster Compute Resource, HostSystem, Non-ESX Host System
Provides a view of the current, 7-day,and 21-day forecast of capacityremaining for all clusters and hosts,and a breakdown of the memory anddisk space remaining.
OpenStack Storage InfrastructureCapacity
Datastore Provides a view of the current, 7-day,and 21-day forecast of capacityremaining for all data stores, and abreakdown of the disk spaceremaining.
OpenStack Tenant Alerts Tenant Provides a list of the number of alertsreported for each tenant. Alerts arebroken down into current and 7-dayaverages for Critical, Immediate, andWarning alerts.
OpenStack Tenant Quota Usage Tenant Provides an overview of thepercentage of instances, vCPUs,vRAM, Floating IPs, and SecurityGroups provisioned by each tenant,and a detailed breakdown of theprovisioned and quota numbers ofeach object type for each tenant.
Generate a ReportThe Management Pack for OpenStack provides a list of report templates.
Procedure
1 In the left pane of vRealize Operations Manager, click the Environment icon.
2 Select the Management Pack for OpenStack object for which you want to generate the report.
The Report tab is displayed.
VMware, Inc. 71

3 From the Report tab, select the required report template, and click the Run Template icon.
When the report is complete, the number of generated reports is updated under the name of the reporttemplate.
What to do next
Download the report by clicking Generated Reports. Select the report from the list of reports, and click therequired format in the Download column.
vRealize Operations Management Pack for OpenStack
72 VMware, Inc.

Index
Aalert definitions 29
Ccapacity models 45configuring, OpenStack instance 11
Ddashboards
displaying 19OpenStack Controllers 20OpenStack Tenants 23OpenStack Compute Infrastructure 20OpenStack Network Infrastructure 21OpenStack vCenter Storage Infrastructure 22
Gglossary 5
Iinstalling management packs 10installing the management pack 9integrate OpenStack
management pack for Hyperic 9management pack for NSX for Multi-
Hypervisor 9management pack for vCenter 9
intended audience 5
Mmanagement packs, installing 10
Oobjects and metrics 49open external application
Log Insight 26NSX manager 26OpenStack Horizon 26vSphere web client 26
Rreports
generating 71templates 71
VvRealize Hyperic plug-ins
Apache 15Memcached 15MySQL 15OpenStack 15RabbitMQ 15
VMware, Inc. 73

vRealize Operations Management Pack for OpenStack
74 VMware, Inc.