Embed Size (px)
Citation preview
vRealize Operations Manager Configuration Guide
05 DEC 2019vRealize Operations Manager 8.0
You can find the most up-to-date technical documentation on the VMware website at:
https://docs.vmware.com/
If you have comments about this documentation, submit your feedback to
VMware, Inc.3401 Hillview Ave.Palo Alto, CA 94304www.vmware.com
Copyright © 2019 VMware, Inc. All rights reserved. Copyright and trademark information.
vRealize Operations Manager Configuration Guide
VMware, Inc. 2
Contents
About Configuration 8
1 Connecting to Data Sources 9VMware vSphere Solution 10
Configure a vCenter Server Cloud Account in vRealize Operations Manager 12
Configure User Access for Actions 15
Cloud Account Information - VMware vSphere Account Options 16
Installing Optional Solutions 18
Solutions in vRealize Operations Manager 19
Solutions Repository Page 23
Add Solutions Wizard 24
Managing Solution Credentials 26
Managing Collector Groups 28
vRealize Application Remote Collector 30
vRealize Application Remote Collector 31
Deploy vRealize Application Remote Collector 32
Upgrade 47
Post Installation 49
Troubleshooting your Deployment 50
Security Reference 54
Application Monitoring 59
Activate the VMware vRealize Application Management Pack 60
Configure the Application Remote Collector 60
Manage Agents in Virtual Machines 66
Monitor Applications In vRealize Operations Manager 76
Operating System Metrics Collected by vRealize Application Remote Collector 76
Application Service Metrics Collected by vRealize Application Remote Collector 79
Troubleshooting the Integration of vRealize Application Remote Collector with vRealize Operations Manager 109
Service Discovery 112
Supported Platforms and Products for Service Discovery 112
Supported Services 113
Configure Service Discovery 114
Manage Services 116
Discovered Services 117
Service Discovery Metrics 118
Log Insight 119
Log Insight Page 119
VMware, Inc. 3
Logs Tab 119
Configuring vRealize Log Insight with vRealize Operations Manager 120
Log Forwarding 121
Business Management 123
Cost Settings for Financial Accounting Model 123
Overview of Cost Drivers 124
Cloud Providers Overview 127
Editing Cost Drivers 128
Cluster Cost Overview 135
Cost Calculation Status Overview 137
vRealize Automation 7.x 138
Supported vRealize Automation Versions 138
Object Types and Relationships 138
vRealize Automation Workload Placement 139
Port Information 140
Security Guidelines 140
Configuring vRealize Automation 140
Alert Definitions 144
vRealize Automation 8.X 145
Supported Versions 145
Object Types 145
Workload Placement 146
Pricing for vRealize Automation 8.x Components in vRealize Operations Manager 147
Configuring VMware vRealize Automation 8.x with vRealize Operations Manager 148
Support for Cloud Automation Services Instance in vRealize Operations Manager 148
Cloud Zones in vRealize Operations Manager 149
vSAN 150
Configure a vSAN Adapter Instance 151
Verify that the Adapter Instance is Connected and Collecting Data 152
End Point Operations Management Solution 154
End Point Operations Management Agent Installation and Deployment 154
Roles and Privileges 197
Registering Agents on Clusters 197
Manually Create Operating System Objects 198
Managing Objects with Missing Configuration Parameters 199
Mapping Virtual Machines to Operating Systems 200
Customizing How End Point Operations Management Monitors Operating Systems 200
Management Pack for Microsoft Azure 212
Configuring the Management Pack for Microsoft Azure 212
Management Pack for AWS 215
Introduction to the Management Pack for AWS 216
vRealize Operations Manager Configuration Guide
VMware, Inc. 4
Configuring the Management Pack for AWS 219
2 Configuring Alerts and Actions 226Types of Alerts 226
Alert Information 226
Configuring Alerts 228
Defining Alerts in vRealize Operations Manager 228
Defining Symptoms for Alerts 229
Defining Recommendations for Alert Definitions 232
Create a New Alert Definition 233
Alert Definition Best Practices 234
Creating and Managing Alert Notifications 235
Create an Alert Definition for Department Objects 249
Alerts Group 260
Viewing Actions 261
List of vRealize Operations Manager Actions 261
Actions Supported for Automation 263
Integration of Actions with vRealize Automation 264
Working with Actions That Use Power Off Allowed 265
3 Configuring and Using Workload Optimization 269Configuring Workload Optimization 270
Business Intent: Tag-Based VM Placement in Clusters 271
Business Intent - Host-Based Virtual Machine Placement 274
Business Intent Workspace 275
Configuring Workload Optimization Alerts 276
Using Workload Optimization 277
Example: Run Workload Optimization 277
Example: Schedule a Repeating Optimization Action 279
Example: Run Workload Optimization from Recommended Actions 281
4 Configuring Policies 282Policies 282
Policy Decisions and Objectives 284
Active Policies Tab for Policies 284
Policy Library Tab for Policies 287
Operational Policies 289
Types of Policies 290
Custom Policies 290
Default Policy in vRealize Operations Manager 292
Policies Provided with vRealize Operations Manager 292
vRealize Operations Manager Configuration Guide
VMware, Inc. 5
Using the Monitoring Policy Workspace to Create and Modify Operational Policies 293
Policy Workspace in vRealize Operations Manager 294
5 Configuring Compliance 312What Are Compliance Benchmarks 312
Compliance Score Cards 313
Compliance Alerts 315
How To Configure Compliance Benchmarks 316
Enable VMware SDDC Benchmarks 316
Create a New Custom Benchmark 317
Import or Export a Custom Benchmark 317
Install a Regulatory Benchmark 318
6 Configuring Super Metrics 320Create a Super Metric 321
Enhancing Your Super Metrics 324
Exporting and Importing a Super Metric 325
7 Configuring Objects 327Object Discovery 327
About Objects 328
Managing Objects in Your Environment 330
Managing Custom Object Groups 336
Managing Application Groups 340
8 Configuring Data Display 342Widgets 342
Widget Interactions 343
Manage Metric Configuration 343
Add a Resource Interaction XML File 344
Widget Definitions List 345
Dashboards 347
Types Of Dashboards 348
Create and Configure Dashboards 375
Manage Dashboards 378
Dashboards Actions and Options 380
Views 384
Views Overview 385
Views and Reports Ownership 386
Create and Configure a View 386
Editing, Cloning, and Deleting a View 398
vRealize Operations Manager Configuration Guide
VMware, Inc. 6
User Scenario: Create, Run, Export, and Import a vRealize Operations Manager View for Tracking Virtual Machines 398
Reports 401
Report Templates Tab 401
Generated Reports Tab 402
Create and Modify a Report Template 403
Add a Network Share Plug-In for vRealize Operations Manager Reports 406
Report Templates Overview 407
Generated Reports Overview 408
Schedule Reports Overview 410
Upload a Default Cover Page Image for Reports 412
9 Configuring Administration Settings 413Managing Users and Access Control 413
Users of vRealize Operations Manager 414
Roles and Privileges 418
User Scenario: Manage User Access Control 419
Configure a Single Sign-On Source 422
Authentication Sources 425
Audit Users and the Environment 431
Passwords and Certificates 432
Reset the Administrator Password 433
Generate a Passphrase 433
Custom Certificates 434
Modifying Global Settings 439
List of Global Settings 439
Global Settings 442
Transfer Ownership of Dashboards and Report Schedules 443
Create a Support Bundle 444
Customizing Icons 445
Customize an Object Type Icon 445
Customize an Adapter Type Icon 445
10 OPS-CLI Command-Line Tool 447dashboard Command Operations 448
template Command Operations 449
supermetric Command Operations 450
attribute Command Operations 451
reskind Command Operations for Object Types 451
report Command Operations 451
view Command Operations 451
file Command Operations 452
vRealize Operations Manager Configuration Guide
VMware, Inc. 7
About Configuration
The VMware vRealize Operations Manager Configuration Guide describes how to configure and monitor your environment. It shows you how to connect vRealize Operations Manager to external data sources and analyze the data collected from them, ensure that users and their supporting infrastructure are in place, configure resources to determine the behavior of your objects, and format the content that appears in vRealize Operations Manager.
To help you maintain and expand your vRealize Operations Manager installation, this information describes how to manage nodes and clusters, configure NTP, view log files, create support bundles, and add a maintenance schedule. It provides information about license keys and groups, and shows you how to generate a passphrase, review the certificates used for authentication, run the describe process, and perform advanced maintenance functions.
Intended AudienceThis information is intended for vRealize Operations Manager administrators, virtual infrastructure administrators, and operations engineers who install, configure, monitor, manage, and maintain the objects in your environment.
For users who want to configure vRealize Operations Manager programmatically, the VMware vRealize Operations Manager REST API documentation is available in HTML format and is installed with your vRealize Operations Manager instance. For example, if the URL of your instance is https://vrealize.example.com, the API reference is available from https://vrealize.example.com/suite-api/docs/rest/index.html.
VMware, Inc. 8
Connecting vRealize Operations Manager to Data Sources 1Configure management packs in vRealize Operations Manager to connect to and analyze data from external data sources in your environment. Once connected, you use vRealize Operations Manager to monitor and manage objects in your environment.
A management pack might be only a connection to a data source, or it might include predefined dashboards, widgets, alerts, and views.
vRealize Operations Manager includes management packs that are pre-installed. These solutions are installed when you install vRealize Operations Manager and cannot be deactivated. The management packs are as follows:
n VMware vSphere
n VMware vRealize Log Insight
n VMware vRealize Assessments
n VMware vSAN
n vRealize Operations Service Discovery Management Pack
n VMware vRealize Automation 8.x
n VMware Management Pack for AWS
n VMware Management Pack for Microsoft Azure
vRealize Operations Manager also includes management packs that are bundled with vRealize Operations Manager, but not activated. You can activate these management packs from the Repository page. The management packs are as follows:
n Operating Systems/Remote Service Monitoring
n VMware vRealize Application Management Pack
n VMware vRealize Automation 7.x
Note The management packs bundled with vRealize Operations Manager are reinstalled if vRealize Operations Manager is upgraded. If there is a fresh deployment of vRealize Operations Manager, only VMware vSphere and vRealize Optimization Assessments are installed and activated, all other management packs are pre-bundled and require activation for use.
VMware, Inc. 9
Other management packs such as the VMware Management Pack for NSX for vSphere, can be added to vRealize Operations Manager as management packs from the Repository page. To download VMware management packs and other third-party solutions, visit the VMware Solution Exchange at https://marketplace.vmware.com/vsx/.
This chapter includes the following topics:
n VMware vSphere Solution in vRealize Operations Manager
n Installing Optional Solutions in vRealize Operations Manager
n vRealize Application Remote Collector
n Application Monitoring
n Service Discovery
n Log Insight
n Business Management
n vRealize Automation 7.x
n vRealize Automation 8.X
n vSAN
n End Point Operations Management Solution in vRealize Operations Manager
n Management Pack for Microsoft Azure
n Management Pack for AWS
VMware vSphere Solution in vRealize Operations ManagerThe VMware vSphere solution connects vRealize Operations Manager to one or more vCenter Server instances. You collect data and metrics from those instances, monitor them, and run actions in them.
vRealize Operations Manager evaluates the data in your environment, identifying trends in object behavior, calculating possible problems and future capacity for objects in your system based on those trends, and alerting you when an object exhibits defined symptoms.
Configuring the vSphere SolutionThe vSphere solution is installed together with vRealize Operations Manager. The solution provides the vCenter Server adapter which you must configure to connect vRealize Operations Manager to your vCenter Server instances.
vRealize Operations Manager Configuration Guide
VMware, Inc. 10
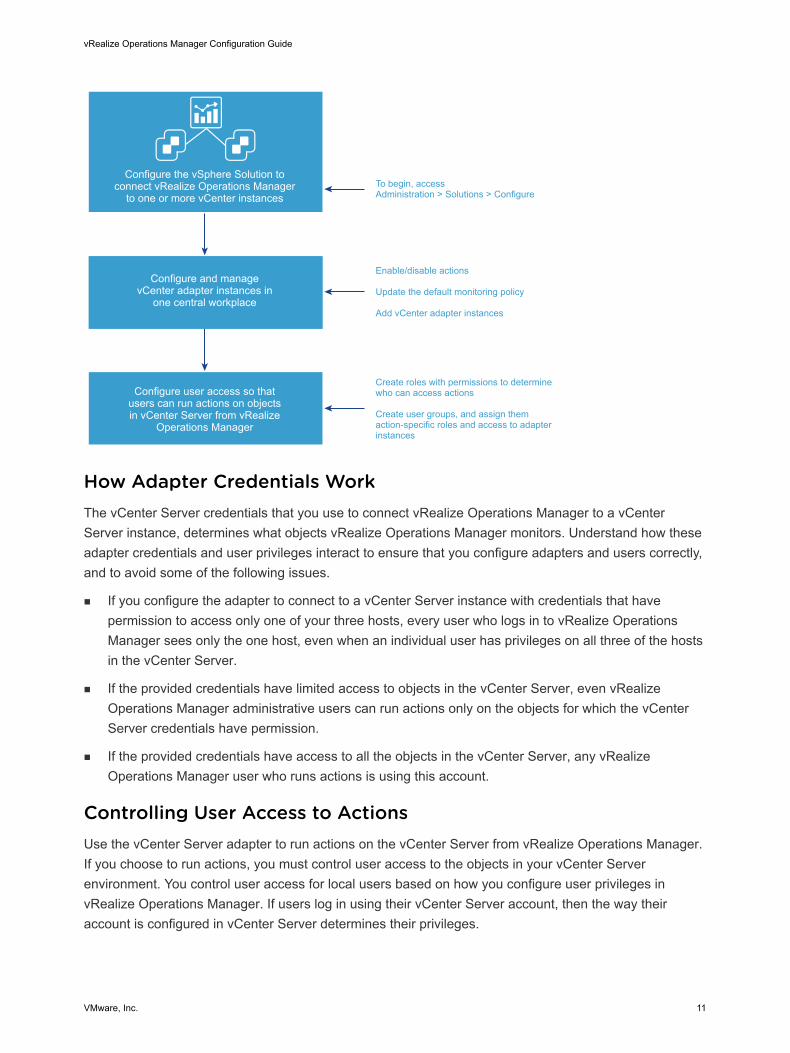
Configure and manage vCenter adapter instances in
one central workplace
Configure user access so that users can run actions on objects in vCenter Server from vRealize
Operations Manager
Enable/disable actions
Update the default monitoring policy
Add vCenter adapter instances
Configure the vSphere Solution to connect vRealize Operations Manager
to one or more vCenter instancesTo begin, access Administration > Solutions > Configure
Create roles with permissions to determine who can access actions
Create user groups, and assign them action-specific roles and access to adapter instances
How Adapter Credentials WorkThe vCenter Server credentials that you use to connect vRealize Operations Manager to a vCenter Server instance, determines what objects vRealize Operations Manager monitors. Understand how these adapter credentials and user privileges interact to ensure that you configure adapters and users correctly, and to avoid some of the following issues.
n If you configure the adapter to connect to a vCenter Server instance with credentials that have permission to access only one of your three hosts, every user who logs in to vRealize Operations Manager sees only the one host, even when an individual user has privileges on all three of the hosts in the vCenter Server.
n If the provided credentials have limited access to objects in the vCenter Server, even vRealize Operations Manager administrative users can run actions only on the objects for which the vCenter Server credentials have permission.
n If the provided credentials have access to all the objects in the vCenter Server, any vRealize Operations Manager user who runs actions is using this account.
Controlling User Access to ActionsUse the vCenter Server adapter to run actions on the vCenter Server from vRealize Operations Manager. If you choose to run actions, you must control user access to the objects in your vCenter Server environment. You control user access for local users based on how you configure user privileges in vRealize Operations Manager. If users log in using their vCenter Server account, then the way their account is configured in vCenter Server determines their privileges.
vRealize Operations Manager Configuration Guide
VMware, Inc. 11
For example, you might have a vCenter Server user with a read-only role in vCenter Server. If you give this user the vRealize Operations Manager Power User role in vCenter Server rather than a more restrictive role, the user can run actions on objects because the adapter is configured with credentials that has privileges to change objects. To avoid this type of unexpected result, configure local vRealize Operations Manager users and vCenter Server users with the privileges you want them to have in your environment.
Configure a vCenter Server Cloud Account in vRealize Operations ManagerTo manage your vCenter Server instances in vRealize Operations Manager, you must configure a cloud account for each vCenter Server instance. The adapter requires the credentials that are used for communication with the target vCenter Server.
Caution Any adapter credentials you add are shared with other adapter administrators and vRealize Operations Manager collector hosts. Other administrators might use these credentials to configure a new adapter instance or to move an adapter instance to a new host.
Prerequisites
Verify that you know the vCenter Server credentials that have sufficient privileges to connect and collect data, see Privileges Required for Configuring a vCenter Adapter Instance. If the provided credentials have limited access to objects in vCenter Server, all users, regardless of their vCenter Server privileges see only the objects that the provided credentials can access. At a minimum, the user account must have Read privileges and the Read privileges must be assigned at the data center or vCenter Server level.
Procedure
1 On the menu, click Administration and in the left pane, click Solutions > Cloud Accounts.
2 On the Cloud Accounts page, click Add Accounts.
3 On the Accounts Type page, click vCenter .
4 Enter a display name and description for the cloud account.
n Display name. Enter the name for the vCenter Server instance as you want it to appear in vRealize Operations Manager. A common practice is to include the IP address so that you can readily identify and differentiate between instances.
n Description. Enter any additional information that helps you manage your instances.
5 In the vCenter Server text box, enter the FQDN or IP address of the vCenter Server instance to which you are connecting.
The vCenter Server FQDN or IP address must be reachable from all nodes in the vRealize Operations Manager cluster.
6 To add credentials for the vCenter Server instance, click the Add icon, and enter the required credentials. The vCenter credential must have Performance > Modify intervals permission enabled in the target vCenter to collect VM guest metrics.
vRealize Operations Manager Configuration Guide
VMware, Inc. 12
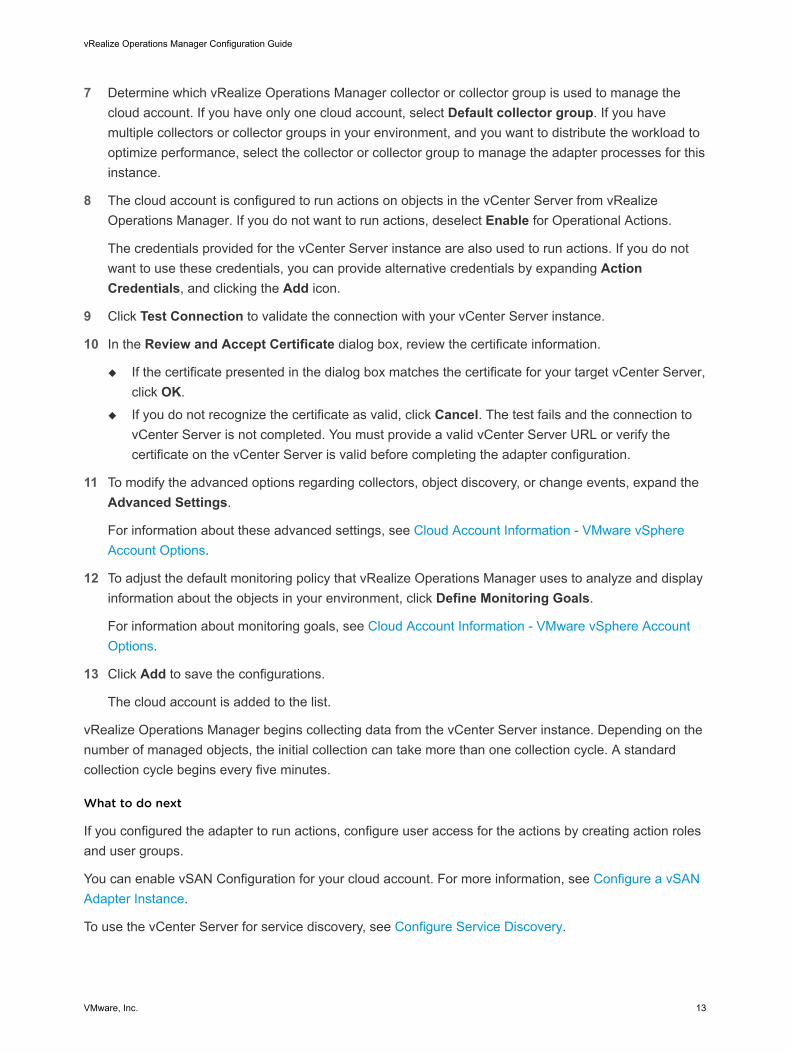
7 Determine which vRealize Operations Manager collector or collector group is used to manage the cloud account. If you have only one cloud account, select Default collector group. If you have multiple collectors or collector groups in your environment, and you want to distribute the workload to optimize performance, select the collector or collector group to manage the adapter processes for this instance.
8 The cloud account is configured to run actions on objects in the vCenter Server from vRealize Operations Manager. If you do not want to run actions, deselect Enable for Operational Actions.
The credentials provided for the vCenter Server instance are also used to run actions. If you do not want to use these credentials, you can provide alternative credentials by expanding Action Credentials, and clicking the Add icon.
9 Click Test Connection to validate the connection with your vCenter Server instance.
10 In the Review and Accept Certificate dialog box, review the certificate information.
u If the certificate presented in the dialog box matches the certificate for your target vCenter Server, click OK.
u If you do not recognize the certificate as valid, click Cancel. The test fails and the connection to vCenter Server is not completed. You must provide a valid vCenter Server URL or verify the certificate on the vCenter Server is valid before completing the adapter configuration.
11 To modify the advanced options regarding collectors, object discovery, or change events, expand the Advanced Settings.
For information about these advanced settings, see Cloud Account Information - VMware vSphere Account Options.
12 To adjust the default monitoring policy that vRealize Operations Manager uses to analyze and display information about the objects in your environment, click Define Monitoring Goals.
For information about monitoring goals, see Cloud Account Information - VMware vSphere Account Options.
13 Click Add to save the configurations.
The cloud account is added to the list.
vRealize Operations Manager begins collecting data from the vCenter Server instance. Depending on the number of managed objects, the initial collection can take more than one collection cycle. A standard collection cycle begins every five minutes.
What to do next
If you configured the adapter to run actions, configure user access for the actions by creating action roles and user groups.
You can enable vSAN Configuration for your cloud account. For more information, see Configure a vSAN Adapter Instance.
To use the vCenter Server for service discovery, see Configure Service Discovery.
vRealize Operations Manager Configuration Guide
VMware, Inc. 13
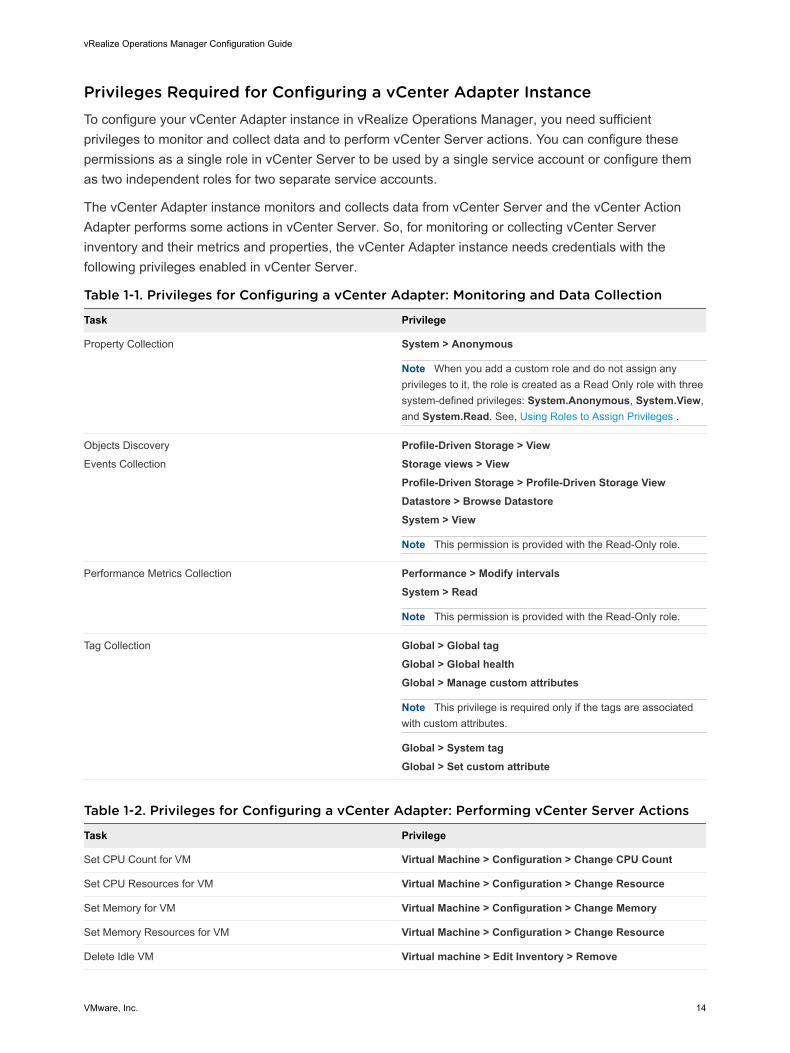
Privileges Required for Configuring a vCenter Adapter InstanceTo configure your vCenter Adapter instance in vRealize Operations Manager, you need sufficient privileges to monitor and collect data and to perform vCenter Server actions. You can configure these permissions as a single role in vCenter Server to be used by a single service account or configure them as two independent roles for two separate service accounts.
The vCenter Adapter instance monitors and collects data from vCenter Server and the vCenter Action Adapter performs some actions in vCenter Server. So, for monitoring or collecting vCenter Server inventory and their metrics and properties, the vCenter Adapter instance needs credentials with the following privileges enabled in vCenter Server.
Table 1-1. Privileges for Configuring a vCenter Adapter: Monitoring and Data Collection
Task Privilege
Property Collection System > Anonymous
Note When you add a custom role and do not assign any privileges to it, the role is created as a Read Only role with three system-defined privileges: System.Anonymous, System.View, and System.Read. See, Using Roles to Assign Privileges .
Objects Discovery
Events Collection
Profile-Driven Storage > ViewStorage views > ViewProfile-Driven Storage > Profile-Driven Storage ViewDatastore > Browse DatastoreSystem > View
Note This permission is provided with the Read-Only role.
Performance Metrics Collection Performance > Modify intervalsSystem > Read
Note This permission is provided with the Read-Only role.
Tag Collection Global > Global tagGlobal > Global healthGlobal > Manage custom attributes
Note This privilege is required only if the tags are associated with custom attributes.
Global > System tagGlobal > Set custom attribute
Table 1-2. Privileges for Configuring a vCenter Adapter: Performing vCenter Server Actions
Task Privilege
Set CPU Count for VM Virtual Machine > Configuration > Change CPU Count
Set CPU Resources for VM Virtual Machine > Configuration > Change Resource
Set Memory for VM Virtual Machine > Configuration > Change Memory
Set Memory Resources for VM Virtual Machine > Configuration > Change Resource
Delete Idle VM Virtual machine > Edit Inventory > Remove
vRealize Operations Manager Configuration Guide
VMware, Inc. 14
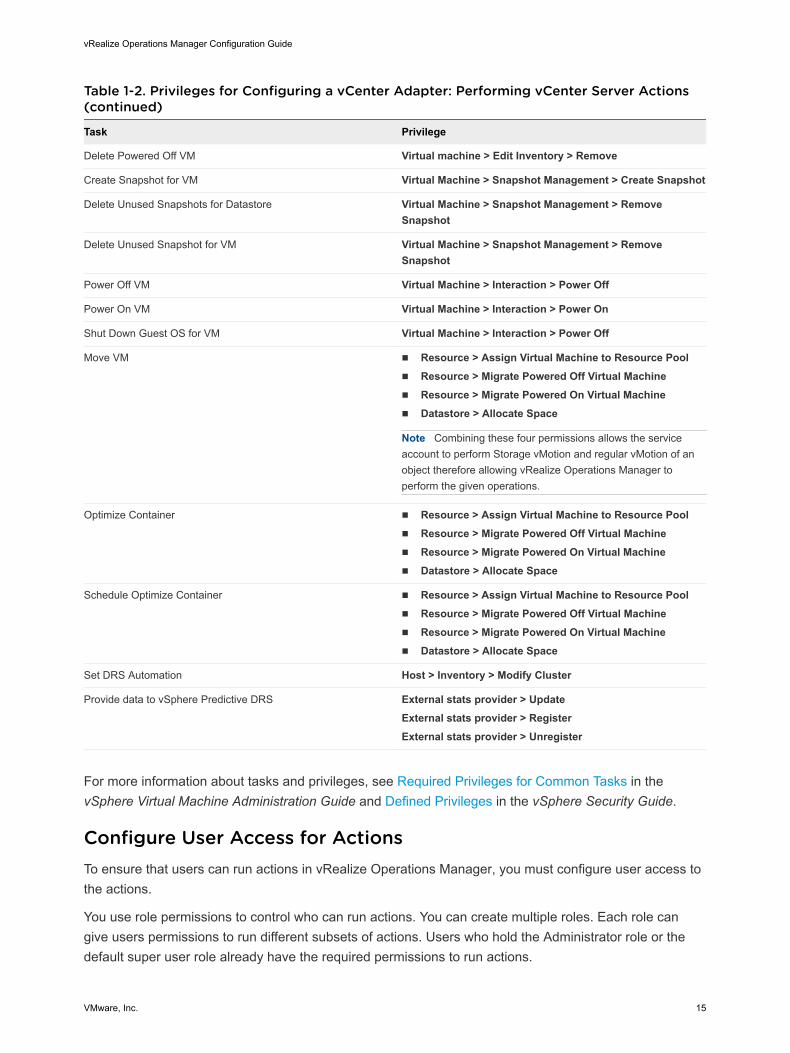
Table 1-2. Privileges for Configuring a vCenter Adapter: Performing vCenter Server Actions (continued)
Task Privilege
Delete Powered Off VM Virtual machine > Edit Inventory > Remove
Create Snapshot for VM Virtual Machine > Snapshot Management > Create Snapshot
Delete Unused Snapshots for Datastore Virtual Machine > Snapshot Management > Remove Snapshot
Delete Unused Snapshot for VM Virtual Machine > Snapshot Management > Remove Snapshot
Power Off VM Virtual Machine > Interaction > Power Off
Power On VM Virtual Machine > Interaction > Power On
Shut Down Guest OS for VM Virtual Machine > Interaction > Power Off
Move VM n Resource > Assign Virtual Machine to Resource Pooln Resource > Migrate Powered Off Virtual Machinen Resource > Migrate Powered On Virtual Machinen Datastore > Allocate Space
Note Combining these four permissions allows the service account to perform Storage vMotion and regular vMotion of an object therefore allowing vRealize Operations Manager to perform the given operations.
Optimize Container n Resource > Assign Virtual Machine to Resource Pooln Resource > Migrate Powered Off Virtual Machinen Resource > Migrate Powered On Virtual Machinen Datastore > Allocate Space
Schedule Optimize Container n Resource > Assign Virtual Machine to Resource Pooln Resource > Migrate Powered Off Virtual Machinen Resource > Migrate Powered On Virtual Machinen Datastore > Allocate Space
Set DRS Automation Host > Inventory > Modify Cluster
Provide data to vSphere Predictive DRS External stats provider > UpdateExternal stats provider > RegisterExternal stats provider > Unregister
For more information about tasks and privileges, see Required Privileges for Common Tasks in the vSphere Virtual Machine Administration Guide and Defined Privileges in the vSphere Security Guide.
Configure User Access for ActionsTo ensure that users can run actions in vRealize Operations Manager, you must configure user access to the actions.
You use role permissions to control who can run actions. You can create multiple roles. Each role can give users permissions to run different subsets of actions. Users who hold the Administrator role or the default super user role already have the required permissions to run actions.
vRealize Operations Manager Configuration Guide
VMware, Inc. 15
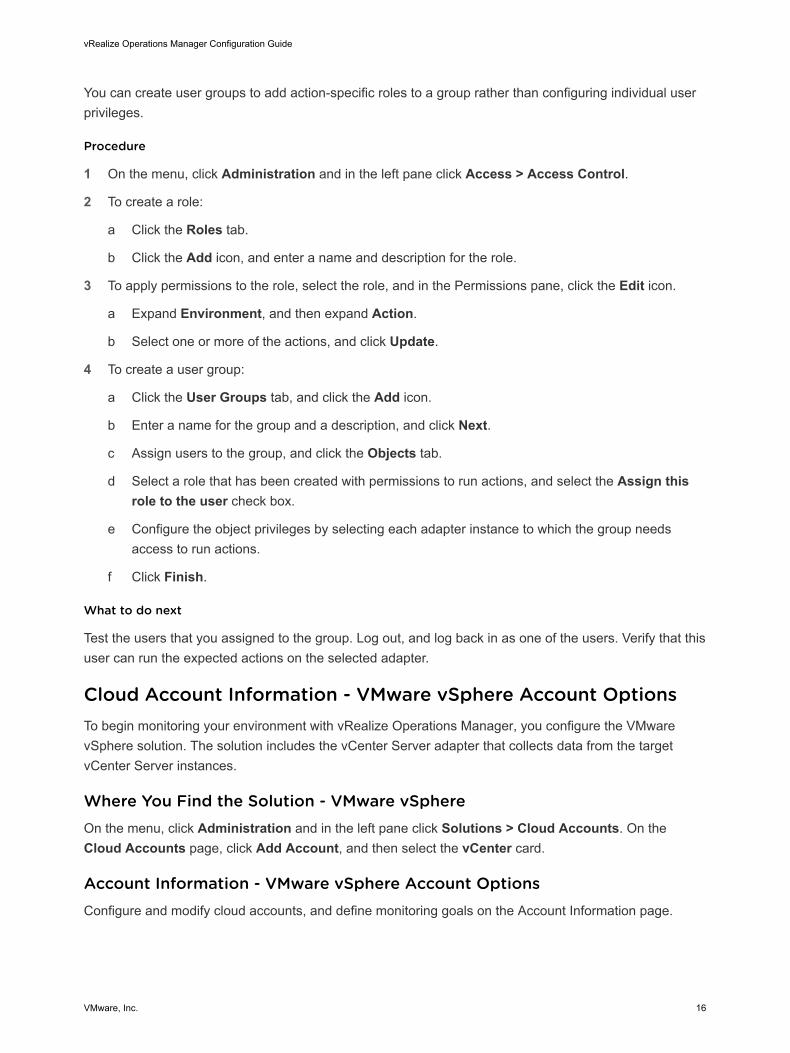
You can create user groups to add action-specific roles to a group rather than configuring individual user privileges.
Procedure
1 On the menu, click Administration and in the left pane click Access > Access Control.
2 To create a role:
a Click the Roles tab.
b Click the Add icon, and enter a name and description for the role.
3 To apply permissions to the role, select the role, and in the Permissions pane, click the Edit icon.
a Expand Environment, and then expand Action.
b Select one or more of the actions, and click Update.
4 To create a user group:
a Click the User Groups tab, and click the Add icon.
b Enter a name for the group and a description, and click Next.
c Assign users to the group, and click the Objects tab.
d Select a role that has been created with permissions to run actions, and select the Assign this role to the user check box.
e Configure the object privileges by selecting each adapter instance to which the group needs access to run actions.
f Click Finish.
What to do next
Test the users that you assigned to the group. Log out, and log back in as one of the users. Verify that this user can run the expected actions on the selected adapter.
Cloud Account Information - VMware vSphere Account OptionsTo begin monitoring your environment with vRealize Operations Manager, you configure the VMware vSphere solution. The solution includes the vCenter Server adapter that collects data from the target vCenter Server instances.
Where You Find the Solution - VMware vSphereOn the menu, click Administration and in the left pane click Solutions > Cloud Accounts. On the Cloud Accounts page, click Add Account, and then select the vCenter card.
Account Information - VMware vSphere Account OptionsConfigure and modify cloud accounts, and define monitoring goals on the Account Information page.
vRealize Operations Manager Configuration Guide
VMware, Inc. 16
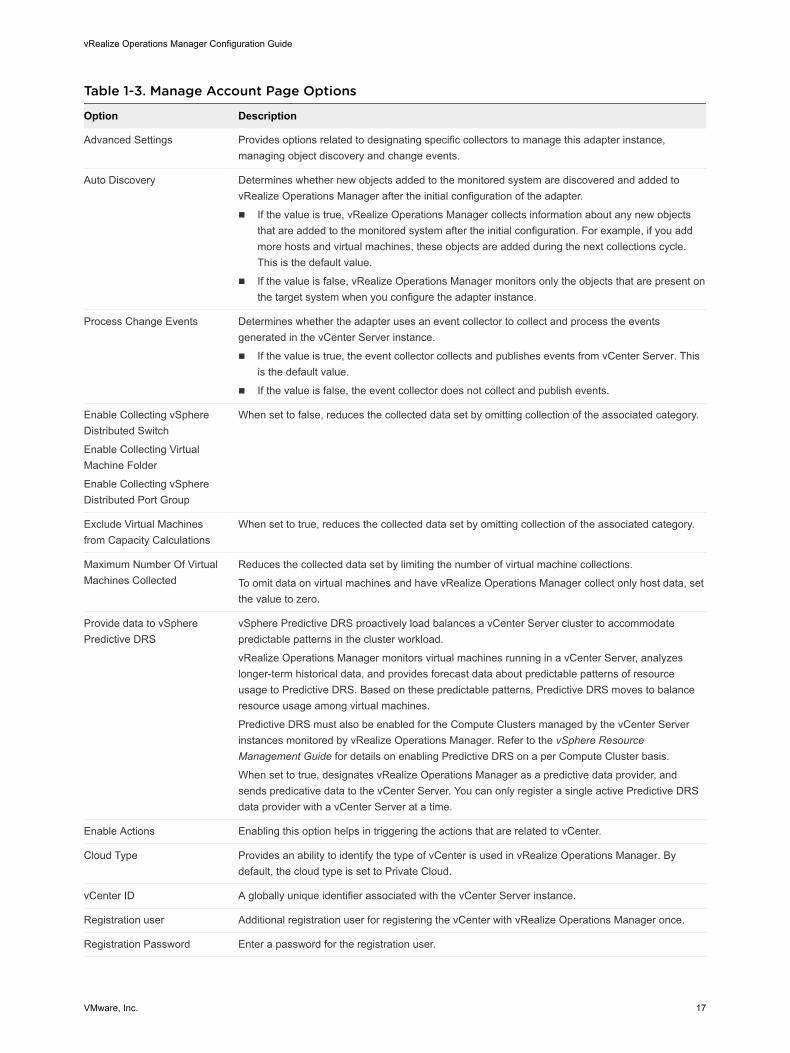
Table 1-3. Manage Account Page Options
Option Description
Advanced Settings Provides options related to designating specific collectors to manage this adapter instance, managing object discovery and change events.
Auto Discovery Determines whether new objects added to the monitored system are discovered and added to vRealize Operations Manager after the initial configuration of the adapter.
n If the value is true, vRealize Operations Manager collects information about any new objects that are added to the monitored system after the initial configuration. For example, if you add more hosts and virtual machines, these objects are added during the next collections cycle. This is the default value.
n If the value is false, vRealize Operations Manager monitors only the objects that are present on the target system when you configure the adapter instance.
Process Change Events Determines whether the adapter uses an event collector to collect and process the events generated in the vCenter Server instance.
n If the value is true, the event collector collects and publishes events from vCenter Server. This is the default value.
n If the value is false, the event collector does not collect and publish events.
Enable Collecting vSphere Distributed Switch
Enable Collecting Virtual Machine Folder
Enable Collecting vSphere Distributed Port Group
When set to false, reduces the collected data set by omitting collection of the associated category.
Exclude Virtual Machines from Capacity Calculations
When set to true, reduces the collected data set by omitting collection of the associated category.
Maximum Number Of Virtual Machines Collected
Reduces the collected data set by limiting the number of virtual machine collections.
To omit data on virtual machines and have vRealize Operations Manager collect only host data, set the value to zero.
Provide data to vSphere Predictive DRS
vSphere Predictive DRS proactively load balances a vCenter Server cluster to accommodate predictable patterns in the cluster workload.
vRealize Operations Manager monitors virtual machines running in a vCenter Server, analyzes longer-term historical data, and provides forecast data about predictable patterns of resource usage to Predictive DRS. Based on these predictable patterns, Predictive DRS moves to balance resource usage among virtual machines.
Predictive DRS must also be enabled for the Compute Clusters managed by the vCenter Server instances monitored by vRealize Operations Manager. Refer to the vSphere Resource Management Guide for details on enabling Predictive DRS on a per Compute Cluster basis.
When set to true, designates vRealize Operations Manager as a predictive data provider, and sends predicative data to the vCenter Server. You can only register a single active Predictive DRS data provider with a vCenter Server at a time.
Enable Actions Enabling this option helps in triggering the actions that are related to vCenter.
Cloud Type Provides an ability to identify the type of vCenter is used in vRealize Operations Manager. By default, the cloud type is set to Private Cloud.
vCenter ID A globally unique identifier associated with the vCenter Server instance.
Registration user Additional registration user for registering the vCenter with vRealize Operations Manager once.
Registration Password Enter a password for the registration user.
vRealize Operations Manager Configuration Guide
VMware, Inc. 17
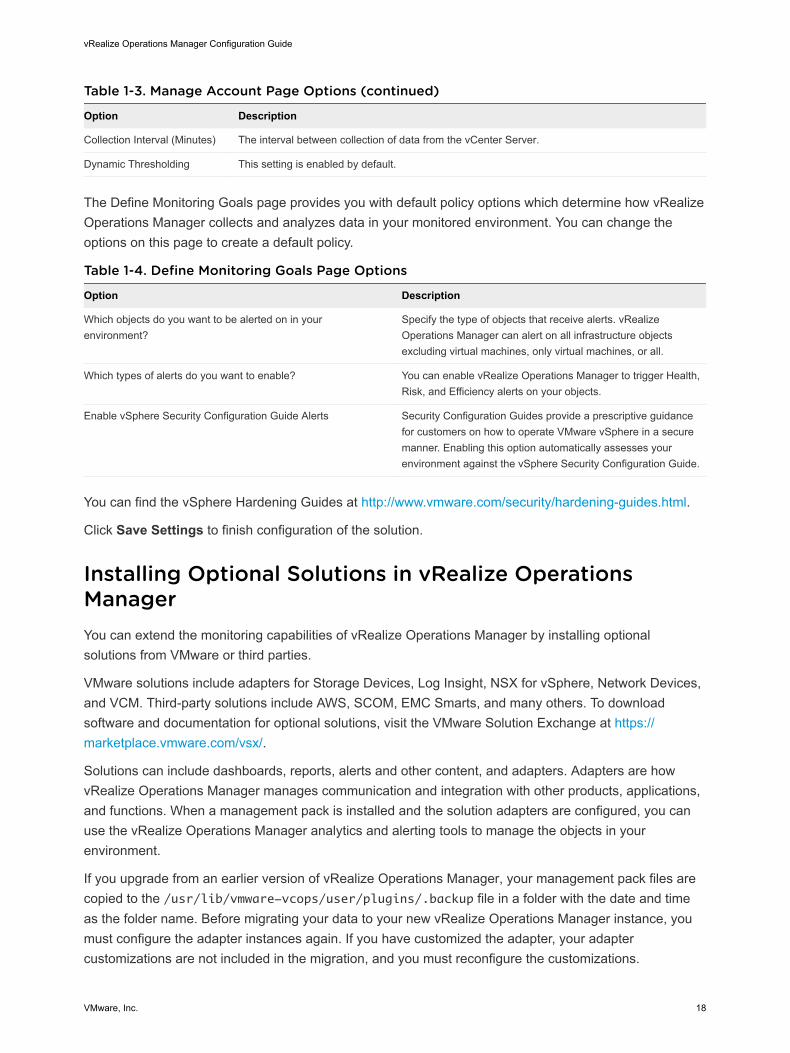
Table 1-3. Manage Account Page Options (continued)
Option Description
Collection Interval (Minutes) The interval between collection of data from the vCenter Server.
Dynamic Thresholding This setting is enabled by default.
The Define Monitoring Goals page provides you with default policy options which determine how vRealize Operations Manager collects and analyzes data in your monitored environment. You can change the options on this page to create a default policy.
Table 1-4. Define Monitoring Goals Page Options
Option Description
Which objects do you want to be alerted on in your environment?
Specify the type of objects that receive alerts. vRealize Operations Manager can alert on all infrastructure objects excluding virtual machines, only virtual machines, or all.
Which types of alerts do you want to enable? You can enable vRealize Operations Manager to trigger Health, Risk, and Efficiency alerts on your objects.
Enable vSphere Security Configuration Guide Alerts Security Configuration Guides provide a prescriptive guidance for customers on how to operate VMware vSphere in a secure manner. Enabling this option automatically assesses your environment against the vSphere Security Configuration Guide.
You can find the vSphere Hardening Guides at http://www.vmware.com/security/hardening-guides.html.
Click Save Settings to finish configuration of the solution.
Installing Optional Solutions in vRealize Operations ManagerYou can extend the monitoring capabilities of vRealize Operations Manager by installing optional solutions from VMware or third parties.
VMware solutions include adapters for Storage Devices, Log Insight, NSX for vSphere, Network Devices, and VCM. Third-party solutions include AWS, SCOM, EMC Smarts, and many others. To download software and documentation for optional solutions, visit the VMware Solution Exchange at https://marketplace.vmware.com/vsx/.
Solutions can include dashboards, reports, alerts and other content, and adapters. Adapters are how vRealize Operations Manager manages communication and integration with other products, applications, and functions. When a management pack is installed and the solution adapters are configured, you can use the vRealize Operations Manager analytics and alerting tools to manage the objects in your environment.
If you upgrade from an earlier version of vRealize Operations Manager, your management pack files are copied to the /usr/lib/vmware-vcops/user/plugins/.backup file in a folder with the date and time as the folder name. Before migrating your data to your new vRealize Operations Manager instance, you must configure the adapter instances again. If you have customized the adapter, your adapter customizations are not included in the migration, and you must reconfigure the customizations.
vRealize Operations Manager Configuration Guide
VMware, Inc. 18
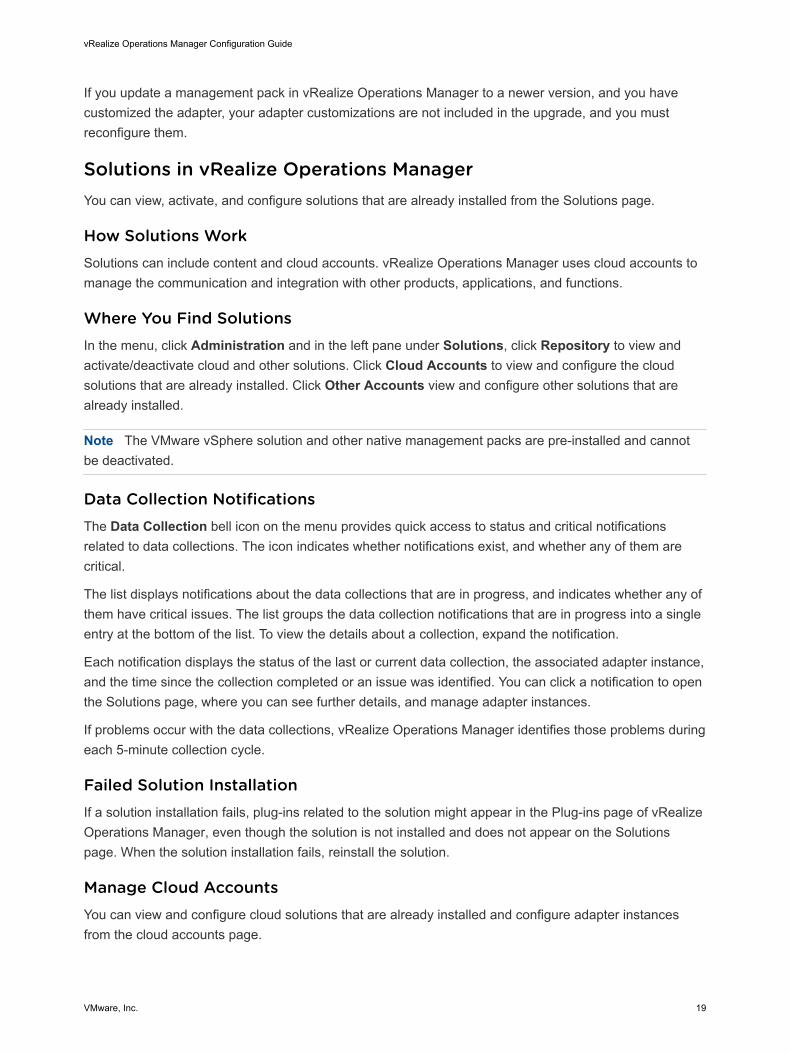
If you update a management pack in vRealize Operations Manager to a newer version, and you have customized the adapter, your adapter customizations are not included in the upgrade, and you must reconfigure them.
Solutions in vRealize Operations ManagerYou can view, activate, and configure solutions that are already installed from the Solutions page.
How Solutions WorkSolutions can include content and cloud accounts. vRealize Operations Manager uses cloud accounts to manage the communication and integration with other products, applications, and functions.
Where You Find SolutionsIn the menu, click Administration and in the left pane under Solutions, click Repository to view and activate/deactivate cloud and other solutions. Click Cloud Accounts to view and configure the cloud solutions that are already installed. Click Other Accounts view and configure other solutions that are already installed.
Note The VMware vSphere solution and other native management packs are pre-installed and cannot be deactivated.
Data Collection NotificationsThe Data Collection bell icon on the menu provides quick access to status and critical notifications related to data collections. The icon indicates whether notifications exist, and whether any of them are critical.
The list displays notifications about the data collections that are in progress, and indicates whether any of them have critical issues. The list groups the data collection notifications that are in progress into a single entry at the bottom of the list. To view the details about a collection, expand the notification.
Each notification displays the status of the last or current data collection, the associated adapter instance, and the time since the collection completed or an issue was identified. You can click a notification to open the Solutions page, where you can see further details, and manage adapter instances.
If problems occur with the data collections, vRealize Operations Manager identifies those problems during each 5-minute collection cycle.
Failed Solution InstallationIf a solution installation fails, plug-ins related to the solution might appear in the Plug-ins page of vRealize Operations Manager, even though the solution is not installed and does not appear on the Solutions page. When the solution installation fails, reinstall the solution.
Manage Cloud AccountsYou can view and configure cloud solutions that are already installed and configure adapter instances from the cloud accounts page.
vRealize Operations Manager Configuration Guide
VMware, Inc. 19
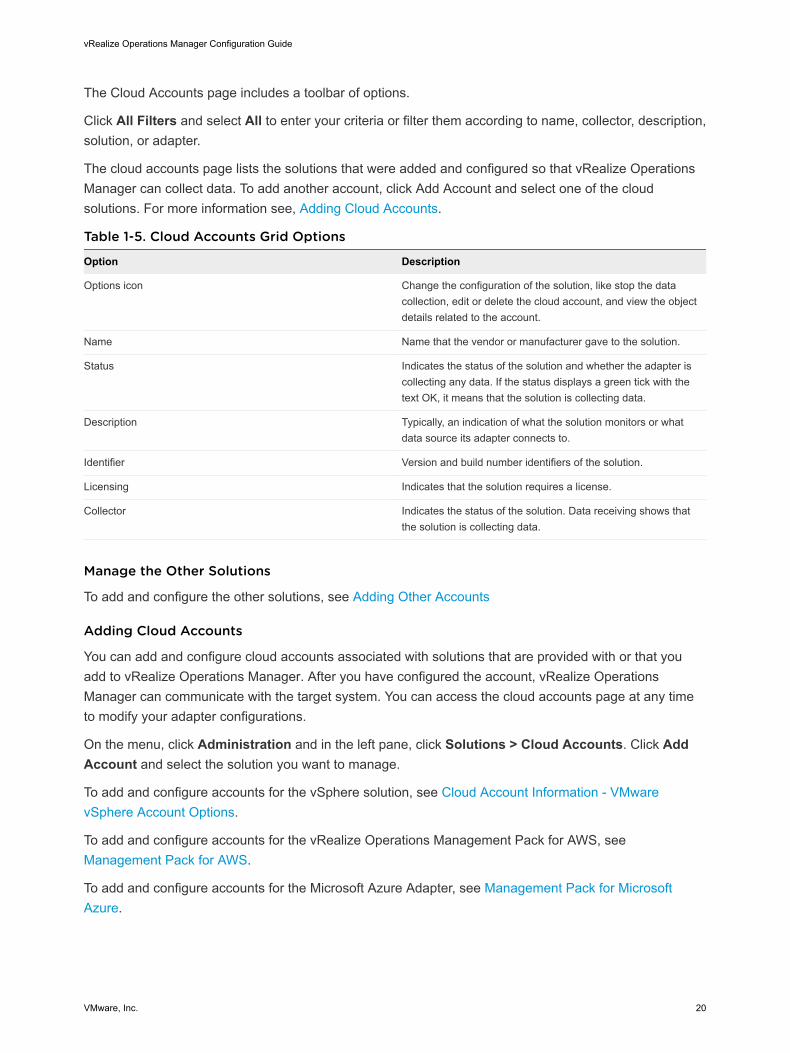
The Cloud Accounts page includes a toolbar of options.
Click All Filters and select All to enter your criteria or filter them according to name, collector, description, solution, or adapter.
The cloud accounts page lists the solutions that were added and configured so that vRealize Operations Manager can collect data. To add another account, click Add Account and select one of the cloud solutions. For more information see, Adding Cloud Accounts.
Table 1-5. Cloud Accounts Grid Options
Option Description
Options icon Change the configuration of the solution, like stop the data collection, edit or delete the cloud account, and view the object details related to the account.
Name Name that the vendor or manufacturer gave to the solution.
Status Indicates the status of the solution and whether the adapter is collecting any data. If the status displays a green tick with the text OK, it means that the solution is collecting data.
Description Typically, an indication of what the solution monitors or what data source its adapter connects to.
Identifier Version and build number identifiers of the solution.
Licensing Indicates that the solution requires a license.
Collector Indicates the status of the solution. Data receiving shows that the solution is collecting data.
Manage the Other Solutions
To add and configure the other solutions, see Adding Other Accounts
Adding Cloud Accounts
You can add and configure cloud accounts associated with solutions that are provided with or that you add to vRealize Operations Manager. After you have configured the account, vRealize Operations Manager can communicate with the target system. You can access the cloud accounts page at any time to modify your adapter configurations.
On the menu, click Administration and in the left pane, click Solutions > Cloud Accounts. Click Add Account and select the solution you want to manage.
To add and configure accounts for the vSphere solution, see Cloud Account Information - VMware vSphere Account Options.
To add and configure accounts for the vRealize Operations Management Pack for AWS, see Management Pack for AWS.
To add and configure accounts for the Microsoft Azure Adapter, see Management Pack for Microsoft Azure.
vRealize Operations Manager Configuration Guide
VMware, Inc. 20
Prerequisites
Note n Activate the cloud account before adding and configuring cloud accounts.
n VMware vSphere solution is activated by default and cannot be deactivated.
Importing Cloud Accounts
You can import and synchronize existing cloud accounts from vRealize Automation 8.x to vRealize Operations Manager.The Import Accounts page lists all the cloud accounts associated with vCenter Server, Amazon AWS, and Microsoft Azure that are not managed by vRealize Operations Manager. You can select and import these accounts into vRealize Operations Manager directly with existing credentials as defined in vRealize Automation or add or edit the credentials before the import process. The Import Accounts option is hidden from the user until the integration with vRealized Automation 8.x is enabled from the integration page under Administration > Management.
Prerequisites
n Verify that vRealize Automation 8.x is enabled from Administration > Management > Integrations in vRealize Operations Manager.
n Verify that you know the vCenter Server credentials that have sufficient privileges to connect and collect data.
n Verify that the user has privileges of Organizational Owner and Cloud Assembly administrator set in vRealize Automation.
Procedure
1 In the menu, click Administration and then in the left pane, click Cloud Accounts > Import Accounts.
2 From the Import Accounts page, select the cloud account you want to import.
3 To override an existing credential from vRealize Automation, click the Edit icon next to Edit Credential.
n Select the existing credential from the Credential drop-down menu and click Save.
n To add a new credential, click the plus icon next to the Credential drop-down menu and enter the credential details and click Save.
4 Select the collector/group from the drop-down menu.
5 Click Validate to verify that the connection is successful.
6 Click Import.
The imported cloud account is listed in the Cloud Accounts page. After the data collection for the cloud account is complete the configuration status changes from Warning to OK.
vRealize Operations Manager Configuration Guide
VMware, Inc. 21
Manage Other AccountsYou can view and configure native management packs and other solutions that are already installed and configure adapter instances from the other accounts page.
Note You need to activate solutions before configuring them. For more information, see Solutions Repository Page
The Other Accounts page includes a toolbar of options.
Click All Filters and select All to enter your criteria or filter them according to name, collector, description, solution, or adapter.
The other accounts page lists the solutions that were added and configured so that vRealize Operations Manager can collect data. To add another account, click Add Account and select one of the solutions. For more information see, Adding Other Accounts.
Table 1-6. Cloud Accounts Grid Options
Option Description
Options icon Change the configuration of the solution, like stop the data collection, edit or delete the cloud account, and view the object details related to the account.
Name Name that the vendor or manufacturer gave to the solution.
Status Indicates the status of the solution and whether the adapter is collecting any data. If the status displays a green tick with the text OK, it means that the solution is collecting data.
Description Typically, an indication of what the solution monitors or what data source its adapter connects to.
Identifier Version and build number identifiers of the solution.
Licensing Indicates that the solution requires a license.
Collector Indicates the status of the solution. Data receiving shows that the solution is collecting data.
Manage the Cloud Solutions
To add and configure the cloud accounts, see Manage Other Accounts
Adding Other Accounts
You can add and configure accounts associated with other solutions that you add to vRealize Operations Manager. After you have configured the account, vRealize Operations Manager can collect data from or send data to the target system. You can access the other accounts page at any time to modify your adapter configurations.
Note n Activate the solutions before adding and configuring other accounts.
vRealize Operations Manager Configuration Guide
VMware, Inc. 22
On the menu, click Administration and in the left pane, click Solutions > Other Accounts. Click Add Accounts and select the solution you want to manage.
The options available depend on the selected solution.
Manage IntegrationsvRealize Operations Manager includes a central page where you can configure and integrate your end points to communicate with the vRealize Automation management pack and vRealize Log Insight Management Pack.
Where You Find Integrations
On the menu, click Administration and in the left pane click Management > Integrations.
Table 1-7. Integration Page Options
Property Description
Configure Allows you to configure and integrate your adapter instance.
Edit Allows you to edit the integrated adapter instance.
Deactivate Removes the adapter instance and clears the objects associated with the instance from the system, including historical data and role assignments.
Pause Stops the data collection process.
Name Displays the name of the Integrated adapter instance.
Version Displays the version of the integrated adapter instance.
Status Displays warning, OK, or Not Configured state of the integrated adapter instance.
Solutions Repository PageYou can activate or deactivate native management packs and add or upgrade other management packs from the Repository page.
Where You Find the Repository Page
In the menu, click Administration. From the left pane, select Solutions > Repository.
Table 1-8. Repository Page Options
Options Descriptions
VMware Native Management Packs
Name Name that the vendor or manufacturer gave to the solution.
vRealize Operations Manager Configuration Guide
VMware, Inc. 23
Table 1-8. Repository Page Options (continued)
Options Descriptions
Activate Installs the native management pack. You can configure cloud management packs after activation from Solutions > Cloud Accounts. You can configure all other management packs after activation from Solutions > Other Accounts.
The activation starts only if all the cluster's nodes are accessible.
Note Pre-Installed management packs are activated by default. You can configure them from the Cloud Accounts or the Other Accounts page as applicable. Click Add Account configure the solutions.
Deactivate Uninstalls the management pack.
Note Pre-installed management packs cannot be deactivated.
Status Indicates whether the management pack has been configured or not. A green tick symbolizes that the management pack has been successfully installed. If configured, you can view the number of accounts associated to it.
To view or edit the accounts, click the account link to navigate to the accounts page associated to the management pack.
Provided By Vendor or manufacturer that created the solution.
Version Version and build number identifiers of the solution.
View Content Displays the list of content that has been deployed using the management pack.
Reset Default Content This option is only available for VMware vSphere solution.
After you update your instance of vRealize Operations Manager and select the option to overwrite alert definitions and symptom definitions, you must overwrite your existing compliance alert definitions.
Reset Default Content ensures that compliance standards are current for your vSphere 6.0 and 5.5 objects. The alert definitions and symptom definitions now include the compliance standards for both vSphere 6.0 and 5.5.
When you upgrade your current version of vRealize Operations Manager, you must select this option to overwrite alert definitions and symptom definitions. If you do not overwrite alert and symptom definitions, compliance rules use a mixture of new and outdated definitions.
Other Management Packs
Add/Upgrade You can add a management pack. For more details, see the topic called Add Solutions Wizard.
Add Solutions WizardSolutions are delivered as PAK files that you upload, license, and install.
vRealize Operations Manager Configuration Guide
VMware, Inc. 24
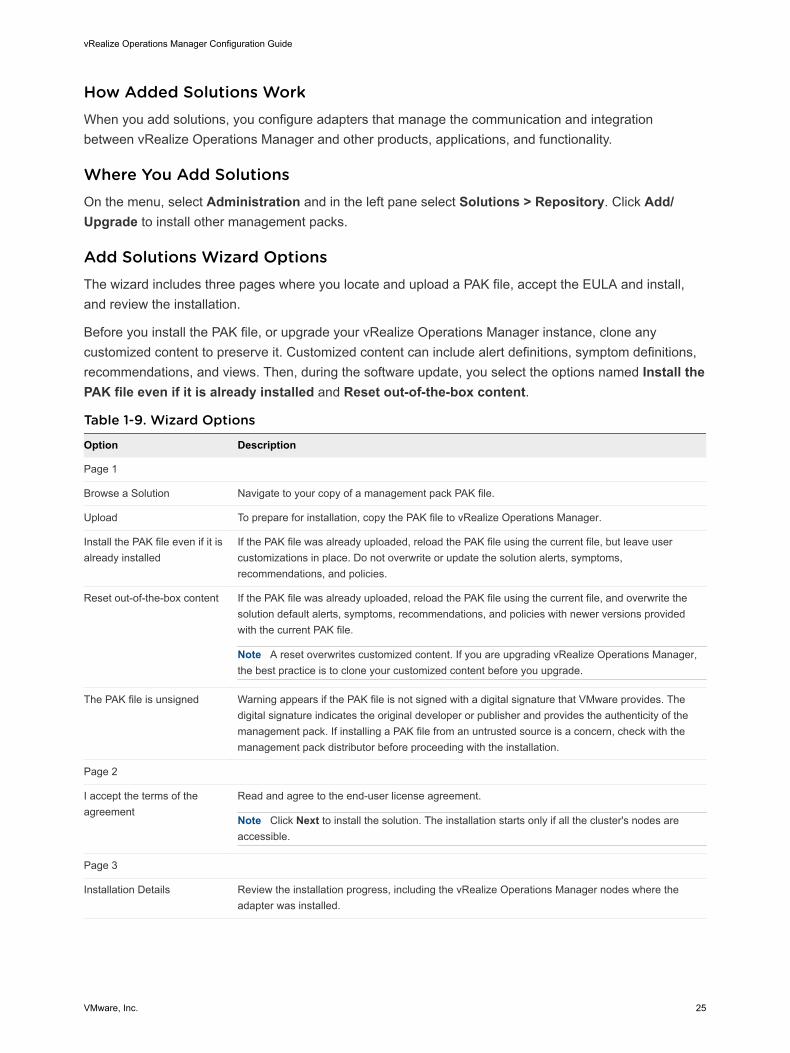
How Added Solutions WorkWhen you add solutions, you configure adapters that manage the communication and integration between vRealize Operations Manager and other products, applications, and functionality.
Where You Add SolutionsOn the menu, select Administration and in the left pane select Solutions > Repository. Click Add/Upgrade to install other management packs.
Add Solutions Wizard OptionsThe wizard includes three pages where you locate and upload a PAK file, accept the EULA and install, and review the installation.
Before you install the PAK file, or upgrade your vRealize Operations Manager instance, clone any customized content to preserve it. Customized content can include alert definitions, symptom definitions, recommendations, and views. Then, during the software update, you select the options named Install the PAK file even if it is already installed and Reset out-of-the-box content.
Table 1-9. Wizard Options
Option Description
Page 1
Browse a Solution Navigate to your copy of a management pack PAK file.
Upload To prepare for installation, copy the PAK file to vRealize Operations Manager.
Install the PAK file even if it is already installed
If the PAK file was already uploaded, reload the PAK file using the current file, but leave user customizations in place. Do not overwrite or update the solution alerts, symptoms, recommendations, and policies.
Reset out-of-the-box content If the PAK file was already uploaded, reload the PAK file using the current file, and overwrite the solution default alerts, symptoms, recommendations, and policies with newer versions provided with the current PAK file.
Note A reset overwrites customized content. If you are upgrading vRealize Operations Manager, the best practice is to clone your customized content before you upgrade.
The PAK file is unsigned Warning appears if the PAK file is not signed with a digital signature that VMware provides. The digital signature indicates the original developer or publisher and provides the authenticity of the management pack. If installing a PAK file from an untrusted source is a concern, check with the management pack distributor before proceeding with the installation.
Page 2
I accept the terms of the agreement
Read and agree to the end-user license agreement.
Note Click Next to install the solution. The installation starts only if all the cluster's nodes are accessible.
Page 3
Installation Details Review the installation progress, including the vRealize Operations Manager nodes where the adapter was installed.
vRealize Operations Manager Configuration Guide
VMware, Inc. 25
Managing Solution CredentialsCredentials are the user accounts that vRealize Operations Manager uses to enable one or more solutions and associated adapters, and to establish communication with the target data sources. The credentials are supplied when you configure each adapter. You can add or modify the credential settings outside the adapter configuration process to accommodate changes to your environment.
For example, if you are modifying credentials to accommodate changes based on your password policy, the adapters configured with these credentials begin using the new user name and password to communicate between vRealize Operations Manager and the target system.
Another use of credential management is to remove misconfigured credentials. If you delete valid credentials that were in active use by an adapter, you disable the communication between the two systems.
If you need to change the configured credential to accommodate changes in your environment, you can edit the credential settings without being required to configure a new adapter instance for the target system. To edit credential settings, click Administration on the menu, and in the left pane, click Management> Credentials.
Any adapter credential you add is shared with other adapter administrators and vRealize Operations Manager collector hosts. Other administrators might use these credentials to configure a new adapter instance or to move an adapter instance to a new host.
CredentialsThe credentials are the collection configuration settings, for example, user names and passwords, that the adapters use to authenticate the connection on the external data sources. Other credentials can include values such as domain names, pass phrases, or proxy credentials. You can configure for one or more solutions to connect to data sources as you manage your changing environment.
Where You Find Credentials
On the menu, click Administration and in the left pane click Management > Credentials.
vRealize Operations Manager Configuration Guide
VMware, Inc. 26
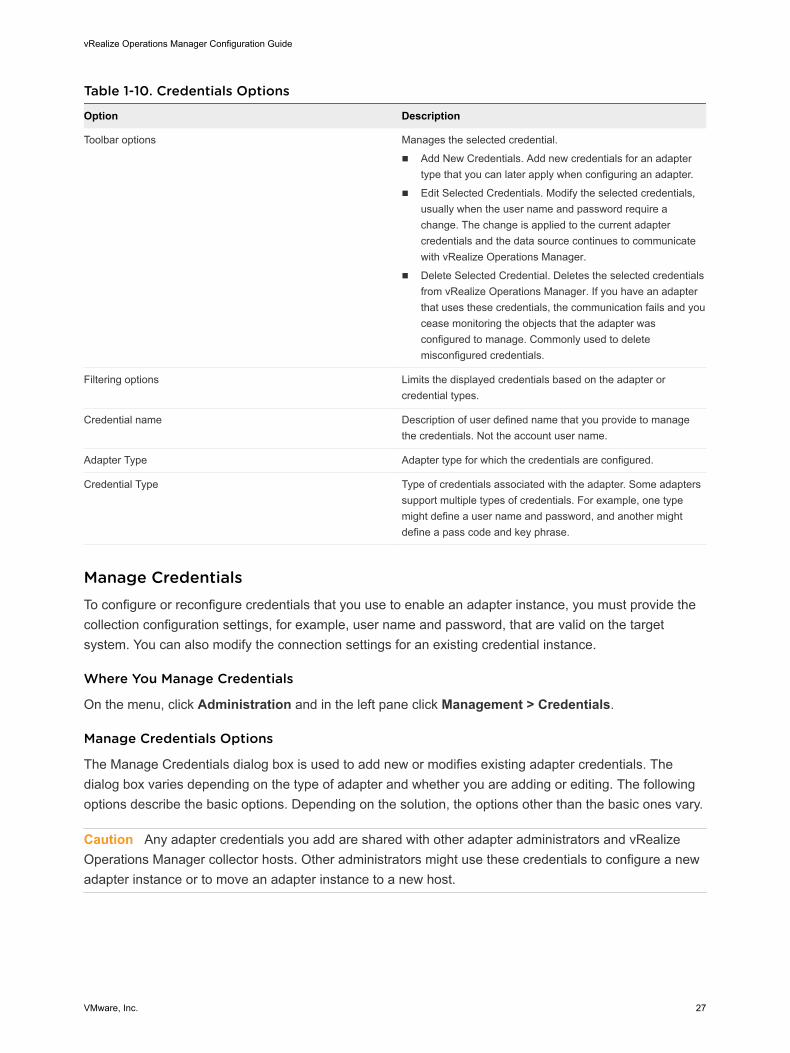
Table 1-10. Credentials Options
Option Description
Toolbar options Manages the selected credential.
n Add New Credentials. Add new credentials for an adapter type that you can later apply when configuring an adapter.
n Edit Selected Credentials. Modify the selected credentials, usually when the user name and password require a change. The change is applied to the current adapter credentials and the data source continues to communicate with vRealize Operations Manager.
n Delete Selected Credential. Deletes the selected credentials from vRealize Operations Manager. If you have an adapter that uses these credentials, the communication fails and you cease monitoring the objects that the adapter was configured to manage. Commonly used to delete misconfigured credentials.
Filtering options Limits the displayed credentials based on the adapter or credential types.
Credential name Description of user defined name that you provide to manage the credentials. Not the account user name.
Adapter Type Adapter type for which the credentials are configured.
Credential Type Type of credentials associated with the adapter. Some adapters support multiple types of credentials. For example, one type might define a user name and password, and another might define a pass code and key phrase.
Manage CredentialsTo configure or reconfigure credentials that you use to enable an adapter instance, you must provide the collection configuration settings, for example, user name and password, that are valid on the target system. You can also modify the connection settings for an existing credential instance.
Where You Manage Credentials
On the menu, click Administration and in the left pane click Management > Credentials.
Manage Credentials Options
The Manage Credentials dialog box is used to add new or modifies existing adapter credentials. The dialog box varies depending on the type of adapter and whether you are adding or editing. The following options describe the basic options. Depending on the solution, the options other than the basic ones vary.
Caution Any adapter credentials you add are shared with other adapter administrators and vRealize Operations Manager collector hosts. Other administrators might use these credentials to configure a new adapter instance or to move an adapter instance to a new host.
vRealize Operations Manager Configuration Guide
VMware, Inc. 27
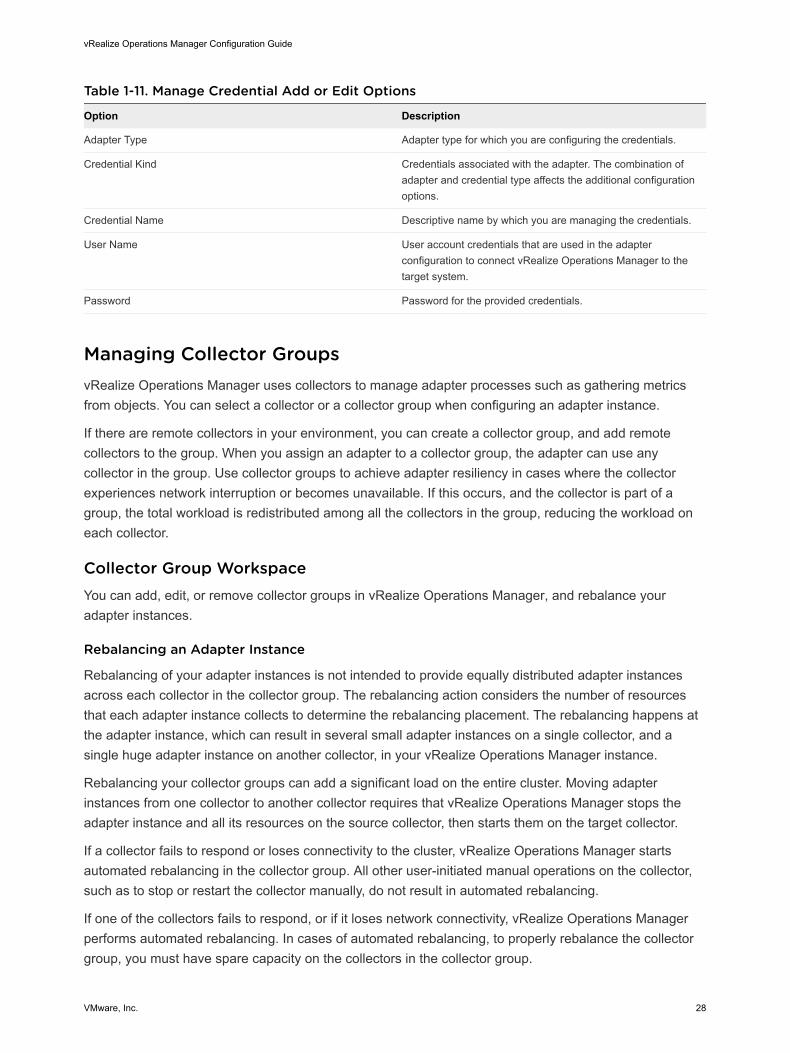
Table 1-11. Manage Credential Add or Edit Options
Option Description
Adapter Type Adapter type for which you are configuring the credentials.
Credential Kind Credentials associated with the adapter. The combination of adapter and credential type affects the additional configuration options.
Credential Name Descriptive name by which you are managing the credentials.
User Name User account credentials that are used in the adapter configuration to connect vRealize Operations Manager to the target system.
Password Password for the provided credentials.
Managing Collector GroupsvRealize Operations Manager uses collectors to manage adapter processes such as gathering metrics from objects. You can select a collector or a collector group when configuring an adapter instance.
If there are remote collectors in your environment, you can create a collector group, and add remote collectors to the group. When you assign an adapter to a collector group, the adapter can use any collector in the group. Use collector groups to achieve adapter resiliency in cases where the collector experiences network interruption or becomes unavailable. If this occurs, and the collector is part of a group, the total workload is redistributed among all the collectors in the group, reducing the workload on each collector.
Collector Group WorkspaceYou can add, edit, or remove collector groups in vRealize Operations Manager, and rebalance your adapter instances.
Rebalancing an Adapter Instance
Rebalancing of your adapter instances is not intended to provide equally distributed adapter instances across each collector in the collector group. The rebalancing action considers the number of resources that each adapter instance collects to determine the rebalancing placement. The rebalancing happens at the adapter instance, which can result in several small adapter instances on a single collector, and a single huge adapter instance on another collector, in your vRealize Operations Manager instance.
Rebalancing your collector groups can add a significant load on the entire cluster. Moving adapter instances from one collector to another collector requires that vRealize Operations Manager stops the adapter instance and all its resources on the source collector, then starts them on the target collector.
If a collector fails to respond or loses connectivity to the cluster, vRealize Operations Manager starts automated rebalancing in the collector group. All other user-initiated manual operations on the collector, such as to stop or restart the collector manually, do not result in automated rebalancing.
If one of the collectors fails to respond, or if it loses network connectivity, vRealize Operations Manager performs automated rebalancing. In cases of automated rebalancing, to properly rebalance the collector group, you must have spare capacity on the collectors in the collector group.
vRealize Operations Manager Configuration Guide
VMware, Inc. 28
Where You Manage Collector Groups
On the menu, click Administration and in the left pane click Management > Collector Groups.
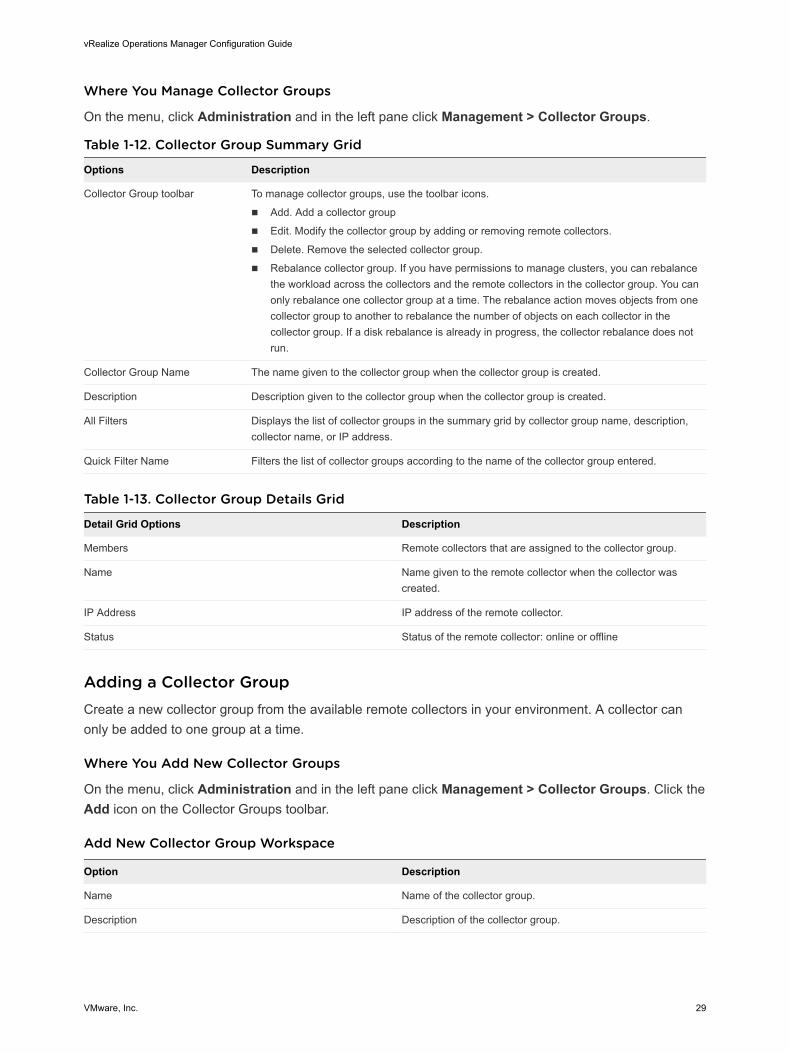
Table 1-12. Collector Group Summary Grid
Options Description
Collector Group toolbar To manage collector groups, use the toolbar icons.
n Add. Add a collector group
n Edit. Modify the collector group by adding or removing remote collectors.
n Delete. Remove the selected collector group.
n Rebalance collector group. If you have permissions to manage clusters, you can rebalance the workload across the collectors and the remote collectors in the collector group. You can only rebalance one collector group at a time. The rebalance action moves objects from one collector group to another to rebalance the number of objects on each collector in the collector group. If a disk rebalance is already in progress, the collector rebalance does not run.
Collector Group Name The name given to the collector group when the collector group is created.
Description Description given to the collector group when the collector group is created.
All Filters Displays the list of collector groups in the summary grid by collector group name, description, collector name, or IP address.
Quick Filter Name Filters the list of collector groups according to the name of the collector group entered.
Table 1-13. Collector Group Details Grid
Detail Grid Options Description
Members Remote collectors that are assigned to the collector group.
Name Name given to the remote collector when the collector was created.
IP Address IP address of the remote collector.
Status Status of the remote collector: online or offline
Adding a Collector GroupCreate a new collector group from the available remote collectors in your environment. A collector can only be added to one group at a time.
Where You Add New Collector Groups
On the menu, click Administration and in the left pane click Management > Collector Groups. Click the Add icon on the Collector Groups toolbar.
Add New Collector Group Workspace
Option Description
Name Name of the collector group.
Description Description of the collector group.
vRealize Operations Manager Configuration Guide
VMware, Inc. 29
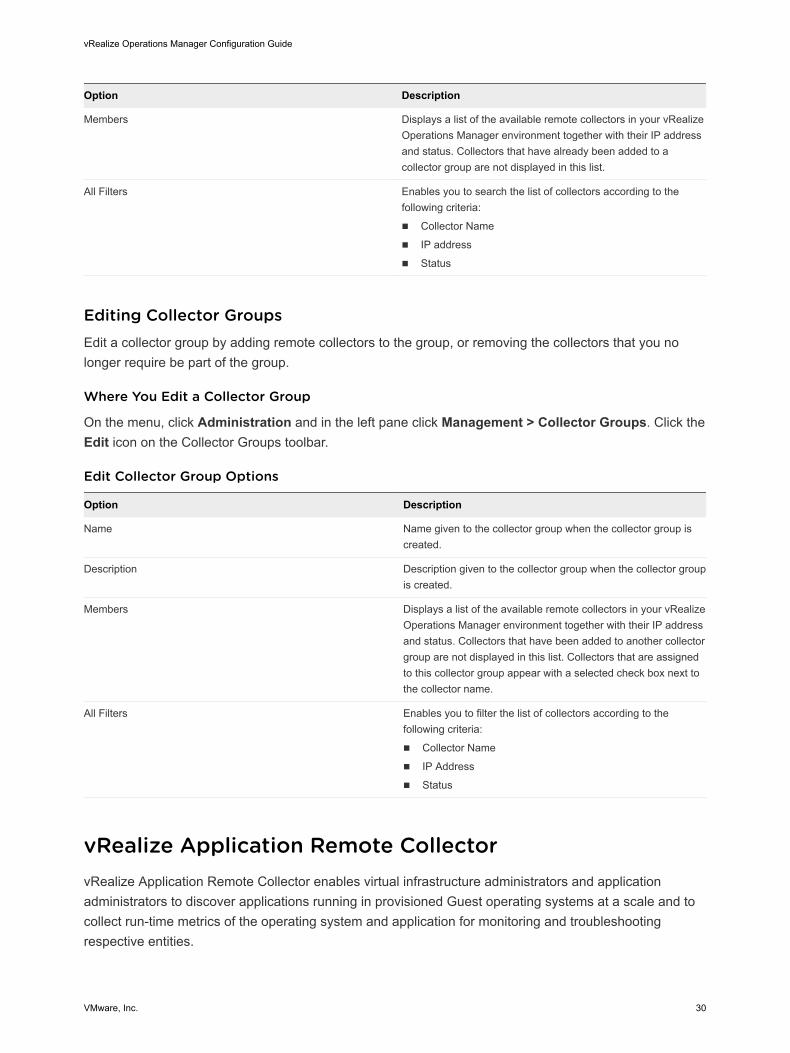
Option Description
Members Displays a list of the available remote collectors in your vRealize Operations Manager environment together with their IP address and status. Collectors that have already been added to a collector group are not displayed in this list.
All Filters Enables you to search the list of collectors according to the following criteria:
n Collector Name
n IP address
n Status
Editing Collector GroupsEdit a collector group by adding remote collectors to the group, or removing the collectors that you no longer require be part of the group.
Where You Edit a Collector Group
On the menu, click Administration and in the left pane click Management > Collector Groups. Click the Edit icon on the Collector Groups toolbar.
Edit Collector Group Options
Option Description
Name Name given to the collector group when the collector group is created.
Description Description given to the collector group when the collector group is created.
Members Displays a list of the available remote collectors in your vRealize Operations Manager environment together with their IP address and status. Collectors that have been added to another collector group are not displayed in this list. Collectors that are assigned to this collector group appear with a selected check box next to the collector name.
All Filters Enables you to filter the list of collectors according to the following criteria:
n Collector Name
n IP Address
n Status
vRealize Application Remote CollectorvRealize Application Remote Collector enables virtual infrastructure administrators and application administrators to discover applications running in provisioned Guest operating systems at a scale and to collect run-time metrics of the operating system and application for monitoring and troubleshooting respective entities.
vRealize Operations Manager Configuration Guide
VMware, Inc. 30
vRealize Application Remote Collector
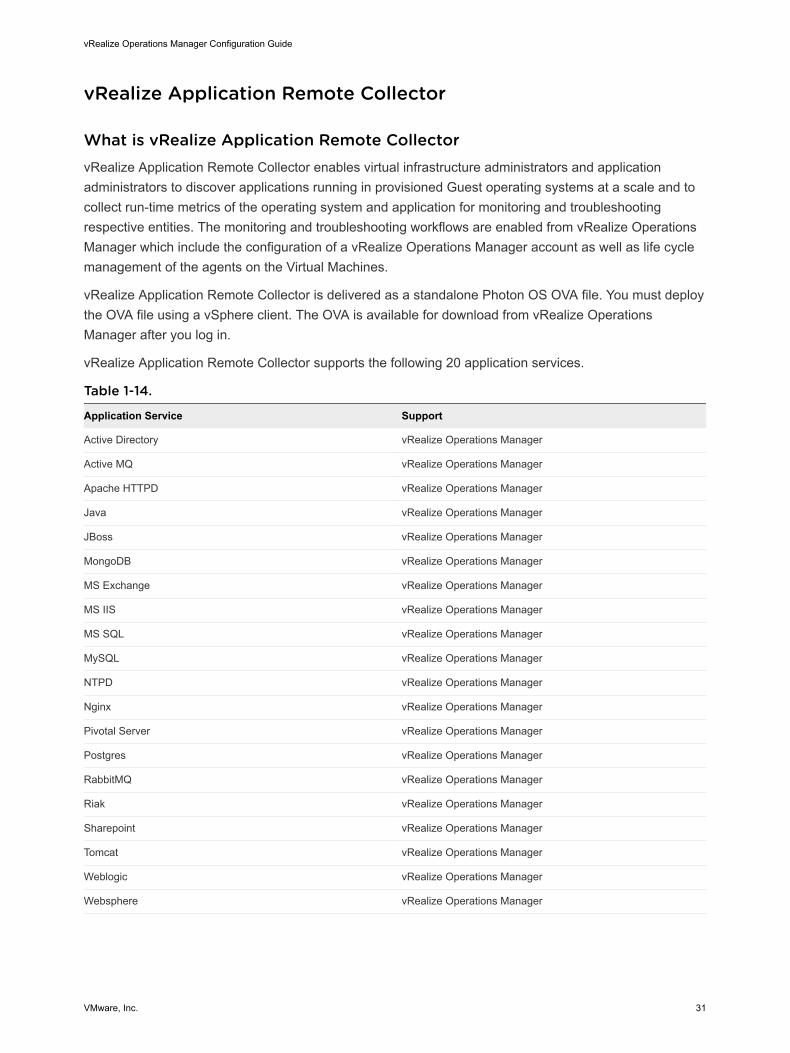
What is vRealize Application Remote CollectorvRealize Application Remote Collector enables virtual infrastructure administrators and application administrators to discover applications running in provisioned Guest operating systems at a scale and to collect run-time metrics of the operating system and application for monitoring and troubleshooting respective entities. The monitoring and troubleshooting workflows are enabled from vRealize Operations Manager which include the configuration of a vRealize Operations Manager account as well as life cycle management of the agents on the Virtual Machines.
vRealize Application Remote Collector is delivered as a standalone Photon OS OVA file. You must deploy the OVA file using a vSphere client. The OVA is available for download from vRealize Operations Manager after you log in.
vRealize Application Remote Collector supports the following 20 application services.
Table 1-14.
Application Service Support
Active Directory vRealize Operations Manager
Active MQ vRealize Operations Manager
Apache HTTPD vRealize Operations Manager
Java vRealize Operations Manager
JBoss vRealize Operations Manager
MongoDB vRealize Operations Manager
MS Exchange vRealize Operations Manager
MS IIS vRealize Operations Manager
MS SQL vRealize Operations Manager
MySQL vRealize Operations Manager
NTPD vRealize Operations Manager
Nginx vRealize Operations Manager
Pivotal Server vRealize Operations Manager
Postgres vRealize Operations Manager
RabbitMQ vRealize Operations Manager
Riak vRealize Operations Manager
Sharepoint vRealize Operations Manager
Tomcat vRealize Operations Manager
Weblogic vRealize Operations Manager
Websphere vRealize Operations Manager
vRealize Operations Manager Configuration Guide
VMware, Inc. 31
Deploy vRealize Application Remote Collector
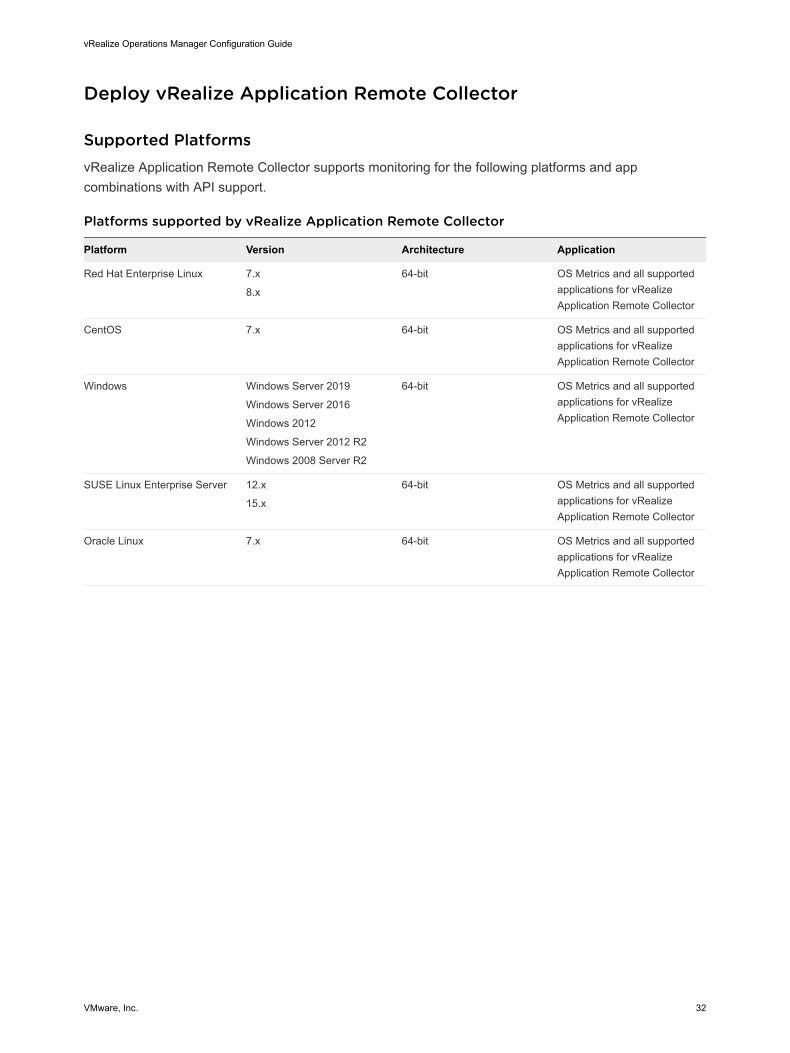
Supported PlatformsvRealize Application Remote Collector supports monitoring for the following platforms and app combinations with API support.
Platforms supported by vRealize Application Remote Collector
Platform Version Architecture Application
Red Hat Enterprise Linux 7.x
8.x
64-bit OS Metrics and all supported applications for vRealize Application Remote Collector
CentOS 7.x 64-bit OS Metrics and all supported applications for vRealize Application Remote Collector
Windows Windows Server 2019
Windows Server 2016
Windows 2012
Windows Server 2012 R2
Windows 2008 Server R2
64-bit OS Metrics and all supported applications for vRealize Application Remote Collector
SUSE Linux Enterprise Server 12.x
15.x
64-bit OS Metrics and all supported applications for vRealize Application Remote Collector
Oracle Linux 7.x 64-bit OS Metrics and all supported applications for vRealize Application Remote Collector
vRealize Operations Manager Configuration Guide
VMware, Inc. 32
Platform Version Architecture Application
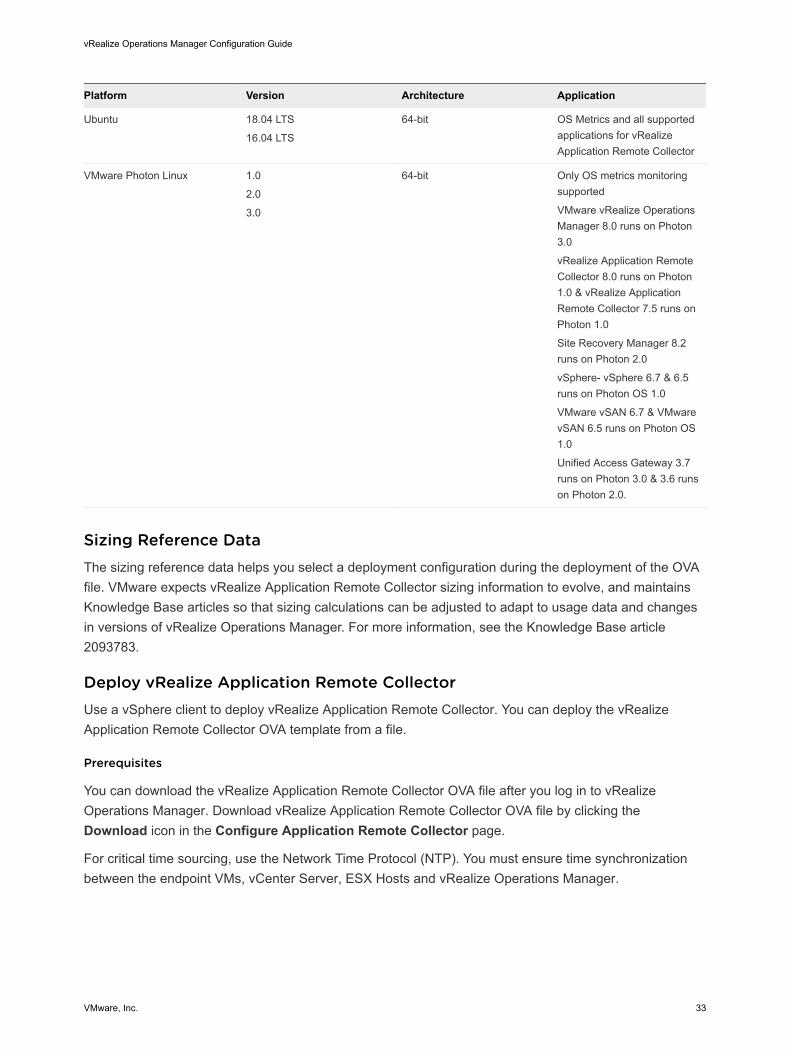
Ubuntu 18.04 LTS
16.04 LTS
64-bit OS Metrics and all supported applications for vRealize Application Remote Collector
VMware Photon Linux 1.0
2.0
3.0
64-bit Only OS metrics monitoring supported
VMware vRealize Operations Manager 8.0 runs on Photon 3.0
vRealize Application Remote Collector 8.0 runs on Photon 1.0 & vRealize Application Remote Collector 7.5 runs on Photon 1.0
Site Recovery Manager 8.2 runs on Photon 2.0
vSphere- vSphere 6.7 & 6.5 runs on Photon OS 1.0
VMware vSAN 6.7 & VMware vSAN 6.5 runs on Photon OS 1.0
Unified Access Gateway 3.7 runs on Photon 3.0 & 3.6 runs on Photon 2.0.
Sizing Reference DataThe sizing reference data helps you select a deployment configuration during the deployment of the OVA file. VMware expects vRealize Application Remote Collector sizing information to evolve, and maintains Knowledge Base articles so that sizing calculations can be adjusted to adapt to usage data and changes in versions of vRealize Operations Manager. For more information, see the Knowledge Base article 2093783.
Deploy vRealize Application Remote CollectorUse a vSphere client to deploy vRealize Application Remote Collector. You can deploy the vRealize Application Remote Collector OVA template from a file.
Prerequisites
You can download the vRealize Application Remote Collector OVA file after you log in to vRealize Operations Manager. Download vRealize Application Remote Collector OVA file by clicking the Download icon in the Configure Application Remote Collector page.
For critical time sourcing, use the Network Time Protocol (NTP). You must ensure time synchronization between the endpoint VMs, vCenter Server, ESX Hosts and vRealize Operations Manager.
vRealize Operations Manager Configuration Guide
VMware, Inc. 33
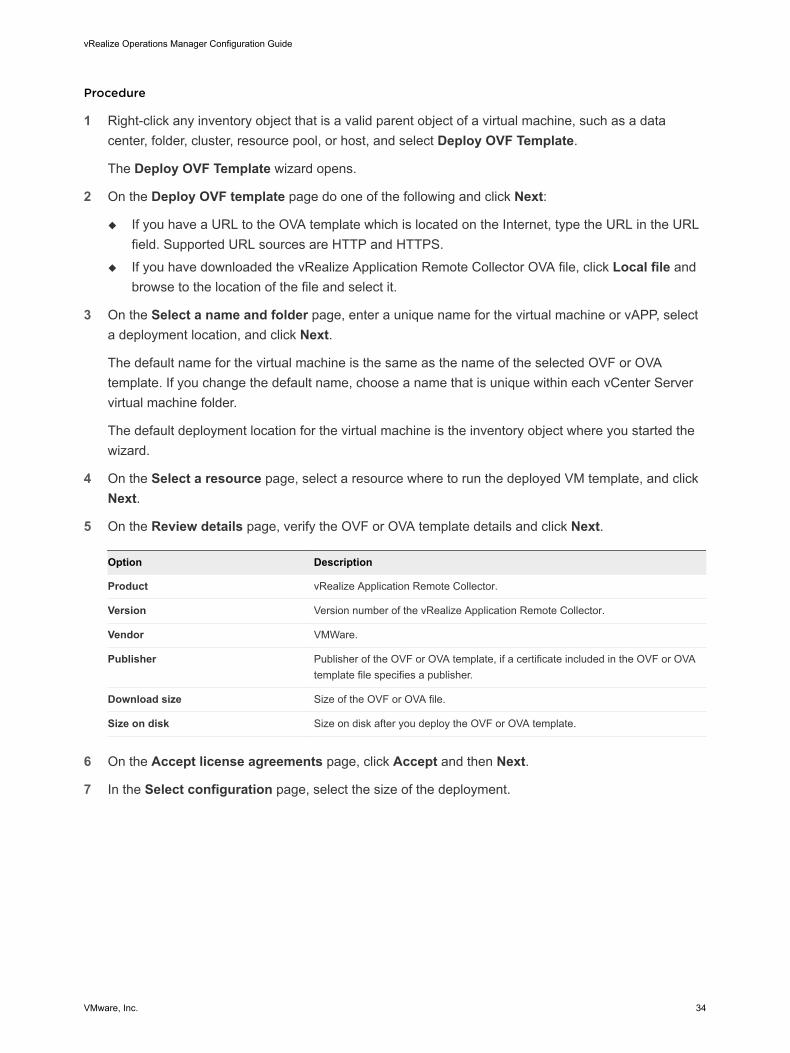
Procedure
1 Right-click any inventory object that is a valid parent object of a virtual machine, such as a data center, folder, cluster, resource pool, or host, and select Deploy OVF Template.
The Deploy OVF Template wizard opens.
2 On the Deploy OVF template page do one of the following and click Next:
u If you have a URL to the OVA template which is located on the Internet, type the URL in the URL field. Supported URL sources are HTTP and HTTPS.
u If you have downloaded the vRealize Application Remote Collector OVA file, click Local file and browse to the location of the file and select it.
3 On the Select a name and folder page, enter a unique name for the virtual machine or vAPP, select a deployment location, and click Next.
The default name for the virtual machine is the same as the name of the selected OVF or OVA template. If you change the default name, choose a name that is unique within each vCenter Server virtual machine folder.
The default deployment location for the virtual machine is the inventory object where you started the wizard.
4 On the Select a resource page, select a resource where to run the deployed VM template, and click Next.
5 On the Review details page, verify the OVF or OVA template details and click Next.
Option Description
Product vRealize Application Remote Collector.
Version Version number of the vRealize Application Remote Collector.
Vendor VMWare.
Publisher Publisher of the OVF or OVA template, if a certificate included in the OVF or OVA template file specifies a publisher.
Download size Size of the OVF or OVA file.
Size on disk Size on disk after you deploy the OVF or OVA template.
6 On the Accept license agreements page, click Accept and then Next.
7 In the Select configuration page, select the size of the deployment.
vRealize Operations Manager Configuration Guide
VMware, Inc. 34
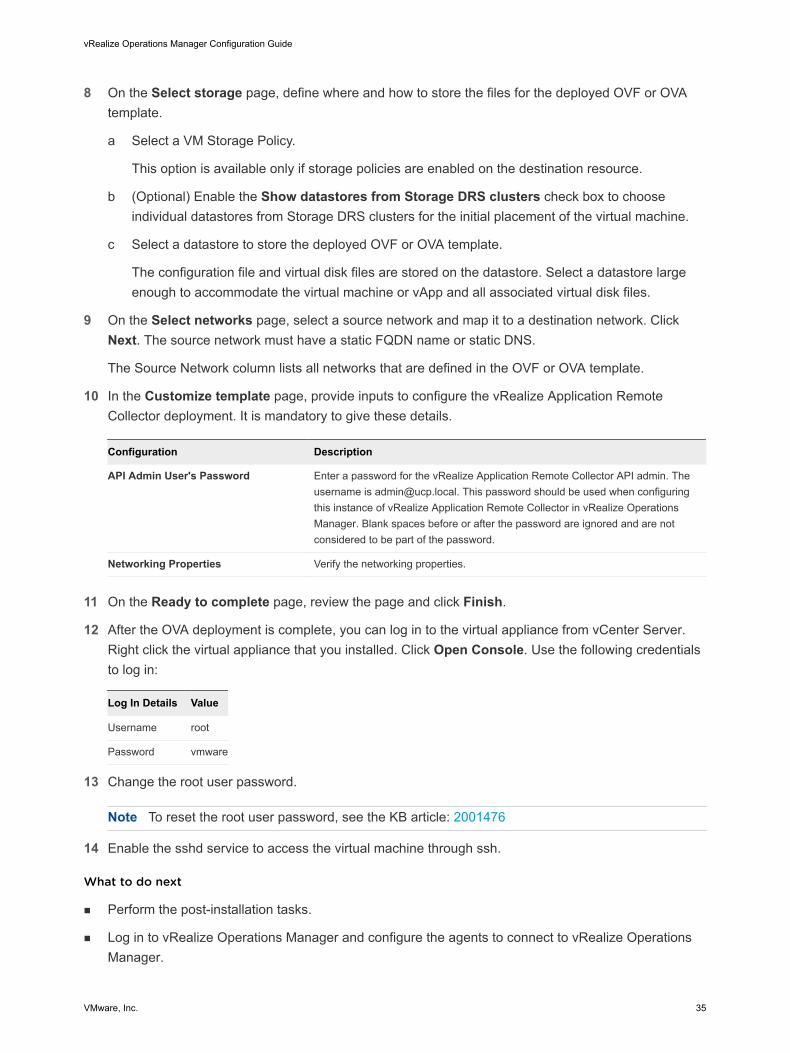
8 On the Select storage page, define where and how to store the files for the deployed OVF or OVA template.
a Select a VM Storage Policy.
This option is available only if storage policies are enabled on the destination resource.
b (Optional) Enable the Show datastores from Storage DRS clusters check box to choose individual datastores from Storage DRS clusters for the initial placement of the virtual machine.
c Select a datastore to store the deployed OVF or OVA template.
The configuration file and virtual disk files are stored on the datastore. Select a datastore large enough to accommodate the virtual machine or vApp and all associated virtual disk files.
9 On the Select networks page, select a source network and map it to a destination network. Click Next. The source network must have a static FQDN name or static DNS.
The Source Network column lists all networks that are defined in the OVF or OVA template.
10 In the Customize template page, provide inputs to configure the vRealize Application Remote Collector deployment. It is mandatory to give these details.
Configuration Description
API Admin User's Password Enter a password for the vRealize Application Remote Collector API admin. The username is [email protected]. This password should be used when configuring this instance of vRealize Application Remote Collector in vRealize Operations Manager. Blank spaces before or after the password are ignored and are not considered to be part of the password.
Networking Properties Verify the networking properties.
11 On the Ready to complete page, review the page and click Finish.
12 After the OVA deployment is complete, you can log in to the virtual appliance from vCenter Server. Right click the virtual appliance that you installed. Click Open Console. Use the following credentials to log in:
Log In Details Value
Username root
Password vmware
13 Change the root user password.
Note To reset the root user password, see the KB article: 2001476
14 Enable the sshd service to access the virtual machine through ssh.
What to do next
n Perform the post-installation tasks.
n Log in to vRealize Operations Manager and configure the agents to connect to vRealize Operations Manager.
vRealize Operations Manager Configuration Guide
VMware, Inc. 35
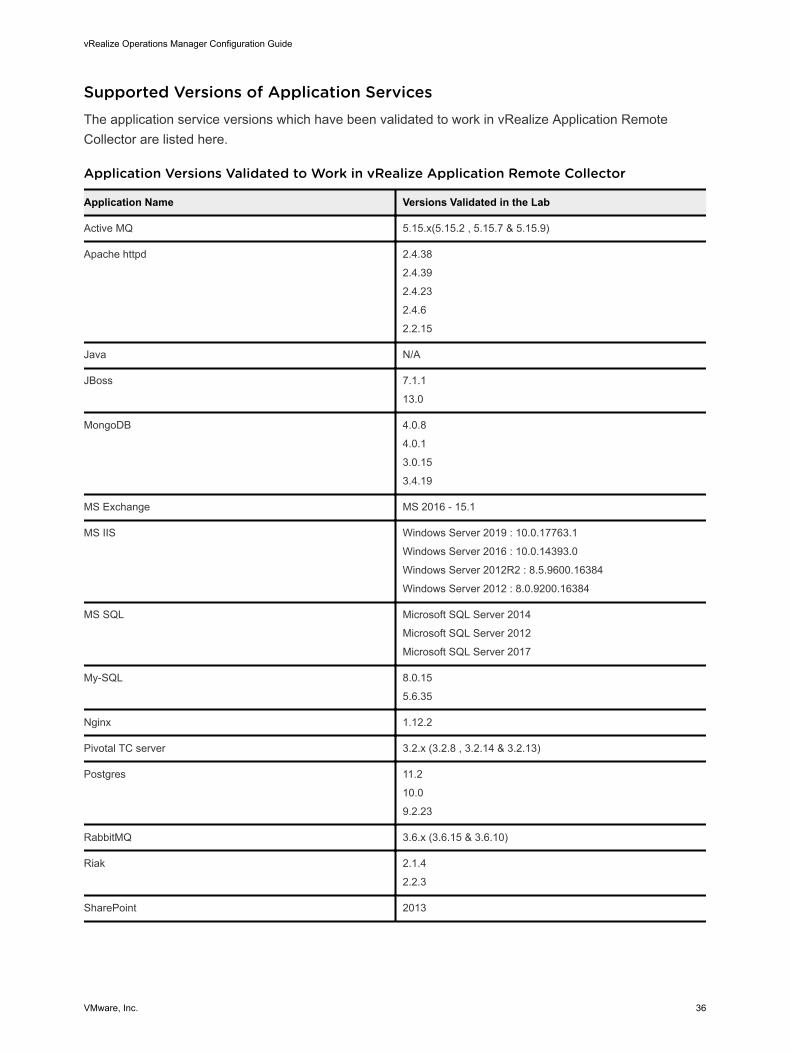
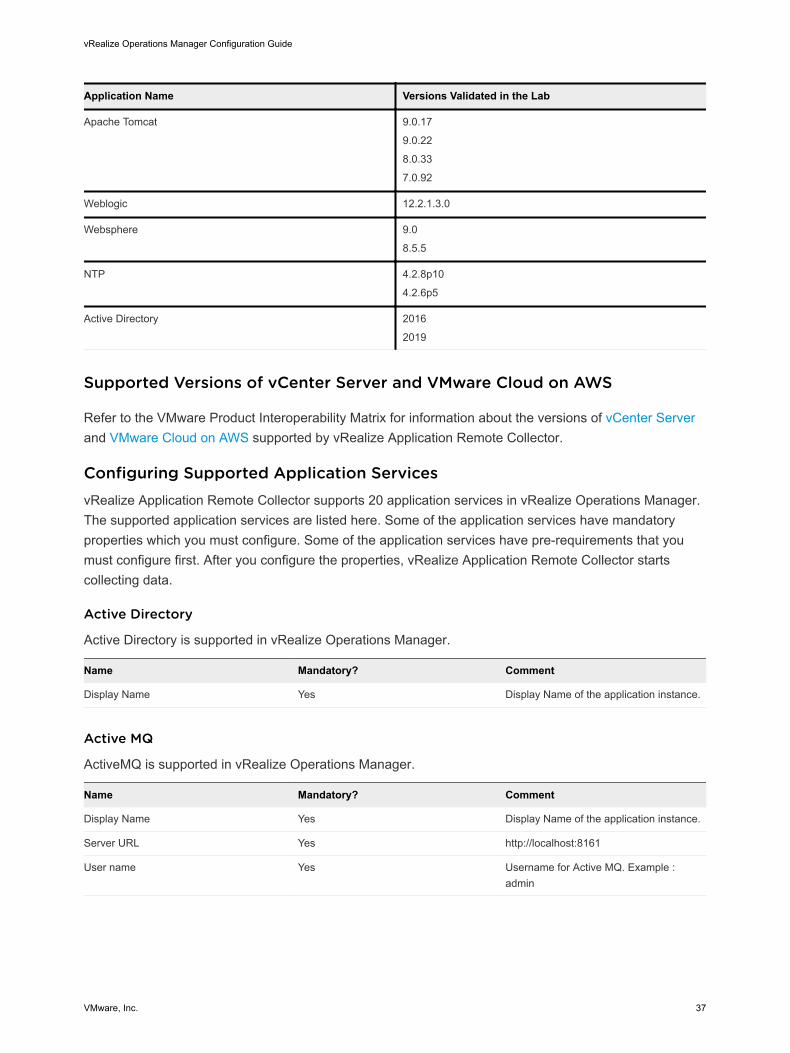
Supported Versions of Application ServicesThe application service versions which have been validated to work in vRealize Application Remote Collector are listed here.
Application Versions Validated to Work in vRealize Application Remote Collector
Application Name Versions Validated in the Lab
Active MQ 5.15.x(5.15.2 , 5.15.7 & 5.15.9)
Apache httpd 2.4.38
2.4.39
2.4.23
2.4.6
2.2.15
Java N/A
JBoss 7.1.1
13.0
MongoDB 4.0.8
4.0.1
3.0.15
3.4.19
MS Exchange MS 2016 - 15.1
MS IIS Windows Server 2019 : 10.0.17763.1
Windows Server 2016 : 10.0.14393.0
Windows Server 2012R2 : 8.5.9600.16384
Windows Server 2012 : 8.0.9200.16384
MS SQL Microsoft SQL Server 2014
Microsoft SQL Server 2012
Microsoft SQL Server 2017
My-SQL 8.0.15
5.6.35
Nginx 1.12.2
Pivotal TC server 3.2.x (3.2.8 , 3.2.14 & 3.2.13)
Postgres 11.2
10.0
9.2.23
RabbitMQ 3.6.x (3.6.15 & 3.6.10)
Riak 2.1.4
2.2.3
SharePoint 2013
vRealize Operations Manager Configuration Guide
VMware, Inc. 36
Application Name Versions Validated in the Lab
Apache Tomcat 9.0.17
9.0.22
8.0.33
7.0.92
Weblogic 12.2.1.3.0
Websphere 9.0
8.5.5
NTP 4.2.8p10
4.2.6p5
Active Directory 2016
2019
Supported Versions of vCenter Server and VMware Cloud on AWS
Refer to the VMware Product Interoperability Matrix for information about the versions of vCenter Server and VMware Cloud on AWS supported by vRealize Application Remote Collector.
Configuring Supported Application ServicesvRealize Application Remote Collector supports 20 application services in vRealize Operations Manager. The supported application services are listed here. Some of the application services have mandatory properties which you must configure. Some of the application services have pre-requirements that you must configure first. After you configure the properties, vRealize Application Remote Collector starts collecting data.
Active Directory
Active Directory is supported in vRealize Operations Manager.
Name Mandatory? Comment
Display Name Yes Display Name of the application instance.
Active MQ
ActiveMQ is supported in vRealize Operations Manager.
Name Mandatory? Comment
Display Name Yes Display Name of the application instance.
Server URL Yes http://localhost:8161
User name Yes Username for Active MQ. Example : admin
vRealize Operations Manager Configuration Guide
VMware, Inc. 37
Name Mandatory? Comment
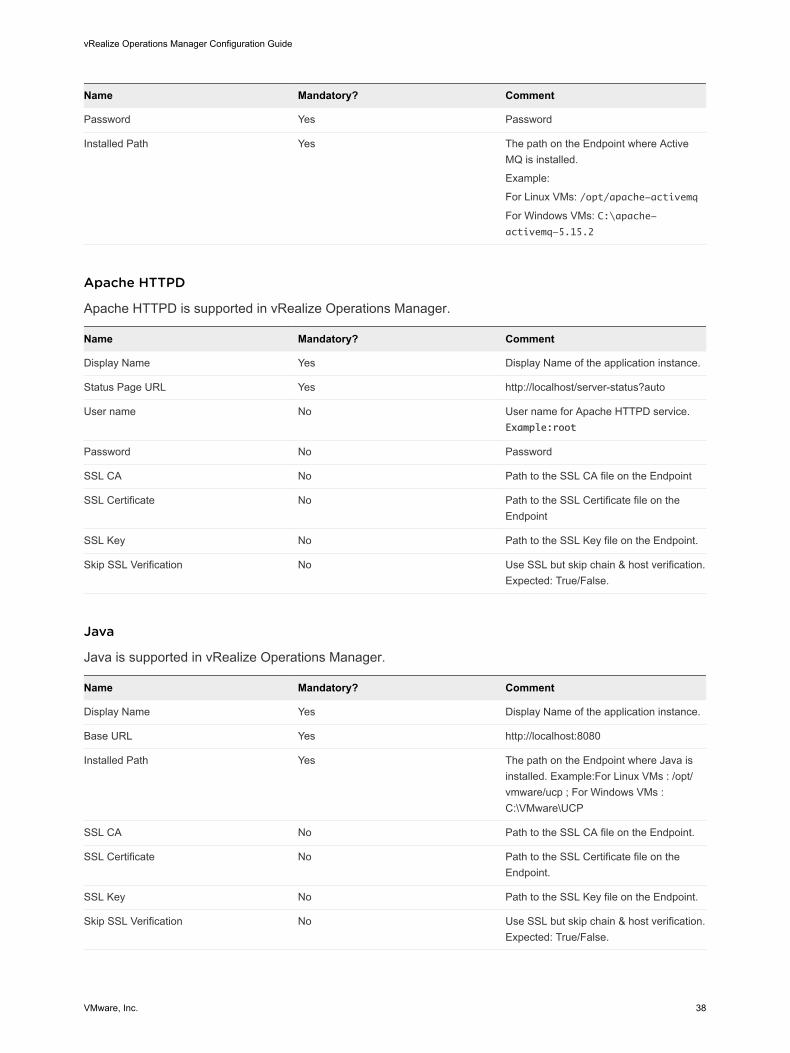
Password Yes Password
Installed Path Yes The path on the Endpoint where Active MQ is installed.
Example:
For Linux VMs: /opt/apache-activemq
For Windows VMs: C:\apache-activemq-5.15.2
Apache HTTPD
Apache HTTPD is supported in vRealize Operations Manager.
Name Mandatory? Comment
Display Name Yes Display Name of the application instance.
Status Page URL Yes http://localhost/server-status?auto
User name No User name for Apache HTTPD service. Example:root
Password No Password
SSL CA No Path to the SSL CA file on the Endpoint
SSL Certificate No Path to the SSL Certificate file on the Endpoint
SSL Key No Path to the SSL Key file on the Endpoint.
Skip SSL Verification No Use SSL but skip chain & host verification. Expected: True/False.
Java
Java is supported in vRealize Operations Manager.
Name Mandatory? Comment
Display Name Yes Display Name of the application instance.
Base URL Yes http://localhost:8080
Installed Path Yes The path on the Endpoint where Java is installed. Example:For Linux VMs : /opt/vmware/ucp ; For Windows VMs : C:\VMware\UCP
SSL CA No Path to the SSL CA file on the Endpoint.
SSL Certificate No Path to the SSL Certificate file on the Endpoint.
SSL Key No Path to the SSL Key file on the Endpoint.
Skip SSL Verification No Use SSL but skip chain & host verification. Expected: True/False.
vRealize Operations Manager Configuration Guide
VMware, Inc. 38
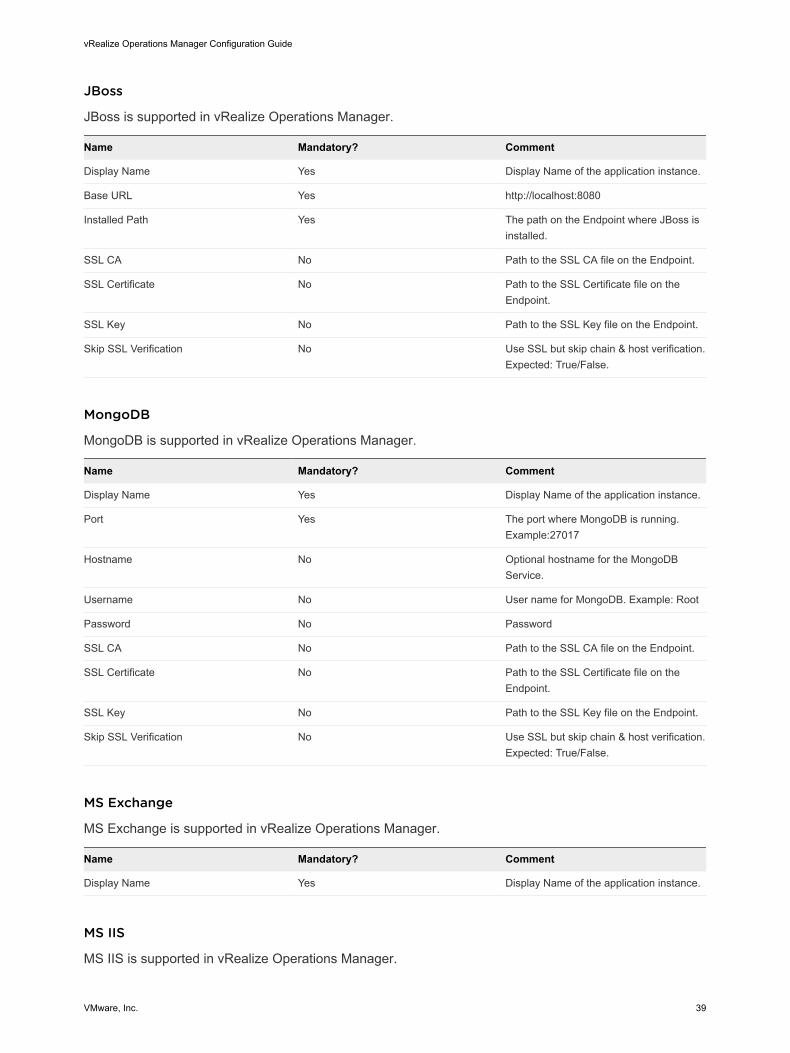
JBoss
JBoss is supported in vRealize Operations Manager.
Name Mandatory? Comment
Display Name Yes Display Name of the application instance.
Base URL Yes http://localhost:8080
Installed Path Yes The path on the Endpoint where JBoss is installed.
SSL CA No Path to the SSL CA file on the Endpoint.
SSL Certificate No Path to the SSL Certificate file on the Endpoint.
SSL Key No Path to the SSL Key file on the Endpoint.
Skip SSL Verification No Use SSL but skip chain & host verification. Expected: True/False.
MongoDB
MongoDB is supported in vRealize Operations Manager.
Name Mandatory? Comment
Display Name Yes Display Name of the application instance.
Port Yes The port where MongoDB is running. Example:27017
Hostname No Optional hostname for the MongoDB Service.
Username No User name for MongoDB. Example: Root
Password No Password
SSL CA No Path to the SSL CA file on the Endpoint.
SSL Certificate No Path to the SSL Certificate file on the Endpoint.
SSL Key No Path to the SSL Key file on the Endpoint.
Skip SSL Verification No Use SSL but skip chain & host verification. Expected: True/False.
MS Exchange
MS Exchange is supported in vRealize Operations Manager.
Name Mandatory? Comment
Display Name Yes Display Name of the application instance.
MS IIS
MS IIS is supported in vRealize Operations Manager.
vRealize Operations Manager Configuration Guide
VMware, Inc. 39
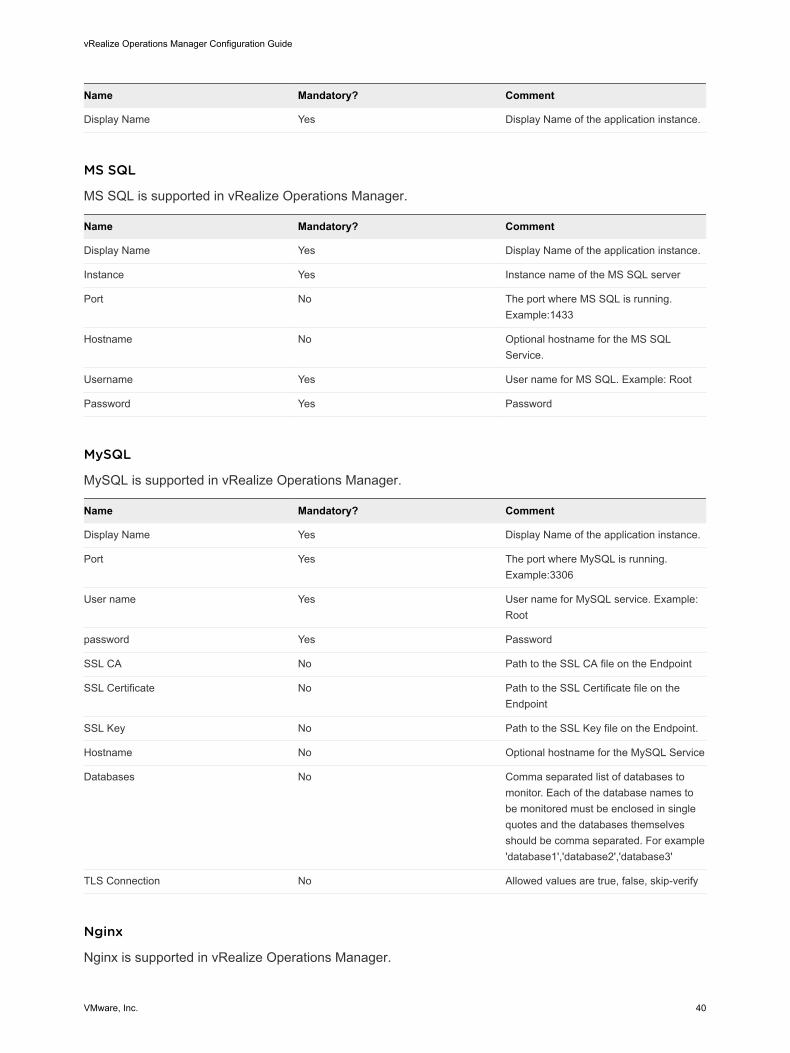
Name Mandatory? Comment
Display Name Yes Display Name of the application instance.
MS SQL
MS SQL is supported in vRealize Operations Manager.
Name Mandatory? Comment
Display Name Yes Display Name of the application instance.
Instance Yes Instance name of the MS SQL server
Port No The port where MS SQL is running. Example:1433
Hostname No Optional hostname for the MS SQL Service.
Username Yes User name for MS SQL. Example: Root
Password Yes Password
MySQL
MySQL is supported in vRealize Operations Manager.
Name Mandatory? Comment
Display Name Yes Display Name of the application instance.
Port Yes The port where MySQL is running. Example:3306
User name Yes User name for MySQL service. Example: Root
password Yes Password
SSL CA No Path to the SSL CA file on the Endpoint
SSL Certificate No Path to the SSL Certificate file on the Endpoint
SSL Key No Path to the SSL Key file on the Endpoint.
Hostname No Optional hostname for the MySQL Service
Databases No Comma separated list of databases to monitor. Each of the database names to be monitored must be enclosed in single quotes and the databases themselves should be comma separated. For example 'database1','database2','database3'
TLS Connection No Allowed values are true, false, skip-verify
Nginx
Nginx is supported in vRealize Operations Manager.
vRealize Operations Manager Configuration Guide
VMware, Inc. 40
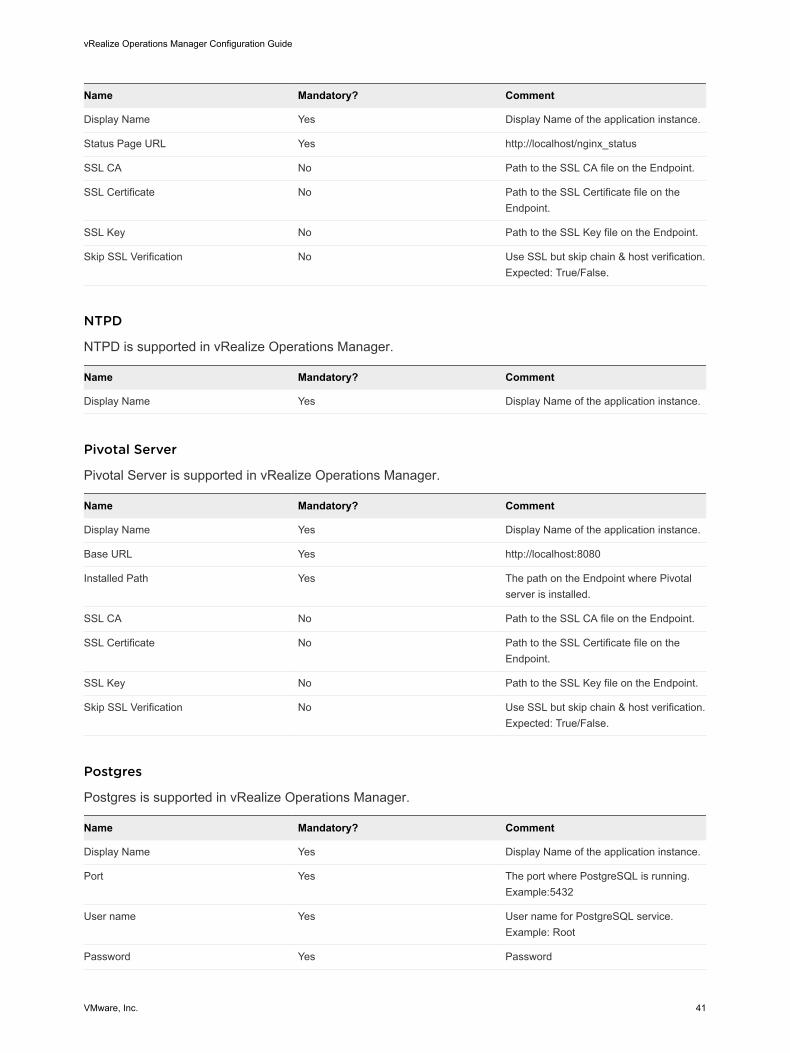
Name Mandatory? Comment
Display Name Yes Display Name of the application instance.
Status Page URL Yes http://localhost/nginx_status
SSL CA No Path to the SSL CA file on the Endpoint.
SSL Certificate No Path to the SSL Certificate file on the Endpoint.
SSL Key No Path to the SSL Key file on the Endpoint.
Skip SSL Verification No Use SSL but skip chain & host verification. Expected: True/False.
NTPD
NTPD is supported in vRealize Operations Manager.
Name Mandatory? Comment
Display Name Yes Display Name of the application instance.
Pivotal Server
Pivotal Server is supported in vRealize Operations Manager.
Name Mandatory? Comment
Display Name Yes Display Name of the application instance.
Base URL Yes http://localhost:8080
Installed Path Yes The path on the Endpoint where Pivotal server is installed.
SSL CA No Path to the SSL CA file on the Endpoint.
SSL Certificate No Path to the SSL Certificate file on the Endpoint.
SSL Key No Path to the SSL Key file on the Endpoint.
Skip SSL Verification No Use SSL but skip chain & host verification. Expected: True/False.
Postgres
Postgres is supported in vRealize Operations Manager.
Name Mandatory? Comment
Display Name Yes Display Name of the application instance.
Port Yes The port where PostgreSQL is running. Example:5432
User name Yes User name for PostgreSQL service. Example: Root
Password Yes Password
vRealize Operations Manager Configuration Guide
VMware, Inc. 41
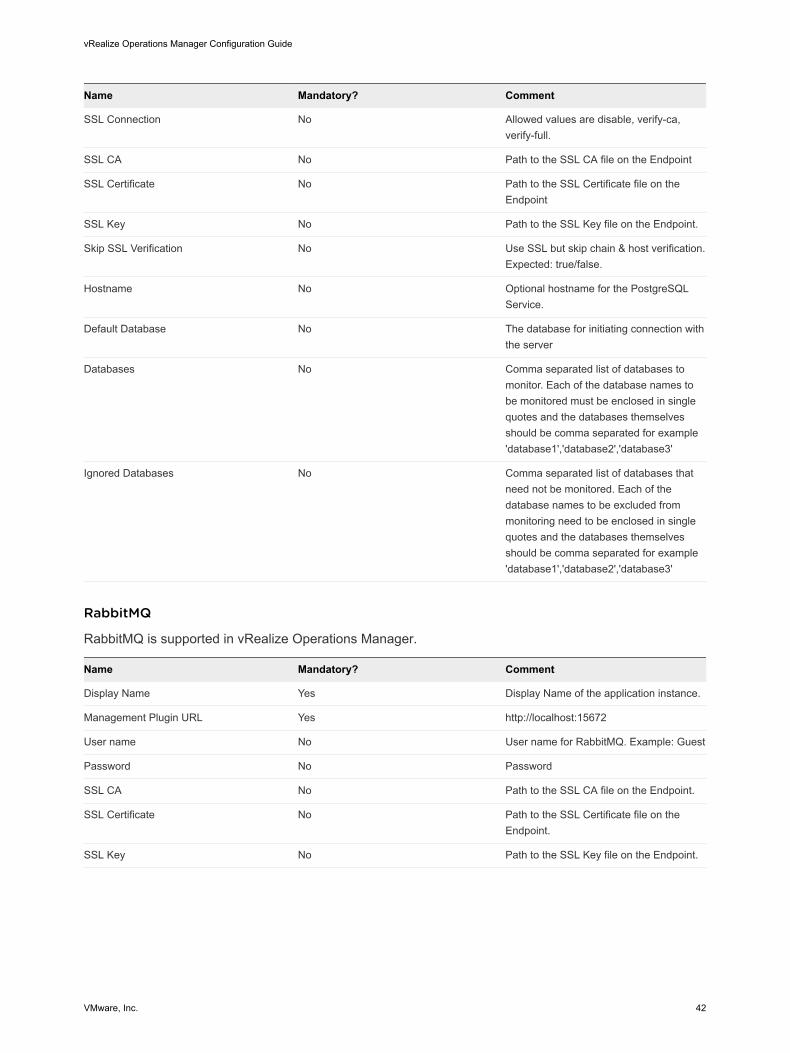
Name Mandatory? Comment
SSL Connection No Allowed values are disable, verify-ca, verify-full.
SSL CA No Path to the SSL CA file on the Endpoint
SSL Certificate No Path to the SSL Certificate file on the Endpoint
SSL Key No Path to the SSL Key file on the Endpoint.
Skip SSL Verification No Use SSL but skip chain & host verification. Expected: true/false.
Hostname No Optional hostname for the PostgreSQL Service.
Default Database No The database for initiating connection with the server
Databases No Comma separated list of databases to monitor. Each of the database names to be monitored must be enclosed in single quotes and the databases themselves should be comma separated for example 'database1','database2','database3'
Ignored Databases No Comma separated list of databases that need not be monitored. Each of the database names to be excluded from monitoring need to be enclosed in single quotes and the databases themselves should be comma separated for example 'database1','database2','database3'
RabbitMQ
RabbitMQ is supported in vRealize Operations Manager.
Name Mandatory? Comment
Display Name Yes Display Name of the application instance.
Management Plugin URL Yes http://localhost:15672
User name No User name for RabbitMQ. Example: Guest
Password No Password
SSL CA No Path to the SSL CA file on the Endpoint.
SSL Certificate No Path to the SSL Certificate file on the Endpoint.
SSL Key No Path to the SSL Key file on the Endpoint.
vRealize Operations Manager Configuration Guide
VMware, Inc. 42
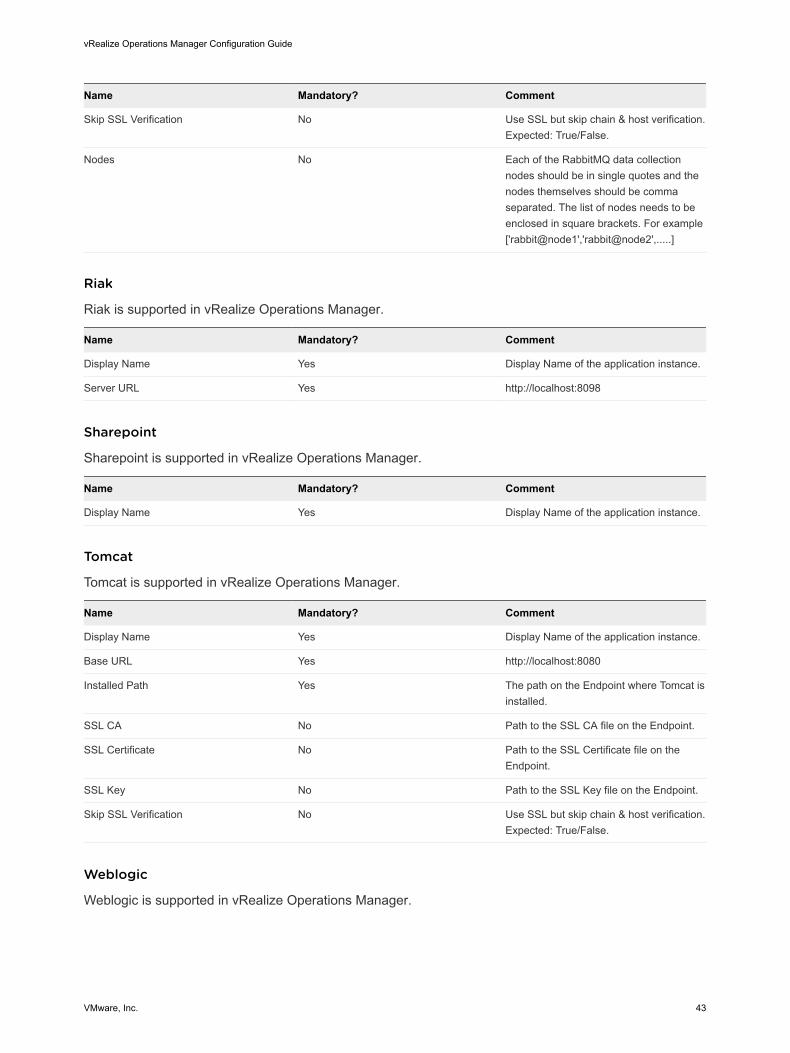
Name Mandatory? Comment
Skip SSL Verification No Use SSL but skip chain & host verification. Expected: True/False.
Nodes No Each of the RabbitMQ data collection nodes should be in single quotes and the nodes themselves should be comma separated. The list of nodes needs to be enclosed in square brackets. For example ['rabbit@node1','rabbit@node2',.....]
Riak
Riak is supported in vRealize Operations Manager.
Name Mandatory? Comment
Display Name Yes Display Name of the application instance.
Server URL Yes http://localhost:8098
Sharepoint
Sharepoint is supported in vRealize Operations Manager.
Name Mandatory? Comment
Display Name Yes Display Name of the application instance.
Tomcat
Tomcat is supported in vRealize Operations Manager.
Name Mandatory? Comment
Display Name Yes Display Name of the application instance.
Base URL Yes http://localhost:8080
Installed Path Yes The path on the Endpoint where Tomcat is installed.
SSL CA No Path to the SSL CA file on the Endpoint.
SSL Certificate No Path to the SSL Certificate file on the Endpoint.
SSL Key No Path to the SSL Key file on the Endpoint.
Skip SSL Verification No Use SSL but skip chain & host verification. Expected: True/False.
Weblogic
Weblogic is supported in vRealize Operations Manager.
vRealize Operations Manager Configuration Guide
VMware, Inc. 43
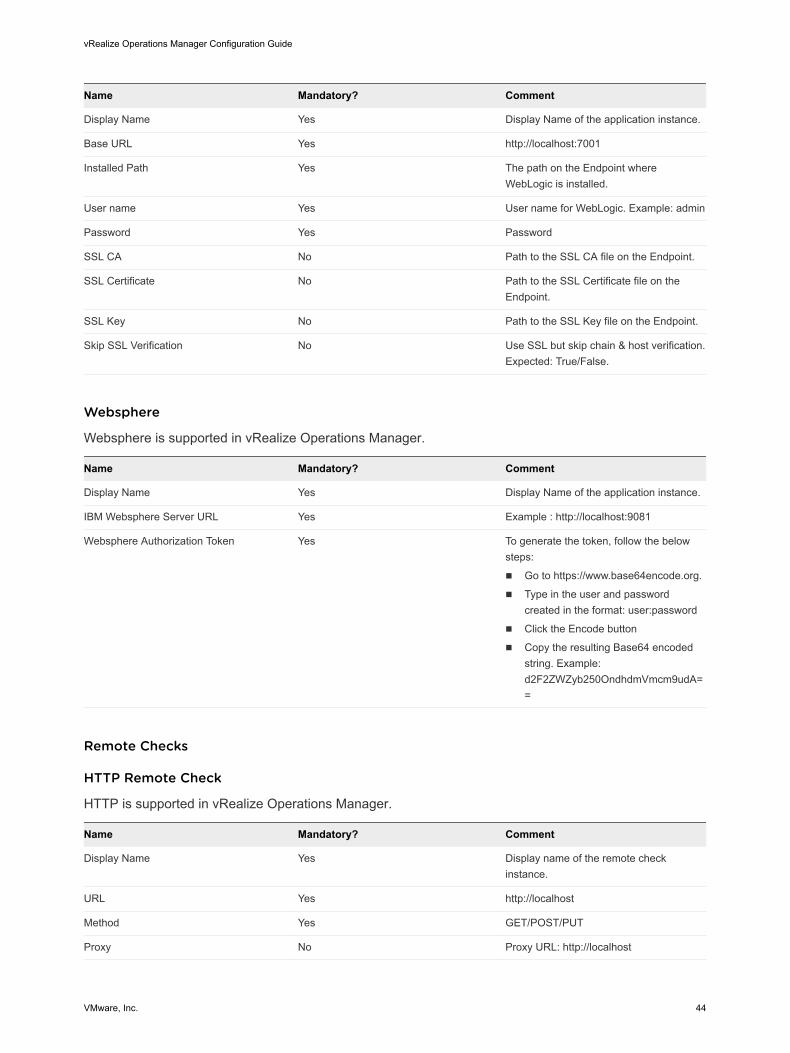
Name Mandatory? Comment
Display Name Yes Display Name of the application instance.
Base URL Yes http://localhost:7001
Installed Path Yes The path on the Endpoint where WebLogic is installed.
User name Yes User name for WebLogic. Example: admin
Password Yes Password
SSL CA No Path to the SSL CA file on the Endpoint.
SSL Certificate No Path to the SSL Certificate file on the Endpoint.
SSL Key No Path to the SSL Key file on the Endpoint.
Skip SSL Verification No Use SSL but skip chain & host verification. Expected: True/False.
Websphere
Websphere is supported in vRealize Operations Manager.
Name Mandatory? Comment
Display Name Yes Display Name of the application instance.
IBM Websphere Server URL Yes Example : http://localhost:9081
Websphere Authorization Token Yes To generate the token, follow the below steps:
n Go to https://www.base64encode.org.
n Type in the user and password created in the format: user:password
n Click the Encode button
n Copy the resulting Base64 encoded string. Example: d2F2ZWZyb250OndhdmVmcm9udA==
Remote Checks
HTTP Remote Check
HTTP is supported in vRealize Operations Manager.
Name Mandatory? Comment
Display Name Yes Display name of the remote check instance.
URL Yes http://localhost
Method Yes GET/POST/PUT
Proxy No Proxy URL: http://localhost
vRealize Operations Manager Configuration Guide
VMware, Inc. 44
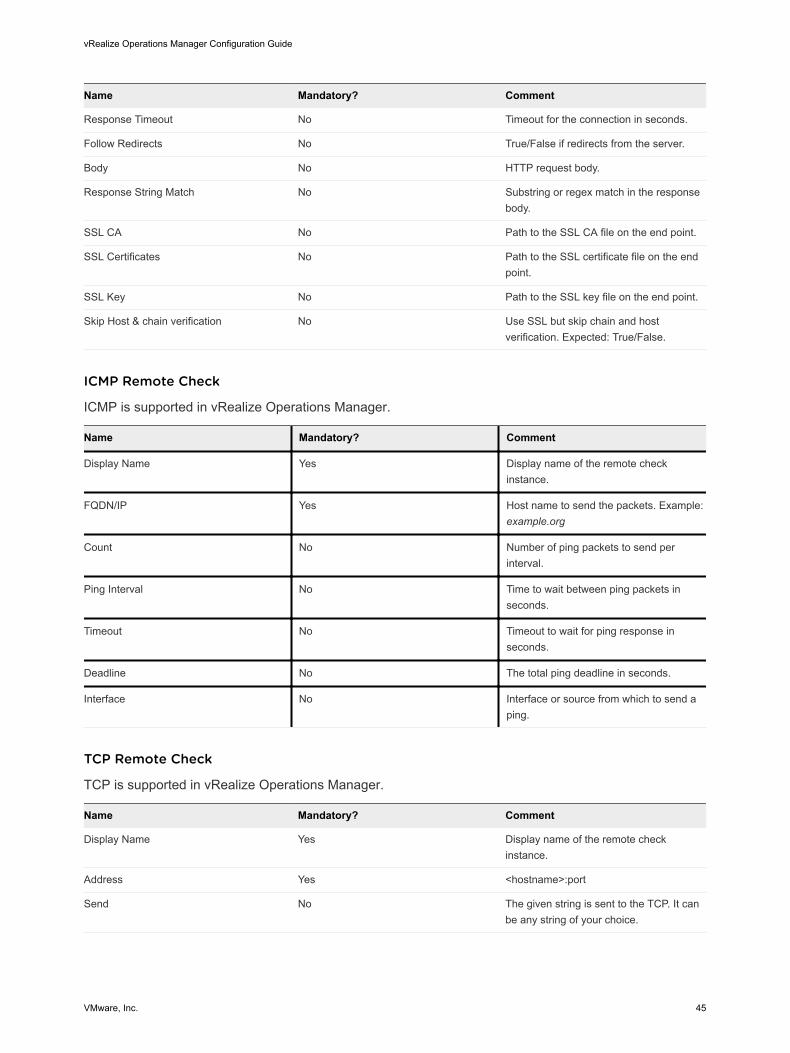
Name Mandatory? Comment
Response Timeout No Timeout for the connection in seconds.
Follow Redirects No True/False if redirects from the server.
Body No HTTP request body.
Response String Match No Substring or regex match in the response body.
SSL CA No Path to the SSL CA file on the end point.
SSL Certificates No Path to the SSL certificate file on the end point.
SSL Key No Path to the SSL key file on the end point.
Skip Host & chain verification No Use SSL but skip chain and host verification. Expected: True/False.
ICMP Remote Check
ICMP is supported in vRealize Operations Manager.
Name Mandatory? Comment
Display Name Yes Display name of the remote check instance.
FQDN/IP Yes Host name to send the packets. Example: example.org
Count No Number of ping packets to send per interval.
Ping Interval No Time to wait between ping packets in seconds.
Timeout No Timeout to wait for ping response in seconds.
Deadline No The total ping deadline in seconds.
Interface No Interface or source from which to send a ping.
TCP Remote Check
TCP is supported in vRealize Operations Manager.
Name Mandatory? Comment
Display Name Yes Display name of the remote check instance.
Address Yes <hostname>:port
Send No The given string is sent to the TCP. It can be any string of your choice.
vRealize Operations Manager Configuration Guide
VMware, Inc. 45
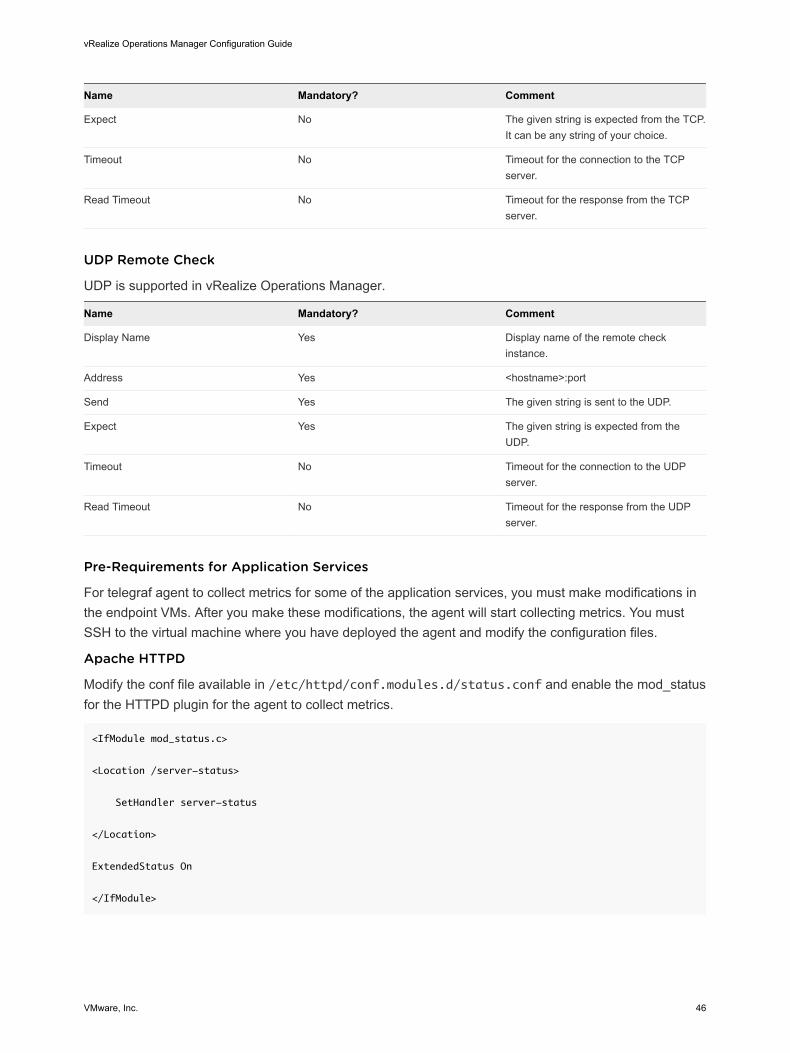
Name Mandatory? Comment
Expect No The given string is expected from the TCP. It can be any string of your choice.
Timeout No Timeout for the connection to the TCP server.
Read Timeout No Timeout for the response from the TCP server.
UDP Remote Check
UDP is supported in vRealize Operations Manager.
Name Mandatory? Comment
Display Name Yes Display name of the remote check instance.
Address Yes <hostname>:port
Send Yes The given string is sent to the UDP.
Expect Yes The given string is expected from the UDP.
Timeout No Timeout for the connection to the UDP server.
Read Timeout No Timeout for the response from the UDP server.
Pre-Requirements for Application Services
For telegraf agent to collect metrics for some of the application services, you must make modifications in the endpoint VMs. After you make these modifications, the agent will start collecting metrics. You must SSH to the virtual machine where you have deployed the agent and modify the configuration files.
Apache HTTPD
Modify the conf file available in /etc/httpd/conf.modules.d/status.conf and enable the mod_status for the HTTPD plugin for the agent to collect metrics.
<IfModule mod_status.c>
<Location /server-status>
SetHandler server-status
</Location>
ExtendedStatus On
</IfModule>
vRealize Operations Manager Configuration Guide
VMware, Inc. 46
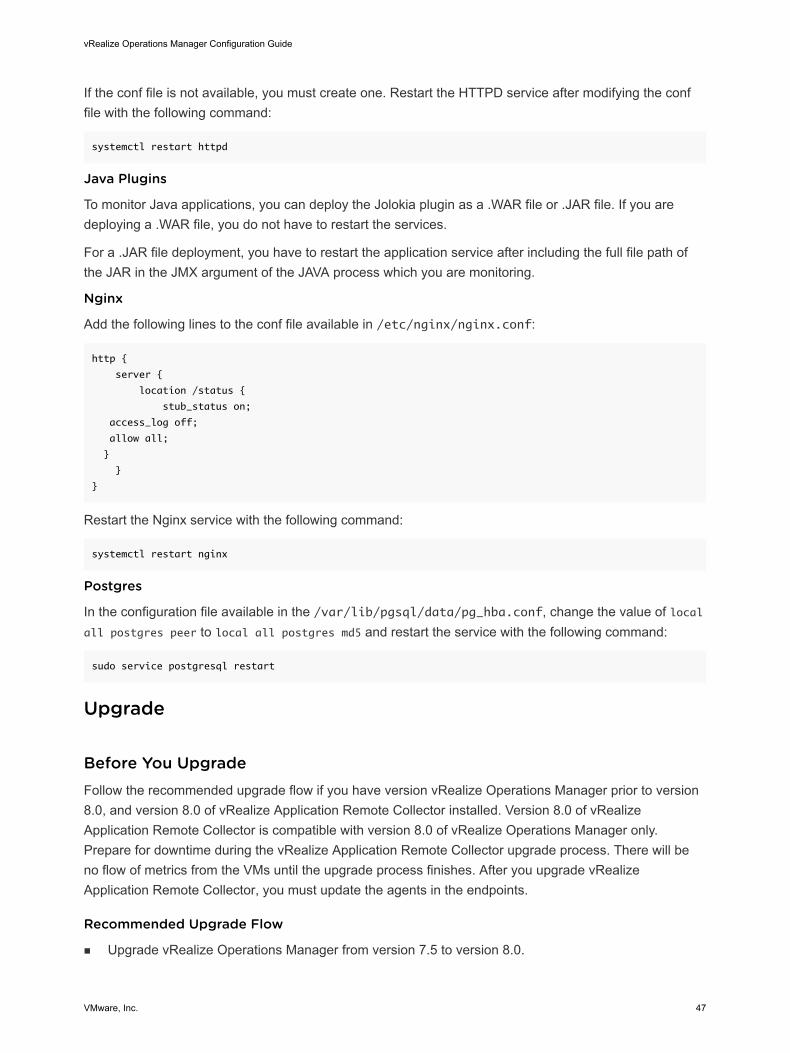
If the conf file is not available, you must create one. Restart the HTTPD service after modifying the conf file with the following command:
systemctl restart httpd
Java Plugins
To monitor Java applications, you can deploy the Jolokia plugin as a .WAR file or .JAR file. If you are deploying a .WAR file, you do not have to restart the services.
For a .JAR file deployment, you have to restart the application service after including the full file path of the JAR in the JMX argument of the JAVA process which you are monitoring.
Nginx
Add the following lines to the conf file available in /etc/nginx/nginx.conf:
http {
server {
location /status {
stub_status on;
access_log off;
allow all;
}
}
}
Restart the Nginx service with the following command:
systemctl restart nginx
Postgres
In the configuration file available in the /var/lib/pgsql/data/pg_hba.conf, change the value of local all postgres peer to local all postgres md5 and restart the service with the following command:
sudo service postgresql restart
Upgrade
Before You UpgradeFollow the recommended upgrade flow if you have version vRealize Operations Manager prior to version 8.0, and version 8.0 of vRealize Application Remote Collector installed. Version 8.0 of vRealize Application Remote Collector is compatible with version 8.0 of vRealize Operations Manager only. Prepare for downtime during the vRealize Application Remote Collector upgrade process. There will be no flow of metrics from the VMs until the upgrade process finishes. After you upgrade vRealize Application Remote Collector, you must update the agents in the endpoints.
Recommended Upgrade Flow
n Upgrade vRealize Operations Manager from version 7.5 to version 8.0.
vRealize Operations Manager Configuration Guide
VMware, Inc. 47
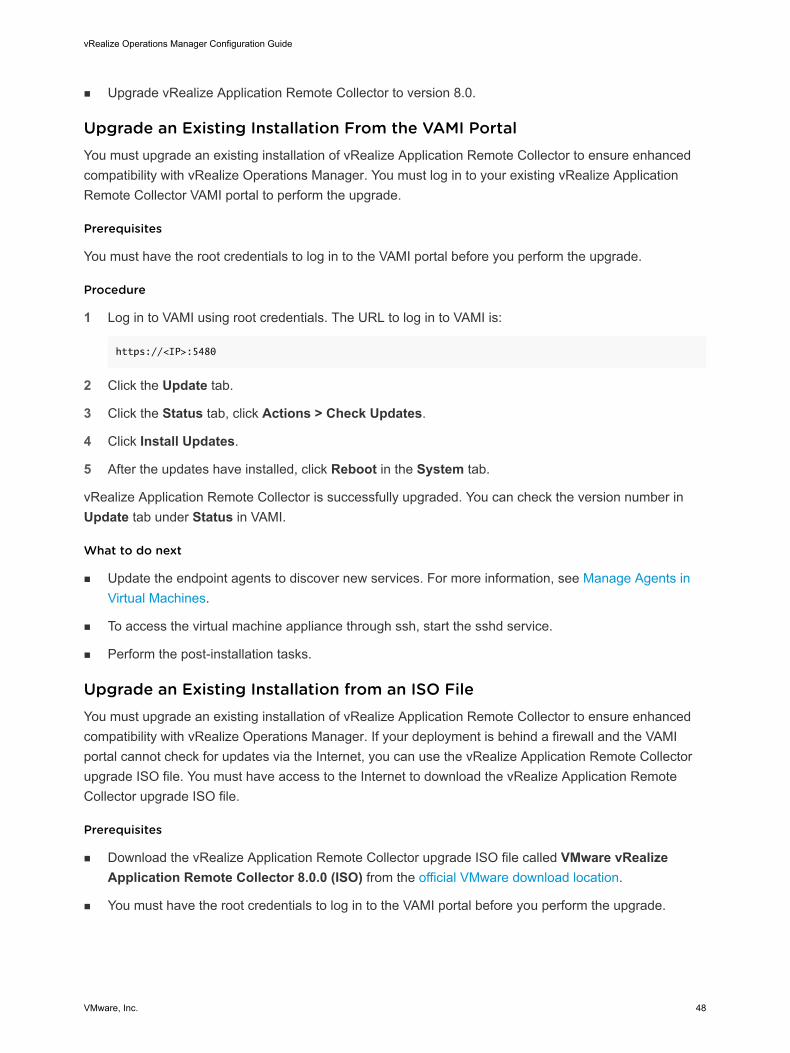
n Upgrade vRealize Application Remote Collector to version 8.0.
Upgrade an Existing Installation From the VAMI PortalYou must upgrade an existing installation of vRealize Application Remote Collector to ensure enhanced compatibility with vRealize Operations Manager. You must log in to your existing vRealize Application Remote Collector VAMI portal to perform the upgrade.
Prerequisites
You must have the root credentials to log in to the VAMI portal before you perform the upgrade.
Procedure
1 Log in to VAMI using root credentials. The URL to log in to VAMI is:
https://<IP>:5480
2 Click the Update tab.
3 Click the Status tab, click Actions > Check Updates.
4 Click Install Updates.
5 After the updates have installed, click Reboot in the System tab.
vRealize Application Remote Collector is successfully upgraded. You can check the version number in Update tab under Status in VAMI.
What to do next
n Update the endpoint agents to discover new services. For more information, see Manage Agents in Virtual Machines.
n To access the virtual machine appliance through ssh, start the sshd service.
n Perform the post-installation tasks.
Upgrade an Existing Installation from an ISO FileYou must upgrade an existing installation of vRealize Application Remote Collector to ensure enhanced compatibility with vRealize Operations Manager. If your deployment is behind a firewall and the VAMI portal cannot check for updates via the Internet, you can use the vRealize Application Remote Collector upgrade ISO file. You must have access to the Internet to download the vRealize Application Remote Collector upgrade ISO file.
Prerequisites
n Download the vRealize Application Remote Collector upgrade ISO file called VMware vRealize Application Remote Collector 8.0.0 (ISO) from the official VMware download location.
n You must have the root credentials to log in to the VAMI portal before you perform the upgrade.
vRealize Operations Manager Configuration Guide
VMware, Inc. 48

Procedure
1 Upload the vRealize Application Remote Collector upgrade ISO file to the datastore where the vRealize Application Remote Collector appliance is deployed.
2 Power off the vRealize Application Remote Collector virtual machine.
3 Mount the vRealize Application Remote Collector upgrade ISO file to the virtual machine.
4 Power on the vRealize Application Remote Collector virtual machine.
5 Log in to VAMI using root credentials. The URL to log in to VAMI is:
https://<IP>:5480
6 Click Install Updates under Status > Updates.
7 After the updates have installed, click Reboot in the System tab.
vRealize Application Remote Collector is successfully upgraded. You can check the version number in Update tab under Status in VAMI.
What to do next
n Update the endpoint agents to discover new services. For more information, see Manage Agents in Virtual Machines.
n To access the virtual machine appliance through ssh, start the sshd service.
n Perform the post-installation tasks.
Post Installation
Configure Network Time Protocol SettingsAfter you install or upgrade to the latest version of vRealize Application Remote Collector, you must set up accurate timekeeping as part of the deployment. If the time settings between vRealize Application Remote Collector and vRealize Operations Manager are not synchronized, you face agent installation and metric collection issues. Ensure time synchronization between the endpoint VMs, vCenter Server, ESX Hosts, and vRealize Operations Manager using the Network Time Protocol (NTP).
Procedure
1 Log in to the vRealize Application Remote Collector appliance and modify the ntp.conf file available in /etc/ntp.conf by adding following in the following format:
server time.vmware.com
Note Replace time.vmware.com with a suitable time server setting. You can use the FQDN or IP of the time server.
vRealize Operations Manager Configuration Guide
VMware, Inc. 49
2 Enter the following command to start the NTP daemon:
systemctl start ntpd
3 Enter the following command to enable the NTP daemon:
systemctl enable ntpd
4 Run the following command to verify if NTP is configured correctly:
ntpstat
If NTP is synchronized correctly, you see a message similar to the following:
synchronised to NTP server (10.113.60.176) at stratum 3
time correct to within 50 ms
polling server every 64 s
Troubleshooting your Deployment
Troubleshoot Agent Installation and Metric Collection IssuesIf the time settings between vRealize Application Remote Collector and vRealize Operations Manager are not synchronized, you may face agent installation and metric collection issues. Eventually, you may not see any metrics in the vRealize Operations Manager dashboards.
Problem
You may notice the following issues in vRealize Operations Manager:
n You cannot add vRealize Application Remote Collector to vRealize Operations Manager
n You cannot install an agent in the Windows and Linux target VMs.
Cause
Time synchronization is a prerequisite of the TLS/SSO communication between client and server.
If the vRealize Operations Manager and vRealize Application Remote Collector are not time synchronized, the test connection fails while configuring vRealize Application Remote Collector in vRealize Operations Manager.
If the Windows and Linux target VMs are not time synchronized with vRealize Operations Manager, communication between vRealize Application Remote Collector and agents will break after installing the agents. Hence monitored metrics are not sent to vRealize Operations Manager. Alternatively, stop and restart the agent to resolve this issue.
vRealize Operations Manager Configuration Guide
VMware, Inc. 50
Solution
1 Check the vRealize Operations Manager support bundle in the following path: COLLECTOR/adapters/APPOSUCPAdapter/ for errors.
2 Check the vRealize Application Remote Collector support bundle, ucpapi.log, for errors.
3 Ensure time synchronization between vRealize Application Remote Collector, vRealize Operations Manager and the Windows and Linux target VMs.
4 To start and restart the agent, see Manage Agents in Virtual Machines.
Download Support BundlesDownload the support bundles from the virtual machines where you deployed vRealize Application Remote Collector. For Linux and Windows end point VMs, run the specified command and access the support bundle. Support bundles are required to troubleshoot any problem related to vRealize Application Remote Collector.
For vRealize Application Remote Collector
1 Access the VAMI page by entering https://<vRealize Application Remote Collector hostname>:5480
2 Log in with root credentials.
3 Click the Support Bundle tab. Click the Generate Logs for VA button.
vRealize Application Remote Collector creates the support bundles which you can download.
For End Point VMs
1 Log in to the end point.
2 Run the following commands based on the end point VM's operating system type:
For Linux End Point VMs
/opt/vmware/ucp/ucp-minion/bin/ucp-minion.sh --config /opt/vmware/ucp/salt-minion/etc/salt/grains
--action gen_support_bundle --log_level INFO
The support bundle is generated and placed as a ZIP file in the /opt/vmware/ucp/support-bundle-endpoints/ directory.
For Windows End Point VMs
C:\VMware\UCP\ucp-minion\bin\ucp-minion.bat --config C:\VMware\UCP\salt\conf\grains --action
gen_support_bundle --log_level INFO
The support bundle is generated and placed as a ZIP file in the %SystemDrive%\VMware\UCP\support-bundle-endpoints\ directory.
Troubleshooting UpgradeYou might see error messages, or inconsistent status icons in vRealize Operations Manager if you do not upgrade to the compatible versions of vRealize Operations Manager and vRealize Application Remote Collector.
vRealize Operations Manager Configuration Guide
VMware, Inc. 51
Problem
vRealize Application Remote Collector UI Problems
n You cannot update your endpoint VM to have the latest vRealize Application Remote Collector agent.
n If you bootstrap/re-bootstrap a VM after upgrading vRealize Application Remote Collector you cannot activate the newly discovered application. You see an error message if you try to activate it.
Manage vRealize Application Remote Collector UI Problems
n You can see an option to update the endpoint agent but you are unable to perform the update.
n Services supported in the latest versions of vRealize Application Remote Collector cannot be discovered.
Cause
The first set of problems occurs because vRealize Application Remote Collector is upgraded to the latest version, but vRealize Operations Manager is an old version.
The second set of problems occurs because vRealize Operations Manager is upgraded to the latest version, but vRealize Application Remote Collector is in version 1.x.
Solution
u Upgrade to the compatible versions of vRealize Operations Manager and vRealize Application Remote Collector.
Note For more troubleshooting steps, see Troubleshooting the Integration of vRealize Application Remote Collector with vRealize Operations Manager.
Backup and Restore a vRealize Application Remote Collector InstanceYou can run the backup and restore script to ensure that VMware vRealize Operations Manager continues to receive data after the vRealize Application Remote Collector instance becomes unavailable. All the existing endpoints that are configured will automatically connect back to vRealize Application Remote Collector and continue to send data after you restore the vRealize Application Remote Collector instance.
The task is divided into two parts. The first part involves performing an on-demand back up of the vRealize Application Remote Collector connection and configuration details. A cron job also performs the back up automatically every day.
The second part involves restoring the vRealize Application Remote Collector instance using the backup file that you created, or the backup file created by the cron job.
Prerequisites
n vRealize Application Remote Collector appliance must be configured with a static I.P. or static FQDN. The endpoints must be configured.
vRealize Operations Manager Configuration Guide
VMware, Inc. 52
n Back up the network configuration details of the vRealize Application Remote Collector appliance. Capture the network configuration details of vRealize Application Remote Collector either using the VAMI UI or vCenter Server Tools. Keep the network details available when you restore the vRealize Application Remote Collector appliance from the backup.
n The sizing of the new vRealize Application Remote Collector appliance that you are restoring a backup to, should be greater or equal to the old appliance. The network configuration, static I.P. or static FQDN should be the same. This is to enable the endpoint VMs to reach the new appliance.
Procedure
1 Back up a running instance of vRealize Application Remote Collector by making a copy of the connection and configuration details.
a Connect to the virtual machine running vRealize Application Remote Collector using SSH.
b Enter the following command to access the scripts folder:
cd /ucp/ucp-config-scripts
c Run the arc-state-bundle.sh script with the backup option. The script performs a back up or restore task based on the option you provide.
./arc-state-bundle.sh backup_state
Running this script pushes the backup file to the /ucp-bkup/state-bundles folder. The filename is in the format Application-Remote-Collector-State-Bundle_<<Timestamp>>.tar. This file contains the connection and configuration details for the endpoints.
d Archive the Application-Remote-Collector-State-Bundle_<<Timestamp>>.tar file to a remote location.
2 A cron job also runs every day and backs up the Application-Remote-Collector-State-Bundle_<<Timestamp>>.tar file. The .tar file is stored for five days. On the sixth day, the oldest .tar file is deleted and replaced. In order to restore the vRealize Application Remote Collector appliance from the .tar file, archive the file to a remote location.
3 Restore the backed up configuration files to a new vRealize Application Remote Collector appliance.
a Configure the new vRealize Application Remote Collector appliance with the same network and IP configuration as the previous appliance. This information is available in the network configuration file that you backed up.
b Connect to the VM running vRealize Application Remote Collector using SSH.
c Retrieve the latest Application-Remote-Collector-State-Bundle_<<Timestamp>>.tar file from the archive, and copy it to a location which is accessible by the vRealize Application Remote Collector appliance.
vRealize Operations Manager Configuration Guide
VMware, Inc. 53
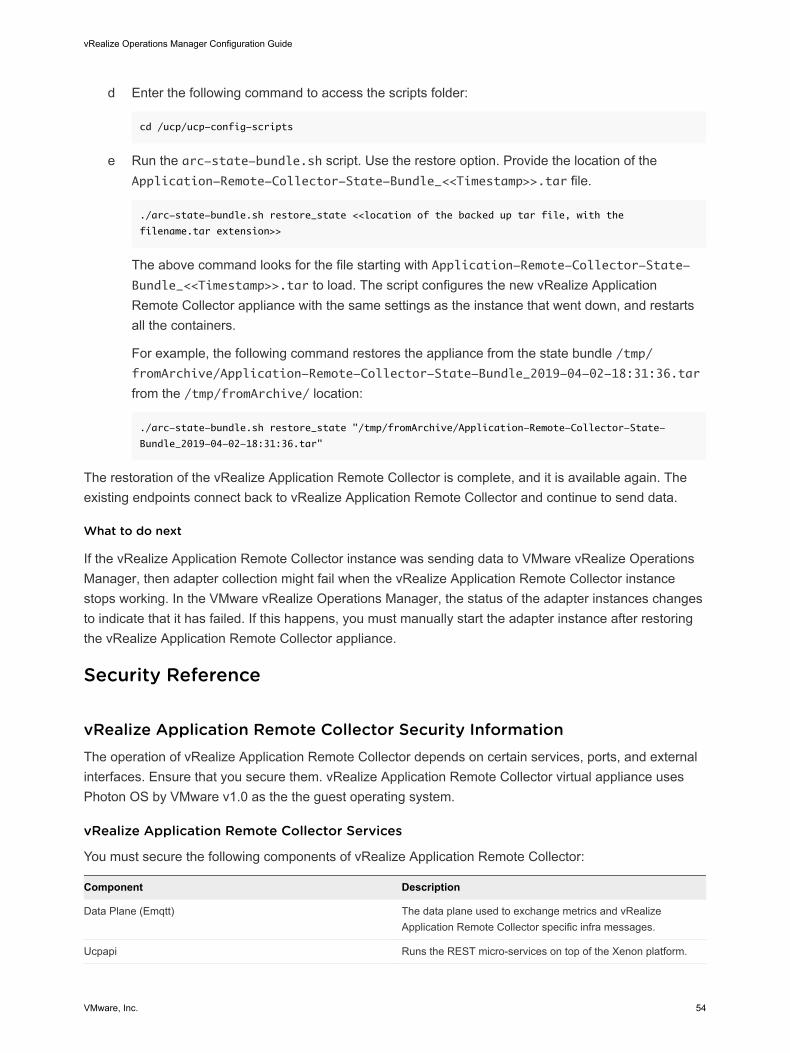
d Enter the following command to access the scripts folder:
cd /ucp/ucp-config-scripts
e Run the arc-state-bundle.sh script. Use the restore option. Provide the location of the Application-Remote-Collector-State-Bundle_<<Timestamp>>.tar file.
./arc-state-bundle.sh restore_state <<location of the backed up tar file, with the
filename.tar extension>>
The above command looks for the file starting with Application-Remote-Collector-State-Bundle_<<Timestamp>>.tar to load. The script configures the new vRealize Application Remote Collector appliance with the same settings as the instance that went down, and restarts all the containers.
For example, the following command restores the appliance from the state bundle /tmp/fromArchive/Application-Remote-Collector-State-Bundle_2019-04-02-18:31:36.tar
from the /tmp/fromArchive/ location:
./arc-state-bundle.sh restore_state "/tmp/fromArchive/Application-Remote-Collector-State-
Bundle_2019-04-02-18:31:36.tar"
The restoration of the vRealize Application Remote Collector is complete, and it is available again. The existing endpoints connect back to vRealize Application Remote Collector and continue to send data.
What to do next
If the vRealize Application Remote Collector instance was sending data to VMware vRealize Operations Manager, then adapter collection might fail when the vRealize Application Remote Collector instance stops working. In the VMware vRealize Operations Manager, the status of the adapter instances changes to indicate that it has failed. If this happens, you must manually start the adapter instance after restoring the vRealize Application Remote Collector appliance.
Security Reference
vRealize Application Remote Collector Security InformationThe operation of vRealize Application Remote Collector depends on certain services, ports, and external interfaces. Ensure that you secure them. vRealize Application Remote Collector virtual appliance uses Photon OS by VMware v1.0 as the the guest operating system.
vRealize Application Remote Collector Services
You must secure the following components of vRealize Application Remote Collector:
Component Description
Data Plane (Emqtt) The data plane used to exchange metrics and vRealize Application Remote Collector specific infra messages.
Ucpapi Runs the REST micro-services on top of the Xenon platform.
vRealize Operations Manager Configuration Guide
VMware, Inc. 54
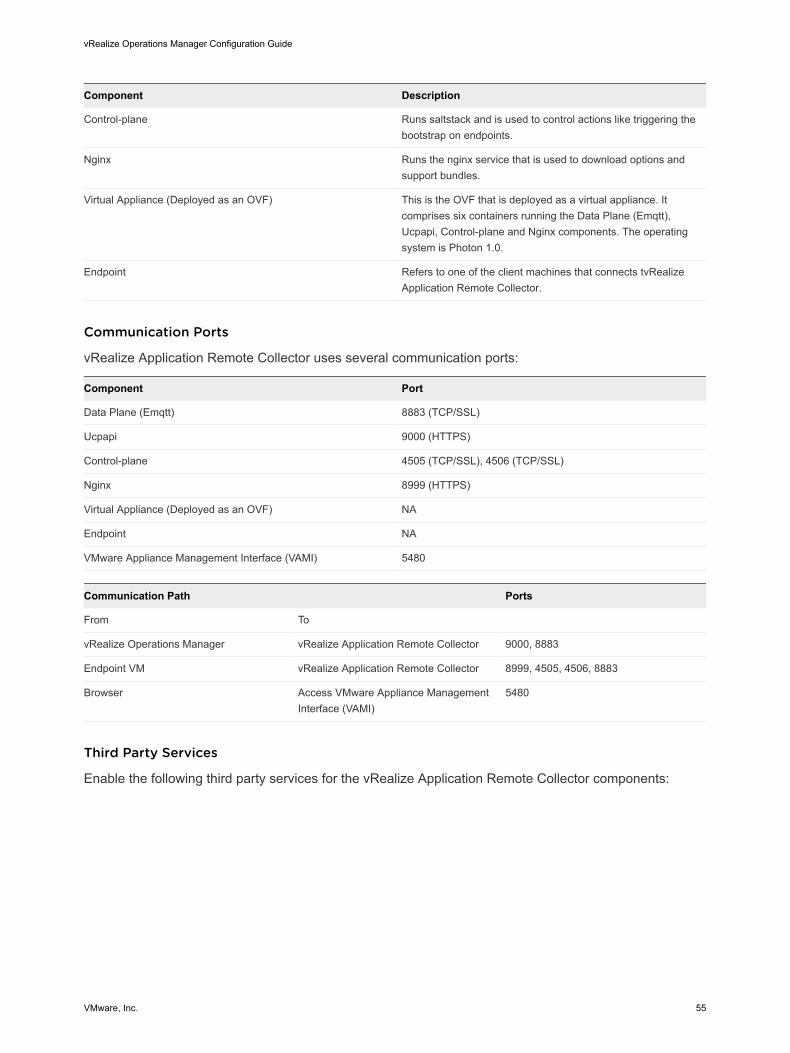
Component Description
Control-plane Runs saltstack and is used to control actions like triggering the bootstrap on endpoints.
Nginx Runs the nginx service that is used to download options and support bundles.
Virtual Appliance (Deployed as an OVF) This is the OVF that is deployed as a virtual appliance. It comprises six containers running the Data Plane (Emqtt), Ucpapi, Control-plane and Nginx components. The operating system is Photon 1.0.
Endpoint Refers to one of the client machines that connects tvRealize Application Remote Collector.
Communication Ports
vRealize Application Remote Collector uses several communication ports:
Component Port
Data Plane (Emqtt) 8883 (TCP/SSL)
Ucpapi 9000 (HTTPS)
Control-plane 4505 (TCP/SSL), 4506 (TCP/SSL)
Nginx 8999 (HTTPS)
Virtual Appliance (Deployed as an OVF) NA
Endpoint NA
VMware Appliance Management Interface (VAMI) 5480
Communication Path Ports
From To
vRealize Operations Manager vRealize Application Remote Collector 9000, 8883
Endpoint VM vRealize Application Remote Collector 8999, 4505, 4506, 8883
Browser Access VMware Appliance Management Interface (VAMI)
5480
Third Party Services
Enable the following third party services for the vRealize Application Remote Collector components:
vRealize Operations Manager Configuration Guide
VMware, Inc. 55
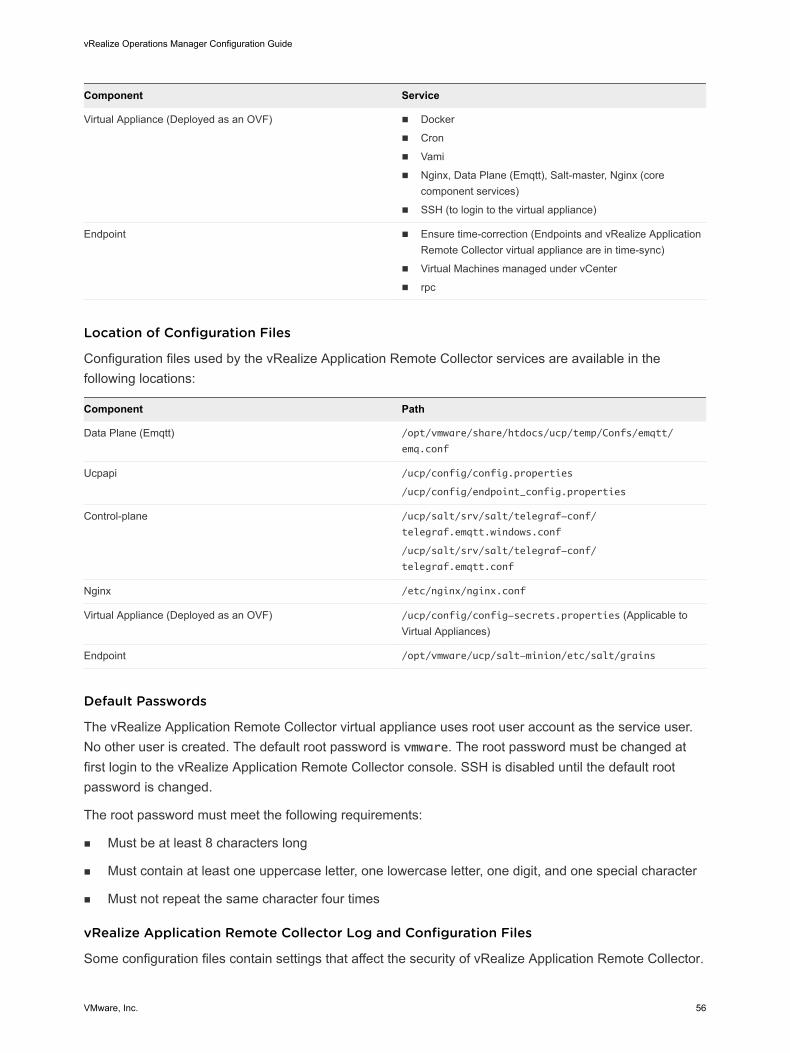
Component Service
Virtual Appliance (Deployed as an OVF) n Docker
n Cron
n Vami
n Nginx, Data Plane (Emqtt), Salt-master, Nginx (core component services)
n SSH (to login to the virtual appliance)
Endpoint n Ensure time-correction (Endpoints and vRealize Application Remote Collector virtual appliance are in time-sync)
n Virtual Machines managed under vCenter
n rpc
Location of Configuration Files
Configuration files used by the vRealize Application Remote Collector services are available in the following locations:
Component Path
Data Plane (Emqtt) /opt/vmware/share/htdocs/ucp/temp/Confs/emqtt/
emq.conf
Ucpapi /ucp/config/config.properties
/ucp/config/endpoint_config.properties
Control-plane /ucp/salt/srv/salt/telegraf-conf/
telegraf.emqtt.windows.conf
/ucp/salt/srv/salt/telegraf-conf/
telegraf.emqtt.conf
Nginx /etc/nginx/nginx.conf
Virtual Appliance (Deployed as an OVF) /ucp/config/config-secrets.properties (Applicable to Virtual Appliances)
Endpoint /opt/vmware/ucp/salt-minion/etc/salt/grains
Default Passwords
The vRealize Application Remote Collector virtual appliance uses root user account as the service user. No other user is created. The default root password is vmware. The root password must be changed at first login to the vRealize Application Remote Collector console. SSH is disabled until the default root password is changed.
The root password must meet the following requirements:
n Must be at least 8 characters long
n Must contain at least one uppercase letter, one lowercase letter, one digit, and one special character
n Must not repeat the same character four times
vRealize Application Remote Collector Log and Configuration Files
Some configuration files contain settings that affect the security of vRealize Application Remote Collector.
vRealize Operations Manager Configuration Guide
VMware, Inc. 56
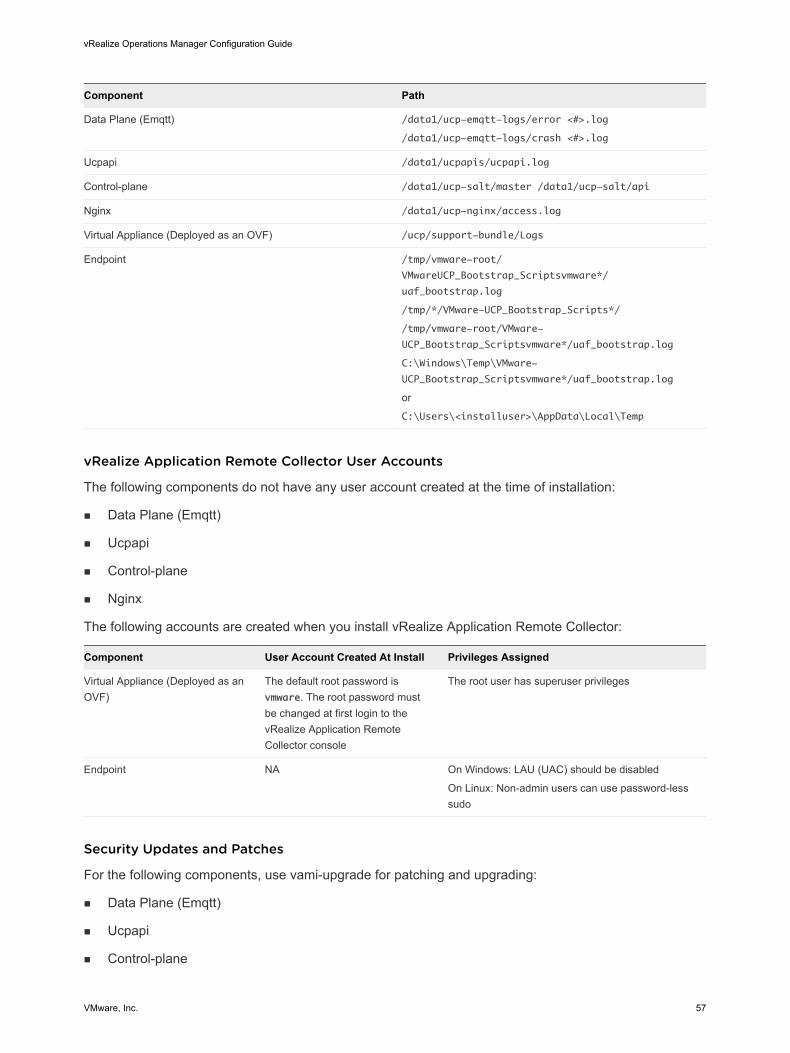
Component Path
Data Plane (Emqtt) /data1/ucp-emqtt-logs/error <#>.log
/data1/ucp-emqtt-logs/crash <#>.log
Ucpapi /data1/ucpapis/ucpapi.log
Control-plane /data1/ucp-salt/master /data1/ucp-salt/api
Nginx /data1/ucp-nginx/access.log
Virtual Appliance (Deployed as an OVF) /ucp/support-bundle/Logs
Endpoint /tmp/vmware-root/
VMwareUCP_Bootstrap_Scriptsvmware*/
uaf_bootstrap.log
/tmp/*/VMware-UCP_Bootstrap_Scripts*/
/tmp/vmware-root/VMware-
UCP_Bootstrap_Scriptsvmware*/uaf_bootstrap.log
C:\Windows\Temp\VMware-
UCP_Bootstrap_Scriptsvmware*/uaf_bootstrap.log
or
C:\Users\<installuser>\AppData\Local\Temp
vRealize Application Remote Collector User Accounts
The following components do not have any user account created at the time of installation:
n Data Plane (Emqtt)
n Ucpapi
n Control-plane
n Nginx
The following accounts are created when you install vRealize Application Remote Collector:
Component User Account Created At Install Privileges Assigned
Virtual Appliance (Deployed as an OVF)
The default root password is vmware. The root password must be changed at first login to the vRealize Application Remote Collector console
The root user has superuser privileges
Endpoint NA On Windows: LAU (UAC) should be disabled
On Linux: Non-admin users can use password-less sudo
Security Updates and Patches
For the following components, use vami-upgrade for patching and upgrading:
n Data Plane (Emqtt)
n Ucpapi
n Control-plane
vRealize Operations Manager Configuration Guide
VMware, Inc. 57
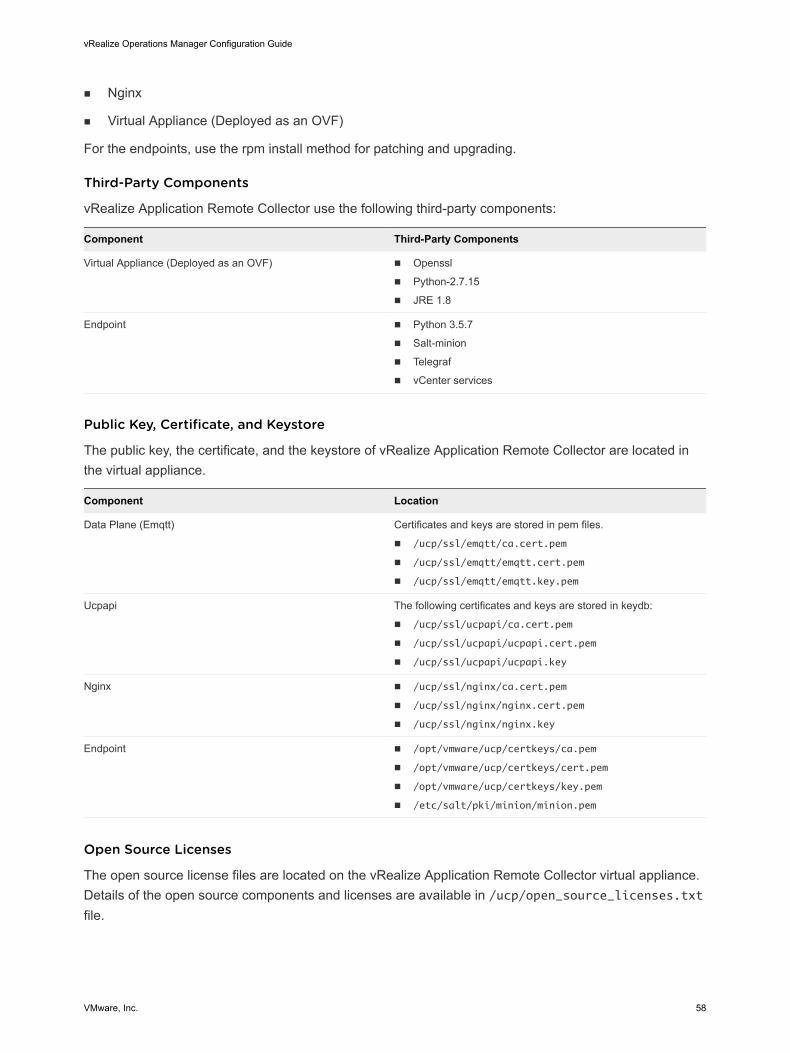
n Nginx
n Virtual Appliance (Deployed as an OVF)
For the endpoints, use the rpm install method for patching and upgrading.
Third-Party Components
vRealize Application Remote Collector use the following third-party components:
Component Third-Party Components
Virtual Appliance (Deployed as an OVF) n Openssl
n Python-2.7.15
n JRE 1.8
Endpoint n Python 3.5.7
n Salt-minion
n Telegraf
n vCenter services
Public Key, Certificate, and Keystore
The public key, the certificate, and the keystore of vRealize Application Remote Collector are located in the virtual appliance.
Component Location
Data Plane (Emqtt) Certificates and keys are stored in pem files.
n /ucp/ssl/emqtt/ca.cert.pem
n /ucp/ssl/emqtt/emqtt.cert.pem
n /ucp/ssl/emqtt/emqtt.key.pem
Ucpapi The following certificates and keys are stored in keydb:
n /ucp/ssl/ucpapi/ca.cert.pem
n /ucp/ssl/ucpapi/ucpapi.cert.pem
n /ucp/ssl/ucpapi/ucpapi.key
Nginx n /ucp/ssl/nginx/ca.cert.pem
n /ucp/ssl/nginx/nginx.cert.pem
n /ucp/ssl/nginx/nginx.key
Endpoint n /opt/vmware/ucp/certkeys/ca.pem
n /opt/vmware/ucp/certkeys/cert.pem
n /opt/vmware/ucp/certkeys/key.pem
n /etc/salt/pki/minion/minion.pem
Open Source Licenses
The open source license files are located on the vRealize Application Remote Collector virtual appliance. Details of the open source components and licenses are available in /ucp/open_source_licenses.txt file.
vRealize Operations Manager Configuration Guide
VMware, Inc. 58
Application MonitoringYou can monitor application services supported by vRealize Application Remote Collector in vRealize Operations Manager. You can also manage the life cycle of agents and application services on virtual machines.
For example, as an administrator, you might need to ensure that the infrastructure provided for running the application services is sufficient and that there are no problems. If you receive a complaint that a particular application service is not working properly or is slow, you can troubleshoot by looking at the infrastructure on which the application is deployed. You can view important metrics related to the applications and share the information with the team managing the applications. You can use vRealize Operations Manager to deploy the agents and send the related application data to vRealize Operations Manager. You can view the data in vRealize Operations Manager and share it with the team so that they can troubleshoot the application service.
Using vRealize Operations Advanced edition, you can monitor operating systems and conduct remote checks in vRealize Operations Manager. Using vRealize Operations Enterprise edition, you can conduct remote checks, monitor operating systems and applications, and run custom scripts in vRealize Operations Manager.
vRealize Operations Manager can monitor applications using the End Point Operations Management Solution and vRealize Application Remote Collector.
Note You cannot run the vRealize Application Remote Collector agent on the same VM as the End Point Operations Management agent.
To monitor and collect metrics for your applications and operating systems supported by vRealize Application Remote Collector, follow these steps in vRealize Operations Manager:
1 Activate the VMware vRealize Application Management Pack.
For more information, see Activate the VMware vRealize Application Management Pack.
2 Download the vRealize Application Remote Collector by clicking the Download icon in the Application Remote Collector page.
For information about deploying vRealize Application Remote Collector, see Deploy vRealize Application Remote Collector .
3 Configure an application remote collector.
For information about configuring vRealize Application Remote Collector, see Configure the Application Remote Collector and Add and Configure an Application Remote Collector.
4 Install agents on selected VMs and discover and manage application services.
For more information, see Manage Agents in Virtual Machines.
5 Monitor your applications in vRealize Operations Manager.
For more information about monitoring your applications in vRealize Operations Manager, see Monitor Applications In vRealize Operations Manager.
vRealize Operations Manager Configuration Guide
VMware, Inc. 59
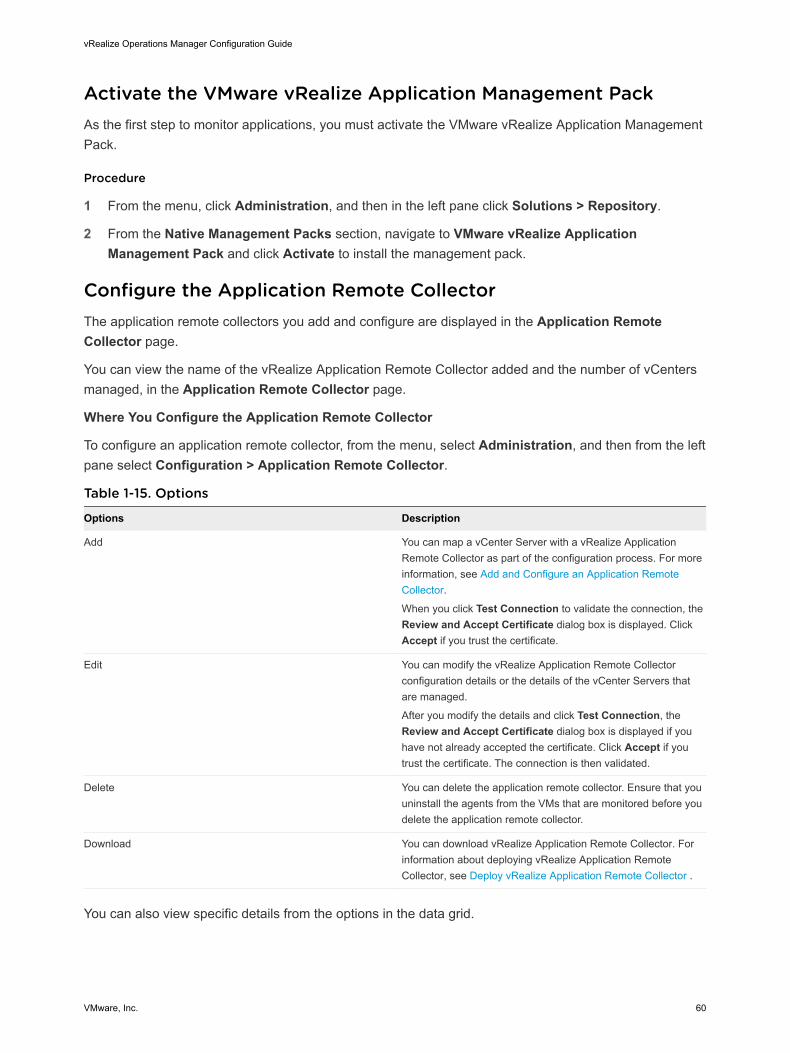
Activate the VMware vRealize Application Management PackAs the first step to monitor applications, you must activate the VMware vRealize Application Management Pack.
Procedure
1 From the menu, click Administration, and then in the left pane click Solutions > Repository.
2 From the Native Management Packs section, navigate to VMware vRealize Application Management Pack and click Activate to install the management pack.
Configure the Application Remote CollectorThe application remote collectors you add and configure are displayed in the Application Remote Collector page.
You can view the name of the vRealize Application Remote Collector added and the number of vCenters managed, in the Application Remote Collector page.
Where You Configure the Application Remote Collector
To configure an application remote collector, from the menu, select Administration, and then from the left pane select Configuration > Application Remote Collector.
Table 1-15. Options
Options Description
Add You can map a vCenter Server with a vRealize Application Remote Collector as part of the configuration process. For more information, see Add and Configure an Application Remote Collector.
When you click Test Connection to validate the connection, the Review and Accept Certificate dialog box is displayed. Click Accept if you trust the certificate.
Edit You can modify the vRealize Application Remote Collector configuration details or the details of the vCenter Servers that are managed.
After you modify the details and click Test Connection, the Review and Accept Certificate dialog box is displayed if you have not already accepted the certificate. Click Accept if you trust the certificate. The connection is then validated.
Delete You can delete the application remote collector. Ensure that you uninstall the agents from the VMs that are monitored before you delete the application remote collector.
Download You can download vRealize Application Remote Collector. For information about deploying vRealize Application Remote Collector, see Deploy vRealize Application Remote Collector .
You can also view specific details from the options in the data grid.
vRealize Operations Manager Configuration Guide
VMware, Inc. 60
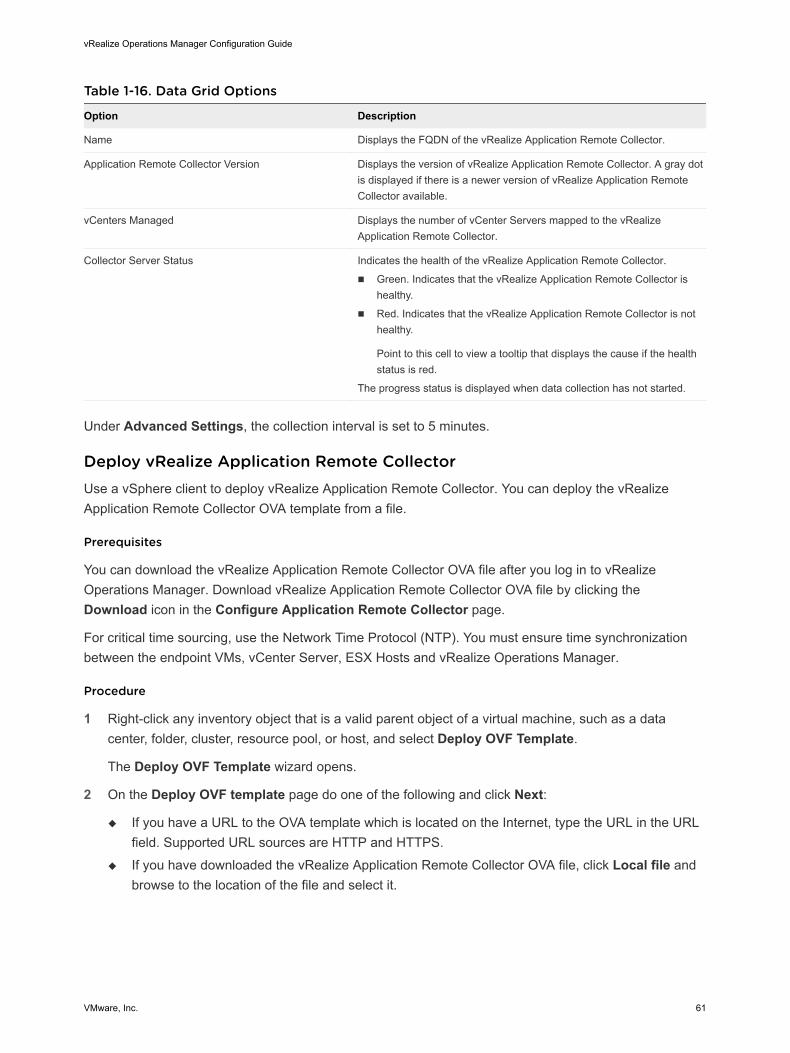
Table 1-16. Data Grid Options
Option Description
Name Displays the FQDN of the vRealize Application Remote Collector.
Application Remote Collector Version Displays the version of vRealize Application Remote Collector. A gray dot is displayed if there is a newer version of vRealize Application Remote Collector available.
vCenters Managed Displays the number of vCenter Servers mapped to the vRealize Application Remote Collector.
Collector Server Status Indicates the health of the vRealize Application Remote Collector.
n Green. Indicates that the vRealize Application Remote Collector is healthy.
n Red. Indicates that the vRealize Application Remote Collector is not healthy.
Point to this cell to view a tooltip that displays the cause if the health status is red.
The progress status is displayed when data collection has not started.
Under Advanced Settings, the collection interval is set to 5 minutes.
Deploy vRealize Application Remote CollectorUse a vSphere client to deploy vRealize Application Remote Collector. You can deploy the vRealize Application Remote Collector OVA template from a file.
Prerequisites
You can download the vRealize Application Remote Collector OVA file after you log in to vRealize Operations Manager. Download vRealize Application Remote Collector OVA file by clicking the Download icon in the Configure Application Remote Collector page.
For critical time sourcing, use the Network Time Protocol (NTP). You must ensure time synchronization between the endpoint VMs, vCenter Server, ESX Hosts and vRealize Operations Manager.
Procedure
1 Right-click any inventory object that is a valid parent object of a virtual machine, such as a data center, folder, cluster, resource pool, or host, and select Deploy OVF Template.
The Deploy OVF Template wizard opens.
2 On the Deploy OVF template page do one of the following and click Next:
u If you have a URL to the OVA template which is located on the Internet, type the URL in the URL field. Supported URL sources are HTTP and HTTPS.
u If you have downloaded the vRealize Application Remote Collector OVA file, click Local file and browse to the location of the file and select it.
vRealize Operations Manager Configuration Guide
VMware, Inc. 61
3 On the Select a name and folder page, enter a unique name for the virtual machine or vAPP, select a deployment location, and click Next.
The default name for the virtual machine is the same as the name of the selected OVF or OVA template. If you change the default name, choose a name that is unique within each vCenter Server virtual machine folder.
The default deployment location for the virtual machine is the inventory object where you started the wizard.
4 On the Select a resource page, select a resource where to run the deployed VM template, and click Next.
5 On the Review details page, verify the OVF or OVA template details and click Next.
Option Description
Product vRealize Application Remote Collector.
Version Version number of the vRealize Application Remote Collector.
Vendor VMWare.
Publisher Publisher of the OVF or OVA template, if a certificate included in the OVF or OVA template file specifies a publisher.
Download size Size of the OVF or OVA file.
Size on disk Size on disk after you deploy the OVF or OVA template.
6 On the Accept license agreements page, click Accept and then Next.
7 In the Select configuration page, select the size of the deployment.
8 On the Select storage page, define where and how to store the files for the deployed OVF or OVA template.
a Select a VM Storage Policy.
This option is available only if storage policies are enabled on the destination resource.
b (Optional) Enable the Show datastores from Storage DRS clusters check box to choose individual datastores from Storage DRS clusters for the initial placement of the virtual machine.
c Select a datastore to store the deployed OVF or OVA template.
The configuration file and virtual disk files are stored on the datastore. Select a datastore large enough to accommodate the virtual machine or vApp and all associated virtual disk files.
9 On the Select networks page, select a source network and map it to a destination network. Click Next. The source network must have a static FQDN name or static DNS.
The Source Network column lists all networks that are defined in the OVF or OVA template.
vRealize Operations Manager Configuration Guide
VMware, Inc. 62
10 In the Customize template page, provide inputs to configure the vRealize Application Remote Collector deployment. It is mandatory to give these details.
Configuration Description
API Admin User's Password Enter a password for the vRealize Application Remote Collector API admin. The username is [email protected]. This password should be used when configuring this instance of vRealize Application Remote Collector in vRealize Operations Manager. Blank spaces before or after the password are ignored and are not considered to be part of the password.
Networking Properties Verify the networking properties.
11 On the Ready to complete page, review the page and click Finish.
12 After the OVA deployment is complete, you can log in to the virtual appliance from vCenter Server. Right click the virtual appliance that you installed. Click Open Console. Use the following credentials to log in:
Log In Details Value
Username root
Password vmware
13 Change the root user password.
Note To reset the root user password, see the KB article: 2001476
14 Enable the sshd service to access the virtual machine through ssh.
What to do next
n Perform the post-installation tasks.
n Log in to vRealize Operations Manager and configure the agents to connect to vRealize Operations Manager.
Configure Network Time Protocol SettingsAfter you install or upgrade to the latest version of vRealize Application Remote Collector, you must set up accurate timekeeping as part of the deployment. If the time settings between vRealize Application Remote Collector and vRealize Operations Manager are not synchronized, you face agent installation and metric collection issues. Ensure time synchronization between the endpoint VMs, vCenter Server, ESX Hosts, and vRealize Operations Manager using the Network Time Protocol (NTP).
vRealize Operations Manager Configuration Guide
VMware, Inc. 63
Procedure
1 Log in to the vRealize Application Remote Collector appliance and modify the ntp.conf file available in /etc/ntp.conf by adding following in the following format:
server time.vmware.com
Note Replace time.vmware.com with a suitable time server setting. You can use the FQDN or IP of the time server.
2 Enter the following command to start the NTP daemon:
systemctl start ntpd
3 Enter the following command to enable the NTP daemon:
systemctl enable ntpd
4 Run the following command to verify if NTP is configured correctly:
ntpstat
If NTP is synchronized correctly, you see a message similar to the following:
synchronised to NTP server (10.113.60.176) at stratum 3
time correct to within 50 ms
polling server every 64 s
Add and Configure an Application Remote CollectorYou can add and configure an application remote collector from the Application Remote Collector page to manage the life cycle of agents and application services.
To add and configure a vRealize Application Remote Collector, in the menu, click Administration, and then in the left pane select Configuration > Application Remote Collector.
Note Time synchronization between vRealize Application Remote Collector and vRealize Operations Manager is mandatory when you add an application remote collector. If the time settings are not synchronized, you face problems such as, a failed test connection when you add an application remote collector, agent installation issues, and issues in metrics collection after the agent is installed. For more information, see Troubleshoot Agent Installation and Metric Collection Issues.
For more troubleshooting information on vRealize Application Remote Collector, see Troubleshooting your Deployment.
vRealize Operations Manager Configuration Guide
VMware, Inc. 64
Prerequisites
n Verify that you have configured a vCenter adapter. The vCenter Server user account with which the vCenter adapter is configured in vRealize Operations Manager, should have the following permissions: Guest operation modifications, Guest operation program execution, and Guest operation queries. See Install an Agent.
n Ensure that the ports for vRealize Application Remote Collector are open. For more information on ports, see vRealize Application Remote Collector Security Information.
n Download and deploy vRealize Application Remote Collector.
You can download vRealize Application Remote Collector by clicking the Download icon in the Configure Application Remote Collector page.
For information about deploying the vRealize Application Remote Collector, see Deploy vRealize Application Remote Collector .
n Configure network protocol settings. For more information, see Configure Network Time Protocol Settings.
Procedure
1 To configure a vRealize Application Remote Collector, click the Add icon from the Application Remote Collector page.
2 In the Application Remote Collector page, enter the following details:
a FQDN of the vRealize Application Remote Collector you have configured during the installation of vRealize Application Remote Collector.
b You cannot modify the user name which is admin.
c The API password of the vRealize Application Remote Collector you have configured during the installation of vRealize Application Remote Collector.
d Click Next.
3 From the Map vCenters page, complete the following steps:
a Select the vCenter Servers to which you want to map the vRealize Application Remote Collector.
If you have mapped a vCenter Server to a vRealize Application Remote Collector, it is not displayed in the drop-down menu.
b The vCenter Servers that are mapped to the vRealize Application Remote Collector are displayed on the page.
vRealize Operations Manager Configuration Guide
VMware, Inc. 65
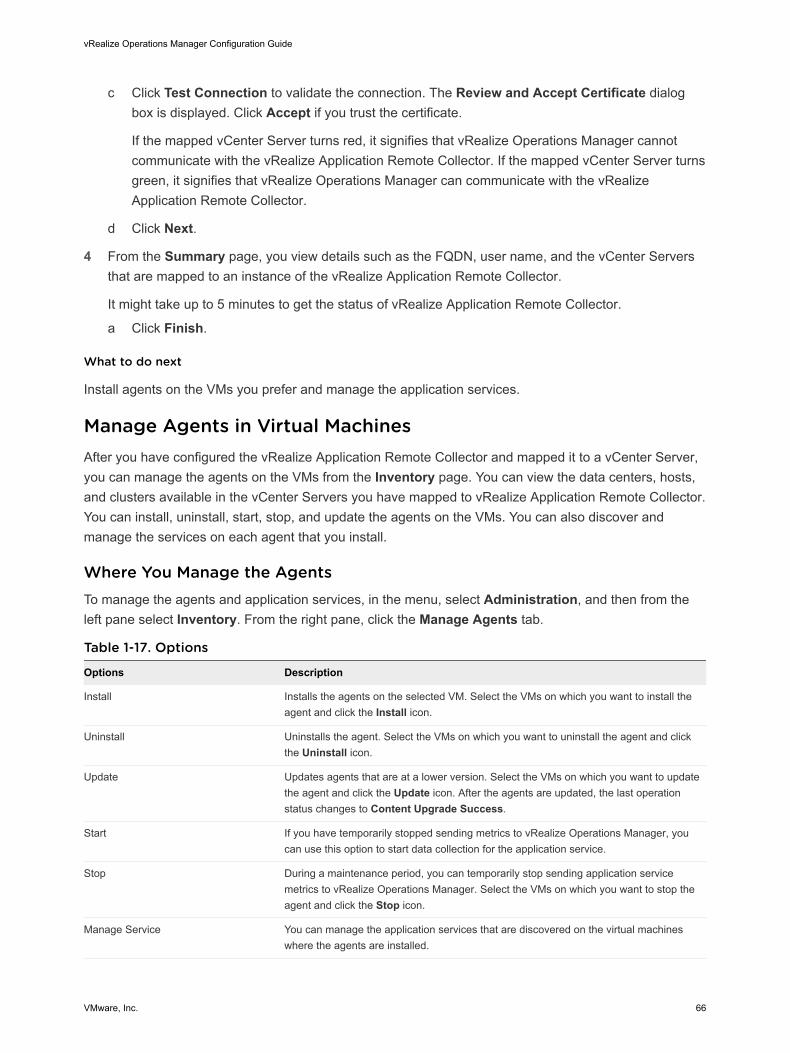
c Click Test Connection to validate the connection. The Review and Accept Certificate dialog box is displayed. Click Accept if you trust the certificate.
If the mapped vCenter Server turns red, it signifies that vRealize Operations Manager cannot communicate with the vRealize Application Remote Collector. If the mapped vCenter Server turns green, it signifies that vRealize Operations Manager can communicate with the vRealize Application Remote Collector.
d Click Next.
4 From the Summary page, you view details such as the FQDN, user name, and the vCenter Servers that are mapped to an instance of the vRealize Application Remote Collector.
It might take up to 5 minutes to get the status of vRealize Application Remote Collector.
a Click Finish.
What to do next
Install agents on the VMs you prefer and manage the application services.
Manage Agents in Virtual MachinesAfter you have configured the vRealize Application Remote Collector and mapped it to a vCenter Server, you can manage the agents on the VMs from the Inventory page. You can view the data centers, hosts, and clusters available in the vCenter Servers you have mapped to vRealize Application Remote Collector. You can install, uninstall, start, stop, and update the agents on the VMs. You can also discover and manage the services on each agent that you install.
Where You Manage the AgentsTo manage the agents and application services, in the menu, select Administration, and then from the left pane select Inventory. From the right pane, click the Manage Agents tab.
Table 1-17. Options
Options Description
Install Installs the agents on the selected VM. Select the VMs on which you want to install the agent and click the Install icon.
Uninstall Uninstalls the agent. Select the VMs on which you want to uninstall the agent and click the Uninstall icon.
Update Updates agents that are at a lower version. Select the VMs on which you want to update the agent and click the Update icon. After the agents are updated, the last operation status changes to Content Upgrade Success.
Start If you have temporarily stopped sending metrics to vRealize Operations Manager, you can use this option to start data collection for the application service.
Stop During a maintenance period, you can temporarily stop sending application service metrics to vRealize Operations Manager. Select the VMs on which you want to stop the agent and click the Stop icon.
Manage Service You can manage the application services that are discovered on the virtual machines where the agents are installed.
vRealize Operations Manager Configuration Guide
VMware, Inc. 66
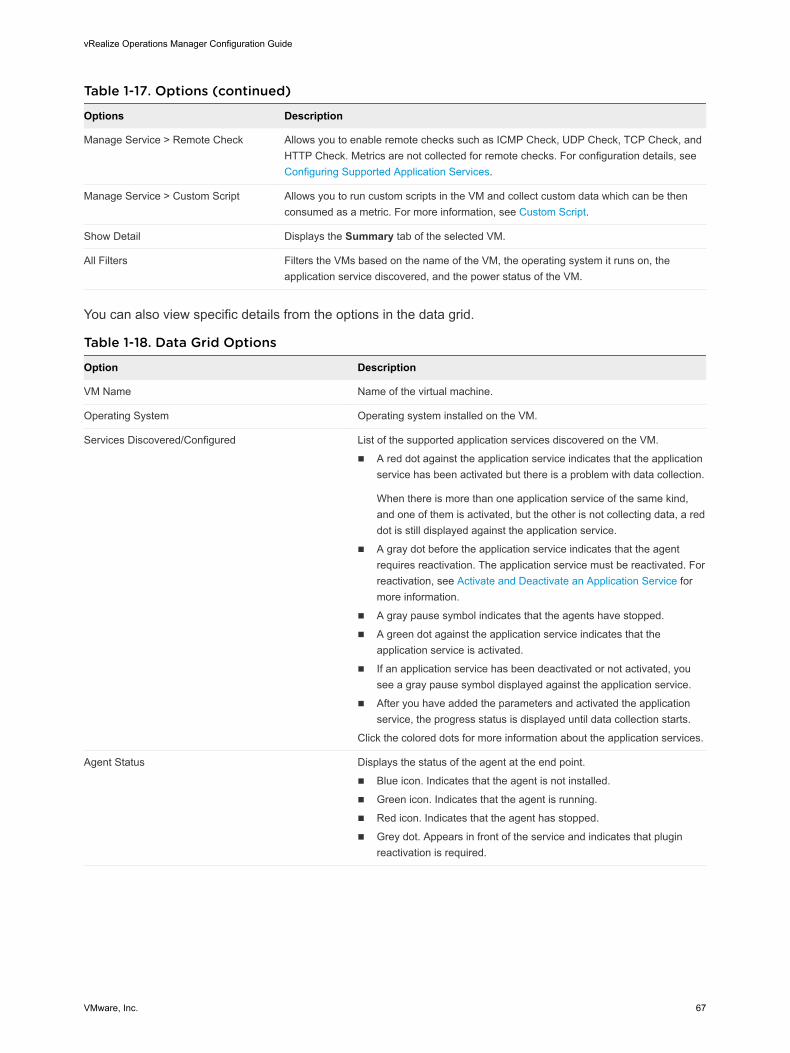
Table 1-17. Options (continued)
Options Description
Manage Service > Remote Check Allows you to enable remote checks such as ICMP Check, UDP Check, TCP Check, and HTTP Check. Metrics are not collected for remote checks. For configuration details, see Configuring Supported Application Services.
Manage Service > Custom Script Allows you to run custom scripts in the VM and collect custom data which can be then consumed as a metric. For more information, see Custom Script.
Show Detail Displays the Summary tab of the selected VM.
All Filters Filters the VMs based on the name of the VM, the operating system it runs on, the application service discovered, and the power status of the VM.
You can also view specific details from the options in the data grid.
Table 1-18. Data Grid Options
Option Description
VM Name Name of the virtual machine.
Operating System Operating system installed on the VM.
Services Discovered/Configured List of the supported application services discovered on the VM.
n A red dot against the application service indicates that the application service has been activated but there is a problem with data collection.
When there is more than one application service of the same kind, and one of them is activated, but the other is not collecting data, a red dot is still displayed against the application service.
n A gray dot before the application service indicates that the agent requires reactivation. The application service must be reactivated. For reactivation, see Activate and Deactivate an Application Service for more information.
n A gray pause symbol indicates that the agents have stopped.
n A green dot against the application service indicates that the application service is activated.
n If an application service has been deactivated or not activated, you see a gray pause symbol displayed against the application service.
n After you have added the parameters and activated the application service, the progress status is displayed until data collection starts.
Click the colored dots for more information about the application services.
Agent Status Displays the status of the agent at the end point.
n Blue icon. Indicates that the agent is not installed.
n Green icon. Indicates that the agent is running.
n Red icon. Indicates that the agent has stopped.
n Grey dot. Appears in front of the service and indicates that plugin reactivation is required.
vRealize Operations Manager Configuration Guide
VMware, Inc. 67
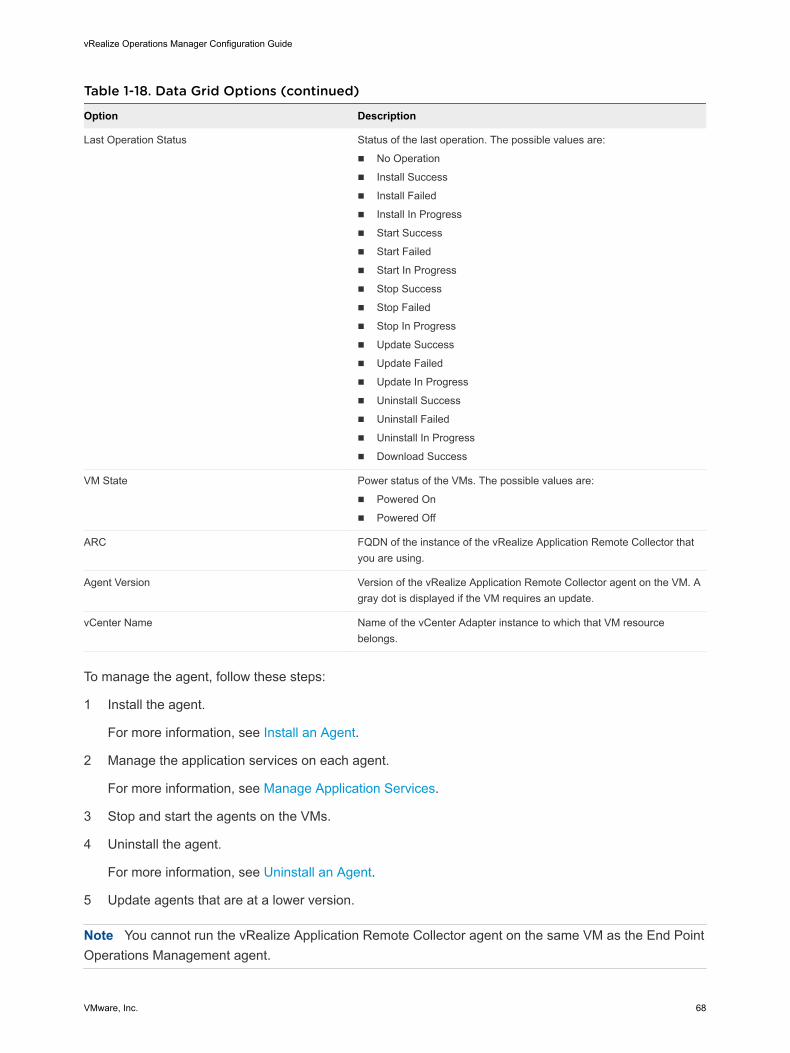
Table 1-18. Data Grid Options (continued)
Option Description
Last Operation Status Status of the last operation. The possible values are:
n No Operation
n Install Success
n Install Failed
n Install In Progress
n Start Success
n Start Failed
n Start In Progress
n Stop Success
n Stop Failed
n Stop In Progress
n Update Success
n Update Failed
n Update In Progress
n Uninstall Success
n Uninstall Failed
n Uninstall In Progress
n Download Success
VM State Power status of the VMs. The possible values are:
n Powered On
n Powered Off
ARC FQDN of the instance of the vRealize Application Remote Collector that you are using.
Agent Version Version of the vRealize Application Remote Collector agent on the VM. A gray dot is displayed if the VM requires an update.
vCenter Name Name of the vCenter Adapter instance to which that VM resource belongs.
To manage the agent, follow these steps:
1 Install the agent.
For more information, see Install an Agent.
2 Manage the application services on each agent.
For more information, see Manage Application Services.
3 Stop and start the agents on the VMs.
4 Uninstall the agent.
For more information, see Uninstall an Agent.
5 Update agents that are at a lower version.
Note You cannot run the vRealize Application Remote Collector agent on the same VM as the End Point Operations Management agent.
vRealize Operations Manager Configuration Guide
VMware, Inc. 68
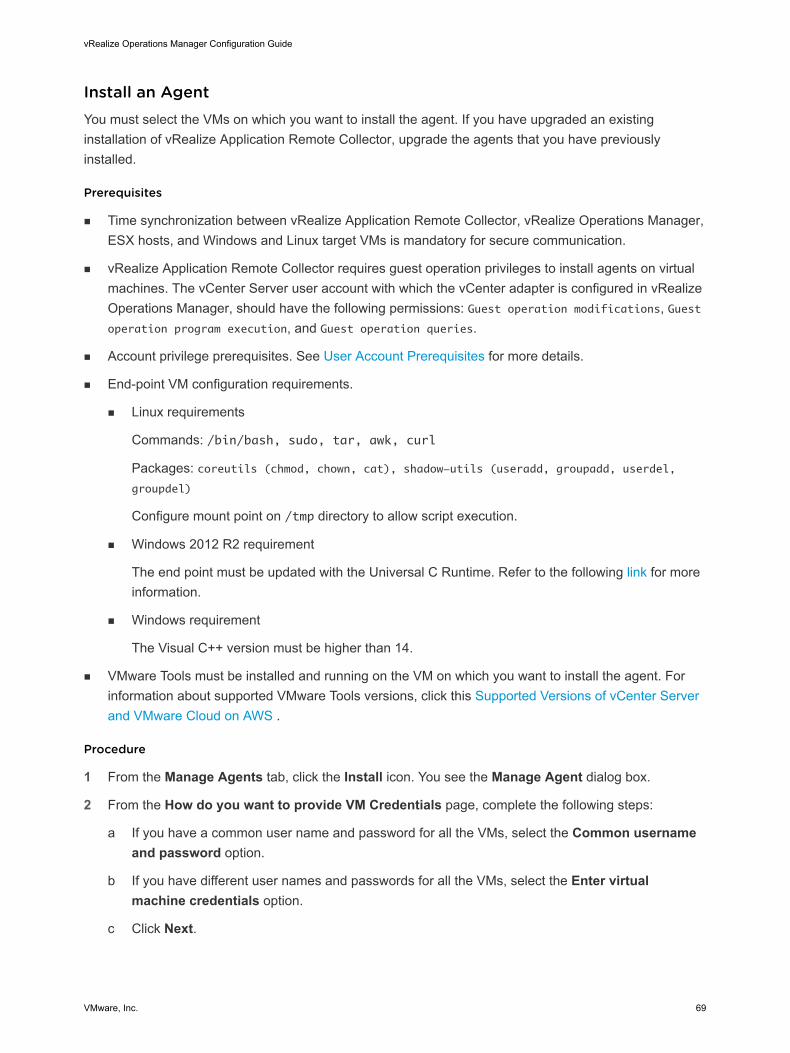
Install an AgentYou must select the VMs on which you want to install the agent. If you have upgraded an existing installation of vRealize Application Remote Collector, upgrade the agents that you have previously installed.
Prerequisites
n Time synchronization between vRealize Application Remote Collector, vRealize Operations Manager, ESX hosts, and Windows and Linux target VMs is mandatory for secure communication.
n vRealize Application Remote Collector requires guest operation privileges to install agents on virtual machines. The vCenter Server user account with which the vCenter adapter is configured in vRealize Operations Manager, should have the following permissions: Guest operation modifications, Guest operation program execution, and Guest operation queries.
n Account privilege prerequisites. See User Account Prerequisites for more details.
n End-point VM configuration requirements.
n Linux requirements
Commands: /bin/bash, sudo, tar, awk, curl
Packages: coreutils (chmod, chown, cat), shadow-utils (useradd, groupadd, userdel, groupdel)
Configure mount point on /tmp directory to allow script execution.
n Windows 2012 R2 requirement
The end point must be updated with the Universal C Runtime. Refer to the following link for more information.
n Windows requirement
The Visual C++ version must be higher than 14.
n VMware Tools must be installed and running on the VM on which you want to install the agent. For information about supported VMware Tools versions, click this Supported Versions of vCenter Server and VMware Cloud on AWS .
Procedure
1 From the Manage Agents tab, click the Install icon. You see the Manage Agent dialog box.
2 From the How do you want to provide VM Credentials page, complete the following steps:
a If you have a common user name and password for all the VMs, select the Common username and password option.
b If you have different user names and passwords for all the VMs, select the Enter virtual machine credentials option.
c Click Next.
vRealize Operations Manager Configuration Guide
VMware, Inc. 69
3 From the Provide Credentials page, depending on whether you have a common credential for all VMs or different credentials for all VMs, enter the following details:
a If the selected VMs have a common user name and password, enter the common user name and password.
b For different user names and passwords for each VM, download the CSV template and add the required details such as the user name, password for each VM. Use the Browse button to select the template.
c The Create run time user on Linux virtual machines, with required permissions as part of agent installation check box is selected by default. For more information, see User Account Prerequisites.
d Click Next.
4 From the Summary page, you can view the list of VMs on which the agent is to be deployed.
5 Click Install Agent. Refresh the UI to view the agents that are installed.
On UAC disabled machines on Windows end points, the agent discovers the application services that are installed on the VMs. The application services are displayed in the Services Discovered/Configured column in the Manage Agents tab. You can view the status of agent installation from the Agent Status column in the Manage Agents tab.
UAC Enabled Machines on Windows End Points
The bits are downloaded to the end point. You have to manually install the bits.
a From C:\VMware\UCP\downloads, run a bootstrap launcher.
b Go to %SYSTEMDRIVE%\VMware\UCP\downloads.
c Open cmd with administrator privileges.
d Run the cmd /c uaf-bootstrap-launcher.bat > uaf_bootstrap.log 2>&1 command.
e View the results from uaf_bootstrap.log.
f Verify the status of agent installation from the Agent Status and Last Operation Status columns in the Manage Agents tab.
What to do next
You can manage the services on each agent.
User Account Prerequisites
There are certain user account prerequisites required for the install of agents.
Prerequisites for Windows End Points
n To install agents,
n The user must be either an administrator, or
n A non-administrator who belongs to the administrator group.
vRealize Operations Manager Configuration Guide
VMware, Inc. 70
Prerequisites for Linux End Points
n /tmp mount point should be mounted with exec mount option.
n Ensure that the following lines exist in /etc/sudoers.
1.root ALL=(ALL:ALL) ALL
2.Defaults:root !requiretty
3.Defaults:arcuser !requiretty
(1) can be omitted if password-less sudo is already enabled for the root user. (2) and (3) can be omitted if your end point VMs are already configured to turn off requiretty.
For Linux end points, there are two user accounts, such as the install user and the run-time user.
Install User Prerequisites
You can use one of the following install users for Linux end points.
n root user - All privileges
n A non-root user with all privileges -
Password-less sudo elevation access for a non-root user or a non-root user group.
To enable password-less sudo elevation access for a user called bob, add bob ALL=(ALL:ALL) NOPASSWD: ALL to /etc/sudoers.
To enable password-less sudo elevation access for a user group called bobg, add %bobg ALL=(ALL:ALL) NOPASSWD: ALL to /etc/sudoers.
n A non-root user with a specific set of privileges -
Password-less sudo elevation access for a non-root user with access to certain commands. To enable password-less sudo elevation access for the ARC_INSTALL_USER, add the following corresponding entries to the sudoers file:
Defaults:ARC_INSTALL_USER !requiretty
Cmnd_Alias ARC_INSTALL_USER_COMMANDS=/usr/bin/cp*,/bin/cp*,/usr/bin/mkdir*,/bin/mkdir*,/usr/bin/
chmod*,/bin/chmod*,/opt/vmware/ucp/bootstrap/uaf-bootstrap.sh,/opt/vmware/ucp/ucp-minion/bin/ucp-
minion.sh
ARC_INSTALL_USER ALL=(ALL)NOPASSWD: ARC_INSTALL_USER_COMMANDS
For example,for a user bob, add the following lines to /etc/sudoers:
Defaults:bob !requiretty
Cmnd_Alias ARC_INSTALL_USER_COMMANDS=/usr/bin/cp*,/bin/cp*,/usr/bin/mkdir*,/bin/mkdir*,/usr/bin/
chmod*,/bin/chmod*,/opt/vmware/ucp/bootstrap/uaf-bootstrap.sh,/opt/vmware/ucp/ucp-minion/bin/ucp-
minion.sh
bob ALL=(ALL)NOPASSWD: ARC_INSTALL_USER_COMMANDS
Run-Time User Prerequisites
vRealize Operations Manager Configuration Guide
VMware, Inc. 71
There are two ways in which a run-time user is created in Linux end points: automatically and manually. A run-time user has a standard name and group, which is the arcuser and arcgroup respectively. By default, the arcuser and arcgroup are created automatically. If you choose to manually create the arcuser and arcgroup, here are the prerequisites:
n Manually created arcuser and arcgroup.
Create the arcgroup and arcuser and associate the arcgroup as the primary group of the arcuser. Here are the requirements:
a The arcgroup must be the primary group of the arcuser.
For example, the following commands can be used to create the arcgroup and arcuser:
groupadd arcgroup
useradd arcuser -g arcgroup -M -s /bin/false
b The arcuser must be created with no home directory and no access to the login shell.
For example, the etc/passwd entry for the arcuser is as follows after adding arcuser and arcgroup.
arcuser:x:1001:1001::/home/arcuser:/bin/false
c The arcuser must have either password-less all privileges or password-less specific set of privileges as mentioned below:
To enable password-less sudo elevation access for the run-time arcuser, add the following corresponding entries to the sudoers file.
All privileges:
arcuser ALL=(ALL:ALL) NOPASSWD: ALL
Specific set of privileges:
Cmnd_Alias ARC_RUN_COMMANDS=/usr/bin/systemctl * ucp-telegraf*,/bin/systemctl * ucp-
telegraf*, /usr/bin/systemctl * ucp-minion*, /bin/systemctl * ucp-minion*, /usr/bin/systemctl
* salt-minion*, /bin/sytemctl * salt-minion*, /usr/bin/netstat, /bin/netstat, /opt/
vmware/ucp/tmp/telegraf_post_install_linux.sh, /opt/vmware/ucp/bootstrap/uaf-
bootstrap.sh, /opt/vmware/ucp/uaf/runscript.sh, /opt/vmware/ucp/ucp-minion/bin/ucp-minion.sh
arcuser ALL=(ALL) NOPASSWD: ARC_RUN_COMMANDS
Manage Application ServicesYou can manage the application services supported by vRealize Application Remote Collector on the VMs where the agents are installed.
Procedure
1 Select a VM on which the agent has been installed and the application services have been discovered, from the Manage Agents tab.
2 Select Manage Service and then from the drop-down menu select the service name. You see the Manage <service name> Agent dialog box.
vRealize Operations Manager Configuration Guide
VMware, Inc. 72
3 By default, all metrics are collected for the activated application service.
4 Activate data collection for the application service.
5 Enter the relevant settings for the application service.
6 Click Save and then Close.
Fields with a star are mandatory.
For more information about the status details that appear against the application services in the Services Discovered/Configured column, see the table called Data Grid Options in Manage Agents in Virtual Machines.
For information about supported application services and their properties, see Configuring Supported Application Services.
What to do next
You can monitor the applications services from vRealize Operations Manager.
Custom Script
You can run custom scripts in the VM and collect custom data which can then be consumed as a metric.
Prerequisites
n All the scripts that you run using the custom script, must output a single integer value. If the output is not a single integer value, an error is displayed in the user interface.
n The custom script uses Telegraf’s exec plugin to run scripts on a VM’s operating system. The scripts are run by the user who installed the Telegraf agent on an operating system. In Linux operating systems, a special user called arcuser with specific privileges, is created for installing the Telegraf agent. As a result, the exec plugin runs the scripts using that arcuser user. Ensure that the arcuser can run the scripts that use the custom script (the arcuser must have permissions to run the script). For example, the arcuser created automatically by vRealize Application Remote Collector, does not have privileges to run scripts which are stored under the /root directory.
n The script must be placed in the /opt/vmware folder.
Instance Settings
Option Description
Status Enable the custom script execution.
Display Name Add a suitable name for the script.
Filepath Enter the path to the script file on the end point VM.
Prefix Enter a prefix if necessary.
Args List the arguments in the script.
Timeout Enter a script execution timeout on the VM.
vRealize Operations Manager Configuration Guide
VMware, Inc. 73
After you save the script, it appears in the left pane of the Custom Script dialog box. You can add or delete scripts by clicking the Add or Delete buttons in the left pane. After the scripts have been added and saved, from the Manage Agents tab > Services Discovered/Configured column, you see the Custom Script label. Point to the Custom Script label to view the list of scripts and their status.
Note n The custom script must throw all errors in the format ERROR|<Error_message> for the error
propagation to work. If the script does not throw an error in the given format, vRealize Operations Manager displays an error message Unable to parse the error message. Please check the endpoint in the user interface. This is by design, until vRealize Application Remote Collector propagates the exact error message.
n The bash script must start with shebang (#!/bin/bash).
All Metrics Tab
When data is collected successfully, you can view the script as a metric for the VM, in the All Metrics tab. The script metrics are created under an object called Custom Script which is a single object per VM. All the metrics from the scripts for the VM are placed under that Custom Script object that contains all the custom scripts you have created. You can view the output for the specific metric. The metric name under the Scripts folder is the display name that the user specifies while creating the script configuration. For example, if you set the display name as Python script, then a metric is created with the name Python script if data is collected successfully.
Activate and Deactivate an Application ServiceTo monitor application services running on the target VMs, vRealize Application Remote Collector plugins must be configured in the target VMs after the agent is installed.
After you have installed the agent, you can choose to activate or deactivate vRealize Application Remote Collector plugins to monitor application services. You can also reactivate plugins that need to be monitored.
Prerequisite
n If plugin activation requires the location of a file (for example, client certificates for SSL Trust) on the endpoint VM, the location and the files should have appropriate read permissions for the arcuser to access those files.
Note If the plugin displays a permission denied status, provide the arcuser with permissions to the file locations that you have specified during plugin activation.
Activate an Application Service
To monitor an application service, complete the following steps:
1 Navigate to the Inventory > Manage Agents tab.
2 Select the VM on which agent is already installed.
3 Select Manage Service icon and then from the drop-down menu select the service name.
vRealize Operations Manager Configuration Guide
VMware, Inc. 74

4 Activate the application service from the right pane of the Manage <service name> Agent dialog box.
5 Click the Add icon in the left pane to add multiple instances of the application service.
6 Click the Delete icon in the left pane to delete instances of the application service.
7 Enter the details for each instance that you add and click Save.
For more information about the status details that appear against the application services in the Services Discovered column, see the table called Data Grid Options in Manage Agents in Virtual Machines.
The following special characters are permitted in the DB user field: '[]{} (),.<> ?:!|/~@#$%^&*- _ +=
You can provide DB name lists in the following format ['DBNAME_1', 'DBNAME_2', 'DBNAME_3'] where DBNAME_1, DBNAME_2, DBNAME_3 must not contain quotes such as ' and ".
Note When multiple VMs are selected, the Manage Service option is disabled.
Deactivate an Application Service
To deactivate a plugin to stop monitoring the application service that is sending data to vRealize Operations Manager, complete the following steps:
1 Navigate to the Inventory > Manage Agents tab.
2 Select the VM on which the agent is already installed.
3 Select the Manage Service icon and then from the drop-down menu select the service name.
4 Deactivate the application service from the right pane of the Manage <service name> Agent dialog box.
5 Click Save.
When you stop an agent, you cannot activate or deactivate a plugin. If the VM is powered off or if you lose connection with vRealize Application Remote Collector, you cannot configure or activate a plugin.
Uninstall an AgentYou must select the VMs on which you want to uninstall the agent.
Procedure
1 From the Manage Agents tab, click the Uninstall icon. You see the Manage Agent dialog box.
2 From the How do you want to provide VM Credentials page, complete the following steps:
a If you have a common user name and password for all the VMs, select the Common username and password option.
b If you have different user names and passwords for all the VMs, select the Enter virtual machine credentials option.
c Click Next.
vRealize Operations Manager Configuration Guide
VMware, Inc. 75
3 From the Provide Credentials page, depending on whether you have a common credential for all VMs or different credentials for all VMs, enter the following details:
a If your VM has a single user name and password, enter the common user name and password.
b For multiple user names and passwords for each VM, download the CSV template and add the details. Use the Browse button to select the template.
c Click Next.
4 From the Summary page, you can view the list of VMs on which the agent is deployed.
5 Click Uninstall Agent. Refresh the UI to view the progress of agent uninstallation.
The Agent Status and Services Discovered columns in the workspace indicate that uninstallation is complete and that there are no application services discovered on each agent.
Monitor Applications In vRealize Operations ManagerYou can monitor applications and operating systems from vRealize Operations Manager to view services and processes.
Where You Monitor Applications in vRealize Operations ManagerFrom the menu, select Home, and then in the left pane select Monitor Applications.
Discovered Operating Systems and ServicesYou see the application services that are discovered on the virtual machines where the agents are installed. From the Discovered Operating Systems and Services section in the Monitor Applications page, click the text next to the number to view the status of the agent, the operation status, the power status of the VM, and the list of supported application services discovered on the VM. For more information, see Manage Agents in Virtual Machines.
Supported Operating SystemsYou see a list of supported operating systems for which vRealize Operations Manager collects metrics using the vRealize Application Remote Collector.
Supported ServicesYou see a list of supported services for which vRealize Operations Manager collects metrics using the vRealize Application Remote Collector.
Operating System Metrics Collected by vRealize Application Remote CollectorvRealize Application Remote Collector collects metrics for Linux and Windows operating systems.
Linux PlatformsvRealize Application Remote Collector collects the following metrics for Linux operating systems:
vRealize Operations Manager Configuration Guide
VMware, Inc. 76
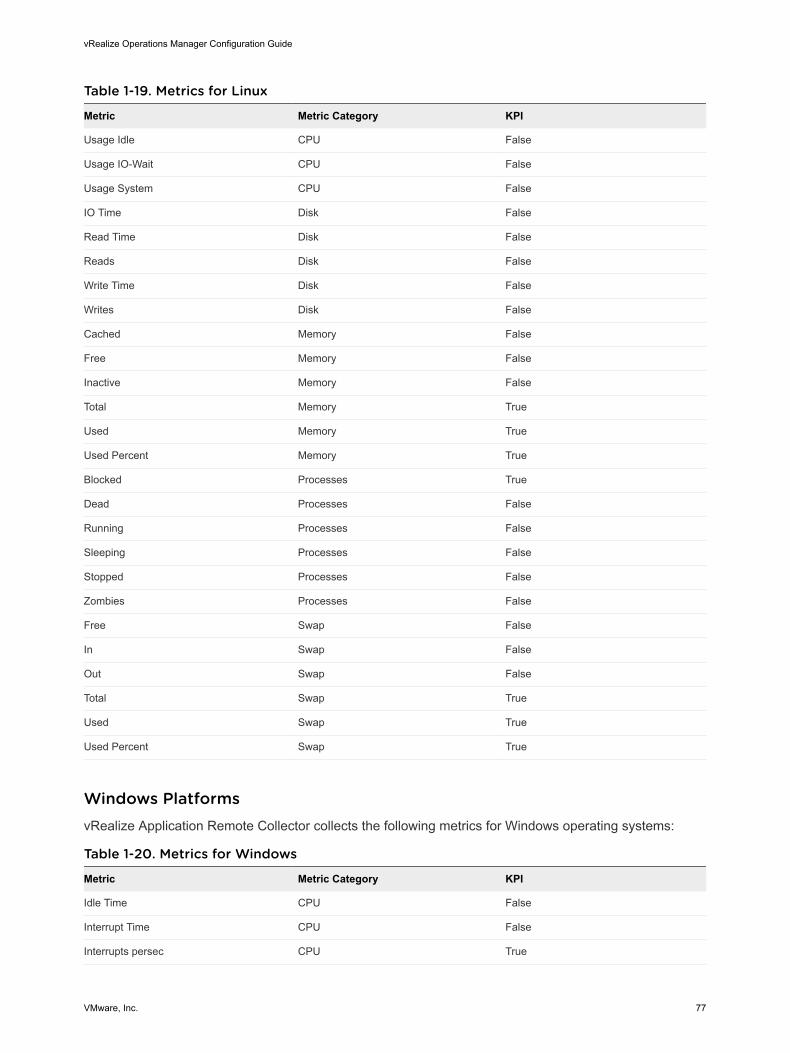
Table 1-19. Metrics for Linux
Metric Metric Category KPI
Usage Idle CPU False
Usage IO-Wait CPU False
Usage System CPU False
IO Time Disk False
Read Time Disk False
Reads Disk False
Write Time Disk False
Writes Disk False
Cached Memory False
Free Memory False
Inactive Memory False
Total Memory True
Used Memory True
Used Percent Memory True
Blocked Processes True
Dead Processes False
Running Processes False
Sleeping Processes False
Stopped Processes False
Zombies Processes False
Free Swap False
In Swap False
Out Swap False
Total Swap True
Used Swap True
Used Percent Swap True
Windows PlatformsvRealize Application Remote Collector collects the following metrics for Windows operating systems:
Table 1-20. Metrics for Windows
Metric Metric Category KPI
Idle Time CPU False
Interrupt Time CPU False
Interrupts persec CPU True
vRealize Operations Manager Configuration Guide
VMware, Inc. 77
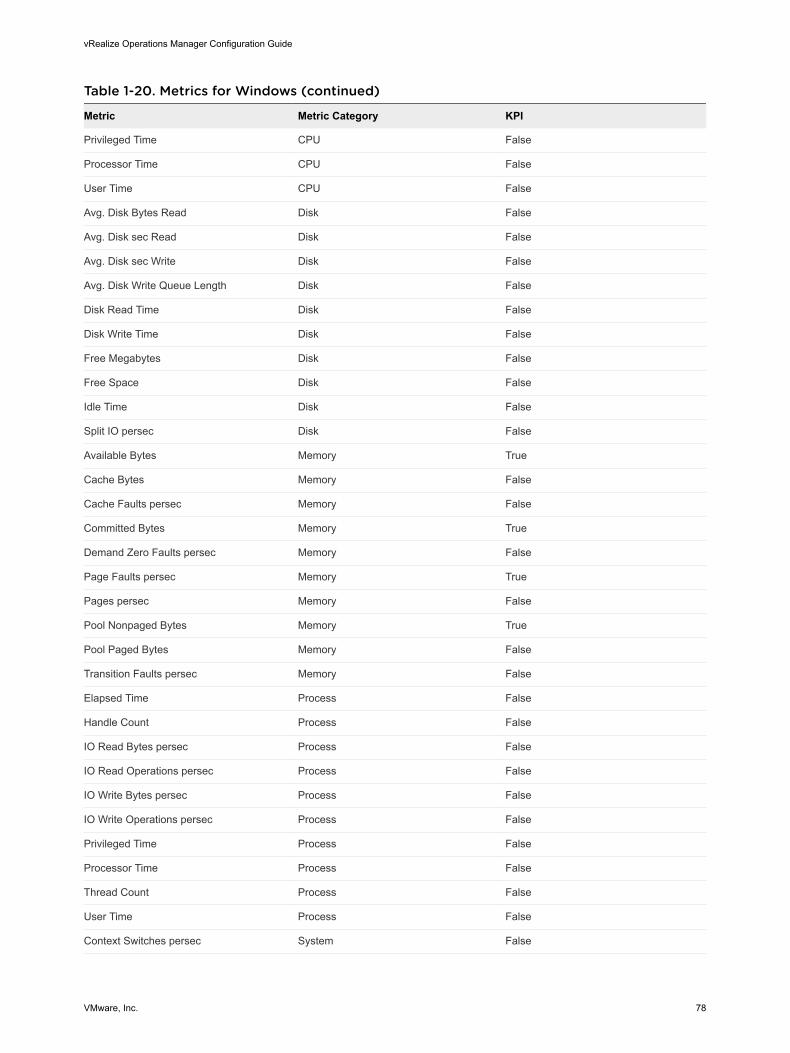
Table 1-20. Metrics for Windows (continued)
Metric Metric Category KPI
Privileged Time CPU False
Processor Time CPU False
User Time CPU False
Avg. Disk Bytes Read Disk False
Avg. Disk sec Read Disk False
Avg. Disk sec Write Disk False
Avg. Disk Write Queue Length Disk False
Disk Read Time Disk False
Disk Write Time Disk False
Free Megabytes Disk False
Free Space Disk False
Idle Time Disk False
Split IO persec Disk False
Available Bytes Memory True
Cache Bytes Memory False
Cache Faults persec Memory False
Committed Bytes Memory True
Demand Zero Faults persec Memory False
Page Faults persec Memory True
Pages persec Memory False
Pool Nonpaged Bytes Memory True
Pool Paged Bytes Memory False
Transition Faults persec Memory False
Elapsed Time Process False
Handle Count Process False
IO Read Bytes persec Process False
IO Read Operations persec Process False
IO Write Bytes persec Process False
IO Write Operations persec Process False
Privileged Time Process False
Processor Time Process False
Thread Count Process False
User Time Process False
Context Switches persec System False
vRealize Operations Manager Configuration Guide
VMware, Inc. 78
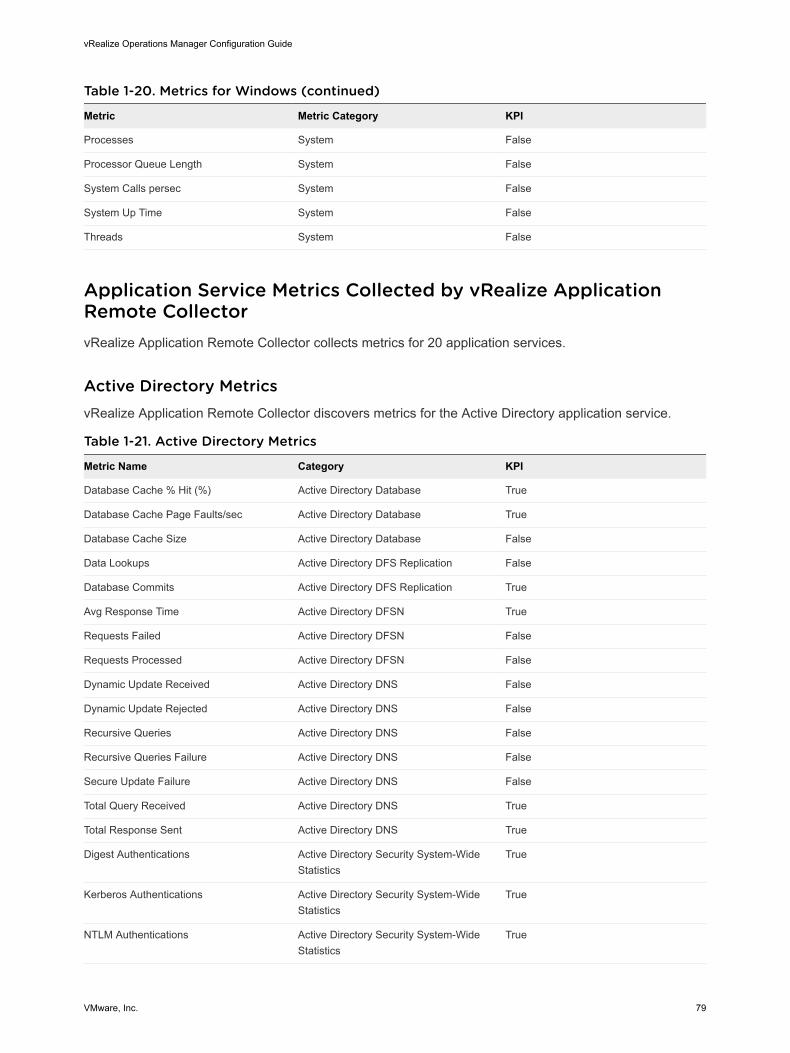
Table 1-20. Metrics for Windows (continued)
Metric Metric Category KPI
Processes System False
Processor Queue Length System False
System Calls persec System False
System Up Time System False
Threads System False
Application Service Metrics Collected by vRealize Application Remote CollectorvRealize Application Remote Collector collects metrics for 20 application services.
Active Directory MetricsvRealize Application Remote Collector discovers metrics for the Active Directory application service.
Table 1-21. Active Directory Metrics
Metric Name Category KPI
Database Cache % Hit (%) Active Directory Database True
Database Cache Page Faults/sec Active Directory Database True
Database Cache Size Active Directory Database False
Data Lookups Active Directory DFS Replication False
Database Commits Active Directory DFS Replication True
Avg Response Time Active Directory DFSN True
Requests Failed Active Directory DFSN False
Requests Processed Active Directory DFSN False
Dynamic Update Received Active Directory DNS False
Dynamic Update Rejected Active Directory DNS False
Recursive Queries Active Directory DNS False
Recursive Queries Failure Active Directory DNS False
Secure Update Failure Active Directory DNS False
Total Query Received Active Directory DNS True
Total Response Sent Active Directory DNS True
Digest Authentications Active Directory Security System-Wide Statistics
True
Kerberos Authentications Active Directory Security System-Wide Statistics
True
NTLM Authentications Active Directory Security System-Wide Statistics
True
vRealize Operations Manager Configuration Guide
VMware, Inc. 79
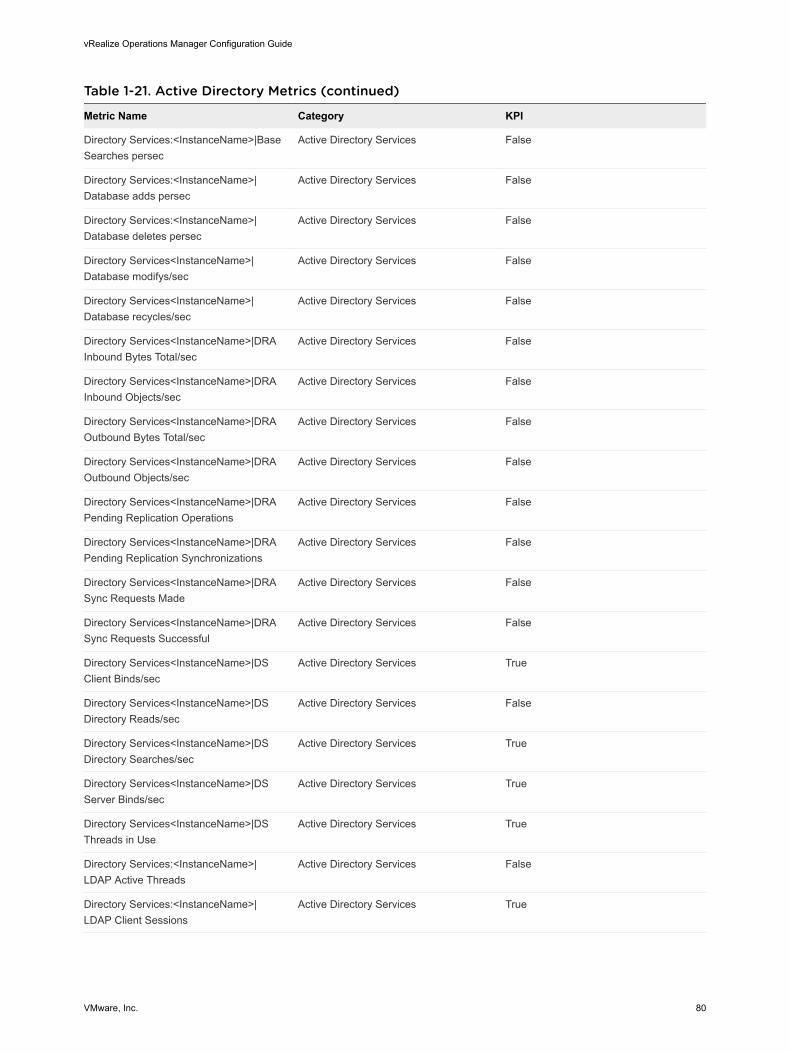
Table 1-21. Active Directory Metrics (continued)
Metric Name Category KPI
Directory Services:<InstanceName>|Base Searches persec
Active Directory Services False
Directory Services:<InstanceName>|Database adds persec
Active Directory Services False
Directory Services:<InstanceName>|Database deletes persec
Active Directory Services False
Directory Services<InstanceName>|Database modifys/sec
Active Directory Services False
Directory Services<InstanceName>|Database recycles/sec
Active Directory Services False
Directory Services<InstanceName>|DRA Inbound Bytes Total/sec
Active Directory Services False
Directory Services<InstanceName>|DRA Inbound Objects/sec
Active Directory Services False
Directory Services<InstanceName>|DRA Outbound Bytes Total/sec
Active Directory Services False
Directory Services<InstanceName>|DRA Outbound Objects/sec
Active Directory Services False
Directory Services<InstanceName>|DRA Pending Replication Operations
Active Directory Services False
Directory Services<InstanceName>|DRA Pending Replication Synchronizations
Active Directory Services False
Directory Services<InstanceName>|DRA Sync Requests Made
Active Directory Services False
Directory Services<InstanceName>|DRA Sync Requests Successful
Active Directory Services False
Directory Services<InstanceName>|DS Client Binds/sec
Active Directory Services True
Directory Services<InstanceName>|DS Directory Reads/sec
Active Directory Services False
Directory Services<InstanceName>|DS Directory Searches/sec
Active Directory Services True
Directory Services<InstanceName>|DS Server Binds/sec
Active Directory Services True
Directory Services<InstanceName>|DS Threads in Use
Active Directory Services True
Directory Services:<InstanceName>|LDAP Active Threads
Active Directory Services False
Directory Services:<InstanceName>|LDAP Client Sessions
Active Directory Services True
vRealize Operations Manager Configuration Guide
VMware, Inc. 80
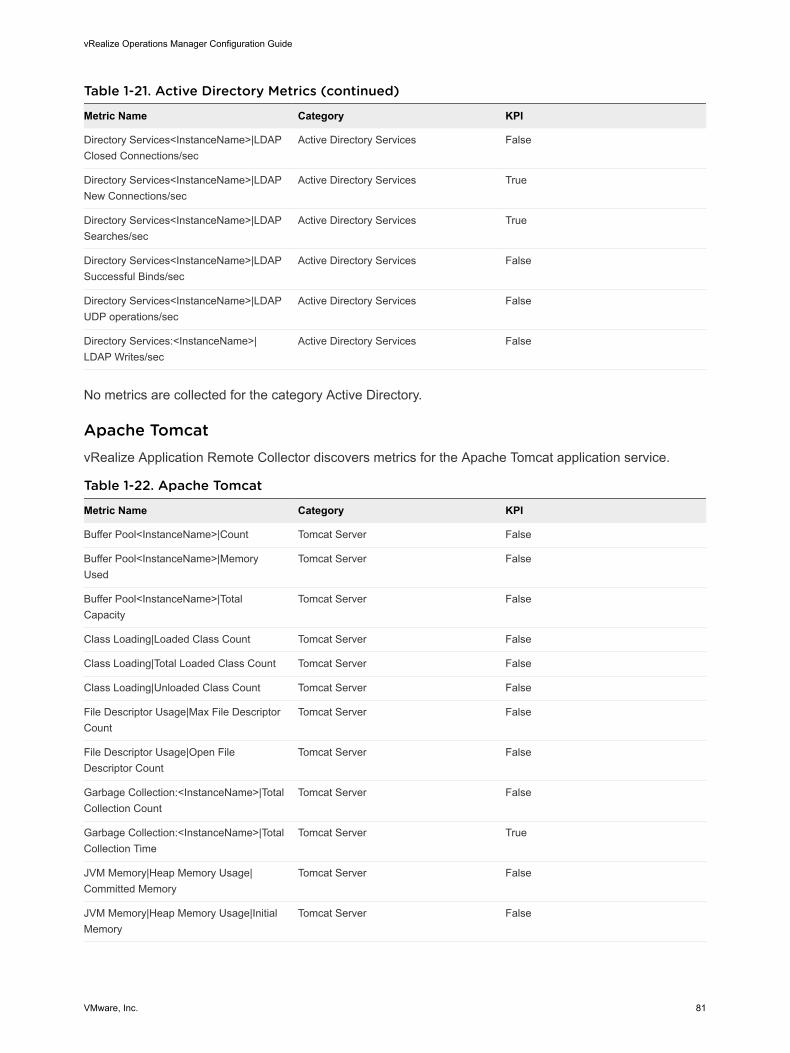
Table 1-21. Active Directory Metrics (continued)
Metric Name Category KPI
Directory Services<InstanceName>|LDAP Closed Connections/sec
Active Directory Services False
Directory Services<InstanceName>|LDAP New Connections/sec
Active Directory Services True
Directory Services<InstanceName>|LDAP Searches/sec
Active Directory Services True
Directory Services<InstanceName>|LDAP Successful Binds/sec
Active Directory Services False
Directory Services<InstanceName>|LDAP UDP operations/sec
Active Directory Services False
Directory Services:<InstanceName>|LDAP Writes/sec
Active Directory Services False
No metrics are collected for the category Active Directory.
Apache TomcatvRealize Application Remote Collector discovers metrics for the Apache Tomcat application service.
Table 1-22. Apache Tomcat
Metric Name Category KPI
Buffer Pool<InstanceName>|Count Tomcat Server False
Buffer Pool<InstanceName>|Memory Used
Tomcat Server False
Buffer Pool<InstanceName>|Total Capacity
Tomcat Server False
Class Loading|Loaded Class Count Tomcat Server False
Class Loading|Total Loaded Class Count Tomcat Server False
Class Loading|Unloaded Class Count Tomcat Server False
File Descriptor Usage|Max File Descriptor Count
Tomcat Server False
File Descriptor Usage|Open File Descriptor Count
Tomcat Server False
Garbage Collection:<InstanceName>|Total Collection Count
Tomcat Server False
Garbage Collection:<InstanceName>|Total Collection Time
Tomcat Server True
JVM Memory|Heap Memory Usage|Committed Memory
Tomcat Server False
JVM Memory|Heap Memory Usage|Initial Memory
Tomcat Server False
vRealize Operations Manager Configuration Guide
VMware, Inc. 81
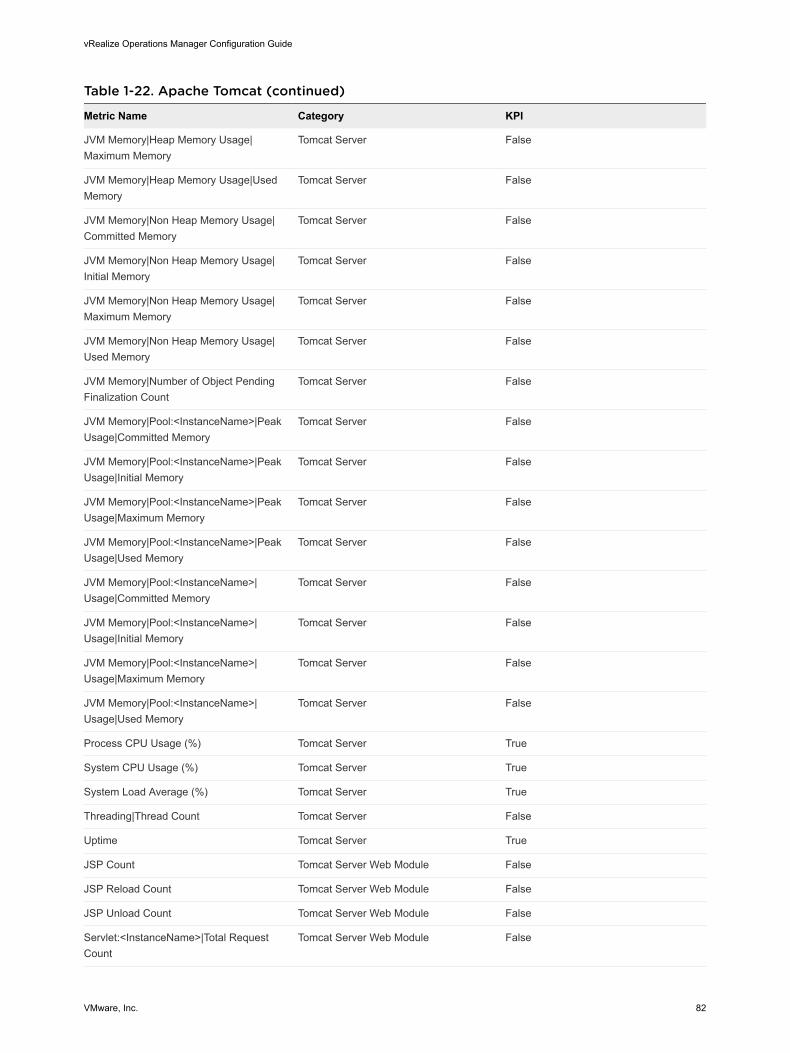
Table 1-22. Apache Tomcat (continued)
Metric Name Category KPI
JVM Memory|Heap Memory Usage|Maximum Memory
Tomcat Server False
JVM Memory|Heap Memory Usage|Used Memory
Tomcat Server False
JVM Memory|Non Heap Memory Usage|Committed Memory
Tomcat Server False
JVM Memory|Non Heap Memory Usage|Initial Memory
Tomcat Server False
JVM Memory|Non Heap Memory Usage|Maximum Memory
Tomcat Server False
JVM Memory|Non Heap Memory Usage|Used Memory
Tomcat Server False
JVM Memory|Number of Object Pending Finalization Count
Tomcat Server False
JVM Memory|Pool:<InstanceName>|Peak Usage|Committed Memory
Tomcat Server False
JVM Memory|Pool:<InstanceName>|Peak Usage|Initial Memory
Tomcat Server False
JVM Memory|Pool:<InstanceName>|Peak Usage|Maximum Memory
Tomcat Server False
JVM Memory|Pool:<InstanceName>|Peak Usage|Used Memory
Tomcat Server False
JVM Memory|Pool:<InstanceName>|Usage|Committed Memory
Tomcat Server False
JVM Memory|Pool:<InstanceName>|Usage|Initial Memory
Tomcat Server False
JVM Memory|Pool:<InstanceName>|Usage|Maximum Memory
Tomcat Server False
JVM Memory|Pool:<InstanceName>|Usage|Used Memory
Tomcat Server False
Process CPU Usage (%) Tomcat Server True
System CPU Usage (%) Tomcat Server True
System Load Average (%) Tomcat Server True
Threading|Thread Count Tomcat Server False
Uptime Tomcat Server True
JSP Count Tomcat Server Web Module False
JSP Reload Count Tomcat Server Web Module False
JSP Unload Count Tomcat Server Web Module False
Servlet:<InstanceName>|Total Request Count
Tomcat Server Web Module False
vRealize Operations Manager Configuration Guide
VMware, Inc. 82
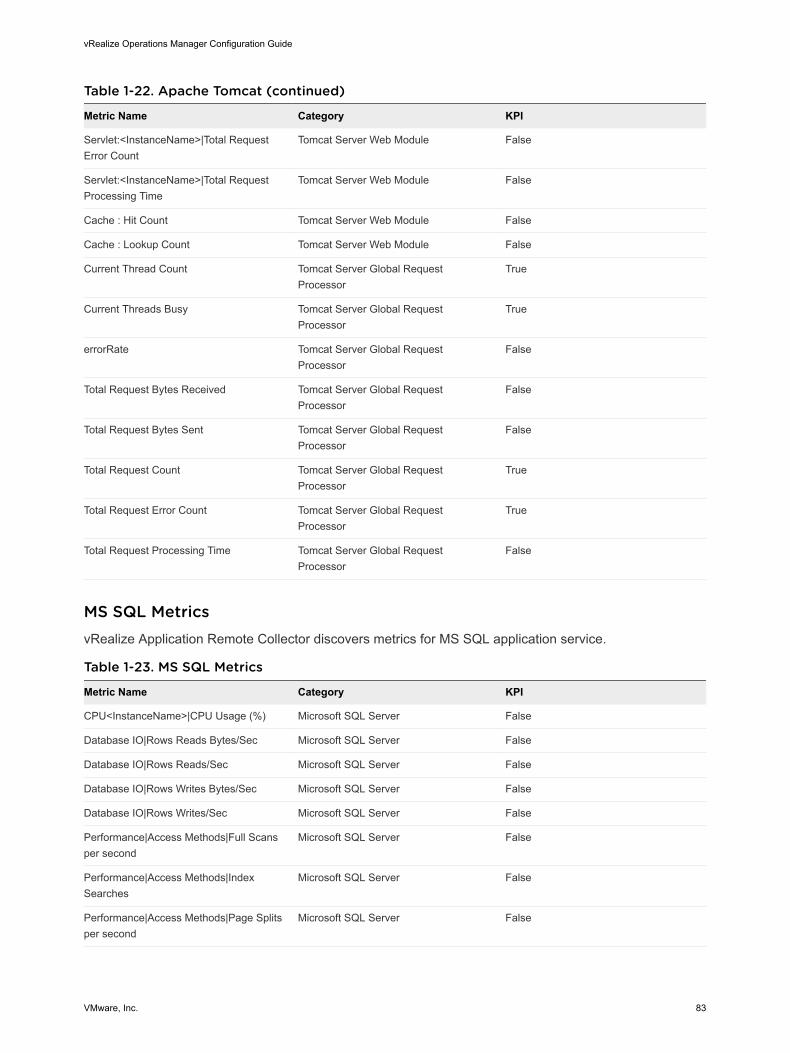
Table 1-22. Apache Tomcat (continued)
Metric Name Category KPI
Servlet:<InstanceName>|Total Request Error Count
Tomcat Server Web Module False
Servlet:<InstanceName>|Total Request Processing Time
Tomcat Server Web Module False
Cache : Hit Count Tomcat Server Web Module False
Cache : Lookup Count Tomcat Server Web Module False
Current Thread Count Tomcat Server Global Request Processor
True
Current Threads Busy Tomcat Server Global Request Processor
True
errorRate Tomcat Server Global Request Processor
False
Total Request Bytes Received Tomcat Server Global Request Processor
False
Total Request Bytes Sent Tomcat Server Global Request Processor
False
Total Request Count Tomcat Server Global Request Processor
True
Total Request Error Count Tomcat Server Global Request Processor
True
Total Request Processing Time Tomcat Server Global Request Processor
False
MS SQL MetricsvRealize Application Remote Collector discovers metrics for MS SQL application service.
Table 1-23. MS SQL Metrics
Metric Name Category KPI
CPU<InstanceName>|CPU Usage (%) Microsoft SQL Server False
Database IO|Rows Reads Bytes/Sec Microsoft SQL Server False
Database IO|Rows Reads/Sec Microsoft SQL Server False
Database IO|Rows Writes Bytes/Sec Microsoft SQL Server False
Database IO|Rows Writes/Sec Microsoft SQL Server False
Performance|Access Methods|Full Scans per second
Microsoft SQL Server False
Performance|Access Methods|Index Searches
Microsoft SQL Server False
Performance|Access Methods|Page Splits per second
Microsoft SQL Server False
vRealize Operations Manager Configuration Guide
VMware, Inc. 83
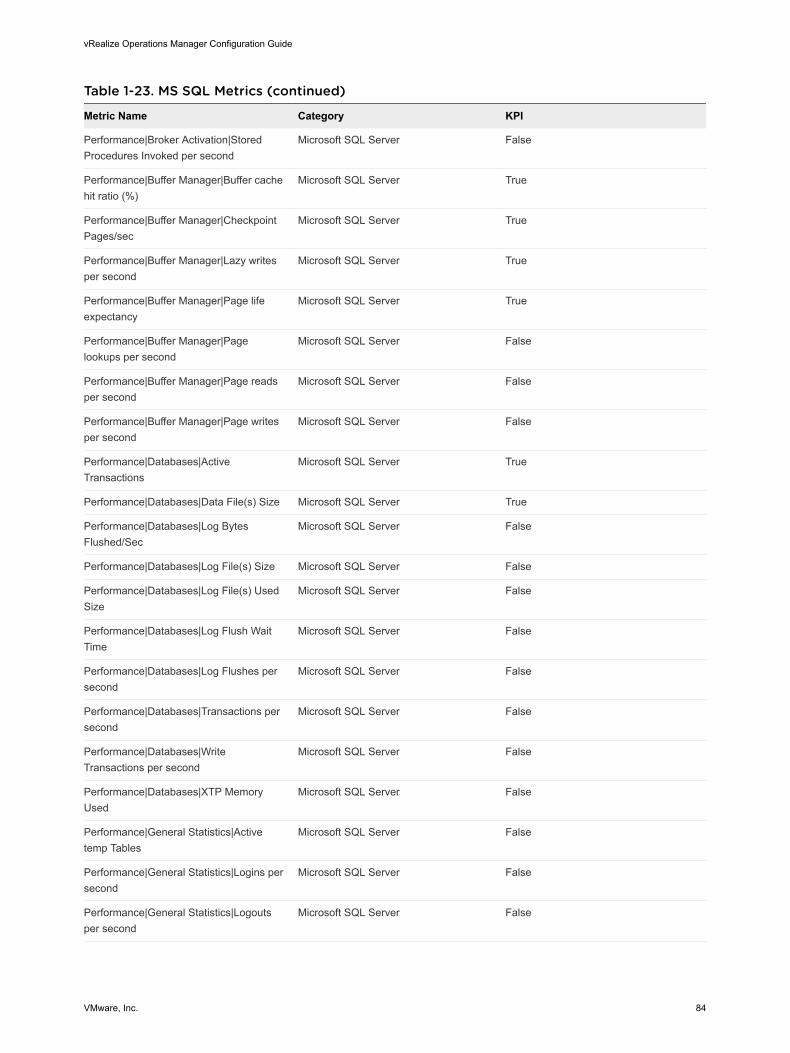
Table 1-23. MS SQL Metrics (continued)
Metric Name Category KPI
Performance|Broker Activation|Stored Procedures Invoked per second
Microsoft SQL Server False
Performance|Buffer Manager|Buffer cache hit ratio (%)
Microsoft SQL Server True
Performance|Buffer Manager|Checkpoint Pages/sec
Microsoft SQL Server True
Performance|Buffer Manager|Lazy writes per second
Microsoft SQL Server True
Performance|Buffer Manager|Page life expectancy
Microsoft SQL Server True
Performance|Buffer Manager|Page lookups per second
Microsoft SQL Server False
Performance|Buffer Manager|Page reads per second
Microsoft SQL Server False
Performance|Buffer Manager|Page writes per second
Microsoft SQL Server False
Performance|Databases|Active Transactions
Microsoft SQL Server True
Performance|Databases|Data File(s) Size Microsoft SQL Server True
Performance|Databases|Log Bytes Flushed/Sec
Microsoft SQL Server False
Performance|Databases|Log File(s) Size Microsoft SQL Server False
Performance|Databases|Log File(s) Used Size
Microsoft SQL Server False
Performance|Databases|Log Flush Wait Time
Microsoft SQL Server False
Performance|Databases|Log Flushes per second
Microsoft SQL Server False
Performance|Databases|Transactions per second
Microsoft SQL Server False
Performance|Databases|Write Transactions per second
Microsoft SQL Server False
Performance|Databases|XTP Memory Used
Microsoft SQL Server False
Performance|General Statistics|Active temp Tables
Microsoft SQL Server False
Performance|General Statistics|Logins per second
Microsoft SQL Server False
Performance|General Statistics|Logouts per second
Microsoft SQL Server False
vRealize Operations Manager Configuration Guide
VMware, Inc. 84
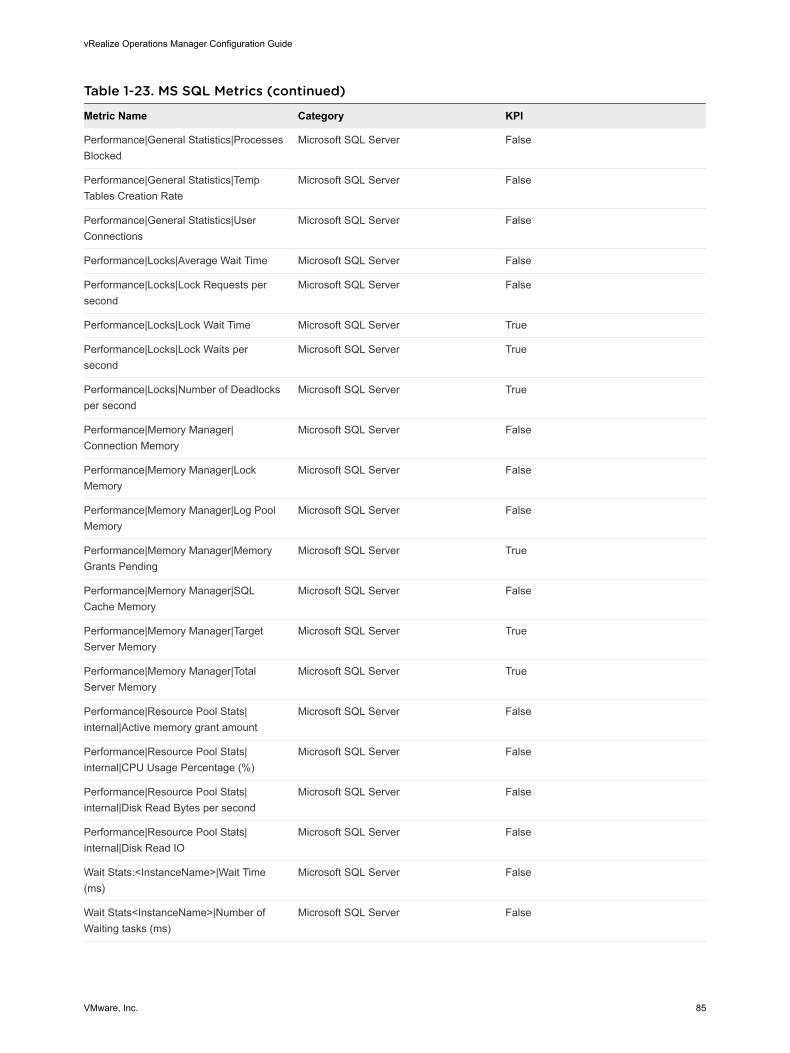
Table 1-23. MS SQL Metrics (continued)
Metric Name Category KPI
Performance|General Statistics|Processes Blocked
Microsoft SQL Server False
Performance|General Statistics|Temp Tables Creation Rate
Microsoft SQL Server False
Performance|General Statistics|User Connections
Microsoft SQL Server False
Performance|Locks|Average Wait Time Microsoft SQL Server False
Performance|Locks|Lock Requests per second
Microsoft SQL Server False
Performance|Locks|Lock Wait Time Microsoft SQL Server True
Performance|Locks|Lock Waits per second
Microsoft SQL Server True
Performance|Locks|Number of Deadlocks per second
Microsoft SQL Server True
Performance|Memory Manager|Connection Memory
Microsoft SQL Server False
Performance|Memory Manager|Lock Memory
Microsoft SQL Server False
Performance|Memory Manager|Log Pool Memory
Microsoft SQL Server False
Performance|Memory Manager|Memory Grants Pending
Microsoft SQL Server True
Performance|Memory Manager|SQL Cache Memory
Microsoft SQL Server False
Performance|Memory Manager|Target Server Memory
Microsoft SQL Server True
Performance|Memory Manager|Total Server Memory
Microsoft SQL Server True
Performance|Resource Pool Stats|internal|Active memory grant amount
Microsoft SQL Server False
Performance|Resource Pool Stats|internal|CPU Usage Percentage (%)
Microsoft SQL Server False
Performance|Resource Pool Stats|internal|Disk Read Bytes per second
Microsoft SQL Server False
Performance|Resource Pool Stats|internal|Disk Read IO
Microsoft SQL Server False
Wait Stats:<InstanceName>|Wait Time (ms)
Microsoft SQL Server False
Wait Stats<InstanceName>|Number of Waiting tasks (ms)
Microsoft SQL Server False
vRealize Operations Manager Configuration Guide
VMware, Inc. 85
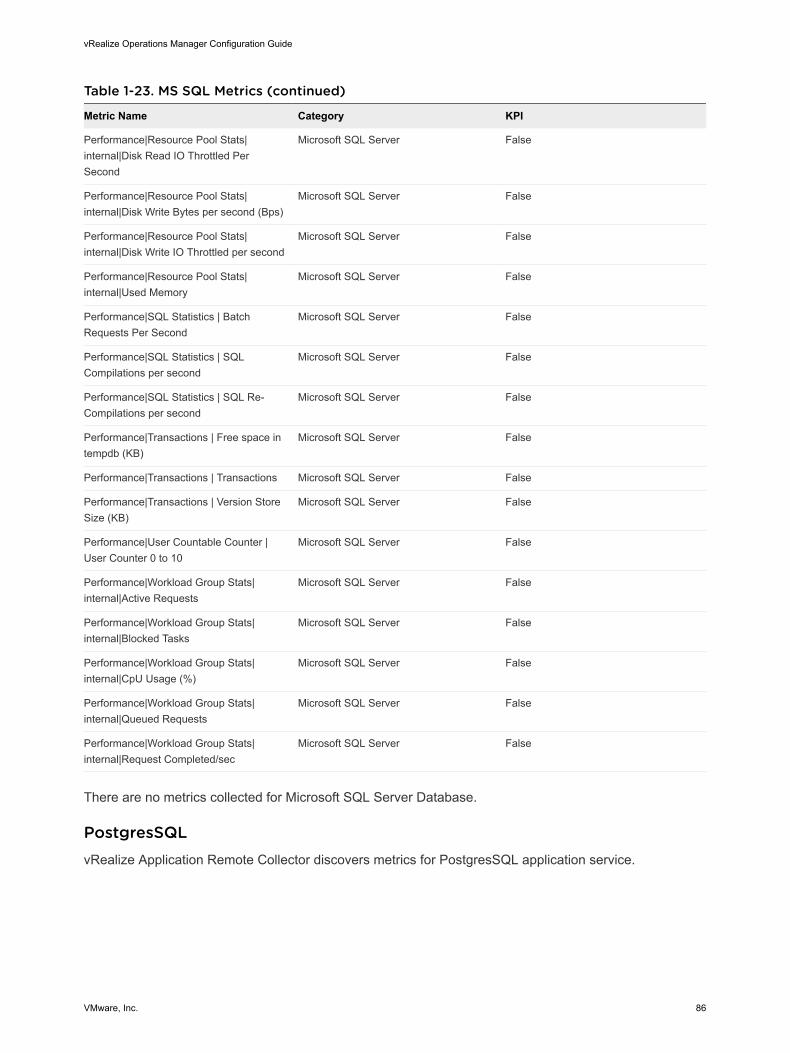
Table 1-23. MS SQL Metrics (continued)
Metric Name Category KPI
Performance|Resource Pool Stats|internal|Disk Read IO Throttled Per Second
Microsoft SQL Server False
Performance|Resource Pool Stats|internal|Disk Write Bytes per second (Bps)
Microsoft SQL Server False
Performance|Resource Pool Stats|internal|Disk Write IO Throttled per second
Microsoft SQL Server False
Performance|Resource Pool Stats|internal|Used Memory
Microsoft SQL Server False
Performance|SQL Statistics | Batch Requests Per Second
Microsoft SQL Server False
Performance|SQL Statistics | SQL Compilations per second
Microsoft SQL Server False
Performance|SQL Statistics | SQL Re-Compilations per second
Microsoft SQL Server False
Performance|Transactions | Free space in tempdb (KB)
Microsoft SQL Server False
Performance|Transactions | Transactions Microsoft SQL Server False
Performance|Transactions | Version Store Size (KB)
Microsoft SQL Server False
Performance|User Countable Counter | User Counter 0 to 10
Microsoft SQL Server False
Performance|Workload Group Stats|internal|Active Requests
Microsoft SQL Server False
Performance|Workload Group Stats|internal|Blocked Tasks
Microsoft SQL Server False
Performance|Workload Group Stats|internal|CpU Usage (%)
Microsoft SQL Server False
Performance|Workload Group Stats|internal|Queued Requests
Microsoft SQL Server False
Performance|Workload Group Stats|internal|Request Completed/sec
Microsoft SQL Server False
There are no metrics collected for Microsoft SQL Server Database.
PostgresSQLvRealize Application Remote Collector discovers metrics for PostgresSQL application service.
vRealize Operations Manager Configuration Guide
VMware, Inc. 86
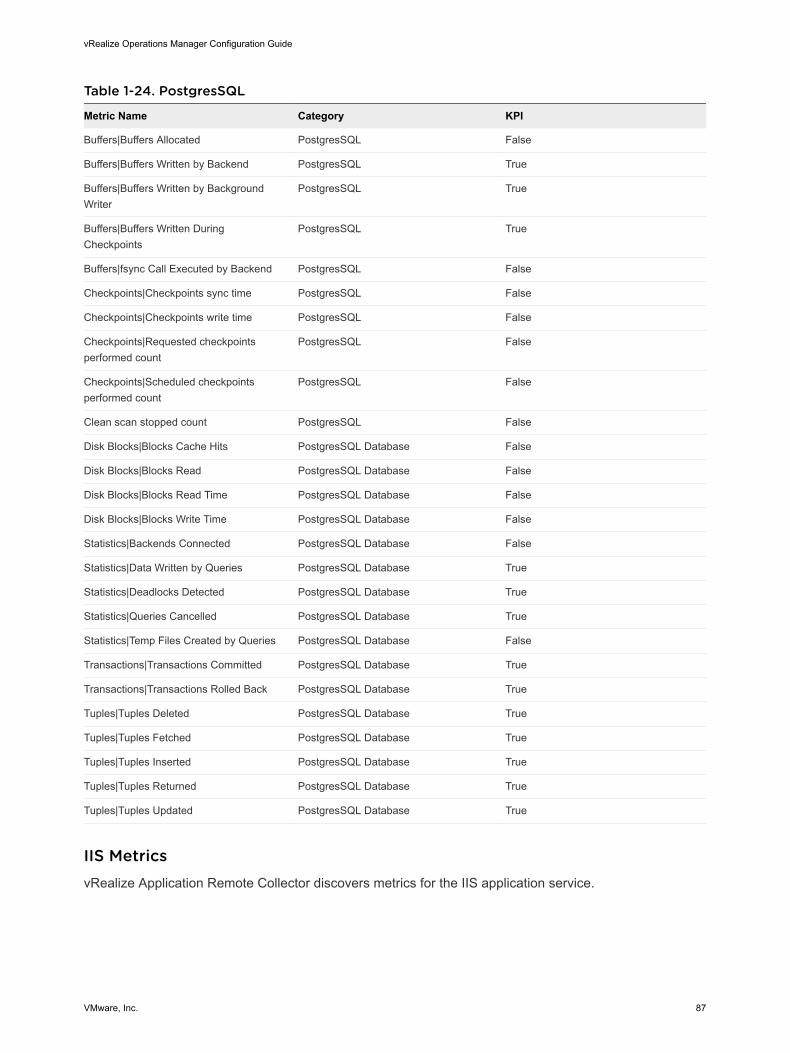
Table 1-24. PostgresSQL
Metric Name Category KPI
Buffers|Buffers Allocated PostgresSQL False
Buffers|Buffers Written by Backend PostgresSQL True
Buffers|Buffers Written by Background Writer
PostgresSQL True
Buffers|Buffers Written During Checkpoints
PostgresSQL True
Buffers|fsync Call Executed by Backend PostgresSQL False
Checkpoints|Checkpoints sync time PostgresSQL False
Checkpoints|Checkpoints write time PostgresSQL False
Checkpoints|Requested checkpoints performed count
PostgresSQL False
Checkpoints|Scheduled checkpoints performed count
PostgresSQL False
Clean scan stopped count PostgresSQL False
Disk Blocks|Blocks Cache Hits PostgresSQL Database False
Disk Blocks|Blocks Read PostgresSQL Database False
Disk Blocks|Blocks Read Time PostgresSQL Database False
Disk Blocks|Blocks Write Time PostgresSQL Database False
Statistics|Backends Connected PostgresSQL Database False
Statistics|Data Written by Queries PostgresSQL Database True
Statistics|Deadlocks Detected PostgresSQL Database True
Statistics|Queries Cancelled PostgresSQL Database True
Statistics|Temp Files Created by Queries PostgresSQL Database False
Transactions|Transactions Committed PostgresSQL Database True
Transactions|Transactions Rolled Back PostgresSQL Database True
Tuples|Tuples Deleted PostgresSQL Database True
Tuples|Tuples Fetched PostgresSQL Database True
Tuples|Tuples Inserted PostgresSQL Database True
Tuples|Tuples Returned PostgresSQL Database True
Tuples|Tuples Updated PostgresSQL Database True
IIS MetricsvRealize Application Remote Collector discovers metrics for the IIS application service.
vRealize Operations Manager Configuration Guide
VMware, Inc. 87

Table 1-25. IIS Metrics
Metric Name Category KPI
HTTP Service Request Queues<InstanceName>AppPool|CurrentQueueSize
IIS HTTP Service Request Queues True
HTTP Service Request Queues<InstanceName>AppPool|RejectedRequests
IIS HTTP Service Request Queues False
Web Services<InstanceName> Web Site|Bytes Received
IIS Web Services False
Web Services<InstanceName> Web Site|Bytes Sent/sec
IIS Web Services False
Web Services<InstanceName> Web Site|Bytes Total/sec
IIS Web Services False
Web Services<InstanceName> Web Site|Connection Attempts/sec
IIS Web Services False
Web Services<InstanceName> Web Site|Current Connections
IIS Web Services False
Web Services<InstanceName> Web Site|Get Requests/sec
IIS Web Services False
Web Services<InstanceName> Web Site|Locked Errors/sec
IIS Web Services False
Web Services<InstanceName> Web Site|Not Found Errors/sec
IIS Web Services False
Web Services<InstanceName> Web Site|Post Requests/sec
IIS Web Services False
Web Services<InstanceName> Web Site|Service Uptime
IIS Web Services False
Web Services<InstanceName> Web Site|Total Bytes Sent
IIS Web Services False
Web Services<InstanceName> Web Site|Total Get Requests
IIS Web Services True
Web Services<InstanceName> Web Site|Total Post Requests
IIS Web Services True
Web Services<InstanceName> Web Site|Total Put Requests
IIS Web Services False
Current File Cache Memory Usage (bytes) IIS Web Services Cache False
File Cache Hits Percent (%) IIS Web Services Cache False
Kernel URI Cache Hits Percent (%) IIS Web Services Cache False
Kernel URI Cache Misses IIS Web Services Cache False
Total Flushed URIs IIS Web Services Cache False
URI Cache Hits IIS Web Services Cache False
vRealize Operations Manager Configuration Guide
VMware, Inc. 88
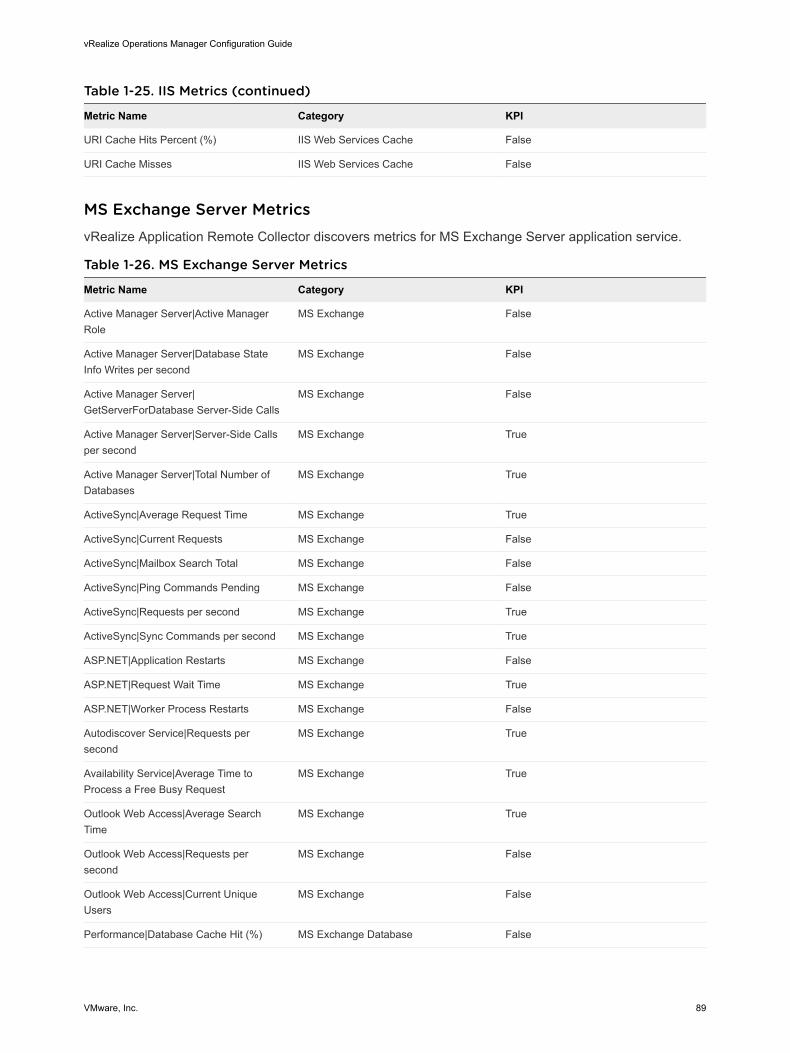
Table 1-25. IIS Metrics (continued)
Metric Name Category KPI
URI Cache Hits Percent (%) IIS Web Services Cache False
URI Cache Misses IIS Web Services Cache False
MS Exchange Server MetricsvRealize Application Remote Collector discovers metrics for MS Exchange Server application service.
Table 1-26. MS Exchange Server Metrics
Metric Name Category KPI
Active Manager Server|Active Manager Role
MS Exchange False
Active Manager Server|Database State Info Writes per second
MS Exchange False
Active Manager Server|GetServerForDatabase Server-Side Calls
MS Exchange False
Active Manager Server|Server-Side Calls per second
MS Exchange True
Active Manager Server|Total Number of Databases
MS Exchange True
ActiveSync|Average Request Time MS Exchange True
ActiveSync|Current Requests MS Exchange False
ActiveSync|Mailbox Search Total MS Exchange False
ActiveSync|Ping Commands Pending MS Exchange False
ActiveSync|Requests per second MS Exchange True
ActiveSync|Sync Commands per second MS Exchange True
ASP.NET|Application Restarts MS Exchange False
ASP.NET|Request Wait Time MS Exchange True
ASP.NET|Worker Process Restarts MS Exchange False
Autodiscover Service|Requests per second
MS Exchange True
Availability Service|Average Time to Process a Free Busy Request
MS Exchange True
Outlook Web Access|Average Search Time
MS Exchange True
Outlook Web Access|Requests per second
MS Exchange False
Outlook Web Access|Current Unique Users
MS Exchange False
Performance|Database Cache Hit (%) MS Exchange Database False
vRealize Operations Manager Configuration Guide
VMware, Inc. 89
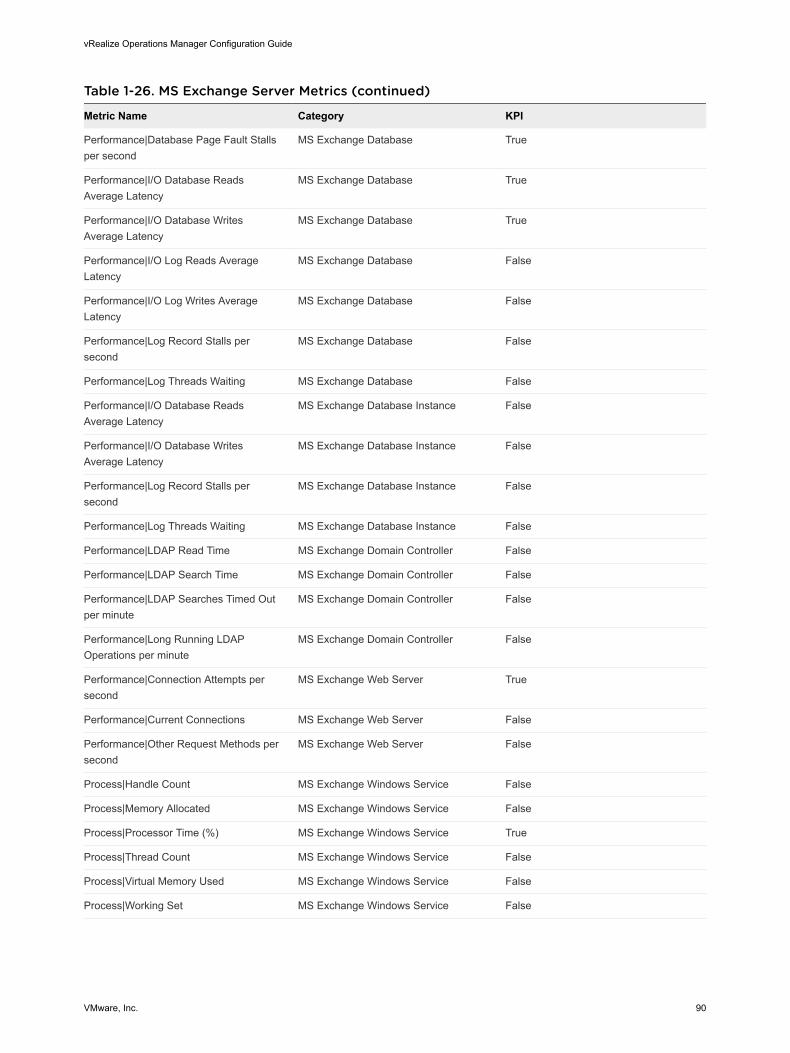
Table 1-26. MS Exchange Server Metrics (continued)
Metric Name Category KPI
Performance|Database Page Fault Stalls per second
MS Exchange Database True
Performance|I/O Database Reads Average Latency
MS Exchange Database True
Performance|I/O Database Writes Average Latency
MS Exchange Database True
Performance|I/O Log Reads Average Latency
MS Exchange Database False
Performance|I/O Log Writes Average Latency
MS Exchange Database False
Performance|Log Record Stalls per second
MS Exchange Database False
Performance|Log Threads Waiting MS Exchange Database False
Performance|I/O Database Reads Average Latency
MS Exchange Database Instance False
Performance|I/O Database Writes Average Latency
MS Exchange Database Instance False
Performance|Log Record Stalls per second
MS Exchange Database Instance False
Performance|Log Threads Waiting MS Exchange Database Instance False
Performance|LDAP Read Time MS Exchange Domain Controller False
Performance|LDAP Search Time MS Exchange Domain Controller False
Performance|LDAP Searches Timed Out per minute
MS Exchange Domain Controller False
Performance|Long Running LDAP Operations per minute
MS Exchange Domain Controller False
Performance|Connection Attempts per second
MS Exchange Web Server True
Performance|Current Connections MS Exchange Web Server False
Performance|Other Request Methods per second
MS Exchange Web Server False
Process|Handle Count MS Exchange Windows Service False
Process|Memory Allocated MS Exchange Windows Service False
Process|Processor Time (%) MS Exchange Windows Service True
Process|Thread Count MS Exchange Windows Service False
Process|Virtual Memory Used MS Exchange Windows Service False
Process|Working Set MS Exchange Windows Service False
vRealize Operations Manager Configuration Guide
VMware, Inc. 90
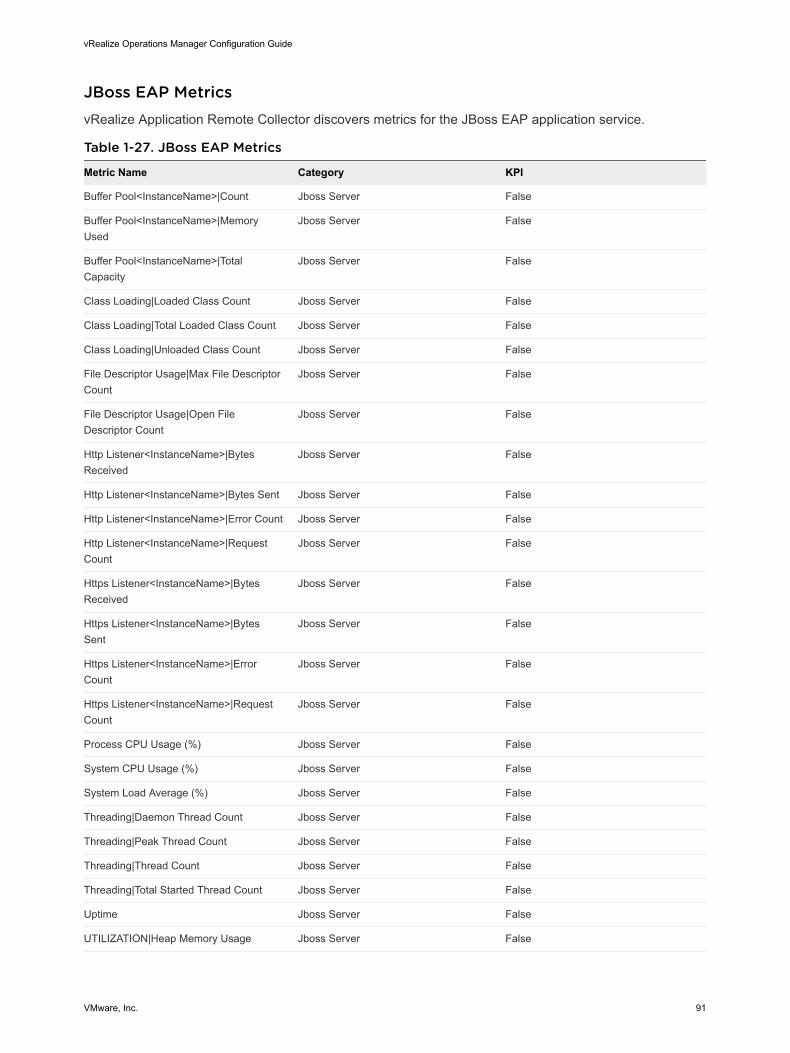
JBoss EAP MetricsvRealize Application Remote Collector discovers metrics for the JBoss EAP application service.
Table 1-27. JBoss EAP Metrics
Metric Name Category KPI
Buffer Pool<InstanceName>|Count Jboss Server False
Buffer Pool<InstanceName>|Memory Used
Jboss Server False
Buffer Pool<InstanceName>|Total Capacity
Jboss Server False
Class Loading|Loaded Class Count Jboss Server False
Class Loading|Total Loaded Class Count Jboss Server False
Class Loading|Unloaded Class Count Jboss Server False
File Descriptor Usage|Max File Descriptor Count
Jboss Server False
File Descriptor Usage|Open File Descriptor Count
Jboss Server False
Http Listener<InstanceName>|Bytes Received
Jboss Server False
Http Listener<InstanceName>|Bytes Sent Jboss Server False
Http Listener<InstanceName>|Error Count Jboss Server False
Http Listener<InstanceName>|Request Count
Jboss Server False
Https Listener<InstanceName>|Bytes Received
Jboss Server False
Https Listener<InstanceName>|Bytes Sent
Jboss Server False
Https Listener<InstanceName>|Error Count
Jboss Server False
Https Listener<InstanceName>|Request Count
Jboss Server False
Process CPU Usage (%) Jboss Server False
System CPU Usage (%) Jboss Server False
System Load Average (%) Jboss Server False
Threading|Daemon Thread Count Jboss Server False
Threading|Peak Thread Count Jboss Server False
Threading|Thread Count Jboss Server False
Threading|Total Started Thread Count Jboss Server False
Uptime Jboss Server False
UTILIZATION|Heap Memory Usage Jboss Server False
vRealize Operations Manager Configuration Guide
VMware, Inc. 91
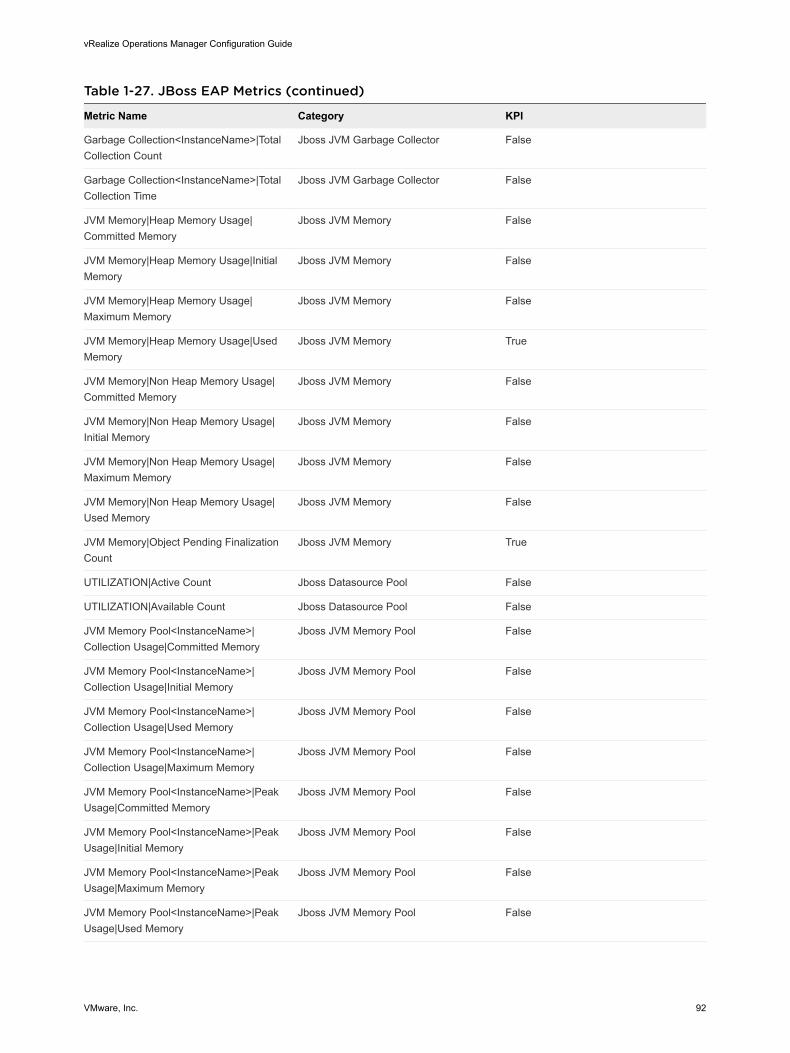
Table 1-27. JBoss EAP Metrics (continued)
Metric Name Category KPI
Garbage Collection<InstanceName>|Total Collection Count
Jboss JVM Garbage Collector False
Garbage Collection<InstanceName>|Total Collection Time
Jboss JVM Garbage Collector False
JVM Memory|Heap Memory Usage|Committed Memory
Jboss JVM Memory False
JVM Memory|Heap Memory Usage|Initial Memory
Jboss JVM Memory False
JVM Memory|Heap Memory Usage|Maximum Memory
Jboss JVM Memory False
JVM Memory|Heap Memory Usage|Used Memory
Jboss JVM Memory True
JVM Memory|Non Heap Memory Usage|Committed Memory
Jboss JVM Memory False
JVM Memory|Non Heap Memory Usage|Initial Memory
Jboss JVM Memory False
JVM Memory|Non Heap Memory Usage|Maximum Memory
Jboss JVM Memory False
JVM Memory|Non Heap Memory Usage|Used Memory
Jboss JVM Memory False
JVM Memory|Object Pending Finalization Count
Jboss JVM Memory True
UTILIZATION|Active Count Jboss Datasource Pool False
UTILIZATION|Available Count Jboss Datasource Pool False
JVM Memory Pool<InstanceName>|Collection Usage|Committed Memory
Jboss JVM Memory Pool False
JVM Memory Pool<InstanceName>|Collection Usage|Initial Memory
Jboss JVM Memory Pool False
JVM Memory Pool<InstanceName>|Collection Usage|Used Memory
Jboss JVM Memory Pool False
JVM Memory Pool<InstanceName>|Collection Usage|Maximum Memory
Jboss JVM Memory Pool False
JVM Memory Pool<InstanceName>|Peak Usage|Committed Memory
Jboss JVM Memory Pool False
JVM Memory Pool<InstanceName>|Peak Usage|Initial Memory
Jboss JVM Memory Pool False
JVM Memory Pool<InstanceName>|Peak Usage|Maximum Memory
Jboss JVM Memory Pool False
JVM Memory Pool<InstanceName>|Peak Usage|Used Memory
Jboss JVM Memory Pool False
vRealize Operations Manager Configuration Guide
VMware, Inc. 92
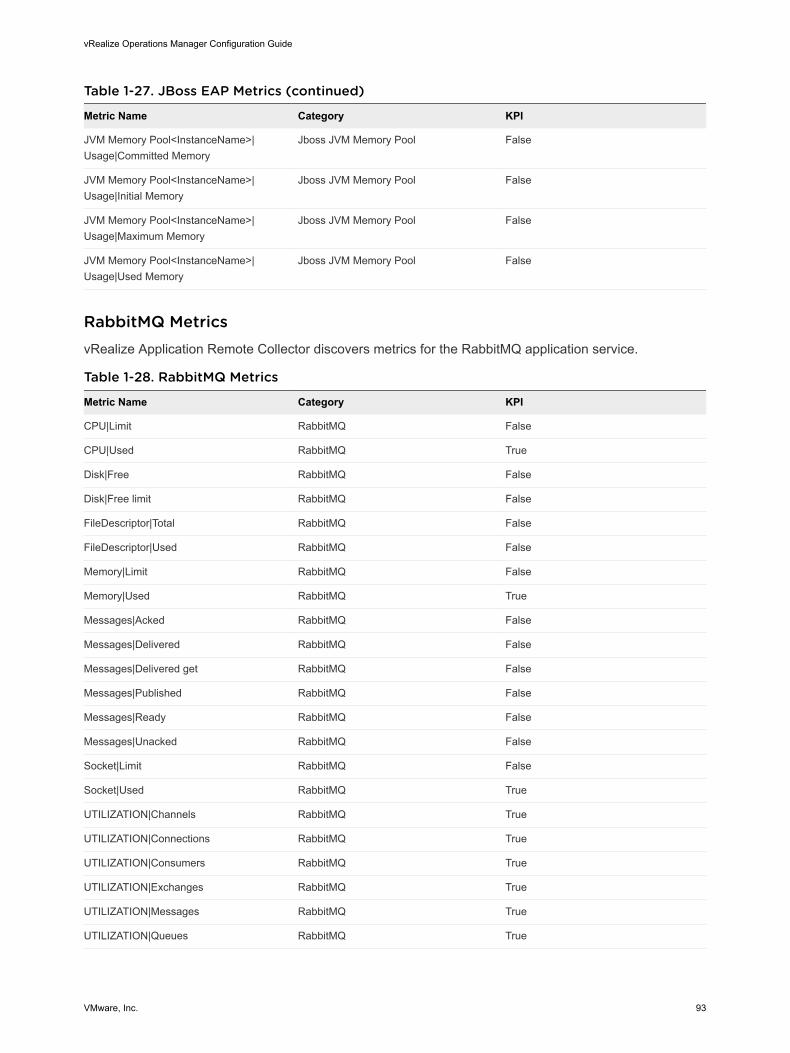
Table 1-27. JBoss EAP Metrics (continued)
Metric Name Category KPI
JVM Memory Pool<InstanceName>|Usage|Committed Memory
Jboss JVM Memory Pool False
JVM Memory Pool<InstanceName>|Usage|Initial Memory
Jboss JVM Memory Pool False
JVM Memory Pool<InstanceName>|Usage|Maximum Memory
Jboss JVM Memory Pool False
JVM Memory Pool<InstanceName>|Usage|Used Memory
Jboss JVM Memory Pool False
RabbitMQ MetricsvRealize Application Remote Collector discovers metrics for the RabbitMQ application service.
Table 1-28. RabbitMQ Metrics
Metric Name Category KPI
CPU|Limit RabbitMQ False
CPU|Used RabbitMQ True
Disk|Free RabbitMQ False
Disk|Free limit RabbitMQ False
FileDescriptor|Total RabbitMQ False
FileDescriptor|Used RabbitMQ False
Memory|Limit RabbitMQ False
Memory|Used RabbitMQ True
Messages|Acked RabbitMQ False
Messages|Delivered RabbitMQ False
Messages|Delivered get RabbitMQ False
Messages|Published RabbitMQ False
Messages|Ready RabbitMQ False
Messages|Unacked RabbitMQ False
Socket|Limit RabbitMQ False
Socket|Used RabbitMQ True
UTILIZATION|Channels RabbitMQ True
UTILIZATION|Connections RabbitMQ True
UTILIZATION|Consumers RabbitMQ True
UTILIZATION|Exchanges RabbitMQ True
UTILIZATION|Messages RabbitMQ True
UTILIZATION|Queues RabbitMQ True
vRealize Operations Manager Configuration Guide
VMware, Inc. 93
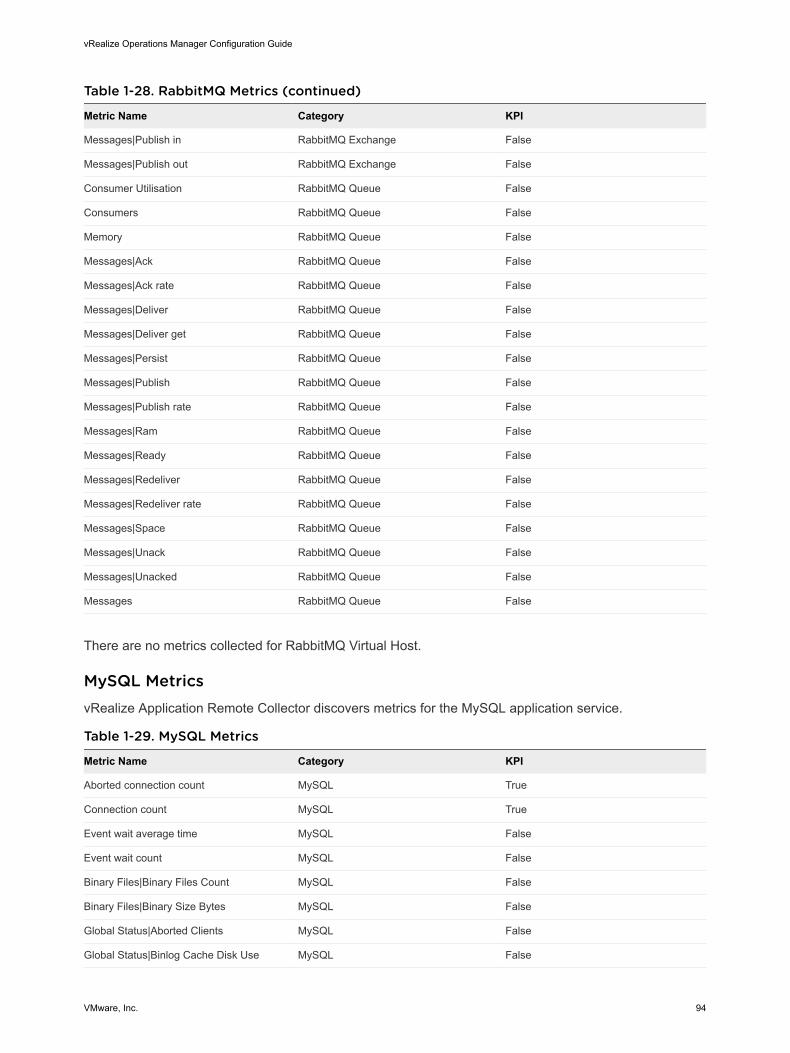
Table 1-28. RabbitMQ Metrics (continued)
Metric Name Category KPI
Messages|Publish in RabbitMQ Exchange False
Messages|Publish out RabbitMQ Exchange False
Consumer Utilisation RabbitMQ Queue False
Consumers RabbitMQ Queue False
Memory RabbitMQ Queue False
Messages|Ack RabbitMQ Queue False
Messages|Ack rate RabbitMQ Queue False
Messages|Deliver RabbitMQ Queue False
Messages|Deliver get RabbitMQ Queue False
Messages|Persist RabbitMQ Queue False
Messages|Publish RabbitMQ Queue False
Messages|Publish rate RabbitMQ Queue False
Messages|Ram RabbitMQ Queue False
Messages|Ready RabbitMQ Queue False
Messages|Redeliver RabbitMQ Queue False
Messages|Redeliver rate RabbitMQ Queue False
Messages|Space RabbitMQ Queue False
Messages|Unack RabbitMQ Queue False
Messages|Unacked RabbitMQ Queue False
Messages RabbitMQ Queue False
There are no metrics collected for RabbitMQ Virtual Host.
MySQL MetricsvRealize Application Remote Collector discovers metrics for the MySQL application service.
Table 1-29. MySQL Metrics
Metric Name Category KPI
Aborted connection count MySQL True
Connection count MySQL True
Event wait average time MySQL False
Event wait count MySQL False
Binary Files|Binary Files Count MySQL False
Binary Files|Binary Size Bytes MySQL False
Global Status|Aborted Clients MySQL False
Global Status|Binlog Cache Disk Use MySQL False
vRealize Operations Manager Configuration Guide
VMware, Inc. 94
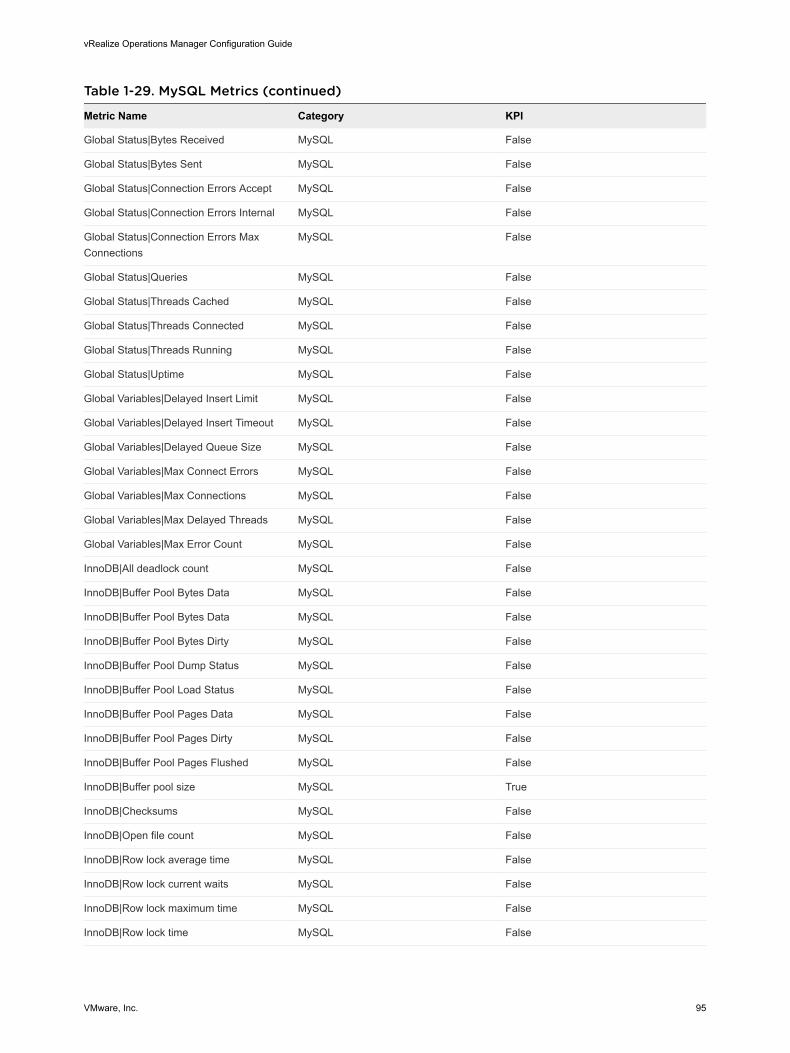
Table 1-29. MySQL Metrics (continued)
Metric Name Category KPI
Global Status|Bytes Received MySQL False
Global Status|Bytes Sent MySQL False
Global Status|Connection Errors Accept MySQL False
Global Status|Connection Errors Internal MySQL False
Global Status|Connection Errors Max Connections
MySQL False
Global Status|Queries MySQL False
Global Status|Threads Cached MySQL False
Global Status|Threads Connected MySQL False
Global Status|Threads Running MySQL False
Global Status|Uptime MySQL False
Global Variables|Delayed Insert Limit MySQL False
Global Variables|Delayed Insert Timeout MySQL False
Global Variables|Delayed Queue Size MySQL False
Global Variables|Max Connect Errors MySQL False
Global Variables|Max Connections MySQL False
Global Variables|Max Delayed Threads MySQL False
Global Variables|Max Error Count MySQL False
InnoDB|All deadlock count MySQL False
InnoDB|Buffer Pool Bytes Data MySQL False
InnoDB|Buffer Pool Bytes Data MySQL False
InnoDB|Buffer Pool Bytes Dirty MySQL False
InnoDB|Buffer Pool Dump Status MySQL False
InnoDB|Buffer Pool Load Status MySQL False
InnoDB|Buffer Pool Pages Data MySQL False
InnoDB|Buffer Pool Pages Dirty MySQL False
InnoDB|Buffer Pool Pages Flushed MySQL False
InnoDB|Buffer pool size MySQL True
InnoDB|Checksums MySQL False
InnoDB|Open file count MySQL False
InnoDB|Row lock average time MySQL False
InnoDB|Row lock current waits MySQL False
InnoDB|Row lock maximum time MySQL False
InnoDB|Row lock time MySQL False
vRealize Operations Manager Configuration Guide
VMware, Inc. 95
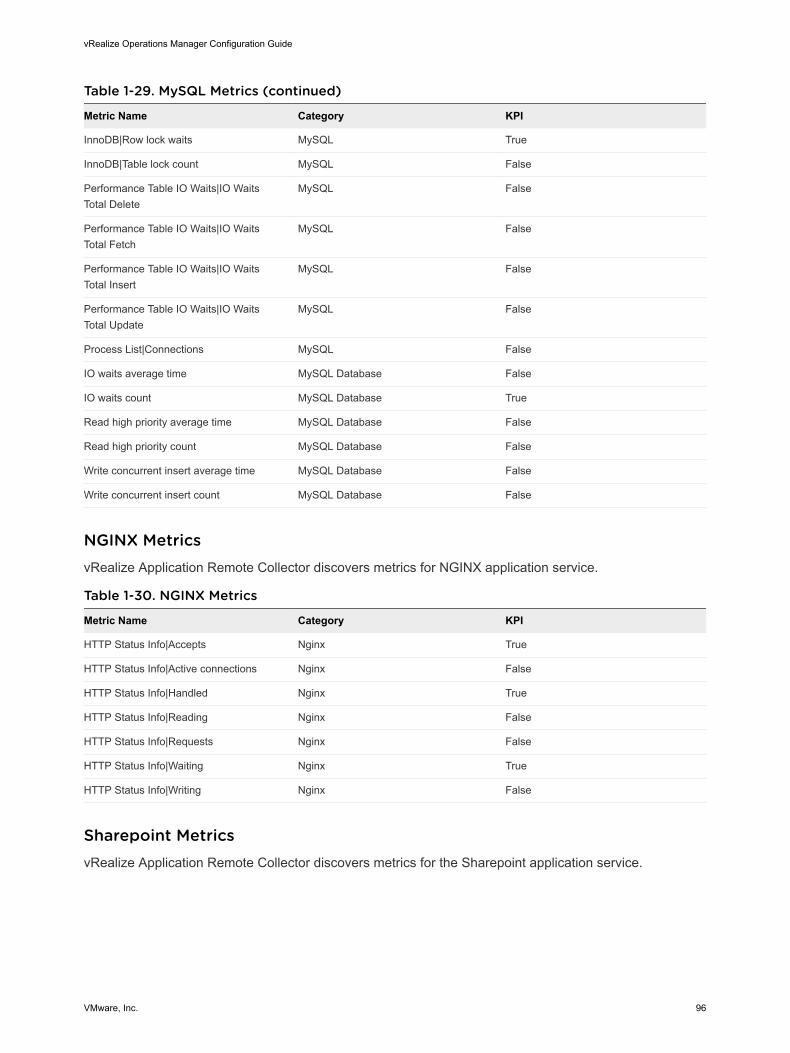
Table 1-29. MySQL Metrics (continued)
Metric Name Category KPI
InnoDB|Row lock waits MySQL True
InnoDB|Table lock count MySQL False
Performance Table IO Waits|IO Waits Total Delete
MySQL False
Performance Table IO Waits|IO Waits Total Fetch
MySQL False
Performance Table IO Waits|IO Waits Total Insert
MySQL False
Performance Table IO Waits|IO Waits Total Update
MySQL False
Process List|Connections MySQL False
IO waits average time MySQL Database False
IO waits count MySQL Database True
Read high priority average time MySQL Database False
Read high priority count MySQL Database False
Write concurrent insert average time MySQL Database False
Write concurrent insert count MySQL Database False
NGINX MetricsvRealize Application Remote Collector discovers metrics for NGINX application service.
Table 1-30. NGINX Metrics
Metric Name Category KPI
HTTP Status Info|Accepts Nginx True
HTTP Status Info|Active connections Nginx False
HTTP Status Info|Handled Nginx True
HTTP Status Info|Reading Nginx False
HTTP Status Info|Requests Nginx False
HTTP Status Info|Waiting Nginx True
HTTP Status Info|Writing Nginx False
Sharepoint MetricsvRealize Application Remote Collector discovers metrics for the Sharepoint application service.
vRealize Operations Manager Configuration Guide
VMware, Inc. 96
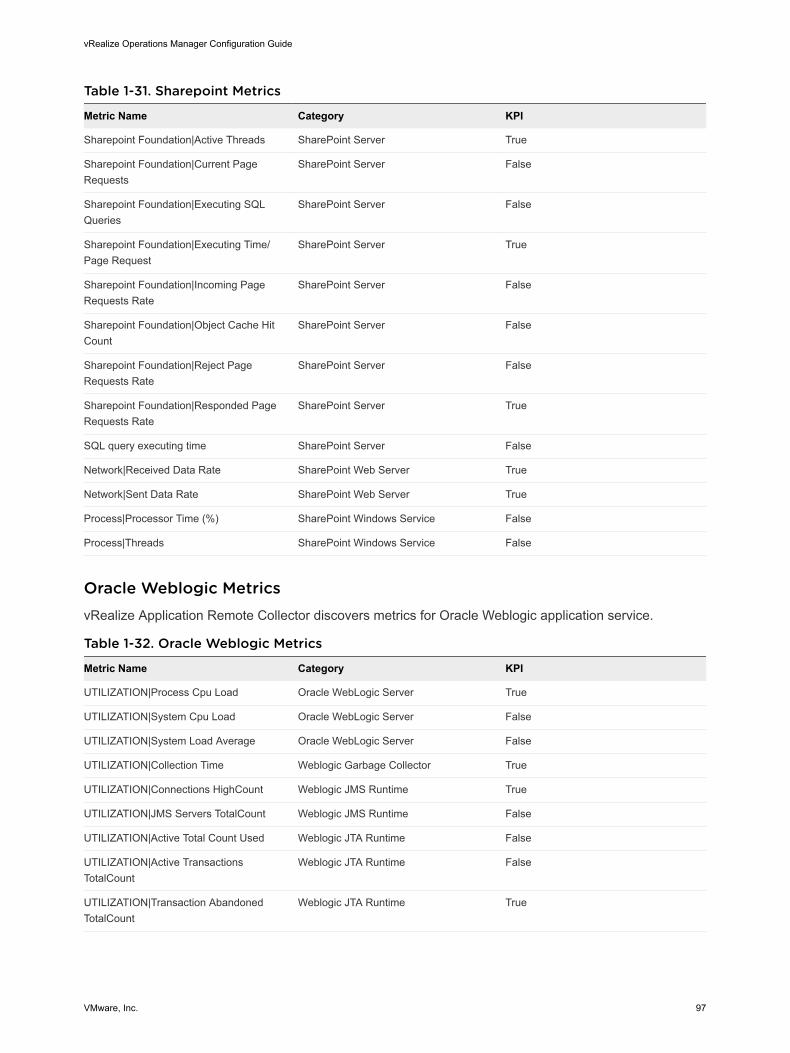
Table 1-31. Sharepoint Metrics
Metric Name Category KPI
Sharepoint Foundation|Active Threads SharePoint Server True
Sharepoint Foundation|Current Page Requests
SharePoint Server False
Sharepoint Foundation|Executing SQL Queries
SharePoint Server False
Sharepoint Foundation|Executing Time/Page Request
SharePoint Server True
Sharepoint Foundation|Incoming Page Requests Rate
SharePoint Server False
Sharepoint Foundation|Object Cache Hit Count
SharePoint Server False
Sharepoint Foundation|Reject Page Requests Rate
SharePoint Server False
Sharepoint Foundation|Responded Page Requests Rate
SharePoint Server True
SQL query executing time SharePoint Server False
Network|Received Data Rate SharePoint Web Server True
Network|Sent Data Rate SharePoint Web Server True
Process|Processor Time (%) SharePoint Windows Service False
Process|Threads SharePoint Windows Service False
Oracle Weblogic MetricsvRealize Application Remote Collector discovers metrics for Oracle Weblogic application service.
Table 1-32. Oracle Weblogic Metrics
Metric Name Category KPI
UTILIZATION|Process Cpu Load Oracle WebLogic Server True
UTILIZATION|System Cpu Load Oracle WebLogic Server False
UTILIZATION|System Load Average Oracle WebLogic Server False
UTILIZATION|Collection Time Weblogic Garbage Collector True
UTILIZATION|Connections HighCount Weblogic JMS Runtime True
UTILIZATION|JMS Servers TotalCount Weblogic JMS Runtime False
UTILIZATION|Active Total Count Used Weblogic JTA Runtime False
UTILIZATION|Active Transactions TotalCount
Weblogic JTA Runtime False
UTILIZATION|Transaction Abandoned TotalCount
Weblogic JTA Runtime True
vRealize Operations Manager Configuration Guide
VMware, Inc. 97
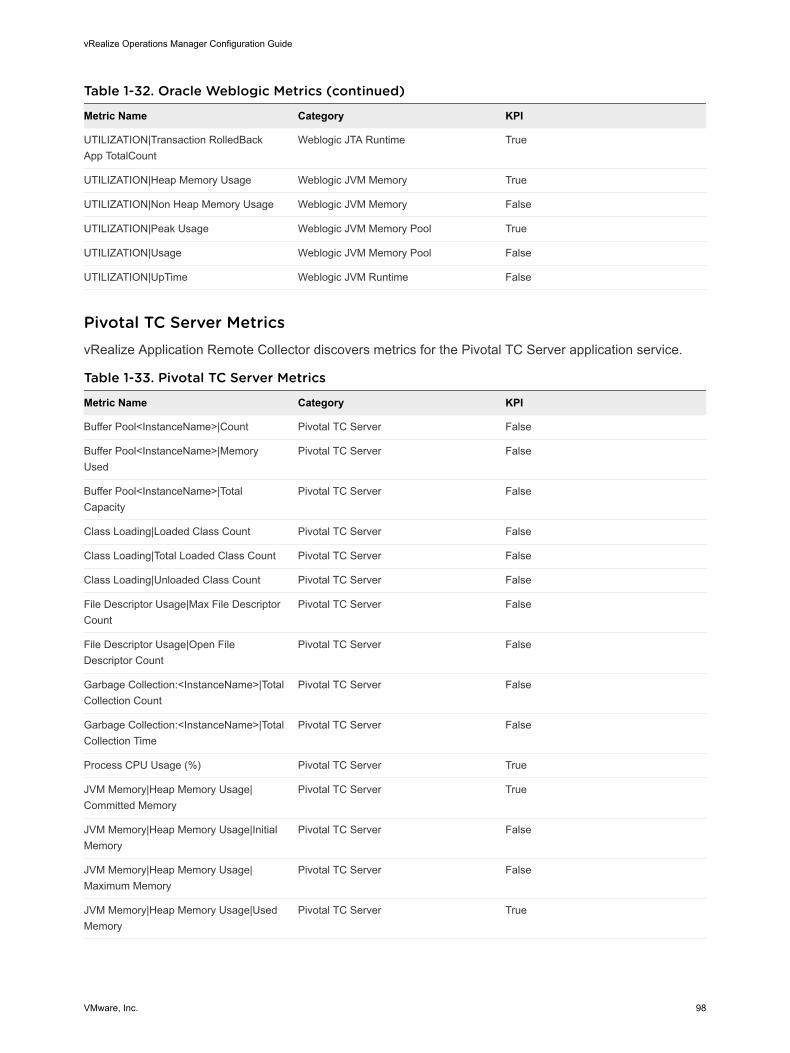
Table 1-32. Oracle Weblogic Metrics (continued)
Metric Name Category KPI
UTILIZATION|Transaction RolledBack App TotalCount
Weblogic JTA Runtime True
UTILIZATION|Heap Memory Usage Weblogic JVM Memory True
UTILIZATION|Non Heap Memory Usage Weblogic JVM Memory False
UTILIZATION|Peak Usage Weblogic JVM Memory Pool True
UTILIZATION|Usage Weblogic JVM Memory Pool False
UTILIZATION|UpTime Weblogic JVM Runtime False
Pivotal TC Server MetricsvRealize Application Remote Collector discovers metrics for the Pivotal TC Server application service.
Table 1-33. Pivotal TC Server Metrics
Metric Name Category KPI
Buffer Pool<InstanceName>|Count Pivotal TC Server False
Buffer Pool<InstanceName>|Memory Used
Pivotal TC Server False
Buffer Pool<InstanceName>|Total Capacity
Pivotal TC Server False
Class Loading|Loaded Class Count Pivotal TC Server False
Class Loading|Total Loaded Class Count Pivotal TC Server False
Class Loading|Unloaded Class Count Pivotal TC Server False
File Descriptor Usage|Max File Descriptor Count
Pivotal TC Server False
File Descriptor Usage|Open File Descriptor Count
Pivotal TC Server False
Garbage Collection:<InstanceName>|Total Collection Count
Pivotal TC Server False
Garbage Collection:<InstanceName>|Total Collection Time
Pivotal TC Server False
Process CPU Usage (%) Pivotal TC Server True
JVM Memory|Heap Memory Usage|Committed Memory
Pivotal TC Server True
JVM Memory|Heap Memory Usage|Initial Memory
Pivotal TC Server False
JVM Memory|Heap Memory Usage|Maximum Memory
Pivotal TC Server False
JVM Memory|Heap Memory Usage|Used Memory
Pivotal TC Server True
vRealize Operations Manager Configuration Guide
VMware, Inc. 98
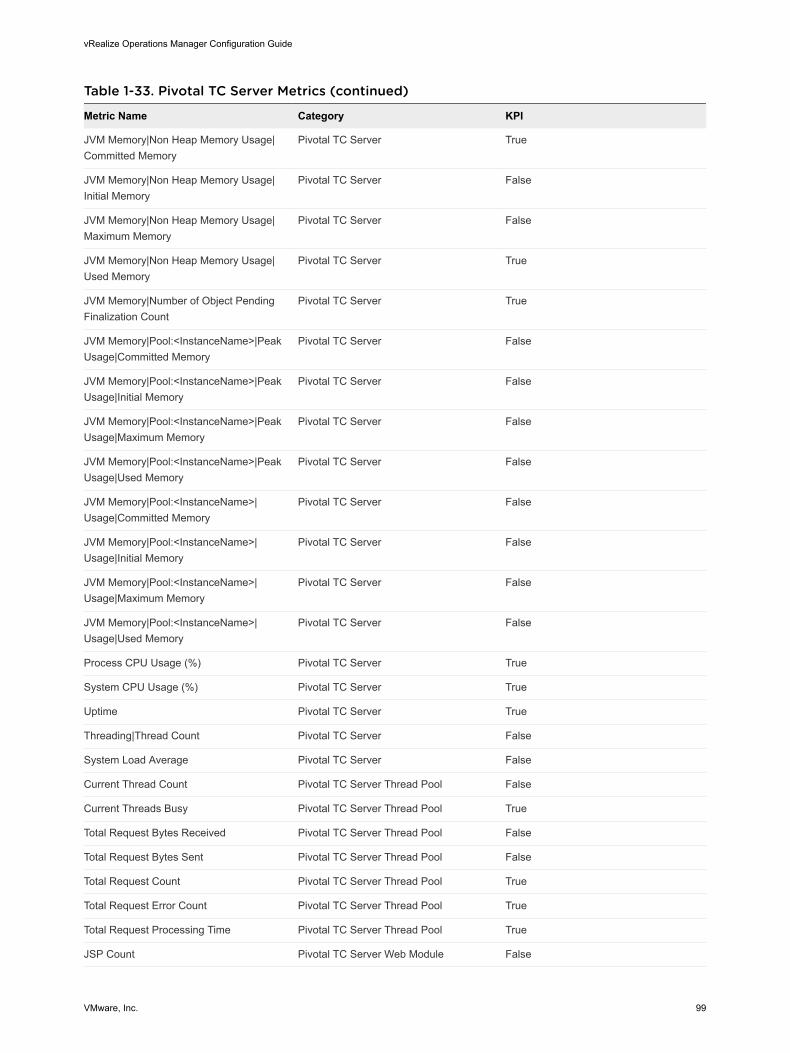
Table 1-33. Pivotal TC Server Metrics (continued)
Metric Name Category KPI
JVM Memory|Non Heap Memory Usage|Committed Memory
Pivotal TC Server True
JVM Memory|Non Heap Memory Usage|Initial Memory
Pivotal TC Server False
JVM Memory|Non Heap Memory Usage|Maximum Memory
Pivotal TC Server False
JVM Memory|Non Heap Memory Usage|Used Memory
Pivotal TC Server True
JVM Memory|Number of Object Pending Finalization Count
Pivotal TC Server True
JVM Memory|Pool:<InstanceName>|Peak Usage|Committed Memory
Pivotal TC Server False
JVM Memory|Pool:<InstanceName>|Peak Usage|Initial Memory
Pivotal TC Server False
JVM Memory|Pool:<InstanceName>|Peak Usage|Maximum Memory
Pivotal TC Server False
JVM Memory|Pool:<InstanceName>|Peak Usage|Used Memory
Pivotal TC Server False
JVM Memory|Pool:<InstanceName>|Usage|Committed Memory
Pivotal TC Server False
JVM Memory|Pool:<InstanceName>|Usage|Initial Memory
Pivotal TC Server False
JVM Memory|Pool:<InstanceName>|Usage|Maximum Memory
Pivotal TC Server False
JVM Memory|Pool:<InstanceName>|Usage|Used Memory
Pivotal TC Server False
Process CPU Usage (%) Pivotal TC Server True
System CPU Usage (%) Pivotal TC Server True
Uptime Pivotal TC Server True
Threading|Thread Count Pivotal TC Server False
System Load Average Pivotal TC Server False
Current Thread Count Pivotal TC Server Thread Pool False
Current Threads Busy Pivotal TC Server Thread Pool True
Total Request Bytes Received Pivotal TC Server Thread Pool False
Total Request Bytes Sent Pivotal TC Server Thread Pool False
Total Request Count Pivotal TC Server Thread Pool True
Total Request Error Count Pivotal TC Server Thread Pool True
Total Request Processing Time Pivotal TC Server Thread Pool True
JSP Count Pivotal TC Server Web Module False
vRealize Operations Manager Configuration Guide
VMware, Inc. 99
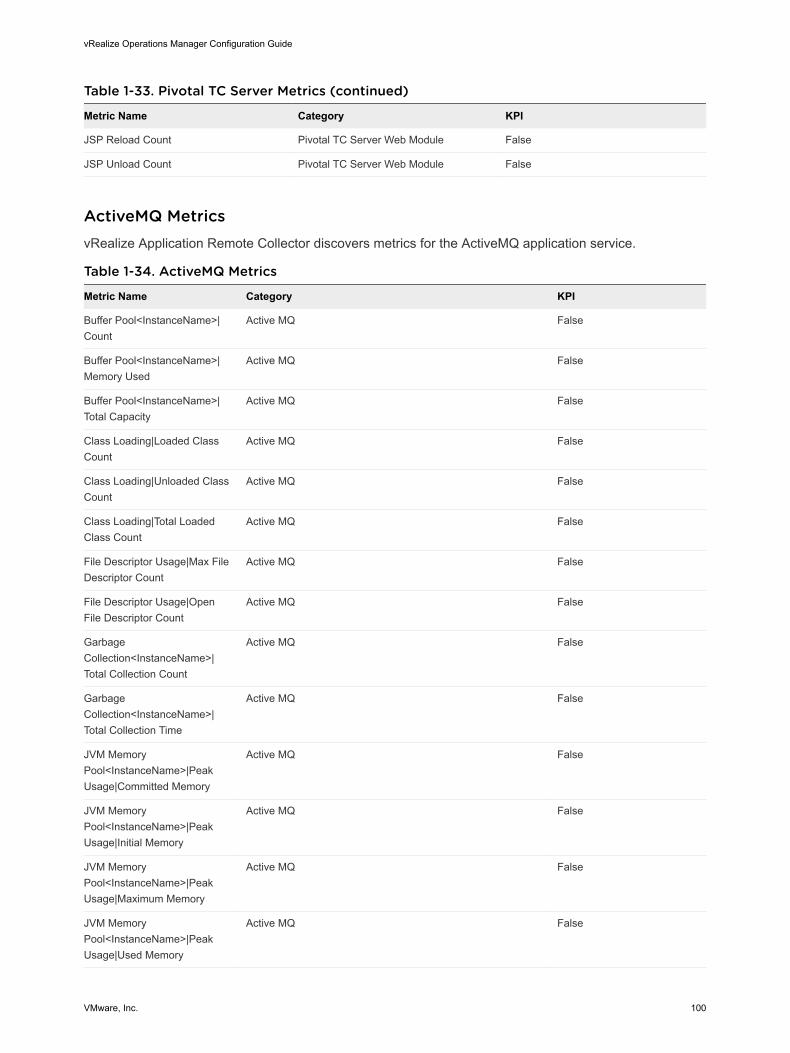
Table 1-33. Pivotal TC Server Metrics (continued)
Metric Name Category KPI
JSP Reload Count Pivotal TC Server Web Module False
JSP Unload Count Pivotal TC Server Web Module False
ActiveMQ MetricsvRealize Application Remote Collector discovers metrics for the ActiveMQ application service.
Table 1-34. ActiveMQ Metrics
Metric Name Category KPI
Buffer Pool<InstanceName>|Count
Active MQ False
Buffer Pool<InstanceName>|Memory Used
Active MQ False
Buffer Pool<InstanceName>|Total Capacity
Active MQ False
Class Loading|Loaded Class Count
Active MQ False
Class Loading|Unloaded Class Count
Active MQ False
Class Loading|Total Loaded Class Count
Active MQ False
File Descriptor Usage|Max File Descriptor Count
Active MQ False
File Descriptor Usage|Open File Descriptor Count
Active MQ False
Garbage Collection<InstanceName>|Total Collection Count
Active MQ False
Garbage Collection<InstanceName>|Total Collection Time
Active MQ False
JVM Memory Pool<InstanceName>|Peak Usage|Committed Memory
Active MQ False
JVM Memory Pool<InstanceName>|Peak Usage|Initial Memory
Active MQ False
JVM Memory Pool<InstanceName>|Peak Usage|Maximum Memory
Active MQ False
JVM Memory Pool<InstanceName>|Peak Usage|Used Memory
Active MQ False
vRealize Operations Manager Configuration Guide
VMware, Inc. 100

Table 1-34. ActiveMQ Metrics (continued)
Metric Name Category KPI
JVM Memory Pool<InstanceName>|Usage|Committed Memory
Active MQ False
JVM Memory Pool<InstanceName>|Usage|Initial Memory
Active MQ False
JVM Memory Pool<InstanceName>|Usage|Maximum Memory
Active MQ False
JVM Memory Pool<InstanceName>|Usage|Used Memory
Active MQ False
Threading|Thread Count Active MQ False
Uptime Active MQ False
UTILIZATION|Process CpuLoad
Active MQ False
UTILIZATION|Memory Limit ActiveMQ Broker True
UTILIZATION|Memory Percent Usage (%)
ActiveMQ Broker True
UTILIZATION|Store Limit ActiveMQ Broker False
UTILIZATION|Store Percent Usage (%)
ActiveMQ Broker False
UTILIZATION|Temp Limit ActiveMQ Broker False
UTILIZATION|Temp Percent Usage (%)
ActiveMQ Broker False
UTILIZATION|Total Consumer Count
ActiveMQ Broker True
UTILIZATION|Total Dequeue Count
ActiveMQ Broker True
UTILIZATION|Total Enqueue Count
ActiveMQ Broker True
UTILIZATION|Total Message Count
ActiveMQ Broker True
JVM Memory|Heap Memory Usage|Initial Memory
ActiveMQ JVM Memory Usage False
JVM Memory|Heap Memory Usage|Committed Memory
ActiveMQ JVM Memory Usage False
JVM Memory|Heap Memory Usage|Maximum Memory
ActiveMQ JVM Memory Usage False
JVM Memory|Heap Memory Usage|Used Memory
ActiveMQ JVM Memory Usage False
vRealize Operations Manager Configuration Guide
VMware, Inc. 101
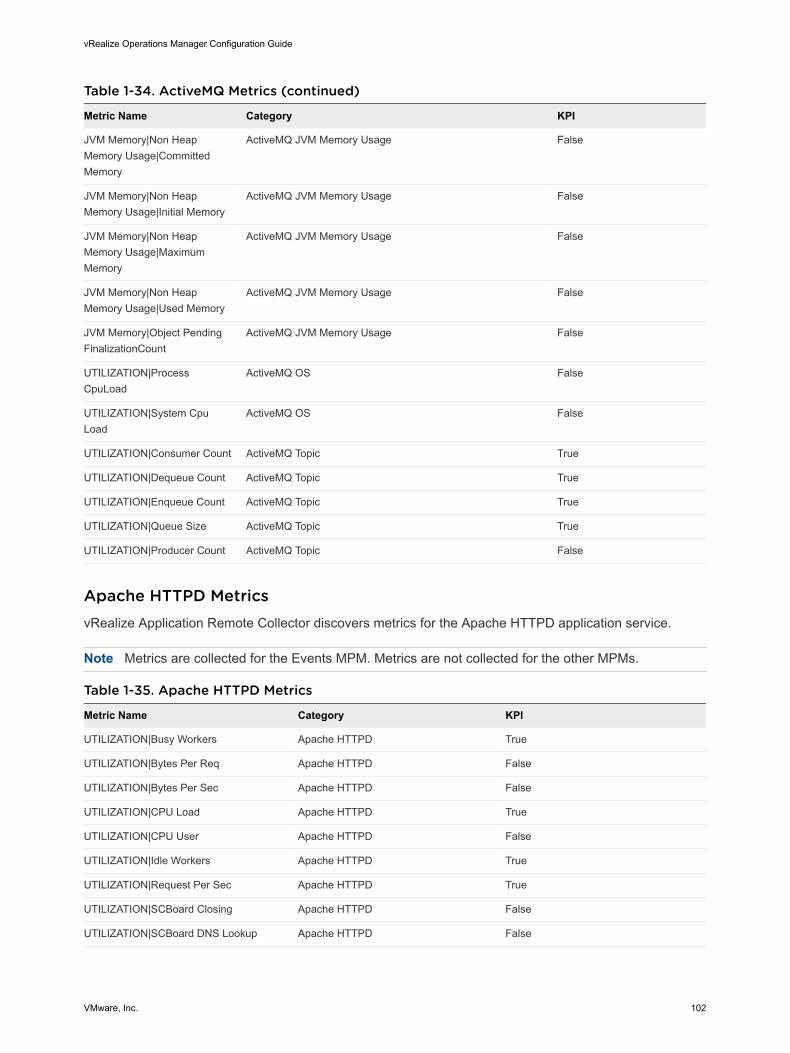
Table 1-34. ActiveMQ Metrics (continued)
Metric Name Category KPI
JVM Memory|Non Heap Memory Usage|Committed Memory
ActiveMQ JVM Memory Usage False
JVM Memory|Non Heap Memory Usage|Initial Memory
ActiveMQ JVM Memory Usage False
JVM Memory|Non Heap Memory Usage|Maximum Memory
ActiveMQ JVM Memory Usage False
JVM Memory|Non Heap Memory Usage|Used Memory
ActiveMQ JVM Memory Usage False
JVM Memory|Object Pending FinalizationCount
ActiveMQ JVM Memory Usage False
UTILIZATION|Process CpuLoad
ActiveMQ OS False
UTILIZATION|System Cpu Load
ActiveMQ OS False
UTILIZATION|Consumer Count ActiveMQ Topic True
UTILIZATION|Dequeue Count ActiveMQ Topic True
UTILIZATION|Enqueue Count ActiveMQ Topic True
UTILIZATION|Queue Size ActiveMQ Topic True
UTILIZATION|Producer Count ActiveMQ Topic False
Apache HTTPD MetricsvRealize Application Remote Collector discovers metrics for the Apache HTTPD application service.
Note Metrics are collected for the Events MPM. Metrics are not collected for the other MPMs.
Table 1-35. Apache HTTPD Metrics
Metric Name Category KPI
UTILIZATION|Busy Workers Apache HTTPD True
UTILIZATION|Bytes Per Req Apache HTTPD False
UTILIZATION|Bytes Per Sec Apache HTTPD False
UTILIZATION|CPU Load Apache HTTPD True
UTILIZATION|CPU User Apache HTTPD False
UTILIZATION|Idle Workers Apache HTTPD True
UTILIZATION|Request Per Sec Apache HTTPD True
UTILIZATION|SCBoard Closing Apache HTTPD False
UTILIZATION|SCBoard DNS Lookup Apache HTTPD False
vRealize Operations Manager Configuration Guide
VMware, Inc. 102
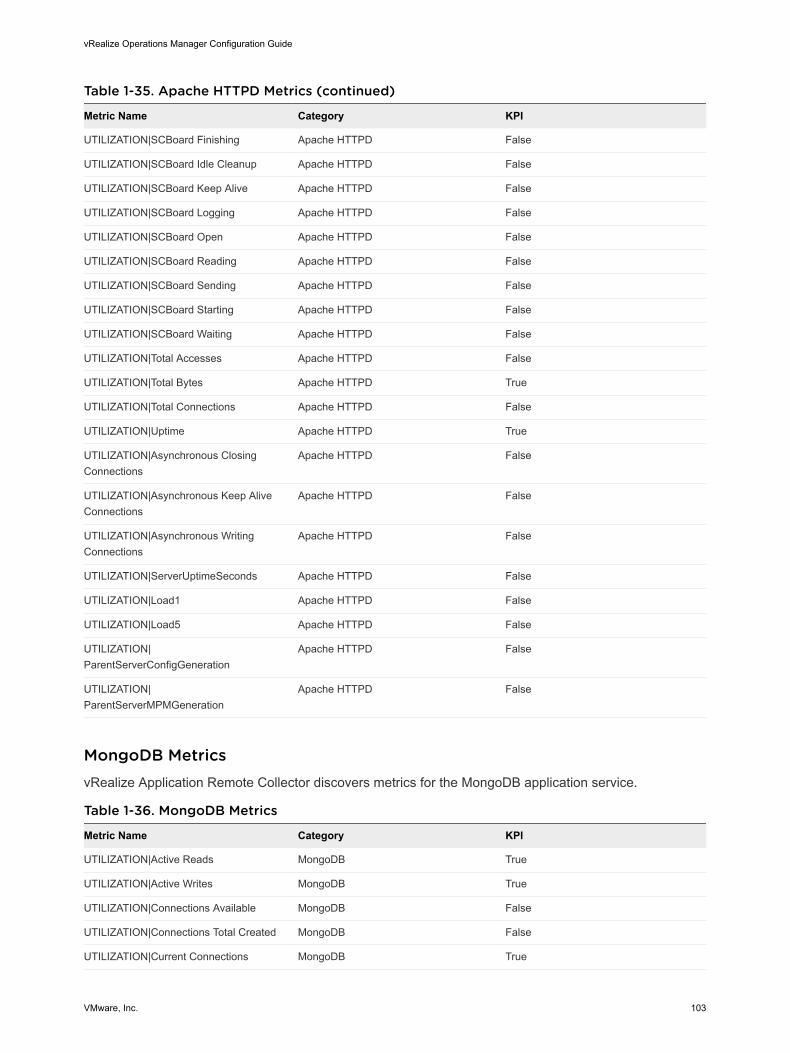
Table 1-35. Apache HTTPD Metrics (continued)
Metric Name Category KPI
UTILIZATION|SCBoard Finishing Apache HTTPD False
UTILIZATION|SCBoard Idle Cleanup Apache HTTPD False
UTILIZATION|SCBoard Keep Alive Apache HTTPD False
UTILIZATION|SCBoard Logging Apache HTTPD False
UTILIZATION|SCBoard Open Apache HTTPD False
UTILIZATION|SCBoard Reading Apache HTTPD False
UTILIZATION|SCBoard Sending Apache HTTPD False
UTILIZATION|SCBoard Starting Apache HTTPD False
UTILIZATION|SCBoard Waiting Apache HTTPD False
UTILIZATION|Total Accesses Apache HTTPD False
UTILIZATION|Total Bytes Apache HTTPD True
UTILIZATION|Total Connections Apache HTTPD False
UTILIZATION|Uptime Apache HTTPD True
UTILIZATION|Asynchronous Closing Connections
Apache HTTPD False
UTILIZATION|Asynchronous Keep Alive Connections
Apache HTTPD False
UTILIZATION|Asynchronous Writing Connections
Apache HTTPD False
UTILIZATION|ServerUptimeSeconds Apache HTTPD False
UTILIZATION|Load1 Apache HTTPD False
UTILIZATION|Load5 Apache HTTPD False
UTILIZATION|ParentServerConfigGeneration
Apache HTTPD False
UTILIZATION|ParentServerMPMGeneration
Apache HTTPD False
MongoDB MetricsvRealize Application Remote Collector discovers metrics for the MongoDB application service.
Table 1-36. MongoDB Metrics
Metric Name Category KPI
UTILIZATION|Active Reads MongoDB True
UTILIZATION|Active Writes MongoDB True
UTILIZATION|Connections Available MongoDB False
UTILIZATION|Connections Total Created MongoDB False
UTILIZATION|Current Connections MongoDB True
vRealize Operations Manager Configuration Guide
VMware, Inc. 103
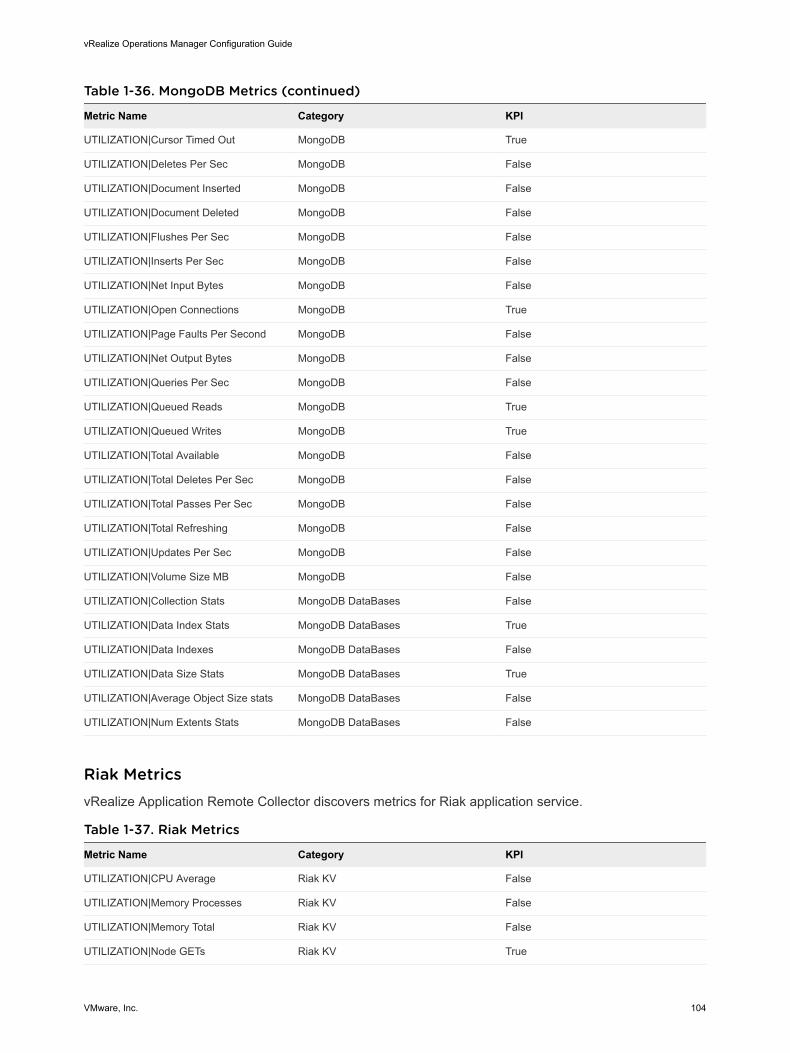
Table 1-36. MongoDB Metrics (continued)
Metric Name Category KPI
UTILIZATION|Cursor Timed Out MongoDB True
UTILIZATION|Deletes Per Sec MongoDB False
UTILIZATION|Document Inserted MongoDB False
UTILIZATION|Document Deleted MongoDB False
UTILIZATION|Flushes Per Sec MongoDB False
UTILIZATION|Inserts Per Sec MongoDB False
UTILIZATION|Net Input Bytes MongoDB False
UTILIZATION|Open Connections MongoDB True
UTILIZATION|Page Faults Per Second MongoDB False
UTILIZATION|Net Output Bytes MongoDB False
UTILIZATION|Queries Per Sec MongoDB False
UTILIZATION|Queued Reads MongoDB True
UTILIZATION|Queued Writes MongoDB True
UTILIZATION|Total Available MongoDB False
UTILIZATION|Total Deletes Per Sec MongoDB False
UTILIZATION|Total Passes Per Sec MongoDB False
UTILIZATION|Total Refreshing MongoDB False
UTILIZATION|Updates Per Sec MongoDB False
UTILIZATION|Volume Size MB MongoDB False
UTILIZATION|Collection Stats MongoDB DataBases False
UTILIZATION|Data Index Stats MongoDB DataBases True
UTILIZATION|Data Indexes MongoDB DataBases False
UTILIZATION|Data Size Stats MongoDB DataBases True
UTILIZATION|Average Object Size stats MongoDB DataBases False
UTILIZATION|Num Extents Stats MongoDB DataBases False
Riak MetricsvRealize Application Remote Collector discovers metrics for Riak application service.
Table 1-37. Riak Metrics
Metric Name Category KPI
UTILIZATION|CPU Average Riak KV False
UTILIZATION|Memory Processes Riak KV False
UTILIZATION|Memory Total Riak KV False
UTILIZATION|Node GETs Riak KV True
vRealize Operations Manager Configuration Guide
VMware, Inc. 104
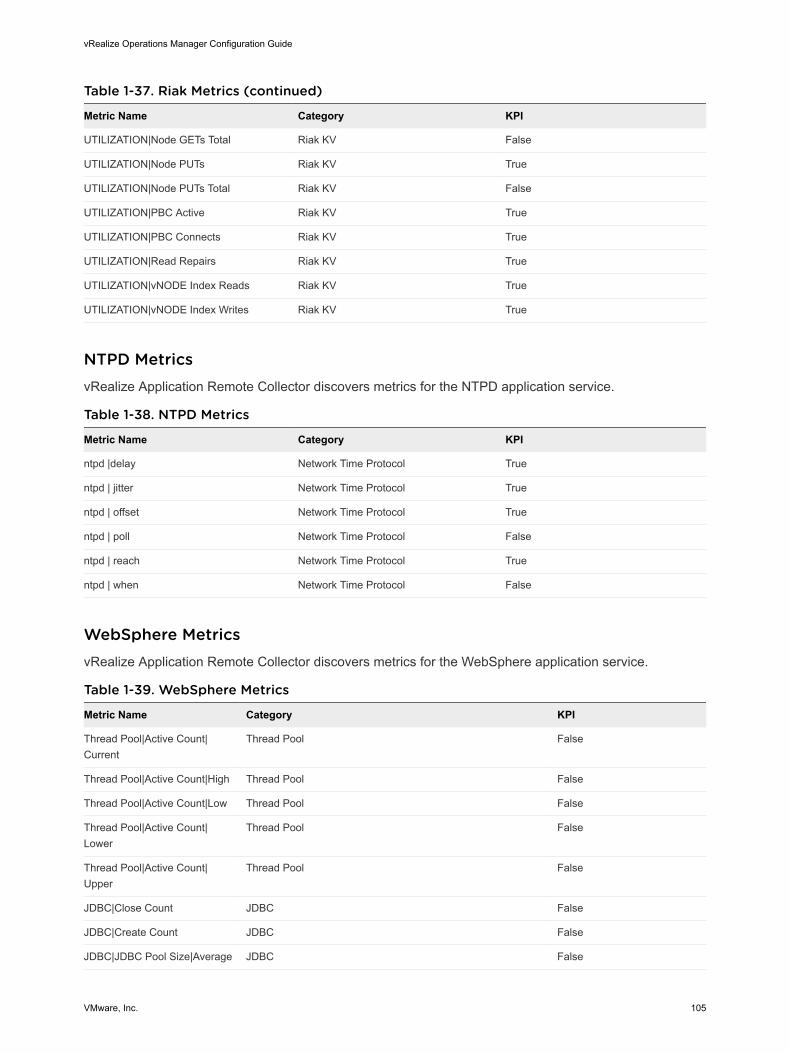
Table 1-37. Riak Metrics (continued)
Metric Name Category KPI
UTILIZATION|Node GETs Total Riak KV False
UTILIZATION|Node PUTs Riak KV True
UTILIZATION|Node PUTs Total Riak KV False
UTILIZATION|PBC Active Riak KV True
UTILIZATION|PBC Connects Riak KV True
UTILIZATION|Read Repairs Riak KV True
UTILIZATION|vNODE Index Reads Riak KV True
UTILIZATION|vNODE Index Writes Riak KV True
NTPD MetricsvRealize Application Remote Collector discovers metrics for the NTPD application service.
Table 1-38. NTPD Metrics
Metric Name Category KPI
ntpd |delay Network Time Protocol True
ntpd | jitter Network Time Protocol True
ntpd | offset Network Time Protocol True
ntpd | poll Network Time Protocol False
ntpd | reach Network Time Protocol True
ntpd | when Network Time Protocol False
WebSphere MetricsvRealize Application Remote Collector discovers metrics for the WebSphere application service.
Table 1-39. WebSphere Metrics
Metric Name Category KPI
Thread Pool|Active Count|Current
Thread Pool False
Thread Pool|Active Count|High Thread Pool False
Thread Pool|Active Count|Low Thread Pool False
Thread Pool|Active Count|Lower
Thread Pool False
Thread Pool|Active Count|Upper
Thread Pool False
JDBC|Close Count JDBC False
JDBC|Create Count JDBC False
JDBC|JDBC Pool Size|Average JDBC False
vRealize Operations Manager Configuration Guide
VMware, Inc. 105
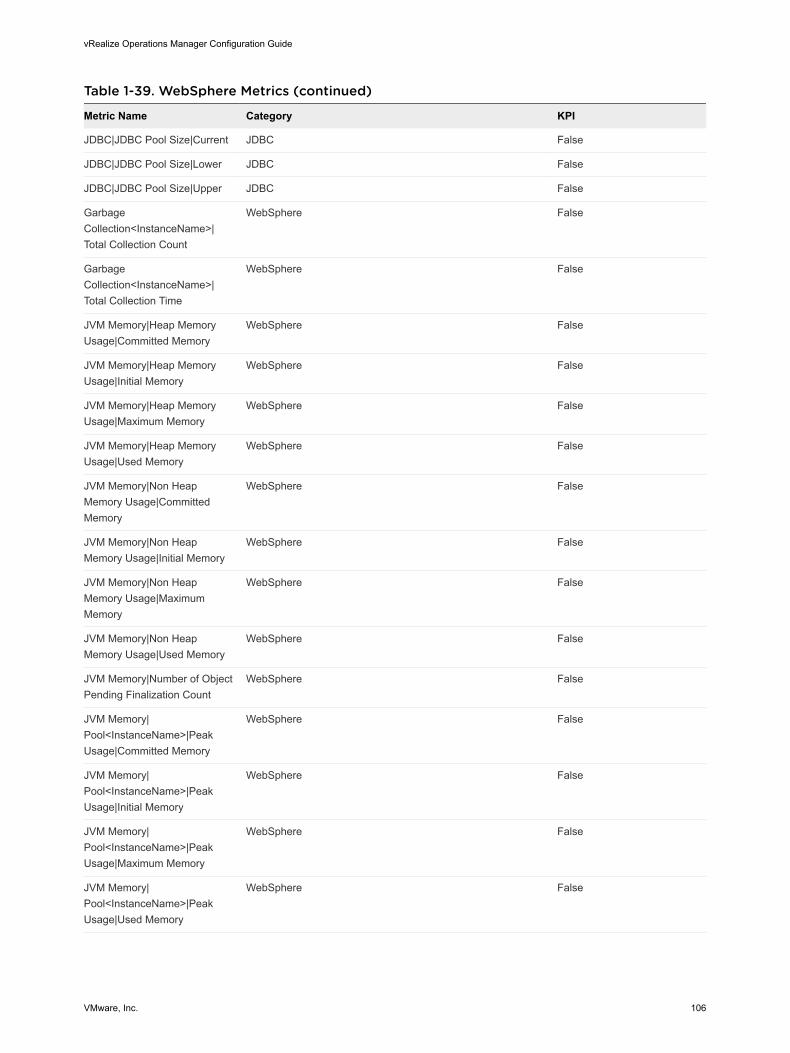
Table 1-39. WebSphere Metrics (continued)
Metric Name Category KPI
JDBC|JDBC Pool Size|Current JDBC False
JDBC|JDBC Pool Size|Lower JDBC False
JDBC|JDBC Pool Size|Upper JDBC False
Garbage Collection<InstanceName>|Total Collection Count
WebSphere False
Garbage Collection<InstanceName>|Total Collection Time
WebSphere False
JVM Memory|Heap Memory Usage|Committed Memory
WebSphere False
JVM Memory|Heap Memory Usage|Initial Memory
WebSphere False
JVM Memory|Heap Memory Usage|Maximum Memory
WebSphere False
JVM Memory|Heap Memory Usage|Used Memory
WebSphere False
JVM Memory|Non Heap Memory Usage|Committed Memory
WebSphere False
JVM Memory|Non Heap Memory Usage|Initial Memory
WebSphere False
JVM Memory|Non Heap Memory Usage|Maximum Memory
WebSphere False
JVM Memory|Non Heap Memory Usage|Used Memory
WebSphere False
JVM Memory|Number of Object Pending Finalization Count
WebSphere False
JVM Memory|Pool<InstanceName>|Peak Usage|Committed Memory
WebSphere False
JVM Memory|Pool<InstanceName>|Peak Usage|Initial Memory
WebSphere False
JVM Memory|Pool<InstanceName>|Peak Usage|Maximum Memory
WebSphere False
JVM Memory|Pool<InstanceName>|Peak Usage|Used Memory
WebSphere False
vRealize Operations Manager Configuration Guide
VMware, Inc. 106
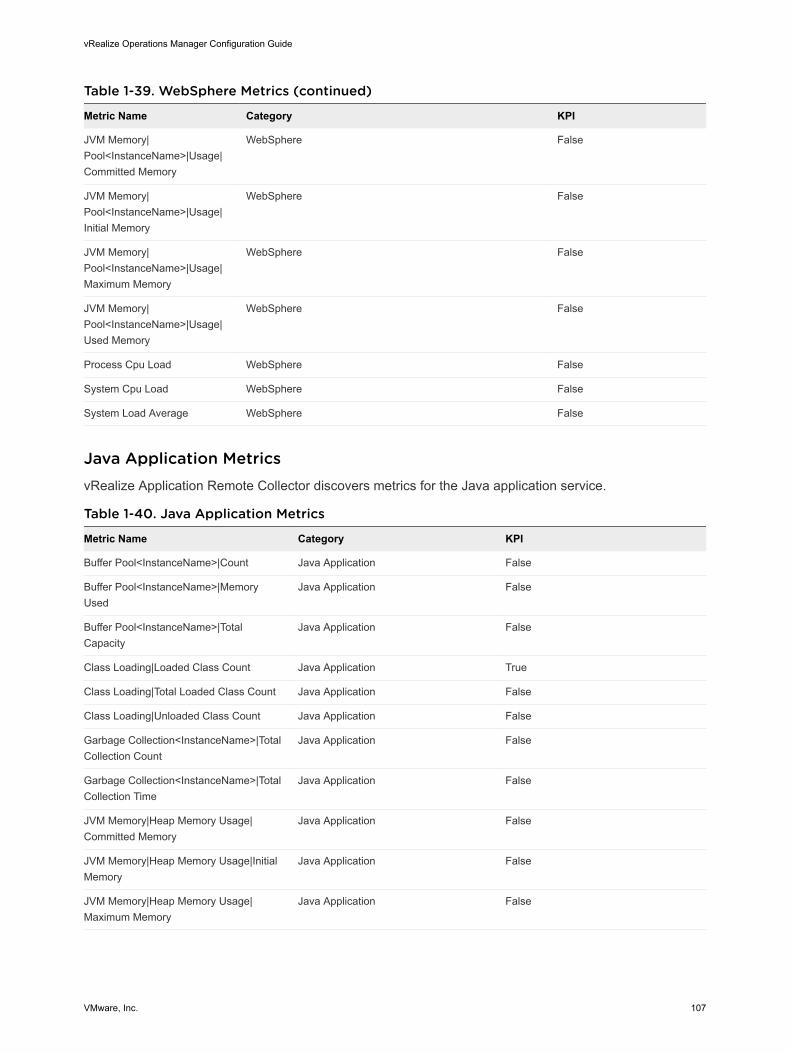
Table 1-39. WebSphere Metrics (continued)
Metric Name Category KPI
JVM Memory|Pool<InstanceName>|Usage|Committed Memory
WebSphere False
JVM Memory|Pool<InstanceName>|Usage|Initial Memory
WebSphere False
JVM Memory|Pool<InstanceName>|Usage|Maximum Memory
WebSphere False
JVM Memory|Pool<InstanceName>|Usage|Used Memory
WebSphere False
Process Cpu Load WebSphere False
System Cpu Load WebSphere False
System Load Average WebSphere False
Java Application MetricsvRealize Application Remote Collector discovers metrics for the Java application service.
Table 1-40. Java Application Metrics
Metric Name Category KPI
Buffer Pool<InstanceName>|Count Java Application False
Buffer Pool<InstanceName>|Memory Used
Java Application False
Buffer Pool<InstanceName>|Total Capacity
Java Application False
Class Loading|Loaded Class Count Java Application True
Class Loading|Total Loaded Class Count Java Application False
Class Loading|Unloaded Class Count Java Application False
Garbage Collection<InstanceName>|Total Collection Count
Java Application False
Garbage Collection<InstanceName>|Total Collection Time
Java Application False
JVM Memory|Heap Memory Usage|Committed Memory
Java Application False
JVM Memory|Heap Memory Usage|Initial Memory
Java Application False
JVM Memory|Heap Memory Usage|Maximum Memory
Java Application False
vRealize Operations Manager Configuration Guide
VMware, Inc. 107
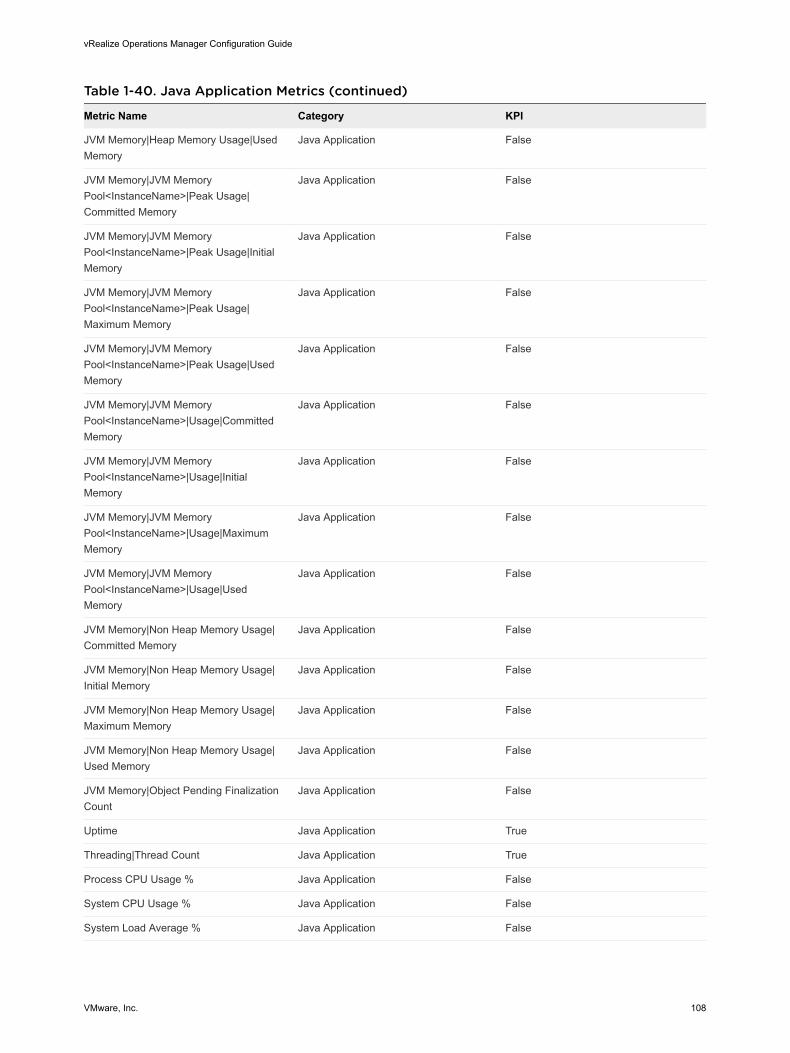
Table 1-40. Java Application Metrics (continued)
Metric Name Category KPI
JVM Memory|Heap Memory Usage|Used Memory
Java Application False
JVM Memory|JVM Memory Pool<InstanceName>|Peak Usage|Committed Memory
Java Application False
JVM Memory|JVM Memory Pool<InstanceName>|Peak Usage|Initial Memory
Java Application False
JVM Memory|JVM Memory Pool<InstanceName>|Peak Usage|Maximum Memory
Java Application False
JVM Memory|JVM Memory Pool<InstanceName>|Peak Usage|Used Memory
Java Application False
JVM Memory|JVM Memory Pool<InstanceName>|Usage|Committed Memory
Java Application False
JVM Memory|JVM Memory Pool<InstanceName>|Usage|Initial Memory
Java Application False
JVM Memory|JVM Memory Pool<InstanceName>|Usage|Maximum Memory
Java Application False
JVM Memory|JVM Memory Pool<InstanceName>|Usage|Used Memory
Java Application False
JVM Memory|Non Heap Memory Usage|Committed Memory
Java Application False
JVM Memory|Non Heap Memory Usage|Initial Memory
Java Application False
JVM Memory|Non Heap Memory Usage|Maximum Memory
Java Application False
JVM Memory|Non Heap Memory Usage|Used Memory
Java Application False
JVM Memory|Object Pending Finalization Count
Java Application False
Uptime Java Application True
Threading|Thread Count Java Application True
Process CPU Usage % Java Application False
System CPU Usage % Java Application False
System Load Average % Java Application False
vRealize Operations Manager Configuration Guide
VMware, Inc. 108
Troubleshooting the Integration of vRealize Application Remote Collector with vRealize Operations ManagerHere are troubleshooting tips for errors and install failures during the integration of vRealize Application Remote Collector with vRealize Operations Manager.
Install Fails When UAC is Disabled
Problem
Install of the agent fails even when UAC is disabled.
Solution
u To disable UAC (previously known as LUA) on Windows, complete the following steps:
a In the registry path HKLM:\Software\Microsoft\Windows\CurrentVersion\Policies\System, set the value for the key EnableLUA to 0.
b You must reboot the machine for the changes to take effect.
vCenter Server User PermissionsvRealize Application Remote Collector requires guest operation privileges to install agents on virtual machines.
Problem
Agent installation fails with the following error message if there are no guest operation privileges:
vCenter adapter user is missing either of the following guest operations privileges – execute,
modify, query
Solution
1 Verify that you have configured a vCenter adapter.
2 The vCenter Server user account with which the vCenter adapter is configured in vRealize Operations Manager, should have the following permissions: Guest operation modifications, Guest operation program execution, and Guest operation queries.
Installing an Agent on a Linux End Point FailsInstall of an agent on a Linux end point fails for a non-root user with a specific set of privileges.
Problem
Agent installation fails with the following error if the tty command is not added:
Bootstrap Failed for VM <VM ID> with error message:{ "status":"FAILED", "data":[ { "status":"FAILED",
"message":"Failed - install - passwordless sudo access is required for the user <Install Username> on
the command mkdir. [sudo: sorry, you must have a tty to run sudo]", "stage":"0" } ],
"currentstage":"0", "totalstages":"0" }
vRealize Operations Manager Configuration Guide
VMware, Inc. 109

Solution
u If you get the error as stated above, verify that the following lines exist in /etc/sudoers.
1. root ALL=(ALL:ALL) ALL
2.Defaults:root !requiretty
3.Defaults:arcuser !requiretty
(1) can be omitted if password-less sudo is already enabled for the root user. (2) and (3) can be omitted if your endpoint VMs are already configured to turn off requiretty.
Add these lines to /etc/sudoers, if you have not added them.
u To solve other failures on Linux end points, ensure that /tmp mount point is mounted with the exec mount option.
Configuration Failure When Ports Are Not EnabledAn error occurs when you add a vCenter Server while configuring the vRealize Application Remote Collector.
Problem
Configuration of vRealize Application Remote Collector fails with the following error:
Unable to establish a valid connection to the target system.
Wait for response of Task ‘Test connection’ is timed out for collector
‘vRealize Operations Manager Collector-Master’.
Solution
u Enable the relevant ports. For more information, see vRealize Application Remote Collector Security Information.
Network Time Protocol SettingsIf the actual time of the vRealize Application Remote Collector server is behind or ahead of the current time, you might face configuration or installation failures.
Problem
n Agent installation fails
n Adapter configuration fails
Solution
u Ensure that you configure network time protocol settings. For more information, see Configure Network Time Protocol Settings, or
vRealize Operations Manager Configuration Guide
VMware, Inc. 110
u Run the following command to update the time immediately from an NTP server: ntpdate time.vmware.com
Ensure that you have stopped the ntpd service before you run the ntpdate command.
Note The system time takes about five minutes to sync with the NTP server time.
Content Upgrade Error
Problem
Content upgrade for an end point fails with the following error:
process hasn’t exited
Cause
Sometimes content upgrade for an end point fails because of a timeout in the vRealize Application Remote Collector server.
Solution
u Retrigger content upgrade for the end point to resolve the issue.
Renaming the Telegraf Folder Fails Because of a Permission ErrorIn Windows, during bootstrap, when the Telegraf folder is renamed to ucp-telegraf, it can result in a failure because of a permission error.
Problem
Sometimes, there are certain antiviruses running, which prevent the application from renaming or modifying the directory or files. In such a situation, the following error message is displayed:
Install telegraf [unable to install telegraf due to system error : [WinError 5]
Access is denied: 'C:\\VMware\\UCP\\ucp-telegraf']"}].
Solution
u Disable the antivirus and then proceed with bootstrapping.
Unable to Activate a PluginUnable to activate a plugin with the same fields until the plugin configuration is deleted.
Problem
An error message is displayed in the user interface of vRealize Operations Manager that states the following:
Failed to update resource: Resource with same key already exists
vRealize Operations Manager Configuration Guide
VMware, Inc. 111
Solution
u Manually delete the existing plugin configuration and then continue with the activation of the plugin. If the problem persists, delete the corresponding resource from the inventory.
Plugin Status Is Displayed as UnknownThe status of a few plugins is Unknown after vRealize Application Remote Collector and vRealize Operations Manager are upgraded from 7.5 to 8.0.
Problem
The Unknown icon is displayed with a gray icon against the plugin.
Solution
u Reactivate the plugin.
Service DiscoveryService discovery helps you discover services running in each VM and then builds a relationship or dependency between the services from different VMs. You can view basic metrics based on the services you want to monitor. You can also use the service discovery dashboards to monitor the services.
Service discovery helps you determine the kind of services running on each VM in your environment. You can find out which VM is a part of a service, the impact of shutting down or moving a VM, the impact of an incident, and the right escalation path for a problem. You can also determine which VMs are used to migrate a service and which services are impacted by a planned outage on a VM or an infrastructure component.
Licensing
You can discover and monitor services using vRealize Operations Advanced and Enterprise editions.
To discover and monitor services, follow these steps in vRealize Operations Manager:
n Configure Service Discovery. For more information, see Configure Service Discovery.
n Manage Services. For more information, see Manage Services .
n Monitor services using dashboards. For more information, see Service Discovery Dashboards.
n View the services discovered. For more information, see Discovered Services.
Supported Platforms and Products for Service DiscoveryService discovery supports specific platforms and product versions.
Supported Product Versionsn ESXi 6.0 or later
n vCenter Server 6.0 or later
n VMware Tools: For details see KB 75122
vRealize Operations Manager Configuration Guide
VMware, Inc. 112
n VMware Cloud on AWS 1.7 and 1.8
Operating System Versions
Operating Systems Version
Windows Windows 7, Windows Server 2008/R2, and above.
Linux Photon, RHEL, CentOS, SUSE Linux Enterprise Server, OEL, and Ubuntu (all Linux operating systems must be based on kernel version 2.6.25 or above).
Supported ServicesService discovery supports several services that are supported in vRealize Operations Manager. The supported services are listed here.
Supported Services:n Active Directory
n Apache HTTP
n Apache Tomcat
n DB2
n Exchange Client Access Server
n Exchange Edge Transport Server
n Exchange Hub Transport Server
n Exchange Mailbox Server
n Exchange Server
n Exchange Unified Messaging Server
n GemFire
n IIS
n JBoss
n MS SQL DB
n MySQL DB
n Nginx
n Oracle DB
n RabbitMQ
n SharePoint
n SRM vCenter Replication Management Server
n SRM vCenter Replication Server
vRealize Operations Manager Configuration Guide
VMware, Inc. 113
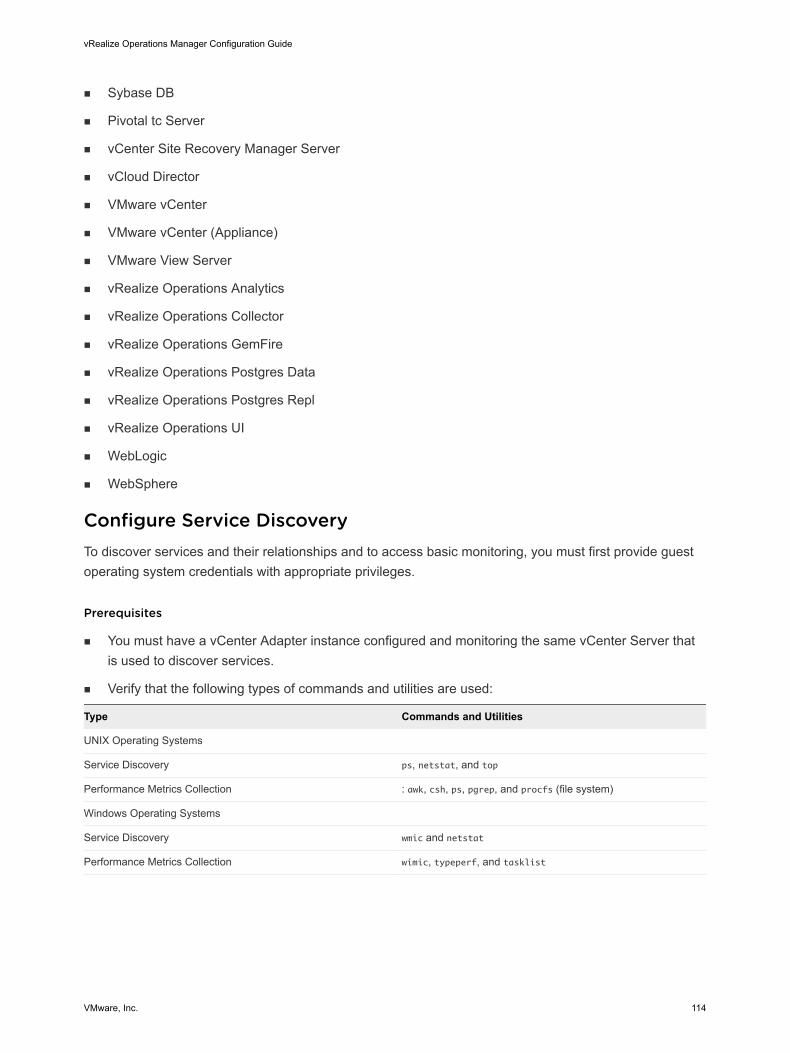
n Sybase DB
n Pivotal tc Server
n vCenter Site Recovery Manager Server
n vCloud Director
n VMware vCenter
n VMware vCenter (Appliance)
n VMware View Server
n vRealize Operations Analytics
n vRealize Operations Collector
n vRealize Operations GemFire
n vRealize Operations Postgres Data
n vRealize Operations Postgres Repl
n vRealize Operations UI
n WebLogic
n WebSphere
Configure Service DiscoveryTo discover services and their relationships and to access basic monitoring, you must first provide guest operating system credentials with appropriate privileges.
Prerequisites
n You must have a vCenter Adapter instance configured and monitoring the same vCenter Server that is used to discover services.
n Verify that the following types of commands and utilities are used:
Type Commands and Utilities
UNIX Operating Systems
Service Discovery ps, netstat, and top
Performance Metrics Collection : awk, csh, ps, pgrep, and procfs (file system)
Windows Operating Systems
Service Discovery wmic and netstat
Performance Metrics Collection wimic, typeperf, and tasklist
vRealize Operations Manager Configuration Guide
VMware, Inc. 114
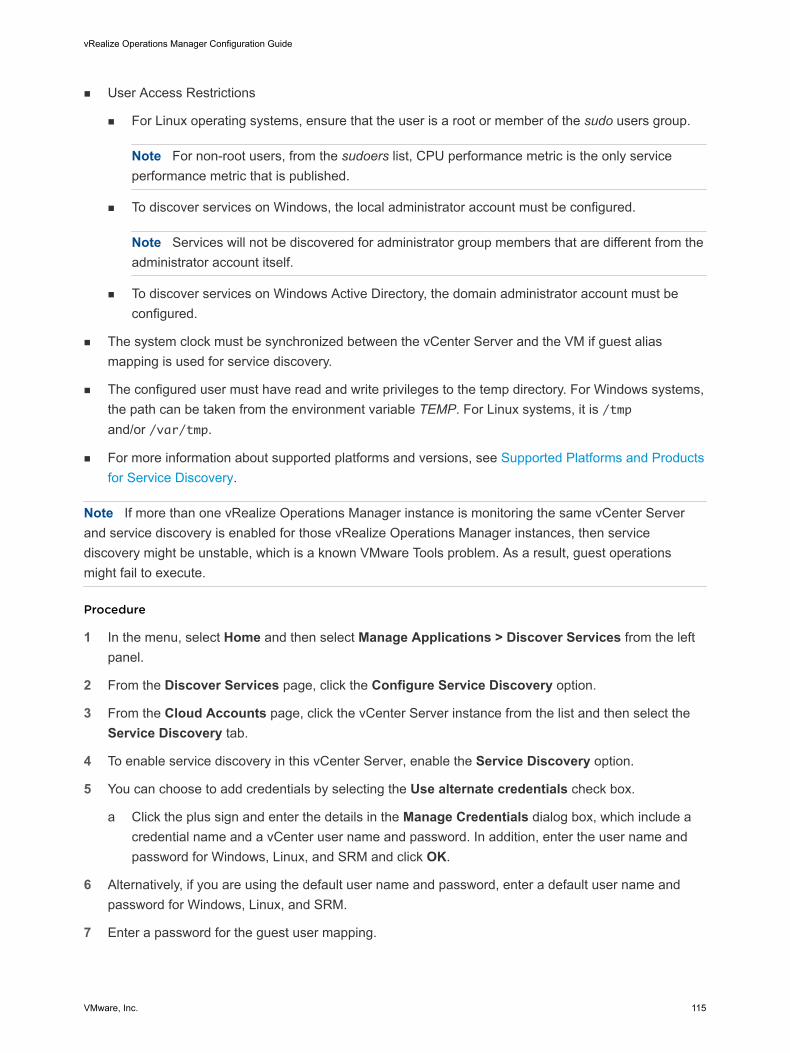
n User Access Restrictions
n For Linux operating systems, ensure that the user is a root or member of the sudo users group.
Note For non-root users, from the sudoers list, CPU performance metric is the only service performance metric that is published.
n To discover services on Windows, the local administrator account must be configured.
Note Services will not be discovered for administrator group members that are different from the administrator account itself.
n To discover services on Windows Active Directory, the domain administrator account must be configured.
n The system clock must be synchronized between the vCenter Server and the VM if guest alias mapping is used for service discovery.
n The configured user must have read and write privileges to the temp directory. For Windows systems, the path can be taken from the environment variable TEMP. For Linux systems, it is /tmp and/or /var/tmp.
n For more information about supported platforms and versions, see Supported Platforms and Products for Service Discovery.
Note If more than one vRealize Operations Manager instance is monitoring the same vCenter Server and service discovery is enabled for those vRealize Operations Manager instances, then service discovery might be unstable, which is a known VMware Tools problem. As a result, guest operations might fail to execute.
Procedure
1 In the menu, select Home and then select Manage Applications > Discover Services from the left panel.
2 From the Discover Services page, click the Configure Service Discovery option.
3 From the Cloud Accounts page, click the vCenter Server instance from the list and then select the Service Discovery tab.
4 To enable service discovery in this vCenter Server, enable the Service Discovery option.
5 You can choose to add credentials by selecting the Use alternate credentials check box.
a Click the plus sign and enter the details in the Manage Credentials dialog box, which include a credential name and a vCenter user name and password. In addition, enter the user name and password for Windows, Linux, and SRM and click OK.
6 Alternatively, if you are using the default user name and password, enter a default user name and password for Windows, Linux, and SRM.
7 Enter a password for the guest user mapping.
vRealize Operations Manager Configuration Guide
VMware, Inc. 115
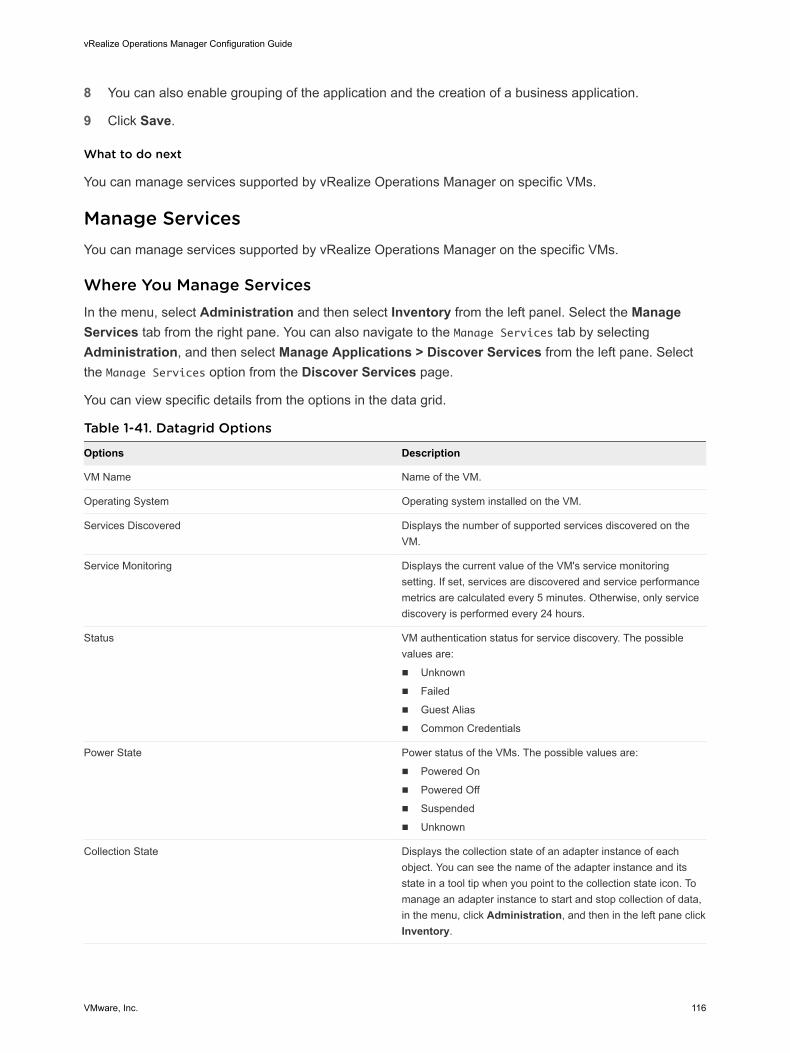
8 You can also enable grouping of the application and the creation of a business application.
9 Click Save.
What to do next
You can manage services supported by vRealize Operations Manager on specific VMs.
Manage ServicesYou can manage services supported by vRealize Operations Manager on the specific VMs.
Where You Manage ServicesIn the menu, select Administration and then select Inventory from the left panel. Select the Manage Services tab from the right pane. You can also navigate to the Manage Services tab by selecting Administration, and then select Manage Applications > Discover Services from the left pane. Select the Manage Services option from the Discover Services page.
You can view specific details from the options in the data grid.
Table 1-41. Datagrid Options
Options Description
VM Name Name of the VM.
Operating System Operating system installed on the VM.
Services Discovered Displays the number of supported services discovered on the VM.
Service Monitoring Displays the current value of the VM's service monitoring setting. If set, services are discovered and service performance metrics are calculated every 5 minutes. Otherwise, only service discovery is performed every 24 hours.
Status VM authentication status for service discovery. The possible values are:
n Unknown
n Failed
n Guest Alias
n Common Credentials
Power State Power status of the VMs. The possible values are:
n Powered On
n Powered Off
n Suspended
n Unknown
Collection State Displays the collection state of an adapter instance of each object. You can see the name of the adapter instance and its state in a tool tip when you point to the collection state icon. To manage an adapter instance to start and stop collection of data, in the menu, click Administration, and then in the left pane click Inventory.
vRealize Operations Manager Configuration Guide
VMware, Inc. 116

Table 1-41. Datagrid Options (continued)
Options Description
Collection Status Displays the collection status of the adapter instance of each object. You can see the name of the adapter instance and its status in a tool tip when you point to the collection status icon. To manage an adapter instance to start and stop collection of data, in the menu, click Administration, and then in the left pane click Inventory.
vCenter Name Name of the vCenter Adapter instance to which that VM resource belongs.
Table 1-42. Toolbar Options
Options Description
Provide Password Select VMs from the list and click Provide Password to provide a user name and password for the selected VMs to discover the services.
Enable Service Monitoring Select VMs from the list and click Enable Service Monitoring to enable frequent service discovery and service performance metrics calculation (every 5 minutes).
Note Selecting too many VMs will potentially result in vCenter Server degradation which is a known issue.
Disable Service Monitoring Select VMs from the list and click Disable Service Monitoring to disable frequent service discovery and service performance metrics calculation. Service discovery defaults to the 24-hour cycle.
Clear Selections Clears all VM object selections.
Select All Selects all VM objects.
Show Detail Navigates to the Summary tab for the selected VM. See the Summary tab.
Page Size The number of objects to list per page.
All Filters You can search through the list of VMs according to the following criteria: VM Name, Operating System, Power State, Status, and Service.
Discovered ServicesYou can view discovered services, the number of VMs on which each discovered service is running, and you can configure service discovery.
Where You View the Discovered Services
From the menu, select Home, and then from the left pane select Discover Services.
Discovered Services
vRealize Operations Manager Configuration Guide
VMware, Inc. 117
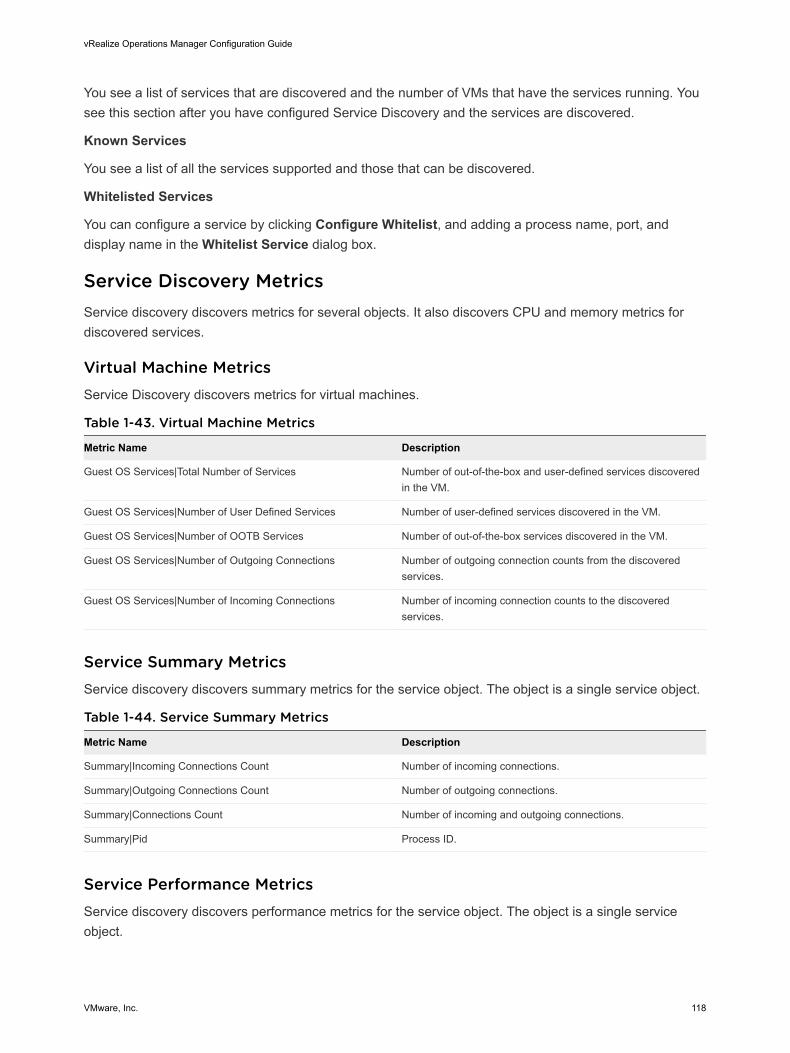
You see a list of services that are discovered and the number of VMs that have the services running. You see this section after you have configured Service Discovery and the services are discovered.
Known Services
You see a list of all the services supported and those that can be discovered.
Whitelisted Services
You can configure a service by clicking Configure Whitelist, and adding a process name, port, and display name in the Whitelist Service dialog box.
Service Discovery MetricsService discovery discovers metrics for several objects. It also discovers CPU and memory metrics for discovered services.
Virtual Machine MetricsService Discovery discovers metrics for virtual machines.
Table 1-43. Virtual Machine Metrics
Metric Name Description
Guest OS Services|Total Number of Services Number of out-of-the-box and user-defined services discovered in the VM.
Guest OS Services|Number of User Defined Services Number of user-defined services discovered in the VM.
Guest OS Services|Number of OOTB Services Number of out-of-the-box services discovered in the VM.
Guest OS Services|Number of Outgoing Connections Number of outgoing connection counts from the discovered services.
Guest OS Services|Number of Incoming Connections Number of incoming connection counts to the discovered services.
Service Summary MetricsService discovery discovers summary metrics for the service object. The object is a single service object.
Table 1-44. Service Summary Metrics
Metric Name Description
Summary|Incoming Connections Count Number of incoming connections.
Summary|Outgoing Connections Count Number of outgoing connections.
Summary|Connections Count Number of incoming and outgoing connections.
Summary|Pid Process ID.
Service Performance MetricsService discovery discovers performance metrics for the service object. The object is a single service object.
vRealize Operations Manager Configuration Guide
VMware, Inc. 118
Table 1-45. Service Performance Metrics
Metric Name Description
Performance metrics group|CPU CPU usage in percentage.
Performance metrics group|Memory Memory usage in KB.
Performance metrics group|IO Read Throughput IO read throughput in KBps.
Performance metrics group|IO Write Throughput IO write throughput in KBps.
Service Type MetricsService discovery discovers metrics for service type objects.
Table 1-46. Service Type Metrics
Metric Name Description
Number of instances Number of instances of this service type.
Log InsightWhen vRealize Operations Manager is integrated with Log Insight, you can view the Log Insight page, the Troubleshoot with Logs dashboard, and the Logs tab. You can collect and analyze log feeds. You can filter and search for log messages. You can also dynamically extract fields from log messages based on customized queries.
Log Insight PageWhen vRealize Operations Manager is integrated with vRealize Log Insight, you can search and filter log events. From the Interactive Analytics tab in the Log Insight page, you can create queries to extract events based on timestamp, text, source, and fields in log events . vRealize Log Insight presents charts of the query results.
To access the Log Insight page from vRealize Operations Manager, you must either:
n Configure the vRealize Log Insight adapter from the vRealize Operations Manager interface, or
n Configure vRealize Operations Manager in vRealize Log Insight.
For more information about configuring, see Configuring vRealize Log Insight with vRealize Operations Manager.
For information about vRealize Log Insight interactive analytics, see the vRealize Log Insight documentation.
Logs TabWhen vRealize Operations Manager is integrated with vRealize Log Insight, you can view the logs for a selected object from the Logs tab. You can troubleshoot a problem in your environment by correlating the information in the logs with the metrics. You can then most likely determine the root cause of the problem.
vRealize Operations Manager Configuration Guide
VMware, Inc. 119

How the Logs Tab WorksBy default, the Logs tab displays different event types for the last hour. For vSphere objects, the logs are filtered to show the event types for the specific object you select. For more information on the different filtering and querying capabilities, see the vRealize Log Insight documentation.
Where You Find the Logs TabIn the menu, select Environment and then from the left pane select an inventory object. Click the Logs tab. To view the Logs tab, you have to configure vRealize Operations Manager in vRealize Log Insight. For more information, see Configuring vRealize Log Insight with vRealize Operations Manager.
After integrating vRealize Operations Manager with vRealize Log Insight, refresh the browser to see the Logs tab.
Configuring vRealize Log Insight with vRealize Operations ManagerTo use the Log Insight page, the Troubleshoot with Logs dashboard, and Logs tab in vRealize Operations Manager, you must configure vRealize Log Insight with vRealize Operations Manager.
Configuring the vRealize Log Insight Adapter in vRealize Operations ManagerTo access the Log Insight page and the Troubleshoot with Logs dashboard from vRealize Operations Manager, you must configure the vRealize Log Insight adapter in vRealize Operations Manager.
vRealize Operations Manager accesses the first instance of the vRealize Log Insight adapter that is configured.
Prerequisites
n Verify that vRealize Log Insight and vRealize Operations Manager are installed.
n Verify that you know the IP address or FQDN of the vRealize Log Insight instance you have installed.
Procedure
1 In the menu, select Administration, and then from the left pane, select Management > Integrations.
2 From the Integrations page, click VMware vRealize Log Insight.
3 In the VMware vRealize Log Insight page complete the following steps:
n Enter the IP address or FQDN in the Log Insight server text box of the vRealize Log Insight you have installed and want to integrate with.
n Select the collector group from the Collectors/Groups drop-down menu.
n Click Test Connection to verify that the connection is successful.
n Click Save.
4 From the vRealize Operations Manager Home page, click Troubleshoot > Using Logs from the left pane. If you see a statement at the bottom of the page, click the link and accept the certificate exception in vRealize Log Insight or contact your IT support for more information.
vRealize Operations Manager Configuration Guide
VMware, Inc. 120
5 From the vRealize Operations Manager Home page, click Troubleshoot > Using Logs from the left pane and enter the user name and password of the vRealize Log Insight instance you have installed.
Configuring vRealize Operations Manager in vRealize Log InsightYou configure vRealize Operations Manager in vRealize Log Insight in the following scenarios:
n To access the Logs tab in vRealize Operations Manager.
n To access the Troubleshoot with Logs dashboard and the Log Insight page from vRealize Operations Manager.
Prerequisites
n Verify that vRealize Log Insight and vRealize Operations Manager are installed.
n Verify that you know the IP address, hostname, and password of the vRealize Operations Manager instance you want to integrate with.
Procedure
1 From the Administration page of vRealize Log Insight, click vRealize Operations from the left pane. You see the vRealize Operations Integration pane.
2 In the Hostname text box, enter the IP address or FQDN of the vRealize Operations Manager instance you want to integrate with.
Note If you are using a load balancer, use its IP address or FQDN as a hostname value.
3 In the Username and Password text boxes, enter the user name and password of the vRealize Operations Manager instance you want to integrate with.
4 Select the Enable alerts integration option.
5 Select the Enable launch in context option.
6 Click Test Connection to verify that the connection is successful and accept the certificate if it is untrusted.
7 Click Save.
You can now view the log details for an object in vRealize Operations Manager.
Log ForwardingFor troubleshooting in the product UI, you can send the logs to an external log server or a vRealize Log Insight server.
If you have configured log forwarding from Administration > Support > Logs in earlier versions of vRealize Operations Manager, VMware recommends that you reconfigure in this version of vRealize Operations Manager.
Where You Find the Log Forwarding PageIn the menu, select Administration and then from the left pane select Management > Log Forwarding.
vRealize Operations Manager Configuration Guide
VMware, Inc. 121
Table 1-47. Log Forwarding Page Options
Options Description
Self-monitoring logging configuration Forwards the logs to an external log server.
Forwarded Logs You can select the set of logs you want to forward to the external log server or the vRealize Log Insight server.
Log Insight Servers You can select an available vRealize Log Insight server IP.
If there is no available vRealize Log Insight server IP, select Other from the drop-down menu and manually enter the configuration details.
Host IP address of the external log server where logs have to be forwarded.
Protocol You can select either cfapi or syslog from the drop-down menu to send event logging messages.
Port The default port value depends on whether or not SSL has been set up for each protocol. The following are the possible default port values:
Protocol SSL Default Port
cfapi No 9000
cfapi Yes 9543
syslog No 514
syslog Yes 6514
Use SSL Allows the vRealize Log Insight agent to send data securely.
Path to Certificate Authority File You can enter the path to the trusted root certificates bundle file. If you do not enter a certificate path, the vRealize Log Insight Windows agent uses system root certificates and the vRealize Log Insight Linux agent attempts to load trusted certificates from /etc/pki/tls/certs/ca-bundle.crt or /etc/ssl/certs/ca-certificates.crt.
Cluster Name Displays the name of the cluster. You can edit this field.
Modifying Existing Log TypesIf you manually modified the existing entries or logs sections and then modify the log forwarding settings from vRealize Operations Manager, you lose the changes that you made.
The following server entries are overwritten by the vRealize Operations Manager log forwarding settings.
port
proto
hostname
ssl
reconnect
ssl_ca_path
vRealize Operations Manager Configuration Guide
VMware, Inc. 122
The following [common | global] tags are being added or overwritten by the vRealize Operations Manager log forwarding settings.
vmw_vr_ops_appname
vmw_vr_ops_clustername
vmw_vr_ops_clusterrole
vmw_vr_ops_hostname
vmw_vr_ops_nodename
Note Cluster role changes do not change the value of the vmw_vr_ops_clusterrole tag. You can either manually modify or ignore it.
Business ManagementSDDC costing is out-of-the box with vRealize Operations Manager. There is no integration required with vRealize Business for Cloud.
Cost Settings for Financial Accounting ModelYou can configure Server Hardware cost driver and resource utilization parameters to calculate the accurate cost and improve the efficiency of your environment.
Cost Drivers analyzes the resources and the performance of your virtual environment. Based on the values you define, Cost Drivers can identify reclamation opportunities and can provide recommendations to reduce wastage of resources and cost.
Configuring Depreciation PreferencesTo compute the amortized cost of the Server Hardware cost driver, you can configure the depreciation method and the depreciation period. Cost Drivers supports two yearly depreciation methods and you can set the depreciation period from two to seven years.
Note Cost Drivers calculates the yearly depreciation values and then divides the value by 12 to arrive at the monthly depreciation.
Method Calculation
Straight line Yearly straight line depreciation = [(original cost - accumulated depreciation) / number of
remaining depreciation years]
Max of Double or Straight
Yearly max of Double or Straight = Maximum (yearly depreciation of double declining balance
method, yearly depreciation of straight line method)
Yearly depreciation of double declining method= [(original cost - accumulated depreciation) *
depreciation rate].
Depreciation rate = 2 / number of depreciation years.
Note Double declining depreciation for the last year = original cost - accumulated depreciation
vRealize Operations Manager Configuration Guide
VMware, Inc. 123
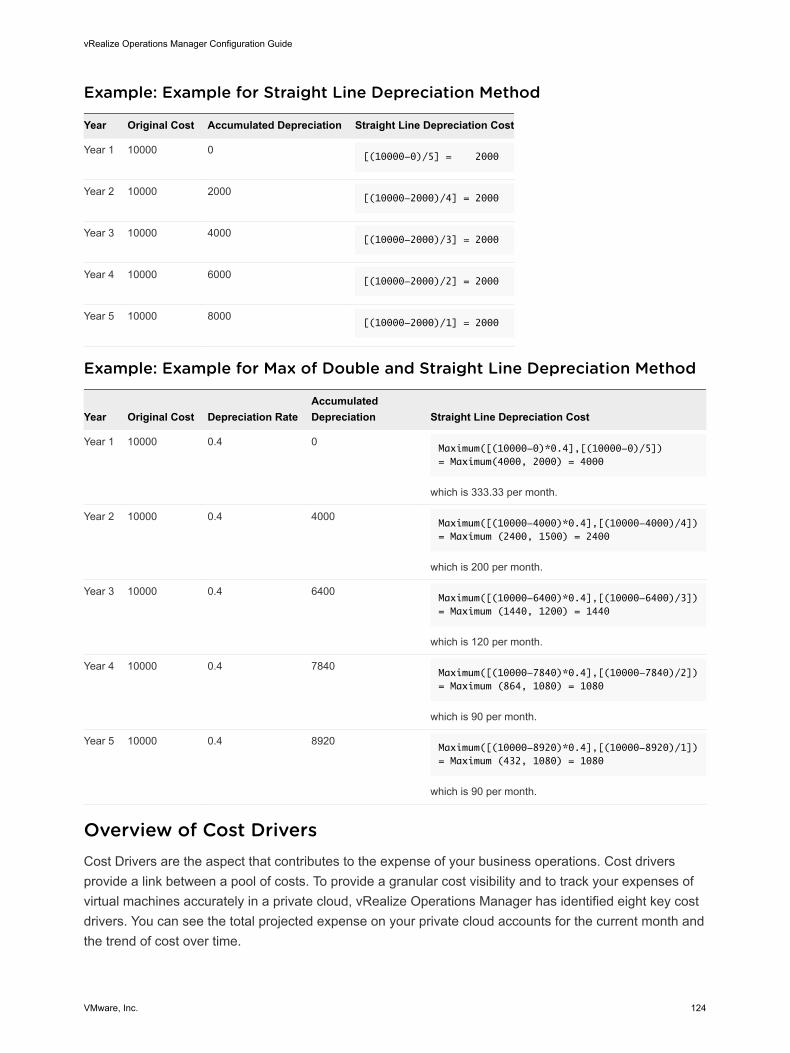
Example: Example for Straight Line Depreciation Method
Year Original Cost Accumulated Depreciation Straight Line Depreciation Cost
Year 1 10000 0[(10000-0)/5] = 2000
Year 2 10000 2000[(10000-2000)/4] = 2000
Year 3 10000 4000[(10000-2000)/3] = 2000
Year 4 10000 6000[(10000-2000)/2] = 2000
Year 5 10000 8000[(10000-2000)/1] = 2000
Example: Example for Max of Double and Straight Line Depreciation Method
Year Original Cost Depreciation RateAccumulated Depreciation Straight Line Depreciation Cost
Year 1 10000 0.4 0Maximum([(10000-0)*0.4],[(10000-0)/5])= Maximum(4000, 2000) = 4000
which is 333.33 per month.
Year 2 10000 0.4 4000Maximum([(10000-4000)*0.4],[(10000-4000)/4])= Maximum (2400, 1500) = 2400
which is 200 per month.
Year 3 10000 0.4 6400Maximum([(10000-6400)*0.4],[(10000-6400)/3])= Maximum (1440, 1200) = 1440
which is 120 per month.
Year 4 10000 0.4 7840Maximum([(10000-7840)*0.4],[(10000-7840)/2])= Maximum (864, 1080) = 1080
which is 90 per month.
Year 5 10000 0.4 8920Maximum([(10000-8920)*0.4],[(10000-8920)/1])= Maximum (432, 1080) = 1080
which is 90 per month.
Overview of Cost DriversCost Drivers are the aspect that contributes to the expense of your business operations. Cost drivers provide a link between a pool of costs. To provide a granular cost visibility and to track your expenses of virtual machines accurately in a private cloud, vRealize Operations Manager has identified eight key cost drivers. You can see the total projected expense on your private cloud accounts for the current month and the trend of cost over time.
vRealize Operations Manager Configuration Guide
VMware, Inc. 124
You can now set a total cost for the License, Labor, Network, Maintenance, and facilities cost drivers in vRealize Operations Manager:
Note The total cost set by you is distributed across resources in the data center. For example, if you set the total cost for the RHEL license, the cost is divided across all the hosts and VMs which use the RHEL license.
According to the industry standard, vRealize Operations Manager maintains a reference cost for these cost drivers. This reference cost helps you for calculating the cost of your setup, but might not be accurate. For example, you might have received some special discounts during a bulk purchase or you might have an ELA with VMware that might not match the socket-based pricing available in the reference database. To get accurate values, you can modify the reference cost of cost drivers in vRealize Operations Manager, which overrides the values in the reference database. Based on your inputs, vRealize Operations Manager recalculates the total amount for the private cloud expenses. After you add a private cloud into vRealize Operations Manager, vRealize Operations Manager automatically discovers one or more vCenter Servers that are part of your Private Cloud. In addition, it also retrieves the inventory details from each vCenter Server. The details include:
n Associated clusters: Count and names
n ESXi hosts: Count, model, configuration, and so on.
n Datastores: Count, storage, type, capacity
n VMs: Count, OS type, tags, configuration, utilization
Based on these configuration and utilizations of inventory, and the available reference cost, vRealize Operations Manager calculates the estimated monthly cost of each cost driver. The total cost of your private cloud is the sum of all these cost driver expenses.
You can modify the expense of your data center. These costs can be in terms of the percentage value or unit rate, and might not always be in terms of the overall cost. Based on your inputs, the final amount of expense is calculated. If you do not provide inputs regarding expenses, the default values are taken from the reference database.
You can see the projected cost of private cloud for the current month and the trend of total cost over time. For all the expenses, cost drivers invRealize Operations Manager display the monthly trend of the cost variations, the actual expense, and a chart that represents the actual expense and the reference cost of the expense.
Note If the vCenter Server was added from more than six months, the trend displays the total cost for the last six months only. Otherwise, the trend displays the total cost from the month the vCenter Server was added into vRealize Operations Manager.
vRealize Operations Manager Configuration Guide
VMware, Inc. 125
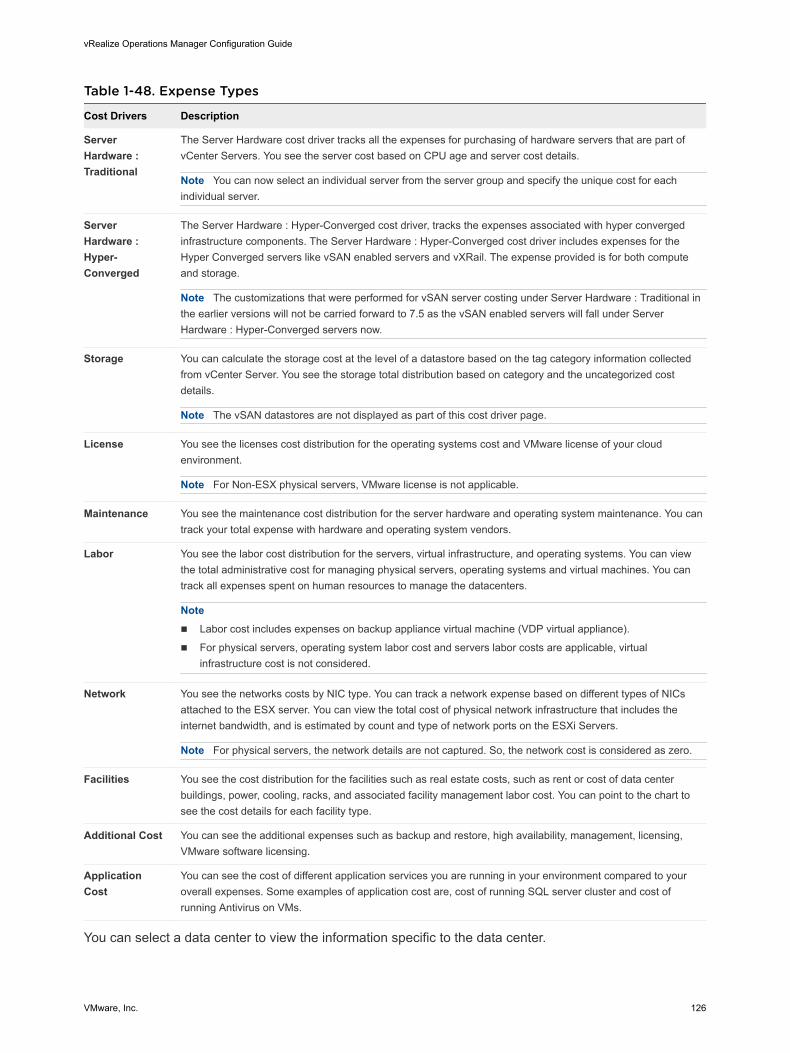
Table 1-48. Expense Types
Cost Drivers Description
Server Hardware : Traditional
The Server Hardware cost driver tracks all the expenses for purchasing of hardware servers that are part of vCenter Servers. You see the server cost based on CPU age and server cost details.
Note You can now select an individual server from the server group and specify the unique cost for each individual server.
Server Hardware : Hyper-Converged
The Server Hardware : Hyper-Converged cost driver, tracks the expenses associated with hyper converged infrastructure components. The Server Hardware : Hyper-Converged cost driver includes expenses for the Hyper Converged servers like vSAN enabled servers and vXRail. The expense provided is for both compute and storage.
Note The customizations that were performed for vSAN server costing under Server Hardware : Traditional in the earlier versions will not be carried forward to 7.5 as the vSAN enabled servers will fall under Server Hardware : Hyper-Converged servers now.
Storage You can calculate the storage cost at the level of a datastore based on the tag category information collected from vCenter Server. You see the storage total distribution based on category and the uncategorized cost details.
Note The vSAN datastores are not displayed as part of this cost driver page.
License You see the licenses cost distribution for the operating systems cost and VMware license of your cloud environment.
Note For Non-ESX physical servers, VMware license is not applicable.
Maintenance You see the maintenance cost distribution for the server hardware and operating system maintenance. You can track your total expense with hardware and operating system vendors.
Labor You see the labor cost distribution for the servers, virtual infrastructure, and operating systems. You can view the total administrative cost for managing physical servers, operating systems and virtual machines. You can track all expenses spent on human resources to manage the datacenters.
Note n Labor cost includes expenses on backup appliance virtual machine (VDP virtual appliance).
n For physical servers, operating system labor cost and servers labor costs are applicable, virtual infrastructure cost is not considered.
Network You see the networks costs by NIC type. You can track a network expense based on different types of NICs attached to the ESX server. You can view the total cost of physical network infrastructure that includes the internet bandwidth, and is estimated by count and type of network ports on the ESXi Servers.
Note For physical servers, the network details are not captured. So, the network cost is considered as zero.
Facilities You see the cost distribution for the facilities such as real estate costs, such as rent or cost of data center buildings, power, cooling, racks, and associated facility management labor cost. You can point to the chart to see the cost details for each facility type.
Additional Cost You can see the additional expenses such as backup and restore, high availability, management, licensing, VMware software licensing.
Application Cost
You can see the cost of different application services you are running in your environment compared to your overall expenses. Some examples of application cost are, cost of running SQL server cluster and cost of running Antivirus on VMs.
You can select a data center to view the information specific to the data center.
vRealize Operations Manager Configuration Guide
VMware, Inc. 126
Cloud Providers OverviewBy default, you can see that Amazon Web Services (AWS), Google Cloud, IBM Cloud, and Microsoft Azure are included in vRealize Operations Manager. You can also add your own cloud provider by using a standard vRealize Operations Manager template.
You can configure the new cloud provider as per the standard vRealize Operations Manager template and perform a migration scenario. The vRealize Operations Manager template contains data points for vCPU, CPU, RAM, OS, region, plan term, location, and built-in instance storage, you must provide these values when you add cloud providers. The result of the migration scenario helps you assess the cost savings achieved using your cloud provider against the default cloud providers.
You can edit the rate card for new cloud providers and default cloud providers. However, you cannot delete the default cloud providers.
Add Cloud ProviderYou can use the Add Cloud Provider workspace to add or edit a cloud provider. You can edit the cloud provider rate card for default cloud providers and the new cloud provider.
Procedure
1 On the menu, click Administration and in the left pane click Configuration > Cost Settings > Cloud Providers.
You can also reach the Cloud Providers page from the Home Screen. In the Home screen, navigate to Optimize Capacity > What-If Analysis > Plan Migration > Add Cloud Providers. For more information, see What-If-Analysis - Migration Planning section in vRealize Operations Manager help.
2 Click the Add Cloud icon.
3 Enter the Cloud Provider Name.
4 Select the cloud provider logo and click Upload Logo.
5 Click Next.
6 Click Download Template and specify the required values.
Note When you edit a cloud provider the Download Template link is replaced with Download Existing Rate Card. You can update the existing rate card and upload the same.
7 Select the updated template and click Upload Rate Card.
8 Click Validate.
Note vRealize Operations Manager validates the rate card and reports success or failure. If errors are reported, you can correct the errors and proceed further.
9 Click Finish.
The new cloud provider is now part of the vRealize Operations Manager cloud provider list.
vRealize Operations Manager Configuration Guide
VMware, Inc. 127
Editing Cost DriversYou can manually edit monthly cost of all the eight expense types from the current month onwards.
The configuration used for cost drivers determines how vRealize Operations Manager calculates and displays the cost.
Editing Server Hardware : TraditionalYou can view, add, edit, or delete the cost of each server group, based on their configuration and the purchase date of a batch server running in your cloud environment. You can also specify the server cost for individual servers in a server group. After you update the server hardware cost, cost drivers update the total monthly cost and average monthly cost for each server group.
Procedure
1 Click Administration and in the left pane click Configuration > Cost Settings.
2 In the Cost Drivers tab, click Server Hardware : Traditional.
3 Click any server from the list of Server Group Description.
The cost drivers groups all server hardware from all data centers in your inventory based on their hardware configuration.
Category Description
Server Group Description Displays the name of the server in your inventory.
Number of Servers Displays the total number of servers of any particular hardware configuration in your inventory.
Monthly Cost Displays the average monthly cost for server. This value is calculated as a weighted average of prices of purchased and leased batches.
4 After selecting a server group, you can manually enter the required fields.
a Enter the Purchase Type and Cost Per Server.
Note You can use the + ADD COST PER SERVER option to create multiple server batches and set the cost for a specific server in a server group.
b Click Save.
Editing Server Hardware: Hyper-ConvergedYou can view, add, edit, or delete the cost of Hyper converged Infrastructure (HCI) component in your server group. You can specify the cost per server and compute percentage exclusively for the HCI servers. After you update the server hardware cost, cost drivers update the total monthly cost and average monthly cost for each server group.
Procedure
1 Click Administration and in the left pane click Configuration > Cost Settings.
2 In the Cost Drivers tab, click Server Hardware : Hyper-Converged.
vRealize Operations Manager Configuration Guide
VMware, Inc. 128
3 Click any server from the list of Server Group Description.
The cost drivers groups all server hardware from all data centers in your inventory based on their hardware configuration.
Category Description
Server Group Description Displays the name of servers falling under vSAN clusters and vXrail servers in your inventory.
Number of Servers Displays the total number of servers of any particular hardware configuration in your inventory.
Monthly Cost Displays the average monthly cost for server. This value is calculated as a weighted average of prices of purchased and leased batches.
Note You can edit the Compute Pct column to adjust the storage rate of the vSAN datastores. You can use the same percentage to determine the cost.
4 After selecting a server group, you can manually enter the required fields.
a Enter Purchase Type, Cost Per Server, and Compute Percentage.
Note You can use the + ADD COST PER SERVER option to create multiple server batches and to customize the cost per server.
b Click Save.
Edit Monthly Cost of StorageThe storage hardware is categorized according to the datastore tag category. You can edit the monthly cost per storage GB for the datastores based on their storage category (using tags) and storage type (NAS, SAN, Fiber Channel, or Block).
Prerequisites
To edit the cost based on the storage category, you must create tags and apply them to the datastores on the vCenter Server user interface. For more information, see the VMware vSphere Documentation.
Procedure
1 Click Administration and in the left pane click Configuration > Cost Settings.
2 In the Cost Drivers tab, click Storage.
3 (Optional) Select a tag category.
Assume that you have two tag categories (for example, Profile and Tiers) with three tags in each category, you can select either Profile or Tiers from Tag Category to categorize the datastores based on tags.
vRealize Operations Manager Configuration Guide
VMware, Inc. 129
Category Description
Edit Mode You can select the storage cost to be applicable for all the data centers or a specific data center.
n Edit for All Data Centers mode enables you to customize a single cost driver value for all the data centers. Any customizations done for the Specific data center mode are lost.
n Edit for specific Data Center mode enables you to customize different cost driver values for different data centers. Any customizations done for All data centers mode are lost.
Select Data center You can select the data center for which you want to change the storage cost. This field is applicable only for specific data centers.
Tag Category n Category displays the tag categories for datastores and also the tags associated with the category.
Note If you perform fresh installation of vCenter Server 6.0, and not assign tags to the datastores, cost drivers display the tag category for datastores as uncategorized.
Datastores Displays the total number of datastores for a specific category or type. You can click the datastore value to see the list of datastores and its details such as monthly cost, total GB for each datastore.
Total Storage (GB) Displays the total storage for a specific category or type.
Monthly Cost Per GB
Displays the monthly cost per GB for a specific category or type. You can edit this value for defining the monthly cost per GB for datastores.
Monthly Cost Displays the total monthly cost for a specific category or type.
4 Click Save.
Edit Monthly Cost of LicenseYou can edit the total operating system licensing cost and VMware license cost of your cloud environment. You can now set a total fixed cost for the license in vRealize Operations Manager. The total license cost is divided across all the hosts present in the data center. You can edit the license cost by either selecting the ELA charging policy or selecting the per socket value.
Procedure
1 Click Administration and in the left pane click Configuration > Cost Drivers.
2 In the Cost Drivers tab, click License.
3 Select the required edit mode for changing the license cost.
n Edit for All Data centers - mode enables you to customize a single cost driver value for all the data centers. Any customizations done for the Specific data center mode are lost.
n Edit for specific Data Center - mode enables you to customize different cost driver values for different data centers. Any customizations done for All data centers mode are lost.
Note When you select Edit for specific data center as the edit mode, then the select data center option is enabled. Select the data center from the drop-down menu
4 Click Save.
The Cost drivers display all the licenses in your cloud environment.
vRealize Operations Manager Configuration Guide
VMware, Inc. 130
Category Description
Name Displays the category of the operating system. If the operating system is not Windows or Linux, cost drivers categorize the operating system under Other Operating Systems.
Note Two new cost components, Monthly cost of VMware vSAN Per Socket and Monthly cost of VMware vSAN SnS have been included for the vSAN cost calculation. The default values for these components are based on the reference database values.
VMs Displays the number of virtual machines that are running on the specific operating system.
Sockets Displays the number of sockets on which the specific operating system is running.
Charged by Displays whether a cost is charged by socket or ELA.
Note The Charged By column can be edited to mention that the cost is charged by socket, core, instance, or ELA.
Total Cost Displays the total cost of the specific operating system.
5 Click Save.
According to your inputs, vRealize Operations Manager calculates and displays the total cost and updates the Charged by column with the option that you have selected.
Edit Monthly Cost of MaintenanceYou can edit the monthly cost of maintaining your cloud environment. Maintenance cost is categorized into hardware maintenance cost and operating system maintenance cost. Hardware maintenance cost is calculated as a percentage of the purchase cost of servers. Operating system maintenance cost is calculated as a percentage of the Windows licensing costs. You can snow specify a total fixed cost for maintenance in vRealize Operations Manager. The total maintenance cost is divided across all the hosts present in the data center.
Procedure
1 Click Administration and in the left pane click Configuration > Cost Settings.
2 In the Cost Drivers tab, click Maintenance.
3 Select the required edit mode for changing the monthly maintenance cost.
n Edit for All Data centers - mode enables you to customize a single cost driver value for all the data centers. Any customizations done for the Specific data center mode are lost.
n Edit for specific Data Center - mode enables you to customize different cost driver values for different data centers. Any customizations done for All data centers mode are lost.
Note When you select Edit for specific data center as the edit mode, then the select data center option is enabled. Select the data center from the drop-down menu
4 Edit the monthly maintenance cost.
n Edit the percentage value of the hardware maintenance cost.
n Edit the percentage value of the operating system maintenance cost.
vRealize Operations Manager Configuration Guide
VMware, Inc. 131
5 Click Save.
Edit Monthly Cost of LaborYou can edit the monthly cost of labor for your cloud environment. You can set a total fixed cost for labor in vRealize Operations Manager. The total labor cost is divided across all the hosts present in the data center. The labor cost is combination of the total cost of the server administrator, virtual infrastructure administrator, and the operating system administrator.
Procedure
1 Click Administration and in the left pane click Configuration > Cost Settings.
2 In the Cost Driver tab, click Labor.
3 Select the required edit mode for changing the monthly labor cost.
n Edit for All Data centers - mode enables you to customize a single cost driver value for all the data centers. Any customizations done for the Specific data center mode are lost.
n Edit for specific Data Center - mode enables you to customize different cost driver values for different data centers. Any customizations done for All data centers mode are lost.
Note When you select Edit for specific data center as the edit mode, then the select data center option is enabled. Select the data center from the drop-down menu
4 Edit the monthly labor cost.
n Edit the detailed cost of labor.
n Edit the total monthly labor cost for servers, virtual infrastructure, and operating system.
The monthly labor cost is displayed.
Category Description
Category Displays the categories of labor cost, servers, virtual infrastructure, and operating system
Calculated by Displays whether the cost is calculated hourly or monthly.
Total Monthly Cost Displays the total monthly cost of the particular category
Reference Cost Displays the reference cost for the category from the cost drivers database
5 Click Save.
The total monthly cost is updated. The hourly rate option or the monthly cost option that you select is updated in the Calculated by column.
Edit Monthly Cost of the NetworkYou can edit the monthly cost for each Network Interface Controller (NIC) type or can edit the total cost of all the networking expenses associated with the cloud. You can now set a total fixed cost for network resources in vRealize Operations Manager. The total network cost is divided across all the hosts present in the data center.
vRealize Operations Manager Configuration Guide
VMware, Inc. 132
Procedure
1 Click Administration and in the left pane click Configuration > Cost Settings.
2 In the Cost Driver tab, click Network.
3 Select the required edit mode for changing the monthly network cost.
n Edit for All Data centers - mode enables you to customize a single cost driver value for all the data centers. Any customizations done for the Specific data center mode are lost.
n Edit for specific Data Center - mode enables you to customize different cost driver values for different data centers. Any customizations done for All data centers mode are lost.
Note When you select Edit for specific data center as the edit mode, then the select data center option is enabled. Select the data center from the drop-down menu
4 Edit the monthly cost of network.
n Modify the values for 1 Gigabit NIC, 10 Gigabit NIC, 25 Gigabit NIC, 40 Gigabit NIC, and the 100 Gigabit NIC.
n Modify the total monthly cost of all network expenses associated with the cloud.
5 Click Save.
The total monthly network expenses are updated.
Edit Monthly Cost of FacilitiesFor your cloud environment, you can specify the total monthly cost of facilities or edit the facilities cost for real estate, power, and cooling requirements. You can now set the total fixed cost for facilities in vRealize Operations Manager. The total facilities cost is divided across all the hosts present in the data center.
Procedure
1 Click Administration and in the left pane click Configuration > Cost Settings.
2 In the Cost Driver tab, click Facilities.
3 Select the required edit mode for changing the monthly facilities cost.
n Edit for All Data centers - mode enables you to customize a single cost driver value for all the data centers. Any customizations done for the Specific data center mode are lost.
n Edit for specific Data Center - mode enables you to customize different cost driver values for different data centers. Any customizations done for All data centers mode are lost.
4 (Optional) Select the data center from the drop-down menu.
Note If you select Edit for specific data center as the edit mode, then the select data center option is enabled.
vRealize Operations Manager Configuration Guide
VMware, Inc. 133
5 Edit the monthly facilities cost.
n Modify the cost of rent or real estate per rack unit and modify the monthly cost of power and cooling per kilowatt-hour.
n Modify the total monthly cost of facilities.
6 Click Save.
The monthly facilities cost is updated.
Editing Additional CostsThe additional cost lets you add any additional or extra expense that is not covered by other expenses categorized by vRealize Operations Manager. No reference value is present for this expense.
Procedure
1 Click Administration and in the left pane click Configuration > Cost Settings.
2 In the Cost Driver tab, click Additonal Costs.
3 Enter or select the cost type for the expenses.
Note As a first time user, you must enter the cost type values manually. The values get saved and appear for all future selections.
4 Select the Entity Type and Entity Selection.
The Entity Count gets updated automatically.
5 Enter the Monthly Cost per entity .
The Total Cost per month gets computed automatically.
6 Click Save.
Edit Application CostvRealize Operations Manager allows you to edit the application cost of an application present in your cloud environment. You can only modify the cost associated with the application, as all the other attributes are predefined.
Prerequisites
Create applications in vRealize Operations Manager.
Procedure
1 In the menu, click Administration and in the left pane click Configuration > Cost Settings.
2 In the Cost Drivers tab, click Applications.
3 Click the edit icon next to the application cost you want to edit.
4 Modify the cost of the application.
5 Click Save.
vRealize Operations Manager Configuration Guide
VMware, Inc. 134
Cluster Cost OverviewvRealize Operations Manager calculates the base rates of CPU and memory so that they can be used for the virtual machine cost computation. Base rates are determined for each cluster, which are homogeneous provisioning groups. As a result, base rates might change across clusters, but are the same within a cluster.
1 vRealize Operations Manager first arrives at the fully loaded cost of the cluster from the cost drivers. After the cost of a cluster is determined, this cost is split into CPU and memory costs based on the industry standard cost ratios for the different models of the server.
2 The CPU base rate is first computed by dividing the CPU cost of the cluster by the CPU capacity of the cluster. CPU base rate is then prorated by dividing the CPU base rate by expected CPU use percentage to arrive at a true base rate for charging the virtual machines.
3 The memory base rate is first computed by dividing the memory cost of the cluster by the memory capacity of the cluster. Memory base rate is then prorated by dividing the memory base rate by expected memory use percentage to arrive at true base rate for charging the virtual machines.
4 You can either provide the expected CPU and memory use or you can use the actual CPU and memory usage values.
Cluster Cost Elements Calculation
Total Compute Cost Total Compute Cost = (Total Infrastructure cost, which is a sum of all cost drivers) – (Storage cost) – (Direct VM cost, which is sum of OS labor, VM labor and any Windows Desktop licenses).
Expected CPU and Memory use
Expected CPU and Memory use = These percentages are arrived based on historical actual use of clusters.
Per GHz CPU base rate
Per GHz CPU base rate = (Cost attributed to CPU out of Total compute cost) / (Expected CPU Utilization * Cluster CPU Capacity in gHZ).
Per GB RAM base rate Per GB RAM base rate = (Cost attributed to RAM out of Total compute cost) / (Expected Memory Utilization * Cluster RAM Capacity in GB).
Average CPU Utilization
Average CPU Utilization = (Cost attributed to CPU utilization of VMs in a cluster, out of Total compute cost) / (Total number of VMs in the cluster).
Average Memory Utilization
Average Memory Utilization = (Cost attributed to Memory utilization of VMs in a cluster, out of Total compute cost) / (Total number of VMs in the cluster).
Expected CPU Utilization
The utilization percentage level of CPU that the cluster is expected to operate.
Note When you select actual utilization as the cost calculation mode, the cost engine by default rounds off the actual utilization value in multiples of five or to the nearest value.
Expected Memory Utilization
The utilization percentage level of Memory that the cluster is expected to operate.
Note When you select actual utilization as the cost calculation mode, the cost engine by default rounds off the actual utilization value in multiples of five or to the nearest value.
vRealize Operations Manager Configuration Guide
VMware, Inc. 135
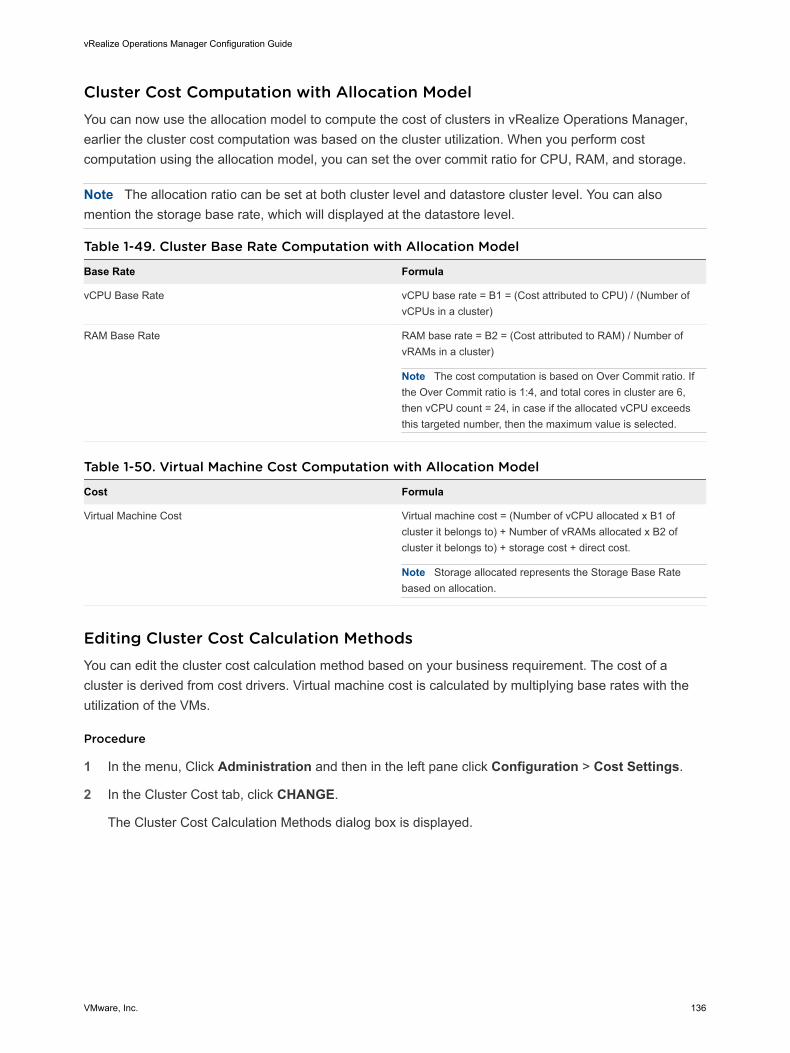
Cluster Cost Computation with Allocation ModelYou can now use the allocation model to compute the cost of clusters in vRealize Operations Manager, earlier the cluster cost computation was based on the cluster utilization. When you perform cost computation using the allocation model, you can set the over commit ratio for CPU, RAM, and storage.
Note The allocation ratio can be set at both cluster level and datastore cluster level. You can also mention the storage base rate, which will displayed at the datastore level.
Table 1-49. Cluster Base Rate Computation with Allocation Model
Base Rate Formula
vCPU Base Rate vCPU base rate = B1 = (Cost attributed to CPU) / (Number of vCPUs in a cluster)
RAM Base Rate RAM base rate = B2 = (Cost attributed to RAM) / Number of vRAMs in a cluster)
Note The cost computation is based on Over Commit ratio. If the Over Commit ratio is 1:4, and total cores in cluster are 6, then vCPU count = 24, in case if the allocated vCPU exceeds this targeted number, then the maximum value is selected.
Table 1-50. Virtual Machine Cost Computation with Allocation Model
Cost Formula
Virtual Machine Cost Virtual machine cost = (Number of vCPU allocated x B1 of cluster it belongs to) + Number of vRAMs allocated x B2 of cluster it belongs to) + storage cost + direct cost.
Note Storage allocated represents the Storage Base Rate based on allocation.
Editing Cluster Cost Calculation MethodsYou can edit the cluster cost calculation method based on your business requirement. The cost of a cluster is derived from cost drivers. Virtual machine cost is calculated by multiplying base rates with the utilization of the VMs.
Procedure
1 In the menu, Click Administration and then in the left pane click Configuration > Cost Settings.
2 In the Cluster Cost tab, click CHANGE.
The Cluster Cost Calculation Methods dialog box is displayed.
vRealize Operations Manager Configuration Guide
VMware, Inc. 136
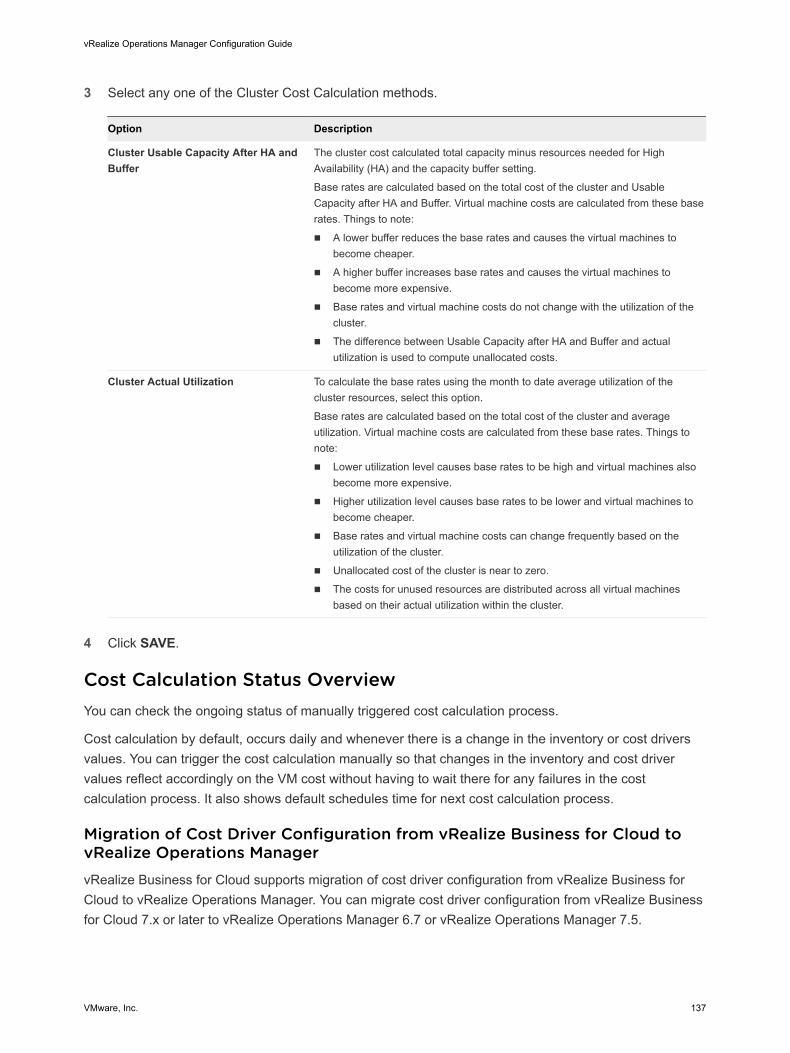
3 Select any one of the Cluster Cost Calculation methods.
Option Description
Cluster Usable Capacity After HA and Buffer
The cluster cost calculated total capacity minus resources needed for High Availability (HA) and the capacity buffer setting.
Base rates are calculated based on the total cost of the cluster and Usable Capacity after HA and Buffer. Virtual machine costs are calculated from these base rates. Things to note:
n A lower buffer reduces the base rates and causes the virtual machines to become cheaper.
n A higher buffer increases base rates and causes the virtual machines to become more expensive.
n Base rates and virtual machine costs do not change with the utilization of the cluster.
n The difference between Usable Capacity after HA and Buffer and actual utilization is used to compute unallocated costs.
Cluster Actual Utilization To calculate the base rates using the month to date average utilization of the cluster resources, select this option.
Base rates are calculated based on the total cost of the cluster and average utilization. Virtual machine costs are calculated from these base rates. Things to note:
n Lower utilization level causes base rates to be high and virtual machines also become more expensive.
n Higher utilization level causes base rates to be lower and virtual machines to become cheaper.
n Base rates and virtual machine costs can change frequently based on the utilization of the cluster.
n Unallocated cost of the cluster is near to zero.
n The costs for unused resources are distributed across all virtual machines based on their actual utilization within the cluster.
4 Click SAVE.
Cost Calculation Status OverviewYou can check the ongoing status of manually triggered cost calculation process.
Cost calculation by default, occurs daily and whenever there is a change in the inventory or cost drivers values. You can trigger the cost calculation manually so that changes in the inventory and cost driver values reflect accordingly on the VM cost without having to wait there for any failures in the cost calculation process. It also shows default schedules time for next cost calculation process.
Migration of Cost Driver Configuration from vRealize Business for Cloud to vRealize Operations ManagervRealize Business for Cloud supports migration of cost driver configuration from vRealize Business for Cloud to vRealize Operations Manager. You can migrate cost driver configuration from vRealize Business for Cloud 7.x or later to vRealize Operations Manager 6.7 or vRealize Operations Manager 7.5.
vRealize Operations Manager Configuration Guide
VMware, Inc. 137
For more information about the migration process, see the KB article https://kb.vmware.com/s/article/55785.
vRealize Automation 7.xvRealize Automation 7.x extends operational management capabilities of the vRealize Operations Manager platform to provide tenant-aware operational visibility of the cloud infrastructure.
vRealize Automation 7.x enables you as a cloud provider to monitor the health and capacity risk of your cloud infrastructure in the context of the tenant's business groups.
You can use vRealize Automation 7.x to perform some of the following key tasks:
n To gain visibility into the performance and health of the tenant’s business groups that the underlying cloud infrastructure supports.
n To minimize the time taken to troubleshoot, if there is a tenant workload or an underlying infrastructure problem. vRealize Automation 7.x provides visibility into the impact to performance, health, and capacity risk of the business groups because of an operational problem in the underlying cloud infrastructure layer.
n To manage the placements of VMs that are part of the clusters managed by vRealize Automation.
n To view capacity for tenants, business groups, and reservations. From the menu, select Administration and then in the left pane, select Inventory. Select the Objects tab in the right pane. By default, the usage capacity model is enabled for these objects. You can enable the allocation model from the policy settings.
Supported vRealize Automation VersionsvRealize Operations Manager 8.x is supported with vRealize Automation 7.0 versions. Workload placement for day 1 operations is supported from vRealize Automation 7.3 onwards with vRealize Operations Manager 6.6 and above. Workload placement for day 2 operations is supported from vRealize Automation 7.5 onwards with vRealize Operations Manager 7.0 and above.
If you upgrade from a previous version to vRealize Operations Manager 8.0, vRealize Automation Management Pack is upgraded to 8.0.
Object Types and RelationshipsvRealize Automation 7.x brings in cloud constructs and their relationships from vRealize Automation into vRealize Operations Manager for operational analysis.
You can use the following items in the virtual infrastructure as object types in vRealize Operations Manager.
n Tenant
n Reservation
n Business Group
vRealize Operations Manager Configuration Guide
VMware, Inc. 138
n Deployment
n Blueprint
n Managed Resources
n Reservation Policy
n Virtual Machine
n Datastore
n vRealize Automation World
n vRealize Automation Management Pack Instance
n User
You can view the different users from the Inventory > List tab. The user object type has a relationship with VMs, deployments, and business groups.
Objects types in an enterprise environment are related to other objects types in that environment. Object types are either part of a larger object type, or they contain smaller component objects, or both. When you select a parent object type, vRealize Operations Manager shows any related child objects types.
Table 1-51. Relationship Model
Relationship View Parent-Child Relationship Between Objects
vRealize Automation Tenant View Tenant > Business Group > Reservation
vRealize Automation App View Tenant > Blueprint > Deployment > VM
vRealize Automation Custom Data Center View CDC > Cluster > Host > VM
vRealize Automation Reservation Policy View Reservation Policy > Reservation > VM
vRealize Automation Virtual Machine View Tenant > Business group > Deployment > VM
vRealize Automation Workload PlacementYou can enable workload placement when you add vRealize Operations Manager 6.6 as an endpoint in vRealize Automation 7.3. You cannot enable workload placement by adding a version of vRealize Operations Manager that is previous to version 6.6, as an endpoint in vRealize Automation 7.3.
To add vRealize Operations Manager as an endpoint in vRealize Automation 7.3, complete the following steps.
Procedure
1 Log in to vRealize Automation as a tenant user.
2 Select Infrastructure > Endpoint > Endpoints.
3 Select New > Management > vRealize Operations Manager.
4 Enter the general information for the vRealize Operations Manager endpoint.
5 Click OK.
vRealize Operations Manager Configuration Guide
VMware, Inc. 139
Port InformationIn environments where strict firewalls are in place, specific ports must be open for vRealize Automation 7.x to retrieve data from vRealize Operations Manager.
n vRealize Automation CAFÉ Appliance/VIP URL on port 443
n vRealize Automation IAAS URL on port 443
n vRealize Automation SSO URL on port 7444
Note vRealize Automation 7.x supports only vCenter objects used and managed by vRealize Automation. No other object kinds such as AWS or Openstack resources are supported currently.
Security GuidelinesSolutions in vRealize Operations Manager execute independently. They execute within a common runtime environment within the vRealize Operations Manager collector host.
Java language security protects the adapters from interference with other adapters. All adapters execute within the common JRE process trust zone. You must only load and use adapters that you obtain from a publisher you trust and only after you verify the adapter's code integrity before loading into vRealize Operations Manager.
Even though adapters execute independently, they can make configuration changes to the collector host or Java runtime environment that can affect the security of other adapters. For example, at installation time an adapter can modify the list of trusted certificates. During execution an adapter can change the TLS/SSL certificate validation scheme and thereby change how other adapters validate certificates. The vRealize Operations Manager system and collector hosts do not isolate adapters beyond the natural isolation provided by Java execution. The system trusts all adapters equally.
Adapters are responsible for their own data security. When they collect data or make configuration changes to data sources, each adapter provides its own mechanisms and guarantees with regard to the confidentiality, integrity, and authenticity of the collected data.
vRealize Automation 7.x enforces certificate checks when communicating with the vRealize Automation servers. These certificates are presented when the user clicks the Test button on the Adapter Instance setup page. Once these certificates are accepted by the user, they are associated with that adapter instance. Any communication to the vRealize Automation servers ensures that the certificates presented by the servers match the ones accepted by the user.
Configuring vRealize AutomationYou can configure an instance of vRealize Automation from which you are collecting data.
Prerequisites
n The super user must have the following privileges:
n Infrastructure administrator rights for all tenants.
n Infrastructure architect rights for all tenants.
vRealize Operations Manager Configuration Guide
VMware, Inc. 140
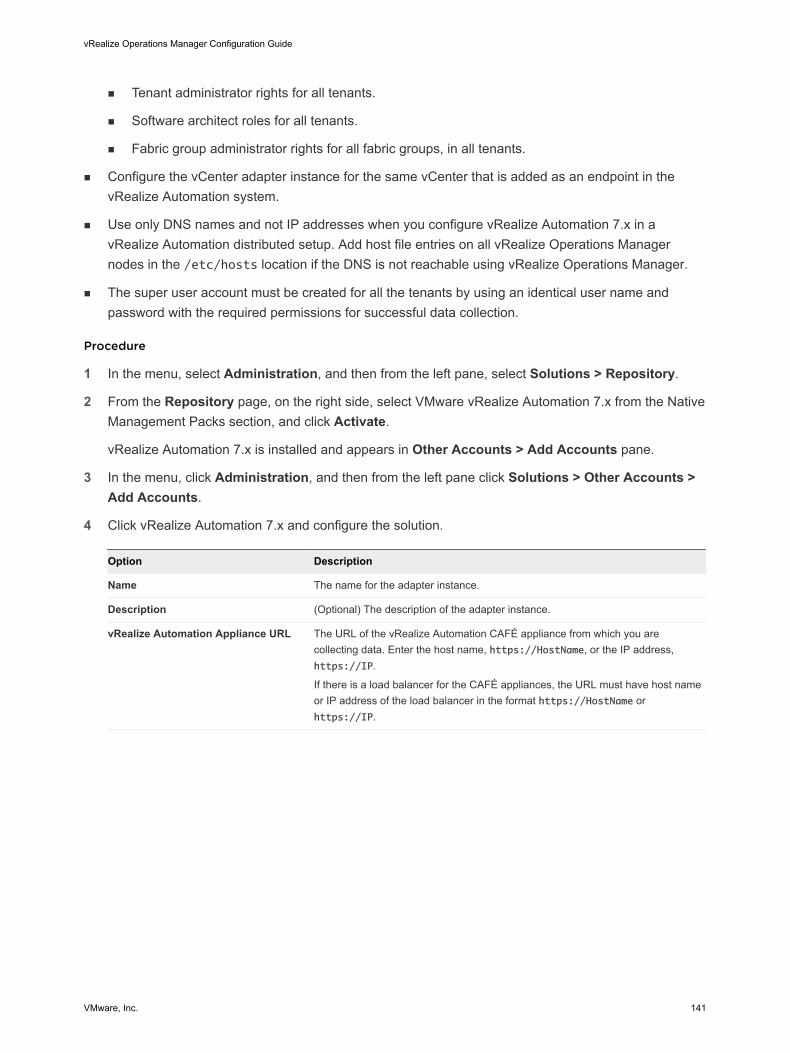
n Tenant administrator rights for all tenants.
n Software architect roles for all tenants.
n Fabric group administrator rights for all fabric groups, in all tenants.
n Configure the vCenter adapter instance for the same vCenter that is added as an endpoint in the vRealize Automation system.
n Use only DNS names and not IP addresses when you configure vRealize Automation 7.x in a vRealize Automation distributed setup. Add host file entries on all vRealize Operations Manager nodes in the /etc/hosts location if the DNS is not reachable using vRealize Operations Manager.
n The super user account must be created for all the tenants by using an identical user name and password with the required permissions for successful data collection.
Procedure
1 In the menu, select Administration, and then from the left pane, select Solutions > Repository.
2 From the Repository page, on the right side, select VMware vRealize Automation 7.x from the Native Management Packs section, and click Activate.
vRealize Automation 7.x is installed and appears in Other Accounts > Add Accounts pane.
3 In the menu, click Administration, and then from the left pane click Solutions > Other Accounts > Add Accounts.
4 Click vRealize Automation 7.x and configure the solution.
Option Description
Name The name for the adapter instance.
Description (Optional) The description of the adapter instance.
vRealize Automation Appliance URL The URL of the vRealize Automation CAFÉ appliance from which you are collecting data. Enter the host name, https://HostName, or the IP address, https://IP.
If there is a load balancer for the CAFÉ appliances, the URL must have host name or IP address of the load balancer in the format https://HostName or https://IP.
vRealize Operations Manager Configuration Guide
VMware, Inc. 141
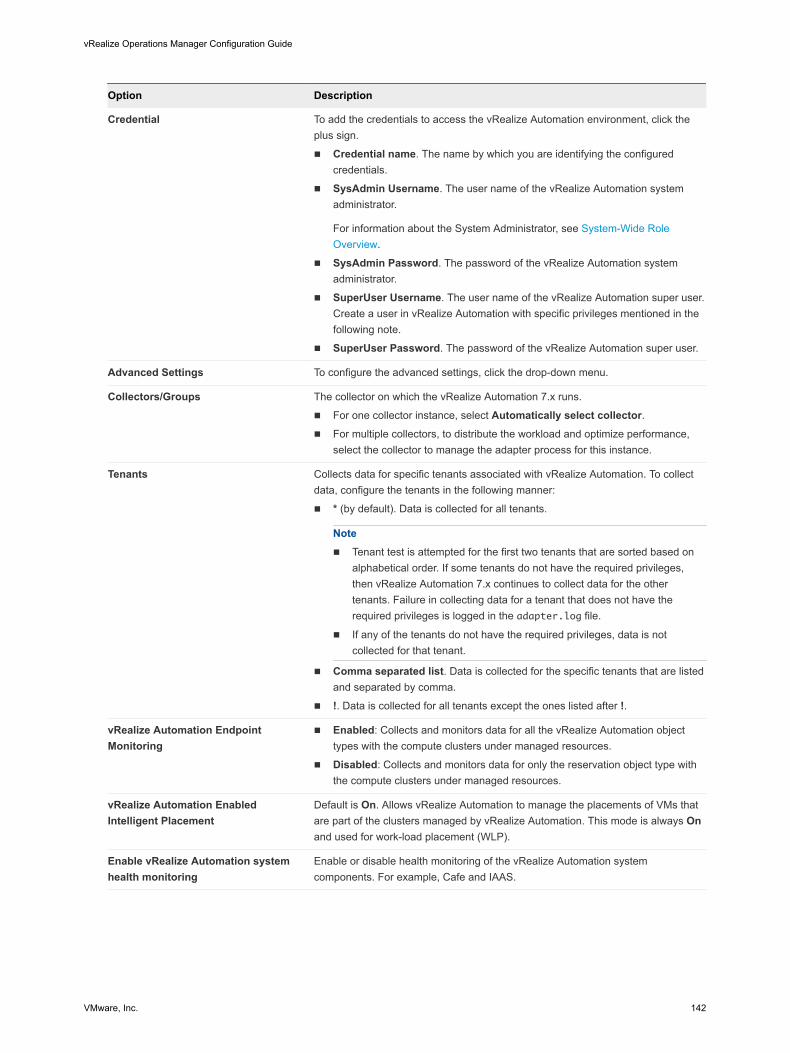
Option Description
Credential To add the credentials to access the vRealize Automation environment, click the plus sign.
n Credential name. The name by which you are identifying the configured credentials.
n SysAdmin Username. The user name of the vRealize Automation system administrator.
For information about the System Administrator, see System-Wide Role Overview.
n SysAdmin Password. The password of the vRealize Automation system administrator.
n SuperUser Username. The user name of the vRealize Automation super user. Create a user in vRealize Automation with specific privileges mentioned in the following note.
n SuperUser Password. The password of the vRealize Automation super user.
Advanced Settings To configure the advanced settings, click the drop-down menu.
Collectors/Groups The collector on which the vRealize Automation 7.x runs.
n For one collector instance, select Automatically select collector.n For multiple collectors, to distribute the workload and optimize performance,
select the collector to manage the adapter process for this instance.
Tenants Collects data for specific tenants associated with vRealize Automation. To collect data, configure the tenants in the following manner:
n * (by default). Data is collected for all tenants.
Note n Tenant test is attempted for the first two tenants that are sorted based on
alphabetical order. If some tenants do not have the required privileges, then vRealize Automation 7.x continues to collect data for the other tenants. Failure in collecting data for a tenant that does not have the required privileges is logged in the adapter.log file.
n If any of the tenants do not have the required privileges, data is not collected for that tenant.
n Comma separated list. Data is collected for the specific tenants that are listed and separated by comma.
n !. Data is collected for all tenants except the ones listed after !.
vRealize Automation Endpoint Monitoring
n Enabled: Collects and monitors data for all the vRealize Automation object types with the compute clusters under managed resources.
n Disabled: Collects and monitors data for only the reservation object type with the compute clusters under managed resources.
vRealize Automation Enabled Intelligent Placement
Default is On. Allows vRealize Automation to manage the placements of VMs that are part of the clusters managed by vRealize Automation. This mode is always On and used for work-load placement (WLP).
Enable vRealize Automation system health monitoring
Enable or disable health monitoring of the vRealize Automation system components. For example, Cafe and IAAS.
vRealize Operations Manager Configuration Guide
VMware, Inc. 142
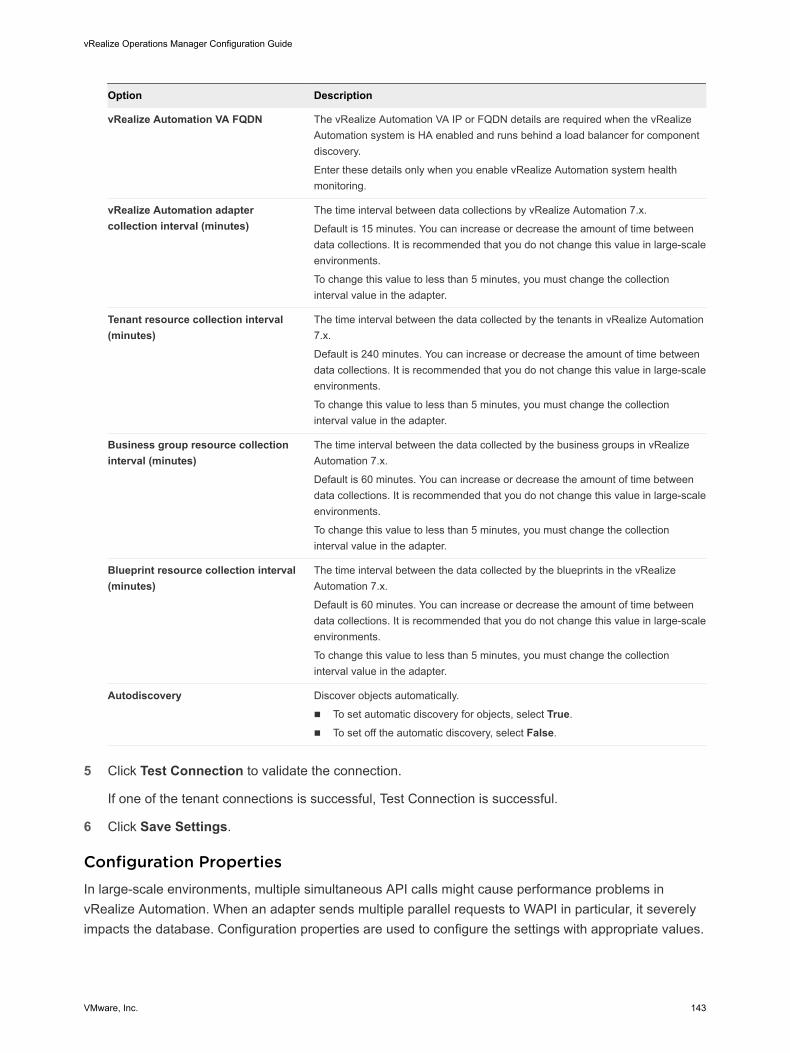
Option Description
vRealize Automation VA FQDN The vRealize Automation VA IP or FQDN details are required when the vRealize Automation system is HA enabled and runs behind a load balancer for component discovery.
Enter these details only when you enable vRealize Automation system health monitoring.
vRealize Automation adapter collection interval (minutes)
The time interval between data collections by vRealize Automation 7.x.
Default is 15 minutes. You can increase or decrease the amount of time between data collections. It is recommended that you do not change this value in large-scale environments.
To change this value to less than 5 minutes, you must change the collection interval value in the adapter.
Tenant resource collection interval (minutes)
The time interval between the data collected by the tenants in vRealize Automation 7.x.
Default is 240 minutes. You can increase or decrease the amount of time between data collections. It is recommended that you do not change this value in large-scale environments.
To change this value to less than 5 minutes, you must change the collection interval value in the adapter.
Business group resource collection interval (minutes)
The time interval between the data collected by the business groups in vRealize Automation 7.x.
Default is 60 minutes. You can increase or decrease the amount of time between data collections. It is recommended that you do not change this value in large-scale environments.
To change this value to less than 5 minutes, you must change the collection interval value in the adapter.
Blueprint resource collection interval (minutes)
The time interval between the data collected by the blueprints in the vRealize Automation 7.x.
Default is 60 minutes. You can increase or decrease the amount of time between data collections. It is recommended that you do not change this value in large-scale environments.
To change this value to less than 5 minutes, you must change the collection interval value in the adapter.
Autodiscovery Discover objects automatically.
n To set automatic discovery for objects, select True.
n To set off the automatic discovery, select False.
5 Click Test Connection to validate the connection.
If one of the tenant connections is successful, Test Connection is successful.
6 Click Save Settings.
Configuration PropertiesIn large-scale environments, multiple simultaneous API calls might cause performance problems in vRealize Automation. When an adapter sends multiple parallel requests to WAPI in particular, it severely impacts the database. Configuration properties are used to configure the settings with appropriate values.
vRealize Operations Manager Configuration Guide
VMware, Inc. 143
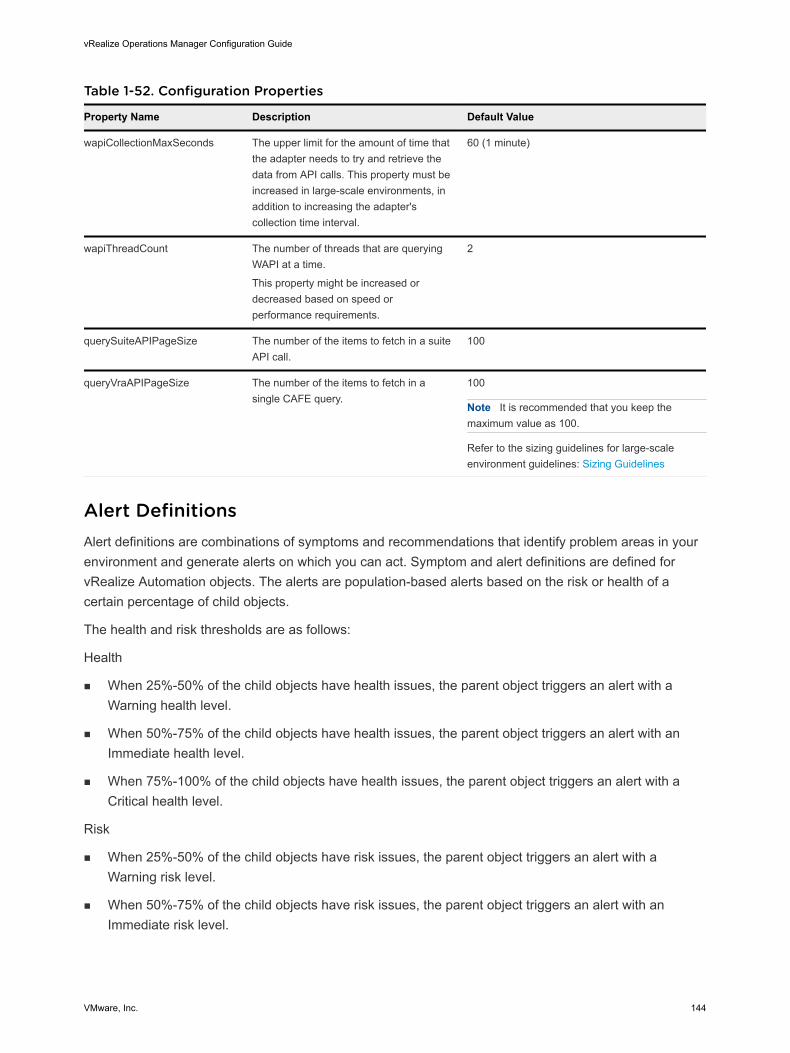
Table 1-52. Configuration Properties
Property Name Description Default Value
wapiCollectionMaxSeconds The upper limit for the amount of time that the adapter needs to try and retrieve the data from API calls. This property must be increased in large-scale environments, in addition to increasing the adapter's collection time interval.
60 (1 minute)
wapiThreadCount The number of threads that are querying WAPI at a time.
This property might be increased or decreased based on speed or performance requirements.
2
querySuiteAPIPageSize The number of the items to fetch in a suite API call.
100
queryVraAPIPageSize The number of the items to fetch in a single CAFE query.
100
Note It is recommended that you keep the maximum value as 100.
Refer to the sizing guidelines for large-scale environment guidelines: Sizing Guidelines
Alert DefinitionsAlert definitions are combinations of symptoms and recommendations that identify problem areas in your environment and generate alerts on which you can act. Symptom and alert definitions are defined for vRealize Automation objects. The alerts are population-based alerts based on the risk or health of a certain percentage of child objects.
The health and risk thresholds are as follows:
Health
n When 25%-50% of the child objects have health issues, the parent object triggers an alert with a Warning health level.
n When 50%-75% of the child objects have health issues, the parent object triggers an alert with an Immediate health level.
n When 75%-100% of the child objects have health issues, the parent object triggers an alert with a Critical health level.
Risk
n When 25%-50% of the child objects have risk issues, the parent object triggers an alert with a Warning risk level.
n When 50%-75% of the child objects have risk issues, the parent object triggers an alert with an Immediate risk level.
vRealize Operations Manager Configuration Guide
VMware, Inc. 144
n When 75%-100% of the child objects have risk issues, the parent object triggers an alert with a Critical risk level.
vRealize Automation 8.XThe vRealize Automation 8.x extends operational management capabilities of the vRealize Operations Manager platform to provide the cloud aware operational visibility of the cloud infrastructure. The vRealize Automation 8.x enables you to monitor the health, efficiency, and capacity risks associated with the imported cloud accounts.
You can use the vRealize Automation 8.x to perform some of the following key tasks:
n Gain visibility into the performance and health of cloud zones integrated with vRealize Operations Manager.
n Import and synchronize existing cloud accounts from vRealize Automation 8.x to vRealize Operations Manager.
n Manage the workload placement of VMs that are part of the clusters managed by vRealize Automation 8.x.
n Integrate and troubleshoot vSphere endpoint issues associated with vRealize Automation 8.x using the vRealize Operations Manager dashboard.
Note In this release we support only vSphere endpoints.
Supported VersionsvRealize Automation 8.x is supported on vRealize Operations Manager 8.0 version. Workload placement for day 1 operations is supported from vRealize Automation 7.3 onwards with vRealize Operations Manager 6.6 and above. Workload placement for day 2 operations is supported from vRealize Automation 7.5 onwards with vRealize Operations Manager 7.0 and above.
Object TypesvRealize Automation 8.x brings in cloud accounts and their relationships from vRealize Automation into vRealize Operations Manager for operational analysis. You can use the following items in the virtual infrastructure as object types in vRealize Operations Manager.
n Cloud Zone
n Blueprint
n Project
n Deployment
n Cloud Account
n User
n Organization
vRealize Operations Manager Configuration Guide
VMware, Inc. 145
n Cloud Automation Services World
Workload PlacementIn vRealize Operations Manager, you can configure vRealize Automation 8.x instances to work with vRealize Operations Manager instances. Using vRealize Operations Manager you can monitor the placement of existing workloads and optimize the resource usage.
Prerequisites
n Verify that the user has privileges of Organizational Owner and Cloud Assembly Administrator set in vRealize Automation.
n You must know the vCenter Server credentials and have the necessary permissions to connect and collect data.
n Verify that vRealize Automation 8.x is enabled from Administration > Management > Integrations in vRealize Operations Manager. For more information, see Configuring VMware vRealize Automation 8.x with vRealize Operations Manager.
n vRealize Operations Manager must have the same vCenter Cloud Account configured to match with vRealize Automation 8.x.
n Ensure that integration is enabled for vRealize Operations Manager and vRealize Automation 8.x.
Procedure
1 In the menu, select Home and then select Workload Optimization.
2 Click the View filter drop-down menu and select the VRA Managed objects.
All the Cloud Zones related to the vCenter Server are displayed in vRealize Operations Manager.
3 Click the Cloud Zone you want to optimize.
4 Based on the operational intent, click Optimize Now.
The system creates an optimization plan, which depicts BEFORE and (projected) AFTER workload statistics for the optimization action.
5 If you are satisfied with the projected results of the optimization action, click NEXT.
6 Review the optimization moves, then click BEGIN ACTION.
In the scope of vRealize Automation 8.x integration, vRealize Operations Manager sends a move migration request directly to vRealize Automation 8.x. In the earlier versions, the migration request was sent to the vCenter Server.
vRealize Operations Manager Configuration Guide
VMware, Inc. 146
What to do next
To verify that the optimization action is complete, select Administration on the top menu, and click History > Recent Tasks in the left pane. In the Recent Tasks page, use the Status function on the menu bar to locate your action by its status. You can also search using a range of filters. For example, first filter on Starting Time and scroll to the time when you began the action, then select the Object Name filter. Finally, enter the name of one of the VMs in the rebalance plan.
Pricing for vRealize Automation 8.x Components in vRealize Operations ManagerAfter you integrate vRealize Automation 8.x private cloud adapter instances with vRealize Operations Manager, you can calculate the cost of deployments, projects, and virtual machines of the selected cloud adapter. Pricing provides an overview of the costs related to the cloud environment, cloud resources, and the costs associated with the project.
How the Pricing Works in vRealize Automation 8.xn vRealize Operations Manager understands the constructs defined in vRealize Automation 8.x and
calculates the CPU, RAM, Storage and Additional prices for Projects, Deployments, and virtual machines.
n A single project can have multiple deployments and a single deployment can have multiple virtual machines associated with the deployment.
n Pricing for multiple virtual machines associated with the deployment is the sum of all the resources associated with individual virtual machines.
n If a single project has multiple deployments, then the project pricing is equal to the sum of individual deployments, the deployment can have multiple virtual machines and resources associated with it.
n On day one, the pricing is equal to the cost of resources defined in vRealize Operations Manager.
n On day two, the price is calculated using the following formula.
n Cost of resources for the present day – Cost of resources for the previous day
n If in case the pricing does not happen as per the definition, then the partial price is set to true, and the pricing is calculated based on the previous days price.
n In vRealize Operations Manager, the following new dashboards are included to view the pricing details for the vRealize Automation 8.x instances.
n Cloud Automation Environment Overview
n Cloud Automation Project Cost Overview
n Cloud Automation Resource Consumption Overview
n Cloud Automation Top-N Dashboard
Note If the user wants to view the cost from the vRealize Automation 8.x side, then you must integrate vRealize Operations Manager with vRealize Automation 8.x.
vRealize Operations Manager Configuration Guide
VMware, Inc. 147
Configuring VMware vRealize Automation 8.x with vRealize Operations ManagerTo access vRealize Automation 8.x instance and troubleshoot automation issues using vRealize Operations Manager, you must configure the vRealize Automation adapter in vRealize Operations Manager.
Prerequisites
n Verify that you know the FQDN/IP address, user name, and password of the vRealize Automation instance you have installed.
Procedure
1 In the VMware vRealize Automation 8.x page, enter the FQDN or IP address of the vRealize Automation 8.x instance to which you are connecting.
Note When you configure a Cloud Automation Services adapter, you must specify only the FQDN value.
2 To add credentials, click the plus sign.
a In the Credential name text box, enter the name by which you are identifying the configured credentials.
b Enter the user name and password for the VMware vRealize Automation instance.
c Click OK.
You have configured credentials to connect to a VMware vRealize Automation instance.
3 From the Collectors/Groups drop-down menu, select the collector group.
4 Click Test Connection to verify that the connection is successful.
5 Review and accept the Server certificate.
6 Click Advanced Settings and set Auto Discovery to true.
7 Click Add to save the adapter instance.
After integrating vRealize Automation adapter instance with vRealize Operations Manager, you can view the vRealize Automation adapter data from the vRealize Operations Manager dashboard.
Support for Cloud Automation Services Instance in vRealize Operations ManagerThe vRealize Operations Manager extends operational management capabilities to Cloud Automation Services Management Pack, using vRealize Operations Manager you can retrieve cloud accounts, cloud zones, projects, blueprints, deployment, and virtual machines associated with vRealize Automation 8.x.
vRealize Operations Manager Configuration Guide
VMware, Inc. 148

The Cloud Automation Services Management Pack provides information about some of the following key tasks:
n Integrate vRealize Operations Manager specific workload placement engine with vRealize Automation 8.x workload provisioning and management engine for the optimal placement of resources. For more information, see Configuring VMware vRealization Automation 8.x with vRealize Operations Manager.
n View Cloud Automation dashboards to monitor and troubleshoot objects in your cloud infrastructure.
n Verify that the existing cloud accounts from vRealize Automation 8.x are imported to vRealize Operations Manager.
n View the inventory details of vRealize Automation 8.x objects discovered in vRealize Operations Manager.
n Retrieve cloud zones defined in VMware Cloud Automation Services (CAS) into vRealize Operations Manager.
Note The Cloud Zones option is hidden from the user until the integration with vRealize Automation 8.x is enabled from the integration page under Administration > Management.
Cloud Zones in vRealize Operations ManagerCloud zones enable you to group a set of compute resources and assign capability tags to the zone. The cloud zone is based on accounts/regions, so you must have at least one cloud account configured before you can create a cloud zone. Cloud zones define where and how blueprints configure deployments. You can have one or many cloud zones assigned to each project based on priority and limits.
How Cloud Zones WorkAfter you integrate vRealize Automation 8.x with vRealize Operations Manager, you can retrieve cloud zones into vRealize Operations Manager. The Cloud Zones option is hidden from the user until the integration with vRealize Automation 8.x is enabled from the integration page under Administration > Management.
The Cloud Zones option is enabled in vRealize Operations Manager, only if the following conditions are met.
n vRealize Automation 8.x instance is integrated successfully in vRealize Operations Manager Administration > Management>Integrations.
n vRealize Automation 8.x objects are discovered in vRealize Operations Manager.
n vRealize Automation 8.x accounts and vRealize Operations vCenter Cloud Accounts are synchronized.
All the Cloud Zone objects which are existing in vRealize Automation 8.x environment, are discovered in vRealize Operations Manager. Cloud zones, whose dependent clusters are not discovered in vRealize Operations Manager, are not represented in Capacity Overview, Reclaim, and Workload Optimization pages.
vRealize Operations Manager Configuration Guide
VMware, Inc. 149
Cloud Zones ListYou can view the list of cloud zones that exist in your environment. In this view, you can click a cloud zone to display all the resources and objects that are associated with the cloud account. When you click the Cloud Zone, you are directed to the standard object summary page of the cloud account.
Where You Find Cloud Zones
Select Environment in the menu and click Cloud Zones tab.
Cloud Zone Tab Options
Option Description
Name Displays the name of the selected cloud zone.
Cloud Account Displays the cloud accounts associated with the cloud zone.
Resources Displays the cloud account resources associated with the cloud zone.
Note If the resource field is empty, it means vRealize Operations Manager does not have a corresponding vCenter Cloud Account for that associated Cloud Zone. Add a new vCenter Cloud Account manually or use the Import Cloud Account option from the Cloud Account page.
Capability Tags Displays the capability tags associated wit the cloud zone.
vSANYou can make vSAN operational in a production environment by using dashboards to evaluate, manage, and optimize the performance of vSAN objects and vSAN-enabled objects in your vCenter Server system.
vSAN extends the following features:
n Discovers vSAN disk groups in a vSAN datastore.
n Identifies the vSAN-enabled cluster compute resource, host system, and datastore objects in a vCenter Server system.
n Automatically adds related vCenter Server components that are in the monitoring state.
n Support for vSAN datastores in workload optimization with cross-cluster rebalance actions.
n You can move VMs from one vSAN datastore to another vSAN datastore.
n You can optimize the container if all the vSAN clusters are not in resync state.
n VMs with different storage policies for each disk or VMs with different types of storage for each disk will not be moved.
n You can generate a rebalance plan only if sufficient disk space is available at the destination vSAN datastore (The vSAN datastore slack space will also be considered).
n The storage policy assigned to the VM will be considered during the workload optimization (Compatibility check is performed against the storage policy).
vRealize Operations Manager Configuration Guide
VMware, Inc. 150
n VM migration from vSAN datastore to vSAN stretched clusters is not supported.
Configure a vSAN Adapter InstanceWhen configuring an adapter instance for vSAN, you add credentials for a vCenter Server. In the earlier versions of vRealize Operations Manager, the vSAN solution was installed as part of the vRealize Operations Manager installation. Now, in case of a new installation the vSAN solution is pre-bundled as part of vRealize Operations Manager OVF, you must install the vSAN solution separately.
Prerequisites
Only vCenter Server systems that are configured for both the vCenter adapter and the vSAN adapter appear in the inventory tree under the vSAN and Storage Devices. Verify that the vCenter Server that you use to configure the vSAN adapter instance is also configured as a vCenter adapter instance for the VMware vSphere® solution. If not, add a vCenter adapter instance for that vCenter Server.
You must open port 5989 between the host and any vRealize Operations Manager node on which the vSAN adapter resides. This is applicable when the vSAN version in vSphere is 6.6 or lower.
You must have a vCenter Adapter instance configured and monitoring the same vCenter Server that is used to monitor the vSAN and Storage Devices.
To know how to install the Native Management Packs, see Solutions Repository Page.
Procedure
1 In the menu, select Administration and then select Solutions > Cloud Accounts from the left panel.
2 From the Cloud Accounts page, select the vCenter Server instance from the list and then click the vSAN tab.
3 To use the vCenter Server for enabling vSAN, move the vSAN configuraton option to the right.
Note Once vSAN adapter instance is enabled and saved, the enable vSAN configuration option is not visible.
4 The credentials provided for the vCenter Server instance are also used for vSAN adapter instance. If you do not want to use these credentials, you can click Use alternate credentials option.
a Click the plus sign next to the Credential field and enter the details in the Manage Credentials dialog box.
b Enter the credential name, vCenter user name, and password and click OK.
5 Choose Enable SMART data collection, to enable SMART data collection for physical disk devices.
6 Click Add.
The vSAN configuration is enabled for the cloud account.
7 Click Test Connection to validate the connection with your vCenter Server instance.
8 Accept the vCenter Server security certificate.
vRealize Operations Manager Configuration Guide
VMware, Inc. 151
9 Click Save Settings.
The adapter is added to the Adapter Instance list and is active.
What to do next
To verify that the adapter is configured and collecting data from vSAN objects, wait a few collection cycles, then view application-related data.
n Inventory. Verify that all the objects related to the vSAN instance are listed. Objects should be in the collecting state and receiving data.
n Dashboards. Verify that vSAN Capacity Overview, Migrate to vSAN, vSAN Operations Overview, and Troubleshoot vSAN, are added to the default dashboards.
n Under Environment > vSAN and Storage Devices, verify that the vSAN hierarchy includes the following related vCenter Server system objects:
n vSAN World
n Cache Disk
n Capacity Disk
n vSAN-enabled vCenter Server clusters
n vSAN Fault Domains (optional)
n vSAN-enabled Hosts
n vSAN Datastores
n vSAN Disk Groups
n vSAN Datastore related VMs
n vSAN Witness Hosts (optional)
Verify that the Adapter Instance is Connected and Collecting DataYou configured an adapter instance of vSAN with credentials for a vCenter Server. Now you want to verify that your adapter instance can retrieve information from vSAN objects in your environment.
To view the object types, in the menu, click Administration > Configuration > Inventory > Adapter Instances > vSAN Adapter Instance > <User_Created_Instance>.
Table 1-53. Object Types that vSAN Discovers
Object Type Description
vSAN Adapter Instance The vRealize Operations Management Pack for vSAN instance.
vSAN Cluster vSAN clusters in your data center.
vSAN Datastore vSAN datastores in your data center.
vSAN Disk Group A collection of SSDs and magnetic disks used by vSAN.
vSAN Fault Domain A tag for a fault domain in your data center.
vRealize Operations Manager Configuration Guide
VMware, Inc. 152
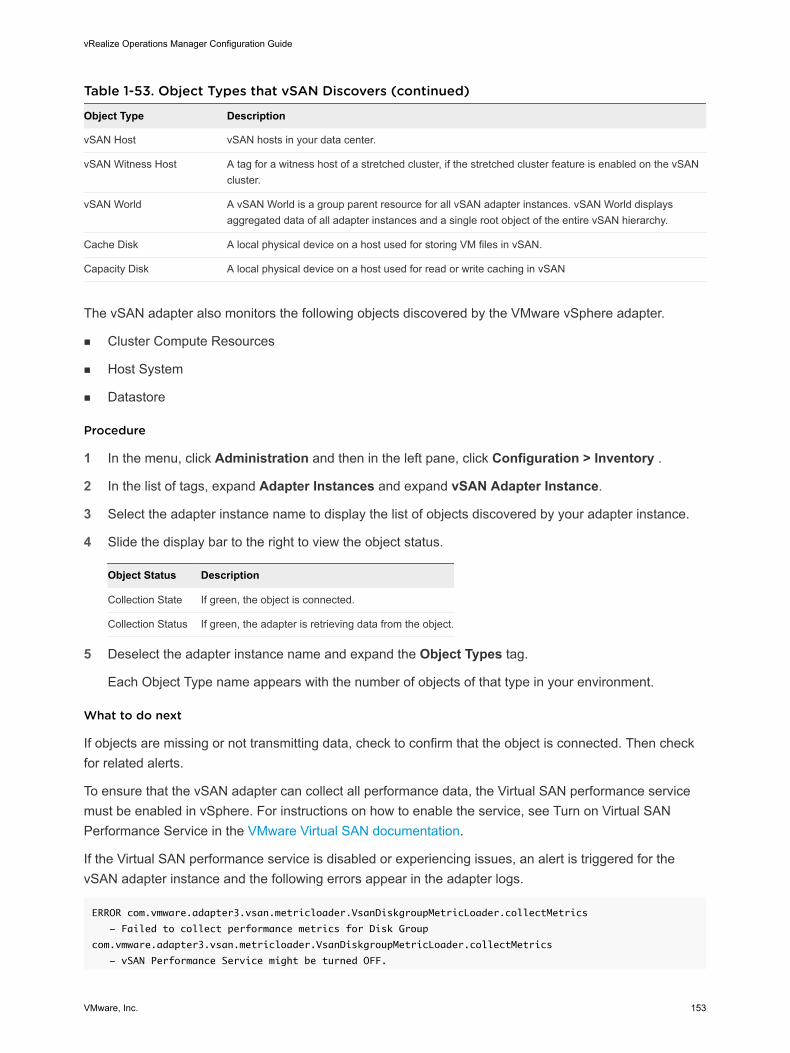
Table 1-53. Object Types that vSAN Discovers (continued)
Object Type Description
vSAN Host vSAN hosts in your data center.
vSAN Witness Host A tag for a witness host of a stretched cluster, if the stretched cluster feature is enabled on the vSAN cluster.
vSAN World A vSAN World is a group parent resource for all vSAN adapter instances. vSAN World displays aggregated data of all adapter instances and a single root object of the entire vSAN hierarchy.
Cache Disk A local physical device on a host used for storing VM files in vSAN.
Capacity Disk A local physical device on a host used for read or write caching in vSAN
The vSAN adapter also monitors the following objects discovered by the VMware vSphere adapter.
n Cluster Compute Resources
n Host System
n Datastore
Procedure
1 In the menu, click Administration and then in the left pane, click Configuration > Inventory .
2 In the list of tags, expand Adapter Instances and expand vSAN Adapter Instance.
3 Select the adapter instance name to display the list of objects discovered by your adapter instance.
4 Slide the display bar to the right to view the object status.
Object Status Description
Collection State If green, the object is connected.
Collection Status If green, the adapter is retrieving data from the object.
5 Deselect the adapter instance name and expand the Object Types tag.
Each Object Type name appears with the number of objects of that type in your environment.
What to do next
If objects are missing or not transmitting data, check to confirm that the object is connected. Then check for related alerts.
To ensure that the vSAN adapter can collect all performance data, the Virtual SAN performance service must be enabled in vSphere. For instructions on how to enable the service, see Turn on Virtual SAN Performance Service in the VMware Virtual SAN documentation.
If the Virtual SAN performance service is disabled or experiencing issues, an alert is triggered for the vSAN adapter instance and the following errors appear in the adapter logs.
ERROR com.vmware.adapter3.vsan.metricloader.VsanDiskgroupMetricLoader.collectMetrics
- Failed to collect performance metrics for Disk Group
com.vmware.adapter3.vsan.metricloader.VsanDiskgroupMetricLoader.collectMetrics
- vSAN Performance Service might be turned OFF.
vRealize Operations Manager Configuration Guide
VMware, Inc. 153
com.vmware.adapter3.vsan.metricloader.VsanDiskgroupMetricLoader.collectMetrics
- (vim.fault.NotFound)
{
faultCause = null,
faultMessage = (vmodl.LocalizableMessage)
[
com.vmware.vim.binding.impl.vmodl.LocalizableMessageImpl@98e1294
]
}
End Point Operations Management Solution in vRealize Operations ManagerYou configure End Point Operations Management to gather operating system metrics and to monitor availability of remote platforms and applications. This solution is installed with vRealize Operations Manager.
End Point Operations Management Agent Installation and DeploymentUse the information in these links to help you to install and deploy End Point Operations Management agents in your environment.
Prepare to Install the End Point Operations Management AgentBefore you can install the End Point Operations Management agent, you must perform preparatory tasks.
Prerequisites
n To configure the agent to use a keystore that you manage yourself for SSL communication, set up a JKS-format keystore for the agent on its host and import its SSL certificate. Make a note of the full path to the keystore, and its password. You must specify this data in the agent's agent.properties file.
Verify that the agent keystore password and the private key password are identical.
n Define the agent HQ_JAVA_HOME location.
vRealize Operations Manager platform-specific installers include JRE 1.8.x . Depending on your environment and the installer you use, you may need to define the location of the JRE to ensure that the agent can find the JRE to use. See Configuring JRE Locations for End Point Operations Management Components.
Note You cannot run the vRealize Application Remote Collector agent on the same VM as the End Point Operations Management agent.
vRealize Operations Manager Configuration Guide
VMware, Inc. 154
Supported Operating Systems for the End Point Operations Management AgentThese tables describe the supported operating systems for End Point Operations Management agent deployments.
These configurations are supported for the agent in both development and production environments.
Table 1-54. Supported Operating Systems for the End Point Operations Management Agent
Operating System Processor Architecture JVM
RedHat Enterprise Linux (RHEL) 5.x, 6.x, 7.x
x86_64, x86_32 Oracle Java SE8
CentOS 5.x, 6.x, 7.x x86_64, x86_32 Oracle Java SE8
SUSE Enterprise Linux (SLES) 11.x, 12.x x86_64 Oracle Java SE8
Windows 2008 Server, 2008 Server R2 x86_64, x86_32 Oracle Java SE8
Windows 2012 Server, 2012 Server R2 x86_64 Oracle Java SE8
Windows Server 2016 x86_64 Oracle Java SE8
Solaris 10, 11 x86_64, SPARC Oracle Java SE7
AIX 6.1, 7.1 Power PC IBM Java SE7
VMware Photon Linux 1. 0 x86_64 Open JDK 1.8.0_72-BLFS
Oracle Linux versions 5, 6, 7 x86_64, x86_32 Open JDK Runtime Environment 1.7
Selecting an Agent Installer PackageThe End Point Operations Management agent installation files are included in the vRealize Operations Manager installation package.
You can install the End Point Operations Management agent from a tar.gz or .zip archive, or from an operating system-specific installer for Windows or for Linux-like systems that support RPM.
When you install a non-JRE version of End Point Operations Management agent, to avoid being exposed to security risks related to earlier versions of Java, it is recommended that you only use the latest Java version.
n Install the Agent on a Linux Platform from an RPM Package
You can install the End Point Operations Management agent from a RedHat Package Manager (RPM) package. The agent in the noarch package does not include a JRE.
n Install the Agent on a Linux Platform from an Archive
You can install an End Point Operations Management agent on a Linux platform from a tar.gz archive.
n Install the Agent on a Windows Platform from an Archive
You can install an End Point Operations Management agent on a Windows platform from a .zip file.
vRealize Operations Manager Configuration Guide
VMware, Inc. 155
n Install the Agent on a Windows Platform Using the Windows Installer
You can install the End Point Operations Management agent on a Windows platform using a Windows installer.
n Installing an End Point Operations Management Agent Silently on a Windows Machine
You can install an End Point Operations Management agent on a Windows machine using silent or very silent installation.
n Install the Agent on an AIX Platform
You can install the End Point Operations Management agent on an AIX platform.
n Install the Agent on a Solaris Platform
You can install the End Point Operations Management agent on a Solaris platform.
Install the Agent on a Linux Platform from an RPM Package
You can install the End Point Operations Management agent from a RedHat Package Manager (RPM) package. The agent in the noarch package does not include a JRE.
Agent-only archives are useful when you deploy agents to a large number of platforms with various operating systems and architectures. Agent archives are available for Windows and UNIX-like environments, with and without built-in JREs.
The RPM performs the following actions:
n Creates a user and group named epops if they do not exist. The user is a service account that is locked and you cannot log into it.
n Installs the agent files into /opt/vmware/epops-agent.
n Installs an init script to /etc/init.d/epops-agent.
n Adds the init script to chkconfig and sets it to on for run levels 2, 3, 4, and 5.
If you have multiple agents to install, see Install Multiple End Point Operations Management Agents Simultaneously.
Prerequisites
n Verify that you have sufficient privileges to deploy an End Point Operations Management agent. You must have vRealize Operations Manager user credentials that include a role that allows you to install End Point Operations Management agents. See Roles and Privileges in vRealize Operations Manager.
n If you plan to run ICMP checks, you must install the End Point Operations Management agent with root privileges.
n To configure the agent to use a keystore that you manage yourself for SSL communication, set up a JKS-format keystore for the agent on its host and configure the agent to use its SSL certificate. Note the full path to the keystore, and its password. You must specify this data in the agent agent.properties file.
Verify that the agent keystore password and the private key password are identical.
vRealize Operations Manager Configuration Guide
VMware, Inc. 156
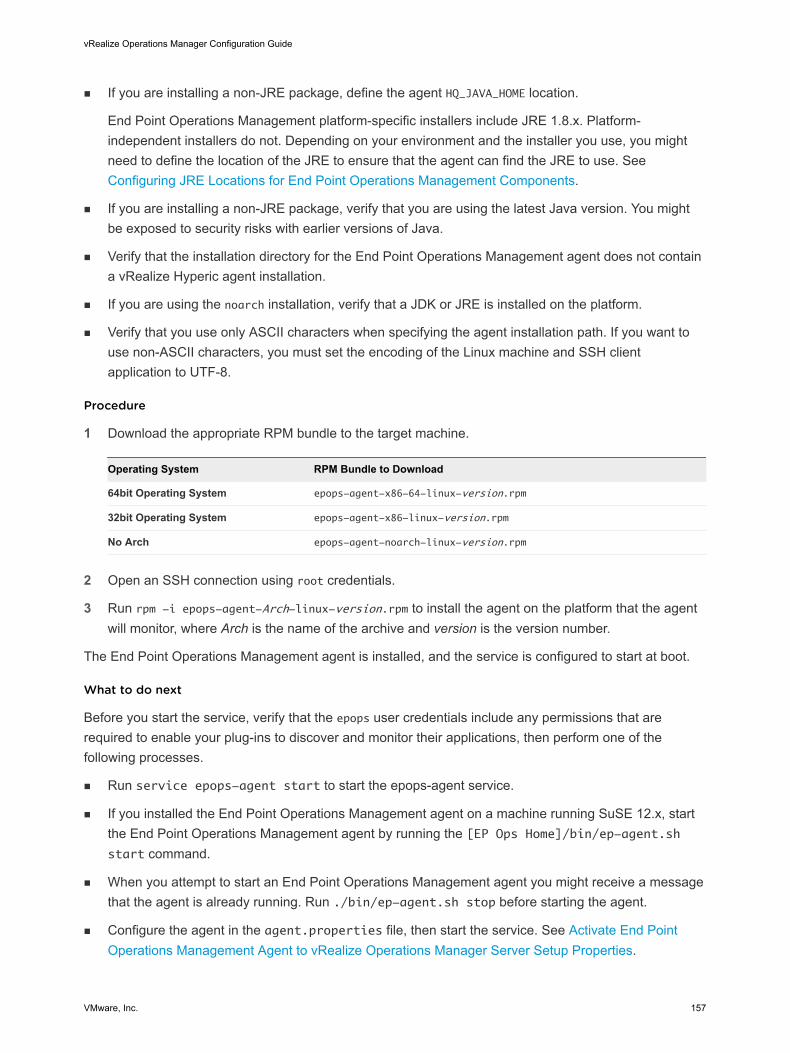
n If you are installing a non-JRE package, define the agent HQ_JAVA_HOME location.
End Point Operations Management platform-specific installers include JRE 1.8.x. Platform-independent installers do not. Depending on your environment and the installer you use, you might need to define the location of the JRE to ensure that the agent can find the JRE to use. See Configuring JRE Locations for End Point Operations Management Components.
n If you are installing a non-JRE package, verify that you are using the latest Java version. You might be exposed to security risks with earlier versions of Java.
n Verify that the installation directory for the End Point Operations Management agent does not contain a vRealize Hyperic agent installation.
n If you are using the noarch installation, verify that a JDK or JRE is installed on the platform.
n Verify that you use only ASCII characters when specifying the agent installation path. If you want to use non-ASCII characters, you must set the encoding of the Linux machine and SSH client application to UTF-8.
Procedure
1 Download the appropriate RPM bundle to the target machine.
Operating System RPM Bundle to Download
64bit Operating System epops-agent-x86-64-linux-version.rpm
32bit Operating System epops-agent-x86-linux-version.rpm
No Arch epops-agent-noarch-linux-version.rpm
2 Open an SSH connection using root credentials.
3 Run rpm -i epops-agent-Arch-linux-version.rpm to install the agent on the platform that the agent will monitor, where Arch is the name of the archive and version is the version number.
The End Point Operations Management agent is installed, and the service is configured to start at boot.
What to do next
Before you start the service, verify that the epops user credentials include any permissions that are required to enable your plug-ins to discover and monitor their applications, then perform one of the following processes.
n Run service epops-agent start to start the epops-agent service.
n If you installed the End Point Operations Management agent on a machine running SuSE 12.x, start the End Point Operations Management agent by running the [EP Ops Home]/bin/ep-agent.sh start command.
n When you attempt to start an End Point Operations Management agent you might receive a message that the agent is already running. Run ./bin/ep-agent.sh stop before starting the agent.
n Configure the agent in the agent.properties file, then start the service. See Activate End Point Operations Management Agent to vRealize Operations Manager Server Setup Properties.
vRealize Operations Manager Configuration Guide
VMware, Inc. 157
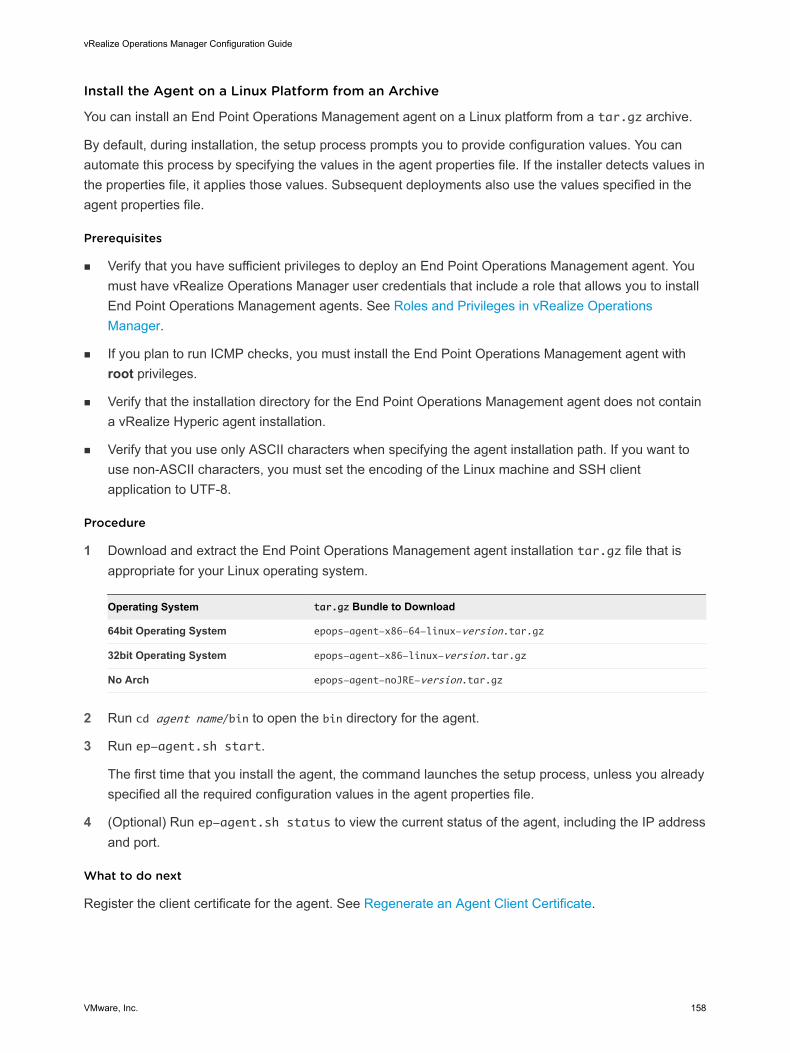
Install the Agent on a Linux Platform from an Archive
You can install an End Point Operations Management agent on a Linux platform from a tar.gz archive.
By default, during installation, the setup process prompts you to provide configuration values. You can automate this process by specifying the values in the agent properties file. If the installer detects values in the properties file, it applies those values. Subsequent deployments also use the values specified in the agent properties file.
Prerequisites
n Verify that you have sufficient privileges to deploy an End Point Operations Management agent. You must have vRealize Operations Manager user credentials that include a role that allows you to install End Point Operations Management agents. See Roles and Privileges in vRealize Operations Manager.
n If you plan to run ICMP checks, you must install the End Point Operations Management agent with root privileges.
n Verify that the installation directory for the End Point Operations Management agent does not contain a vRealize Hyperic agent installation.
n Verify that you use only ASCII characters when specifying the agent installation path. If you want to use non-ASCII characters, you must set the encoding of the Linux machine and SSH client application to UTF-8.
Procedure
1 Download and extract the End Point Operations Management agent installation tar.gz file that is appropriate for your Linux operating system.
Operating System tar.gz Bundle to Download
64bit Operating System epops-agent-x86-64-linux-version.tar.gz
32bit Operating System epops-agent-x86-linux-version.tar.gz
No Arch epops-agent-noJRE-version.tar.gz
2 Run cd agent name/bin to open the bin directory for the agent.
3 Run ep-agent.sh start.
The first time that you install the agent, the command launches the setup process, unless you already specified all the required configuration values in the agent properties file.
4 (Optional) Run ep-agent.sh status to view the current status of the agent, including the IP address and port.
What to do next
Register the client certificate for the agent. See Regenerate an Agent Client Certificate.
vRealize Operations Manager Configuration Guide
VMware, Inc. 158
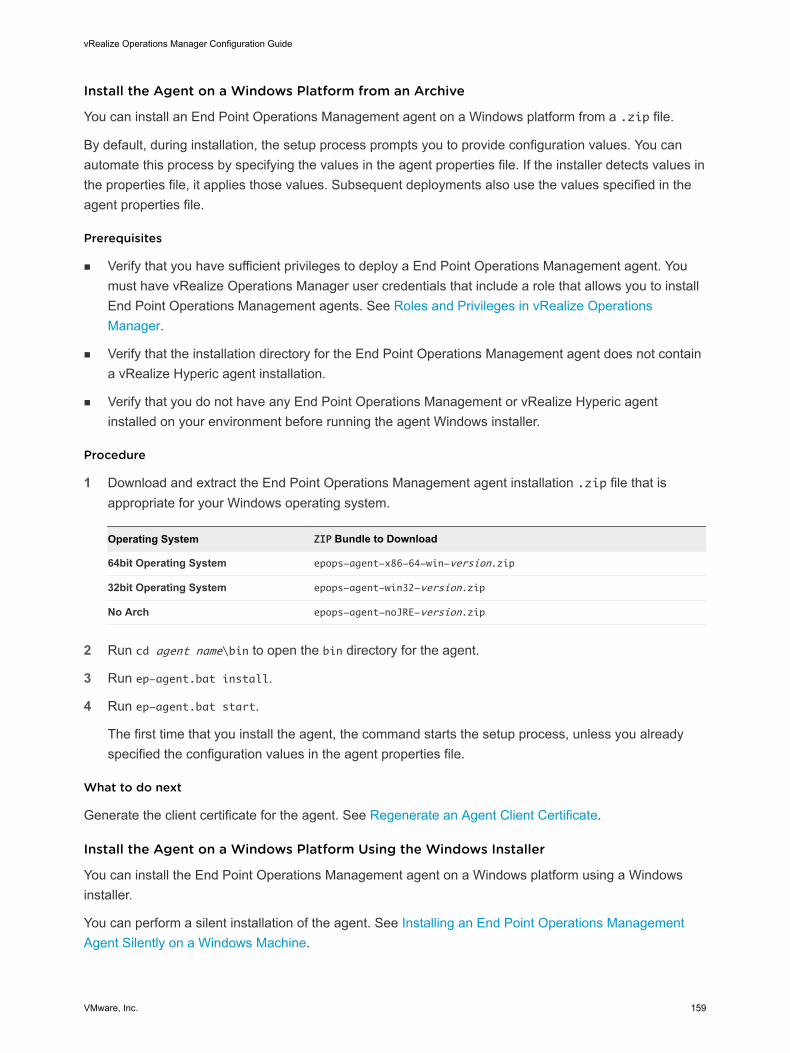
Install the Agent on a Windows Platform from an Archive
You can install an End Point Operations Management agent on a Windows platform from a .zip file.
By default, during installation, the setup process prompts you to provide configuration values. You can automate this process by specifying the values in the agent properties file. If the installer detects values in the properties file, it applies those values. Subsequent deployments also use the values specified in the agent properties file.
Prerequisites
n Verify that you have sufficient privileges to deploy a End Point Operations Management agent. You must have vRealize Operations Manager user credentials that include a role that allows you to install End Point Operations Management agents. See Roles and Privileges in vRealize Operations Manager.
n Verify that the installation directory for the End Point Operations Management agent does not contain a vRealize Hyperic agent installation.
n Verify that you do not have any End Point Operations Management or vRealize Hyperic agent installed on your environment before running the agent Windows installer.
Procedure
1 Download and extract the End Point Operations Management agent installation .zip file that is appropriate for your Windows operating system.
Operating System ZIP Bundle to Download
64bit Operating System epops-agent-x86-64-win-version.zip
32bit Operating System epops-agent-win32-version.zip
No Arch epops-agent-noJRE-version.zip
2 Run cd agent name\bin to open the bin directory for the agent.
3 Run ep-agent.bat install.
4 Run ep-agent.bat start.
The first time that you install the agent, the command starts the setup process, unless you already specified the configuration values in the agent properties file.
What to do next
Generate the client certificate for the agent. See Regenerate an Agent Client Certificate.
Install the Agent on a Windows Platform Using the Windows Installer
You can install the End Point Operations Management agent on a Windows platform using a Windows installer.
You can perform a silent installation of the agent. See Installing an End Point Operations Management Agent Silently on a Windows Machine.
vRealize Operations Manager Configuration Guide
VMware, Inc. 159
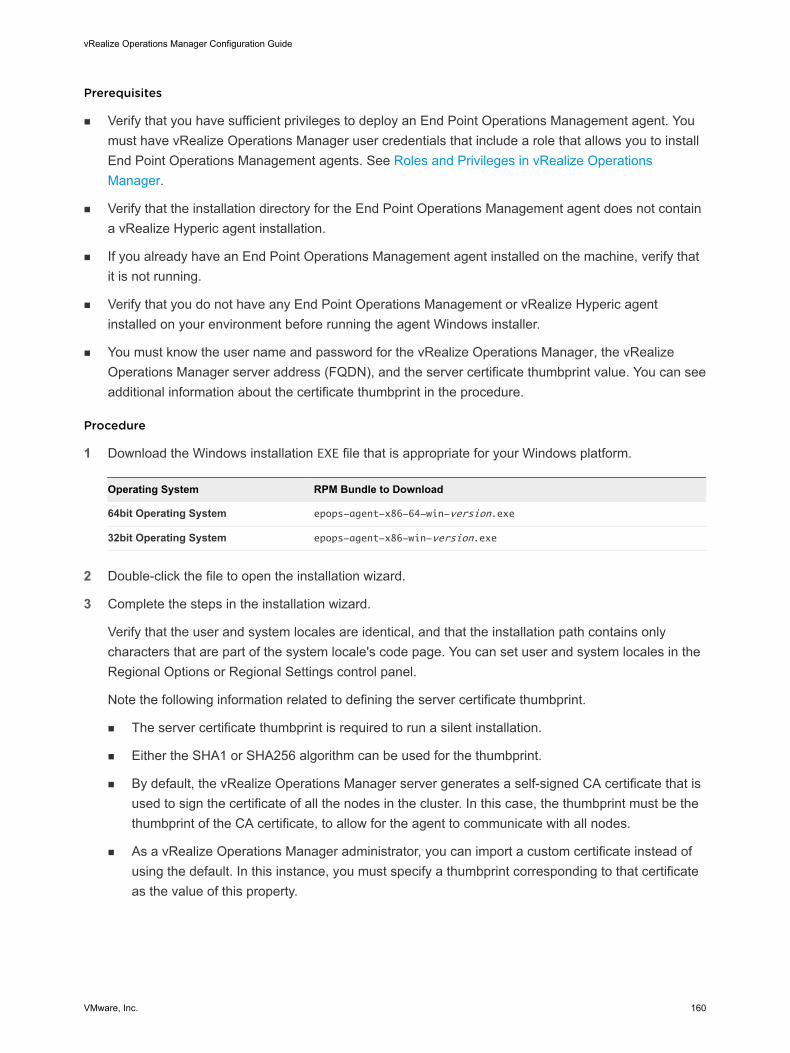
Prerequisites
n Verify that you have sufficient privileges to deploy an End Point Operations Management agent. You must have vRealize Operations Manager user credentials that include a role that allows you to install End Point Operations Management agents. See Roles and Privileges in vRealize Operations Manager.
n Verify that the installation directory for the End Point Operations Management agent does not contain a vRealize Hyperic agent installation.
n If you already have an End Point Operations Management agent installed on the machine, verify that it is not running.
n Verify that you do not have any End Point Operations Management or vRealize Hyperic agent installed on your environment before running the agent Windows installer.
n You must know the user name and password for the vRealize Operations Manager, the vRealize Operations Manager server address (FQDN), and the server certificate thumbprint value. You can see additional information about the certificate thumbprint in the procedure.
Procedure
1 Download the Windows installation EXE file that is appropriate for your Windows platform.
Operating System RPM Bundle to Download
64bit Operating System epops-agent-x86-64-win-version.exe
32bit Operating System epops-agent-x86-win-version.exe
2 Double-click the file to open the installation wizard.
3 Complete the steps in the installation wizard.
Verify that the user and system locales are identical, and that the installation path contains only characters that are part of the system locale's code page. You can set user and system locales in the Regional Options or Regional Settings control panel.
Note the following information related to defining the server certificate thumbprint.
n The server certificate thumbprint is required to run a silent installation.
n Either the SHA1 or SHA256 algorithm can be used for the thumbprint.
n By default, the vRealize Operations Manager server generates a self-signed CA certificate that is used to sign the certificate of all the nodes in the cluster. In this case, the thumbprint must be the thumbprint of the CA certificate, to allow for the agent to communicate with all nodes.
n As a vRealize Operations Manager administrator, you can import a custom certificate instead of using the default. In this instance, you must specify a thumbprint corresponding to that certificate as the value of this property.
vRealize Operations Manager Configuration Guide
VMware, Inc. 160
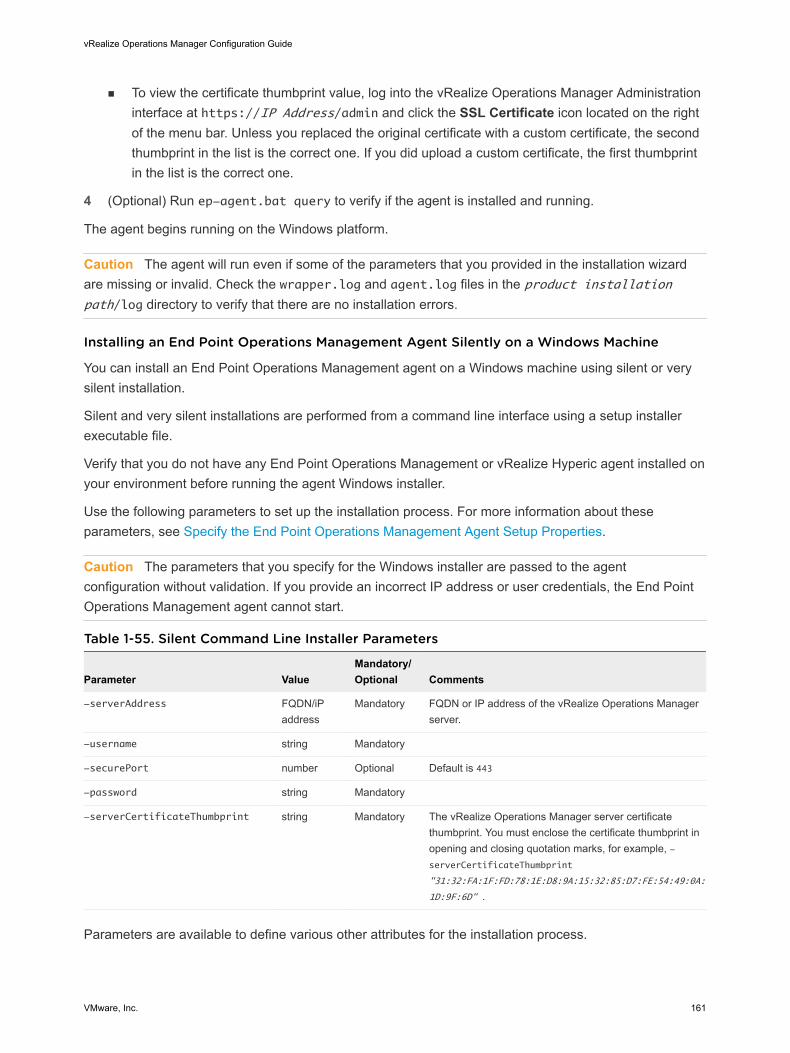
n To view the certificate thumbprint value, log into the vRealize Operations Manager Administration interface at https://IP Address/admin and click the SSL Certificate icon located on the right of the menu bar. Unless you replaced the original certificate with a custom certificate, the second thumbprint in the list is the correct one. If you did upload a custom certificate, the first thumbprint in the list is the correct one.
4 (Optional) Run ep-agent.bat query to verify if the agent is installed and running.
The agent begins running on the Windows platform.
Caution The agent will run even if some of the parameters that you provided in the installation wizard are missing or invalid. Check the wrapper.log and agent.log files in the product installation path/log directory to verify that there are no installation errors.
Installing an End Point Operations Management Agent Silently on a Windows Machine
You can install an End Point Operations Management agent on a Windows machine using silent or very silent installation.
Silent and very silent installations are performed from a command line interface using a setup installer executable file.
Verify that you do not have any End Point Operations Management or vRealize Hyperic agent installed on your environment before running the agent Windows installer.
Use the following parameters to set up the installation process. For more information about these parameters, see Specify the End Point Operations Management Agent Setup Properties.
Caution The parameters that you specify for the Windows installer are passed to the agent configuration without validation. If you provide an incorrect IP address or user credentials, the End Point Operations Management agent cannot start.
Table 1-55. Silent Command Line Installer Parameters
Parameter ValueMandatory/Optional Comments
-serverAddress FQDN/iP address
Mandatory FQDN or IP address of the vRealize Operations Manager server.
-username string Mandatory
-securePort number Optional Default is 443
-password string Mandatory
-serverCertificateThumbprint string Mandatory The vRealize Operations Manager server certificate thumbprint. You must enclose the certificate thumbprint in opening and closing quotation marks, for example, -serverCertificateThumbprint
"31:32:FA:1F:FD:78:1E:D8:9A:15:32:85:D7:FE:54:49:0A:
1D:9F:6D" .
Parameters are available to define various other attributes for the installation process.
vRealize Operations Manager Configuration Guide
VMware, Inc. 161
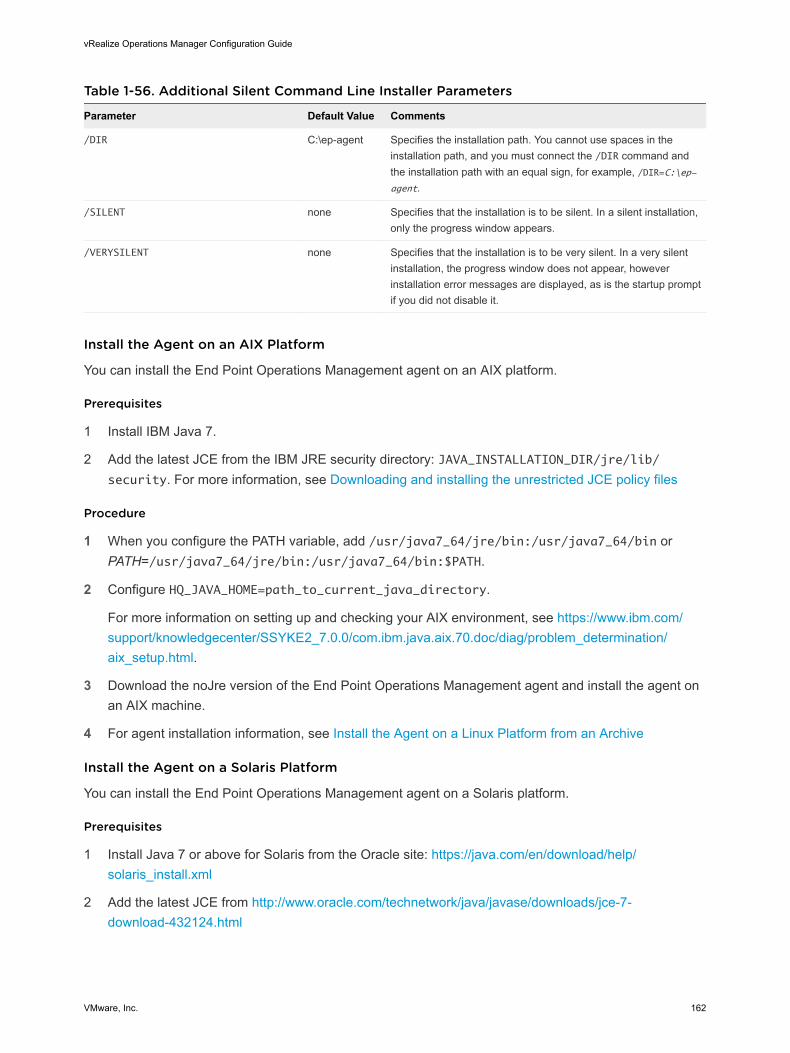
Table 1-56. Additional Silent Command Line Installer Parameters
Parameter Default Value Comments
/DIR C:\ep-agent Specifies the installation path. You cannot use spaces in the installation path, and you must connect the /DIR command and the installation path with an equal sign, for example, /DIR=C:\ep-agent.
/SILENT none Specifies that the installation is to be silent. In a silent installation, only the progress window appears.
/VERYSILENT none Specifies that the installation is to be very silent. In a very silent installation, the progress window does not appear, however installation error messages are displayed, as is the startup prompt if you did not disable it.
Install the Agent on an AIX Platform
You can install the End Point Operations Management agent on an AIX platform.
Prerequisites
1 Install IBM Java 7.
2 Add the latest JCE from the IBM JRE security directory: JAVA_INSTALLATION_DIR/jre/lib/security. For more information, see Downloading and installing the unrestricted JCE policy files
Procedure
1 When you configure the PATH variable, add /usr/java7_64/jre/bin:/usr/java7_64/bin or PATH=/usr/java7_64/jre/bin:/usr/java7_64/bin:$PATH.
2 Configure HQ_JAVA_HOME=path_to_current_java_directory.
For more information on setting up and checking your AIX environment, see https://www.ibm.com/support/knowledgecenter/SSYKE2_7.0.0/com.ibm.java.aix.70.doc/diag/problem_determination/aix_setup.html.
3 Download the noJre version of the End Point Operations Management agent and install the agent on an AIX machine.
4 For agent installation information, see Install the Agent on a Linux Platform from an Archive
Install the Agent on a Solaris Platform
You can install the End Point Operations Management agent on a Solaris platform.
Prerequisites
1 Install Java 7 or above for Solaris from the Oracle site: https://java.com/en/download/help/solaris_install.xml
2 Add the latest JCE from http://www.oracle.com/technetwork/java/javase/downloads/jce-7-download-432124.html
vRealize Operations Manager Configuration Guide
VMware, Inc. 162
Procedure
1 When you configure the PATH variable, add /usr/java7_64/jre/bin:/usr/java7_64/bin or PATH=/usr/java7_64/jre/bin:/usr/java7_64/bin:$PATH.
2 Configure HQ_JAVA_HOME=path_to_current_java_directory.
3 Download and install the noJre version of the End Point Operations Management agent on a Solaris machine.
4 For agent installation information, see Install the Agent on a Linux Platform from an Archive
Java Prerequisites for the End Point Operations Management AgentAll End Point Operations Management agents require Java Cryptography Extension (JCE) Unlimited Strength Jurisdiction policy files be included as part of the Java package.
Java Cryptography Extension (JCE) Unlimited Strength Jurisdiction policy files are included in the JRE End Point Operations Management agent installation options.
You can install an End Point Operations Management agent package that does not contain JRE files, or choose to add JRE later.
If you select a non-JRE installation option, you must ensure that your Java package includes Java Cryptography Extension (JCE) Unlimited Strength Jurisdiction policy files to enable registration of the End Point Operations Management agent. If you select a non-JRE option and your Java package does not include Java Cryptography Extension (JCE) Unlimited Strength Jurisdiction policy files, you receive these error messages Server might be down (or wrong IP/port were used) and Cannot support TLS_RSA_WITH_AES_256_CBC_SHA with currently installed providers.
Configuring JRE Locations for End Point Operations Management ComponentsEnd Point Operations Management agents require a JRE. The platform-specific End Point Operations Management agent installers include a JRE. Platform-independent End Point Operations Management agent installers do not include a JRE.
If you select a non-JRE installation option, you must ensure that your Java package includes Java Cryptography Extension (JCE) Unlimited Strength Jurisdiction policy files to enable registration of the End Point Operations Management agent. For more information , see Java Prerequisites for the End Point Operations Management Agent.
Depending on your environment and the installation package that you use, you might need to define the location of the JRE for your agents. The following environments require JRE location configuration.
n Platform-specific agent installation on a machine that has its own JRE that you want to use.
n Platform-independent agent installation.
vRealize Operations Manager Configuration Guide
VMware, Inc. 163
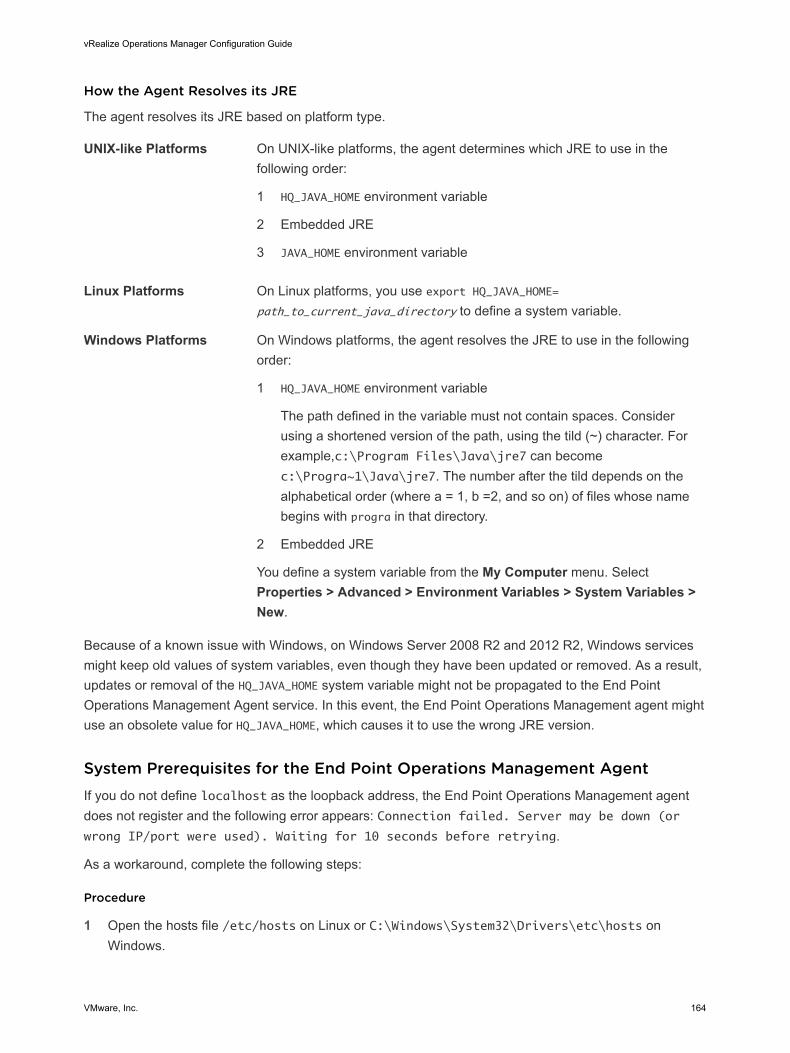
How the Agent Resolves its JRE
The agent resolves its JRE based on platform type.
UNIX-like Platforms On UNIX-like platforms, the agent determines which JRE to use in the following order:
1 HQ_JAVA_HOME environment variable
2 Embedded JRE
3 JAVA_HOME environment variable
Linux Platforms On Linux platforms, you use export HQ_JAVA_HOME= path_to_current_java_directory to define a system variable.
Windows Platforms On Windows platforms, the agent resolves the JRE to use in the following order:
1 HQ_JAVA_HOME environment variable
The path defined in the variable must not contain spaces. Consider using a shortened version of the path, using the tild (~) character. For example,c:\Program Files\Java\jre7 can become c:\Progra~1\Java\jre7. The number after the tild depends on the alphabetical order (where a = 1, b =2, and so on) of files whose name begins with progra in that directory.
2 Embedded JRE
You define a system variable from the My Computer menu. Select Properties > Advanced > Environment Variables > System Variables > New.
Because of a known issue with Windows, on Windows Server 2008 R2 and 2012 R2, Windows services might keep old values of system variables, even though they have been updated or removed. As a result, updates or removal of the HQ_JAVA_HOME system variable might not be propagated to the End Point Operations Management Agent service. In this event, the End Point Operations Management agent might use an obsolete value for HQ_JAVA_HOME, which causes it to use the wrong JRE version.
System Prerequisites for the End Point Operations Management AgentIf you do not define localhost as the loopback address, the End Point Operations Management agent does not register and the following error appears: Connection failed. Server may be down (or wrong IP/port were used). Waiting for 10 seconds before retrying.
As a workaround, complete the following steps:
Procedure
1 Open the hosts file /etc/hosts on Linux or C:\Windows\System32\Drivers\etc\hosts on Windows.
vRealize Operations Manager Configuration Guide
VMware, Inc. 164
2 Modify the file to include a localhost mapping to the IPv4 127.0.0.1 loopback address, using 127.0.0.1 localhost.
3 Save the file.
Configure the End Point Operations Management Agent to vRealize Operations ManagerServer Communication PropertiesBefore first agent startup, you can define the properties that enable the agent to communicate with the vRealize Operations Manager server, and other agent properties, in the agent.properties file of an agent. When you configure the agent in the properties file you can streamline the deployment for multiple agents.
If a properties file exists, back it up before you make configuration changes. If the agent does not have a properties file, create one.
An agent looks for its properties file in AgentHome/conf. This is the default location of agent.properties.
If the agent does not find the required properties for establishing communications with the vRealize Operations Manager server in either of these locations, it prompts for the property values at initial start up of the agent.
A number of steps are required to complete the configuration.
You can define some agent properties before or after the initial startup. You must always configure properties that control the following behaviors before initial startup.
n When the agent must use an SSL keystore that you manage, rather than a keystore that vRealize Operations Manager generates.
n When the agent must connect to the vRealize Operations Manager server through a proxy server.
Prerequisites
Verify that the vRealize Operations Manager server is running.
Procedure
1 Activate End Point Operations Management Agent to vRealize Operations Manager Server Setup Properties
In the agent.properties file, properties relating to communication between the End Point Operations Management agent and the vRealize Operations Manager server are inactive by default. You must activate them.
2 Specify the End Point Operations Management Agent Setup Properties
The agent.properties file contains properties that you can configure to manage communication.
vRealize Operations Manager Configuration Guide
VMware, Inc. 165
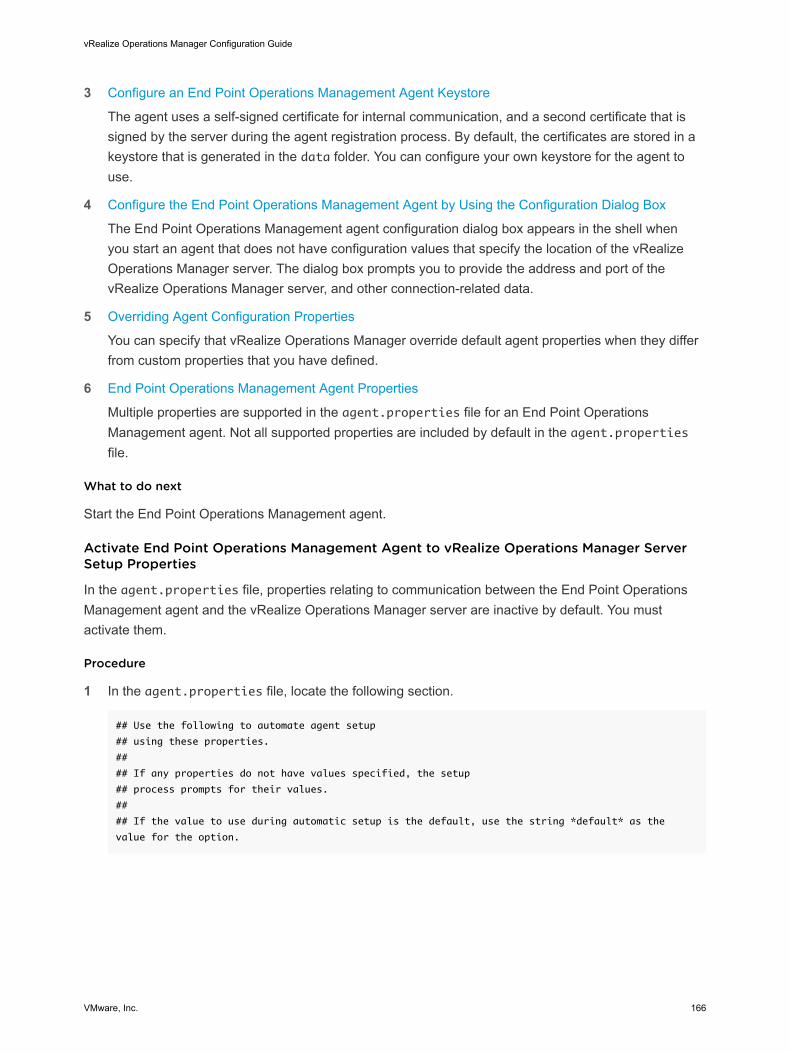
3 Configure an End Point Operations Management Agent Keystore
The agent uses a self-signed certificate for internal communication, and a second certificate that is signed by the server during the agent registration process. By default, the certificates are stored in a keystore that is generated in the data folder. You can configure your own keystore for the agent to use.
4 Configure the End Point Operations Management Agent by Using the Configuration Dialog Box
The End Point Operations Management agent configuration dialog box appears in the shell when you start an agent that does not have configuration values that specify the location of the vRealize Operations Manager server. The dialog box prompts you to provide the address and port of the vRealize Operations Manager server, and other connection-related data.
5 Overriding Agent Configuration Properties
You can specify that vRealize Operations Manager override default agent properties when they differ from custom properties that you have defined.
6 End Point Operations Management Agent Properties
Multiple properties are supported in the agent.properties file for an End Point Operations Management agent. Not all supported properties are included by default in the agent.properties file.
What to do next
Start the End Point Operations Management agent.
Activate End Point Operations Management Agent to vRealize Operations Manager Server Setup Properties
In the agent.properties file, properties relating to communication between the End Point Operations Management agent and the vRealize Operations Manager server are inactive by default. You must activate them.
Procedure
1 In the agent.properties file, locate the following section.
## Use the following to automate agent setup
## using these properties.
##
## If any properties do not have values specified, the setup
## process prompts for their values.
##
## If the value to use during automatic setup is the default, use the string *default* as the
value for the option.
vRealize Operations Manager Configuration Guide
VMware, Inc. 166
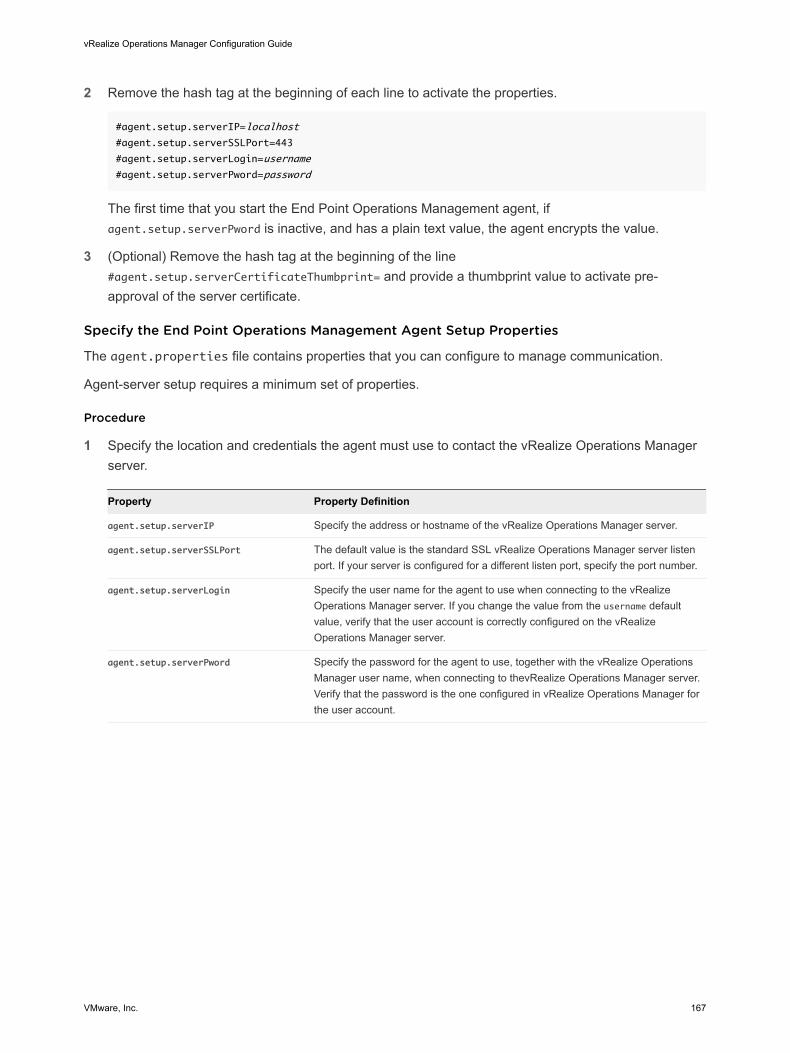
2 Remove the hash tag at the beginning of each line to activate the properties.
#agent.setup.serverIP=localhost
#agent.setup.serverSSLPort=443
#agent.setup.serverLogin=username
#agent.setup.serverPword=password
The first time that you start the End Point Operations Management agent, if agent.setup.serverPword is inactive, and has a plain text value, the agent encrypts the value.
3 (Optional) Remove the hash tag at the beginning of the line #agent.setup.serverCertificateThumbprint= and provide a thumbprint value to activate pre-approval of the server certificate.
Specify the End Point Operations Management Agent Setup Properties
The agent.properties file contains properties that you can configure to manage communication.
Agent-server setup requires a minimum set of properties.
Procedure
1 Specify the location and credentials the agent must use to contact the vRealize Operations Manager server.
Property Property Definition
agent.setup.serverIP Specify the address or hostname of the vRealize Operations Manager server.
agent.setup.serverSSLPort The default value is the standard SSL vRealize Operations Manager server listen port. If your server is configured for a different listen port, specify the port number.
agent.setup.serverLogin Specify the user name for the agent to use when connecting to the vRealize Operations Manager server. If you change the value from the username default value, verify that the user account is correctly configured on the vRealize Operations Manager server.
agent.setup.serverPword Specify the password for the agent to use, together with the vRealize Operations Manager user name, when connecting to thevRealize Operations Manager server. Verify that the password is the one configured in vRealize Operations Manager for the user account.
vRealize Operations Manager Configuration Guide
VMware, Inc. 167
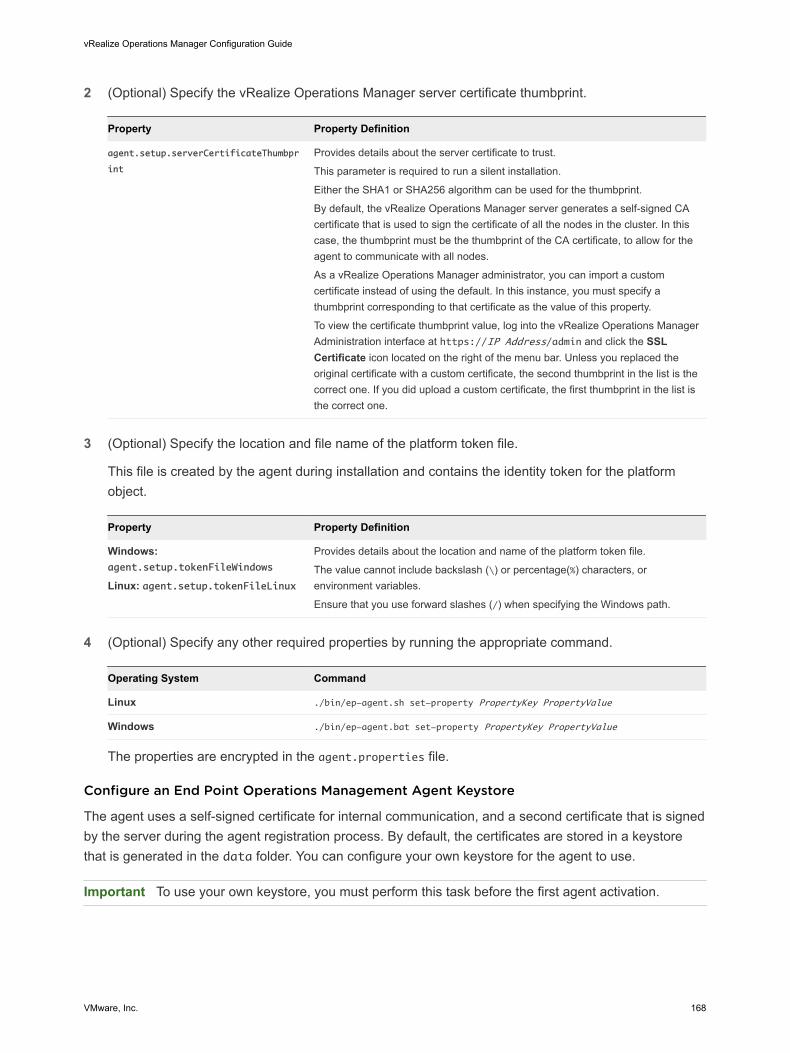
2 (Optional) Specify the vRealize Operations Manager server certificate thumbprint.
Property Property Definition
agent.setup.serverCertificateThumbpr
int
Provides details about the server certificate to trust.
This parameter is required to run a silent installation.
Either the SHA1 or SHA256 algorithm can be used for the thumbprint.
By default, the vRealize Operations Manager server generates a self-signed CA certificate that is used to sign the certificate of all the nodes in the cluster. In this case, the thumbprint must be the thumbprint of the CA certificate, to allow for the agent to communicate with all nodes.
As a vRealize Operations Manager administrator, you can import a custom certificate instead of using the default. In this instance, you must specify a thumbprint corresponding to that certificate as the value of this property.
To view the certificate thumbprint value, log into the vRealize Operations Manager Administration interface at https://IP Address/admin and click the SSL Certificate icon located on the right of the menu bar. Unless you replaced the original certificate with a custom certificate, the second thumbprint in the list is the correct one. If you did upload a custom certificate, the first thumbprint in the list is the correct one.
3 (Optional) Specify the location and file name of the platform token file.
This file is created by the agent during installation and contains the identity token for the platform object.
Property Property Definition
Windows: agent.setup.tokenFileWindows
Linux: agent.setup.tokenFileLinux
Provides details about the location and name of the platform token file.
The value cannot include backslash (\) or percentage(%) characters, or environment variables.
Ensure that you use forward slashes (/) when specifying the Windows path.
4 (Optional) Specify any other required properties by running the appropriate command.
Operating System Command
Linux ./bin/ep-agent.sh set-property PropertyKey PropertyValue
Windows ./bin/ep-agent.bat set-property PropertyKey PropertyValue
The properties are encrypted in the agent.properties file.
Configure an End Point Operations Management Agent Keystore
The agent uses a self-signed certificate for internal communication, and a second certificate that is signed by the server during the agent registration process. By default, the certificates are stored in a keystore that is generated in the data folder. You can configure your own keystore for the agent to use.
Important To use your own keystore, you must perform this task before the first agent activation.
vRealize Operations Manager Configuration Guide
VMware, Inc. 168
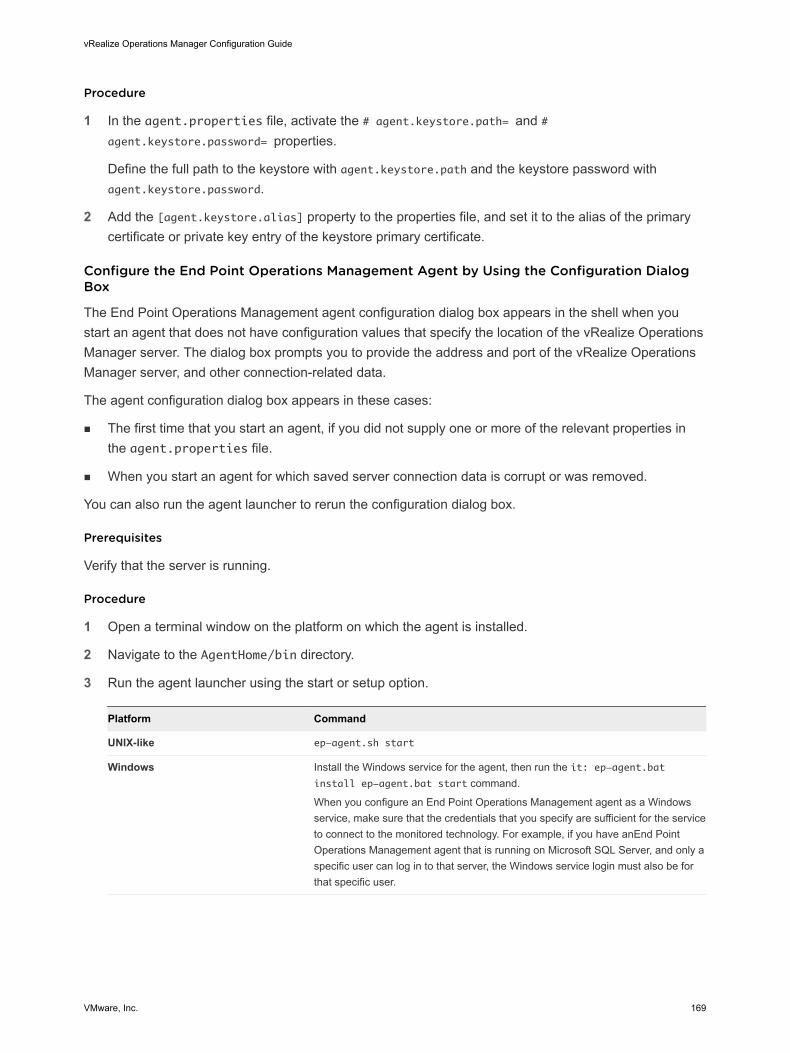
Procedure
1 In the agent.properties file, activate the # agent.keystore.path= and # agent.keystore.password= properties.
Define the full path to the keystore with agent.keystore.path and the keystore password with agent.keystore.password.
2 Add the [agent.keystore.alias] property to the properties file, and set it to the alias of the primary certificate or private key entry of the keystore primary certificate.
Configure the End Point Operations Management Agent by Using the Configuration Dialog Box
The End Point Operations Management agent configuration dialog box appears in the shell when you start an agent that does not have configuration values that specify the location of the vRealize Operations Manager server. The dialog box prompts you to provide the address and port of the vRealize Operations Manager server, and other connection-related data.
The agent configuration dialog box appears in these cases:
n The first time that you start an agent, if you did not supply one or more of the relevant properties in the agent.properties file.
n When you start an agent for which saved server connection data is corrupt or was removed.
You can also run the agent launcher to rerun the configuration dialog box.
Prerequisites
Verify that the server is running.
Procedure
1 Open a terminal window on the platform on which the agent is installed.
2 Navigate to the AgentHome/bin directory.
3 Run the agent launcher using the start or setup option.
Platform Command
UNIX-like ep-agent.sh start
Windows Install the Windows service for the agent, then run the it: ep-agent.bat install ep-agent.bat start command.
When you configure an End Point Operations Management agent as a Windows service, make sure that the credentials that you specify are sufficient for the service to connect to the monitored technology. For example, if you have anEnd Point Operations Management agent that is running on Microsoft SQL Server, and only a specific user can log in to that server, the Windows service login must also be for that specific user.
vRealize Operations Manager Configuration Guide
VMware, Inc. 169
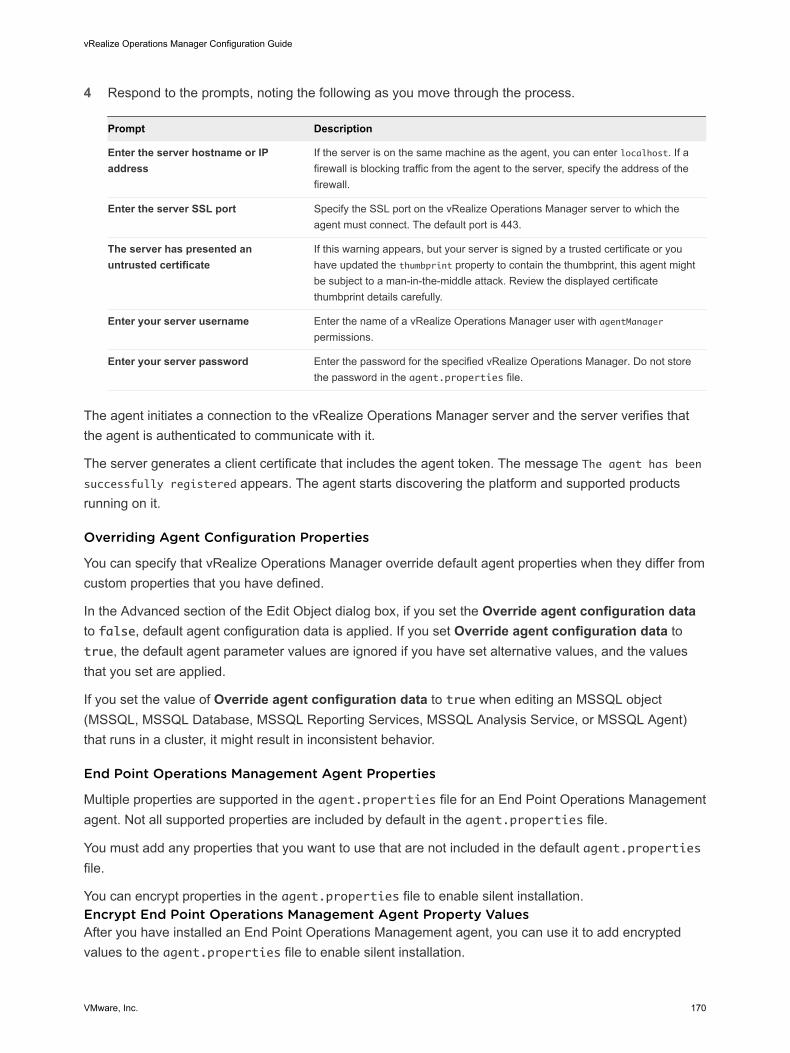
4 Respond to the prompts, noting the following as you move through the process.
Prompt Description
Enter the server hostname or IP address
If the server is on the same machine as the agent, you can enter localhost. If a firewall is blocking traffic from the agent to the server, specify the address of the firewall.
Enter the server SSL port Specify the SSL port on the vRealize Operations Manager server to which the agent must connect. The default port is 443.
The server has presented an untrusted certificate
If this warning appears, but your server is signed by a trusted certificate or you have updated the thumbprint property to contain the thumbprint, this agent might be subject to a man-in-the-middle attack. Review the displayed certificate thumbprint details carefully.
Enter your server username Enter the name of a vRealize Operations Manager user with agentManager permissions.
Enter your server password Enter the password for the specified vRealize Operations Manager. Do not store the password in the agent.properties file.
The agent initiates a connection to the vRealize Operations Manager server and the server verifies that the agent is authenticated to communicate with it.
The server generates a client certificate that includes the agent token. The message The agent has been successfully registered appears. The agent starts discovering the platform and supported products running on it.
Overriding Agent Configuration Properties
You can specify that vRealize Operations Manager override default agent properties when they differ from custom properties that you have defined.
In the Advanced section of the Edit Object dialog box, if you set the Override agent configuration data to false, default agent configuration data is applied. If you set Override agent configuration data to true, the default agent parameter values are ignored if you have set alternative values, and the values that you set are applied.
If you set the value of Override agent configuration data to true when editing an MSSQL object (MSSQL, MSSQL Database, MSSQL Reporting Services, MSSQL Analysis Service, or MSSQL Agent) that runs in a cluster, it might result in inconsistent behavior.
End Point Operations Management Agent Properties
Multiple properties are supported in the agent.properties file for an End Point Operations Management agent. Not all supported properties are included by default in the agent.properties file.
You must add any properties that you want to use that are not included in the default agent.properties file.
You can encrypt properties in the agent.properties file to enable silent installation.Encrypt End Point Operations Management Agent Property ValuesAfter you have installed an End Point Operations Management agent, you can use it to add encrypted values to the agent.properties file to enable silent installation.
vRealize Operations Manager Configuration Guide
VMware, Inc. 170
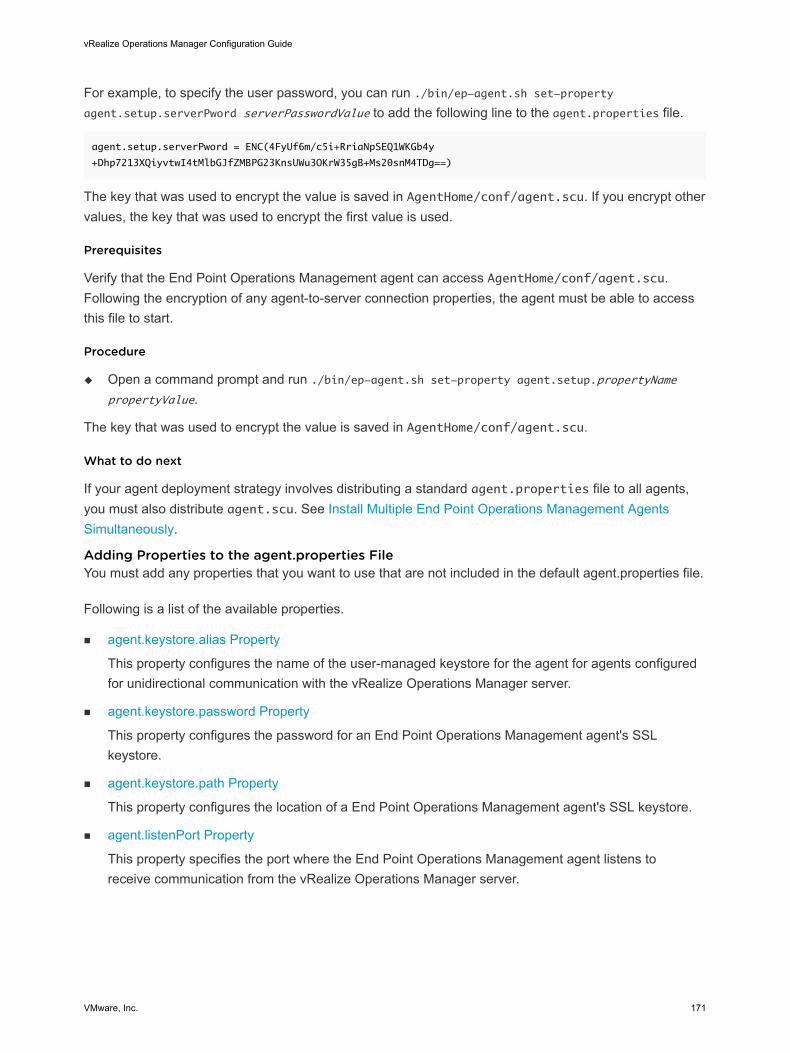
For example, to specify the user password, you can run ./bin/ep-agent.sh set-property agent.setup.serverPword serverPasswordValue to add the following line to the agent.properties file.
agent.setup.serverPword = ENC(4FyUf6m/c5i+RriaNpSEQ1WKGb4y
+Dhp7213XQiyvtwI4tMlbGJfZMBPG23KnsUWu3OKrW35gB+Ms20snM4TDg==)
The key that was used to encrypt the value is saved in AgentHome/conf/agent.scu. If you encrypt other values, the key that was used to encrypt the first value is used.
Prerequisites
Verify that the End Point Operations Management agent can access AgentHome/conf/agent.scu. Following the encryption of any agent-to-server connection properties, the agent must be able to access this file to start.
Procedure
u Open a command prompt and run ./bin/ep-agent.sh set-property agent.setup.propertyName propertyValue.
The key that was used to encrypt the value is saved in AgentHome/conf/agent.scu.
What to do next
If your agent deployment strategy involves distributing a standard agent.properties file to all agents, you must also distribute agent.scu. See Install Multiple End Point Operations Management Agents Simultaneously.
Adding Properties to the agent.properties FileYou must add any properties that you want to use that are not included in the default agent.properties file.
Following is a list of the available properties.
n agent.keystore.alias Property
This property configures the name of the user-managed keystore for the agent for agents configured for unidirectional communication with the vRealize Operations Manager server.
n agent.keystore.password Property
This property configures the password for an End Point Operations Management agent's SSL keystore.
n agent.keystore.path Property
This property configures the location of a End Point Operations Management agent's SSL keystore.
n agent.listenPort Property
This property specifies the port where the End Point Operations Management agent listens to receive communication from the vRealize Operations Manager server.
vRealize Operations Manager Configuration Guide
VMware, Inc. 171
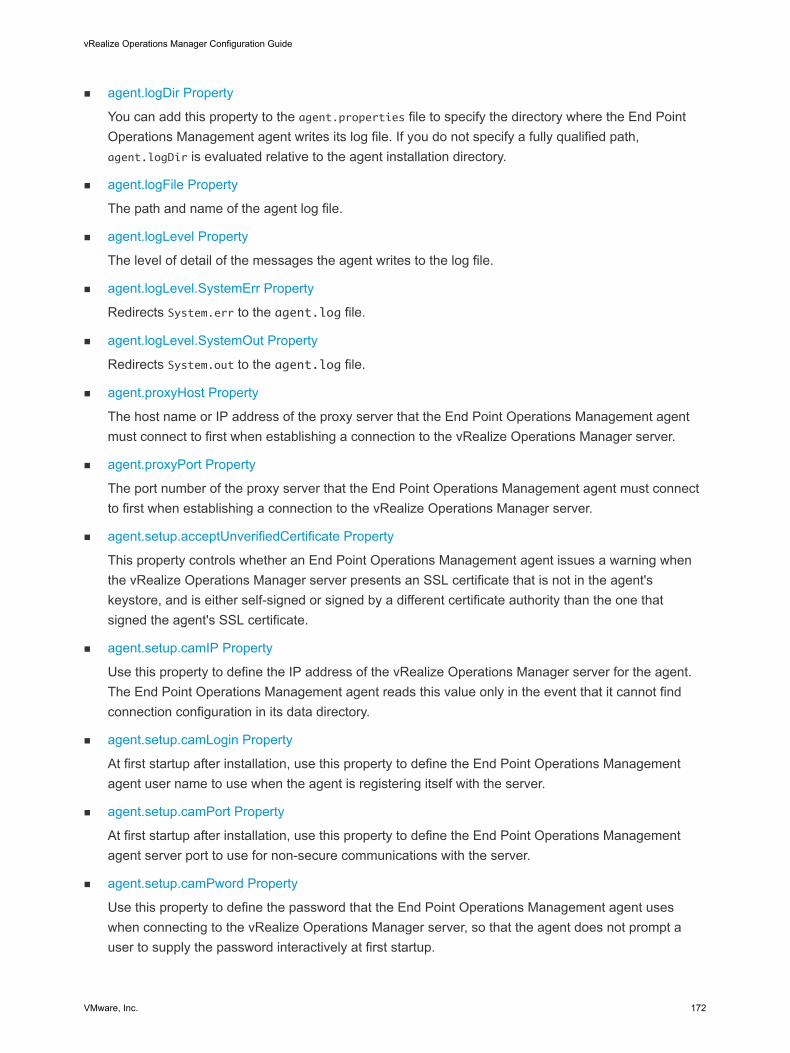
n agent.logDir Property
You can add this property to the agent.properties file to specify the directory where the End Point Operations Management agent writes its log file. If you do not specify a fully qualified path, agent.logDir is evaluated relative to the agent installation directory.
n agent.logFile Property
The path and name of the agent log file.
n agent.logLevel Property
The level of detail of the messages the agent writes to the log file.
n agent.logLevel.SystemErr Property
Redirects System.err to the agent.log file.
n agent.logLevel.SystemOut Property
Redirects System.out to the agent.log file.
n agent.proxyHost Property
The host name or IP address of the proxy server that the End Point Operations Management agent must connect to first when establishing a connection to the vRealize Operations Manager server.
n agent.proxyPort Property
The port number of the proxy server that the End Point Operations Management agent must connect to first when establishing a connection to the vRealize Operations Manager server.
n agent.setup.acceptUnverifiedCertificate Property
This property controls whether an End Point Operations Management agent issues a warning when the vRealize Operations Manager server presents an SSL certificate that is not in the agent's keystore, and is either self-signed or signed by a different certificate authority than the one that signed the agent's SSL certificate.
n agent.setup.camIP Property
Use this property to define the IP address of the vRealize Operations Manager server for the agent. The End Point Operations Management agent reads this value only in the event that it cannot find connection configuration in its data directory.
n agent.setup.camLogin Property
At first startup after installation, use this property to define the End Point Operations Management agent user name to use when the agent is registering itself with the server.
n agent.setup.camPort Property
At first startup after installation, use this property to define the End Point Operations Management agent server port to use for non-secure communications with the server.
n agent.setup.camPword Property
Use this property to define the password that the End Point Operations Management agent uses when connecting to the vRealize Operations Manager server, so that the agent does not prompt a user to supply the password interactively at first startup.
vRealize Operations Manager Configuration Guide
VMware, Inc. 172
n agent.setup.camSecure
This property is used when you are registering the End Point Operations Management with the vRealize Operations Manager server to communicate using encryption.
n agent.setup.camSSLPort Property
At first startup after installation, use this property to define the End Point Operations Management agent server port to use for SSL communications with the server.
n agent.setup.resetupToken Property
Use this property to configure an End Point Operations Management agent to create a new token to use for authentication with the server at startup. Regenerating a token is useful if the agent cannot connect to the server because the token has been deleted or corrupted.
n agent.setup.unidirectional Property
Enables unidirectional communications between the End Point Operations Management agent and vRealize Operations Manager server.
n agent.startupTimeOut Property
The number of seconds that the End Point Operations Management agent startup script waits before determining that the agent has not started up successfully. If the agent is found to not be listening for requests within this period, an error is logged, and the startup script times out.
n autoinventory.defaultScan.interval.millis Property
Specifies how frequently the End Point Operations Management agent performs a default autoinventory scan.
n autoinventory.runtimeScan.interval.millis Property
Specifies how frequently an End Point Operations Management agent performs a runtime scan.
n http.useragent Property
Defines the value for the user-agent request header in HTTP requests issued by the End Point Operations Management agent.
n log4j Properties
The log4j properties for the End Point Operations Management agent are described here.
n platform.log_track.eventfmt Property
Specifies the content and format of the Windows event attributes that an End Point Operations Management agent includes when logging a Windows event as an event in vRealize Operations Manager.
n plugins.exclude Property
Specifies plug-ins that the End Point Operations Management agent does not load at startup. This is useful for reducing an agent's memory footprint.
n plugins.include Property
Specifies plug-ins that the End Point Operations Management agent loads at startup. This is useful for reducing the agent's memory footprint.
vRealize Operations Manager Configuration Guide
VMware, Inc. 173
n postgresql.database.name.format Property
This property specifies the format of the name that the PostgreSQL plug-in assigns to auto-discovered PostgreSQL Database and vPostgreSQL Database database types.
n postgresql.index.name.format Property
This property specifies the format of the name that the PostgreSQL plug-in assigns to auto-discovered PostgreSQL Index and vPostgreSQL Index index types.
n postgresql.server.name.format Property
This property specifies the format of the name that the PostgreSQL plug-in assigns to auto-discovered PostgreSQL and vPostgreSQL server types.
n postgresql.table.name.format Property
This property specifies the format of the name that the PostgreSQL plug-in assigns to auto-discovered PostgreSQL Table and vPostgreSQL Table table types.
n scheduleThread.cancelTimeout Property
This property specifies the maximum time, in milliseconds, that the ScheduleThread allows a metric collection process to run before attempting to interrupt it.
n scheduleThread.fetchLogTimeout Property
This property controls when a warning message is issued for a long-running metric collection process.
n scheduleThread.poolsize Property
This property enables a plug-in to use multiple threads for metric collection. The property can increase metric throughput for plug-ins known to be thread-safe.
n scheduleThread.queuesize Property
Use this property to limit the metric collection queue size (the number of metrics) for a plug-in.
n sigar.mirror.procnet Property
mirror /proc/net/tcp on Linux.
n sigar.pdh.enableTranslation Property
Use this property to enable translation based on the detected locale of the operating system.
n snmpTrapReceiver.listenAddress Property
Specifies the port on which the End Point Operations Management agent listens for SNMP traps
agent.keystore.alias PropertyThis property configures the name of the user-managed keystore for the agent for agents configured for unidirectional communication with the vRealize Operations Manager server.
vRealize Operations Manager Configuration Guide
VMware, Inc. 174
Example: Defining the Name of a Keystore
Given this user-managed keystore for a unidirectional agent
hq self-signed cert), Jul 27, 2011, trustedCertEntry,
Certificate fingerprint (MD5): 98:FF:B8:3D:25:74:23:68:6A:CB:0B:9C:20:88:74:CE
hq-agent, Jul 27, 2011, PrivateKeyEntry,
Certificate fingerprint (MD5): 03:09:C4:BC:20:9E:9A:32:DC:B2:E8:29:C0:3C:FE:38
you define the name of the keystore like this
agent.keystore.alias=hq-agent
If the value of this property does not match the keystore name, agent-server communication fails.
Default
The default behavior of the agent is to look for the hq keystore.
For unidirectional agents with user-managed keystores, you must define the keystore name using this property.agent.keystore.password PropertyThis property configures the password for an End Point Operations Management agent's SSL keystore.
Define the location of the keystore using the agent.keystore.path Property property.
By default, the first time you start the End Point Operations Management agent following installation, if agent.keystore.password is uncommented and has a plain text value, the agent automatically encrypts the property value. You can encrypt this property value yourself, prior to starting the agent.
It is good practice to specify the same password for the agent keystore as for the agent private key.
Default
By default, the agent.properties file does not include this property.agent.keystore.path PropertyThis property configures the location of a End Point Operations Management agent's SSL keystore.
Specify the full path to the keystore. Define the password for the keystore using the agent.keystore.password property. See agent.keystore.password Property.
Specifying the Keystore Path on Windows
On Windows platforms, specify the path to the keystore in this format.
C:/Documents and Settings/Desktop/keystore
Default
AgentHome/data/keystore.agent.listenPort PropertyThis property specifies the port where the End Point Operations Management agent listens to receive communication from the vRealize Operations Manager server.
The property is not required for unidirectional communication.
vRealize Operations Manager Configuration Guide
VMware, Inc. 175
agent.logDir PropertyYou can add this property to the agent.properties file to specify the directory where the End Point Operations Management agent writes its log file. If you do not specify a fully qualified path, agent.logDir is evaluated relative to the agent installation directory.
To change the location for the agent log file, enter a path relative to the agent installation directory, or a fully qualified path.
Note that the name of the agent log file is configured with the agent.logFile property.
Default
By default, the agent.properties file does not include this property.
The default behavior is agent.logDir=log, resulting in the agent log file being written to the AgentHome/log directory.agent.logFile PropertyThe path and name of the agent log file.
Default
In the agent.properties file, the default setting for the agent.LogFile property is made up of a variable and a string
agent.logFile=${agent.logDir}\agent.log
where
n agent.logDir is a variable that supplies the value of an identically named agent property. By default, the value of agent.logDir is log, interpreted relative to the agent installation directory.
n agent.log is the name for the agent log file.
By default, the agent log file is named agent.log, and is written to the AgentHome/log directory.agent.logLevel PropertyThe level of detail of the messages the agent writes to the log file.
Permitted values are INFO and DEBUG.
Default
INFO
agent.logLevel.SystemErr PropertyRedirects System.err to the agent.log file.
Commenting out this setting causes System.err to be directed to agent.log.startup.
Default
ERROR
agent.logLevel.SystemOut PropertyRedirects System.out to the agent.log file.
Commenting out this setting causes System.out to be directed to agent.log.startup.
vRealize Operations Manager Configuration Guide
VMware, Inc. 176
Default
INFO
agent.proxyHost PropertyThe host name or IP address of the proxy server that the End Point Operations Management agent must connect to first when establishing a connection to the vRealize Operations Manager server.
This property is supported for agents configured for unidirectional communication.
Use this property in conjunction with agent.proxyPort and agent.setup.unidirectional.
Default
Noneagent.proxyPort PropertyThe port number of the proxy server that the End Point Operations Management agent must connect to first when establishing a connection to the vRealize Operations Manager server.
This property is supported for agents configured for unidirectional communication.
Use this property in conjunction with agent.proxyPort and agent.setup.unidirectional.
Default
Noneagent.setup.acceptUnverifiedCertificate PropertyThis property controls whether an End Point Operations Management agent issues a warning when the vRealize Operations Manager server presents an SSL certificate that is not in the agent's keystore, and is either self-signed or signed by a different certificate authority than the one that signed the agent's SSL certificate.
When the default is used, the agent issues the warning
The authenticity of host 'localhost' can't be established.
Are you sure you want to continue connecting? [default=no]:
If you respond yes, the agent imports the server's certificate and will continue to trust the certificate from this point on.
Default
agent.setup.acceptUnverifiedCertificate=no
agent.setup.camIP PropertyUse this property to define the IP address of the vRealize Operations Manager server for the agent. The End Point Operations Management agent reads this value only in the event that it cannot find connection configuration in its data directory.
You can specify this and other agent.setup.* properties to reduce the user interaction required to configure an agent to communicate with the server.
The value can be provided as an IP address or a fully qualified domain name. To identify an server on the same host as the server, set the value to 127.0.0.1.
vRealize Operations Manager Configuration Guide
VMware, Inc. 177
If there is a firewall between the agent and server, specify the address of the firewall, and configure the firewall to forward traffic on port 7080, or 7443 if you use the SSL port, to the vRealize Operations Manager server.
Default
Commented out, localhost.agent.setup.camLogin PropertyAt first startup after installation, use this property to define the End Point Operations Management agent user name to use when the agent is registering itself with the server.
The permission required on the server for this initialization is Create, for platforms.
Log in from the agent to the server is only required during the initial configuration of the agent.
The agent reads this value only in the event that it cannot find connection configuration in its data directory.
You can specify this and other agent.setup.* properties to reduce the user interaction required to configure an agent to communicate with the server.
Default
Commented our hqadmin.agent.setup.camPort PropertyAt first startup after installation, use this property to define the End Point Operations Management agent server port to use for non-secure communications with the server.
The agent reads this value only in the event that it cannot find connection configuration in its data directory.
You can specify this and other agent.setup.* properties to reduce the user interaction required to configure an agent to communicate with the server.
Default
Commented out 7080.agent.setup.camPword PropertyUse this property to define the password that the End Point Operations Management agent uses when connecting to the vRealize Operations Manager server, so that the agent does not prompt a user to supply the password interactively at first startup.
The password for the user is that specified by agent.setup.camLogin.
The agent reads this value only in the event that it cannot find connection configuration in its data directory.
You can specify this and other agent.setup.* properties to reduce the user interaction required to configure an agent to communicate with the server.
The first time you start the End Point Operations Management agent after installation, if agent.keystore.password is uncommented and has a plain text value, the agent automatically encrypts the property value. You can encrypt these property values prior to starting the agent.
vRealize Operations Manager Configuration Guide
VMware, Inc. 178
Default
Commented our hqadmin.agent.setup.camSecureThis property is used when you are registering the End Point Operations Management with the vRealize Operations Manager server to communicate using encryption.
Use yes=secure, encrypted, or SSL, as appropriate, to encrypt communication.
Use no=unencrypted for unencrypted communication.agent.setup.camSSLPort PropertyAt first startup after installation, use this property to define the End Point Operations Management agent server port to use for SSL communications with the server.
The agent reads this value only in the event that it cannot find connection configuration in its data directory.
You can specify this and other agent.setup.* properties to reduce the user interaction required to configure an agent to communicate with the server.
Default
Commented out 7443.agent.setup.resetupToken PropertyUse this property to configure an End Point Operations Management agent to create a new token to use for authentication with the server at startup. Regenerating a token is useful if the agent cannot connect to the server because the token has been deleted or corrupted.
The agent reads this value only in the event that it cannot find connection configuration in its data directory.
Regardless of the value of this property, an agent generates a token the first time it is started after installation.
Default
Commented out no.agent.setup.unidirectional PropertyEnables unidirectional communications between the End Point Operations Management agent and vRealize Operations Manager server.
If you configure an agent for unidirectional communication, all communication with the server is initiated by the agent.
For a unidirectional agent with a user-managed keystore, you must configure the keystore name in the agent.properties file.
Default
Commented out no.agent.startupTimeOut Property
vRealize Operations Manager Configuration Guide
VMware, Inc. 179
The number of seconds that the End Point Operations Management agent startup script waits before determining that the agent has not started up successfully. If the agent is found to not be listening for requests within this period, an error is logged, and the startup script times out.
Default
By default, the agent.properties file does not include this property.
The default behavior of the agent is to timeout after 300 seconds.autoinventory.defaultScan.interval.millis PropertySpecifies how frequently the End Point Operations Management agent performs a default autoinventory scan.
The default scan detects server and platform services objects, typically using the process table or the Windows registry. Default scans are less resource-intensive than runtime scans.
Default
The agent performs the default scan at startup and every 15 minutes thereafter.
Commented out 86,400,000 milliseconds, or one day.autoinventory.runtimeScan.interval.millis PropertySpecifies how frequently an End Point Operations Management agent performs a runtime scan.
A runtime scan may use more resource-intensive methods to detect services than a default scan. For example, a runtime scan might involve issuing an SQL query or looking up an MBean.
Default
86,400,000 milliseconds, or one day.http.useragent PropertyDefines the value for the user-agent request header in HTTP requests issued by the End Point Operations Management agent.
You can use http.useragent to define a user-agent value that is consistent across upgrades.
By default, the agent.properties file does not include this property.
Default
By default, the user-agent in agent requests includes the End Point Operations Management agent version, so changes when the agent is upgraded. If a target HTTP server is configured to block requests with an unknown user-agent, agent requests fail after an agent upgrade.
Hyperic-HQ-Agent/Version, for example, Hyperic-HQ-Agent/4.1.2-EE.log4j PropertiesThe log4j properties for the End Point Operations Management agent are described here.
log4j.rootLogger=${agent.logLevel}, R
log4j.appender.R.File=${agent.logFile}
log4j.appender.R.MaxBackupIndex=1
log4j.appender.R.MaxFileSize=5000KB
log4j.appender.R.layout.ConversionPattern=%d{dd-MM-yyyy HH:mm:ss,SSS z} %-5p [%t] [%c{1}@%L] %m%n
vRealize Operations Manager Configuration Guide
VMware, Inc. 180
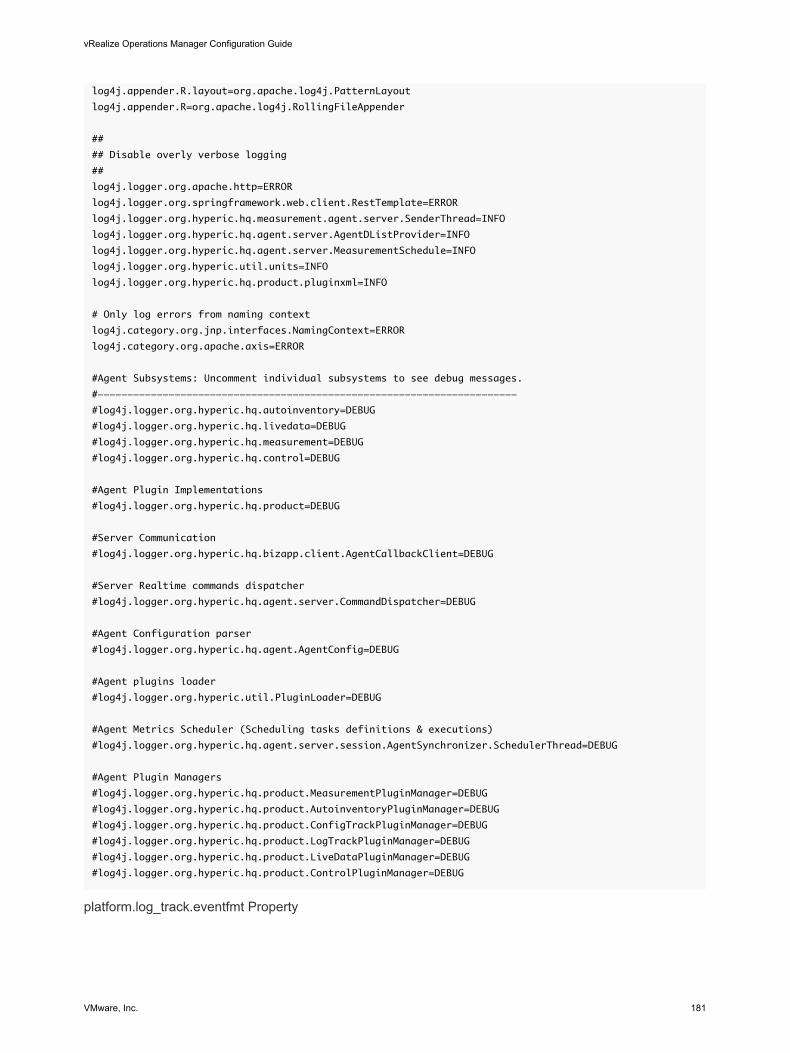
log4j.appender.R.layout=org.apache.log4j.PatternLayout
log4j.appender.R=org.apache.log4j.RollingFileAppender
##
## Disable overly verbose logging
##
log4j.logger.org.apache.http=ERROR
log4j.logger.org.springframework.web.client.RestTemplate=ERROR
log4j.logger.org.hyperic.hq.measurement.agent.server.SenderThread=INFO
log4j.logger.org.hyperic.hq.agent.server.AgentDListProvider=INFO
log4j.logger.org.hyperic.hq.agent.server.MeasurementSchedule=INFO
log4j.logger.org.hyperic.util.units=INFO
log4j.logger.org.hyperic.hq.product.pluginxml=INFO
# Only log errors from naming context
log4j.category.org.jnp.interfaces.NamingContext=ERROR
log4j.category.org.apache.axis=ERROR
#Agent Subsystems: Uncomment individual subsystems to see debug messages.
#-----------------------------------------------------------------------
#log4j.logger.org.hyperic.hq.autoinventory=DEBUG
#log4j.logger.org.hyperic.hq.livedata=DEBUG
#log4j.logger.org.hyperic.hq.measurement=DEBUG
#log4j.logger.org.hyperic.hq.control=DEBUG
#Agent Plugin Implementations
#log4j.logger.org.hyperic.hq.product=DEBUG
#Server Communication
#log4j.logger.org.hyperic.hq.bizapp.client.AgentCallbackClient=DEBUG
#Server Realtime commands dispatcher
#log4j.logger.org.hyperic.hq.agent.server.CommandDispatcher=DEBUG
#Agent Configuration parser
#log4j.logger.org.hyperic.hq.agent.AgentConfig=DEBUG
#Agent plugins loader
#log4j.logger.org.hyperic.util.PluginLoader=DEBUG
#Agent Metrics Scheduler (Scheduling tasks definitions & executions)
#log4j.logger.org.hyperic.hq.agent.server.session.AgentSynchronizer.SchedulerThread=DEBUG
#Agent Plugin Managers
#log4j.logger.org.hyperic.hq.product.MeasurementPluginManager=DEBUG
#log4j.logger.org.hyperic.hq.product.AutoinventoryPluginManager=DEBUG
#log4j.logger.org.hyperic.hq.product.ConfigTrackPluginManager=DEBUG
#log4j.logger.org.hyperic.hq.product.LogTrackPluginManager=DEBUG
#log4j.logger.org.hyperic.hq.product.LiveDataPluginManager=DEBUG
#log4j.logger.org.hyperic.hq.product.ControlPluginManager=DEBUG
platform.log_track.eventfmt Property
vRealize Operations Manager Configuration Guide
VMware, Inc. 181
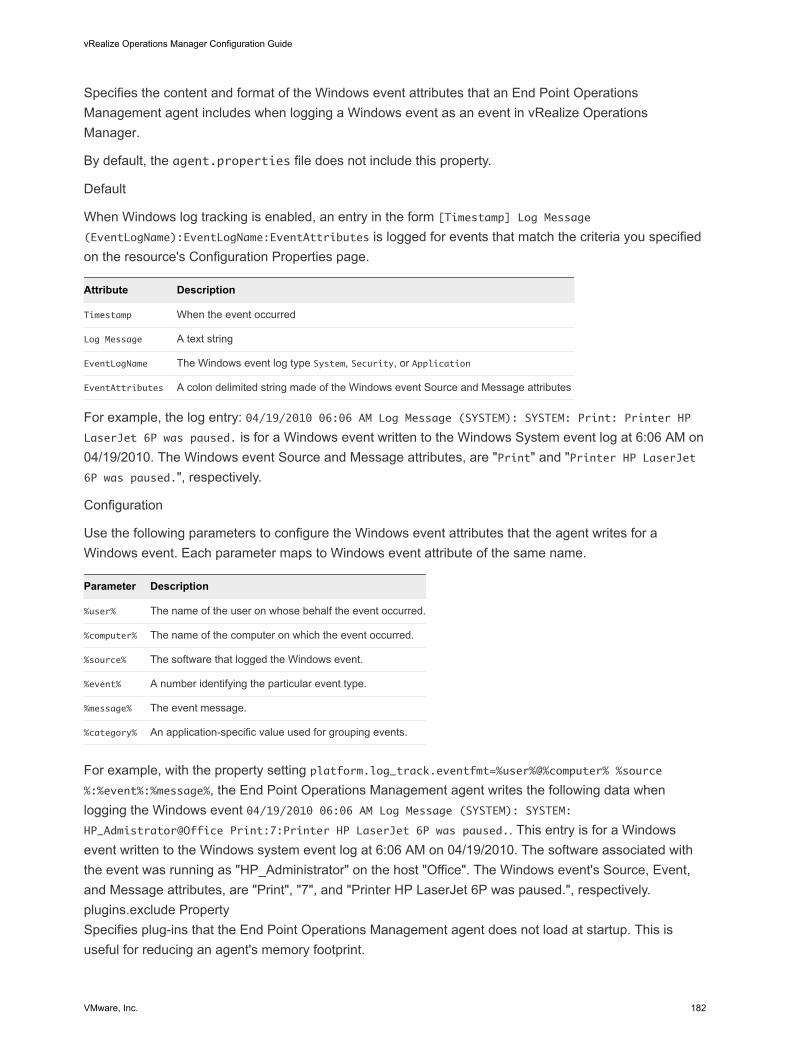
Specifies the content and format of the Windows event attributes that an End Point Operations Management agent includes when logging a Windows event as an event in vRealize Operations Manager.
By default, the agent.properties file does not include this property.
Default
When Windows log tracking is enabled, an entry in the form [Timestamp] Log Message (EventLogName):EventLogName:EventAttributes is logged for events that match the criteria you specified on the resource's Configuration Properties page.
Attribute Description
Timestamp When the event occurred
Log Message A text string
EventLogName The Windows event log type System, Security, or Application
EventAttributes A colon delimited string made of the Windows event Source and Message attributes
For example, the log entry: 04/19/2010 06:06 AM Log Message (SYSTEM): SYSTEM: Print: Printer HP LaserJet 6P was paused. is for a Windows event written to the Windows System event log at 6:06 AM on 04/19/2010. The Windows event Source and Message attributes, are "Print" and "Printer HP LaserJet 6P was paused.", respectively.
Configuration
Use the following parameters to configure the Windows event attributes that the agent writes for a Windows event. Each parameter maps to Windows event attribute of the same name.
Parameter Description
%user% The name of the user on whose behalf the event occurred.
%computer% The name of the computer on which the event occurred.
%source% The software that logged the Windows event.
%event% A number identifying the particular event type.
%message% The event message.
%category% An application-specific value used for grouping events.
For example, with the property setting platform.log_track.eventfmt=%user%@%computer% %source%:%event%:%message%, the End Point Operations Management agent writes the following data when logging the Windows event 04/19/2010 06:06 AM Log Message (SYSTEM): SYSTEM: HP_Admistrator@Office Print:7:Printer HP LaserJet 6P was paused.. This entry is for a Windows event written to the Windows system event log at 6:06 AM on 04/19/2010. The software associated with the event was running as "HP_Administrator" on the host "Office". The Windows event's Source, Event, and Message attributes, are "Print", "7", and "Printer HP LaserJet 6P was paused.", respectively.plugins.exclude PropertySpecifies plug-ins that the End Point Operations Management agent does not load at startup. This is useful for reducing an agent's memory footprint.
vRealize Operations Manager Configuration Guide
VMware, Inc. 182
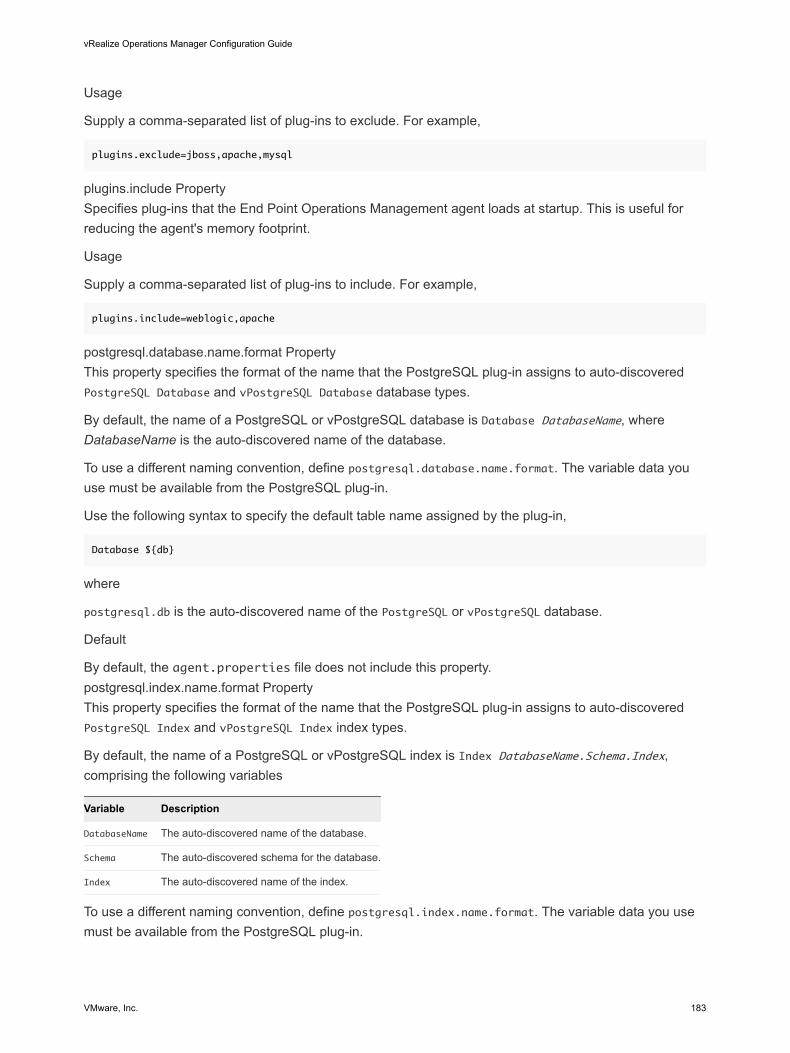
Usage
Supply a comma-separated list of plug-ins to exclude. For example,
plugins.exclude=jboss,apache,mysql
plugins.include PropertySpecifies plug-ins that the End Point Operations Management agent loads at startup. This is useful for reducing the agent's memory footprint.
Usage
Supply a comma-separated list of plug-ins to include. For example,
plugins.include=weblogic,apache
postgresql.database.name.format PropertyThis property specifies the format of the name that the PostgreSQL plug-in assigns to auto-discovered PostgreSQL Database and vPostgreSQL Database database types.
By default, the name of a PostgreSQL or vPostgreSQL database is Database DatabaseName, where DatabaseName is the auto-discovered name of the database.
To use a different naming convention, define postgresql.database.name.format. The variable data you use must be available from the PostgreSQL plug-in.
Use the following syntax to specify the default table name assigned by the plug-in,
Database ${db}
where
postgresql.db is the auto-discovered name of the PostgreSQL or vPostgreSQL database.
Default
By default, the agent.properties file does not include this property.postgresql.index.name.format PropertyThis property specifies the format of the name that the PostgreSQL plug-in assigns to auto-discovered PostgreSQL Index and vPostgreSQL Index index types.
By default, the name of a PostgreSQL or vPostgreSQL index is Index DatabaseName.Schema.Index, comprising the following variables
Variable Description
DatabaseName The auto-discovered name of the database.
Schema The auto-discovered schema for the database.
Index The auto-discovered name of the index.
To use a different naming convention, define postgresql.index.name.format. The variable data you use must be available from the PostgreSQL plug-in.
vRealize Operations Manager Configuration Guide
VMware, Inc. 183
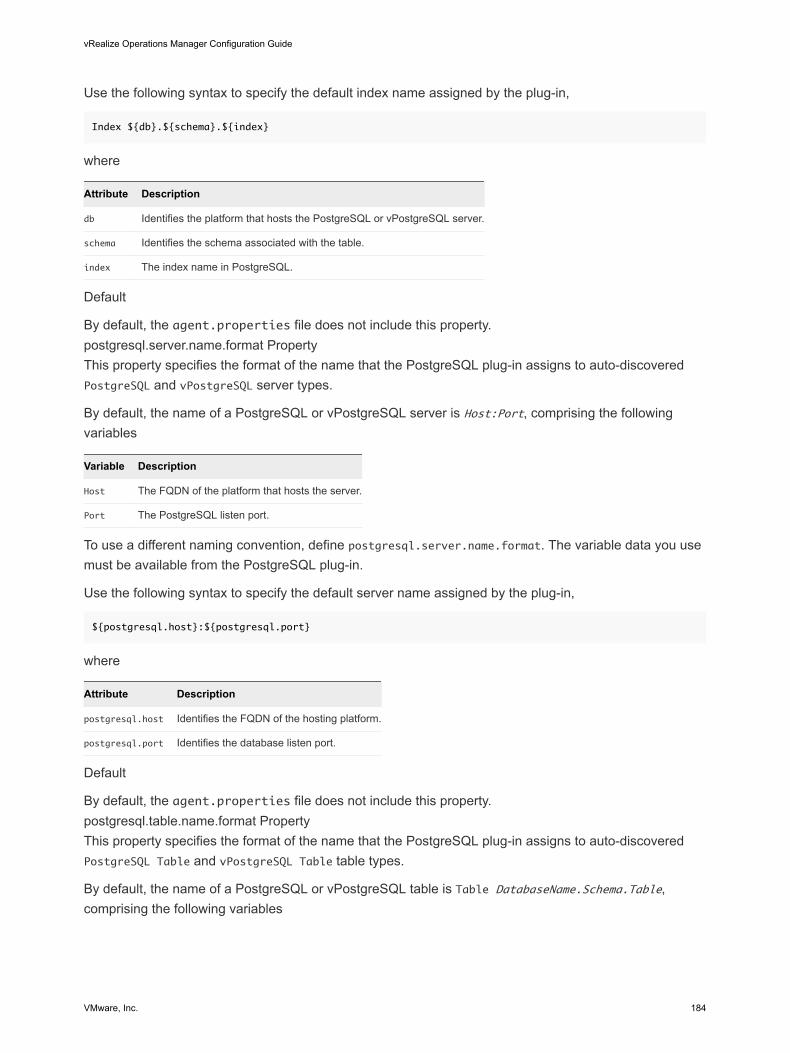
Use the following syntax to specify the default index name assigned by the plug-in,
Index ${db}.${schema}.${index}
where
Attribute Description
db Identifies the platform that hosts the PostgreSQL or vPostgreSQL server.
schema Identifies the schema associated with the table.
index The index name in PostgreSQL.
Default
By default, the agent.properties file does not include this property.postgresql.server.name.format PropertyThis property specifies the format of the name that the PostgreSQL plug-in assigns to auto-discovered PostgreSQL and vPostgreSQL server types.
By default, the name of a PostgreSQL or vPostgreSQL server is Host:Port, comprising the following variables
Variable Description
Host The FQDN of the platform that hosts the server.
Port The PostgreSQL listen port.
To use a different naming convention, define postgresql.server.name.format. The variable data you use must be available from the PostgreSQL plug-in.
Use the following syntax to specify the default server name assigned by the plug-in,
${postgresql.host}:${postgresql.port}
where
Attribute Description
postgresql.host Identifies the FQDN of the hosting platform.
postgresql.port Identifies the database listen port.
Default
By default, the agent.properties file does not include this property.postgresql.table.name.format PropertyThis property specifies the format of the name that the PostgreSQL plug-in assigns to auto-discovered PostgreSQL Table and vPostgreSQL Table table types.
By default, the name of a PostgreSQL or vPostgreSQL table is Table DatabaseName.Schema.Table, comprising the following variables
vRealize Operations Manager Configuration Guide
VMware, Inc. 184
Variable Description
DatabaseName The auto-discovered name of the database.
Schema The auto-discovered schema for the database.
Table The auto-discovered name of the table.
To use a different naming convention, define postgresql.table.name.format. The variable data you use must be available from the PostgreSQL plug-in.
Use the following syntax to specify the default table name assigned by the plug-in,
Table ${db}.${schema}.${table}
where
Attribute Description
db Identifies the platform that hosts the PostgreSQL or vPostgreSQL server.
schema Identifies the schema associated with the table.
table The table name in PostgreSQL.
Default
By default, the agent.properties file does not include this property.scheduleThread.cancelTimeout PropertyThis property specifies the maximum time, in milliseconds, that the ScheduleThread allows a metric collection process to run before attempting to interrupt it.
When the timeout is exceeded, collection of the metric is interrupted, if it is in a wait(), sleep() or non-blocking read() state.
UsagescheduleThread.cancelTimeout=5000
Default
5000 milliseconds.scheduleThread.fetchLogTimeout PropertyThis property controls when a warning message is issued for a long-running metric collection process.
If a metric collection process exceeds the value of this property, which is measured in milliseconds, the agent writes a warning message to the agent.log file.
UsagescheduleThread.fetchLogTimeout=2000
Default
2000 milliseconds.scheduleThread.poolsize PropertyThis property enables a plug-in to use multiple threads for metric collection. The property can increase metric throughput for plug-ins known to be thread-safe.
vRealize Operations Manager Configuration Guide
VMware, Inc. 185
Usage
Specify the plug-in by name and the number of threads to allocate for metric collection
scheduleThread.poolsize.PluginName=2
where PluginName is the name of the plug-in to which you are allocating threads. For example,
scheduleThread.poolsize.vsphere=2
Default1
scheduleThread.queuesize PropertyUse this property to limit the metric collection queue size (the number of metrics) for a plug-in.
Usage
Specify the plug-in by name and the maximum metric queue length number:
scheduleThread.queuesize.PluginName=15000
where PluginName is the name of the plug-in on which you are imposing a metric limit.
For example,
scheduleThread.queuesize.vsphere=15000
Default1000
sigar.mirror.procnet Propertymirror /proc/net/tcp on Linux.
Defaulttrue
sigar.pdh.enableTranslation PropertyUse this property to enable translation based on the detected locale of the operating system.snmpTrapReceiver.listenAddress PropertySpecifies the port on which the End Point Operations Management agent listens for SNMP traps
By default, the agent.properties file does not include this property.
Typically SNMP uses the UDP port 162 for trap messages. This port is in the privileged range, so an agent listening for trap messages on it must run as root, or as an administrative user on Windows.
You can run the agent in the context of a non-administrative user, by configuring the agent to listen for trap messages on an unprivileged port.
Usage
vRealize Operations Manager Configuration Guide
VMware, Inc. 186
Specify an IP address (or 0.0.0.0 to specify all interfaces on the platform) and the port for UDP communications in the format
snmpTrapReceiver.listenAddress=udp:IP_address/port
To enable the End Point Operations Management agent to receive SNMP traps on an unprivileged port, specify port 1024 or higher. The following setting allows the agent to receive traps on any interface on the platform, on UDP port 1620.
snmpTrapReceiver.listenAddress=udp:0.0.0.0/1620
Managing Agent Registration on vRealize Operations Manager ServersThe End Point Operations Management agents identify themselves to the server using client certificates. The agent registration process generates the client certificate.
The client certificate includes a token that is used as the unique identifier. If you suspect that a client certificate was stolen or compromised, you must replace the certificate.
You must have AgentManager credentials to perform the agent registration process. On a freshly deployed instance of vRealize Operations Manager, before you register the End Point Operations Management agent, you must also manually activate the management pack from Administration > Solutions > Repository > Operating Systems/Remote Service Monitoring.
If you remove and reinstall an agent by removing the data directory, the agent token is retained to enable data continuity. See Understanding Agent Uninstallation and Reinstallation Implications.
Regenerate an Agent Client Certificate
An End Point Operations Management agent client certificate might expire and need to be replaced. For example, you might replace a certificate that you suspected was corrupt or compromised.
Prerequisites
Verify that you have sufficient privileges to deploy an End Point Operations Management agent. You must have vRealize Operations Manager user credentials that include a role that allows you to install End Point Operations Management agents. See Roles and Privileges in vRealize Operations Manager.
Procedure
u Start the registration process by running the setup command that is appropriate for the operating system on which the agent is running.
Operating System Run Command
Linux ep-agent.sh setup
Windows ep-agent.bat setup
The agent installer runs the setup, requests a new certificate from the server, and imports the new certificate to the keystore.
vRealize Operations Manager Configuration Guide
VMware, Inc. 187
Securing Communications with the ServerCommunication from an End Point Operations Management agent to the vRealize Operations Manager server is unidirectional, however both parties must be authenticated. Communication is always secured using transport layer security (TLS).
The first time an agent initiates a connection to the vRealize Operations Manager server following installation, the server presents its SSL certificate to the agent.
If the agent trusts the certificate that the server presented, the agent imports the server's certificate to its own keystore.
The agent trusts a server certificate if that certificate, or one of its issuers (CA) already exists in the agent's keystore.
By default, if the agent does not trust the certificate that the server presents, the agent issues a warning. You can choose to trust the certificate, or to terminate the configuration process. The vRealize Operations Manager server and the agent do not import untrusted certificates unless you respond yes to the warning prompt.
You can configure the agent to accept a specific thumb print without warning by specifying the thumb print of the certificate for the vRealize Operations Manager server.
By default, the vRealize Operations Manager server generates a self-signed CA certificate that is used to sign the certificate of all the nodes in the cluster. In this case, the thumbprint must be the thumbprint of the issuer, to allow for the agent to communicate with all nodes.
As a vRealize Operations Manager administrator, you can import a custom certificate instead of using the default. In this instance, you must specify a thumbprint corresponding to that certificate as the value of this property.
Either the SHA1 or SHA256 algorithm can be used for the thumbprint.
Launching Agents from a Command LineYou can launch agents from a command line on both Linux and Windows operating systems.
Use the appropriate process for your operating system.
If you are deleting the data directory, do not use Windows Services to stop and start an End Point Operations Management agent. Stop the agent using epops-agent.bat stop. Delete the data directory, then start the agent using epops-agent.bat start.
Run the Agent Launcher from a Linux Command Line
You can initiate the agent launcher and agent lifecycle commands with the epops-agent.sh script in the AgentHome/bin directory.
Procedure
1 Open a command shell or terminal window.
vRealize Operations Manager Configuration Guide
VMware, Inc. 188
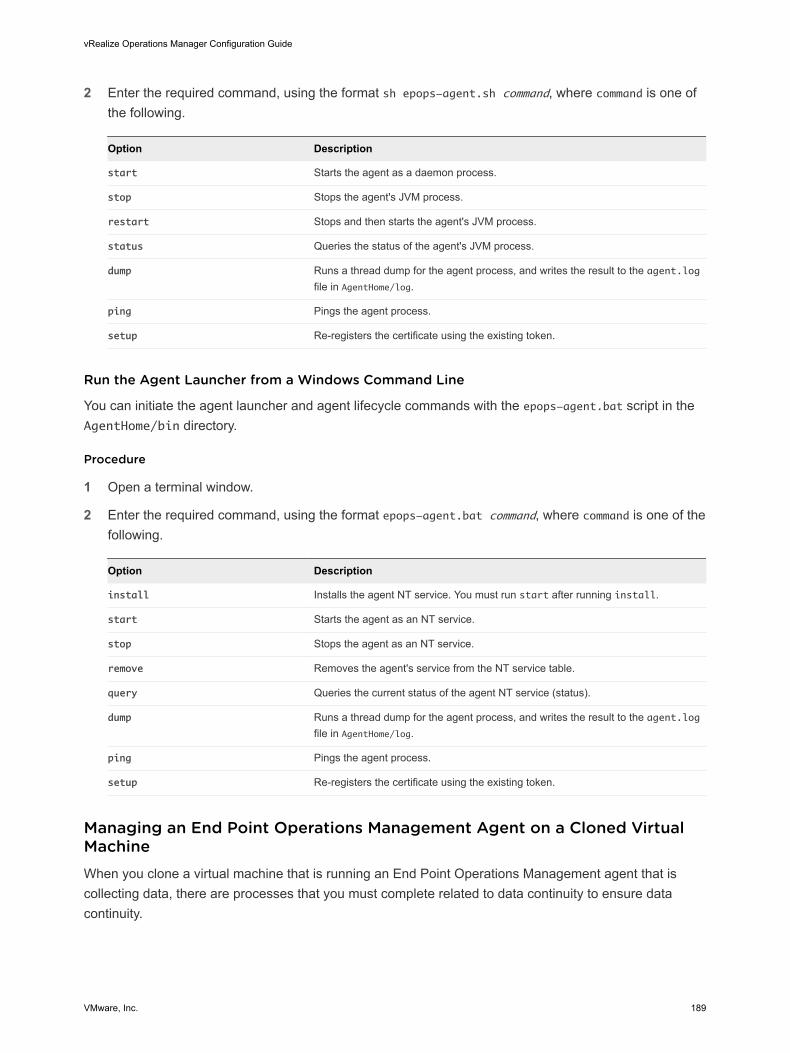
2 Enter the required command, using the format sh epops-agent.sh command, where command is one of the following.
Option Description
start Starts the agent as a daemon process.
stop Stops the agent's JVM process.
restart Stops and then starts the agent's JVM process.
status Queries the status of the agent's JVM process.
dump Runs a thread dump for the agent process, and writes the result to the agent.log file in AgentHome/log.
ping Pings the agent process.
setup Re-registers the certificate using the existing token.
Run the Agent Launcher from a Windows Command Line
You can initiate the agent launcher and agent lifecycle commands with the epops-agent.bat script in the AgentHome/bin directory.
Procedure
1 Open a terminal window.
2 Enter the required command, using the format epops-agent.bat command, where command is one of the following.
Option Description
install Installs the agent NT service. You must run start after running install.
start Starts the agent as an NT service.
stop Stops the agent as an NT service.
remove Removes the agent's service from the NT service table.
query Queries the current status of the agent NT service (status).
dump Runs a thread dump for the agent process, and writes the result to the agent.log file in AgentHome/log.
ping Pings the agent process.
setup Re-registers the certificate using the existing token.
Managing an End Point Operations Management Agent on a Cloned Virtual MachineWhen you clone a virtual machine that is running an End Point Operations Management agent that is collecting data, there are processes that you must complete related to data continuity to ensure data continuity.
vRealize Operations Manager Configuration Guide
VMware, Inc. 189
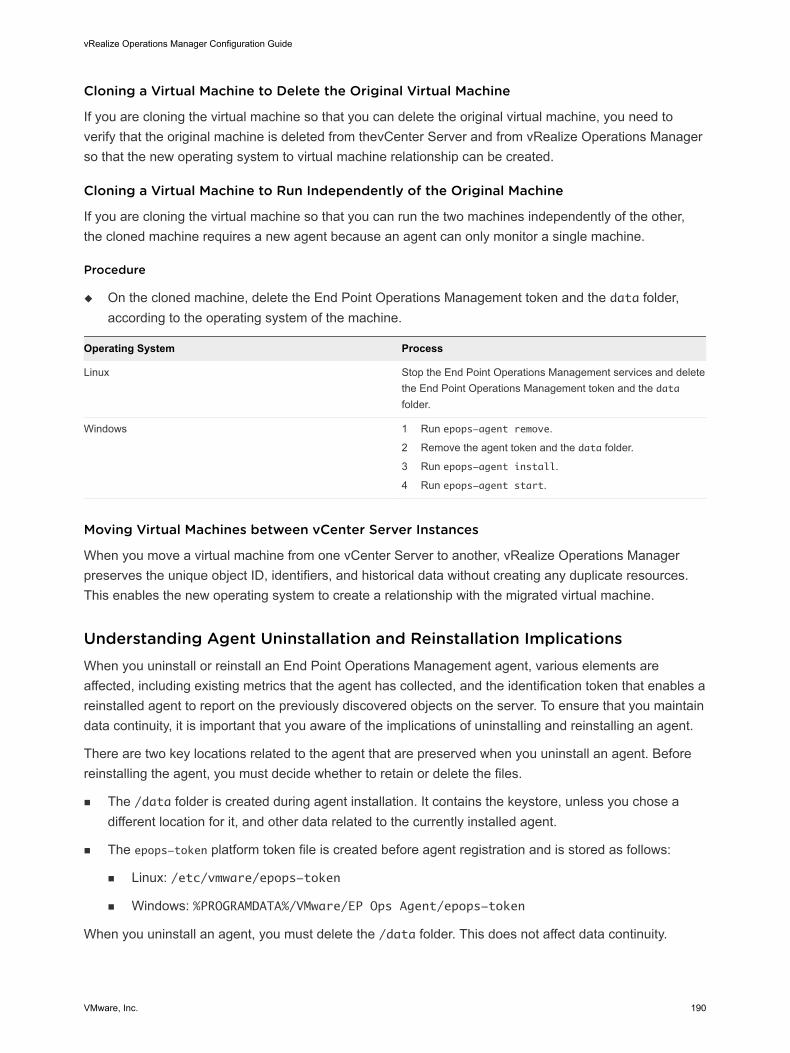
Cloning a Virtual Machine to Delete the Original Virtual Machine
If you are cloning the virtual machine so that you can delete the original virtual machine, you need to verify that the original machine is deleted from thevCenter Server and from vRealize Operations Manager so that the new operating system to virtual machine relationship can be created.
Cloning a Virtual Machine to Run Independently of the Original Machine
If you are cloning the virtual machine so that you can run the two machines independently of the other, the cloned machine requires a new agent because an agent can only monitor a single machine.
Procedure
u On the cloned machine, delete the End Point Operations Management token and the data folder, according to the operating system of the machine.
Operating System Process
Linux Stop the End Point Operations Management services and delete the End Point Operations Management token and the data folder.
Windows 1 Run epops-agent remove.
2 Remove the agent token and the data folder.
3 Run epops-agent install.
4 Run epops-agent start.
Moving Virtual Machines between vCenter Server Instances
When you move a virtual machine from one vCenter Server to another, vRealize Operations Manager preserves the unique object ID, identifiers, and historical data without creating any duplicate resources. This enables the new operating system to create a relationship with the migrated virtual machine.
Understanding Agent Uninstallation and Reinstallation ImplicationsWhen you uninstall or reinstall an End Point Operations Management agent, various elements are affected, including existing metrics that the agent has collected, and the identification token that enables a reinstalled agent to report on the previously discovered objects on the server. To ensure that you maintain data continuity, it is important that you aware of the implications of uninstalling and reinstalling an agent.
There are two key locations related to the agent that are preserved when you uninstall an agent. Before reinstalling the agent, you must decide whether to retain or delete the files.
n The /data folder is created during agent installation. It contains the keystore, unless you chose a different location for it, and other data related to the currently installed agent.
n The epops-token platform token file is created before agent registration and is stored as follows:
n Linux: /etc/vmware/epops-token
n Windows: %PROGRAMDATA%/VMware/EP Ops Agent/epops-token
When you uninstall an agent, you must delete the /data folder. This does not affect data continuity.
vRealize Operations Manager Configuration Guide
VMware, Inc. 190
However, to enable data continuity it is important that you do not delete the epops-token file. This file contains the identity token for the platform object. Following agent reinstallation, the token enables the agent to be synchronized with the previously discovered objects on the server.
When you reinstall the agent, the system notifies you whether it found an existing token, and provides its identifier. If a token is found, the system uses that token. If a token in not found, the system creates a new one. In the case of an error, the system prompts you to provide either a location and file name for the existing token file, or a location and file name for a new one.
The method that you use to uninstall an agent depends on how it was installed.
n Uninstall an Agent that was Installed from an Archive
You can use this procedure to uninstall agents that you installed on virtual machines in your environment from an archive.
n Uninstall an Agent that was Installed Using an RPM Package
You can use this procedure to uninstall agents that you installed on virtual machines in your environment using an RPM package.
n Uninstall an Agent that was Installed Using a Windows Executable
You can use this procedure to uninstall agents that you installed on virtual machines in your environment from a Windows EXE file.
n Reinstall an Agent
If you change the IP address, hostname or port number of the vRealize Operations Manager server, you need to uninstall and reinstall your agents.
Uninstall an Agent that was Installed from an Archive
You can use this procedure to uninstall agents that you installed on virtual machines in your environment from an archive.
Prerequisites
Verify that the agent is stopped.
Procedure
1 (Optional) If you have a Windows operating system, run ep-agent.bat remove to remove the agent service.
2 Select the uninstall option that is appropriate to your situation.
n If you do not intend to reinstall the agent after you have uninstalled it, delete the agent directory.
The default name of the directory is epops-agent-version.
n If you are reinstalling the agent after you have uninstalled it, delete the /data directory.
vRealize Operations Manager Configuration Guide
VMware, Inc. 191
3 (Optional) If you do not intend to reinstall the agent after you have uninstalled it, or you do not need to maintain data continuity, delete the epops-token platform token file.
Depending on your operating system, the file to delete is one of the following, unless otherwise defined in the properties file.
n Linux: /etc/epops/epops-token
n Windows: %PROGRAMDATA%/VMware/EP Ops Agent/epops-token
Uninstall an Agent that was Installed Using an RPM Package
You can use this procedure to uninstall agents that you installed on virtual machines in your environment using an RPM package.
When you are uninstalling an End Point Operations Management agent, it is good practice to stop the agent running, to reduce unnecessary load on the server.
Procedure
u On the virtual machine from which you are removing the agent, open a command line and run rpm -e epops-agent.
The agent is uninstalled from the virtual machine.
Uninstall an Agent that was Installed Using a Windows Executable
You can use this procedure to uninstall agents that you installed on virtual machines in your environment from a Windows EXE file.
When you are uninstalling an End Point Operations Management agent, it is good practice to stop the agent running, to reduce unnecessary load on the server.
Procedure
u Double-click unins000.exe in the installation destination directory for the agent.
The agent is uninstalled from the virtual machine.
Reinstall an Agent
If you change the IP address, hostname or port number of the vRealize Operations Manager server, you need to uninstall and reinstall your agents.
Prerequisites
To maintain data continuity, you must have retained the epops-token platform token file when you uninstalled your agent. See Uninstall an Agent that was Installed from an Archive.
When you reinstall an End Point Operations Management agent on a virtual machine, objects that had previously been detected are no longer monitored. To avoid this situation, do not restart the End Point Operations Management agent until the plug-in synchronization is complete.
vRealize Operations Manager Configuration Guide
VMware, Inc. 192
Procedure
u Run the agent install procedure that is relevant to your operating system.
See Selecting an Agent Installer Package.
What to do next
After you reinstall an agent, MSSQL resources might stop receiving data. If this happens, edit the problematic resources and click OK.
Install Multiple End Point Operations Management Agents SimultaneouslyIf you have multiple End Point Operations Management agents to install at one time, you can create a single standardized agent.properties file that all the agents can use.
Installing multiple agents entails a number of steps. Perform the steps in the order listed.
Prerequisites
Verify that the following prerequisites are satisfied.
1 Set up an installation server.
An installation server is a server that can access the target platforms from which to perform remote installation.
The server must be configured with a user account that has permissions to SSH to each target platform without requiring a password.
2 Verify that each target platform on which an End Point Operations Management agent will be installed has the following items.
n A user account that is identical to that created on the installation server.
n An identically named installation directory, for example /home/epomagent.
n A trusted keystore, if required.
Procedure
1 Create a Standard End Point Operations Management Agent Properties File
You can create a single properties file that contains property values that multiple agents use.
2 Deploy and Start Multiple Agents One-By-One
You can perform remote installations to deploy multiple agents that use a single agent.properties file one-by-one.
3 Deploy and Start Multiple Agents Simultaneously
You can perform remote installations to simultaneously deploy agents that use a single agent.properties file.
Create a Standard End Point Operations Management Agent Properties File
You can create a single properties file that contains property values that multiple agents use.
vRealize Operations Manager Configuration Guide
VMware, Inc. 193
To enable multiple agent deployment, you create an agent.properties file that defines the agent properties required for the agent to start up and connect with the vRealize Operations Manager server. If you supply the necessary information in the properties file, each agent locates its setup configuration at startup, rather than prompting you for the location. You can copy the agent properties file to the agent installation directory, or to a location available to the installed agent.
Prerequisites
Verify that the prerequisites in Install Multiple End Point Operations Management Agents Simultaneously are satisfied.
Procedure
1 Create an agent.properties file in a directory.
You will copy this file later to other machines.
2 Configure the properties as required.
The minimum configuration is the IP address, user name, password, thumb print, and port of the vRealize Operations Manager installation server.
3 Save your configurations.
The first time that the agents are started, they read the agent.properties file to identify the server connection information. The agents connect to the server and register themselves.
What to do next
Perform remote agent installations. See Deploy and Start Multiple Agents One-By-One or Deploy and Start Multiple Agents Simultaneously.
Deploy and Start Multiple Agents One-By-One
You can perform remote installations to deploy multiple agents that use a single agent.properties file one-by-one.
Prerequisites
n Verify that the prerequisites in Install Multiple End Point Operations Management Agents Simultaneously are satisfied.
n Verify that you configured a standard agent properties file and copied it to the agent installation, or to a location available to the agent installation.
Procedure
1 Log in to the installation server user account that you configured with permissions to use SSH to connect to each target platform without requiring a password.
2 Use SSH to connect to the remote platform.
3 Copy the agent archive to the agent host.
4 Unpack the agent archive.
vRealize Operations Manager Configuration Guide
VMware, Inc. 194
5 Copy the agent.properties file to the AgentHome/conf directory of the unpacked agent archive on the remote platform.
6 Start the new agent.
The agent registers with the vRealize Operations Manager server and the agent runs an autodiscovery scan to discover its host platform and supported managed products that are running on the platform.
Deploy and Start Multiple Agents Simultaneously
You can perform remote installations to simultaneously deploy agents that use a single agent.properties file.
Prerequisites
n Verify that the prerequisites in Install Multiple End Point Operations Management Agents Simultaneously are satisfied.
n Verify that you configured a standard agent properties file and copied it to the agent installation, or to a location available to the agent installation. See Create a Standard End Point Operations Management Agent Properties File.
Procedure
1 Create a hosts.txt file on your installation server that maps the hostname to the IP address of each platform on which you are installing an agent.
2 Open a command-line shell on the installation server.
3 Type the following command in the shell, supplying the correct name for the agent package in the export command.
$ export AGENT=epops-agent-x86-64-linux-1.0.0.tar.gz
$ export PATH_TO_AGENT_INSTALL=</path/to/agent/install>
$ for host in `cat hosts.txt`; do scp $AGENT $host:$PATH_TO_AGENT_INSTALL && ssh $host "cd
$PATH_TO_AGENT_INSTALL; tar zxfp $AGENT &&
./epops-agent-1.0.0/ep-agent.sh start"; done
4 (Optional) If the target hosts have sequential names, for example host001, host002, host003, and so on, you can skip the hosts.txt file and use the seq command.
$ export AGENT=epops-agent-x86-64-linux-1.0.0.tar.gz
$ for i in `seq 1 9`; do scp $AGENT host$i: && ssh host$i "tar zxfp $AGENT &&
./epops-agent-1.0.0/ep-agent.sh start"; done
The agents register with the vRealize Operations Manager server and the agents run an autodiscovery scan to discover their host platform and supported managed products that are running on the platform.
Upgrade the End Point Operations Management AgentYou can upgrade the 6.3 or 6.4 version of an End Point Operations Management agent to a 6.5 version or later, from the vRealize Operations Manager administration interface.
vRealize Operations Manager Configuration Guide
VMware, Inc. 195
Prerequisites
n Download the End Point Operations Management PAK file.
n Before you install the PAK file, or upgrade your vRealize Operations Manager instance, clone any customized content to preserve it. Customized content can include alert definitions, symptom definitions, recommendations, and views. Then, during the software update, you select the options named Install the PAK file even if it is already installed and Reset out-of-the-box content.
Procedure
1 Log into the vRealize Operations Manager administration interface of your cluster at https://IP-address/admin.
2 Click Software Update in the left panel.
3 Click Install a Software Update in the main panel.
4 From the Add Software Update dialog box, click Browse to select the PAK file.
5 Click Upload and follow the steps in the wizard to install your PAK file.
6 After Step 4 of the install is complete, you return to the Software Update page of the End Point Operations Management administration interface.
7 A message that indicates that the software update completed successfully appears in the main pane.
If any of the agents have not installed successfully, rerun the upgrade steps and ensure that you have selected Install the PAK file even if it is already installed in the Add Software Update - Select Software Update page.
What to do next
You can view the log files from the vRealize Operations Manager administration interface > Support page.
Access and View the Log Files
You can access and view the log files to troubleshoot agent upgrade failure. You can verify the status of the agents during and after the upgrade process to find out if the agents have upgraded successfully.
You can view the status of the agents during the upgrade from the epops-agent-upgrade-status.txt file. You can view a final report of the number of agents that have successfully upgraded or failed upgrade from the epops-agent-bundle-upgrade-summary.txt file.
Procedure
1 Log into the vRealize Operations Manager administration interface of your cluster at https://IP-address/admin.
2 Click Support in the left panel.
3 Click the Logs tab in the right pane and double-click EPOPS.
4 Double-click the log file to view the contents.
vRealize Operations Manager Configuration Guide
VMware, Inc. 196
Roles and Privileges in vRealize Operations ManagervRealize Operations Manager provides several predefined roles to assign privileges to users. You can also create your own roles.
You must have privileges to access specific features in the vRealize Operations Manager user interface. The roles associated with your user account determine the features you can access and the actions you can perform.
Each predefined role includes a set of privileges for users to perform, create, read, update, or delete actions on components such as dashboards, reports, administration, capacity, policies, problems, symptoms, alerts, user account management, and adapters. For information about roles and associated permissions, see KB 59484.
Administrator Includes privileges to all features, objects, and actions in vRealize Operations Manager.
PowerUser Users have privileges to perform the actions of the Administrator role except for privileges to user management and cluster management. vRealize Operations Manager maps vCenter Server users to this role.
PowerUserMinusRemediation
Users have privileges to perform the actions of the Administrator role except for privileges to user management, cluster management, and remediation actions.
ContentAdmin Users can manage all content, including views, reports, dashboards, and custom groups in vRealize Operations Manager.
AgentManager Users can deploy and configure End Point Operations Management agents.
GeneralUser-1 through GeneralUser-4
These predefined template roles are initially defined as ReadOnly roles. vCenter Server administrators can configure these roles to create combinations of roles to give users multiple types of privileges. Roles are synchronized to vCenter Server once during registration.
ReadOnly Users have read-only access and can perform read operations, but cannot perform write actions such as create, update, or delete.
Registering Agents on ClustersYou can streamline the process of registering agents on clusters by defining a DNS name for a cluster and configuring that cluster so that the metrics are shared sequentially in a loop.
You only need to register the agent on the DNS, not on the IP address of each individual machine in the cluster. If you do register the agent on each node in the cluster, it affects the scale of your environment.
vRealize Operations Manager Configuration Guide
VMware, Inc. 197
When you have configured the cluster so that the received metrics are shared in a sequential loop, each time that the agent queries the DNS server for an IP address, the returned address is for one of the virtual machines in the cluster. The next time the agent queries the DNS, it sequentially supplies the IP address of the next virtual machine in the cluster, and so on. The clustered machines are set up in a loop configuration so that each machine receives metrics in turn, ensuring a balanced load.
After you configure the DNS, it is important to maintain it, ensuring that when machines are added or removed from the cluster, their IP address information is updated accordingly.
Manually Create Operating System ObjectsThe agent discovers some of the objects to monitor. You can manually add other objects, such as files, scripts or processes, and specify the details so that the agent can monitor them.
The Monitor OS Object action only appears in the Actions menu of an object that can be a parent object.
Procedure
1 In the left pane of vRealize Operations Manager, select the agent adapter object that is to be the parent under which you are creating an OS object.
2 Select Actions > Monitor OS Object.
A list of parent object context-sensitive objects appear in the menu.
3 Choose one of the following options.
n Click an object type from the list to open the Monitor OS Object dialog box for that object type.
The three most popularly selected object types appear in the list.
n If the object type that you want to select is not in the list, click More to open the Monitor OS Object dialog box. Select the object type from the complete list of objects that are available for selection in the Object Type menu.
4 Specify a display name for the OS object.
5 Enter the appropriate values in the other text boxes.
The options in the menu are filtered according to the OS object type that you select.
Some text boxes might display default values, which you can overwrite if necessary. Note the following information about default values.
vRealize Operations Manager Configuration Guide
VMware, Inc. 198
Option Value
Process Supply the PTQL query in the form: Class.Attribute.operator=value.
For example, Pid.PidFile.eq=/var/run/sshd.pid.
Where:
n Class is the name of the Sigar class without the Proc prefix.
n Attribute is an attribute of the given Class, index into an array or key in a Map class.
n operator is one of the following (for String values):
n eq Equal to value
n ne Not Equal to value
n ew Ends with value
n sw Starts with value
n ct Contains value (substring)
n re Regular expression value matches
Delimit queries with a comma.
Windows Service
Monitor an application that runs as a service under Windows.
To configure it, you supply its Service Name in Windows.
To determine the Service Name:
1 Select Run from the Windows Start menu.
2 Type services.msc in the run dialog box and click OK.
3 In the list of services displayed, right-click the service to monitor and choose Properties.
4 Locate the Service Name on the General tab.
Script Configure vRealize Operations Manager to periodically run a script that collects a system or application metric.
6 Click OK.
You cannot click OK until you enter values for all the mandatory text boxes.
The OS object appears under its parent object and monitoring begins.
Caution If you enter invalid details when you create an OS object, the object is created but the agent cannot discover it, and metrics are not collected.
Managing Objects with Missing Configuration ParametersSometimes when an object is discovered by vRealize Operations Manager for the first time, the absence of values for some mandatory configuration parameters is detected. You can edit the object's parameters to supply the missing values.
If you select Custom Groups > Objects with Missing Configuration (EP Ops) in the Environment Overview view of vRealize Operations Manager, you can see the list of all objects that have missing mandatory configuration parameters. In addition, objects with such missing parameters return an error in the Collection Status data.
If you select an object in the vRealize Operations Manager user interface that has missing configuration parameters, the red Missing Configuration State icon appears on the menu bar. When you point to the icon, details about the specific issue appear.
You can add the missing parameter values through the Action > Edit Object menu.
vRealize Operations Manager Configuration Guide
VMware, Inc. 199
Mapping Virtual Machines to Operating SystemsYou can map your virtual machines to an operating system to provide additional information to assist you to determine the root cause of why an alert was triggered for a virtual machine.
vRealize Operations Manager monitors your ESXi hosts and the virtual machines located on them. When you deploy an End Point Operations Management agent, it discovers the virtual machines and the objects that are running on them. By correlating the virtual machines discovered by the End Point Operations Management agent with the operating systems monitored by vRealize Operations Manager you have more details to determine the exact cause of an alert being triggered.
Verify that you have the vCenter Adapter configured with the vCenter Server that manages the virtual machines. You also need to ensure that you have VMware Tools that are compatible with the vCenter Server installed on each of the virtual machines.
User ScenariovRealize Operations Manager is running but you have not yet deployed the End Point Operations Management agent in your environment. You configured vRealize Operations Manager to send you alerts when CPU problems occur. You see an alert on your dashboard because insufficient CPU capacity is available on one of your virtual machines that is running a Linux operating system. You deploy another two virtual CPUs but the alert remains. You struggle to determine what is causing the problem.
In the same situation, if you deployed the End Point Operations Management agent, you can see the objects on your virtual machines, and determine that an application-type object is using all available CPU capacity. When you add more CPU capacity, it also uses that. You disable the object and your CPU availability is no longer a problem.
Viewing Objects on Virtual MachinesAfter you deploy an End Point Operations Management agent on a virtual machine, the machine is mapped to the operating system and you can see the objects on that machine.
All the actions and the views that are available to other objects in your vRealize Operations Manager environment are also available for newly discovered server, service, and application objects, and for the deployed agent.
You can see the objects on a virtual machine in the inventory when you select the machine by clicking Environment from the menu, and then from the left pane click vSphere Environment > vSphere Hosts and Clusters. You can see the objects and the deployed agent under the operating system.
When you select an object, the center pane of the user interface displays data relevant to that objects.
Customizing How End Point Operations Management Monitors Operating SystemsEnd Point Operations Management gathers operating system metrics through agent-based collections. In addition to the features available after initial configuration of End Point Operations Management, you can enable remote monitoring, enable or disable plug-ins for additional monitoring, and customize End Point Operations Management logging.
vRealize Operations Manager Configuration Guide
VMware, Inc. 200
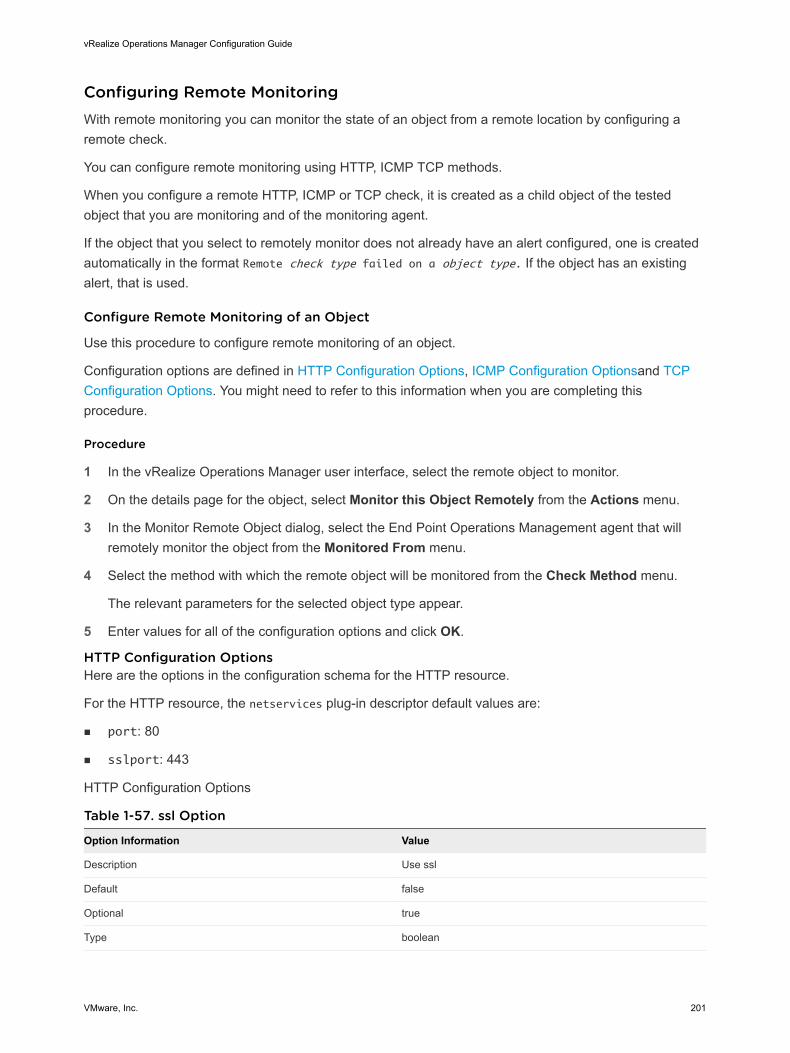
Configuring Remote MonitoringWith remote monitoring you can monitor the state of an object from a remote location by configuring a remote check.
You can configure remote monitoring using HTTP, ICMP TCP methods.
When you configure a remote HTTP, ICMP or TCP check, it is created as a child object of the tested object that you are monitoring and of the monitoring agent.
If the object that you select to remotely monitor does not already have an alert configured, one is created automatically in the format Remote check type failed on a object type. If the object has an existing alert, that is used.
Configure Remote Monitoring of an Object
Use this procedure to configure remote monitoring of an object.
Configuration options are defined in HTTP Configuration Options, ICMP Configuration Optionsand TCP Configuration Options. You might need to refer to this information when you are completing this procedure.
Procedure
1 In the vRealize Operations Manager user interface, select the remote object to monitor.
2 On the details page for the object, select Monitor this Object Remotely from the Actions menu.
3 In the Monitor Remote Object dialog, select the End Point Operations Management agent that will remotely monitor the object from the Monitored From menu.
4 Select the method with which the remote object will be monitored from the Check Method menu.
The relevant parameters for the selected object type appear.
5 Enter values for all of the configuration options and click OK.
HTTP Configuration OptionsHere are the options in the configuration schema for the HTTP resource.
For the HTTP resource, the netservices plug-in descriptor default values are:
n port: 80
n sslport: 443
HTTP Configuration Options
Table 1-57. ssl Option
Option Information Value
Description Use ssl
Default false
Optional true
Type boolean
vRealize Operations Manager Configuration Guide
VMware, Inc. 201
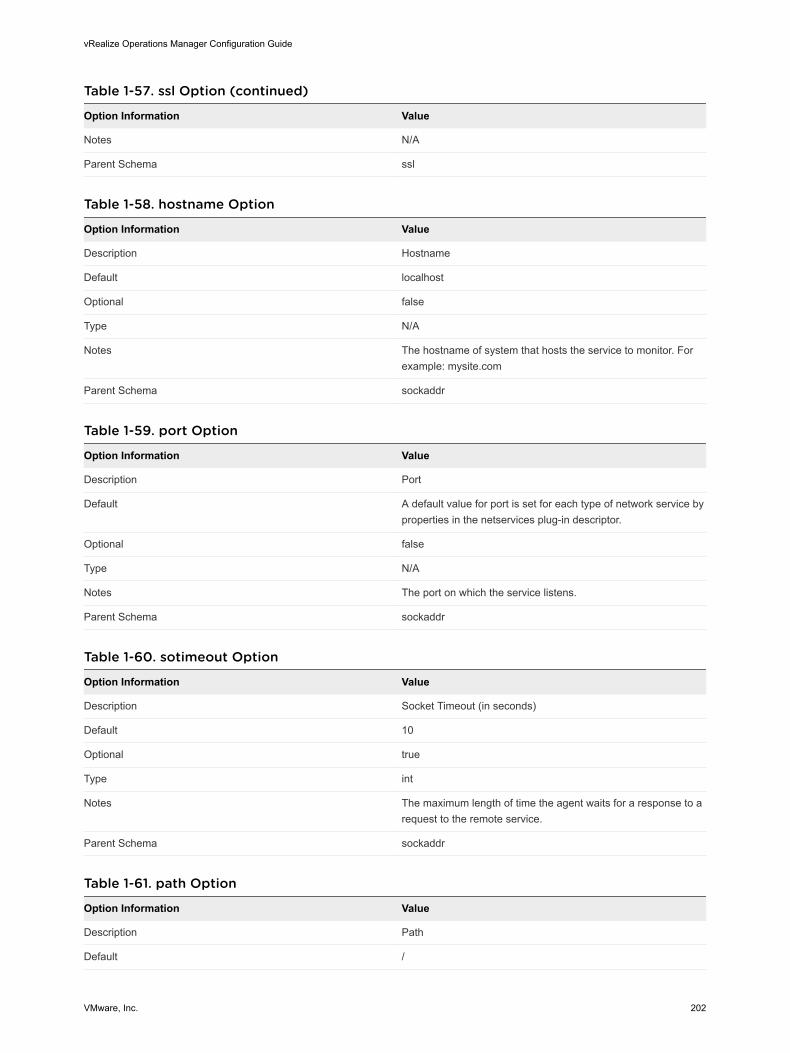
Table 1-57. ssl Option (continued)
Option Information Value
Notes N/A
Parent Schema ssl
Table 1-58. hostname Option
Option Information Value
Description Hostname
Default localhost
Optional false
Type N/A
Notes The hostname of system that hosts the service to monitor. For example: mysite.com
Parent Schema sockaddr
Table 1-59. port Option
Option Information Value
Description Port
Default A default value for port is set for each type of network service by properties in the netservices plug-in descriptor.
Optional false
Type N/A
Notes The port on which the service listens.
Parent Schema sockaddr
Table 1-60. sotimeout Option
Option Information Value
Description Socket Timeout (in seconds)
Default 10
Optional true
Type int
Notes The maximum length of time the agent waits for a response to a request to the remote service.
Parent Schema sockaddr
Table 1-61. path Option
Option Information Value
Description Path
Default /
vRealize Operations Manager Configuration Guide
VMware, Inc. 202
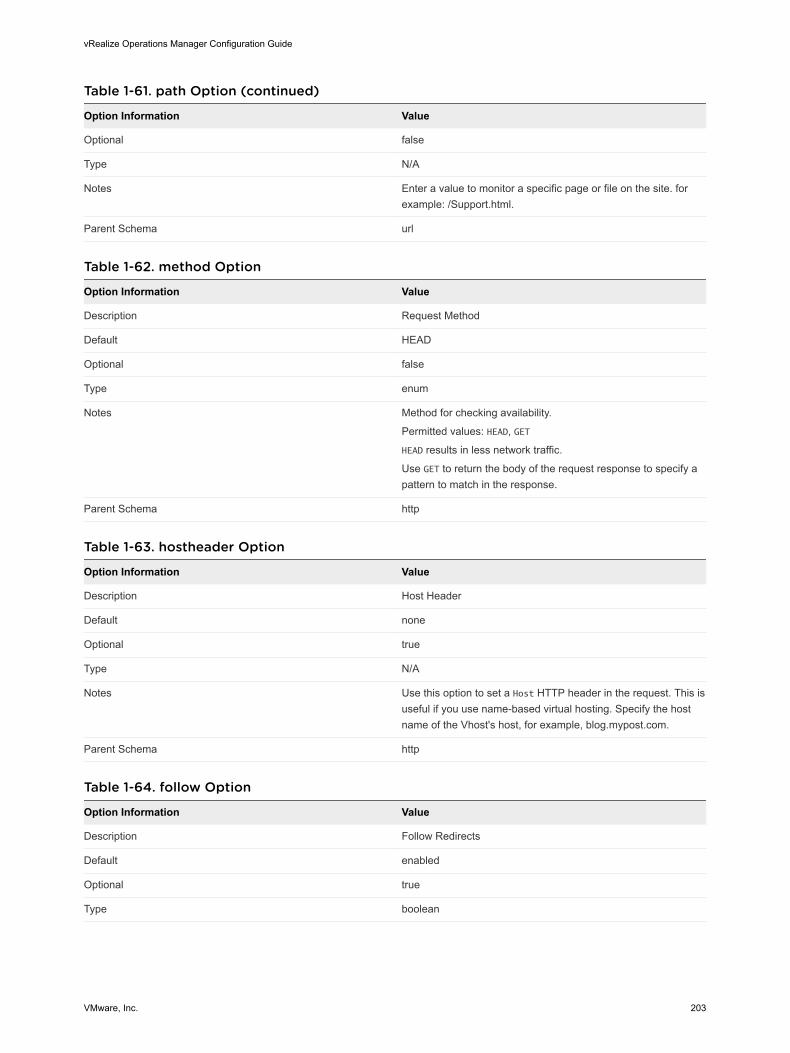
Table 1-61. path Option (continued)
Option Information Value
Optional false
Type N/A
Notes Enter a value to monitor a specific page or file on the site. for example: /Support.html.
Parent Schema url
Table 1-62. method Option
Option Information Value
Description Request Method
Default HEAD
Optional false
Type enum
Notes Method for checking availability.
Permitted values: HEAD, GET
HEAD results in less network traffic.
Use GET to return the body of the request response to specify a pattern to match in the response.
Parent Schema http
Table 1-63. hostheader Option
Option Information Value
Description Host Header
Default none
Optional true
Type N/A
Notes Use this option to set a Host HTTP header in the request. This is useful if you use name-based virtual hosting. Specify the host name of the Vhost's host, for example, blog.mypost.com.
Parent Schema http
Table 1-64. follow Option
Option Information Value
Description Follow Redirects
Default enabled
Optional true
Type boolean
vRealize Operations Manager Configuration Guide
VMware, Inc. 203
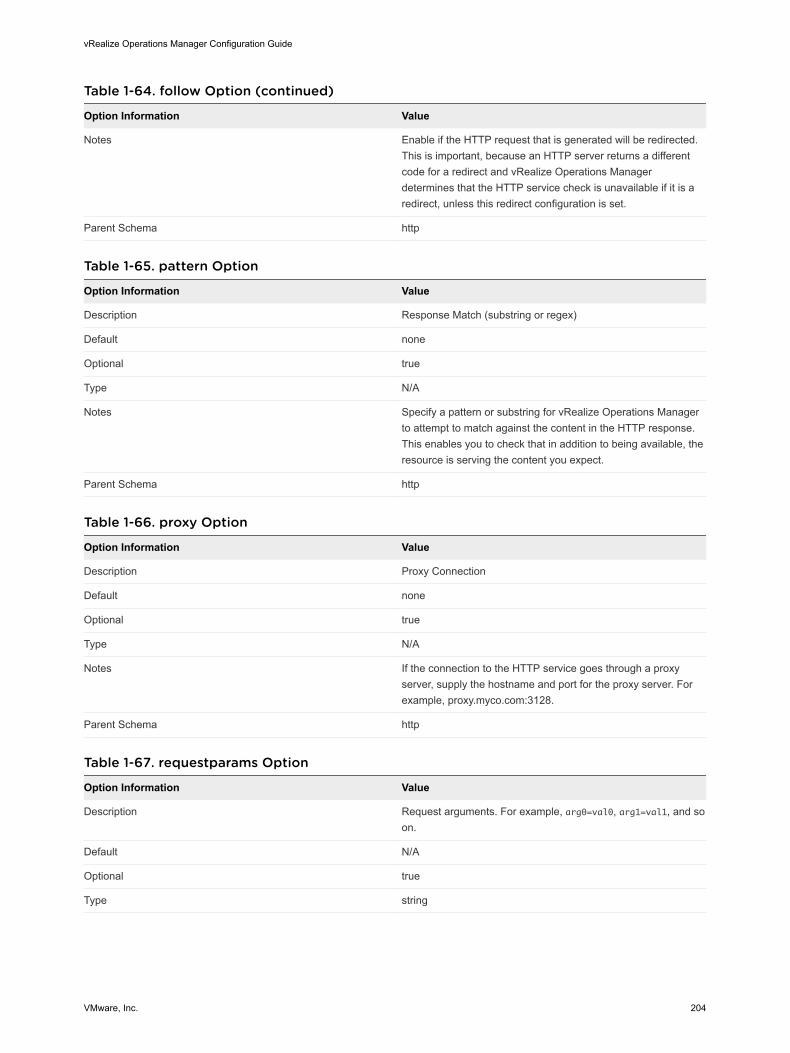
Table 1-64. follow Option (continued)
Option Information Value
Notes Enable if the HTTP request that is generated will be redirected. This is important, because an HTTP server returns a different code for a redirect and vRealize Operations Manager determines that the HTTP service check is unavailable if it is a redirect, unless this redirect configuration is set.
Parent Schema http
Table 1-65. pattern Option
Option Information Value
Description Response Match (substring or regex)
Default none
Optional true
Type N/A
Notes Specify a pattern or substring for vRealize Operations Manager to attempt to match against the content in the HTTP response. This enables you to check that in addition to being available, the resource is serving the content you expect.
Parent Schema http
Table 1-66. proxy Option
Option Information Value
Description Proxy Connection
Default none
Optional true
Type N/A
Notes If the connection to the HTTP service goes through a proxy server, supply the hostname and port for the proxy server. For example, proxy.myco.com:3128.
Parent Schema http
Table 1-67. requestparams Option
Option Information Value
Description Request arguments. For example, arg0=val0, arg1=val1, and so on.
Default N/A
Optional true
Type string
vRealize Operations Manager Configuration Guide
VMware, Inc. 204
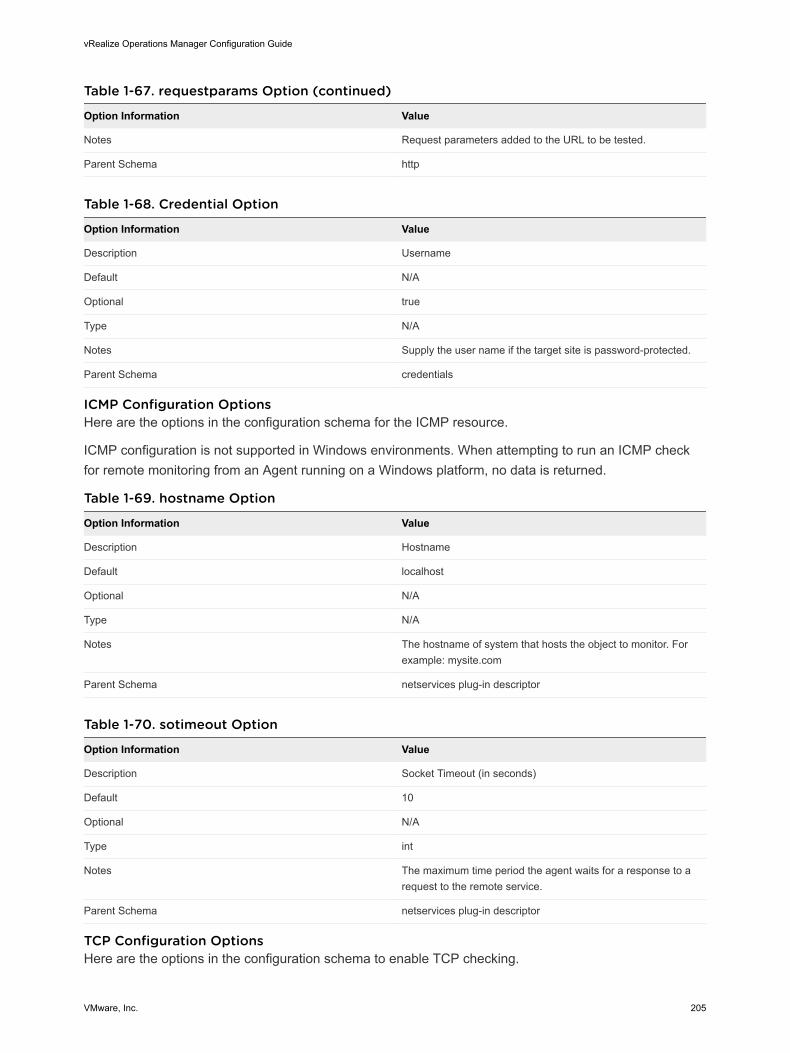
Table 1-67. requestparams Option (continued)
Option Information Value
Notes Request parameters added to the URL to be tested.
Parent Schema http
Table 1-68. Credential Option
Option Information Value
Description Username
Default N/A
Optional true
Type N/A
Notes Supply the user name if the target site is password-protected.
Parent Schema credentials
ICMP Configuration OptionsHere are the options in the configuration schema for the ICMP resource.
ICMP configuration is not supported in Windows environments. When attempting to run an ICMP check for remote monitoring from an Agent running on a Windows platform, no data is returned.
Table 1-69. hostname Option
Option Information Value
Description Hostname
Default localhost
Optional N/A
Type N/A
Notes The hostname of system that hosts the object to monitor. For example: mysite.com
Parent Schema netservices plug-in descriptor
Table 1-70. sotimeout Option
Option Information Value
Description Socket Timeout (in seconds)
Default 10
Optional N/A
Type int
Notes The maximum time period the agent waits for a response to a request to the remote service.
Parent Schema netservices plug-in descriptor
TCP Configuration OptionsHere are the options in the configuration schema to enable TCP checking.
vRealize Operations Manager Configuration Guide
VMware, Inc. 205
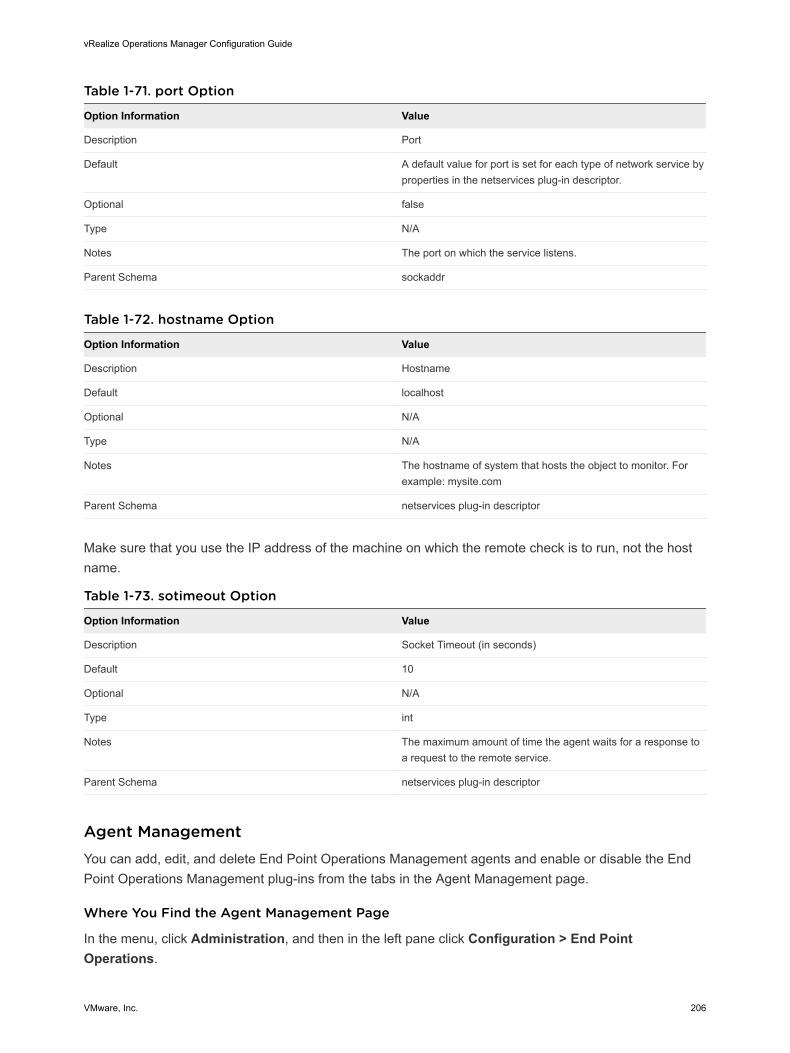
Table 1-71. port Option
Option Information Value
Description Port
Default A default value for port is set for each type of network service by properties in the netservices plug-in descriptor.
Optional false
Type N/A
Notes The port on which the service listens.
Parent Schema sockaddr
Table 1-72. hostname Option
Option Information Value
Description Hostname
Default localhost
Optional N/A
Type N/A
Notes The hostname of system that hosts the object to monitor. For example: mysite.com
Parent Schema netservices plug-in descriptor
Make sure that you use the IP address of the machine on which the remote check is to run, not the host name.
Table 1-73. sotimeout Option
Option Information Value
Description Socket Timeout (in seconds)
Default 10
Optional N/A
Type int
Notes The maximum amount of time the agent waits for a response to a request to the remote service.
Parent Schema netservices plug-in descriptor
Agent ManagementYou can add, edit, and delete End Point Operations Management agents and enable or disable the End Point Operations Management plug-ins from the tabs in the Agent Management page.
Where You Find the Agent Management Page
In the menu, click Administration, and then in the left pane click Configuration > End Point Operations.
vRealize Operations Manager Configuration Guide
VMware, Inc. 206
Agents Tab
You can view the End Point Operations Management agents that are installed and deployed in your environment.
Where You Find the Agents Tab
In the menu, click Administration, and then in the left pane click Configuration > End Point Operations.
How the Agents Tab Works
You can view all the agents that are installed, the virtual machines on which they are installed, their operating system and the agent bundle version. You can also view the collection details of each agent. You can filter the list of agents based on the name of the agent. You add a filter from the upper-right corner of the toolbar. You can sort the Agent Token, Agent Name, Collection State, and Collection Status columns by clicking the column name.
Plug-ins Tab
End Point Operations Management agents include plug-ins that determine which objects to monitor, how they should be monitored, which metrics to collect, and so on. Some plug-ins are included in the default End Point Operations Management agent installation, and other plug-ins might be added as part of any management pack solution that you install to extend the vRealize Operations Manager monitoring process.
You can use the Plug-ins tab from the Agents Management page to disable or enable the agent plug-ins that are deployed in your environment as part of a solution installation. For example, you might want to temporarily disable a plug-in so that you can analyze the implication of that plug-in on a monitored virtual machine. To access the Plug-ins tab, in the menu, click Administration, and then in the left pane click Configuration > End Point Operations. You can sort all the columns in the tab by clicking the column name.
All the default plug-ins and the plug-ins that are deployed when you installed one or more solutions are listed alphabetically on the tab.
You must have Manage Plug-ins permissions to enable and disable plug-ins.
When you disable a plug-in, it is removed from all the agents on which it has existed, and the agent no longer collects the metrics and other data related to that plug-in. The plug-in is marked as disabled on the vRealize Operations Manager server.
You cannot disable the default plug-ins that are installed during the vRealize Operations Manager installation.
You use the action menu that appears when you click the gear wheel icon to disable or enable plug-ins.
Before you deploy a new version of a plug-in, you must implement a shutdown method. If you do not implement a shutdown method, the existing plug-in version does not shut down so that a new instance is created and allocated resources such as static threads are not released. Implement a shutdown method for these plug-ins.
n Plug-ins that use third-party libraries
vRealize Operations Manager Configuration Guide
VMware, Inc. 207
n Plug-ins that use native libraries
n Plug-ins that use connection pools
n Plug-ins that might lock files, which cause issues on Windows operating systems
It is good practice that plug-ins do not use threads, third-party libraries, or static collection.
Configuring Plug-in Loading
At startup, an End Point Operations Management agent loads all the plug-ins in the AgentHome/bundles/agent-x.y.z-nnnn/pdk/plugins directory. You can configure properties in the agent.properties file to reduce an agent's memory footprint by configuring it to load only the plug-ins that you use.
Plug-ins are deployed to all agents when a solution is installed. You might want to use the properties described here in a situation in which you need to remove one or more plug-ins from a specific machine. You can either specify a list of plug-ins to exclude, or configure a list of plug-ins to load.
plugins.exclude
Use this property to specify the plug-ins that the End Point Operations Management agent must not load at startup.
You supply a comma-separated list of plugins to exclude. For example, plugins.exclude=jboss,apache,mysql.
plugins.include
Use this property to specify the plug-ins that the End Point Operations Management agent must load at startup.
You supply a comma-separated list of plugins to include. For example, plugins.include=weblogic,apache.
Understanding the Unsynchronized Agents Group
An unsynchronized agent is an agent that is not synchronized with the vRealize Operations Manager server in terms of its plug-ins. The agent might be missing plug-ins that are registered on the server, include plug-ins that are not registered on the server, or include plug-ins that have a different version to that registered on the server.
Each agent must be synchronized with the vRealize Operations Manager server. During the time that an agent is not synchronized with the server, it appears in the Unsynchronized Agents list. The list is located in the vRealize Operations Manager user interface on the Groups tab in the Environment view.
The first time an agent is started, a status message is sent to the server. The server compares the status sent by the agent with that on the server. The server sends commands to the agent to synchronize, download or delete plug-ins, as required by the differences that it detects.
When a plug-in is deployed, disabled, or enabled as part of a management pack solution update, the vRealize Operations Manager server detects that change and sends a new command to the agents so that synchronization occurs.
vRealize Operations Manager Configuration Guide
VMware, Inc. 208
Commonly, multiple agents are affected at the same time when a plug-in is deployed, disabled or enabled. All agents have an equal need to be updated so, to avoid overloading the server and creating performance issues that might occur if many agents were all synchronized at the same time, synchronization is performed in batches and is staggered in one-minute periods. You will notice that the list of unsynchronized agents decrements over time.
Configuring Agent LoggingYou can configure the name, location, and logging level for End Point Operations Management agent logs. You can also redirect system messages to the agent log, and configure the debug log level for an agent subsystem.
Agent Log Files
The End Point Operations Management agent log files are stored in the AgentHome/log directory.
Agent log files include the following:
agent.log
agent.operations.log This log is applicable to Windows-based agents only.
This is an audit log that records the commands that were run on the agent, together with the parameters that the agent used to action them.
wrapper.log The Java service wrapper-based agent launcher writes messages to the wrapper.log file. For a non-JRE agent, this file is located in agentHome/wrapper/sbin.
In the event that the value was changed ifr the agent.logDir property, the file is also located in agentHome/wrapper/sbin.
Configuring the Agent Log Name or Location
Use these properties to change the name or location of the agent log file.
agent.logDir
You can add this property to the agent.properties file to specify the directory where the End Point Operations Management agent will write its log file. If you do not specify a fully qualified path, agent.logDir is evaluated relative to the agent installation directory.
This property does not exist in the agent.properties file unless you explicitly add it. The default behavior is equivalent to the agent.logDir=log setting, resulting in the agent log file being written to the AgentHome/log directory.
To change the location for the agent log file, add agent.logDir to the agent.properties file and enter a path relative to the agent installation directory, or a fully qualified path.
The name of the agent log file is configured with the agent.logFile property.
agent.logFile
This property specifies the path and name of the agent log file.
vRealize Operations Manager Configuration Guide
VMware, Inc. 209
In the agent.properties file, the default setting for the agent.LogFile property is made up of a variable and a string, agent.logFile=${agent.logDir}\agent.logDir.
n agent.logDir is a variable that supplies the value of an identically named agent property. By default, the value of agent.logDir is log, interpreted relative to the agent installation directory.
n agent.log is the name for the agent log file.
By default, the agent log file is named agent.log and is written to the AgentHome/log directory.
To configure the agent to log to a different directory, you must explicitly add the agent.logDir property to the agent.properties file.
Configuring the Agent Logging Level
Use this property to control the severity level of messages that the End Point Operations Management agent writes to the agent log file.
agent.logLevel
This property specifies the level of detail of the messages that the End Point Operations Management agent writes to the log file.
Setting the agent.logLevel property value to DEBUG level is not advised. This level of logging across all subsystems imposes overhead, and can also cause the log file to roll over so frequently that log messages of interest are lost. It is preferable to configure debug level logging only at the subsystem level.
The changes that you make to this property become effective approximately five minutes after you save the properties file. It is not necessary to restart the agent to initiate the change.
Redirecting System Messages to the Agent Log
You can use these properties to redirect system-generated messages to the End Point Operations Management agent log file.
agent.logLevel.SystemErr
This property redirects System.err to agent.log. Commenting out this setting causes System.err to be directed to agent.log.startup.
The default value is ERROR.
agent.logLevel.SystemOut
This property redirects System.out to agent.log. Commenting out this setting causes System.out to be directed to agent.log.startup.
The default value is INFO.
Configuring the Debug Level for an Agent Subsystem
For troubleshooting purposes, you can increase the logging level for an individual agent subsystem.
To increase the logging level for an individual agent subsystem, uncomment the appropriate line in the section of the agent.properties file that is labeled Agent Subsystems: Uncomment individual subsystems to see debug messages.
vRealize Operations Manager Configuration Guide
VMware, Inc. 210
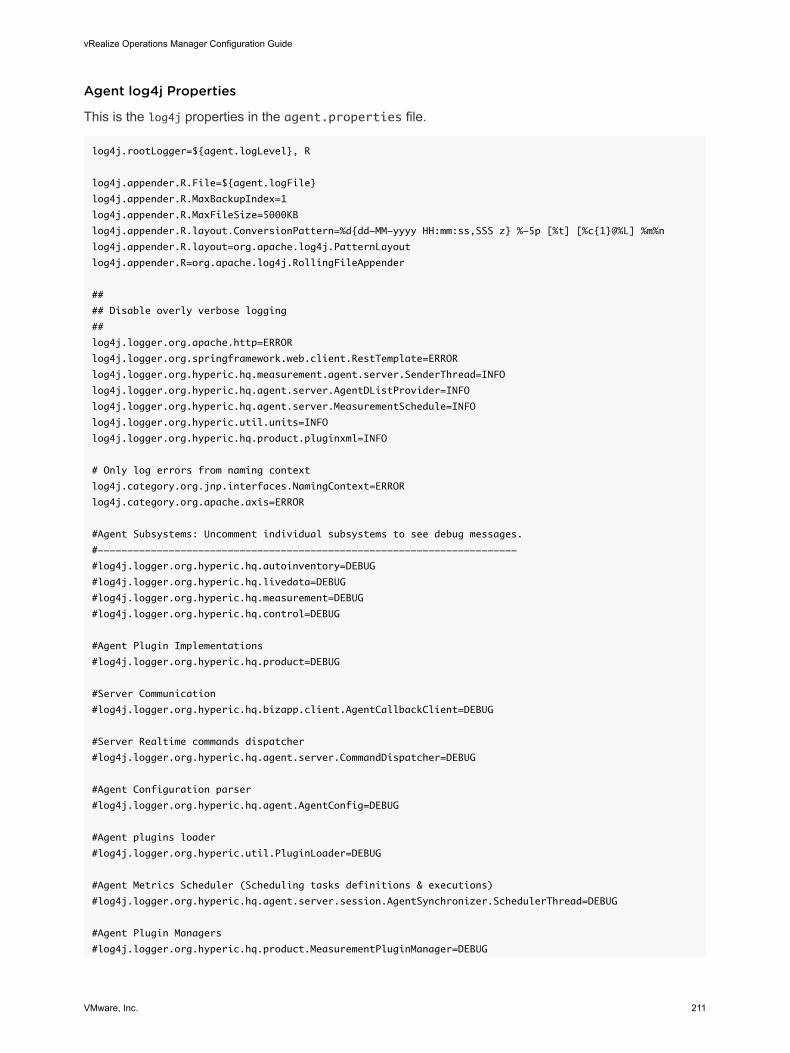
Agent log4j Properties
This is the log4j properties in the agent.properties file.
log4j.rootLogger=${agent.logLevel}, R
log4j.appender.R.File=${agent.logFile}
log4j.appender.R.MaxBackupIndex=1
log4j.appender.R.MaxFileSize=5000KB
log4j.appender.R.layout.ConversionPattern=%d{dd-MM-yyyy HH:mm:ss,SSS z} %-5p [%t] [%c{1}@%L] %m%n
log4j.appender.R.layout=org.apache.log4j.PatternLayout
log4j.appender.R=org.apache.log4j.RollingFileAppender
##
## Disable overly verbose logging
##
log4j.logger.org.apache.http=ERROR
log4j.logger.org.springframework.web.client.RestTemplate=ERROR
log4j.logger.org.hyperic.hq.measurement.agent.server.SenderThread=INFO
log4j.logger.org.hyperic.hq.agent.server.AgentDListProvider=INFO
log4j.logger.org.hyperic.hq.agent.server.MeasurementSchedule=INFO
log4j.logger.org.hyperic.util.units=INFO
log4j.logger.org.hyperic.hq.product.pluginxml=INFO
# Only log errors from naming context
log4j.category.org.jnp.interfaces.NamingContext=ERROR
log4j.category.org.apache.axis=ERROR
#Agent Subsystems: Uncomment individual subsystems to see debug messages.
#-----------------------------------------------------------------------
#log4j.logger.org.hyperic.hq.autoinventory=DEBUG
#log4j.logger.org.hyperic.hq.livedata=DEBUG
#log4j.logger.org.hyperic.hq.measurement=DEBUG
#log4j.logger.org.hyperic.hq.control=DEBUG
#Agent Plugin Implementations
#log4j.logger.org.hyperic.hq.product=DEBUG
#Server Communication
#log4j.logger.org.hyperic.hq.bizapp.client.AgentCallbackClient=DEBUG
#Server Realtime commands dispatcher
#log4j.logger.org.hyperic.hq.agent.server.CommandDispatcher=DEBUG
#Agent Configuration parser
#log4j.logger.org.hyperic.hq.agent.AgentConfig=DEBUG
#Agent plugins loader
#log4j.logger.org.hyperic.util.PluginLoader=DEBUG
#Agent Metrics Scheduler (Scheduling tasks definitions & executions)
#log4j.logger.org.hyperic.hq.agent.server.session.AgentSynchronizer.SchedulerThread=DEBUG
#Agent Plugin Managers
#log4j.logger.org.hyperic.hq.product.MeasurementPluginManager=DEBUG
vRealize Operations Manager Configuration Guide
VMware, Inc. 211
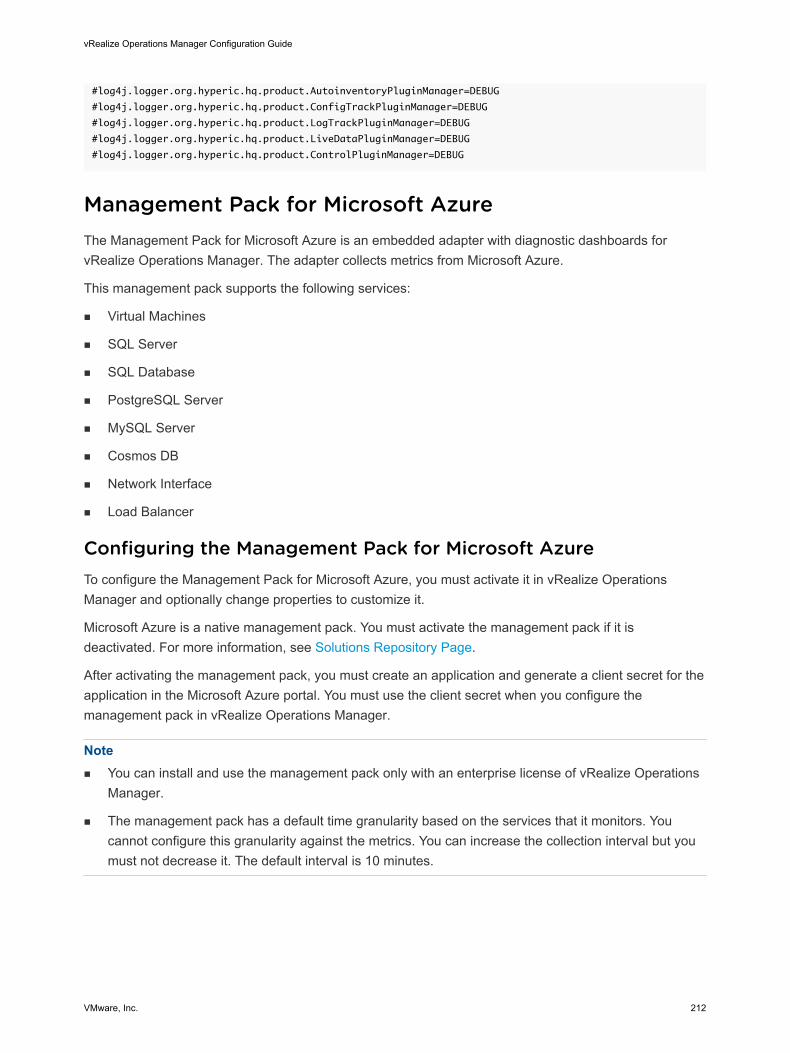
#log4j.logger.org.hyperic.hq.product.AutoinventoryPluginManager=DEBUG
#log4j.logger.org.hyperic.hq.product.ConfigTrackPluginManager=DEBUG
#log4j.logger.org.hyperic.hq.product.LogTrackPluginManager=DEBUG
#log4j.logger.org.hyperic.hq.product.LiveDataPluginManager=DEBUG
#log4j.logger.org.hyperic.hq.product.ControlPluginManager=DEBUG
Management Pack for Microsoft AzureThe Management Pack for Microsoft Azure is an embedded adapter with diagnostic dashboards for vRealize Operations Manager. The adapter collects metrics from Microsoft Azure.
This management pack supports the following services:
n Virtual Machines
n SQL Server
n SQL Database
n PostgreSQL Server
n MySQL Server
n Cosmos DB
n Network Interface
n Load Balancer
Configuring the Management Pack for Microsoft AzureTo configure the Management Pack for Microsoft Azure, you must activate it in vRealize Operations Manager and optionally change properties to customize it.
Microsoft Azure is a native management pack. You must activate the management pack if it is deactivated. For more information, see Solutions Repository Page.
After activating the management pack, you must create an application and generate a client secret for the application in the Microsoft Azure portal. You must use the client secret when you configure the management pack in vRealize Operations Manager.
Note n You can install and use the management pack only with an enterprise license of vRealize Operations
Manager.
n The management pack has a default time granularity based on the services that it monitors. You cannot configure this granularity against the metrics. You can increase the collection interval but you must not decrease it. The default interval is 10 minutes.
vRealize Operations Manager Configuration Guide
VMware, Inc. 212
Generate a Client SecretCreate an Active Directory application and generate a client secret for the application in the Microsoft Azure portal. You must use the client secret when you configure a cloud account for the Management Pack for Microsoft Azure.
Prerequisites
n Ensure that you are using Microsoft Azure Cloud.
n Ensure that you have a valid subscription in the Microsoft Azure portal with an Active Directory integration.
Procedure
1 Log in to the Microsoft Azure portal.
2 To create an application and generate a secret for the application, follow the instructions at https://docs.microsoft.com/en-us/azure/active-directory/develop/howto-create-service-principal-portal.
Complete the following tasks:
a Create an Azure Active Directory application.
b Assign the application to a role.
c Generate a client secret for the application.
d Copy the subscription ID, directory (tenant) ID, application (client) ID, and client secret to use in your cloud account.
Add a Cloud Account for the Management Pack for Microsoft AzureThe Management Pack for Microsoft Azure is an embedded adapter, in which each adapter instance has diagnostic dashboards, and collects metrics from Microsoft Azure. You can add a cloud account to configure an adapter instance in vRealize Operations Manager.
Prerequisites
n If the Management Pack for Microsoft Azure is deactivated, activate it in vRealize Operations Manager. For more information, see Solutions Repository Page.
n Generate a client secret in the Microsoft Azure portal to use in this configuration. For more information, see Generate a Client Secret.
Procedure
1 On the menu, click Administration.
2 In the left pane, click Solutions > Cloud Accounts.
3 Click Add Account and select Microsoft Azure.
vRealize Operations Manager Configuration Guide
VMware, Inc. 213
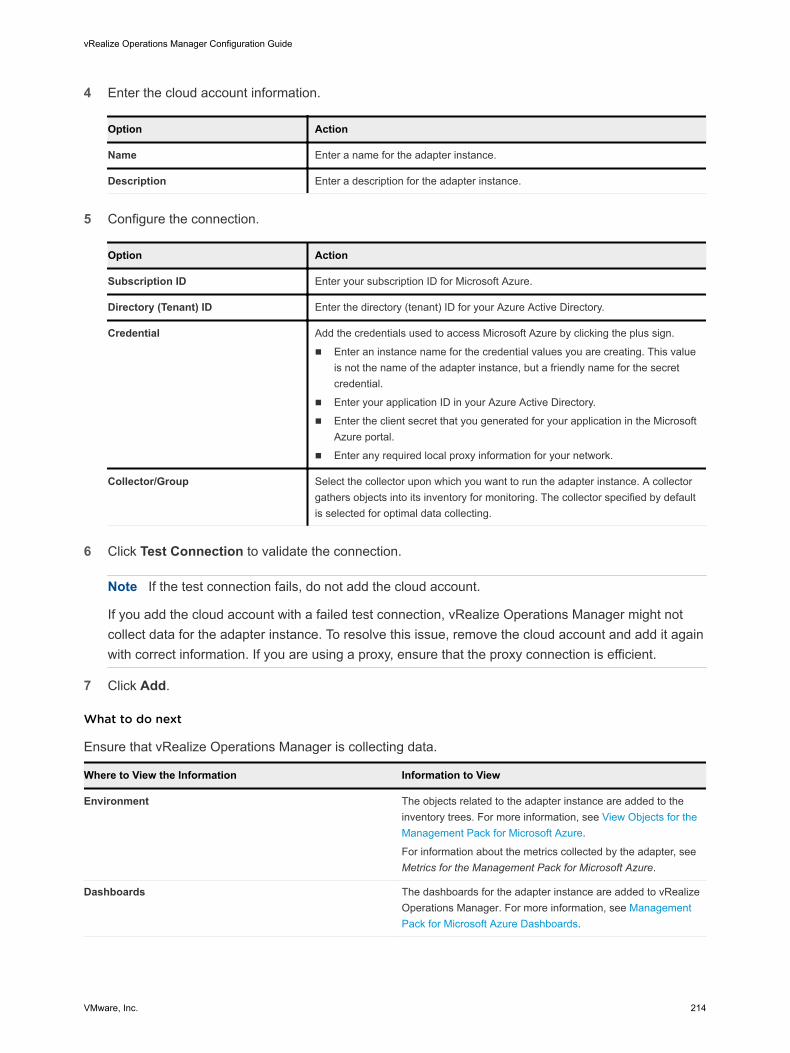
4 Enter the cloud account information.
Option Action
Name Enter a name for the adapter instance.
Description Enter a description for the adapter instance.
5 Configure the connection.
Option Action
Subscription ID Enter your subscription ID for Microsoft Azure.
Directory (Tenant) ID Enter the directory (tenant) ID for your Azure Active Directory.
Credential Add the credentials used to access Microsoft Azure by clicking the plus sign.
n Enter an instance name for the credential values you are creating. This value is not the name of the adapter instance, but a friendly name for the secret credential.
n Enter your application ID in your Azure Active Directory.
n Enter the client secret that you generated for your application in the Microsoft Azure portal.
n Enter any required local proxy information for your network.
Collector/Group Select the collector upon which you want to run the adapter instance. A collector gathers objects into its inventory for monitoring. The collector specified by default is selected for optimal data collecting.
6 Click Test Connection to validate the connection.
Note If the test connection fails, do not add the cloud account.
If you add the cloud account with a failed test connection, vRealize Operations Manager might not collect data for the adapter instance. To resolve this issue, remove the cloud account and add it again with correct information. If you are using a proxy, ensure that the proxy connection is efficient.
7 Click Add.
What to do next
Ensure that vRealize Operations Manager is collecting data.
Where to View the Information Information to View
Environment The objects related to the adapter instance are added to the inventory trees. For more information, see View Objects for the Management Pack for Microsoft Azure.
For information about the metrics collected by the adapter, see Metrics for the Management Pack for Microsoft Azure.
Dashboards The dashboards for the adapter instance are added to vRealize Operations Manager. For more information, see Management Pack for Microsoft Azure Dashboards.
vRealize Operations Manager Configuration Guide
VMware, Inc. 214
View Objects for the Management Pack for Microsoft AzureYou can use the inventory tree in vRealize Operations Manager to browse and select objects for an adapter instance of the Management Pack for Microsoft Azure. The inventory tree shows a hierarchical arrangement of the objects by cloud account and by region.
Prerequisites
Configure an adapter instance of the Management Pack for Microsoft Azure. For more information, see Add a Cloud Account for the Management Pack for Microsoft Azure.
Procedure
1 On the menu, click Environment.
2 In the left pane, under Environment Overview, expand VMware vRealize Operations Management Pack for Microsoft Azure.
3 Select either of the following options:
n To view the objects by region, click Azure Resources By Region.
n To view the objects by cloud account, click Azure Resources By Subscription.
4 To view the object information by region, region per cloud account, subregion, cloud account, or resource group, select either of the following options:
n If you are viewing objects by region, select a region. You can click the Azure Region per Subscription tab to view the object information for the region per cloud account. You can also expand the inventory tree for each region and select a subregion.
n If you are viewing objects by cloud account, select a cloud account. You can also expand the inventory tree for each cloud account and select a resource group.
5 To view information about each object, select either of the following options:
n If you are viewing objects by region, expand the inventory tree for a subregion and select an object.
n If you are viewing objects by cloud account, select an object under a cloud account or expand the inventory tree for a resource group and select an object.
You can expand the inventory tree for an SQL Server object and select an SQL Database object to view information about the database object.
Management Pack for AWSInstall and configure the Management Pack for AWS for vRealize Operations Manager. The Management Pack for AWS is an embedded adapter with diagnostic dashboards for vRealize Operations Manager. The adapter collects metrics from Amazon Web Services (AWS).
vRealize Operations Manager Configuration Guide
VMware, Inc. 215
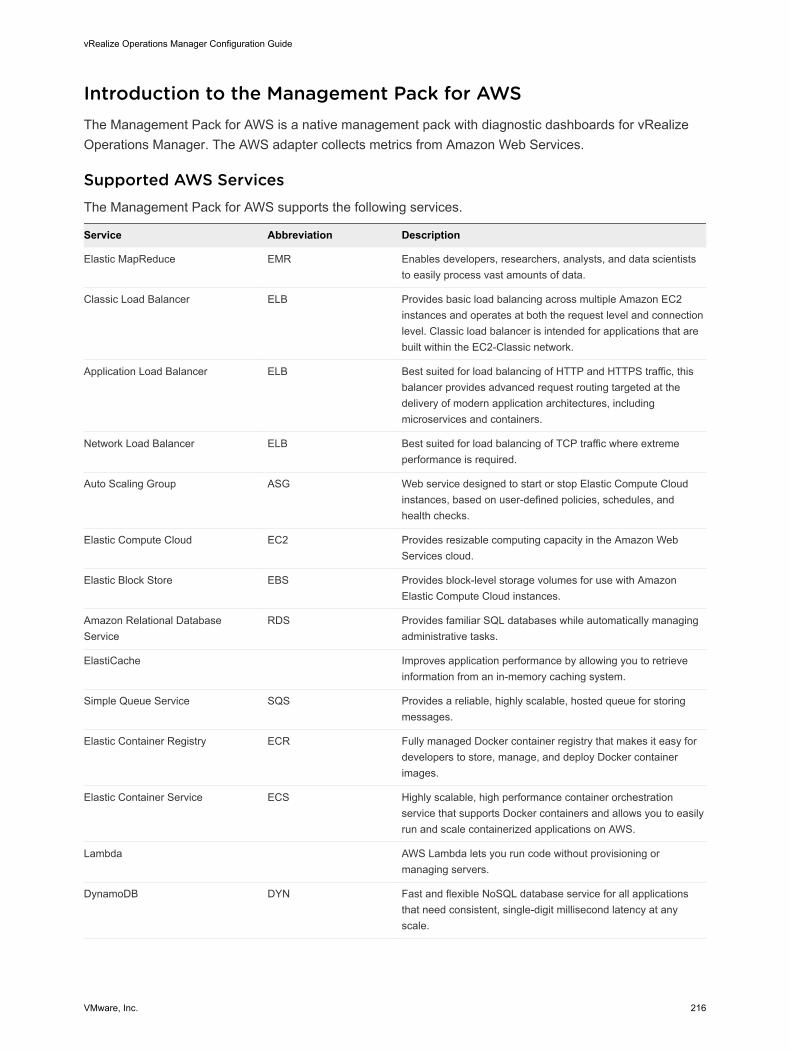
Introduction to the Management Pack for AWSThe Management Pack for AWS is a native management pack with diagnostic dashboards for vRealize Operations Manager. The AWS adapter collects metrics from Amazon Web Services.
Supported AWS ServicesThe Management Pack for AWS supports the following services.
Service Abbreviation Description
Elastic MapReduce EMR Enables developers, researchers, analysts, and data scientists to easily process vast amounts of data.
Classic Load Balancer ELB Provides basic load balancing across multiple Amazon EC2 instances and operates at both the request level and connection level. Classic load balancer is intended for applications that are built within the EC2-Classic network.
Application Load Balancer ELB Best suited for load balancing of HTTP and HTTPS traffic, this balancer provides advanced request routing targeted at the delivery of modern application architectures, including microservices and containers.
Network Load Balancer ELB Best suited for load balancing of TCP traffic where extreme performance is required.
Auto Scaling Group ASG Web service designed to start or stop Elastic Compute Cloud instances, based on user-defined policies, schedules, and health checks.
Elastic Compute Cloud EC2 Provides resizable computing capacity in the Amazon Web Services cloud.
Elastic Block Store EBS Provides block-level storage volumes for use with Amazon Elastic Compute Cloud instances.
Amazon Relational Database Service
RDS Provides familiar SQL databases while automatically managing administrative tasks.
ElastiCache Improves application performance by allowing you to retrieve information from an in-memory caching system.
Simple Queue Service SQS Provides a reliable, highly scalable, hosted queue for storing messages.
Elastic Container Registry ECR Fully managed Docker container registry that makes it easy for developers to store, manage, and deploy Docker container images.
Elastic Container Service ECS Highly scalable, high performance container orchestration service that supports Docker containers and allows you to easily run and scale containerized applications on AWS.
Lambda AWS Lambda lets you run code without provisioning or managing servers.
DynamoDB DYN Fast and flexible NoSQL database service for all applications that need consistent, single-digit millisecond latency at any scale.
vRealize Operations Manager Configuration Guide
VMware, Inc. 216
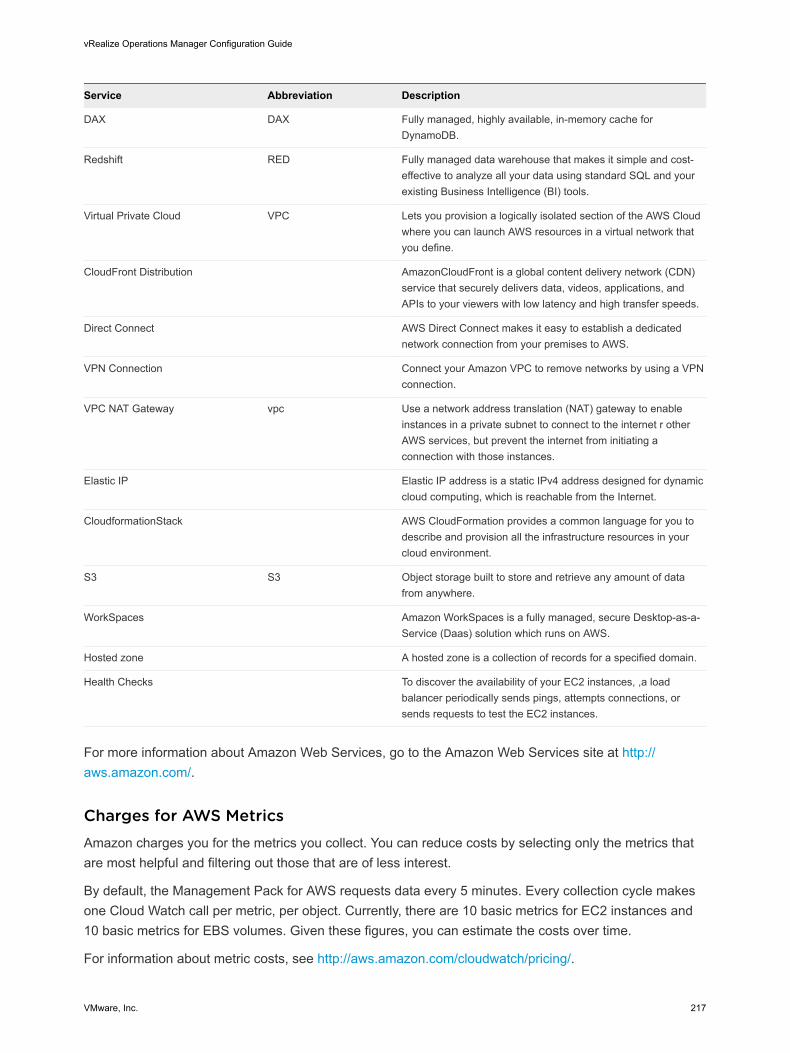
Service Abbreviation Description
DAX DAX Fully managed, highly available, in-memory cache for DynamoDB.
Redshift RED Fully managed data warehouse that makes it simple and cost-effective to analyze all your data using standard SQL and your existing Business Intelligence (BI) tools.
Virtual Private Cloud VPC Lets you provision a logically isolated section of the AWS Cloud where you can launch AWS resources in a virtual network that you define.
CloudFront Distribution AmazonCloudFront is a global content delivery network (CDN) service that securely delivers data, videos, applications, and APIs to your viewers with low latency and high transfer speeds.
Direct Connect AWS Direct Connect makes it easy to establish a dedicated network connection from your premises to AWS.
VPN Connection Connect your Amazon VPC to remove networks by using a VPN connection.
VPC NAT Gateway vpc Use a network address translation (NAT) gateway to enable instances in a private subnet to connect to the internet r other AWS services, but prevent the internet from initiating a connection with those instances.
Elastic IP Elastic IP address is a static IPv4 address designed for dynamic cloud computing, which is reachable from the Internet.
CloudformationStack AWS CloudFormation provides a common language for you to describe and provision all the infrastructure resources in your cloud environment.
S3 S3 Object storage built to store and retrieve any amount of data from anywhere.
WorkSpaces Amazon WorkSpaces is a fully managed, secure Desktop-as-a-Service (Daas) solution which runs on AWS.
Hosted zone A hosted zone is a collection of records for a specified domain.
Health Checks To discover the availability of your EC2 instances, ,a load balancer periodically sends pings, attempts connections, or sends requests to test the EC2 instances.
For more information about Amazon Web Services, go to the Amazon Web Services site at http://aws.amazon.com/.
Charges for AWS MetricsAmazon charges you for the metrics you collect. You can reduce costs by selecting only the metrics that are most helpful and filtering out those that are of less interest.
By default, the Management Pack for AWS requests data every 5 minutes. Every collection cycle makes one Cloud Watch call per metric, per object. Currently, there are 10 basic metrics for EC2 instances and 10 basic metrics for EBS volumes. Given these figures, you can estimate the costs over time.
For information about metric costs, see http://aws.amazon.com/cloudwatch/pricing/.
vRealize Operations Manager Configuration Guide
VMware, Inc. 217

Based on the costs associated with running the adapter, you can take advantage of some of the features that limit the amount of data you collect from AWS.
n Turn off auto discovery and use manual discovery. Select only those objects that are critical to your system.
n Subscribe only to specific critical regions or services.
n Use white and black list filtering to select object import by name.
n Go to the default attribute package for each object. Turn off collection of metrics that are not critical for your system.
View Management Pack for AWS ObjectsYou can use the inventory tree to browse and select objects. The inventory tree shows a hierarchical arrangement of the Management Pack for AWS objects by region.
Procedure
1 In the left pane of vRealize Operations Manager, click the Environment icon.
2 In the Environment Overview, under the Inventory Trees, click AWS Resources by Regions.
3 To view the child objects, expand the regions and then expand the regions per account.
Note All the account-specific objects related to a region are grouped under the region per account section.
4 To display information about the object, select an object in the inventory tree.
Security ConsiderationsThere are security issues that must be considered when installing the Management Pack for AWS.
vRealize Operations Manager administrators can install various management packs. VMware creates some management packs and some are created by third-party developers. Although adapters run independently, they run within a common runtime environment in the vRealize Operations Manager collector host. Java language security protects adapters from interference with other adapters, but all run within the common JRE process trust zone. You should only use management packs that you have obtained from a publisher you trust. Verify the management pack's code integrity before loading into vRealize Operations Manager.
Verify the integrity of a management pack by generating an md5 or sha1 hash for the management pack's binary, and comparing it to the sha1 or md5 hash file accompanying the management pack binary.
Although adapters run independently, they can make configuration changes to the collector host or Java runtime environment that can affect the security of other adapters. For example, during installation, an adapter can modify the list of trusted certificates. During execution, an adapter can change the TLS/SSL certificate validation scheme, and change how other adapters validate certificates. The vRealize Operations Manager system and collector hosts do not isolate adapters beyond the natural isolation provided by Java execution. The system trusts all adapters equally.
vRealize Operations Manager Configuration Guide
VMware, Inc. 218
Adapters are responsible for their own data security. When collecting data or making configuration changes to data sources, each adapter provides its own mechanisms and guarantees regarding the confidentiality, integrity, and authenticity of collected data.
The Management Pack for AWS relies on the AWS SDK for Java. The protocol used is https. There is no way to disable this and use http. The latest Javadoc for the AWS SDK can be found here: http://docs.aws.amazon.com/AWSJavaSDK/latest/javadoc/.
Configuring the Management Pack for AWSConfigure the Management Pack for AWS in vRealize Operations Manager and optionally change its properties to customize the management pack's operation.
An Amazon Web Services account has multiple types of credentials associated with the account. Sign-in credentials are used to access the Amazon Web Services Web-based console, key pairs are used to access EC2 instances, and access keys are used in the REST API that Amazon Web Services exposes.
Because the AWS adapter is based on the REST API, you must use access keys when you set up the adapter. You generate access keys from the Amazon Web Services console. You can create credentials on a per user basis. Access keys are not a username-password pair, but a generated sequence of characters.
Note While it is not required, it is recommended that you create a guest type account, which has a read-only access to Amazon Web Services, and use the access keys associated with this account. When you create a guest group with default permissions, they do not include read access to the Elastic Map Reduce (EMR) service. You must use the IAM console to add the following permission:
elasticmapreduce:DescribeJobFlows
Generate Required Access KeysTo configure the Management Pack for AWS, you must acquire an access key and secret key from the Amazon server. You can acquire these keys as an Amazon Web Services Admin user or as an Amazon Identity and Access Management (IAM) user. For the latest instructions,
Prerequisites
n Ensure that you are using Amazon Web Services.
n Ensure that you have the valid permissions and roles in Amazon Web Services.
Procedure
1 Log in to Amazon Web Services.
2 To generate access keys, see the online documentation on the https://docs.aws.amazon.com/ site.
Complete the following tasks:
n Generate access keys as an Amazon Web Services Administrator.
n Generate access keys as Amazon Web Services Identity and Access Management User.
vRealize Operations Manager Configuration Guide
VMware, Inc. 219
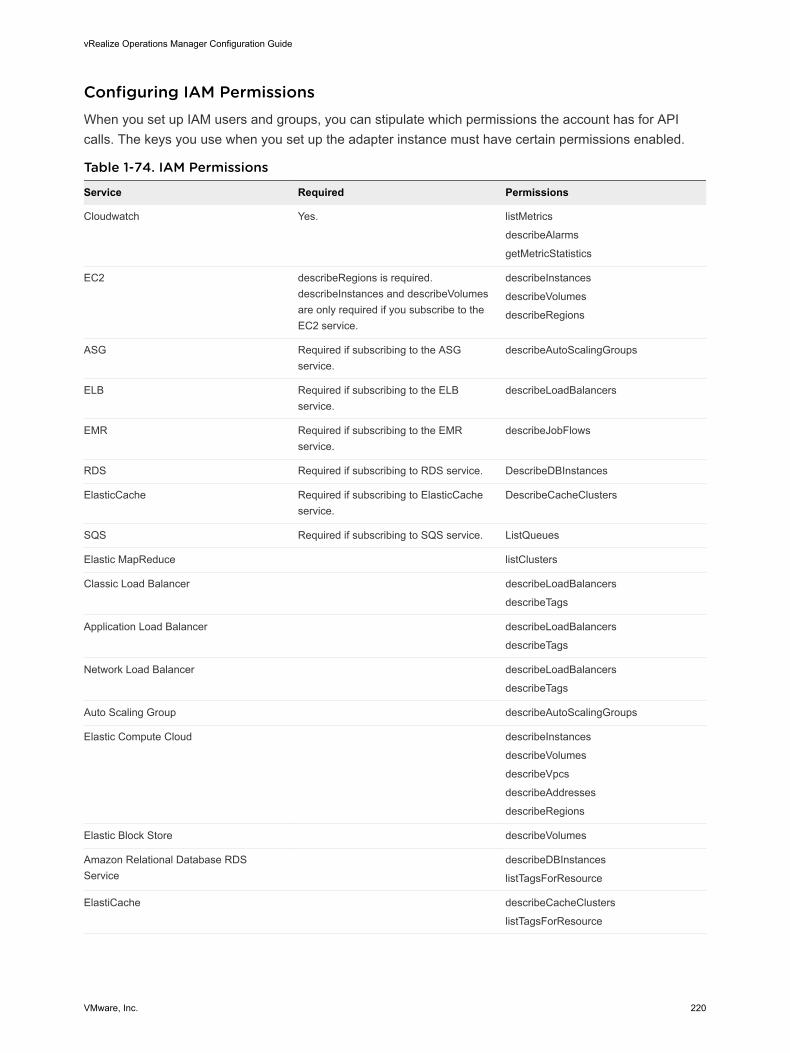
Configuring IAM PermissionsWhen you set up IAM users and groups, you can stipulate which permissions the account has for API calls. The keys you use when you set up the adapter instance must have certain permissions enabled.
Table 1-74. IAM Permissions
Service Required Permissions
Cloudwatch Yes. listMetrics
describeAlarms
getMetricStatistics
EC2 describeRegions is required. describeInstances and describeVolumes are only required if you subscribe to the EC2 service.
describeInstances
describeVolumes
describeRegions
ASG Required if subscribing to the ASG service.
describeAutoScalingGroups
ELB Required if subscribing to the ELB service.
describeLoadBalancers
EMR Required if subscribing to the EMR service.
describeJobFlows
RDS Required if subscribing to RDS service. DescribeDBInstances
ElasticCache Required if subscribing to ElasticCache service.
DescribeCacheClusters
SQS Required if subscribing to SQS service. ListQueues
Elastic MapReduce listClusters
Classic Load Balancer describeLoadBalancers
describeTags
Application Load Balancer describeLoadBalancers
describeTags
Network Load Balancer describeLoadBalancers
describeTags
Auto Scaling Group describeAutoScalingGroups
Elastic Compute Cloud describeInstances
describeVolumes
describeVpcs
describeAddresses
describeRegions
Elastic Block Store describeVolumes
Amazon Relational Database RDS Service
describeDBInstances
listTagsForResource
ElastiCache describeCacheClusters
listTagsForResource
vRealize Operations Manager Configuration Guide
VMware, Inc. 220
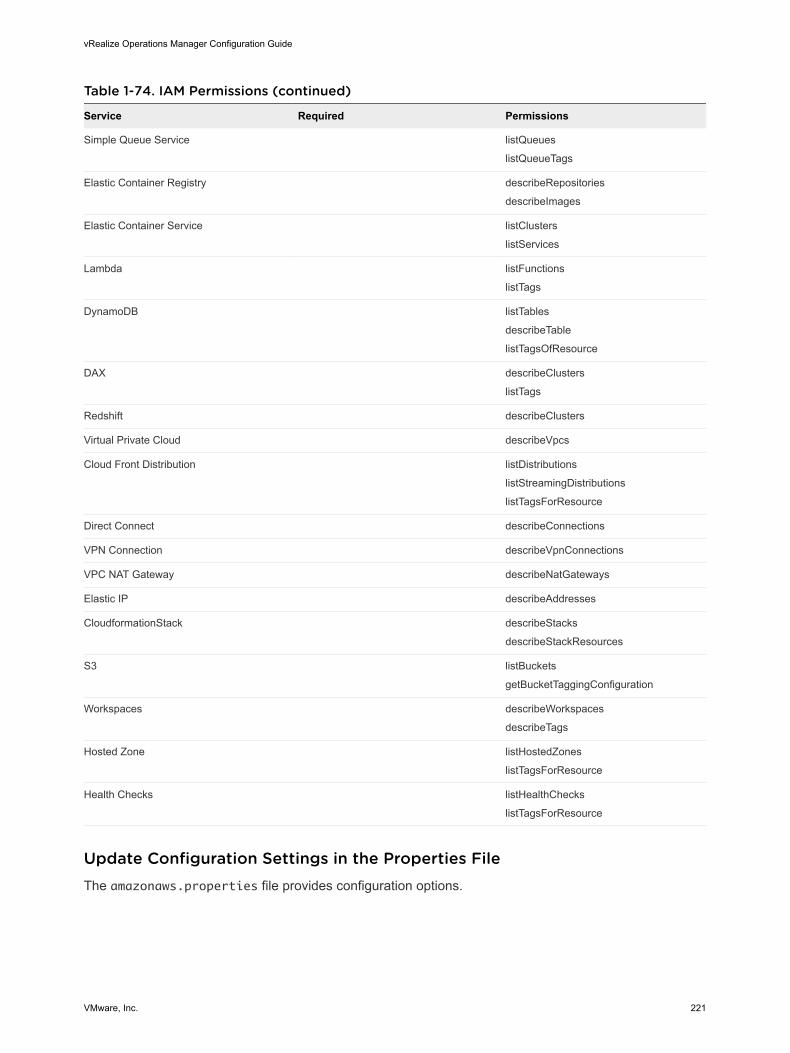
Table 1-74. IAM Permissions (continued)
Service Required Permissions
Simple Queue Service listQueues
listQueueTags
Elastic Container Registry describeRepositories
describeImages
Elastic Container Service listClusters
listServices
Lambda listFunctions
listTags
DynamoDB listTables
describeTable
listTagsOfResource
DAX describeClusters
listTags
Redshift describeClusters
Virtual Private Cloud describeVpcs
Cloud Front Distribution listDistributions
listStreamingDistributions
listTagsForResource
Direct Connect describeConnections
VPN Connection describeVpnConnections
VPC NAT Gateway describeNatGateways
Elastic IP describeAddresses
CloudformationStack describeStacks
describeStackResources
S3 listBuckets
getBucketTaggingConfiguration
Workspaces describeWorkspaces
describeTags
Hosted Zone listHostedZones
listTagsForResource
Health Checks listHealthChecks
listTagsForResource
Update Configuration Settings in the Properties FileThe amazonaws.properties file provides configuration options.
vRealize Operations Manager Configuration Guide
VMware, Inc. 221
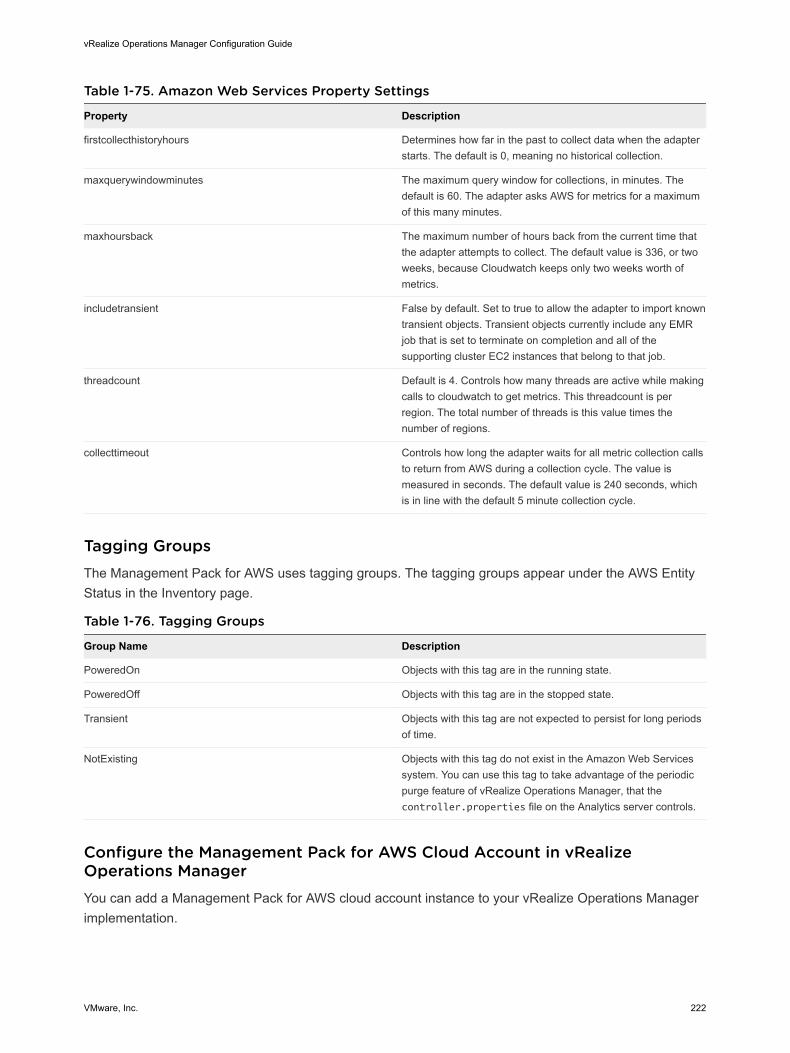
Table 1-75. Amazon Web Services Property Settings
Property Description
firstcollecthistoryhours Determines how far in the past to collect data when the adapter starts. The default is 0, meaning no historical collection.
maxquerywindowminutes The maximum query window for collections, in minutes. The default is 60. The adapter asks AWS for metrics for a maximum of this many minutes.
maxhoursback The maximum number of hours back from the current time that the adapter attempts to collect. The default value is 336, or two weeks, because Cloudwatch keeps only two weeks worth of metrics.
includetransient False by default. Set to true to allow the adapter to import known transient objects. Transient objects currently include any EMR job that is set to terminate on completion and all of the supporting cluster EC2 instances that belong to that job.
threadcount Default is 4. Controls how many threads are active while making calls to cloudwatch to get metrics. This threadcount is per region. The total number of threads is this value times the number of regions.
collecttimeout Controls how long the adapter waits for all metric collection calls to return from AWS during a collection cycle. The value is measured in seconds. The default value is 240 seconds, which is in line with the default 5 minute collection cycle.
Tagging GroupsThe Management Pack for AWS uses tagging groups. The tagging groups appear under the AWS Entity Status in the Inventory page.
Table 1-76. Tagging Groups
Group Name Description
PoweredOn Objects with this tag are in the running state.
PoweredOff Objects with this tag are in the stopped state.
Transient Objects with this tag are not expected to persist for long periods of time.
NotExisting Objects with this tag do not exist in the Amazon Web Services system. You can use this tag to take advantage of the periodic purge feature of vRealize Operations Manager, that the controller.properties file on the Analytics server controls.
Configure the Management Pack for AWS Cloud Account in vRealize Operations ManagerYou can add a Management Pack for AWS cloud account instance to your vRealize Operations Manager implementation.
vRealize Operations Manager Configuration Guide
VMware, Inc. 222
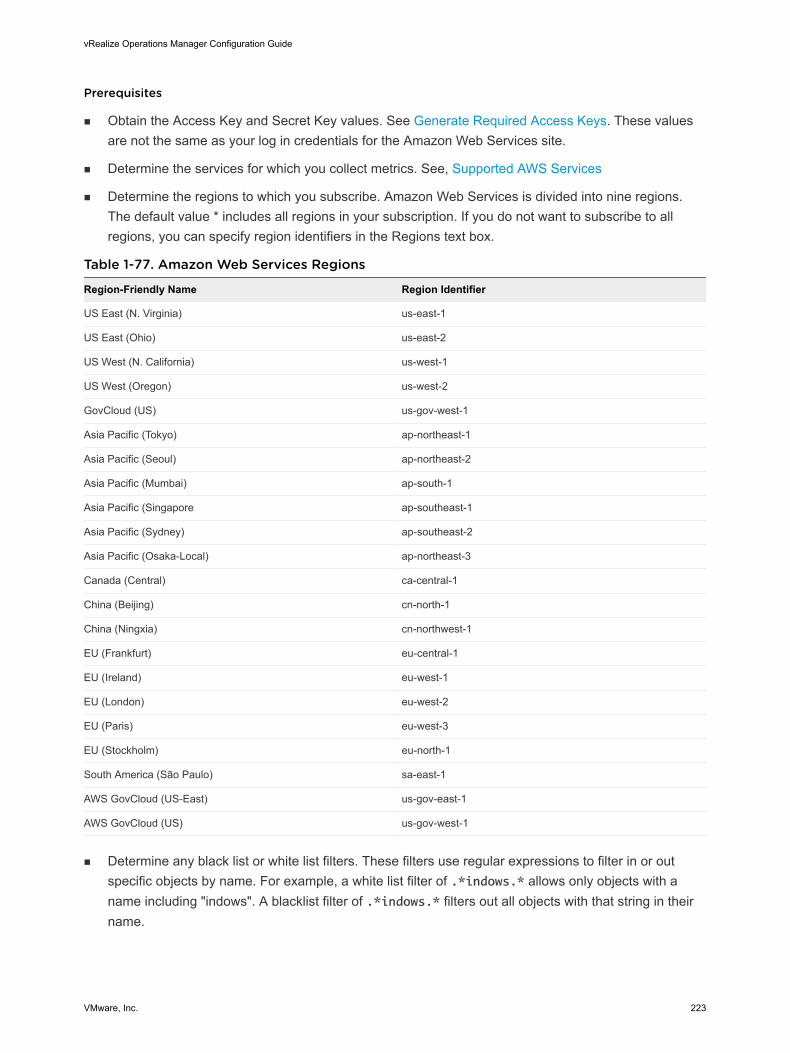
Prerequisites
n Obtain the Access Key and Secret Key values. See Generate Required Access Keys. These values are not the same as your log in credentials for the Amazon Web Services site.
n Determine the services for which you collect metrics. See, Supported AWS Services
n Determine the regions to which you subscribe. Amazon Web Services is divided into nine regions. The default value * includes all regions in your subscription. If you do not want to subscribe to all regions, you can specify region identifiers in the Regions text box.
Table 1-77. Amazon Web Services Regions
Region-Friendly Name Region Identifier
US East (N. Virginia) us-east-1
US East (Ohio) us-east-2
US West (N. California) us-west-1
US West (Oregon) us-west-2
GovCloud (US) us-gov-west-1
Asia Pacific (Tokyo) ap-northeast-1
Asia Pacific (Seoul) ap-northeast-2
Asia Pacific (Mumbai) ap-south-1
Asia Pacific (Singapore ap-southeast-1
Asia Pacific (Sydney) ap-southeast-2
Asia Pacific (Osaka-Local) ap-northeast-3
Canada (Central) ca-central-1
China (Beijing) cn-north-1
China (Ningxia) cn-northwest-1
EU (Frankfurt) eu-central-1
EU (Ireland) eu-west-1
EU (London) eu-west-2
EU (Paris) eu-west-3
EU (Stockholm) eu-north-1
South America (São Paulo) sa-east-1
AWS GovCloud (US-East) us-gov-east-1
AWS GovCloud (US) us-gov-west-1
n Determine any black list or white list filters. These filters use regular expressions to filter in or out specific objects by name. For example, a white list filter of .*indows.* allows only objects with a name including "indows". A blacklist filter of .*indows.* filters out all objects with that string in their name.
vRealize Operations Manager Configuration Guide
VMware, Inc. 223
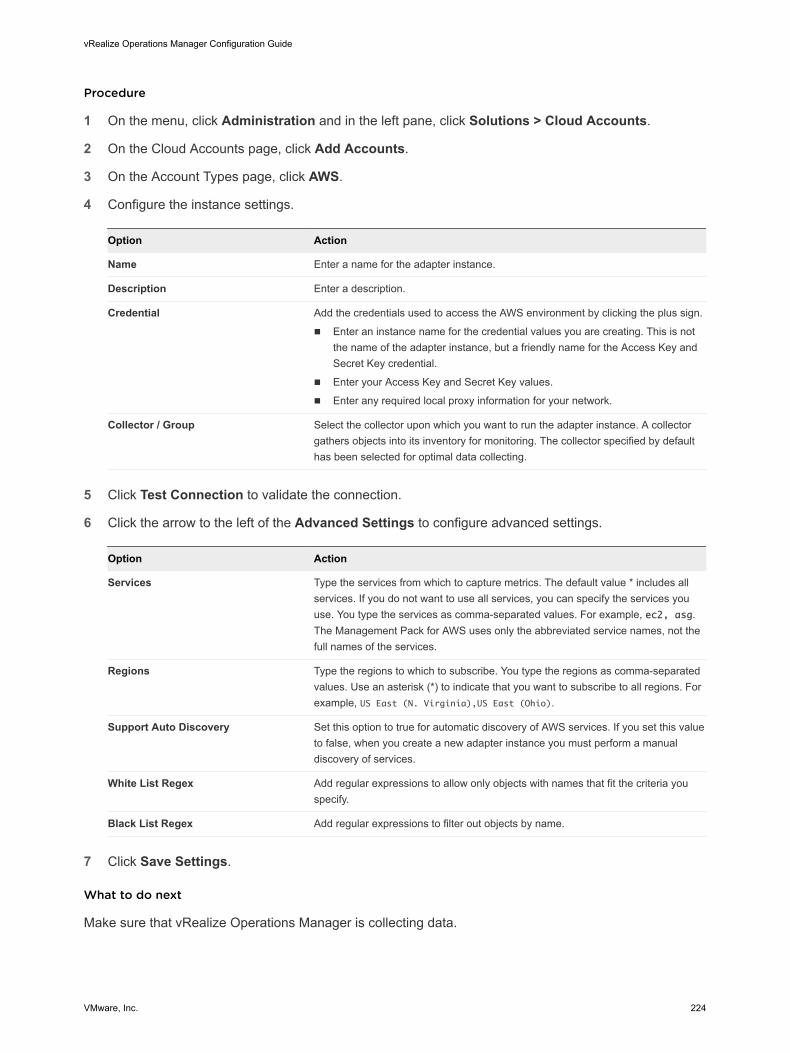
Procedure
1 On the menu, click Administration and in the left pane, click Solutions > Cloud Accounts.
2 On the Cloud Accounts page, click Add Accounts.
3 On the Account Types page, click AWS.
4 Configure the instance settings.
Option Action
Name Enter a name for the adapter instance.
Description Enter a description.
Credential Add the credentials used to access the AWS environment by clicking the plus sign.
n Enter an instance name for the credential values you are creating. This is not the name of the adapter instance, but a friendly name for the Access Key and Secret Key credential.
n Enter your Access Key and Secret Key values.
n Enter any required local proxy information for your network.
Collector / Group Select the collector upon which you want to run the adapter instance. A collector gathers objects into its inventory for monitoring. The collector specified by default has been selected for optimal data collecting.
5 Click Test Connection to validate the connection.
6 Click the arrow to the left of the Advanced Settings to configure advanced settings.
Option Action
Services Type the services from which to capture metrics. The default value * includes all services. If you do not want to use all services, you can specify the services you use. You type the services as comma-separated values. For example, ec2, asg. The Management Pack for AWS uses only the abbreviated service names, not the full names of the services.
Regions Type the regions to which to subscribe. You type the regions as comma-separated values. Use an asterisk (*) to indicate that you want to subscribe to all regions. For example, US East (N. Virginia),US East (Ohio).
Support Auto Discovery Set this option to true for automatic discovery of AWS services. If you set this value to false, when you create a new adapter instance you must perform a manual discovery of services.
White List Regex Add regular expressions to allow only objects with names that fit the criteria you specify.
Black List Regex Add regular expressions to filter out objects by name.
7 Click Save Settings.
What to do next
Make sure that vRealize Operations Manager is collecting data.
vRealize Operations Manager Configuration Guide
VMware, Inc. 224
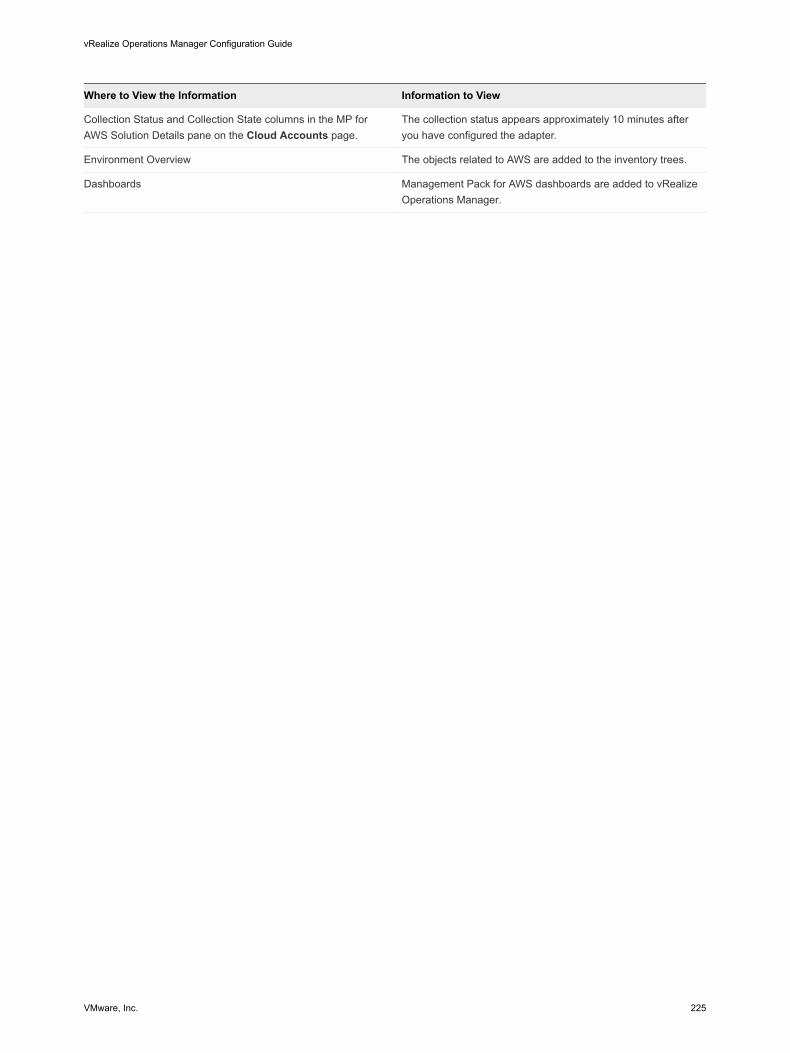
Where to View the Information Information to View
Collection Status and Collection State columns in the MP for AWS Solution Details pane on the Cloud Accounts page.
The collection status appears approximately 10 minutes after you have configured the adapter.
Environment Overview The objects related to AWS are added to the inventory trees.
Dashboards Management Pack for AWS dashboards are added to vRealize Operations Manager.
vRealize Operations Manager Configuration Guide
VMware, Inc. 225
Configuring Alerts and Actions 2In VMware vRealize Operations Manager, alerts and actions play key roles in monitoring the objects.
This chapter includes the following topics:
n Types of Alerts
n Alert Information
n Configuring Alerts
n Configuring Actions
Types of AlertsAlerts in vRealize Operations Manager are of three types. The alert type determines the severity of the problem.
Health Alerts The health alert list is all the generated alerts that are configured to affect the health of your environment and require immediate attention. You use the health alert list to evaluate, prioritize, and immediately begin resolving the problems.
Risk Alerts The risk alerts list is all the generated alerts that are configured to indicate risk in your environment. Address risk alerts in the near future, before the triggering symptoms that generated the alert negatively affect the health of your environment.
Efficiency Alerts The efficiency alerts list is all the generated alerts that are configured to indicate problems with the efficient use of your monitored objects in your environment. Address efficiency alerts to reclaim wasted space or to improve the performance of objects in your environment.
Alert InformationWhen you click an alert from the all alerts list, the alert information appears on the right. View the alert information to see the symptoms which triggered the alert, recommendations to fix the underlying issue, and troubleshoot the cause of the alert.
VMware, Inc. 226
How You View the Alert Informationn In the menu, click Alerts. Click an alert from the alert list.
n In the menu, click Environment, then select a group, custom data center, application, or inventory object. Click the object and then the Alerts tab.
n In the menu, select Search and locate the object of interest. Click the object and then the Alerts tab.
The alert description is hidden when you open the alert information. Click View Description to see the description of the alert. View the time stamp of when the alert started, and when it was updated, below the alert title.
Alert Details Tab
Section Description
Recommendations View recommendations for the alert. Click < or > to cycle through the recommendations. To resolve the alert, click the Run Action button if it appears.
Other Recommendations Collapse the section to view additional recommendations. See the links in the Need More Information? section to view additional metrics, events, or other details that appear as a link.
Symptoms View the symptoms that triggered the alert. Collapse each symptom to view additional information.
Notes Enter your notes about the alert and click Submit to save.
Close Click the X icon to close the alert details tab.
Related Alerts TabThe Related Scope displayed on the right, shows the objects that are one level above and one level below the object on which the alert was triggered. This topology is fixed. You cannot change the scope in the Related Alerts tab.
On the right, you can see the following:
n If the same alert was triggered on the object, in the past 30 days. This helps you understand if this is a recurring problem or something new.
n If the same alert was triggered on other peers in the same environment, in the past 30 days. This helps you do a quick peer analysis to understand if others are impacted with the same problem.
n All the alerts triggered in the current topology. This helps you investigate if there are other alerts upstream or downstream in the environment which are impacting the health of the object.
Potential Evidence TabSee the Potential Evidence tab to see potential evidences around the problem, to understand and arrive at the root cause. This tab displays events, property changes, and anomalous metrics potentially relevant to the alert. The time range and the scope is fixed. To modify the scope or the time range and investigate further, click Launch Workbench. This runs the troubleshooting workbench.
vRealize Operations Manager Configuration Guide
VMware, Inc. 227
The time range that is displayed in the potential evidence tab is two hour and thirty minutes before the alert was triggered. vRealize Operations Manager looks for potential evidences in this time range.
Configuring AlertsWhenever there is a problem in the environment, the alerts are generated. You can create the alert definitions so that the generated alerts tell you about the problems in the monitored environment.
Defining Alerts in vRealize Operations ManagerAn alert definition comprises one or more symptom definitions, and the alert definition is associated with a set of recommendations and actions that help you resolve the problem. Alert definitions include triggering symptom definitions and actionable recommendations. You create the alert definitions so that the generated alerts tell you about problems in the monitored environment. You can then respond to the alerts with effective solutions that are provided in the recommendations.
Predefined alerts are provided in vRealize Operations Manager as part of your configured adapters. You can add or modify alert definitions to reflect the needs of your environment.
Symptoms in Alert DefinitionsSymptom definitions evaluate conditions in your environment that, if the conditions become true, trigger a symptom and can result in a generated alert. You can add symptom definitions that are based on metrics or super metrics, properties, message events, fault events, or metric events. You can create a symptom definition as you create an alert definition or as an individual item in the appropriate symptom definition list.
When you add a symptom definition to an alert definition, it becomes a part of a symptom set. A symptom set is the combination of the defined symptom with the argument that determines when the symptom condition becomes true.
A symptom set combines one or more symptom definitions by applying an Any or All condition, and allows you to choose the presence or absence of a particular symptom. If the symptom set pertains to related objects rather than to Self, you can apply a population clause to identify a percentage or a specific count of related objects that exhibit the included symptom definitions.
An alert definition comprises one or more symptom sets. If an alert definition requires all of the symptom sets to be triggered before generating an alert, and only one symptom set is triggered, an alert is not generated. If the alert definition requires only one of several symptom sets to be triggered, then the alert is generated even though the other symptom sets were not triggered.
Recommendations in Alert DefinitionsRecommendations are the remediation options that you provide to your users to resolve the problems that the generated alert indicates.
vRealize Operations Manager Configuration Guide
VMware, Inc. 228
When you add an alert definition that indicates a problem with objects in your monitored environment, add a relevant recommendation. Recommendations can be instructions to your users, links to other information or instruction sources, or vRealize Operations Manager actions that run on the target systems.
Modifying Alert DefinitionsIf you modify the alert impact type of an alert definition, any alerts that are already generated will have the previous impact level. Any new alerts will be at the new impact level. If you want to reset all the generated alerts to the new level, cancel the old alerts. If they are generated after cancellation, they will have the new impact level.
Defining Symptoms for AlertsSymptoms are conditions that indicate problems in your environment. You define symptoms that you add to alert definitions so that you know when a problem occurs with your monitored objects.
As data is collected from your monitored objects, the data is compared to the defined symptom condition. If the condition is true, then the symptom is triggered.
You can define symptoms based on metrics and super metrics, properties, message events, fault events, and metric events.
Defined symptoms in your environment are managed in the Symptom Definitions. When the symptoms that are added to an alert definition are triggered, they contribute to a generated alert.
Define Symptoms to Cover All Possible Severities and ConditionsUse a series of symptoms to describe incremental levels of concern. For example, Volume nearing capacity limit might have a severity value of Warning while Volume reached capacity limit might have a severity level of Critical. The first symptom is not an immediate threat. The second symptom is an immediate threat.
About Metrics and Super Metrics SymptomsMetric and super metric symptoms are based on the operational or performance values that vRealize Operations Manager collects from target objects in your environment. You can configure the symptoms to evaluate static thresholds or dynamic thresholds.
You define symptoms based on metrics so that you can create alert definitions that let you know when the performance of an object in your environment is adversely affected.
Static Thresholds
Metric symptoms that are based on a static threshold compare the currently collected metric value against the fixed value you configure in the symptom definition.
For example, you can configure a static metric symptom where, when the virtual machine CPU workload is greater than 90, a critical symptom is triggered.
vRealize Operations Manager Configuration Guide
VMware, Inc. 229
Dynamic Thresholds
Metric symptoms that are based on dynamic thresholds compare the currently collected metric value against the trend identified by vRealize Operations Manager, evaluating whether the current value is above, below, or generally outside the trend.
For example, you can configure a dynamic metric symptom where, when the virtual machine CPU workload is above the trended normal value, a critical symptom is triggered.
Property SymptomsProperty symptoms are based on the configuration properties that vRealize Operations Manager collects from the target objects in your environment.
You define symptoms based on properties so that you can create alert definitions that let you know when changes to properties on your monitored objects can affect the behavior of the objects in your environment.
Message Event SymptomsMessage event symptoms are based on events received as messages from a component of vRealize Operations Manager or from an external monitored system through the system's REST API. You define symptoms based on message events to include in alert definitions that use these symptoms. When the configured symptom condition is true, the symptom is triggered.
The adapters for the external monitored systems and the REST API are inbound channels for collecting events from external sources. Adapters and the REST server both run in the vRealize Operations Manager system. The external system sends the messages, and vRealize Operations Manager collects them.
You can create message event symptoms for the supported event types. The following list is of supported event types with example events.
n System Performance Degradation. This message event type corresponds to the EVENT_CLASS_SYSTEM and EVENT_SUBCLASS_PERFORM_DEGRADATION type and subtype in the vRealize Operations Manager API SDK.
n Change. The VMware adapter sends a change event when the CPU limit for a virtual machine is changed from unlimited to 2 GHz. You can create a symptom to detect CPU contention issues as a result of this configuration change. This message event type corresponds to the EVENT_CLASS_CHANGE and EVENT_SUBCLASS_CHANGE type and subtype in the vRealize Operations Manager API SDK.
n Environment Down. The vRealize Operations Manager adapter sends an environment down event when the collector component is not communicating with the other components. You can create a symptom that is used for internal health monitoring. This message event type corresponds to the EVENT_CLASS_ENVIRONMENT and EVENT_SUBCLASS_DOWN type and subtype in the vRealize Operations Manager API SDK.
n Notification. This message event type corresponds to the EVENT_CLASS_NOTIFICATION and EVENT_SUBCLASS_EXTEVENT type and subtype in the vRealize Operations Manager API SDK.
vRealize Operations Manager Configuration Guide
VMware, Inc. 230
Fault SymptomsFault symptoms are based on events published by monitored systems. vRealize Operations Manager correlates a subset of these events and delivers them as faults. Faults are intended to signify events in the monitored systems that affect the availability of objects in your environment. You define symptoms based on faults to include in alert definitions that use these symptoms. When the configured symptom condition is true, the symptom is triggered.
You can create fault symptoms for the supported published faults. Some object types have multiple fault definitions from which to choose, while others have no fault definitions.
If the adapter published fault definitions for an object type, you can select one or more fault events for a given fault while you define the symptom. The symptom is triggered if the fault is active because of any of the chosen events. If you do not select a fault event, the symptom is triggered if the fault is active because of a fault event.
Metric Event SymptomsMetric event symptoms are based on events communicated from a monitored system where the selected metric violates a threshold in a specified manner. The external system manages the threshold, not vRealize Operations Manager.
Metric event symptoms are based on conditions reported for selected metrics by an external monitored system, as compared to metric symptoms, which are based on thresholds that vRealize Operations Manager is actively monitoring.
The metric event thresholds, which determine whether the metric is above, below, equal to, or not equal to the threshold set on the monitored system, represent the type and subtype combination that is specified in the incoming metric event.
n Above Threshold. Corresponds to type and subtype constants EVENT_CLASS_HT and EVENT_SUBCLASS_ABOVE defined in the vRealize Operations Manager API SDK.
n Below Threshold. Corresponds to type and subtype constants EVENT_CLASS_HT and EVENT_SUBCLASS_BELOW defined in the vRealize Operations Manager API SDK.
n Equal Threshold. Corresponds to type and subtype constants EVENT_CLASS_HT and EVENT_SUBCLASS_EQUAL defined in the vRealize Operations Manager API SDK.
n Not Equal Threshold. Corresponds to type and subtype constants EVENT_CLASS_HT and EVENT_SUBCLASS_NOT_EQUAL defined in the vRealize Operations Manager API SDK.
Understanding Negative Symptoms for vRealize Operations Manager AlertsAlert symptoms are conditions that indicate problems in your environment. When you define an alert, you include symptoms that generate the alert when they become true in your environment. Negative symptoms are based on the absence of the symptom condition. If the symptom is not true, the symptom is triggered.
To use the absence of the symptom condition in an alert definition, you negate the symptom in the symptom set.
vRealize Operations Manager Configuration Guide
VMware, Inc. 231

All defined symptoms have a configured criticality. However, if you negate a symptom in an alert definition, it does not have an associated criticality when the alert is generated.
All symptom definitions have a configured criticality. If the symptom is triggered because the condition is true, the symptom criticality will be the same as the configured criticality. However, if you negate a symptom in an alert definition and the negation is true, it does not have an associated criticality.
When negative symptoms are triggered and an alert is generated, the effect on the criticality of the alert depends on how the alert definition is configured.
The following table provides examples of the effect negative symptoms have on generated alerts.
Table 2-1. Negative Symptoms Effect on Generated Alert Criticality
Alert Definition CriticalityNegative Symptom Configured Criticality
Standard Symptom Configured Criticality
Alert Criticality When Triggered
Warning One Critical Symptom One Immediate Symptom Warning. The alert criticality is based on the defined alert criticality.
Symptom Based One Critical Symptom One Warning Symptom Warning. The negative symptom has no associated criticality and the criticality of the standard symptom determines the criticality of the generated alert.
Symptom Based One Critical Symptom No standard symptom included Info. Because an alert must have a criticality and the negative alert does not have an associated criticality, the generated alert has a criticality of Info, which is the lowest possible criticality level.
Defining Recommendations for Alert DefinitionsRecommendations are instructions to your users who are responsible for responding to alerts. You add recommendations to vRealize Operations Manager alerts so that your users can maintain the objects in your environment at the required levels of performance.
Recommendations provide your network engineers or virtual infrastructure administrators with information to resolve alerts.
Depending on the knowledge level of your users, you can provide more or less information, including the following options, in any combination.
n One line of instruction.
n Steps to resolve the alert on the target object.
n Hyperlink to a Web site, runbook, wiki, or other source.
n Action that makes a change on the target object.
vRealize Operations Manager Configuration Guide
VMware, Inc. 232
When you define an alert, provide as many relevant action recommendations as possible. If more than one recommendation is available, arrange them in priority order so that the solution with the lowest effect and highest effectiveness is listed first. If no action recommendation is available, add text recommendations. Be as precise as possible when describing what the administrator should do to fix the alert.
Create a New Alert DefinitionBased on the root cause of the problem, and the solutions that you used to fix the problem, you can create a new alert definition for vRealize Operations Manager to alert you. When the alert is triggered on your host system, vRealize Operations Manager alerts you and provides recommendations on how to solve the problem.
To alert you before your host systems experience critical capacity problems, and have vRealize Operations Manager notify you of problems in advance, you create alert definitions, and add symptom definitions to the alert definition.
Procedure
1 In the menu, click Alerts and then in the left pane, select Alert Settings > Alert Definitions.
2 Enter capacity in the search text box.
Review the available list of capacity alert definitions. If a capacity alert definition does not exist for host systems, you can create one.
3 Click the plus sign to create a new capacity alert definition for your host systems.
a In the alert definition workspace, for the Name and Description, enter Hosts - Alert on Capacity Exceeded.
b For the Base Object Type, select vCenter Adapter > Host System
c For the Alert Impact, select the following options.
Option Selection
Impact Select Risk.
Criticality Select Immediate.
Alert Type and Subtype Select Application : Capacity.
Wait Cycle Select 1.
Cancel Cycle Select 1.
d For Add Symptom Definitions, select the following options.
Option Selection
Defined On Select Self.
Symptom Definition Type Select Metric / Supermetric.
Quick filter (Name) Enter capacity.
vRealize Operations Manager Configuration Guide
VMware, Inc. 233

e From the Symptom Definition list, click Host System Capacity Remaining is moderately low and drag it to the right pane.
In the Symptoms pane, make sure that the Base object exhibits criteria is set to All by default.
f For Add Recommendations, enter virtual machine in the quick filter text box.
g Click Review the symptoms listed and remove the number of vCPUs from the virtual machine as recommended by the system, and drag it to the recommendations area in the right pane.
This recommendation is set to Priority 1.
4 Click Save to save the alert definition.
Your new alert appears in the list of alert definitions.
You have added an alert definition to have vRealize Operations Manager alert you when the capacity of your host systems begins to run out.
Alert Definition Best PracticesAs you create alert definitions for your environment, apply consistent best practices so that you optimize alert behavior for your monitored objects.
Alert Definitions Naming and DescriptionThe alert definition name is the short name that appears in the following places:
n In data grids when alerts are generated
n In outbound alert notifications, including the email notifications that are sent when outbound alerts and notifications are configured in your environment
Ensure that you provide an informative name that clearly states the reported problem. Your users can evaluate alerts based on the alert definition name.
The alert definition description is the text that appears in the alert definition details and the outbound alerts. Ensure that you provide a useful description that helps your users understand the problem that generated the alert.
Wait and Cancel CycleThe wait cycle setting helps you adjust for sensitivity in your environment. The wait cycle for the alert definition goes into effect after the wait cycle for the symptom definition results in a triggered symptom. In most alert definitions you configure the sensitivity at the symptom level and configure the wait cycle of alert definition to 1. This configuration ensures that the alert is immediately generated after all of the symptoms are triggered at the desired symptom sensitivity level.
vRealize Operations Manager Configuration Guide
VMware, Inc. 234
The cancel cycle setting helps you adjust for sensitivity in your environment. The cancel cycle for the alert definition goes into affect after the cancel cycle for the symptom definition results in a cancelled symptom. In most definitions you configure the sensitivity at the symptom level and configure the cancel cycle of alert definition to 1. This configuration ensures that the alert is immediately cancelled after all of the symptoms conditions disappear after the desired symptom cancel cycle.
Create Alert Definitions to Generate the Fewest AlertsYou can control the size of your alert list and make it easier to manage. When an alert is about a general problem that can be triggered on a large number of objects, configure its definition so that the alert is generated on a higher level object in the hierarchy rather than on individual objects.
As you add symptoms to your alert definition, do not overcrowd a single alert definition with secondary symptoms. Keep the combination of symptoms as simple and straightforward as possible.
You can also use a series of symptom definitions to describe incremental levels of concern. For example, Volume nearing capacity limit might have a severity value of Warning while Volume reached capacity limit might have a severity level of Critical. The first symptom is not an immediate threat, but the second one is an immediate threat. You can then include the Warning and Critical symptom definitions in a single alert definition with an Any condition and set the alert criticality to be Symptom Based. These settings cause the alert to be generated with the right criticality if either of the symptoms is triggered.
Avoid Overlapping and Gaps Between AlertsOverlaps result in two or more alerts being generated for the same underlying condition. Gaps occur when an unresolved alert with lower severity is canceled, but a related alert with a higher severity cannot be triggered.
A gap occurs in a situation where the value is <=50% in one alert definition and >=75% in a second alert definition. The gap occurs because when the percentage of volumes with high use falls between 50 percent and 75 percent, the first problem cancels but the second does not generate an alert. This situation is problematic because no alert definitions are active to cover the gap.
Actionable RecommendationsIf you provide text instructions to your users that help them resolve a problem identified by an alert definition, precisely describe how the engineer or administrator should fix the problem to resolve the alert.
To support the instructions, add a link to a wiki, runbook, or other sources of information, and add actions that you run from vRealize Operations Manageron the target systems.
Creating and Managing vRealize Operations Manager Alert NotificationsWhen alerts are generated in vRealize Operations Manager, they appear in the alert details and object details, but you can also configure vRealize Operations Manager to send your alerts to outside applications using one or more outbound alert options.
vRealize Operations Manager Configuration Guide
VMware, Inc. 235
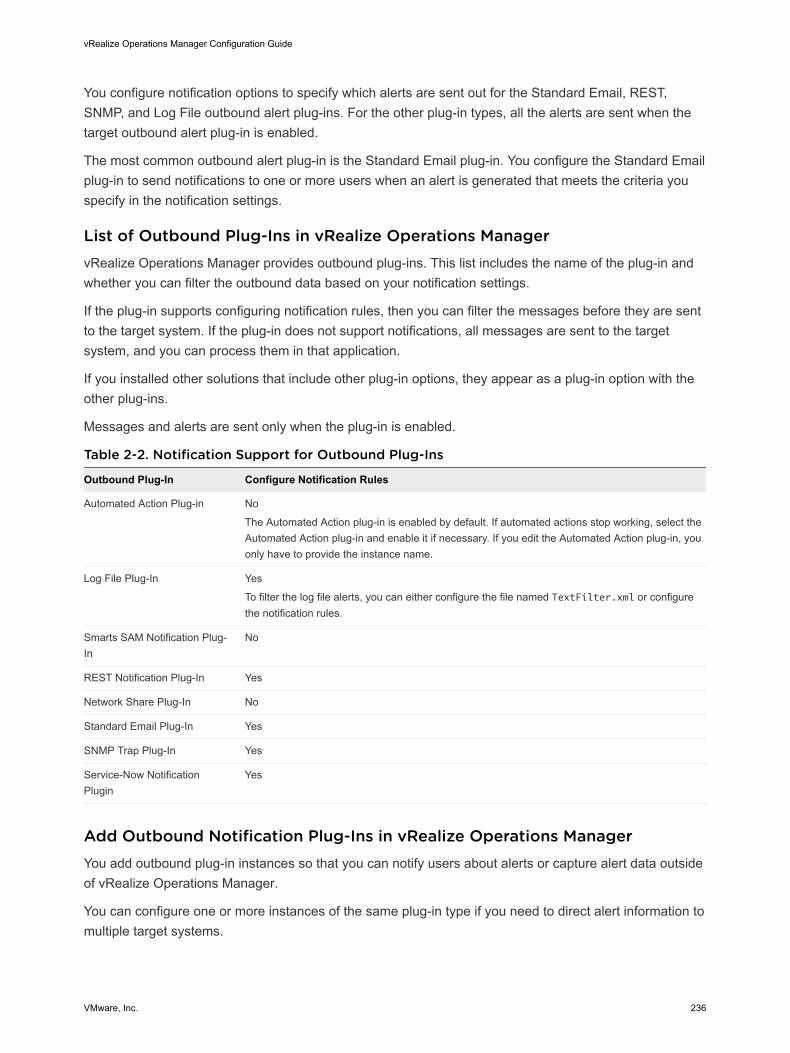
You configure notification options to specify which alerts are sent out for the Standard Email, REST, SNMP, and Log File outbound alert plug-ins. For the other plug-in types, all the alerts are sent when the target outbound alert plug-in is enabled.
The most common outbound alert plug-in is the Standard Email plug-in. You configure the Standard Email plug-in to send notifications to one or more users when an alert is generated that meets the criteria you specify in the notification settings.
List of Outbound Plug-Ins in vRealize Operations ManagervRealize Operations Manager provides outbound plug-ins. This list includes the name of the plug-in and whether you can filter the outbound data based on your notification settings.
If the plug-in supports configuring notification rules, then you can filter the messages before they are sent to the target system. If the plug-in does not support notifications, all messages are sent to the target system, and you can process them in that application.
If you installed other solutions that include other plug-in options, they appear as a plug-in option with the other plug-ins.
Messages and alerts are sent only when the plug-in is enabled.
Table 2-2. Notification Support for Outbound Plug-Ins
Outbound Plug-In Configure Notification Rules
Automated Action Plug-in No
The Automated Action plug-in is enabled by default. If automated actions stop working, select the Automated Action plug-in and enable it if necessary. If you edit the Automated Action plug-in, you only have to provide the instance name.
Log File Plug-In Yes
To filter the log file alerts, you can either configure the file named TextFilter.xml or configure the notification rules.
Smarts SAM Notification Plug-In
No
REST Notification Plug-In Yes
Network Share Plug-In No
Standard Email Plug-In Yes
SNMP Trap Plug-In Yes
Service-Now Notification Plugin
Yes
Add Outbound Notification Plug-Ins in vRealize Operations ManagerYou add outbound plug-in instances so that you can notify users about alerts or capture alert data outside of vRealize Operations Manager.
You can configure one or more instances of the same plug-in type if you need to direct alert information to multiple target systems.
vRealize Operations Manager Configuration Guide
VMware, Inc. 236
The Automated Action plug-in is enabled by default. If automated actions stop working, check the Automated Action plug-in and enable it if necessary. If you edit the Automated Action plug-in, you only need to provide the instance name.
n Add a Standard Email Plug-In for vRealize Operations Manager Outbound Alerts
You add a Standard Email Plug-In so that you can use Simple Mail Transfer Protocol (SMTP) to email vRealize Operations Manager alert notifications to your virtual infrastructure administrators, network operations engineers, and other interested individuals.
n Add a REST Plug-In for vRealize Operations Manager Outbound Alerts
You add a REST Plug-In so that you can send vRealize Operations Manager alerts to another REST-enabled application where you built a REST Web service to accept these messages.
n Add a Log File Plug-In for vRealize Operations Manager Outbound Alerts
You add a Log File plug-in when you want to configure vRealize Operations Manager to log alerts to a file on each of your vRealize Operations Manager nodes. If you installed vRealize Operations Manager as a multiple node cluster, each node processes and logs the alerts for the objects that it monitors. Each node logs the alerts for the objects it processes.
n Add a Network Share Plug-In for vRealize Operations Manager Reports
You add a Network Share plug-in when you want to configure vRealize Operations Manager to send reports to a shared location. The Network Share plug-in supports only SMB version 2.1.
n Add an SNMP Trap Plug-In for vRealize Operations Manager Outbound Alerts
You add an SNMP Trap plug-in when you want to configure vRealize Operations Manager to log alerts on an existing SNMP Trap server in your environment.
n Add a Smarts Service Assurance Manager Notification Plug-In for vRealize Operations Manager Outbound Alerts
You add a Smarts SAM Notification plug-in when you want to configure vRealize Operations Manager to send alert notifications to EMC Smarts Server Assurance Manager.
n Add a Service-Now Notification Plug-In for Outbound Alerts
You add a Service-Now Notification plug-in when you want to integrate Service Now ticketing system with vRealize Operations Manager. Service Now creates an incident whenever an alert is triggered in vRealize Operations Manager.
Add a Standard Email Plug-In for vRealize Operations Manager Outbound Alerts
You add a Standard Email Plug-In so that you can use Simple Mail Transfer Protocol (SMTP) to email vRealize Operations Manager alert notifications to your virtual infrastructure administrators, network operations engineers, and other interested individuals.
Prerequisites
Ensure that you have an email user account that you can use as the connection account for the alert notifications. If you choose to require authentication, you must also know the password for this account.
vRealize Operations Manager Configuration Guide
VMware, Inc. 237
Procedure
1 In the menu, click Administration and then in the left pane, click Management.
2 Click Outbound Settings and click the plus sign to add a plug-in.
3 From the Plug-In Type drop-down menu, select Standard Email Plugin.
The dialog box expands to include your SMTP settings.
4 Enter an Instance Name.
This is the name that identifies this instance that you select when you later configure notification rules.
5 Configure the SMTP options appropriate for your environment.
Option Description
Use Secure Connection Enables secure communication encryption using SSL/TLS. If you select this option, you must select a method in the Secure Connection Type drop-down menu.
Requires Authentication Enables authentication on the email user account that you use to configure this SMTP instance. If you select this option, you must provide a password for the user account.
SMTP Host URL or IP address of your email host server.
SMTP Port Default port SMTP uses to connect with the server.
Secure Connection Type Select either SSL/TLS as the communication encryption method used in your environment from the drop-down menu. You must select a connection type if you select Use Secure Connection.
User Name Email user account that is used to connect to the email server.
Password Password for the connection user account. A password is required if you select Requires Authentication.
Sender Email Address Email address that appears on the notification message
Sender Name Displayed name for the sender email address.
6 Click Save.
7 To start the outbound alert service for this plug-in, select the instance in the list and click Enable on the toolbar.
This instance of the standard email plug-in for outbound SMTP alerts is configured and running.
What to do next
Create notification rules that use the standard email plug-in to send a message to your users about alerts requiring their attention. See User Scenario: Create a vRealize Operations Manager Email Alert Notification .
Add a REST Plug-In for vRealize Operations Manager Outbound Alerts
You add a REST Plug-In so that you can send vRealize Operations Manager alerts to another REST-enabled application where you built a REST Web service to accept these messages.
vRealize Operations Manager Configuration Guide
VMware, Inc. 238
The REST Plug-In supports enabling an integration, it does not provide an integration. Depending on your target application, you might need an intermediary REST service or some other mechanism that will correlate the alert and object identifiers included in the REST alert output with the identifiers in your target application.
Determine which content type you are delivering to your target application. If you select application/json, the body of the POST or PUT calls that are sent have the following format. Sample data is included.
{
"startDate":1369757346267,
"criticality":"ALERT_CRITICALITY_LEVEL_WARNING",
"Risk":4.0,
"resourceId":"sample-object-uuid",
"alertId":"sample-alert-uuid",
"status":"ACTIVE",
"subType":"ALERT_SUBTYPE_AVAILABILITY_PROBLEM",
"cancelDate":1369757346267,
"resourceKind":"sample-object-type",
"alertName":"Invalid IP Address for connected Leaf Switch",
"attributeKeyID":5325,
"Efficiency":1.0,
"adapterKind":"sample-adapter-type",
"Health":1.0,
"type":"ALERT_TYPE_APPLICATION_PROBLEM",
"resourceName":"sample-object-name",
"updateDate":1369757346267,
"info":"sample-info"
}
If you select application/xml, the body of the POST or PUT calls that are sent have the following format:
<alert>
<startDate>1369757346267</startDate>
<criticality>ALERT_CRITICALITY_LEVEL_WARNING</criticality>
<Risk>4.0</Risk>
<resourceId>sample-object-uuid</resourceId>
<alertId>sample-alert-uuid</alertId>
<status>ACTIVE</status>
<subType>ALERT_SUBTYPE_AVAILABILITY_PROBLEM</subType>
<cancelDate>1369757346267</cancelDate>
<resourceKind>sample-object-type</resourceKind>
<alertName>Invalid IP Address for connected Leaf Switch</alertName>
<attributeKeyId>5325</attributeKeyId>
<Efficiency>1.0</Efficiency>
<adapterKind>sample-adapter-type</adapterKind>
<Health>1.0</Health>
<type>ALERT_TYPE_APPLICATION_PROBLEM</type>
vRealize Operations Manager Configuration Guide
VMware, Inc. 239
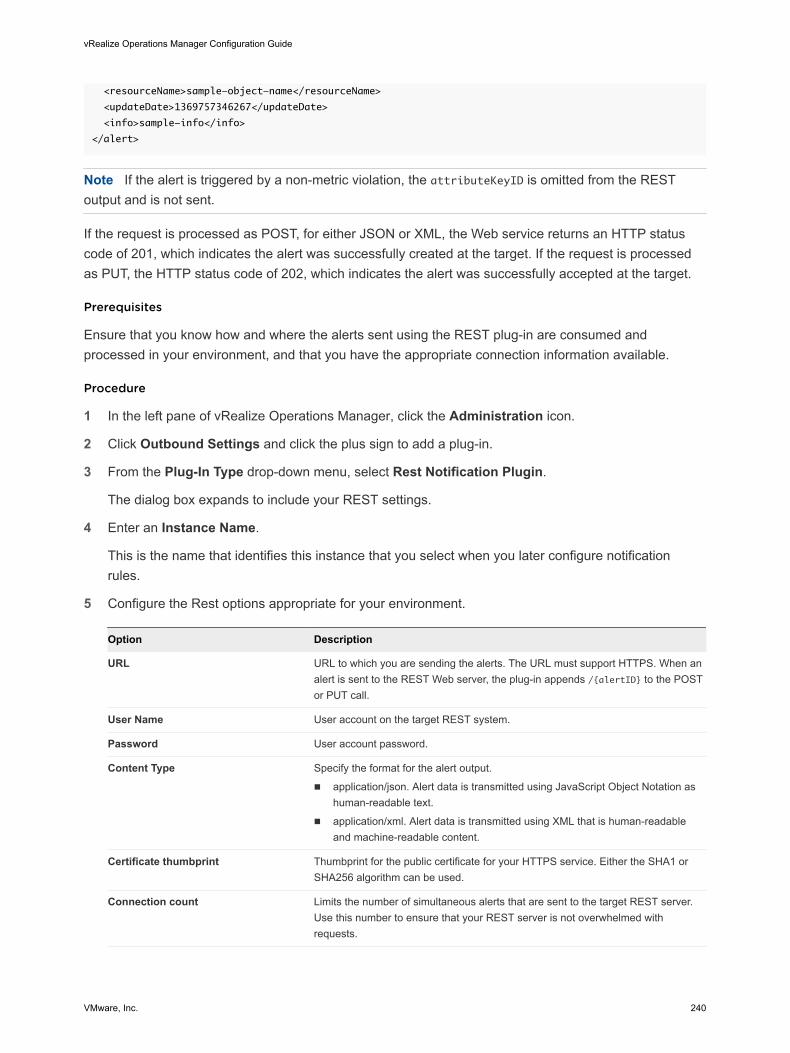
<resourceName>sample-object-name</resourceName>
<updateDate>1369757346267</updateDate>
<info>sample-info</info>
</alert>
Note If the alert is triggered by a non-metric violation, the attributeKeyID is omitted from the REST output and is not sent.
If the request is processed as POST, for either JSON or XML, the Web service returns an HTTP status code of 201, which indicates the alert was successfully created at the target. If the request is processed as PUT, the HTTP status code of 202, which indicates the alert was successfully accepted at the target.
Prerequisites
Ensure that you know how and where the alerts sent using the REST plug-in are consumed and processed in your environment, and that you have the appropriate connection information available.
Procedure
1 In the left pane of vRealize Operations Manager, click the Administration icon.
2 Click Outbound Settings and click the plus sign to add a plug-in.
3 From the Plug-In Type drop-down menu, select Rest Notification Plugin.
The dialog box expands to include your REST settings.
4 Enter an Instance Name.
This is the name that identifies this instance that you select when you later configure notification rules.
5 Configure the Rest options appropriate for your environment.
Option Description
URL URL to which you are sending the alerts. The URL must support HTTPS. When an alert is sent to the REST Web server, the plug-in appends /{alertID} to the POST or PUT call.
User Name User account on the target REST system.
Password User account password.
Content Type Specify the format for the alert output.
n application/json. Alert data is transmitted using JavaScript Object Notation as human-readable text.
n application/xml. Alert data is transmitted using XML that is human-readable and machine-readable content.
Certificate thumbprint Thumbprint for the public certificate for your HTTPS service. Either the SHA1 or SHA256 algorithm can be used.
Connection count Limits the number of simultaneous alerts that are sent to the target REST server. Use this number to ensure that your REST server is not overwhelmed with requests.
vRealize Operations Manager Configuration Guide
VMware, Inc. 240
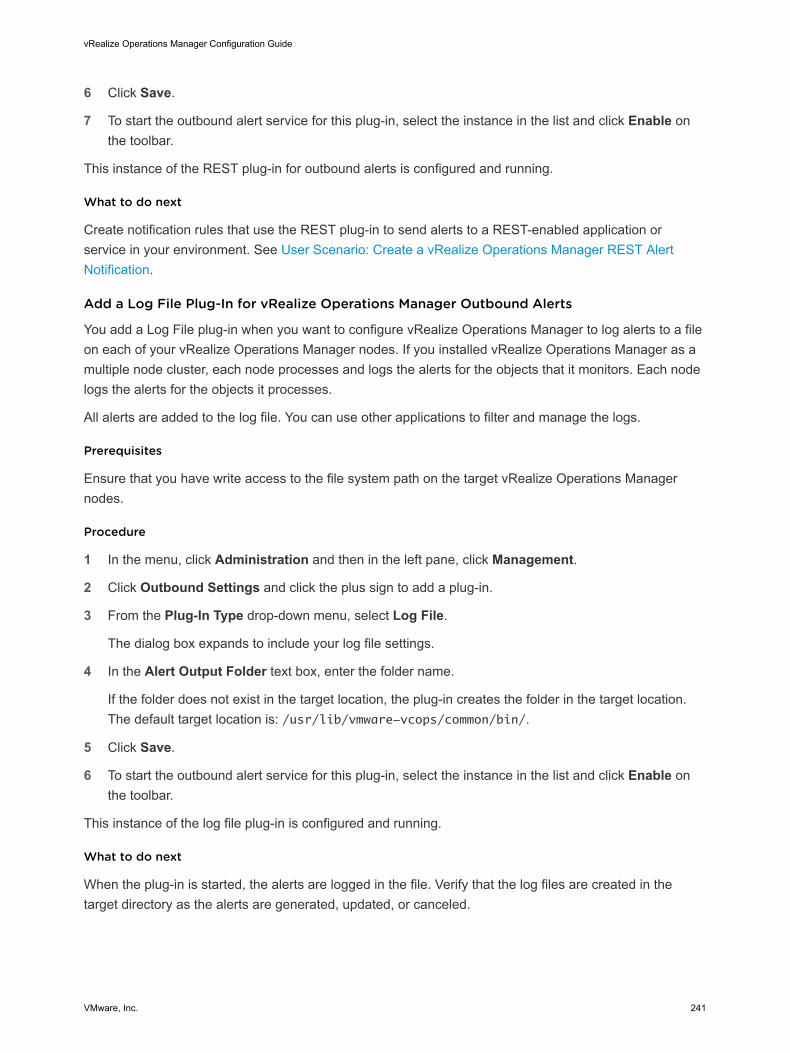
6 Click Save.
7 To start the outbound alert service for this plug-in, select the instance in the list and click Enable on the toolbar.
This instance of the REST plug-in for outbound alerts is configured and running.
What to do next
Create notification rules that use the REST plug-in to send alerts to a REST-enabled application or service in your environment. See User Scenario: Create a vRealize Operations Manager REST Alert Notification.
Add a Log File Plug-In for vRealize Operations Manager Outbound Alerts
You add a Log File plug-in when you want to configure vRealize Operations Manager to log alerts to a file on each of your vRealize Operations Manager nodes. If you installed vRealize Operations Manager as a multiple node cluster, each node processes and logs the alerts for the objects that it monitors. Each node logs the alerts for the objects it processes.
All alerts are added to the log file. You can use other applications to filter and manage the logs.
Prerequisites
Ensure that you have write access to the file system path on the target vRealize Operations Manager nodes.
Procedure
1 In the menu, click Administration and then in the left pane, click Management.
2 Click Outbound Settings and click the plus sign to add a plug-in.
3 From the Plug-In Type drop-down menu, select Log File.
The dialog box expands to include your log file settings.
4 In the Alert Output Folder text box, enter the folder name.
If the folder does not exist in the target location, the plug-in creates the folder in the target location. The default target location is: /usr/lib/vmware-vcops/common/bin/.
5 Click Save.
6 To start the outbound alert service for this plug-in, select the instance in the list and click Enable on the toolbar.
This instance of the log file plug-in is configured and running.
What to do next
When the plug-in is started, the alerts are logged in the file. Verify that the log files are created in the target directory as the alerts are generated, updated, or canceled.
vRealize Operations Manager Configuration Guide
VMware, Inc. 241

Add a Network Share Plug-In for vRealize Operations Manager Reports
You add a Network Share plug-in when you want to configure vRealize Operations Manager to send reports to a shared location. The Network Share plug-in supports only SMB version 2.1.
Prerequisites
Verify that you have read, write, and delete permissions to the network share location.
Procedure
1 In the menu, click Administration and then in the left pane, click Management > Outbound Settings.
2 From the toolbar, click the Add icon.
3 From the Plug-In Type drop-down menu, select Network Share Plug-in.
The dialog box expands to include your plug-in instance settings.
4 Enter an Instance Name.
This is the name that identifies this instance that you select when you later configure notification rules.
5 Configure the Network Share options appropriate for your environment.
Option Description
Domain Your shared network domain address.
User Name The domain user account that is used to connect to the network.
Password The password for the domain user account.
Network share root The path to the root folder where you want to save the reports. You can specify subfolders for each report when you configure the schedule publication.
You must enter an IP address. For example, \\IP_address\ShareRoot. You can use the host name instead of the IP address if the host name is resolved to an IPv4 when accessed from the vRealize Operations Manager host.
Note Verify that the root destination folder exists. If the folder is missing, the Network Share plug-in logs an error after 5 unsuccessful attempts.
6 Click Test to verify the specified paths, credentials, and permissions.
The test might take up to a minute.
7 Click Save.
The outbound service for this plug-in starts automatically.
8 (Optional) To stop an outbound service, select an instance and click Disable on the toolbar.
This instance of the Network Share plug-in is configured and running.
What to do next
Create a report schedule and configure it to send reports to your shared folder.
vRealize Operations Manager Configuration Guide
VMware, Inc. 242
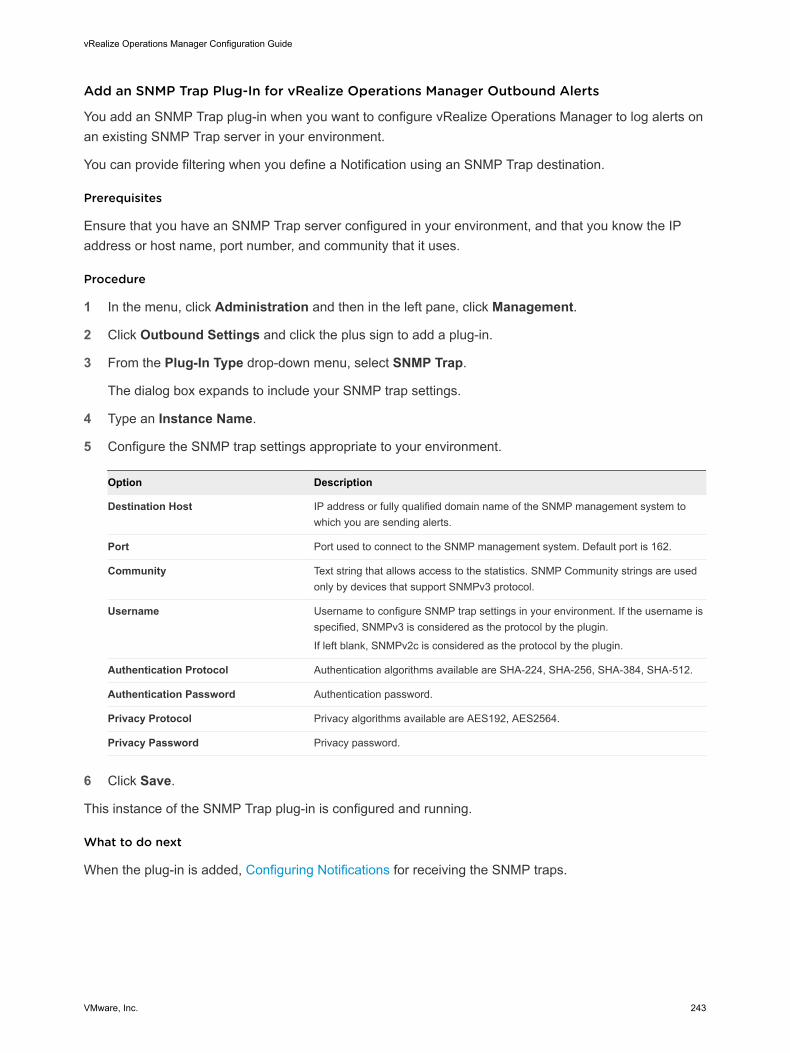
Add an SNMP Trap Plug-In for vRealize Operations Manager Outbound Alerts
You add an SNMP Trap plug-in when you want to configure vRealize Operations Manager to log alerts on an existing SNMP Trap server in your environment.
You can provide filtering when you define a Notification using an SNMP Trap destination.
Prerequisites
Ensure that you have an SNMP Trap server configured in your environment, and that you know the IP address or host name, port number, and community that it uses.
Procedure
1 In the menu, click Administration and then in the left pane, click Management.
2 Click Outbound Settings and click the plus sign to add a plug-in.
3 From the Plug-In Type drop-down menu, select SNMP Trap.
The dialog box expands to include your SNMP trap settings.
4 Type an Instance Name.
5 Configure the SNMP trap settings appropriate to your environment.
Option Description
Destination Host IP address or fully qualified domain name of the SNMP management system to which you are sending alerts.
Port Port used to connect to the SNMP management system. Default port is 162.
Community Text string that allows access to the statistics. SNMP Community strings are used only by devices that support SNMPv3 protocol.
Username Username to configure SNMP trap settings in your environment. If the username is specified, SNMPv3 is considered as the protocol by the plugin.
If left blank, SNMPv2c is considered as the protocol by the plugin.
Authentication Protocol Authentication algorithms available are SHA-224, SHA-256, SHA-384, SHA-512.
Authentication Password Authentication password.
Privacy Protocol Privacy algorithms available are AES192, AES2564.
Privacy Password Privacy password.
6 Click Save.
This instance of the SNMP Trap plug-in is configured and running.
What to do next
When the plug-in is added, Configuring Notifications for receiving the SNMP traps.
vRealize Operations Manager Configuration Guide
VMware, Inc. 243
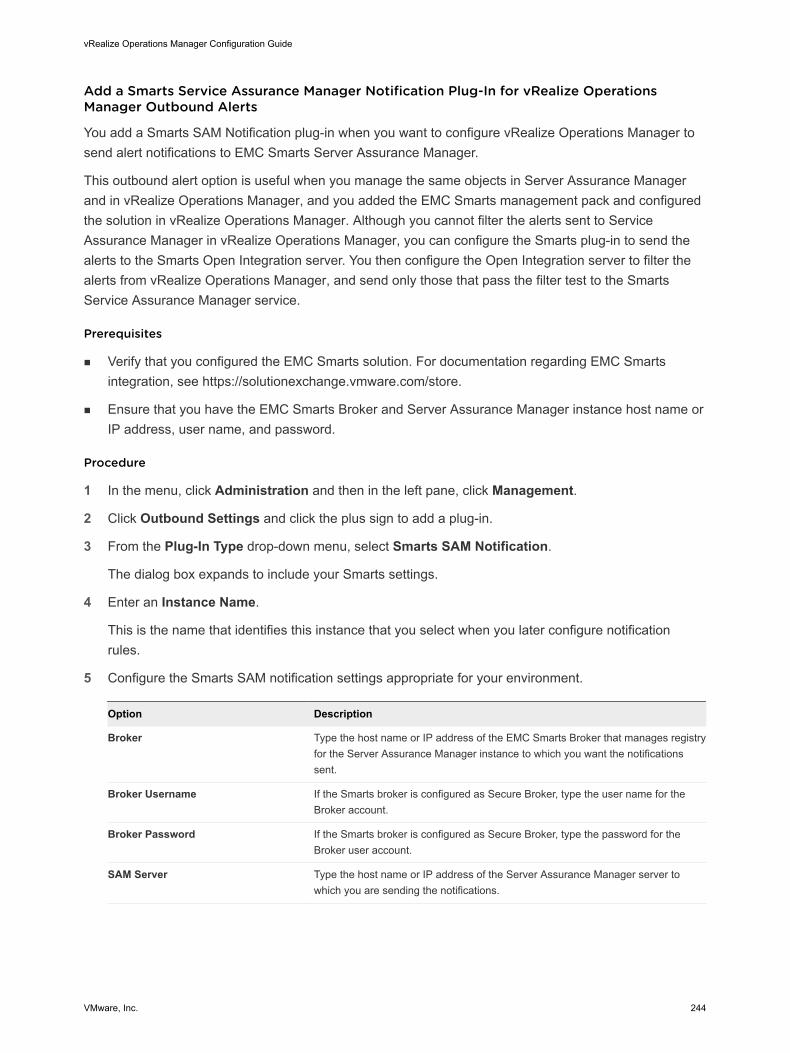
Add a Smarts Service Assurance Manager Notification Plug-In for vRealize Operations Manager Outbound Alerts
You add a Smarts SAM Notification plug-in when you want to configure vRealize Operations Manager to send alert notifications to EMC Smarts Server Assurance Manager.
This outbound alert option is useful when you manage the same objects in Server Assurance Manager and in vRealize Operations Manager, and you added the EMC Smarts management pack and configured the solution in vRealize Operations Manager. Although you cannot filter the alerts sent to Service Assurance Manager in vRealize Operations Manager, you can configure the Smarts plug-in to send the alerts to the Smarts Open Integration server. You then configure the Open Integration server to filter the alerts from vRealize Operations Manager, and send only those that pass the filter test to the Smarts Service Assurance Manager service.
Prerequisites
n Verify that you configured the EMC Smarts solution. For documentation regarding EMC Smarts integration, see https://solutionexchange.vmware.com/store.
n Ensure that you have the EMC Smarts Broker and Server Assurance Manager instance host name or IP address, user name, and password.
Procedure
1 In the menu, click Administration and then in the left pane, click Management.
2 Click Outbound Settings and click the plus sign to add a plug-in.
3 From the Plug-In Type drop-down menu, select Smarts SAM Notification.
The dialog box expands to include your Smarts settings.
4 Enter an Instance Name.
This is the name that identifies this instance that you select when you later configure notification rules.
5 Configure the Smarts SAM notification settings appropriate for your environment.
Option Description
Broker Type the host name or IP address of the EMC Smarts Broker that manages registry for the Server Assurance Manager instance to which you want the notifications sent.
Broker Username If the Smarts broker is configured as Secure Broker, type the user name for the Broker account.
Broker Password If the Smarts broker is configured as Secure Broker, type the password for the Broker user account.
SAM Server Type the host name or IP address of the Server Assurance Manager server to which you are sending the notifications.
vRealize Operations Manager Configuration Guide
VMware, Inc. 244
Option Description
User Name Type the user name for the Server Assurance Manager server instance. This account must have read and write permissions for the notifications on the Smarts server as specified in the SAM Server.
Password Type the password for the Server Assurance Manager server account.
6 Click Save.
7 Modify the Smarts SAM plug-in properties file.
a Open the properties file at: /usr/lib/vmware-vcops/user/plugins/outbound/vcops-smartsalert-plugin/conf/plugin.properties
b Add the following string to the properties file: # sendByType=APPLICATION::AVAILABILITY,APPLICATION::PERFORMANCE,APPLICATION::CAPACITY,AP
PLICATION::COMPLIANCE,VIRTUALIZATION::AVAILABILITY,VIRTUALIZATION::PERFORMANCE,VIRTUAL
IZATION::CAPACITY,VIRTUALIZATION::COMPLIANCE,HARDWARE::AVAILABILITY,HARDWARE::PERFORMA
NCE,HARDWARE::CAPACITY,HARDWARE::COMPLIANCE,STORAGE::AVAILABILITY,STORAGE::PERFORMANCE
,STORAGE::CAPACITY,STORAGE::COMPLIANCE,NETWORK::AVAILABILITY,NETWORK::PERFORMANCE,NETW
ORK::CAPACITY,NETWORK::COMPLIANCE
c Save the properties file.
8 To start the outbound alert service for this plug-in, select the instance in the list and click Enable on the toolbar.
This instance of the Smarts SAM Notifications plug-in is configured and running.
What to do next
In Smarts Service Assurance Manager, configure your Notification Log Console to filter the alerts from vRealize Operations Manager. To configure the filtering for Service Assurance Manager, see the EMC Smarts Service Assurance Manager documentation.
Add a Service-Now Notification Plug-In for Outbound Alerts
You add a Service-Now Notification plug-in when you want to integrate Service Now ticketing system with vRealize Operations Manager. Service Now creates an incident whenever an alert is triggered in vRealize Operations Manager.
Using Service-Now Notification Plug-In you can send alert notifications to the Service Now ticketing system to create incidents. The incident includes information like the Caller, Category, Subcategory, Business Service, and other attributes related to alerts.
Prerequisites
Ensure that you have log in credentials for Service-Now.
Ensure that you are assigned with IT Infrastructure Library (ITIL) role in Service Now.
vRealize Operations Manager Configuration Guide
VMware, Inc. 245

Procedure
1 In the menu, click Administration and then in the left pane, click Management > Outbound Settings.
2 From the toolbar, click the Add icon.
3 From the Plug-In Type drop-down menu, select Service-Now Notification Plug-in.
The dialog box expands to include your plug-in instance settings.
4 Enter an Instance Name.
5 Enter the Service Now URL.
https://dev22418.service-now.com/
6 Enter the user name and password for Service Now.
7 Enter a value for the Connection Count.
The connection count represents the maximum number of open connections allowed per node in vRealize Operations Manager.
8 To verify the specified paths, credentials, and permissions, click Test.
9 Click Save.
This instance of the Service-Now Notifications plug-in is configured and running.
What to do next
When the plug-in is added, Configuring Notifications for creating incidents in Service-Now ticketing system.
Configuring NotificationsNotifications are alert notifications that meet the filter criteria in the notification rules before they are sent outside vRealize Operations Manager. You configure notification rules for the supported outbound alerts so that you can filter the alerts that are sent to the selected external system.
You use the notifications list to manage your rules. You then use the notification rules to limit the alerts that are sent to the external system. To use notifications, the supported outbound alert plug-ins must be added and running.
With notification rules, you can limit the data that is sent to the following external systems.
n Standard Email. You can create multiple notification rules for various email recipients based on one or more of the filter selections. If you add recipients but do not add filter selections, all the generated alerts are sent to the recipients.
n REST. You can create a rule to limit alerts that are sent to the target REST system so that you do not need to implement filtering on that target system.
n SNMP Trap. You can configure vRealize Operations Manager to log alerts on an existing SNMP Trap server in your environment.
vRealize Operations Manager Configuration Guide
VMware, Inc. 246
n Log File. You can configure vRealize Operations Manager to log alerts to a file on each of your vRealize Operations Manager nodes.
User Scenario: Create a vRealize Operations Manager Email Alert Notification
As a virtual infrastructure administrator, you need vRealize Operations Manager to send email notifications to your advanced network engineers when critical alerts are generated for mmbhost object, the host for many virtual machines that run transactional applications, where no one has yet taken ownership of the alert.
Prerequisites
n Ensure that you have at least one alert definition for which you are sending a notification. For an example of an alert definition, see Create an Alert Definition for Department Objects.
n Ensure that at least one instance of the standard email plug-in is configured and running. See Add a Standard Email Plug-In for vRealize Operations Manager Outbound Alerts.
Procedure
1 In the menu, click Alerts and then in the left pane, click Alert Settings.
2 Click Notification Settings and click the plus sign to add a notification rule.
3 In the Name text box type a name similar to Unclaimed Critical Alerts for mmbhost.
4 In the Method area, select Standard Email Plug-In from the drop-down menu, and select the configured instance of the email plug-in.
5 Configure the email options.
a In the Recipients text box, type the email addresses of the members of your advance engineering team, separating the addresses with a semi-colon (;).
b To send a second notification if the alert is still active after a specified amount of time, type the number of minutes in the Notify again text box.
c Type number of notifications that are sent to users in the Max Notifications text box.
6 Configure the scope of filtering criteria.
a From the Scope drop-down menu, select Object.
b Click Click to select Object and type the name of the object.
In this example, type mmbhost.
c Locate and select the object in the list, and click Select.
7 Configure the Notification Trigger.
a From the Notification Trigger drop-down menu, select Impact.
b From the adjacent drop-down menu, select Health.
8 In the Criticality area, click Critical.
vRealize Operations Manager Configuration Guide
VMware, Inc. 247
9 Expand the Advanced Filters and from the Alert States drop-down menu, select Open.
The Open state indicates that no engineer or administrator has taken ownership of the alert.
10 Click Save.
You created a notification rule that sends an email message to the members of your advance network engineering team when any critical alerts are generated for the mmbhost object and the alert is not claimed by an engineer. This email reminds them to look at the alert, take ownership of it, and work to resolve the triggering symptoms.
What to do next
Respond to alert email notifications. See vRealize Operations Manager User Guide.
User Scenario: Create a vRealize Operations Manager REST Alert Notification
As a virtual infrastructure administrator, you need vRealize Operations Manager to send alerts in JSON or XML to a REST-enabled application that has REST Web service that accepts these messages. You want only alerts where the virtualization alerts that affect availability alert types go to this outside application. You can then use the provided information to initiate a remediation process in that application to address the problem indicated by the alert.
The notification configuration limits the alerts sent to the outbound alert instance to those matching the notification criteria.
Prerequisites
n Verify that you have at least one alert definition for which you are sending a notification. For an example of an alert definition, see Create an Alert Definition for Department Objects.
n Verify that at least one instance of the REST plug-in is configured and running. See Add a REST Plug-In for vRealize Operations Manager Outbound Alerts.
Procedure
1 In the menu, click Alerts and then in the left pane, click Alert Settings.
2 Click Notifications and click the plus sign to add a notification rule.
3 In the Name text box type a name similar to Virtualization Alerts for Availability.
4 In the Method area, select REST Plug-In from the drop-down menu, and select the configured instance of the email plug-in.
5 Configure the Notification Trigger.
a From the Notification Trigger drop-down menu, select Alert Type.
b Click Click to select Alert type/subtype and select Virtualization/Hypervisor Alerts Availability.
6 In the Criticality area, click Warning.
vRealize Operations Manager Configuration Guide
VMware, Inc. 248
7 Expand the Advanced Filters and from the Alert Status drop-down menu, select New.
The New status indicates that the alert is new to the system and not updated.
8 Click Save.
You created a notification rule that sends the alert text to the target REST-enabled system. Only the alerts where the configured alert impact is Virtualization/Hypervisor Availability and where the alert is configured as a warning are sent to the target instance using the REST plug-in.
Create an Alert Definition for Department ObjectsAs a virtual infrastructure administrator, you are responsible for the virtual machines and hosts that the accounting department uses. You can create alerts to manage the accounting department objects.
You received several complaints from your users about delays when they are using their accounting applications. Using vRealize Operations Manager, you identified the problem as related to CPU allocations and workloads. To better manage the problem, you create an alert definition with tighter symptom parameters so that you can track the alerts and identify problems before your users encounter further problems.
Using this scenario, you create a monitoring system that monitors your accounting objects and provides timely notifications when problems occur.
Add Description and Base Object to Alert DefinitionTo create an alert to monitor the CPUs for the accounting department virtual machines and monitor host memory for the hosts on which they operate, you begin by describing the alert.
When you name the alert definition and define alert impact information, you specify how the information about the alert appears in vRealize Operations Manager. The base object is the object around which the alert definition is created. The symptoms can be for the base object and for related objects.
Procedure
1 In the menu, click Alerts and then in the left pane, click Alert Settings > Alert Definitions.
2 Click the plus sign to add a definition.
3 Type a name and description.
In this scenario, type Acct VM CPU early warning as the alert name, which is a quick overview of the problem. The description, which is a detailed overview. should provide information that is as useful as possible. When the alert is generated, this name and description appears in the alert list and in the notification.
4 Click Base Object Type.
vRealize Operations Manager Configuration Guide
VMware, Inc. 249
5 From the drop-down menu, expand vCenter Adapter and select Host System.
This alert is based on host systems because you want an alert that acts as an early warning to possible CPU stress on the virtual machines used in the accounting department. By using host systems as the based object type, you can respond to the alert symptom for the virtual machines with bulk actions rather than responding to an alert for each virtual machine.
6 Click Alert Impact and configure the metadata for this alert definition.
a From the Impact drop-down menu, select Risk.
This alert indicates a potential problem and requires attention in the near future.
b From the Criticality drop-down menu, select Immediate.
As a Risk alert, which is indicative of a future problem, you still want to give it a high criticality so that it is ranked for correct processing. Because it is designed as an early warning, this configuration provides a built-in buffer that makes it an immediate risk rather than a critical risk.
c From the Alert Type and Subtype drop-down menu, expand Virtualization/Hypervisor and select Performance.
d To ensure that the alert is generated during the first collection cycle after the symptoms become true, set the Wait Cycle to 1.
e To ensure that the an alert is removed as soon as the symptoms are no longer triggered, set the Cancel Cycle to 1.
The alert is canceled in the next collection cycle if the symptoms are no long true.
These alert impact options help you identify and prioritize alerts as they are generated.
You started an alert definition where you provided the name and description, selected host system as the base object type, and defined the data that appears when the alert generated.
What to do next
Continue in the workspace, adding symptoms to your alert definition. See Add a Virtual Machine CPU Usage Symptom to the Alert Definition.
Add a Virtual Machine CPU Usage Symptom to the Alert DefinitionTo generate alerts related to CPU usage on your accounting virtual machines, you add symptoms to your vRealize Operations Manager alert definition after you provide the basic descriptive information for the alert. The first symptom you add is related to CPU usage on virtual machines. You later use a policy and group to apply alert to the accounting virtual machines.
This scenario has two symptoms, one for the accounting virtual machines and one to monitor the hosts on which the virtual machines operate.
Prerequisites
Begin configuring the alert definition. See Add Description and Base Object to Alert Definition.
vRealize Operations Manager Configuration Guide
VMware, Inc. 250
Procedure
1 In the Alert Definition Workspace window, after you configure the Name and Description, Base Object Type, and Alert Impact, click Add Symptom Definitions and configure the symptoms.
2 Begin configuring the symptom set related to virtual machines CPU usage.
a From the Defined On drop-down menu, select Child.
b From the Filter by Object Type drop-down menu, select Virtual Machine.
c From the Symptom Definition Type drop-down menu, select Metric / Supermetric.
d Click the Add button to open the Add Symptom Definition workspace window.
3 Configure the virtual machine CPU usage symptom in the Add Symptom Definition workspace window.
a From the Base Object Type drop-down menu, expand vCenter Adapter and select Virtual Machine.
The collected metrics for virtual machines appears in the list.
b In the metrics list Search text box, which searches the metric names, type usage.
c In the list, expand CPU and drag Usage (%) to the workspace on the right.
d From the threshold drop-down menu, select Dynamic Threshold.
Dynamic thresholds use vRealize Operations Manager analytics to identify the trend metric values for objects.
e In the Symptom Definition Name text box, type a name similar to VM CPU Usage above trend.
f From the criticality drop-down menu, select Warning.
g From the threshold drop-down menu, select Above Threshold.
h Leave the Wait Cycle and Cancel Cycle at the default values of 3.
This Wait Cycle setting requires the symptom condition to be true for 3 collection cycles before the symptom is triggered. This wait avoids triggering the symptom when there is a short spike in CPU usage.
i Click Save.
The dynamic symptom, which identifies when the usage is above the tracked trend, is added to the symptom list.
4 In the Alert Definition Workspace window, drag VM CPU Usage above trend from the symptom definition list to the symptom workspace on the right.
The Child-Virtual Machine symptom set is added to the symptom workspace.
vRealize Operations Manager Configuration Guide
VMware, Inc. 251
5 In the symptoms set, configure the triggering condition so that when the symptom is true on half of the virtual machines in the group to which this alert definition is applied, the symptom set is true.
a From the value operator drop-down menu, select >.
b In the value text box, enter 50.
c From the value type drop-down menu, select Percent.
You defined the first symptom set for the alert definition.
What to do next
Add the host memory usage symptom to the alert definition. See Add a Host Memory Usage Symptom to the Alert Definition.
Add a Host Memory Usage Symptom to the Alert DefinitionTo generate alerts related to CPU usage on your accounting virtual machines, you add a second symptom to your vRealize Operations Manager alert definition after you add the first symptom. The second symptom is related to host memory usage for the hosts on which the accounting virtual machines operate.
Prerequisites
Add the virtual machine CPU usage symptom. See Add a Virtual Machine CPU Usage Symptom to the Alert Definition.
Procedure
1 In the Alert Definition Workspace window, after you configure the Name and Description, Base Object Type, and Alert Impact, click Add Symptom Definitions.
2 Configure the symptom related to host systems for the virtual machines.
a From the Defined On drop-down menu, select Self.
b From the Symptom Definition Type drop-down menu, select Metric / Supermetric.
c Click the Add button to configure the new symptom.
3 Configure the host system symptom in the Add Symptom Definition workspace window.
a From the Base Object Type drop-down menu, expand vCenter Adapters and select Host System.
b In the metrics list, expand Memory and drag Usage (%) to the workspace on the right.
c From the threshold drop-down menu, select Dynamic Threshold.
Dynamic thresholds use vRealize Operations Manager analytics to identify the trend metric values for objects.
d In the Symptom Definition Name text box, enter a name similar to Host memory usage above trend.
e From the criticality drop-down menu, select Warning.
vRealize Operations Manager Configuration Guide
VMware, Inc. 252
f From the threshold drop-down menu, select Above Threshold.
g Leave the Wait Cycle and Cancel Cycle at the default values of 3.
This Wait Cycle setting requires the symptom condition to be true for three collection cycles before the symptom is triggered. This wait avoids triggering the symptom when a short spike occurs in host memory usage.
h Click Save.
The dynamic symptom identifies when the hosts on which the accounting virtual machines run are operating above the tracked trend for memory usage.
The dynamic symptom is added to the symptom list.
4 In the Alert Definition Workspace window, drag Host memory usage above trend from the symptoms list to the symptom workspace on the right.
The Self-Host System symptom set is added to the symptom workspace.
5 On the Self-Host System symptom set, from the value type drop-down menu for This Symptom set is true when, select Any.
With this configuration, when any of the hosts running accounting virtual machines exhibit memory usage that is above the analyzed trend, the symptom condition is true.
6 At the top of the symptom set list, from the Match {operator} of the following symptoms drop-down menu, select Any.
With this configuration, if either of the two symptom sets, virtual machine CPU usage or the host memory, are triggered, an alert is generated for the host.
You defined the second symptom set for the alert definition and configured how the two symptom sets are evaluated to determine when the alert is generated.
What to do next
Add recommendations to your alert definition so that you and your engineers know how to resolve the alert when it is generated. See Add Recommendations to the Alert Definition.
Add Recommendations to the Alert DefinitionTo resolve a generated alert for the accounting department's virtual machines, you provide recommendations so that you or other engineers have the information you need to resolve the alert before your users encounter performance problems.
As part of the alert definition, you add recommendations that include actions that you run from vRealize Operations Manager and instructions for making changes in vCenter Server that resolve the generated alert.
Prerequisites
Add symptoms to your alert definition. See Add a Host Memory Usage Symptom to the Alert Definition.
vRealize Operations Manager Configuration Guide
VMware, Inc. 253
Procedure
1 In the Alert Definition Workspace window, after you configure the Name and Description, Base Object Type, Alert Impact, and Add Symptom Definitions, click Add Recommendations and add the recommended actions and instructions.
2 Click Add and select an action recommendation to resolve the virtual machine alerts.
a In the New Recommendation text box, enter a description of the action similar to Add CPUs to virtual machines.
b From the Actions drop-down menu, select Set CPU Count for VM.
c Click Save.
3 Click Add and provide an instructive recommendation to resolve host memory problems similar to this example.
If this host is part of a DRS cluster, check the DRS settings to verify that the
load balancing setting are configured correctly. If necessary, manually vMotion
the virtual machines.
4 Click Add and provide an instructive recommendation to resolve host memory alerts.
a Enter a description of the recommendation similar to this example.
If this is a standalone host, add more memory to the host.
b To make the URL a hyperlink in the instructions, copy the URL, for example, https://www.vmware.com/support/pubs/vsphere-esxi-vcenter-server-pubs.html, to your clipboard.
c Highlight the text in the text box and click Create a hyperlink.
d Paste the URL in the Create a hyperlink text box and click OK.
e Click Save.
5 In the Alert Definition Workspace, drag Add CPUs to virtual machines, If this host is part of a DRS cluster, and the If this is a standalone host recommendations from the list to the recommendation workspace in the order presented.
6 Click Save.
You provided the recommended actions and instructions to resolve the alert when it is generated. One of the recommendations resolves the virtual machine CPU usage problem and the other resolves the host memory problem.
What to do next
Create a group of objects to use to manage your accounting objects. See Create a Custom Accounting Department Group.
Create a Custom Accounting Department GroupTo manage, monitor, and apply policies to the accounting objects as a group, you create a custom object group.
vRealize Operations Manager Configuration Guide
VMware, Inc. 254
Prerequisites
Verify that you completed the alert definition for this scenario. See Add Recommendations to the Alert Definition.
Procedure
1 In the menu, click Environment and click the Custom Groups tab.
2 Click the New Custom Group icon to create a new custom group.
3 Type a name similar to Accounting VMs and Hosts.
4 From the Group Type drop-down menu, select Department.
5 From the Policy drop-down menu, select Default Policy.
When you create a policy, you apply the new policy to the accounting group.
6 In the Define membership criteria area, from the Select the Object Type that matches the following criteria drop-down menu, expand vCenter Adapter, select Host System, and configure the dynamic group criteria.
a From the criteria drop-down menu, select Relationship.
b From the relationships options drop-down menu, select Parent of.
c From the operator drop-down menu, select contains.
d In the Object name text box, enter acct.
e From the navigation tree drop-down list, select vSphere Hosts and Clusters.
You created a dynamic group where host objects that are the host for virtual machines with acct in the virtual machine name are included in the group. If a virtual machine with acct in the object name is added or moved to a host, the host object is added to the group.
7 Click Preview in the lower-left corner of the workspace, and verify that the hosts on which your virtual machines that include acct in the object name appear in the Preview Group window.
8 Click Close.
9 Click Add another criteria set.
A new criteria set is added with the OR operator between the two criteria sets.
10 From the Select the Object Type that matches the following criteria drop-down menu, expand vCenter Adapter, select Virtual Machine, and configure the dynamic group criteria.
a From the criteria drop-down menu, select Properties.
b From the Pick a property drop-down menu, expand Configuration and double-click Name.
c From the operator drop-down menu, select contains.
d In the Property value text box, enter acct.
vRealize Operations Manager Configuration Guide
VMware, Inc. 255
You created a dynamic group where virtual machine objects with acct in the object name are included in the group that depends on the presence of those virtual machines. If a virtual machine with acct in the name is added to your environment, it is added to the group.
11 Click Preview in the lower-left corner of the workspace, and verify that the virtual machines with acct in the object name are added to the list that also includes the host systems.
12 Click Close.
13 Click OK.
The Accounting VMs and Hosts group is added to the Groups list.
You created a dynamic object group that changes as virtual machines with acct in their names are added, removed, and moved in your environment.
What to do next
Create a policy that determines how vRealize Operations Manager uses the alert definition to monitor your environment. See Create a Policy for the Accounting Alert.
Create a Policy for the Accounting AlertTo configure how vRealize Operations Manager evaluates the accounting alert definition in your environment, you configure a policy that determines behavior so that you can apply the policy to an object group. The policy limits the application of the alert definition to only the members of the selected object group.
When an alert definition is created, it is added to the default policy and enabled, ensuring that any alert definitions that you create are active in your environment. This alert definition is intended to meet the needs of the accounting department, so you disable it in the default policy and create a new policy to govern how the alert definition is evaluated in your environment, including which accounting virtual machines and related hosts to monitor.
Prerequisites
n Verify that you completed the alert definition for this scenario. See Add Recommendations to the Alert Definition.
n Verify that you created a group of objects that you use to manage you accounting objects. See Create a Custom Accounting Department Group.
Procedure
1 In the menu, click Administration and then in the left pane, click Policies.
2 Click the Policy Library tab.
3 Click Add New Policy.
vRealize Operations Manager Configuration Guide
VMware, Inc. 256
4 Type a name similar to Accounting Objects Alerts Policy and provide a useful description similar to the following example.
This policy is configured to generate alerts when
Accounting VMs and Hosts group objects are above trended
CPU or memory usage.
5 Select Default Policy from the Start with drop-down menu.
6 On the left, click Customize Alert / Symptom Definitions and disable all the alert definitions except the new Acct VM CPU early warning alert.
a In the Alert Definitions area, click Actions and select Select All.
The alerts on the current page are selected.
b Click Actions and select Disable.
The alerts indicate Disabled in the State column.
c Repeat the process on each page of the alerts list.
d Select Acct VM CPU early warning in the list, click Actions and select Enable.
The Acct VM CPU early warning alert is now enabled.
7 On the left, click Apply Policy to Groups and select Accounting VMs and Hosts.
8 Click Save.
You created a policy where the accounting alert definition exists in a custom policy that is applied only to the virtual machines and hosts for the accounting department.
What to do next
Create an email notification so that you learn about alerts even you when you are not actively monitoring vRealize Operations Manager. See Configure Notifications for the Department Alert.
Configure Notifications for the Department AlertTo receive an email notification when the accounting alert is generated, rather than relying on your ability to generally monitor the accounting department objects in vRealize Operations Manager, you create notification rules.
Creating an email notification when accounting alerts are triggered is an optional process, but it provides you with the alert even when you are not currently working in vRealize Operations Manager.
Prerequisites
n Verify that you completed the alert definition for this scenario. See Add Recommendations to the Alert Definition.
n Verify that standard email outbound alerts are configured in your system. See Add a Standard Email Plug-In for vRealize Operations Manager Outbound Alerts.
vRealize Operations Manager Configuration Guide
VMware, Inc. 257
Procedure
1 In the menu, click Alerts and then in the left pane, click Alert Settings.
2 Click Notification Settings and click the plus sign to add a notification rule.
3 Configure the communication options.
a In the Name text box, type a name similar to Acct Dept VMs or Hosts Alerts.
b From the Select Plug-In Type drop-down menu, select StandardEmailPlugin.
c From the Select Instance drop-down menu, select the standard email instance that is configured to send messages.
d In the Recipients text box, type your email address and the addresses of other recipients responsible for the accounting department alerts. Use a semicolon between recipients.
e Leave the Notify again text box blank.
If you do not provide a value, the email notice is sent only once. This alert is a Risk alert and is intended as an early warning rather than requiring an immediate response.
You configured the name of the notification when it is sent to you and the method that is used to send the message.
4 In the Filtering Criteria area, configure the accounting alert notification trigger.
a From the Notification Trigger drop-down menu, select Alert Definition.
b Click Click to select Alert Definition.
c Select Acct VM CPU early warning and click Select.
5 Click Save.
You created a notification rule that sends you and your designated engineers an email message when this alert is generated for your accounting department alert definition.
What to do next
Create a dashboard with alert-related widgets so that you can monitor alerts for the accounting object group. See Create a Dashboard to Monitor Department Objects.
Create a Dashboard to Monitor Department ObjectsTo monitor all the alerts related to the accounting department object group, you create a dashboard that includes the alert list and other widgets. The dashboard provides the alert data in a single location for all related objects.
Creating a dashboard to monitor the accounting virtual machines and related hosts is an optional process, but it provides you with a focused view of the accounting object group alerts and objects.
Prerequisites
Create an object group for the accounting department virtual machines and related objects. See Create a Custom Accounting Department Group.
vRealize Operations Manager Configuration Guide
VMware, Inc. 258
Procedure
1 In the menu, click Dashboards > Actions > Create Dashboard.
2 In the Dashboard Configuration definition area, type a tab name similar to Accounting VMs and Hosts and configure the layout options.
3 Click Widget List and drag the following widgets to the workspace.
n Alert List
n Efficiency
n Health
n Risk
n Top Alerts
n Alert Volume
The blank widgets are added to the workspace. To change the order in which they appear, you can drag them to a different location in the workspace.
4 On the Alert List widget title bar, click Edit Widget and configure the settings.
a In the Title text box, change the title to Acct Dept Alert List.
b For the Refresh Content option, select On.
c Type Accounting in the Search text box and click Search.
The Accounting value corresponds to the name of the object group for the accounting department virtual machines and related hosts.
d In the filtered resource list, select the Accounting VMs and Hosts group.
The Accounting VMs and Hosts group is identified in the Selected Resource text box.
e Click OK.
The Acct Dept Alert List is now configured to display alerts for the Accounting VMs and Hosts group objects.
5 Click Widget Interactions and configure the following interactions.
a For Acct Dept Alert List, leave the selected resources blank.
b For Top Alerts, Health, Risk, Efficiency, and Alert Volume select Acct Dept Alert List from the Selected Resources drop-down menu.
c Click Apply Interactions.
With the widget interaction configured in this way, the select alert in the Acct Dept Alert List is the source for the data in the other widgets. When you select an alert in the alert list, the Health, Risk, and Efficiency widgets display alerts for that object, Top Alerts displays the topic issues affecting the health of the object, and Alert Volume displays an alert trend chart.
6 Click Save.
vRealize Operations Manager Configuration Guide
VMware, Inc. 259
You created a dashboard that displays the alerts related to the accounting virtual machines and hosts group, including the Risk alert you created.
Alerts GroupFor easy and better management of alerts, you can arrange them as a group as per your requirement.
It is complicated to identify a problem in large environments as you receive different kind of alerts. To manage alerts easily, group them by their definitions.
For example, there are 1000 alerts in your system. To identify different types of alerts, group them based on their alert definitions. It is also easy to detect the alert having the highest severity in the group.
When you group alerts, you can see the number of times the alerts having the same alert definition are triggered. By grouping alerts, you can perform the following tasks easily and quickly:
n Find the noisiest alert: The alert that has triggered maximum number of times is known as the noisiest alert. Once you find it, you can disable it to avoid further noise.
n Filter alerts: You can filter alerts based on a substring in alert definitions. The result shows the group of alerts that contain the substring.
Note n If you cancel or disable an alert group, the alerts are not canceled instantly. It might take some time if
the group is large.
n Only one group can be expanded at a time.
n The number next to the group denotes the number of alerts in that particular group.
n The criticality sign indicates the highest level of severity of an alert in a group.
Grouping AlertsYou can group alerts by time, criticality, definition, and object type.
To group alerts:
Procedure
1 In the menu, click Alerts.
2 Select from the various options available from the Group By drop-down menu.
Disable AlertsIn an alerts group, you can disable an alert by a single click.
To disable an alert, in the menu, click Alerts and then in the left pane, click All Alerts. Select the alert name from the data grid, and click Actions > Disable.
The alerts can be disabled by two methods:
n Disable Alert in All Policies: You disable the alert for all the objects for all the policies.
vRealize Operations Manager Configuration Guide
VMware, Inc. 260
n Disable Alert in Selected Policies: You disable the alert for the objects having the selected policy. Note that this method will work only for objects with alerts.
Configuring ActionsActions are the ability to update objects or read data about objects in monitored systems, and are commonly provided in vRealize Operations Manager as part of a solution. The actions added by solutions are available from the object Actions menu, list and view menus, including some dashboard widgets, and can be added to alert definition recommendations.
The possible actions include read actions and update actions.
The read actions retrieve data from the target objects.
The update actions modifies the target objects. For example, you can configure an alert definition to notify you when a virtual machine is experiencing memory issues. Add an action in the recommendations that runs the Set Memory for Virtual Machine action. This action increases the memory and resolves the likely cause of the alert.
To see or use the actions for your vCenter Server objects, you must enable actions in the vCenter Adapter for each monitored vCenter Server instance. Actions can only be viewed and accessed if you have the required permissions.
List of vRealize Operations Manager ActionsThe list of actions includes the name of the action, the objects that each one modifies, and the object levels at which you can run the action. You use this information to ensure that you correctly apply the actions as alert recommendations and when the actions are available in the Actions menu.
Actions and Modified ObjectsvRealize Operations Manager actions make changes to objects in your managed vCenter Server instances.
When you grant a user access to actions in vRealize Operations Manager, that user can take the granted action on any object that vRealize Operations Manager manages.
Action Object LevelsThe actions are available when you work with different object levels, but they modify only the specified object. If you are working at the cluster level and select Power On VM, all the virtual machines in the cluster for which you have access permission are available for you to run the action. If you are working at the virtual machine level, only the selected virtual machine is available.
vRealize Operations Manager Configuration Guide
VMware, Inc. 261
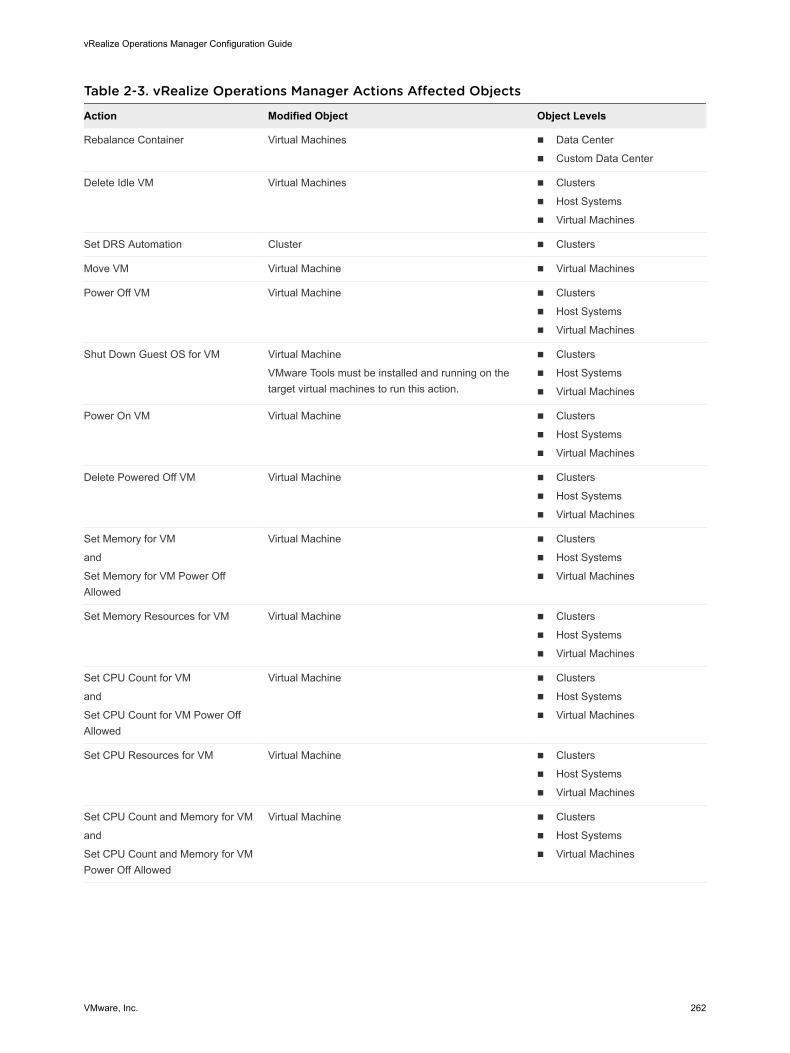
Table 2-3. vRealize Operations Manager Actions Affected Objects
Action Modified Object Object Levels
Rebalance Container Virtual Machines n Data Center
n Custom Data Center
Delete Idle VM Virtual Machines n Clusters
n Host Systems
n Virtual Machines
Set DRS Automation Cluster n Clusters
Move VM Virtual Machine n Virtual Machines
Power Off VM Virtual Machine n Clusters
n Host Systems
n Virtual Machines
Shut Down Guest OS for VM Virtual Machine
VMware Tools must be installed and running on the target virtual machines to run this action.
n Clusters
n Host Systems
n Virtual Machines
Power On VM Virtual Machine n Clusters
n Host Systems
n Virtual Machines
Delete Powered Off VM Virtual Machine n Clusters
n Host Systems
n Virtual Machines
Set Memory for VM
and
Set Memory for VM Power Off Allowed
Virtual Machine n Clusters
n Host Systems
n Virtual Machines
Set Memory Resources for VM Virtual Machine n Clusters
n Host Systems
n Virtual Machines
Set CPU Count for VM
and
Set CPU Count for VM Power Off Allowed
Virtual Machine n Clusters
n Host Systems
n Virtual Machines
Set CPU Resources for VM Virtual Machine n Clusters
n Host Systems
n Virtual Machines
Set CPU Count and Memory for VM
and
Set CPU Count and Memory for VM Power Off Allowed
Virtual Machine n Clusters
n Host Systems
n Virtual Machines
vRealize Operations Manager Configuration Guide
VMware, Inc. 262
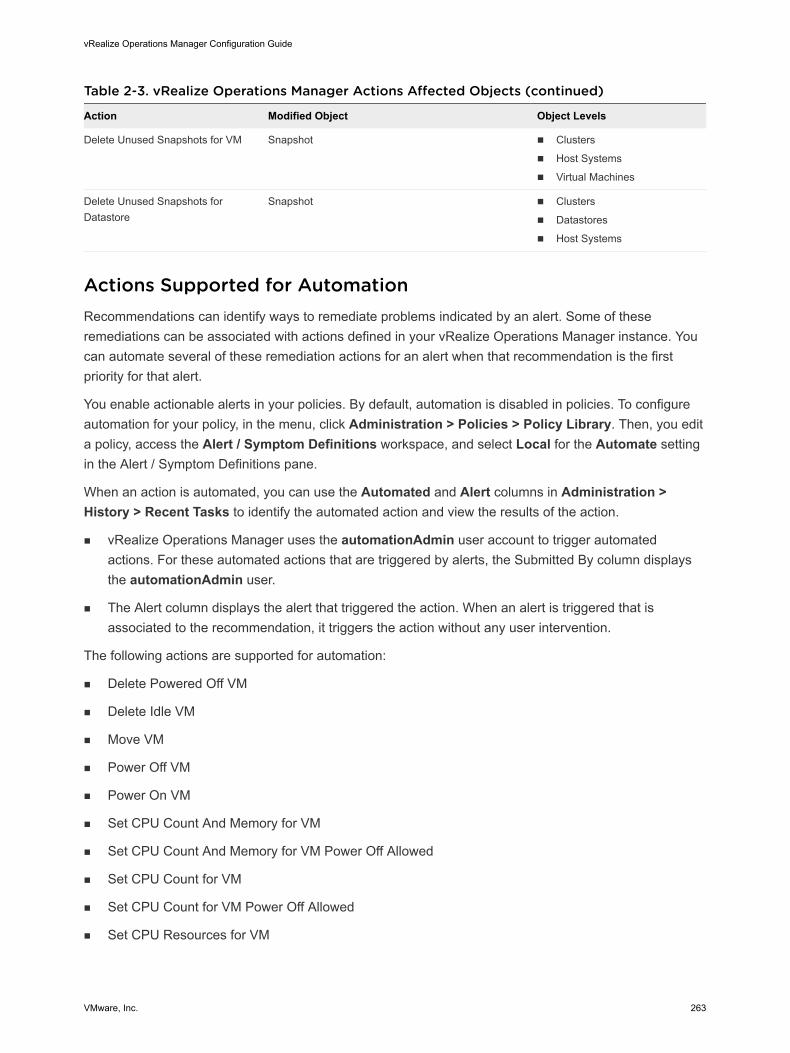
Table 2-3. vRealize Operations Manager Actions Affected Objects (continued)
Action Modified Object Object Levels
Delete Unused Snapshots for VM Snapshot n Clusters
n Host Systems
n Virtual Machines
Delete Unused Snapshots for Datastore
Snapshot n Clusters
n Datastores
n Host Systems
Actions Supported for AutomationRecommendations can identify ways to remediate problems indicated by an alert. Some of these remediations can be associated with actions defined in your vRealize Operations Manager instance. You can automate several of these remediation actions for an alert when that recommendation is the first priority for that alert.
You enable actionable alerts in your policies. By default, automation is disabled in policies. To configure automation for your policy, in the menu, click Administration > Policies > Policy Library. Then, you edit a policy, access the Alert / Symptom Definitions workspace, and select Local for the Automate setting in the Alert / Symptom Definitions pane.
When an action is automated, you can use the Automated and Alert columns in Administration > History > Recent Tasks to identify the automated action and view the results of the action.
n vRealize Operations Manager uses the automationAdmin user account to trigger automated actions. For these automated actions that are triggered by alerts, the Submitted By column displays the automationAdmin user.
n The Alert column displays the alert that triggered the action. When an alert is triggered that is associated to the recommendation, it triggers the action without any user intervention.
The following actions are supported for automation:
n Delete Powered Off VM
n Delete Idle VM
n Move VM
n Power Off VM
n Power On VM
n Set CPU Count And Memory for VM
n Set CPU Count And Memory for VM Power Off Allowed
n Set CPU Count for VM
n Set CPU Count for VM Power Off Allowed
n Set CPU Resources for VM
vRealize Operations Manager Configuration Guide
VMware, Inc. 263
n Set Memory for VM
n Set Memory for VM Power Off Allowed
n Set Memory Resources for VM
n Shut Down Guest OS for VM
Roles Needed to Automate ActionsTo automate actions, your role must have the following permissions:
n Create, edit, and import policies in Administration > Policies > Policy Library.
n Create, clone, edit, and import alert definitions in Alerts > Alert Settings > Alert Definitions.
n Create, edit, and import recommendation definitions in Alerts > Alert Settings > Recommendations.
Important You set the permissions used to run the actions separately from the alert and recommendation definition. Anyone who can modify alerts, recommendations, and policies can also automate the action, even if they do not have permission to run the action.
For example, if you do not have access to the Power Off VM action, but you can create and modify alerts and recommendations, you can see the Power Off VM action and assign it to an alert recommendation. Then, if you automate the action in your policy, vRealize Operations Manager uses the automationAdmin user to run the action.
Example Action Supported for AutomationFor the Alert Definition named Virtual machine has chronic high CPU workload leading to CPU stress, you can automate the action named Set CPU Count for VM.
When CPU stress on your virtual machines exceeds a critical, immediate, or warning level, the alert triggers the recommended action without user intervention.
Integration of Actions with vRealize AutomationvRealize Operations Manager restricts actions on objects that vRealize Automation manages, so that the actions do not violate any constraints set forth by vRealize Automation.
When objects in your environment are managed by vRealize Automation, actions in vRealize Operations Manager are not available on those objects. For example, if a host or parent object is being managed by vRealize Automation, actions are not available on that object.
This behavior is true for all actions, including Power Off VM, Move VM, Rebalance Container, and so on.
You cannot turn on or turn off the exclusion of actions on vRealize Automation managed objects.
vRealize Operations Manager Configuration Guide
VMware, Inc. 264
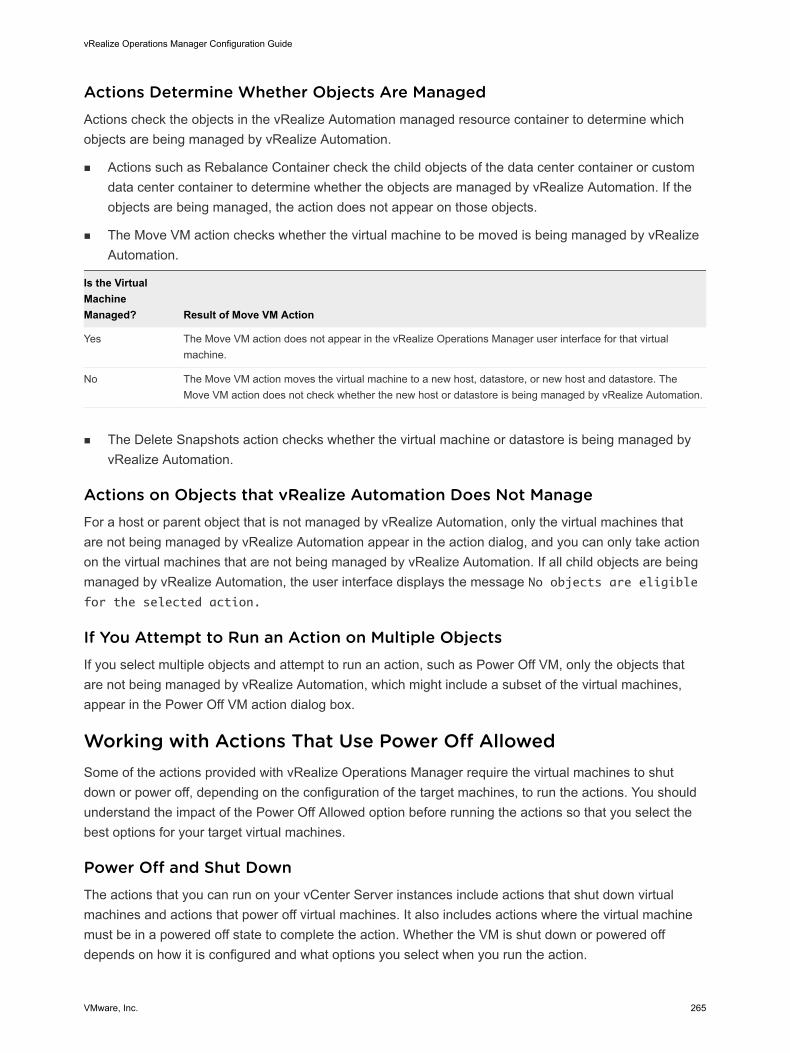
Actions Determine Whether Objects Are ManagedActions check the objects in the vRealize Automation managed resource container to determine which objects are being managed by vRealize Automation.
n Actions such as Rebalance Container check the child objects of the data center container or custom data center container to determine whether the objects are managed by vRealize Automation. If the objects are being managed, the action does not appear on those objects.
n The Move VM action checks whether the virtual machine to be moved is being managed by vRealize Automation.
Is the Virtual Machine Managed? Result of Move VM Action
Yes The Move VM action does not appear in the vRealize Operations Manager user interface for that virtual machine.
No The Move VM action moves the virtual machine to a new host, datastore, or new host and datastore. The Move VM action does not check whether the new host or datastore is being managed by vRealize Automation.
n The Delete Snapshots action checks whether the virtual machine or datastore is being managed by vRealize Automation.
Actions on Objects that vRealize Automation Does Not ManageFor a host or parent object that is not managed by vRealize Automation, only the virtual machines that are not being managed by vRealize Automation appear in the action dialog, and you can only take action on the virtual machines that are not being managed by vRealize Automation. If all child objects are being managed by vRealize Automation, the user interface displays the message No objects are eligible for the selected action.
If You Attempt to Run an Action on Multiple ObjectsIf you select multiple objects and attempt to run an action, such as Power Off VM, only the objects that are not being managed by vRealize Automation, which might include a subset of the virtual machines, appear in the Power Off VM action dialog box.
Working with Actions That Use Power Off AllowedSome of the actions provided with vRealize Operations Manager require the virtual machines to shut down or power off, depending on the configuration of the target machines, to run the actions. You should understand the impact of the Power Off Allowed option before running the actions so that you select the best options for your target virtual machines.
Power Off and Shut DownThe actions that you can run on your vCenter Server instances include actions that shut down virtual machines and actions that power off virtual machines. It also includes actions where the virtual machine must be in a powered off state to complete the action. Whether the VM is shut down or powered off depends on how it is configured and what options you select when you run the action.
vRealize Operations Manager Configuration Guide
VMware, Inc. 265
The shut-down action shuts down the guest operating system and then powers off the virtual machine. To shut down a virtual machine from vRealize Operations Manager, the VMware Tools must be installed and running on the target objects.
The power off action turns off the VM without regard for the state of the guest operating system. In this case, if the VM is running applications, your user might lose data. After the action is finished, for example, modifying the CPU count, the virtual machine is returned to the power state it was in when the action began.
Power Off Allowed and VMware Tools
For the actions where you are increasing the CPU count or the amount of memory on a VM, some operating systems support the actions if the Hot Plug is configured on the VM. For other operating systems, the virtual machine must be in a powered off state to change the configuration. To accommodate this need where the VMware Tools is not running, the Set CPU Count, Set Memory, and Set CPU Count and Memory actions include the Power Off Allowed option.
If you select Power Off Allowed, and the machine is running, the action verifies whether VMware Tools is installed and running.
n If VMware Tools is installed and running, the virtual machine is shut down before completing the action.
n If VMware Tools is not running or not installed, the virtual machine is powered off without regard for the state of the operating system.
If you do not select Power Off Allowed and you are decreasing the CPU count or memory, or the hot plug is not enabled for increasing the CPU count or memory, the action does not run and the failure is reported in Recent Tasks.
Power Off Allowed When Changing CPU Count or MemoryWhen you run the actions that change the CPU count and the amount of memory, you must consider several factors to determine if you want to use the Power Off Allowed option. These factors include whether you are increasing or decreasing the CPU or memory and whether the target virtual machines are powered on. If you increase the CPU or memory values, whether hot plug is enabled also affects how you apply the option when you run the action.
How you use Power Off Allowed when you are decreasing the CPU count or the amount of memory depends on the power state of the target virtual machines.
vRealize Operations Manager Configuration Guide
VMware, Inc. 266

Table 2-4. Decreasing CPU Count and Memory Behavior Based On Options
Virtual Machine Power State Power Off Allowed Selected Results
On Yes If VMware Tools is installed and running, the action shuts down the virtual machine, decreases the CPU or memory, and powers the machine back on.
If VMware Tools is not installed, the action powers off the virtual machine, decreases the CPU or memory, and powers the machine back on.
On No The action does not run on the virtual machine.
Off Not applicable. The virtual machine is powered off.
The action decreases the value and leaves the virtual machine in a powered off state.
How you use Power Off Allowed when you are increasing the CPU count or the amount of memory depends on several factors, including the state of the target virtual machine and whether hot plug is enabled. Use the following information to determine which scenario applies to your target objects.
If you are increasing the CPU count, you must consider the power state of the virtual machine and whether CPU Hot Plug is enabled when determining whether to apply Power Off Allowed.
Table 2-5. Increasing CPU Count Behavior.
Virtual Machine Power State CPU Hot Plug Enabled Power Off Allowed Selected Results
On Yes No The action increases the CPU count to the specified amount.
On No Yes If VMware Tools is installed and running, the action shuts down the virtual machine, increases the CPU count, and powers the machine back on.
If VMware Tools is not installed, the action powers off the virtual machine, increases the CPU count, and powers the machine back on.
Off Not applicable. The virtual machine is powered off.
Not required. The action increases the CPU count to the specified amount.
If you are increasing the memory, you must consider the power state of the virtual machine, whether Memory Hot Plug is enabled, and whether there is a Hot Memory Limit when determining how to apply Power Off Allowed.
vRealize Operations Manager Configuration Guide
VMware, Inc. 267
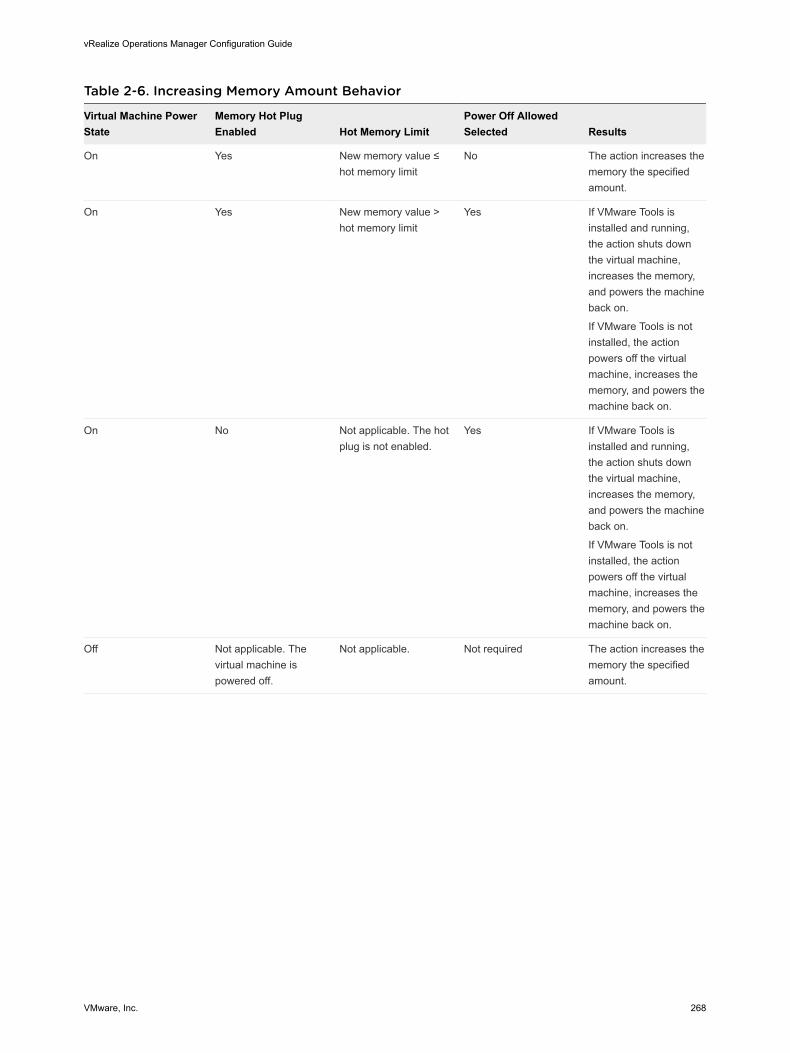
Table 2-6. Increasing Memory Amount Behavior
Virtual Machine Power State
Memory Hot Plug Enabled Hot Memory Limit
Power Off Allowed Selected Results
On Yes New memory value ≤ hot memory limit
No The action increases the memory the specified amount.
On Yes New memory value > hot memory limit
Yes If VMware Tools is installed and running, the action shuts down the virtual machine, increases the memory, and powers the machine back on.
If VMware Tools is not installed, the action powers off the virtual machine, increases the memory, and powers the machine back on.
On No Not applicable. The hot plug is not enabled.
Yes If VMware Tools is installed and running, the action shuts down the virtual machine, increases the memory, and powers the machine back on.
If VMware Tools is not installed, the action powers off the virtual machine, increases the memory, and powers the machine back on.
Off Not applicable. The virtual machine is powered off.
Not applicable. Not required The action increases the memory the specified amount.
vRealize Operations Manager Configuration Guide
VMware, Inc. 268
Configuring and Using Workload Optimization 3Workload Optimization provides for moving virtual compute resources and their file systems dynamically across datastore clusters within a data center or custom data center.
Using Workload Optimization, you can rebalance virtual machines and storage across clusters, relieving demand on an overloaded individual cluster and maintaining or improving cluster performance. You can also set your automated rebalancing policies to emphasize VM consolidation, which potentially frees up hosts and reduces resource demand.
Workload Optimization further enables you potentially to automate a significant portion of your data center compute and storage optimization efforts. With properly defined policies determining the threshold at which resource contention automatically runs an action, a data center performs at optimum.
vRealize Automation IntegrationWhen you add an instance to a vRealize Automation adapter or solution pack as well as to a vCenter Server adapter instance that is connected to the vRealize Automation server, using vRealize Automation-managed resources, vRealize Operations Manager automatically adds a custom data center for the vCenter Server, using vRealize Automation-managed resources.
On the vRealize Operations Manager side, to get the day2 chain configured, you must make the following initial configurations:
1 In vCenter Server, Administration -> Solutions and then add the VMware vSphere adapter instance for the vCenter Server that is configured as an endpoint in vRealize Automation Server.
2 In vCenter Server, Administration -> Solutions and then add the VMware vRealize Automation adapter instance for the server that will appear in the vRealize Operations Manager and vRealize Automation integration day2 chain.
vRealize Operations Manager can manage workload placement and optimization for the custom data centers that reside in vRealize Automation-managed clusters.
However, vRealize Operations Manager is not permitted to set tag policies for the custom data center. (At the Workload Optimization screen, the Business Intent window is not operational for vRealize Automation custom data centers.) When rebalancing a vRealize Automation custom data center, vRealize Operations Manager uses all applicable policies and placement principles from both systems: vRealize Automation
VMware, Inc. 269

and vRealize Operations Manager. For more information on configuring vRealize Automation to work with vRealize Operations Manager, see vRealize Automation 7.x For complete information on creating and managing vRealize Automation custom data centers that are managed by vRealize Operations Manager, see the vRealize Automation documentation.
This chapter includes the following topics:
n Configuring Workload Optimization
n Using Workload Optimization
Configuring Workload OptimizationWorkload Optimization offers you the potential to automate fully a significant portion of your cluster workload rebalancing tasks. The tasks to accomplish workload automation are as follows:
1 Configure the Workload Automation Details. See Workload Automation Details.
2 Tag VMs for cluster placement. See Business Intent - Host-Based Virtual Machine Placement and Business Intent: Tag-Based VM Placement in Clusters.
3 If you do not use the AUTOMATE function in the Optimization Recommendation pane at the Workload Automation screen, configure the two Workload Optimization alerts to be triggered when cluster CPU/memory limits are breached, and configure them as automated. When the alerts are automated, the actions calculated by Workload Optimization are run automatically. See Configuring Workload Optimization Alerts
PrerequisitesWorkload Optimization acts on objects associated with the VMware vSphere Solution that connects vRealize Operations Manager to one or more vCenter Server instances. The virtual objects in this environment include a vCenter Server, data centers and custom data centers, cluster compute and storage resources, host systems, and virtual machines. Specific requirements:
n A vCenter Adapter configured with the actions enabled for each vCenter Server instance.
n A vCenter Server instance with at least two datastore clusters with sDRS enabled and fully automated.
n Any non-datastore clusters must have DRS enabled and fully automated
n Storage vMotion must be set to ON at Workload Automation Details. The default is On.
n You must have permission to access all objects in the environment.
vRealize Operations Manager Configuration Guide
VMware, Inc. 270
Design ConsiderationsThe following rules constrain the possible computer and storage resource moves that can be performed.
Note When vRealize Operations Manager suggests that you optimize clusters in a data center, the system does not guarantee it can run an optimization action. vRealize Operations Manager analytics can determine that optimization is desirable and can create a rebalancing plan. However, the system cannot automatically identify all the architectural constraints that may be present. Such constraints may prevent an optimization action, or cause an action in progress to fail.
n Moving compute and storage resources is allowed only within, not across data centers or custom data centers.
n Storage resources cannot be moved across non-datastore clusters. Storage can move only across datastore clusters that have sDRS fully automated.
n Compute-resource-only moves are permitted through shared storage.
n Virtual machines defined with affinity rules or anti-affinity rules are not to be moved.
n Virtual machines cannot be moved when residing on a local datastore, unless a storage swap exists on the local datastore.
n Virtual machines cannot be moved if they have data residing across multiple datastore clusters. Compute-only moves with similar shared storage are not permitted.
n A virtual machine cannot have data that resides across different storage types. For example, if a virtual machine has a VM disk on a datastore and a second VM disk on a datastore cluster, the virtual machine does not move, even when the datastore is shared with the destination or has swap on it.
n A virtual machine can use RDM so long as the destination datastore cluster can access the RDM LUN.
n A virtual machine can implement VM disks on multiple datastores inside a single datastore cluster.
n Workload Optimization may suggest moving virtual machines that are protected by vSphere Replication or Array Based Replication. You must ensure that all the clusters within a selected data center or custom data center have replication available. You can set up DRS affinity rules on virtual machines that you do not want moving across clusters.
Business Intent: Tag-Based VM Placement in ClustersYou can use vCenter Server tagging to tag VMs and associated clusters, respectively, with specific tags. These tags define - for a given cluster - the set of VMs that is placed with that cluster and remains within the cluster. When the system runs an optimization action, it uses VM-to-cluster tag matching to ensure that VMs are moved to - or stay with - the appropriate cluster.
To edit Business Intent values, you must have privileges for Administration -> Configuration -> Workload Placement Settings -> Edit.
vRealize Operations Manager Configuration Guide
VMware, Inc. 271
Using Tags for Cluster FlexibilityWhen configuring custom data centers and clusters without tags, you configure CDCs as relatively homogeneous. All cluster resources must support, for example, the same OS or the same security requirements so that optimization actions do not place VMs in the wrong cluster.
The tagging approach enables you to define zones of infrastructure within cluster boundaries. For example, you can ensure that during workload optimization actions, Windows VMs are moved only to Windows-licensed clusters and Oracle VMs are moved only to Oracle-licensed clusters. Similarly, you can enable tiers of service in an application, where "Tier 1" VMs are moved only to Tier 1 clusters running business-critical applications. Other examples include separating VMs according to OS, or creating network boundaries.
VMs and clusters can be tagged with more than one tag. VMs with multiple tags are placed only on clusters with all matching tags.
Note VM-to-cluster tagging is not the same as host-based VM tagging. See Business Intent - Host-Based Virtual Machine Placement .
vCenter Server tags are implemented as key:value labels that enable operators to add meta-data to vCenter Server objects. In vCenter Server terminology, the key is the tag category and the value is the tag name.
Using this construct, the tag OS: Linux can indicate a cluster or VM that is assigned to the category OS with a tag name of Linux. For complete information on vCenter Server tagging capabilities, refer to the vCenter Server and Host Management guide.
The system provides several preset categories at the Business Intent Workspace:
n Operating System
n Environment
n Tier
n Network
n Other
These categories represent potential business intent in gathering VMs into various associations. You are free to remove a category or add a new one that works for your environment.
Using this construct, the tag OS: Linux can indicate a cluster or VM that is assigned to the category OS with a tag name of Linux. For complete information on vCenter Server tagging capabilities, refer to the vCenter Server and Host Management guide.
In vRealize Operations Manager, you assign category and name tags in Policies, at the Business Intent workspace.
vRealize Operations Manager Configuration Guide
VMware, Inc. 272

Tagging Considerationsn You can choose either cluster-tag-based placement or host-based placement in the same data center
or custom data center, but not both. If you select cluster-tag-based placement, host tags are ignored. Conversely, if you choose host-tag-based placement, cluster tags are ignored.
n If a VM is tagless, the system attempts to move it to a tagless cluster.
Tag Implementation Example: Cluster Zones of Service and LicensingThe following example shows how an administrator assigned tags to clusters and VMs to create zones within a data center:
1
6
11
2 3
7 8
12 13
4 5
9 10
14 15
Clusters
Data Center A
Production
Gold Silver Oracle
Staging
Dev
Using vCenter Server, the administrator sets up these tag categories and associated tag names:
n Environment: Production, Staging, Dev
n Service Tier: Gold, Silver
n Licensing: Oracle
Data Center A includes 15 clusters. The administrator tags the clusters and VMs in those clusters as follows:
Cluster Environment Service Tier Licensing
1 Production Gold
2, 3 Production Silver
4, 5 Production Oracle
6 Staging Gold
7, 8 Staging Silver
9, 10 Staging Oracle
vRealize Operations Manager Configuration Guide
VMware, Inc. 273
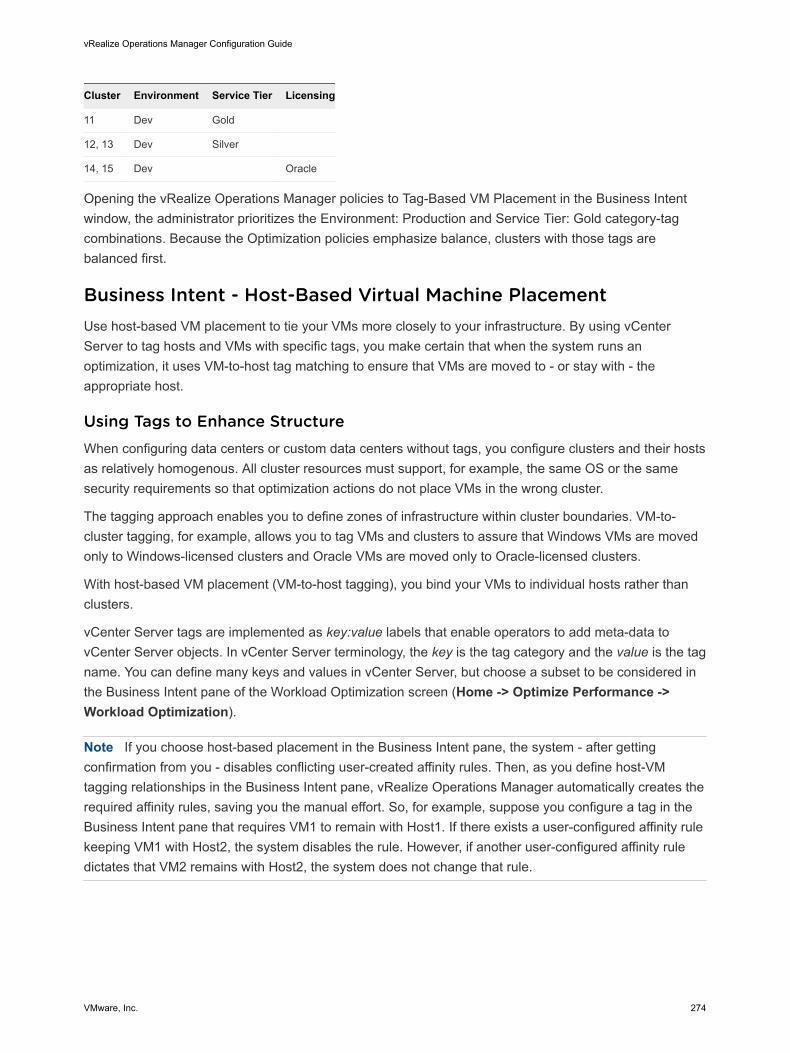
Cluster Environment Service Tier Licensing
11 Dev Gold
12, 13 Dev Silver
14, 15 Dev Oracle
Opening the vRealize Operations Manager policies to Tag-Based VM Placement in the Business Intent window, the administrator prioritizes the Environment: Production and Service Tier: Gold category-tag combinations. Because the Optimization policies emphasize balance, clusters with those tags are balanced first.
Business Intent - Host-Based Virtual Machine PlacementUse host-based VM placement to tie your VMs more closely to your infrastructure. By using vCenter Server to tag hosts and VMs with specific tags, you make certain that when the system runs an optimization, it uses VM-to-host tag matching to ensure that VMs are moved to - or stay with - the appropriate host.
Using Tags to Enhance StructureWhen configuring data centers or custom data centers without tags, you configure clusters and their hosts as relatively homogenous. All cluster resources must support, for example, the same OS or the same security requirements so that optimization actions do not place VMs in the wrong cluster.
The tagging approach enables you to define zones of infrastructure within cluster boundaries. VM-to-cluster tagging, for example, allows you to tag VMs and clusters to assure that Windows VMs are moved only to Windows-licensed clusters and Oracle VMs are moved only to Oracle-licensed clusters.
With host-based VM placement (VM-to-host tagging), you bind your VMs to individual hosts rather than clusters.
vCenter Server tags are implemented as key:value labels that enable operators to add meta-data to vCenter Server objects. In vCenter Server terminology, the key is the tag category and the value is the tag name. You can define many keys and values in vCenter Server, but choose a subset to be considered in the Business Intent pane of the Workload Optimization screen (Home -> Optimize Performance -> Workload Optimization).
Note If you choose host-based placement in the Business Intent pane, the system - after getting confirmation from you - disables conflicting user-created affinity rules. Then, as you define host-VM tagging relationships in the Business Intent pane, vRealize Operations Manager automatically creates the required affinity rules, saving you the manual effort. So, for example, suppose you configure a tag in the Business Intent pane that requires VM1 to remain with Host1. If there exists a user-configured affinity rule keeping VM1 with Host2, the system disables the rule. However, if another user-configured affinity rule dictates that VM2 remains with Host2, the system does not change that rule.
vRealize Operations Manager Configuration Guide
VMware, Inc. 274
Additional Considerationsn You are not permitted to employ both VM-to-cluster tagging and VM-to-host tagging in the same data
center or custom data center - only one tagging method or the other. If you select host-based VM placement, any cluster tags are ignored.
n With host-based VM placement, only one category and one tag per VM is allowed per VM.
n A tagless VM can be sent to any host, even a tagged host.
n A host with multiple tags is treated as tagless.
n Even if all workloads are balanced, if there is also a tag violation, the system is by definition not optimized.
n The system does not consider any tags of storage - that is, datastores or datastore clusters.
Business Intent WorkspaceYou can use vCenter Server tagging to tag VMs, hosts, and/or clusters with specific tags. vRealize Operations Manager can be configured to leverage tags to define business-related placement constraints: VMs can only be placed on hosts/clusters with matching tags.
Where You Find Business IntentFrom the Home page, click the chevron next to Optimize Performance on the left. Click Workload Optimization, select a data center or custom data center from the top row, and click Edit in the Business Intent window.
To edit Business Intent values, you must have privileges for Administration -> Configuration -> Workload Placement Settings -> Edit.
Establishing Business IntentTags are implemented in vCenter Server as key:value labels that enable operators to add meta-data to vCenter Server objects. In vCenter Server terminology, the key is the tag category and the value is the tag name. Using this construct, the tag OS: Linux can indicate a cluster or VM that is assigned to the category OS with a tag name of Linux. For complete information on vCenter Server tagging capabilities, refer to the vCenter Server and Host Management guide.
To specify tags considered for placement, first select the radio button for the type of object you want to associate with VMs in this business intent session: Clusters or Hosts.
The system provides several suggested categories. These categories are only suggestions. You must specify the actual categories in vCenter Server after you expand the section for a suggested category . For example, in section "Tier", you can specify the actual vCenter Server tag category that represents tier semantics, for instance, "service level".
n Operating System
n Environment
n Tier
vRealize Operations Manager Configuration Guide
VMware, Inc. 275
n Network
n Other
Any actual categories you specify must first be created in vCenter Server.
Then you can associate tagged VMs with clusters or hosts, based on the rules for each type of tagging.
1 Click the chevron to the left of the first suggested category. A tag category field appears.
2 Click the drop-down menu indicator and choose a category from the list defined in vCenter Server.
3 Click the drop-down menu indicator in the Tag Name (Optional) field and choose a tag name from the list defined in vCenter Server.
4 Click Include Tag. All VMs with that tag are associated with the category.
Rules for Host-Based PlacementTo set host level placement constraints, vRealize Operations Manager automatically creates and manages DRS rules. All conflicting user-created DRS rules are DISABLED.
These rules include the following:
n Any VM-VM affinity and anti-affinity rules.
n Any VM-Host affinity and anti-affinity rules.
You must check the selection box next to the statement, "I understand that vRealize Operations will disable all my current and future DRS rules".
See also Business Intent - Host-Based Virtual Machine Placement .
Rules for Cluster-Based PlacementSee Business Intent: Tag-Based VM Placement in Clusters.
Configuring Workload Optimization AlertsvRealize Operations Manager provides two preconfigured alerts designed to work with the Workload Optimization feature. You must take additional action in the Policies area to turn on the alerts and automate them so that predetermined actions are run when the alerts fire.
The following preconfigured alerts are designed to work with the Workload Optimization feature:
n Data center performance can potentially be optimized in one or more clusters.
n Custom data center performance can potentially be optimized in one or more clusters.
The preconfigured alerts fire only if the AUTOMATE function is not turned on at the Workload Optimization screen. (Home -> Optimize Performance -> Workload Optimization).
Prerequisites
Ensure that you have all required permissions to access the Workload Optimization UI pages and manage vCenter Server objects.
vRealize Operations Manager Configuration Guide
VMware, Inc. 276
Procedure
1 Select Administration from the menu, then Policies from the left pane.
2 Click Policy Library and select the policy that includes settings for the relevant data centers and custom data centers, for example, vSphere Solution’s Default Policy.
3 Click Edit.
4 Click #6 on the lower left, Alert/Symptom Definitions.
5 Search on "can potentially be optimized" to locate the two alerts you want.
6 The alerts are turned ON by default/inheritance (see the State column).
7 The alerts are not automated by default/inheritance (see the Automate column). To automate the alerts, click the menu symbol to the right of the inherited value and select the green check mark.
Workload Optimization is fully automated for your environment.
What to do next
To confirm that actions are taken automatically, monitor rebalance activity at the Workload Optimization screen.
Using Workload OptimizationUse the Workload Optimization UI pages to monitor optimizing moves in a fully automated system. If your system is not fully automated, you can use the UI to conduct research and run actions directly.
vRealize Operations Manager monitors virtual objects and collects and analyzes related data that is presented to you in graphical form at the Workload Optimization screen. Depending on what appears on the screen, you might use optimization functions to distribute a workload differently in a data center or custom data center. Or you may decide to perform more research, including checking the Alerts page to determine if any alerts have been generated for objects of interest.
For comprehensive general instructions on responding to alerts and analyzing problems related to objects in your environment, see .
For comprehensive general instructions on responding to alerts and analyzing problems related to objects in your environment, see the vRealize Operations Manager User Guide.
The following examples demonstrate the primary ways you can use Workload Optimization to keep your data centers balanced and performing their best.
Example: Run Workload OptimizationAs a virtual infrastructure administrator or other IT professional, you use Workload Optimization functions to identify points of resource contention or imbalance. In this example, you manually run an optimization action to consolidate demand.
When you log into vRealize Operations Manager, you see the Quick Start page. In the left-most column, Optimize Performance, is the alert 3 DATA CENTERS REQUIRING OPTIMIZATION.
vRealize Operations Manager Configuration Guide
VMware, Inc. 277
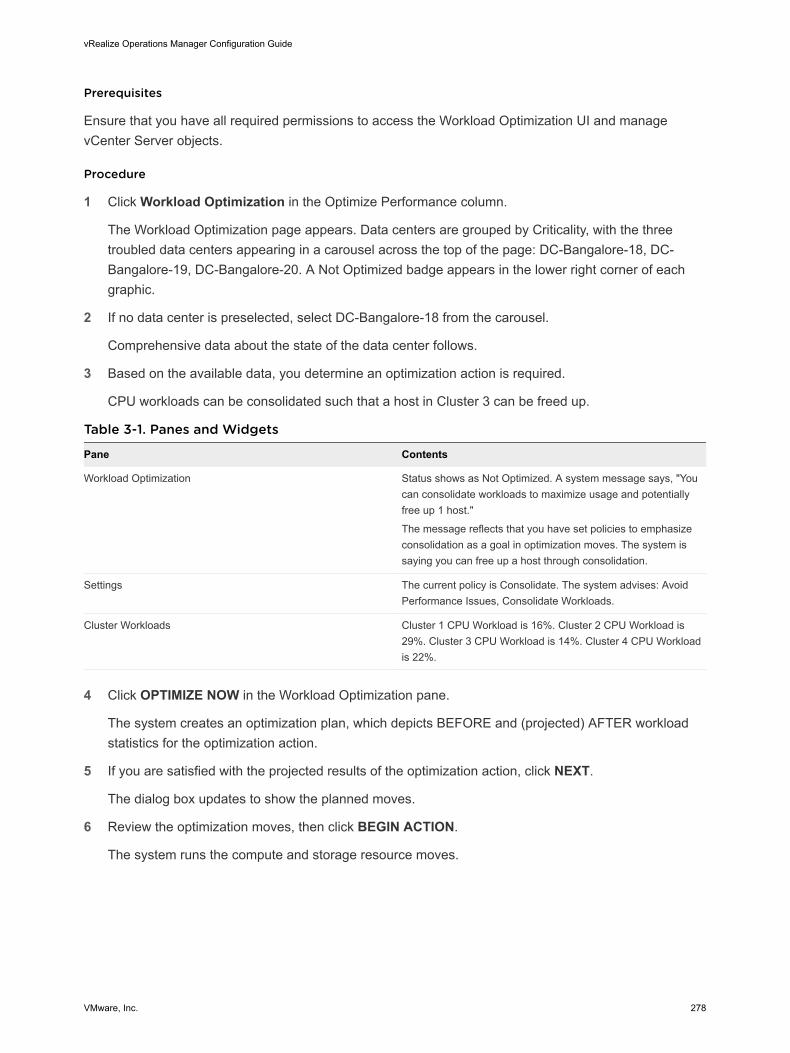
Prerequisites
Ensure that you have all required permissions to access the Workload Optimization UI and manage vCenter Server objects.
Procedure
1 Click Workload Optimization in the Optimize Performance column.
The Workload Optimization page appears. Data centers are grouped by Criticality, with the three troubled data centers appearing in a carousel across the top of the page: DC-Bangalore-18, DC-Bangalore-19, DC-Bangalore-20. A Not Optimized badge appears in the lower right corner of each graphic.
2 If no data center is preselected, select DC-Bangalore-18 from the carousel.
Comprehensive data about the state of the data center follows.
3 Based on the available data, you determine an optimization action is required.
CPU workloads can be consolidated such that a host in Cluster 3 can be freed up.
Table 3-1. Panes and Widgets
Pane Contents
Workload Optimization Status shows as Not Optimized. A system message says, "You can consolidate workloads to maximize usage and potentially free up 1 host."
The message reflects that you have set policies to emphasize consolidation as a goal in optimization moves. The system is saying you can free up a host through consolidation.
Settings The current policy is Consolidate. The system advises: Avoid Performance Issues, Consolidate Workloads.
Cluster Workloads Cluster 1 CPU Workload is 16%. Cluster 2 CPU Workload is 29%. Cluster 3 CPU Workload is 14%. Cluster 4 CPU Workload is 22%.
4 Click OPTIMIZE NOW in the Workload Optimization pane.
The system creates an optimization plan, which depicts BEFORE and (projected) AFTER workload statistics for the optimization action.
5 If you are satisfied with the projected results of the optimization action, click NEXT.
The dialog box updates to show the planned moves.
6 Review the optimization moves, then click BEGIN ACTION.
The system runs the compute and storage resource moves.
vRealize Operations Manager Configuration Guide
VMware, Inc. 278
The optimization action moved compute and storage resources from some clusters to other clusters in the data center, and so freed up a host on one cluster.
Note The Workload Optimization page refreshes every five minutes. Depending on when you run an optimization action, the system might not reflect the result for up to five minutes, or longer when longer-running actions extend the processing time.
What to do next
To confirm that your optimization action was completed, go to the Recent Tasks page by selecting Administration on the top menu, and clicking History > Recent Tasks in the left pane. In the Recent Tasks page, use the Status function on the menu bar to locate your action by its status. You can also search using a range of filters. For example, first filter on Starting Time and scroll to the time when you began the action, then select the Object Name filter. Finally, enter the name of one of the VMs in the rebalance plan.
Note Sometimes an optimizing action may be suggested, for example to consolidate two hosts, but when you run the optimization, the generated placement plan does not show any potential consolidation. The seeming inconsistency results from the fact that suggested optimization actions are based on current conditions, whereas the placement plan logic includes forecasting. If forecasting predicts that consolidation might incur stress in the future, then consolidation is not suggested.
Example: Schedule a Repeating Optimization ActionAs a virtual infrastructure administrator or other IT professional, you determine that compute and storage resources in a given data center are volatile and a regularly scheduled optimization action can address the problem.
vRealize Operations Manager monitors virtual objects and collects and analyzes related data that is presented to you in graphical form at the Workload Optimization page. Depending on what appears, you may determine that you must schedule optimization functions to distribute a workload more evenly in a data center or custom data center.
Prerequisites
Ensure that you have all required permissions to access the Workload Optimization UI and manage vCenter Server objects.
Procedure
1 From the Home screen, click Optimize Performance > Workload Optimization in the left pane.
2 From the carousel of data centers across the top of the page, select a data center for which you want to schedule repeated optimization actions.
3 In the Workload Optimization pane, click SCHEDULE.
4 Give the schedule a name and choose a time zone.
vRealize Operations Manager Configuration Guide
VMware, Inc. 279
5 Determine how often you want to repeat the optimization action and click the relevant radio button under Recurrence.
Depending on your selection under Recurrence, additional options appear to the right. In this instance, you choose to repeat the optimization daily.
6 Leave the current date and time.
7 Select the Repeat every day radio button.
8 Select the Expire after radio button and tick the counter up to 6.
9 Click Save.
The optimization action repeats for six days, then stops.
At the Workload Optimization page, the Scheduled button appears in the upper right of the Workload Optimization pane if optimization actions are scheduled for the selected data center. If you want to edit or delete a schedule, click the Scheduled button. The Optimization Schedules page appears, where you can perform those actions.
Note If you schedule a number of optimization actions close together, and the optimization plans of two or more actions include overlapping functions, that is, they impact the same set of resources, the system shifts the actions into a queue. As a result, some actions may complete later than expected, with longer running actions and other potential system constraints extending the lag time. Optimization actions that do not overlap can run concurrently.
What to do next
To confirm that your optimization action was finished, go to the Recent Tasks screen by selecting Administration on the top menu, and clicking History > Recent Task in the left pane. In the Recent Tasks screen, use the Status function on the menu bar to locate your action by its status. You can also search using a range of filters. For example, filter on Event Source and enter the name of the scheduled optimization plan.
Note Because real-time data center resource contention is dynamic, the system calculates a new optimization plan each time the scheduled optimization action starts, but before it runs. The system does not run the action if the system determines that the data center container is balanced at this moment. On the Recent Tasks page, the name of the affected data center appears in the Object Name column, and the Message “The optimization of the selected container cannot be improved” appears under Details. Another possibility is that a scheduled optimization plan is attempted, but does not go forward. In this event - which is not the same as a "failed" action - the name of the affected data center also appears in the Object Name column.
vRealize Operations Manager Configuration Guide
VMware, Inc. 280
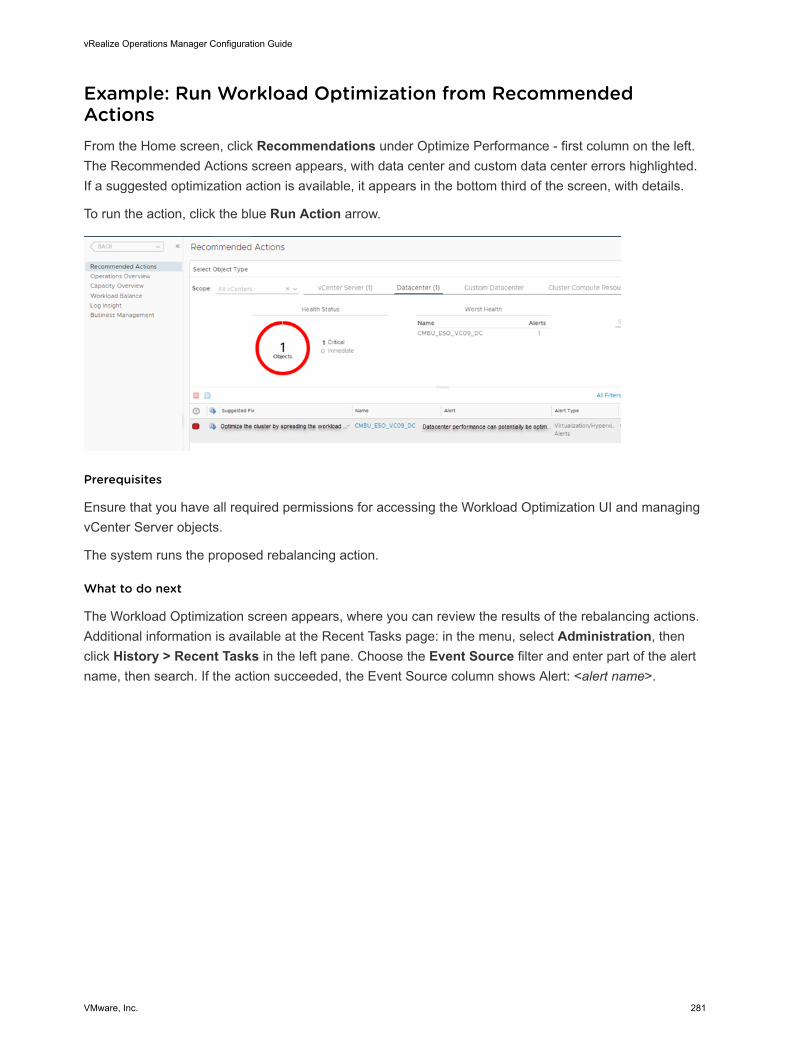
Example: Run Workload Optimization from Recommended ActionsFrom the Home screen, click Recommendations under Optimize Performance - first column on the left. The Recommended Actions screen appears, with data center and custom data center errors highlighted. If a suggested optimization action is available, it appears in the bottom third of the screen, with details.
To run the action, click the blue Run Action arrow.
Prerequisites
Ensure that you have all required permissions for accessing the Workload Optimization UI and managing vCenter Server objects.
The system runs the proposed rebalancing action.
What to do next
The Workload Optimization screen appears, where you can review the results of the rebalancing actions. Additional information is available at the Recent Tasks page: in the menu, select Administration, then click History > Recent Tasks in the left pane. Choose the Event Source filter and enter part of the alert name, then search. If the action succeeded, the Event Source column shows Alert: <alert name>.
vRealize Operations Manager Configuration Guide
VMware, Inc. 281
Configuring Policies 4To create a policy, you can inherit the settings from an existing policy, and you can modify the settings in existing policies if you have adequate permissions. After you create a policy, or edit an existing policy, you can apply the policy to one or more groups of objects.
This chapter includes the following topics:
n Policies
n Operational Policies
n Types of Policies
n Using the Monitoring Policy Workspace to Create and Modify Operational Policies
PoliciesA policy is a set of rules that you define for vRealize Operations Manager to use to analyze and display information about the objects in your environment. You can create, modify, and administer policies to determine how vRealize Operations Manager displays data in dashboards, views, and reports.
How Policies Relate to Your EnvironmentvRealize Operations Manager policies support the operational decisions established for your IT infrastructure and business units. With policies, you control what data vRealize Operations Manager collects and reports on for specific objects in your environment. Each policy can inherit settings from other policies, and you can customize and override various analysis settings, alert definitions, and symptom definitions for specific object types, to support the service Level agreements and business priorities established for your environment.
When you manage policies, you must understand the operational priorities for your environment, and the tolerances for alerts and symptoms to meet the requirements for your business critical applications. Then, you can configure the policies so that you apply the correct policy and threshold settings for your production and test environments.
VMware, Inc. 282
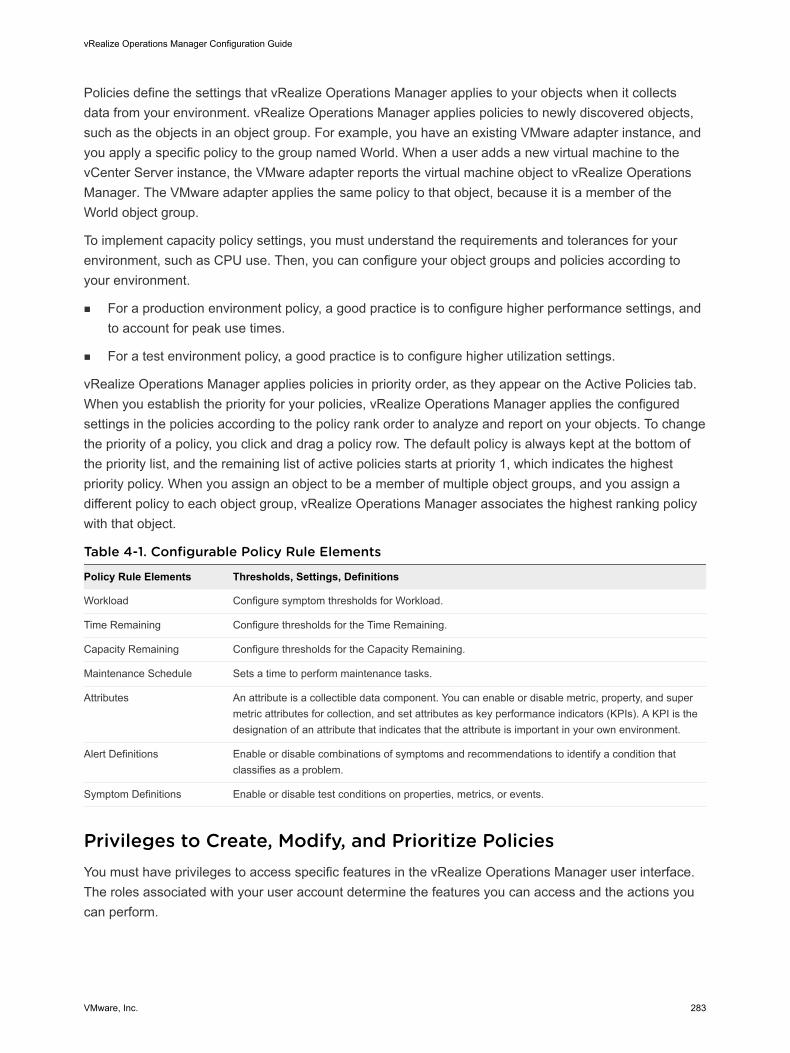
Policies define the settings that vRealize Operations Manager applies to your objects when it collects data from your environment. vRealize Operations Manager applies policies to newly discovered objects, such as the objects in an object group. For example, you have an existing VMware adapter instance, and you apply a specific policy to the group named World. When a user adds a new virtual machine to the vCenter Server instance, the VMware adapter reports the virtual machine object to vRealize Operations Manager. The VMware adapter applies the same policy to that object, because it is a member of the World object group.
To implement capacity policy settings, you must understand the requirements and tolerances for your environment, such as CPU use. Then, you can configure your object groups and policies according to your environment.
n For a production environment policy, a good practice is to configure higher performance settings, and to account for peak use times.
n For a test environment policy, a good practice is to configure higher utilization settings.
vRealize Operations Manager applies policies in priority order, as they appear on the Active Policies tab. When you establish the priority for your policies, vRealize Operations Manager applies the configured settings in the policies according to the policy rank order to analyze and report on your objects. To change the priority of a policy, you click and drag a policy row. The default policy is always kept at the bottom of the priority list, and the remaining list of active policies starts at priority 1, which indicates the highest priority policy. When you assign an object to be a member of multiple object groups, and you assign a different policy to each object group, vRealize Operations Manager associates the highest ranking policy with that object.
Table 4-1. Configurable Policy Rule Elements
Policy Rule Elements Thresholds, Settings, Definitions
Workload Configure symptom thresholds for Workload.
Time Remaining Configure thresholds for the Time Remaining.
Capacity Remaining Configure thresholds for the Capacity Remaining.
Maintenance Schedule Sets a time to perform maintenance tasks.
Attributes An attribute is a collectible data component. You can enable or disable metric, property, and super metric attributes for collection, and set attributes as key performance indicators (KPIs). A KPI is the designation of an attribute that indicates that the attribute is important in your own environment.
Alert Definitions Enable or disable combinations of symptoms and recommendations to identify a condition that classifies as a problem.
Symptom Definitions Enable or disable test conditions on properties, metrics, or events.
Privileges to Create, Modify, and Prioritize PoliciesYou must have privileges to access specific features in the vRealize Operations Manager user interface. The roles associated with your user account determine the features you can access and the actions you can perform.
vRealize Operations Manager Configuration Guide
VMware, Inc. 283
To set the policy priority, on the Active Policies tab, click the policy row and drag it to place it at the desired priority in the list. The priority for the Default Policy is always designated with the letter D.
How Upgrades Affect Your PoliciesAfter you upgrade vRealize Operations Manager from a previous version, you might find newly added or updated default settings of policies such as, new alerts and symptoms. Hence, you must analyze the settings and modify these settings to optimize them for your current environment. If you apply the policies used with a previous version of vRealize Operations Manager, the manually modified policy settings remain unaltered.
Policy Decisions and ObjectivesImplementing policy decisions in vRealize Operations Manager is typically the responsibility of the Infrastructure Administrator or the Virtual Infrastructure Administrator, but users who have privileges can also create and modify policies.
You must be aware of the policies established to analyze and monitor the resources in your IT infrastructure.
n If you are a Network Operations engineer, you must understand how policies affect the data that vRealize Operations Manager reports on objects, and which policies assigned to objects report alerts and issues.
n If you are the person whose role is to recommend an initial setup for policies, you typically edit and configure the policies in vRealize Operations Manager.
n If your primary role is to assess problems that occur in your environment, but you do not have the responsibility to change the policies, you must still understand how the policies applied to objects affect the data that appears in vRealize Operations Manager. For example, you might need to know which policies apply to objects that are associated with particular alerts.
n If you are a typical application user who receives reports from vRealize Operations Manager, you must have a high-level understanding of the operational policies so that you can understand the reported data values.
Active Policies Tab for PoliciesThe Active Policies tab displays the policies associated with groups of objects. You can manage the active policies for the objects in your environment so that you can have vRealize Operations Manager analyze and display specific data about those objects in dashboards, views, and reports.
How the Active Policies Tab WorksUse the Active Policies tab to associate a policy with one or more object groups, and to set the default policy. You can view the locally defined settings for a policy, and the complete list of settings, which includes those that are inherited from the base policies that you select in the Add or Edit Policy workspace. You can assign any policy to be the default policy.
vRealize Operations Manager Configuration Guide
VMware, Inc. 284
vRealize Operations Manager applies policies in priority order, as they appear on the Active Policies tab. When you establish the priority for your policies, vRealize Operations Manager applies the configured settings in the policies according to the policy rank order to analyze and report on your objects. To change the priority of a policy, you click and drag a policy row. The default policy is always kept at the bottom of the priority list, and the remaining list of active policies starts at priority 1, which indicates the highest priority policy. When you assign an object to be a member of multiple object groups, and you assign a different policy to each object group, vRealize Operations Manager associates the highest ranking policy with that object.
To display the details for a selected policy, click the split bar to expand the pane. The Details and Related Items tabs and options for the policy appear in the lower pane. On the Related Items tab, you can also apply the selected policy to object groups.
You can use the far right column of the Active Policies tab to reorder and therefore reprioritize the policies by dragging them to a new position. However, even though it seems like you can drag a custom policy below the default policy, you cannot. The default policy is always the last policy in the list after the view is refreshed.
How to Prioritize PoliciesTo set the policy priority, on the Active Policies tab, click the policy row and drag it to place it at the desired priority in the list. The priority for the Default Policy is always designated with the letter D.
Where You Manage the Active PoliciesTo manage the active policies, in the menu, click Administration, and then in the left pane click Policies. The Active Policies tab appears and lists the policies that are active for the objects in your environment.
vRealize Operations Manager Configuration Guide
VMware, Inc. 285
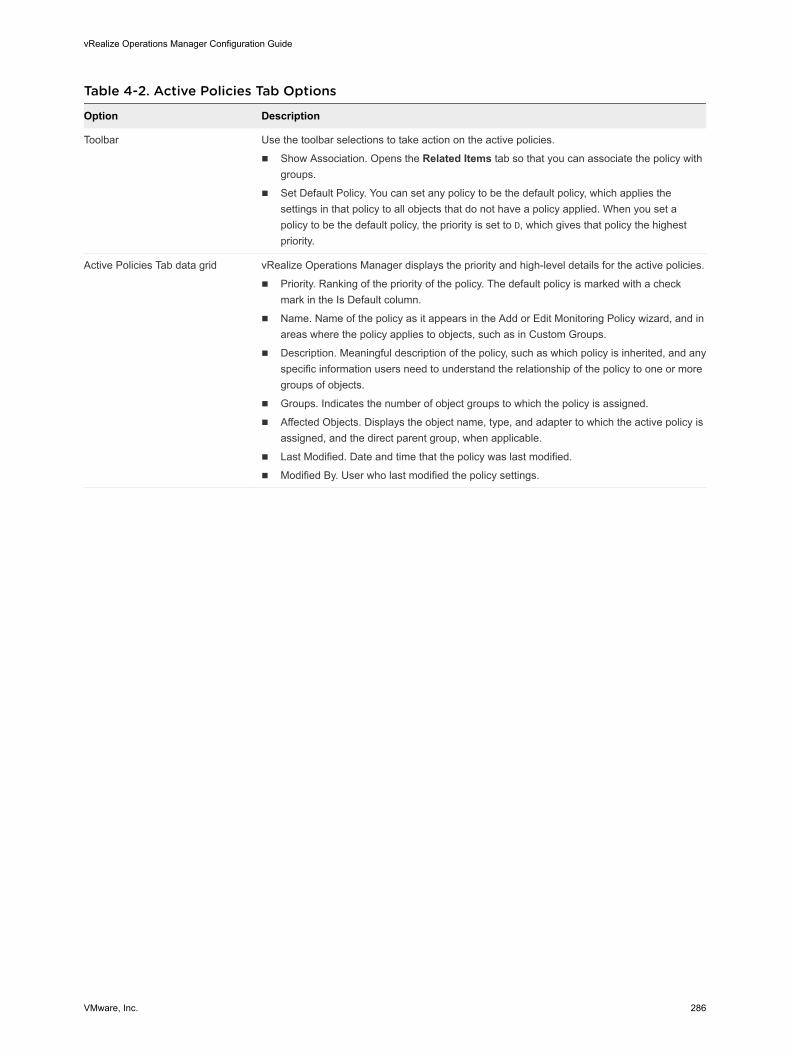
Table 4-2. Active Policies Tab Options
Option Description
Toolbar Use the toolbar selections to take action on the active policies.
n Show Association. Opens the Related Items tab so that you can associate the policy with groups.
n Set Default Policy. You can set any policy to be the default policy, which applies the settings in that policy to all objects that do not have a policy applied. When you set a policy to be the default policy, the priority is set to D, which gives that policy the highest priority.
Active Policies Tab data grid vRealize Operations Manager displays the priority and high-level details for the active policies.
n Priority. Ranking of the priority of the policy. The default policy is marked with a check mark in the Is Default column.
n Name. Name of the policy as it appears in the Add or Edit Monitoring Policy wizard, and in areas where the policy applies to objects, such as in Custom Groups.
n Description. Meaningful description of the policy, such as which policy is inherited, and any specific information users need to understand the relationship of the policy to one or more groups of objects.
n Groups. Indicates the number of object groups to which the policy is assigned.
n Affected Objects. Displays the object name, type, and adapter to which the active policy is assigned, and the direct parent group, when applicable.
n Last Modified. Date and time that the policy was last modified.
n Modified By. User who last modified the policy settings.
vRealize Operations Manager Configuration Guide
VMware, Inc. 286
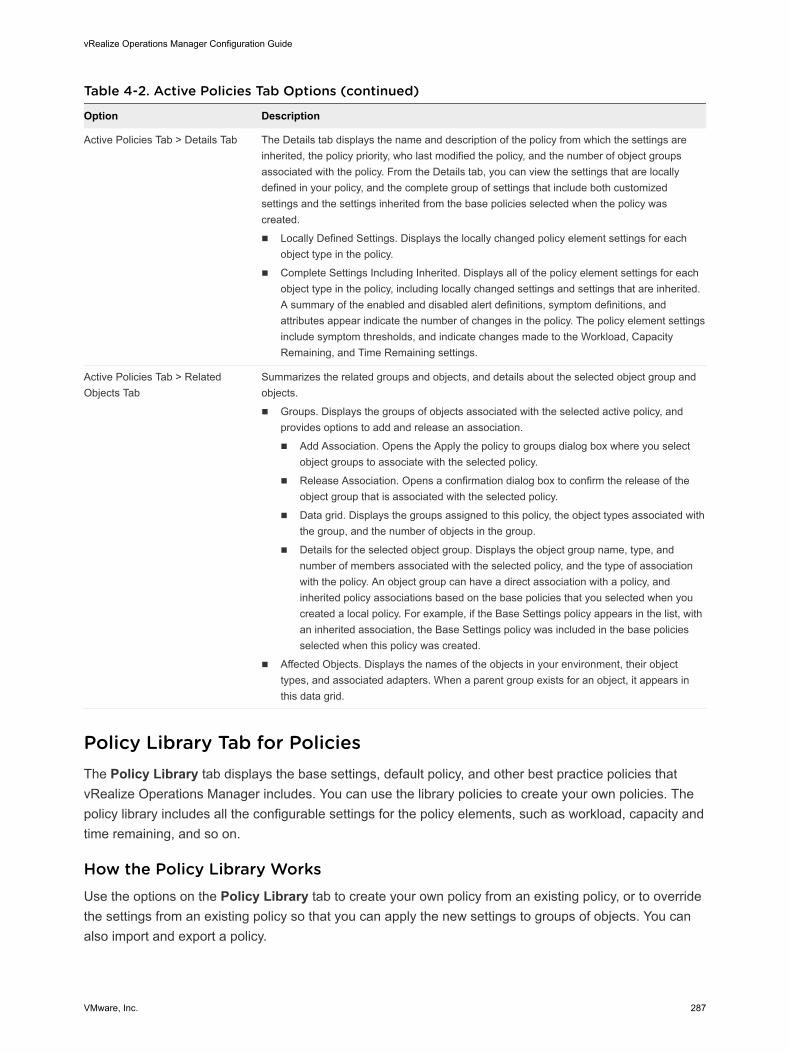
Table 4-2. Active Policies Tab Options (continued)
Option Description
Active Policies Tab > Details Tab The Details tab displays the name and description of the policy from which the settings are inherited, the policy priority, who last modified the policy, and the number of object groups associated with the policy. From the Details tab, you can view the settings that are locally defined in your policy, and the complete group of settings that include both customized settings and the settings inherited from the base policies selected when the policy was created.
n Locally Defined Settings. Displays the locally changed policy element settings for each object type in the policy.
n Complete Settings Including Inherited. Displays all of the policy element settings for each object type in the policy, including locally changed settings and settings that are inherited. A summary of the enabled and disabled alert definitions, symptom definitions, and attributes appear indicate the number of changes in the policy. The policy element settings include symptom thresholds, and indicate changes made to the Workload, Capacity Remaining, and Time Remaining settings.
Active Policies Tab > Related Objects Tab
Summarizes the related groups and objects, and details about the selected object group and objects.
n Groups. Displays the groups of objects associated with the selected active policy, and provides options to add and release an association.
n Add Association. Opens the Apply the policy to groups dialog box where you select object groups to associate with the selected policy.
n Release Association. Opens a confirmation dialog box to confirm the release of the object group that is associated with the selected policy.
n Data grid. Displays the groups assigned to this policy, the object types associated with the group, and the number of objects in the group.
n Details for the selected object group. Displays the object group name, type, and number of members associated with the selected policy, and the type of association with the policy. An object group can have a direct association with a policy, and inherited policy associations based on the base policies that you selected when you created a local policy. For example, if the Base Settings policy appears in the list, with an inherited association, the Base Settings policy was included in the base policies selected when this policy was created.
n Affected Objects. Displays the names of the objects in your environment, their object types, and associated adapters. When a parent group exists for an object, it appears in this data grid.
Policy Library Tab for PoliciesThe Policy Library tab displays the base settings, default policy, and other best practice policies that vRealize Operations Manager includes. You can use the library policies to create your own policies. The policy library includes all the configurable settings for the policy elements, such as workload, capacity and time remaining, and so on.
How the Policy Library WorksUse the options on the Policy Library tab to create your own policy from an existing policy, or to override the settings from an existing policy so that you can apply the new settings to groups of objects. You can also import and export a policy.
vRealize Operations Manager Configuration Guide
VMware, Inc. 287
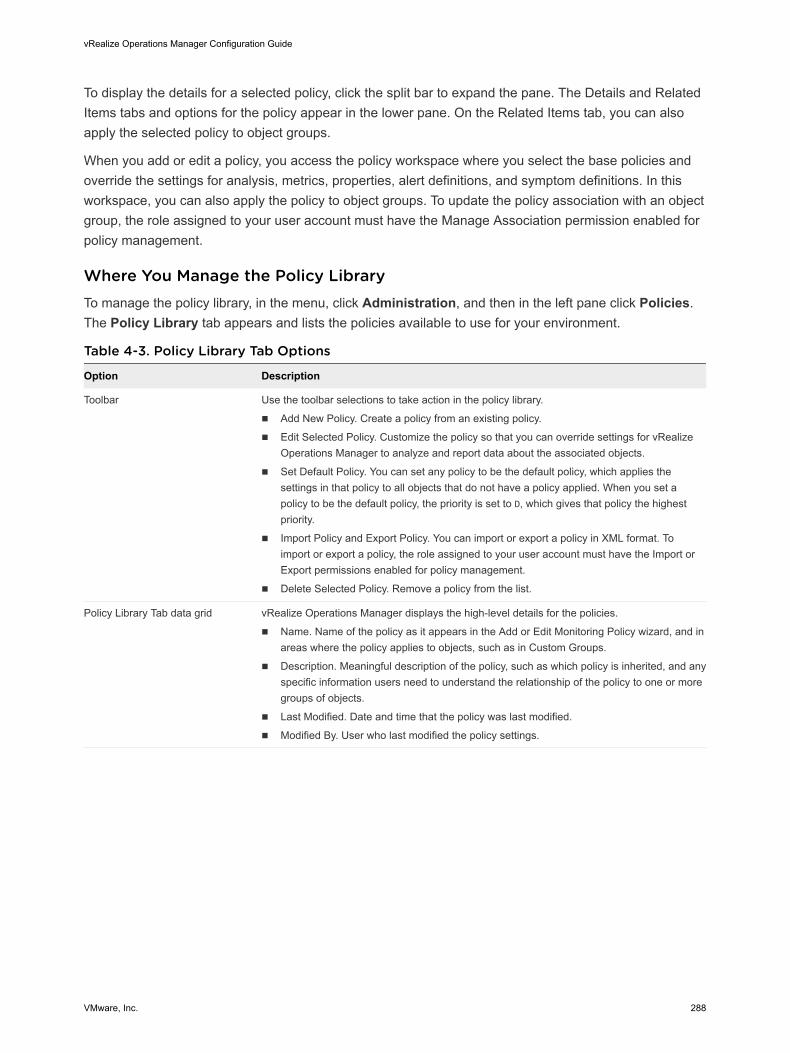
To display the details for a selected policy, click the split bar to expand the pane. The Details and Related Items tabs and options for the policy appear in the lower pane. On the Related Items tab, you can also apply the selected policy to object groups.
When you add or edit a policy, you access the policy workspace where you select the base policies and override the settings for analysis, metrics, properties, alert definitions, and symptom definitions. In this workspace, you can also apply the policy to object groups. To update the policy association with an object group, the role assigned to your user account must have the Manage Association permission enabled for policy management.
Where You Manage the Policy LibraryTo manage the policy library, in the menu, click Administration, and then in the left pane click Policies. The Policy Library tab appears and lists the policies available to use for your environment.
Table 4-3. Policy Library Tab Options
Option Description
Toolbar Use the toolbar selections to take action in the policy library.
n Add New Policy. Create a policy from an existing policy.
n Edit Selected Policy. Customize the policy so that you can override settings for vRealize Operations Manager to analyze and report data about the associated objects.
n Set Default Policy. You can set any policy to be the default policy, which applies the settings in that policy to all objects that do not have a policy applied. When you set a policy to be the default policy, the priority is set to D, which gives that policy the highest priority.
n Import Policy and Export Policy. You can import or export a policy in XML format. To import or export a policy, the role assigned to your user account must have the Import or Export permissions enabled for policy management.
n Delete Selected Policy. Remove a policy from the list.
Policy Library Tab data grid vRealize Operations Manager displays the high-level details for the policies.
n Name. Name of the policy as it appears in the Add or Edit Monitoring Policy wizard, and in areas where the policy applies to objects, such as in Custom Groups.
n Description. Meaningful description of the policy, such as which policy is inherited, and any specific information users need to understand the relationship of the policy to one or more groups of objects.
n Last Modified. Date and time that the policy was last modified.
n Modified By. User who last modified the policy settings.
vRealize Operations Manager Configuration Guide
VMware, Inc. 288
Table 4-3. Policy Library Tab Options (continued)
Option Description
Policy Library Tab > Details Tab The Details tab displays the name and description of the policy from which the settings are inherited, the policy priority, who last modified the policy, and the number of object groups associated with the policy. From the Details tab, you can view the settings that are locally defined in your policy, and the complete group of settings that include both customized settings and the settings inherited from the base policies selected when the policy was created.
n Locally Defined Settings. Displays the locally changed policy element settings for each object type in the policy.
n Complete Settings Including Inherited. Displays all of the policy element settings for each object type in the policy, including locally changed settings and settings that are inherited. A summary of the enabled and disabled alert definitions, symptom definitions, and attributes appear indicate the number of changes in the policy. The policy element settings include symptom thresholds, and indicate changes made to the Workload, Capacity Remaining, and Time Remaining settings.
Related Objects Tab Summarizes the related groups and objects, and details about the selected object group and objects.
n Groups. Displays the groups of objects associated with the selected active policy, and provides options to add and release an association.
n Add Association. Opens the Apply the policy to groups dialog box where you select object groups to associate with the selected policy.
n Release Association. Opens a confirmation dialog box to confirm the release of the object group that is associated with the selected policy.
n Data grid. Displays the groups assigned to this policy, the object types associated with the group, and the number of objects in the group.
n Details for the selected object group. Displays the object group name, type, and number of members associated with the selected policy, and the type of association with the policy. An object group can have a direct association with a policy, and inherited policy associations based on the base policies that you selected when you created a local policy. For example, if the Base Settings policy appears in the list, with an inherited association, the Base Settings policy was included in the base policies selected when this policy was created.
n Affected Objects. Displays the names of the objects in your environment, their object types, and associated adapters. When a parent group exists for an object, it appears in this data grid.
Operational PoliciesDetermine how to have vRealize Operations Manager monitor your objects, and how to notify you about problems that occur with those objects.
vRealize Operations Manager Administrators assign policies to object groups and applications to support Service Level Agreements (SLAs) and business priorities. When you use policies with object groups, you ensure that the rules defined in the policies are quickly put into effect for the objects in your environment.
With policies, you can:
n Enable and disable alerts.
n Control data collections by persisting or not persisting metrics on the objects in your environment.
vRealize Operations Manager Configuration Guide
VMware, Inc. 289
n Configure the product analytics and thresholds.
n Monitor objects and applications at different service levels.
n Prioritize policies so that the most important rules override the defaults.
n Understand the rules that affect the analytics.
n Understand which policies apply to object groups.
vRealize Operations Manager includes a library of built-in active policies that are already defined for your use. vRealize Operations Manager applies these policies in priority order.
When you apply a policy to an object group, vRealize Operations Manager collects data from the objects in the object group based on the thresholds, metrics, super metrics, attributes, properties, alert definitions, and problem definitions that are enabled in the policy.
The following examples of policies might exist for a typical IT environment.
n Maintenance: Optimized for ongoing monitoring, with no thresholds or alerts.
n Critical Production: Production environment ready, optimized for performance with sensitive alerting.
n Important Production: Production environment ready, optimized for performance with medium alerting.
n Batch Workloads: Optimized to process jobs.
n Test, Staging, and QA: Less critical settings, fewer alerts.
n Development: Less critical settings, no alerts.
n Low Priority: Ensures efficient use of resources.
n Default Policy: Default system settings.
Types of PoliciesThere are three types of policies such as default policies, custom policies, and policies that are offered with vRealize Operations Manager.
Custom PoliciesYou can customize the default policy and base policies included with vRealize Operations Manager for your own environment. You can then apply your custom policy to groups of objects, such as the objects in a cluster, or virtual machines and hosts, or to a group that you create to include unique objects and specific criteria.
You must be familiar with the policies so that you can understand the data that appears in the user interface, because policies drive the results that appear in the vRealize Operations Manager dashboards, views, and reports.
vRealize Operations Manager Configuration Guide
VMware, Inc. 290
To determine how to customize operational policies and apply them to your environment, you must plan ahead. For example:
n Must you track CPU allocation? If you overallocate CPU, what percentage must you apply to your production and test objects?
n Will you overallocate memory or storage? If you use High Availability, what buffers must you use?
n How do you classify your logically defined workloads, such as production clusters, test or development clusters, and clusters used for batch workloads? Or, do you include all clusters in a single workload?
n How do you capture peak use times or spikes in system activity? In some cases, you might need to reduce alerts so that they are meaningful when you apply policies.
When you have privileges applied to your user account through the roles assigned, you can create and modify policies, and apply them to objects. For example:
n Create a policy from an existing base policy, inherit the base policy settings, then override specific settings to analyze and monitor your objects.
n Use policies to analyze and monitor vCenter Server objects and non-vCenter Server objects.
n Set custom thresholds for analysis settings on all object types to have vRealize Operations Manager report on workload, and so on.
n Enable specific attributes for collection, including metrics, properties, and super metrics.
n Enable or disable alert definitions and symptom definitions in your custom policy settings.
n Apply the custom policy to object groups.
When you use an existing policy to create a custom policy, you override the policy settings to meet your own needs. You set the allocation and demand, the overcommit ratios for CPU and memory, and the thresholds for capacity risk and buffers. To allocate and configure what your environment is actually using, you use the allocation model and the demand model together. Depending on the type of environment you monitor, such as a production environment versus a test or development environment, whether you over allocate at all and by how much depends on the workloads and environment to which the policy applies. You might be more conservative with the level of allocation in your test environment and less conservative in your production environment.
vRealize Operations Manager applies policies in priority order, as they appear on the Active Policies tab. When you establish the priority for your policies, vRealize Operations Manager applies the configured settings in the policies according to the policy rank order to analyze and report on your objects. To change the priority of a policy, you click and drag a policy row. The default policy is always kept at the bottom of the priority list, and the remaining list of active policies starts at priority 1, which indicates the highest priority policy. When you assign an object to be a member of multiple object groups, and you assign a different policy to each object group, vRealize Operations Manager associates the highest ranking policy with that object.
vRealize Operations Manager Configuration Guide
VMware, Inc. 291
Your policies are unique to your environment. Because policies direct vRealize Operations Manager to monitor the objects in your environment, they are read-only and do not alter the state of your objects. For this reason, you can override the policy settings to fine-tune them until vRealize Operations Manager displays the results that are meaningful and that affect for your environment. For example, you can adjust the capacity buffer settings in your policy, and then view the data that appears in the dashboards to see the effect of the policy settings.
Default Policy in vRealize Operations ManagerThe default policy is a set of rules that applies to the majority of your objects.
The Default policy appears on the Active Policies tab, and is marked with the letter D in the Priority column. The Default policy can apply to any number of objects.
The Default policy always appears at the bottom in the list of policies, even if that policy is not associated with an object group. When an object group does not have a policy applied, vRealize Operations Manager associates the Default policy with that group.
A policy can inherit the Default policy settings, and those settings can apply to various objects under several conditions.
The policy that is set to Default always takes the lowest priority. If you attempt to set two policies as the Default policy, the first policy that you set to Default is initially set to the lowest priority. When you set the second policy to Default, that policy then takes the lowest priority, and the earlier policy that you set to Default is set to the second lowest priority.
You can use the Default policy as the base policy to create your own custom policy. You modify the default policy settings to create a policy that meets your analysis and monitoring needs. When you start with the Default policy, your new policy inherits all of the settings from the Default base policy. You can then customize your new policy and override these settings.
The data adapters and solutions installed in vRealize Operations Manager provide a collective group of base settings that apply to all objects. In the policy navigation tree on the Policy Library tab, these settings are called Base Settings. The Default policy inherits all of the base settings by default.
Policies Provided with vRealize Operations ManagervRealize Operations Manager includes sets of policies that you can use to monitor your environment, or as the starting point to create your own policies.
Verify that you are familiar with the policies provided with vRealize Operations Manager so that you can use them in your own environment, and to include settings in new policies that you create.
Where You Find the Policies Provided with vRealize Operations Manager PoliciesIn the menu, click Administration, and then in the left pane click Policies. Click the Policy Library tab. To see the policies provided with vRealize Operations Manager, expand the Base Settings policy.
vRealize Operations Manager Configuration Guide
VMware, Inc. 292
Policies That vRealize Operations Manager IncludesAll policies exist under the Base Settings, because the data adapters and solutions installed in your vRealize Operations Manager instance provide a collective group of base settings that apply to all objects. In the policy navigation tree on the Policy Library tab, these settings are called Base Settings.
The Base Settings policy is the umbrella policy for all other policies, and appears at the top of the policy list in the policy library. All of the other policies reside under the Base Settings, because the data adapters and solutions installed in your vRealize Operations Manager instance provide a collective group of base settings that apply to all objects.
The Config Wizard Based Policy set includes policies provided with vRealize Operations Manager that you use for specific settings on objects to report on your objects. The Config Wizard Based Policy set includes several types of policies:
n Efficiency alerts policies for infrastructure objects and virtual machines
n Health alerts policies for infrastructure objects
n Overcommit policies for CPU and Memory
n Risk alerts policies for infrastructure objects and virtual machines
The Default Policy includes a set of rules that applies to the majority of your objects.
Using the Monitoring Policy Workspace to Create and Modify Operational PoliciesYou can use the workflow in the monitoring policy workspace to create local policies quickly, and update the settings in existing policies. Select a base policy to use as the source for your local policy settings, and modify the thresholds and settings used for analysis and collection of data from groups of objects in your environment. A policy that has no local settings defined inherits the settings from its base policy to apply to the associated object groups.
Prerequisites
Verify that objects groups exist for vRealize Operations Manager to analyze and collect data, and if they do not exist, create them. See Managing Custom Object Groups in VMware vRealize Operations Manager.
Procedure
1 In the menu, click Administration, and then in the left pane click Policies.
2 Click Policy Library, and click the Add New Policy icon to add a policy, or select the policy and click the Edit Selected Policy icon to edit an existing policy.
You can add and edit policies on the Policy Library tab, and remove certain policies. You can use the Base Settings policy or the Default Policy as the root policy for the settings in other policies that you create. You can set any policy to be the default policy.
vRealize Operations Manager Configuration Guide
VMware, Inc. 293
3 In the Getting Started workspace, assign a name and description to the policy.
Give the policy a meaningful name and description so that all users know the purpose of the policy.
4 Click Select Base Policies, and in the workspace, select one or more policies to use as a baseline to define the settings for your new local policy.
When you create a policy, you can use any of the policies provided with vRealize Operations Manager as a baseline source for your new policy settings.
5 Click Override Settings, and in the workspace, filter the object types to customize your policy for the objects to associate with this policy.
Filter the object types, and modify the settings for those object types so that vRealize Operations Manager collects and displays the data that you expect in the dashboards and views.
6 Click Override Attributes, and in the workspace, select the metric, property, or super metric attributes to include in your policy.
vRealize Operations Manager collects data from the objects in your environment based on the metric, property, or super metric attributes that you include in the policy.
7 Click Override Alert / Symptom Definitions, and in the workspace, enable or disable the alert definitions and symptom definitions for your policy.
vRealize Operations Manager identifies problems on objects in your environment and triggers alerts when conditions occur that qualify as problems.
8 Click Apply Policy to Groups, and in the workspace, select one or more groups to which the policy applies.
VMware vRealize Operations Manager monitors the objects according to the settings in the policy that is applied to the object group, triggers alerts when thresholds are violated, and reports the results in the dashboards, views, and reports. If you do not assign a policy to one or more object groups, VMware vRealize Operations Manager does not assign the settings in that policy to any objects, and the policy is not active. For an object group that dos not have a policy assigned, VMware vRealize Operations Manager associates the object group with the Default Policy.
9 Click Save to retain the settings defined for your local policy.
What to do next
After vRealize Operations Manager analyzes and collects data from the objects in your environment, review the data in the dashboards and views. If the data is not what you expected, edit your local policy to customize and override the settings until the dashboards display the data that you need.
Policy Workspace in vRealize Operations ManagerThe policy workspace allows you to quickly create and modify policies. To create a policy, you can inherit the settings from an existing policy, and you can modify the settings in existing policies if you have adequate permissions. After you create a policy, or edit an existing policy, you can apply the policy to one or more groups of objects.
vRealize Operations Manager Configuration Guide
VMware, Inc. 294
How the Policy Workspace WorksEvery policy includes a set of packages, and uses the defined problems, symptoms, metrics, and properties in those packages to apply to specific object groups in your environment. You can view details for the settings inherited from the base policy, and display specific settings for certain object types. You can override the settings of other policies, and include additional policy settings to apply to object types.
Use the Add and Edit options to create policies and edit existing policies.
Where You Create and Modify a PolicyTo create and modify policies, in the menu, click Administration, and then in the left pane click Policies. Click the Policy Library tab, and click the Add New Policy icon to add a policy or click the Edit Selected Policy icon to edit a policy. The policy workspace is where you select the base policies, and customize and override the settings for analysis, metrics, properties, alert definitions, and symptom definitions. In this workspace, you can apply the policy to object groups.
To remove a policy from the list, select the policy and click the red X.
Policy Workspace OptionsThe policy workspace includes a step-by-step workflow to create and edit a policy, and apply the policy to custom object groups.
n Getting Started Details
When you create a policy, you must give the policy a meaningful name and description so that users know the purpose of the policy.
n Select Base Policy Details
You can use any of the policies provided with vRealize Operations Manager as a baseline source for your policy settings when you create a new policy. In the policy content area, you can view the packages and elements for the base policy and additional policies that you selected to override the settings, and compare the differences in settings highlighted between these policies. You select the settings and objects types to display.
n Analysis Settings Details
You can filter the object types, and modify the settings for those object types so that vRealize Operations Manager applies these settings. The data that you expect then appears in the dashboards and views.
n Workload Automation Details
You can set the workload automation options for your policy, so that vRealize Operations Manager can optimize the workload in your environment per your definition.
n Collect Metrics and Properties Details
You can select the attribute type to include in your policy so that vRealize Operations Manager can collect data from the objects in your environment. Attribute types include metrics, properties, and super metrics. You enable or disable each metric, and determine whether to inherit the metrics from base policies that you selected in the workspace.
vRealize Operations Manager Configuration Guide
VMware, Inc. 295
n Alert and Symptom Definitions Details
You can enable or disable alert and symptom definitions to have vRealize Operations Manager identify problems on objects in your environment and trigger alerts when conditions occur that qualify as problems. You can automate alerts.
n Apply Policy to Groups Details
You can assign your local policy to one or more groups of objects to have VMware vRealize Operations Manager analyze those objects according to the settings in your policy, trigger alerts when the defined threshold levels are violated, and display the results in your dashboards, views, and reports.
Getting Started DetailsWhen you create a policy, you must give the policy a meaningful name and description so that users know the purpose of the policy.
Where You Assign the Policy Name and Description
To add a name and description to a policy, in the menu, click Administration, and then in the left pane click Policies. Click the Policy Library tab, and click the Add New Policy icon to add a policy or click the Edit Selected Policy icon to edit a policy. In the Add or Edit Monitoring policy workspace, on the left click Getting Started. The name and description appear in the workspace.
Table 4-4. Name and Description Options in the Add or Edit Monitoring Policy Workspace
Option Description
Name Name of the policy as it appears in the Add or Edit Monitoring Policy wizard, and in areas where the policy applies to objects, such as Custom Groups.
Description Meaningful description of the policy. For example, use the description to indicate which policy is inherited, and any specific information that users need to understand the relationship of the policy to one or more groups of objects.
Start with The base policy that will be used as a starting point. All settings from the base policy will be inherited as default settings in your new policy. You can override these settings to customize the new policy.
Select a base policy to inherit the base policy settings as a starting point for your new policy.
Select Base Policy DetailsYou can use any of the policies provided with vRealize Operations Manager as a baseline source for your policy settings when you create a new policy. In the policy content area, you can view the packages and elements for the base policy and additional policies that you selected to override the settings, and compare the differences in settings highlighted between these policies. You select the settings and objects types to display.
vRealize Operations Manager Configuration Guide
VMware, Inc. 296
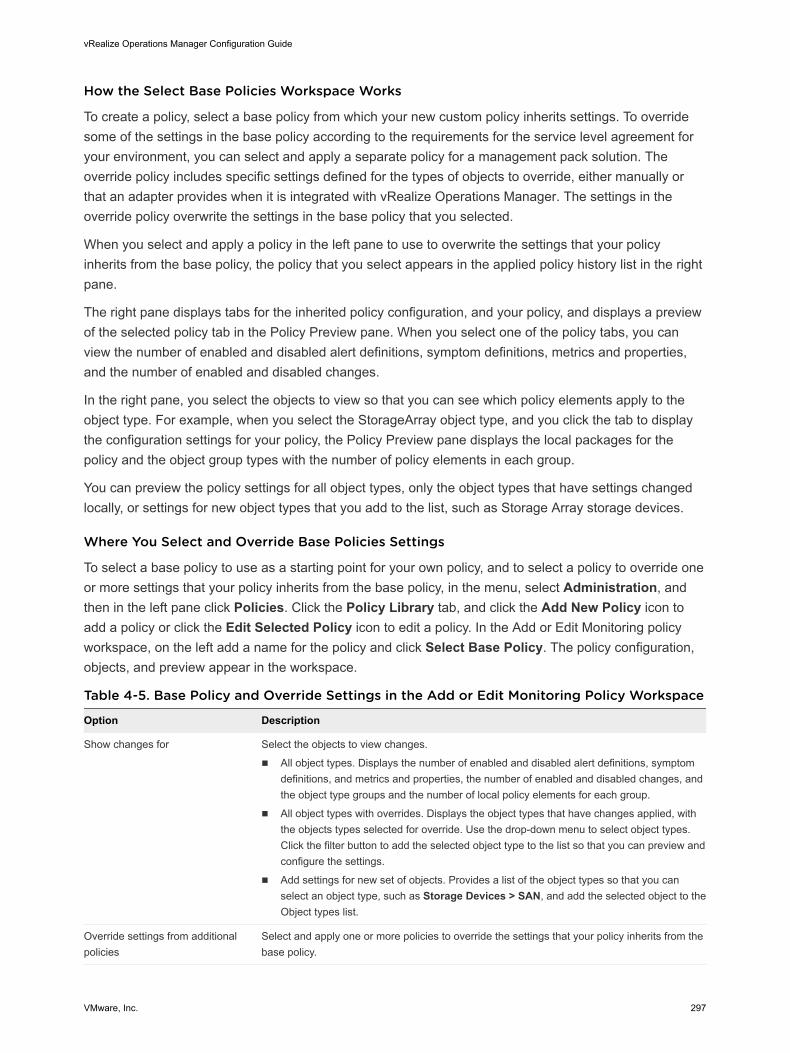
How the Select Base Policies Workspace Works
To create a policy, select a base policy from which your new custom policy inherits settings. To override some of the settings in the base policy according to the requirements for the service level agreement for your environment, you can select and apply a separate policy for a management pack solution. The override policy includes specific settings defined for the types of objects to override, either manually or that an adapter provides when it is integrated with vRealize Operations Manager. The settings in the override policy overwrite the settings in the base policy that you selected.
When you select and apply a policy in the left pane to use to overwrite the settings that your policy inherits from the base policy, the policy that you select appears in the applied policy history list in the right pane.
The right pane displays tabs for the inherited policy configuration, and your policy, and displays a preview of the selected policy tab in the Policy Preview pane. When you select one of the policy tabs, you can view the number of enabled and disabled alert definitions, symptom definitions, metrics and properties, and the number of enabled and disabled changes.
In the right pane, you select the objects to view so that you can see which policy elements apply to the object type. For example, when you select the StorageArray object type, and you click the tab to display the configuration settings for your policy, the Policy Preview pane displays the local packages for the policy and the object group types with the number of policy elements in each group.
You can preview the policy settings for all object types, only the object types that have settings changed locally, or settings for new object types that you add to the list, such as Storage Array storage devices.
Where You Select and Override Base Policies Settings
To select a base policy to use as a starting point for your own policy, and to select a policy to override one or more settings that your policy inherits from the base policy, in the menu, select Administration, and then in the left pane click Policies. Click the Policy Library tab, and click the Add New Policy icon to add a policy or click the Edit Selected Policy icon to edit a policy. In the Add or Edit Monitoring policy workspace, on the left add a name for the policy and click Select Base Policy. The policy configuration, objects, and preview appear in the workspace.
Table 4-5. Base Policy and Override Settings in the Add or Edit Monitoring Policy Workspace
Option Description
Show changes for Select the objects to view changes.
n All object types. Displays the number of enabled and disabled alert definitions, symptom definitions, and metrics and properties, the number of enabled and disabled changes, and the object type groups and the number of local policy elements for each group.
n All object types with overrides. Displays the object types that have changes applied, with the objects types selected for override. Use the drop-down menu to select object types. Click the filter button to add the selected object type to the list so that you can preview and configure the settings.
n Add settings for new set of objects. Provides a list of the object types so that you can select an object type, such as Storage Devices > SAN, and add the selected object to the Object types list.
Override settings from additional policies
Select and apply one or more policies to override the settings that your policy inherits from the base policy.
vRealize Operations Manager Configuration Guide
VMware, Inc. 297
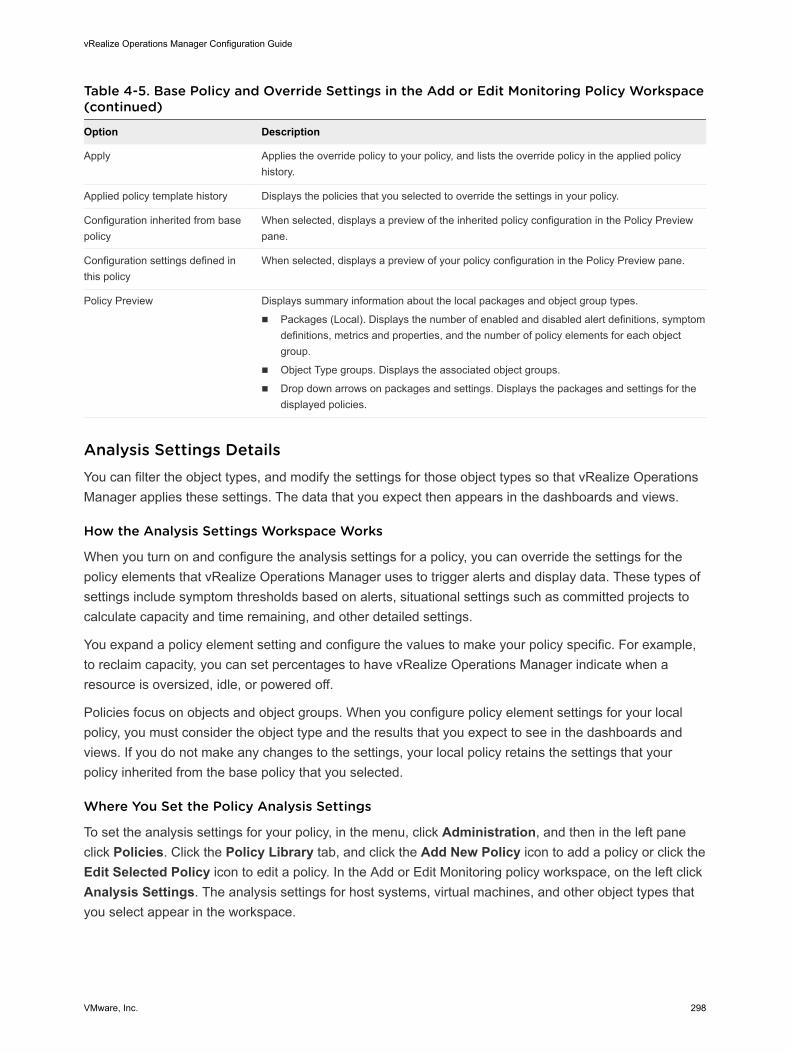
Table 4-5. Base Policy and Override Settings in the Add or Edit Monitoring Policy Workspace (continued)
Option Description
Apply Applies the override policy to your policy, and lists the override policy in the applied policy history.
Applied policy template history Displays the policies that you selected to override the settings in your policy.
Configuration inherited from base policy
When selected, displays a preview of the inherited policy configuration in the Policy Preview pane.
Configuration settings defined in this policy
When selected, displays a preview of your policy configuration in the Policy Preview pane.
Policy Preview Displays summary information about the local packages and object group types.
n Packages (Local). Displays the number of enabled and disabled alert definitions, symptom definitions, metrics and properties, and the number of policy elements for each object group.
n Object Type groups. Displays the associated object groups.
n Drop down arrows on packages and settings. Displays the packages and settings for the displayed policies.
Analysis Settings DetailsYou can filter the object types, and modify the settings for those object types so that vRealize Operations Manager applies these settings. The data that you expect then appears in the dashboards and views.
How the Analysis Settings Workspace Works
When you turn on and configure the analysis settings for a policy, you can override the settings for the policy elements that vRealize Operations Manager uses to trigger alerts and display data. These types of settings include symptom thresholds based on alerts, situational settings such as committed projects to calculate capacity and time remaining, and other detailed settings.
You expand a policy element setting and configure the values to make your policy specific. For example, to reclaim capacity, you can set percentages to have vRealize Operations Manager indicate when a resource is oversized, idle, or powered off.
Policies focus on objects and object groups. When you configure policy element settings for your local policy, you must consider the object type and the results that you expect to see in the dashboards and views. If you do not make any changes to the settings, your local policy retains the settings that your policy inherited from the base policy that you selected.
Where You Set the Policy Analysis Settings
To set the analysis settings for your policy, in the menu, click Administration, and then in the left pane click Policies. Click the Policy Library tab, and click the Add New Policy icon to add a policy or click the Edit Selected Policy icon to edit a policy. In the Add or Edit Monitoring policy workspace, on the left click Analysis Settings. The analysis settings for host systems, virtual machines, and other object types that you select appear in the workspace.
vRealize Operations Manager Configuration Guide
VMware, Inc. 298
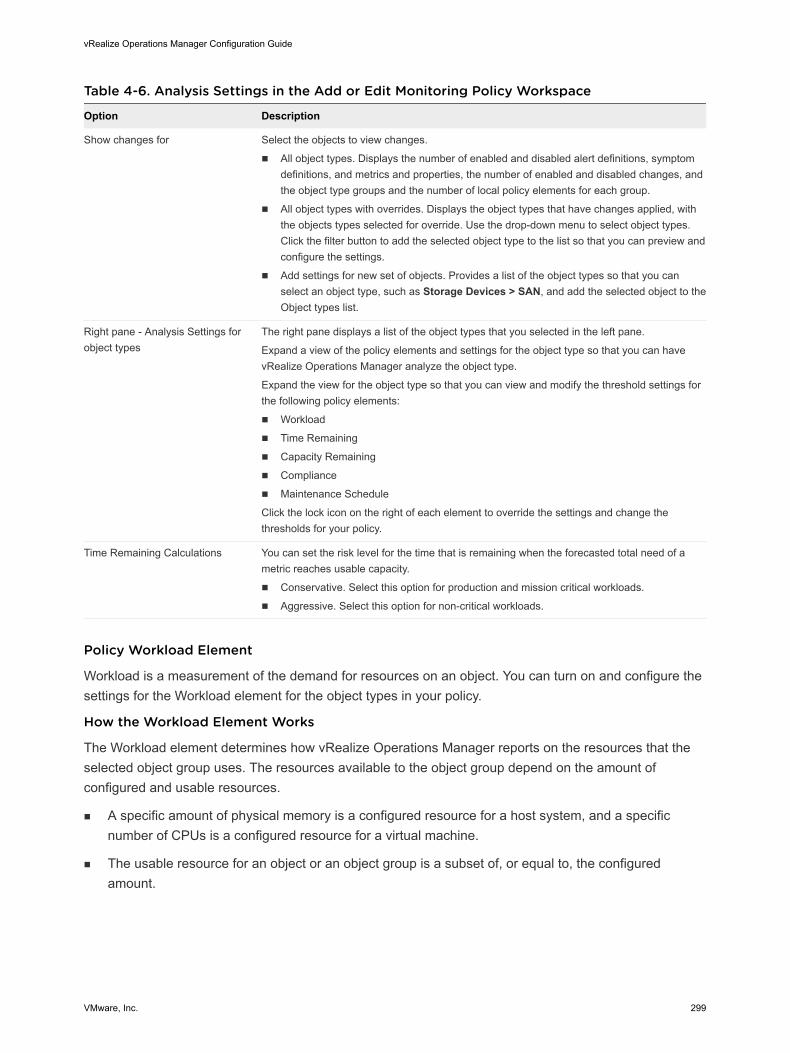
Table 4-6. Analysis Settings in the Add or Edit Monitoring Policy Workspace
Option Description
Show changes for Select the objects to view changes.
n All object types. Displays the number of enabled and disabled alert definitions, symptom definitions, and metrics and properties, the number of enabled and disabled changes, and the object type groups and the number of local policy elements for each group.
n All object types with overrides. Displays the object types that have changes applied, with the objects types selected for override. Use the drop-down menu to select object types. Click the filter button to add the selected object type to the list so that you can preview and configure the settings.
n Add settings for new set of objects. Provides a list of the object types so that you can select an object type, such as Storage Devices > SAN, and add the selected object to the Object types list.
Right pane - Analysis Settings for object types
The right pane displays a list of the object types that you selected in the left pane.
Expand a view of the policy elements and settings for the object type so that you can have vRealize Operations Manager analyze the object type.
Expand the view for the object type so that you can view and modify the threshold settings for the following policy elements:
n Workload
n Time Remaining
n Capacity Remaining
n Compliance
n Maintenance Schedule
Click the lock icon on the right of each element to override the settings and change the thresholds for your policy.
Time Remaining Calculations You can set the risk level for the time that is remaining when the forecasted total need of a metric reaches usable capacity.
n Conservative. Select this option for production and mission critical workloads.
n Aggressive. Select this option for non-critical workloads.
Policy Workload Element
Workload is a measurement of the demand for resources on an object. You can turn on and configure the settings for the Workload element for the object types in your policy.
How the Workload Element Works
The Workload element determines how vRealize Operations Manager reports on the resources that the selected object group uses. The resources available to the object group depend on the amount of configured and usable resources.
n A specific amount of physical memory is a configured resource for a host system, and a specific number of CPUs is a configured resource for a virtual machine.
n The usable resource for an object or an object group is a subset of, or equal to, the configured amount.
vRealize Operations Manager Configuration Guide
VMware, Inc. 299
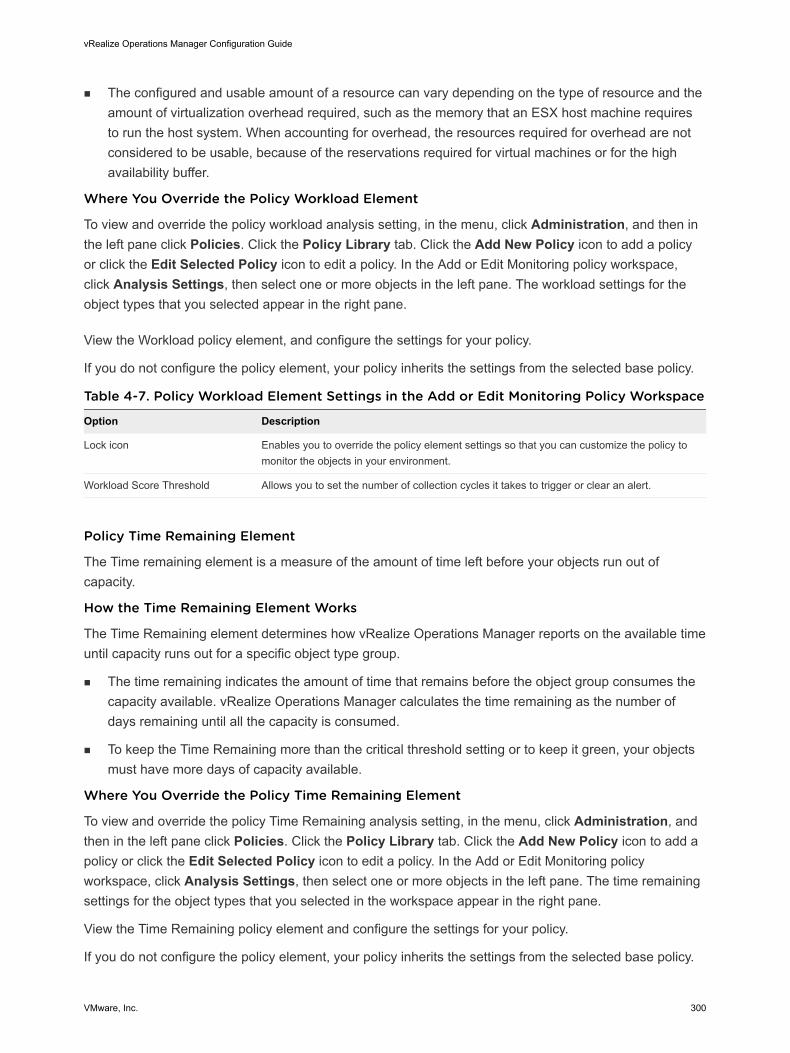
n The configured and usable amount of a resource can vary depending on the type of resource and the amount of virtualization overhead required, such as the memory that an ESX host machine requires to run the host system. When accounting for overhead, the resources required for overhead are not considered to be usable, because of the reservations required for virtual machines or for the high availability buffer.
Where You Override the Policy Workload Element
To view and override the policy workload analysis setting, in the menu, click Administration, and then in the left pane click Policies. Click the Policy Library tab. Click the Add New Policy icon to add a policy or click the Edit Selected Policy icon to edit a policy. In the Add or Edit Monitoring policy workspace, click Analysis Settings, then select one or more objects in the left pane. The workload settings for the object types that you selected appear in the right pane.
View the Workload policy element, and configure the settings for your policy.
If you do not configure the policy element, your policy inherits the settings from the selected base policy.
Table 4-7. Policy Workload Element Settings in the Add or Edit Monitoring Policy Workspace
Option Description
Lock icon Enables you to override the policy element settings so that you can customize the policy to monitor the objects in your environment.
Workload Score Threshold Allows you to set the number of collection cycles it takes to trigger or clear an alert.
Policy Time Remaining Element
The Time remaining element is a measure of the amount of time left before your objects run out of capacity.
How the Time Remaining Element Works
The Time Remaining element determines how vRealize Operations Manager reports on the available time until capacity runs out for a specific object type group.
n The time remaining indicates the amount of time that remains before the object group consumes the capacity available. vRealize Operations Manager calculates the time remaining as the number of days remaining until all the capacity is consumed.
n To keep the Time Remaining more than the critical threshold setting or to keep it green, your objects must have more days of capacity available.
Where You Override the Policy Time Remaining Element
To view and override the policy Time Remaining analysis setting, in the menu, click Administration, and then in the left pane click Policies. Click the Policy Library tab. Click the Add New Policy icon to add a policy or click the Edit Selected Policy icon to edit a policy. In the Add or Edit Monitoring policy workspace, click Analysis Settings, then select one or more objects in the left pane. The time remaining settings for the object types that you selected in the workspace appear in the right pane.
View the Time Remaining policy element and configure the settings for your policy.
If you do not configure the policy element, your policy inherits the settings from the selected base policy.
vRealize Operations Manager Configuration Guide
VMware, Inc. 300
Table 4-8. Policy Time Remaining Element Settings in the Add or Edit Monitoring Policy Workspace
Option Description
Lock icon Enables you to override the policy element settings so that you can customize the policy to monitor the objects in your environment.
Time Remaining Score Threshold Allows you to set the number of days until capacity is projected to run out based on your current consumption trend.
Policy Capacity Remaining Element
Capacity is a measurement of the amount of memory, CPU, and disk space for an object. You can turn on and configure the settings for the Capacity Remaining element for the object types in your policy.
How the Capacity Remaining Element Works
The Capacity Remaining element determines how vRealize Operations Manager reports on the available capacity until resources run out for a specific object type group.
n The capacity remaining indicates the capability of your environment to accommodate workload.
n Usable capacity is a measurement of the percentage of capacity available, minus the capacity affected when you use high availability.
Where You Override the Policy Capacity Remaining Element
To view and override the policy Capacity Remaining analysis setting, in the menu, click Administration, and then in the left pane click Policies. Click the Policy Library tab. Click the Add New Policy icon to add a policy or click the Edit Selected Policy icon to edit a policy. In the Add or Edit Monitoring policy workspace, click Analysis Settings, then select one or more objects in the left pane. The capacity remaining settings for the object types that you selected in the workspace appear in the right pane.
View the Capacity Remaining policy element and configure the settings for your policy.
If you do not configure the policy element, your policy inherits the settings from the selected base policy.
Table 4-9. Policy Capacity Remaining Element Settings in the Add or Edit Monitoring Policy Workspace
Option Description
Lock icon Enables you to override the policy element settings so that you can customize the policy to monitor the objects in your environment.
Capacity Remaining Score Threshold
Allows you to set the percentage at which the capacity remaining alerts must be triggered.
Policy Compliance Element
Compliance is a measurement that ensures that the objects in your environment meet industrial, governmental, regulatory, or internal standards. You can unlock and configure the settings for the Compliance element for the object types in your policy.
vRealize Operations Manager Configuration Guide
VMware, Inc. 301
Where You Override the Policy Compliance Element
To view and override the policy Compliance analysis setting, in the menu, click Administration, and then in the left pane click Policies. Click the Policy Library tab. Click the Add New Policy icon to add a policy or click the Edit Selected Policy icon to edit a policy. In the Add or Edit Monitoring policy workspace, click Analysis Settings, then select one or more objects in the left pane. The compliance settings for the object types that you selected appear in the right pane.
View the Compliance policy element and configure the settings for your policy.
If you do not configure the policy element, your policy inherits the settings from the selected base policy.
Table 4-10. Policy Compliance Element Settings in the Add or Edit Monitoring Policy Workspace
Option Description
Lock icon Enables you to override the policy element settings so that you can customize the policy to monitor the objects in your environment.
Compliance Score Threshold Allows you to set the compliance score threshold based on the number of violations against those standards.
Policy Maintenance Schedule Element
You can set a time to perform maintenance tasks for each policy.
Where You Override the Policy Maintenance Schedule Element
To view and override the policy Maintenance Schedule analysis setting, in the menu, click Administration, and then in the left pane, click Policies. Click the Policy Library tab. Click the Add New Policy icon to add a policy or click the Edit Selected Policy icon to edit a policy. In the Add or Edit Monitoring policy workspace, click Analysis Settings, then select one or more objects in the left pane. The maintenance schedule settings for the object types that you selected appear in the right pane.
View the maintenance schedule policy element.
If you do not configure the policy element, your policy inherits the settings from the selected base policy.
Table 4-11. Policy Maintenance Schedule Element Settings in the Add or Edit Monitoring Policy Workspace
Option Description
Lock icon Enables you to override the policy element settings so that you can customize the policy to monitor the objects in your environment.
Maintenance Schedule Sets a time to perform maintenance tasks. During maintenance, vRealize Operations Manager does not calculate analytics.
Policy Allocation Model Element
Allocation model defines how much CPU, memory, or disk space is allocated to objects in a cluster or datastore cluster. In the policy, you can turn on the Allocation Model element and configure the resource allocation for the objects.
vRealize Operations Manager Configuration Guide
VMware, Inc. 302
How the Allocation Model Element Works
The Allocation Model element determines how vRealize Operations Manager calculates capacity when you allocate a specific amount of CPU, memory, and disk space resource to clusters or data store clusters. You can specify the allocation ratio for either one, or all of the resource containers of the cluster. Unlike the demand model, the allocation model is used for capacity calculations only when you turn it on in the policy.
The allocation model element also affects the reclaimable resources for memory and storage in Reclaim page. When you turn on the Allocation Model element in the policy, the tabular representation of the VMs and snapshots in the selected data center from which resources can be reclaimed displays reclaimable memory and disk space based on the overcommit values.
Where You Override the Allocation Model Element
To view and override the policy workload analysis setting, in the menu, click Administration, and then in the left pane click Policies. Click the Policy Library tab. Click the Add New Policy icon to add a policy or click the Edit Selected Policy icon to edit a policy. In the Add or Edit Monitoring policy workspace, click Analysis Settings and click All object types. The analysis settings for the object types appear in the right pane.
Click the unlock icon next to Allocation Model to set the overcommit ratios.
Table 4-12. Policy Allocation Model Element Settings
Option Description
Set overcommit ratio, to enable Allocation Model
Allows you to set the overcommit ratio for CPU, memory, or disk space. Select the check box next to the resource container you want to edit and change the overcommit ratio value.
Policy Custom Profile Element
The custom profile element lets you apply a custom profile which shows how many more of a specified object can fit in your environment depending on the available capacity and object configuration.
Where You Define the Custom Profiles
To define a custom profile, in the menu click Administration, and then in the left pane click Configuration. Click Custom Profiles and click the Add icon to define a new custom profile.
Where You Select the Custom Profile Element
To view and override the policy Custom Profile analysis setting, in the menu, click Administration, and then in the left pane click Policies. Click the Policy Library tab. Click the Add New Policy icon to add a policy or click the Edit Selected Policy icon to edit a policy. In the Add or Edit Monitoring policy workspace, click Analysis Settings, select Cluster or Datastore Cluster in the left pane and click Show Object Type. The custom profile element for the object types that you selected in the workspace appear in the right pane. Click the lock icon to unlock the section and make changes.
Policy Capacity Buffer Element
The capacity buffer element lets you add buffer for capacity and cost calculation. For vCenter Server objects, you can add buffer to CPU, Memory, and Disk Space for the Demand and Allocation models. You can add capacity buffer to clusters and datastore clusters. The values that you define here affect the
vRealize Operations Manager Configuration Guide
VMware, Inc. 303
cluster cost calculation. The time remaining, capacity remaining, and recommended values are calculated based on the buffer. For WLP, capacity buffer is first considered and then the headroom that you have defined is considered.
Where You Define the Capacity Buffer
To view and override the policy Capacity Buffer analysis setting, in the menu, click Administration, and then in the left pane click Policies. Click the Policy Library tab. Click the Add New Policy icon to add a policy or click the Edit Selected Policy icon to edit a policy. In the Add or Edit Monitoring policy workspace, click Analysis Settings, select Cluster, Datastore, or Datastore Cluster in the left pane and click Show Object Type. The custom profile element for the object types that you selected in the workspace appear in the right pane. Click the lock icon to unlock the section and make changes.
How the Capacity Buffer Element Works
The Capacity Buffer element determines how much extra headroom you have and ensures that you have extra space for growth inside the cluster when required. The value of the usable capacity reduces by the buffer amount that you specify here. The default buffer value is zero. If you are upgrading from a previous version of vRealize Operations Manager, the buffer values are carried forward to the new version.
The capacity buffer value that you specify for the Allocation model is considered only if you have enabled allocation model in the policy.
The following tables display the capacity buffer that you can define based on the vCenter Server object types:
Object Type Valid Models for Capacity Buffer
Clusters Demand
Allocation
Datastore Clusters Usage
Allocation
Workload Automation DetailsYou can set the workload automation options for your policy, so that vRealize Operations Manager can optimize the workload in your environment per your definition.
How the Workload Automation Workspace Works
You click the lock icon to unlock and configure the workload automation options specific for your policy. When you click the lock icon to lock the option, your policy inherits the parent policy settings.
Where You Set the Policy Workload Automation
To set the workload automation for your policy, in the menu, click Administration, and then in the left pane click Policies. Click the Policy Library tab, and click the Add New Policy icon to add a policy or click the Edit Selected Policy icon to edit a policy. In the Add or Edit Monitoring policy workspace, on the left click Workload Automation.
vRealize Operations Manager Configuration Guide
VMware, Inc. 304
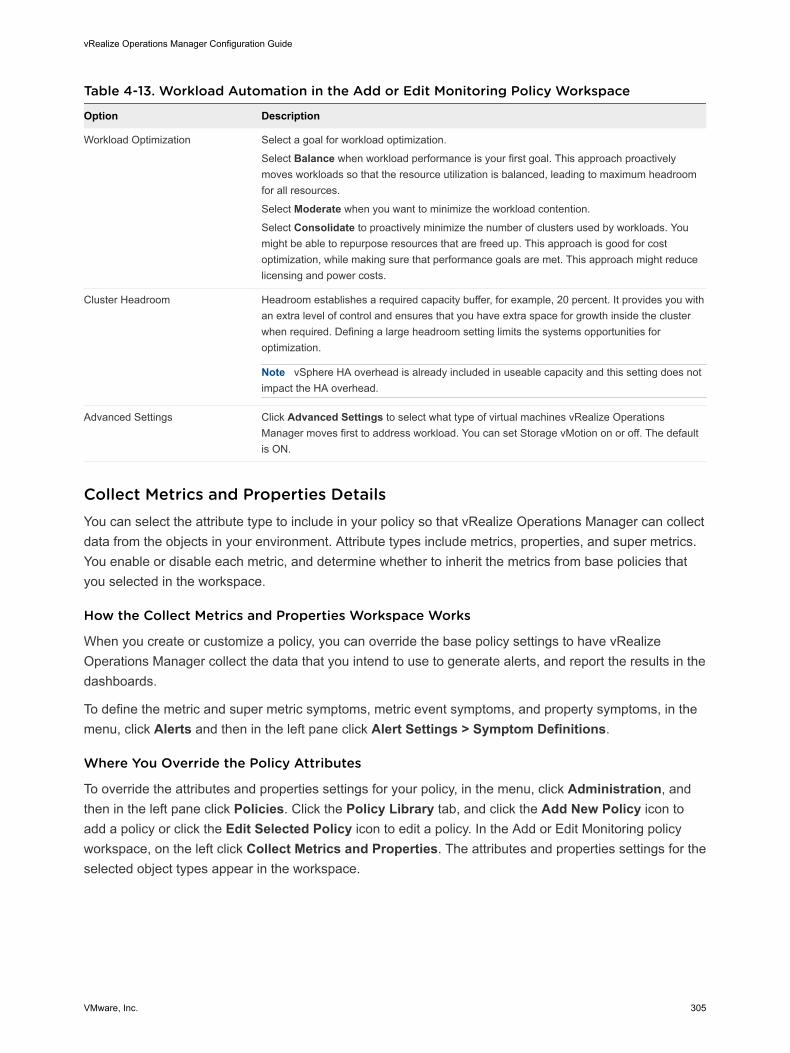
Table 4-13. Workload Automation in the Add or Edit Monitoring Policy Workspace
Option Description
Workload Optimization Select a goal for workload optimization.
Select Balance when workload performance is your first goal. This approach proactively moves workloads so that the resource utilization is balanced, leading to maximum headroom for all resources.
Select Moderate when you want to minimize the workload contention.
Select Consolidate to proactively minimize the number of clusters used by workloads. You might be able to repurpose resources that are freed up. This approach is good for cost optimization, while making sure that performance goals are met. This approach might reduce licensing and power costs.
Cluster Headroom Headroom establishes a required capacity buffer, for example, 20 percent. It provides you with an extra level of control and ensures that you have extra space for growth inside the cluster when required. Defining a large headroom setting limits the systems opportunities for optimization.
Note vSphere HA overhead is already included in useable capacity and this setting does not impact the HA overhead.
Advanced Settings Click Advanced Settings to select what type of virtual machines vRealize Operations Manager moves first to address workload. You can set Storage vMotion on or off. The default is ON.
Collect Metrics and Properties DetailsYou can select the attribute type to include in your policy so that vRealize Operations Manager can collect data from the objects in your environment. Attribute types include metrics, properties, and super metrics. You enable or disable each metric, and determine whether to inherit the metrics from base policies that you selected in the workspace.
How the Collect Metrics and Properties Workspace Works
When you create or customize a policy, you can override the base policy settings to have vRealize Operations Manager collect the data that you intend to use to generate alerts, and report the results in the dashboards.
To define the metric and super metric symptoms, metric event symptoms, and property symptoms, in the menu, click Alerts and then in the left pane click Alert Settings > Symptom Definitions.
Where You Override the Policy Attributes
To override the attributes and properties settings for your policy, in the menu, click Administration, and then in the left pane click Policies. Click the Policy Library tab, and click the Add New Policy icon to add a policy or click the Edit Selected Policy icon to edit a policy. In the Add or Edit Monitoring policy workspace, on the left click Collect Metrics and Properties. The attributes and properties settings for the selected object types appear in the workspace.
vRealize Operations Manager Configuration Guide
VMware, Inc. 305
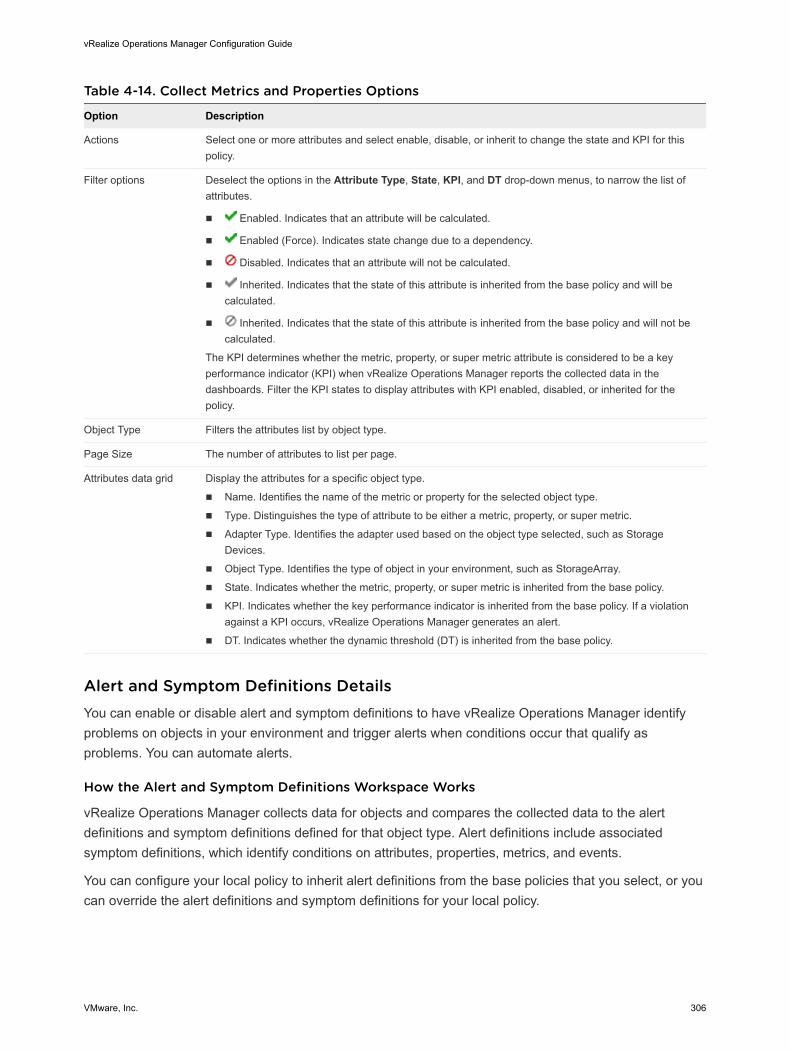
Table 4-14. Collect Metrics and Properties Options
Option Description
Actions Select one or more attributes and select enable, disable, or inherit to change the state and KPI for this policy.
Filter options Deselect the options in the Attribute Type, State, KPI, and DT drop-down menus, to narrow the list of attributes.
n Enabled. Indicates that an attribute will be calculated.
n Enabled (Force). Indicates state change due to a dependency.
n Disabled. Indicates that an attribute will not be calculated.
n Inherited. Indicates that the state of this attribute is inherited from the base policy and will be calculated.
n Inherited. Indicates that the state of this attribute is inherited from the base policy and will not be calculated.
The KPI determines whether the metric, property, or super metric attribute is considered to be a key performance indicator (KPI) when vRealize Operations Manager reports the collected data in the dashboards. Filter the KPI states to display attributes with KPI enabled, disabled, or inherited for the policy.
Object Type Filters the attributes list by object type.
Page Size The number of attributes to list per page.
Attributes data grid Display the attributes for a specific object type.
n Name. Identifies the name of the metric or property for the selected object type.
n Type. Distinguishes the type of attribute to be either a metric, property, or super metric.
n Adapter Type. Identifies the adapter used based on the object type selected, such as Storage Devices.
n Object Type. Identifies the type of object in your environment, such as StorageArray.
n State. Indicates whether the metric, property, or super metric is inherited from the base policy.
n KPI. Indicates whether the key performance indicator is inherited from the base policy. If a violation against a KPI occurs, vRealize Operations Manager generates an alert.
n DT. Indicates whether the dynamic threshold (DT) is inherited from the base policy.
Alert and Symptom Definitions DetailsYou can enable or disable alert and symptom definitions to have vRealize Operations Manager identify problems on objects in your environment and trigger alerts when conditions occur that qualify as problems. You can automate alerts.
How the Alert and Symptom Definitions Workspace Works
vRealize Operations Manager collects data for objects and compares the collected data to the alert definitions and symptom definitions defined for that object type. Alert definitions include associated symptom definitions, which identify conditions on attributes, properties, metrics, and events.
You can configure your local policy to inherit alert definitions from the base policies that you select, or you can override the alert definitions and symptom definitions for your local policy.
vRealize Operations Manager Configuration Guide
VMware, Inc. 306
Before you add or override the alert definitions and symptom definitions for a policy, familiarize yourself on the available alerts and symptoms.
n To view the available alert definitions, in the menu, click Alerts and then in the left pane click Alert Settings > Alert Definitions.
n To view the available symptom definitions, in the menu, click Alerts and then in the left pane click Alert Settings > Symptom Definitions. Symptom definitions are available for metrics, properties, messages, faults, smart early warnings, and external events.
A summary of the number of problem and symptoms that are enabled and disabled, and the difference in changes of the problem and symptoms as compared to the base policy, appear in the Analysis Settings pane of the policies workspace.
Where You Override the Alert Definitions and Symptom Definitions
To override the alert definitions and symptom definitions for your policy, in the menu, click Administration, and then in the left pane click Policies. Click the Policy Library tab, and click the Add New Policy icon to add a policy or click the Edit Selected Policy icon to edit a policy. In the Add or Edit Monitoring policy workspace, on the left click Alert / Symptom Definitions. The definitions appear in the workspace.
Policy Alert Definitions and Symptom Definitions
You can override the alert definitions and symptom definitions for each policy.
n Policy Alert Definitions
Each policy includes alert definitions. Each alert uses a combination of symptoms and recommendations to identify a condition that classifies as a problem, such as failures or high stress. You can enable or disable the alert definitions in your policy, and you can set actions to be automated when an alert triggers.
n Policy Symptom Definitions
Each policy includes a package of symptom definitions. Each symptom represents a distinct test condition on a property, metric, or event. You can enable or disable the symptom definitions in your policy.
Policy Alert Definitions
Each policy includes alert definitions. Each alert uses a combination of symptoms and recommendations to identify a condition that classifies as a problem, such as failures or high stress. You can enable or disable the alert definitions in your policy, and you can set actions to be automated when an alert triggers.
How the Policy Alert Definitions Work
vRealize Operations Manager uses problems to trigger alerts. A problem manifests when a set of symptoms exists for an object, and requires you to take action on the problem. Alerts indicate problems in your environment. vRealize Operations Manager generates alerts when the collected data for an object is compared to alert definitions for that object type and the defined symptoms are true. When an alert occurs, vRealize Operations Manager presents the triggering symptoms for you to take action.
vRealize Operations Manager Configuration Guide
VMware, Inc. 307
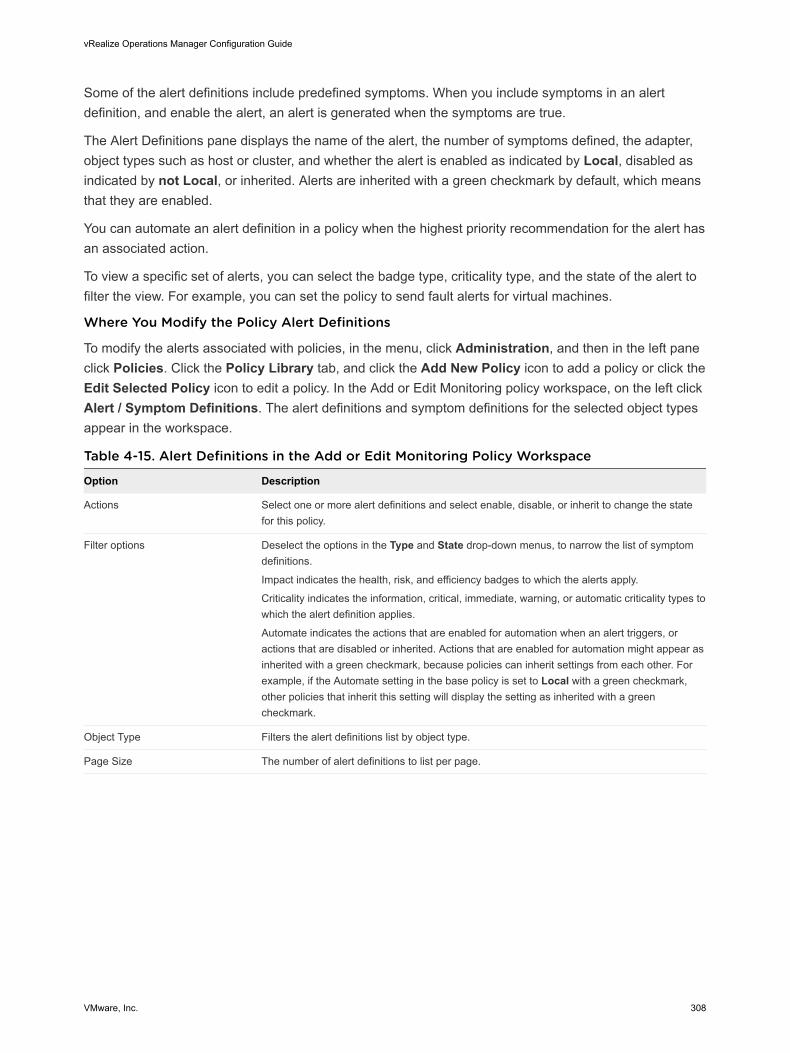
Some of the alert definitions include predefined symptoms. When you include symptoms in an alert definition, and enable the alert, an alert is generated when the symptoms are true.
The Alert Definitions pane displays the name of the alert, the number of symptoms defined, the adapter, object types such as host or cluster, and whether the alert is enabled as indicated by Local, disabled as indicated by not Local, or inherited. Alerts are inherited with a green checkmark by default, which means that they are enabled.
You can automate an alert definition in a policy when the highest priority recommendation for the alert has an associated action.
To view a specific set of alerts, you can select the badge type, criticality type, and the state of the alert to filter the view. For example, you can set the policy to send fault alerts for virtual machines.
Where You Modify the Policy Alert Definitions
To modify the alerts associated with policies, in the menu, click Administration, and then in the left pane click Policies. Click the Policy Library tab, and click the Add New Policy icon to add a policy or click the Edit Selected Policy icon to edit a policy. In the Add or Edit Monitoring policy workspace, on the left click Alert / Symptom Definitions. The alert definitions and symptom definitions for the selected object types appear in the workspace.
Table 4-15. Alert Definitions in the Add or Edit Monitoring Policy Workspace
Option Description
Actions Select one or more alert definitions and select enable, disable, or inherit to change the state for this policy.
Filter options Deselect the options in the Type and State drop-down menus, to narrow the list of symptom definitions.
Impact indicates the health, risk, and efficiency badges to which the alerts apply.
Criticality indicates the information, critical, immediate, warning, or automatic criticality types to which the alert definition applies.
Automate indicates the actions that are enabled for automation when an alert triggers, or actions that are disabled or inherited. Actions that are enabled for automation might appear as inherited with a green checkmark, because policies can inherit settings from each other. For example, if the Automate setting in the base policy is set to Local with a green checkmark, other policies that inherit this setting will display the setting as inherited with a green checkmark.
Object Type Filters the alert definitions list by object type.
Page Size The number of alert definitions to list per page.
vRealize Operations Manager Configuration Guide
VMware, Inc. 308
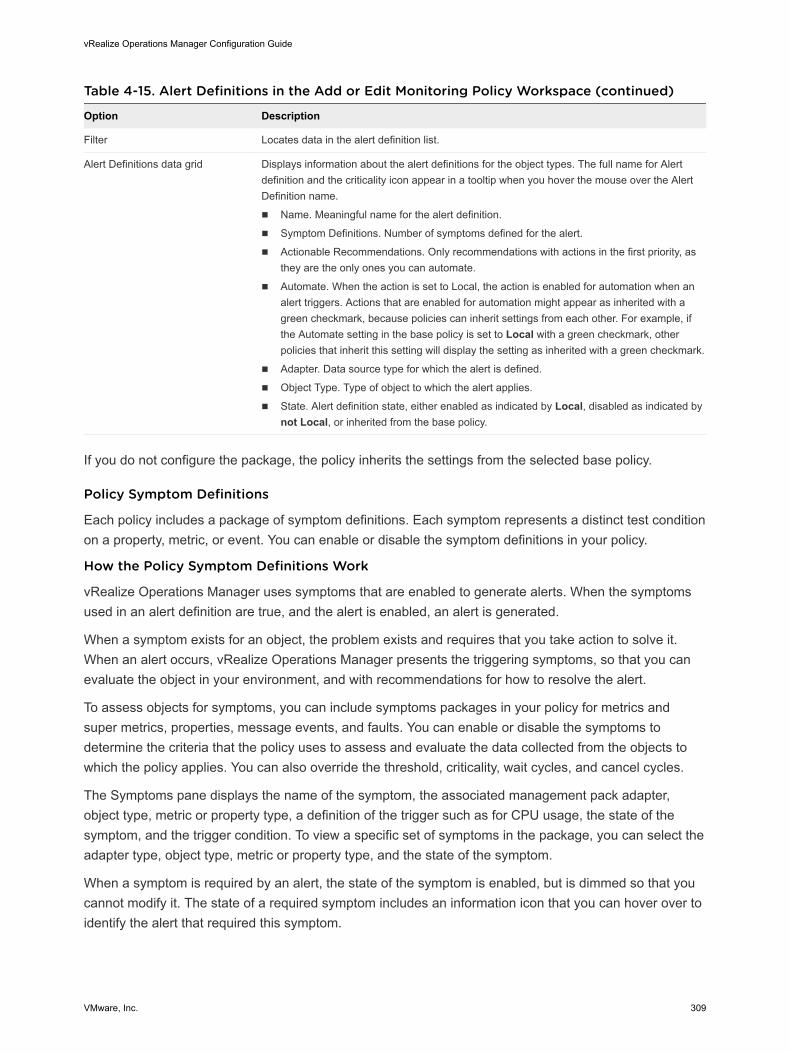
Table 4-15. Alert Definitions in the Add or Edit Monitoring Policy Workspace (continued)
Option Description
Filter Locates data in the alert definition list.
Alert Definitions data grid Displays information about the alert definitions for the object types. The full name for Alert definition and the criticality icon appear in a tooltip when you hover the mouse over the Alert Definition name.
n Name. Meaningful name for the alert definition.
n Symptom Definitions. Number of symptoms defined for the alert.
n Actionable Recommendations. Only recommendations with actions in the first priority, as they are the only ones you can automate.
n Automate. When the action is set to Local, the action is enabled for automation when an alert triggers. Actions that are enabled for automation might appear as inherited with a green checkmark, because policies can inherit settings from each other. For example, if the Automate setting in the base policy is set to Local with a green checkmark, other policies that inherit this setting will display the setting as inherited with a green checkmark.
n Adapter. Data source type for which the alert is defined.
n Object Type. Type of object to which the alert applies.
n State. Alert definition state, either enabled as indicated by Local, disabled as indicated by not Local, or inherited from the base policy.
If you do not configure the package, the policy inherits the settings from the selected base policy.
Policy Symptom Definitions
Each policy includes a package of symptom definitions. Each symptom represents a distinct test condition on a property, metric, or event. You can enable or disable the symptom definitions in your policy.
How the Policy Symptom Definitions Work
vRealize Operations Manager uses symptoms that are enabled to generate alerts. When the symptoms used in an alert definition are true, and the alert is enabled, an alert is generated.
When a symptom exists for an object, the problem exists and requires that you take action to solve it. When an alert occurs, vRealize Operations Manager presents the triggering symptoms, so that you can evaluate the object in your environment, and with recommendations for how to resolve the alert.
To assess objects for symptoms, you can include symptoms packages in your policy for metrics and super metrics, properties, message events, and faults. You can enable or disable the symptoms to determine the criteria that the policy uses to assess and evaluate the data collected from the objects to which the policy applies. You can also override the threshold, criticality, wait cycles, and cancel cycles.
The Symptoms pane displays the name of the symptom, the associated management pack adapter, object type, metric or property type, a definition of the trigger such as for CPU usage, the state of the symptom, and the trigger condition. To view a specific set of symptoms in the package, you can select the adapter type, object type, metric or property type, and the state of the symptom.
When a symptom is required by an alert, the state of the symptom is enabled, but is dimmed so that you cannot modify it. The state of a required symptom includes an information icon that you can hover over to identify the alert that required this symptom.
vRealize Operations Manager Configuration Guide
VMware, Inc. 309
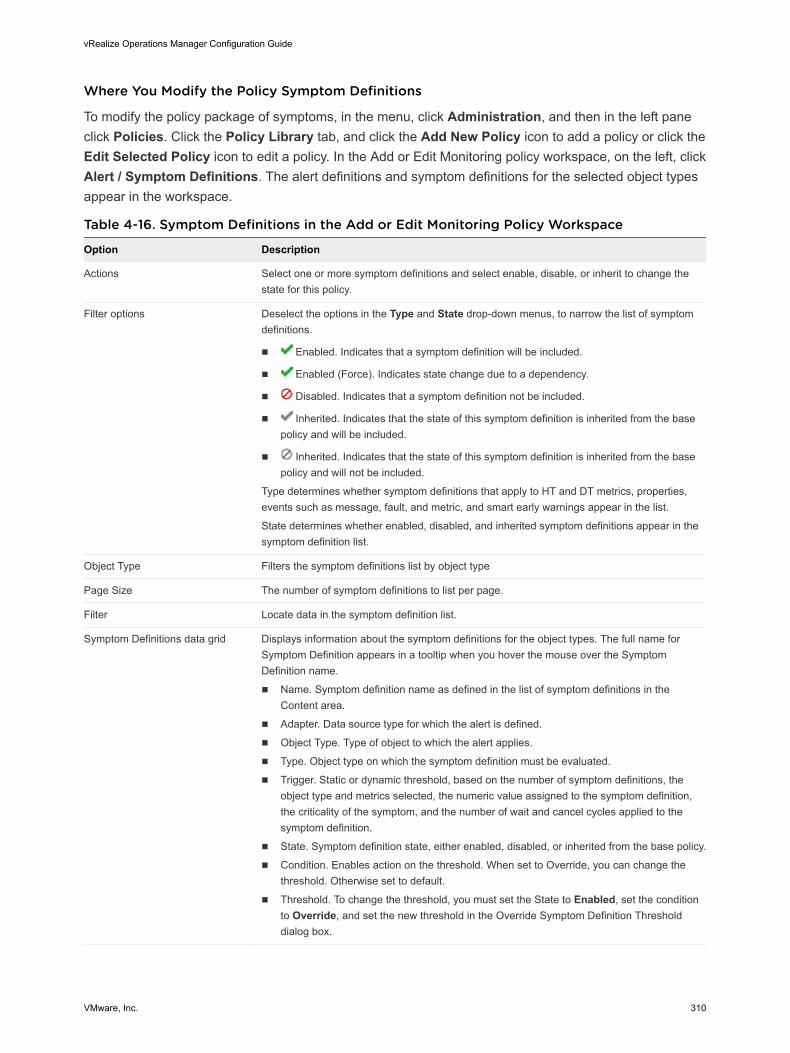
Where You Modify the Policy Symptom Definitions
To modify the policy package of symptoms, in the menu, click Administration, and then in the left pane click Policies. Click the Policy Library tab, and click the Add New Policy icon to add a policy or click the Edit Selected Policy icon to edit a policy. In the Add or Edit Monitoring policy workspace, on the left, click Alert / Symptom Definitions. The alert definitions and symptom definitions for the selected object types appear in the workspace.
Table 4-16. Symptom Definitions in the Add or Edit Monitoring Policy Workspace
Option Description
Actions Select one or more symptom definitions and select enable, disable, or inherit to change the state for this policy.
Filter options Deselect the options in the Type and State drop-down menus, to narrow the list of symptom definitions.
n Enabled. Indicates that a symptom definition will be included.
n Enabled (Force). Indicates state change due to a dependency.
n Disabled. Indicates that a symptom definition not be included.
n Inherited. Indicates that the state of this symptom definition is inherited from the base policy and will be included.
n Inherited. Indicates that the state of this symptom definition is inherited from the base policy and will not be included.
Type determines whether symptom definitions that apply to HT and DT metrics, properties, events such as message, fault, and metric, and smart early warnings appear in the list.
State determines whether enabled, disabled, and inherited symptom definitions appear in the symptom definition list.
Object Type Filters the symptom definitions list by object type
Page Size The number of symptom definitions to list per page.
Filter Locate data in the symptom definition list.
Symptom Definitions data grid Displays information about the symptom definitions for the object types. The full name for Symptom Definition appears in a tooltip when you hover the mouse over the Symptom Definition name.
n Name. Symptom definition name as defined in the list of symptom definitions in the Content area.
n Adapter. Data source type for which the alert is defined.
n Object Type. Type of object to which the alert applies.
n Type. Object type on which the symptom definition must be evaluated.
n Trigger. Static or dynamic threshold, based on the number of symptom definitions, the object type and metrics selected, the numeric value assigned to the symptom definition, the criticality of the symptom, and the number of wait and cancel cycles applied to the symptom definition.
n State. Symptom definition state, either enabled, disabled, or inherited from the base policy.
n Condition. Enables action on the threshold. When set to Override, you can change the threshold. Otherwise set to default.
n Threshold. To change the threshold, you must set the State to Enabled, set the condition to Override, and set the new threshold in the Override Symptom Definition Threshold dialog box.
vRealize Operations Manager Configuration Guide
VMware, Inc. 310
If you do not configure the package, the policy inherits the settings from the selected base policy.
Apply Policy to Groups DetailsYou can assign your local policy to one or more groups of objects to have VMware vRealize Operations Manager analyze those objects according to the settings in your policy, trigger alerts when the defined threshold levels are violated, and display the results in your dashboards, views, and reports.
How the Apply Policy to Groups Workspace Works
When you create a policy, or modify the settings in an existing policy, you apply the policy to one or more object groups. VMware vRealize Operations Manager uses the settings in the policy to analyze and collect data from the associated objects, and displays the data in dashboards, views, and reports.
Where You Apply a Policy to Groups
To apply the policy to object groups, in the menu, click Administration, and then in the left pane click Policies. Click the Policy Library tab, and click the Add New Policy icon to add a policy or click the Edit Selected Policy icon to edit a policy. In the Add or Edit Monitoring policy workspace, on the left click Apply Policy to Groups.
Apply Policy to Groups Options
To apply the policy to groups of objects, select the check box for the object group in the workspace.
You can then view the details about each object group associated with the policy. In the menu, click Administration, and then in the left pane click Policies. Click Active Policies > Related Objects. Click an object group in the list of groups, and view the summary in the Details pane.
For more information about how to create an object group, see the topic called Custom Object Groups Workspace to Create a New Group.
For more information about how to create a policy, see Policy Workspace in vRealize Operations Manager.
vRealize Operations Manager Configuration Guide
VMware, Inc. 311
Configuring Compliance 5You can set compliance on your objects to meet the defined standards and determine the compliance of your objects against the configuration standards.
This chapter includes the following topics:
n What Are Compliance Benchmarks
n How To Configure Compliance Benchmarks
What Are Compliance BenchmarksCompliance benchmarks display score cards that help you proactively detect compliance problems in vRealize Operations Manager. The compliance benchmarks are measured against a set of standard rules, regulatory best practices, or custom alert definitions.
How Compliance Benchmarks WorkAll the compliance standards in vRealize Operations Manager, including any standards that you define, are based on alert definitions. Only alert definitions of the Compliance subtype are counted. Custom score cards can monitor user-defined alerts.
In previous releases of vRealize Operations Manager, you had to modify the current default policy to monitor compliance against a set of standard rules, regulatory best practices, or custom alert definitions. In the current release, you can manage all compliance related tasks from the Home > Troubleshoot > Compliance page. When you configure a benchmark, you select an applicable policy. vRealize Operations Manager then enables the appropriate alert definitions in the policy to measure compliance.
The compliance assessment is based on the environment where your objects are deployed. You can monitor objects that are deployed in your VMware Self-Managed Cloud (SDDC) environment, including DC and Edge environments, and your VMware Managed Cloud (VMC SDDC) environment. Compliance benchmarks on VMC SDDC are applicable only on client VMs that you have deployed in the VMware Managed Cloud environment.
VMware, Inc. 312

vRealize Operations Manager Compliance Benchmark Types
VMware SDDC Benchmarks
Displays score cards based on alerts which are measured against the latest hardening guides:
n vSphere Security Configuration Guide
n vSAN Security Configuration Guide
n NSX Security Configuration Guide
Displays benchmarks for and in the SDDC and VMC SDDC tabs.
Note vSphere 6.7 Update 1 Security Configuration Guide no longer contains risk profiles. For more information, see blogs.vmware.com.
Custom Benchmarks Dislays benchmarks that you define. Use compliance alerts from vSphere and regulatory management packs, or define your own alerts to monitor. You can define up to five custom score cards. You can import custom score cards from other instances of vRealize Operations Manager.
Regulatory Benchmarks
Displays benchmarks for industry standard regulatory compliance requirements. You can install management packs for the following regulatory standards:
n Health Insurance Portability and Accountability Act (HIPAA)
n Payment Card Industry Data Security Standard (PCI DSS) compliance standards
n CIS Security Standards
n Defense Information Systems Agency (DISA) Security Standards
n The Federal Information Security Management Act (FISMA) Security Standards
n International Organization for Standardization (ISO) Security Standards
Compliance Score CardsThe compliance page in vRealize Operations Manager displays score cards for each type of benchmark. A score card is a compliance visualization term.
What is a Compliance Score CardScore cards in the Compliance landing page display the number of non-compliant objects, and the total number of objects affected by each hardening guide as well as the compliance score which is counted as the ratio of compliant objects to total number of objects assessed by the given benchmark, represented in percentage. In addition, you can see the breakdown of the total number of objects that are compliant and non-compliant. You can click on a score card to see more details, including alerts that were triggered based on the compliance standards.
vRealize Operations Manager Configuration Guide
VMware, Inc. 313
The compliance score card of an object is counted as the smallest rounded off integer (100*(total number of symptoms triggered on an object/total number of symptoms)).
The compliance score for the object is based on the most critical of the violated standards. The score card displays 100 when all objects are compliant. When an object is non-compliant, the number of non-compliant symptoms are displayed in red and the total number of symptoms in grey.
Where You Find Compliance Score CardsYou can view score cards for each of the different types of benchmarks in the Home > Troubleshoot > Compliance page.
You can view score cards for objects in the Environment > Object > Compliance tab.
Compliance Page In the Home > Troubleshoot > Compliance summary page, vRealize Operations Manager monitors compliance for SDDC and VMC SDDC objects. You can switch between the tabs to view the benchmarks for your on-premise deployment and cloud environments.
In each of these tabs, vRealize Operations Manager displays compliance score cards in the following sections:
n VMware SDDC Benchmarks
n Custom Benchmarks
n Regulatory Benchmarks
Compliance Tab In the Environment > Object > Compliance tab, vRealize Operations Manager displays score cards for the benchmarks that include the current objects in their calculations, based on the alert definitions and policies associated with that benchmark. The score cards display the total number of rules and the number non-compliant (violated) rules based on symptoms for each hardening guide.
Score Cards in the Compliance PageIn the Home > Troubleshoot > Compliance page, you can view scores for benchmarks that you have enabled. Click a score card to view more information.
vRealize Operations Manager Configuration Guide
VMware, Inc. 314
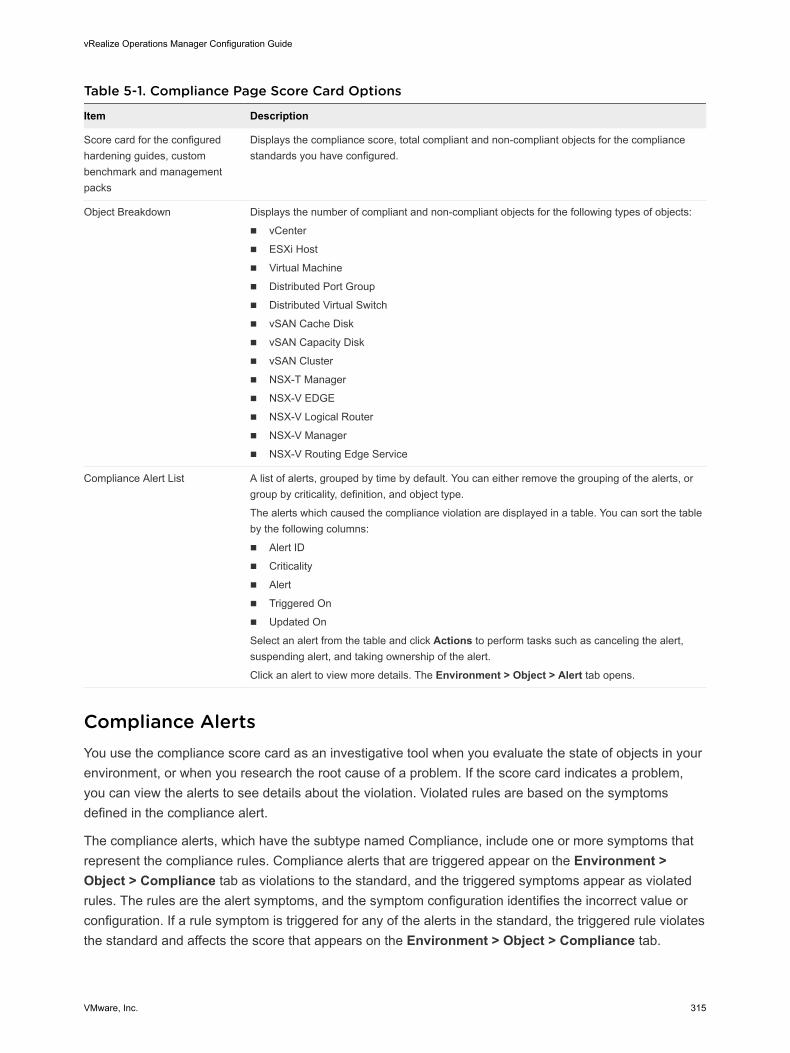
Table 5-1. Compliance Page Score Card Options
Item Description
Score card for the configured hardening guides, custom benchmark and management packs
Displays the compliance score, total compliant and non-compliant objects for the compliance standards you have configured.
Object Breakdown Displays the number of compliant and non-compliant objects for the following types of objects:
n vCenter
n ESXi Host
n Virtual Machine
n Distributed Port Group
n Distributed Virtual Switch
n vSAN Cache Disk
n vSAN Capacity Disk
n vSAN Cluster
n NSX-T Manager
n NSX-V EDGE
n NSX-V Logical Router
n NSX-V Manager
n NSX-V Routing Edge Service
Compliance Alert List A list of alerts, grouped by time by default. You can either remove the grouping of the alerts, or group by criticality, definition, and object type.
The alerts which caused the compliance violation are displayed in a table. You can sort the table by the following columns:
n Alert ID
n Criticality
n Alert
n Triggered On
n Updated On
Select an alert from the table and click Actions to perform tasks such as canceling the alert, suspending alert, and taking ownership of the alert.
Click an alert to view more details. The Environment > Object > Alert tab opens.
Compliance AlertsYou use the compliance score card as an investigative tool when you evaluate the state of objects in your environment, or when you research the root cause of a problem. If the score card indicates a problem, you can view the alerts to see details about the violation. Violated rules are based on the symptoms defined in the compliance alert.
The compliance alerts, which have the subtype named Compliance, include one or more symptoms that represent the compliance rules. Compliance alerts that are triggered appear on the Environment > Object > Compliance tab as violations to the standard, and the triggered symptoms appear as violated rules. The rules are the alert symptoms, and the symptom configuration identifies the incorrect value or configuration. If a rule symptom is triggered for any of the alerts in the standard, the triggered rule violates the standard and affects the score that appears on the Environment > Object > Compliance tab.
vRealize Operations Manager Configuration Guide
VMware, Inc. 315
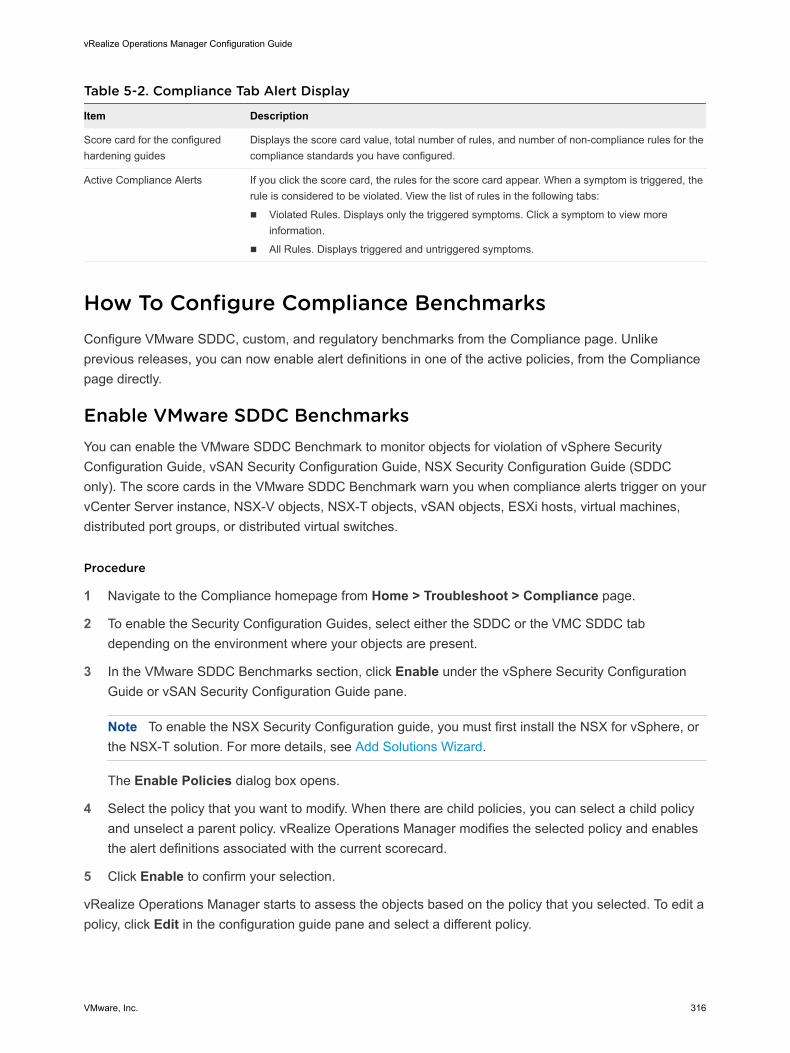
Table 5-2. Compliance Tab Alert Display
Item Description
Score card for the configured hardening guides
Displays the score card value, total number of rules, and number of non-compliance rules for the compliance standards you have configured.
Active Compliance Alerts If you click the score card, the rules for the score card appear. When a symptom is triggered, the rule is considered to be violated. View the list of rules in the following tabs:
n Violated Rules. Displays only the triggered symptoms. Click a symptom to view more information.
n All Rules. Displays triggered and untriggered symptoms.
How To Configure Compliance BenchmarksConfigure VMware SDDC, custom, and regulatory benchmarks from the Compliance page. Unlike previous releases, you can now enable alert definitions in one of the active policies, from the Compliance page directly.
Enable VMware SDDC BenchmarksYou can enable the VMware SDDC Benchmark to monitor objects for violation of vSphere Security Configuration Guide, vSAN Security Configuration Guide, NSX Security Configuration Guide (SDDC only). The score cards in the VMware SDDC Benchmark warn you when compliance alerts trigger on your vCenter Server instance, NSX-V objects, NSX-T objects, vSAN objects, ESXi hosts, virtual machines, distributed port groups, or distributed virtual switches.
Procedure
1 Navigate to the Compliance homepage from Home > Troubleshoot > Compliance page.
2 To enable the Security Configuration Guides, select either the SDDC or the VMC SDDC tab depending on the environment where your objects are present.
3 In the VMware SDDC Benchmarks section, click Enable under the vSphere Security Configuration Guide or vSAN Security Configuration Guide pane.
Note To enable the NSX Security Configuration guide, you must first install the NSX for vSphere, or the NSX-T solution. For more details, see Add Solutions Wizard.
The Enable Policies dialog box opens.
4 Select the policy that you want to modify. When there are child policies, you can select a child policy and unselect a parent policy. vRealize Operations Manager modifies the selected policy and enables the alert definitions associated with the current scorecard.
5 Click Enable to confirm your selection.
vRealize Operations Manager starts to assess the objects based on the policy that you selected. To edit a policy, click Edit in the configuration guide pane and select a different policy.
vRealize Operations Manager Configuration Guide
VMware, Inc. 316
Create a New Custom BenchmarkYou can create a custom compliance benchmark to ensure that objects comply with compliance alerts available in vRealize Operations Manager, or custom compliance alert definitions. When a compliance alert is triggered on your vCenter Server instance, hosts, virtual machines, distributed port groups, or distributed switches, you investigate the compliance violation. You can add up to five custom compliance score cards.
Prerequisites
To create a custom benchmark based on industry standard regulatory compliance requirements, you must first download and install the compliance management packs.
Procedure
1 Navigate to the Compliance homepage from Home > Troubleshoot > Compliance page.
2 To create a custom benchmark, first select either the SDDC or the VMC SDDC tab depending on where your objects are present.
3 In the Custom Benchmarks section, click Add Custom Compliance.
The Add Custom Compliance dialog box opens.
4 Select Create a New Custom Benchmark.
a In the Name and Description step, provide a name and description for the custom benchmark and click Next.
b In the Alert Definitions step, select the compliance alerts that you want to add to this custom compliance benchmark and click Next.
c In the Policies step, select the policies to enable compliance and click Finish.
The custom compliance which monitors alert definitions that you selected is available in the Custom Benchmarks section of the Compliance page. You can edit the alert definitions and policies at any time by clicking Edit.
Import or Export a Custom BenchmarkYou can export custom benchmarks from any vRealize Operations Manager instance and import it to another instance. Reusing custom benchmarks saves you time and effort. You can modify an imported custom benchmark. Exported files are in the XML format. The XML file contains information about alert groups, alerts, and filters.
Prerequisites
You must first export a XML file with the custom benchmarks from another instance of vRealize Operations Manager before importing the XML file to another instance.
Procedure
1 Navigate to the Compliance homepage from Home > Troubleshoot > Compliance page.
vRealize Operations Manager Configuration Guide
VMware, Inc. 317
2 To import a custom benchmark, select either the SDDC or the VMC SDDC tab depending on where your objects are present.
3 In the Custom Benchmarks section, click Add Custom Compliance.
The Add Custom Compliance dialog box opens.
4 Select Import An Existing Custom Benchmark.
a In the Import Compliance Score card dialog box, select the Score card Definition XML file from your local computer. If the XML file contains cloned alerts from the vRealize Operations Manager instance that was used to export the file, the cloned alerts are also imported.
b vRealize Operations Manager displays a message to indicate if the XML file was successfully imported.
c If you see a message which indicates that there is a conflict between the data in the XML file and the custom benchmarks already defined, make a selection on how to handle a conflict.
d Click Done.
5 To export an existing custom benchmark, click the score card to select the benchmark and select Export from the Actions menu.
The imported compliance benchmarks are available in the Custom Benchmarks section of the Compliance page. You can edit the alert definitions and policies at any time by clicking Edit from the Actions menu after clicking the score card.
Install a Regulatory BenchmarkTo enforce and report on the compliance of your vSphere objects, you install the PAK file that contains the policies for the regulatory standard. Then, you select the policy to enable the appropriate regulatory alerts for your virtual machines.
Prerequisites
You must download the PAK files from the VMware Solutions Exchange website. You must provide your login credentials before you can download the PAK files from the VMware Solutions Exchange website.
Procedure
1 Navigate to the Compliance homepage from Home > Troubleshoot > Compliance page.
The Compliance Home page opens.
2 You can install a regulatory benchmark from either the SDDC or the VMC SDDC tab. The management pack is available for both environments irrespective of which tab you selected.
3 Click Marketplace Download to download the PAK file if you do not have it. If you have the PAK file, click Install.
vRealize Operations Manager Configuration Guide
VMware, Inc. 318

4 In the wizard, follow the options on each page to install the PAK file.
Table 5-3. Wizard Options
Option Description
Page 1
Browse Navigate to your copy of a management pack PAK file.
Upload To prepare for installation, copy the PAK file to vRealize Operations Manager.
Install the PAK file even if it is already installed
If the PAK file was already uploaded, reload the PAK file using the current file, but leave user customization in place. Do not overwrite or update the solution alerts, symptoms, recommendations, and policies.
Reset Default Content, overwriting to a newer version provided by this update. User modifications to DEFAULT Alert Definitions, Symptoms, Recommendations, Policy Definitions, Views, Dashboards, Widgets, and Reports are overwritten. If you are installing a product software update, clone or backup the content before you proceed.
If the PAK file was already uploaded, reload the PAK file using the current file, and overwrite the solution default alerts, symptoms, recommendations, and policies with newer versions provided with the current PAK file.
Note A reset overwrites customized content. If you are upgrading vRealize Operations Manager, the best practice is to clone your customized content before you upgrade.
The PAK file is unsigned Warning appears if the PAK file is not signed with a digital signature that VMware provides. The digital signature indicates the original developer or publisher and provides the authenticity of the management pack. If installing a PAK file from an untrusted source is a concern, check with the management pack distributor before proceeding with the installation.
Page 2
End User License Agreement Read and agree to the end-user license agreement. Click the I accept the terms of this agreement check-box.
Note Clicking Next installs the solution.
Page 3
Installation Details Review the installation progress. Click Finish after the installation is complete.
5 Select the policies that you want to modify based on the compliance management pack that you installed.
6 Click Finish to complete the process.
vRealize Operations Manager starts to assess the objects based on the regulatory benchmark that you installed.
vRealize Operations Manager Configuration Guide
VMware, Inc. 319
Configuring Super Metrics 6The super metric is a mathematical formula that contains one or more metrics or properties. It is a custom metric that you design to help track combinations of metrics or properties, either from a single object or from multiple objects. If a single metric does not inform you about the behavior of your environment, you can define a super metric.
After you define it, you assign the super metric to one or more object types. This action calculates the super metric for the objects in that object type and simplifies the metrics display. For example, you define a super metric that calculates the average CPU usage on all virtual machines, and you assign it to a cluster. The average CPU usage on all virtual machines in that cluster is reported as a super metric for the cluster.
When the super metric attribute is enabled in a policy, you can also collect super metrics from a group of objects associated with a policy.
Because super metric formulas can be complex, plan your super metric before you build it. The key to creating a super metric that alerts you to the expected behavior of your objects is knowing your own enterprise and data. Use this checklist to help identify the most important aspects of your environment before you begin to configure a super metric.
Table 6-1. Designing a Super Metric Checklist
Determine the objects that are involved in the behavior to track.
When you define the metrics to use, you can select either specific objects or object types. For example, you can select the specific objects VM001 and VM002, or you can select the object type virtual machine.
Determine the metrics to include in the super metric. If you are tracking the transfer of packets along a network, use metrics that refer to packets in and packets out. In another common use of super metrics, the metrics might be the average CPU usage or average memory usage of the object type you select.
Decide how to combine or compare the metrics. For example, to find the ratio of packets in to packets out, you must divide the two metrics. If you are tracking CPU usage for an object type, you might want to determine the average use. You might also want to determine what the highest or lowest use is for any object of that type. In more complex scenarios, you might need a formula that uses constants or trigonometric functions.
VMware, Inc. 320
Table 6-1. Designing a Super Metric Checklist (continued)
Decide where to assign the super metric. You define the objects to track in the super metric, then assign the super metric to the object type that contains the objects being tracked. To monitor all the objects in a group, enable the super metric in the policy, and apply the policy to the object group.
Determine the policy to which you add the super metric. After you create the super metric, you add it to a policy. For more information, refer to Policy Workspace in vRealize Operations Manager.
What Else Can You Do with Super Metricsn To see the super metrics in your environment, generate a system audit report. For more information,
refer to the System Audit section in the Information Center.
n To create alert definitions to notify you of the performance of objects in your environment, define symptoms based on super metrics. For more information, refer to About Metrics and Super Metrics Symptoms.
n Learn about the use of super metrics in policies. For more information, refer to Policy Workspace in vRealize Operations Manager.
n Use OPS CLI commands to import, export, configure, and delete super metrics. For more information, refer to the OPS CLI documentation.
n To display metric-related widgets, create a custom set of metrics. You can configure one or more files that define different sets of metrics for a particular adapter and object types. This ensures that the supported widgets are populated based on the configured metrics and selected object type. For more information, refer to Manage Metric Configuration.
This chapter includes the following topics:
n Create a Super Metric
n Enhancing Your Super Metrics
n Exporting and Importing a Super Metric
Create a Super MetricCreate a super metric when you want to check the health of your environment, but cannot find a suitable metric to perform the analysis.
Procedure
1 On the menu, click Administration and in the left pane click Configuration > Super Metrics.
2 Click the Add icon.
The Manage Super Metric wizard opens.
vRealize Operations Manager Configuration Guide
VMware, Inc. 321
3 Enter a meaningful name for the super metric such as Worst VM CPU Usage (%) in the Name text box.
Note It is important that you have an intuitive name as it appears in dashboards, alerts, and reports. For meaningful names, always use space between words so that it is easier to read. Use title case for consistency with the out of the box metrics and add the unit at the end.
4 Provide a brief summary of the super metric in the Description text box and click Next.
Note Information regarding the super metric, like why it was created and by whom can provide clarity and help you track your super metrics with ease.
The Create a formula screen appears.
5 Create the formula for the super metric.
For example, to add a super metric that captures the average CPU usage across all virtual machines in a cluster, perform the following steps.
a Select the function or operator. This selection helps combine the metric expression with operators and/or functions. In the super metric editor, enter avg and select the avg function.
You can manually enter functions, operators, objects, object types, metrics, metrics types, property, and properties types in the text box and use the suggestive text to complete your super metric formula.
Alternatively, select the function or operator from the Functions and Operators drop-down menus.
b To create a metric expression, enter Virtual and select Virtual Machine from the object type list.
c Add the metric type, enter usage, and select the CPU|Usage (%) metric from the metric type list.
Note The expression ends with depth=1 by default. If the expression ends with depth=1, that means that the metric is assigned to an object that is one level above virtual machines in the relationship chain. However, since this super metric is for a cluster which is two levels above virtual machine in the relationship chain, change the depth to 2.
The depth can also be negative, this happens when you need to aggregate the parents of a child object. For example, when aggregating all the VMs in a datastore, the metric expression ends with depth=-1, because VM is a parent object of datastore. But, if you want to aggregate all the VMs at a Datastore Cluster level, you need to implement 2 super metrics. You cannot directly aggregate from VM to Datastore Cluster, because both are parents of a datastore. For a super metric to be valid, depth cannot be 0 (-1+1=0). Hence, you need to create the first super metric (with depth=-1) for the aggregate at the datastore level, and then build the second super metric based on the first (with depth = 1).
The metric expression is created.
vRealize Operations Manager Configuration Guide
VMware, Inc. 322
d To calculate the average CPU usage of powered on virtual machines in a cluster, you can add the where clause. Enter where=””.
Note The where clause cannot point to another object, but can point to a different metric in the same object. For example, you cannot count the number of VMs in a cluster with the CPU contention metric > SLA of that cluster. The phrase "SLA of that cluster " belongs to the cluster object, and not to the VM object. The right operand must also be a number and cannot be another super metric or variable. The where clause cannot be combined using AND, OR, NOT, which means you cannot have where="VM CPU>4 and VM RAM>16" in your super metric formula.
e Position the pointer between the quotation marks, enter Virtual, and select the Virtual Machine object type and the System|Powered ON metric type.
f To add the numeric value for the metric, enter ==1.
g To view hints and suggestions, click ctrl+space and select the adapter type, objects, object types, metrics, metrics types, property, and properties types to build your super metric formula.
h Click the This object icon.
If the This object icon is selected during the creation of a metric expression, it means that the metric expression is associated to the object for which the super metric is created.
6 You can also use the Legacy template to create a super metric formula without the suggestive text.
To view the super metric formula in a human-readable format, click the Show Formula Description icon. If the formula syntax is wrong, an error message appears.
Note If you are using Internet Explorer, you are automatically directed to the legacy template.
7 Verify that the super metric formula has been created correctly.
a Expand the Preview section.
b In the Objects text box, enter and select a Cluster.
A metric graph is displayed showing values of the metric collected for the object. Verify that the graph shows values over time.
c Click the Snapshots icon.
You can save a snapshot, or download the metric chart in a .csv format.
d Click the Monitoring Objects icon.
If enabled, only the objects that are being monitored are used in the formula calculation.
e Click Next.
The Assign to Object Types screen appears.
vRealize Operations Manager Configuration Guide
VMware, Inc. 323
8 Associate the super metric with an object type. vRealize Operations Manager calculates the super metric for the target objects and displays it as a metric for the object type.
a In the Assign to an Object Type text box, enter Cluster and select the Cluster Compute Resource object type.
After one collection cycle, the super metric appears on each instance of the specified object type. For example, if you define a super metric to calculate the average CPU usage across all virtual machines and assign it to the cluster object type, the super metric appears as a super metric on each cluster.
b Click Next.
The Enable in a Policy screen appears.
9 Enable the super metric in a policy, wait for at least one collection cycle till the super metric begins collecting and processing data, and then review your super metric on the All Metrics tab.
a In the Enable in a Policy section, you can view the policies related to the object types you assigned your super metric to. Select the policy in which you want to enable the super metric. For example, select the Default Policy for Cluster.
10 Click Finish.
You can now view the super metric you created and the associated object type and policy on the Super Metrics page.
Enhancing Your Super MetricsYou can enhance your super metrics by using clauses and resource entry aliasing.
Where ClauseThe where clause verifies whether a particular metric value can be used in the super metric. Use this clause to point to a different metric of the same object, such as where = "metric_group|my_metric > 0.
For example: count(${objecttype = ExampleAdapter, adaptertype = ExampleObject, metric =
ExampleGroup|Rating, depth=2, where = "==1"})
Resource Entry AliasingResource entries are used to retrieve metric data from vRealize Operations Manager for computing super metrics. A resource entry is the part of an expression which begins with $ followed by a {..} block. When computing a super metric, you might have to use the same resource entry multiple times. If you have to change your computation, you must change every resource entry, which might lead to errors. You can use resource entry aliasing to rewrite the expression.
The following example, shows a resource entry that has been used twice.
vRealize Operations Manager Configuration Guide
VMware, Inc. 324
(min(${adaptertype=VMWARE, objecttype=HostSystem, attribute= cpu|demand|
active_longterm_load, depth=5, where=”>=0”}) + 0.0001)/(max(${adaptertype=VMWARE,
objecttype=HostSystem, attribute=cpu|demand|active_longterm_load, depth=5,
where=”>=0”}) + 0.0001)"
The following example shows how to write the expressing using resource entry aliasing. The output of both expressions is the same.
(min(${adaptertype=VMWARE, objecttype=HostSystem, attribute= cpu|demand|
active_longterm_load, depth=5, where=”>=0”} as cpuload) + 0.0001)/(max(cpuload) +
0.0001)"
Follow these guidelines when you use resource entry aliasing:
n When you create an alias, make sure that after the resource entry you write as and then alias:name. For example: ${…} as alias_name.
n The alias cannot contain the ()[]+-*/%|&!=<>,.?:$ special characters, and cannot begin with a digit.
n An alias name, like all names in super metric expressions, is case-insensitive.
n Use of an alias name is optional. You can define the alias, and not use it in an expression.
n Each alias name can be used only once. For example:${resource1,…} as r1 + ${resource2,…} as R1.
n You can specify multiple aliases for the same resource entry. For example: ${…} as a1 as a2.
Conditional Expression ?: Ternary OperatorsYou can use a ternary operator in an expression to run conditional expressions.
For example: expression_condition ? expression_if_true : expression_if_false.
The result of the conditional expression is converted to a number. If the value is not 0, then the condition is assumed as true.
For example: -0.7 ? 10 : 20 equals 10. 2 + 2 / 2 - 3 ? 4 + 5 / 6 : 7 + 8 equals 15 (7 + 8).
Depending on the condition, either expression_if_true or expression_if_false is run, but not both of them. In this way, you can write expressions such as, ${this, metric=cpu|demandmhz} as a != 0 ? 1/a : -1. A ternary operator can contain other operators in all its expressions, including other ternary operators.
For example: !1 ? 2 ? 3 : 4 : 5 equals 5.
Exporting and Importing a Super MetricYou can export a super metric from one vRealize Operations Manager instance and import it to another vRealize Operations Manager instance. For example, after developing a super metric in a test environment, you can export it from the test environment and import it use in a production environment.
vRealize Operations Manager Configuration Guide
VMware, Inc. 325
If the super metric to import contains a reference to an object that does not exist in the target instance, the import fails. vRealize Operations Manager returns a brief error message and writes detailed information to the log file.
Procedure
1 Export a super metric.
a On the menu, select Administration and in the left pane select Configuration > Super Metrics.
b Select the super metric to export, click the Actions icon and select Export Selected Super Metric icon.
vRealize Operations Manager creates a super metric file, for example, SuperMetric.json.
c Download the super metric file to your computer.
2 Import a super metric.
a On the menu, select Administration and in the left pane select Configuration > Super Metrics.
b Click the Actions icon and select Import Super Metric.
c (Optional). If the target instance has a super metric with the same name as the super metric you are importing, you can either overwrite the existing super metric or skip the import, which is the default.
vRealize Operations Manager Configuration Guide
VMware, Inc. 326
Configuring Objects 7Using the power of object management - including metrics and alerts - you can monitor objects, applications, and systems that must stay up and running. Some metrics and alerts are prepackaged into dashboards and policies; others you combine into custom tools
vRealize Operations Manager discovers objects in your environment and makes them available to you. With the information that vRealize Operations Manager provides, you can quickly access and configure any object. For example, you can determine if a datastore is connected or providing data, or you can power on a virtual machine.
This chapter includes the following topics:
n Object Discovery
Object DiscoveryIts ability to monitor and collect data on objects in your systems environment makes vRealize Operations Manager a critical tool in maintaining system uptime and ensuring ongoing good health for all system resources from virtual machines to applications to storage - across physical, virtual and cloud infrastructures.
Following are examples of objects that can be monitored.
n vCenter Server
n Virtual machines
n Servers/hosts
n Compute resources
n Resource pools
n Data centers
n Storage components
n Switches
n Port groups
n Datastores
VMware, Inc. 327
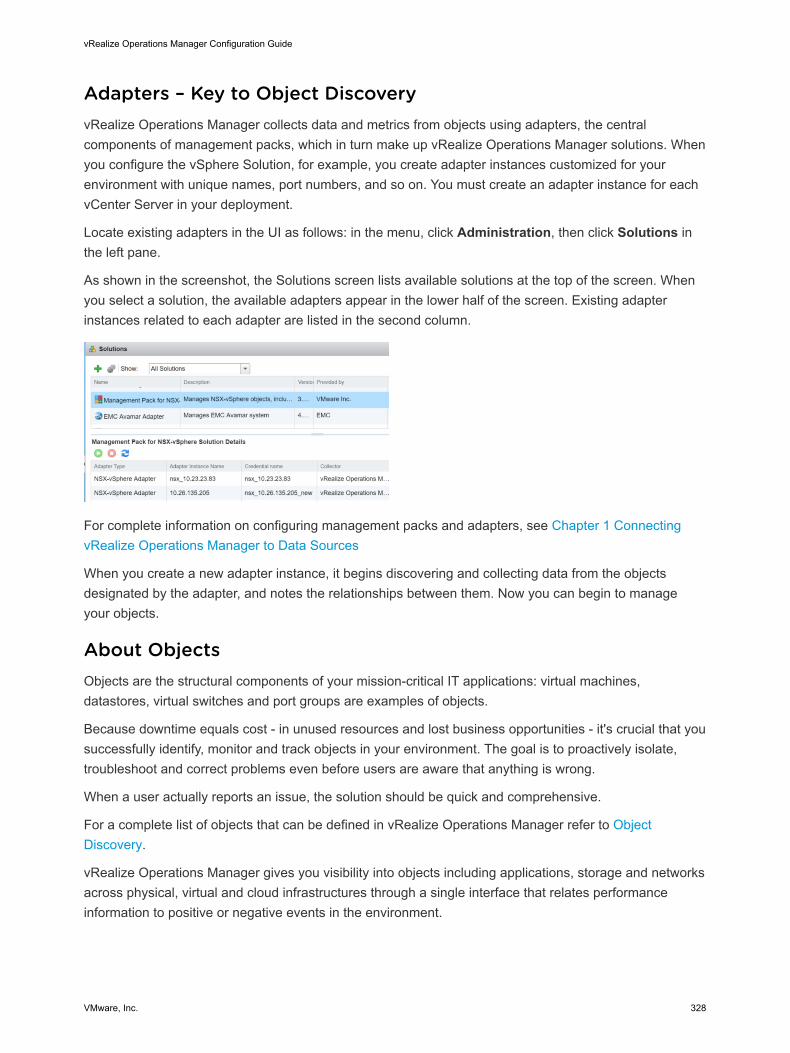
Adapters – Key to Object DiscoveryvRealize Operations Manager collects data and metrics from objects using adapters, the central components of management packs, which in turn make up vRealize Operations Manager solutions. When you configure the vSphere Solution, for example, you create adapter instances customized for your environment with unique names, port numbers, and so on. You must create an adapter instance for each vCenter Server in your deployment.
Locate existing adapters in the UI as follows: in the menu, click Administration, then click Solutions in the left pane.
As shown in the screenshot, the Solutions screen lists available solutions at the top of the screen. When you select a solution, the available adapters appear in the lower half of the screen. Existing adapter instances related to each adapter are listed in the second column.
For complete information on configuring management packs and adapters, see Chapter 1 Connecting vRealize Operations Manager to Data Sources
When you create a new adapter instance, it begins discovering and collecting data from the objects designated by the adapter, and notes the relationships between them. Now you can begin to manage your objects.
About ObjectsObjects are the structural components of your mission-critical IT applications: virtual machines, datastores, virtual switches and port groups are examples of objects.
Because downtime equals cost - in unused resources and lost business opportunities - it's crucial that you successfully identify, monitor and track objects in your environment. The goal is to proactively isolate, troubleshoot and correct problems even before users are aware that anything is wrong.
When a user actually reports an issue, the solution should be quick and comprehensive.
For a complete list of objects that can be defined in vRealize Operations Manager refer to Object Discovery.
vRealize Operations Manager gives you visibility into objects including applications, storage and networks across physical, virtual and cloud infrastructures through a single interface that relates performance information to positive or negative events in the environment.
vRealize Operations Manager Configuration Guide
VMware, Inc. 328

Managing ObjectsWhen you monitor a large infrastructure, the number of objects and corresponding metrics in vRealize Operations Manager grows rapidly, especially as you add solutions that extend dynamic monitoring and alerts to more parts of your infrastructure. vRealize Operations Manager gives you ample tools to stay abreast of events and issues.
Adding Objects and Configuring Object RelationshipsvRealize Operations Manager automatically discovers objects and their relationships once you create an adapter instance. You have the added ability to manually add any objects that you want monitored and to configure object relationships using abstract concepts rather than the connections recorded by vRealize Operations Manager. Where vRealize Operations Manager might discover the classic parent-child relationships between objects, you can create relationships between objects that might not normally be related. For example, you could configure all the datastores supporting a company department to be related.
When objects are related, a problem with one object appears as an anomaly on related objects. So object relationships can help you to identify problems in your environment quickly. The object relationships that you create are called custom groups.
Custom GroupsTo create an automated management system you need some way to organize objects so that you can quickly gain insights. You can achieve a high level of automation using custom groups. You have multiple options for tailoring group attributes to support your monitoring strategy.
For example, you can designate a group either to be static or to be updated automatically with membership criteria that you designate. Consider a non-static group of all virtual machines that are powered on and have OS type Linux. When you power on a new Linux VM, it is automatically added to the group and the policy is applied.
For additional flexibility, you can also specify individual objects to be always included or excluded from a given custom group. Or you can have a different set of alerts and capacity calculations for your production environment versus your testing environments.
Managing ApplicationsvRealize Operations Manager allows you to create containers or objects that can contain a group of virtual machines or other objects in different structural tiers. This new application can then be managed as a single object, and have health badges and alarms aggregated from the child objects of the group.
For example, the system administrator of an online training system might request that you monitor components in the Web, application and database tiers of the training environment. You build an application that groups related training objects together in each tier. If a problem occurs with one of the objects, it is highlighted in the application display and you can investigate the source of the problem
vRealize Operations Manager Configuration Guide
VMware, Inc. 329
The Power of Object ManagementUsing the power of object management, including metrics and alerts - some prepackaged into dashboards and policies, others that you combine into custom monitoring tools - you'll keep a close watch on the objects, applications and systems that must stay up and running.
Managing Objects in Your EnvironmentAn object is the individual managed item in your environment for which vRealize Operations Manager collects data, such as a router, switch, database, virtual machine, host, and vCenter Server instances.
The system requires specific information about each object. When you configure an adapter instance, vRealize Operations Manager performs object discovery to start collecting data from the objects with which the adapter communicates.
An object can be a single entity, such as a database, or a container that holds other objects. For example, if you have multiple Web servers, you can define a single object for each Web server and define a separate container object to hold all of the Web server objects. Groups and applications are types of containers.
Categorize your objects using tags, so that you can easily find, group, or filter them later. A tag type can have multiple tag values. You or vRealize Operations Manager assigns objects to tag values. When you select a tag value, vRealize Operations Manager displays the objects associated with that tag. For example, if a tag type is Lifecycle and tag values are Development, Test, Pre-production, and Production, you might assign virtual machine objects VM1, VM2, or VM3 in your environment to one or more of these tag values, depending on the virtual machine function.
Adding an Object to Your EnvironmentYou might want to add an object by providing its information to vRealize Operations Manager. For example, some solutions cannot discover all the objects that might be monitored. For these solutions, you must either use manual discovery or manually add the object.
When you add an individual object, you provide specific information about it, including the kind of adapter to use to make the connection and the connection method. For example, a vSAN adapter does not know the location of the vSAN devices that you want to monitor.
Prerequisites
Verify that an adapter is present for the object you plan to add. See the vRealize Operations Manager vApp Deployment and Configuration Guide.
Procedure
1 In the menu, click Administration, then select Configuration > Inventory from the left pane.
2 On the toolbar, click the plus sign.
vRealize Operations Manager Configuration Guide
VMware, Inc. 330
3 Use the topic menus to reveal all fields and provide the required information.
Option Description
Display name Enter a name for the object. For example, enter vSAN-Host1.
Description Enter any description. For example, enter vSAN-Host monitored with vSAN adapter
Adapter type Select an adapter type. For example, select vSAN Adapter.
Adapter instance Select an adapter instance.
Object type Select an object type. For a vSAN adapter, you might select vSAN-Host. When you select the object type, the dialog box selections change to include information you provide so that vRealize Operations Manager can find and connect with the selected object type.
Host IP address Enter the host IP. For example, enter the IP address of vSAN-Host1.
Port number Accept the default port number or enter a new value.
Credential Select the Credential, or click the plus sign to add new login credentials for the object.
Collection interval Enter the collection interval, in minutes. For example, if you expect the host to generate performance data every 5 minutes, set the collection interval to 5 minutes.
Dynamic Thresholding. Accept the default, Yes.
4 Click OK to add the object.
vSAN-Host1 appears in the Inventory as a host object type for the vSAN adapter type.
What to do next
For each new object, vRealize Operations Manager assigns tag values for its collector and its object type. Sometimes, you might want to assign other tags.
Configuring Object RelationshipsvRealize Operations Manager shows the relationship between objects in your environment. Most relationships are automatically formed when the objects are discovered by an installed adapter. In addition, you can use vRealize Operations Manager to create relationships between objects that might not normally be related.
Objects are related physically, logically, or structurally.
n Physical relationships represent how objects connect in the physical world. For example, virtual machines running on a host are physically related.
n Logical relationships represent business silos. For example, all the storage objects in an environment are related to one another.
n Structural relationships represent a business value. For example, all the virtual machines that support a database are structurally related.
vRealize Operations Manager Configuration Guide
VMware, Inc. 331
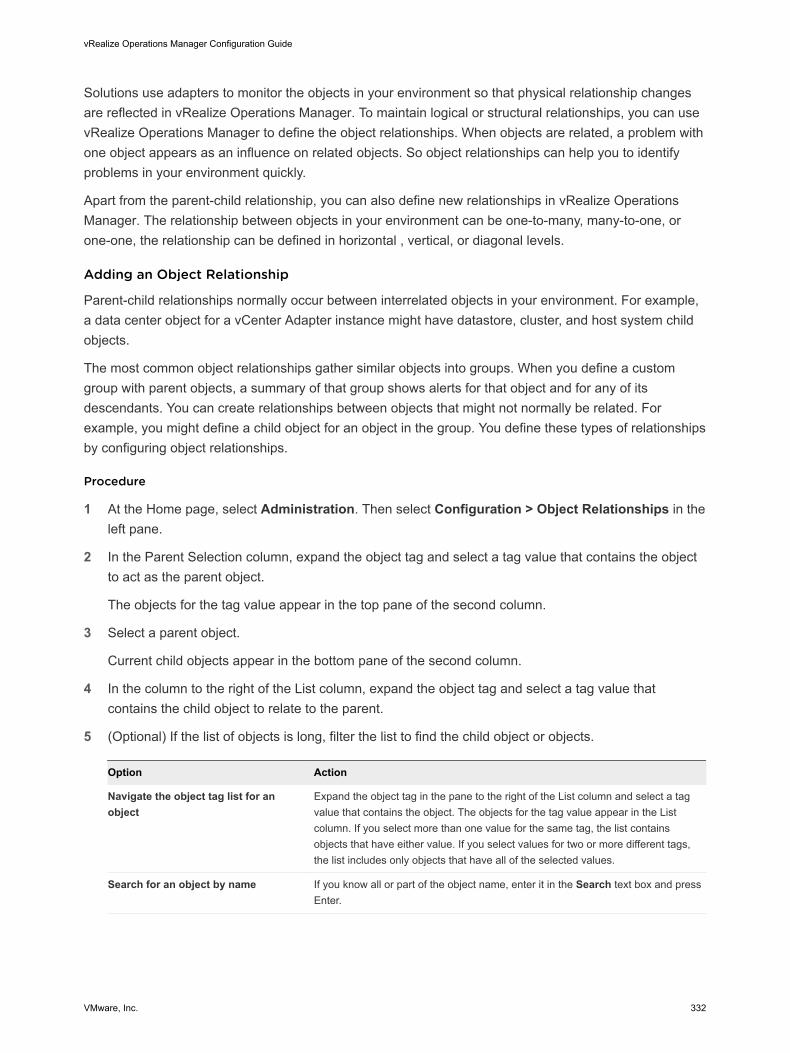
Solutions use adapters to monitor the objects in your environment so that physical relationship changes are reflected in vRealize Operations Manager. To maintain logical or structural relationships, you can use vRealize Operations Manager to define the object relationships. When objects are related, a problem with one object appears as an influence on related objects. So object relationships can help you to identify problems in your environment quickly.
Apart from the parent-child relationship, you can also define new relationships in vRealize Operations Manager. The relationship between objects in your environment can be one-to-many, many-to-one, or one-one, the relationship can be defined in horizontal , vertical, or diagonal levels.
Adding an Object Relationship
Parent-child relationships normally occur between interrelated objects in your environment. For example, a data center object for a vCenter Adapter instance might have datastore, cluster, and host system child objects.
The most common object relationships gather similar objects into groups. When you define a custom group with parent objects, a summary of that group shows alerts for that object and for any of its descendants. You can create relationships between objects that might not normally be related. For example, you might define a child object for an object in the group. You define these types of relationships by configuring object relationships.
Procedure
1 At the Home page, select Administration. Then select Configuration > Object Relationships in the left pane.
2 In the Parent Selection column, expand the object tag and select a tag value that contains the object to act as the parent object.
The objects for the tag value appear in the top pane of the second column.
3 Select a parent object.
Current child objects appear in the bottom pane of the second column.
4 In the column to the right of the List column, expand the object tag and select a tag value that contains the child object to relate to the parent.
5 (Optional) If the list of objects is long, filter the list to find the child object or objects.
Option Action
Navigate the object tag list for an object
Expand the object tag in the pane to the right of the List column and select a tag value that contains the object. The objects for the tag value appear in the List column. If you select more than one value for the same tag, the list contains objects that have either value. If you select values for two or more different tags, the list includes only objects that have all of the selected values.
Search for an object by name If you know all or part of the object name, enter it in the Search text box and press Enter.
vRealize Operations Manager Configuration Guide
VMware, Inc. 332
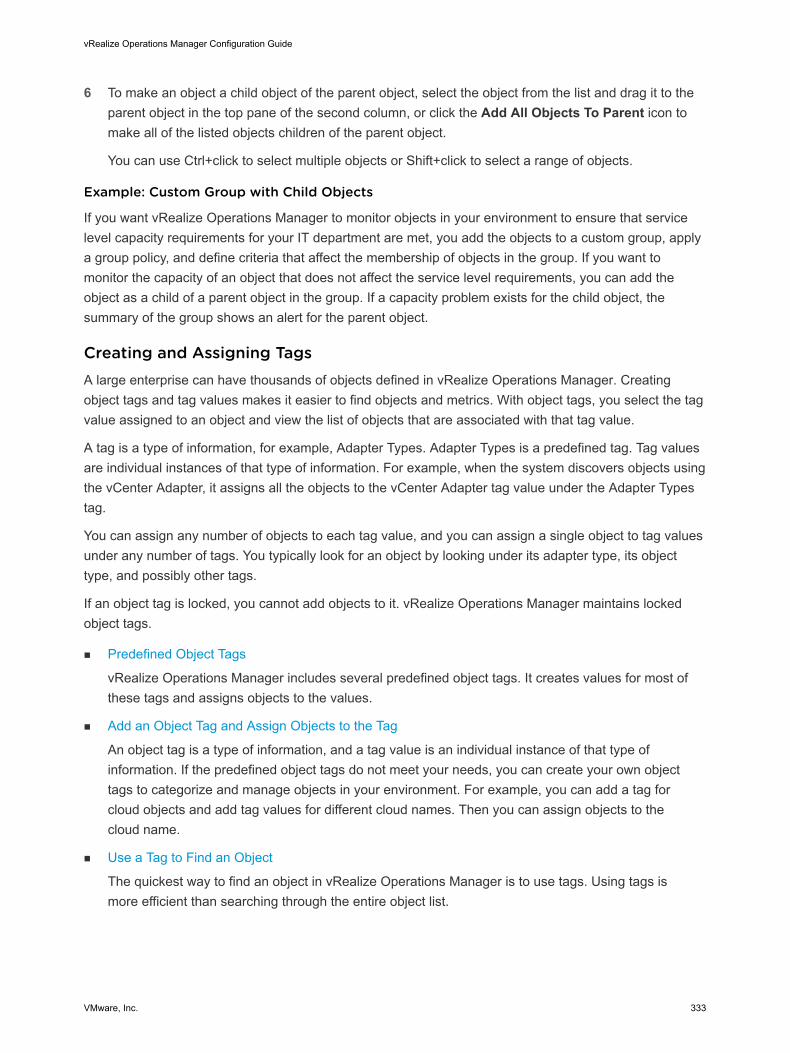
6 To make an object a child object of the parent object, select the object from the list and drag it to the parent object in the top pane of the second column, or click the Add All Objects To Parent icon to make all of the listed objects children of the parent object.
You can use Ctrl+click to select multiple objects or Shift+click to select a range of objects.
Example: Custom Group with Child Objects
If you want vRealize Operations Manager to monitor objects in your environment to ensure that service level capacity requirements for your IT department are met, you add the objects to a custom group, apply a group policy, and define criteria that affect the membership of objects in the group. If you want to monitor the capacity of an object that does not affect the service level requirements, you can add the object as a child of a parent object in the group. If a capacity problem exists for the child object, the summary of the group shows an alert for the parent object.
Creating and Assigning TagsA large enterprise can have thousands of objects defined in vRealize Operations Manager. Creating object tags and tag values makes it easier to find objects and metrics. With object tags, you select the tag value assigned to an object and view the list of objects that are associated with that tag value.
A tag is a type of information, for example, Adapter Types. Adapter Types is a predefined tag. Tag values are individual instances of that type of information. For example, when the system discovers objects using the vCenter Adapter, it assigns all the objects to the vCenter Adapter tag value under the Adapter Types tag.
You can assign any number of objects to each tag value, and you can assign a single object to tag values under any number of tags. You typically look for an object by looking under its adapter type, its object type, and possibly other tags.
If an object tag is locked, you cannot add objects to it. vRealize Operations Manager maintains locked object tags.
n Predefined Object Tags
vRealize Operations Manager includes several predefined object tags. It creates values for most of these tags and assigns objects to the values.
n Add an Object Tag and Assign Objects to the Tag
An object tag is a type of information, and a tag value is an individual instance of that type of information. If the predefined object tags do not meet your needs, you can create your own object tags to categorize and manage objects in your environment. For example, you can add a tag for cloud objects and add tag values for different cloud names. Then you can assign objects to the cloud name.
n Use a Tag to Find an Object
The quickest way to find an object in vRealize Operations Manager is to use tags. Using tags is more efficient than searching through the entire object list.
vRealize Operations Manager Configuration Guide
VMware, Inc. 333

Predefined Object Tags
vRealize Operations Manager includes several predefined object tags. It creates values for most of these tags and assigns objects to the values.
For example, when you add an object, the system assigns it to the tag value for the collector it uses and the kind of object that it is. vRealize Operations Manager creates tag values if they do not already exist.
If a predefined tag has no values, there is no object of that tag type. For example, if no applications are defined, the applications tag has no tag values.
Each tag value appears with the number of objects that have that tag. Tag values that have no objects appear with the value zero. You cannot delete the predefined tags or tag values.
Table 7-1. Predefined Tags
Tag Description
Collectors (Full Set) Each defined collector is a tag value. Each object is assigned to the tag value for the collector that it uses when you add the object to vRealize Operations Manager. The default collector is vRealize Operations Manager Collector-vRealize.
Applications (Full Set) Each defined application is a tag value. When you add a tier to an application, or an object to a tier in an application, the tier is assigned to that tag value.
Maintenance Schedules (Full Set) Each defined maintenance schedule is a tag value, and objects are assigned to the value when you give them a schedule by adding or editing them.
Adapter Types Each adapter type is a tag value, and each object that uses that adapter type is given the tag value.
Adapter Instances Each adapter instance is a tag value, and each object is assigned the tag value for the adapter instance or instances through which its metrics are collected.
Object Types Each type of object is a tag value, and each object is assigned to the tag value for its type when you add the object.
Recently Added Objects The last day, seven days, 10 days, and 30 days have tag values. Objects have this tag value as long as the tag value applies to them.
Object Statuses Tag value assigned to objects that are not receiving data.
Collection States Tag value assigned to indicate the object collection state, such as collecting or not collecting.
Health Ranges Good (green), Warning (yellow), Immediate (orange), Critical (red), and Unknown (blue) health statuses have tag values. Each object is assigned the value for its current health status.
Entire Enterprise The only tag value is Entire Enterprise Applications. This tag value is assigned to each application.
vRealize Operations Manager Configuration Guide
VMware, Inc. 334
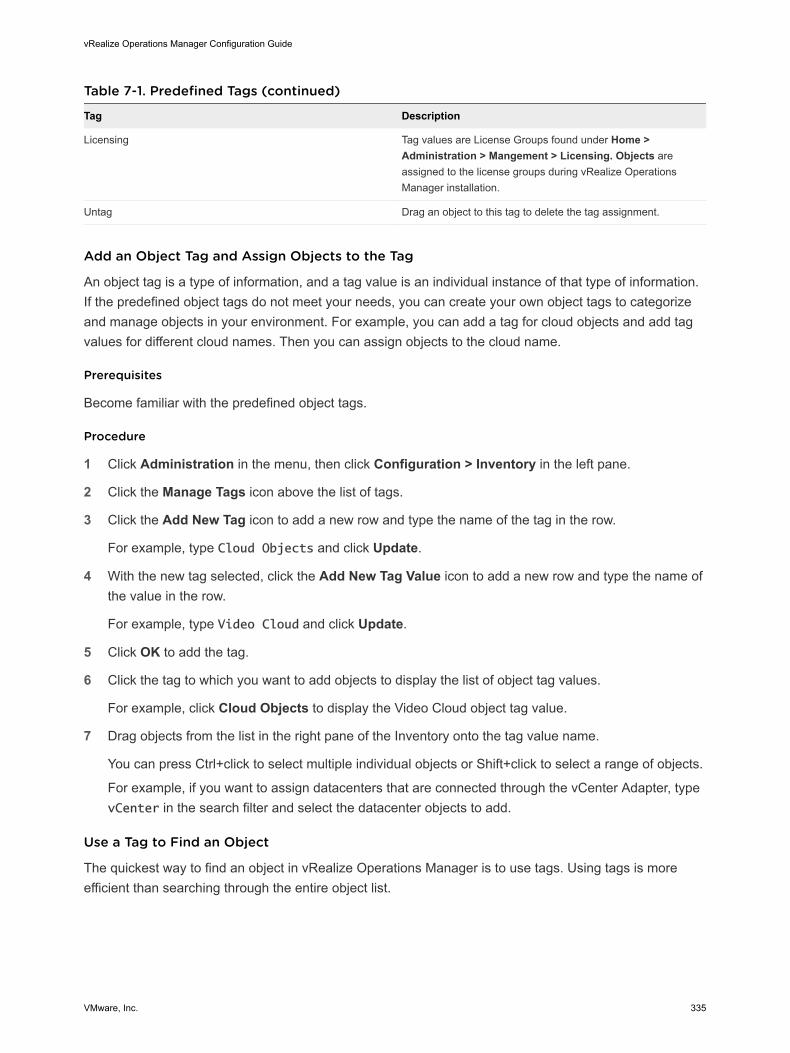
Table 7-1. Predefined Tags (continued)
Tag Description
Licensing Tag values are License Groups found under Home > Administration > Mangement > Licensing. Objects are assigned to the license groups during vRealize Operations Manager installation.
Untag Drag an object to this tag to delete the tag assignment.
Add an Object Tag and Assign Objects to the Tag
An object tag is a type of information, and a tag value is an individual instance of that type of information. If the predefined object tags do not meet your needs, you can create your own object tags to categorize and manage objects in your environment. For example, you can add a tag for cloud objects and add tag values for different cloud names. Then you can assign objects to the cloud name.
Prerequisites
Become familiar with the predefined object tags.
Procedure
1 Click Administration in the menu, then click Configuration > Inventory in the left pane.
2 Click the Manage Tags icon above the list of tags.
3 Click the Add New Tag icon to add a new row and type the name of the tag in the row.
For example, type Cloud Objects and click Update.
4 With the new tag selected, click the Add New Tag Value icon to add a new row and type the name of the value in the row.
For example, type Video Cloud and click Update.
5 Click OK to add the tag.
6 Click the tag to which you want to add objects to display the list of object tag values.
For example, click Cloud Objects to display the Video Cloud object tag value.
7 Drag objects from the list in the right pane of the Inventory onto the tag value name.
You can press Ctrl+click to select multiple individual objects or Shift+click to select a range of objects.
For example, if you want to assign datacenters that are connected through the vCenter Adapter, type vCenter in the search filter and select the datacenter objects to add.
Use a Tag to Find an Object
The quickest way to find an object in vRealize Operations Manager is to use tags. Using tags is more efficient than searching through the entire object list.
vRealize Operations Manager Configuration Guide
VMware, Inc. 335
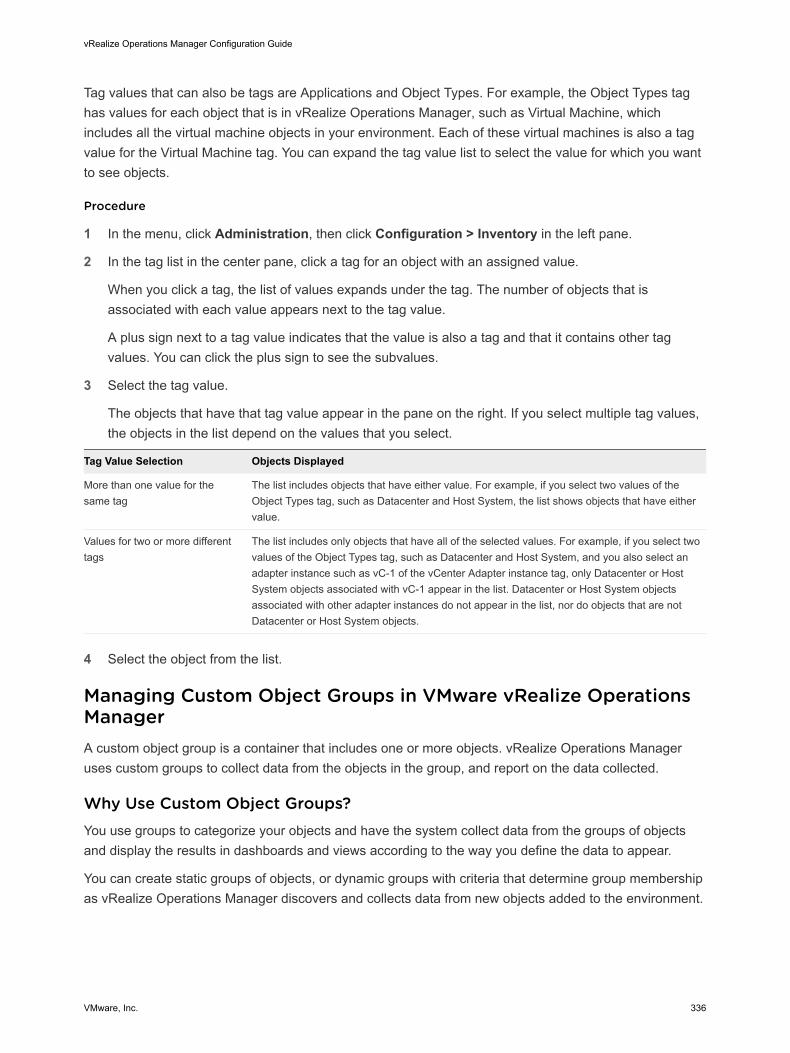
Tag values that can also be tags are Applications and Object Types. For example, the Object Types tag has values for each object that is in vRealize Operations Manager, such as Virtual Machine, which includes all the virtual machine objects in your environment. Each of these virtual machines is also a tag value for the Virtual Machine tag. You can expand the tag value list to select the value for which you want to see objects.
Procedure
1 In the menu, click Administration, then click Configuration > Inventory in the left pane.
2 In the tag list in the center pane, click a tag for an object with an assigned value.
When you click a tag, the list of values expands under the tag. The number of objects that is associated with each value appears next to the tag value.
A plus sign next to a tag value indicates that the value is also a tag and that it contains other tag values. You can click the plus sign to see the subvalues.
3 Select the tag value.
The objects that have that tag value appear in the pane on the right. If you select multiple tag values, the objects in the list depend on the values that you select.
Tag Value Selection Objects Displayed
More than one value for the same tag
The list includes objects that have either value. For example, if you select two values of the Object Types tag, such as Datacenter and Host System, the list shows objects that have either value.
Values for two or more different tags
The list includes only objects that have all of the selected values. For example, if you select two values of the Object Types tag, such as Datacenter and Host System, and you also select an adapter instance such as vC-1 of the vCenter Adapter instance tag, only Datacenter or Host System objects associated with vC-1 appear in the list. Datacenter or Host System objects associated with other adapter instances do not appear in the list, nor do objects that are not Datacenter or Host System objects.
4 Select the object from the list.
Managing Custom Object Groups in VMware vRealize Operations ManagerA custom object group is a container that includes one or more objects. vRealize Operations Manager uses custom groups to collect data from the objects in the group, and report on the data collected.
Why Use Custom Object Groups?You use groups to categorize your objects and have the system collect data from the groups of objects and display the results in dashboards and views according to the way you define the data to appear.
You can create static groups of objects, or dynamic groups with criteria that determine group membership as vRealize Operations Manager discovers and collects data from new objects added to the environment.
vRealize Operations Manager Configuration Guide
VMware, Inc. 336

vRealize Operations Manager provides commonly used object group types, such as World, Environment, and Licensing. The system uses the object group types to categorize groups of objects. You assign a group type to each group so that you can categorize and organize the groups of objects that you create.
Types of Custom Object GroupsWhen you create custom groups, you can use rules to apply dynamic membership of objects to the group, or you can manually add the objects to the group. When you add an adapter, the groups associated with the adapter become available in vRealize Operations Manager.
n Dynamic group membership. To dynamically update the membership of objects in a group, define rules when you create a group. vRealize Operations Manager adds objects to the group based on the criteria that you define.
n Mixed membership, which includes dynamic and manual.
n Manual group membership. From the inventory of objects, you select objects to add as members to the group.
n Groups associated with adapters. Each adapter manages the membership of the group. For example, the vCenter Server adapter adds groups such as datastore, host, and network, for the container objects in the vSphere inventory. To modify these groups, you must do so in the adapter.
Administrators of vRealize Operations Manager can set advanced permissions on custom groups. Users who have privileges to create groups can create custom groups of objects and have vRealize Operations Manager apply a policy to each group to collect data from the objects and report the results in dashboards and views.
When you create a custom group, and assign a policy to the group, the system uses the criteria defined in the applied policy to collect data from and analyze the objects in the group. vRealize Operations Manager reports on the status, problems, and recommendations for those objects based on the settings in the policy.
Note Only custom groups defined explicitly by users can be exported from or imported to vRealize Operations Manager. Users are able to export or import multiple custom groups. Once an import function has been executed, the user must check to determine if a policy or policies should be associated with the imported group. Export-import operations are available for user defined (created explicitly by user) custom groups only.
How Policies Help vRealize Operations Manager Report On Object GroupsWhen you apply a policy to an object group, vRealize Operations Manager uses threshold settings, metrics, super metrics, attributes, properties, alert definitions, and problem definitions that you enabled in the policy to collect data from the objects in the group, and report the results in dashboards and views.
When you create a new object group, you have the option to apply a policy to the group.
n To associate a policy with the custom object group, select the policy in the group creation wizard.
vRealize Operations Manager Configuration Guide
VMware, Inc. 337
n To not associate a specific policy with the object group, leave the policy selection blank. The custom object group will be associated with the default policy. If the default policy changes, this object group will be associated with the new default policy.
vRealize Operations Manager applies policies in priority order, as they appear on the Active Policies tab. When you establish the priority for your policies, vRealize Operations Manager applies the configured settings in the policies according to the policy rank order to analyze and report on your objects. To change the priority of a policy, you click and drag a policy row. The default policy is always kept at the bottom of the priority list, and the remaining list of active policies starts at priority 1, which indicates the highest priority policy. When you assign an object to be a member of multiple object groups, and you assign a different policy to each object group, vRealize Operations Manager associates the highest ranking policy with that object.
User Scenario: Creating Custom Object GroupsAs a system administrator, you must monitor the capacity for your clusters, hosts, and virtual machines. vRealize Operations Manager monitors them at different service levels to ensure that these objects adhere to the policies established for your IT department, and discovers and monitors new objects added to the environment. You have vRealize Operations Manager apply policies to the object groups to analyze, monitor, and report on the status of their capacity levels.
To have vRealize Operations Manager monitor the capacity levels for your objects to ensure that they adhere to your policies for your service levels, you categorize your objects into Platinum, Gold, and Silver object groups to support the service tiers established.
You create a group type, and create dynamic object groups for each service level. You define membership criteria for each dynamic object group to have vRealize Operations Manager keep the membership of objects current. For each dynamic object group, you assign the group type, and add criteria to maintain membership of your objects in the group. To associate a policy with the custom object group, you can select the policy in the group creation wizard.
Prerequisites
n Know the objects that exist in your environment, and the service levels that they support.
n Understand the policies required to monitor your objects.
n Verify that policies are available to monitor the capacity of your objects.
Procedure
1 To create a group type to identify service level monitoring, click Administration in the menu, then click Configuration > Group Types.
2 On the Group Types toolbar, click the plus sign and type Service Level Capacity for the group type.
Your group type appears in the list.
3 Click Environment in the menu, then click the Custom Groups tab.
vRealize Operations Manager Configuration Guide
VMware, Inc. 338
4 To create a new object group, click the plus sign on the Groups toolbar.
The New Group workspace appears where you define the data and membership criteria for the dynamic group.
a In the Name text box, type a meaningful name for the object group, such as Platinum_Objects.
b In the Group Type drop-down menu, select Service Level Capacity.
c (Optional) In the Policy drop-down menu, select your service level policy that has thresholds set to monitor the capacity of your objects.
To associate a policy with the custom object group, select the policy in the group creation wizard. To not associate a specific policy with the object group, leave the policy selection blank. The custom object group will be associated with the default policy. If the default policy changes, this object group will be associated with the new default policy.
d Select the Keep group membership up to date check box so that vRealize Operations Manager can discover objects that meet the criteria, and add those objects to the group.
5 Define the membership for virtual machines in your new dynamic object group to monitor them as platinum objects.
a From the Select Object drop-down menu, select vCenter Adapter, and select Virtual Machine.
b From the empty drop-down menu for the criteria, select Metrics.
c From the Pick a metric drop-down menu, select Disk Space and double-click Current Size.
d From the conditional value drop-down menu, select is less than.
e From the Metric value drop-down menu, type 10.
6 Define the membership for host systems in your new dynamic object group to monitor them as platinum objects.
a Click Add another criteria set.
b From the Select Object drop-down menu, select vCenter Adapter, and select Host System.
c From the empty drop-down menu for the criteria, select Metrics.
d From the Pick a metric drop-down menu, select Disk Space and double-click Current Size.
e From the conditional value drop-down menu, select is less than.
f From the Metric value drop-down menu, type 100.
7 Define the membership for cluster compute resources in your new dynamic object group.
a Click Add another criteria set.
b From the Select Object drop-down menu, select vCenter Adapter, and select Cluster Compute Resources.
c From the empty drop-down menu for the criteria, select Metrics.
vRealize Operations Manager Configuration Guide
VMware, Inc. 339
d From the Pick a metric drop-down menu, select Disk Space and double-click capacityRemaining.
e From the conditional value drop-down menu, select is less than.
f From the Metric value drop-down menu, type 1000.
g Click Preview to determine whether objects already match this criteria.
8 Click OK to save your group.
When you save your new dynamic group, the group appears in the Service Level Capacity folder, and in the list of groups on the Groups tab.
9 Wait five minutes for vRealize Operations Manager to collect data from the objects in your environment.
vRealize Operations Manager collects data from the cluster compute resources, host systems, and virtual machines in your environment, according to the metrics that you defined in the group and the thresholds defined in the policy that is applied to the group, and displays the results about your objects in dashboards and views.
What to do next
To monitor the capacity levels for your platinum objects, create a dashboard, and add widgets to the dashboard. See Dashboards.
Managing Application GroupsAn application is a container construct that represents a collection of interdependent hardware and software components that deliver a specific capability to support your business. vRealize Operations Manager builds an application to determine how your environment is affected when one or more components in an application experiences problems, and to monitor the overall health and performance of the application. Object membership in an application is not dynamic. To change the application, you manually modify the objects in the container.
Reasons to Use ApplicationsvRealize Operations Manager collects data from components in the application and displays the results in a summary dashboard for each application with a real-time analysis for any of the components. If a component experiences problems, you can see where in the application the problems arise, and determine how problems spread to other objects.
Note vRealize Operations Manager provides for calendar periodicity. If your application includes work performed on a specific day of the month, for example, the 15th of the month or the last day of the month, this calendar function identifies the pattern after six cycles of the application. Once the pattern is recognized, the system can forecast accurately into the future. Because the system acquires its information from the input data, you do not have to give any details about how you schedule periodical work.
vRealize Operations Manager Configuration Guide
VMware, Inc. 340
User Scenario: Adding an ApplicationAs the system administrator of an online training system, you must monitor components in the Web, application, and database tiers of your environment that can affect the performance of the system. You build an application that groups related objects together in each tier. If a problem occurs with one of the objects, it is reflected in the application display and you can open a summary to investigate the source of the problem further.
In your application, you add the DB-related objects that store data for the training system in a tier, Web-related objects that run the user interface in a tier, and application-related objects that process the data for the training system in a tier. The network tier might not be needed. Use this model to develop your application.
Procedure
1 In the menu, click Environment, then click Groups and Applications in the left pane.
2 Click the Applications tab and click the plus sign.
3 Click Basic n-tier Web App and click OK.
The Application Management page that appears has two rows. Select objects from the bottom row to populate the tiers in the top row.
4 Type a meaningful name such as Online Training Application in the Application text box.
5 For each of the Web, application and database tiers listed, add the objects to the Tier Objects section.
a Select a tier name. This is the tier that you populate.
b To the left of the object row, select object tags to filter for objects that have that tag value. Click the tag name once to select the tag from the list and click the tag name again to deselect the tag from the list. If you select multiple tags, objects displayed depend on the values that you select.
You can also search for the object by name.
c To the right of the object row, select the objects to add to the tier.
d Drag the objects to the Tier Objects section.
6 Click Save to save the application.
The new application appears in the list of applications on the Environment Overview Applications page. If any of the components in any of the tiers develops a problem, the application displays a yellow or red status.
What to do next
To investigate the source of the problem, click the application name and evaluate the object summary information. See the vRealize Operations Manager User Guide.
vRealize Operations Manager Configuration Guide
VMware, Inc. 341
Configuring Data Display 8You configure the content in vRealize Operations Manager to suit your information needs, using views, reports, dashboards, and widgets.
Views display data, based on an object type. You can select from various view types to see your data from a different perspective. Views are reusable components that you can include in reports and dashboards. Reports can contain predefined or custom views and dashboards in a specified order. You build the reports to represent objects and metrics in your environment. You can customize the report layout by adding a cover page, a table of contents, and a footer. You can export the report in a PDF or CSV file format for further reference.
You use dashboards to monitor the performance and state of objects in your virtual infrastructure. Widgets are the building blocks of dashboards and display data about configured attributes, resources, аpplications, or the overall processes in your environment. You can also incorporate views in dashboards using the vRealize Operations Manager View Widget.
This chapter includes the following topics:
n Widgets
n Dashboards
n Views
n Reports
WidgetsWidgets are the panes on your dashboards. You add widgets to a dashboard to create a dashboard. Widgets show information about attributes, resources, applications, or the overall processes in your environment.
You can configure widgets to reflect your specific needs. The available configuration options vary depending on the widget type. You must configure some of the widgets before they display any data. Many widgets can provide or accept data from one or more widgets. You can use this feature to set the data from one widget as filter and display related information on a single dashboard.
VMware, Inc. 342
Widget InteractionsWidget interactions are the configured relationships between widgets in a dashboard where one widget provides information to a receiving widget. When you are using a widget in the dashboard, you select data on one widget to limit the data that appears in another widget, allowing you to focus on a smaller subset data.
How Interactions WorkIf you configured interactions between widget at the dashboard level, you can then select one or more objects in the providing widget to filter the data that appears in the receiving widget, allowing you to focus on data related to an object.
To use the interaction option between the widgets in a dashboard, you configure interactions at the dashboard level. If you do not configure any interactions, the data that appears in the widgets is based on how the widget is configured.
When you configure widget interaction, you specify the providing widget for the receiving widget. For some widgets, you can define two providing widgets, each of which can be used to filter data in the receiving widget.
For example, if you configured the Object List widget to be a provider widget for the Top-N widget, you can select one or more objects in the Object List widget and the Top-N displays data only for the selected objects.
For some widgets, you can define more than one providing widget. For example, you can configure the Metric Chart widget to receive data from a metrics provider widget and an objects providing widget. In such case, the Metric Chart widget shows data for any object that you select in the two provider widgets.
Manage Metric ConfigurationYou can create a custom set of metrics to display the widgets. You can configure one or more files that define different sets of metrics for a particular adapter and object types so that the supported widgets are populated based on the configured metrics and selected object type.
How the Metric Configuration WorksFrom the Metric Configuration page, you create an XML file that displays a set of metrics at a supported widget. The widgets are Metric Chart, Property List, Rolling View Chart, Scoreboard, Sparkline Chart, and Topology Graph. To use the metric configuration, you must set the widget Self Provider to Off and create a widget interaction with a provider widget.
Where You Find the Metric ConfigurationTo manage metric configurations, in the menu, click Administration, and then in the left pane click Configuration > Metric Configurations.
vRealize Operations Manager Configuration Guide
VMware, Inc. 343
Table 8-1. Manage Metric Config Toolbar Options
Option Description
Create Configuration Creates an empty XML file in a selected folder.
Edit Configuration Activates a selected XML file for edit in the text box on the right.
Delete Configuration Deletes a selected XML file.
Text box Displays a selected XML file. You must select an XML file and click Edit to edit it.
Add a Resource Interaction XML FileA resource interaction file is a custom set of metrics that you want to display in widgets that support the option. You can configure one or more files that define different sets of metrics for particular object types so that the supported widgets are populated based the configured metrics and selected object type.
The following widgets support the resource interaction mode:
n Metric Chart
n Property List
n Rolling View Chart
n Scoreboard
n Sparkline Chart
n Topology Graph
To use the metric configuration, which displays a set of metrics that you defined in an XML file, the dashboard and widget configuration must meet the following criteria:
n The dashboard Widget Interaction options are configured so that another widget provides objects to the target widget. For example, an Object List widget provides the object interaction to a chart widget.
n The widget Self Provider option is set to Off.
n The custom XML file in the Metric Configuration drop-down menu is in the/usr/lib/vmware-vcops/tools/opscli directory and has been imported into the global storage using the import command.
If you add an XML file and later modify it, the changes might not take effect.
Prerequisites
n Verify that you have the necessary permissions to access the installed files for vRealize Operations Manager and add files.
n Create a new files based on the existing examples. Examples are available in the following location:
n vApp. The XML file is in /usr/lib/vmware-vcops/tomcat-web-app/webapps/vcops-web-ent/WEB-INF/classes/resources/reskndmetrics.
vRealize Operations Manager Configuration Guide
VMware, Inc. 344
Procedure
1 Create an XML file that defines the set of metrics.
For example:
<?xml version="1.0" encoding="UTF-8" standalone="yes"?>
<AdapterKinds>
<AdapterKind adapterKindKey="VMWARE">
<ResourceKind resourceKindKey="HostSystem">
<Metric attrkey="sys:host/vim/vmvisor/slp|resourceMemOverhead_latest" />
<Metric attrkey="cpu|capacity_provisioned" />
<Metric attrkey="mem|host_contention" />
</ResourceKind>
</AdapterKind>
</AdapterKinds>
In this example, the displayed data for the host system based on the specified metrics.
2 Save the XML file in one of the following directories base on the operating system of your vRealize Operations Manager instance.
Operating System File Location
vApp /usr/lib/vmware-vcops/tools/opscli
3 Run the import command.
Operating System File Location
vApp ./ops-cli.sh file import reskndmetric YourCustomFilename.xml
The file is imported into global storage and is accessible from the supported widgets.
4 If you update an exisiting file and must re-import the file, append --force to the above import command and run it.
For example, ./vcops-cli.sh file import reskndmetric YourCustomFilename.xml --force.
What to do next
To verify that the XML file is imported, configure one of the supported widgets and ensure that the new file appears in the drop-down menu.
You can also create a custom set of metrics to display the widgets, from the Manage Metric Configuration.
Widget Definitions ListA widget is a pane on a dashboard that contains information about configured attributes, resources, applications, or the overall processes in your environment. Widgets can provide a holistic, end-to-end view of the health of all of the objects and applications in your enterprise. If your user account has the necessary access rights, you can add and remove widgets from your dashboards.
vRealize Operations Manager Configuration Guide
VMware, Inc. 345
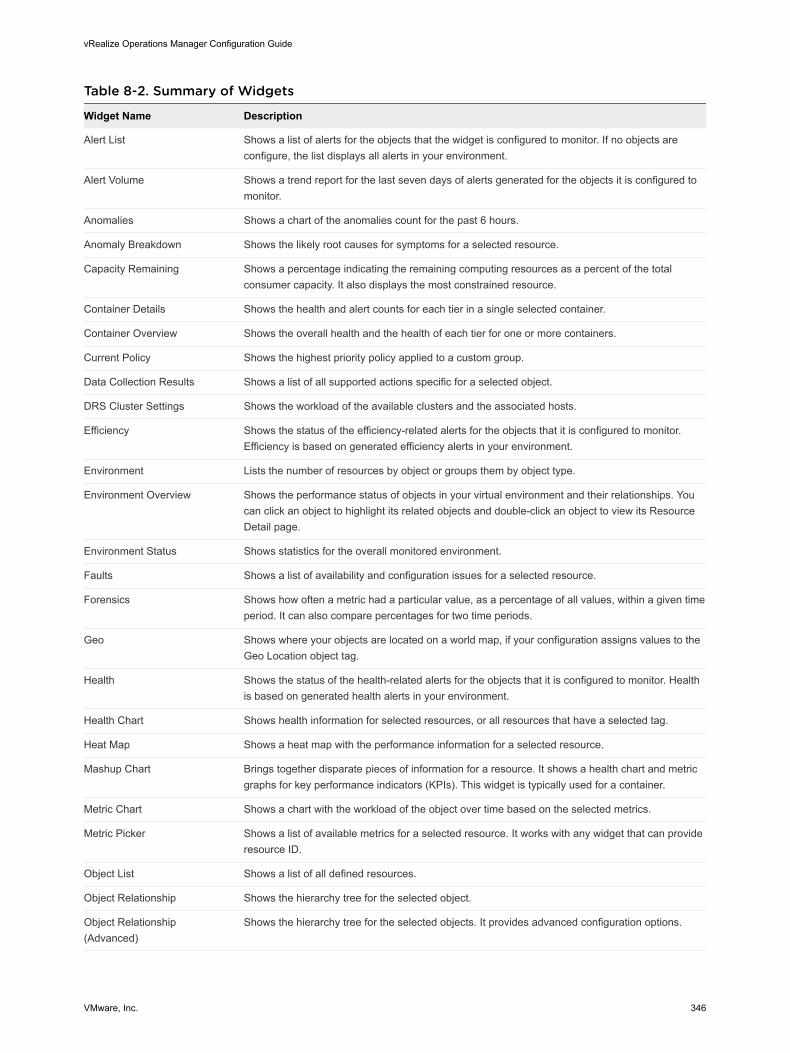
Table 8-2. Summary of Widgets
Widget Name Description
Alert List Shows a list of alerts for the objects that the widget is configured to monitor. If no objects are configure, the list displays all alerts in your environment.
Alert Volume Shows a trend report for the last seven days of alerts generated for the objects it is configured to monitor.
Anomalies Shows a chart of the anomalies count for the past 6 hours.
Anomaly Breakdown Shows the likely root causes for symptoms for a selected resource.
Capacity Remaining Shows a percentage indicating the remaining computing resources as a percent of the total consumer capacity. It also displays the most constrained resource.
Container Details Shows the health and alert counts for each tier in a single selected container.
Container Overview Shows the overall health and the health of each tier for one or more containers.
Current Policy Shows the highest priority policy applied to a custom group.
Data Collection Results Shows a list of all supported actions specific for a selected object.
DRS Cluster Settings Shows the workload of the available clusters and the associated hosts.
Efficiency Shows the status of the efficiency-related alerts for the objects that it is configured to monitor. Efficiency is based on generated efficiency alerts in your environment.
Environment Lists the number of resources by object or groups them by object type.
Environment Overview Shows the performance status of objects in your virtual environment and their relationships. You can click an object to highlight its related objects and double-click an object to view its Resource Detail page.
Environment Status Shows statistics for the overall monitored environment.
Faults Shows a list of availability and configuration issues for a selected resource.
Forensics Shows how often a metric had a particular value, as a percentage of all values, within a given time period. It can also compare percentages for two time periods.
Geo Shows where your objects are located on a world map, if your configuration assigns values to the Geo Location object tag.
Health Shows the status of the health-related alerts for the objects that it is configured to monitor. Health is based on generated health alerts in your environment.
Health Chart Shows health information for selected resources, or all resources that have a selected tag.
Heat Map Shows a heat map with the performance information for a selected resource.
Mashup Chart Brings together disparate pieces of information for a resource. It shows a health chart and metric graphs for key performance indicators (KPIs). This widget is typically used for a container.
Metric Chart Shows a chart with the workload of the object over time based on the selected metrics.
Metric Picker Shows a list of available metrics for a selected resource. It works with any widget that can provide resource ID.
Object List Shows a list of all defined resources.
Object Relationship Shows the hierarchy tree for the selected object.
Object Relationship (Advanced)
Shows the hierarchy tree for the selected objects. It provides advanced configuration options.
vRealize Operations Manager Configuration Guide
VMware, Inc. 346
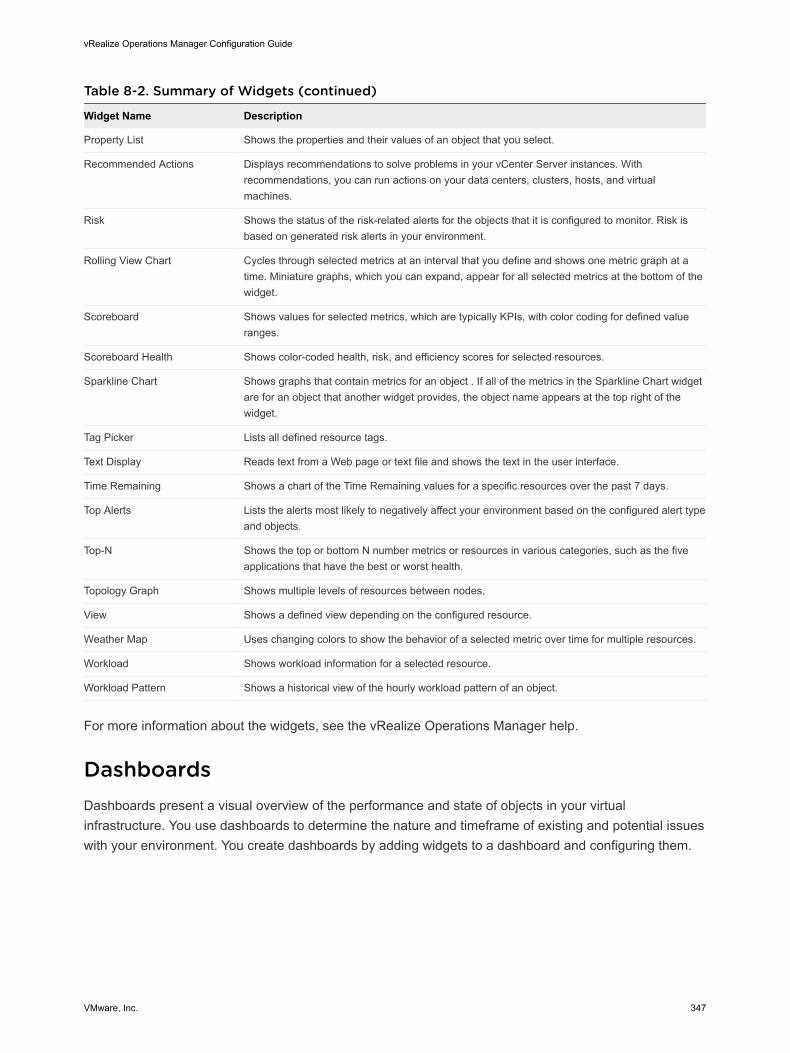
Table 8-2. Summary of Widgets (continued)
Widget Name Description
Property List Shows the properties and their values of an object that you select.
Recommended Actions Displays recommendations to solve problems in your vCenter Server instances. With recommendations, you can run actions on your data centers, clusters, hosts, and virtual machines.
Risk Shows the status of the risk-related alerts for the objects that it is configured to monitor. Risk is based on generated risk alerts in your environment.
Rolling View Chart Cycles through selected metrics at an interval that you define and shows one metric graph at a time. Miniature graphs, which you can expand, appear for all selected metrics at the bottom of the widget.
Scoreboard Shows values for selected metrics, which are typically KPIs, with color coding for defined value ranges.
Scoreboard Health Shows color-coded health, risk, and efficiency scores for selected resources.
Sparkline Chart Shows graphs that contain metrics for an object . If all of the metrics in the Sparkline Chart widget are for an object that another widget provides, the object name appears at the top right of the widget.
Tag Picker Lists all defined resource tags.
Text Display Reads text from a Web page or text file and shows the text in the user interface.
Time Remaining Shows a chart of the Time Remaining values for a specific resources over the past 7 days.
Top Alerts Lists the alerts most likely to negatively affect your environment based on the configured alert type and objects.
Top-N Shows the top or bottom N number metrics or resources in various categories, such as the five applications that have the best or worst health.
Topology Graph Shows multiple levels of resources between nodes.
View Shows a defined view depending on the configured resource.
Weather Map Uses changing colors to show the behavior of a selected metric over time for multiple resources.
Workload Shows workload information for a selected resource.
Workload Pattern Shows a historical view of the hourly workload pattern of an object.
For more information about the widgets, see the vRealize Operations Manager help.
DashboardsDashboards present a visual overview of the performance and state of objects in your virtual infrastructure. You use dashboards to determine the nature and timeframe of existing and potential issues with your environment. You create dashboards by adding widgets to a dashboard and configuring them.
vRealize Operations Manager Configuration Guide
VMware, Inc. 347
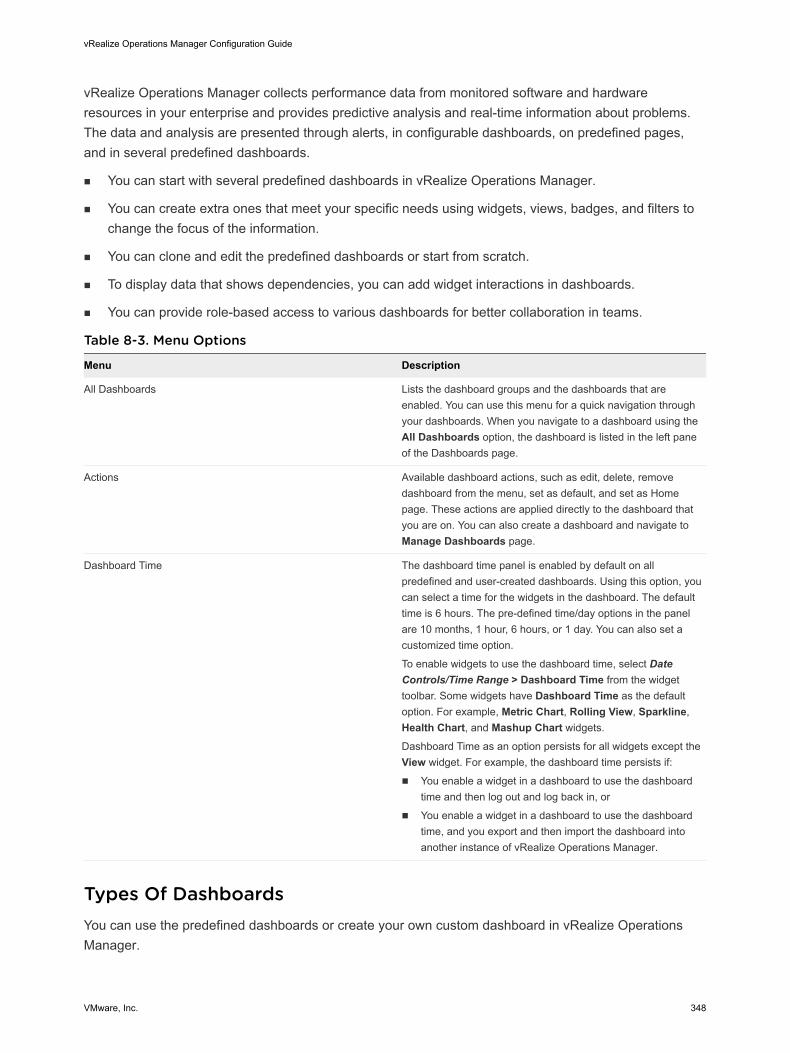
vRealize Operations Manager collects performance data from monitored software and hardware resources in your enterprise and provides predictive analysis and real-time information about problems. The data and analysis are presented through alerts, in configurable dashboards, on predefined pages, and in several predefined dashboards.
n You can start with several predefined dashboards in vRealize Operations Manager.
n You can create extra ones that meet your specific needs using widgets, views, badges, and filters to change the focus of the information.
n You can clone and edit the predefined dashboards or start from scratch.
n To display data that shows dependencies, you can add widget interactions in dashboards.
n You can provide role-based access to various dashboards for better collaboration in teams.
Table 8-3. Menu Options
Menu Description
All Dashboards Lists the dashboard groups and the dashboards that are enabled. You can use this menu for a quick navigation through your dashboards. When you navigate to a dashboard using the All Dashboards option, the dashboard is listed in the left pane of the Dashboards page.
Actions Available dashboard actions, such as edit, delete, remove dashboard from the menu, set as default, and set as Home page. These actions are applied directly to the dashboard that you are on. You can also create a dashboard and navigate to Manage Dashboards page.
Dashboard Time The dashboard time panel is enabled by default on all predefined and user-created dashboards. Using this option, you can select a time for the widgets in the dashboard. The default time is 6 hours. The pre-defined time/day options in the panel are 10 months, 1 hour, 6 hours, or 1 day. You can also set a customized time option.
To enable widgets to use the dashboard time, select Date Controls/Time Range > Dashboard Time from the widget toolbar. Some widgets have Dashboard Time as the default option. For example, Metric Chart, Rolling View, Sparkline, Health Chart, and Mashup Chart widgets.
Dashboard Time as an option persists for all widgets except the View widget. For example, the dashboard time persists if:
n You enable a widget in a dashboard to use the dashboard time and then log out and log back in, or
n You enable a widget in a dashboard to use the dashboard time, and you export and then import the dashboard into another instance of vRealize Operations Manager.
Types Of DashboardsYou can use the predefined dashboards or create your own custom dashboard in vRealize Operations Manager.
vRealize Operations Manager Configuration Guide
VMware, Inc. 348
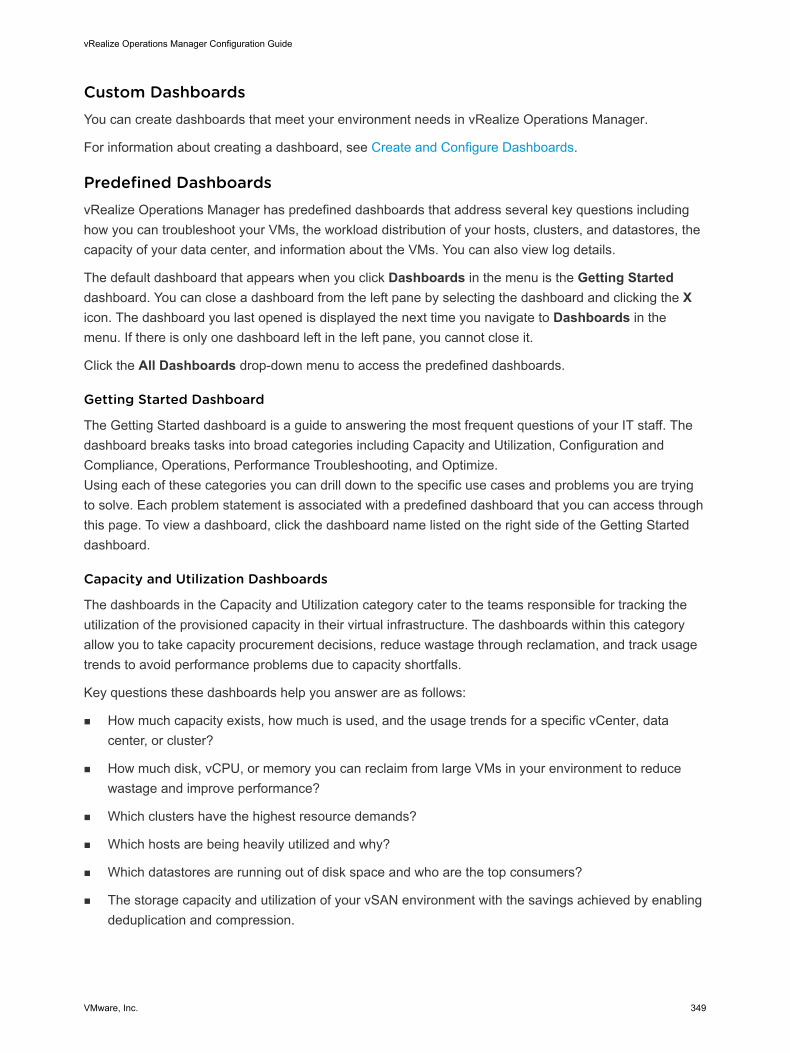
Custom DashboardsYou can create dashboards that meet your environment needs in vRealize Operations Manager.
For information about creating a dashboard, see Create and Configure Dashboards.
Predefined DashboardsvRealize Operations Manager has predefined dashboards that address several key questions including how you can troubleshoot your VMs, the workload distribution of your hosts, clusters, and datastores, the capacity of your data center, and information about the VMs. You can also view log details.
The default dashboard that appears when you click Dashboards in the menu is the Getting Started dashboard. You can close a dashboard from the left pane by selecting the dashboard and clicking the X icon. The dashboard you last opened is displayed the next time you navigate to Dashboards in the menu. If there is only one dashboard left in the left pane, you cannot close it.
Click the All Dashboards drop-down menu to access the predefined dashboards.
Getting Started Dashboard
The Getting Started dashboard is a guide to answering the most frequent questions of your IT staff. The dashboard breaks tasks into broad categories including Capacity and Utilization, Configuration and Compliance, Operations, Performance Troubleshooting, and Optimize.Using each of these categories you can drill down to the specific use cases and problems you are trying to solve. Each problem statement is associated with a predefined dashboard that you can access through this page. To view a dashboard, click the dashboard name listed on the right side of the Getting Started dashboard.
Capacity and Utilization Dashboards
The dashboards in the Capacity and Utilization category cater to the teams responsible for tracking the utilization of the provisioned capacity in their virtual infrastructure. The dashboards within this category allow you to take capacity procurement decisions, reduce wastage through reclamation, and track usage trends to avoid performance problems due to capacity shortfalls.
Key questions these dashboards help you answer are as follows:
n How much capacity exists, how much is used, and the usage trends for a specific vCenter, data center, or cluster?
n How much disk, vCPU, or memory you can reclaim from large VMs in your environment to reduce wastage and improve performance?
n Which clusters have the highest resource demands?
n Which hosts are being heavily utilized and why?
n Which datastores are running out of disk space and who are the top consumers?
n The storage capacity and utilization of your vSAN environment with the savings achieved by enabling deduplication and compression.
vRealize Operations Manager Configuration Guide
VMware, Inc. 349
Capacity Allocation Overview DashboardThis dashboard provides an overview of allocation ratios for virtual machines, vCPUs, and memory for a specific data center or cluster.Cluster Utilization DashboardThe Cluster Utilization dashboard helps you identify vSphere clusters that are extensively consumed from a CPU, memory, disk, and network perspective.
You can use this dashboard to identify the clusters that cannot serve the virtual machine demand.
You can select a cluster with high CPU, memory, disk, or network demand. The dashboard lists the ESXi hosts that are a part of the given cluster. If there is an imbalance in the use of hosts within the selected clusters, you can balance the hosts by moving the VMs within the cluster.
You can use this dashboard to view the historical cluster demand. If the situation is critical, use Workload Balance and move the VMs out of the clusters to avoid potential performance issues. For more information, see Chapter 3 Configuring and Using Workload Optimization. If all the clusters in a given environment display the same pattern, you might have to add new capacity to cater to the increase in demand.Datastore Utilization DashboardThe Datastore Utilization dashboard helps you identify storage provisioning and utilization patterns in a virtual infrastructure.
As a best practice, ensure that the datastores are of standard size, to manage storage in your virtual environments. The heat map on this dashboard displays all the datastores monitored by vRealize Operations Manager and groups them by clusters.
The dashboard uses colors to depict the utilization pattern of the datastores. Grey represents an underutilized datastore, red represents a datastore that has run out of disk space, and green represents an optimally used datastore. You can select a datastore from the dashboard to see the past utilization trends and forecasted usage. The dashboard lists all the VMs that run on the selected datastore. You can reclaim storage used by large VM snapshots or powered off VMs.
You can use the vRealize Operations Manager action framework to reclaim resources by deleting the snapshots or unwanted powered off VMs.
n Datastore Capacity and Utilization: Use this widget to find out which datastores are overused and which ones are underused. You can also find out whether the datastores are of equal size. When you select a datastore from this widget, the dashboard is automatically populated with the relevant data.
n VMs in the Selected Datastore: Use this widget to view a list of VMs based on the datastore you select. You can also view relevant details such as whether the VMs are powered on and the size of the snapshot if any.
n Usage Trend of Selected Datastore: Use this widget to find out the trends in capacity used by a selected datastore as against the total capacity available.
n All Shared Datastores in the Environment: Use this widget to view a list of datastores that are shared in your environment. The information displayed in this widget helps you make an informed decision about whether you have to rebalance the capacity of the datastores based on usage.
vRealize Operations Manager Configuration Guide
VMware, Inc. 350
Heavy Hitter VMsThe Heavy Hitter VMs dashboard helps you identify virtual machines which are consistently consuming a large amount of resources from your virtual infrastructure. In heavily over-provisioned environments, this might create resource bottlenecks resulting in potential performance issues.
You can use this dashboard to identify the resource utilization trends of each of your vSphere clusters. With the utilization trends, you can also view a list of VMs within those clusters based on their resource demands from the CPU, memory, disk, and network within your environment. You can also analyze the workload pattern of these VMs over the past week to identify heavy hitter VMs which might be running a sustained, heavy workload that is measured over a day, or bursty workloads that is measured using peak demand.
You can export a list of offenders and take appropriate action to distribute this demand and reduce potential bottlenecks.
You can use the dashboard widgets in several ways.
n Select a Cluster: Use this widget to select a cluster. You can use the filter to narrow your list based on several parameters. After you identify the cluster you want to view, select it. The dashboard is automatically populated with the relevant data.
n Cluster CPU and Cluster Memory: Use these widgets to view the CPU and memory for the cluster.
n Cluster IOPS and Cluster Network Throughput: Use these widgets to view the IOPS and network throughput for the cluster.
n Use the other widgets in the dashboard to view which VMs in the cluster generated the highest network throughput and IOPS. You can also view which VMs in the cluster generated the highest CPU demand and the highest memory demand. You can compare the information for the VM with the results for the cluster and correlate the trends. You can manually set the time to the time period for which you want to view data.
Host Utilization DashboardThe Host Utilization dashboard helps you identify hosts that are extensively consumed from a CPU, memory, disk, and network perspective.
You can use this dashboard to identify hosts that cannot serve the virtual machine demand. The dashboard provides a list of the top 10 virtual machines. You can identify the source of this unexpected demand and take appropriate actions.
You can use the dashboard to view demand patterns over the last 24 hours and identify hosts that have a history of high demand. You must move the virtual machines out of these hosts to avoid potential performance issues. If all the hosts of a given cluster display the same pattern, you might have to add new capacity to cater to the increase in demand.Utilization Overview DashboardThe Utilization Overview dashboard helps you view the available capacity in the virtual infrastructure.
The Utilization Overview dashboard allows you to assess the utilization at each resource group level such as vCenter, data center, custom data center, or vSphere cluster. You can quickly select an object and view the total capacity, used capacity, and usable capacity of the object to understand the current capacity situation.
vRealize Operations Manager Configuration Guide
VMware, Inc. 351
You can use the dashboard widgets in several ways.
n Total Environment Summary: Use this widget to view the total available capacity in the environment including information about the number of hosts and datastores. You can also view storage, memory, and CPU capacity, and the number of physical CPUs.
n Select an Environment: Use this widget to select a data center, a cluster compute resource, or a vCenter Server. You can use the filter to narrow your list based on several parameters. After you identify the data center you want to view, select it. The dashboard is populated with the relevant data.
n Inventory: Use this widget to view the number of running VMs and hosts. You can also view the number of datastores and the consolidation ratio in the environment.
n Usable Capacity (Exclude HA Buffers): Use this widget to view the capacity that is available in the virtual infrastructure.
n Used Capacity: Used this widget to view how the capacity is used in various data centers and clusters.
n Capacity Remaining: Use this widget to view the capacity remaining in terms of memory, storage, and CPU capacity remaining.
n Predicted Time Remaining: Use this widget to view the predicted time remaining based on the use patterns in the environment.
n Cluster Capacity Details: Use this widget to view detailed capacity information for each cluster.
VM Utilization DashboardThe VM Utilization dashboard helps you as an administrator to capture the utilization trends of any VM in your environment. You can list the key properties of a VM and the resource utilization trends for a specific time period. You can share the details with the VM or application owners.
The dashboard displays resource utilization trends so that the VM or application owners can view these trends when they expect a high load on applications. For example, activities like batch jobs, backup schedules, and load testing. Application owners must ensure that the VMs do not consume 100% of the provisioned resources during these periods. Excessive consumption of the provisioned resources can lead to resource contention within the applications and can cause performance issues.
n Search for a VM to Report its Usage: Use this widget to select the VM you want to troubleshoot. You can use the filter to narrow your list based on several parameters. After you identify the VM that you want to view, select it. The dashboard is automatically populated with the relevant data.
n About the VM: Use this widget to view the VM you selected and its details. You select the VM in the Search for a VM to Report its Usage widget.
n VM Utilization Trend: CPU, Memory, IOPS, Network: Use this widget to view information about the utilization and allocation trends for CPU demand, memory workload, disk commands per second, and the network usage rate.
vSAN Capacity OverviewThe vSAN Capacity Overview dashboard provides an overview of vSAN storage capacity and savings achieved by enabling deduplication and compression across all vSAN clusters.
vRealize Operations Manager Configuration Guide
VMware, Inc. 352
You can view current and historical use trends, and future procurement requirements from the dashboard. You can view details such as capacity remaining, time remaining, and storage reclamation opportunities to make effective capacity management decisions.
You can view the distribution of use among vSAN disks from the dashboard. You can view these details either as an aggregate or at an individual cluster level.vSAN Stretched ClustersThe vSAN Stretched Clusters dashboard provides an overview of the cluster resources used across vSAN fault domains. Using the stretched clusters dashboard you can monitor the resource consumption at the site level for Preferred Sites and Secondary Sites. You can create custom dashboards for specific vSAN stretched cluster metrics.
Where to View vSAN Stretched Cluster Objects
On the menu, click Dashboard > Capacity and Utilization > vSAN Stretched Clusters.
You can also view the vSAN stretched cluster objects from Environment > VMware vSAN > vSAN and Storage Devices > vSAN Clusters, if the vSAN cluster is a stretched cluster.
The vSAN Stretched Clusters dashboard provides information about CPU Capacity, Cores, Memory Capacity, and Disk Capacity for the Preferred Site and the Secondary Site. You can identify the vSAN stretched clusters running out of capacity looking at the utilization metrics.
Configuration and Compliance Dashboards
The dashboards in the Configuration and Compliance category cater to administrators who are responsible for managing configuration drifts within a virtual infrastructure. Since most of the issues in a virtual infrastructure are a result of inconsistent configurations, dashboards in this category highlight the inconsistencies at various levels such as VMs, hosts, clusters, and virtual networks. You can view a list of configuration improvements that helps you avoid problems that are caused because of misconfigurations.
Your IT security teams can also measure your environment against the vSphere hardening best practices to ensure that your environment is fully secured and meets all the compliance standards.
Key questions these dashboards help you answer are as follows:
n Are the vSphere clusters consistently configured for high availability (HA) and optimal performance?
n Are the ESXi hosts consistently configured and available to use?
n Are the VMs sized and configured as per the recommended best practices?
n Are virtual switches configured optimally?
n Is the environment configured in accordance with the vSphere Hardening Guide?
Cluster Configuration DashboardThe Cluster Configuration dashboard provides a quick overview of your vSphere cluster configurations. The dashboard highlights the areas that are important in delivering performance and availability to your virtual machines. The dashboard also highlights if there are clusters which are not configured for DRS, High Availability (HA), or admission control to avoid any resource bottlenecks or availability issues when a host fails.
vRealize Operations Manager Configuration Guide
VMware, Inc. 353
The heat map in this dashboard helps you to identify if you have hosts where vMotion was not enabled as this may not allow the VMs to move from or to that host. This may cause potential performance issues for the VMs on that host if the host gets too busy. You can also view how consistently your clusters are sized and whether the hosts on each of those clusters are consistently configured.
The Cluster Properties widget in this dashboard allows you to report on all these parameters by exporting the data. You can share the data with the relevant stakeholders within your organization.
You can use the dashboard widgets in several ways.
n vSphere DRS Status, vSphere HA Status, and HA Admission Control Status: Use these widgets to view if there are clusters that are not configured for DRS, HA, or admission control. With the information, you can avoid resource bottlenecks or availability issues when a host fails.
n Is vMotion enabled on hosts in a cluster: Use this widget to identify if you have hosts where vMotion was not enabled. If vMotion is not enabled, the VMs do not move from or to the host and causes potential performance issues in the VMs on that host if the host gets too busy.
n Host Count across Clusters: Use this widget to view all the clusters in your environment. If the clusters have a consistent number of hosts, the boxes displayed are of equal size. This representation helps you determine whether there is a large deviation among cluster sizes, whether there is a small cluster with fewer than four hosts, or whether there is a large cluster. Operationally, keep your clusters consistent and of moderate size.
n Attributes of ESXi Hosts in the Selected Cluster: Use this widget to view the configuration details for the hosts within a cluster.
n All Clusters Properties: Use this widget to view the properties for all the clusters in the widget.
Distributed Switch Configuration DashboardThe Distributed Switch Configuration dashboard allows you to view details of virtual switch configuration and utilization. When you select a virtual switch, you can see the list of ESXi hosts, distributed port groups, and virtual machines that use or are on the selected switch. You can also find out which ESXi hosts and VMs use a specific switch.
You can identify misconfigurations within various network components by reviewing the properties listed in the views within the dashboard. You can track important information such as the IP address and the MAC address assigned to the virtual machines.
As a network administrator, you can use this dashboard to get visibility into the virtual infrastructure network configuration.
You can use the dashboard widgets in several ways.
n Select a Distributed Switch: Use this widget to select the switch for which you want to view details. You can use the filter to narrow your list based on several parameters. After you identify the switch that you want to view, select it. The dashboard is automatically populated with the relevant data.
n Distributed Port Groups on the Switch: Use this widget to view the port groups on the switch, how many ports each switch has, and the usage details.
vRealize Operations Manager Configuration Guide
VMware, Inc. 354
n ESXi Hosts/VMs Using the Selected Switch: Use these widgets to find out which ESXi hosts and VMs use the selected switch. You can also view configuration details about the ESXi hosts and VMs that use the selected switch.
Host Configuration DashboardThe Host Configuration dashboard provides an overview of your ESXi host configurations, and displays inconsistencies so that you can take corrective action.
The dashboard also measures the ESXi hosts against the vSphere best practices and indicates deviations that can impact the performance or availability of your virtual infrastructure. Although you can view this type of data in other dashboards, in this dashboard you can export the ESXi configuration view and share it with other administrators.VM Configuration DashboardThe VM dashboard focuses on highlighting the key configurations of the virtual machines in your environment. You can use this dashboard to find inconsistencies in configuration within your virtual machines and take quick remedial measures. You can safeguard the applications which are hosted on these virtual machines by avoiding potential issues due to misconfigurations.
Some of the basic problems the dashboard focuses on includes identifying VMs running on older VMware tools versions, VMware tools not running, or virtual machines running on large disk snapshots. VMs with such symptoms can lead to potential performance issues and hence it is important that you ensure that they do not deviate from the defined standards. This dashboard includes a predefined Virtual Machine Inventory Summary report which you can use to report the configurations highlighted in this dashboard for quick remediation.
You can use the dashboard widgets in several ways.
n Use the Large VMs widgets to view graphical representations of VMs that have a large CPU, RAM, and disk space.
n Guest OS Distribution: Use this widget to view a break up of the different flavors of operating systems you are running.
n Guest Tools Version and Guest Tools Status: Use these widgets to identify if you have inconsistent or older version of VMware tools which might lead to performance issues.
n View the VMs with limits, large snapshots, orphaned VMs, VMs with more than one NIC, and VMs with a nonstandard operating system. These VMs have a performance impact on the rest of the VMs in your environment even though they do not fully use their allocated resources.
You can customize the views in the widgets.
1 Click the Edit Widget icon from title bar of the widget. The Edit widget dialog box is displayed.
2 From the Views section, click the Edit View icon. The Edit View dialog box is displayed.
3 Click the Presentation option in the left pane and make the required modifications.
vSphere Security Compliance DashboardThe vSphere Security Compliance dashboard measures your environment against the vSphere Hardening Guide and lists any objects which are non-compliant.
vRealize Operations Manager Configuration Guide
VMware, Inc. 355
This dashboard displays the trend of high risk, medium risk, and low risk violations and shows the overall compliance score of your virtual infrastructure. Using heat maps, you can investigate various components to check the compliance for your ESXi hosts, clusters, port groups, and virtual machines. Each non-compliant object is listed in the dashboard with recommendations on the remediation required to secure your environment.
Operations Dashboards
The dashboards in the Operations category are most helpful to personnel within an organization that require a summary of important data to take quick decisions. As a member of the network operations center (NOC) team, you may want to identify problems and take action or as an executive, you may want a quick overview of your environments to keep track of important KPIs.
Key questions these dashboards help you answer are as follows:
n What does the infrastructure inventory look like?
n What is the alert volume trend in the environment?
n Are virtual machines being served well?
n Are there areas in the data center you have to worry about?
n What does the vSAN environment look like and are there optimization opportunities by migrating VMs to vSAN?
Datastore Usage Overview DashboardThe Datastore Usage Overview dashboard provides a view of all the virtual machines in your environment in a heat map. The dashboard is suitable for an NOC environment.
The heat map contains a box for each virtual machine in your environment. You can identify the virtual machines that are generating excessive IOPS because the boxes are sized by the number of IOPS they generate.
The colors of the boxes represent the latency experienced by the virtual machines from the underlying storage. An NOC administrator can investigate the cause of this latency and resolve it to avoid potential performance problems.Host Usage Overview DashboardThe Host Usage Overview dashboard provides a view of all the ESXi hosts in your environment in a heat map. The dashboard is suitable for an NOC environment.
Using this dashboard an NOC administrator can easily find resource bottlenecks created due to excessive Memory Demand, Memory Consumption or CPU Demand.
The heat map displays hosts grouped by clusters to help you locate clusters that are using excessive CPU or memory. You can also identify if you have ESXi hosts within the clusters that are not evenly utilized. An administrator can then trigger activities such as workload balance or set DRS to ensure that hot spots are eliminated.Migrate to vSANThe Migrate to vSAN dashboard provides you with an easy way to move virtual machines from existing storage to newly deployed vSAN storage.
vRealize Operations Manager Configuration Guide
VMware, Inc. 356
You can use this dashboard to select non-vSAN datastores that might not serve the virtual machine IO demand. By selecting the virtual machines on a given datastore, you can identify the historical IO demand and the latency trends of a given virtual machine. You can then find a suitable vSAN datastore which has the space and the performance characteristics to serve the demand of this VM. You can move the virtual machine from the existing non-vSAN datastore to the vSAN datastore. You can continue to watch the use patterns to see how the VM is served by vSAN after you move the VM.Operations Overview DashboardThe Operations Overview dashboard provides you with a high-level view of objects which make up your virtual environment. You can view an aggregate of the virtual machine growth trends across the different data centers that vRealize Operations Manager monitors.
You can also view a list of all your data centers with inventory information about how many clusters, hosts, and virtual machines you are running in each of your data centers. By selecting a particular data center, you can narrow down on the areas of availability and performance. The dashboard provides a trend of known issues in each of your data centers based on the alerts which have triggered in the past.
You can also view a list of the top 15 virtual machines in the selected data center which might be contending for resources.
You can use the dashboard widgets in several ways.
n Environment Summary: Use this widget to view a summary of the overall inventory of your environment.
n Select a Datacenter: Use this widget to select the data center for which you want to view operational information. You can use the filter to narrow your list based on several parameters. After you identify the data center you want to view, select it. The dashboard is automatically populated with the relevant data.
n Cumulative Up-time of all Clusters: Use this widget to view the overall health of the clusters in the data center you selected. The metric value is calculated based on the uptime of each ESXi host, when you take into account one host as the HA host. If the number displayed is less than 100%, it means that at least two hosts within the cluster were not operational for that period.
n Alert Volume (in selected DC): Use this widget to view the breakdown of alert trends based on their criticality.
n Top-N: You can also view a list of 15 VMs that had the highest average CPU contention, the highest use of memory, and the highest disk latency for the last 24 hours. To obtain specific data, you can manually set the time to the time of the problem. To set the time, click the Edit Widget icon from the title bar of the widget and edit the Period Length drop-down menu.
vSAN Operations OverviewThe vSAN Operations Overview dashboard provides an aggregated view of the health and performance of your vSAN clusters.
You can use this dashboard to get a complete view of your vSAN environment and what components make up the environment. You can also view the growth trend of virtual machines served by vSAN.
vRealize Operations Manager Configuration Guide
VMware, Inc. 357
You can use the dashboard to understand the utilization and performance patterns for each of your vSAN clusters by selecting one from the list that is provided. You can use this dashboard to track vSAN properties such as hybrid or all flash, deduplication and compression, or a stretched vSAN cluster.
You can view the historic performance, utilization, growth trends, and events related to vSAN, with the current state.
You can identify the vSAN encryption status at cluster levels.
Optimize Dashboards
The Optimize group of dashboards include the Optimize Performance, Access Cost, and Optimization History dashboards.Assess Cost DashboardThe Assess Cost dashboard gives you cost and reclaimable resources for your data centers and clusters.
The Assess Cost dashboard belongs to the Optimize group of dashboards. This dashboard is ideal for executives, finance, or others who are accountable for overall IT spend. It is also helpful for identifying and planning cost optimization initiatives.
Any cost information shown in this dashboard is using the currency settings you select during vRealize Operations Manager configuration.
The dashboard provides an overview of the cost and inventory for your environment, including total cost of ownership and a total of the potential cost savings based on vRealize Operations capacity engine recommendations.
Individual data centers are listed showing population details, cost information, and reclaimable resources.
At the bottom of the dashboard, you can find the top 10 lists for the most expensive and least expensive clusters in your environment. These lists include the total monthly cost and count of hosts, datastores, and virtual machines. These lists can be helpful in identification of under-utilized clusters by noting the number of virtual machines hosted relative to the monthly cluster cost.Optimization History DashboardThe Optimization History dashboard displays the results of optimization activity.
The Optimization History dashboard belongs to the Optimize group of dashboards. The dashboard covers three optimization benefits; optimize performance, optimize capacity, and optimize virtual machine placement.
Optimizing performance can be performed in vRealize Operations Manager using Workload Optimization, or started on demand. The charts on this row show a box for each data center or custom data center and the optimization recommendation. Green indicates an optimized data center or custom data center. A red box means that optimization might be required, and a white box means that optimization is not configured for that object.
For capacity optimization, this row provides a summary of the average VM cost per month, the savings that can be achieved through reclaiming idle or powered off virtual machines, or deleting old snapshots.
vRealize Operations Manager Configuration Guide
VMware, Inc. 358
Virtual Machine Happiness is a term used to describe VMs that are getting the resources they need, when they need them. You can also see recent vMotion activity related to vSphere's Distributed Resource Scheduler, which together with vRealize Operations predictive DRS feature makes sure your VMs are getting the resources they need. Workload placement vMotions are also shown as Non-DRS Moves in the graph.Optimize Performance DashboardThe Optimize Performance dashboard helps you identify virtual machines that can be configured to improve overall performance.
The capacity analytics engine intelligently calculates the settings for CPU and memory for virtual machines to give you the best performance and accurate resource allocation for all workloads.
The dashboard organizes virtual machines by undersized - or virtual machines that are not being served well - and oversized - which are virtual machines that are not using all allocated resources. Both categories consider CPU and memory usage and provide recommendations for optimal sizing.
Performance Troubleshooting Dashboards
The dashboards in the Performance Troubleshooting category cater to the administrators responsible for managing the performance and availability of the virtual machines running in the virtual infrastructure. This category runs you through a guided workflow to answer questions that help you with the troubleshooting process. The dashboards in this category identify and isolate problems that may impact your applications. They provide insight into the full stack to isolate and identify the root cause quickly.
Key questions these dashboards help you answer are as follows:
n Is the application performance impacted due to virtual infrastructure?
n Are noisy neighbors impacting multiple virtual machines and corresponding applications?
n Are there active alerts which require action?
n Are there any known issues impacting the performance and availability of a vSAN cluster?
Troubleshoot a ClusterThe Troubleshoot a Cluster dashboard allows you to identify clusters that have issues and isolate them easily.
You can use the search option to identify a cluster that has an issue. You can also sort the clusters based on the number of active alerts.
After you select the cluster you want to work with, you can view a quick summary of the number of hosts in that cluster and the VMs served by the cluster. The dashboard provides you with current and past utilization trends and also known issues in the cluster in the form of alerts.
You can view the hierarchy of objects related to the cluster and review the status to identify if the objects are impacted because of the current health of the cluster. You can quickly identify any contention issues by looking at the maximum and average contention faced by the VMs on the selected cluster. You can narrow down and view those VMs that have resource contention and take specific steps to troubleshoot and resolve issues.
vRealize Operations Manager Configuration Guide
VMware, Inc. 359
You can use the dashboard widgets in several ways.
n Search for a cluster: Use this widget to select the cluster for which you want to view performance details. You can use the filter to narrow your list based on several parameters. After you identify the cluster you want to view, select it. The dashboard is automatically populated with the relevant data.
n Is your cluster busy?: Use this widget to view the CPU and memory demand.
n Are there active alerts on your cluster: Use this widget to view only the critical alerts.
n Are the relatives healthy?: Use this widget to view the hierarchy of the objects related to the cluster and if any of the objects are impacted.
n View the maximum and average CPU, memory, and disk latency for the VMs. If the VM faces contention, it might mean that the underlying infrastructure does not have enough resources to meet the needs of the VMs.
n View a list of VMs that face CPU, memory, and disk latency contention. You can then troubleshoot and take steps to resolve the problem.
Troubleshoot a DatastoreThe Troubleshoot a Datastore dashboard allows you to identify storage issues and act on them.
You can use the search option to identify a datastore that has an issue or you can identify a datastore that has high latency as seen in red on the heat map. You can also sort all the datastores with active alerts and troubleshoot the datastore with known issues.
You can select a datastore to see its current capacity and utilization with the number of VMs served by that datastore. The metric charts help you view historical trends of key storage metrics such as latency, outstanding IOs, and throughput.
The dashboard also lists the VMs served by the selected datastore and helps you analyze the utilization and performance trends of those VMs. You can migrate the VMs to other datastores to even out the IO load.
You can use the dashboard widgets in several ways.
n Search for a datastore: Use this widget to select the datastore for which you want to view performance details. You can use the filter to narrow your list based on several parameters. After you identify the datastore you want to view, select it. The dashboard is automatically populated with the relevant data.
n Are there active alerts on your datastore: Use this widget to view only the critical alerts.
n Are the relatives healthy?: Use this widget to view the hierarchy of the objects related to the datastore and if any of the objects are impacted.
n Is your datastore experiencing high latency? and Any outstanding disk I/Os?: Use these widgets to view those datastores with high latency and outstanding disk I/O trends. Ideally, your datastores must not have outstanding disk I/O.
n How many IOPS is your datastore serving and Latency trend for the I/Os done by the VM: Use these widgets to view the current IOPS and latency of the VMs in the selected datastore.
vRealize Operations Manager Configuration Guide
VMware, Inc. 360
n Use the other widgets in the dashboard to view trends for the selected datastore regarding disk latency, IOPS, and throughput, VMs served by the datastore and I/O pattern of the selected VM.
Troubleshoot a HostThe Troubleshoot a Host dashboard allows you to search for specific hosts or sort hosts with active alerts. ESXi hosts are the main source of providing resources to a VM and are critical for performance and availability.
To view the key properties of each host, select a host from the dashboard. You can ensure that the host is configured according to the virtual infrastructure design. Any deviation from standards might cause potential issues. You can use the dashboard to answer key questions about current and past utilization and workload trends over the last week. You can also view if the VMs served by the host are healthy.
Since the dashboard lists all the critical events that might affect the availability of the hosts, you can view hardware faults associated with the host. You can view a list of the top 10 VMs that demand CPU and memory resources from the identified host.Troubleshoot a VM DashboardThe Troubleshoot a VM dashboard helps an administrator to troubleshoot everyday issues in a virtual infrastructure. While most of the IT issues in an organization are reported at the application layer, you can use the guided workflow in this dashboard to help investigate an ongoing or a suspected issue with the VMs supporting the impacted applications.
You can search for a VM by its name or you can sort the list of VMs with active alerts on them to start your troubleshooting process. When you select a VM, you can view its key properties to ensure that the VM is configured as per your virtual infrastructure design. Any deviation from standards may cause potential issues. You can view known alerts and the workload trend of the VM over the past week. You can also view if any of the resources serving the virtual machine have an ongoing issue.
The next step in the troubleshooting process allows you to eliminate the major symptoms which might impact the performance or availability of a VM. You can use key metrics to find out if the utilization patterns of the VMs are abnormal or if the VM is contending for basic resources such as CPU, memory, or disk.
You can use the dashboard widgets in several ways.
n Search for a VM: Use this widget to view all the VMs in the environment. You can select the VM you want to troubleshoot. You can use the filter to narrow your list based on several parameters, such as name, folder name, associated tag, host, or vCenter Server. After you identify the VM you want to troubleshoot, select it. The dashboard is automatically populated with the relevant data.
n About the VM: Use this widget to understand the context of the VM. This widget also lends insights to analyze the root cause of the problem or potential mitigations.
n Are there active alerts on the VM?: Use this widget to view active alerts. To see noncritical alerts, click the VM object.
n Is the VM working hard over the last week?: Use this widget to view the workload trend of the VM for the last week.
vRealize Operations Manager Configuration Guide
VMware, Inc. 361
n Are the relatives healthy?: Use this widget to view the ESXi host where the VM is now running. This host might not be the ESXi host where the VM was running in the past. You can view the remaining related objects and see whether they might contribute to the problem.
n Is the VMs demand spiking or abnormal?: Use this widget to identify spikes in the VM demand for any of the resources such as CPU, memory, and network. Spikes in the demand might indicate an abnormal behavior of the VM or that the VM is undersized. The memory utilization is based on the Guest OS metric. It requires VMware Tools 10.0.0 or later and vSphere 6 Update 1 or later. If you do not have these products, the metric remains blank.
n Is the VM facing contention?: Use this widget to identify whether the VM is facing contention. If the VM is facing contention, the underlying infrastructure might not have enough resources to meet the needs of the VM.
n Does the cluster serving the VM have contention?: Use this widget to view the trend for the maximum CPU contention for a VM within the cluster. The trend might indicate a constant contention within the cluster. If there is contention, you must troubleshoot the cluster as the problem is no longer with the VM.
n Does the datastore serving the VM have latency?: Use this widget to help you correlate the latency at the datastore level with the total latency of the VM. If the VM has latency spikes, but the datastore does not have such spikes, it might indicate a problem with the VM. If the datastore faces latency as well, you can troubleshoot to find out why the datastore has these spikes.
n Parent Host and Parent Cluster: Use these widgets to view the host and the cluster on which the VM resides.
Troubleshoot an Application DashboardYou can use this dashboard to determine the logical path to troubleshoot an application by identifying bottlenecks to performance and eliminating SDDC components that are healthy.
Select the application service you want to troubleshoot. You see the components of the application service, the guest operating system, and supporting SDDC components. You can also view KPIs for the selected application service and see the alerts for the selected object. If necessary, you can select metrics for the selected objects and view how they are trending.Troubleshoot vSAN DashboardThe Troubleshoot vSAN dashboard helps you view the properties of your vSAN cluster and the active alerts on the cluster components. The cluster components include hosts, disk groups, or the vSAN datastores.
You can select a cluster from the dashboard and then list all the known problems with the objects associated with the cluster. The objects include clusters, datastores, disk groups, physical disks, and VMs served by the selected vSAN cluster.
You can view the key use and performance metrics from the dashboard. You can also view the usage and performance trend of the cluster for the last 24 hours. You can also view historical issues and analyze the host, disk group, or physical disk.
vRealize Operations Manager Configuration Guide
VMware, Inc. 362
You can use the heat maps within the dashboard to answer questions about write buffer usage, cache hit ratio, and host configurations. You can also use the heat maps to answer questions about physical issues with capacity and cache disks, such as drive wear out, drive temperature, and read-write errors.
You can use the dashboard widgets in several ways.
n Search for a vSAN cluster: Use this widget to search vSAN clusters. You can view the details of each vSAN cluster including the number of hosts, VMs, cache disks, capacity disks, and cluster type are provided. You can also view if the vSAN cluster is dedupe and compression enabled, and stretched.
n Any alerts on the cluster, hosts, VMs or disks?: Use this widget to view alerts on the cluster, VMs, or disks in your environment.
n Are the relatives healthy?: Use this widget to view the health, risk, and efficiency of the relatives. This widget also allows you to view the health of the datastore in a host and disks in each disk group.
n Are outstanding I/Os high?: Use this widget to view the key performance metrics. The widget indicates outstanding I/Os within 24 hours time period.
n Are VMs facing read latency?: Use this widget to view the read latency of VMs.
n Are VMs facing write latency?: Use this widget to view the write latency of VMs.
n Is the write buffer low?: Use this widget to view the usage of the write buffer on diskgroups in a cluster.
n Are the hosts consistently configured?: Use this widget to view the participating hosts in the selected cluster and to determine if the hosts are consistently configured.
n Cache Disks: Any hardware issues?: Use this widget to view the individual cache disks measured against various metrics.
n Capacity Disks: Any hardware issues?: Use this widget to view the individual capacity disks measured against various metrics.
Troubleshoot with Logs DashboardWhen vRealize Operations Manager is integrated with vRealize Log Insight, you can access the custom dashboards and content pack dashboards from the Troubleshoot with Logs dashboard. You can view graphs of log events in your environment, or create custom sets of widgets to access the information that matters most to you.
You can investigate an ongoing issue within your virtual infrastructure using the logs. You can view predefined views created within vRealize Log Insight to answer questions from predefined queries within vRealize Log Insight.
You can correlate metrics and queries within vRealize Operations Manager to troubleshoot issues across applications and infrastructure.
For more information about the Troubleshoot with Logs dashboard, see the vRealize Log Insight documentation.
vRealize Operations Manager Configuration Guide
VMware, Inc. 363
To access the Troubleshoot with Logs dashboard from vRealize Operations Manager, you must either:
n Configure the vRealize Log Insight adapter from the vRealize Operations Manager interface, or
n Configure vRealize Operations Manager in vRealize Log Insight.
For more information on configuring, see Configuring vRealize Log Insight with vRealize Operations Manager.
vRealize Automation 7.x Dashboards
With the vRealize Automation 7.x dashboards, you can monitor and troubleshoot objects in your cloud infrastructure.
The following vRealize Automation 7.x dashboards are added to the predefined vRealize Operations Manager dashboards:
n Application Overview
n Environment Overview
n Resource Consumption Overview
n Top-N
Application Overview DashboardYou can use the widgets in the Application Overview dashboard to view the blueprint objects and the blueprint deployment details.
You can use the Application Overview dashboard to view the hierarchy, the properties of the blueprint and deployments, and the metric information.
You can use the dashboard widgets in several ways.
n Blueprint List: Use this widget to view the blueprint objects in the environment.
n Blueprint Overview: Use this widget to view the relationship between the blueprint objects and the deployment, virtual machines, cluster compute resources, and the datastore objects. To find the deployment, virtual machine, and other related details, click the blueprint object.
n Blueprint Property List: Use this widget to view the properties of the blueprint object such as the total cost, average deployment time, and the average cost of the blueprint object .
n Deployment List: Use this widget to view the blueprint objects deployed in the environment.
n Deployment Property List: Use this widget to view the properties for the deployment object such as the cost until date and the approval time for each deployment.
n Blueprint Deployment Info: Use this widget to select a metric. You can view the details in the Metric Chart widget.
n Metric Chart: Use this widget to view the relevant data based on the metric you select in the Blueprint Deployment Info widget.
n Virtual Machine: Use this widget to view VMs that belong to the deployment.
vRealize Operations Manager Configuration Guide
VMware, Inc. 364
n Configured Users: Use this widget to view information about the user that the virtual machine belongs to.
Environment Overview DashboardYou can use the Environment Overview dashboard to view information about the tenants and the related alerts.
You can use the Environment Overview dashboard to perform some of the following tasks:
n To view the active alerts on vCenter resources that are managed by vRealize Automation.
You can use the dashboard widgets in several ways.
n Environment Summary. Use this widget to view the health of tenants, business groups, virtual machines, blueprints, reservations, deployments, cluster compute resources and the relationships between these objects. If you double-click an object in the Environment Overview widget, you can view detailed information for the object.
n Tenant List. Use this widget to view the tenant objects available in the environment. You can see a data grid with a list of objects in the inventory on which you can sort and search.
n Business Group List. Use this widget to view the business group objects available in the environment. You can see a data grid with a list of objects in the inventory on which you can sort and search. You can see a data grid with a list of objects in the inventory on which you can sort and search.
n Configured Users. Use this widget to view the business group name and the user configured for the business group.
n vRealize Automation Inventory. Use this widget to view the objects available for each vRealize Automation solution that is deployed in the environment.
n vRealize Automation Managed Clusters. Use this widget to view the vCenter clusters which are managed by vRealize Automation. You can see a data grid with a list of objects in the inventory on which you can sort and search.
n Top Alerts. Alerts with the greatest significance on the selected objects it is configured to monitor. The top alerts include a short description of alerts configured for the widget. The alert name opens a secondary window from which you can link to the alert details. In the alert details, you can begin resolving the alerts.
Resource Consumption Overview DashboardYou can use the widgets in the Resource Consumption Overview dashboard to view the resources consumed by vRealize Automation on a vCenter Server.
You can use the Resource Consumption Overview dashboard widgets in several ways.
n Tenant List: Use this widget to view the tenant objects available in the environment. You can see a data grid with a list of tenants objects in the inventory on which you can sort and search.
n Business Group List: Use this widget to view the business group objects available in the environment. You can see a data grid with a list of objects in the inventory on which you can sort and search.
vRealize Operations Manager Configuration Guide
VMware, Inc. 365
n Reservation List: Use this widget to view the reservation objects available in the environment. You can see a data grid with a list of objects in the inventory on which you can sort and search.
n Tenant Capacity: Use this widget to analyze the capacity of the tenant object.
n Business Group Capacity: Use this widget to view the memory, storage, and quota capacity that is allocated, reserved, and free for each business group object.
n Reservation Capacity: Use this widget to view the memory, storage, and quota capacity that is allocated, reserved, and free for each reservation object.
n Tenant Capacity Remaining: Use this widget to view the capacity constrained for a tenant object.
n Business Group Capacity Remaining: Use this widget to view the capacity constrained for a business group object.
n Reservation Capacity Remaining: Use this widget to view the capacity constrained for a reservation object.
n Tenant Memory Trend: Use this widget to view and analyze a seven-day trend for the memory allocated, reserved, and free for a tenant object.
n Tenant Storage Trend: Use this widget to view and analyze a seven-day trend for the storage allocated, reserved, and free for a tenant object.
Top-N DashboardYou can use the widgets in the Top-N dashboard to view the top results from analysis of blueprints, business groups, and tenants that you select.
You can use the Top-N dashboard to perform some of the following tasks:
n To view the most popular blueprints, business groups, and tenants.
n To view the business groups that have the most critical alerts.
You can use the dashboard widgets in several ways.
n Tenant with most critical alerts. Use this widget to view the top- five tenant objects that have the most critical alerts.
n Business Groups with most Critical Alerts. Use this widget to view the top-five business group objects that have the most critical alerts.
n Tenant with most failed requests. Use this widget to view the top-five tenant objects that have the most failed requests.
n Most popular deployed Tenant. Use this widget to view the top-five most popular deployed tenant objects in the environment.
n Most popular deployed Business Group. Use this widget to view the top-five most popular deployed business group objects in the environment.
n Most Popular Deployed Blueprints. Use this widget to view the top-five most popular deployed blueprint objects in the environment.
vRealize Operations Manager Configuration Guide
VMware, Inc. 366
n Most Popular Deployed Business Group (7 day trend). Use this widget to view graphical trends that contain metrics for the virtual machine count that has been deployed the most for the business group object over a seven-day period.
n Most Popular Deployed Blueprints (7 day trend). Use this widget to view graphical trends that contain metrics for the virtual machine count that has been deployed the most for the blueprint object over a seven-day period.
vRealize Automation 8.x Dashboards
With the vRealize Automation 8.x dashboards, you can monitor and troubleshoot objects in your cloud infrastructure.
The following vRealize Automation 8.x dashboards are added to the predefined vRealize Operations Manager dashboards:
n Cloud Automation Environment Overview
n Cloud Automation Project Cost Overview
n Cloud Automation Resource Consumption Overview
n Cloud Automation Top-N Dashboard
Cloud Automation Environment OverviewYou can use the widgets in the Cloud Automation Environment Overview dashboard to view the environment details for the vCenter Cloud Zone objects. You can use the Cloud Automation Environment Overview dashboard to view the projects, deployments associated with the vCenter Cloud accounts.
You can use the dashboard widgets in several ways.
n vCenter Cloud Zone List: Use this widget to view the CPU, Disk, Memory, health, risk, and efficiency details for the cloud zone objects present in your environment.
n Project List: Use this widget to view the total blueprints, cloud zones, deployments, virtual machines, health, risk, efficiency details in your environment.
n Top Alerts: Use this widget to view the top alerts in your environment.
n VM List: Use this widget to view all the VM details in your environment.
n Blueprint List: Use this widget to view the blueprint objects in your environment.
n Deployment List: Use this widget to view the blueprint objects deployed in your environment.
Cloud Automation Project Cost OverviewYou can use the widgets in the Cloud Automation Project Cost Overview dashboard to view the project cost associated with cloud zone objects present in your environment.
You can use the dashboard widgets in several ways.
n Project Cost: Use this widget to view the project wise cost for compute, storage, and additional resources associated with your cloud environment.
n Total Cost Over Time: Use this widget to view the cost of individual projects on a day to day basis.
vRealize Operations Manager Configuration Guide
VMware, Inc. 367
n Deployment Cost by Selected Project: Use this widget to view the deployment cost for the selected project in your cloud environment.
Cloud Automation Resource Consumption OverviewYou can use the widgets in the Cloud Automation Resource Consumption Overview dashboard to view the resources consumed by vRealize Automation 8.x on Cloud Accounts.
You can use the Cloud Automation Resource Consumption Overview dashboard widgets in several ways.
n Cloud Account: Use this widget to view all the attributes related to the cloud account.
n Cloud Zone: Use this widget to view all the attributes related to the cloud zones.
n Project: Use this widget to view all the project details associated with your cloud account.
n Cluster List: Use this widget to view all the details associated with the clusters in your account.
n Cluster Utilization: Use this widget to view the cluster utilization details for the cloud accounts.
n Deployment Heat Map by Project: Use this widget to view the heat map for each deployed project in your cloud environment.
n Cloud Zone Capacity: Use this widget to view the memory and storage capacity that is allocated, reserved, and free for each cloud zone object.
n Cloud Zone Memory Trend: Use this widget to view and analyze a seven-day trend for the memory allocated, reserved, and free for the cloud zone.
n Cloud Zone Storage Trend: Use this widget to view and analyze a seven-day trend for the storage allocated, reserved, and free for the cloud zone.
Cloud Automation Top-N DashboardYou can use the widgets in the Cloud Automation Top-N dashboard to view the projects with most critical alerts, to view the blueprint with most deployments, and to view the deployments with the highest cost.
You can use the dashboard widgets in several ways.
n Project with Most Critical Alerts: Use this widget to view the projects which has most critical alerts.
n Top Alerts: Use this widget to view the top alerts for the projects in your cloud account.
n Blueprints with Most Deployment: Use this widget to view the blueprint which has maximum deployments for the cloud account.
n Relationship: Use this widget to analyze the relationship between blueprints and deployments, and deployment and cost.
n Deployment with Highest Cost: Use this widget to identify the most expensive deployment associated with your cloud account.
Service Discovery Dashboards
Using the service discovery dashboards, you can determine the inter-dependencies of virtual machines and the dependencies of each service in the respective virtual machines.
vRealize Operations Manager Configuration Guide
VMware, Inc. 368
The following service discovery dashboards are added to the predefined vRealize Operations Manager dashboards:
n Service Distribution
n Service Relationships
n Service Visibility
n Virtual Machine Relationships
Service Distribution DashboardYou can use the dashboard to view the distribution of different services in the selected data center, cluster, or a host system. You can also view known and unknown services including the category and distribution percentage across a vSphere resource.
You can use the dashboard widgets in several ways:
n Inventory Item: Use this widget to view a hierarchical representation of objects in the form of badges.
n Known Services Distribution: Use this widget to view different services discovered from a selected object.
n Service Categories: Use this widget to view the service categories that are discovered by selecting an object from the resource widget.
n User Defined Services Distribution: Use this widget to view a list of user-defined services.
Service Relationships DashboardYou can use the dashboard to view properties of the service such as the install path, the ports used, and the version. You can also view the relationship between the services that run on other VMs.
You can use the dashboard widgets in several ways:
n List of Services Discovered: Use this widget to view the services that have been discovered.
n Connections from the Selected Services: Use this widget to view the relationship between the services and the other services running on the VMs.
n Properties of the Selected Service: Use this widget to view the properties of the selected services.
Service Visibility DashboardYou can use the dashboard to view a list of VMs without service visibility and VMs with user-defined services after you select a vSphere object.
You can use the dashboard widgets in several ways:
n Inventory Tree: Use this widget to view a hierarchical representation of objects in the form of badges.
n Virtual Machines without Service Visibility: Use this widget to view information about services where discovery has failed.
n Virtual Machines with User-Defined Services: Use this widget to view a list of VMs where the user has defined such services.
vRealize Operations Manager Configuration Guide
VMware, Inc. 369
Virtual Machine Relationships DashboardYou can use the dashboard to view a list of VMs with service discovery details such as, status, method, incoming/outgoing connections, and protection groups. When you select a VM, the dashboard displays a list of discovered services on the VM, the relationships of the VMs with other VMs based on the relationships of the discovered service.
You can use the dashboard widgets in several ways:
n List of virtual machines: Use this widget to view all the VMs discovered by the vCenter Server.
n Node relationship of the selected VM: Use this widget to view the relationship between the objects.
n List of Services running in the selected VM: Use this widget to view all the properties of the selected VM.
n Connections of Virtual Machines: Use this widget to view the relationship between one or more VMs.
Inventory Dashboards
The three vSphere Inventory dashboards cater to the compute, network, and storage teams. Using these dashboards, you can navigate through the environment and view your inventory and their key metrics at a glance. The Network and Storage dashboards can be shared with the network and storage teams respectively, giving them the necessary visibility, and increasing the collaboration between teams.
While each dashboard is built specifically for each role, they share a common design. They have a similar layout and are used in the same manner. This makes learning easier, especially in smaller environments where the same team manages the full environment.
These dashboards help you answer several key questions:
n What is the topology of your vSphere compute inventory?
n What is the topology of your vSphere storage inventory?
n What is the topology of your vSphere network inventory?
vSphere Compute Inventory DashboardYou can use the vSphere Compute Inventory Dashboard to browse through the topology of your vSphere compute inventory which includes information related to vSphere world, vCenter Server, data center, clusters, hosts, virtual machines, properties, and metrics.
You can select an object type to view the properties and metrics related to it. You can also view the clusters, ESXi hosts, and virtual machines associated with the object.
You can use the dashboard widgets in several ways.
n Properties: View the properties related to an object in the environment.
n Metrics: View the metrics related to the object.
n Clusters: View the cluster functionality.
n ESXi Hosts: View the data related to the hosts.
n Virtual Machines: View VMs that belong to the object.
vRealize Operations Manager Configuration Guide
VMware, Inc. 370
vSphere Network Inventory DashboardThe vSphere Network Inventory Dashboard allows you to browse through the topology of your vSphere network inventory which includes information related to vSphere world, vCenter Server, data center, distributed vSwitches, distributed port groups, virtual machines, properties, and metrics.
You can select an object type to view the properties and metrics related to it. You can also view the distributed vSwitches, distributed port groups, virtual machines associated with it.
You can use the dashboard widgets in several ways.
n Properties: View the properties related to the object in the environment.
n Metrics: View the metrics of the object.
n Distributed vSwitches: View details related to the distributed vSwitches.
n Distributed Port Groups: View data relevant to distributed port groups.
n Virtual Machines: View VMs that belong to the object.
vSphere Storage Inventory DashboardThe vSphere Storage Inventory dashboard allows you to browse through the topology of your vSphere storage inventory which includes information related to vSphere world, vCenter Server, data center, datastore clusters, datastores, virtual machines, properties, and metrics.
You can select an object type to view the properties and metrics related to it. You can also view the datastore clusters, datastores, and virtual machines associated with it.
You can use the dashboard widgets in several ways.
n Properties: View the properties related to the object in the environment.
n Metrics: View the metrics of the object.
n Datastore Clusters: View the datastore cluster functionality.
n Datastores: View the datastore functionality.
n Virtual Machines: View VMs that belong to the object.
Management Pack for Microsoft Azure Dashboards
Use dashboards to monitor and troubleshoot Microsoft Azure issues in vRealize Operations Manager.
To access the dashboards, click Dashboards on the menu and click the dashboard names that start with Azure.
The following dashboards are available:
vRealize Operations Manager Configuration Guide
VMware, Inc. 371
Dashboard Name Purpose
Availability View the availability of each Microsoft Azure service. Available services are green. Unavailable services are red and will be removed.
Inventory View the adapter instance count in each resource group. Select a resource group to see a sparkline chart and the metrics for all the resources in the group.
Select an SQL server in the SQL Server widget and then select an SQL database corresponding to the server in the SQL Database widget to view the inventory for the database.
Note Metrics that are not collected or created are grayed out.
Optimization View whether you are effectively using Microsoft Azure services. This dashboard collects the CPU usage data in the form of metrics for the last 24 hours and displays forecasting information for the next 24 hours in a rolling view chart.
Virtual Machine Select a virtual machine to view its scoreboard, property list, object relationship with resource group, and CPU usage and forecasting. This dashboard collects the CPU usage data in the form of metrics for the last 24 hours and displays forecasting information for the next 24 hours in a rolling view chart.
SQL Database Select an SQL server in the SQL Server widget and then select an SQL database corresponding to the server in the SQL Database widget to view the scoreboard, object relationship, and CPU usage for the database. This dashboard collects the CPU usage data in the form of metrics for the last 24 hours and displays forecasting information for the next 24 hours in a rolling view chart.
Load Balancer Select a load balancer to view its scoreboard, object relationship, and data path availability. This dashboard collects the CPU usage data in the form of metrics for the last 24 hours and displays forecasting information for the next 24 hours in a rolling view chart.
Management Pack for AWS Dashboards
Dashboards provide the user interface you use to monitor and troubleshoot Amazon Web Services problems in vRealize Operations Manager.
You can access the dashboards by selecting Dashboards > All Dashboards, and then selecting AWS.
vRealize Operations Manager Configuration Guide
VMware, Inc. 372

Table 8-4. AWS MP 2.1 Dashboards
Dashboard Name Purpose
AWS Alerts The Alerts dashboard reports system-generated performance information for Amazon Web Services. In vRealize Operations Manager 5.8 and later, the dashboard also displays alerts received from Amazon Web Services Cloudwatch.
AWS ASG Utilization Use the Auto Scaling Group (ASG) dashboard to identify which ASG groups have a high utilization across the metrics CPU, Disk IO, Network Transmissions, Received/Sent, and Number of Instances in the ASG. Use that information to determine whether any action is needed to adjust the ASG parameters. For example, you might need to raise or lower the scaling threshold for the CPU metric.
ASG metrics are not collected by default. You must enable them when creating the group. This applies only to the metrics belonging directly to the auto scale group, for example GroupDesiredCapacity. It does not apply to the aggregate instance metrics for the ASG, for example Instance Aggregate CPU Utilization.
AWS Disk Space Use the Disk Space dashboard to monitor EBS volumes to see whether they are running out of disk space and take appropriate action to anticipate future storage needs. Amazon Web Services does not report disk space by default.
For more information on accessing additional metrics, including disk space, and corresponding pricing, go to the Amazon Web Services documentation page at http://docs.aws.amazon.com/AmazonCloudWatch/latest/DeveloperGuide/mon-scripts.html
AWS Instance Heatmap Use the Instance Heatmap to monitor CPU/Disk/Network metric elements and identify instances that perform poorly.
AWS Instance Utilization Use to identify which EC2 instances have high use across the metrics for CPU, Disk IO, Network Transmissions, Received/Sent, and Memory. Use that information to determine whether you can optimize the system by making adjustments to EC2 instances.
AWS Troubleshooting This dashboard is most helpful when someone calls in with a problem and you know which device they are using. You can search for that type of device or the specific device, if you know the name.
When you select the device, the relationship tree displays the item, its parents, and children. You can observe the Health, Workload, Anomalies, and Faults to get an overview of how the system is functioning in those areas. You can use information in the Interesting Metrics widget to help identify the root cause of issues. The Health, Anomalies, and Events Mash-up widget allows you to compare changes in the system to see how they might affect one another.
AWS Volume Performance Use the Volume Performance dashboard to identify Elastic Block Store (EBS) volumes that are experiencing high disk read time, high disk write time, a high volume of disk read operations, or a high volume of disk write operations.
vRealize Operations Manager Configuration Guide
VMware, Inc. 373
Table 8-5. AWS - All Other Dashboards
Dashboard Name Purpose
AWS Services
n CloudFormation Stacks
n Compute: EC2
n Compute: Elastic Containers
n Compute: Lambda Functions
n Database: Dynamo
n Database: Elasticache
n Database: RDS
n Database: Redshift
n Desktop: Workspaces
n Network: Load Balancers
n Network: VPS
n Simple Queue Services
n Storage
Select AWS Services and then select a dashboard to view a specific service-related information.
AWS Availability Use this dashboard to view the availability of each AWS service.
AWS Inventory Use this dashboard to view the count of each AWS service instance in each region.
AWS Optimization Use this dashboard to view if you are effectively using AWS services.
AWS Instance Utilization DashboardUse the AWS Instance Utilization dashboard to identify which EC2 instances have a high usage across the metrics for CPU, Disk IO, Network Transmissions, Received/Sent, and Memory. Use that information to determine whether you can optimize the system by adjusting the EC2 instances.
For example, you might determine that you need to resize the EC2 instance to make it larger or smaller.
You most often use this dashboard to troubleshoot issues with the listed metrics based on a support request from a user.
You can also identify which EC2 instances have been running for the longest and shortest amount of time. Then, you can use that information to determine whether EC2 instances can be decommissioned, or discover instances that have been added and need to be tracked in inventory.
Memory metrics require that you implement an add-on for each EC2 instance. These add-ons cost extra, and are not included by default.AWS Auto Scaling Group DashboardUse the AWS Auto Scaling Group (ASG) dashboard to identify which ASG groups have a high utilization across the metrics CPU, Disk IO, Network Transmissions, Received/Sent, and Number of Instances in the ASG. Use that information to determine whether any action is needed to adjust the ASG parameters. For example, you might need to raise or lower the scaling threshold for the CPU metric.AWS Troubleshooting DashboardWhen a user calls in with a problem and you know the name of the device they are using, can search for that type of device or the specific device and use the AWS Troubleshooting dashboard to get an overview of the system functionality.
vRealize Operations Manager Configuration Guide
VMware, Inc. 374
When you select the device, the relationship tree displays the item, its parents, and children. You can observe the Health, Workload, Anomalies, and Faults to get an overview of how the system is functioning in those areas.
Use information in the Interesting Metrics widget to help identify the root cause of issues. The Health, Anomalies, and Events Mash-up widget allows you to compare changes in the system to see how they might affect one another.
There is a suggested flow to using the widgets in this dashboard.
1 Start with only the AWS Object widget open, and find the item you want to inspect.
2 Select the item, then expand the AWS Relationship widget to view the item's status.
3 Select one or all the related objects, then view the Ordered Symptoms, Interesting Metrics, and Mash-up.
4 Optionally, drag widgets into a new configuration if it makes it easier for you to compare information that is meaningful to you.
5 Examine the list of ordered symptoms and determine which of these events, in the given order might cause the problem to occur.
AWS Instance Heatmap DashboardUse the AWS Instance Heatmap dashboard to monitor CPU/Disk/Network metric elements and identify instances that perform poorly.
You can use the Troubleshooting dashboard to find more detail, and research the root cause of issues. Then you can view the specific object instance to identify faulty processes and take a corrective action.AWS Volume Performance DashboardUse the AWS Volume Performance dashboard to identify Elastic Block Store (EBS) volumes that are experiencing high disk read time, high disk write time, a high volume of disk read operations, or a high volume of disk write operations. When you identify the EC2 instance that generates the load, use the Troubleshooting dashboard to investigate further.AWS Disk Space DashboardUse the AWS Disk Space dashboard to monitor EBS volumes to see whether they are running out of disk space and take appropriate action to anticipate future storage needs. Amazon Web Services does not report disk space by default.
For more information on accessing additional metrics, including disk space, and corresponding pricing, go to the Amazon Web Services documentation page at http://docs.aws.amazon.com/AmazonCloudWatch/latest/DeveloperGuide/mon-scripts.html.AWS Alerts DashboardThe AWS Alerts dashboard reports system-generated performance information for Amazon Web Services. In vRealize Operations Manager 6.6 and later, the dashboard also displays alerts received from Amazon Web Services Cloud watch.
Create and Configure DashboardsTo view the status of all objects in vRealize Operations Manager, create a dashboard by adding widgets or views. You can create and modify dashboards and configure them to meet your environment needs.
vRealize Operations Manager Configuration Guide
VMware, Inc. 375
Procedure
1 In the menu, click Dashboards.
2 Click Actions > Create Dashboard to create and configure a dashboard.
3 Complete the following steps to:
a Enter a name for the dashboard.
Dashboard Name
b Add widgets or views to the dashboard.
Widget or View List Details
c Configure widget interactions.
Widget and View Interactions Details
d Create dashboard navigation.
Dashboard Navigation Details
4 Click Save.
5 Click Actions > Edit Dashboard to modify the dashboard.
Dashboard NameThe name and visualization of the dashboard as it appears on the vRealize Operations Manager Home page.
Where You Add a Name in a Dashboard
To create or edit your dashboard, in the menu, click Dashboards. Click Actions > Create Dashboard to add a dashboard or Actions > Edit Dashboard to edit the selected dashboard. Enter a name in the New Dashboard field.
If you use a forward slash while entering a name, the forward slash acts as a group divider and creates a folder with the specified name in the dashboards list if the name does not exist. For example, if you name a dashboard clusters/hosts, the dashboard is named hosts under the group clusters.
Widget or View List DetailsvRealize Operations Manager provides a list of widgets or views that you can add to your dashboard to monitor specific metrics and properties of objects in your environment.
Where You Add Widgets or Views to a Dashboard
To create or edit your dashboard, in the menu, click Dashboards. Click Actions > Create Dashboard to add a dashboard or Actions > Edit Dashboard to edit the selected dashboard. Toggle between the Views and Widgets option to view and add a widget or view to the dashboard.
vRealize Operations Manager Configuration Guide
VMware, Inc. 376
How to Add Widgets or Views to a Dashboard
In the widgets list panel, you see a list of all the predefined vRealize Operations Manager widgets or views. Drag the widget or view to the dashboard workspace in the upper panel.
To locate a widget or view, you can type the name or part of the name of a widget or view in the Filter option. For example, when you enter top, the list is filtered to display the Top Alerts, Top-N, and Topology Graph widgets. You can then select the widget you require.
Most widgets or views must be configured individually to display information. For more information about how to configure each widget, see Widgets.
How to Arrange Widgets or Views in a Dashboard
You can modify your dashboard layout to suit your needs. By default, the first widgets or views that you add are automatically arranged horizontally wherever you place them.
n To position a widget or a view, drag the widget or view to the desired location in the layout. Other widgets and views automatically rearrange to make room.
n To resize a widget or a view, drag the bottom right corner of the widget or the view.
Widget and View Interactions DetailsYou can connect widgets and views so that the information they show depends on each other.
Where You Create Widget and View Interactions
To create interactions for widgets or views in a dashboard, in the menu, click Dashboards. Click Actions > Create Dashboard to add a dashboard or Actions > Edit Dashboard to edit the selected dashboard. From the toolbar, click Show Interactions.
How to Create and Remove Widget Interactions
The list of available interactions depends on the widgets or views in the dashboard. Widgets and views can provide, receive, and can both provide and receive interactions at the same time.
To create interactions, click Show Interactions. Click a provider plug and drag to the receiver. You can also apply interactions from receiver to provider plugs. For more information about how interactions work, see Widget Interactions.
To remove interactions, click on the interaction line and select Remove Interaction. You can also click the provider plug and select Remove Interaction > <widget name>.
Dashboard Navigation DetailsYou can apply sections or context from one dashboard to another. You can connect widgets and views to widgets and views on other dashboards to investigate problems or better analyze the provided information.
vRealize Operations Manager Configuration Guide
VMware, Inc. 377
Where You Add Another Dashboard
To create dashboard navigation to a dashboard, in the menu, click Dashboards. Click Actions > Create Dashboard to add a dashboard or Actions > Edit Dashboard to edit the selected dashboard. In the dashboard workspace, click Show Interactions. From the Select Another Dashboard drop-down menu, select the dashboard to which you want to navigate.
How Dashboard Navigation Works
You can create dashboard navigation only for provider widgets and views. The provider widget or view sends information to the destination widget or view. When you create dashboard navigation, the destination widgets or views are filtered based on the information type they can receive.
How to Add a Dashboard Navigation to a Dashboard
The list of available dashboards for navigation depends on the available dashboards and the widgets and views in the current dashboard. To add navigation, you can drag and drop from a sender widget interaction plug to a receiver widget interaction plug. You can select more than one applicable widget or view.
Note If a dashboard is unavailable for selection, it is unavailable for dashboard navigation.
The Dashboard Navigation icon ( ) appears in the top menu of each widget or view when a dashboard navigation is available.
Manage DashboardsYou can select dashboards individually or as a group and perform several actions.
To manage your dashboards, in the menu, click Dashboards. Click Actions > Manage Dashboards and then use the options from the Actions drop-down menu.
All the dashboards are listed on this page. You can filter the dashboards based on the name of the dashboard, the dashboard group, enabled dashboards, or shared dashboards. Also, you can click New Dasboard to create a dashboard. For information about creating a dashboard, see Create and Configure Dashboards.
You can select a dashboard from the list, click the vertical ellipsis against each dashboard, and select the various options such as edit, delete, and clone a dashboard. You can also transfer ownership of dashboards, save the dashboard as a template, and export the dashboard. By default, the list of dashboards is sorted by name and all the columns can be sorted.
Datagrid Options
Column Names Description
Name Displays the name of the dashboard.
Group Lists the group to which each dashboard belongs.
Description Displays the description of the dashboard.
Enabled Enables and disables the dashboard.
vRealize Operations Manager Configuration Guide
VMware, Inc. 378
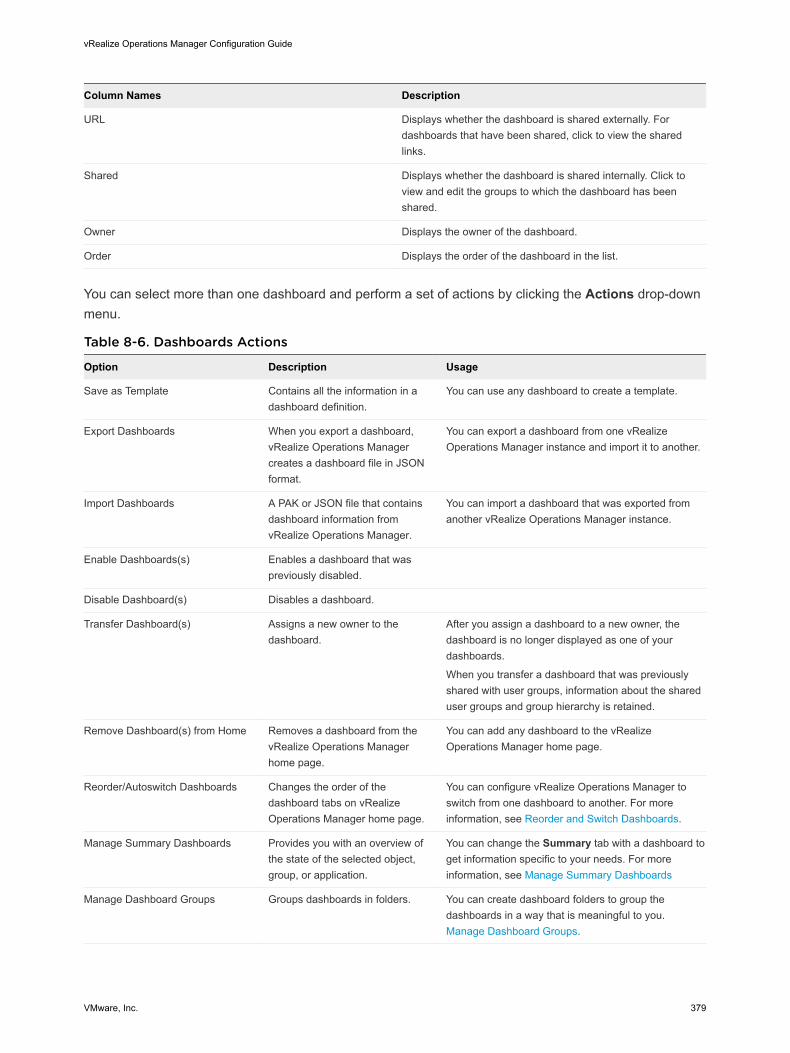
Column Names Description
URL Displays whether the dashboard is shared externally. For dashboards that have been shared, click to view the shared links.
Shared Displays whether the dashboard is shared internally. Click to view and edit the groups to which the dashboard has been shared.
Owner Displays the owner of the dashboard.
Order Displays the order of the dashboard in the list.
You can select more than one dashboard and perform a set of actions by clicking the Actions drop-down menu.
Table 8-6. Dashboards Actions
Option Description Usage
Save as Template Contains all the information in a dashboard definition.
You can use any dashboard to create a template.
Export Dashboards When you export a dashboard, vRealize Operations Manager creates a dashboard file in JSON format.
You can export a dashboard from one vRealize Operations Manager instance and import it to another.
Import Dashboards A PAK or JSON file that contains dashboard information from vRealize Operations Manager.
You can import a dashboard that was exported from another vRealize Operations Manager instance.
Enable Dashboards(s) Enables a dashboard that was previously disabled.
Disable Dashboard(s) Disables a dashboard.
Transfer Dashboard(s) Assigns a new owner to the dashboard.
After you assign a dashboard to a new owner, the dashboard is no longer displayed as one of your dashboards.
When you transfer a dashboard that was previously shared with user groups, information about the shared user groups and group hierarchy is retained.
Remove Dashboard(s) from Home Removes a dashboard from the vRealize Operations Manager home page.
You can add any dashboard to the vRealize Operations Manager home page.
Reorder/Autoswitch Dashboards Changes the order of the dashboard tabs on vRealize Operations Manager home page.
You can configure vRealize Operations Manager to switch from one dashboard to another. For more information, see Reorder and Switch Dashboards.
Manage Summary Dashboards Provides you with an overview of the state of the selected object, group, or application.
You can change the Summary tab with a dashboard to get information specific to your needs. For more information, see Manage Summary Dashboards
Manage Dashboard Groups Groups dashboards in folders. You can create dashboard folders to group the dashboards in a way that is meaningful to you. Manage Dashboard Groups.
vRealize Operations Manager Configuration Guide
VMware, Inc. 379
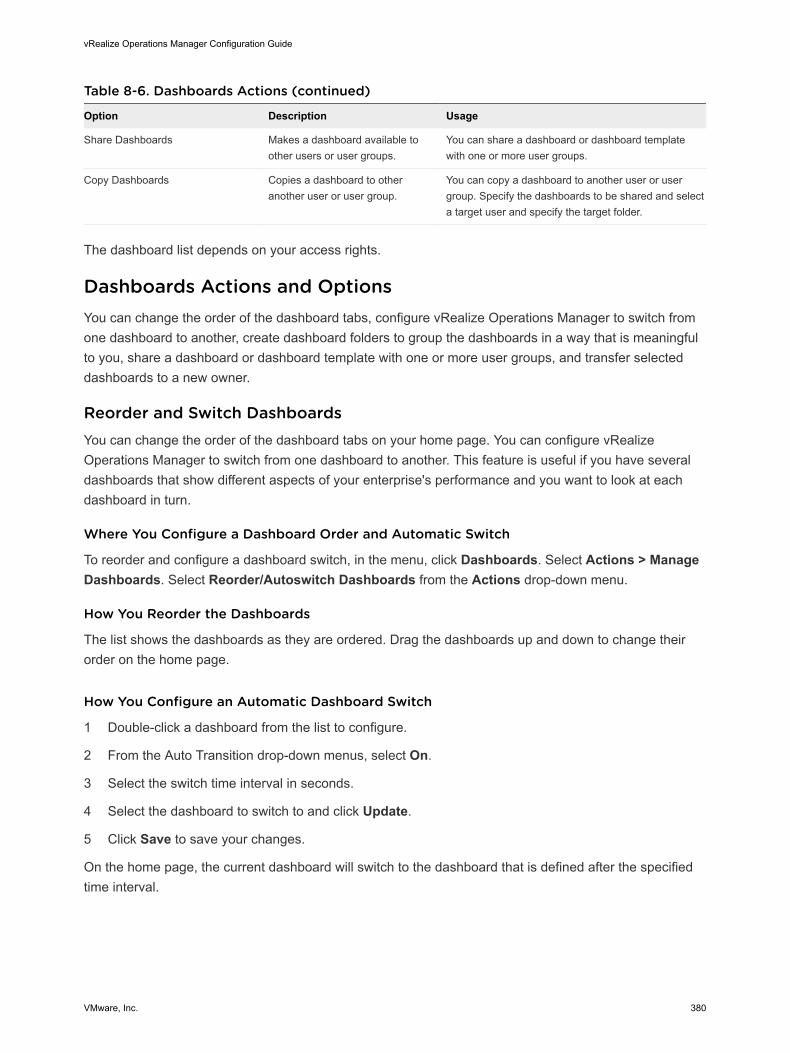
Table 8-6. Dashboards Actions (continued)
Option Description Usage
Share Dashboards Makes a dashboard available to other users or user groups.
You can share a dashboard or dashboard template with one or more user groups.
Copy Dashboards Copies a dashboard to other another user or user group.
You can copy a dashboard to another user or user group. Specify the dashboards to be shared and select a target user and specify the target folder.
The dashboard list depends on your access rights.
Dashboards Actions and OptionsYou can change the order of the dashboard tabs, configure vRealize Operations Manager to switch from one dashboard to another, create dashboard folders to group the dashboards in a way that is meaningful to you, share a dashboard or dashboard template with one or more user groups, and transfer selected dashboards to a new owner.
Reorder and Switch DashboardsYou can change the order of the dashboard tabs on your home page. You can configure vRealize Operations Manager to switch from one dashboard to another. This feature is useful if you have several dashboards that show different aspects of your enterprise's performance and you want to look at each dashboard in turn.
Where You Configure a Dashboard Order and Automatic Switch
To reorder and configure a dashboard switch, in the menu, click Dashboards. Select Actions > Manage Dashboards. Select Reorder/Autoswitch Dashboards from the Actions drop-down menu.
How You Reorder the Dashboards
The list shows the dashboards as they are ordered. Drag the dashboards up and down to change their order on the home page.
How You Configure an Automatic Dashboard Switch
1 Double-click a dashboard from the list to configure.
2 From the Auto Transition drop-down menus, select On.
3 Select the switch time interval in seconds.
4 Select the dashboard to switch to and click Update.
5 Click Save to save your changes.
On the home page, the current dashboard will switch to the dashboard that is defined after the specified time interval.
vRealize Operations Manager Configuration Guide
VMware, Inc. 380
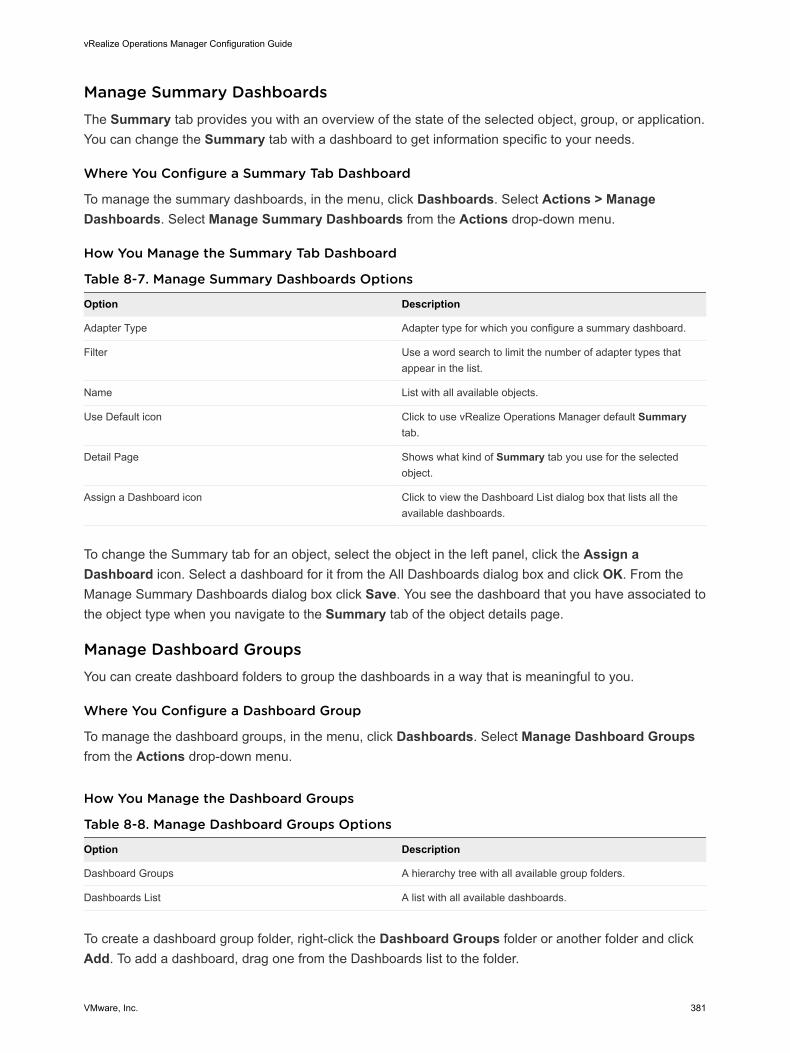
Manage Summary DashboardsThe Summary tab provides you with an overview of the state of the selected object, group, or application. You can change the Summary tab with a dashboard to get information specific to your needs.
Where You Configure a Summary Tab Dashboard
To manage the summary dashboards, in the menu, click Dashboards. Select Actions > Manage Dashboards. Select Manage Summary Dashboards from the Actions drop-down menu.
How You Manage the Summary Tab Dashboard
Table 8-7. Manage Summary Dashboards Options
Option Description
Adapter Type Adapter type for which you configure a summary dashboard.
Filter Use a word search to limit the number of adapter types that appear in the list.
Name List with all available objects.
Use Default icon Click to use vRealize Operations Manager default Summary tab.
Detail Page Shows what kind of Summary tab you use for the selected object.
Assign a Dashboard icon Click to view the Dashboard List dialog box that lists all the available dashboards.
To change the Summary tab for an object, select the object in the left panel, click the Assign a Dashboard icon. Select a dashboard for it from the All Dashboards dialog box and click OK. From the Manage Summary Dashboards dialog box click Save. You see the dashboard that you have associated to the object type when you navigate to the Summary tab of the object details page.
Manage Dashboard GroupsYou can create dashboard folders to group the dashboards in a way that is meaningful to you.
Where You Configure a Dashboard Group
To manage the dashboard groups, in the menu, click Dashboards. Select Manage Dashboard Groups from the Actions drop-down menu.
How You Manage the Dashboard Groups
Table 8-8. Manage Dashboard Groups Options
Option Description
Dashboard Groups A hierarchy tree with all available group folders.
Dashboards List A list with all available dashboards.
To create a dashboard group folder, right-click the Dashboard Groups folder or another folder and click Add. To add a dashboard, drag one from the Dashboards list to the folder.
vRealize Operations Manager Configuration Guide
VMware, Inc. 381

Share Dashboards with UsersYou can share a dashboard or dashboard template with one or more user groups. When you share a dashboard, it becomes available to all the users in the user group that you select. The dashboard appears the same to all the users who share it. If you edit a shared dashboard, the dashboard changes for all users. Other users can only view a shared dashboard. They cannot change it.
Where You Share a Dashboard From
To share a dashboard, in the menu, click Dashboards. Select Actions > Manage Dashboards. Select Share Dashboards from the Actions drop-down menu.
Table 8-9. Share Dashboards Options
Option Description
Accounts Group All available groups with which you can share a dashboard.
Shared Dashboards All available dashboards and templates that you can share. You can switch between dashboard templates by clicking the Share Dashboard Templates icon.
How You Manage a Shared Dashboard Tab
To share a dashboard tab, navigate to the dashboard in the list of Shared Dashboards and drag it to the group to share it with on the left.
To stop sharing a dashboard with a group, click that group on the left panel, navigate to the dashboard in the right panel, and click the Stop Sharing icon above the list.
To stop sharing a dashboard with more than one group, click the Not Grouped name on the left panel, navigate to the dashboard in the right panel, and click the Stop Sharing icon above the list.
Options for Sharing DashboardsYou can share predefined or custom dashboards using URLs, emails, and by copying the code to embed the dashboard into confluence or other internal official web pages. You can also assign and unassign a dashboard to specific user groups and export the dashboard configuration details.
When you use a non-authenticated shared URL, as a user you can open the dashboard in a new browser session. If you have already logged into vRealize Operations Manager in another session, you are redirected to this dashboard and the user authentication permissions apply. To ensure that the non-authenticated URL opens the intended dashboard, as a user you must log out from all existing user sessions.
The dashboard shared with the URL opens in a page where you can access all the widgets within the dashboard and you can interact with the given widgets at the same time. A non-authenticated dashboard however, does not allow you to browse to other areas of vRealize Operations Manager.
Where You Can Access the Options to Share Dashboards
From the menu, select Dashboards. Click on an existing dashboard and then click the Share Dashboard icon in the top right corner.
vRealize Operations Manager Configuration Guide
VMware, Inc. 382
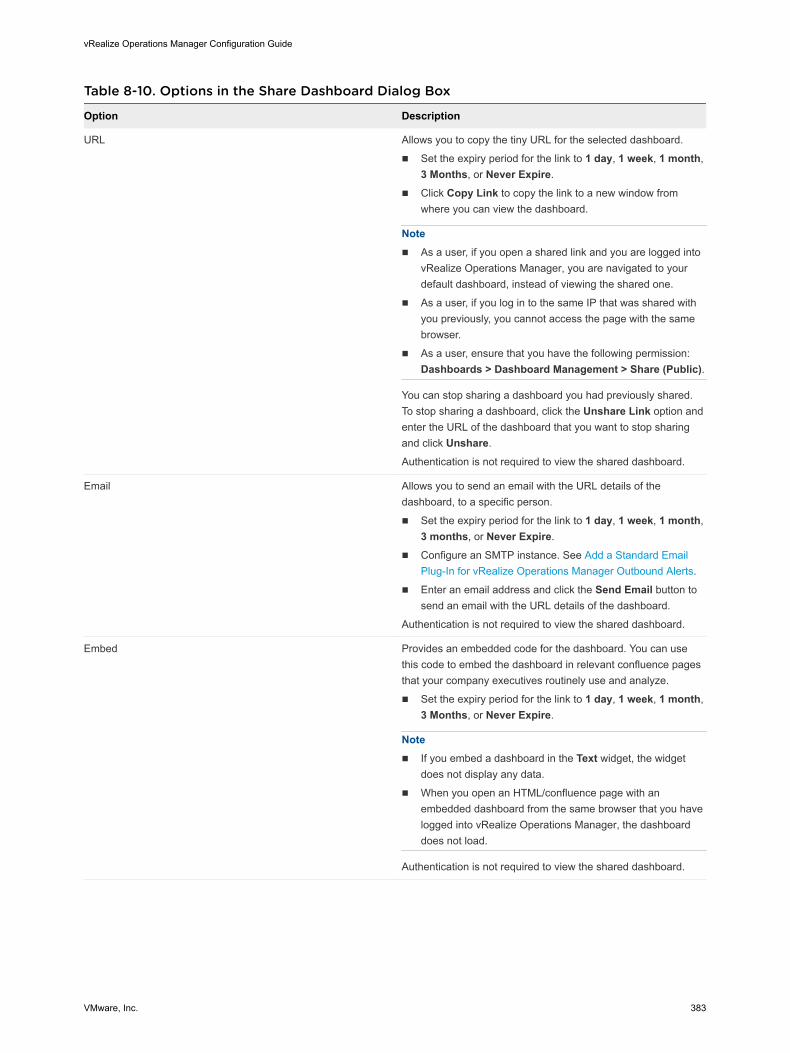
Table 8-10. Options in the Share Dashboard Dialog Box
Option Description
URL Allows you to copy the tiny URL for the selected dashboard.
n Set the expiry period for the link to 1 day, 1 week, 1 month, 3 Months, or Never Expire.
n Click Copy Link to copy the link to a new window from where you can view the dashboard.
Note n As a user, if you open a shared link and you are logged into
vRealize Operations Manager, you are navigated to your default dashboard, instead of viewing the shared one.
n As a user, if you log in to the same IP that was shared with you previously, you cannot access the page with the same browser.
n As a user, ensure that you have the following permission: Dashboards > Dashboard Management > Share (Public).
You can stop sharing a dashboard you had previously shared. To stop sharing a dashboard, click the Unshare Link option and enter the URL of the dashboard that you want to stop sharing and click Unshare.
Authentication is not required to view the shared dashboard.
Email Allows you to send an email with the URL details of the dashboard, to a specific person.
n Set the expiry period for the link to 1 day, 1 week, 1 month, 3 months, or Never Expire.
n Configure an SMTP instance. See Add a Standard Email Plug-In for vRealize Operations Manager Outbound Alerts.
n Enter an email address and click the Send Email button to send an email with the URL details of the dashboard.
Authentication is not required to view the shared dashboard.
Embed Provides an embedded code for the dashboard. You can use this code to embed the dashboard in relevant confluence pages that your company executives routinely use and analyze.
n Set the expiry period for the link to 1 day, 1 week, 1 month, 3 Months, or Never Expire.
Note n If you embed a dashboard in the Text widget, the widget
does not display any data.
n When you open an HTML/confluence page with an embedded dashboard from the same browser that you have logged into vRealize Operations Manager, the dashboard does not load.
Authentication is not required to view the shared dashboard.
vRealize Operations Manager Configuration Guide
VMware, Inc. 383
Table 8-10. Options in the Share Dashboard Dialog Box (continued)
Option Description
Groups Allows you to assign and unassign a dashboard to specific user groups.
n Select the group to which you want to grant dashboard access from the drop-down menu and click Include. You can include more than one dashboard.
n From the label, select the cross mark to unassign the dashboard.
Log in to vRealize Operations Manager to view the shared dashboard.
Export Allows you to export the dashboard configuration details.
Log in to vRealize Operations Manager to export/import a dashboard.
Manage Widgets in DashboardsYou can replicate widgets multiple times in a dashboard by using the copy and paste functionality.
Navigate to the dashboard from which you want to copy widgets. Select Actions > Edit Dashboards. Select one or more widgets that you want to copy by clicking the title of the widget and then select Actions > Copy Widget(s). Click Actions > Paste Widget(s) to paste one or more widgets in the same dashboard.
To paste one or more widgets into another dashboard, exit the edit screen of the dashboard by selecting Cancel. Navigate to the dashboard to which you want to paste one or more widgets and select Actions > Edit Dashboards and then Actions > Paste Widget(s).
ViewsvRealize Operations Manager provides several types of views. Each type of view helps you to interpret metrics, properties, policies of various monitored objects including alerts, symptoms, and so on, from a different perspective. vRealize Operations Manager Views also show information that the adapters in your environment provide.
You can configure vRealize Operations Manager views to show transformation, forecast, and trend calculations.
n The transformation type determines how the values are aggregated.
n The trend option shows how the values tend to change, based on the historical, raw data. The trend calculations depend on the transformation type and roll up interval.
n The forecast option shows what the future values can be, based on the trend calculations of the historical data.
Create Views (http://link.brightcove.com/services/player/bcpid2296383276001?bctid=ref:video_create_view_vrop)
vRealize Operations Manager Configuration Guide
VMware, Inc. 384
You can use vRealize Operations Manager views in different areas of vRealize Operations Manager.
n To manage all views, in the menu, click Dashboards, and then in the left pane click Views.
n To see the data that a view provides for a specific object, navigate to that object, click the Details tab, and click Views.
n To see the data that a view provides in your dashboard, add the View widget to the dashboard.
n To have a link to a view in the Further Analysis section, select the Further Analysis option on the view workspace visibility step.
Views and Reports OwnershipThe default owner of all predefined views and templates is System. If you edit them, you become the owner. If you want to keep the original predefined view or template, you have to clone it. After you clone it, you become the owner of the clone.
The last user who edited a view, template, or schedule is the owner. For example, if you create a view you are listed as its owner. If another user edits your view, that user becomes the owner listed in the Owner column.
The user who imports the view or template is its owner, even if the view is initially created by someone else. For example, User 1 creates a template and exports it. User 2 imports it in back, the owner of the template becomes User 2.
The user who generated the report is its owner, regardless of who owns the template. If a report is generated from a schedule, the user who created the schedule is the owner of the generated report. For example, if User 1 creates a template and User 2 creates a schedule for this template, the generated report owner is User 2.
Views OverviewA view presents collected information for an object in a certain way depending on the view type. Each type of view helps you to interpret metrics, properties, policies of various monitored objects including alerts, symptoms, and so on, from a different perspective.
How You Access the Views Page
In the menu, click Dashboards, and then in the left pane click Views to access the Views page.
Manage and Preview ViewsYou can preview a view by clicking a view from the Views page. Add an object if necessary, by clicking Select preview source from the upper-right corner of the Views page. The preview of the view appears just below the Views option in the right pane.
You can select a view from the list, click the vertical ellipsis against each view, and select the various options such as edit, delete, clone, and export a view.
You can filter the views based on the name, type, description, subject, and owner of the view. You can click New View to create a view. For information about creating a view, see Create and Configure a View.
vRealize Operations Manager Configuration Guide
VMware, Inc. 385
You can select more than one view and delete, export, and import views by clicking the Actions drop-down menu.
Views are also categorized and listed in the All Views menu based on the type of view and subject. You can access the All Views menu from a specific view preview page.
Table 8-11. Filter Groups
Filter Group Description
Name Filter by the view name. For example, type my view to list all views that contain the my view phrase in their name.
Type Filter by the view type.
Description Filter by the view description. For example, type my view to list all views that contain the my view phrase in their description.
Subject Filter by the subject.
Owner Filter by the owner.
Views and Reports OwnershipThe owner of views, reports, or templates might change over time.
The default owner of all predefined views and templates is System. If you edit them, you become the owner. If you want to keep the original predefined view or template, you have to clone it. After you clone it, you become the owner of the clone.
The last user who edited a view, template, or schedule is the owner. For example, if you create a view you are listed as its owner. If another user edits your view, that user becomes the owner listed in the Owner column.
The user who imports the view or template is its owner, even if the view is initially created by someone else. For example, User 1 creates a template and exports it. User 2 imports it in back, the owner of the template becomes User 2.
The user who generated the report is its owner, regardless of who owns the template. If a report is generated from a schedule, the user who created the schedule is the owner of the generated report. For example, if User 1 creates a template and User 2 creates a schedule for this template, the generated report owner is User 2.
Create and Configure a ViewTo collect and display information for a specific object, you can create a custom view.
Procedure
1 In the menu, click Dashboards, and then in the left pane click Views.
2 Click the Create View icon to create a view.
vRealize Operations Manager Configuration Guide
VMware, Inc. 386
3 Complete the steps in the left pane to:
a Enter a name and description for the view.
Name and Description Details
b Change the presentation of a view.
Presentation Details
c Select the base object type for a view.
Subjects Details
d Add data to a view.
Data Details
e Change the visibility of a view.
Visibility Details
4 Click Save.
5 From the Views page, click the Edit View icon to modify the view.
Name and Description DetailsThe name and description of the view as they appear in the list of views on the Views page.
To add a name and description to a view, in the menu, click Dashboards, and then in the left pane click Views. On the Views toolbar, click the plus sign to add a view or the pencil to edit the selected view. In the workspace, on the left, click Name and Description.
Table 8-12. Name and Description Options in the View Workspace
Option Description
Name Name of the view as it appears on the Views page.
Description Description of the view.
Presentation DetailsA presentation is a way the collected information for the object is presented. Each type of view helps you to interpret metrics and properties from a different perspective.
To change the presentation of a view, in the menu, click Dashboards, and then in the left pane click Views. On the Views toolbar, click the plus sign to add a view or the pencil to edit the selected view. In the workspace, on the left, click Presentation. If you create a view, complete the required previous steps.
vRealize Operations Manager Configuration Guide
VMware, Inc. 387
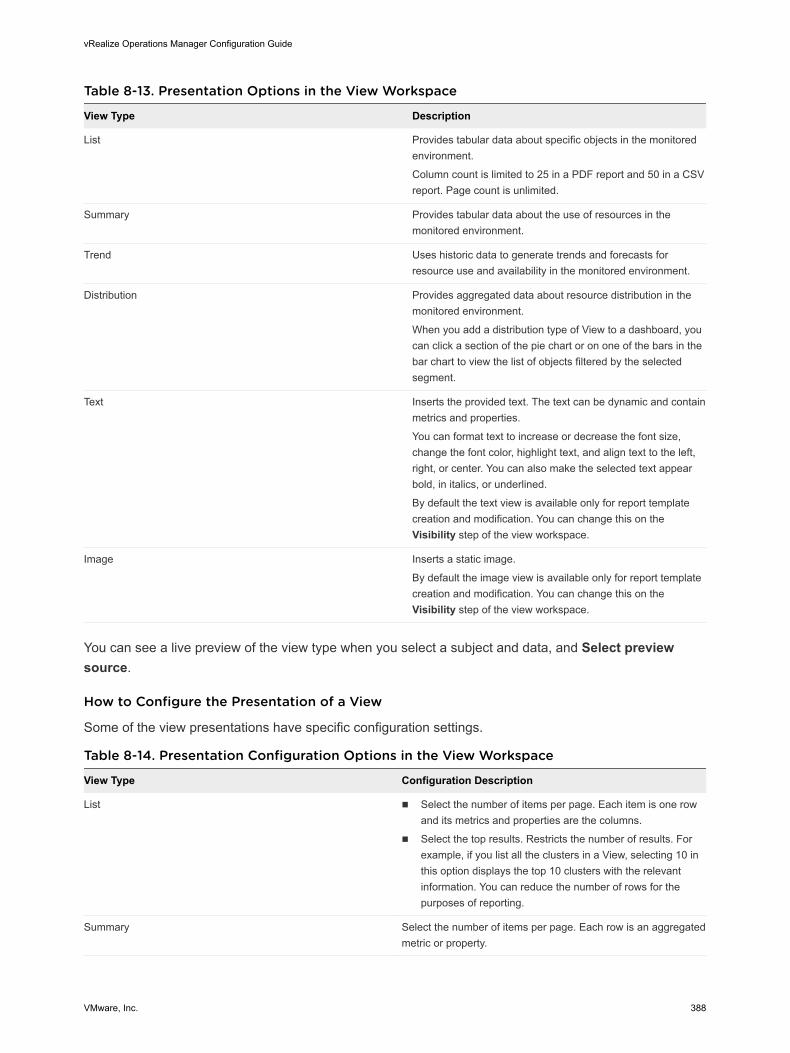
Table 8-13. Presentation Options in the View Workspace
View Type Description
List Provides tabular data about specific objects in the monitored environment.
Column count is limited to 25 in a PDF report and 50 in a CSV report. Page count is unlimited.
Summary Provides tabular data about the use of resources in the monitored environment.
Trend Uses historic data to generate trends and forecasts for resource use and availability in the monitored environment.
Distribution Provides aggregated data about resource distribution in the monitored environment.
When you add a distribution type of View to a dashboard, you can click a section of the pie chart or on one of the bars in the bar chart to view the list of objects filtered by the selected segment.
Text Inserts the provided text. The text can be dynamic and contain metrics and properties.
You can format text to increase or decrease the font size, change the font color, highlight text, and align text to the left, right, or center. You can also make the selected text appear bold, in italics, or underlined.
By default the text view is available only for report template creation and modification. You can change this on the Visibility step of the view workspace.
Image Inserts a static image.
By default the image view is available only for report template creation and modification. You can change this on the Visibility step of the view workspace.
You can see a live preview of the view type when you select a subject and data, and Select preview source.
How to Configure the Presentation of a View
Some of the view presentations have specific configuration settings.
Table 8-14. Presentation Configuration Options in the View Workspace
View Type Configuration Description
List n Select the number of items per page. Each item is one row and its metrics and properties are the columns.
n Select the top results. Restricts the number of results. For example, if you list all the clusters in a View, selecting 10 in this option displays the top 10 clusters with the relevant information. You can reduce the number of rows for the purposes of reporting.
Summary Select the number of items per page. Each row is an aggregated metric or property.
vRealize Operations Manager Configuration Guide
VMware, Inc. 388
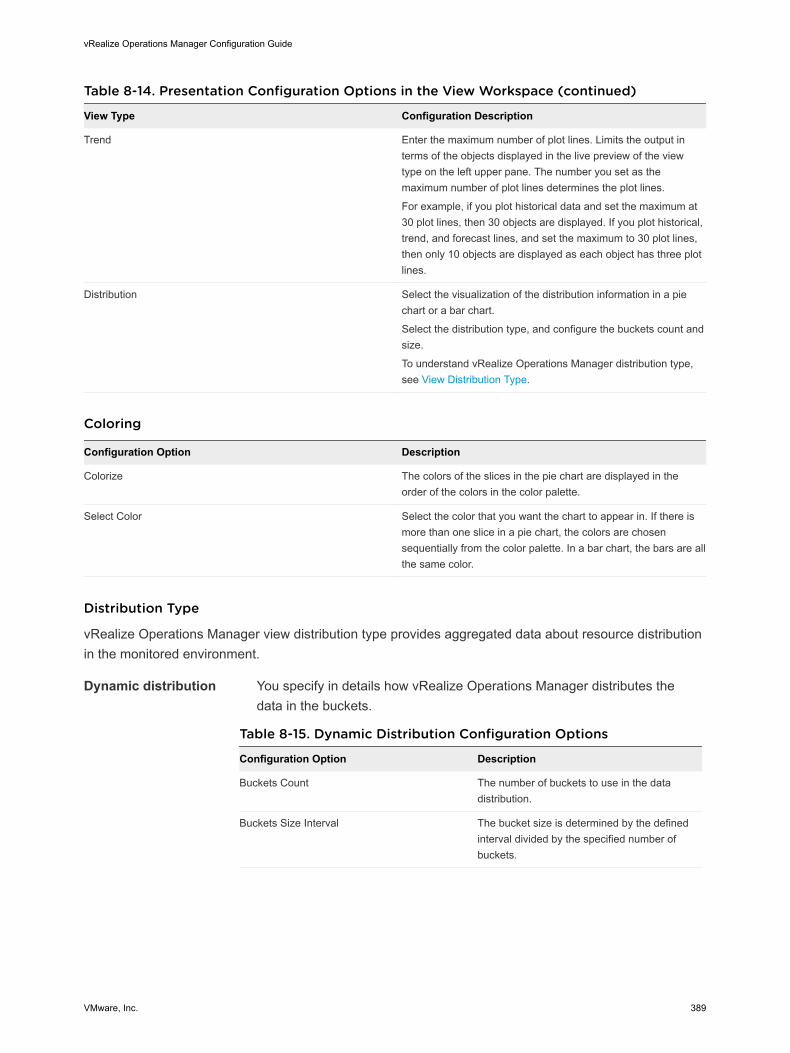
Table 8-14. Presentation Configuration Options in the View Workspace (continued)
View Type Configuration Description
Trend Enter the maximum number of plot lines. Limits the output in terms of the objects displayed in the live preview of the view type on the left upper pane. The number you set as the maximum number of plot lines determines the plot lines.
For example, if you plot historical data and set the maximum at 30 plot lines, then 30 objects are displayed. If you plot historical, trend, and forecast lines, and set the maximum to 30 plot lines, then only 10 objects are displayed as each object has three plot lines.
Distribution Select the visualization of the distribution information in a pie chart or a bar chart.
Select the distribution type, and configure the buckets count and size.
To understand vRealize Operations Manager distribution type, see View Distribution Type.
Coloring
Configuration Option Description
Colorize The colors of the slices in the pie chart are displayed in the order of the colors in the color palette.
Select Color Select the color that you want the chart to appear in. If there is more than one slice in a pie chart, the colors are chosen sequentially from the color palette. In a bar chart, the bars are all the same color.
Distribution Type
vRealize Operations Manager view distribution type provides aggregated data about resource distribution in the monitored environment.
Dynamic distribution You specify in details how vRealize Operations Manager distributes the data in the buckets.
Table 8-15. Dynamic Distribution Configuration Options
Configuration Option Description
Buckets Count The number of buckets to use in the data distribution.
Buckets Size Interval The bucket size is determined by the defined interval divided by the specified number of buckets.
vRealize Operations Manager Configuration Guide
VMware, Inc. 389
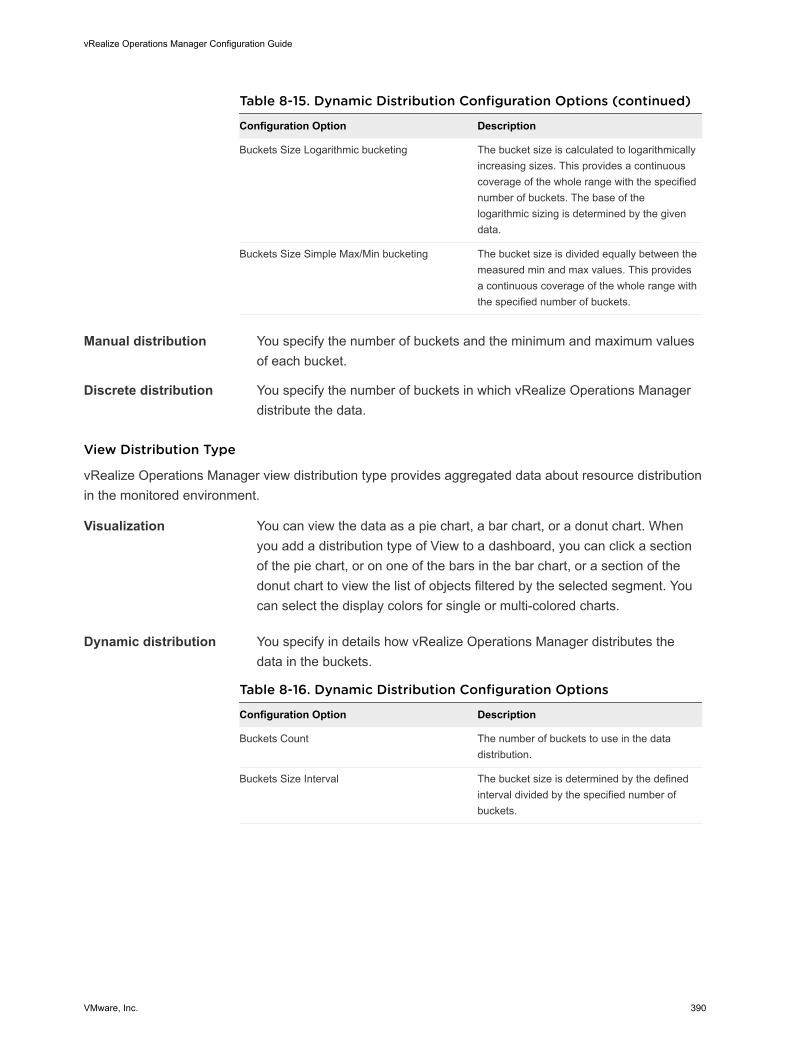
Table 8-15. Dynamic Distribution Configuration Options (continued)
Configuration Option Description
Buckets Size Logarithmic bucketing The bucket size is calculated to logarithmically increasing sizes. This provides a continuous coverage of the whole range with the specified number of buckets. The base of the logarithmic sizing is determined by the given data.
Buckets Size Simple Max/Min bucketing The bucket size is divided equally between the measured min and max values. This provides a continuous coverage of the whole range with the specified number of buckets.
Manual distribution You specify the number of buckets and the minimum and maximum values of each bucket.
Discrete distribution You specify the number of buckets in which vRealize Operations Manager distribute the data.
View Distribution Type
vRealize Operations Manager view distribution type provides aggregated data about resource distribution in the monitored environment.
Visualization You can view the data as a pie chart, a bar chart, or a donut chart. When you add a distribution type of View to a dashboard, you can click a section of the pie chart, or on one of the bars in the bar chart, or a section of the donut chart to view the list of objects filtered by the selected segment. You can select the display colors for single or multi-colored charts.
Dynamic distribution You specify in details how vRealize Operations Manager distributes the data in the buckets.
Table 8-16. Dynamic Distribution Configuration Options
Configuration Option Description
Buckets Count The number of buckets to use in the data distribution.
Buckets Size Interval The bucket size is determined by the defined interval divided by the specified number of buckets.
vRealize Operations Manager Configuration Guide
VMware, Inc. 390
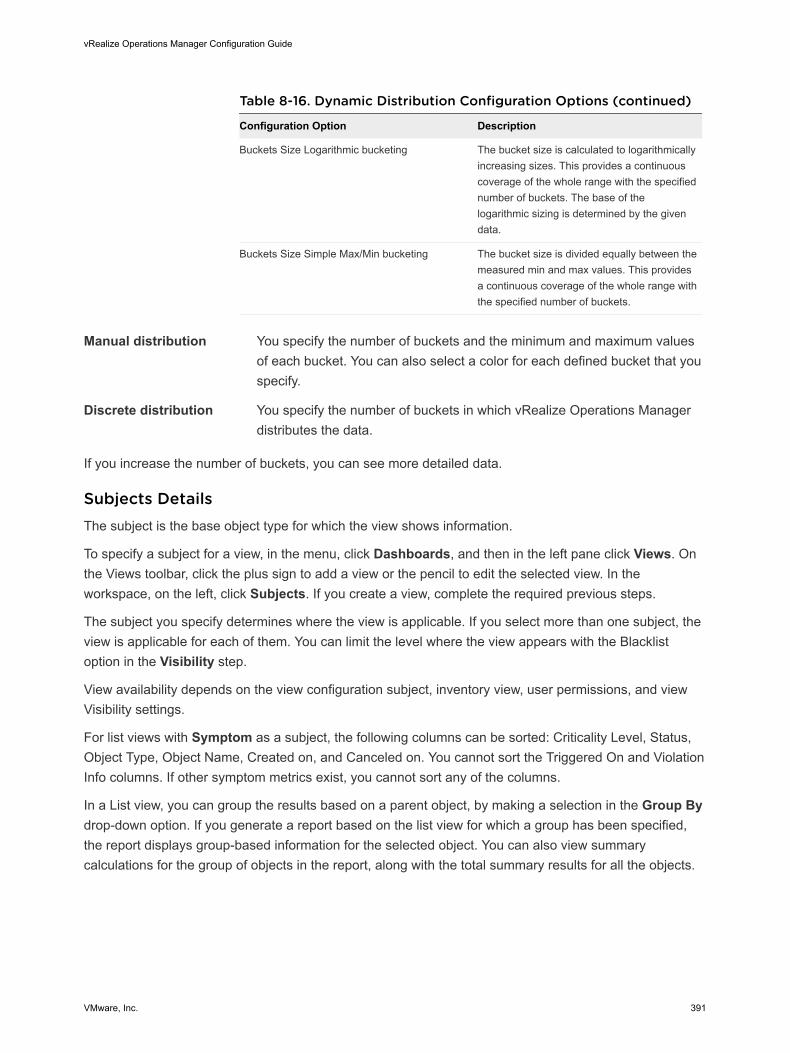
Table 8-16. Dynamic Distribution Configuration Options (continued)
Configuration Option Description
Buckets Size Logarithmic bucketing The bucket size is calculated to logarithmically increasing sizes. This provides a continuous coverage of the whole range with the specified number of buckets. The base of the logarithmic sizing is determined by the given data.
Buckets Size Simple Max/Min bucketing The bucket size is divided equally between the measured min and max values. This provides a continuous coverage of the whole range with the specified number of buckets.
Manual distribution You specify the number of buckets and the minimum and maximum values of each bucket. You can also select a color for each defined bucket that you specify.
Discrete distribution You specify the number of buckets in which vRealize Operations Manager distributes the data.
If you increase the number of buckets, you can see more detailed data.
Subjects DetailsThe subject is the base object type for which the view shows information.
To specify a subject for a view, in the menu, click Dashboards, and then in the left pane click Views. On the Views toolbar, click the plus sign to add a view or the pencil to edit the selected view. In the workspace, on the left, click Subjects. If you create a view, complete the required previous steps.
The subject you specify determines where the view is applicable. If you select more than one subject, the view is applicable for each of them. You can limit the level where the view appears with the Blacklist option in the Visibility step.
View availability depends on the view configuration subject, inventory view, user permissions, and view Visibility settings.
For list views with Symptom as a subject, the following columns can be sorted: Criticality Level, Status, Object Type, Object Name, Created on, and Canceled on. You cannot sort the Triggered On and Violation Info columns. If other symptom metrics exist, you cannot sort any of the columns.
In a List view, you can group the results based on a parent object, by making a selection in the Group By drop-down option. If you generate a report based on the list view for which a group has been specified, the report displays group-based information for the selected object. You can also view summary calculations for the group of objects in the report, along with the total summary results for all the objects.
vRealize Operations Manager Configuration Guide
VMware, Inc. 391
Views Applicability
Views might not always appear where you expect them to. The main applicability of views depends on the view subject and the inventory view.
List View When you navigate through the environment tree, you can see the List view at the subjects that you specify during the view configuration and at their object containers. Depending on the inventory view, the List view might be missing at the object containers. For example, you create a List view with subject Host System. When you go to Environment > vSphere Hosts and Clusters > vSphere World, select a vCenter Server, and click the Details tab, you can see your List view. If you go to Environment > vSphere Storage > vSphere World, select the same vCenter Server, and click the Details tab, your List view is missing. Your List view with subject Host System is missing because the object Host System is not included in the vSphere Storage inventory view.
Summary View When you navigate through the environment tree, you can see the Summary view at the subjects that you specify during the view configuration and at their object containers. Depending on the inventory view, the Summary view might be missing at the object containers. For example, you create a Summary view with subject Datastore. When you go to Environment > vSphere Storage > vSphere World, select a vCenter Server, and click the Details tab, you can see your List view. If you go to Environment > vSphere Networking > vSphere World, select the same vCenter Server, and click the Details tab, your Summary view is missing. Your Summary view with subject datastore is missing because the object Datastore is not included in the vSphere Networking inventory view.
Trend View When you navigate through the environment tree, you can see the Trend view only at the subjects that you specify during the view configuration. For example, you create a Trend view with subject Virtual Machine. When you navigate to a virtual machine in the navigation tree, you see your view.
Distribution View When you navigate through the environment tree, you can see the Distribution view only at the object containers of the subjects that you specify during the view configuration. Depending on the inventory view, the Distribution view might be missing at the object containers. For example, you create a Distribution view with subject Host System. When you go to Environment > vSphere Hosts and Clusters > vSphere World, select a vCenter Server, and click the Details tab, you can see your Distribution view. If you go to Environment > vSphere Networking > vSphere World, select the same vCenter Server, and click the Details tab, your Distribution view is missing. Your Distribution view with subject Host System is missing because the object Host System is not included in the vSphere Networking inventory view.
vRealize Operations Manager Configuration Guide
VMware, Inc. 392
Text View When you navigate through the environment tree, you can see the Text view only at the subjects that you specify during the view configuration. For example, you create a Text view with subject vCenter Server. When you navigate to a vCenter Server in the navigation tree, you see your view. If you did not specify a subject, you see your view for every subject in the environment.
Image View The Image view is applicable for every object in the environment.
Note Views applicability depends also on your user permissions and the view Visibility configuration.
Data DetailsThe data definition process includes adding properties, metrics, policies, or data that adapters provide to a view. These are the items by which vRealize Operations Manager collects, calculates, and presents the information for the view.
To add data to a view, in the menu, click Dashboards, and then in the left pane click Views. On the Views toolbar, click the plus sign to add a view or the pencil to edit the selected view. In the workspace, on the left, click Data. If you create a view, complete the required previous steps.
How to Add Data to a View
If you selected more than one subject, specify the subject for which you add data. Double-click the data from the tree in the left panel to add it to the view. For each subject the data available to add might be different.
How to Configure the Data Transformation
The data configuration options depend on the view and data type that you select. Most of the options are available for all views.
Table 8-17. Data Configuration Options
Configuration Option Description
Metric name Default metric name.
Available for all views.
Metric label Customizable label as it appears in the view or report.
Available for all views.
Units Depends on the added metric or property. You can select in what unit to display the values. For example, for CPU|Demand(MHz) from the Units drop-down menu, you can change the value to Hz, KHz, or GHz. If you select Auto, the scaling is set to a meaningful unit.
Available for all views.
Sort order Orders the values in ascending or descending order.
Available for List view and Summary view.
vRealize Operations Manager Configuration Guide
VMware, Inc. 393
Table 8-17. Data Configuration Options (continued)
Configuration Option Description
Transformation Determines what calculation method is applied on the raw data. You can select the type of transformation:
n Minimum. The minimum value of the metric over the selected time range.
n Maximum. The maximum value of the metric over the selected time range.
n Average. The mean of all the metric values over the selected time range.
n Sum. The sum of the metric values over the selected time range.
n First. The first metric value for the selected time range.
n Last. The last value of a metric within the selected time range. If you have selected Last as the transformation in versions before vRealize Operations Manager 6.7, and the end of specified time range is not before the last five minutes, use the Current transformation.
n Current. The last available value of a metric if it was last updated not before five collection cycles were complete, otherwise it is null.
n Standard Deviation. The standard deviation of the metric values.
n Metric Correlation. Displays the value when another metric is at the minimum or maximum. For example, displays the value for memory.usage when cpu.usage is at a maximum.
n Forecast. Performs a regressive analysis and predicts future values. Displays the last metric value of the selected range.
n Percentile. Calculates the specified percentile for the data range. For example, you can view the 95th percentile, 99th percentile, and so on.
n Expression. Allows you to construct a mathematical expression over already existing transformations using minus, plus, multiplication, division, unary minus, unary plus, and round brackets. For example, sum/((max + min)/2). You can use the operands of some of the existing transformations such as, max, min, avg, sum, first, last, current. You cannot use standard deviation, forecast, metric correlation, and percentile
.
Available for all views, except Trend.
Timestamp Adds a timestamp when metrics and properties are added or modified.
Available for List view and Minimum, Maximum, Current, First, and Last transformations.
vRealize Operations Manager Configuration Guide
VMware, Inc. 394
Table 8-17. Data Configuration Options (continued)
Configuration Option Description
Ranges for metric coloring You can associate colors to metrics by entering a percentage, range, or specific state. For example, you can enter Powered Off in the Red Bound field when you select virtual machine as an object. You can set the colors only for views and not for csv or pdf formats.
Data Series You can select whether to include historical data, trend of historical data, and forecast for future time in the trend view calculations.
Available for Trend view.
Series Roll up The time interval at which the data is rolled up. You can select one of the available options. For example, if you select Sum as a Transformation and 5 minutes as the roll-up interval, then the system selects 5-minute interval values and adds them.
This option is applicable to the Transformation configuration option.
Available for all views.
Threshold Lines You can set a threshold for a single metric:
n None. You have not set a threshold.
n By Symptom Definition. You can set a threshold value based on a symptom definition.
n Custom. You can set the threshold value as Warning, Critical, or Immediate. These options are available only for the Custom option.
Available for Trend view.
How to Configure Time Settings
Use the time settings to select the time interval of data transformation. These options are available for all view types, except Image.
You can set a time range for a past period or set a future date for the end of the time period. When you select a future end date and no data is available, the view is populated by forecast data.
Table 8-18. Time Settings Options
Configuration Option Description
Time Range Mode In Basic mode, you can select date ranges.
In Advanced mode, you can select any combination of relative or specific start and end dates.
Relative Date Range Select a relative date range of data transformation.
Available in Basic mode.
Specific Date Range Select a specific date range of data transformation.
Available in Basic mode.
vRealize Operations Manager Configuration Guide
VMware, Inc. 395
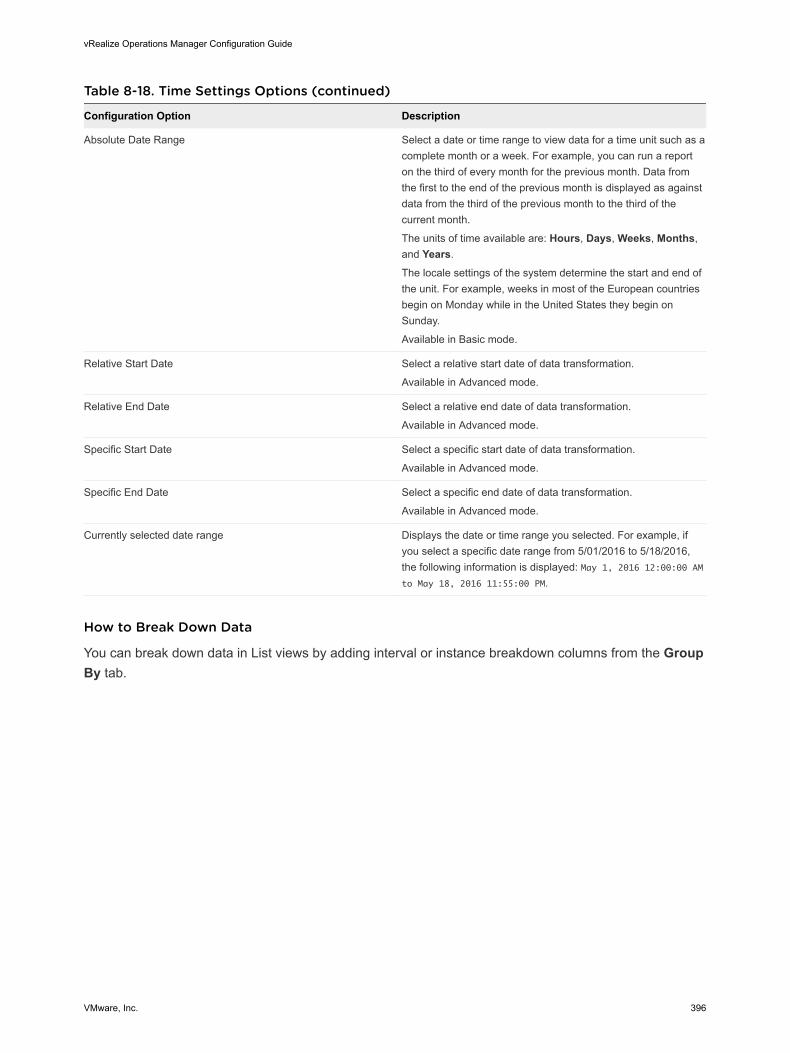
Table 8-18. Time Settings Options (continued)
Configuration Option Description
Absolute Date Range Select a date or time range to view data for a time unit such as a complete month or a week. For example, you can run a report on the third of every month for the previous month. Data from the first to the end of the previous month is displayed as against data from the third of the previous month to the third of the current month.
The units of time available are: Hours, Days, Weeks, Months, and Years.
The locale settings of the system determine the start and end of the unit. For example, weeks in most of the European countries begin on Monday while in the United States they begin on Sunday.
Available in Basic mode.
Relative Start Date Select a relative start date of data transformation.
Available in Advanced mode.
Relative End Date Select a relative end date of data transformation.
Available in Advanced mode.
Specific Start Date Select a specific start date of data transformation.
Available in Advanced mode.
Specific End Date Select a specific end date of data transformation.
Available in Advanced mode.
Currently selected date range Displays the date or time range you selected. For example, if you select a specific date range from 5/01/2016 to 5/18/2016, the following information is displayed: May 1, 2016 12:00:00 AM to May 18, 2016 11:55:00 PM.
How to Break Down Data
You can break down data in List views by adding interval or instance breakdown columns from the Group By tab.
vRealize Operations Manager Configuration Guide
VMware, Inc. 396
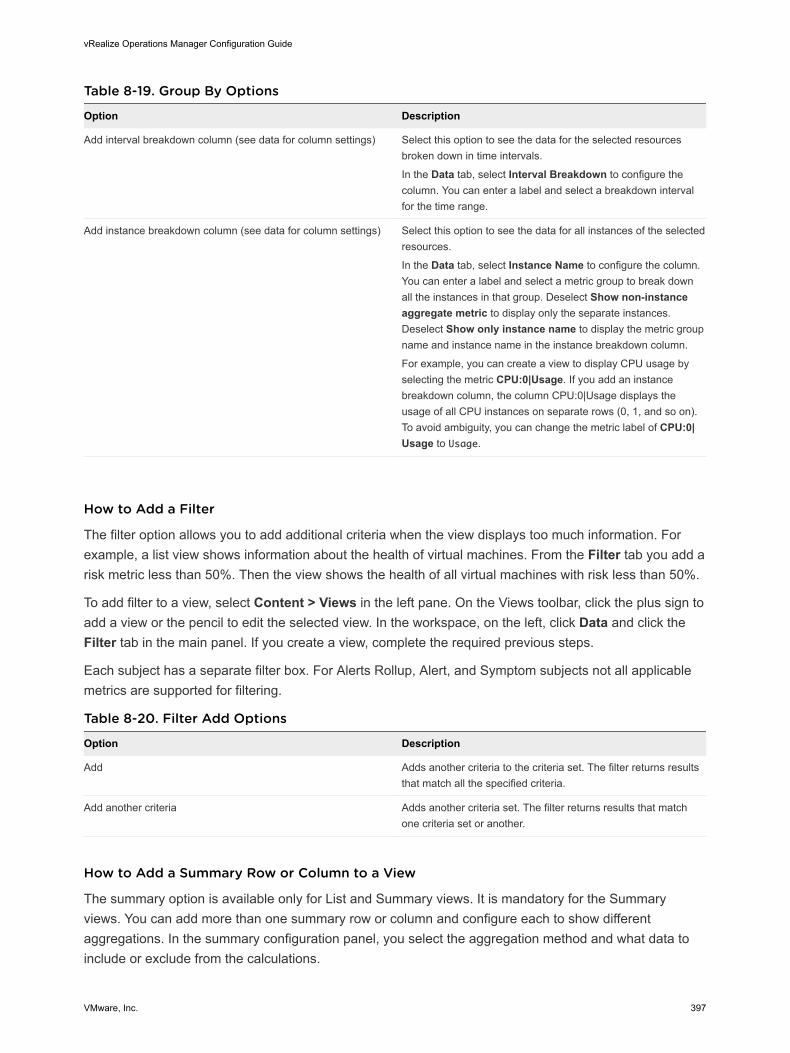
Table 8-19. Group By Options
Option Description
Add interval breakdown column (see data for column settings) Select this option to see the data for the selected resources broken down in time intervals.
In the Data tab, select Interval Breakdown to configure the column. You can enter a label and select a breakdown interval for the time range.
Add instance breakdown column (see data for column settings) Select this option to see the data for all instances of the selected resources.
In the Data tab, select Instance Name to configure the column. You can enter a label and select a metric group to break down all the instances in that group. Deselect Show non-instance aggregate metric to display only the separate instances. Deselect Show only instance name to display the metric group name and instance name in the instance breakdown column.
For example, you can create a view to display CPU usage by selecting the metric CPU:0|Usage. If you add an instance breakdown column, the column CPU:0|Usage displays the usage of all CPU instances on separate rows (0, 1, and so on). To avoid ambiguity, you can change the metric label of CPU:0|Usage to Usage.
How to Add a Filter
The filter option allows you to add additional criteria when the view displays too much information. For example, a list view shows information about the health of virtual machines. From the Filter tab you add a risk metric less than 50%. Then the view shows the health of all virtual machines with risk less than 50%.
To add filter to a view, select Content > Views in the left pane. On the Views toolbar, click the plus sign to add a view or the pencil to edit the selected view. In the workspace, on the left, click Data and click the Filter tab in the main panel. If you create a view, complete the required previous steps.
Each subject has a separate filter box. For Alerts Rollup, Alert, and Symptom subjects not all applicable metrics are supported for filtering.
Table 8-20. Filter Add Options
Option Description
Add Adds another criteria to the criteria set. The filter returns results that match all the specified criteria.
Add another criteria Adds another criteria set. The filter returns results that match one criteria set or another.
How to Add a Summary Row or Column to a View
The summary option is available only for List and Summary views. It is mandatory for the Summary views. You can add more than one summary row or column and configure each to show different aggregations. In the summary configuration panel, you select the aggregation method and what data to include or exclude from the calculations.
vRealize Operations Manager Configuration Guide
VMware, Inc. 397
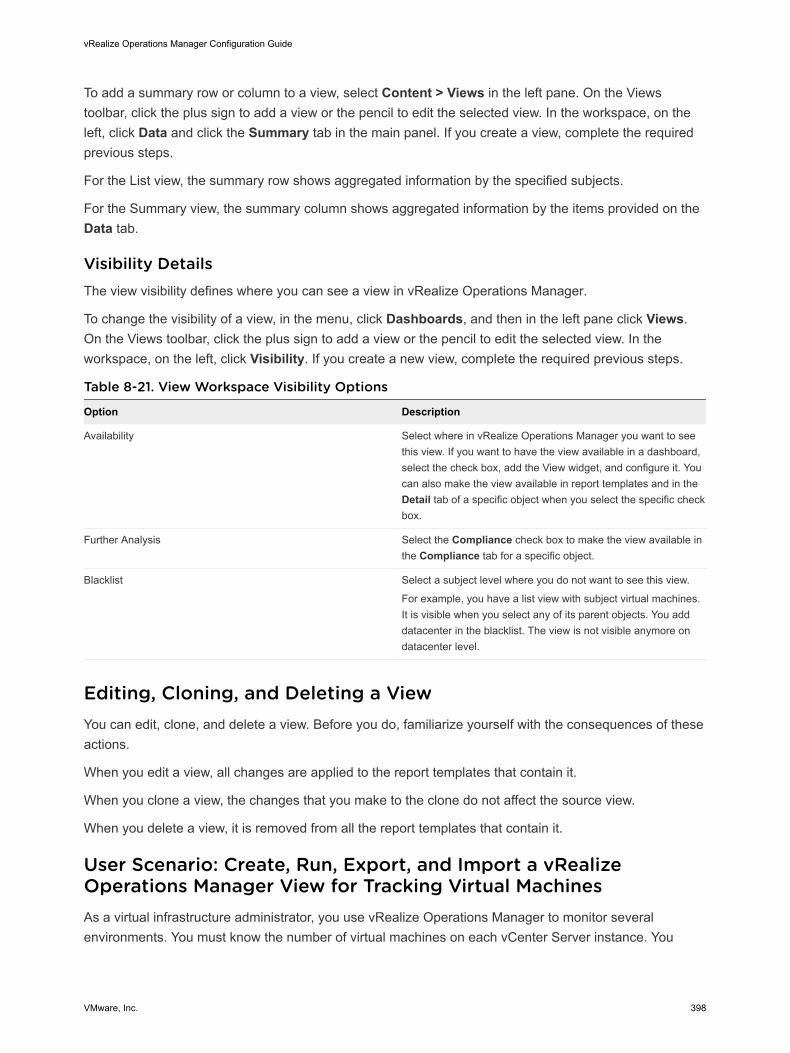
To add a summary row or column to a view, select Content > Views in the left pane. On the Views toolbar, click the plus sign to add a view or the pencil to edit the selected view. In the workspace, on the left, click Data and click the Summary tab in the main panel. If you create a view, complete the required previous steps.
For the List view, the summary row shows aggregated information by the specified subjects.
For the Summary view, the summary column shows aggregated information by the items provided on the Data tab.
Visibility DetailsThe view visibility defines where you can see a view in vRealize Operations Manager.
To change the visibility of a view, in the menu, click Dashboards, and then in the left pane click Views. On the Views toolbar, click the plus sign to add a view or the pencil to edit the selected view. In the workspace, on the left, click Visibility. If you create a new view, complete the required previous steps.
Table 8-21. View Workspace Visibility Options
Option Description
Availability Select where in vRealize Operations Manager you want to see this view. If you want to have the view available in a dashboard, select the check box, add the View widget, and configure it. You can also make the view available in report templates and in the Detail tab of a specific object when you select the specific check box.
Further Analysis Select the Compliance check box to make the view available in the Compliance tab for a specific object.
Blacklist Select a subject level where you do not want to see this view.
For example, you have a list view with subject virtual machines. It is visible when you select any of its parent objects. You add datacenter in the blacklist. The view is not visible anymore on datacenter level.
Editing, Cloning, and Deleting a ViewYou can edit, clone, and delete a view. Before you do, familiarize yourself with the consequences of these actions.
When you edit a view, all changes are applied to the report templates that contain it.
When you clone a view, the changes that you make to the clone do not affect the source view.
When you delete a view, it is removed from all the report templates that contain it.
User Scenario: Create, Run, Export, and Import a vRealize Operations Manager View for Tracking Virtual MachinesAs a virtual infrastructure administrator, you use vRealize Operations Manager to monitor several environments. You must know the number of virtual machines on each vCenter Server instance. You
vRealize Operations Manager Configuration Guide
VMware, Inc. 398
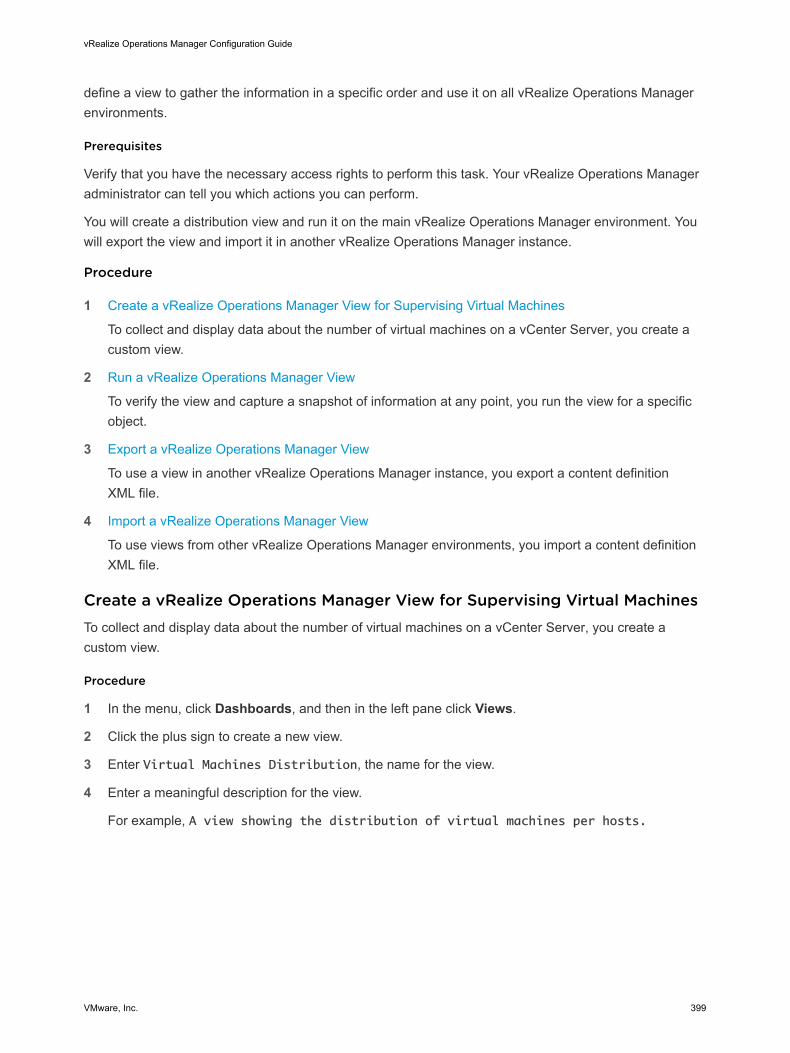
define a view to gather the information in a specific order and use it on all vRealize Operations Manager environments.
Prerequisites
Verify that you have the necessary access rights to perform this task. Your vRealize Operations Manager administrator can tell you which actions you can perform.
You will create a distribution view and run it on the main vRealize Operations Manager environment. You will export the view and import it in another vRealize Operations Manager instance.
Procedure
1 Create a vRealize Operations Manager View for Supervising Virtual Machines
To collect and display data about the number of virtual machines on a vCenter Server, you create a custom view.
2 Run a vRealize Operations Manager View
To verify the view and capture a snapshot of information at any point, you run the view for a specific object.
3 Export a vRealize Operations Manager View
To use a view in another vRealize Operations Manager instance, you export a content definition XML file.
4 Import a vRealize Operations Manager View
To use views from other vRealize Operations Manager environments, you import a content definition XML file.
Create a vRealize Operations Manager View for Supervising Virtual MachinesTo collect and display data about the number of virtual machines on a vCenter Server, you create a custom view.
Procedure
1 In the menu, click Dashboards, and then in the left pane click Views.
2 Click the plus sign to create a new view.
3 Enter Virtual Machines Distribution, the name for the view.
4 Enter a meaningful description for the view.
For example, A view showing the distribution of virtual machines per hosts.
vRealize Operations Manager Configuration Guide
VMware, Inc. 399

5 Click Presentation and select the Distribution view type.
The view type is the way the information is displayed.
a From the Visualization drop-down menu, select Pie Chart.
b From the Distribution Type configurations, select Discrete distribution.
Leave Max number of buckets deselected because you do not know the number of hosts on each vCenter Server instance. If you specify a number of buckets and the hosts are more than that number, one of the slices shows unspecified information labeled Others.
6 Click Subjects to select the object type that applies to the view.
a From the drop-down menu, select Host System.
The Distribution view is visible at the object containers of the subjects that you specify during the view configuration.
7 Click Data and in the filter text box enter Total Number of VMs.
8 Select Summary > Total Number of VMs and double-click to add the metric.
9 Retain the default metric configurations and click Save.
Run a vRealize Operations Manager ViewTo verify the view and capture a snapshot of information at any point, you run the view for a specific object.
Prerequisites
Verify that you have the necessary access rights to perform this task. Your vRealize Operations Manager administrator can tell you which actions you can perform.
Procedure
1 In the menu, click Environment.
2 In the left pane, navigate to a vCenter Server instance and click the Details tab.
All listed views are applicable for the vCenter Server instance.
3 From the All Filters drop-down menu on the left, select Type > Distribution.
You filter the views list to show only distribution type views.
4 Navigate to and click the Virtual Machines Distribution view.
The bottom pane shows the distribution view with information about this vCenter Server. Each slice represents a host and the numbers on the far left show the number of virtual machines.
Export a vRealize Operations Manager ViewTo use a view in another vRealize Operations Manager instance, you export a content definition XML file.
If the exported view contains custom created metrics, such as what-if, supermetrics, or custom adapter metrics, you must recreate them in the new environment.
vRealize Operations Manager Configuration Guide
VMware, Inc. 400
Prerequisites
Verify that you have the necessary access rights to perform this task. Your vRealize Operations Manager administrator can tell you which actions you can perform.
Procedure
1 In the menu, click Dashboards, and then in the left pane click Views.
2 Select a view and click Actions > Export.
Import a vRealize Operations Manager ViewTo use views from other vRealize Operations Manager environments, you import a content definition XML file.
Prerequisites
Verify that you have the necessary access rights to perform this task. Your vRealize Operations Manager administrator can tell you which actions you can perform.
Procedure
1 In the menu, click Dashboards, and then in the left pane click Views.
2 Select a view and click Actions > Import Views.
3 Browse to select the Virtual Machines Distribution content definition XML file and click Import.
If the imported view contains custom created metrics, such as what-if, supermetrics, or custom adapter metrics, you must recreate them in the new environment.
Note The imported view overwrites if a view with the same name exists. All report templates that use the existing view are updated with the imported view.
ReportsA report is a scheduled snapshot of views and dashboards. You can create it to represent objects and metrics. It can contain table of contents, cover page, and footer.
With the vRealize Operations Manager reporting functions, you can generate a report to capture details related to current or predicted resource needs. You can download the report in a PDF or CSV file format for future and offline needs.
Create Reports (http://link.brightcove.com/services/player/bcpid2296383276001?bctid=ref:video_reports_vrops)
Report Templates TabOn the Report Templates tab you can create, edit, delete, clone, run, schedule, export, and import templates.
vRealize Operations Manager Configuration Guide
VMware, Inc. 401

In the menu, click Environment, and then in the left pane select an object and click Reports > Report Templates to access the Reports Templates tab.
All templates that are applicable for the selected object are listed on the Report Templates tab. You can order them by report name, subject, date they were modified, last run, or owner.
For more information about the options and actions in the Reports Tab page, see Report Templates Overview.
Table 8-22. Predefined Filter Groups
Filter Group Description
Name Filter by the template name. For example, you can list all reports that contain my template in their name by typing my template.
Subject Filter by another object. If the report contains more than one view applicable for another type of object, you can filter by those objects.
Owner Filter by the owner of the report template.
vSphere users must be logged in until the report generation is complete. If you log out or your session expires, the report generation fails.
Note The maximum number of reports per template is 10. With every new generated report, vRealize Operations Manager deletes the oldest report.
Generated Reports TabAll reports that are generated for a selected object are listed on the Generated Reports tab.
In the menu, click Environment, and then in the left pane select an object and click Reports > Generated Reports to access the Generated Reports tab.
You can order the reports by the date and time that they were created, the report name, the owner, or their status. If the report is generated through a schedule, the owner is the user who created the schedule.
Note The maximum number of reports per template is 10. With every new generated report, vRealize Operations Manager deletes the oldest report.
You can filter the reports list by adding a filter from the right side of the panel.
For more information about the options and actions in the Generated Reports tab page, see Generated Reports Overview.
vRealize Operations Manager Configuration Guide
VMware, Inc. 402
Table 8-23. Predefined Filter Groups
Filter Group Description
Report Name Filter by the report template name. For example, you can list all reports that contain my template in their name by typing my template.
Template Filter by the report template. You can select a template from a list of templates applicable for this object.
Completion Date/Time Filter by the date, time, or time range.
Status Filter by the status of the report.
On each data node, only one report can be processed. Therefore, reports that are queued can be moved to the processed state only after the previous report on the specific node has failed or completed. The maximum queue time is restricted to 4 hours. After 4 hours, if processing of the report has not started, the report is marked as failed.
Subject Filter by another object. If the report contains more than one view applicable for another type of object, you can filter by those objects.
You can download a report in a PDF or CSV format. You define the format that a report is generated in the report template.
Create and Modify a Report TemplateYou create a report to generate a scheduled snapshot of views and dashboards. You can track current resources and predict potential risks to the environment. You can schedule automated reports at regular intervals.
Procedure
1 In the menu, click Dashboards, and then in the left pane click Reports.
2 On the Report Templates tab, click the New Template icon to create a template.
3 Complete the steps in the left pane to:
a Enter a name and description for the report template.
Name and Description Details
b Add a view or a dashboard.
Views and Dashboards Details
c Select an output for the report.
Formats Details
d Select the layout options.
Layout Options Details
4 Click Save.
vRealize Operations Manager Configuration Guide
VMware, Inc. 403
5 From the Report Templates tab, click Edit Template to modify the report template.
Name and Description DetailsThe name and description of the report template as they appear in the list of templates on the Report Templates tab.
Where You Add Name and Description
To create or edit report templates, in the menu, click Dashboards, and then in the left pane click Reports. On the Report Templates toolbar, click the New Template icon to add a template or the Edit Template icon to edit the selected template. From the New Template or Edit Report Template dialog box, in the workspace, on the left, click Name and Description.
Table 8-24. Name and Description Options in the Report Template Workspace
Option Description
Name Name of the template as it appears on the Report Templates tab.
Description Description of the template.
Views and Dashboards DetailsThe report template contains views and dashboards. Views present collected information for an object. Dashboards give a visual overview of the performance and state of objects in your virtual infrastructure. You can combine different views and dashboards and order them to suit your needs.
Where You Add Views and Dashboards
To create or edit report templates, in the menu, click Dashboards, and then in the left pane click Reports. On the Report Templates toolbar, click the New Template icon to add a template or the Edit Template icon to edit the selected template. From the New Template or Edit Report Template dialog box, in the workspace, on the left, click Views and Dashboards. If you create a template, complete the required previous steps of the workspace.
How You Add Views and Dashboards
To add a view or a dashboard to your report template, select it from the list on the left pane and drag it to the main panel. You can drag the views and dashboards in the main panel to reorder them. You can select a portrait or landscape orientation for each view or dashboard from the drop-down menu next to its title.
Table 8-25. Views and Dashboards Options in the Report Template Workspace
Option Description
Data type Select Views or Dashboards to display a list of available views or dashboards that you can add to the template.
Create View Create a view directly from the template workspace. This option is available when you select Views from the Data type drop-down menu.
vRealize Operations Manager Configuration Guide
VMware, Inc. 404

Table 8-25. Views and Dashboards Options in the Report Template Workspace (continued)
Option Description
Edit View Edit a view directly from the template workspace. This option is available when you select Views from the Data type drop-down menu.
Create Dashboard Create a dashboard directly from the template workspace. This option is available when you select Dashboards from the Data type drop-down menu.
Edit Dashboard Edit a dashboard directly from the template workspace. This option is available when you select Dashboards from the Data type drop-down menu.
Search Search for views or dashboards by name. To see the complete list of views or dashboards, delete the search box contents and press Enter.
List of views List of the views that you can add to the template. This list is available when you select Views from the Data type drop-down menu.
List of dashboards List of the dashboards that you can add to the template. This list is available when you select Dashboards from the Data type drop-down menu.
Preview of views and dashboards In the main panel, you see a preview of the views and dashboards that you add.
When you create a template in the context of an object from the environment, you see a live preview of the views and dashboards.
Colorization You can enable or disable a colorized PDF output for each list view. This option is available from the right panel when you select Views from the Data type drop-down menu.
Formats DetailsThe formats are the outputs in which you can generate the report.
Where You Add Formats
To create or edit report templates, in the menu, click Dashboards, and then in the left pane click Reports. On the Report Templates toolbar, click the New Template icon to add a template or the Edit Template icon to edit the selected template. From the New Template or Edit Report Template dialog box, in the workspace, on the left, click Formats to select a format for the report template. If you create a template, complete the required previous steps of the workspace.
Table 8-26. Formats Options in the Report Template Workspace
Option Description
PDF With the PDF format, you can read the reports, either on or off line. This format provides a page-by-page view of the reports, as they appear in printed form.
CSV In the CSV format, the data is in a structured table of lists.
vRealize Operations Manager Configuration Guide
VMware, Inc. 405
Layout Options DetailsThe report template can contain layout options such as a cover page, table of contents, and footer.
Where You Add Layout Options
To create or edit report templates, in the menu, click Dashboards, and then in the left pane click Reports. On the Report Templates toolbar, click the New Template icon to add a template or the Edit Template icon to edit the selected template. From the New Template or Edit Report Template dialog box, in the workspace, on the left, click Layout Options. If you create a template, complete the required previous steps of the template.
Table 8-27. Layout Options in the Report Template Workspace
Option Description
Cover Page Can contain an image up to 5 MB.
The default report size is 8.5 inches by 11 inches. The image is resized to fit the report front page.
Table of contents Provides a list of the template parts, organized in the order of their appearance in the report.
Footer Includes the date when the report is created, a note that the report is created by VMware vRealize Operations Manager, and page number.
Add a Network Share Plug-In for vRealize Operations Manager ReportsYou add a Network Share plug-in when you want to configure vRealize Operations Manager to send reports to a shared location. The Network Share plug-in supports only SMB version 2.1.
Prerequisites
Verify that you have read, write, and delete permissions to the network share location.
Procedure
1 In the menu, click Administration and then in the left pane, click Management > Outbound Settings.
2 From the toolbar, click the Add icon.
3 From the Plug-In Type drop-down menu, select Network Share Plug-in.
The dialog box expands to include your plug-in instance settings.
4 Enter an Instance Name.
This is the name that identifies this instance that you select when you later configure notification rules.
vRealize Operations Manager Configuration Guide
VMware, Inc. 406
5 Configure the Network Share options appropriate for your environment.
Option Description
Domain Your shared network domain address.
User Name The domain user account that is used to connect to the network.
Password The password for the domain user account.
Network share root The path to the root folder where you want to save the reports. You can specify subfolders for each report when you configure the schedule publication.
You must enter an IP address. For example, \\IP_address\ShareRoot. You can use the host name instead of the IP address if the host name is resolved to an IPv4 when accessed from the vRealize Operations Manager host.
Note Verify that the root destination folder exists. If the folder is missing, the Network Share plug-in logs an error after 5 unsuccessful attempts.
6 Click Test to verify the specified paths, credentials, and permissions.
The test might take up to a minute.
7 Click Save.
The outbound service for this plug-in starts automatically.
8 (Optional) To stop an outbound service, select an instance and click Disable on the toolbar.
This instance of the Network Share plug-in is configured and running.
What to do next
Create a report schedule and configure it to send reports to your shared folder.
Report Templates OverviewThe report template contains views and dashboards. Views present collected information for an object. Dashboards give a visual overview of the performance and state of objects in your virtual infrastructure. You can combine different views and dashboards and order them to suit your needs.
In the menu, click Dashboards, and then in the left pane select Reports > Report Templates to access the Report Templates tab.
The listed templates are user-defined and predefined by vRealize Operations Manager. You can order them by template name, subject, date they were modified, last run report, or the owner. For each template, you can see the number of generated reports and schedules.
You can filter the reports based on the name of the report template, the subject, and the owner. Also, you can click New Template to create a report template. For information about creating a report template, see Create and Modify a Report Template.
You can select a report template from the list, click the vertical ellipsis against each report template, and select options such as run, edit, schedule, delete, clone, and export a report.
vRealize Operations Manager Configuration Guide
VMware, Inc. 407
Table 8-28. Predefined Filter Groups
Filter Group Description
Name Filter by the template name. For example, type my template to list all reports that contain the my template phrase in their name.
Subject Filter by another object. If the report contains more than one view applicable for another type of object, you can filter by the other objects.
Owner Filter by the owner of the report template.
The maximum number of reports per template is 10. After the tenth report is generated, vRealize Operations Manager deletes the oldest report.
Report Template Actions
You can select more than one report template and perform a set of actions by clicking the Actions drop-down menu.
Option Description
Delete template Deletes the report template.
Export Template Downloads the report template.
Import Template Allows you to import a report template by selecting a report template in XML or zip file format.
Change default cover image Allows you to change the default cover image of the report template. For more information, see Upload a Default Cover Page Image for Reports.
Generated Reports OverviewA report is a scheduled snapshot of views and dashboards. It presents data in formats that can be downloaded.
In the menu, click Dashboards, and then in the left pane select Reports > Generated Reports to access the Generated Reports tab.
The list contains all generated reports. You can order them by the date and time they were created, report name, owner, or status. If the report is generated through a schedule, the owner is the user who created the schedule.
Note The maximum number of reports per template is 10. After the tenth report is generated, vRealize Operations Manager deletes the oldest report.
To select a generated report from the list, click the vertical ellipsis against each generated report and select options such as run and delete. You can also select more than one generated report and select Delete report from the Actions drop-down menu to delete a generated report.
You can filter the reports list by adding a filter from the upper-right corner of the panel.
vRealize Operations Manager Configuration Guide
VMware, Inc. 408
Table 8-29. Predefined Filter Groups
Filter Group Description
Report Name Filter by the report template name. For example, type my template to list all reports that contain the my template phrase in their name.
Template Filter by the report template. You can select a template from a list of templates applicable for this object.
Completion Date/Time Filter by the date, time, or time range.
Subject Filter by another object. If the report contains more than one view applicable for another type of object, you can filter by that second object.
Status Filter by the status of the report.
You can download a report in a PDF or CSV format. You define the format that a report is generated in the report template.
If you log in to vRealize Operations Manager with vCenter Server credentials and generate a report, the generated report is always blank.
Generate and Regenerate a ReportTo generate a report, use a report template.
Prerequisites
Create a report template.
Procedure
1 In the menu, click Environment.
2 In the left pane, navigate to the relevant object.
3 Click the Reports tab and click Report Templates.
The listed report templates are associated with the current object.
4 Navigate to the relevant report template and click the Run Template icon.
The report is generated and listed on the Generated Reports tab.
Note To regenerate the selected report, click Regenerate Report from the Generated Reports tab.
What to do next
Download the generated report and verify the output.
Download a ReportTo verify that the information appears as expected, you download the generated report.
vRealize Operations Manager Configuration Guide
VMware, Inc. 409
Prerequisites
Generate a report.
Procedure
1 In the menu, click Environment.
2 In the left pane, navigate to the object for which you want to download a report.
3 Click the Reports tab and click Generated Reports.
The listed reports are generated for the current object.
4 Click the PDF ( ) icon to save the report.
vRealize Operations Manager saves the report file to the location you selected.
What to do next
Schedule a report generation and set the email options, so your team receives the report.
Schedule Reports OverviewThe schedule of a report is the time and recurrence of a report generation.
Where Do You Schedule a ReportTo schedule a report generation, in the menu, click Environment, and then in the left pane navigate to an object and click the Reports tab. Select a template to schedule, click the vertical ellipsis, and then click Schedule. To edit the schedule of a report, click the Schedules link of a report from the Report Templates tab, and then from the Scheduled Reports dialog box, click Edit Schedule.
How Do You Schedule a ReportTable 8-30. Schedule Report Options
Option Description
Recurrence Schedule a report to run automatically at regular intervals.
Publishing Email a generated report to a predefined email group or to a network shared location.
Save a generated report to an external location. For more information about how to configure an external location, see Add a Network Share Plug-In for vRealize Operations Manager Reports
You can add a relative path to upload the report to a predefined sub folder of the Network Share Root folder. For example, to upload the report to the share host C:/documents/uploadedReports/SubFolder1, in the Relative Path text box, enter SubFolder1. To upload the report to the Network Share Root folder, leave the Relative Path text box empty.
Note Only users created in vRealize Operations Manager can add and edit report schedules.
vRealize Operations Manager Configuration Guide
VMware, Inc. 410
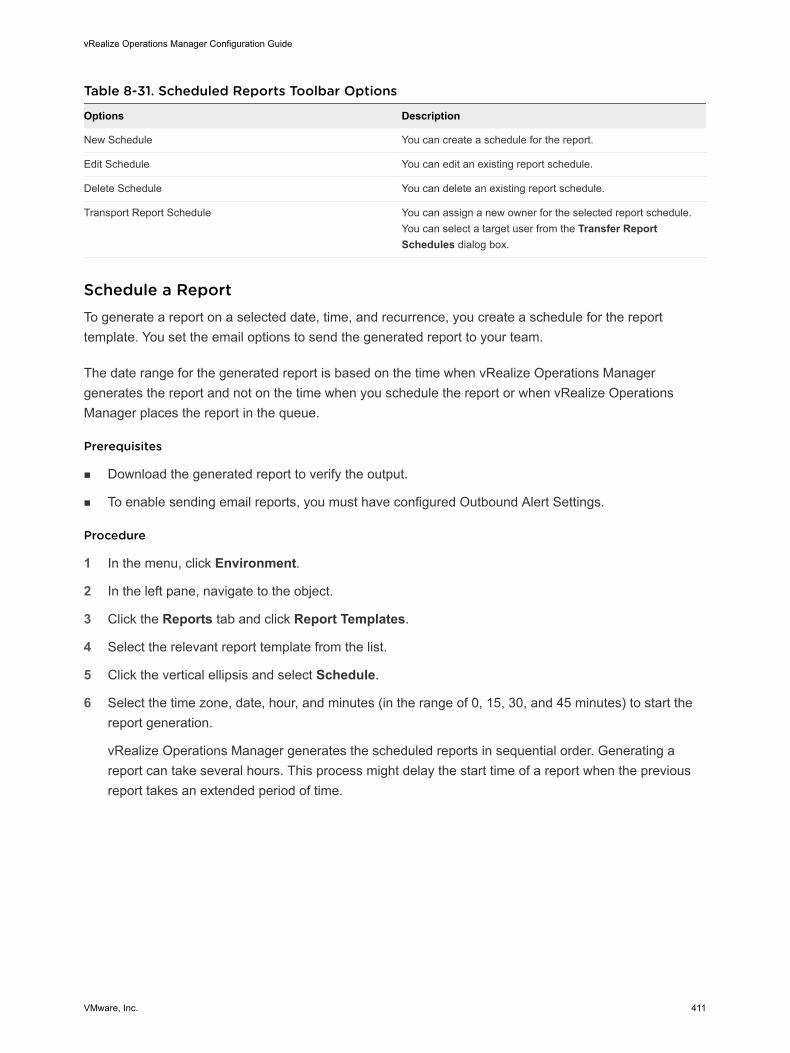
Table 8-31. Scheduled Reports Toolbar Options
Options Description
New Schedule You can create a schedule for the report.
Edit Schedule You can edit an existing report schedule.
Delete Schedule You can delete an existing report schedule.
Transport Report Schedule You can assign a new owner for the selected report schedule. You can select a target user from the Transfer Report Schedules dialog box.
Schedule a ReportTo generate a report on a selected date, time, and recurrence, you create a schedule for the report template. You set the email options to send the generated report to your team.
The date range for the generated report is based on the time when vRealize Operations Manager generates the report and not on the time when you schedule the report or when vRealize Operations Manager places the report in the queue.
Prerequisites
n Download the generated report to verify the output.
n To enable sending email reports, you must have configured Outbound Alert Settings.
Procedure
1 In the menu, click Environment.
2 In the left pane, navigate to the object.
3 Click the Reports tab and click Report Templates.
4 Select the relevant report template from the list.
5 Click the vertical ellipsis and select Schedule.
6 Select the time zone, date, hour, and minutes (in the range of 0, 15, 30, and 45 minutes) to start the report generation.
vRealize Operations Manager generates the scheduled reports in sequential order. Generating a report can take several hours. This process might delay the start time of a report when the previous report takes an extended period of time.
vRealize Operations Manager Configuration Guide
VMware, Inc. 411
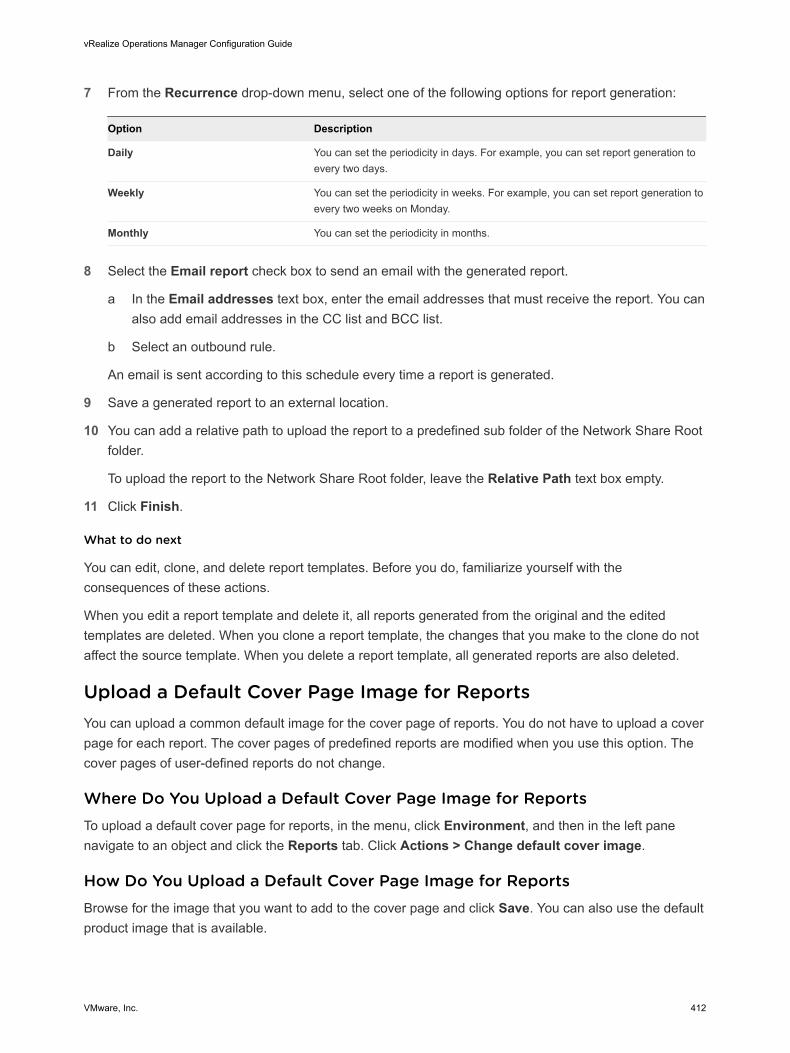
7 From the Recurrence drop-down menu, select one of the following options for report generation:
Option Description
Daily You can set the periodicity in days. For example, you can set report generation to every two days.
Weekly You can set the periodicity in weeks. For example, you can set report generation to every two weeks on Monday.
Monthly You can set the periodicity in months.
8 Select the Email report check box to send an email with the generated report.
a In the Email addresses text box, enter the email addresses that must receive the report. You can also add email addresses in the CC list and BCC list.
b Select an outbound rule.
An email is sent according to this schedule every time a report is generated.
9 Save a generated report to an external location.
10 You can add a relative path to upload the report to a predefined sub folder of the Network Share Root folder.
To upload the report to the Network Share Root folder, leave the Relative Path text box empty.
11 Click Finish.
What to do next
You can edit, clone, and delete report templates. Before you do, familiarize yourself with the consequences of these actions.
When you edit a report template and delete it, all reports generated from the original and the edited templates are deleted. When you clone a report template, the changes that you make to the clone do not affect the source template. When you delete a report template, all generated reports are also deleted.
Upload a Default Cover Page Image for ReportsYou can upload a common default image for the cover page of reports. You do not have to upload a cover page for each report. The cover pages of predefined reports are modified when you use this option. The cover pages of user-defined reports do not change.
Where Do You Upload a Default Cover Page Image for ReportsTo upload a default cover page for reports, in the menu, click Environment, and then in the left pane navigate to an object and click the Reports tab. Click Actions > Change default cover image.
How Do You Upload a Default Cover Page Image for ReportsBrowse for the image that you want to add to the cover page and click Save. You can also use the default product image that is available.
vRealize Operations Manager Configuration Guide
VMware, Inc. 412
Configuring Administration Settings 9After vRealize Operations Manager is installed and configured, you can use administration settings to manage your environment. You find most administration settings under the Administration selection of the vRealize Operations Manager interface.
This chapter includes the following topics:
n Managing Users and Access Control in vRealize Operations Manager
n vRealize Operations Manager Passwords and Certificates
n Modifying Global Settings
n Transfer Ownership of Dashboards and Report Schedules
n Create a vRealize Operations Manager Support Bundle
n Customizing Icons
Managing Users and Access Control in vRealize Operations ManagerTo ensure security of the objects in your vRealize Operations Manager instance, as a system administrator you can manage all aspects of user access control. You create user accounts, assign each user to be a member of one or more user groups, and assign roles to each user or user group to set their privileges.
Users must have privileges to access specific features in the vRealize Operations Manager user interface. Access control is defined by assigning privileges to both users and objects. You can assign one or more roles to users, and enable them to perform a range of different actions on the same types of objects. For example, you can assign a user with the privileges to delete a virtual machine, and assign the same user with read-only privileges for another virtual machine.
User Access ControlYou can authenticate users in vRealize Operations Manager in several ways.
n Create local user accounts in vRealize Operations Manager.
VMware, Inc. 413
n Use VMware vCenter Server® users. After the vCenter Server is registered with vRealize Operations Manager, configure the vCenter Server user options in the vRealize Operations Manager global settings to enable a vCenter Server user to log in to vRealize Operations Manager. When logged into vRealize Operations Manager, vCenter Server users access objects according to their vCenter Server-assigned permissions.
n Add an authentication source to authenticate imported users and user group information that resides on another machine.
n Use LDAP to import users or user groups from an LDAP server. LDAP users can use their LDAP credentials to log in to vRealize Operations Manager.
n Create a single sign-on source and import users and user groups from a single sign-on server. Single sign-on users can use their single sign-on credentials to log in to vRealize Operations Manager and vCenter Server. You can also use Active Directory through single sign-on by configuring the Active Directory through single sign-on and adding the single sign-on source to vRealize Operations Manager.
User PreferencesTo determine the display options for vRealize Operations Manager, such as colors for the display and health chart, the number of metrics and groups to display, and whether to synchronize system time with the host machine, you configure the user preferences on the top toolbar.
Users of vRealize Operations ManagerEach user has an account to authenticate them when they log in to vRealize Operations Manager.
The accounts of local users and LDAP users are visible in the vRealize Operations Manager user interface when they are set up. The accounts of vCenter Server and single sign-on users only appear in the user interface after a user logs in for the first time. Each user can be assigned one or more roles, and can be an authenticated member of one or more user groups.
Local Users in vRealize Operations ManagerWhen you create user accounts in a local vRealize Operations Manager instance, vRealize Operations Manager stores the credentials for those accounts in its global database, and authenticates the account user locally.
Each user account must have a unique identity, and can include any associated user preferences.
If you are logging in to vRealize Operations Manager as a local user, and on occasion receive an invalid password message, try the following workaround. In the Login page, change the Authentication Source to All vCenter Servers, change it back to Local Users, and log in again.
vCenter Server Users in vRealize Operations ManagervRealize Operations Manager supports vCenter Server users. To log in to vRealize Operations Manager, vCenter Server users must be valid users in vCenter Server.
vRealize Operations Manager Configuration Guide
VMware, Inc. 414
Roles and Associations
A vCenter Server user must have either the vCenter Server Admin role or one of the vRealize Operations Manager privileges, such as PowerUser which assigned at the root level in vCenter Server, to log in to vRealize Operations Manager. vRealize Operations Manager uses only the vCenter privileges, meaning the vRealize Operations Manager roles, at the root level, and applies them to all the objects to which the user has access. After logging in, vCenter Server users can view all the objects in vRealize Operations Manager that they can already view in vCenter Server.
Logging in to vCenter Server Instances and Accessing Objects
vCenter Server users can access either a single vCenter Server instance or multiple vCenter Server instances, depending on the authentication source they select when they log in to vRealize Operations Manager.
n If users select a single vCenter Server instance as the authentication source, they have permission to access the objects in that vCenter Server instance. After the user has logged in, an account is created in vRealize Operations Manager with the specific vCenter Server instance serving as the authentication source.
n If users select All vCenter Servers as the authentication source, and they have identical credentials for each vCenter Server in the environment, they see all the objects in all the vCenter Server instances. Only users that have been authenticated by all the vCenter Servers in the environment can log in. After a user has logged in, an account is created in vRealize Operations Manager with all vCenter Server instances serving as the authentication source.
vRealize Operations Manager does not support linked vCenter Server instances. Instead, you must configure the vCenter Server adapter for each vCenter Server instance, and register each vCenter Server instance to vRealize Operations Manager.
Only objects from a specific vCenter Server instance appear in vRealize Operations Manager. If a vCenter Server instance has other linked vCenter Server instances, the data does not appear.
vCenter Server Roles and Privileges
You cannot view or edit vCenter Server roles or privileges in vRealize Operations Manager. vRealize Operations Manager sends roles as privileges to vCenter Server as part of the vCenter Server Global privilege group. A vCenter Server administrator must assign vRealize Operations Manager roles to users in vCenter Server.
vRealize Operations Manager privileges in vCenter Server have the role appended to the name. For example, vRealize Operations Manager ContentAdmin Role, or vRealize Operations Manager PowerUser Role.
vRealize Operations Manager Configuration Guide
VMware, Inc. 415
Read-Only Principal
A vCenter Server user is a read-only principal in vRealize Operations Manager, which means that you cannot change the role, group, or objects associated with the role in vRealize Operations Manager. Instead, you must change them in the vCenter Server instance. The role applied to the root folder applies to all the objects in vCenter Server to which a user has privileges. vRealize Operations Manager does not apply individual roles on objects. For example, if a user has the PowerUser role to access the vCenter Server root folder, but has read-only access to a virtual machine, vRealize Operations Manager applies the PowerUser role to the user to access the virtual machine.
Refreshing Permissions
When you change permissions for a vCenter Server user in vCenter Server, the user must log out and log back in to vRealize Operations Manager to refresh the permissions and view the updated results in vRealize Operations Manager. Alternatively, the user can wait for vRealize Operations Manager to refresh. The permissions refresh at fixed intervals, as defined in the $ALIVE_BASE/user/conf/auth.properties file. The default refreshing interval is half an hour. If necessary, you can change this interval for all nodes in the cluster.
Single Sign-On and vCenter Users
When vCenter Server users log into vRealize Operations Manager by way of single sign-on, they are registered on the vRealize Operations Manager User Accounts page. If you delete the account of a vCenter Server user that has logged into vRealize Operations Manager by way of single sign-on, or remove the user from a single sign-on group, the user account entry still appears on the User Account page and you must delete it manually.
Generating Reports
vCenter Server users cannot create or schedule reports in vRealize Operations Manager.
Backward Compatibility for vCenter Server Users in vRealize Operations ManagervRealize Operations Manager provides backward compatibility for users of the earlier version of vRealize Operations Manager, so that users of vCenter Server who have privileges in the earlier version in vCenter Server can log in to vRealize Operations Manager.
When you register vRealize Operations Manager in vCenter Server, certain roles become available in vCenter Server.
n The Administrator account in the previous version of vRealize Operations Manager maps to the PowerUser role.
n The Operator account in the previous version of vRealize Operations Manager maps to the ReadOnly role.
vRealize Operations Manager Configuration Guide
VMware, Inc. 416
During registration, all roles in vRealize Operations Manager, except for vRealize Operations Manager Administrator, Maintenance, and Migration, become available dynamically in vCenter Server. Administrators in vCenter Server have all of the roles in vRealize Operations Manager that map during registration, but these administrator accounts only receive a specific role on the root folder in vCenter Server if it is specially assigned.
Registration of vRealize Operations Manager with vCenter Server is optional. If users choose not to register vRealize Operations Manager with vCenter Server, a vCenter Server administrator can still use their user name and password to log in to vRealize Operations Manager, but these users cannot use the vCenter Server session ID to log in. In this case, typical vCenter Server users must have one or more vRealize Operations Manager roles to log in to vRealize Operations Manager.
When multiple instances of vCenter Server are added to vRealize Operations Manager, user credentials become valid for all of the vCenter Server instances. When a user logs in to vRealize Operations Manager, if the user selects all vCenter Server options during login, vRealize Operations Manager requires that the user's credentials are valid for all of the vCenter Server instances. If a user account is only valid for a single vCenter Server instance, that user can select the vCenter Server instance from the login drop-down menu to log in to vRealize Operations Manager.
vCenter Server users who log in to vRealize Operations Manager must have one or more of the following roles in vCenter Server:
n vRealize Operations Content Admin Role
n vRealize Operations General User Role 1
n vRealize Operations General User Role 2
n vRealize Operations General User Role 3
n vRealize Operations General User Role 4
n vRealize Operations Power User Role
n vRealize Operations Power User without Remediation Actions Role
n vRealize Operations Read Only Role
For more information about vCenter Server users, groups, and roles, see the vCenter Server documentation.
External User Sources in vRealize Operations ManagerYou can obtain user accounts from external sources so that you can use them in your vRealize Operations Manager instance.
There are two types of external user identity sources:
n Lightweight Directory Access Protocol (LDAP): Use the LDAP source if you want to use the Active Directory or LDAP servers as authentication sources. The LDAP source does not support multi-domains even when there is a two-way trust between Domain A and Domain B.
vRealize Operations Manager Configuration Guide
VMware, Inc. 417
n Single Sign-On (SSO): Use a single sign-on source to perform single sign-on with any application that supports vCenter single sign-on, including vRealize Operations Manager. For example, you can install a standalone vCenter Platform Services Controller (PSC) and use it to communicate with an Active Directory server. Use a PSC if the Active Directory has a setup that is too complex for the simple LDAP source in vRealize Operations Manager, or if the LDAP source is experiencing slow performance.
Roles and Privileges in vRealize Operations ManagervRealize Operations Manager provides several predefined roles to assign privileges to users. You can also create your own roles.
You must have privileges to access specific features in the vRealize Operations Manager user interface. The roles associated with your user account determine the features you can access and the actions you can perform.
Each predefined role includes a set of privileges for users to perform, create, read, update, or delete actions on components such as dashboards, reports, administration, capacity, policies, problems, symptoms, alerts, user account management, and adapters. For information about roles and associated permissions, see KB 59484.
Administrator Includes privileges to all features, objects, and actions in vRealize Operations Manager.
PowerUser Users have privileges to perform the actions of the Administrator role except for privileges to user management and cluster management. vRealize Operations Manager maps vCenter Server users to this role.
PowerUserMinusRemediation
Users have privileges to perform the actions of the Administrator role except for privileges to user management, cluster management, and remediation actions.
ContentAdmin Users can manage all content, including views, reports, dashboards, and custom groups in vRealize Operations Manager.
AgentManager Users can deploy and configure End Point Operations Management agents.
GeneralUser-1 through GeneralUser-4
These predefined template roles are initially defined as ReadOnly roles. vCenter Server administrators can configure these roles to create combinations of roles to give users multiple types of privileges. Roles are synchronized to vCenter Server once during registration.
ReadOnly Users have read-only access and can perform read operations, but cannot perform write actions such as create, update, or delete.
vRealize Operations Manager Configuration Guide
VMware, Inc. 418
User Scenario: Manage User Access ControlAs a system administrator or virtual infrastructure administrator, you manage user access control in vRealize Operations Manager so that you can ensure the security of your objects. Your company just hired a new person, and you must create a user account and assign a role to the account so that the new user has permission to access specific content and objects in vRealize Operations Manager.
In this scenario you will learn how to create user accounts and roles, and assign roles to the user accounts to specify access privileges to views and objects. You will then demonstrate the intended behavior of the permissions on these accounts.
You will create a new user account, named Tom User, and a new role that grants administrative access to objects in the vRealize Operations Clusters. You will apply the new role to the user account.
Finally, you will import a user account from an external LDAP user database that resides on another machine to vRealize Operations Manager, and assign a role to the imported user account to configure the user's privileges.
Prerequisites
Verify that the following conditions are met:
n vRealize Operations Manager is installed and operating properly, and contains objects such as clusters, hosts, and virtual machines.
n One or more user groups are defined.
What to do next
Create a new role.
Create a New RoleYou use roles to manage access control for user accounts in vRealize Operations Manager.
In this procedure, you will add a new role and assign administrative permissions to the role.
Prerequisites
Verify that you understand the context of this scenario. See User Scenario: Manage User Access Control. For information about roles and associated permissions, see KB 59484.
Procedure
1 In the menu, click Administration, and then in the left pane click Access > Access Control.
2 Click the Roles tab.
3 Click the Add icon on the toolbar to create a role.
The Create Role dialog box appears.
4 For the role name, type admin_cluster, then type a description and click OK.
The admin_cluster role appears in the list of roles.
vRealize Operations Manager Configuration Guide
VMware, Inc. 419
5 Click the admin_cluster role.
6 In the Details grid below, on the Permissions pane, click the Edit icon.
The Assign Permissions to Role dialog box appears.
7 Select the Administrative Access - all permissions check box.
8 Click Update.
This action gives this role administrative access to all the features in the environment.
What to do next
Create a user account, and assign this role to the account.
Create a User AccountAs an administrator you assign a unique user account to each user so that they can use vRealize Operations Manager. While you set up the user account, you assign the privileges that determine what activities the user can perform in the environment, and upon what objects.
In this procedure, you will create a user account, assign the admin_cluster role to the account, and associate the objects that the user can access while assigned this role. You will assign access to objects in the vRealize Operations Cluster. Then, you will test the user account to confirm that the user can access only the specified objects.
Prerequisites
Create a new role. See Create a New Role.
Procedure
1 In the menu, click Administration, and then in the left pane click Access > Access Control.
2 Click the User Accounts tab.
3 Click the Add icon to create a new user account, and provide the information for this account.
Option Description
User Name Type the user name to use to log in to vRealize Operations Manager.
Password Type a password for the user.
Confirm Password Type the password again to confirm it.
First Name Type the user's first name. For this scenario, type Tom.
Last Name Type the user's last name. For this scenario, type User.
Email Address (Optional). Type the user's email address.
Description (Optional). Type a description for this user.
vRealize Operations Manager Configuration Guide
VMware, Inc. 420
Option Description
Disable this user Do not select this check box, because you want the user to be active for this scenario.
Require password change at next login
Do not select this check box, because you do not need to change the user's password for this scenario.
4 Click Next.
The list of user groups appears.
5 Select a user group to add the user account as a member of the group.
6 Click the Objects tab.
7 Select the admin_cluster role from the drop-down menu.
8 Select the Assign this role to the user check box.
9 In the Object Hierarchies list, select the vRealize Operations Cluster check box.
10 Click Finish.
You created a new user account for a user who can access all the vRealize Operations Cluster objects. The new user now appears in the list of user accounts.
11 Log out of vRealize Operations Manager.
12 Log in to vRealize Operations Manager as Tom User, and verify that this user account can access all the objects in the vRealize Operations Cluster hierarchy, but not other objects in the environment.
13 Log out of vRealize Operations Manager.
You used a specific role to assign permission to access all objects in the vRealize Operations Cluster to a user account named Tom User.
What to do next
Import a user account from an external LDAP user database that resides on another machine, and assign permissions to the user account.
Import a User Account and Assign PermissionsYou can import user accounts from external sources, such as an LDAP database on another machine, or a single sign-on server, so that you can give permission to those users to access certain features and objects in vRealize Operations Manager.
Prerequisites
n Configure an authorization source. See the vRealize Operations Manager Information Center.
Procedure
1 Log out of vRealize Operations Manager, then log in as a system administrator.
2 In the menu, click Administration, and then in the left pane click Access > Access Control.
vRealize Operations Manager Configuration Guide
VMware, Inc. 421
3 On the toolbar, click the Import Users icon.
4 Specify the options to import user accounts from an authorization source.
a On the Import Users page, from the Import From drop-down menu, select an authentication source.
b In the Domain Name drop-down menu, type the domain name from which you want to import users, and click Search.
c Select the users you want to import, and click Next.
d On the Groups tab, select the user group to which you want to add this user account.
e Click the Objects tab, select the admin_cluster role, and select the Assign this role to the user check box.
f In the Object Hierarchies list, select the vRealize Operations Cluster check box, and click Finish.
5 Log out of vRealize Operations Manager.
6 Log in to vRealize Operations Manager as the imported user.
7 Verify that the imported user can access only the objects in the vRealize Operations Cluster.
You imported a user account from an external user database or server to vRealize Operations Manager, and assigned a role and the objects the user can access while holding this role to the user.
You have finished this scenario.
Configure a Single Sign-On Source in vRealize Operations ManagerAs a system administrator or virtual infrastructure administrator, you use single sign-on to enable SSO users to log in securely to your vRealize Operations Manager environment.
After the single sign-on source is configured, users are redirected to an SSO identity source for authentication. When logged in, users can access other vSphere components such as the vCenter Server without having to log in again.
Prerequisites
n Verify that the server system time of the single sign-on source and vRealize Operations Manager are synchronized. If you need to configure the Network Time Protocol (NTP), see information about cluster and node maintenance in the vRealize Operations Manager vApp Deployment and Configuration Guide.
n Verify that you have access to a Platform Services Controller through the vCenter Server. See the VMware vSphere Information Center for more details.
Procedure
1 Log in to vRealize Operations Manager as an administrator.
vRealize Operations Manager Configuration Guide
VMware, Inc. 422
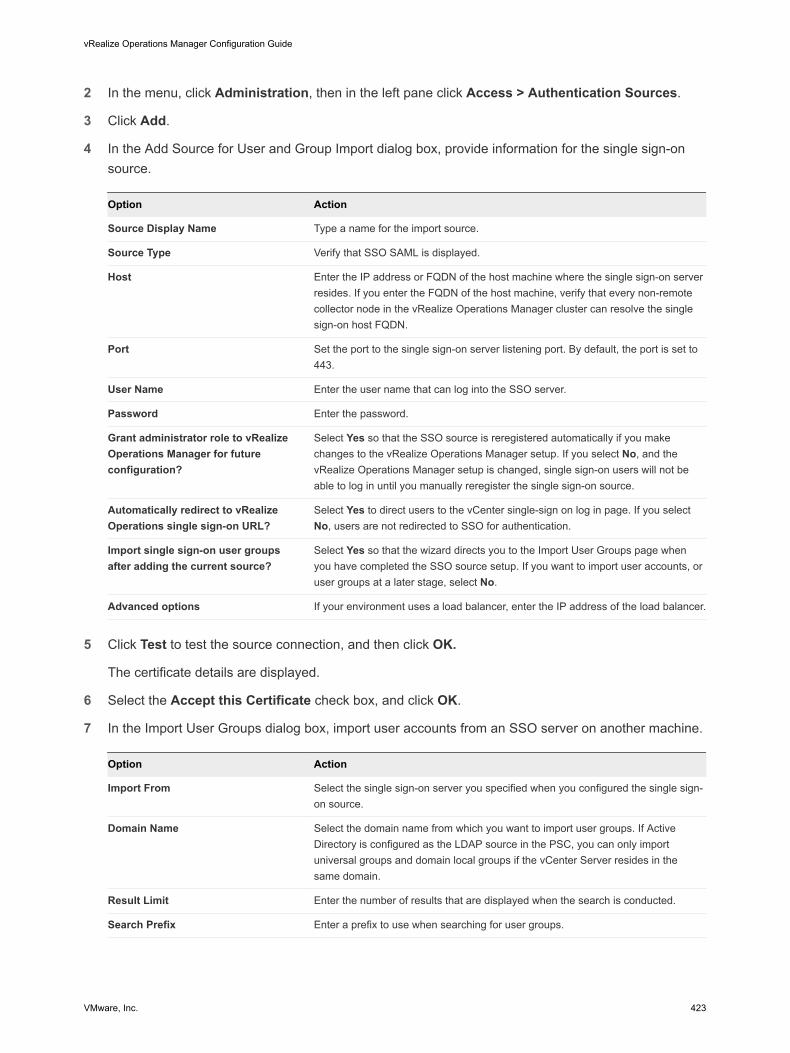
2 In the menu, click Administration, then in the left pane click Access > Authentication Sources.
3 Click Add.
4 In the Add Source for User and Group Import dialog box, provide information for the single sign-on source.
Option Action
Source Display Name Type a name for the import source.
Source Type Verify that SSO SAML is displayed.
Host Enter the IP address or FQDN of the host machine where the single sign-on server resides. If you enter the FQDN of the host machine, verify that every non-remote collector node in the vRealize Operations Manager cluster can resolve the single sign-on host FQDN.
Port Set the port to the single sign-on server listening port. By default, the port is set to 443.
User Name Enter the user name that can log into the SSO server.
Password Enter the password.
Grant administrator role to vRealize Operations Manager for future configuration?
Select Yes so that the SSO source is reregistered automatically if you make changes to the vRealize Operations Manager setup. If you select No, and the vRealize Operations Manager setup is changed, single sign-on users will not be able to log in until you manually reregister the single sign-on source.
Automatically redirect to vRealize Operations single sign-on URL?
Select Yes to direct users to the vCenter single-sign on log in page. If you select No, users are not redirected to SSO for authentication.
Import single sign-on user groups after adding the current source?
Select Yes so that the wizard directs you to the Import User Groups page when you have completed the SSO source setup. If you want to import user accounts, or user groups at a later stage, select No.
Advanced options If your environment uses a load balancer, enter the IP address of the load balancer.
5 Click Test to test the source connection, and then click OK.
The certificate details are displayed.
6 Select the Accept this Certificate check box, and click OK.
7 In the Import User Groups dialog box, import user accounts from an SSO server on another machine.
Option Action
Import From Select the single sign-on server you specified when you configured the single sign-on source.
Domain Name Select the domain name from which you want to import user groups. If Active Directory is configured as the LDAP source in the PSC, you can only import universal groups and domain local groups if the vCenter Server resides in the same domain.
Result Limit Enter the number of results that are displayed when the search is conducted.
Search Prefix Enter a prefix to use when searching for user groups.
vRealize Operations Manager Configuration Guide
VMware, Inc. 423
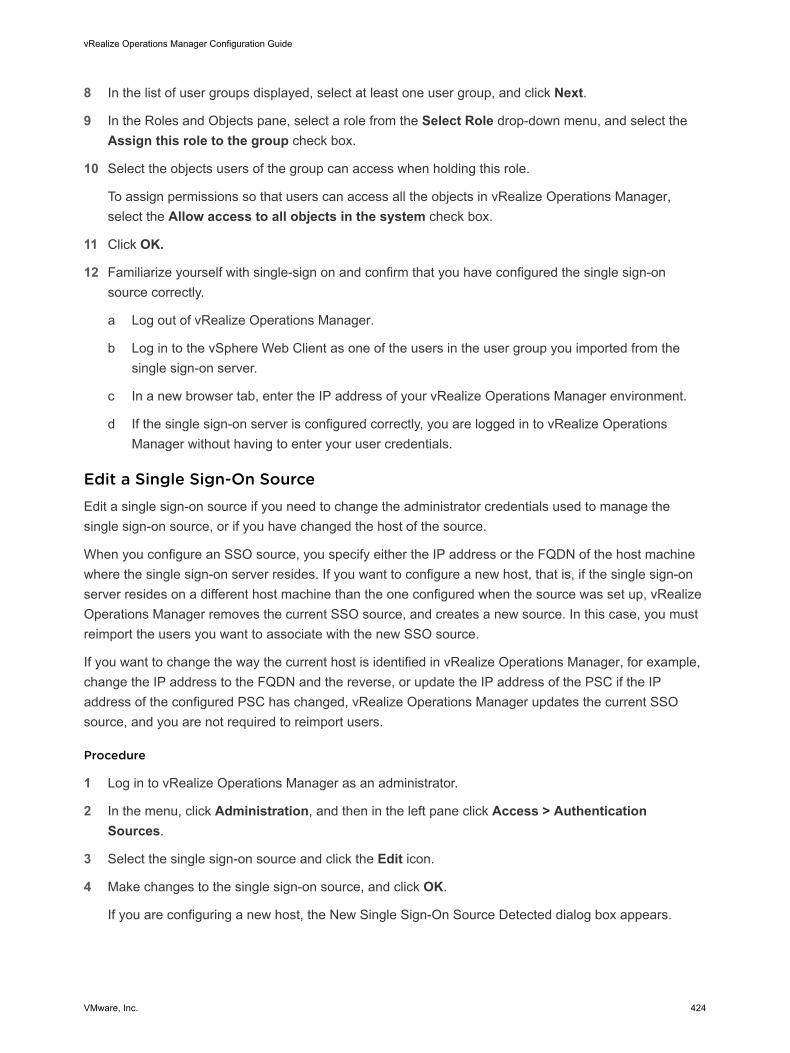
8 In the list of user groups displayed, select at least one user group, and click Next.
9 In the Roles and Objects pane, select a role from the Select Role drop-down menu, and select the Assign this role to the group check box.
10 Select the objects users of the group can access when holding this role.
To assign permissions so that users can access all the objects in vRealize Operations Manager, select the Allow access to all objects in the system check box.
11 Click OK.
12 Familiarize yourself with single-sign on and confirm that you have configured the single sign-on source correctly.
a Log out of vRealize Operations Manager.
b Log in to the vSphere Web Client as one of the users in the user group you imported from the single sign-on server.
c In a new browser tab, enter the IP address of your vRealize Operations Manager environment.
d If the single sign-on server is configured correctly, you are logged in to vRealize Operations Manager without having to enter your user credentials.
Edit a Single Sign-On SourceEdit a single sign-on source if you need to change the administrator credentials used to manage the single sign-on source, or if you have changed the host of the source.
When you configure an SSO source, you specify either the IP address or the FQDN of the host machine where the single sign-on server resides. If you want to configure a new host, that is, if the single sign-on server resides on a different host machine than the one configured when the source was set up, vRealize Operations Manager removes the current SSO source, and creates a new source. In this case, you must reimport the users you want to associate with the new SSO source.
If you want to change the way the current host is identified in vRealize Operations Manager, for example, change the IP address to the FQDN and the reverse, or update the IP address of the PSC if the IP address of the configured PSC has changed, vRealize Operations Manager updates the current SSO source, and you are not required to reimport users.
Procedure
1 Log in to vRealize Operations Manager as an administrator.
2 In the menu, click Administration, and then in the left pane click Access > Authentication Sources.
3 Select the single sign-on source and click the Edit icon.
4 Make changes to the single sign-on source, and click OK.
If you are configuring a new host, the New Single Sign-On Source Detected dialog box appears.
vRealize Operations Manager Configuration Guide
VMware, Inc. 424

5 Enter the administrator credentials that were used to set up the single sign-on source, and click OK.
The current SSO source is removed, and a new one created.
6 Click OK to accept the certificate.
7 Import the users you want to associate with the SSO source.
Authentication SourcesvRealize Operations Manager uses authentication sources that enable you to import and authenticate users and user group information that reside on another machine: the Lightweight Directory Access Protocol (LDAP) platform-independent protocol, Active Directory, VMware Identity Manager, Single Sign-On, and Others.
Where You Manage Authentication SourcesTo manage authentication sources, in the menu, click Administration, and then in the left pane click Access > Authentication Sources.
Table 9-1. Authentication Sources Toolbar and Data Grid
Option Description
Authentication Sources toolbar To manage authentication sources, use the toolbar icons.
n Add icon: Add an authentication source, and provide the information for the source in the Add Source for User and Group Import dialog box.
n Edit icon: Edit the selected authentication source, and modify the details in the Edit Source dialog box.
n Delete icon. Delete an authentication source.
n Synchronize User Groups icon. Synchronize users within the groups imported through the selected Active Directory or LDAP authentication source
Source Display Name Name that you assign to the authentication source.
Source Type Indicates the type of directory services access technology to access the source machine where the authentication database of user accounts resides. Options include:
n Open LDAP: A platform-independent protocol that provides access to an LDAP database on another machine to import user accounts.
n Active Directory or Other: Specifies any other LDAP based directory services, such as Novel or Open DJ, used to import user accounts from an LDAP database on a Linux Mac machine.
n SSO SAML: An open-standard data format that enables Web browser single sign-on.
n VMware Identity Manager: A platform where you can manage users and groups, manage resources and user authentication, and access policies and entitle users to resources.
Host Name or IP address of the host machine where the user database resides.
Port Port used for the import.
Base DN Base distinguished name for the user search. vRealize Operations Manager will locate only the users under the Base DN. The Base DN is an elementary entry for an imported user's distinguished name (DN), which is the base entry for the user name without the need for other related information such as the full path to the user account, or the inclusion of related domain components. Although vRealize Operations Manager populates the Base DN, an Administrator must verify the Base DN before saving the LDAP configuration.
vRealize Operations Manager Configuration Guide
VMware, Inc. 425

Table 9-1. Authentication Sources Toolbar and Data Grid (continued)
Option Description
Auto Synchronization When selected, enables vRealize Operations Manager to map imported LDAP users to user groups.
Last Synchronized Date and time that the synchronization last occurred.
Authentication Sources: Add Authentication Source for User and Group ImportWhen you import user account information that resides on another machine, you must define the criteria used to import the user accounts from the source machine.
Where You Add or Edit Authentication Sources
1 To add authentication sources, in the menu, click Administration, and then in the left pane click Access > Authentication Sources.
2 Click Add.
3 To edit authentication sources, click Edit.
Table 9-2. Authentication Sources Add Source for User and Group Import
Option Description
Source Display Name Name that you assign to the authentication source.
Source Type
Note The option you select in the Source Type drop-down box, determines the options available in this dialog box.
Indicates the type of directory services access technology to access the source machine where the database of user accounts resides. There are two types of databases: LDAP and single sign-on. Options include:
n SSO SAML: An XML-based standard for a web browser single sign-on that enables users to perform single sign-on to multiple applications.
n Open LDAP: A platform-independent protocol that provides access to an LDAP database on another machine to import user accounts.
n Other: Specifies any other LDAP-based directory services, such as Novel or OpenDJ, used to import user accounts from an LDAP database on a Linux Mac machine.
n VMware Identity Manager: A platform where you can manage users and groups, manage resources and user authentication, and access policies and entitle users to resources.
Table 9-3. Authentication Sources Add Source for User and Group Import - Options Available When SSO SAML Is Selected.
Name Description
Host Name or IP address of the host machine where the single sign-on user server resides.
Port The single sign-on listening port. By default this is set to 443.
vRealize Operations Manager Configuration Guide
VMware, Inc. 426
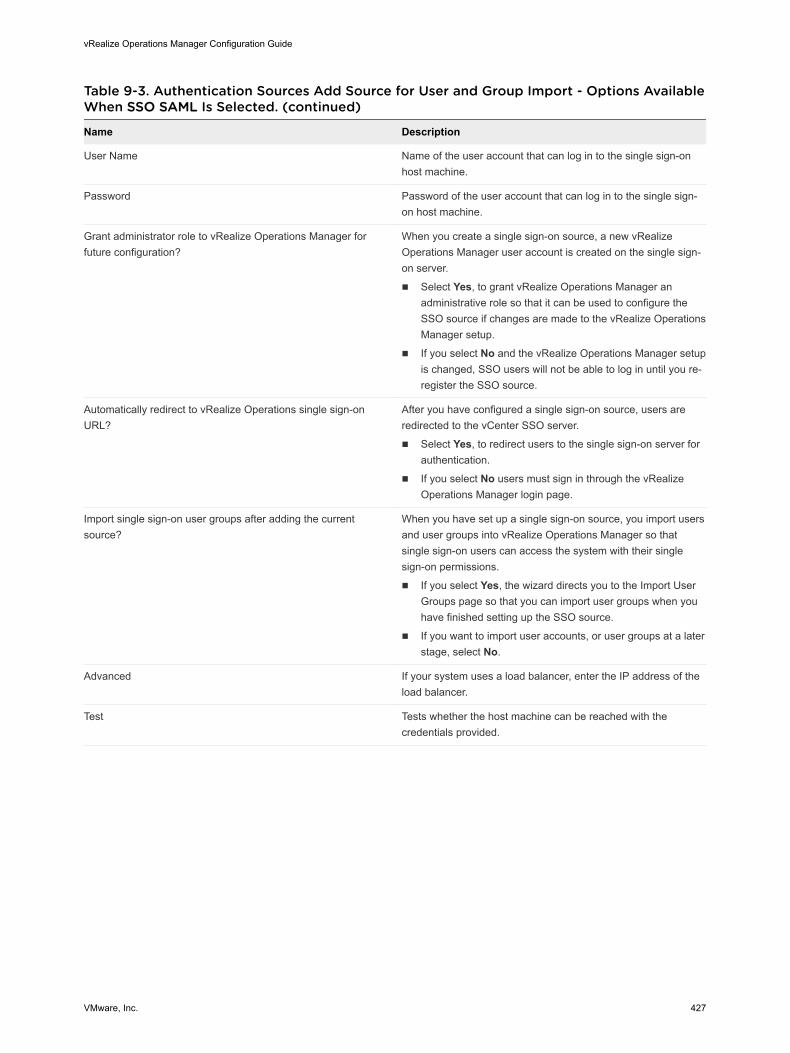
Table 9-3. Authentication Sources Add Source for User and Group Import - Options Available When SSO SAML Is Selected. (continued)
Name Description
User Name Name of the user account that can log in to the single sign-on host machine.
Password Password of the user account that can log in to the single sign-on host machine.
Grant administrator role to vRealize Operations Manager for future configuration?
When you create a single sign-on source, a new vRealize Operations Manager user account is created on the single sign-on server.
n Select Yes, to grant vRealize Operations Manager an administrative role so that it can be used to configure the SSO source if changes are made to the vRealize Operations Manager setup.
n If you select No and the vRealize Operations Manager setup is changed, SSO users will not be able to log in until you re-register the SSO source.
Automatically redirect to vRealize Operations single sign-on URL?
After you have configured a single sign-on source, users are redirected to the vCenter SSO server.
n Select Yes, to redirect users to the single sign-on server for authentication.
n If you select No users must sign in through the vRealize Operations Manager login page.
Import single sign-on user groups after adding the current source?
When you have set up a single sign-on source, you import users and user groups into vRealize Operations Manager so that single sign-on users can access the system with their single sign-on permissions.
n If you select Yes, the wizard directs you to the Import User Groups page so that you can import user groups when you have finished setting up the SSO source.
n If you want to import user accounts, or user groups at a later stage, select No.
Advanced If your system uses a load balancer, enter the IP address of the load balancer.
Test Tests whether the host machine can be reached with the credentials provided.
vRealize Operations Manager Configuration Guide
VMware, Inc. 427
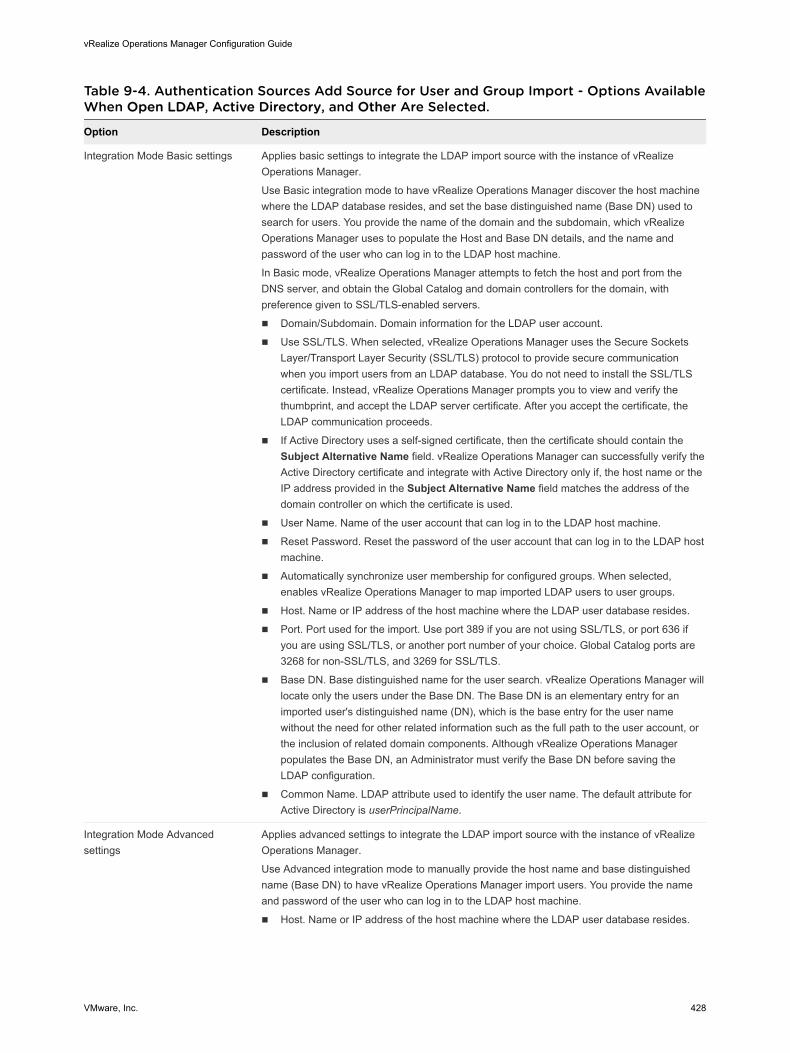
Table 9-4. Authentication Sources Add Source for User and Group Import - Options Available When Open LDAP, Active Directory, and Other Are Selected.
Option Description
Integration Mode Basic settings Applies basic settings to integrate the LDAP import source with the instance of vRealize Operations Manager.
Use Basic integration mode to have vRealize Operations Manager discover the host machine where the LDAP database resides, and set the base distinguished name (Base DN) used to search for users. You provide the name of the domain and the subdomain, which vRealize Operations Manager uses to populate the Host and Base DN details, and the name and password of the user who can log in to the LDAP host machine.
In Basic mode, vRealize Operations Manager attempts to fetch the host and port from the DNS server, and obtain the Global Catalog and domain controllers for the domain, with preference given to SSL/TLS-enabled servers.
n Domain/Subdomain. Domain information for the LDAP user account.
n Use SSL/TLS. When selected, vRealize Operations Manager uses the Secure Sockets Layer/Transport Layer Security (SSL/TLS) protocol to provide secure communication when you import users from an LDAP database. You do not need to install the SSL/TLS certificate. Instead, vRealize Operations Manager prompts you to view and verify the thumbprint, and accept the LDAP server certificate. After you accept the certificate, the LDAP communication proceeds.
n If Active Directory uses a self-signed certificate, then the certificate should contain the Subject Alternative Name field. vRealize Operations Manager can successfully verify the Active Directory certificate and integrate with Active Directory only if, the host name or the IP address provided in the Subject Alternative Name field matches the address of the domain controller on which the certificate is used.
n User Name. Name of the user account that can log in to the LDAP host machine.
n Reset Password. Reset the password of the user account that can log in to the LDAP host machine.
n Automatically synchronize user membership for configured groups. When selected, enables vRealize Operations Manager to map imported LDAP users to user groups.
n Host. Name or IP address of the host machine where the LDAP user database resides.
n Port. Port used for the import. Use port 389 if you are not using SSL/TLS, or port 636 if you are using SSL/TLS, or another port number of your choice. Global Catalog ports are 3268 for non-SSL/TLS, and 3269 for SSL/TLS.
n Base DN. Base distinguished name for the user search. vRealize Operations Manager will locate only the users under the Base DN. The Base DN is an elementary entry for an imported user's distinguished name (DN), which is the base entry for the user name without the need for other related information such as the full path to the user account, or the inclusion of related domain components. Although vRealize Operations Manager populates the Base DN, an Administrator must verify the Base DN before saving the LDAP configuration.
n Common Name. LDAP attribute used to identify the user name. The default attribute for Active Directory is userPrincipalName.
Integration Mode Advanced settings
Applies advanced settings to integrate the LDAP import source with the instance of vRealize Operations Manager.
Use Advanced integration mode to manually provide the host name and base distinguished name (Base DN) to have vRealize Operations Manager import users. You provide the name and password of the user who can log in to the LDAP host machine.
n Host. Name or IP address of the host machine where the LDAP user database resides.
vRealize Operations Manager Configuration Guide
VMware, Inc. 428
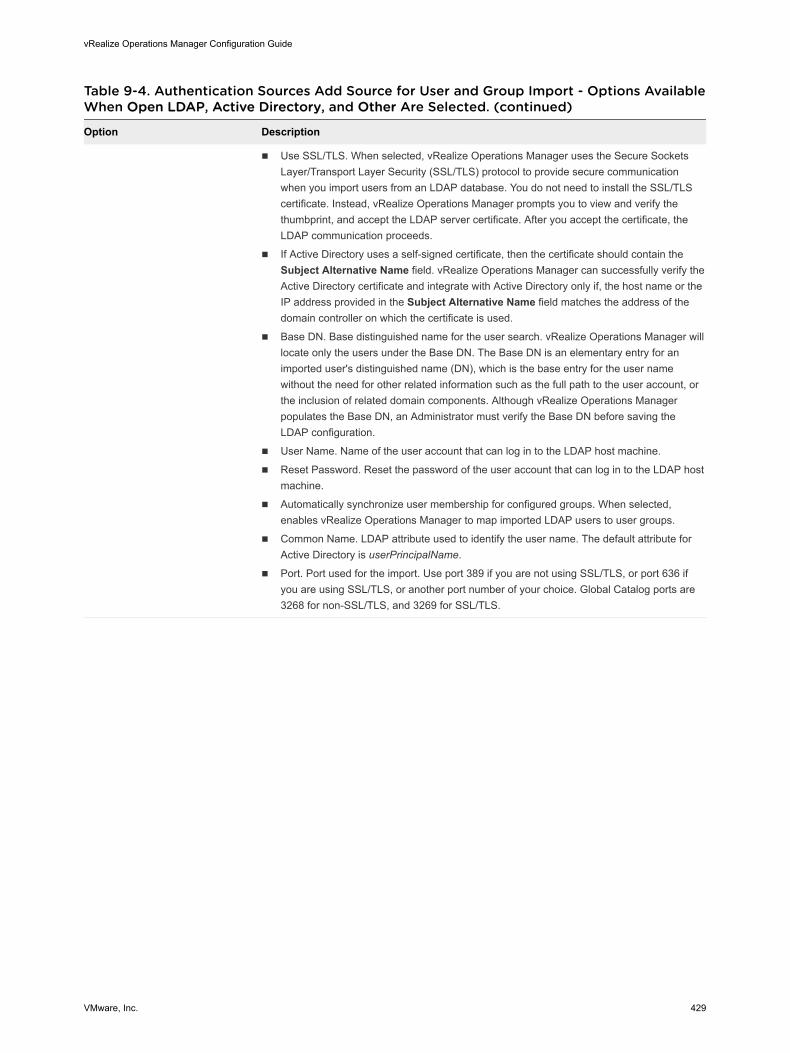
Table 9-4. Authentication Sources Add Source for User and Group Import - Options Available When Open LDAP, Active Directory, and Other Are Selected. (continued)
Option Description
n Use SSL/TLS. When selected, vRealize Operations Manager uses the Secure Sockets Layer/Transport Layer Security (SSL/TLS) protocol to provide secure communication when you import users from an LDAP database. You do not need to install the SSL/TLS certificate. Instead, vRealize Operations Manager prompts you to view and verify the thumbprint, and accept the LDAP server certificate. After you accept the certificate, the LDAP communication proceeds.
n If Active Directory uses a self-signed certificate, then the certificate should contain the Subject Alternative Name field. vRealize Operations Manager can successfully verify the Active Directory certificate and integrate with Active Directory only if, the host name or the IP address provided in the Subject Alternative Name field matches the address of the domain controller on which the certificate is used.
n Base DN. Base distinguished name for the user search. vRealize Operations Manager will locate only the users under the Base DN. The Base DN is an elementary entry for an imported user's distinguished name (DN), which is the base entry for the user name without the need for other related information such as the full path to the user account, or the inclusion of related domain components. Although vRealize Operations Manager populates the Base DN, an Administrator must verify the Base DN before saving the LDAP configuration.
n User Name. Name of the user account that can log in to the LDAP host machine.
n Reset Password. Reset the password of the user account that can log in to the LDAP host machine.
n Automatically synchronize user membership for configured groups. When selected, enables vRealize Operations Manager to map imported LDAP users to user groups.
n Common Name. LDAP attribute used to identify the user name. The default attribute for Active Directory is userPrincipalName.
n Port. Port used for the import. Use port 389 if you are not using SSL/TLS, or port 636 if you are using SSL/TLS, or another port number of your choice. Global Catalog ports are 3268 for non-SSL/TLS, and 3269 for SSL/TLS.
vRealize Operations Manager Configuration Guide
VMware, Inc. 429
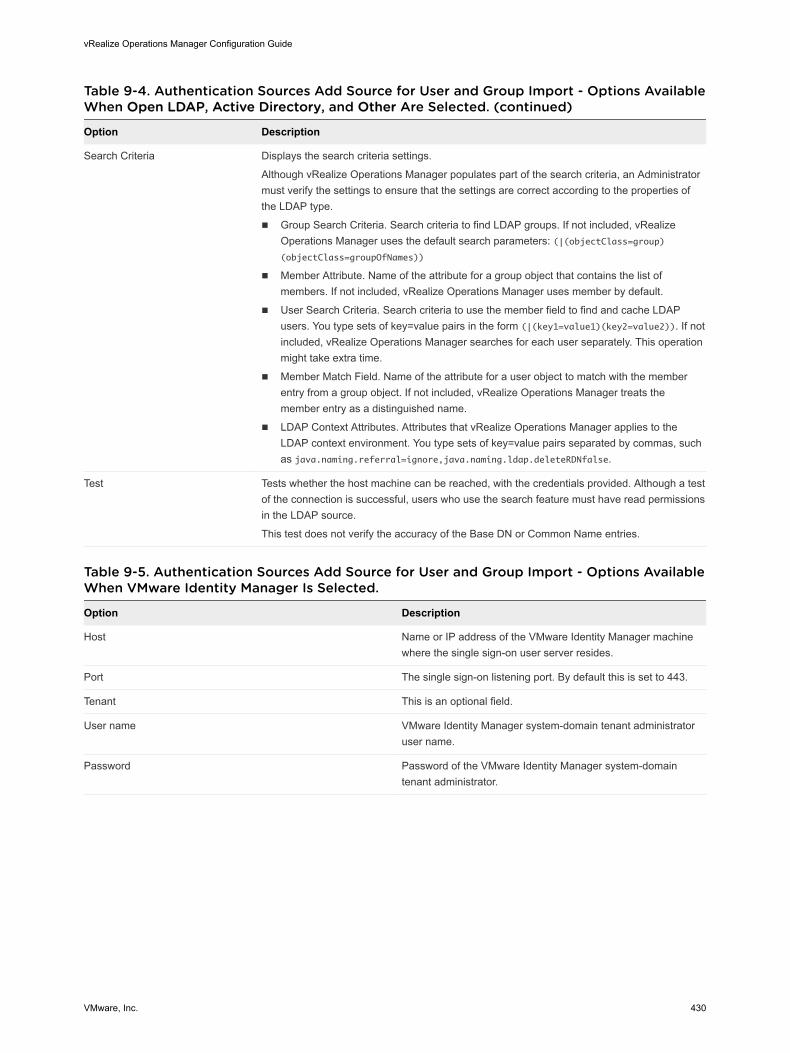
Table 9-4. Authentication Sources Add Source for User and Group Import - Options Available When Open LDAP, Active Directory, and Other Are Selected. (continued)
Option Description
Search Criteria Displays the search criteria settings.
Although vRealize Operations Manager populates part of the search criteria, an Administrator must verify the settings to ensure that the settings are correct according to the properties of the LDAP type.
n Group Search Criteria. Search criteria to find LDAP groups. If not included, vRealize Operations Manager uses the default search parameters: (|(objectClass=group)(objectClass=groupOfNames))
n Member Attribute. Name of the attribute for a group object that contains the list of members. If not included, vRealize Operations Manager uses member by default.
n User Search Criteria. Search criteria to use the member field to find and cache LDAP users. You type sets of key=value pairs in the form (|(key1=value1)(key2=value2)). If not included, vRealize Operations Manager searches for each user separately. This operation might take extra time.
n Member Match Field. Name of the attribute for a user object to match with the member entry from a group object. If not included, vRealize Operations Manager treats the member entry as a distinguished name.
n LDAP Context Attributes. Attributes that vRealize Operations Manager applies to the LDAP context environment. You type sets of key=value pairs separated by commas, such as java.naming.referral=ignore,java.naming.ldap.deleteRDNfalse.
Test Tests whether the host machine can be reached, with the credentials provided. Although a test of the connection is successful, users who use the search feature must have read permissions in the LDAP source.
This test does not verify the accuracy of the Base DN or Common Name entries.
Table 9-5. Authentication Sources Add Source for User and Group Import - Options Available When VMware Identity Manager Is Selected.
Option Description
Host Name or IP address of the VMware Identity Manager machine where the single sign-on user server resides.
Port The single sign-on listening port. By default this is set to 443.
Tenant This is an optional field.
User name VMware Identity Manager system-domain tenant administrator user name.
Password Password of the VMware Identity Manager system-domain tenant administrator.
vRealize Operations Manager Configuration Guide
VMware, Inc. 430
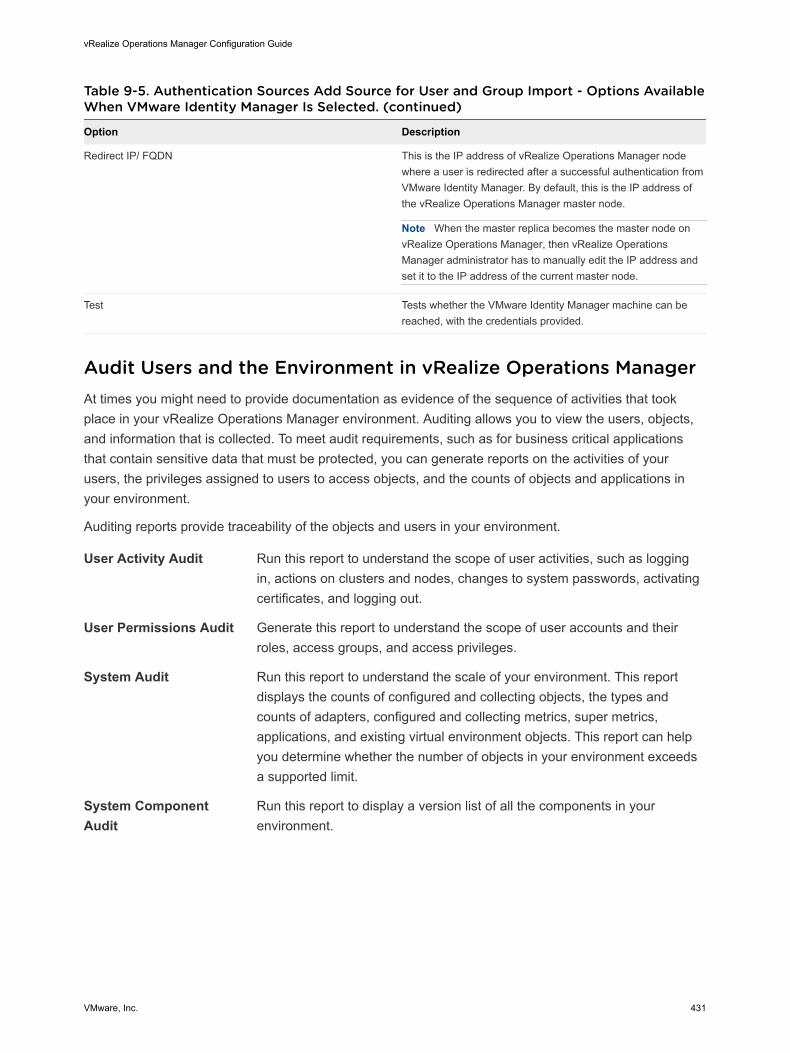
Table 9-5. Authentication Sources Add Source for User and Group Import - Options Available When VMware Identity Manager Is Selected. (continued)
Option Description
Redirect IP/ FQDN This is the IP address of vRealize Operations Manager node where a user is redirected after a successful authentication from VMware Identity Manager. By default, this is the IP address of the vRealize Operations Manager master node.
Note When the master replica becomes the master node on vRealize Operations Manager, then vRealize Operations Manager administrator has to manually edit the IP address and set it to the IP address of the current master node.
Test Tests whether the VMware Identity Manager machine can be reached, with the credentials provided.
Audit Users and the Environment in vRealize Operations ManagerAt times you might need to provide documentation as evidence of the sequence of activities that took place in your vRealize Operations Manager environment. Auditing allows you to view the users, objects, and information that is collected. To meet audit requirements, such as for business critical applications that contain sensitive data that must be protected, you can generate reports on the activities of your users, the privileges assigned to users to access objects, and the counts of objects and applications in your environment.
Auditing reports provide traceability of the objects and users in your environment.
User Activity Audit Run this report to understand the scope of user activities, such as logging in, actions on clusters and nodes, changes to system passwords, activating certificates, and logging out.
User Permissions Audit Generate this report to understand the scope of user accounts and their roles, access groups, and access privileges.
System Audit Run this report to understand the scale of your environment. This report displays the counts of configured and collecting objects, the types and counts of adapters, configured and collecting metrics, super metrics, applications, and existing virtual environment objects. This report can help you determine whether the number of objects in your environment exceeds a supported limit.
System Component Audit
Run this report to display a version list of all the components in your environment.
vRealize Operations Manager Configuration Guide
VMware, Inc. 431
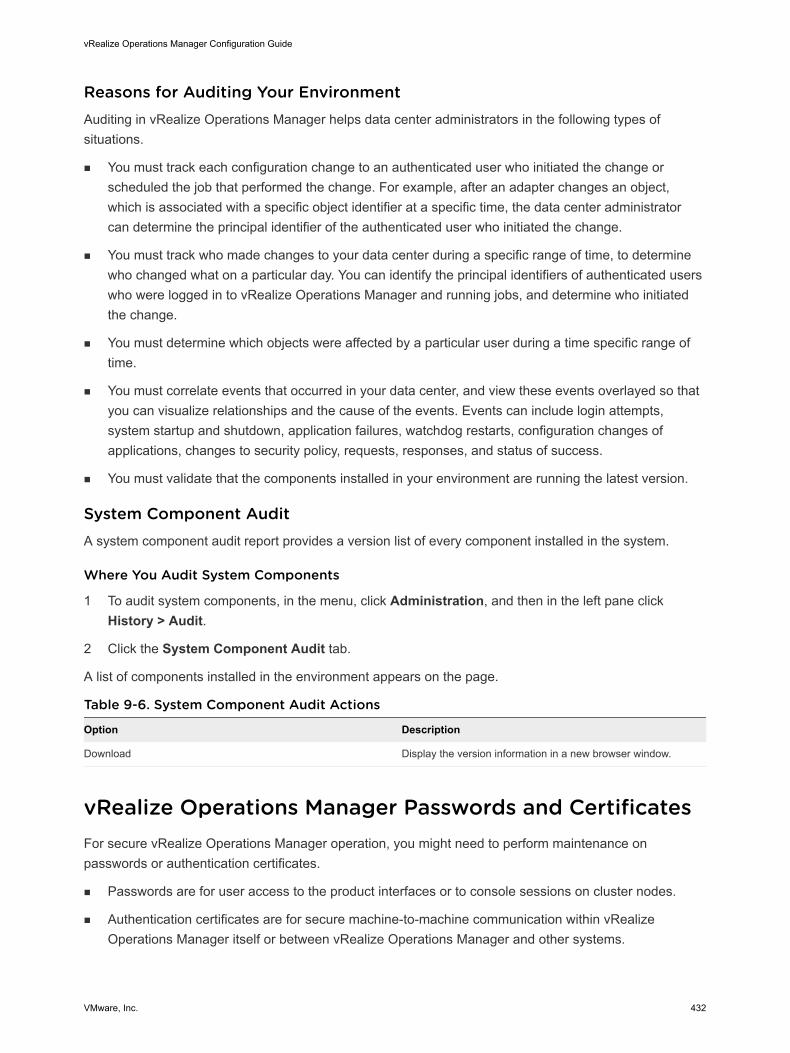
Reasons for Auditing Your EnvironmentAuditing in vRealize Operations Manager helps data center administrators in the following types of situations.
n You must track each configuration change to an authenticated user who initiated the change or scheduled the job that performed the change. For example, after an adapter changes an object, which is associated with a specific object identifier at a specific time, the data center administrator can determine the principal identifier of the authenticated user who initiated the change.
n You must track who made changes to your data center during a specific range of time, to determine who changed what on a particular day. You can identify the principal identifiers of authenticated users who were logged in to vRealize Operations Manager and running jobs, and determine who initiated the change.
n You must determine which objects were affected by a particular user during a time specific range of time.
n You must correlate events that occurred in your data center, and view these events overlayed so that you can visualize relationships and the cause of the events. Events can include login attempts, system startup and shutdown, application failures, watchdog restarts, configuration changes of applications, changes to security policy, requests, responses, and status of success.
n You must validate that the components installed in your environment are running the latest version.
System Component AuditA system component audit report provides a version list of every component installed in the system.
Where You Audit System Components
1 To audit system components, in the menu, click Administration, and then in the left pane click History > Audit.
2 Click the System Component Audit tab.
A list of components installed in the environment appears on the page.
Table 9-6. System Component Audit Actions
Option Description
Download Display the version information in a new browser window.
vRealize Operations Manager Passwords and CertificatesFor secure vRealize Operations Manager operation, you might need to perform maintenance on passwords or authentication certificates.
n Passwords are for user access to the product interfaces or to console sessions on cluster nodes.
n Authentication certificates are for secure machine-to-machine communication within vRealize Operations Manager itself or between vRealize Operations Manager and other systems.
vRealize Operations Manager Configuration Guide
VMware, Inc. 432
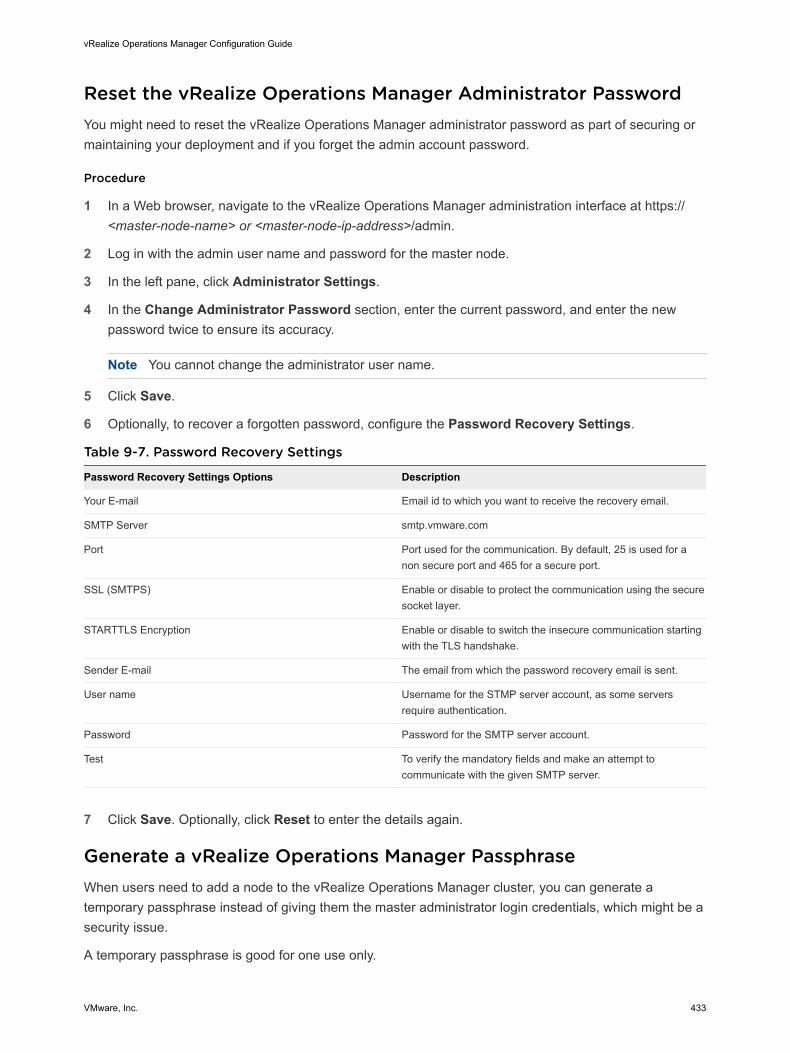
Reset the vRealize Operations Manager Administrator PasswordYou might need to reset the vRealize Operations Manager administrator password as part of securing or maintaining your deployment and if you forget the admin account password.
Procedure
1 In a Web browser, navigate to the vRealize Operations Manager administration interface at https://<master-node-name> or <master-node-ip-address>/admin.
2 Log in with the admin user name and password for the master node.
3 In the left pane, click Administrator Settings.
4 In the Change Administrator Password section, enter the current password, and enter the new password twice to ensure its accuracy.
Note You cannot change the administrator user name.
5 Click Save.
6 Optionally, to recover a forgotten password, configure the Password Recovery Settings.
Table 9-7. Password Recovery Settings
Password Recovery Settings Options Description
Your E-mail Email id to which you want to receive the recovery email.
SMTP Server smtp.vmware.com
Port Port used for the communication. By default, 25 is used for a non secure port and 465 for a secure port.
SSL (SMTPS) Enable or disable to protect the communication using the secure socket layer.
STARTTLS Encryption Enable or disable to switch the insecure communication starting with the TLS handshake.
Sender E-mail The email from which the password recovery email is sent.
User name Username for the STMP server account, as some servers require authentication.
Password Password for the SMTP server account.
Test To verify the mandatory fields and make an attempt to communicate with the given SMTP server.
7 Click Save. Optionally, click Reset to enter the details again.
Generate a vRealize Operations Manager PassphraseWhen users need to add a node to the vRealize Operations Manager cluster, you can generate a temporary passphrase instead of giving them the master administrator login credentials, which might be a security issue.
A temporary passphrase is good for one use only.
vRealize Operations Manager Configuration Guide
VMware, Inc. 433
Prerequisites
Create and configure the master node.
Procedure
1 In a Web browser, navigate to the vRealize Operations Manager administration interface at https://master-node-name-or-ip-address/admin.
2 Log in with the admin user name and password for the master node.
3 In the list of cluster nodes, select the master node.
4 From the toolbar above the list, click the option to generate a passphrase.
5 Enter a number of hours before the passphrase expires.
6 Click Generate.
A random alphanumeric string appears, which you can send to a user who needs to add a node.
What to do next
Have the user supply the passphrase when adding a node.
Custom vRealize Operations Manager CertificatesBy default, vRealize Operations Manager includes its own authentication certificates. The default certificates cause the browser to display a warning when you connect to the vRealize Operations Manager user interface.
Your site security policies might require that you use another certificate, or you might want to avoid the warnings caused by the default certificates. In either case, vRealize Operations Manager supports the use of your own custom certificate. You can upload your custom certificate during initial master node configuration or later.
Custom vRealize Operations Manager Certificate RequirementsA certificate used with vRealize Operations Manager must conform to certain requirements. Using a custom certificate is optional and does not affect vRealize Operations Manager features. You can also use wildcard certificates in vRealize Operations Manager.
Requirements for Custom Certificates
Custom vRealize Operations Manager certificates must meet the following requirements.
n The certificate file must include the terminal (leaf) server certificate, a private key, and all issuing certificates if the certificate is signed by a chain of other certificates.
n In the file, the leaf certificate must be first in the order of certificates. After the leaf certificate, the order does not matter.
n In the file, all certificates and the private key must be in PEM format. vRealize Operations Manager does not support certificates in PFX, PKCS12, PKCS7, or other formats.
vRealize Operations Manager Configuration Guide
VMware, Inc. 434
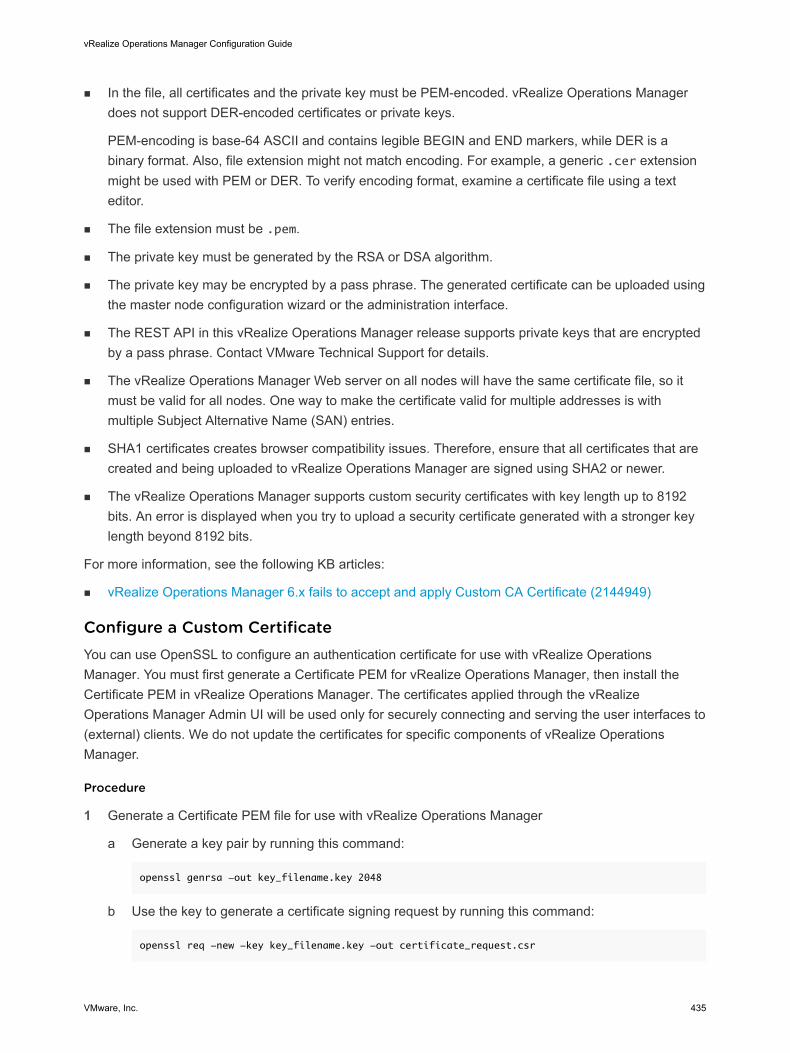
n In the file, all certificates and the private key must be PEM-encoded. vRealize Operations Manager does not support DER-encoded certificates or private keys.
PEM-encoding is base-64 ASCII and contains legible BEGIN and END markers, while DER is a binary format. Also, file extension might not match encoding. For example, a generic .cer extension might be used with PEM or DER. To verify encoding format, examine a certificate file using a text editor.
n The file extension must be .pem.
n The private key must be generated by the RSA or DSA algorithm.
n The private key may be encrypted by a pass phrase. The generated certificate can be uploaded using the master node configuration wizard or the administration interface.
n The REST API in this vRealize Operations Manager release supports private keys that are encrypted by a pass phrase. Contact VMware Technical Support for details.
n The vRealize Operations Manager Web server on all nodes will have the same certificate file, so it must be valid for all nodes. One way to make the certificate valid for multiple addresses is with multiple Subject Alternative Name (SAN) entries.
n SHA1 certificates creates browser compatibility issues. Therefore, ensure that all certificates that are created and being uploaded to vRealize Operations Manager are signed using SHA2 or newer.
n The vRealize Operations Manager supports custom security certificates with key length up to 8192 bits. An error is displayed when you try to upload a security certificate generated with a stronger key length beyond 8192 bits.
For more information, see the following KB articles:
n vRealize Operations Manager 6.x fails to accept and apply Custom CA Certificate (2144949)
Configure a Custom CertificateYou can use OpenSSL to configure an authentication certificate for use with vRealize Operations Manager. You must first generate a Certificate PEM for vRealize Operations Manager, then install the Certificate PEM in vRealize Operations Manager. The certificates applied through the vRealize Operations Manager Admin UI will be used only for securely connecting and serving the user interfaces to (external) clients. We do not update the certificates for specific components of vRealize Operations Manager.
Procedure
1 Generate a Certificate PEM file for use with vRealize Operations Manager
a Generate a key pair by running this command:
openssl genrsa -out key_filename.key 2048
b Use the key to generate a certificate signing request by running this command:
openssl req -new -key key_filename.key -out certificate_request.csr
vRealize Operations Manager Configuration Guide
VMware, Inc. 435

c Submit the CSR file to your Certificate Authority (CA) to obtain a signed certificate.
d From your Certificate Authority, download the certificate and the complete issuing chain (one or more certificates). Download them in Base64 format.
e Enter the command to create a single PEM file containing all certificates and the private key. In this step, the example certificate is server_cert.cer and the issuing chain is cacerts.cer.
Note The order of CA's certs in the .PEM file: Cert, Private Key, Intermediate Cert and then Root Cert.
cat server_cert.cer key_filename.key cacerts.cer > multi_part.pem
In Windows replace cat with type.
The finished PEM file should look similar to the following example, where the number of CERTIFICATE sections depends on the length of the issuing chain:
-----BEGIN CERTIFICATE-----
(Your Primary SSL certificate: your_domain_name.crt)
-----END CERTIFICATE-----
-----BEGIN RSA PRIVATE KEY-----
(Your Private Key: your_domain_name.key)
-----END RSA PRIVATE KEY-----
-----BEGIN CERTIFICATE-----
(Your Intermediate certificate: DigiCertCA.crt)
-----END CERTIFICATE-----
-----BEGIN CERTIFICATE-----
(Your Root certificate: TrustedRoot.crt)
-----END CERTIFICATE-----
2 Install a PEM in vRealize Operations Manager
a In a Web browser, navigate to the vRealize Operations Manager administration interface.
https://vrops-node-FQDN-or-ip-address/admin
b Log in with the admin username and password.
c At the upper right, click the yellow SSL Certificate icon.
d In the SSL Certificate window, click Install New Certificate.
e Click Browse for certificate.
f Locate the certificate .pem file, and click Open to load the file in the Certificate Information text box. The certificate file must contain a valid private key and a valid certificate chain.
g Click Install.
Verifying a Custom vRealize Operations Manager CertificateWhen you upload a custom certificate file, the vRealize Operations Manager interface displays summary information for all certificates in the file.
vRealize Operations Manager Configuration Guide
VMware, Inc. 436
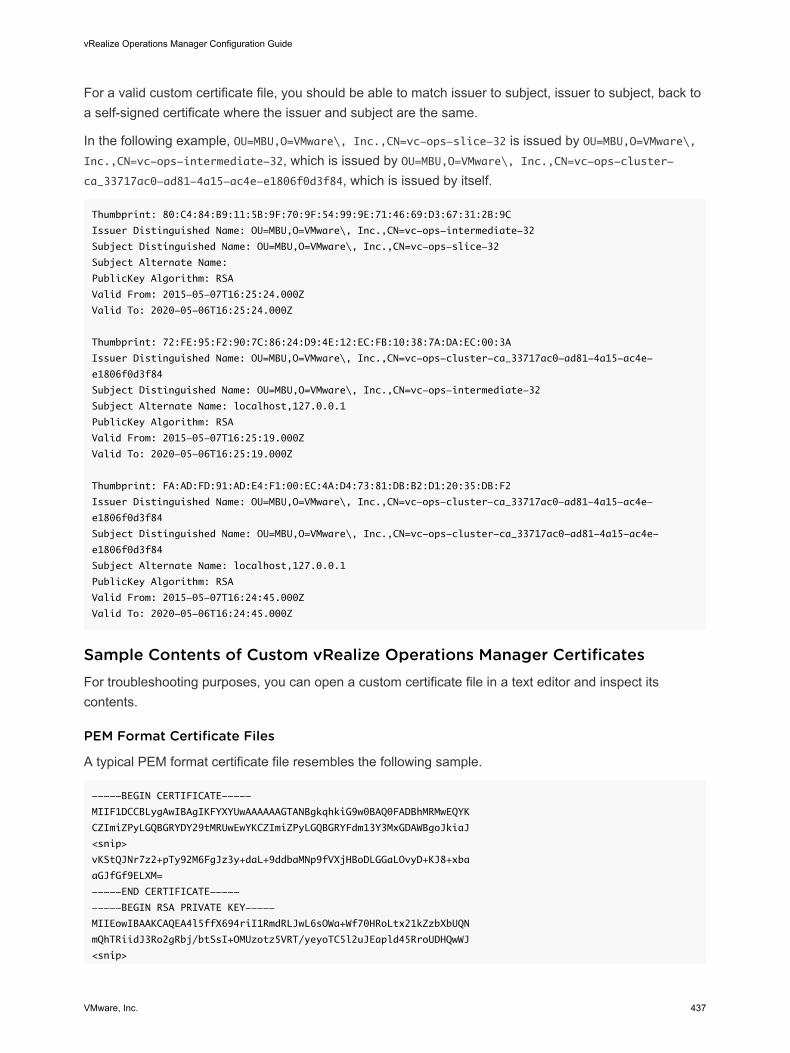
For a valid custom certificate file, you should be able to match issuer to subject, issuer to subject, back to a self-signed certificate where the issuer and subject are the same.
In the following example, OU=MBU,O=VMware\, Inc.,CN=vc-ops-slice-32 is issued by OU=MBU,O=VMware\, Inc.,CN=vc-ops-intermediate-32, which is issued by OU=MBU,O=VMware\, Inc.,CN=vc-ops-cluster-ca_33717ac0-ad81-4a15-ac4e-e1806f0d3f84, which is issued by itself.
Thumbprint: 80:C4:84:B9:11:5B:9F:70:9F:54:99:9E:71:46:69:D3:67:31:2B:9C
Issuer Distinguished Name: OU=MBU,O=VMware\, Inc.,CN=vc-ops-intermediate-32
Subject Distinguished Name: OU=MBU,O=VMware\, Inc.,CN=vc-ops-slice-32
Subject Alternate Name:
PublicKey Algorithm: RSA
Valid From: 2015-05-07T16:25:24.000Z
Valid To: 2020-05-06T16:25:24.000Z
Thumbprint: 72:FE:95:F2:90:7C:86:24:D9:4E:12:EC:FB:10:38:7A:DA:EC:00:3A
Issuer Distinguished Name: OU=MBU,O=VMware\, Inc.,CN=vc-ops-cluster-ca_33717ac0-ad81-4a15-ac4e-
e1806f0d3f84
Subject Distinguished Name: OU=MBU,O=VMware\, Inc.,CN=vc-ops-intermediate-32
Subject Alternate Name: localhost,127.0.0.1
PublicKey Algorithm: RSA
Valid From: 2015-05-07T16:25:19.000Z
Valid To: 2020-05-06T16:25:19.000Z
Thumbprint: FA:AD:FD:91:AD:E4:F1:00:EC:4A:D4:73:81:DB:B2:D1:20:35:DB:F2
Issuer Distinguished Name: OU=MBU,O=VMware\, Inc.,CN=vc-ops-cluster-ca_33717ac0-ad81-4a15-ac4e-
e1806f0d3f84
Subject Distinguished Name: OU=MBU,O=VMware\, Inc.,CN=vc-ops-cluster-ca_33717ac0-ad81-4a15-ac4e-
e1806f0d3f84
Subject Alternate Name: localhost,127.0.0.1
PublicKey Algorithm: RSA
Valid From: 2015-05-07T16:24:45.000Z
Valid To: 2020-05-06T16:24:45.000Z
Sample Contents of Custom vRealize Operations Manager CertificatesFor troubleshooting purposes, you can open a custom certificate file in a text editor and inspect its contents.
PEM Format Certificate Files
A typical PEM format certificate file resembles the following sample.
-----BEGIN CERTIFICATE-----
MIIF1DCCBLygAwIBAgIKFYXYUwAAAAAAGTANBgkqhkiG9w0BAQ0FADBhMRMwEQYK
CZImiZPyLGQBGRYDY29tMRUwEwYKCZImiZPyLGQBGRYFdm13Y3MxGDAWBgoJkiaJ
<snip>
vKStQJNr7z2+pTy92M6FgJz3y+daL+9ddbaMNp9fVXjHBoDLGGaLOvyD+KJ8+xba
aGJfGf9ELXM=
-----END CERTIFICATE-----
-----BEGIN RSA PRIVATE KEY-----
MIIEowIBAAKCAQEA4l5ffX694riI1RmdRLJwL6sOWa+Wf70HRoLtx21kZzbXbUQN
mQhTRiidJ3Ro2gRbj/btSsI+OMUzotz5VRT/yeyoTC5l2uJEapld45RroUDHQwWJ
<snip>
vRealize Operations Manager Configuration Guide
VMware, Inc. 437
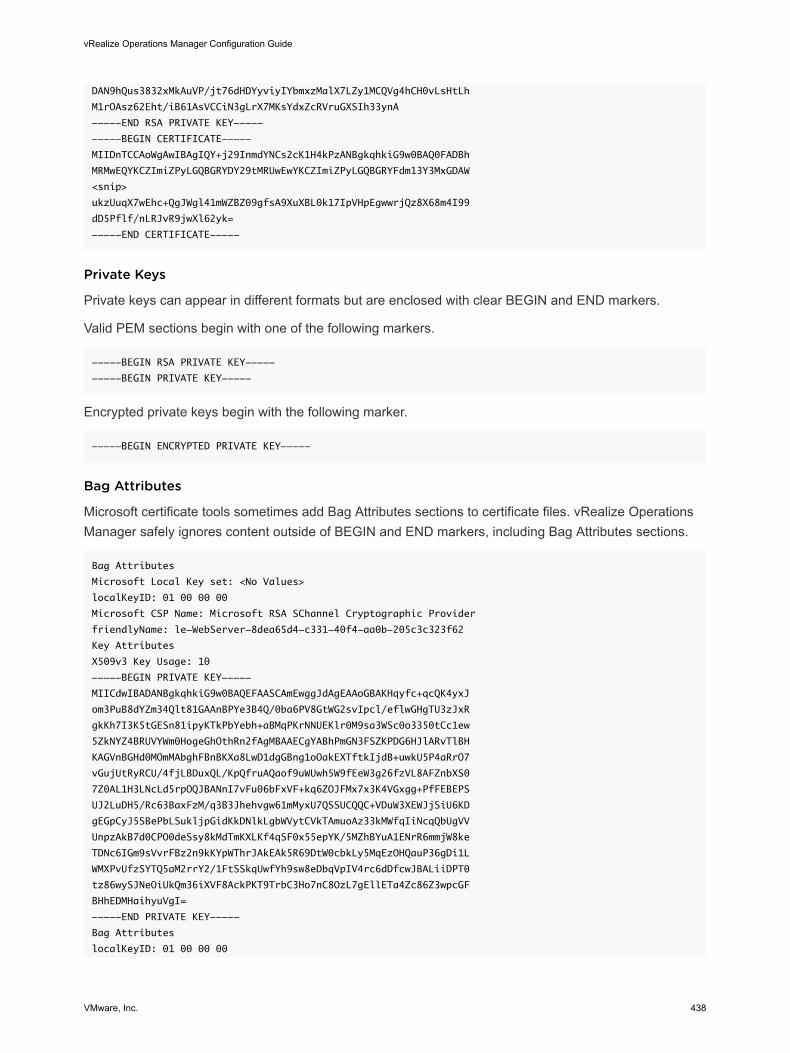
DAN9hQus3832xMkAuVP/jt76dHDYyviyIYbmxzMalX7LZy1MCQVg4hCH0vLsHtLh
M1rOAsz62Eht/iB61AsVCCiN3gLrX7MKsYdxZcRVruGXSIh33ynA
-----END RSA PRIVATE KEY-----
-----BEGIN CERTIFICATE-----
MIIDnTCCAoWgAwIBAgIQY+j29InmdYNCs2cK1H4kPzANBgkqhkiG9w0BAQ0FADBh
MRMwEQYKCZImiZPyLGQBGRYDY29tMRUwEwYKCZImiZPyLGQBGRYFdm13Y3MxGDAW
<snip>
ukzUuqX7wEhc+QgJWgl41mWZBZ09gfsA9XuXBL0k17IpVHpEgwwrjQz8X68m4I99
dD5Pflf/nLRJvR9jwXl62yk=
-----END CERTIFICATE-----
Private Keys
Private keys can appear in different formats but are enclosed with clear BEGIN and END markers.
Valid PEM sections begin with one of the following markers.
-----BEGIN RSA PRIVATE KEY-----
-----BEGIN PRIVATE KEY-----
Encrypted private keys begin with the following marker.
-----BEGIN ENCRYPTED PRIVATE KEY-----
Bag Attributes
Microsoft certificate tools sometimes add Bag Attributes sections to certificate files. vRealize Operations Manager safely ignores content outside of BEGIN and END markers, including Bag Attributes sections.
Bag Attributes
Microsoft Local Key set: <No Values>
localKeyID: 01 00 00 00
Microsoft CSP Name: Microsoft RSA SChannel Cryptographic Provider
friendlyName: le-WebServer-8dea65d4-c331-40f4-aa0b-205c3c323f62
Key Attributes
X509v3 Key Usage: 10
-----BEGIN PRIVATE KEY-----
MIICdwIBADANBgkqhkiG9w0BAQEFAASCAmEwggJdAgEAAoGBAKHqyfc+qcQK4yxJ
om3PuB8dYZm34Qlt81GAAnBPYe3B4Q/0ba6PV8GtWG2svIpcl/eflwGHgTU3zJxR
gkKh7I3K5tGESn81ipyKTkPbYebh+aBMqPKrNNUEKlr0M9sa3WSc0o3350tCc1ew
5ZkNYZ4BRUVYWm0HogeGhOthRn2fAgMBAAECgYABhPmGN3FSZKPDG6HJlARvTlBH
KAGVnBGHd0MOmMAbghFBnBKXa8LwD1dgGBng1oOakEXTftkIjdB+uwkU5P4aRrO7
vGujUtRyRCU/4fjLBDuxQL/KpQfruAQaof9uWUwh5W9fEeW3g26fzVL8AFZnbXS0
7Z0AL1H3LNcLd5rpOQJBANnI7vFu06bFxVF+kq6ZOJFMx7x3K4VGxgg+PfFEBEPS
UJ2LuDH5/Rc63BaxFzM/q3B3Jhehvgw61mMyxU7QSSUCQQC+VDuW3XEWJjSiU6KD
gEGpCyJ5SBePbLSukljpGidKkDNlkLgbWVytCVkTAmuoAz33kMWfqIiNcqQbUgVV
UnpzAkB7d0CPO0deSsy8kMdTmKXLKf4qSF0x55epYK/5MZhBYuA1ENrR6mmjW8ke
TDNc6IGm9sVvrFBz2n9kKYpWThrJAkEAk5R69DtW0cbkLy5MqEzOHQauP36gDi1L
WMXPvUfzSYTQ5aM2rrY2/1FtSSkqUwfYh9sw8eDbqVpIV4rc6dDfcwJBALiiDPT0
tz86wySJNeOiUkQm36iXVF8AckPKT9TrbC3Ho7nC8OzL7gEllETa4Zc86Z3wpcGF
BHhEDMHaihyuVgI=
-----END PRIVATE KEY-----
Bag Attributes
localKeyID: 01 00 00 00
vRealize Operations Manager Configuration Guide
VMware, Inc. 438
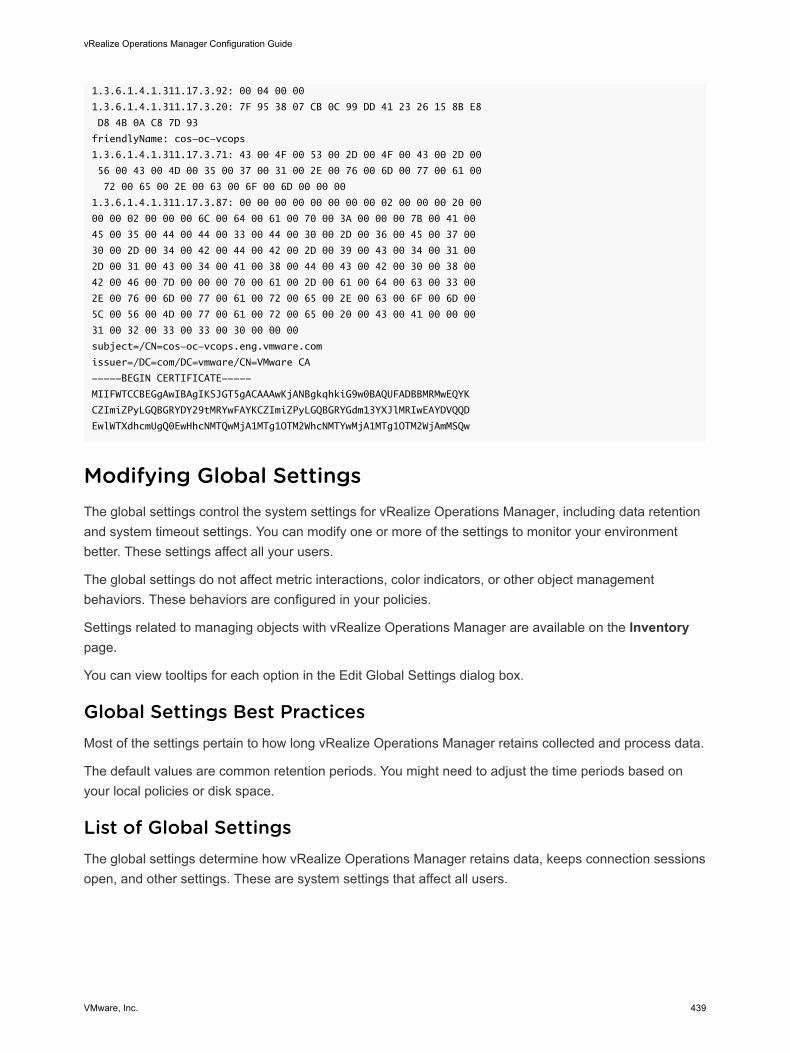
1.3.6.1.4.1.311.17.3.92: 00 04 00 00
1.3.6.1.4.1.311.17.3.20: 7F 95 38 07 CB 0C 99 DD 41 23 26 15 8B E8
D8 4B 0A C8 7D 93
friendlyName: cos-oc-vcops
1.3.6.1.4.1.311.17.3.71: 43 00 4F 00 53 00 2D 00 4F 00 43 00 2D 00
56 00 43 00 4D 00 35 00 37 00 31 00 2E 00 76 00 6D 00 77 00 61 00
72 00 65 00 2E 00 63 00 6F 00 6D 00 00 00
1.3.6.1.4.1.311.17.3.87: 00 00 00 00 00 00 00 00 02 00 00 00 20 00
00 00 02 00 00 00 6C 00 64 00 61 00 70 00 3A 00 00 00 7B 00 41 00
45 00 35 00 44 00 44 00 33 00 44 00 30 00 2D 00 36 00 45 00 37 00
30 00 2D 00 34 00 42 00 44 00 42 00 2D 00 39 00 43 00 34 00 31 00
2D 00 31 00 43 00 34 00 41 00 38 00 44 00 43 00 42 00 30 00 38 00
42 00 46 00 7D 00 00 00 70 00 61 00 2D 00 61 00 64 00 63 00 33 00
2E 00 76 00 6D 00 77 00 61 00 72 00 65 00 2E 00 63 00 6F 00 6D 00
5C 00 56 00 4D 00 77 00 61 00 72 00 65 00 20 00 43 00 41 00 00 00
31 00 32 00 33 00 33 00 30 00 00 00
subject=/CN=cos-oc-vcops.eng.vmware.com
issuer=/DC=com/DC=vmware/CN=VMware CA
-----BEGIN CERTIFICATE-----
MIIFWTCCBEGgAwIBAgIKSJGT5gACAAAwKjANBgkqhkiG9w0BAQUFADBBMRMwEQYK
CZImiZPyLGQBGRYDY29tMRYwFAYKCZImiZPyLGQBGRYGdm13YXJlMRIwEAYDVQQD
EwlWTXdhcmUgQ0EwHhcNMTQwMjA1MTg1OTM2WhcNMTYwMjA1MTg1OTM2WjAmMSQw
Modifying Global SettingsThe global settings control the system settings for vRealize Operations Manager, including data retention and system timeout settings. You can modify one or more of the settings to monitor your environment better. These settings affect all your users.
The global settings do not affect metric interactions, color indicators, or other object management behaviors. These behaviors are configured in your policies.
Settings related to managing objects with vRealize Operations Manager are available on the Inventory page.
You can view tooltips for each option in the Edit Global Settings dialog box.
Global Settings Best PracticesMost of the settings pertain to how long vRealize Operations Manager retains collected and process data.
The default values are common retention periods. You might need to adjust the time periods based on your local policies or disk space.
List of Global SettingsThe global settings determine how vRealize Operations Manager retains data, keeps connection sessions open, and other settings. These are system settings that affect all users.
vRealize Operations Manager Configuration Guide
VMware, Inc. 439
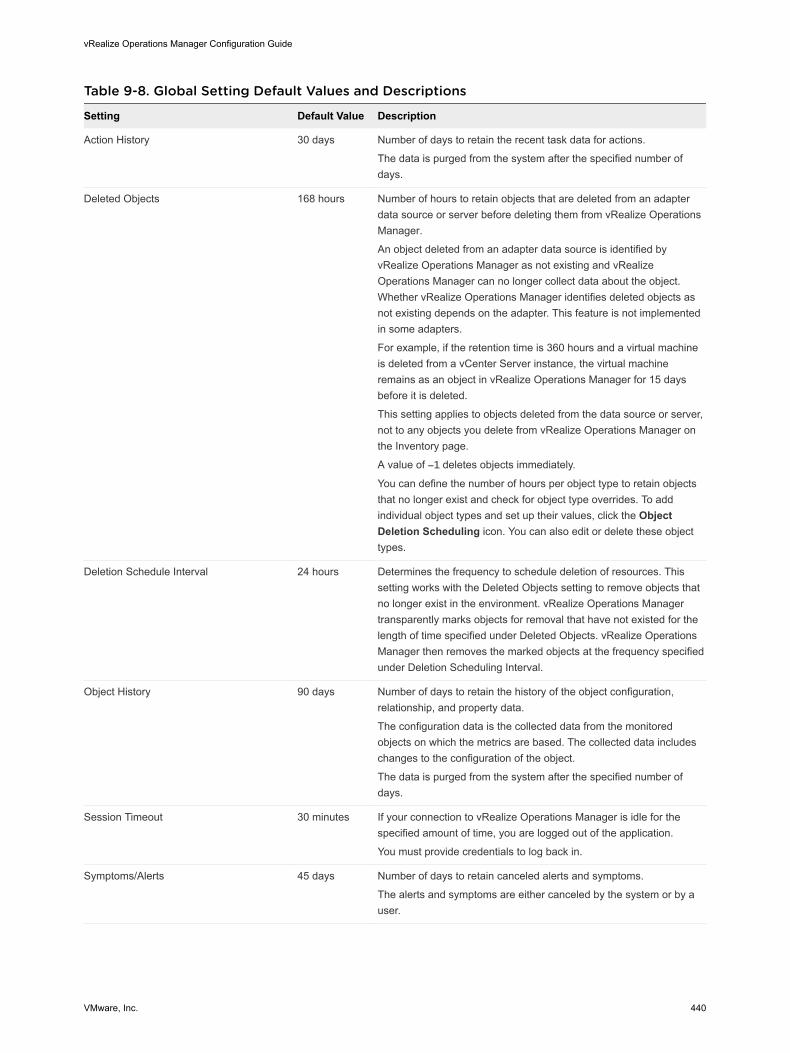
Table 9-8. Global Setting Default Values and Descriptions
Setting Default Value Description
Action History 30 days Number of days to retain the recent task data for actions.
The data is purged from the system after the specified number of days.
Deleted Objects 168 hours Number of hours to retain objects that are deleted from an adapter data source or server before deleting them from vRealize Operations Manager.
An object deleted from an adapter data source is identified by vRealize Operations Manager as not existing and vRealize Operations Manager can no longer collect data about the object. Whether vRealize Operations Manager identifies deleted objects as not existing depends on the adapter. This feature is not implemented in some adapters.
For example, if the retention time is 360 hours and a virtual machine is deleted from a vCenter Server instance, the virtual machine remains as an object in vRealize Operations Manager for 15 days before it is deleted.
This setting applies to objects deleted from the data source or server, not to any objects you delete from vRealize Operations Manager on the Inventory page.
A value of -1 deletes objects immediately.
You can define the number of hours per object type to retain objects that no longer exist and check for object type overrides. To add individual object types and set up their values, click the Object Deletion Scheduling icon. You can also edit or delete these object types.
Deletion Schedule Interval 24 hours Determines the frequency to schedule deletion of resources. This setting works with the Deleted Objects setting to remove objects that no longer exist in the environment. vRealize Operations Manager transparently marks objects for removal that have not existed for the length of time specified under Deleted Objects. vRealize Operations Manager then removes the marked objects at the frequency specified under Deletion Scheduling Interval.
Object History 90 days Number of days to retain the history of the object configuration, relationship, and property data.
The configuration data is the collected data from the monitored objects on which the metrics are based. The collected data includes changes to the configuration of the object.
The data is purged from the system after the specified number of days.
Session Timeout 30 minutes If your connection to vRealize Operations Manager is idle for the specified amount of time, you are logged out of the application.
You must provide credentials to log back in.
Symptoms/Alerts 45 days Number of days to retain canceled alerts and symptoms.
The alerts and symptoms are either canceled by the system or by a user.
vRealize Operations Manager Configuration Guide
VMware, Inc. 440
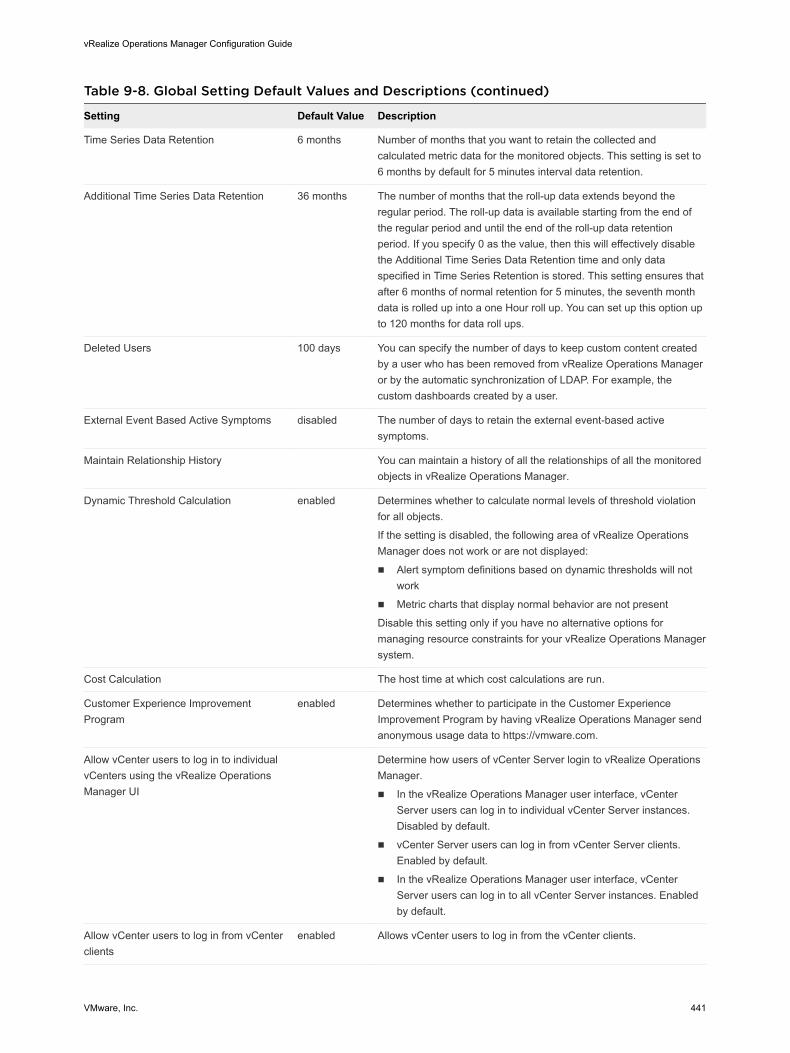
Table 9-8. Global Setting Default Values and Descriptions (continued)
Setting Default Value Description
Time Series Data Retention 6 months Number of months that you want to retain the collected and calculated metric data for the monitored objects. This setting is set to 6 months by default for 5 minutes interval data retention.
Additional Time Series Data Retention 36 months The number of months that the roll-up data extends beyond the regular period. The roll-up data is available starting from the end of the regular period and until the end of the roll-up data retention period. If you specify 0 as the value, then this will effectively disable the Additional Time Series Data Retention time and only data specified in Time Series Retention is stored. This setting ensures that after 6 months of normal retention for 5 minutes, the seventh month data is rolled up into a one Hour roll up. You can set up this option up to 120 months for data roll ups.
Deleted Users 100 days You can specify the number of days to keep custom content created by a user who has been removed from vRealize Operations Manager or by the automatic synchronization of LDAP. For example, the custom dashboards created by a user.
External Event Based Active Symptoms disabled The number of days to retain the external event-based active symptoms.
Maintain Relationship History You can maintain a history of all the relationships of all the monitored objects in vRealize Operations Manager.
Dynamic Threshold Calculation enabled Determines whether to calculate normal levels of threshold violation for all objects.
If the setting is disabled, the following area of vRealize Operations Manager does not work or are not displayed:
n Alert symptom definitions based on dynamic thresholds will not work
n Metric charts that display normal behavior are not present
Disable this setting only if you have no alternative options for managing resource constraints for your vRealize Operations Manager system.
Cost Calculation The host time at which cost calculations are run.
Customer Experience Improvement Program
enabled Determines whether to participate in the Customer Experience Improvement Program by having vRealize Operations Manager send anonymous usage data to https://vmware.com.
Allow vCenter users to log in to individual vCenters using the vRealize Operations Manager UI
Determine how users of vCenter Server login to vRealize Operations Manager.
n In the vRealize Operations Manager user interface, vCenter Server users can log in to individual vCenter Server instances. Disabled by default.
n vCenter Server users can log in from vCenter Server clients. Enabled by default.
n In the vRealize Operations Manager user interface, vCenter Server users can log in to all vCenter Server instances. Enabled by default.
Allow vCenter users to log in from vCenter clients
enabled Allows vCenter users to log in from the vCenter clients.
vRealize Operations Manager Configuration Guide
VMware, Inc. 441

Table 9-8. Global Setting Default Values and Descriptions (continued)
Setting Default Value Description
Allow vCenter users to log in to all vCenters using the vRealize Operations Manager UI
enabled Allows vCenter users to log in to all vCenters using the vRealize Operations Manager UI.
Automated Actions enabled or disabled
Determines whether to allow vRealize Operations Manager to automate actions. When an alert triggered, the alert provides recommendations for remediation. You can automate an action to remediate an alert when the recommendation is the first priority for that alert. You enable actionable alerts in your policies.
Enable Standard Certification Validation This option enables certificate verification to Test Connection in the Create or Modify AI screen, using a standard verification flow.
The option checks CA authority.
n Certificate Subject DN
n Subject alternative name
n Certificate validity period
n Revocation list
This option also presents dialogs to user if one of those checks fail. It is up to the adapter implementation on how the adapter checks source certificate validity during a normal collection cycle. On a usual scenario, adapters just perform a thumb-print verification. However, in case this flag is enabled, Test connection validates certificates in full scale and accepts certificates that are matching all criteria without any user dialogs.
Concurrent UI login sessions enabled Allows concurrent UI login sessions per user. Once changed, this setting affects the subsequent login sessions.
Allow non-imported vIDM user access enabled Allows non-imported VMware Identity Manager users to be created automatically as read-only users upon first access. If disabled, only VMware Identity Manager imported users or users belonging to imported VMware Identity Manager groups will be granted access.
Currency You can specify the currency unit that is used for all the cost calculations. You can select the type of currency from the list of currency types by clicking Choose Currency. From the Set Currency, select the required currency and confirm your action by clicking the check box, and set the currency.
Global SettingsTo manage how vRealize Operations Manager retains data, keeps connection sessions open, and other settings, you can modify the values for the global settings. These system settings affect all users.
You can also choose to participate in the customer experience improvement program. For more information on accessing Global settings, see Access Global Settings.
Access Global SettingsWith global settings, you set times to delete objects, set timeouts, store historical data, use dynamic threshold and capacity calculations, and determine how vCenter Server users log in. For automated
vRealize Operations Manager Configuration Guide
VMware, Inc. 442
actions, you can select whether to allow actions to be triggered from alert recommendations automatically.
Procedure
1 In the menu, click Administration, and then in the left pane click Management > Global Settings.
2 To edit the global settings, click the setting you want to edit.
Note Editable global settings have a hidden Edit icon next to their values. To see the icon, point to the global setting.
Table 9-9. Global Settings Options
Option Description
Edit Global Settings Click the global setting you want to edit to activate the edit mode and modify the setting values. To edit non-switchable settings, select a value and then click Save. To edit switchable settings, select a value and then click Enable or Disable to change the setting. Click Cancel to discard all changes and exit the edit mode.
Setting Setting name.
Value Current value for the setting.
To change the setting value, click Edit Global Settings.
Description Information about the setting. Point to the setting to display additional information about the setting.
Transfer Ownership of Dashboards and Report SchedulesWhen a user is deleted from vRealize Operations Manager, the report schedules and dashboards created by the user are stored as orphaned content. As an admin user, you can transfer ownership of dashboards and report schedules created by deleted users.
From Where You Can Transfer Ownership of Dashboards and Report SchedulesIn the menu, click Administration. From the left pane, select Management > Orphaned Content.
Orphaned Content PageYou can view a list of deleted users from the Deleted Users panel in the left pane of the Orphaned Content page. Based on your selection in the Deleted Users panel, the dashboards and report schedules for the deleted user are displayed under the Dashboard and Report Schedules tabs in the Orphaned Content page.
vRealize Operations Manager Configuration Guide
VMware, Inc. 443
As an admin user, you can take ownership, assign ownership, or discard orphaned dashboards and report schedules, from the Actions menu in the Dashboards and Report Schedules tabs. Enter the name or part of the name of a dashboard or report schedule in the Filter option and click Enter. The relevant dashboard or report schedule is displayed.
Table 9-10. Actions Menu Options
Actions Options
Take Ownership You can take ownership of the selected dashboards or report schedules.
Assign Ownership You can assign a new owner for the selected dashboards or report schedules. You can select a target user from the Transfer Dashboards/Report Schedule dialog box.
Discard You can permanently delete the dashboards or report schedules.
Create a vRealize Operations Manager Support BundleYou create a vRealize Operations Manager support bundle to gather log and configuration files for analysis when troubleshooting a vRealize Operations Manager issue.
When you create a support bundle, vRealize Operations Manager gathers files from cluster nodes into ZIP files for convenience.
Procedure
1 In the menu, click Administration, and then in the left pane, click Support > Supoort Bundles.
2 From the toolbar, click the Create a Support Bundle icon.
3 Select the option to create a Light or Full support bundle.
4 Select the cluster nodes that need to be evaluated for support.
Only logs from the selected nodes are included in the support bundle.
5 Click OK, and click OK to confirm support bundle creation.
Depending on the size of the logs and number of nodes, it might take time for vRealize Operations Manager to create the support bundle.
What to do next
Use the toolbar to download the support bundle ZIP files for analysis. For security, vRealize Operations Manager prompts you for credentials when you download a support bundle.
You can review the log files for error messages or, if you need troubleshooting assistance, send the diagnostic data to VMware Technical Support. When you resolve or close the issue, use the toolbar to delete the outdated support bundle to save disk space.
vRealize Operations Manager Configuration Guide
VMware, Inc. 444
Customizing IconsEvery object or adapter in your environment has an icon representation. You can customize how the icon appears.
vRealize Operations Manager assigns a default icon to each object type and adapter type . Taken collectively, object types and adapter types are known as objects in your environment. Icons represent objects in the UI and help you to identify the type of object. For example, in the Topology Graph widget on a dashboard, labeled icons show how objects are connected to one other. You can quickly identify the type of object from the icon.
If you want to differentiate objects, you can change the icon. For example, a virtual machine icon is generic. If you want to pictorially distinguish the data that a vSphere virtual machine provides from the data that a Hypervisor virtual machine provides, you can assign a different icon to each.
Customize an Object Type IconYou can use the default icons that vRealize Operations Manager provides, or you can upload your own graphics file for an object type. When you change an icon, your changes take effect for all users.
Prerequisites
If you plan to use your own icon files, verify that each image is in PNG format and has the same height and width. For best results, use a 256x256 pixel image size.
Procedure
1 In the menu, click Administration, and then in the left pane, click Configuration > Icons.
2 Click the Object Type Icons tab.
3 Assign the Object Type icon.
a Select the object type in the list with the icon to change.
By default, object types for all adapter types are listed. To limit the selection to the object types that are valid for a single adapter type, select the adapter type from the drop-down menu.
b Click the Upload icon.
c Browse to and select the file to use and click Done.
4 (Optional) To return to the default icon, select the object type and click the Assign Default Icons icon.
The original default icon appears.
Customize an Adapter Type IconYou can use the default icons that vRealize Operations Manager provides, or you can upload your own graphics file for an adapter type. When you change an icon, your changes take effect for all users.
vRealize Operations Manager Configuration Guide
VMware, Inc. 445
Prerequisites
If you plan to use your own icon files, verify that each image is in PNG format and has the same height and width. For best results, use a 256x256 pixel image size.
Procedure
1 In the menu, click Administration, and then in the left pane, click Configuration > Icons.
2 Click Adapter Type Icons tab.
3 Assign the Adapter Type icon.
a Select the adapter type in the list with the icon to change.
b Click the Upload icon.
c Browse to and select the file to use and click Done.
4 (Optional) To return to the default icon, select the adapter type and click the Assign Default Icons icon.
The original default icon appears.
vRealize Operations Manager Configuration Guide
VMware, Inc. 446
OPS-CLI Command-Line Tool 10The OPS-CLI tool is a Java application that you can use to manipulate the vRealize Operations Manager database. It replaces the VCOPS-CLI and DBCLI tools.
The product includes the executable file in the tools directory or in <VCOPS_BASE>/tools/opscli/.
Operating System Filename
Linux ops-cli.sh
Python ops-cli.py
All OPS-CLI commands use the -h parameter for interactive and localized help.
When you add the control command to the post_install.sh script, it triggers the redescribe process after an adapter is installed or upgraded.
control -h | redescribe --force
Related Command-Line DocumentationIn addition to the OPS-CLI, the VMware PowerCLI provides an easy-to-use Windows PowerShell interface for command-line access to administration tasks or for creating executable scripts.
Supported OperationsThe OPS-CLI tool supports the following database operations.
n dashboard Command Operations
You use the dashboard command to import, export, share, unshare, delete, reorder, show, hide, and set the default summary for dashboards.
n template Command Operations
You use the template command to import, export, share, unshare, delete, and reorder templates.
n supermetric Command Operations
You use the supermetric command to import, export, configure, and delete super metrics.
VMware, Inc. 447
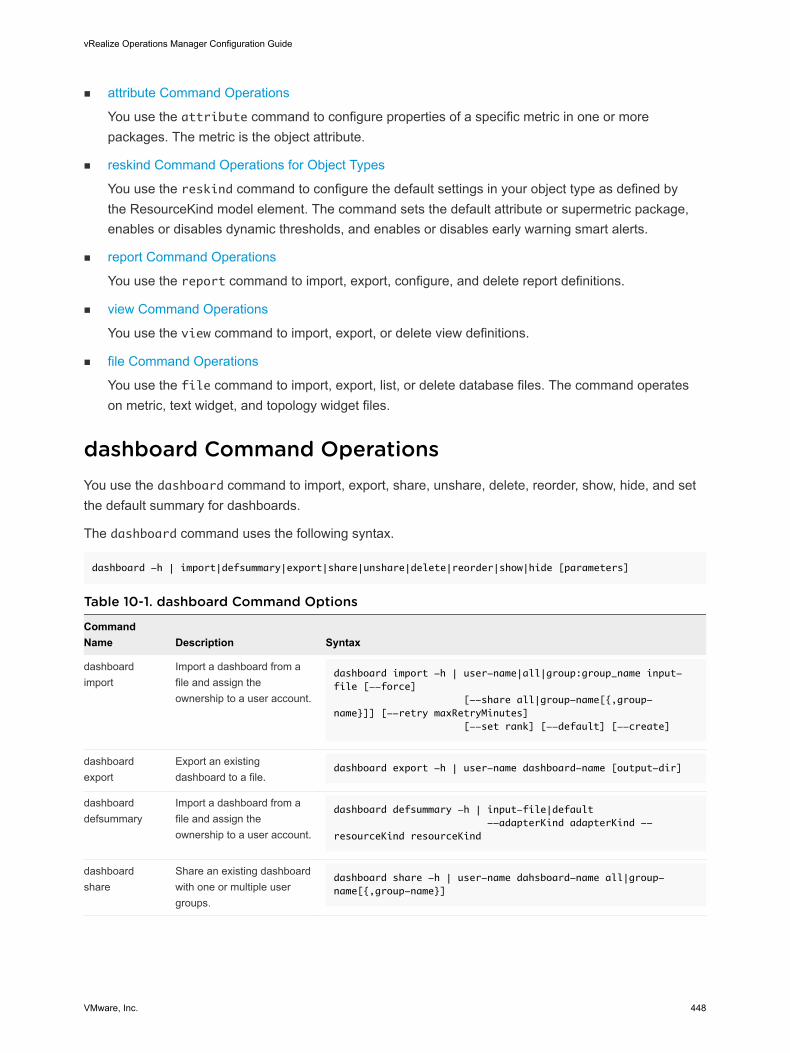
n attribute Command Operations
You use the attribute command to configure properties of a specific metric in one or more packages. The metric is the object attribute.
n reskind Command Operations for Object Types
You use the reskind command to configure the default settings in your object type as defined by the ResourceKind model element. The command sets the default attribute or supermetric package, enables or disables dynamic thresholds, and enables or disables early warning smart alerts.
n report Command Operations
You use the report command to import, export, configure, and delete report definitions.
n view Command Operations
You use the view command to import, export, or delete view definitions.
n file Command Operations
You use the file command to import, export, list, or delete database files. The command operates on metric, text widget, and topology widget files.
dashboard Command OperationsYou use the dashboard command to import, export, share, unshare, delete, reorder, show, hide, and set the default summary for dashboards.
The dashboard command uses the following syntax.
dashboard -h | import|defsummary|export|share|unshare|delete|reorder|show|hide [parameters]
Table 10-1. dashboard Command Options
Command Name Description Syntax
dashboard import
Import a dashboard from a file and assign the ownership to a user account.
dashboard import -h | user-name|all|group:group_name input-file [--force] [--share all|group-name[{,group-name}]] [--retry maxRetryMinutes] [--set rank] [--default] [--create]
dashboard export
Export an existing dashboard to a file.
dashboard export -h | user-name dashboard-name [output-dir]
dashboard defsummary
Import a dashboard from a file and assign the ownership to a user account.
dashboard defsummary -h | input-file|default --adapterKind adapterKind --resourceKind resourceKind
dashboard share
Share an existing dashboard with one or multiple user groups.
dashboard share -h | user-name dahsboard-name all|group-name[{,group-name}]
vRealize Operations Manager Configuration Guide
VMware, Inc. 448
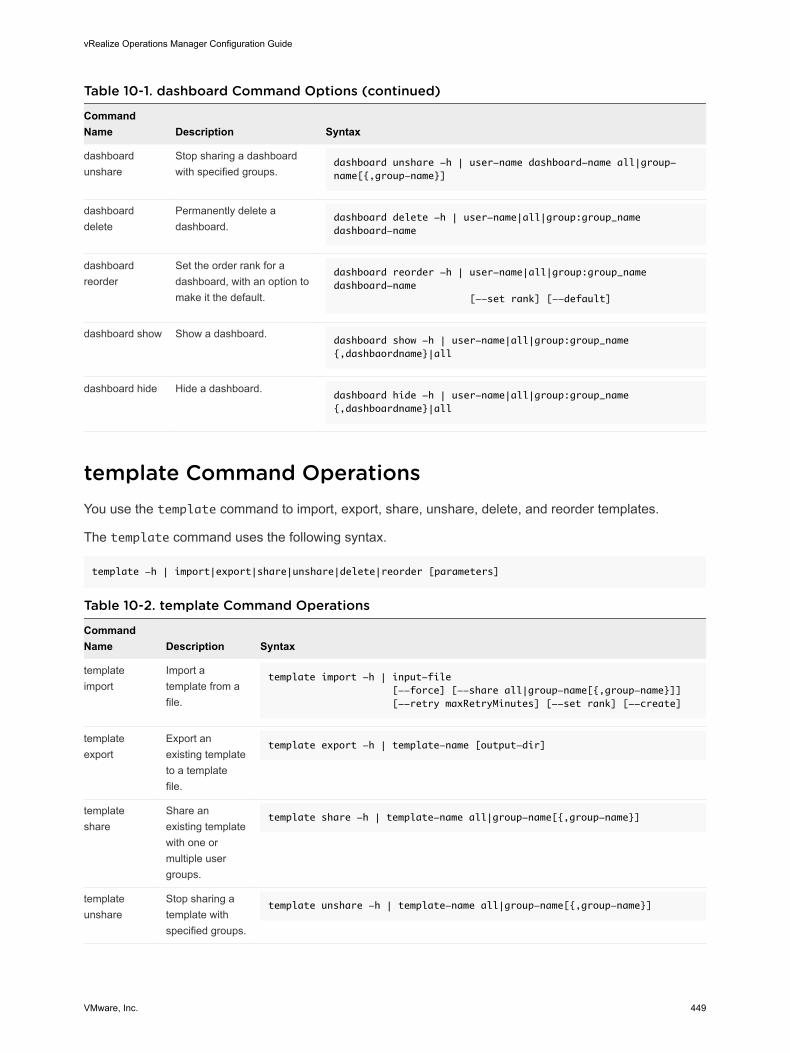
Table 10-1. dashboard Command Options (continued)
Command Name Description Syntax
dashboard unshare
Stop sharing a dashboard with specified groups.
dashboard unshare -h | user-name dashboard-name all|group-name[{,group-name}]
dashboard delete
Permanently delete a dashboard.
dashboard delete -h | user-name|all|group:group_name dashboard-name
dashboard reorder
Set the order rank for a dashboard, with an option to make it the default.
dashboard reorder -h | user-name|all|group:group_name dashboard-name [--set rank] [--default]
dashboard show Show a dashboard.dashboard show -h | user-name|all|group:group_name {,dashbaordname}|all
dashboard hide Hide a dashboard.dashboard hide -h | user-name|all|group:group_name {,dashboardname}|all
template Command OperationsYou use the template command to import, export, share, unshare, delete, and reorder templates.
The template command uses the following syntax.
template -h | import|export|share|unshare|delete|reorder [parameters]
Table 10-2. template Command Operations
Command Name Description Syntax
template import
Import a template from a file.
template import -h | input-file [--force] [--share all|group-name[{,group-name}]] [--retry maxRetryMinutes] [--set rank] [--create]
template export
Export an existing template to a template file.
template export -h | template-name [output-dir]
template share
Share an existing template with one or multiple user groups.
template share -h | template-name all|group-name[{,group-name}]
template unshare
Stop sharing a template with specified groups.
template unshare -h | template-name all|group-name[{,group-name}]
vRealize Operations Manager Configuration Guide
VMware, Inc. 449
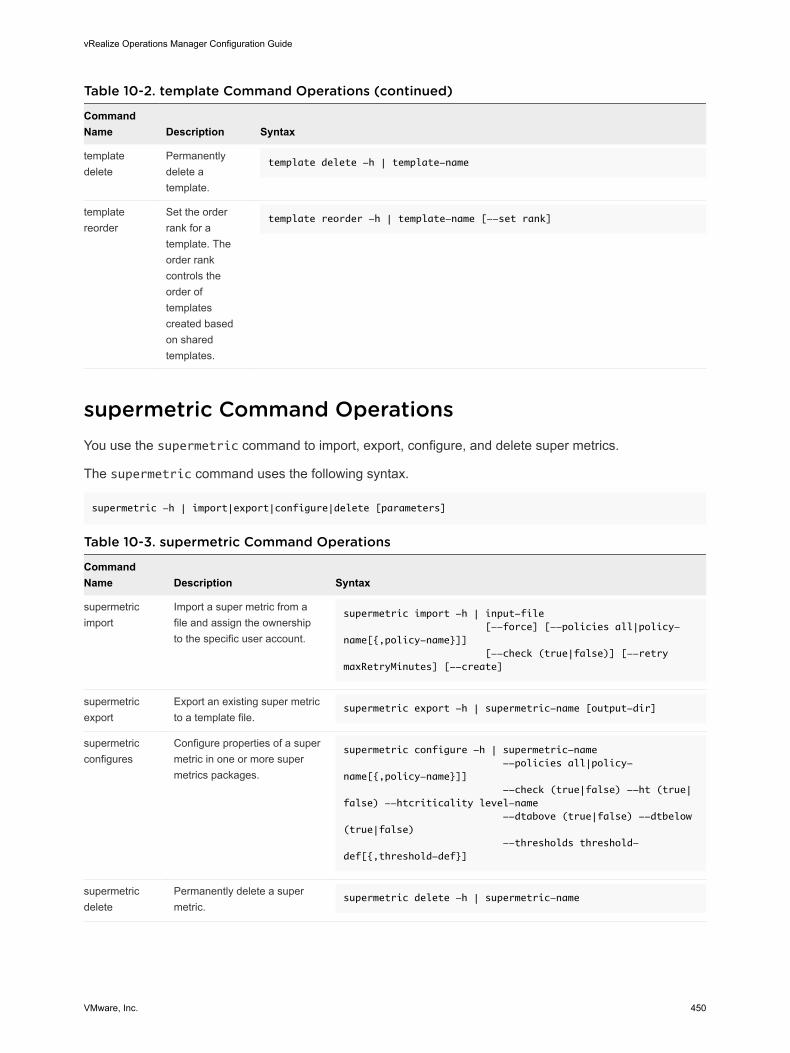
Table 10-2. template Command Operations (continued)
Command Name Description Syntax
template delete
Permanently delete a template.
template delete -h | template-name
template reorder
Set the order rank for a template. The order rank controls the order of templates created based on shared templates.
template reorder -h | template-name [--set rank]
supermetric Command OperationsYou use the supermetric command to import, export, configure, and delete super metrics.
The supermetric command uses the following syntax.
supermetric -h | import|export|configure|delete [parameters]
Table 10-3. supermetric Command Operations
Command Name Description Syntax
supermetric import
Import a super metric from a file and assign the ownership to the specific user account.
supermetric import -h | input-file [--force] [--policies all|policy-name[{,policy-name}]] [--check (true|false)] [--retry maxRetryMinutes] [--create]
supermetric export
Export an existing super metric to a template file.
supermetric export -h | supermetric-name [output-dir]
supermetric configures
Configure properties of a super metric in one or more super metrics packages.
supermetric configure -h | supermetric-name --policies all|policy-name[{,policy-name}]] --check (true|false) --ht (true|false) --htcriticality level-name --dtabove (true|false) --dtbelow (true|false) --thresholds threshold-def[{,threshold-def}]
supermetric delete
Permanently delete a super metric.
supermetric delete -h | supermetric-name
vRealize Operations Manager Configuration Guide
VMware, Inc. 450
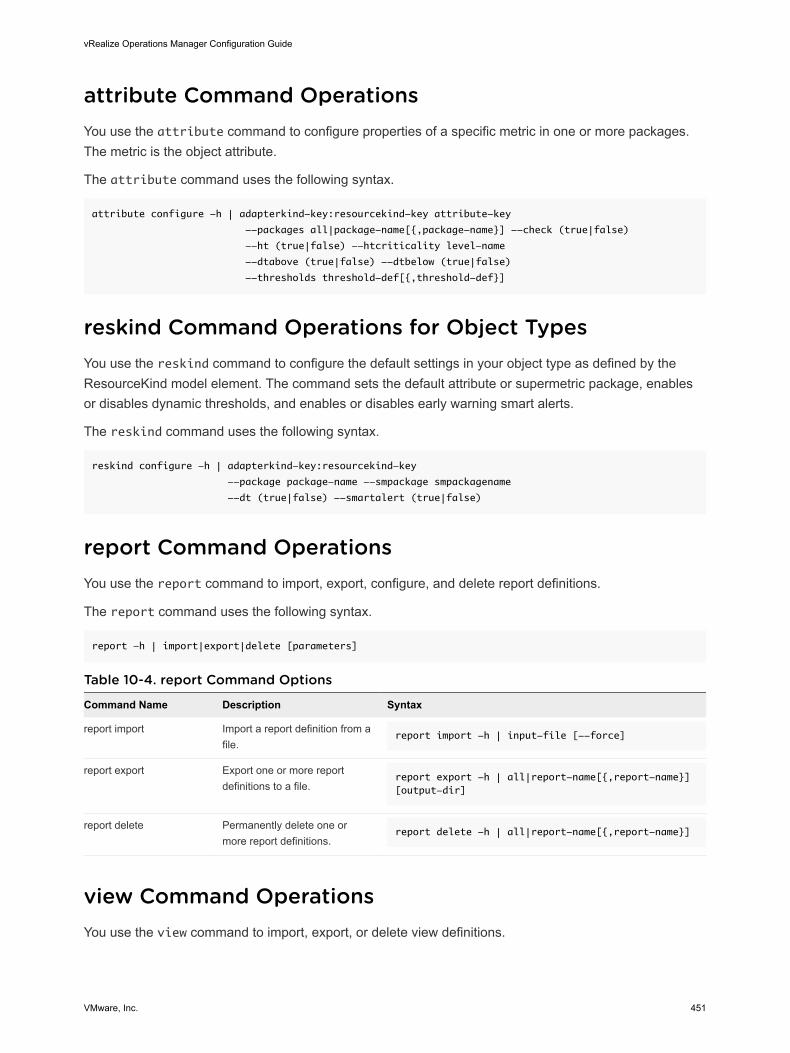
attribute Command OperationsYou use the attribute command to configure properties of a specific metric in one or more packages. The metric is the object attribute.
The attribute command uses the following syntax.
attribute configure -h | adapterkind-key:resourcekind-key attribute-key
--packages all|package-name[{,package-name}] --check (true|false)
--ht (true|false) --htcriticality level-name
--dtabove (true|false) --dtbelow (true|false)
--thresholds threshold-def[{,threshold-def}]
reskind Command Operations for Object TypesYou use the reskind command to configure the default settings in your object type as defined by the ResourceKind model element. The command sets the default attribute or supermetric package, enables or disables dynamic thresholds, and enables or disables early warning smart alerts.
The reskind command uses the following syntax.
reskind configure -h | adapterkind-key:resourcekind-key
--package package-name --smpackage smpackagename
--dt (true|false) --smartalert (true|false)
report Command OperationsYou use the report command to import, export, configure, and delete report definitions.
The report command uses the following syntax.
report -h | import|export|delete [parameters]
Table 10-4. report Command Options
Command Name Description Syntax
report import Import a report definition from a file.
report import -h | input-file [--force]
report export Export one or more report definitions to a file.
report export -h | all|report-name[{,report-name}] [output-dir]
report delete Permanently delete one or more report definitions.
report delete -h | all|report-name[{,report-name}]
view Command OperationsYou use the view command to import, export, or delete view definitions.
vRealize Operations Manager Configuration Guide
VMware, Inc. 451
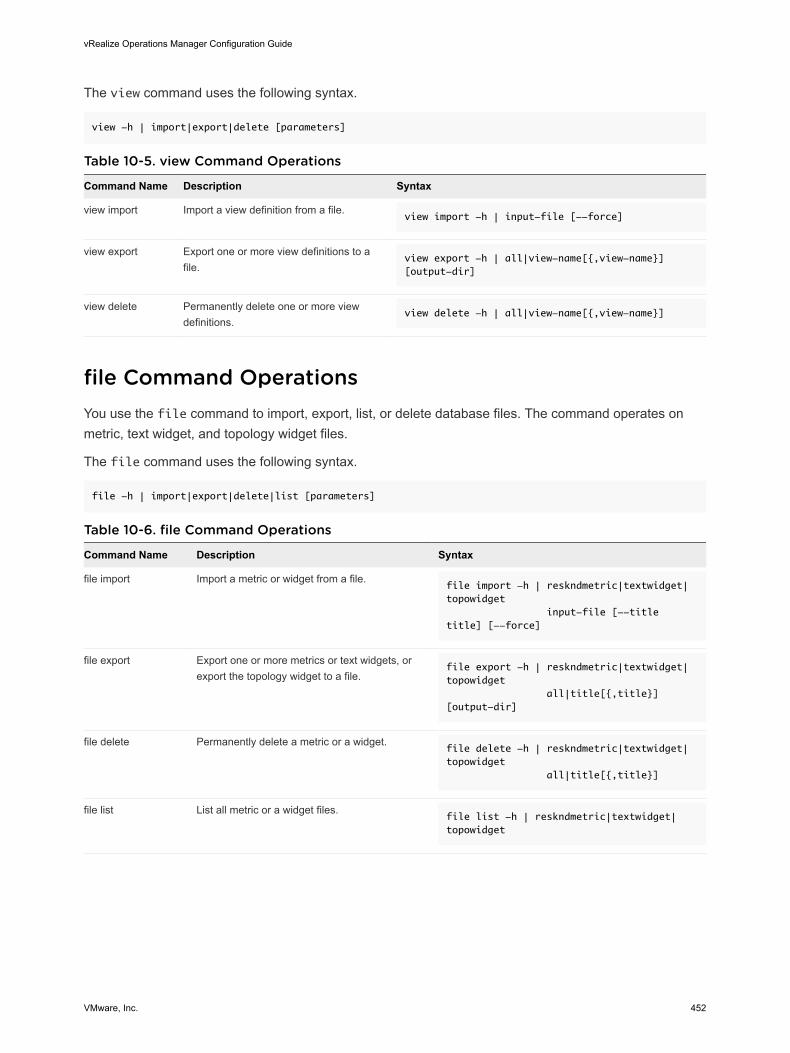
The view command uses the following syntax.
view -h | import|export|delete [parameters]
Table 10-5. view Command Operations
Command Name Description Syntax
view import Import a view definition from a file.view import -h | input-file [--force]
view export Export one or more view definitions to a file.
view export -h | all|view-name[{,view-name}] [output-dir]
view delete Permanently delete one or more view definitions.
view delete -h | all|view-name[{,view-name}]
file Command OperationsYou use the file command to import, export, list, or delete database files. The command operates on metric, text widget, and topology widget files.
The file command uses the following syntax.
file -h | import|export|delete|list [parameters]
Table 10-6. file Command Operations
Command Name Description Syntax
file import Import a metric or widget from a file.file import -h | reskndmetric|textwidget|topowidget input-file [--title title] [--force]
file export Export one or more metrics or text widgets, or export the topology widget to a file.
file export -h | reskndmetric|textwidget|topowidget all|title[{,title}] [output-dir]
file delete Permanently delete a metric or a widget.file delete -h | reskndmetric|textwidget|topowidget all|title[{,title}]
file list List all metric or a widget files.file list -h | reskndmetric|textwidget|topowidget
vRealize Operations Manager Configuration Guide
VMware, Inc. 452