Embed Size (px)
Citation preview
vRealize Operations ManagerCustomization and Administration
GuidevRealize Operations Manager 6.3
vRealize Operations Manager Customization and Administration Guide
2 VMware, Inc.
You can find the most up-to-date technical documentation on the VMware Web site at:
https://docs.vmware.com/
The VMware Web site also provides the latest product updates.
If you have comments about this documentation, submit your feedback to:
Copyright © 2017 VMware, Inc. All rights reserved. Copyright and trademark information.
VMware, Inc.3401 Hillview Ave.Palo Alto, CA 94304www.vmware.com
Contents
About Customization and Administration 7
1 Configuring Users and Groups in vRealize Operations Manager 9
Managing Users and Access Control in vRealize Operations Manager 10Users of vRealize Operations Manager 10Roles and Privileges in vRealize Operations Manager 13User Scenario: Manage User Access Control 14Configure a Single Sign-On Source in vRealize Operations Manager 17Audit Users and the Environment in vRealize Operations Manager 20
Managing Custom Object Groups in VMware vRealize Operations Manager 21User Scenario: Creating Custom Object Groups 22
Managing Application Groups 24User Scenario: Adding an Application 24
2 Customizing How vRealize Operations Manager Displays Your Data 27
Using Dashboards 27User Scenario: Create and Configure Dashboards and Widgets 28Dashboards 32
Using Widgets 32Widget Definitions List 32Widget Interactions 34Add a Resource Interaction XML File 35
Using Views 36User Scenario: Create, Run, Export, and Import a vRealize Operations Manager View for
Tracking Virtual Machines 37Views and Reports Ownership 39Editing, Cloning, and Deleting a View 39
Using Reports 40User Scenario: Handling Reports to Monitor Virtual Machines 40
3 Customizing How vRealize Operations Manager Monitors Your Environment 45
Defining Alerts in vRealize Operations Manager 45Object Relationship Hierarchies for Alert Definitions 46Alert Definition Best Practices 47Understanding Negative Symptoms for vRealize Operations Manager Alerts 48Create an Alert Definition for Department Objects 49Defining Symptoms for Alerts 59Viewing Actions Available in vRealize Operations Manager 61Defining Recommendations for Alert Definitions 61Creating and Managing vRealize Operations Manager Alert Notifications 62
VMware, Inc. 3
Defining Compliance Standards 72vRealize Operations Manager Compliance for vSphere 6.0 Objects 73User Scenario: Ensure Compliance of Your vSphere 6.0 Objects 74User Scenario: Define a Compliance Standard for Custom Standards 78
Operational Policies 80Managing and Administering Policies for vRealize Operations Manager 81
Policy Decisions and Objectives 82Default Policy in vRealize Operations Manager 83Custom Policies 83Policies Provided with vRealize Operations Manager 84User Scenario: Create a Custom Operational Policy for a vSphere Production Environment 86User Scenario: Create an Operational Policy for Production vCenter Server Datastore Objects 93Using the Monitoring Policy Workspace to Create and Modify Operational Policies 101Policy Workspace in vRealize Operations Manager 102
Super Metrics in vRealize Operations Manager 103Super Metric Functions 103User Scenario: Formulate and Apply Your Super Metric 105Building a Super Metric Formula 108Exporting a Super Metric 109Importing a Super Metric 109
Customizing Icons 110Customize an Object Type Icon 110Customize an Adapter Type Icon 110
Managing Objects in Your Environment 111Adding an Object to Your Environment 111Creating and Assigning Tags 112
Configuring Object Relationships 115Adding an Object Relationship 115
Customizing How Endpoint Operations Management Monitors Operating Systems 116Configuring Remote Monitoring 116Working with Agent Plug-ins 122Configuring Agent Logging 123
Modifying Global Settings 126List of Global Settings 127
4 Maintaining and Expanding vRealize Operations Manager 129
vRealize Operations Manager Cluster and Node Maintenance 129vRealize Operations Manager Logging 131vRealize Operations Manager Passwords and Certificates 131
Change the vRealize Operations Manager Administrator Password 131Reset the vRealize Operations Manager Administrator Password on vApp or Linux Clusters 132Reset the vRealize Operations Manager Administrator Password on Windows Clusters 132Generate a vRealize Operations Manager Passphrase 132
How To Preserve Customized Content 133Backup and Restore 134
Backing Up and Restoring with vSphere Data Protection 134Checking the Restore of vRealize Operations Manager Systems 137Change the IP Address of Nodes After Restoring a Cluster on a Remote Host 138Manual Backup Procedure Appears to Stall 139
vRealize Operations Manager Customization and Administration Guide
4 VMware, Inc.
5 OPS-CLI Command-Line Tool 141
dashboard Command Operations 142template Command Operations 142supermetric Command Operations 143attribute Command Operations 144reskind Command Operations for Object Types 144report Command Operations 144view Command Operations 145file Command Operations 145
Index 147
Contents
VMware, Inc. 5

vRealize Operations Manager Customization and Administration Guide
6 VMware, Inc.
About Customization and Administration
The VMware vRealize Operations Manager Customization and Administration Guide describes how to configureand monitor your environment. It shows you how to connect vRealize Operations Manager to external datasources and analyze the data collected from them, ensure that users and their supporting infrastructure arein place, configure resources to determine the behavior of your objects, and format the content that appearsin vRealize Operations Manager.
To help you maintain and expand your vRealize Operations Manager installation, this information describeshow to manage nodes and clusters, configure NTP, view log files, create support bundles, and add amaintenance schedule. It provides information about license keys and groups, and shows you how togenerate a passphrase, review the certificates used for authentication, run the describe process, and performadvanced maintenance functions.
Intended AudienceThis information is intended for vRealize Operations Manager administrators, virtual infrastructureadministrators, and operations engineers who install, configure, monitor, manage, and maintain the objectsin your environment.
VMware Technical Publications GlossaryVMware Technical Publications provides a glossary of terms that might be unfamiliar to you. For definitionsof terms as they are used in VMware technical documentation, go to http://www.vmware.com/support/pubs.
VMware, Inc. 7

vRealize Operations Manager Customization and Administration Guide
8 VMware, Inc.
Configuring Users and Groups invRealize Operations Manager 1
As a system administrator, you must ensure that users and their supporting infrastructure are in place. Youestablish and maintain user access to your instance of vRealize Operations Manager, control userpreferences, and manage settings for the email server.
User Access ControlTo ensure security of the objects in your vRealize Operations Manager instance, and the actions that a usercan perform to the objects and to the system, you manage all aspects of user access control .
vRealize Operations Manager assigns access permissions to users and user groups. Access privileges areorganized into roles. You control users and user groups access to objects in the system, by specifying theprivileges they can perform on selected objects. When you assign a role to a user, you are determining notonly what actions the user can perform in the system, but also the objects upon which he can perform thoseactions. You can assign users a role that gives them complete access to all objects in the system.Alternatively, you can assign users a role that gives them read-only privileges on virtual machines. Sinceusers and user groups can hold more than one role, the same user may have complete access to all thevirtual machines on one cluster, but read-only access to the virtual machines on another.
As a system administrator, you must prevent unauthorized users from accessing certain files in yourWindows-based environment. The %ALIVE_BASE%/user/conf directory contains password and othersensitive information related to accessing your vRealize Operations Manager environment. Access thisdirectory, and assign access permissions accordingly to secure your environment.
User PreferencesTo determine the display options for vRealize Operations Manager, such as colors for the display and healthchart, the number of metrics and groups to display, and whether to synchronize system time with the hostmachine, you configure the user preferences on the top toolbar.
This chapter includes the following topics:
n “Managing Users and Access Control in vRealize Operations Manager,” on page 10
n “Managing Custom Object Groups in VMware vRealize Operations Manager,” on page 21
n “Managing Application Groups,” on page 24
VMware, Inc. 9
Managing Users and Access Control in vRealize Operations ManagerTo ensure security of the objects in your vRealize Operations Manager instance, as a system administratoryou can manage all aspects of user access control. You create user accounts, assign each user to be a memberof one or more user groups, and assign roles to each user or user group to set their privileges.
Users must have privileges to access specific features in the vRealize Operations Manager user interface.Access control is defined by assigning privileges to both users and objects. You can assign one or more rolesto users, and enable them to perform a range of different actions on the same types of objects. For example,you can assign a user with the privileges to delete a virtual machine, and assign the same user with read-only privileges for another virtual machine.
User Access ControlYou can authenticate users in vRealize Operations Manager in several ways.
n Create local user accounts in vRealize Operations Manager.
n Use VMware vCenter Server® users. After the vCenter Server is registered withvRealize Operations Manager, configure the vCenter Server user options in thevRealize Operations Manager global settings to enable a vCenter Server user to log in tovRealize Operations Manager. When logged into vRealize Operations Manager, vCenter Server usersaccess objects according to their vCenter Server-assigned permissions.
n Add an authentication source to authenticate imported users and user group information that resideson another machine.
n Use LDAP to import users or user groups from an LDAP server. LDAP users can use their LDAPcredentials to log in to vRealize Operations Manager. For example, use Active Directory on aWindows machine to log into vRealize Operations Manager through LDAP, by adding the ActiveDirectory server as an LDAP server.
n Create a single sign-on source and import users and user groups from a single sign-on server.Single sign-on users can use their single sign-on credentials to log in tovRealize Operations Manager and vCenter Server. You can also use Active Directory throughsingle sign-on by configuring the Active Directory through single sign-on and adding the singlesign-on source to vRealize Operations Manager.
Users of vRealize Operations ManagerEach user has an account to authenticate them when they log in to vRealize Operations Manager.
The accounts of local users and LDAP users are visible in the vRealize Operations Manager user interfacewhen they are set up. The accounts of vCenter Server and single sign-on users only appear in the userinterface after a user logs in for the first time. Each user can be assigned one or more roles, and can be anauthenticated member of one or more user groups.
Local Users in vRealize Operations ManagerWhen you create user accounts in a local vRealize Operations Manager instance,vRealize Operations Manager stores the credentials for those accounts in its global database, andauthenticates the account user locally.
Each user account must have a unique identity, and can include any associated user preferences.
If you are logging in to vRealize Operations Manager as a local user, and on occasion receive an invalidpassword message, try the following workaround. In the Login page, change the Authentication Source toAll vCenter Servers, change it back to Local Users, and log in again.
vRealize Operations Manager Customization and Administration Guide
10 VMware, Inc.
vCenter Server Users in vRealize Operations ManagervRealize Operations Manager supports vCenter Server users. To log in to vRealize Operations Manager,vCenter Server users must be valid users in vCenter Server.
Roles and Associations
A vCenter Server user must have either the vCenter Server Admin role or one of thevRealize Operations Manager privileges, such as PowerUser which assigned at the root level invCenter Server, to log in to vRealize Operations Manager. vRealize Operations Manager uses only thevCenter privileges, meaning the vRealize Operations Manager roles, at the root level, and applies them to allthe objects to which the user has access. After logging in, vCenter Server users can view all the objects invRealize Operations Manager that they can already view in vCenter Server.
Logging in to vCenter Server Instances and Accessing Objects
vCenter Server users can access either a single vCenter Server instance or multiple vCenter Server instances,depending on the authentication source they select when they log in to vRealize Operations Manager.
n If users select a single vCenter Server instance as the authentication source, they have permission toaccess the objects in that vCenter Server instance. After the user has logged in, an account is created invRealize Operations Manager with the specific vCenter Server instance serving as the authenticationsource.
n If users select All vCenter Servers as the authentication source, and they have identical credentials foreach vCenter Server in the environment, they see all the objects in all the vCenter Server instances. Onlyusers that have been authenticated by all the vCenter Servers in the environment can log in. After a userhas logged in, an account is created in vRealize Operations Manager with all vCenter Server instancesserving as the authentication source.
vRealize Operations Manager does not support linked vCenter Server instances. Instead, you mustconfigure the vCenter Server adapter for each vCenter Server instance, and register each vCenter Serverinstance to vRealize Operations Manager.
Only objects from a specific vCenter Server instance appear in vRealize Operations Manager. If avCenter Server instance has other linked vCenter Server instances, the data does not appear.
vCenter Server Roles and Privileges
You cannot view or edit vCenter Server roles or privileges in vRealize Operations Manager.vRealize Operations Manager sends roles as privileges to vCenter Server as part of the vCenter ServerGlobal privilege group. A vCenter Server administrator must assign vRealize Operations Manager roles tousers in vCenter Server.
vRealize Operations Manager privileges in vCenter Server have the role appended to the name. Forexample, vRealize Operations Manager ContentAdmin Role, or vRealize Operations Manager PowerUserRole.
Read-Only Principal
A vCenter Server user is a read-only principal in vRealize Operations Manager, which means that youcannot change the role, group, or objects associated with the role in vRealize Operations Manager. Instead,you must change them in the vCenter Server instance. The role applied to the root folder applies to all theobjects in vCenter Server to which a user has privileges. vRealize Operations Manager does not applyindividual roles on objects. For example, if a user has the PowerUser role to access the vCenter Server rootfolder, but has read-only access to a virtual machine, vRealize Operations Manager applies the PowerUserrole to the user to access the virtual machine.
Chapter 1 Configuring Users and Groups in vRealize Operations Manager
VMware, Inc. 11
Refreshing Permissions
When you change permissions for a vCenter Server user in vCenter Server, the user must log out and logback in to vRealize Operations Manager to refresh the permissions and view the updated results invRealize Operations Manager. Alternatively, the user can wait for vRealize Operations Manager to refresh.The permissions refresh at fixed intervals, as defined in the $ALIVE_BASE/user/conf/auth.properties file.The default refreshing interval is half an hour. If necessary, you can change this interval for all nodes in thecluster.
Single Sign-On and vCenter Users
When vCenter Server users log into vRealize Operations Manager by way of single sign-on, they areregistered on the vRealize Operations Manager User Accounts page. If you delete the account of avCenter Server user that has logged into vRealize Operations Manager by way of single sign-on, or removethe user from a single sign-on group, the user account entry still appears on the User Account page and youmust delete it manually.
Generating Reports
vCenter Server users cannot create or schedule reports in vRealize Operations Manager.
Backward Compatibility for vCenter Server Users in vRealize Operations ManagervRealize Operations Manager provides backward compatibility for users of the earlier version ofvRealize Operations Manager, so that users of vCenter Server who have privileges in the earlier version invCenter Server can log in to vRealize Operations Manager.
When you register vRealize Operations Manager in vCenter Server, certain roles become available invCenter Server.
n The Administrator account in the previous version of vRealize Operations Manager maps to thePowerUser role.
n The Operator account in the previous version of vRealize Operations Manager maps to the ReadOnlyrole.
During registration, all roles in vRealize Operations Manager, except for vRealize Operations ManagerAdministrator, Maintenance, and Migration, become available dynamically in vCenter Server.Administrators in vCenter Server have all of the roles in vRealize Operations Manager that map duringregistration, but these administrator accounts only receive a specific role on the root folder in vCenter Serverif it is specially assigned.
Registration of vRealize Operations Manager with vCenter Server is optional. If users choose not to registervRealize Operations Manager with vCenter Server, a vCenter Server administrator can still use their username and password to log in to vRealize Operations Manager, but these users cannot use the vCenter Serversession ID to log in. In this case, typical vCenter Server users must have one or morevRealize Operations Manager roles to log in to vRealize Operations Manager.
When multiple instances of vCenter Server are added to vRealize Operations Manager, user credentialsbecome valid for all of the vCenter Server instances. When a user logs in to vRealize Operations Manager, ifthe user selects all vCenter Server options during login, vRealize Operations Manager requires that theuser's credentials are valid for all of the vCenter Server instances. If a user account is only valid for a singlevCenter Server instance, that user can select the vCenter Server instance from the login drop-down menu tolog in to vRealize Operations Manager.
vCenter Server users who log in to vRealize Operations Manager must have one or more of the followingroles in vCenter Server:
n vRealize Operations Content Admin Role
n vRealize Operations General User Role 1
vRealize Operations Manager Customization and Administration Guide
12 VMware, Inc.
n vRealize Operations General User Role 2
n vRealize Operations General User Role 3
n vRealize Operations General User Role 4
n vRealize Operations Power User Role
n vRealize Operations Power User without Remediation Actions Role
n vRealize Operations Read Only Role
For more information about vCenter Server users, groups, and roles, see the vCenter Server documentation.
External User Sources in vRealize Operations ManagerYou can obtain user accounts from external sources so that you can use them in yourvRealize Operations Manager instance.
There are two types of external user identity sources:
n Lightweight Directory Access Protocol (LDAP): Use the LDAP source if you want to use the ActiveDirectory or LDAP servers as authentication sources. The LDAP source does not support multi-domains even when there is a two-way trust between Domain A and Domain B.
n Single Sign-On (SSO): Use a single sign-on source to perform single sign-on with any application thatsupports vCenter single sign-on, including vRealize Operations Manager. For example, you can install astandalone vCenter Platform Services Controller (PSC) and use it to communicate with an ActiveDirectory server. Use a PSC if the Active Directory has a setup that is too complex for the simple LDAPsource in vRealize Operations Manager, or if the LDAP source is experiencing slow performance. Ifyour PSC is configured to use Active Directory with integrated Windows authentication mode, SSOusers can log in using Windows authentication.
Roles and Privileges in vRealize Operations ManagervRealize Operations Manager provides several predefined roles to assign privileges to users. You can alsocreate your own roles.
You must have privileges to access specific features in the vRealize Operations Manager user interface. Theroles associated with your user account determine the features you can access and the actions you canperform.
Each predefined role includes a set of privileges for users to perform create, read, update, or delete actionson components such as dashboards, reports, administration, capacity, policies, problems, symptoms, alerts,user account management, and adapters.
Administrator Includes privileges to all features, objects, and actions invRealize Operations Manager.
ReadOnly Users have read-only access and can perform read operations, but cannotperform write actions such as create, update, or delete.
PowerUser Users have privileges to perform the actions of the Administrator role exceptfor privileges to user management and cluster management.vRealize Operations Manager maps vCenter Server users to this role.
PowerUserMinusRemediation
Users have privileges to perform the actions of the Administrator role exceptfor privileges to user management, cluster management, and remediationactions.
ContentAdmin Users can manage all content, including views, reports, dashboards, andcustom groups in vRealize Operations Manager
Chapter 1 Configuring Users and Groups in vRealize Operations Manager
VMware, Inc. 13
GeneralUser-1 throughGeneralUser-4
These predefined template roles are initially defined as ReadOnly roles.vCenter Server administrators can configure these roles to createcombinations of roles to give users multiple types of privileges. Roles aresynchronized to vCenter Server once during registration.
AgentManager Users can deploy and configure Endpoint Operations Management agents.
User Scenario: Manage User Access ControlAs a system administrator or virtual infrastructure administrator, you manage user access control invRealize Operations Manager so that you can ensure the security of your objects. Your company just hired anew person, and you must create a user account and assign a role to the account so that the new user haspermission to access specific content and objects in vRealize Operations Manager.
In this scenario you will learn how to create user accounts and roles, and assign roles to the user accounts tospecify access privileges to views and objects. You will then demonstrate the intended behavior of thepermissions on these accounts.
You will create a new user account, named Tom User, and a new role that grants administrative access toobjects in the vRealize Operations Clusters. You will apply the new role to the user account.
Finally, you will import a user account from an external LDAP user database that resides on anothermachine to vRealize Operations Manager, and assign a role to the imported user account to configure theuser's privileges.
Prerequisites
Verify that the following conditions are met:
n vRealize Operations Manager is installed and operating properly, and contains objects such as clusters,hosts, and virtual machines.
n One or more user groups are defined.
Procedure
1 Create a New Role on page 14You use roles to manage access control for user accounts in vRealize Operations Manager.
2 Create a User Account on page 15As an administrator you assign a unique user account to each user so that they can usevRealize Operations Manager. While you set up the user account, you assign the privileges thatdetermine what activities the user can perform in the environment, and upon what objects.
3 Import a User Account and Assign Permissions on page 16You can import user accounts from external sources, such as an LDAP database on another machine,or a single sign-on server, so that you can give permission to those users to access certain features andobjects in vRealize Operations Manager.
What to do next
Create a new role.
Create a New RoleYou use roles to manage access control for user accounts in vRealize Operations Manager.
In this procedure, you will add a new role and assign administrative permissions to the role.
vRealize Operations Manager Customization and Administration Guide
14 VMware, Inc.
Prerequisites
Verify that you understand the context of this scenario. See “User Scenario: Manage User Access Control,”on page 14.
Procedure
1 In vRealize Operations Manager, select Administration in the left pane and click Access Control.
2 Click the Roles tab.
3 Click the Add icon on the toolbar to create a new role.
The Create Role dialog box appears.
4 For the role name, type admin_cluster, then type a description and click OK.
The admin_cluster role appears in the list of roles.
5 Click the admin_cluster role.
6 In the Details grid below, on the Permissions pane, click the Edit icon.
The Assign Permissions to Role dialog box appears.
7 Select the Administrative Access - all permissions check box.
8 Click Update.
This action gives this role administrative access to all the features in the environment.
What to do next
Create a user account, and assign this role to the account.
Create a User AccountAs an administrator you assign a unique user account to each user so that they can usevRealize Operations Manager. While you set up the user account, you assign the privileges that determinewhat activities the user can perform in the environment, and upon what objects.
In this procedure, you will create a user account, assign the admin_cluster role to the account, and associatethe objects that the user can access while assigned this role. You will assign access to objects in the vRealizeOperations Cluster. Then, you will test the user account to confirm that the user can access only the specifiedobjects.
Prerequisites
Create a new role. See “Create a New Role,” on page 14.
Procedure
1 In vRealize Operations Manager, select Administration in the left pane and click Access Control.
2 Click the User Accounts tab.
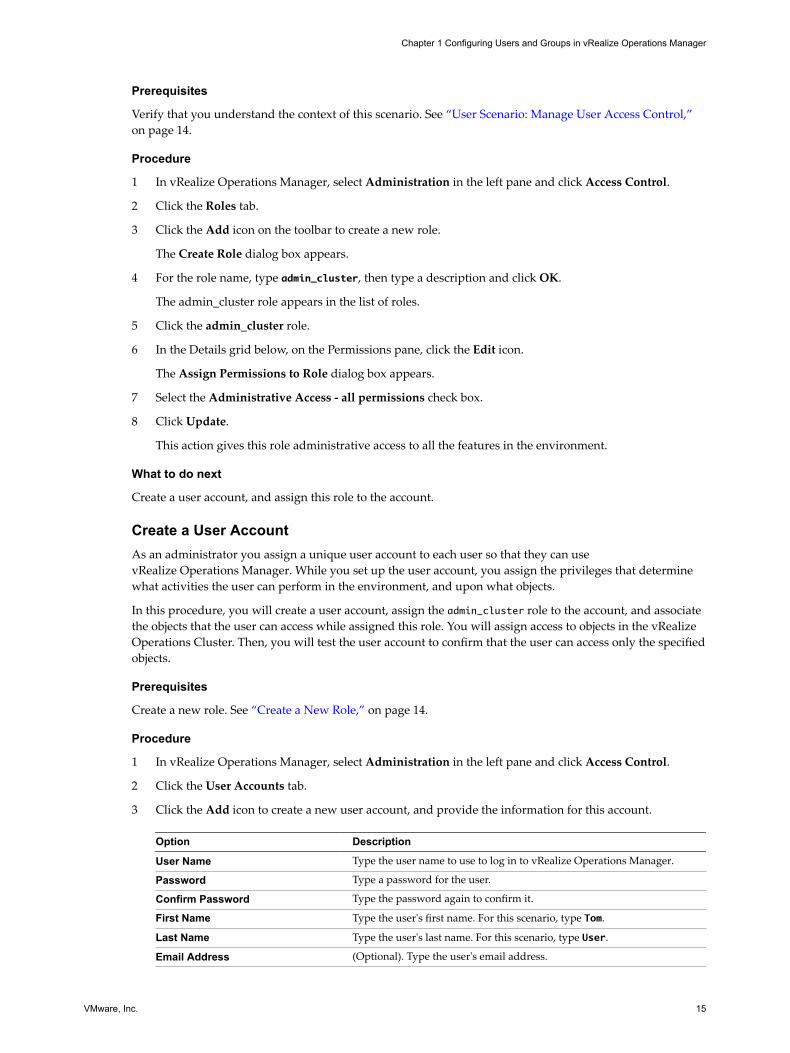
3 Click the Add icon to create a new user account, and provide the information for this account.
Option Description
User Name Type the user name to use to log in to vRealize Operations Manager.
Password Type a password for the user.
Confirm Password Type the password again to confirm it.
First Name Type the user's first name. For this scenario, type Tom.
Last Name Type the user's last name. For this scenario, type User.
Email Address (Optional). Type the user's email address.
Chapter 1 Configuring Users and Groups in vRealize Operations Manager
VMware, Inc. 15
Option Description
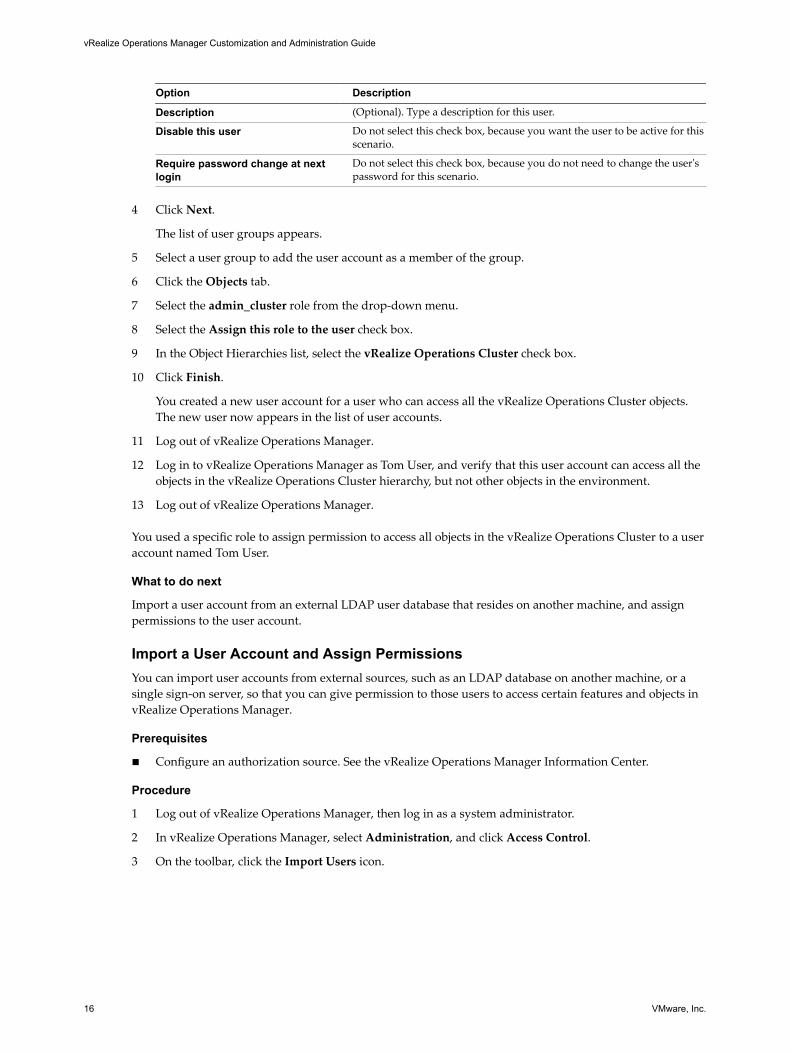
Description (Optional). Type a description for this user.
Disable this user Do not select this check box, because you want the user to be active for thisscenario.
Require password change at nextlogin
Do not select this check box, because you do not need to change the user'spassword for this scenario.
4 Click Next.
The list of user groups appears.
5 Select a user group to add the user account as a member of the group.
6 Click the Objects tab.
7 Select the admin_cluster role from the drop-down menu.
8 Select the Assign this role to the user check box.
9 In the Object Hierarchies list, select the vRealize Operations Cluster check box.
10 Click Finish.
You created a new user account for a user who can access all the vRealize Operations Cluster objects.The new user now appears in the list of user accounts.
11 Log out of vRealize Operations Manager.
12 Log in to vRealize Operations Manager as Tom User, and verify that this user account can access all theobjects in the vRealize Operations Cluster hierarchy, but not other objects in the environment.
13 Log out of vRealize Operations Manager.
You used a specific role to assign permission to access all objects in the vRealize Operations Cluster to a useraccount named Tom User.
What to do next
Import a user account from an external LDAP user database that resides on another machine, and assignpermissions to the user account.
Import a User Account and Assign PermissionsYou can import user accounts from external sources, such as an LDAP database on another machine, or asingle sign-on server, so that you can give permission to those users to access certain features and objects invRealize Operations Manager.
Prerequisites
n Configure an authorization source. See the vRealize Operations Manager Information Center.
Procedure
1 Log out of vRealize Operations Manager, then log in as a system administrator.
2 In vRealize Operations Manager, select Administration, and click Access Control.
3 On the toolbar, click the Import Users icon.
vRealize Operations Manager Customization and Administration Guide
16 VMware, Inc.
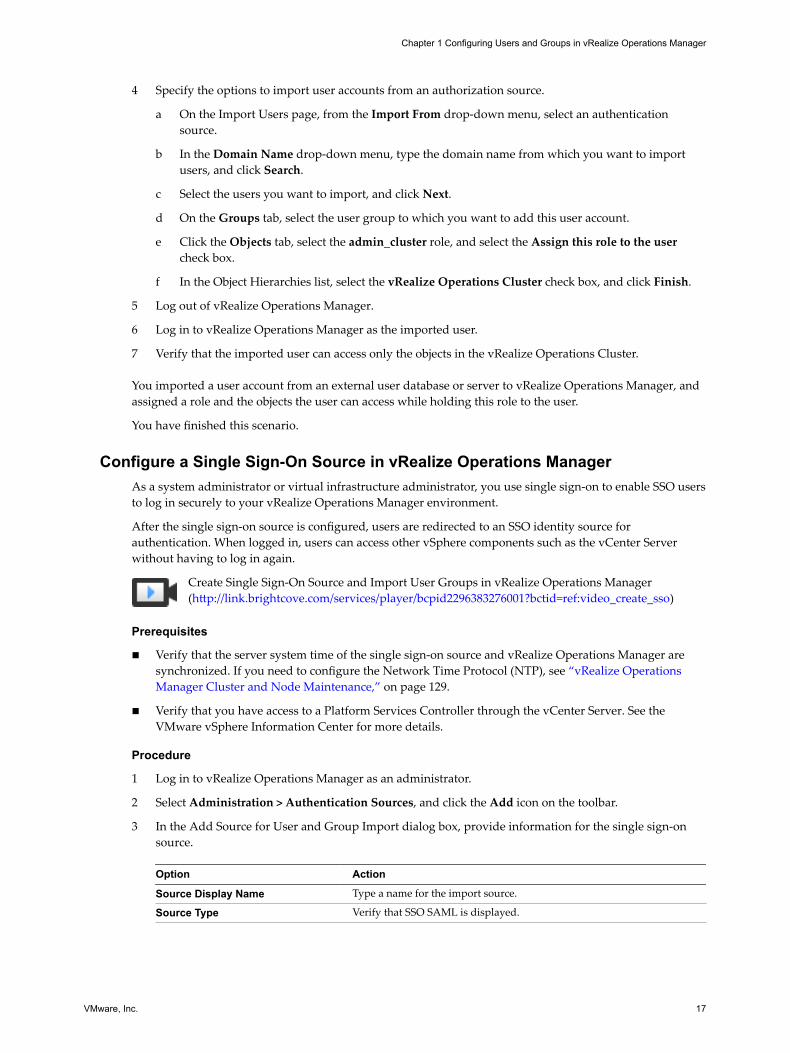
4 Specify the options to import user accounts from an authorization source.
a On the Import Users page, from the Import From drop-down menu, select an authenticationsource.
b In the Domain Name drop-down menu, type the domain name from which you want to importusers, and click Search.
c Select the users you want to import, and click Next.
d On the Groups tab, select the user group to which you want to add this user account.
e Click the Objects tab, select the admin_cluster role, and select the Assign this role to the usercheck box.
f In the Object Hierarchies list, select the vRealize Operations Cluster check box, and click Finish.
5 Log out of vRealize Operations Manager.
6 Log in to vRealize Operations Manager as the imported user.
7 Verify that the imported user can access only the objects in the vRealize Operations Cluster.
You imported a user account from an external user database or server to vRealize Operations Manager, andassigned a role and the objects the user can access while holding this role to the user.
You have finished this scenario.
Configure a Single Sign-On Source in vRealize Operations ManagerAs a system administrator or virtual infrastructure administrator, you use single sign-on to enable SSO usersto log in securely to your vRealize Operations Manager environment.
After the single sign-on source is configured, users are redirected to an SSO identity source forauthentication. When logged in, users can access other vSphere components such as the vCenter Serverwithout having to log in again.
Create Single Sign-On Source and Import User Groups in vRealize Operations Manager(http://link.brightcove.com/services/player/bcpid2296383276001?bctid=ref:video_create_sso)
Prerequisites
n Verify that the server system time of the single sign-on source and vRealize Operations Manager aresynchronized. If you need to configure the Network Time Protocol (NTP), see “vRealize OperationsManager Cluster and Node Maintenance,” on page 129.
n Verify that you have access to a Platform Services Controller through the vCenter Server. See theVMware vSphere Information Center for more details.
Procedure
1 Log in to vRealize Operations Manager as an administrator.
2 Select Administration > Authentication Sources, and click the Add icon on the toolbar.
3 In the Add Source for User and Group Import dialog box, provide information for the single sign-onsource.
Option Action
Source Display Name Type a name for the import source.
Source Type Verify that SSO SAML is displayed.
Chapter 1 Configuring Users and Groups in vRealize Operations Manager
VMware, Inc. 17
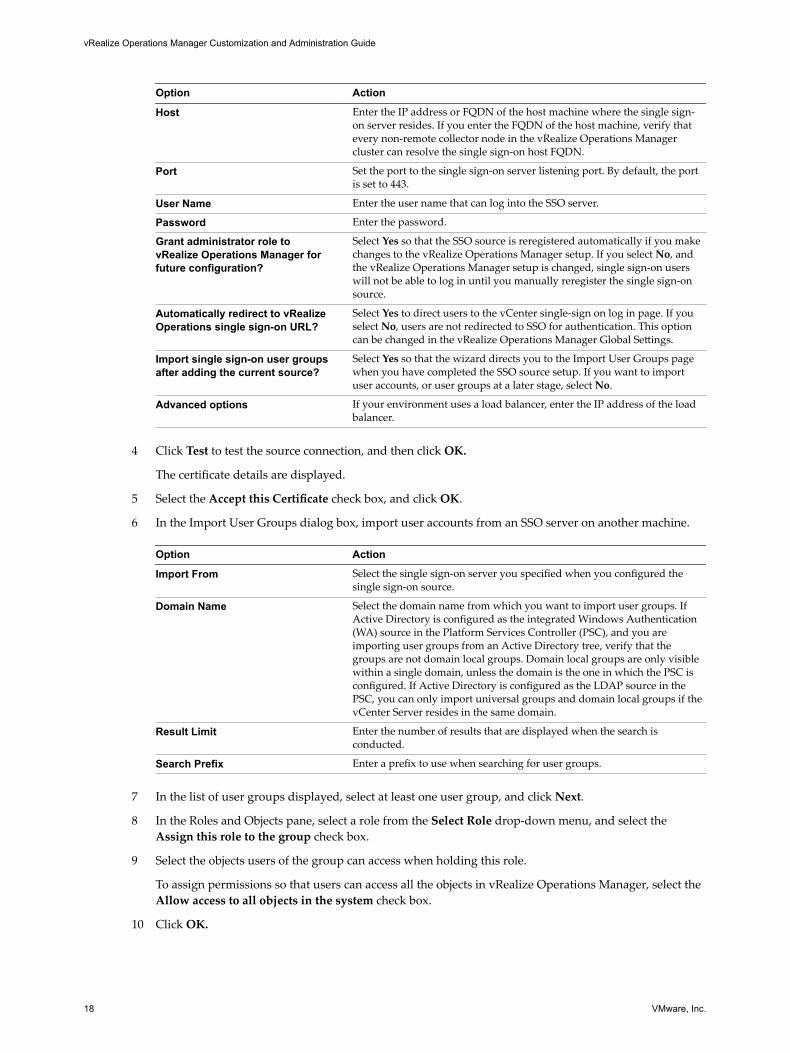
Option Action
Host Enter the IP address or FQDN of the host machine where the single sign-on server resides. If you enter the FQDN of the host machine, verify thatevery non-remote collector node in the vRealize Operations Managercluster can resolve the single sign-on host FQDN.
Port Set the port to the single sign-on server listening port. By default, the portis set to 443.
User Name Enter the user name that can log into the SSO server.
Password Enter the password.
Grant administrator role tovRealize Operations Manager forfuture configuration?
Select Yes so that the SSO source is reregistered automatically if you makechanges to the vRealize Operations Manager setup. If you select No, andthe vRealize Operations Manager setup is changed, single sign-on userswill not be able to log in until you manually reregister the single sign-onsource.
Automatically redirect to vRealizeOperations single sign-on URL?
Select Yes to direct users to the vCenter single-sign on log in page. If youselect No, users are not redirected to SSO for authentication. This optioncan be changed in the vRealize Operations Manager Global Settings.
Import single sign-on user groupsafter adding the current source?
Select Yes so that the wizard directs you to the Import User Groups pagewhen you have completed the SSO source setup. If you want to importuser accounts, or user groups at a later stage, select No.
Advanced options If your environment uses a load balancer, enter the IP address of the loadbalancer.
4 Click Test to test the source connection, and then click OK.
The certificate details are displayed.
5 Select the Accept this Certificate check box, and click OK.
6 In the Import User Groups dialog box, import user accounts from an SSO server on another machine.
Option Action
Import From Select the single sign-on server you specified when you configured thesingle sign-on source.
Domain Name Select the domain name from which you want to import user groups. IfActive Directory is configured as the integrated Windows Authentication(WA) source in the Platform Services Controller (PSC), and you areimporting user groups from an Active Directory tree, verify that thegroups are not domain local groups. Domain local groups are only visiblewithin a single domain, unless the domain is the one in which the PSC isconfigured. If Active Directory is configured as the LDAP source in thePSC, you can only import universal groups and domain local groups if thevCenter Server resides in the same domain.
Result Limit Enter the number of results that are displayed when the search isconducted.
Search Prefix Enter a prefix to use when searching for user groups.
7 In the list of user groups displayed, select at least one user group, and click Next.
8 In the Roles and Objects pane, select a role from the Select Role drop-down menu, and select theAssign this role to the group check box.
9 Select the objects users of the group can access when holding this role.
To assign permissions so that users can access all the objects in vRealize Operations Manager, select theAllow access to all objects in the system check box.
10 Click OK.
vRealize Operations Manager Customization and Administration Guide
18 VMware, Inc.
11 Familiarize yourself with single-sign on and confirm that you have configured the single sign-on sourcecorrectly.
a Log out of vRealize Operations Manager.
b Log in to the vSphere Web Client as one of the users in the user group you imported from thesingle sign-on server.
c In a new browser tab, enter the IP address of your vRealize Operations Manager environment.
d If the single sign-on server is configured correctly, you are logged in tovRealize Operations Manager without having to enter your user credentials.
Edit a Single Sign-On SourceEdit a single sign-on source if you need to change the administrator credentials used to manage the singlesign-on source, or if you have changed the host of the source.
When you configure an SSO source, you specify either the IP address or the FQDN of the host machinewhere the single sign-on server resides. If you want to configure a new host, that is, if the single sign-onserver resides on a different host machine than the one configured when the source was set up,vRealize Operations Manager removes the current SSO source, and creates a new source. In this case, youmust reimport the users you want to associate with the new SSO source.
If you want to change the way the current host is identified in vRealize Operations Manager, for example,change the IP address to the FQDN and the reverse, or update the IP address of the PSC if the IP address ofthe configured PSC has changed, vRealize Operations Manager updates the current SSO source, and you arenot required to reimport users.
Procedure
1 Log in to vRealize Operations Manager as an administrator.
2 Select Administration, and then select Authentication Sources.
3 Select the single sign-on source and click the Edit icon.
4 Make changes to the single sign-on source, and click OK.
If you are configuring a new host, the New Single Sign-On Source Detected dialog box appears.
5 Enter the administrator credentials that were used to set up the single sign-on source, and click OK.
The current SSO source is removed, and a new one created.
6 Click OK to accept the certificate.
7 Import the users you want to associate with the SSO source.
Chapter 1 Configuring Users and Groups in vRealize Operations Manager
VMware, Inc. 19
Audit Users and the Environment in vRealize Operations ManagerAt times you might need to provide documentation as evidence of the sequence of activities that took placein your vRealize Operations Manager environment. Auditing allows you to view the users, objects, andinformation that is collected. To meet audit requirements, such as for business critical applications thatcontain sensitive data that must be protected, you can generate reports on the activities of your users, theprivileges assigned to users to access objects, and the counts of objects and applications in yourenvironment.
Auditing reports provide traceability of the objects and users in your environment.
User Activity Audit Run this report to understand the scope of user activities, such as logging in,actions on clusters and nodes, changes to system passwords, activatingcertificates, and logging out.
User Permissions Audit Generate this report to understand the scope of user accounts and their roles,access groups, and access privileges.
System Audit Run this report to understand the scale of your environment. This reportdisplays the counts of configured and collecting objects, the types and countsof adapters, configured and collecting metrics, super metrics, applications,and existing virtual environment objects. This report can help you determinewhether the number of objects in your environment exceeds a supportedlimit.
System ComponentAudit
Run this report to display a version list of all the components in yourenvironment.
Reasons for Auditing Your EnvironmentAuditing in vRealize Operations Manager helps data center administrators in the following types ofsituations.
n You must track each configuration change to an authenticated user who initiated the change orscheduled the job that performed the change. For example, after an adapter changes an object, which isassociated with a specific object identifier at a specific time, the data center administrator can determinethe principal identifier of the authenticated user who initiated the change.
n You must track who made changes to your data center during a specific range of time, to determinewho changed what on a particular day. You can identify the principal identifiers of authenticated userswho were logged in to vRealize Operations Manager and running jobs, and determine who initiated thechange.
n You must determine which objects were affected by a particular user during a time specific range oftime.
n You must correlate events that occurred in your data center, and view these events overlayed so thatyou can visualize relationships and the cause of the events. Events can include login attempts, systemstartup and shutdown, application failures, watchdog restarts, configuration changes of applications,changes to security policy, requests, responses, and status of success.
n You must validate that the components installed in your environment are running the latest version.
vRealize Operations Manager Customization and Administration Guide
20 VMware, Inc.
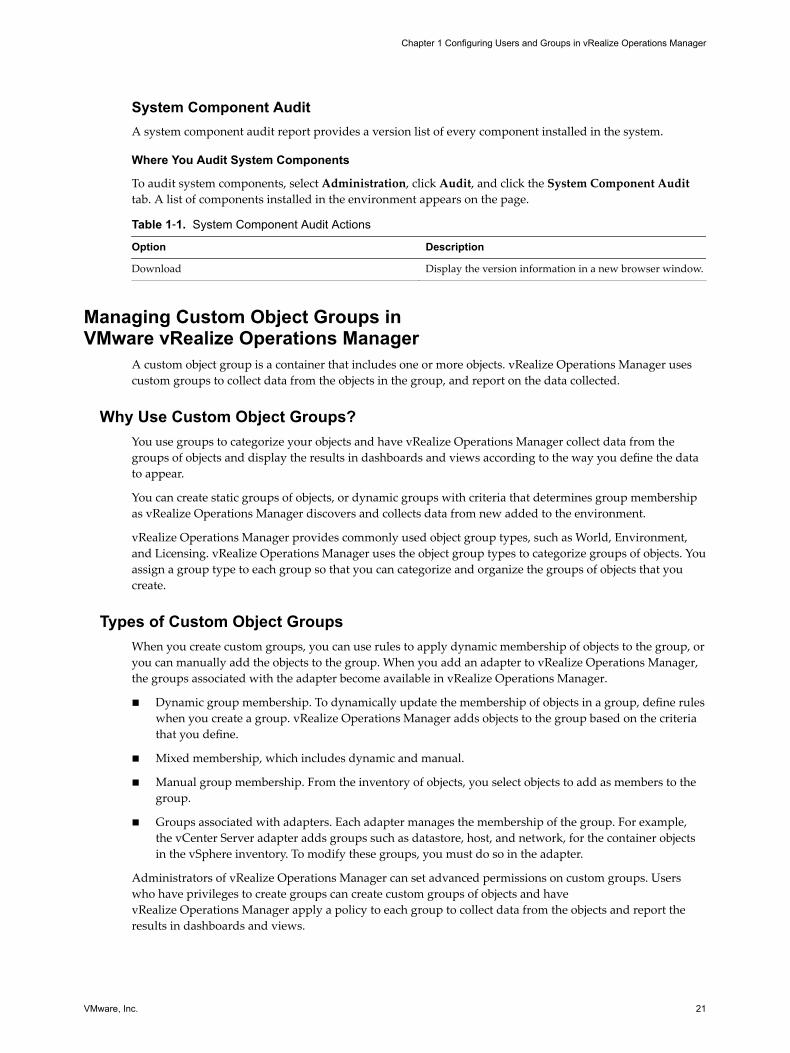
System Component AuditA system component audit report provides a version list of every component installed in the system.
Where You Audit System Components
To audit system components, select Administration, click Audit, and click the System Component Audittab. A list of components installed in the environment appears on the page.
Table 1‑1. System Component Audit Actions
Option Description
Download Display the version information in a new browser window.
Managing Custom Object Groups inVMware vRealize Operations Manager
A custom object group is a container that includes one or more objects. vRealize Operations Manager usescustom groups to collect data from the objects in the group, and report on the data collected.
Why Use Custom Object Groups?You use groups to categorize your objects and have vRealize Operations Manager collect data from thegroups of objects and display the results in dashboards and views according to the way you define the datato appear.
You can create static groups of objects, or dynamic groups with criteria that determines group membershipas vRealize Operations Manager discovers and collects data from new added to the environment.
vRealize Operations Manager provides commonly used object group types, such as World, Environment,and Licensing. vRealize Operations Manager uses the object group types to categorize groups of objects. Youassign a group type to each group so that you can categorize and organize the groups of objects that youcreate.
Types of Custom Object GroupsWhen you create custom groups, you can use rules to apply dynamic membership of objects to the group, oryou can manually add the objects to the group. When you add an adapter to vRealize Operations Manager,the groups associated with the adapter become available in vRealize Operations Manager.
n Dynamic group membership. To dynamically update the membership of objects in a group, define ruleswhen you create a group. vRealize Operations Manager adds objects to the group based on the criteriathat you define.
n Mixed membership, which includes dynamic and manual.
n Manual group membership. From the inventory of objects, you select objects to add as members to thegroup.
n Groups associated with adapters. Each adapter manages the membership of the group. For example,the vCenter Server adapter adds groups such as datastore, host, and network, for the container objectsin the vSphere inventory. To modify these groups, you must do so in the adapter.
Administrators of vRealize Operations Manager can set advanced permissions on custom groups. Userswho have privileges to create groups can create custom groups of objects and havevRealize Operations Manager apply a policy to each group to collect data from the objects and report theresults in dashboards and views.
Chapter 1 Configuring Users and Groups in vRealize Operations Manager
VMware, Inc. 21
When you create a custom group, and assign a policy to the group, vRealize Operations Manager can usethe criteria defined in the applied policy to collect data from and analyze the objects in the group.vRealize Operations Manager reports on the status, problems, and recommendations for those objects basedon the settings in the policy.
How Policies Help vRealize Operations Manager Report On Object GroupsvRealize Operations Manager analyzes the objects in the object group and reports on the workload, capacity,stress, anomalies, and faults of the object group, among other attributes.
When you apply a policy to an object group, vRealize Operations Manager uses threshold settings, metrics,super metrics, attributes, properties, alert definitions, and problem definitions that you enabled in the policyto collect data from the objects in the group, and report the results in dashboards and views.
When you create a new object group, you have the option to apply a policy to the group.
n To associate a policy with the custom object group, select the policy in the group creation wizard.
n To not associate a specific policy with the object group, leave the policy selection blank. The customobject group will be associated with the default policy. If the default policy changes, this object groupwill be associated with the new default policy.
vRealize Operations Manager applies policies in priority order, as they appear on the Active Policies tab.When you establish the priority for your policies, vRealize Operations Manager applies the configuredsettings in the policies according to the policy rank order to analyze and report on your objects. To changethe priority of a policy, you click and drag a policy row. The default policy is always kept at the bottom ofthe priority list, and the remaining list of active policies starts at priority 1, which indicates the highestpriority policy. When you assign an object to be a member of multiple object groups, and you assign adifferent policy to each object group, vRealize Operations Manager associates the highest ranking policywith that object.
User Scenario: Creating Custom Object GroupsAs a system administrator, you must monitor the capacity for your clusters, hosts, and virtual machines.vRealize Operations Manager must monitor them at different service levels to ensure that these objectsadhere to the policies established for your IT department, and discover and monitor new objects added tothe environment. You will have vRealize Operations Manager apply policies to the object groups to analyze,monitor, and report on the status of their capacity levels.
To have vRealize Operations Manager monitor the capacity levels for your objects to ensure that they adhereto your policies for your service levels, you will categorize your objects into Platinum, Gold, and Silverobject groups to support the service tiers established.
You will create a group type, and create dynamic object groups for each service level. You will definemembership criteria for each dynamic object group to have vRealize Operations Manager keep themembership of objects current. For each dynamic object group, you will assign the group type, and addcriteria to maintain membership of your objects in the group. To associate a policy with the custom objectgroup, you can select the policy in the group creation wizard.
Prerequisites
n Know the objects that exist in your environment, and the service levels that they support.
n Understand the policies required to monitor your objects.
n Verify that vRealize Operations Manager includes policies to monitor the capacity of your objects.
Procedure
1 To create a group type to identify service level monitoring, select Content and click Group Types.
vRealize Operations Manager Customization and Administration Guide
22 VMware, Inc.
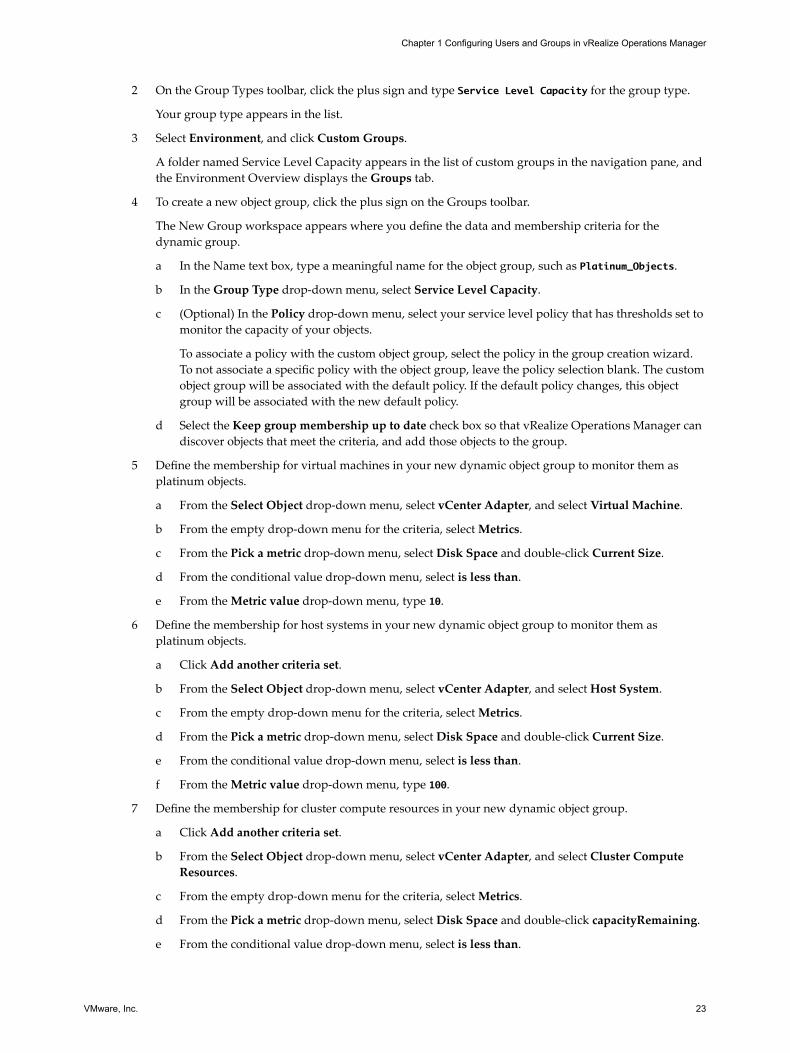
2 On the Group Types toolbar, click the plus sign and type Service Level Capacity for the group type.
Your group type appears in the list.
3 Select Environment, and click Custom Groups.
A folder named Service Level Capacity appears in the list of custom groups in the navigation pane, andthe Environment Overview displays the Groups tab.
4 To create a new object group, click the plus sign on the Groups toolbar.
The New Group workspace appears where you define the data and membership criteria for thedynamic group.
a In the Name text box, type a meaningful name for the object group, such as Platinum_Objects.
b In the Group Type drop-down menu, select Service Level Capacity.
c (Optional) In the Policy drop-down menu, select your service level policy that has thresholds set tomonitor the capacity of your objects.
To associate a policy with the custom object group, select the policy in the group creation wizard.To not associate a specific policy with the object group, leave the policy selection blank. The customobject group will be associated with the default policy. If the default policy changes, this objectgroup will be associated with the new default policy.
d Select the Keep group membership up to date check box so that vRealize Operations Manager candiscover objects that meet the criteria, and add those objects to the group.
5 Define the membership for virtual machines in your new dynamic object group to monitor them asplatinum objects.
a From the Select Object drop-down menu, select vCenter Adapter, and select Virtual Machine.
b From the empty drop-down menu for the criteria, select Metrics.
c From the Pick a metric drop-down menu, select Disk Space and double-click Current Size.
d From the conditional value drop-down menu, select is less than.
e From the Metric value drop-down menu, type 10.
6 Define the membership for host systems in your new dynamic object group to monitor them asplatinum objects.
a Click Add another criteria set.
b From the Select Object drop-down menu, select vCenter Adapter, and select Host System.
c From the empty drop-down menu for the criteria, select Metrics.
d From the Pick a metric drop-down menu, select Disk Space and double-click Current Size.
e From the conditional value drop-down menu, select is less than.
f From the Metric value drop-down menu, type 100.
7 Define the membership for cluster compute resources in your new dynamic object group.
a Click Add another criteria set.
b From the Select Object drop-down menu, select vCenter Adapter, and select Cluster ComputeResources.
c From the empty drop-down menu for the criteria, select Metrics.
d From the Pick a metric drop-down menu, select Disk Space and double-click capacityRemaining.
e From the conditional value drop-down menu, select is less than.
Chapter 1 Configuring Users and Groups in vRealize Operations Manager
VMware, Inc. 23
f From the Metric value drop-down menu, type 1000.
g Click Preview to determine whether objects already match this criteria.
8 Click OK to save your group.
When you save your new dynamic group, the group appears in the Service Level Capacity folder, andin the list of groups on the Groups tab.
9 Wait five minutes for vRealize Operations Manager to collect data from the objects in yourenvironment.
vRealize Operations Manager collects data from the cluster compute resources, host systems, and virtualmachines in your environment, according to the metrics that you defined in the group and the thresholdsdefined in the policy that is applied to the group, and displays the results about your objects in dashboardsand views.
What to do next
To monitor the capacity levels for your platinum objects, create a dashboard, and add widgets to thedashboard. See “Using Dashboards,” on page 27.
Managing Application GroupsAn application is a container construct that represents a collection of interdependent hardware and softwarecomponents that deliver a specific capability to support your business. vRealize Operations Managerbuildsan application to determine how your environment is affected when one or more components in anapplication experiences problems, and to monitor the overall health and performance of the application.Object membership in an application is not dynamic. To change the application, you manually modify theobjects in the container.
Reasons to Use ApplicationsvRealize Operations Manager collects data from components in the application and displays the results in asummary dashboard for each application with a real-time analysis for any or all of the components. If acomponent experiences problems, you can see where in the application the problems arise, and determinehow problems spread to other objects.
User Scenario: Adding an ApplicationAs the system administrator of an online training system, you must monitor components in the Web,application, and database tiers of your environment that can affect the performance of the system. You buildan application that groups related objects together in each tier. If a problem occurs with one of the objects, itis reflected in the application display and you can open a summary to investigate the source of the problemfurther.
In your application, you add the DB-related objects that store data for the training system in a tier, Web-related objects that run the user interface in a tier, and application-related objects that process the data forthe training system in a tier. The network tier might not be needed. Use this model to develop yourapplication.
Procedure
1 Click Environment in the left pane.
2 Click the Applications tab and click the plus sign.
3 Click Basic n-tier Web App and click OK.
The Application Management page that appears has two rows. Select objects from the bottom row topopulate the tiers in the top row.
vRealize Operations Manager Customization and Administration Guide
24 VMware, Inc.
4 Type a meaningful name such as Online Training Application in the Application text box.
5 For each of the Web, application, and database tiers listed, add the objects to the Tier Objects section.
a Select a tier name. This is the tier that you populate.
b To the left of the object row, select object tags to filter for objects that have that tag value. Click thetag name once to select the tag from the list and click the tag name again to deselect the tag fromthe list. If you select multiple tags, objects displayed depend on the values that you select.
You can also search for the object by name.
c To the right of the object row, select the objects to add to the tier.
d Drag the objects to the Tier Objects section.
6 Click Save to save the application.
The new application appears in the list of applications on the Environment Overview Applications page. Ifany of the components in any of the tiers develops a problem, the application displays a yellow or redstatus.
What to do next
To investigate the source of the problem, click the application name and evaluate the object summaryinformation. See the vRealize Operations Manager User Guide.
Chapter 1 Configuring Users and Groups in vRealize Operations Manager
VMware, Inc. 25

vRealize Operations Manager Customization and Administration Guide
26 VMware, Inc.
Customizing HowvRealize Operations ManagerDisplays Your Data 2
You format the content in vRealize Operations Manager to suit your information needs, using views,reports, dashboards and widgets.
Views display data, based on an object type. You can select from various view types to see your data from adifferent perspective. Views are reusable components that you can include in reports and dashboards.Reports can contain predefined or custom views and dashboards in a specified order. You build the reportsto represent objects and metrics in your environment. You can customize the report layout by adding acover page, a table of contents, and a footer. You can export the report in a PDF or CSV file format for furtherreference.
You use dashboards to monitor the performance and state of objects in your virtual infrastructure. Widgetsare the building blocks of dashboards and display data about configured attributes, resources, аpplications,or the overall processes in your environment. You can also incorporate views in dashboards using thevRealize Operations Manager View Widget.
This chapter includes the following topics:
n “Using Dashboards,” on page 27
n “Using Widgets,” on page 32
n “Using Views,” on page 36
n “Using Reports,” on page 40
Using DashboardsDashboards present a visual overview of the performance and state of objects in your virtual infrastructure.You use dashboards to determine the nature and timeframe of existing and potential issues with yourenvironment.
You start with several predefined dashboards in vRealize Operations Manager. You can create additionalones that meet your specific needs using widgets, views, badges, and filters to change the focus of theinformation. You can clone and edit the predefined dashboards or start from scratch. To display data thatshows dependencies, you can add widget interactions in dashboards. You can provide role-based access tovarious dashboards for better collaboration in teams.
Create Custom Dashboards (http://link.brightcove.com/services/player/bcpid2296383276001?bctid=ref:video_create_dashboards_vrom)
VMware, Inc. 27
User Scenario: Create and Configure Dashboards and WidgetsAs a virtual infrastructure administrator, you monitor your vCenter Server environment to detectproblematic resources. You must identify the problems and take action.
Prerequisites
Verify that you have the necessary access rights to perform this task. Your vRealize Operations Manageradministrator can tell you which actions you can perform.
You will create a dashboard to monitor the overview status of vCenter Server instance objects. You willcreate another dashboard to view detailed information about the objects. You will link the widgets on thetwo dashboards and create a way to link the widgets from one dashboard to the other.
Procedure
1 Create a Dashboard to View Object Status on page 28To view the status of all objects of a vRealize Operations Manager instance, create a dashboard.
2 Create a Detailed Object Status Dashboard on page 29To see the issues that might cause problems for an object in a vRealize Operations Manager instance,create a dashboard.
3 Configure Dashboard Navigation on page 30To link the widgets from one dashboard to another, you create dashboard navigations.
4 Work with Dashboard Navigations on page 31To verify that the dashboard navigation works as expected, you must test it.
Create a Dashboard to View Object StatusTo view the status of all objects of a vRealize Operations Manager instance, create a dashboard.
Each widget in a dashboard has a specific configuration. For more information about the widgets, see “Widget Definitions List,” on page 32.
Procedure
1 In the left pane of vRealize Operations Manager, click the Content icon and click Dashboards.
2 Click the Create Dashboard icon to create and configure a dashboard.
Option Description
Dashboard name Enter Environment Health.
Dashboard default Select whether this dashboard is the default for thisvRealize Operations Manager instance.
3 Click Widget List.
4 To locate the Environment Overview widget, use the Filter option in the widgets list.
5 Select the Environment Overview widget and drag it to the right panel.
The widget is added to the dashboard.
6 In the upper-right corner of the widget, click the pencil icon and configure the widget.
Option Action
Widget title Retain the default.
Refresh Content Select On. The widget refreshes its data depending on the refresh interval.
vRealize Operations Manager Customization and Administration Guide
28 VMware, Inc.
Option Action
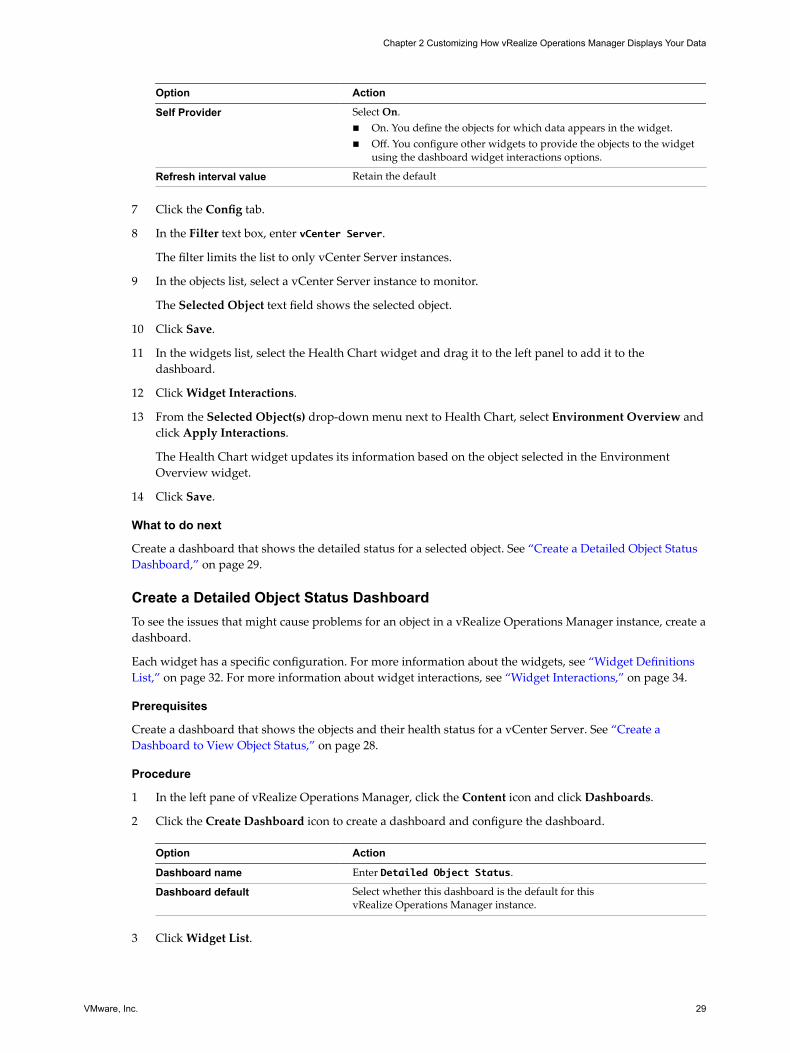
Self Provider Select On.n On. You define the objects for which data appears in the widget.n Off. You configure other widgets to provide the objects to the widget
using the dashboard widget interactions options.
Refresh interval value Retain the default
7 Click the Config tab.
8 In the Filter text box, enter vCenter Server.
The filter limits the list to only vCenter Server instances.
9 In the objects list, select a vCenter Server instance to monitor.
The Selected Object text field shows the selected object.
10 Click Save.
11 In the widgets list, select the Health Chart widget and drag it to the left panel to add it to thedashboard.
12 Click Widget Interactions.
13 From the Selected Object(s) drop-down menu next to Health Chart, select Environment Overview andclick Apply Interactions.
The Health Chart widget updates its information based on the object selected in the EnvironmentOverview widget.
14 Click Save.
What to do next
Create a dashboard that shows the detailed status for a selected object. See “Create a Detailed Object StatusDashboard,” on page 29.
Create a Detailed Object Status DashboardTo see the issues that might cause problems for an object in a vRealize Operations Manager instance, create adashboard.
Each widget has a specific configuration. For more information about the widgets, see “Widget DefinitionsList,” on page 32. For more information about widget interactions, see “Widget Interactions,” on page 34.
Prerequisites
Create a dashboard that shows the objects and their health status for a vCenter Server. See “Create aDashboard to View Object Status,” on page 28.
Procedure
1 In the left pane of vRealize Operations Manager, click the Content icon and click Dashboards.
2 Click the Create Dashboard icon to create a dashboard and configure the dashboard.
Option Action
Dashboard name Enter Detailed Object Status.
Dashboard default Select whether this dashboard is the default for thisvRealize Operations Manager instance.
3 Click Widget List.
Chapter 2 Customizing How vRealize Operations Manager Displays Your Data
VMware, Inc. 29
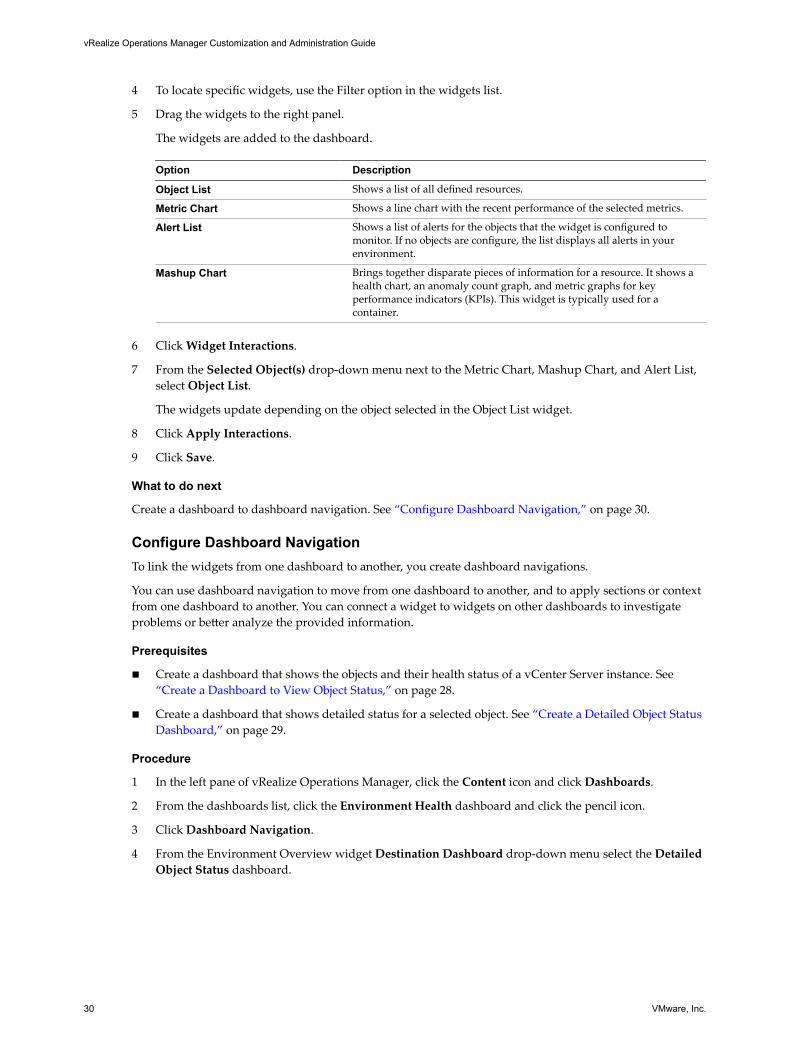
4 To locate specific widgets, use the Filter option in the widgets list.
5 Drag the widgets to the right panel.
The widgets are added to the dashboard.
Option Description
Object List Shows a list of all defined resources.
Metric Chart Shows a line chart with the recent performance of the selected metrics.
Alert List Shows a list of alerts for the objects that the widget is configured tomonitor. If no objects are configure, the list displays all alerts in yourenvironment.
Mashup Chart Brings together disparate pieces of information for a resource. It shows ahealth chart, an anomaly count graph, and metric graphs for keyperformance indicators (KPIs). This widget is typically used for acontainer.
6 Click Widget Interactions.
7 From the Selected Object(s) drop-down menu next to the Metric Chart, Mashup Chart, and Alert List,select Object List.
The widgets update depending on the object selected in the Object List widget.
8 Click Apply Interactions.
9 Click Save.
What to do next
Create a dashboard to dashboard navigation. See “Configure Dashboard Navigation,” on page 30.
Configure Dashboard NavigationTo link the widgets from one dashboard to another, you create dashboard navigations.
You can use dashboard navigation to move from one dashboard to another, and to apply sections or contextfrom one dashboard to another. You can connect a widget to widgets on other dashboards to investigateproblems or better analyze the provided information.
Prerequisites
n Create a dashboard that shows the objects and their health status of a vCenter Server instance. See “Create a Dashboard to View Object Status,” on page 28.
n Create a dashboard that shows detailed status for a selected object. See “Create a Detailed Object StatusDashboard,” on page 29.
Procedure
1 In the left pane of vRealize Operations Manager, click the Content icon and click Dashboards.
2 From the dashboards list, click the Environment Health dashboard and click the pencil icon.
3 Click Dashboard Navigation.
4 From the Environment Overview widget Destination Dashboard drop-down menu select the DetailedObject Status dashboard.
vRealize Operations Manager Customization and Administration Guide
30 VMware, Inc.
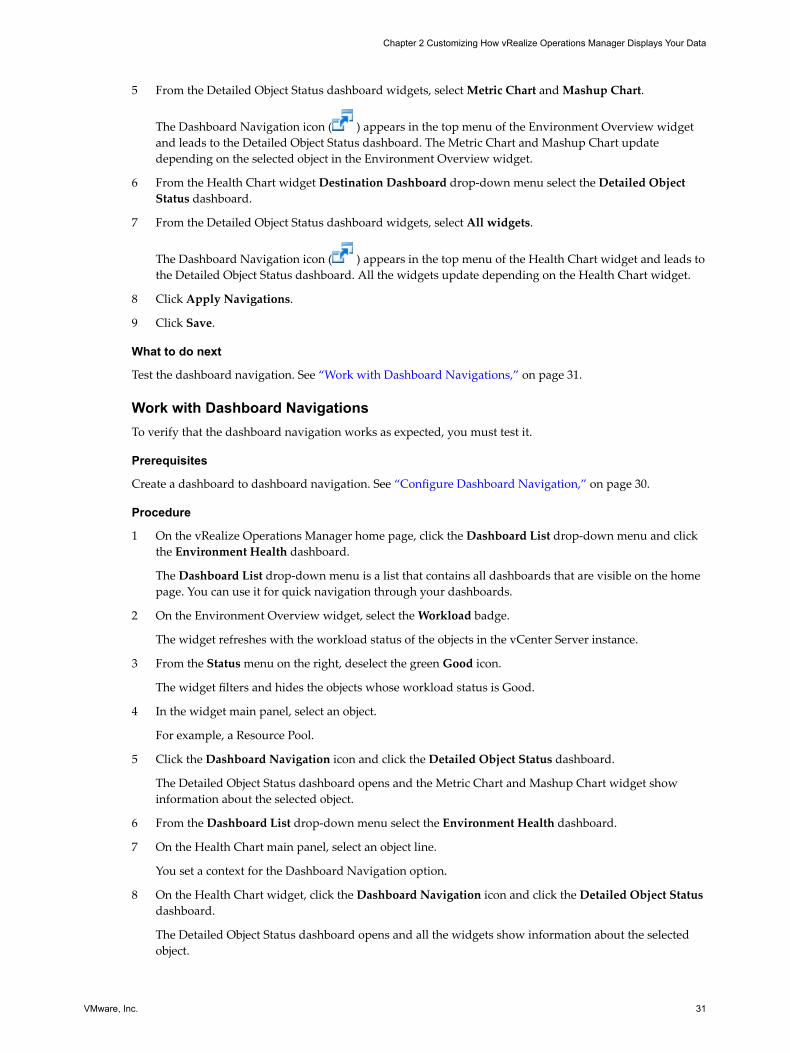
5 From the Detailed Object Status dashboard widgets, select Metric Chart and Mashup Chart.
The Dashboard Navigation icon ( ) appears in the top menu of the Environment Overview widgetand leads to the Detailed Object Status dashboard. The Metric Chart and Mashup Chart updatedepending on the selected object in the Environment Overview widget.
6 From the Health Chart widget Destination Dashboard drop-down menu select the Detailed ObjectStatus dashboard.
7 From the Detailed Object Status dashboard widgets, select All widgets.
The Dashboard Navigation icon ( ) appears in the top menu of the Health Chart widget and leads tothe Detailed Object Status dashboard. All the widgets update depending on the Health Chart widget.
8 Click Apply Navigations.
9 Click Save.
What to do next
Test the dashboard navigation. See “Work with Dashboard Navigations,” on page 31.
Work with Dashboard NavigationsTo verify that the dashboard navigation works as expected, you must test it.
Prerequisites
Create a dashboard to dashboard navigation. See “Configure Dashboard Navigation,” on page 30.
Procedure
1 On the vRealize Operations Manager home page, click the Dashboard List drop-down menu and clickthe Environment Health dashboard.
The Dashboard List drop-down menu is a list that contains all dashboards that are visible on the homepage. You can use it for quick navigation through your dashboards.
2 On the Environment Overview widget, select the Workload badge.
The widget refreshes with the workload status of the objects in the vCenter Server instance.
3 From the Status menu on the right, deselect the green Good icon.
The widget filters and hides the objects whose workload status is Good.
4 In the widget main panel, select an object.
For example, a Resource Pool.
5 Click the Dashboard Navigation icon and click the Detailed Object Status dashboard.
The Detailed Object Status dashboard opens and the Metric Chart and Mashup Chart widget showinformation about the selected object.
6 From the Dashboard List drop-down menu select the Environment Health dashboard.
7 On the Health Chart main panel, select an object line.
You set a context for the Dashboard Navigation option.
8 On the Health Chart widget, click the Dashboard Navigation icon and click the Detailed Object Statusdashboard.
The Detailed Object Status dashboard opens and all the widgets show information about the selectedobject.
Chapter 2 Customizing How vRealize Operations Manager Displays Your Data
VMware, Inc. 31
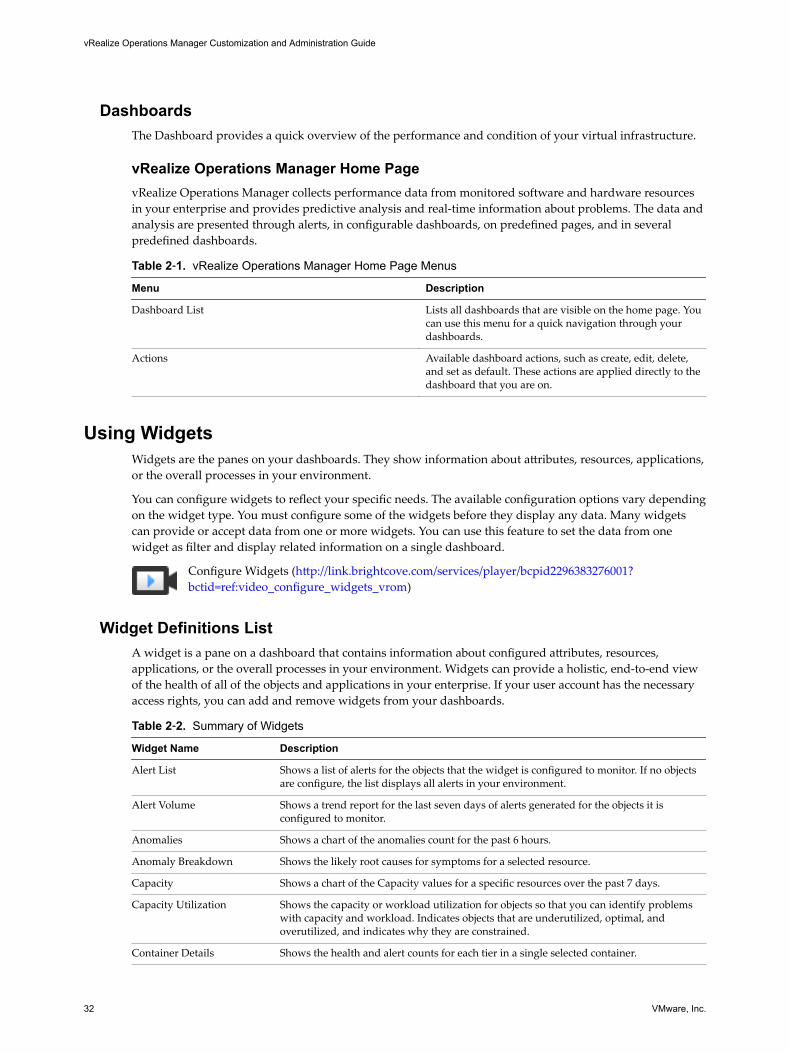
DashboardsThe Dashboard provides a quick overview of the performance and condition of your virtual infrastructure.
vRealize Operations Manager Home PagevRealize Operations Manager collects performance data from monitored software and hardware resourcesin your enterprise and provides predictive analysis and real-time information about problems. The data andanalysis are presented through alerts, in configurable dashboards, on predefined pages, and in severalpredefined dashboards.
Table 2‑1. vRealize Operations Manager Home Page Menus
Menu Description
Dashboard List Lists all dashboards that are visible on the home page. Youcan use this menu for a quick navigation through yourdashboards.
Actions Available dashboard actions, such as create, edit, delete,and set as default. These actions are applied directly to thedashboard that you are on.
Using WidgetsWidgets are the panes on your dashboards. They show information about attributes, resources, applications,or the overall processes in your environment.
You can configure widgets to reflect your specific needs. The available configuration options vary dependingon the widget type. You must configure some of the widgets before they display any data. Many widgetscan provide or accept data from one or more widgets. You can use this feature to set the data from onewidget as filter and display related information on a single dashboard.
Configure Widgets (http://link.brightcove.com/services/player/bcpid2296383276001?bctid=ref:video_configure_widgets_vrom)
Widget Definitions ListA widget is a pane on a dashboard that contains information about configured attributes, resources,applications, or the overall processes in your environment. Widgets can provide a holistic, end-to-end viewof the health of all of the objects and applications in your enterprise. If your user account has the necessaryaccess rights, you can add and remove widgets from your dashboards.
Table 2‑2. Summary of Widgets
Widget Name Description
Alert List Shows a list of alerts for the objects that the widget is configured to monitor. If no objectsare configure, the list displays all alerts in your environment.
Alert Volume Shows a trend report for the last seven days of alerts generated for the objects it isconfigured to monitor.
Anomalies Shows a chart of the anomalies count for the past 6 hours.
Anomaly Breakdown Shows the likely root causes for symptoms for a selected resource.
Capacity Shows a chart of the Capacity values for a specific resources over the past 7 days.
Capacity Utilization Shows the capacity or workload utilization for objects so that you can identify problemswith capacity and workload. Indicates objects that are underutilized, optimal, andoverutilized, and indicates why they are constrained.
Container Details Shows the health and alert counts for each tier in a single selected container.
vRealize Operations Manager Customization and Administration Guide
32 VMware, Inc.
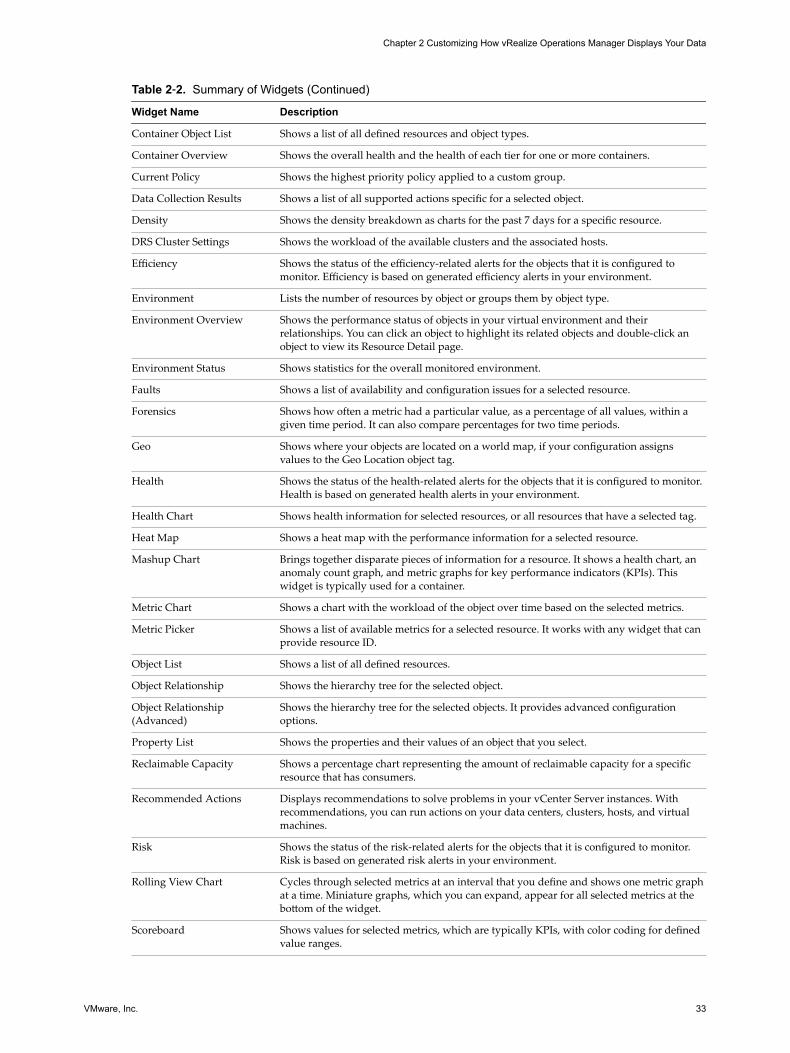
Table 2‑2. Summary of Widgets (Continued)
Widget Name Description
Container Object List Shows a list of all defined resources and object types.
Container Overview Shows the overall health and the health of each tier for one or more containers.
Current Policy Shows the highest priority policy applied to a custom group.
Data Collection Results Shows a list of all supported actions specific for a selected object.
Density Shows the density breakdown as charts for the past 7 days for a specific resource.
DRS Cluster Settings Shows the workload of the available clusters and the associated hosts.
Efficiency Shows the status of the efficiency-related alerts for the objects that it is configured tomonitor. Efficiency is based on generated efficiency alerts in your environment.
Environment Lists the number of resources by object or groups them by object type.
Environment Overview Shows the performance status of objects in your virtual environment and theirrelationships. You can click an object to highlight its related objects and double-click anobject to view its Resource Detail page.
Environment Status Shows statistics for the overall monitored environment.
Faults Shows a list of availability and configuration issues for a selected resource.
Forensics Shows how often a metric had a particular value, as a percentage of all values, within agiven time period. It can also compare percentages for two time periods.
Geo Shows where your objects are located on a world map, if your configuration assignsvalues to the Geo Location object tag.
Health Shows the status of the health-related alerts for the objects that it is configured to monitor.Health is based on generated health alerts in your environment.
Health Chart Shows health information for selected resources, or all resources that have a selected tag.
Heat Map Shows a heat map with the performance information for a selected resource.
Mashup Chart Brings together disparate pieces of information for a resource. It shows a health chart, ananomaly count graph, and metric graphs for key performance indicators (KPIs). Thiswidget is typically used for a container.
Metric Chart Shows a chart with the workload of the object over time based on the selected metrics.
Metric Picker Shows a list of available metrics for a selected resource. It works with any widget that canprovide resource ID.
Object List Shows a list of all defined resources.
Object Relationship Shows the hierarchy tree for the selected object.
Object Relationship(Advanced)
Shows the hierarchy tree for the selected objects. It provides advanced configurationoptions.
Property List Shows the properties and their values of an object that you select.
Reclaimable Capacity Shows a percentage chart representing the amount of reclaimable capacity for a specificresource that has consumers.
Recommended Actions Displays recommendations to solve problems in your vCenter Server instances. Withrecommendations, you can run actions on your data centers, clusters, hosts, and virtualmachines.
Risk Shows the status of the risk-related alerts for the objects that it is configured to monitor.Risk is based on generated risk alerts in your environment.
Rolling View Chart Cycles through selected metrics at an interval that you define and shows one metric graphat a time. Miniature graphs, which you can expand, appear for all selected metrics at thebottom of the widget.
Scoreboard Shows values for selected metrics, which are typically KPIs, with color coding for definedvalue ranges.
Chapter 2 Customizing How vRealize Operations Manager Displays Your Data
VMware, Inc. 33
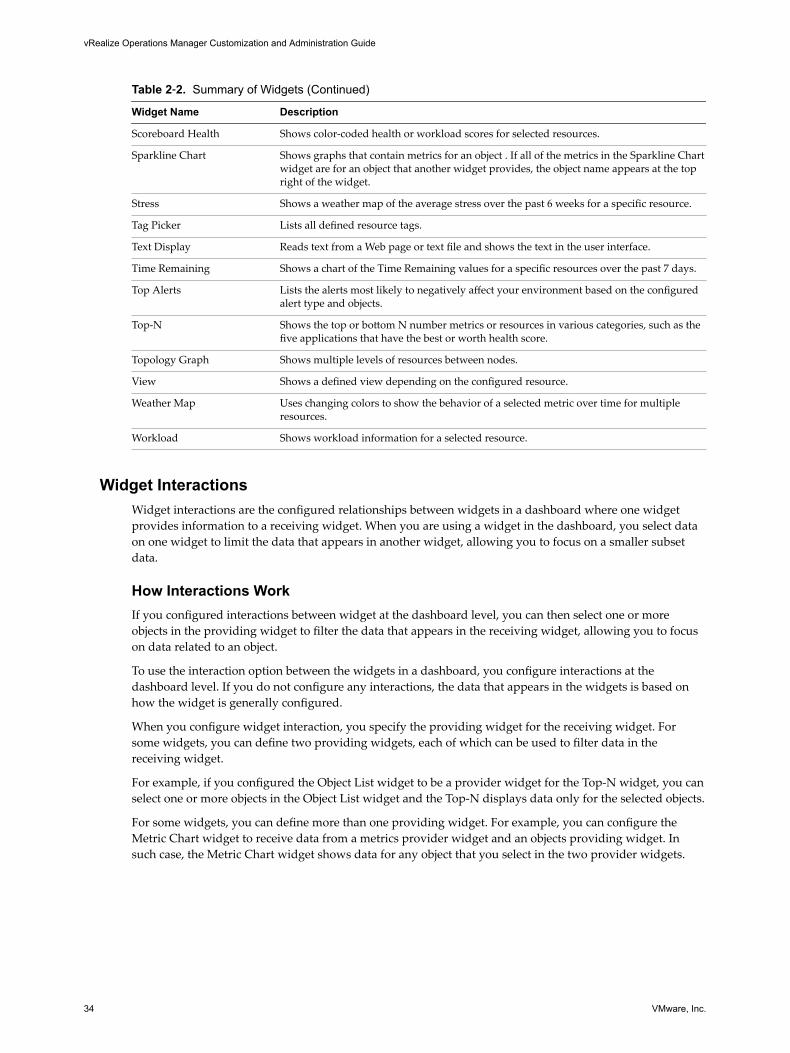
Table 2‑2. Summary of Widgets (Continued)
Widget Name Description
Scoreboard Health Shows color-coded health or workload scores for selected resources.
Sparkline Chart Shows graphs that contain metrics for an object . If all of the metrics in the Sparkline Chartwidget are for an object that another widget provides, the object name appears at the topright of the widget.
Stress Shows a weather map of the average stress over the past 6 weeks for a specific resource.
Tag Picker Lists all defined resource tags.
Text Display Reads text from a Web page or text file and shows the text in the user interface.
Time Remaining Shows a chart of the Time Remaining values for a specific resources over the past 7 days.
Top Alerts Lists the alerts most likely to negatively affect your environment based on the configuredalert type and objects.
Top-N Shows the top or bottom N number metrics or resources in various categories, such as thefive applications that have the best or worth health score.
Topology Graph Shows multiple levels of resources between nodes.
View Shows a defined view depending on the configured resource.
Weather Map Uses changing colors to show the behavior of a selected metric over time for multipleresources.
Workload Shows workload information for a selected resource.
Widget InteractionsWidget interactions are the configured relationships between widgets in a dashboard where one widgetprovides information to a receiving widget. When you are using a widget in the dashboard, you select dataon one widget to limit the data that appears in another widget, allowing you to focus on a smaller subsetdata.
How Interactions WorkIf you configured interactions between widget at the dashboard level, you can then select one or moreobjects in the providing widget to filter the data that appears in the receiving widget, allowing you to focuson data related to an object.
To use the interaction option between the widgets in a dashboard, you configure interactions at thedashboard level. If you do not configure any interactions, the data that appears in the widgets is based onhow the widget is generally configured.
When you configure widget interaction, you specify the providing widget for the receiving widget. Forsome widgets, you can define two providing widgets, each of which can be used to filter data in thereceiving widget.
For example, if you configured the Object List widget to be a provider widget for the Top-N widget, you canselect one or more objects in the Object List widget and the Top-N displays data only for the selected objects.
For some widgets, you can define more than one providing widget. For example, you can configure theMetric Chart widget to receive data from a metrics provider widget and an objects providing widget. Insuch case, the Metric Chart widget shows data for any object that you select in the two provider widgets.
vRealize Operations Manager Customization and Administration Guide
34 VMware, Inc.

Add a Resource Interaction XML FileA resource interaction file is a custom set of metrics that you want to display in widgets that support theoption. You can configure one or more files that define different sets of metrics for particular object types sothat the supported widgets are populated based the configured metrics and selected object type.
The following widgets support the resource interaction mode:
n Metric Chart
n Property List
n Rolling View Chart
n Scoreboard
n Sparkline Chart
n Topology Graph
To use the metric configuration, which displays a set of metrics that you defined in an XML file, thedashboard and widget configuration must meet the following criteria:
n The dashboard Widget Interaction options are configured so that another widget provides objects tothe target widget. For example, an Object List widget provides the object interaction to a chart widget.
n The widget Self Provider option is set to Off.
n The custom XML file in the Metric Configuration drop-down menu is in the following directory andhas been imported into the global storage using the import command.
n vApp or Linux. The XML file is in /usr/lib/vmware-vcops/tools/opscli.
n Windows. The XML file is in C:\vmware\vcenter-operations\vmware-vcops\tools\opscli.
If you add an XML file and later modify it, the changes might not take effect.
Prerequisites
n Verify that you have the necessary permissions to access the installed files forvRealize Operations Manager and add files.
n Create a new files based on the existing examples. Examples are available in the following location:
n vApp or Linux. The XML file is in /usr/lib/vmware-vcops/tomcat-web-app/webapps/vcops-web-ent/WEB-INF/classes/resources/reskndmetrics.
n Windows. The XML file is in C:\vmware\vcenter-operations\vmware-vcops\tomcat-web-app\webapps\vcops-web-ent\WEB-INF\classes\resources\reskndmetrics.
Procedure
1 Create an XML file that defines the set of metrics.
For example:
<?xml version="1.0" encoding="UTF-8" standalone="yes"?>
<AdapterKinds>
<AdapterKind adapterKindKey="VMWARE">
<ResourceKind resourceKindKey="HostSystem">
<Metric attrkey="sys:host/vim/vmvisor/slp|resourceMemOverhead_latest" />
<Metric attrkey="cpu|capacity_provisioned" />
<Metric attrkey="mem|host_contention" />
</ResourceKind>
</AdapterKind>
</AdapterKinds>
Chapter 2 Customizing How vRealize Operations Manager Displays Your Data
VMware, Inc. 35
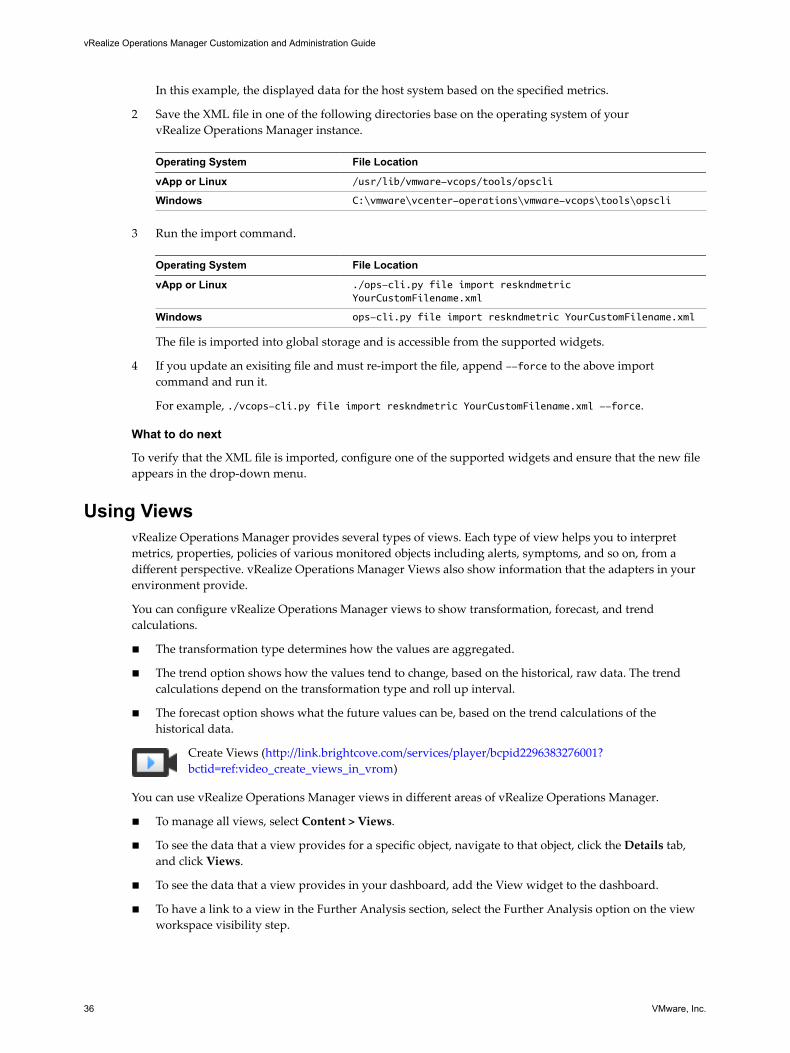
In this example, the displayed data for the host system based on the specified metrics.
2 Save the XML file in one of the following directories base on the operating system of yourvRealize Operations Manager instance.
Operating System File Location
vApp or Linux /usr/lib/vmware-vcops/tools/opscli
Windows C:\vmware\vcenter-operations\vmware-vcops\tools\opscli
3 Run the import command.
Operating System File Location
vApp or Linux ./ops-cli.py file import reskndmetricYourCustomFilename.xml
Windows ops-cli.py file import reskndmetric YourCustomFilename.xml The file is imported into global storage and is accessible from the supported widgets.
4 If you update an exisiting file and must re-import the file, append --force to the above importcommand and run it.
For example, ./vcops-cli.py file import reskndmetric YourCustomFilename.xml --force.
What to do next
To verify that the XML file is imported, configure one of the supported widgets and ensure that the new fileappears in the drop-down menu.
Using ViewsvRealize Operations Manager provides several types of views. Each type of view helps you to interpretmetrics, properties, policies of various monitored objects including alerts, symptoms, and so on, from adifferent perspective. vRealize Operations Manager Views also show information that the adapters in yourenvironment provide.
You can configure vRealize Operations Manager views to show transformation, forecast, and trendcalculations.
n The transformation type determines how the values are aggregated.
n The trend option shows how the values tend to change, based on the historical, raw data. The trendcalculations depend on the transformation type and roll up interval.
n The forecast option shows what the future values can be, based on the trend calculations of thehistorical data.
Create Views (http://link.brightcove.com/services/player/bcpid2296383276001?bctid=ref:video_create_views_in_vrom)
You can use vRealize Operations Manager views in different areas of vRealize Operations Manager.
n To manage all views, select Content > Views.
n To see the data that a view provides for a specific object, navigate to that object, click the Details tab,and click Views.
n To see the data that a view provides in your dashboard, add the View widget to the dashboard.
n To have a link to a view in the Further Analysis section, select the Further Analysis option on the viewworkspace visibility step.
vRealize Operations Manager Customization and Administration Guide
36 VMware, Inc.
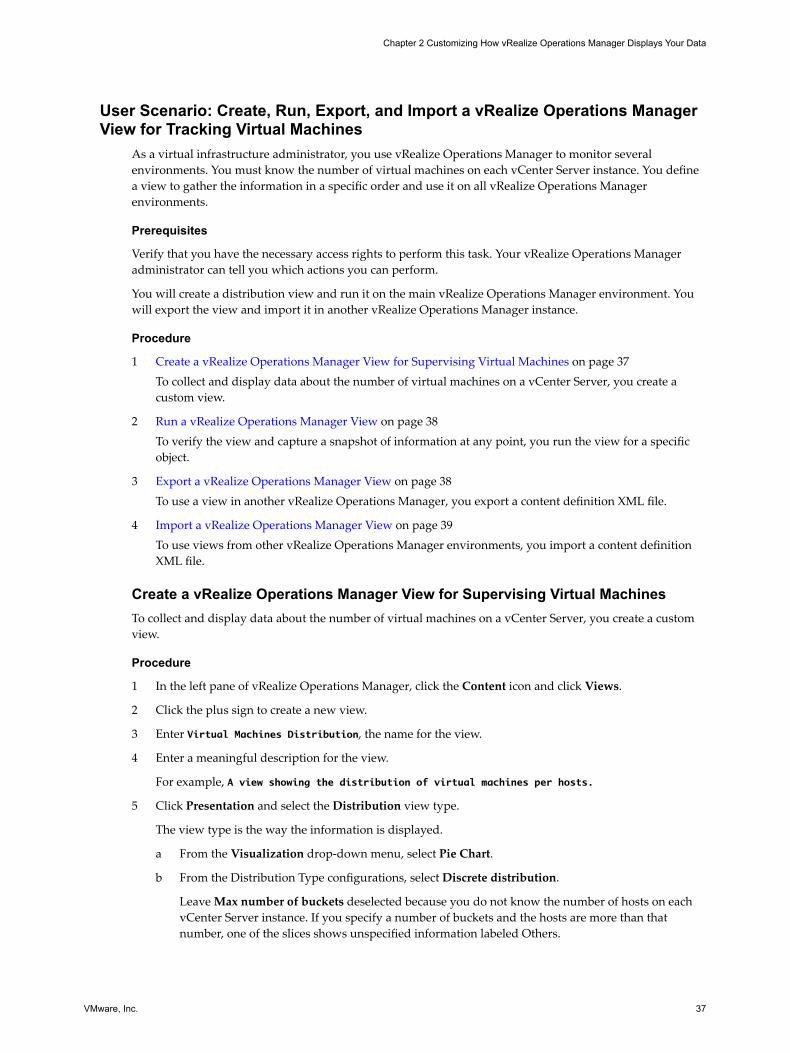
User Scenario: Create, Run, Export, and Import a vRealize Operations ManagerView for Tracking Virtual Machines
As a virtual infrastructure administrator, you use vRealize Operations Manager to monitor severalenvironments. You must know the number of virtual machines on each vCenter Server instance. You definea view to gather the information in a specific order and use it on all vRealize Operations Managerenvironments.
Prerequisites
Verify that you have the necessary access rights to perform this task. Your vRealize Operations Manageradministrator can tell you which actions you can perform.
You will create a distribution view and run it on the main vRealize Operations Manager environment. Youwill export the view and import it in another vRealize Operations Manager instance.
Procedure
1 Create a vRealize Operations Manager View for Supervising Virtual Machines on page 37To collect and display data about the number of virtual machines on a vCenter Server, you create acustom view.
2 Run a vRealize Operations Manager View on page 38To verify the view and capture a snapshot of information at any point, you run the view for a specificobject.
3 Export a vRealize Operations Manager View on page 38To use a view in another vRealize Operations Manager, you export a content definition XML file.
4 Import a vRealize Operations Manager View on page 39To use views from other vRealize Operations Manager environments, you import a content definitionXML file.
Create a vRealize Operations Manager View for Supervising Virtual MachinesTo collect and display data about the number of virtual machines on a vCenter Server, you create a customview.
Procedure
1 In the left pane of vRealize Operations Manager, click the Content icon and click Views.
2 Click the plus sign to create a new view.
3 Enter Virtual Machines Distribution, the name for the view.
4 Enter a meaningful description for the view.
For example, A view showing the distribution of virtual machines per hosts.
5 Click Presentation and select the Distribution view type.
The view type is the way the information is displayed.
a From the Visualization drop-down menu, select Pie Chart.
b From the Distribution Type configurations, select Discrete distribution.
Leave Max number of buckets deselected because you do not know the number of hosts on eachvCenter Server instance. If you specify a number of buckets and the hosts are more than thatnumber, one of the slices shows unspecified information labeled Others.
Chapter 2 Customizing How vRealize Operations Manager Displays Your Data
VMware, Inc. 37
6 Click Subjects to select the object type that applies to the view.
a From the drop-down menu, select Host System.
The Distribution view is visible at the object containers of the subjects that you specify during theview configuration.
7 Click Data and in the filter text box enter Total Number of VMs.
8 Select Summary > Total Number of VMs and double-click to add the metric.
9 Retain the default metric configurations and click Save.
Run a vRealize Operations Manager ViewTo verify the view and capture a snapshot of information at any point, you run the view for a specific object.
Prerequisites
Verify that you have the necessary access rights to perform this task. Your vRealize Operations Manageradministrator can tell you which actions you can perform.
Procedure
1 In the left pane of vRealize Operations Manager, click the Environment icon.
2 Navigate to a vCenter Server instance and click the Details tab.
All listed views are applicable for the vCenter Server instance.
3 From the All Filters drop-down menu on the left, select Type > Distribution.
You filter the views list to show only distribution type views.
4 Navigate to and click the Virtual Machines Distribution view.
The bottom pane shows the distribution view with information about this vCenter Server. Each slicerepresents a host and the numbers on the far left show the number of virtual machines.
Export a vRealize Operations Manager ViewTo use a view in another vRealize Operations Manager, you export a content definition XML file.
If the exported view contains custom created metrics, such as what-if, supermetrics, or custom adaptermetrics, you must recreate them in the new environment.
Prerequisites
Verify that you have the necessary access rights to perform this task. Your vRealize Operations Manageradministrator can tell you which actions you can perform.
Procedure
1 In the left pane of vRealize Operations Manager, click the Content icon and click Views.
2 In the list of views, navigate to and click the Virtual Machines Distribution view .
3 Select All Actions > Export view.
4 Select a location on your local system to save the XML file and click Save.
vRealize Operations Manager Customization and Administration Guide
38 VMware, Inc.
Import a vRealize Operations Manager ViewTo use views from other vRealize Operations Manager environments, you import a content definition XMLfile.
Prerequisites
Verify that you have the necessary access rights to perform this task. Your vRealize Operations Manageradministrator can tell you which actions you can perform.
Procedure
1 In the left pane of vRealize Operations Manager, click the Content icon and click Views.
2 Select All Actions > Import view.
3 Browse to select the Virtual Machines Distribution content definition XML file and click Import.
If the imported view contains custom created metrics, such as what-if, supermetrics, or custom adaptermetrics, you must recreate them in the new environment.
Note The imported view overwrites if a view with the same name exists. All report templates that usethe existing view are updated with the imported view.
Views and Reports OwnershipViews, reports, templates, or schedules owner might change in time.
The default owner of all predefined views and templates is System. If you edit them, you become the owner.If you want to keep the original predefined view or template, you have to clone it. After you clone it, youbecome the owner of the clone.
The last user who edited a view, template, or schedule is the owner. For example, if you create a view youare listed as its owner. If another user edits your view, that user becomes the owner listed in the Ownercolumn.
The user who imports the view or template is its owner, even if the view is initially created by someone else.For example, User 1 creates a template and exports it. User 2 imports it in back, the owner of the templatebecomes User 2.
The user who generated the report is its owner, regardless of who owns the template. If a report is generatedfrom a schedule, the user who created the schedule is the owner of the generated report. For example, ifUser 1 creates a template and User 2 creates a schedule for this template, the generated report owner is User2.
Editing, Cloning, and Deleting a ViewYou can edit, clone, and delete a view. Before you do, familiarize yourself with the consequences of theseactions.
When you edit a view, all changes are applied to the report templates that contain it.
When you clone a view, the changes that you make to the clone do not affect the source view.
When you delete a view, it is removed from all the report templates that contain it.
Chapter 2 Customizing How vRealize Operations Manager Displays Your Data
VMware, Inc. 39

Using ReportsA report is a scheduled snapshot of views and dashboards. You can create it to represent objects andmetrics. It can contain table of contents, cover page, and footer.
With the vRealize Operations Manager reporting functions, you can generate a report to capture detailsrelated to current or predicted resource needs. You can download the report in a PDF or CSV file format forfuture and offline needs.
Create Reports (http://link.brightcove.com/services/player/bcpid2296383276001?bctid=ref:video_reports_in_vrom)
User Scenario: Handling Reports to Monitor Virtual MachinesAs a virtual infrastructure administrator, you use vRealize Operations Manager to monitor severalenvironments. You must present to your team a report with your corporate logo for all oversized andstressed virtual machines, and their current and trend memory use. You use predefined report templates togather and format the information in a specific order.
You will create a report template with predefined views and dashboards. You will generate the report to testthe template and create a schedule for generating the report once every two weeks.
Prerequisites
Verify that you have the necessary access rights to perform this task. Your vRealize Operations Manageradministrator can tell you which actions you can perform.
Procedure
1 Create a Report Template for Monitoring Virtual Machines on page 40To monitor oversized and stressed virtual machines, and their memory use, you create a reporttemplate.
2 Generate a Report on page 42To generate a report, you use the Virtual Machines Report template for a vCenter Server system thatshows information for oversized and stressed virtual machines, and their memory use.
3 Download a Report on page 42To verify that the information appears as expected you download the generated report from theVirtual Machines Report template .
4 Schedule a Report on page 42To generate a report on a selected date, time, and recurrence you create a schedule for the VirtualMachines Report template. You set the email options to send the generated report to your team.
Create a Report Template for Monitoring Virtual MachinesTo monitor oversized and stressed virtual machines, and their memory use, you create a report template.
You create a report template with PDF and CSV output and add views, dashboards and layout options to it.
Prerequisites
n Understand the concept of vRealize Operations Manager views. See “Using Views,” on page 36.
n Know the location of your corporate logo.
Procedure
1 In the left pane of vRealize Operations Manager, click the Content icon and click Reports.
vRealize Operations Manager Customization and Administration Guide
40 VMware, Inc.
2 On the Report Templates tab, click the plus sign to create a template.
3 Enter Virtual Machines Report, the name for the template.
4 Enter a meaningful description for the template.
For example, A template for oversized and stressed virtual machines, and their memory use.
5 Click Views and Dashboards. On the Data type drop-down menu leave Views selected.
The currently configured views are available in the list below the Data type drop-down menu. Viewspresent collected information for an object in a certain way depending on the view type.
6 In the search box, enter Virtual Machine.
The list is now limited to views where the name contains Virtual Machine.
7 Double-click the views to add them to the template.
Option Description
Virtual Machine Rightsizing CPU,Memory, and Disk Space
Monitors oversized VMs
Virtual Machine Recommended CPUand Memory Size
Monitors stressed VMs
The views appear in the main panel of the workspace with a preview of sample data.
8 In the search box, enter VM.
The list is now limited to views where the name contains VM.
9 Navigate to VMs Memory Usage (%) Distribution view, and double-click the view to add it to thetemplate.
The view appears in the main panel of the workspace with a preview of sample data.
10 (Optional) In the main panel of the workspace, drag the views up and down to reorder them.
11 From the Data type drop-down menu, select Dashboards.
The currently configured dashboards appear in the list below the Data type drop-down menu.Dashboards give a visual overview of the performance and state of objects in your virtualinfrastructure.
12 Double-click vSphere VMs Memory, vSphere VMs CPU, and vSphere VMs Disk and Networkdashboards to add them to the template.
The dashboards appear in the main panel of the workspace.
13 Click Formats and leave the PDF and CSV check boxes selected.
14 Click Layout Options and select the Cover Page and Footer check boxes.
The corresponding panes appear in the main panel of the workspace.
15 In the Cover Page panel, click Browse and navigate to an image on your computer.
The default report size is 8.5 inches by 11 inches. The image is resized to fit the report front page.
The image uploads to a database. It is used for the cover page every time you generate a report fromthis template.
16 Click Save.
Your report template is saved and listed on the Report Templates tab of the Content management tab.
Chapter 2 Customizing How vRealize Operations Manager Displays Your Data
VMware, Inc. 41
What to do next
Generate and download the report to verify the output. See “Generate a Report,” on page 42
Generate a ReportTo generate a report, you use the Virtual Machines Report template for a vCenter Server system that showsinformation for oversized and stressed virtual machines, and their memory use.
Prerequisites
Create a report template. See “Create a Report Template for Monitoring Virtual Machines,” on page 40.
Procedure
1 In the left pane of vRealize Operations Manager, click the Environment icon.
2 Navigate to a vCenter Server system.
3 Click the Reports tab and click Report Templates.
The listed report templates are associated with the current object.
4 Navigate to the Virtual Machines Report template and click the Run Template icon.
The report is generated and listed on the Generated Reports tab.
What to do next
Download the generated report and verify the output. See “Download a Report,” on page 42.
Download a ReportTo verify that the information appears as expected you download the generated report from the VirtualMachines Report template .
Prerequisites
Generate a report from the Virtual Machines Report template. See “Generate a Report,” on page 42.
Procedure
1 In the left pane of vRealize Operations Manager, click the Environment icon.
2 Navigate to the object for which you want to download a report.
3 Click the Reports tab and click Generated Reports.
The listed reports are generated for the current object.
4 Click the PDF ( ) and CSV ( ) icon to save the report in the relevant file format.
vRealize Operations Manager saves the report file to the location you selected.
What to do next
Schedule a report generation and set the email options, so your team will receive the report. See “Schedule aReport,” on page 42.
Schedule a ReportTo generate a report on a selected date, time, and recurrence you create a schedule for the Virtual MachinesReport template. You set the email options to send the generated report to your team.
vRealize Operations Manager Customization and Administration Guide
42 VMware, Inc.
The date range for the generated report is based on the time when vRealize Operations Manager generatesthe report and not on the time when you schedule the report or when vRealize Operations Manager placesthe report in the queue.
Prerequisites
n Download the generated report to verify the output. See “Download a Report,” on page 42.
n To enable sending email reports, you must have configured Outbound Alert Settings.
Procedure
1 In the left pane of vRealize Operations Manager, click the Environment icon.
2 Navigate to the object vCenter Server .
3 Click the Reports tab and click Report Templates.
4 Select the Virtual Machines Report template from the list.
5Click the gear icon ( ) and select Schedule report.
6 Select the time zone, date, and hour to start the report generation.
vRealize Operations Manager generates the scheduled reports in sequential order. Generating a reportcan take several hours. This process might delay the start time of a report when the previous reporttakes an extended period of time.
7 From the Recurrence drop-down menu, select Weekly and set the report generation for every twoweeks on Monday.
8 Select the Email report check box to send an email with the generated report.
a In the Email addresses text box, enter the email addresses that must receive the report.
b Select an outbound rule.
An email is sent according to this schedule every time a report is generated.
9 Click Ok.
What to do next
You can edit, clone, and delete report templates. Before you do, familiarize yourself with the consequencesof these actions.
When you edit a report template and delete it, all reports generated from the original and the editedtemplates are deleted. When you clone a report template, the changes that you make to the clone do notaffect the source template. When you delete a report template, all generated reports are also deleted.
Chapter 2 Customizing How vRealize Operations Manager Displays Your Data
VMware, Inc. 43

vRealize Operations Manager Customization and Administration Guide
44 VMware, Inc.
Customizing HowvRealize Operations ManagerMonitors Your Environment 3
Configure the resources that determine the behavior of the objects in your vRealize Operations Managerenvironment.
Use alert and symptom definitions with actionable recommendations to generate alerts that keep you awareof problems that occur on your objects. Use and customize operational policies to determine howvRealize Operations Manager analyzes your objects and displays information about them, so that you arenotified when problems occur on those objects. Use super metrics, which combine metrics into formulas, tocollect combinations of data from your objects.
To identify objects and adapter types, customize icons. Add objects, and metadata about them, to managethose objects when an adapter instance does not support the discovery of a particular object type. Configurethe global settings, which apply to all users, such as data retention and system timeout.
This chapter includes the following topics:
n “Defining Alerts in vRealize Operations Manager,” on page 45
n “Defining Compliance Standards,” on page 72
n “Operational Policies,” on page 80
n “Managing and Administering Policies for vRealize Operations Manager,” on page 81
n “Super Metrics in vRealize Operations Manager,” on page 103
n “Customizing Icons,” on page 110
n “Managing Objects in Your Environment,” on page 111
n “Configuring Object Relationships,” on page 115
n “Customizing How Endpoint Operations Management Monitors Operating Systems,” on page 116
n “Modifying Global Settings,” on page 126
Defining Alerts in vRealize Operations ManagerAn alert definition comprises one or more symptom definitions, and the alert definition is associated with aset of recommendations and actions that help you resolve the problem. Alert definitions include triggeringsymptom definitions and actionable recommendations. You create the alert definitions so that the generatedalerts tell you about problems in the monitored environment. You can then respond to the alerts witheffective solutions that are provided in the recommendations.
Predefined alerts are provided in vRealize Operations Manager as part of your configured adapters. You canadd or modify alert definitions to reflect the needs of your environment.
VMware, Inc. 45
Create Alert Definitions for vRealize Operations Manager(http://link.brightcove.com/services/player/bcpid2296383276001?bctid=ref:video_create_alerts_vrom)
Symptoms in Alert DefinitionsSymptom definitions evaluate conditions in your environment that, if the conditions become true, trigger asymptom and can result in a generated alert. You can add symptom definitions that are based on metrics orsuper metrics, properties, message events, fault events, or metric events. You can create a symptomdefinition as you create an alert definition or as an individual item in the appropriate symptom definitionlist.
When you add a symptom definition to an alert definition, it becomes a part of a symptom set. A symptomset is the combination of the defined symptom with the argument that determines when the symptomcondition becomes true.
A symptom set combines one or more symptom definitions by applying an Any or All condition, and allowsyou to choose the presence or absence of a particular symptom. If the symptom set pertains to relatedobjects rather than to Self, you can apply a population clause to identify a percentage or a specific count ofrelated objects that exhibit the included symptom definitions.
An alert definition comprises one or more symptom sets. If an alert definition requires all of the symptomsets to be triggered before generating an alert, and only one symptom set is triggered, an alert is notgenerated. If the alert definition requires only one of several symptom sets to be triggered, then the alert isgenerated even though the other symptom sets were not triggered.
Recommendations in Alert DefinitionsRecommendations are the remediation options that you provide to your users to resolve the problems thatthe generated alert indicates.
When you add an alert definition that indicates a problem with objects in your monitored environment, adda relevant recommendation. Recommendations can be instructions to your users, links to other informationor instruction sources, or vRealize Operations Manager actions that run on the target systems.
Modifying Alert DefinitionsIf you modify the alert impact type of an alert definition, any alerts that are already generated will have theprevious impact level. Any new alerts will be at the new impact level. If you want to reset all the generatedalerts to the new level, cancel the old alerts. If they are generated after cancellation, they will have the newimpact level.
Object Relationship Hierarchies for Alert DefinitionsObject relationship hierarchies determine how one object is related to another. When you create alertdefinitions, you select the relationship to identify the symptom object with respect to the base object. Theserelationships, for example, ancestor or descendant, produce results based on how the objects are placed inthe relationship hierarchy.
vCenter Server Relationship HierarchiesDepending on the configuration of your vCenter Server instances, objects have the following possiblehierarchies, from higher to lower objects:
n Datacenter, Host, Virtual Machine, Datastore
n Datacenter, Cluster, Host, Virtual Machine, Datastore
n Datacenter, Host, Datastore
vRealize Operations Manager Customization and Administration Guide
46 VMware, Inc.
n Datacenter, Cluster, Host, Datastore
Alert Definition Best PracticesAs you create alert definitions for your environment, apply consistent best practices so that you optimizealert behavior for your monitored objects.
Alert Definitions Naming and DescriptionThe alert definition name is the short name that appears in the following places:
n In data grids when alerts are generated
n In outbound alert notifications, including the email notifications that are sent when outbound alerts andnotifications are configured in your environment
Ensure that you provide an informative name that clearly states the reported problem. Your users canevaluate alerts based on the alert definition name.
The alert definition description is the text that appears in the alert definition details and the outbound alerts.Ensure that you provide a useful description that helps your users understand the problem that generatedthe alert.
Wait and Cancel CycleThe wait cycle setting helps you adjust for sensitivity in your environment. The wait cycle for the alertdefinition goes into effect after the wait cycle for the symptom definition results in a triggered symptom. Inmost alert definitions you configure the sensitivity at the symptom level and configure the wait cycle of alertdefinition to 1. This configuration ensures that the alert is immediately generated after all of the symptomsare triggered at the desired symptom sensitivity level.
The cancel cycle setting helps you adjust for sensitivity in your environment. The cancel cycle for the alertdefinition goes into affect after the cancel cycle for the symptom definition results in a cancelled symptom.In most definitions you configure the sensitivity at the symptom level and configure the cancel cycle of alertdefinition to 1. This configuration ensures that the alert is immediately cancelled after all of the symptomsconditions disappear after the desired symptom cancel cycle.
Create Alert Definitions to Generate the Fewest AlertsYou can control the size of your alert list and make it easier to manage. When an alert is about a generalproblem that can be triggered on a large number of objects, configure its definition so that the alert isgenerated on a higher level object in the hierarchy rather than on individual objects.
As you add symptoms to your alert definition, do not overcrowd a single alert definition with secondarysymptoms. Keep the combination of symptoms as simple and straightforward as possible.
You can also use a series of symptom definitions to describe incremental levels of concern. For example,Volume nearing capacity limit might have a severity value of Warning while Volume reached capacitylimit might have a severity level of Critical. The first symptom is not an immediate threat, but the secondone is an immediate threat. You can then include the Warning and Critical symptom definitions in a singlealert definition with an Any condition and set the alert criticality to be Symptom Based. These settings causethe alert to be generated with the right criticality if either of the symptoms is triggered.
Avoid Overlapping and Gaps Between AlertsOverlaps result in two or more alerts being generated for the same underlying condition. Gaps occur whenan unresolved alert with lower severity is canceled, but a related alert with a higher severity cannot betriggered.
Chapter 3 Customizing How vRealize Operations Manager Monitors Your Environment
VMware, Inc. 47
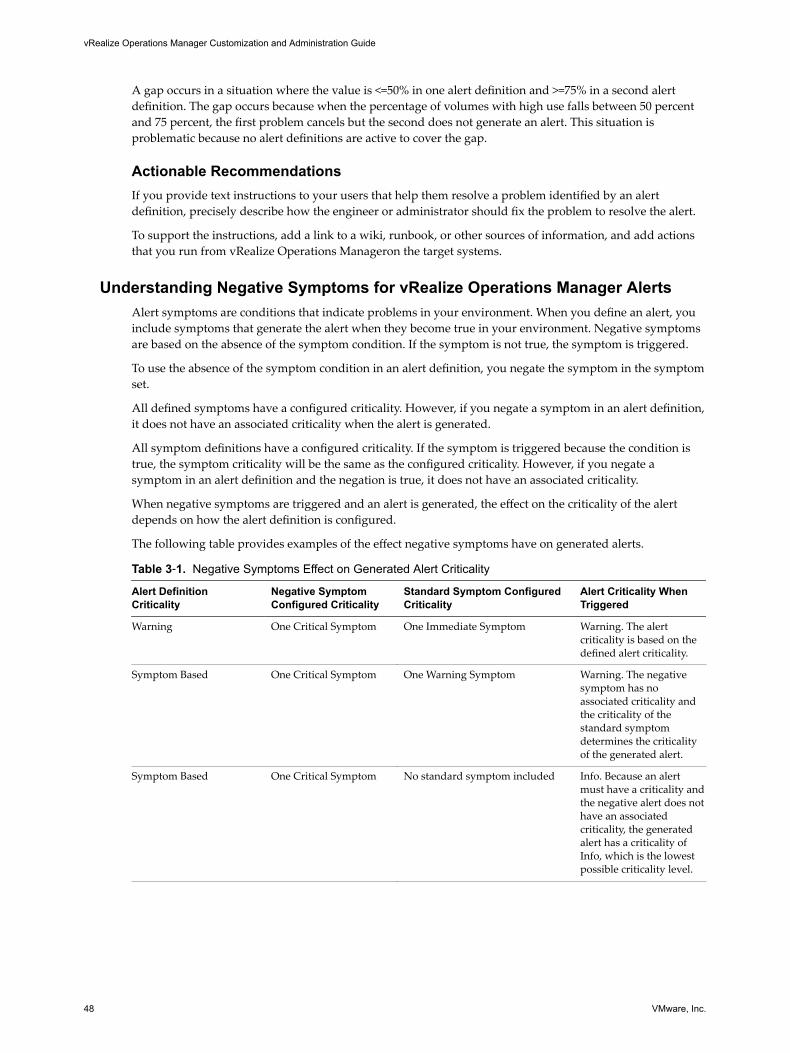
A gap occurs in a situation where the value is <=50% in one alert definition and >=75% in a second alertdefinition. The gap occurs because when the percentage of volumes with high use falls between 50 percentand 75 percent, the first problem cancels but the second does not generate an alert. This situation isproblematic because no alert definitions are active to cover the gap.
Actionable RecommendationsIf you provide text instructions to your users that help them resolve a problem identified by an alertdefinition, precisely describe how the engineer or administrator should fix the problem to resolve the alert.
To support the instructions, add a link to a wiki, runbook, or other sources of information, and add actionsthat you run from vRealize Operations Manageron the target systems.
Understanding Negative Symptoms for vRealize Operations Manager AlertsAlert symptoms are conditions that indicate problems in your environment. When you define an alert, youinclude symptoms that generate the alert when they become true in your environment. Negative symptomsare based on the absence of the symptom condition. If the symptom is not true, the symptom is triggered.
To use the absence of the symptom condition in an alert definition, you negate the symptom in the symptomset.
All defined symptoms have a configured criticality. However, if you negate a symptom in an alert definition,it does not have an associated criticality when the alert is generated.
All symptom definitions have a configured criticality. If the symptom is triggered because the condition istrue, the symptom criticality will be the same as the configured criticality. However, if you negate asymptom in an alert definition and the negation is true, it does not have an associated criticality.
When negative symptoms are triggered and an alert is generated, the effect on the criticality of the alertdepends on how the alert definition is configured.
The following table provides examples of the effect negative symptoms have on generated alerts.
Table 3‑1. Negative Symptoms Effect on Generated Alert Criticality
Alert DefinitionCriticality
Negative SymptomConfigured Criticality
Standard Symptom ConfiguredCriticality
Alert Criticality WhenTriggered
Warning One Critical Symptom One Immediate Symptom Warning. The alertcriticality is based on thedefined alert criticality.
Symptom Based One Critical Symptom One Warning Symptom Warning. The negativesymptom has noassociated criticality andthe criticality of thestandard symptomdetermines the criticalityof the generated alert.
Symptom Based One Critical Symptom No standard symptom included Info. Because an alertmust have a criticality andthe negative alert does nothave an associatedcriticality, the generatedalert has a criticality ofInfo, which is the lowestpossible criticality level.
vRealize Operations Manager Customization and Administration Guide
48 VMware, Inc.
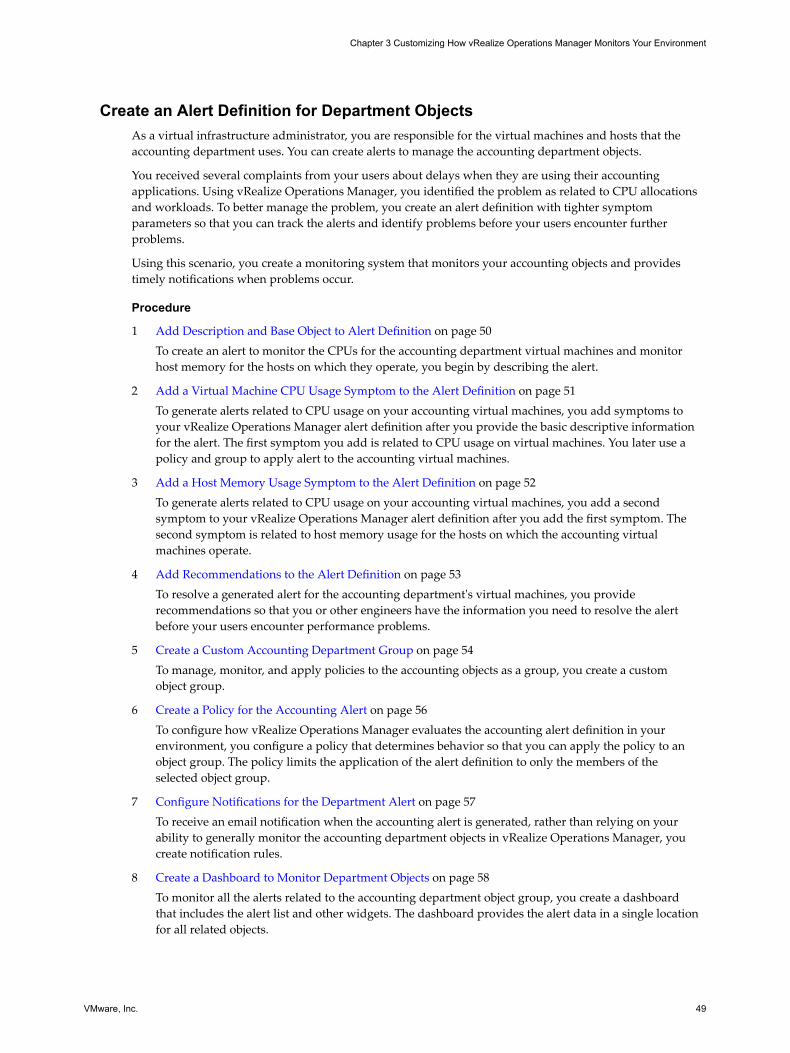
Create an Alert Definition for Department ObjectsAs a virtual infrastructure administrator, you are responsible for the virtual machines and hosts that theaccounting department uses. You can create alerts to manage the accounting department objects.
You received several complaints from your users about delays when they are using their accountingapplications. Using vRealize Operations Manager, you identified the problem as related to CPU allocationsand workloads. To better manage the problem, you create an alert definition with tighter symptomparameters so that you can track the alerts and identify problems before your users encounter furtherproblems.
Using this scenario, you create a monitoring system that monitors your accounting objects and providestimely notifications when problems occur.
Procedure
1 Add Description and Base Object to Alert Definition on page 50To create an alert to monitor the CPUs for the accounting department virtual machines and monitorhost memory for the hosts on which they operate, you begin by describing the alert.
2 Add a Virtual Machine CPU Usage Symptom to the Alert Definition on page 51To generate alerts related to CPU usage on your accounting virtual machines, you add symptoms toyour vRealize Operations Manager alert definition after you provide the basic descriptive informationfor the alert. The first symptom you add is related to CPU usage on virtual machines. You later use apolicy and group to apply alert to the accounting virtual machines.
3 Add a Host Memory Usage Symptom to the Alert Definition on page 52To generate alerts related to CPU usage on your accounting virtual machines, you add a secondsymptom to your vRealize Operations Manager alert definition after you add the first symptom. Thesecond symptom is related to host memory usage for the hosts on which the accounting virtualmachines operate.
4 Add Recommendations to the Alert Definition on page 53To resolve a generated alert for the accounting department's virtual machines, you providerecommendations so that you or other engineers have the information you need to resolve the alertbefore your users encounter performance problems.
5 Create a Custom Accounting Department Group on page 54To manage, monitor, and apply policies to the accounting objects as a group, you create a customobject group.
6 Create a Policy for the Accounting Alert on page 56To configure how vRealize Operations Manager evaluates the accounting alert definition in yourenvironment, you configure a policy that determines behavior so that you can apply the policy to anobject group. The policy limits the application of the alert definition to only the members of theselected object group.
7 Configure Notifications for the Department Alert on page 57To receive an email notification when the accounting alert is generated, rather than relying on yourability to generally monitor the accounting department objects in vRealize Operations Manager, youcreate notification rules.
8 Create a Dashboard to Monitor Department Objects on page 58To monitor all the alerts related to the accounting department object group, you create a dashboardthat includes the alert list and other widgets. The dashboard provides the alert data in a single locationfor all related objects.
Chapter 3 Customizing How vRealize Operations Manager Monitors Your Environment
VMware, Inc. 49
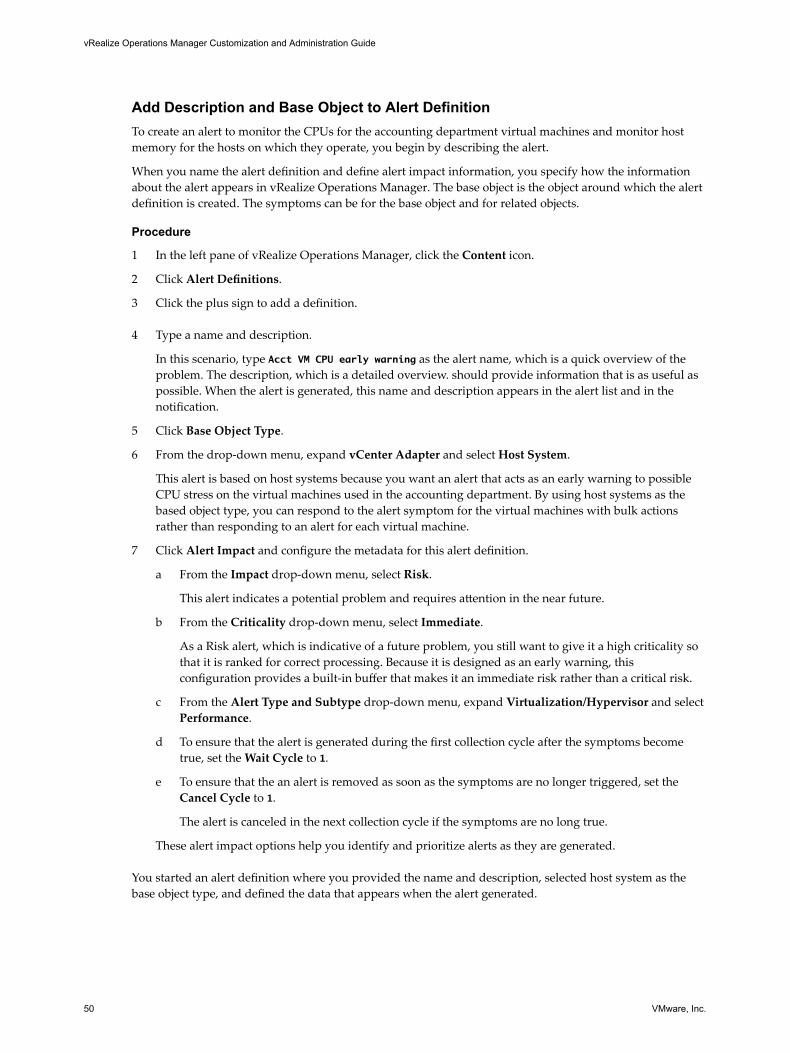
Add Description and Base Object to Alert DefinitionTo create an alert to monitor the CPUs for the accounting department virtual machines and monitor hostmemory for the hosts on which they operate, you begin by describing the alert.
When you name the alert definition and define alert impact information, you specify how the informationabout the alert appears in vRealize Operations Manager. The base object is the object around which the alertdefinition is created. The symptoms can be for the base object and for related objects.
Procedure
1 In the left pane of vRealize Operations Manager, click the Content icon.
2 Click Alert Definitions.
3 Click the plus sign to add a definition.
4 Type a name and description.
In this scenario, type Acct VM CPU early warning as the alert name, which is a quick overview of theproblem. The description, which is a detailed overview. should provide information that is as useful aspossible. When the alert is generated, this name and description appears in the alert list and in thenotification.
5 Click Base Object Type.
6 From the drop-down menu, expand vCenter Adapter and select Host System.
This alert is based on host systems because you want an alert that acts as an early warning to possibleCPU stress on the virtual machines used in the accounting department. By using host systems as thebased object type, you can respond to the alert symptom for the virtual machines with bulk actionsrather than responding to an alert for each virtual machine.
7 Click Alert Impact and configure the metadata for this alert definition.
a From the Impact drop-down menu, select Risk.
This alert indicates a potential problem and requires attention in the near future.
b From the Criticality drop-down menu, select Immediate.
As a Risk alert, which is indicative of a future problem, you still want to give it a high criticality sothat it is ranked for correct processing. Because it is designed as an early warning, thisconfiguration provides a built-in buffer that makes it an immediate risk rather than a critical risk.
c From the Alert Type and Subtype drop-down menu, expand Virtualization/Hypervisor and selectPerformance.
d To ensure that the alert is generated during the first collection cycle after the symptoms becometrue, set the Wait Cycle to 1.
e To ensure that the an alert is removed as soon as the symptoms are no longer triggered, set theCancel Cycle to 1.
The alert is canceled in the next collection cycle if the symptoms are no long true.
These alert impact options help you identify and prioritize alerts as they are generated.
You started an alert definition where you provided the name and description, selected host system as thebase object type, and defined the data that appears when the alert generated.
vRealize Operations Manager Customization and Administration Guide
50 VMware, Inc.
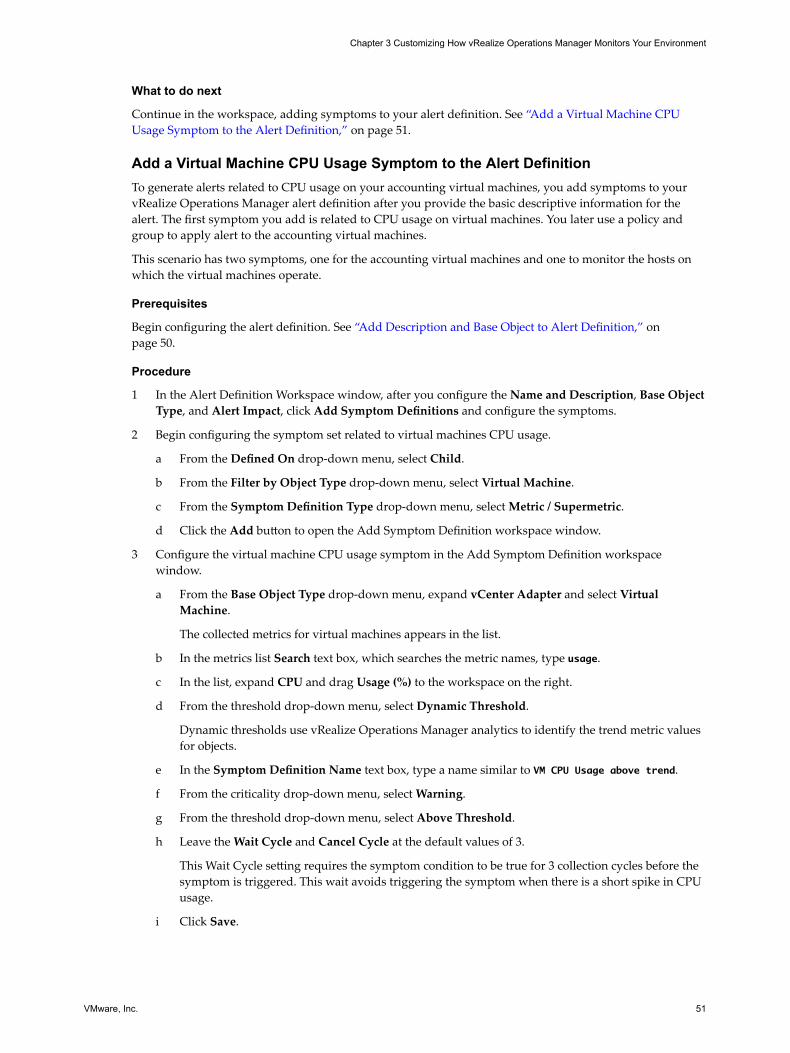
What to do next
Continue in the workspace, adding symptoms to your alert definition. See “Add a Virtual Machine CPUUsage Symptom to the Alert Definition,” on page 51.
Add a Virtual Machine CPU Usage Symptom to the Alert DefinitionTo generate alerts related to CPU usage on your accounting virtual machines, you add symptoms to yourvRealize Operations Manager alert definition after you provide the basic descriptive information for thealert. The first symptom you add is related to CPU usage on virtual machines. You later use a policy andgroup to apply alert to the accounting virtual machines.
This scenario has two symptoms, one for the accounting virtual machines and one to monitor the hosts onwhich the virtual machines operate.
Prerequisites
Begin configuring the alert definition. See “Add Description and Base Object to Alert Definition,” onpage 50.
Procedure
1 In the Alert Definition Workspace window, after you configure the Name and Description, Base ObjectType, and Alert Impact, click Add Symptom Definitions and configure the symptoms.
2 Begin configuring the symptom set related to virtual machines CPU usage.
a From the Defined On drop-down menu, select Child.
b From the Filter by Object Type drop-down menu, select Virtual Machine.
c From the Symptom Definition Type drop-down menu, select Metric / Supermetric.
d Click the Add button to open the Add Symptom Definition workspace window.
3 Configure the virtual machine CPU usage symptom in the Add Symptom Definition workspacewindow.
a From the Base Object Type drop-down menu, expand vCenter Adapter and select VirtualMachine.
The collected metrics for virtual machines appears in the list.
b In the metrics list Search text box, which searches the metric names, type usage.
c In the list, expand CPU and drag Usage (%) to the workspace on the right.
d From the threshold drop-down menu, select Dynamic Threshold.
Dynamic thresholds use vRealize Operations Manager analytics to identify the trend metric valuesfor objects.
e In the Symptom Definition Name text box, type a name similar to VM CPU Usage above trend.
f From the criticality drop-down menu, select Warning.
g From the threshold drop-down menu, select Above Threshold.
h Leave the Wait Cycle and Cancel Cycle at the default values of 3.
This Wait Cycle setting requires the symptom condition to be true for 3 collection cycles before thesymptom is triggered. This wait avoids triggering the symptom when there is a short spike in CPUusage.
i Click Save.
Chapter 3 Customizing How vRealize Operations Manager Monitors Your Environment
VMware, Inc. 51
The dynamic symptom, which identifies when the usage is above the tracked trend, is added to thesymptom list.
4 In the Alert Definition Workspace window, drag VM CPU Usage above trend from the symptomdefinition list to the symptom workspace on the right.
The Child-Virtual Machine symptom set is added to the symptom workspace.
5 In the symptoms set, configure the triggering condition so that when the symptom is true on half of thevirtual machines in the group to which this alert definition is applied, the symptom set is true.
a From the value operator drop-down menu, select >.
b In the value text box, enter 50.
c From the value type drop-down menu, select Percent.
You defined the first symptom set for the alert definition.
What to do next
Add the host memory usage symptom to the alert definition. See “Add a Host Memory Usage Symptom tothe Alert Definition,” on page 52.
Add a Host Memory Usage Symptom to the Alert DefinitionTo generate alerts related to CPU usage on your accounting virtual machines, you add a second symptom toyour vRealize Operations Manager alert definition after you add the first symptom. The second symptom isrelated to host memory usage for the hosts on which the accounting virtual machines operate.
Prerequisites
Add the virtual machine CPU usage symptom. See “Add a Virtual Machine CPU Usage Symptom to theAlert Definition,” on page 51.
Procedure
1 In the Alert Definition Workspace window, after you configure the Name and Description, Base ObjectType, and Alert Impact, click Add Symptom Definitions.
2 Configure the symptom related to host systems for the virtual machines.
a From the Defined On drop-down menu, select Self.
b From the Symptom Definition Type drop-down menu, select Metric / Supermetric.
c Click the Add button to configure the new symptom.
3 Configure the host system symptom in the Add Symptom Definition workspace window.
a From the Base Object Type drop-down menu, expand vCenter Adapters and select Host System.
b In the metrics list, expand Memory and drag Usage (%) to the workspace on the right.
c From the threshold drop-down menu, select Dynamic Threshold.
Dynamic thresholds use vRealize Operations Manager analytics to identify the trend metric valuesfor objects.
d In the Symptom Definition Name text box, enter a name similar toHost memory usage above trend.
e From the criticality drop-down menu, select Warning.
f From the threshold drop-down menu, select Above Threshold.
vRealize Operations Manager Customization and Administration Guide
52 VMware, Inc.
g Leave the Wait Cycle and Cancel Cycle at the default values of 3.
This Wait Cycle setting requires the symptom condition to be true for three collection cycles beforethe symptom is triggered. This wait avoids triggering the symptom when a short spike occurs inhost memory usage.
h Click Save.The dynamic symptom identifies when the hosts on which the accounting virtual machines run areoperating above the tracked trend for memory usage.
The dynamic symptom is added to the symptom list.
4 In the Alert Definition Workspace window, drag Host memory usage above trend from the symptomslist to the symptom workspace on the right.
The Self-Host System symptom set is added to the symptom workspace.
5 On the Self-Host System symptom set, from the value type drop-down menu for This Symptom set istrue when, select Any.
With this configuration, when any of the hosts running accounting virtual machines exhibit memoryusage that is above the analyzed trend, the symptom condition is true.
6 At the top of the symptom set list, from the Match {operator} of the following symptoms drop-downmenu, select Any.
With this configuration, if either of the two symptom sets, virtual machine CPU usage or the hostmemory, are triggered, an alert is generated for the host.
You defined the second symptom set for the alert definition and configured how the two symptom sets areevaluated to determine when the alert is generated.
What to do next
Add recommendations to your alert definition so that you and your engineers know how to resolve the alertwhen it is generated. See “Add Recommendations to the Alert Definition,” on page 53.
Add Recommendations to the Alert DefinitionTo resolve a generated alert for the accounting department's virtual machines, you providerecommendations so that you or other engineers have the information you need to resolve the alert beforeyour users encounter performance problems.
As part of the alert definition, you add recommendations that include actions that you run fromvRealize Operations Manager and instructions for making changes in vCenter Server that resolve thegenerated alert.
Prerequisites
Add symptoms to your alert definition. See “Add a Host Memory Usage Symptom to the Alert Definition,”on page 52.
Procedure
1 In the Alert Definition Workspace window, after you configure the Name and Description, Base ObjectType, Alert Impact, and Add Symptom Definitions, click Add Recommendations and add therecommended actions and instructions.
Chapter 3 Customizing How vRealize Operations Manager Monitors Your Environment
VMware, Inc. 53
2 Click Add and select an action recommendation to resolve the virtual machine alerts.
a In the New Recommendation text box, enter a description of the action similar toAdd CPUs to virtual machines.
b From the Actions drop-down menu, select Set CPU Count for VM.
c Click Save.
3 Click Add and provide an instructive recommendation to resolve host memory problems similar to thisexample.
If this host is part of a DRS cluster, check the DRS settings to verify that the load
balancing setting are configured correctly. If necessary, manually vMotion the virtual
machines.
4 Click Add and provide an instructive recommendation to resolve host memory alerts.
a Enter a description of the recommendation similar to this example.
If this is a standalone host, add more memory to the host.
b To make the URL a hyperlink in the instructions, copy the URL, for example,https://www.vmware.com/support/pubs/vsphere-esxi-vcenter-server-pubs.html, to your clipboard.
c Highlight the text in the text box and click Create a hyperlink.
d Paste the URL in the Create a hyperlink text box and click OK.
e Click Save.
5 In the Alert Definition Workspace, drag Add CPUs to virtual machines, If this host is part of a DRScluster, and the If this is a standalone host recommendations from the list to the recommendationworkspace in the order presented.
6 Click Save.
You provided the recommended actions and instructions to resolve the alert when it is generated. One of therecommendations resolves the virtual machine CPU usage problem and the other resolves the host memoryproblem.
What to do next
Create a group of objects to use to manage your accounting objects. See “Create a Custom AccountingDepartment Group,” on page 54.
Create a Custom Accounting Department GroupTo manage, monitor, and apply policies to the accounting objects as a group, you create a custom objectgroup.
Prerequisites
Verify that you completed the alert definition for this scenario. See “Add Recommendations to the AlertDefinition,” on page 53.
Procedure
1 In the left pane of vRealize Operations Manager, click the Environment icon.
2 Click the Groups tab.
3 Click New Group.
4 Type a name similar to Accounting VMs and Hosts.
5 From the Group Type drop-down menu, select Department.
vRealize Operations Manager Customization and Administration Guide
54 VMware, Inc.
6 From the Policy drop-down menu, select Default Policy.
When you create a policy, you apply the new policy to the accounting group.
7 In the Define membership criteria area, from the Select the Object Type that matches the followingcriteria drop-down menu, expand vCenter Adapter, select Host System, and configure the dynamicgroup criteria.
a From the criteria drop-down menu, select Relationship.
b From the relationships options drop-down menu, select Parent of.
c From the operator drop-down menu, select contains.
d In the Object name text box, enter acct.
e From the navigation tree drop-down list, select vSphere Hosts and Clusters.
You created a dynamic group where host objects that are the host for virtual machines with acct in thevirtual machine name are included in the group. If a virtual machine with acct in the object name isadded or moved to a host, the host object is added to the group.
8 Click Preview in the lower-left corner of the workspace, and verify that the hosts on which your virtualmachines that include acct in the object name appear in the Preview Group window.
9 Click Close.
10 Click Add another criteria set.
A new criteria set is added with the OR operator between the two criteria sets.
11 From the Select the Object Type that matches the following criteria drop-down menu, expandvCenter Adapter, select Virtual Machine, and configure the dynamic group criteria.
a From the criteria drop-down menu, select Properties.
b From the Pick a property drop-down menu, expand Configuration and double-click Name.
c From the operator drop-down menu, select contains.
d In the Property value text box, enter acct.
You created a dynamic group where virtual machine objects with acct in the object name are included inthe group that depends on the presence of those virtual machines. If a virtual machine with acct in thename is added to your environment, it is added to the group.
12 Click Preview in the lower-left corner of the workspace, and verify that the virtual machines with acctin the object name are added to the list that also includes the host systems.
13 Click Close.
14 Click OK.
The Accounting VMs and Hosts group is added to the Groups list.
You created a dynamic object group that changes as virtual machines with acct in their names are added,removed, and moved in your environment.
What to do next
Create a policy that determines how vRealize Operations Manager uses the alert definition to monitor yourenvironment. See “Create a Policy for the Accounting Alert,” on page 56.
Chapter 3 Customizing How vRealize Operations Manager Monitors Your Environment
VMware, Inc. 55
Create a Policy for the Accounting AlertTo configure how vRealize Operations Manager evaluates the accounting alert definition in yourenvironment, you configure a policy that determines behavior so that you can apply the policy to an objectgroup. The policy limits the application of the alert definition to only the members of the selected objectgroup.
When an alert definition is created, it is added to the default policy and enabled, ensuring that any alertdefinitions that you create are active in your environment. This alert definition is intended to meet the needsof the accounting department, so you disable it in the default policy and create a new policy to govern howthe alert definition is evaluated in your environment, including which accounting virtual machines andrelated hosts to monitor.
Prerequisites
n Verify that you completed the alert definition for this scenario. See “Add Recommendations to the AlertDefinition,” on page 53.
n Verify that you created a group of objects that you use to manage you accounting objects. See “Create aCustom Accounting Department Group,” on page 54.
Procedure
1 In the left pane of vRealize Operations Manager, click the Administration icon.
2 Click Policies and click Policy Library.
3 Click Add New Policy.
4 Type a name similar to Accounting Objects Alerts Policy and provide a useful description similar tothe following example.
This policy is configured to generate alerts when
Accounting VMs and Hosts group objects are above trended
CPU or memory usage.
5 Click Select Base Policies and select Default Policy from the Start with drop-down menu.
6 On the left, click Customize Alert / Symptom Definitions and disable all the alert definitions except thenew Acct VM CPU early warning alert.
a In the Alert Definitions area, click Actions and select Select All.
The alerts on the current page are selected.
b Click Actions and select Disable.
The alerts indicate Disabled in the State column.
c Repeat the process on each page of the alerts list.
d Select Acct VM CPU early warning in the list, click Actions and select Enable.
The Acct VM CPU early warning alert is now enabled.
7 On the left, click Apply Policy to Groups and select Accounting VMs and Hosts.
8 Click Save.
You created a policy where the accounting alert definition exists in a custom policy that is applied only tothe virtual machines and hosts for the accounting department.
vRealize Operations Manager Customization and Administration Guide
56 VMware, Inc.
What to do next
Create an email notification so that you learn about alerts even you when you are not actively monitoringvRealize Operations Manager. See “Configure Notifications for the Department Alert,” on page 57.
Configure Notifications for the Department AlertTo receive an email notification when the accounting alert is generated, rather than relying on your ability togenerally monitor the accounting department objects in vRealize Operations Manager, you createnotification rules.
Creating an email notification when accounting alerts are triggered is an optional process, but it providesyou with the alert even when you are not currently working in vRealize Operations Manager.
Prerequisites
n Verify that you completed the alert definition for this scenario. See “Add Recommendations to the AlertDefinition,” on page 53.
n Verify that standard email outbound alerts are configured in your system. See “Add a Standard EmailPlug-In for vRealize Operations Manager Outbound Alerts,” on page 63.
Procedure
1 In the left pane of vRealize Operations Manager, click the Content icon.
2 Click Notifications and click the plus sign to add a notification rule.
3 Configure the communication options.
a In the Name text box, type a name similar to Acct Dept VMs or Hosts Alerts.
b From the Select Plug-In Type drop-down menu, select StandardEmailPlugin.
c From the Select Instance drop-down menu, select the standard email instance that is configured tosend messages.
d In the Recipients text box, type your email address and the addresses of other recipientsresponsible for the accounting department alerts. Use a semicolon between recipients.
e Leave the Notify again text box blank.
If you do not provide a value, the email notice is sent only once. This alert is a Risk alert and isintended as an early warning rather than requiring an immediate response.
You configured the name of the notification when it is sent to you and the method that is used to sendthe message.
4 In the Filtering Criteria area, configure the accounting alert notification trigger.
a From the Notification Trigger drop-down menu, select Alert Definition.
b Click Click to select Alert Definition.
c Select Acct VM CPU early warning and click Select.
5 Click Save.
You created a notification rule that sends you and your designated engineers an email message when thisalert is generated for your accounting department alert definition.
What to do next
Create a dashboard with alert-related widgets so that you can monitor alerts for the accounting objectgroup. See “Create a Dashboard to Monitor Department Objects,” on page 58.
Chapter 3 Customizing How vRealize Operations Manager Monitors Your Environment
VMware, Inc. 57
Create a Dashboard to Monitor Department ObjectsTo monitor all the alerts related to the accounting department object group, you create a dashboard thatincludes the alert list and other widgets. The dashboard provides the alert data in a single location for allrelated objects.
Creating a dashboard to monitor the accounting virtual machines and related hosts is an optional process,but it provides you with a focused view of the accounting object group alerts and objects.
Prerequisites
Create an object group for the accounting department virtual machines and related objects. See “Create aCustom Accounting Department Group,” on page 54.
Procedure
1 In the left pane of vRealize Operations Manager, click the Content icon and click Dashboards.
2 Click Add.
3 In the Dashboard Configuration definition area, type a tab name similar to Accounting VMs and Hostsand configure the layout options.
4 Click Widget List and drag the following widgets to the workspace.
n Alert List
n Efficiency
n Health
n Risk
n Top Alerts
n Alert Volume
The blank widgets are added to the workspace. To change the order in which they appear, you can dragthem to a different location in the workspace.
5 On the Alert List widget title bar, click Edit Widget and configure the settings.
a In the Title text box, change the title to Acct Dept Alert List.
b For the Refresh Content option, select On.
c Type Accounting in the Search text box and click Search.
The Accounting value corresponds to the name of the object group for the accounting departmentvirtual machines and related hosts.
d In the filtered resource list, select the Accounting VMs and Hosts group.
The Accounting VMs and Hosts group is identified in the Selected Resource text box.
e Click OK.
The Acct Dept Alert List is now configured to display alerts for the Accounting VMs and Hosts groupobjects.
6 Click Widget Interactions and configure the following interactions.
a For Acct Dept Alert List, leave the selected resources blank.
b For Top Alerts, Health, Risk, Efficiency, and Alert Volume select Acct Dept Alert List from theSelected Resources drop-down menu.
c Click Apply Interactions.
vRealize Operations Manager Customization and Administration Guide
58 VMware, Inc.
With the widget interaction configured in this way, the select alert in the Acct Dept Alert List is thesource for the data in the other widgets. When you select an alert in the alert list, the Health, Risk, andEfficiency widgets display alerts for that object, Top Alerts displays the topic issues affecting the healthof the object, and Alert Volume displays an alert trend chart.
7 Click Save.
You created a dashboard that displays the alerts related to the accounting virtual machines and hosts group,including the Risk alert you created.
Defining Symptoms for AlertsSymptoms are conditions that indicate problems in your environment. You define symptoms that you addto alert definitions so that you know when a problem occurs with your monitored objects.
As data is collected from your monitored objects, the data is compared to the defined symptom condition. Ifthe condition is true, then the symptom is triggered.
You can define symptoms based on metrics and super metrics, properties, message events, fault events, andmetric events.
Defined symptoms in your environment are managed in the Symptom Definitions. When the symptoms thatare added to an alert definition are triggered, they contribute to a generated alert. Symptoms that are notadded to an alert definition are still evaluated and if the condition is evaluated as true, appear on the AlertDetails Symptom tab on the Troubleshooting tab.
Define Symptoms to Cover All Possible Severities and ConditionsUse a series of symptoms to describe incremental levels of concern. For example, Volume nearing capacitylimit might have a severity value of Warning while Volume reached capacity limit might have a severitylevel of Critical. The first symptom is not an immediate threat. The second symptom is an immediate threat.
About Metrics and Super Metrics SymptomsMetric and super metric symptoms are based on the operational or performance values thatvRealize Operations Manager collects from target objects in your environment. You can configure thesymptoms to evaluate static thresholds or dynamic thresholds.
You define symptoms based on metrics so that you can create alert definitions that let you know when theperformance of an object in your environment is adversely affected.
Static Thresholds
Metric symptoms that are based on a static threshold compare the currently collected metric value againstthe fixed value you configure in the symptom definition.
For example, you can configure a static metric symptom where, when the virtual machine CPU workload isgreater than 90, a critical symptom is triggered.
Dynamic Thresholds
Metric symptoms that are based on dynamic thresholds compare the currently collected metric value againstthe trend identified by vRealize Operations Manager, evaluating whether the current value is above, below,or generally outside the trend.
For example, you can configure a dynamic metric symptom where, when the virtual machine CPUworkload is above the trended normal value, a critical symptom is triggered.
Chapter 3 Customizing How vRealize Operations Manager Monitors Your Environment
VMware, Inc. 59
Property SymptomsProperty symptoms are based on the configuration properties that vRealize Operations Manager collectsfrom the target objects in your environment.
You define symptoms based on properties so that you can create alert definitions that let you know whenchanges to properties on your monitored objects can affect the behavior of the objects in your environment.
Message Event SymptomsMessage event symptoms are based on events received as messages from a component ofvRealize Operations Manager or from an external monitored system through the system's REST API. Youdefine symptoms based on message events to include in alert definitions that use these symptoms. When theconfigured symptom condition is true, the symptom is triggered.
The adapters for the external monitored systems and the REST API are inbound channels for collectingevents from external sources. Adapters and the REST server both run in the vRealize Operations Managersystem. The external system sends the messages, and vRealize Operations Manager collects them.
You can create message event symptoms for the supported event types. The following list is of supportedevent types with example events.
n System Performance Degradation. This message event type corresponds to theEVENT_CLASS_SYSTEM and EVENT_SUBCLASS_PERFORM_DEGRADATION type and subtype inthe vRealize Operations Manager API SDK.
n Change. The VMware adapter sends a change event when the CPU limit for a virtual machine ischanged from unlimited to 2 GHz. You can create a symptom to detect CPU contention issues as aresult of this configuration change. This message event type corresponds to theEVENT_CLASS_CHANGE and EVENT_SUBCLASS_CHANGE type and subtype in thevRealize Operations Manager API SDK.
n Environment Down. The vRealize Operations Manager adapter sends an environment down eventwhen the collector component is not communicating with the other components. You can create asymptom that is used for internal health monitoring. This message event type corresponds to theEVENT_CLASS_ENVIRONMENT and EVENT_SUBCLASS_DOWN type and subtype in thevRealize Operations Manager API SDK.
n Notification. This message event type corresponds to the EVENT_CLASS_NOTIFICATION andEVENT_SUBCLASS_EXTEVENT type and subtype in the vRealize Operations Manager API SDK.
Fault SymptomsFault symptoms are based on events published by monitored systems. vRealize Operations Managercorrelates a subset of these events and delivers them as faults. Faults are intended to signify events in themonitored systems that affect the availability of objects in your environment. You define symptoms basedon faults to include in alert definitions that use these symptoms. When the configured symptom condition istrue, the symptom is triggered.
You can create fault symptoms for the supported published faults. Some object types have multiple faultdefinitions from which to choose, while others have no fault definitions.
If the adapter published fault definitions for an object type, you can select one or more fault events for agiven fault while you define the symptom. The symptom is triggered if the fault is active because of any ofthe chosen events. If you do not select a fault event, the symptom is triggered if the fault is active because ofa fault event.
vRealize Operations Manager Customization and Administration Guide
60 VMware, Inc.
Metric Event SymptomsMetric event symptoms are based on events communicated from a monitored system where the selectedmetric violates a threshold in a specified manner. The external system manages the threshold, notvRealize Operations Manager.
Metric event symptoms are based on conditions reported for selected metrics by an external monitoredsystem, as compared to metric symptoms, which are based on thresholds that vRealize Operations Manageris actively monitoring.
The metric event thresholds, which determine whether the metric is above, below, equal to, or not equal tothe threshold set on the monitored system, represent the type and subtype combination that is specified inthe incoming metric event.
n Above Threshold. Corresponds to type and subtype constants EVENT_CLASS_HT andEVENT_SUBCLASS_ABOVE defined in the vRealize Operations Manager API SDK.
n Below Threshold. Corresponds to type and subtype constants EVENT_CLASS_HT andEVENT_SUBCLASS_BELOW defined in the vRealize Operations Manager API SDK.
n Equal Threshold. Corresponds to type and subtype constants EVENT_CLASS_HT andEVENT_SUBCLASS_EQUAL defined in the vRealize Operations Manager API SDK.
n Not Equal Threshold. Corresponds to type and subtype constants EVENT_CLASS_HT andEVENT_SUBCLASS_NOT_EQUAL defined in the vRealize Operations Manager API SDK.
Viewing Actions Available in vRealize Operations ManagerActions are the ability to update objects or read data about objects in monitored systems, and are commonlyprovided in vRealize Operations Manager as part of a solution. The actions added by solutions are availablefrom the object Actions menu, list and view menus, including some dashboard widgets, and can be added toalert definition recommendations.
The possible actions include read actions and update actions.
The read actions retrieve data from the target objects.
The update actions modifies the target objects. For example, you can configure an alert definition to notifyyou when a virtual machine is experiencing memory issues. Add an action in the recommendations thatruns the Set Memory for Virtual Machine action. This action increases the memory and resolves the likelycause of the alert.
To see or use the actions for your vCenter Server objects, you must enable actions in the vCenter Adapter foreach monitored vCenter Server instance. Actions can only be viewed and accessed if you have the requiredpermissions.
Defining Recommendations for Alert DefinitionsRecommendations are instructions to your users who are responsible for responding to alerts. You addrecommendations to vRealize Operations Manager alerts so that your users can maintain the objects in yourenvironment at the required levels of performance.
Recommendations provide your network engineers or virtual infrastructure administrators withinformation to resolve alerts.
Depending on the knowledge level of your users, you can provide more or less information, including thefollowing options, in any combination.
n One line of instruction.
n Steps to resolve the alert on the target object.
Chapter 3 Customizing How vRealize Operations Manager Monitors Your Environment
VMware, Inc. 61
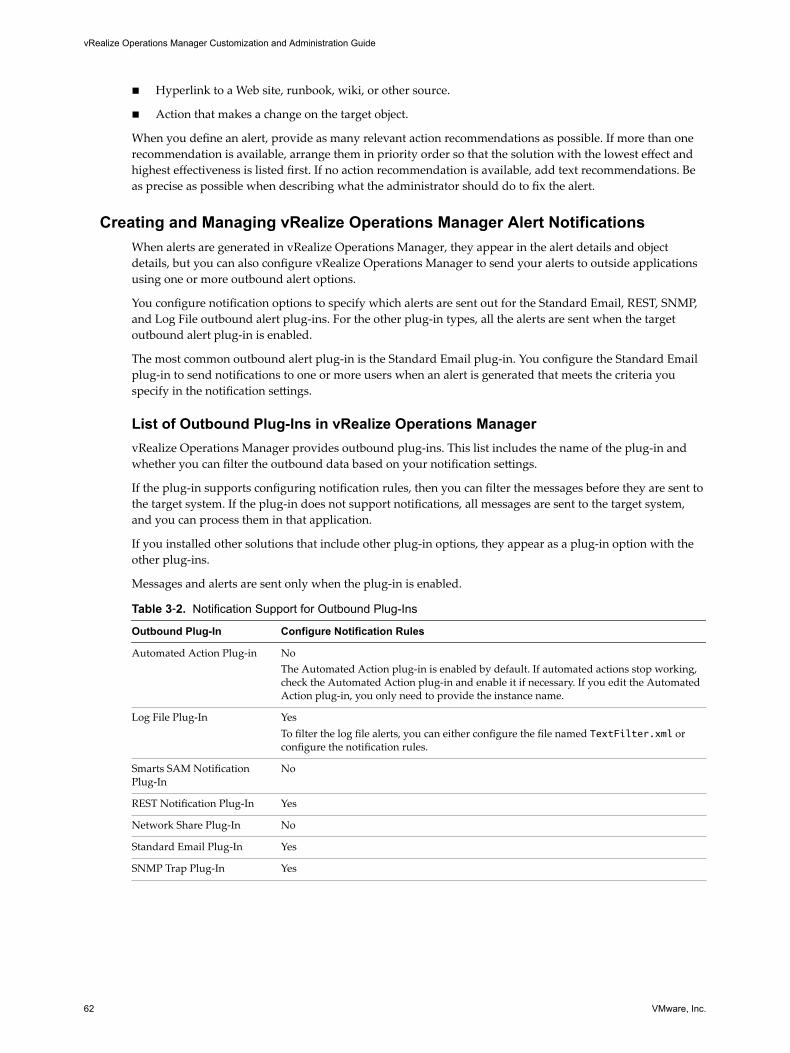
n Hyperlink to a Web site, runbook, wiki, or other source.
n Action that makes a change on the target object.
When you define an alert, provide as many relevant action recommendations as possible. If more than onerecommendation is available, arrange them in priority order so that the solution with the lowest effect andhighest effectiveness is listed first. If no action recommendation is available, add text recommendations. Beas precise as possible when describing what the administrator should do to fix the alert.
Creating and Managing vRealize Operations Manager Alert NotificationsWhen alerts are generated in vRealize Operations Manager, they appear in the alert details and objectdetails, but you can also configure vRealize Operations Manager to send your alerts to outside applicationsusing one or more outbound alert options.
You configure notification options to specify which alerts are sent out for the Standard Email, REST, SNMP,and Log File outbound alert plug-ins. For the other plug-in types, all the alerts are sent when the targetoutbound alert plug-in is enabled.
The most common outbound alert plug-in is the Standard Email plug-in. You configure the Standard Emailplug-in to send notifications to one or more users when an alert is generated that meets the criteria youspecify in the notification settings.
List of Outbound Plug-Ins in vRealize Operations ManagervRealize Operations Manager provides outbound plug-ins. This list includes the name of the plug-in andwhether you can filter the outbound data based on your notification settings.
If the plug-in supports configuring notification rules, then you can filter the messages before they are sent tothe target system. If the plug-in does not support notifications, all messages are sent to the target system,and you can process them in that application.
If you installed other solutions that include other plug-in options, they appear as a plug-in option with theother plug-ins.
Messages and alerts are sent only when the plug-in is enabled.
Table 3‑2. Notification Support for Outbound Plug-Ins
Outbound Plug-In Configure Notification Rules
Automated Action Plug-in NoThe Automated Action plug-in is enabled by default. If automated actions stop working,check the Automated Action plug-in and enable it if necessary. If you edit the AutomatedAction plug-in, you only need to provide the instance name.
Log File Plug-In YesTo filter the log file alerts, you can either configure the file named TextFilter.xml orconfigure the notification rules.
Smarts SAM NotificationPlug-In
No
REST Notification Plug-In Yes
Network Share Plug-In No
Standard Email Plug-In Yes
SNMP Trap Plug-In Yes
vRealize Operations Manager Customization and Administration Guide
62 VMware, Inc.
Add Outbound Notification Plug-Ins in vRealize Operations ManagerYou add outbound plug-in instances so that you can notify users about alerts or capture alert data outside ofvRealize Operations Manager.
You can configure one or more instances of the same plug-in type if you need to direct alert information tomultiple target systems.
The Automated Action plug-in is enabled by default. If automated actions stop working, check theAutomated Action plug-in and enable it if necessary. If you edit the Automated Action plug-in, you onlyneed to provide the instance name.
n Add a Standard Email Plug-In for vRealize Operations Manager Outbound Alerts on page 63You add a Standard Email Plug-In so that you can use Simple Mail Transfer Protocol (SMTP) to emailvRealize Operations Manager alert notifications to your virtual infrastructure administrators, networkoperations engineers, and other interested individuals.
n Add a REST Plug-In for vRealize Operations Manager Outbound Alerts on page 64You add a REST Plug-In so that you can send vRealize Operations Manager alerts to another REST-enabled application where you built a REST Web service to accept these messages.
n Add a Log File Plug-In for vRealize Operations Manager Outbound Alerts on page 66You add a Log File plug-in when you want to configure vRealize Operations Manager to log alerts to afile on each of your vRealize Operations Manager nodes. If you installed vRealize Operations Manageras a multiple node cluster, each node processes and logs the alerts for the objects that it monitors. Eachnode logs the alerts for the objects it processes.
n Add a Network Share Plug-In for vRealize Operations Manager Reports on page 67You add a Network Share plug-in when you want to configure vRealize Operations Manager to sendreports to a shared location.
n Add an SNMP Trap Plug-In for vRealize Operations Manager Outbound Alerts on page 68You add an SNMP Trap plug-in when you want to configure vRealize Operations Manager to logalerts on an existing SNMP Trap server in your environment.
n Add a Smarts Service Assurance Manager Notification Plug-In for vRealize Operations ManagerOutbound Alerts on page 68You add a Smarts SAM Notification plug-in when you want to configure vRealize Operations Managerto send alert notifications to EMC Smarts Server Assurance Manager.
Add a Standard Email Plug-In for vRealize Operations Manager Outbound Alerts
You add a Standard Email Plug-In so that you can use Simple Mail Transfer Protocol (SMTP) to emailvRealize Operations Manager alert notifications to your virtual infrastructure administrators, networkoperations engineers, and other interested individuals.
Prerequisites
Ensure that you have an email user account that you can use as the connection account for the alertnotifications. If you choose to require authentication, you must also know the password for this account.
Procedure
1 In the left pane of vRealize Operations Manager, click the Administration icon.
2 Click Outbound Settings and click the plus sign to add a plug-in.
3 From the Plug-In Type drop-down menu, select Standard Email Plugin.
The dialog box expands to include your SMTP settings.
Chapter 3 Customizing How vRealize Operations Manager Monitors Your Environment
VMware, Inc. 63

4 Enter an Instance Name.
This is the name that identifies this instance that you select when you later configure notification rules.
5 Configure the SMTP options appropriate for your environment.
Option Description
Use Secure Connection Enables secure communication encryption using SSL/TLS. If you select thisoption, you must select a method in the Secure Connection Type drop-down menu.
Requires Authentication Enables authentication on the email user account that you use to configurethis SMTP instance. If you select this option, you must provide a passwordfor the user account.
SMTP Host URL or IP address of your email host server.
SMTP Port Default port SMTP uses to connect with the server.
Secure Connection Type Select either SSL/TLS as the communication encryption method used inyour environment from the drop-down menu. You must select aconnection type if you select Use Secure Connection.
User Name Email user account that is used to connect to the email server.
Password Password for the connection user account. A password is required if youselect Requires Authentication.
Sender Email Address Email address that appears on the notification message
Sender Name Displayed name for the sender email address.
6 Click Save.
7 To start the outbound alert service for this plug-in, select the instance in the list and click Enable on thetoolbar.
This instance of the standard email plug-in for outbound SMTP alerts is configured and running.
What to do next
Create notification rules that use the standard email plug-in to send a message to your users about alertsrequiring their attention. See “User Scenario: Create a vRealize Operations Manager Email AlertNotification,” on page 71.
Add a REST Plug-In for vRealize Operations Manager Outbound Alerts
You add a REST Plug-In so that you can send vRealize Operations Manager alerts to another REST-enabledapplication where you built a REST Web service to accept these messages.
The REST Plug-In supports enabling an integration, it does not provide an integration. Depending on yourtarget application, you might need an intermediary REST service or some other mechanism that willcorrelate the alert and object identifiers included in the REST alert output with the identifiers in your targetapplication.
Determine which content type you are delivering to your target application. If you select application/json,the body of the POST or PUT calls that are sent have the following format. Sample data is included.
{
"startDate":1369757346267,
"criticality":"ALERT_CRITICALITY_LEVEL_WARNING",
"Risk":4.0,
"resourceId":"sample-object-uuid",
"alertId":"sample-alert-uuid",
"status":"ACTIVE",
"subType":"ALERT_SUBTYPE_AVAILABILITY_PROBLEM",
"cancelDate":1369757346267,
vRealize Operations Manager Customization and Administration Guide
64 VMware, Inc.
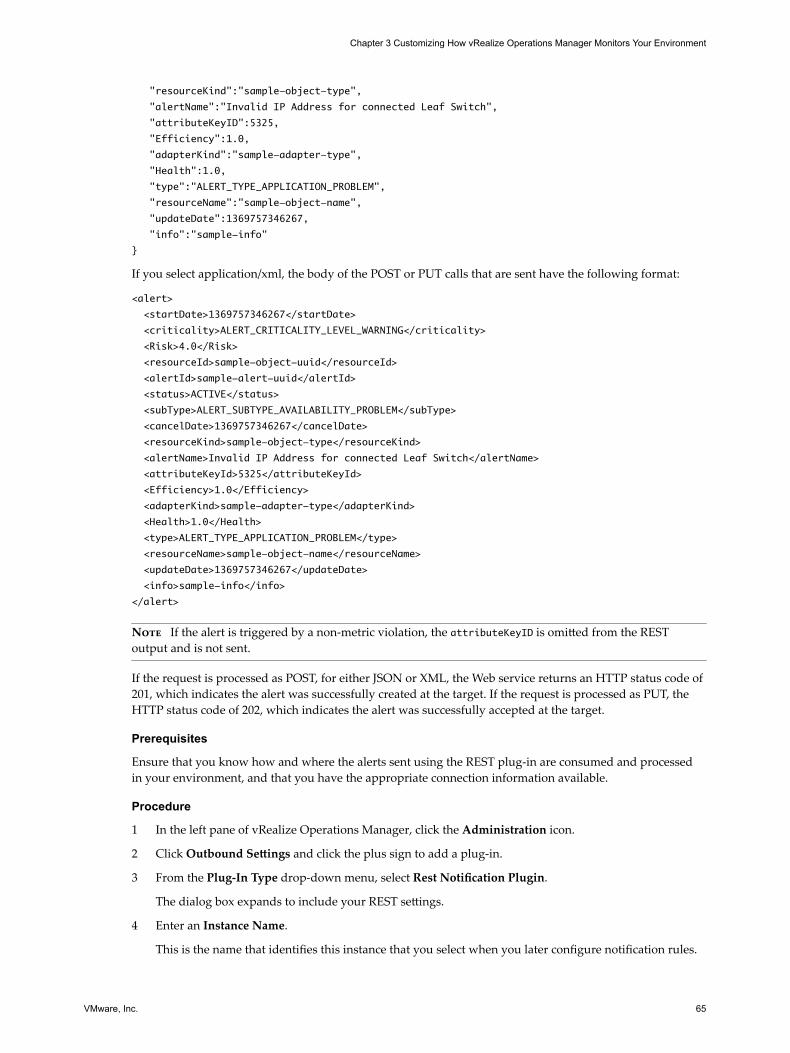
"resourceKind":"sample-object-type",
"alertName":"Invalid IP Address for connected Leaf Switch",
"attributeKeyID":5325,
"Efficiency":1.0,
"adapterKind":"sample-adapter-type",
"Health":1.0,
"type":"ALERT_TYPE_APPLICATION_PROBLEM",
"resourceName":"sample-object-name",
"updateDate":1369757346267,
"info":"sample-info"
}
If you select application/xml, the body of the POST or PUT calls that are sent have the following format:
<alert>
<startDate>1369757346267</startDate>
<criticality>ALERT_CRITICALITY_LEVEL_WARNING</criticality>
<Risk>4.0</Risk>
<resourceId>sample-object-uuid</resourceId>
<alertId>sample-alert-uuid</alertId>
<status>ACTIVE</status>
<subType>ALERT_SUBTYPE_AVAILABILITY_PROBLEM</subType>
<cancelDate>1369757346267</cancelDate>
<resourceKind>sample-object-type</resourceKind>
<alertName>Invalid IP Address for connected Leaf Switch</alertName>
<attributeKeyId>5325</attributeKeyId>
<Efficiency>1.0</Efficiency>
<adapterKind>sample-adapter-type</adapterKind>
<Health>1.0</Health>
<type>ALERT_TYPE_APPLICATION_PROBLEM</type>
<resourceName>sample-object-name</resourceName>
<updateDate>1369757346267</updateDate>
<info>sample-info</info>
</alert>
Note If the alert is triggered by a non-metric violation, the attributeKeyID is omitted from the RESToutput and is not sent.
If the request is processed as POST, for either JSON or XML, the Web service returns an HTTP status code of201, which indicates the alert was successfully created at the target. If the request is processed as PUT, theHTTP status code of 202, which indicates the alert was successfully accepted at the target.
Prerequisites
Ensure that you know how and where the alerts sent using the REST plug-in are consumed and processedin your environment, and that you have the appropriate connection information available.
Procedure
1 In the left pane of vRealize Operations Manager, click the Administration icon.
2 Click Outbound Settings and click the plus sign to add a plug-in.
3 From the Plug-In Type drop-down menu, select Rest Notification Plugin.
The dialog box expands to include your REST settings.
4 Enter an Instance Name.
This is the name that identifies this instance that you select when you later configure notification rules.
Chapter 3 Customizing How vRealize Operations Manager Monitors Your Environment
VMware, Inc. 65
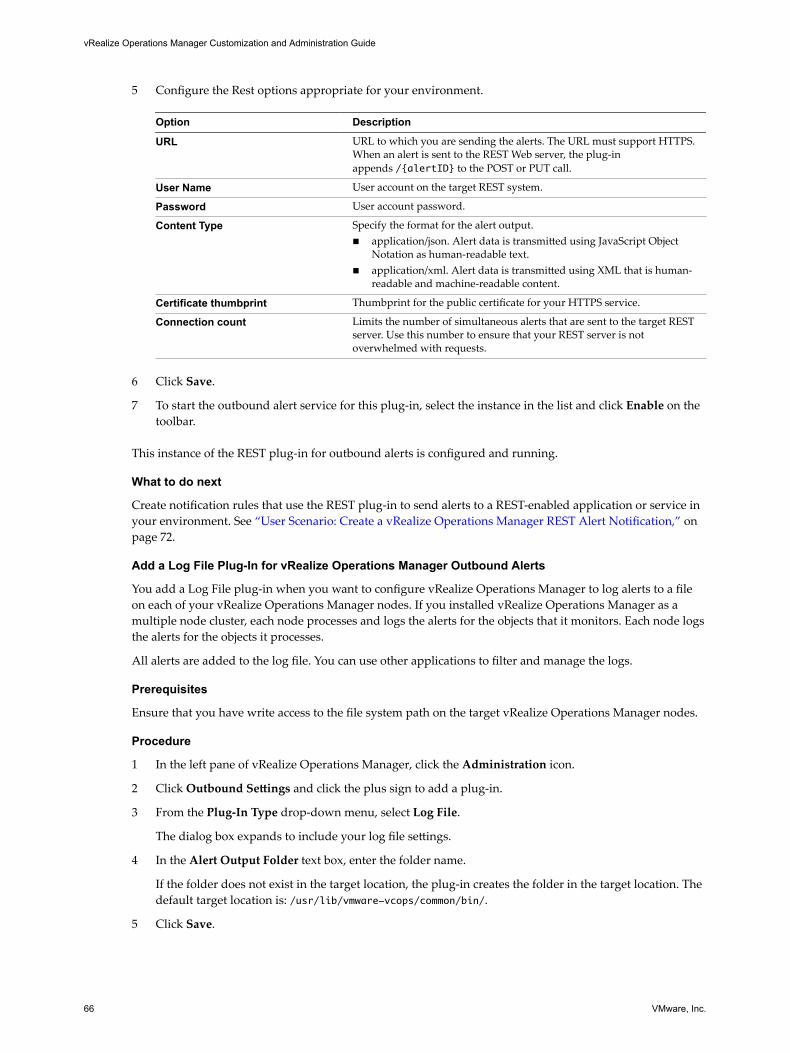
5 Configure the Rest options appropriate for your environment.
Option Description
URL URL to which you are sending the alerts. The URL must support HTTPS.When an alert is sent to the REST Web server, the plug-inappends /{alertID} to the POST or PUT call.
User Name User account on the target REST system.
Password User account password.
Content Type Specify the format for the alert output.n application/json. Alert data is transmitted using JavaScript Object
Notation as human-readable text.n application/xml. Alert data is transmitted using XML that is human-
readable and machine-readable content.
Certificate thumbprint Thumbprint for the public certificate for your HTTPS service.
Connection count Limits the number of simultaneous alerts that are sent to the target RESTserver. Use this number to ensure that your REST server is notoverwhelmed with requests.
6 Click Save.
7 To start the outbound alert service for this plug-in, select the instance in the list and click Enable on thetoolbar.
This instance of the REST plug-in for outbound alerts is configured and running.
What to do next
Create notification rules that use the REST plug-in to send alerts to a REST-enabled application or service inyour environment. See “User Scenario: Create a vRealize Operations Manager REST Alert Notification,” onpage 72.
Add a Log File Plug-In for vRealize Operations Manager Outbound Alerts
You add a Log File plug-in when you want to configure vRealize Operations Manager to log alerts to a fileon each of your vRealize Operations Manager nodes. If you installed vRealize Operations Manager as amultiple node cluster, each node processes and logs the alerts for the objects that it monitors. Each node logsthe alerts for the objects it processes.
All alerts are added to the log file. You can use other applications to filter and manage the logs.
Prerequisites
Ensure that you have write access to the file system path on the target vRealize Operations Manager nodes.
Procedure
1 In the left pane of vRealize Operations Manager, click the Administration icon.
2 Click Outbound Settings and click the plus sign to add a plug-in.
3 From the Plug-In Type drop-down menu, select Log File.
The dialog box expands to include your log file settings.
4 In the Alert Output Folder text box, enter the folder name.
If the folder does not exist in the target location, the plug-in creates the folder in the target location. Thedefault target location is: /usr/lib/vmware-vcops/common/bin/.
5 Click Save.
vRealize Operations Manager Customization and Administration Guide
66 VMware, Inc.
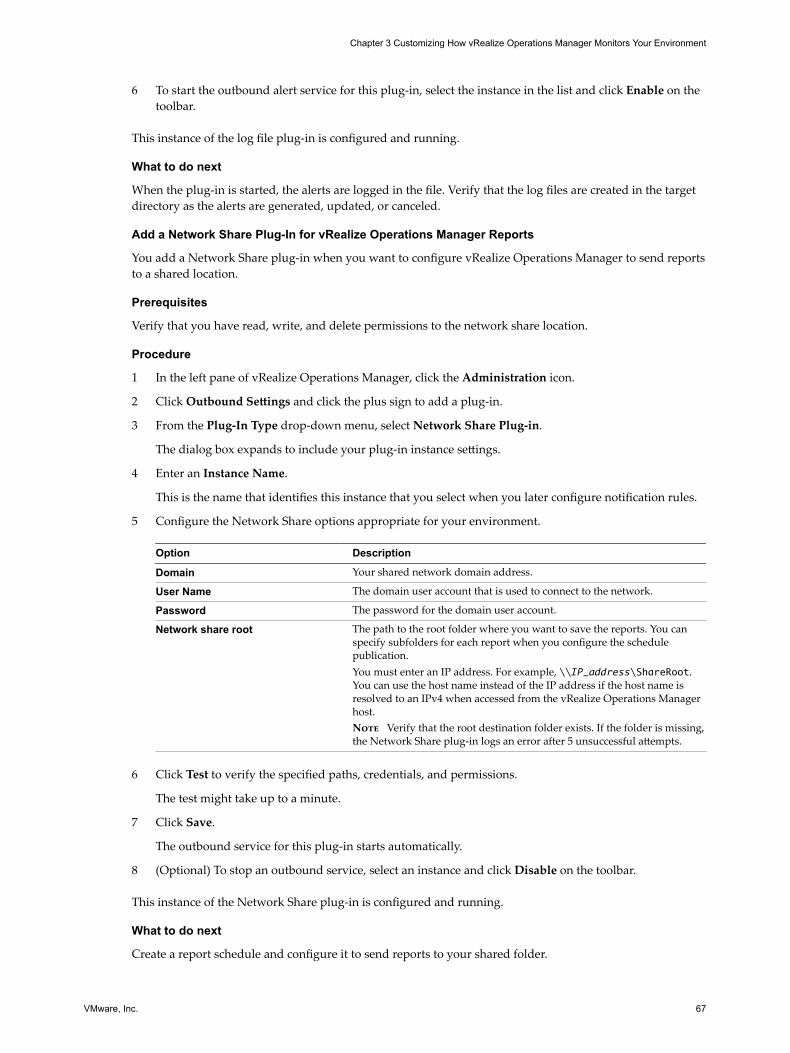
6 To start the outbound alert service for this plug-in, select the instance in the list and click Enable on thetoolbar.
This instance of the log file plug-in is configured and running.
What to do next
When the plug-in is started, the alerts are logged in the file. Verify that the log files are created in the targetdirectory as the alerts are generated, updated, or canceled.
Add a Network Share Plug-In for vRealize Operations Manager Reports
You add a Network Share plug-in when you want to configure vRealize Operations Manager to send reportsto a shared location.
Prerequisites
Verify that you have read, write, and delete permissions to the network share location.
Procedure
1 In the left pane of vRealize Operations Manager, click the Administration icon.
2 Click Outbound Settings and click the plus sign to add a plug-in.
3 From the Plug-In Type drop-down menu, select Network Share Plug-in.
The dialog box expands to include your plug-in instance settings.
4 Enter an Instance Name.
This is the name that identifies this instance that you select when you later configure notification rules.
5 Configure the Network Share options appropriate for your environment.
Option Description
Domain Your shared network domain address.
User Name The domain user account that is used to connect to the network.
Password The password for the domain user account.
Network share root The path to the root folder where you want to save the reports. You canspecify subfolders for each report when you configure the schedulepublication.You must enter an IP address. For example, \\IP_address\ShareRoot.You can use the host name instead of the IP address if the host name isresolved to an IPv4 when accessed from the vRealize Operations Managerhost.Note Verify that the root destination folder exists. If the folder is missing,the Network Share plug-in logs an error after 5 unsuccessful attempts.
6 Click Test to verify the specified paths, credentials, and permissions.
The test might take up to a minute.
7 Click Save.
The outbound service for this plug-in starts automatically.
8 (Optional) To stop an outbound service, select an instance and click Disable on the toolbar.
This instance of the Network Share plug-in is configured and running.
What to do next
Create a report schedule and configure it to send reports to your shared folder.
Chapter 3 Customizing How vRealize Operations Manager Monitors Your Environment
VMware, Inc. 67
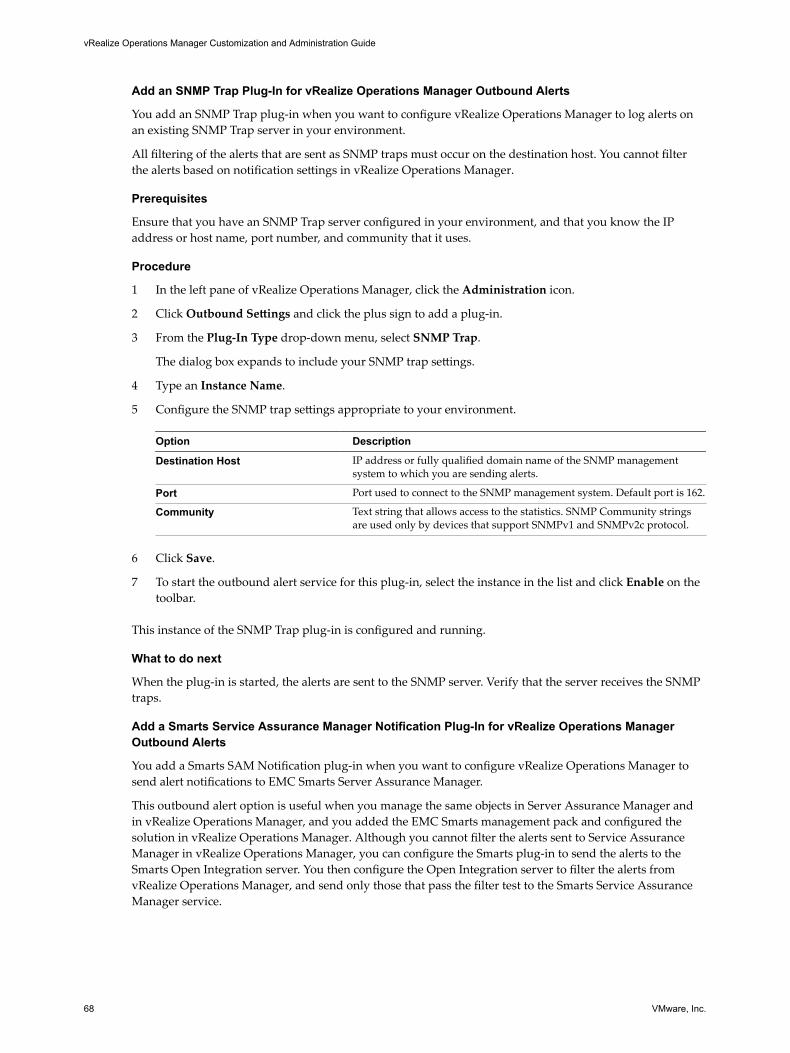
Add an SNMP Trap Plug-In for vRealize Operations Manager Outbound Alerts
You add an SNMP Trap plug-in when you want to configure vRealize Operations Manager to log alerts onan existing SNMP Trap server in your environment.
All filtering of the alerts that are sent as SNMP traps must occur on the destination host. You cannot filterthe alerts based on notification settings in vRealize Operations Manager.
Prerequisites
Ensure that you have an SNMP Trap server configured in your environment, and that you know the IPaddress or host name, port number, and community that it uses.
Procedure
1 In the left pane of vRealize Operations Manager, click the Administration icon.
2 Click Outbound Settings and click the plus sign to add a plug-in.
3 From the Plug-In Type drop-down menu, select SNMP Trap.
The dialog box expands to include your SNMP trap settings.
4 Type an Instance Name.
5 Configure the SNMP trap settings appropriate to your environment.
Option Description
Destination Host IP address or fully qualified domain name of the SNMP managementsystem to which you are sending alerts.
Port Port used to connect to the SNMP management system. Default port is 162.
Community Text string that allows access to the statistics. SNMP Community stringsare used only by devices that support SNMPv1 and SNMPv2c protocol.
6 Click Save.
7 To start the outbound alert service for this plug-in, select the instance in the list and click Enable on thetoolbar.
This instance of the SNMP Trap plug-in is configured and running.
What to do next
When the plug-in is started, the alerts are sent to the SNMP server. Verify that the server receives the SNMPtraps.
Add a Smarts Service Assurance Manager Notification Plug-In for vRealize Operations ManagerOutbound Alerts
You add a Smarts SAM Notification plug-in when you want to configure vRealize Operations Manager tosend alert notifications to EMC Smarts Server Assurance Manager.
This outbound alert option is useful when you manage the same objects in Server Assurance Manager andin vRealize Operations Manager, and you added the EMC Smarts management pack and configured thesolution in vRealize Operations Manager. Although you cannot filter the alerts sent to Service AssuranceManager in vRealize Operations Manager, you can configure the Smarts plug-in to send the alerts to theSmarts Open Integration server. You then configure the Open Integration server to filter the alerts fromvRealize Operations Manager, and send only those that pass the filter test to the Smarts Service AssuranceManager service.
vRealize Operations Manager Customization and Administration Guide
68 VMware, Inc.

Prerequisites
n Verify that you configured the EMC Smarts solution. For documentation regarding EMC Smartsintegration, see https://solutionexchange.vmware.com/store.
n Ensure that you have the EMC Smarts Broker and Server Assurance Manager instance host name or IPaddress, user name, and password.
Procedure
1 In the left pane of vRealize Operations Manager, click the Administration icon.
2 Click Outbound Settings and click the plus sign to add a plug-in.
3 From the Plug-In Type drop-down menu, select Smarts SAM Notification.
The dialog box expands to include your Smarts settings.
4 Enter an Instance Name.
This is the name that identifies this instance that you select when you later configure notification rules.
5 Configure the Smarts SAM notification settings appropriate for your environment.
Option Description
Broker Type the host name or IP address of the EMC Smarts Broker that managesregistry for the Server Assurance Manager instance to which you want thenotifications sent.
Broker Username If the Smarts broker is configured as Secure Broker, type the user name forthe Broker account.
Broker Password If the Smarts broker is configured as Secure Broker, type the password forthe Broker user account.
SAM Server Type the host name or IP address of the Server Assurance Manager serverto which you are sending the notifications.
User Name Type the user name for the Server Assurance Manager server instance. Thisaccount must have read and write permissions for the notifications on theSmarts server as specified in the SAM Server.
Password Type the password for the Server Assurance Manager server account.
6 Click Save.
7 Modify the Smarts SAM plug-in properties file.
a Open the properties file at: /usr/lib/vmware-vcops/user/plugins/outbound/vcops-smartsalert-plugin/conf/plugin.properties
b Add the following string to the properties file: #sendByType=APPLICATION::AVAILABILITY,APPLICATION::PERFORMANCE,APPLICATION::CAPACITY,APPLI
CATION::COMPLIANCE,VIRTUALIZATION::AVAILABILITY,VIRTUALIZATION::PERFORMANCE,VIRTUALIZATIO
N::CAPACITY,VIRTUALIZATION::COMPLIANCE,HARDWARE::AVAILABILITY,HARDWARE::PERFORMANCE,HARDW
ARE::CAPACITY,HARDWARE::COMPLIANCE,STORAGE::AVAILABILITY,STORAGE::PERFORMANCE,STORAGE::CA
PACITY,STORAGE::COMPLIANCE,NETWORK::AVAILABILITY,NETWORK::PERFORMANCE,NETWORK::CAPACITY,N
ETWORK::COMPLIANCE
c Save the properties file.
8 To start the outbound alert service for this plug-in, select the instance in the list and click Enable on thetoolbar.
This instance of the Smarts SAM Notifications plug-in is configured and running.
Chapter 3 Customizing How vRealize Operations Manager Monitors Your Environment
VMware, Inc. 69
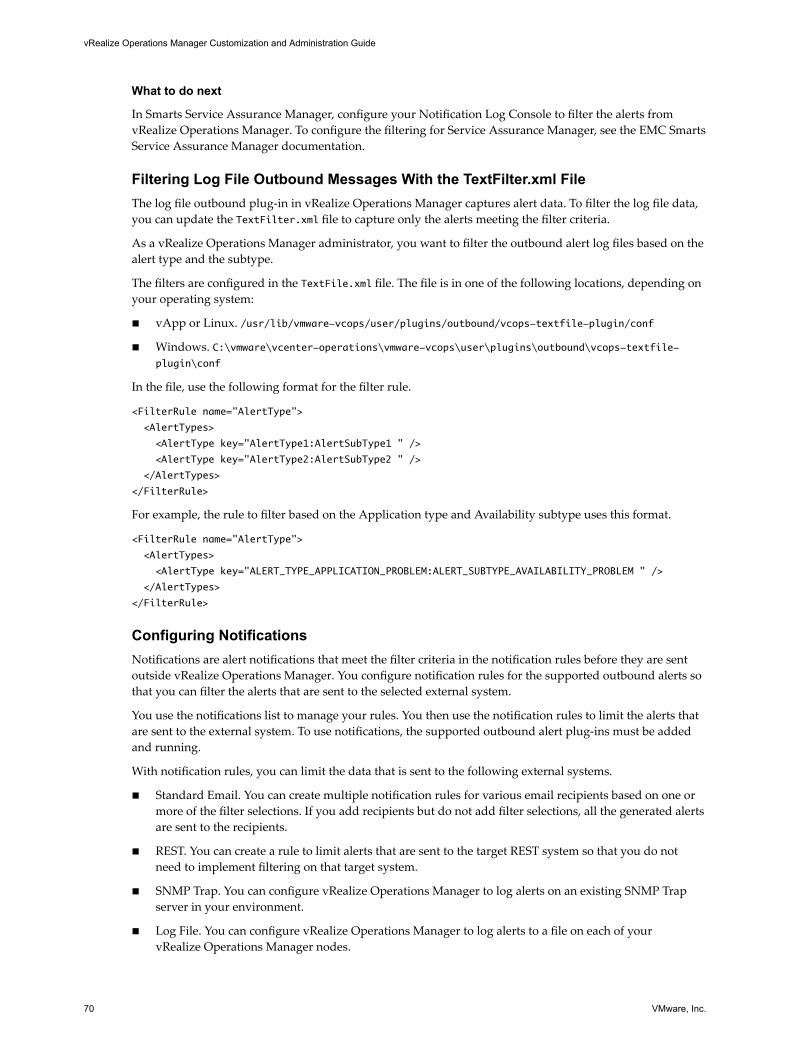
What to do next
In Smarts Service Assurance Manager, configure your Notification Log Console to filter the alerts fromvRealize Operations Manager. To configure the filtering for Service Assurance Manager, see the EMC SmartsService Assurance Manager documentation.
Filtering Log File Outbound Messages With the TextFilter.xml FileThe log file outbound plug-in in vRealize Operations Manager captures alert data. To filter the log file data,you can update the TextFilter.xml file to capture only the alerts meeting the filter criteria.
As a vRealize Operations Manager administrator, you want to filter the outbound alert log files based on thealert type and the subtype.
The filters are configured in the TextFile.xml file. The file is in one of the following locations, depending onyour operating system:
n vApp or Linux. /usr/lib/vmware-vcops/user/plugins/outbound/vcops-textfile-plugin/conf
n Windows. C:\vmware\vcenter-operations\vmware-vcops\user\plugins\outbound\vcops-textfile-plugin\conf
In the file, use the following format for the filter rule.
<FilterRule name="AlertType">
<AlertTypes>
<AlertType key="AlertType1:AlertSubType1 " />
<AlertType key="AlertType2:AlertSubType2 " />
</AlertTypes>
</FilterRule>
For example, the rule to filter based on the Application type and Availability subtype uses this format.
<FilterRule name="AlertType">
<AlertTypes>
<AlertType key="ALERT_TYPE_APPLICATION_PROBLEM:ALERT_SUBTYPE_AVAILABILITY_PROBLEM " />
</AlertTypes>
</FilterRule>
Configuring NotificationsNotifications are alert notifications that meet the filter criteria in the notification rules before they are sentoutside vRealize Operations Manager. You configure notification rules for the supported outbound alerts sothat you can filter the alerts that are sent to the selected external system.
You use the notifications list to manage your rules. You then use the notification rules to limit the alerts thatare sent to the external system. To use notifications, the supported outbound alert plug-ins must be addedand running.
With notification rules, you can limit the data that is sent to the following external systems.
n Standard Email. You can create multiple notification rules for various email recipients based on one ormore of the filter selections. If you add recipients but do not add filter selections, all the generated alertsare sent to the recipients.
n REST. You can create a rule to limit alerts that are sent to the target REST system so that you do notneed to implement filtering on that target system.
n SNMP Trap. You can configure vRealize Operations Manager to log alerts on an existing SNMP Trapserver in your environment.
n Log File. You can configure vRealize Operations Manager to log alerts to a file on each of yourvRealize Operations Manager nodes.
vRealize Operations Manager Customization and Administration Guide
70 VMware, Inc.
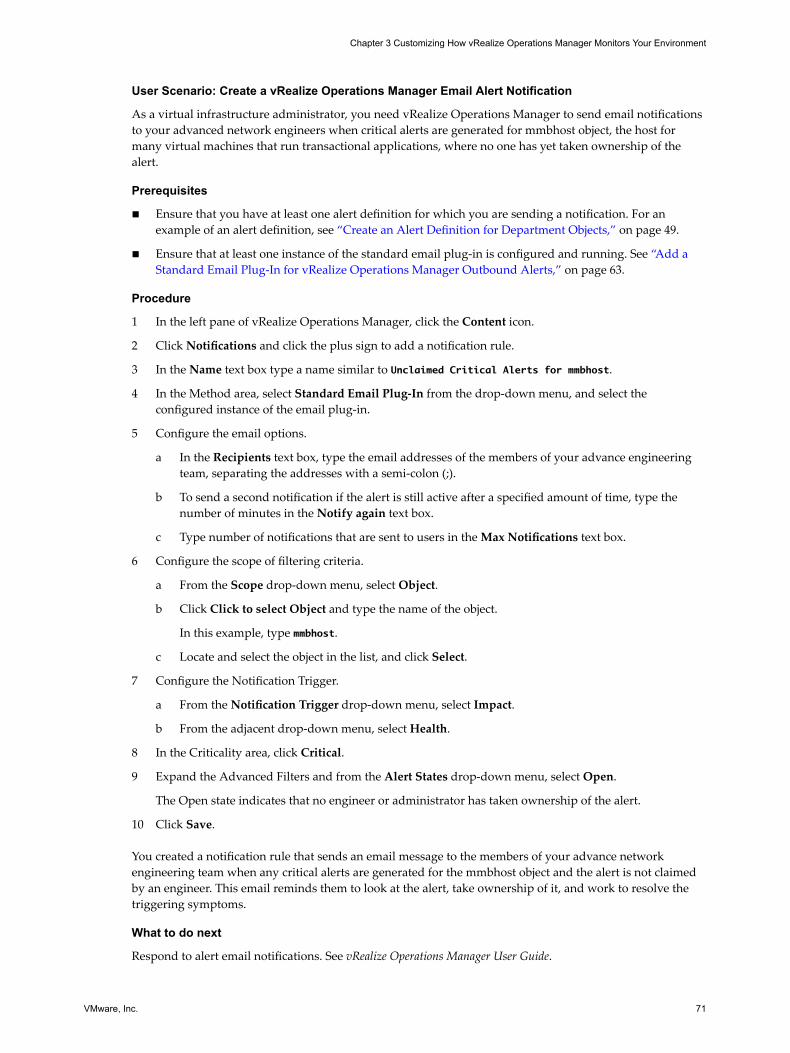
User Scenario: Create a vRealize Operations Manager Email Alert Notification
As a virtual infrastructure administrator, you need vRealize Operations Manager to send email notificationsto your advanced network engineers when critical alerts are generated for mmbhost object, the host formany virtual machines that run transactional applications, where no one has yet taken ownership of thealert.
Prerequisites
n Ensure that you have at least one alert definition for which you are sending a notification. For anexample of an alert definition, see “Create an Alert Definition for Department Objects,” on page 49.
n Ensure that at least one instance of the standard email plug-in is configured and running. See “Add aStandard Email Plug-In for vRealize Operations Manager Outbound Alerts,” on page 63.
Procedure
1 In the left pane of vRealize Operations Manager, click the Content icon.
2 Click Notifications and click the plus sign to add a notification rule.
3 In the Name text box type a name similar to Unclaimed Critical Alerts for mmbhost.
4 In the Method area, select Standard Email Plug-In from the drop-down menu, and select theconfigured instance of the email plug-in.
5 Configure the email options.
a In the Recipients text box, type the email addresses of the members of your advance engineeringteam, separating the addresses with a semi-colon (;).
b To send a second notification if the alert is still active after a specified amount of time, type thenumber of minutes in the Notify again text box.
c Type number of notifications that are sent to users in the Max Notifications text box.
6 Configure the scope of filtering criteria.
a From the Scope drop-down menu, select Object.
b Click Click to select Object and type the name of the object.
In this example, type mmbhost.
c Locate and select the object in the list, and click Select.
7 Configure the Notification Trigger.
a From the Notification Trigger drop-down menu, select Impact.
b From the adjacent drop-down menu, select Health.
8 In the Criticality area, click Critical.
9 Expand the Advanced Filters and from the Alert States drop-down menu, select Open.
The Open state indicates that no engineer or administrator has taken ownership of the alert.
10 Click Save.
You created a notification rule that sends an email message to the members of your advance networkengineering team when any critical alerts are generated for the mmbhost object and the alert is not claimedby an engineer. This email reminds them to look at the alert, take ownership of it, and work to resolve thetriggering symptoms.
What to do next
Respond to alert email notifications. See vRealize Operations Manager User Guide.
Chapter 3 Customizing How vRealize Operations Manager Monitors Your Environment
VMware, Inc. 71
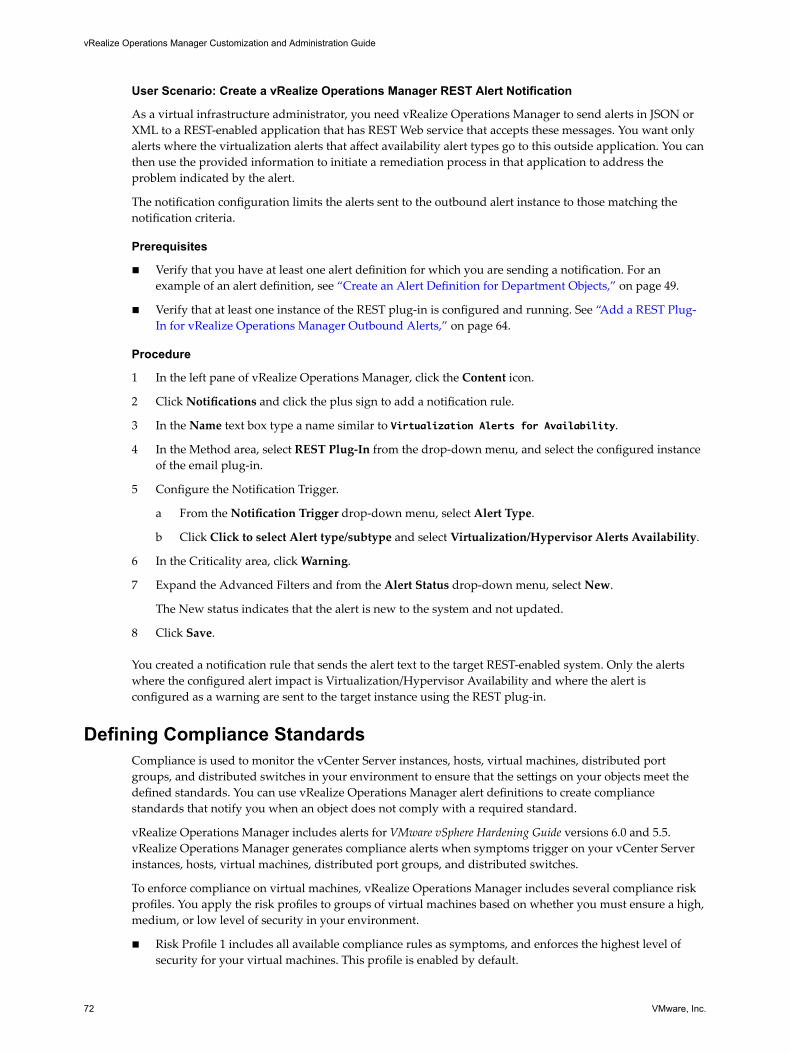
User Scenario: Create a vRealize Operations Manager REST Alert Notification
As a virtual infrastructure administrator, you need vRealize Operations Manager to send alerts in JSON orXML to a REST-enabled application that has REST Web service that accepts these messages. You want onlyalerts where the virtualization alerts that affect availability alert types go to this outside application. You canthen use the provided information to initiate a remediation process in that application to address theproblem indicated by the alert.
The notification configuration limits the alerts sent to the outbound alert instance to those matching thenotification criteria.
Prerequisites
n Verify that you have at least one alert definition for which you are sending a notification. For anexample of an alert definition, see “Create an Alert Definition for Department Objects,” on page 49.
n Verify that at least one instance of the REST plug-in is configured and running. See “Add a REST Plug-In for vRealize Operations Manager Outbound Alerts,” on page 64.
Procedure
1 In the left pane of vRealize Operations Manager, click the Content icon.
2 Click Notifications and click the plus sign to add a notification rule.
3 In the Name text box type a name similar to Virtualization Alerts for Availability.
4 In the Method area, select REST Plug-In from the drop-down menu, and select the configured instanceof the email plug-in.
5 Configure the Notification Trigger.
a From the Notification Trigger drop-down menu, select Alert Type.
b Click Click to select Alert type/subtype and select Virtualization/Hypervisor Alerts Availability.
6 In the Criticality area, click Warning.
7 Expand the Advanced Filters and from the Alert Status drop-down menu, select New.
The New status indicates that the alert is new to the system and not updated.
8 Click Save.
You created a notification rule that sends the alert text to the target REST-enabled system. Only the alertswhere the configured alert impact is Virtualization/Hypervisor Availability and where the alert isconfigured as a warning are sent to the target instance using the REST plug-in.
Defining Compliance StandardsCompliance is used to monitor the vCenter Server instances, hosts, virtual machines, distributed portgroups, and distributed switches in your environment to ensure that the settings on your objects meet thedefined standards. You can use vRealize Operations Manager alert definitions to create compliancestandards that notify you when an object does not comply with a required standard.
vRealize Operations Manager includes alerts for VMware vSphere Hardening Guide versions 6.0 and 5.5.vRealize Operations Manager generates compliance alerts when symptoms trigger on your vCenter Serverinstances, hosts, virtual machines, distributed port groups, and distributed switches.
To enforce compliance on virtual machines, vRealize Operations Manager includes several compliance riskprofiles. You apply the risk profiles to groups of virtual machines based on whether you must ensure a high,medium, or low level of security in your environment.
n Risk Profile 1 includes all available compliance rules as symptoms, and enforces the highest level ofsecurity for your virtual machines. This profile is enabled by default.
vRealize Operations Manager Customization and Administration Guide
72 VMware, Inc.
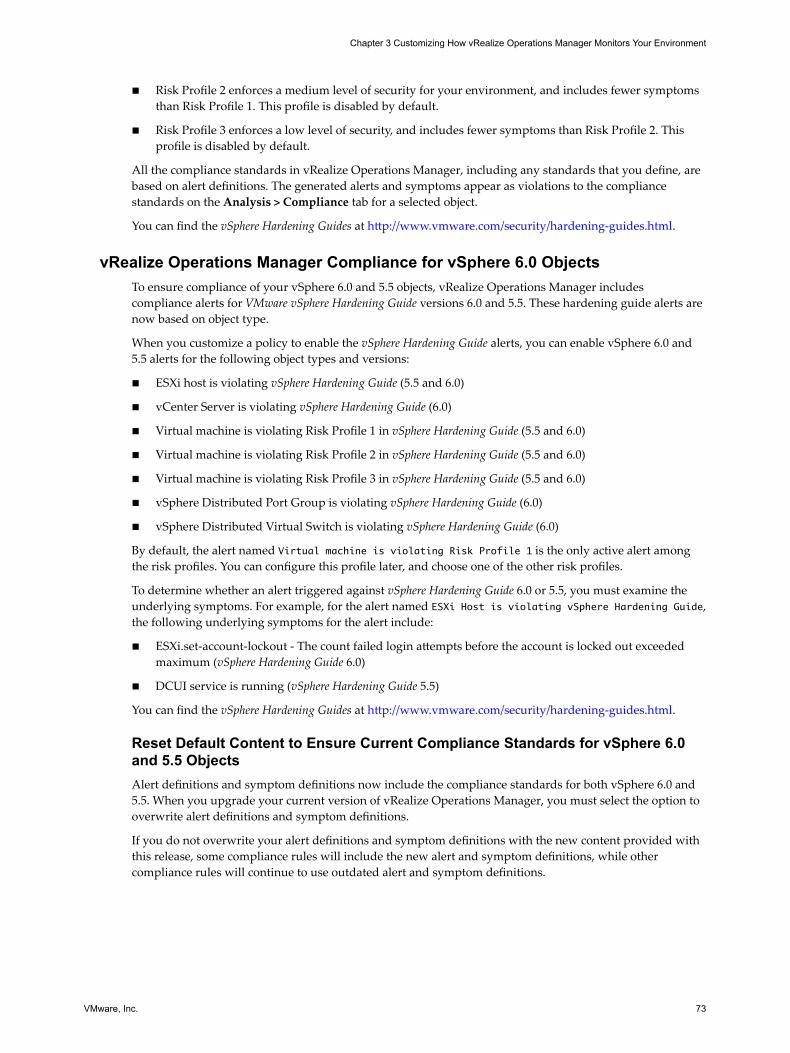
n Risk Profile 2 enforces a medium level of security for your environment, and includes fewer symptomsthan Risk Profile 1. This profile is disabled by default.
n Risk Profile 3 enforces a low level of security, and includes fewer symptoms than Risk Profile 2. Thisprofile is disabled by default.
All the compliance standards in vRealize Operations Manager, including any standards that you define, arebased on alert definitions. The generated alerts and symptoms appear as violations to the compliancestandards on the Analysis > Compliance tab for a selected object.
You can find the vSphere Hardening Guides at http://www.vmware.com/security/hardening-guides.html.
vRealize Operations Manager Compliance for vSphere 6.0 ObjectsTo ensure compliance of your vSphere 6.0 and 5.5 objects, vRealize Operations Manager includescompliance alerts for VMware vSphere Hardening Guide versions 6.0 and 5.5. These hardening guide alerts arenow based on object type.
When you customize a policy to enable the vSphere Hardening Guide alerts, you can enable vSphere 6.0 and5.5 alerts for the following object types and versions:
n ESXi host is violating vSphere Hardening Guide (5.5 and 6.0)
n vCenter Server is violating vSphere Hardening Guide (6.0)
n Virtual machine is violating Risk Profile 1 in vSphere Hardening Guide (5.5 and 6.0)
n Virtual machine is violating Risk Profile 2 in vSphere Hardening Guide (5.5 and 6.0)
n Virtual machine is violating Risk Profile 3 in vSphere Hardening Guide (5.5 and 6.0)
n vSphere Distributed Port Group is violating vSphere Hardening Guide (6.0)
n vSphere Distributed Virtual Switch is violating vSphere Hardening Guide (6.0)
By default, the alert named Virtual machine is violating Risk Profile 1 is the only active alert amongthe risk profiles. You can configure this profile later, and choose one of the other risk profiles.
To determine whether an alert triggered against vSphere Hardening Guide 6.0 or 5.5, you must examine theunderlying symptoms. For example, for the alert named ESXi Host is violating vSphere Hardening Guide,the following underlying symptoms for the alert include:
n ESXi.set-account-lockout - The count failed login attempts before the account is locked out exceededmaximum (vSphere Hardening Guide 6.0)
n DCUI service is running (vSphere Hardening Guide 5.5)
You can find the vSphere Hardening Guides at http://www.vmware.com/security/hardening-guides.html.
Reset Default Content to Ensure Current Compliance Standards for vSphere 6.0and 5.5 ObjectsAlert definitions and symptom definitions now include the compliance standards for both vSphere 6.0 and5.5. When you upgrade your current version of vRealize Operations Manager, you must select the option tooverwrite alert definitions and symptom definitions.
If you do not overwrite your alert definitions and symptom definitions with the new content provided withthis release, some compliance rules will include the new alert and symptom definitions, while othercompliance rules will continue to use outdated alert and symptom definitions.
Chapter 3 Customizing How vRealize Operations Manager Monitors Your Environment
VMware, Inc. 73
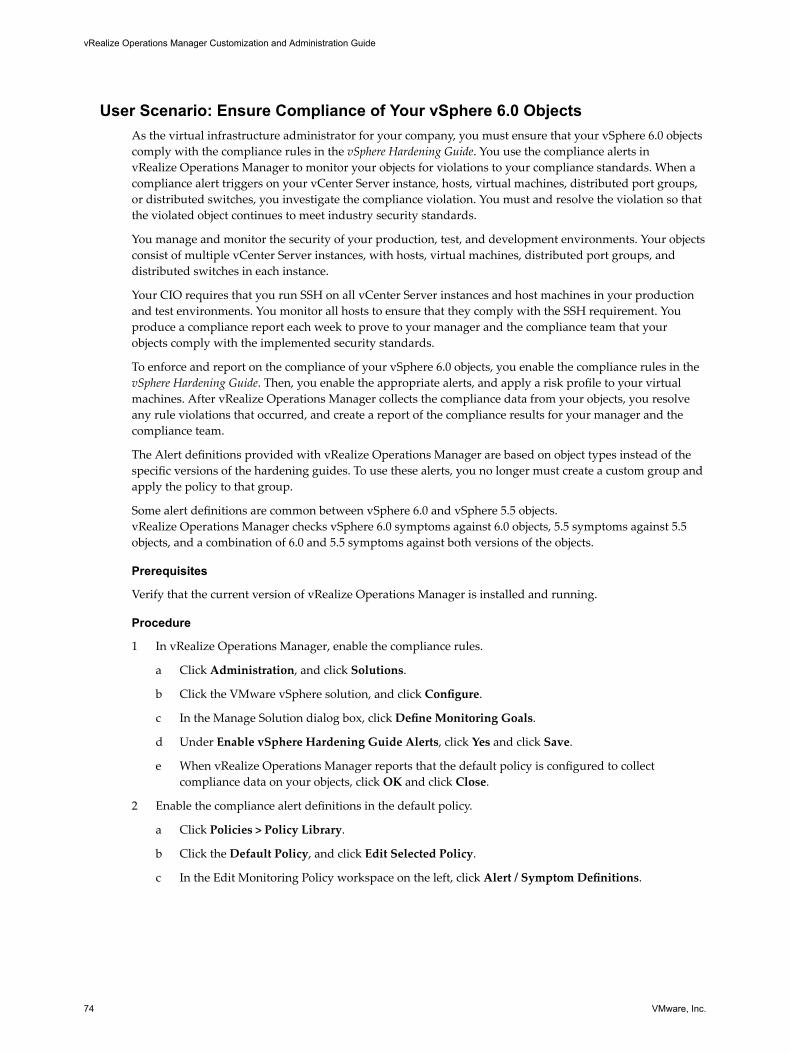
User Scenario: Ensure Compliance of Your vSphere 6.0 ObjectsAs the virtual infrastructure administrator for your company, you must ensure that your vSphere 6.0 objectscomply with the compliance rules in the vSphere Hardening Guide. You use the compliance alerts invRealize Operations Manager to monitor your objects for violations to your compliance standards. When acompliance alert triggers on your vCenter Server instance, hosts, virtual machines, distributed port groups,or distributed switches, you investigate the compliance violation. You must and resolve the violation so thatthe violated object continues to meet industry security standards.
You manage and monitor the security of your production, test, and development environments. Your objectsconsist of multiple vCenter Server instances, with hosts, virtual machines, distributed port groups, anddistributed switches in each instance.
Your CIO requires that you run SSH on all vCenter Server instances and host machines in your productionand test environments. You monitor all hosts to ensure that they comply with the SSH requirement. Youproduce a compliance report each week to prove to your manager and the compliance team that yourobjects comply with the implemented security standards.
To enforce and report on the compliance of your vSphere 6.0 objects, you enable the compliance rules in thevSphere Hardening Guide. Then, you enable the appropriate alerts, and apply a risk profile to your virtualmachines. After vRealize Operations Manager collects the compliance data from your objects, you resolveany rule violations that occurred, and create a report of the compliance results for your manager and thecompliance team.
The Alert definitions provided with vRealize Operations Manager are based on object types instead of thespecific versions of the hardening guides. To use these alerts, you no longer must create a custom group andapply the policy to that group.
Some alert definitions are common between vSphere 6.0 and vSphere 5.5 objects.vRealize Operations Manager checks vSphere 6.0 symptoms against 6.0 objects, 5.5 symptoms against 5.5objects, and a combination of 6.0 and 5.5 symptoms against both versions of the objects.
Prerequisites
Verify that the current version of vRealize Operations Manager is installed and running.
Procedure
1 In vRealize Operations Manager, enable the compliance rules.
a Click Administration, and click Solutions.
b Click the VMware vSphere solution, and click Configure.
c In the Manage Solution dialog box, click Define Monitoring Goals.
d Under Enable vSphere Hardening Guide Alerts, click Yes and click Save.
e When vRealize Operations Manager reports that the default policy is configured to collectcompliance data on your objects, click OK and click Close.
2 Enable the compliance alert definitions in the default policy.
a Click Policies > Policy Library.
b Click the Default Policy, and click Edit Selected Policy.
c In the Edit Monitoring Policy workspace on the left, click Alert / Symptom Definitions.
vRealize Operations Manager Customization and Administration Guide
74 VMware, Inc.
d In the filter text box in the Alert Definitions pane, enter hardening.
Several alert definitions appear, which you use to enforce compliance on your objects. Each alertdisplays the number of symptoms and the object type to which the alert applies. You can see thealert definitions for risk profiles 1, 2, and 3, which you use to ensure high, medium, or low securityon your virtual machines.
e Click the alert named vCenter is violating vSphere Hardening Guide.
f In the State column, click the down arrow, and select Local.
g To enable compliance alerts on your virtual machines, distributed port groups, and distributedswitches, enable the other alert definitions, and click Save.
3 View the symptom set in the alert definition for the ESXi host.
a Click Content > Alert Definitions.
b In the filter text box, enter hardening.
c Click the alert named vCenter is violating vSphere Hardening Guide.
d In the lower pane, locate the alert impact, criticality, and symptom set.
e Scroll through the symptom set and examine the symptoms, which can trigger an alert, for the host.
f Below the symptom set, examine the recommendation to fix the problem if this alert triggers onyour host.
g Click the link to the VMware vSphere Hardening Guide.
The Web page opens to the list of VMware vSphere Security Hardening Guides at http://www.vmware.com/security/hardening-guides.html.
Chapter 3 Customizing How vRealize Operations Manager Monitors Your Environment
VMware, Inc. 75
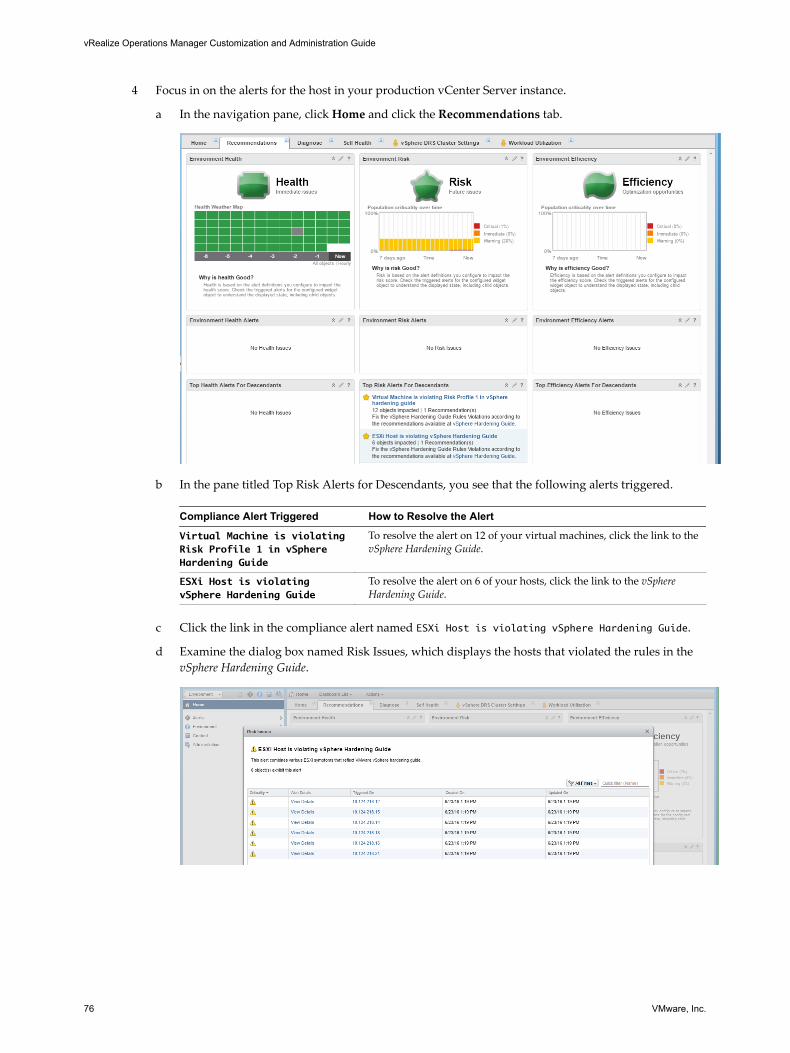
4 Focus in on the alerts for the host in your production vCenter Server instance.
a In the navigation pane, click Home and click the Recommendations tab.
b In the pane titled Top Risk Alerts for Descendants, you see that the following alerts triggered.
Compliance Alert Triggered How to Resolve the Alert
Virtual Machine is violatingRisk Profile 1 in vSphereHardening Guide
To resolve the alert on 12 of your virtual machines, click the link to thevSphere Hardening Guide.
ESXi Host is violatingvSphere Hardening Guide
To resolve the alert on 6 of your hosts, click the link to the vSphereHardening Guide.
c Click the link in the compliance alert named ESXi Host is violating vSphere Hardening Guide.
d Examine the dialog box named Risk Issues, which displays the hosts that violated the rules in thevSphere Hardening Guide.
vRealize Operations Manager Customization and Administration Guide
76 VMware, Inc.
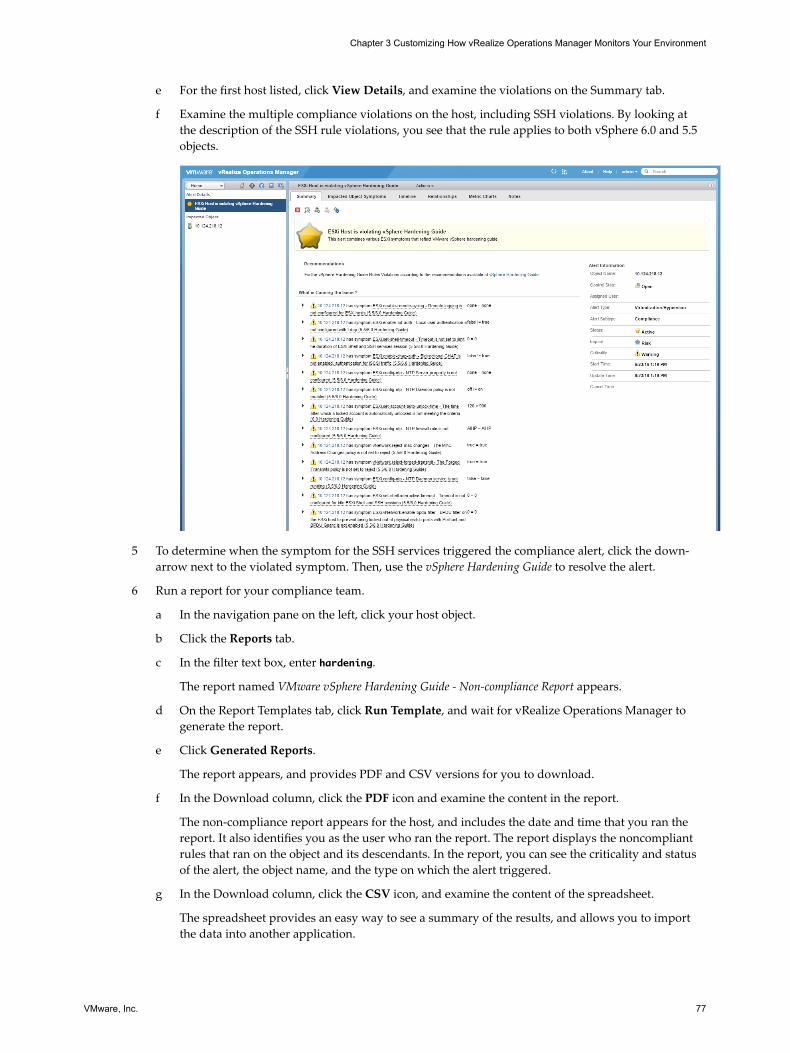
e For the first host listed, click View Details, and examine the violations on the Summary tab.
f Examine the multiple compliance violations on the host, including SSH violations. By looking atthe description of the SSH rule violations, you see that the rule applies to both vSphere 6.0 and 5.5objects.
5 To determine when the symptom for the SSH services triggered the compliance alert, click the down-arrow next to the violated symptom. Then, use the vSphere Hardening Guide to resolve the alert.
6 Run a report for your compliance team.
a In the navigation pane on the left, click your host object.
b Click the Reports tab.
c In the filter text box, enter hardening.
The report named VMware vSphere Hardening Guide - Non-compliance Report appears.
d On the Report Templates tab, click Run Template, and wait for vRealize Operations Manager togenerate the report.
e Click Generated Reports.
The report appears, and provides PDF and CSV versions for you to download.
f In the Download column, click the PDF icon and examine the content in the report.
The non-compliance report appears for the host, and includes the date and time that you ran thereport. It also identifies you as the user who ran the report. The report displays the noncompliantrules that ran on the object and its descendants. In the report, you can see the criticality and statusof the alert, the object name, and the type on which the alert triggered.
g In the Download column, click the CSV icon, and examine the content of the spreadsheet.
The spreadsheet provides an easy way to see a summary of the results, and allows you to importthe data into another application.
Chapter 3 Customizing How vRealize Operations Manager Monitors Your Environment
VMware, Inc. 77
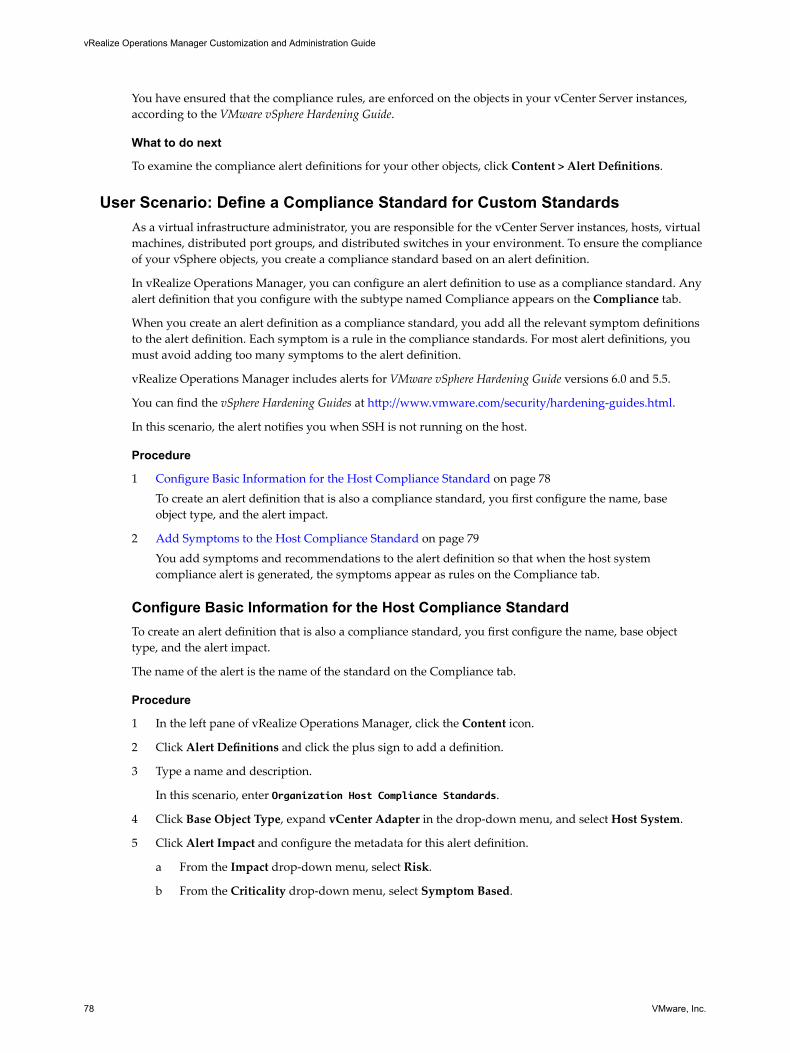
You have ensured that the compliance rules, are enforced on the objects in your vCenter Server instances,according to the VMware vSphere Hardening Guide.
What to do next
To examine the compliance alert definitions for your other objects, click Content > Alert Definitions.
User Scenario: Define a Compliance Standard for Custom StandardsAs a virtual infrastructure administrator, you are responsible for the vCenter Server instances, hosts, virtualmachines, distributed port groups, and distributed switches in your environment. To ensure the complianceof your vSphere objects, you create a compliance standard based on an alert definition.
In vRealize Operations Manager, you can configure an alert definition to use as a compliance standard. Anyalert definition that you configure with the subtype named Compliance appears on the Compliance tab.
When you create an alert definition as a compliance standard, you add all the relevant symptom definitionsto the alert definition. Each symptom is a rule in the compliance standards. For most alert definitions, youmust avoid adding too many symptoms to the alert definition.
vRealize Operations Manager includes alerts for VMware vSphere Hardening Guide versions 6.0 and 5.5.
You can find the vSphere Hardening Guides at http://www.vmware.com/security/hardening-guides.html.
In this scenario, the alert notifies you when SSH is not running on the host.
Procedure
1 Configure Basic Information for the Host Compliance Standard on page 78To create an alert definition that is also a compliance standard, you first configure the name, baseobject type, and the alert impact.
2 Add Symptoms to the Host Compliance Standard on page 79You add symptoms and recommendations to the alert definition so that when the host systemcompliance alert is generated, the symptoms appear as rules on the Compliance tab.
Configure Basic Information for the Host Compliance StandardTo create an alert definition that is also a compliance standard, you first configure the name, base objecttype, and the alert impact.
The name of the alert is the name of the standard on the Compliance tab.
Procedure
1 In the left pane of vRealize Operations Manager, click the Content icon.
2 Click Alert Definitions and click the plus sign to add a definition.
3 Type a name and description.
In this scenario, enter Organization Host Compliance Standards.
4 Click Base Object Type, expand vCenter Adapter in the drop-down menu, and select Host System.
5 Click Alert Impact and configure the metadata for this alert definition.
a From the Impact drop-down menu, select Risk.
b From the Criticality drop-down menu, select Symptom Based.
vRealize Operations Manager Customization and Administration Guide
78 VMware, Inc.
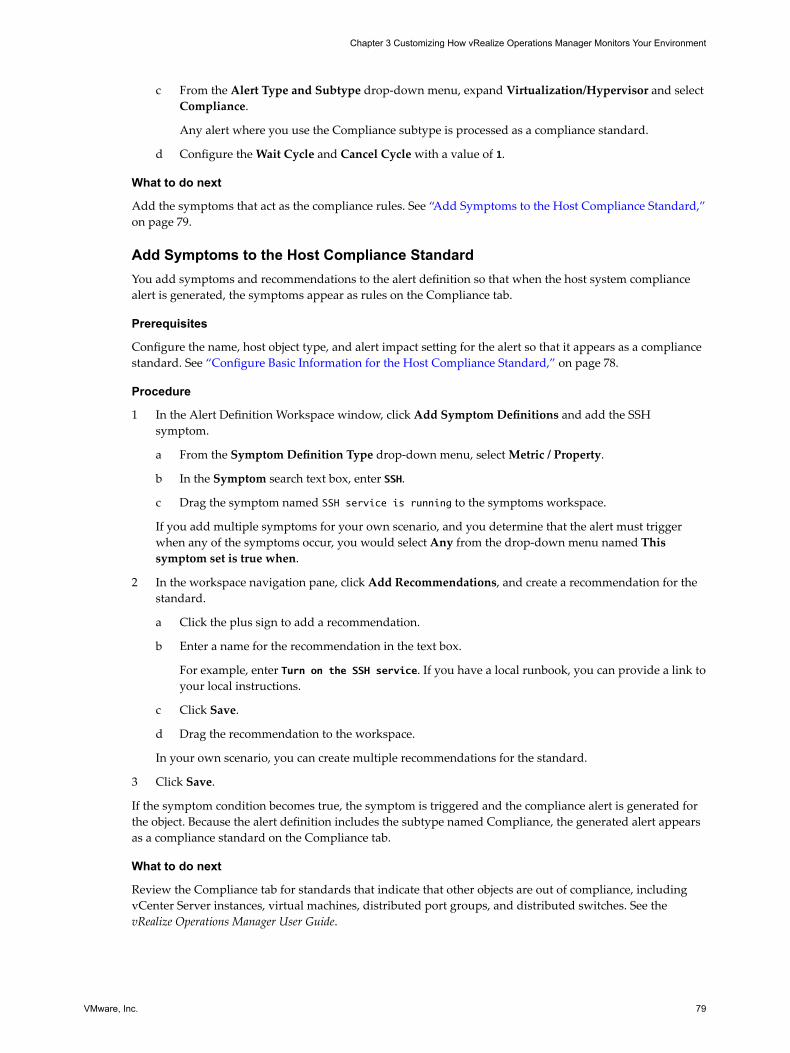
c From the Alert Type and Subtype drop-down menu, expand Virtualization/Hypervisor and selectCompliance.
Any alert where you use the Compliance subtype is processed as a compliance standard.
d Configure the Wait Cycle and Cancel Cycle with a value of 1.
What to do next
Add the symptoms that act as the compliance rules. See “Add Symptoms to the Host Compliance Standard,”on page 79.
Add Symptoms to the Host Compliance StandardYou add symptoms and recommendations to the alert definition so that when the host system compliancealert is generated, the symptoms appear as rules on the Compliance tab.
Prerequisites
Configure the name, host object type, and alert impact setting for the alert so that it appears as a compliancestandard. See “Configure Basic Information for the Host Compliance Standard,” on page 78.
Procedure
1 In the Alert Definition Workspace window, click Add Symptom Definitions and add the SSHsymptom.
a From the Symptom Definition Type drop-down menu, select Metric / Property.
b In the Symptom search text box, enter SSH.
c Drag the symptom named SSH service is running to the symptoms workspace.
If you add multiple symptoms for your own scenario, and you determine that the alert must triggerwhen any of the symptoms occur, you would select Any from the drop-down menu named Thissymptom set is true when.
2 In the workspace navigation pane, click Add Recommendations, and create a recommendation for thestandard.
a Click the plus sign to add a recommendation.
b Enter a name for the recommendation in the text box.
For example, enter Turn on the SSH service. If you have a local runbook, you can provide a link toyour local instructions.
c Click Save.
d Drag the recommendation to the workspace.
In your own scenario, you can create multiple recommendations for the standard.
3 Click Save.
If the symptom condition becomes true, the symptom is triggered and the compliance alert is generated forthe object. Because the alert definition includes the subtype named Compliance, the generated alert appearsas a compliance standard on the Compliance tab.
What to do next
Review the Compliance tab for standards that indicate that other objects are out of compliance, includingvCenter Server instances, virtual machines, distributed port groups, and distributed switches. See thevRealize Operations Manager User Guide.
Chapter 3 Customizing How vRealize Operations Manager Monitors Your Environment
VMware, Inc. 79
Operational PoliciesDetermine how to have vRealize Operations Manager monitor your objects, and how to notify you aboutproblems that occur with those objects.
vRealize Operations Manager Administrators assign policies to object groups and applications to supportService Level Agreements (SLAs) and business priorities. When you use policies with object groups, youensure that the rules defined in the policies are quickly put into effect for the objects in your environment.
With policies, you can:
n Enable and disable alerts.
n Control data collections by persisting or not persisting metrics on the objects in your environment.
n Configure the product analytics and thresholds.
n Monitor objects and applications at different service levels.
n Prioritize policies so that the most important rules override the defaults.
n Understand the rules that affect the analytics.
n Understand which policies apply to object groups.
vRealize Operations Manager includes a library of built-in active policies that are already defined for youruse. vRealize Operations Manager applies these policies in priority order.
Create Operational Policies (http://link.brightcove.com/services/player/bcpid2296383276001?bctid=ref:video_create_policies_vrom)
When you apply a policy to an object group, vRealize Operations Manager collects data from the objects inthe object group based on the thresholds, metrics, super metrics, attributes, properties, alert definitions, andproblem definitions that are enabled in the policy.
The following examples of policies might exist for a typical IT environment.
n Maintenance: Optimized for ongoing monitoring, with no thresholds or alerts.
n Critical Production: Production environment ready, optimized for performance with sensitive alerting.
n Important Production: Production environment ready, optimized for performance with mediumalerting.
n Batch Workloads: Optimized to process jobs.
n Test, Staging, and QA: Less critical settings, fewer alerts.
n Development: Less critical settings, no alerts.
n Low Priority: Ensures efficient use of resources.
n Default Policy: Default system settings.
vRealize Operations Manager Customization and Administration Guide
80 VMware, Inc.
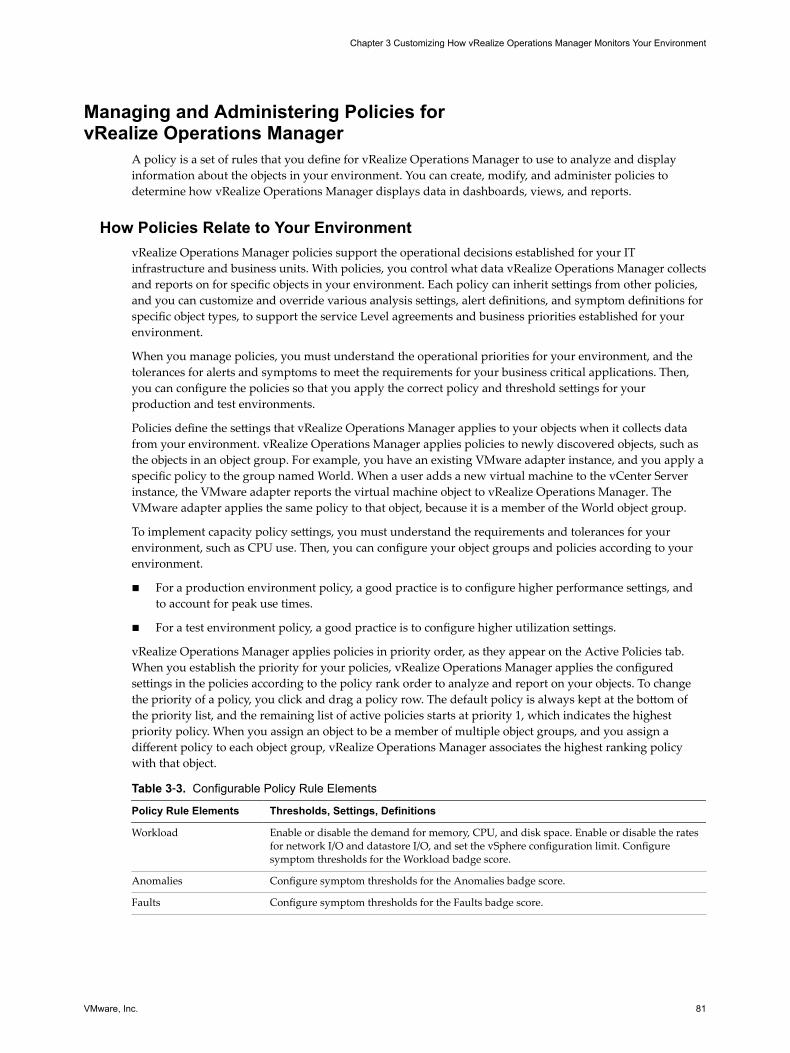
Managing and Administering Policies forvRealize Operations Manager
A policy is a set of rules that you define for vRealize Operations Manager to use to analyze and displayinformation about the objects in your environment. You can create, modify, and administer policies todetermine how vRealize Operations Manager displays data in dashboards, views, and reports.
How Policies Relate to Your EnvironmentvRealize Operations Manager policies support the operational decisions established for your ITinfrastructure and business units. With policies, you control what data vRealize Operations Manager collectsand reports on for specific objects in your environment. Each policy can inherit settings from other policies,and you can customize and override various analysis settings, alert definitions, and symptom definitions forspecific object types, to support the service Level agreements and business priorities established for yourenvironment.
When you manage policies, you must understand the operational priorities for your environment, and thetolerances for alerts and symptoms to meet the requirements for your business critical applications. Then,you can configure the policies so that you apply the correct policy and threshold settings for yourproduction and test environments.
Policies define the settings that vRealize Operations Manager applies to your objects when it collects datafrom your environment. vRealize Operations Manager applies policies to newly discovered objects, such asthe objects in an object group. For example, you have an existing VMware adapter instance, and you apply aspecific policy to the group named World. When a user adds a new virtual machine to the vCenter Serverinstance, the VMware adapter reports the virtual machine object to vRealize Operations Manager. TheVMware adapter applies the same policy to that object, because it is a member of the World object group.
To implement capacity policy settings, you must understand the requirements and tolerances for yourenvironment, such as CPU use. Then, you can configure your object groups and policies according to yourenvironment.
n For a production environment policy, a good practice is to configure higher performance settings, andto account for peak use times.
n For a test environment policy, a good practice is to configure higher utilization settings.
vRealize Operations Manager applies policies in priority order, as they appear on the Active Policies tab.When you establish the priority for your policies, vRealize Operations Manager applies the configuredsettings in the policies according to the policy rank order to analyze and report on your objects. To changethe priority of a policy, you click and drag a policy row. The default policy is always kept at the bottom ofthe priority list, and the remaining list of active policies starts at priority 1, which indicates the highestpriority policy. When you assign an object to be a member of multiple object groups, and you assign adifferent policy to each object group, vRealize Operations Manager associates the highest ranking policywith that object.
Table 3‑3. Configurable Policy Rule Elements
Policy Rule Elements Thresholds, Settings, Definitions
Workload Enable or disable the demand for memory, CPU, and disk space. Enable or disable the ratesfor network I/O and datastore I/O, and set the vSphere configuration limit. Configuresymptom thresholds for the Workload badge score.
Anomalies Configure symptom thresholds for the Anomalies badge score.
Faults Configure symptom thresholds for the Faults badge score.
Chapter 3 Customizing How vRealize Operations Manager Monitors Your Environment
VMware, Inc. 81
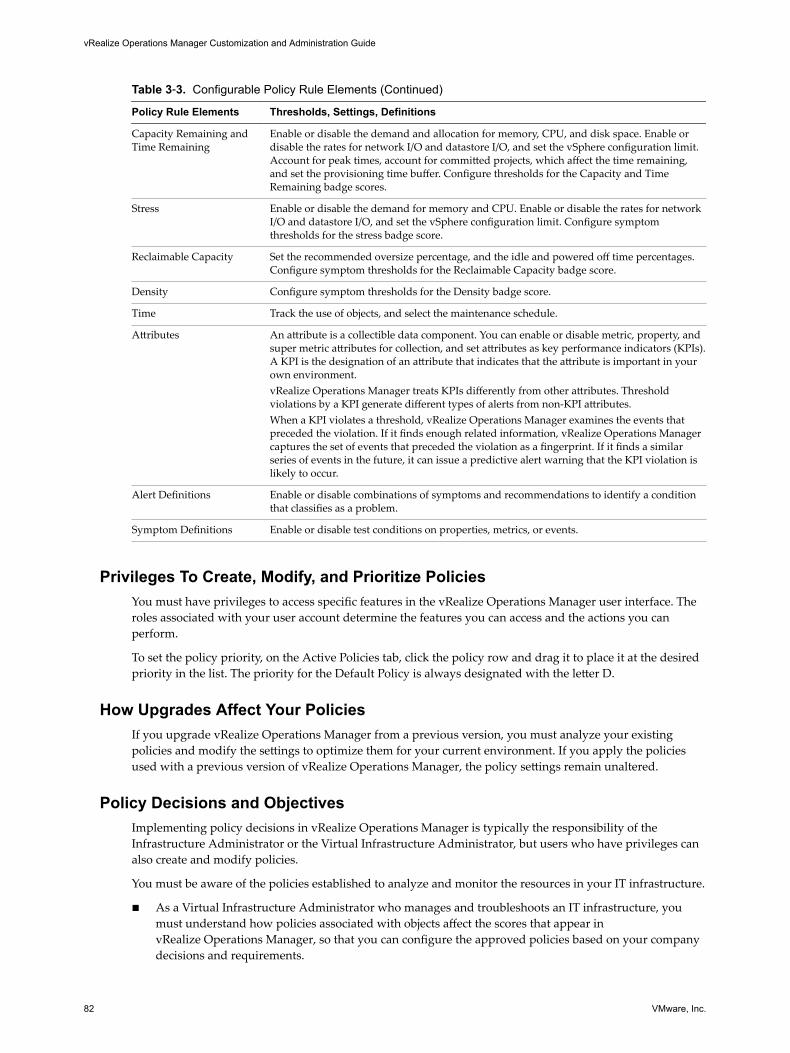
Table 3‑3. Configurable Policy Rule Elements (Continued)
Policy Rule Elements Thresholds, Settings, Definitions
Capacity Remaining andTime Remaining
Enable or disable the demand and allocation for memory, CPU, and disk space. Enable ordisable the rates for network I/O and datastore I/O, and set the vSphere configuration limit.Account for peak times, account for committed projects, which affect the time remaining,and set the provisioning time buffer. Configure thresholds for the Capacity and TimeRemaining badge scores.
Stress Enable or disable the demand for memory and CPU. Enable or disable the rates for networkI/O and datastore I/O, and set the vSphere configuration limit. Configure symptomthresholds for the stress badge score.
Reclaimable Capacity Set the recommended oversize percentage, and the idle and powered off time percentages.Configure symptom thresholds for the Reclaimable Capacity badge score.
Density Configure symptom thresholds for the Density badge score.
Time Track the use of objects, and select the maintenance schedule.
Attributes An attribute is a collectible data component. You can enable or disable metric, property, andsuper metric attributes for collection, and set attributes as key performance indicators (KPIs).A KPI is the designation of an attribute that indicates that the attribute is important in yourown environment.vRealize Operations Manager treats KPIs differently from other attributes. Thresholdviolations by a KPI generate different types of alerts from non-KPI attributes.When a KPI violates a threshold, vRealize Operations Manager examines the events thatpreceded the violation. If it finds enough related information, vRealize Operations Managercaptures the set of events that preceded the violation as a fingerprint. If it finds a similarseries of events in the future, it can issue a predictive alert warning that the KPI violation islikely to occur.
Alert Definitions Enable or disable combinations of symptoms and recommendations to identify a conditionthat classifies as a problem.
Symptom Definitions Enable or disable test conditions on properties, metrics, or events.
Privileges To Create, Modify, and Prioritize PoliciesYou must have privileges to access specific features in the vRealize Operations Manager user interface. Theroles associated with your user account determine the features you can access and the actions you canperform.
To set the policy priority, on the Active Policies tab, click the policy row and drag it to place it at the desiredpriority in the list. The priority for the Default Policy is always designated with the letter D.
How Upgrades Affect Your PoliciesIf you upgrade vRealize Operations Manager from a previous version, you must analyze your existingpolicies and modify the settings to optimize them for your current environment. If you apply the policiesused with a previous version of vRealize Operations Manager, the policy settings remain unaltered.
Policy Decisions and ObjectivesImplementing policy decisions in vRealize Operations Manager is typically the responsibility of theInfrastructure Administrator or the Virtual Infrastructure Administrator, but users who have privileges canalso create and modify policies.
You must be aware of the policies established to analyze and monitor the resources in your IT infrastructure.
n As a Virtual Infrastructure Administrator who manages and troubleshoots an IT infrastructure, youmust understand how policies associated with objects affect the scores that appear invRealize Operations Manager, so that you can configure the approved policies based on your companydecisions and requirements.
vRealize Operations Manager Customization and Administration Guide
82 VMware, Inc.
n If you are a Network Operations engineer, you must understand how policies affect the data thatvRealize Operations Manager reports on objects, and which policies assigned to objects report alertsand issues.
n If you are the person whose role is to recommend an initial setup for policies, you typically edit andconfigure the policies in vRealize Operations Manager.
n If your primary role is to assess problems that occur in your environment, but you do not have theresponsibility to change the policies, you must still understand how the policies applied to objects affectthe data that appears in vRealize Operations Manager. For example, you might need to know whichpolicies apply to objects that are associated with particular alerts.
n If you are a typical application user who receives reports from vRealize Operations Manager, you musthave a high-level understanding of the operational policies so that you can understand the reporteddata values.
Default Policy in vRealize Operations ManagerThe default policy is a set of rules that applies to the majority of your objects.
The Default policy appears on the Active Policies tab, and is marked with the letter D in the Prioritycolumn. The Default policy can apply to any number of objects.
The Default policy always appears at the bottom in the list of policies, even if that policy is not associatedwith an object group. When an object group does not have a policy applied, vRealize Operations Managerassociates the Default policy with that group.
A policy can inherit the Default policy settings, and those settings can apply to various objects under severalconditions.
The policy that is set to Default always takes the lowest priority. If you attempt to set two policies as theDefault policy, the first policy that you set to Default is initially set to the lowest priority. When you set thesecond policy to Default, that policy then takes the lowest priority, and the earlier policy that you set toDefault is set to the second lowest priority.
You can use the Default policy as the base policy to create your own custom policy. You modify the defaultpolicy settings to create a policy that meets your analysis and monitoring needs. When you start with theDefault policy, your new policy inherits all of the settings from the Default base policy. You can thencustomize your new policy and override these settings.
The data adapters and solutions installed in vRealize Operations Manager provide a collective group of basesettings that apply to all objects. In the policy navigation tree on the Policy Library tab, these settings arecalled Base Settings. The Default policy inherits all of the base settings by default.
Custom PoliciesYou can customize the default policy and base policies included with vRealize Operations Manager for yourown environment. You can then apply your custom policy to groups of objects, such as the objects in acluster, or virtual machines and hosts, or to a group that you create to include unique objects and specificcriteria.
You must be familiar with the policies so that you can understand the data that appears in the user interface,because policies drive the results that appear in the vRealize Operations Manager dashboards, views, andreports.
To determine how to customize operational policies and apply them to your environment, you must planahead. For example:
n Must you track CPU allocation? If you overallocate CPU, what percentage must you apply to yourproduction and test objects?
n Will you overallocate memory or storage? If you use High Availability, what buffers must you use?
Chapter 3 Customizing How vRealize Operations Manager Monitors Your Environment
VMware, Inc. 83
n How do you classify your logically defined workloads, such as production clusters, test or developmentclusters, and clusters used for batch workloads? Or, do you include all clusters in a single workload?
n How do you capture peak use times or spikes in system activity? In some cases, you might need toreduce alerts so that they are meaningful when you apply policies.
When you have privileges applied to your user account through the roles assigned, you can create andmodify policies, and apply them to objects. For example:
n Create a policy from an existing base policy, inherit the base policy settings, then override specificsettings to analyze and monitor your objects.
n Use policies to analyze and monitor vCenter Server objects and non-vCenter Server objects.
n Set custom thresholds for analysis settings on all object types to have vRealize Operations Managerreport on workload, anomalies, faults, capacity, stress, and so on.
n Enable specific attributes for collection, including metrics, properties, and super metrics.
n Enable or disable alert definitions and symptom definitions in your custom policy settings.
n Apply the custom policy to object groups.
When you use an existing policy to create a custom policy, you override the policy settings to meet your ownneeds. You set the allocation and demand, the overcommit ratios for CPU and memory, and the thresholdsfor capacity risk and buffers. To allocate and configure what your environment is actually using, you use theallocation model and the demand model together. Depending on the type of environment you monitor, suchas a production environment versus a test or development environment, whether you over allocate at alland by how much depends on the workloads and environment to which the policy applies. You might bemore conservative with the level of allocation in your test environment and less conservative in yourproduction environment.
vRealize Operations Manager applies policies in priority order, as they appear on the Active Policies tab.When you establish the priority for your policies, vRealize Operations Manager applies the configuredsettings in the policies according to the policy rank order to analyze and report on your objects. To changethe priority of a policy, you click and drag a policy row. The default policy is always kept at the bottom ofthe priority list, and the remaining list of active policies starts at priority 1, which indicates the highestpriority policy. When you assign an object to be a member of multiple object groups, and you assign adifferent policy to each object group, vRealize Operations Manager associates the highest ranking policywith that object.
Your policies are unique to your environment. Because policies direct vRealize Operations Manager tomonitor the objects in your environment, they are read-only and do not alter the state of your objects. Forthis reason, you can override the policy settings to fine-tune them until vRealize Operations Managerdisplays the results that are meaningful and that affect for your environment. For example, you can adjustthe capacity buffer settings in your policy, and then view the data that appears in the dashboards to see theeffect of the policy settings.
Policies Provided with vRealize Operations ManagervRealize Operations Manager includes sets of policies that you can use to monitor your environment, or asthe starting point to create your own policies.
Verify that you are familiar with the policies provided with vRealize Operations Manager so that you canuse them in your own environment, and to include settings in new policies that you create.
Where You Find the Policies Provided with vRealize Operations Manager PoliciesClick Administration, click Policies, click the Policy Library tab. To see the policies provided withvRealize Operations Manager, expand the Base Settings policy.
vRealize Operations Manager Customization and Administration Guide
84 VMware, Inc.
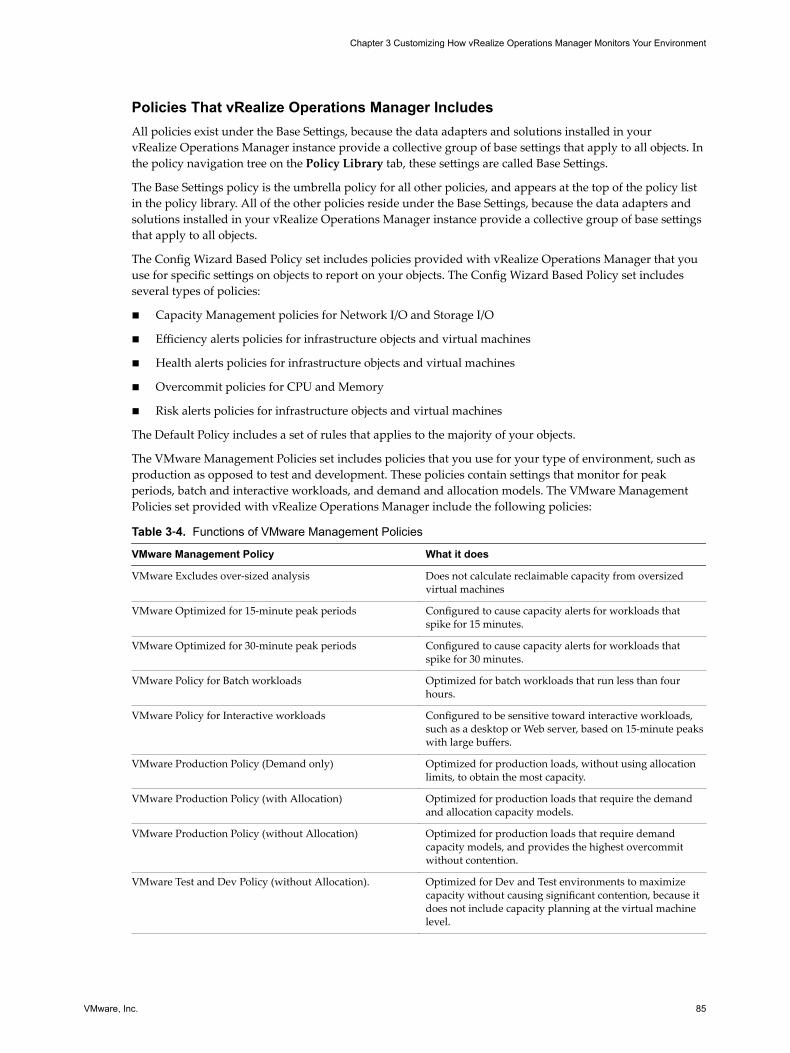
Policies That vRealize Operations Manager IncludesAll policies exist under the Base Settings, because the data adapters and solutions installed in yourvRealize Operations Manager instance provide a collective group of base settings that apply to all objects. Inthe policy navigation tree on the Policy Library tab, these settings are called Base Settings.
The Base Settings policy is the umbrella policy for all other policies, and appears at the top of the policy listin the policy library. All of the other policies reside under the Base Settings, because the data adapters andsolutions installed in your vRealize Operations Manager instance provide a collective group of base settingsthat apply to all objects.
The Config Wizard Based Policy set includes policies provided with vRealize Operations Manager that youuse for specific settings on objects to report on your objects. The Config Wizard Based Policy set includesseveral types of policies:
n Capacity Management policies for Network I/O and Storage I/O
n Efficiency alerts policies for infrastructure objects and virtual machines
n Health alerts policies for infrastructure objects and virtual machines
n Overcommit policies for CPU and Memory
n Risk alerts policies for infrastructure objects and virtual machines
The Default Policy includes a set of rules that applies to the majority of your objects.
The VMware Management Policies set includes policies that you use for your type of environment, such asproduction as opposed to test and development. These policies contain settings that monitor for peakperiods, batch and interactive workloads, and demand and allocation models. The VMware ManagementPolicies set provided with vRealize Operations Manager include the following policies:
Table 3‑4. Functions of VMware Management Policies
VMware Management Policy What it does
VMware Excludes over-sized analysis Does not calculate reclaimable capacity from oversizedvirtual machines
VMware Optimized for 15-minute peak periods Configured to cause capacity alerts for workloads thatspike for 15 minutes.
VMware Optimized for 30-minute peak periods Configured to cause capacity alerts for workloads thatspike for 30 minutes.
VMware Policy for Batch workloads Optimized for batch workloads that run less than fourhours.
VMware Policy for Interactive workloads Configured to be sensitive toward interactive workloads,such as a desktop or Web server, based on 15-minute peakswith large buffers.
VMware Production Policy (Demand only) Optimized for production loads, without using allocationlimits, to obtain the most capacity.
VMware Production Policy (with Allocation) Optimized for production loads that require the demandand allocation capacity models.
VMware Production Policy (without Allocation) Optimized for production loads that require demandcapacity models, and provides the highest overcommitwithout contention.
VMware Test and Dev Policy (without Allocation). Optimized for Dev and Test environments to maximizecapacity without causing significant contention, because itdoes not include capacity planning at the virtual machinelevel.
Chapter 3 Customizing How vRealize Operations Manager Monitors Your Environment
VMware, Inc. 85
User Scenario: Create a Custom Operational Policy for a vSphere ProductionEnvironment
As a system administrator of vRealize Operations Manager, you are responsible for ensuring that the objectsin your vSphere environment conform to specific policies. You must ensure that your objects have enoughmemory and CPU to support your Test, Development, and Production environments.
Large IT environments might include four to six production environments that are organized according toobject types, with a minor policy applied to each area. These large environments typically include a defaultpolicy, a single production policy that applies to the entire environment, and individual policies fordedicated areas.
You typically apply a default policy to most of the objects in your environment. To havevRealize Operations Manager monitor and analyze dedicated groups of objects, you create a separate policyfor each object group, and make only minor changes in the settings for that policy. For example, you mightapply a default operational policy for all of the objects in your vSphere production environment, but youalso need to closely track the health and risk of virtual SQL Server instances, including their capacity levels.To have vRealize Operations Manager analyze only the virtual SQL Server instances, and to monitor them,you create a separate, dedicated policy and apply that policy to that group of objects. The settings in thepolicy that you create to monitor the virtual SQL Server instances differs only slightly from the mainproduction policy.
This scenario shows you how to use multiple policies to analyze and monitor specific objects, so that youcan manage them to ensure continuous operation. In this scenario, your vSphere production environment isone part of your overall production environment. You must create a custom operational policy to monitorthe virtual SQL Server objects in your vSphere production environment.
Prerequisites
n Understand the purpose of using a policy. See “Managing and Administering Policies for vRealizeOperations Manager,” on page 81.
n Verify that your vRealize Operations Manager instance is working properly.
n Verify that your vRealize Operations Manager instance includes the Default Policy and one or moreother policies. See “Default Policy in vRealize Operations Manager,” on page 83.
n Understand the sections and elements in the policy, such as the attributes, alert and symptomdefinitions, and how the policy inherits settings from the base policies that you select. See “PolicyWorkspace in vRealize Operations Manager,” on page 102.
n Understand the analysis settings in the policy, such as capacity remaining and stress on hosts andvirtual machines, and the actions used to override the settings inherited from the base policies. See thevRealize Operations Manager Information Center.
Procedure
1 Determine the vSphere Operational Requirements on page 87You must continuously monitor the capacity levels of your virtual SQL Server machines, and havevRealize Operations Manager notify you about any degradation in the performance of these objects.You want vRealize Operations Manager to notify you 60 days before these objects begin to experienceproblems with their capacity levels.
2 Create a Policy to Meet vSphere Operational Needs on page 88You will create an operational policy for your virtual SQL Server instances, where only these settingsdiffer from the main production policy. In this policy, you change the memory and CPU settings forspecific objects. You then configure vRealize Operations Manager to send alerts to you when theperformance degrades on your virtual SQL Servers.
vRealize Operations Manager Customization and Administration Guide
86 VMware, Inc.
3 Configure the Custom Policy Settings to Analyze and Report on vSphere Objects on page 90You use different policy requirements for your Development, Test, and Production environments sothat you can configure the specific policy settings for vRealize Operations Manager to analyze andreport on your objects, including your virtual SQL Servers.
4 Apply the Custom Policy to vSphere Object Groups on page 91You create an object group type to categorize your virtual SQL Server machines. Then you create anobject group that contains your virtual SQL Server machines, and apply your custom policy to thisgroup of SQL Server virtual machine objects.
What to do next
After you finish this scenario, you must wait for vRealize Operations Manager to collect data from theobjects in your environment. When a violation of the policy thresholds occur, vRealize Operations Managersends an alert to notify you of the problem. If you continuously monitor the state of your objects, you arealways aware of the state of the objects in your environment, and do not need to wait forvRealize Operations Manager to send alerts.
Create a custom dashboard so that you can monitor the virtual SQL Server objects and address problemsthat occur. See “Using Dashboards,” on page 27.
Determine the vSphere Operational RequirementsYou must continuously monitor the capacity levels of your virtual SQL Server machines, and havevRealize Operations Manager notify you about any degradation in the performance of these objects. Youwant vRealize Operations Manager to notify you 60 days before these objects begin to experience problemswith their capacity levels.
Your VP of Infrastructure has defined a default operational policy and a main production policy for all ofthe objects in your production environment, and your IT Director has applied these policies to yourproduction environments. Although the main production policy handles the operational monitoring needsfor most of your objects, your manager requires that you be notified about any degradation in theperformance of your production virtual SQL Server machines. You have vRealize Operations Managercontinuously monitor the capacity levels of your virtual SQL Servers so that you can address problems thatoccur. You have vRealize Operations Manager notify you 60 days before your virtual SQL Servers begin toexperience problems with their capacity levels.
Your IT department divided objects into dedicated groups that support the Development, Test, andProduction areas. You must use vRealize Operations Manager to continually track and assess the health andrisk of the objects in each of these areas.
In this scenario, you create an operational management policy to analyze, monitor, and troubleshoot yourobjects. You then monitor the results in custom dashboards.
You must first determine the vSphere operational requirements so that you can understand the analysissettings required for your policy. You can then create a policy to monitor your virtual SQL Server objects,and configure the custom policy to include minor differences in the settings for the main production policy.
When you create the custom policy to analyze and monitor your virtual SQL Servers, you configure theanalysis settings so that vRealize Operations Manager analyzes specific objects and report the results in thedashboards. You then apply the policy to groups of virtual SQL Server objects.
Prerequisites
Verify that the following conditions are met:
n You understand the context of this scenario. See “User Scenario: Create a Custom Operational Policy fora vSphere Production Environment,” on page 86.
n A default policy and a main production policy are in effect for all of the objects in your vSphereproduction environment.
Chapter 3 Customizing How vRealize Operations Manager Monitors Your Environment
VMware, Inc. 87
Procedure
1 Determine the operational requirements for your vSphere production environment.
In this scenario, the following requirements will be applied to the environment.
2 Develop a plan to create a custom operational policy that meets the requirements to analyze andmonitor the objects in your environment.
a Ensure that virtual SQL Servers continuously have adequate memory and CPU capacity.
b Ensure that you do not overcommit memory on your production virtual SQL Servers.
c Overcommit only a small percentage of the CPUs on your SQL Servers.
In this scenario, you set the value to 2. In some production environments, a typical value might be4.
d Ensure that vRealize Operations Manager alerts you if the capacity of your virtual SQL Serversdrops below the defined thresholds.
e Set the Co-Stop value on your production virtual SQL Servers to an acceptable level so that the SQLServers do not experience delay because of CPU scheduling contention.
f Determine whether to overcommit compute resources for certain ratios.
After you plan the custom policy requirements, you can implement the policy.
What to do next
Create an operational policy for your virtual SQL Server instances.
Create a Policy to Meet vSphere Operational NeedsYou will create an operational policy for your virtual SQL Server instances, where only these settings differfrom the main production policy. In this policy, you change the memory and CPU settings for specificobjects. You then configure vRealize Operations Manager to send alerts to you when the performancedegrades on your virtual SQL Servers.
In this procedure, you create a dedicated policy for a subset of virtual SQL Server objects, and changesettings for the memory and CPU capacity for your virtual SQL Server instances. At this point in thescenario, your custom policy has only minor differences from the production policy.
The difference between the main production policy and your virtual SQL Server policy is in theovercommitment of compute resources. For the SQL Server policy, you do not overcommit computeresources. You have the SQL server policy inherit most of the settings from your overall production policy,except that you change the capacity settings that apply directly to the virtual SQL servers.
After you apply the main production policy to your entire production environment, you create thededicated policy, have it inherit settings from the main policy, and make minor changes to settings in thededicated policy to adjust the capacity levels for your virtual SQL Servers.
To create this policy, you choose a cluster that contains the data center and the vCenter Server that will usethis policy. You make minor changes for all of the objects, including the cluster, data center, host system,resource pools, and the virtual machine resource containers.
Prerequisites
Verify that the following conditions are met:
n You know the vSphere operational requirements. See “Determine the vSphere OperationalRequirements,” on page 87.
n A default policy is in effect for your entire production environment of vSphere objects.
vRealize Operations Manager Customization and Administration Guide
88 VMware, Inc.
Procedure
1 In vRealize Operations Manager, select Administration > Policies.
The Active Policies tab displays the current policies in effect.
2 Click the Policy Library tab, and click the plus sign to add a custom policy.
3 In the workspace navigation pane, click Getting Started and define the basic information for the policy.
a In the Name text box, enter vSphere Production Virtual SQL Servers.
b In the Description text box, enter Analyze capacity of virtual SQL Servers.
c To start with a base policy, select Default Policy from the Start with drop-down menu.
4 View the policy configuration settings.
a In the policy workspace, click Select Base Policies.
b To view the policy configuration for virtual machine objects, click the Show changes for drop-down menu, click vCenter Adapter - Virtual Machine, and click the Show object type filter.
The Virtual Machine policy configuration appears in the right pane.
c To view the inherited settings, in the Policy Preview pane, click Configuration inherited from basepolicy.
5 In the workspace navigation, click Analysis Settings.
6 In the workspace navigation, add the following object types to the list so that you can change theirsettings.
a Click the drop-down arrow, click vCenter Adapter - Cluster Compute Resource, and click thefilter.
b Click the drop-down arrow, click vCenter Adapter - Data Center, and click the filter.
c Click the drop-down arrow, click vCenter Adapter - Host System, and click the filter.
d Click the drop-down arrow, click vCenter Adapter - Resource Pool, and click the filter.
e Click the drop-down arrow, click vCenter Adapter - Virtual Machine, and click the filter.
The analysis settings for these object types appear in the right pane.
7 On the Cluster Compute Resource bar, click the double arrows to expand the list of analysis settings.
8 Locate Capacity Remaining Time Remaining and click the lock button to enable changes.
9 In the resource table, set the overcommit for Memory Allocation value to 0 so thatvRealize Operations Manager does not overcommit these objects for your SQL Server policy.
10 In the resource table, set the overcommit ratio for CPU Allocation to 2 so thatvRealize Operations Manager overcommits a 2:1 ratio for CPU allocation on each SQL Server.
11 Repeat Step 7 through Step 10 for each object type that you added to the right pane.
12 Click Save.
You created a policy and made minor changes to settings so that vRealize Operations Manager can analyzeand report on your SQL Server objects.
What to do next
Configure the alert definitions and symptom definitions for your SQL Server policy. You will apply thepolicy to your SQL Server object groups.
Chapter 3 Customizing How vRealize Operations Manager Monitors Your Environment
VMware, Inc. 89
Configure the Custom Policy Settings to Analyze and Report on vSphere ObjectsYou use different policy requirements for your Development, Test, and Production environments so that youcan configure the specific policy settings for vRealize Operations Manager to analyze and report on yourobjects, including your virtual SQL Servers.
This scenario presents several typical cases where you might be required to differentiate between the policyrequirements for Development, Test, and Production environments.
n For your Development and Test environments, you might not be concerned if the objects in theseenvironments experience network redundancy loss, but you do care when the objects fail. In this case,you locate the Physical NIC link state alert definition, double-click the state, and set it to Disabled.
n For a Test environment, you might not be concerned if your virtual machines demand more memoryand CPU capacity than what is actually configured, because workloads can vary in test environments.
n For a Production environment, your virtual machines might require more memory than you haveconfigured, which might cause a problem with the performance and reliability of your productionenvironment.
In this procedure, you override the symptom definition threshold value for the Co-Stop performance of yourvirtual machines.
Prerequisites
Verify that the following conditions are met:
n You created a custom policy for your virtual SQL Servers. See “Create a Policy to Meet vSphereOperational Needs,” on page 88.
n You understand the Co-Stop CPU performance metric for virtual machines. This metric represents thepercentage of time that a virtual machine is ready to run, but experiences delay because of co-virtualCPU scheduling contention. Co-Stop is one of several performance metrics for virtual machines thatalso include Run, Wait, and Ready.
n The alert definition named Virtual machine has high CPU contention caused by Co-Stop, exists.
n Symptom definitions exist to track the critical, immediate, and warning levels of CPU Co-Stop on thevirtual machines. For example, the critical level for virtual machine CPUs that experience contentionmore than 15% of the time is set to 15% by default, as measured by the Co-Stop metric. The defaultthreshold level for Immediate is 10%, and for warning is 5%. However, in your production policy foryour production virtual machines, you manage the critical level at 3%.
Procedure
1 On the Policy Library tab, locate your vSphere Production Virtual SQL Servers policy, and click thepencil to edit the policy.
The Edit Monitoring Policy workspace appears.
2 In the workspace, click Override Alert / Symptom Definitions.
3 On the Alert Definitions pane, enable the Co-Stop alert definition to notify you about high CPUcontention on your virtual machines.
a In the Object Type drop-down menu, select vCenter Adapter and Virtual Machine.
b In the Search text box, enter stop to display only the alert definitions that relate to the Co-Stopperformance metric for virtual machines.
c For the Alert definition named Virtual machine has high CPU contention caused by Co-Stop,click the State drop-down menu and click Enabled.
vRealize Operations Manager Customization and Administration Guide
90 VMware, Inc.
4 In the Symptom Definitions pane, modify the critical Co-Stop level for virtual machines so thatvRealize Operations Manager triggers an alert based on the threshold level defined for this symptom.
a In the Object Type drop-down menu, click vCenter Adapter and Virtual Machine.
b In the Search text box, enter stop to display the symptom definitions that apply to the Co-Stopperformance metric for virtual machines.
c For the symptom definition named Virtual Machine CPU Co-stop is at Critical level, click theState drop-down menu and click Enabled.
d Click the Condition drop-down menu, and click Override.
For a production policy, a typical critical threshold value is >3. For a development or testenvironment policy, a typical critical threshold value is >10.
e In the Override Symptom Definition Threshold dialog box, enter >3 to change the threshold value,and click Apply.
5 Modify the immediate Co-Stop level for virtual machines.
a For the symptom definition named Virtual Machine CPU Co-stop is at Immediate level, clickthe State drop-down menu and click Enabled.
b Click the Condition drop-down menu, and click Override.
c In the Override Symptom Definition Threshold dialog box, enter >2 to change the threshold value,and click Apply.
6 Modify the warning Co-Stop level for virtual machines.
a For the symptom definition named Virtual Machine CPU Co-stop is at Warning level, click theState drop-down menu and click Enabled.
b Click the Condition drop-down menu, and click Override.
c In the Override Symptom Definition Threshold dialog box, enter >1 to change the threshold value,and click Apply.
7 Click Save to save your policy.
You changed the Co-Stop CPU performance metric for virtual machines to minimize the delay on your SQLServer virtual machines because of CPU scheduling contention.
What to do next
Create a group type to use to categorize your group of virtual SQL Servers, create an object group thatcontains your virtual SQL Servers, and apply the policy to your object group.
Apply the Custom Policy to vSphere Object GroupsYou create an object group type to categorize your virtual SQL Server machines. Then you create an objectgroup that contains your virtual SQL Server machines, and apply your custom policy to this group of SQLServer virtual machine objects.
To have vRealize Operations Manager analyze your SQL Server machines according to the performancecriteria in your custom policy, you must apply the custom policy to your group of SQL Server objects.
For this scenario, you create a static object group that contains your SQL Server virtual machines. In yourown environment, you might need to create a dynamic object group so that vRealize Operations Managerdiscovers new SQL Server instances that become available to analyze and report on.
Chapter 3 Customizing How vRealize Operations Manager Monitors Your Environment
VMware, Inc. 91
Prerequisites
You configured the custom policy settings for your virtual SQL Server machines. See “Configure the CustomPolicy Settings to Analyze and Report on vSphere Objects,” on page 90.
Procedure
1 To create a group type for your virtual SQL Servers, click Content in the left pane, and click GroupTypes.
2 Click the plus sign to add a new object group type, and type vSphere Production Virtual Machines.
You use this group type to categorize your SQL Server virtual machines for analysis.
3 Click Environment in the left pane, and click Custom Groups.
A folder that corresponds to the group type that you just created appears in the list.
4 Click the folder named vSphere Production Virtual Machines, and click the plus sign to add a newobject group.
5 In the New Group dialog box, add your SQL Server virtual machines.
a In the Name text box, type vSphere Production SQL Server Virtual Machines.
b From the Group Type drop-down menu, select vSphere Production Virtual Machines.
c From the Policy drop-down menu, select vSphere Production Virtual SQL Servers.
d In the object type drop-down menu in the Define Membership Criteria pane, expand vCenterAdapter and click Virtual Machine.
6 Click OK to save your object group.
After vRealize Operations Manager collects data, the Groups tab displays the status for the health, risk,and efficiency of the virtual machines in the object group.
You created an object type and object group to have vRealize Operations Manager analyze and report on thestatus of your SQL Server virtual machines.
What to do next
Create a custom dashboard so that you can view the status of your virtual SQL Servers and addressproblems that occur. See “Using Dashboards,” on page 27.
Configure a modeling project that includes capacity planning scenarios for your production virtual SQLServers to have vRealize Operations Manager monitor the capacity trends on these objects and notify you 60days before your virtual SQL Servers experience capacity problems. See the vRealize Operations ManagerInformation Center.
Have vRealize Operations Manager report on the CPU use and memory use of your virtual machines on aregular schedule, and send the reports to you.
vRealize Operations Manager Customization and Administration Guide
92 VMware, Inc.
User Scenario: Create an Operational Policy for Production vCenter ServerDatastore Objects
As a Virtual Infrastructure Administrator, you manage the policies used for vRealize Operations Manager toanalyze objects in your environment, collect data from those objects, and display that data in dashboards,views, and reports. Your IT staff added new datastore objects to your environment, and your responsibilityis to ensure that the new datastore objects adhere to the policy requirements from the VP of Infrastructurefor your test and production environments.
In this scenario, you create a policy to have vRealize Operations Manager monitor the disk space use of yourproduction datastore objects. You create a group type and custom object group for the datastore objects, andapply your policy to your object group. After vRealize Operations Manager collects data from the datastoreobjects in your environment according to the settings in your policy, you view the collected data and anypotential alerts in the dashboards to confirm whether the disk space use is in compliance for your datastoreobjects.
Prerequisites
n Understand the purpose of using a policy. See “Managing and Administering Policies for vRealizeOperations Manager,” on page 81.
n Verify that your vRealize Operations Manager instance is working properly.
n Verify that one or more custom object groups and group types exist in yourvRealize Operations Manager instance. See “Managing Custom Object Groups in VMware vRealizeOperations Manager,” on page 21.
n Verify that your vRealize Operations Manager instance includes the default policy and one or moreother policies. See “Default Policy in vRealize Operations Manager,” on page 83.
n Understand the sections and elements in the default policy, such as the attributes, alert and symptomdefinitions, and how the policy inherits settings from the base policies that you select. See “PolicyWorkspace in vRealize Operations Manager,” on page 102.
n Understand the analysis settings in the default policy, such as capacity remaining and stress on hostsand virtual machines, and the actions used to override the settings inherited from the base policies. Seethe vRealize Operations Manager Information Center.
Procedure
1 Create a Group Type for Your Datastore Objects on page 94Create a group type so that you can categorize your Datastore objects.
2 Create an Object Group for Your Datastore Objects on page 94Create an object group to organize the Datastore objects in your environment as a single object group.
3 Create Your Policy and Select a Base Policy on page 95Create your policy, and select the base policies to use to override the settings for your new policy.
4 Override the Analysis Settings for the Datastore Objects on page 96Display and override the analysis settings for the Datastore objects that your new policy will monitor.
5 Enable Disk Space Attributes for Datastore Objects on page 96Enable the attributes for vRealize Operations Manager to monitor the disk space of your productiondatastore objects.
6 Override Alert and Symptom Definitions for Datastore Objects on page 97Override the alert and symptom definitions for Datastore objects.
Chapter 3 Customizing How vRealize Operations Manager Monitors Your Environment
VMware, Inc. 93
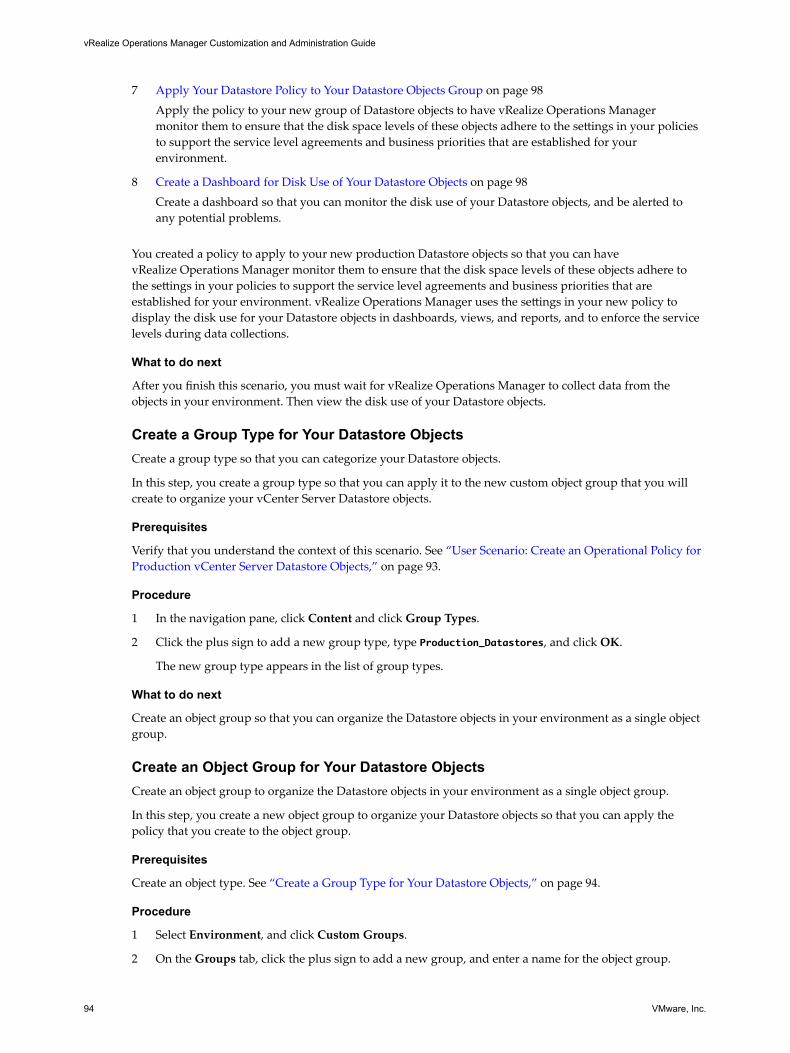
7 Apply Your Datastore Policy to Your Datastore Objects Group on page 98Apply the policy to your new group of Datastore objects to have vRealize Operations Managermonitor them to ensure that the disk space levels of these objects adhere to the settings in your policiesto support the service level agreements and business priorities that are established for yourenvironment.
8 Create a Dashboard for Disk Use of Your Datastore Objects on page 98Create a dashboard so that you can monitor the disk use of your Datastore objects, and be alerted toany potential problems.
You created a policy to apply to your new production Datastore objects so that you can havevRealize Operations Manager monitor them to ensure that the disk space levels of these objects adhere tothe settings in your policies to support the service level agreements and business priorities that areestablished for your environment. vRealize Operations Manager uses the settings in your new policy todisplay the disk use for your Datastore objects in dashboards, views, and reports, and to enforce the servicelevels during data collections.
What to do next
After you finish this scenario, you must wait for vRealize Operations Manager to collect data from theobjects in your environment. Then view the disk use of your Datastore objects.
Create a Group Type for Your Datastore ObjectsCreate a group type so that you can categorize your Datastore objects.
In this step, you create a group type so that you can apply it to the new custom object group that you willcreate to organize your vCenter Server Datastore objects.
Prerequisites
Verify that you understand the context of this scenario. See “User Scenario: Create an Operational Policy forProduction vCenter Server Datastore Objects,” on page 93.
Procedure
1 In the navigation pane, click Content and click Group Types.
2 Click the plus sign to add a new group type, type Production_Datastores, and click OK.
The new group type appears in the list of group types.
What to do next
Create an object group so that you can organize the Datastore objects in your environment as a single objectgroup.
Create an Object Group for Your Datastore ObjectsCreate an object group to organize the Datastore objects in your environment as a single object group.
In this step, you create a new object group to organize your Datastore objects so that you can apply thepolicy that you create to the object group.
Prerequisites
Create an object type. See “Create a Group Type for Your Datastore Objects,” on page 94.
Procedure
1 Select Environment, and click Custom Groups.
2 On the Groups tab, click the plus sign to add a new group, and enter a name for the object group.
vRealize Operations Manager Customization and Administration Guide
94 VMware, Inc.
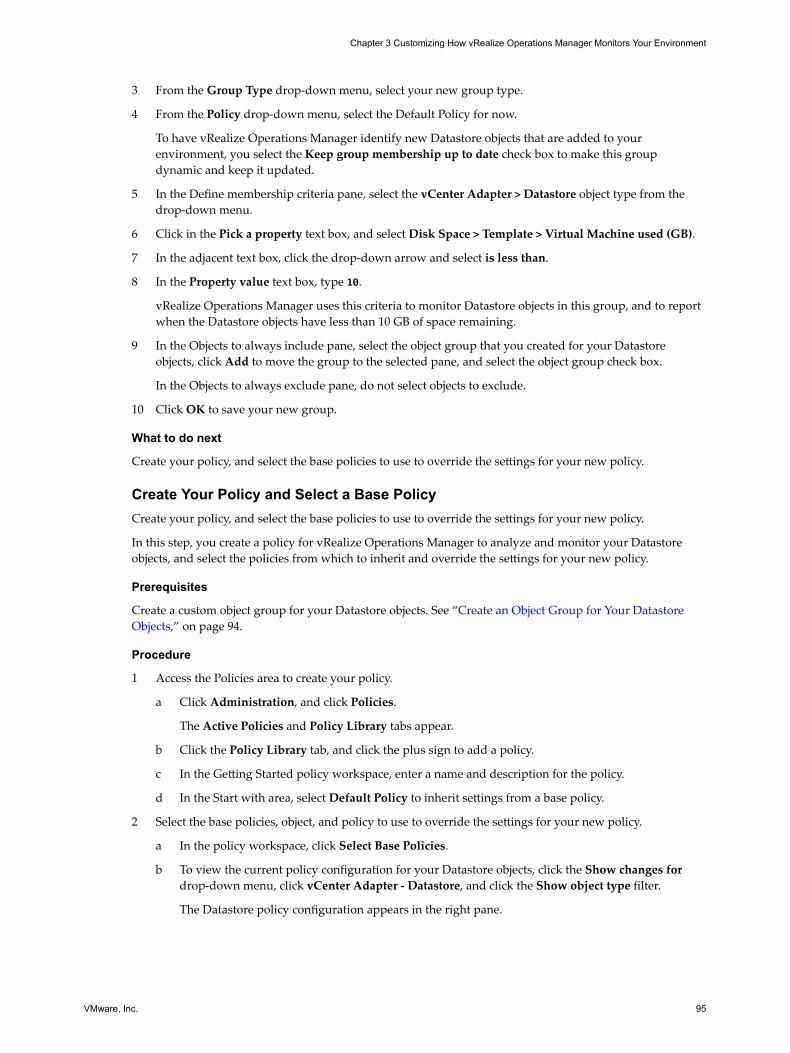
3 From the Group Type drop-down menu, select your new group type.
4 From the Policy drop-down menu, select the Default Policy for now.
To have vRealize Operations Manager identify new Datastore objects that are added to yourenvironment, you select the Keep group membership up to date check box to make this groupdynamic and keep it updated.
5 In the Define membership criteria pane, select the vCenter Adapter > Datastore object type from thedrop-down menu.
6 Click in the Pick a property text box, and select Disk Space > Template > Virtual Machine used (GB).
7 In the adjacent text box, click the drop-down arrow and select is less than.
8 In the Property value text box, type 10.
vRealize Operations Manager uses this criteria to monitor Datastore objects in this group, and to reportwhen the Datastore objects have less than 10 GB of space remaining.
9 In the Objects to always include pane, select the object group that you created for your Datastoreobjects, click Add to move the group to the selected pane, and select the object group check box.
In the Objects to always exclude pane, do not select objects to exclude.
10 Click OK to save your new group.
What to do next
Create your policy, and select the base policies to use to override the settings for your new policy.
Create Your Policy and Select a Base PolicyCreate your policy, and select the base policies to use to override the settings for your new policy.
In this step, you create a policy for vRealize Operations Manager to analyze and monitor your Datastoreobjects, and select the policies from which to inherit and override the settings for your new policy.
Prerequisites
Create a custom object group for your Datastore objects. See “Create an Object Group for Your DatastoreObjects,” on page 94.
Procedure
1 Access the Policies area to create your policy.
a Click Administration, and click Policies.
The Active Policies and Policy Library tabs appear.
b Click the Policy Library tab, and click the plus sign to add a policy.
c In the Getting Started policy workspace, enter a name and description for the policy.
d In the Start with area, select Default Policy to inherit settings from a base policy.
2 Select the base policies, object, and policy to use to override the settings for your new policy.
a In the policy workspace, click Select Base Policies.
b To view the current policy configuration for your Datastore objects, click the Show changes fordrop-down menu, click vCenter Adapter - Datastore, and click the Show object type filter.
The Datastore policy configuration appears in the right pane.
Chapter 3 Customizing How vRealize Operations Manager Monitors Your Environment
VMware, Inc. 95
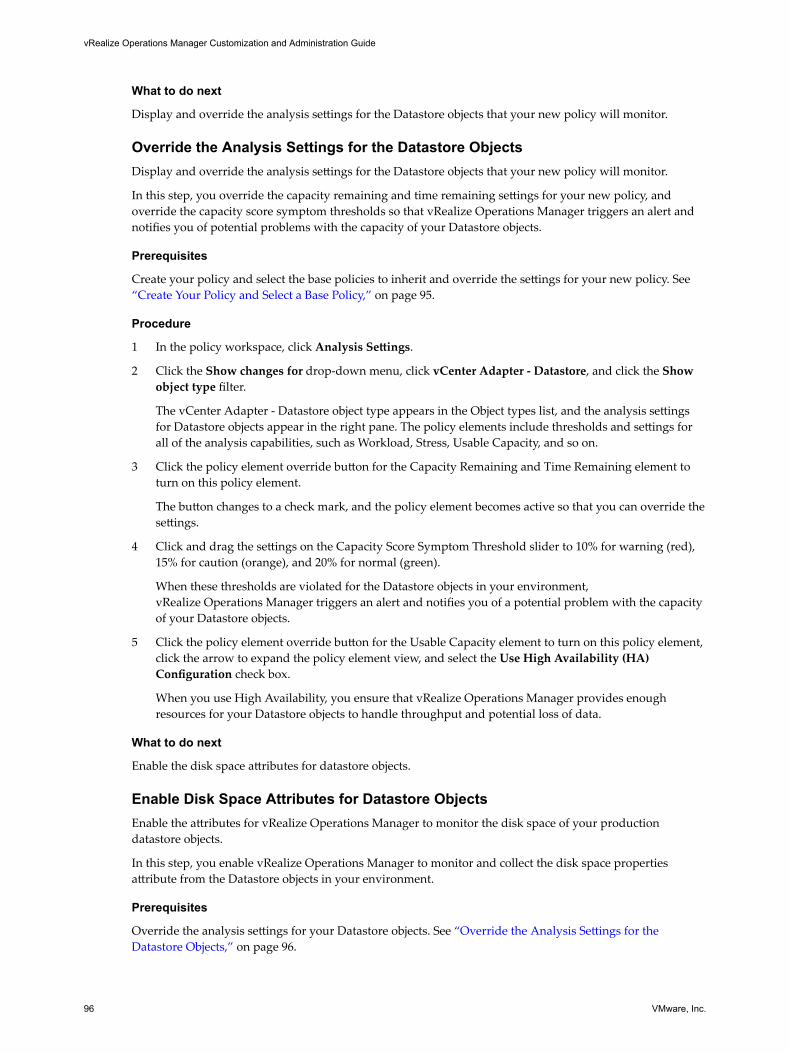
What to do next
Display and override the analysis settings for the Datastore objects that your new policy will monitor.
Override the Analysis Settings for the Datastore ObjectsDisplay and override the analysis settings for the Datastore objects that your new policy will monitor.
In this step, you override the capacity remaining and time remaining settings for your new policy, andoverride the capacity score symptom thresholds so that vRealize Operations Manager triggers an alert andnotifies you of potential problems with the capacity of your Datastore objects.
Prerequisites
Create your policy and select the base policies to inherit and override the settings for your new policy. See “Create Your Policy and Select a Base Policy,” on page 95.
Procedure
1 In the policy workspace, click Analysis Settings.
2 Click the Show changes for drop-down menu, click vCenter Adapter - Datastore, and click the Showobject type filter.
The vCenter Adapter - Datastore object type appears in the Object types list, and the analysis settingsfor Datastore objects appear in the right pane. The policy elements include thresholds and settings forall of the analysis capabilities, such as Workload, Stress, Usable Capacity, and so on.
3 Click the policy element override button for the Capacity Remaining and Time Remaining element toturn on this policy element.
The button changes to a check mark, and the policy element becomes active so that you can override thesettings.
4 Click and drag the settings on the Capacity Score Symptom Threshold slider to 10% for warning (red),15% for caution (orange), and 20% for normal (green).
When these thresholds are violated for the Datastore objects in your environment,vRealize Operations Manager triggers an alert and notifies you of a potential problem with the capacityof your Datastore objects.
5 Click the policy element override button for the Usable Capacity element to turn on this policy element,click the arrow to expand the policy element view, and select the Use High Availability (HA)Configuration check box.
When you use High Availability, you ensure that vRealize Operations Manager provides enoughresources for your Datastore objects to handle throughput and potential loss of data.
What to do next
Enable the disk space attributes for datastore objects.
Enable Disk Space Attributes for Datastore ObjectsEnable the attributes for vRealize Operations Manager to monitor the disk space of your productiondatastore objects.
In this step, you enable vRealize Operations Manager to monitor and collect the disk space propertiesattribute from the Datastore objects in your environment.
Prerequisites
Override the analysis settings for your Datastore objects. See “Override the Analysis Settings for theDatastore Objects,” on page 96.
vRealize Operations Manager Customization and Administration Guide
96 VMware, Inc.
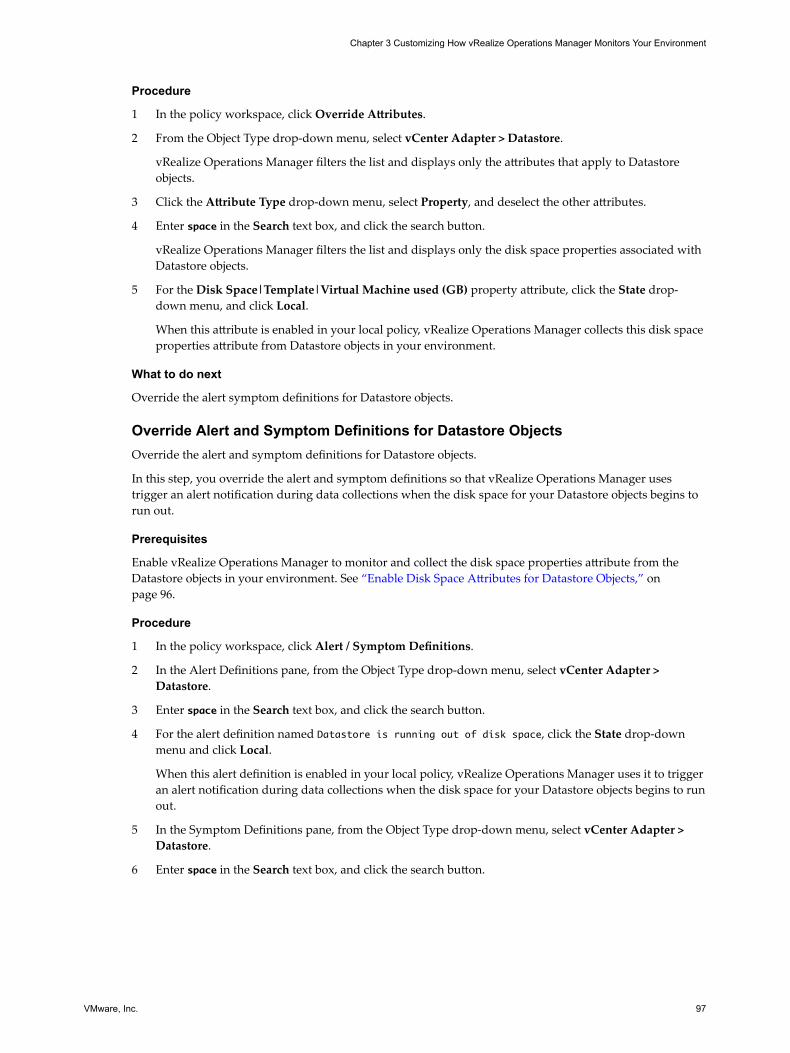
Procedure
1 In the policy workspace, click Override Attributes.
2 From the Object Type drop-down menu, select vCenter Adapter > Datastore.
vRealize Operations Manager filters the list and displays only the attributes that apply to Datastoreobjects.
3 Click the Attribute Type drop-down menu, select Property, and deselect the other attributes.
4 Enter space in the Search text box, and click the search button.
vRealize Operations Manager filters the list and displays only the disk space properties associated withDatastore objects.
5 For the Disk Space|Template|Virtual Machine used (GB) property attribute, click the State drop-down menu, and click Local.
When this attribute is enabled in your local policy, vRealize Operations Manager collects this disk spaceproperties attribute from Datastore objects in your environment.
What to do next
Override the alert symptom definitions for Datastore objects.
Override Alert and Symptom Definitions for Datastore ObjectsOverride the alert and symptom definitions for Datastore objects.
In this step, you override the alert and symptom definitions so that vRealize Operations Manager usestrigger an alert notification during data collections when the disk space for your Datastore objects begins torun out.
Prerequisites
Enable vRealize Operations Manager to monitor and collect the disk space properties attribute from theDatastore objects in your environment. See “Enable Disk Space Attributes for Datastore Objects,” onpage 96.
Procedure
1 In the policy workspace, click Alert / Symptom Definitions.
2 In the Alert Definitions pane, from the Object Type drop-down menu, select vCenter Adapter >Datastore.
3 Enter space in the Search text box, and click the search button.
4 For the alert definition named Datastore is running out of disk space, click the State drop-downmenu and click Local.
When this alert definition is enabled in your local policy, vRealize Operations Manager uses it to triggeran alert notification during data collections when the disk space for your Datastore objects begins to runout.
5 In the Symptom Definitions pane, from the Object Type drop-down menu, select vCenter Adapter >Datastore.
6 Enter space in the Search text box, and click the search button.
Chapter 3 Customizing How vRealize Operations Manager Monitors Your Environment
VMware, Inc. 97
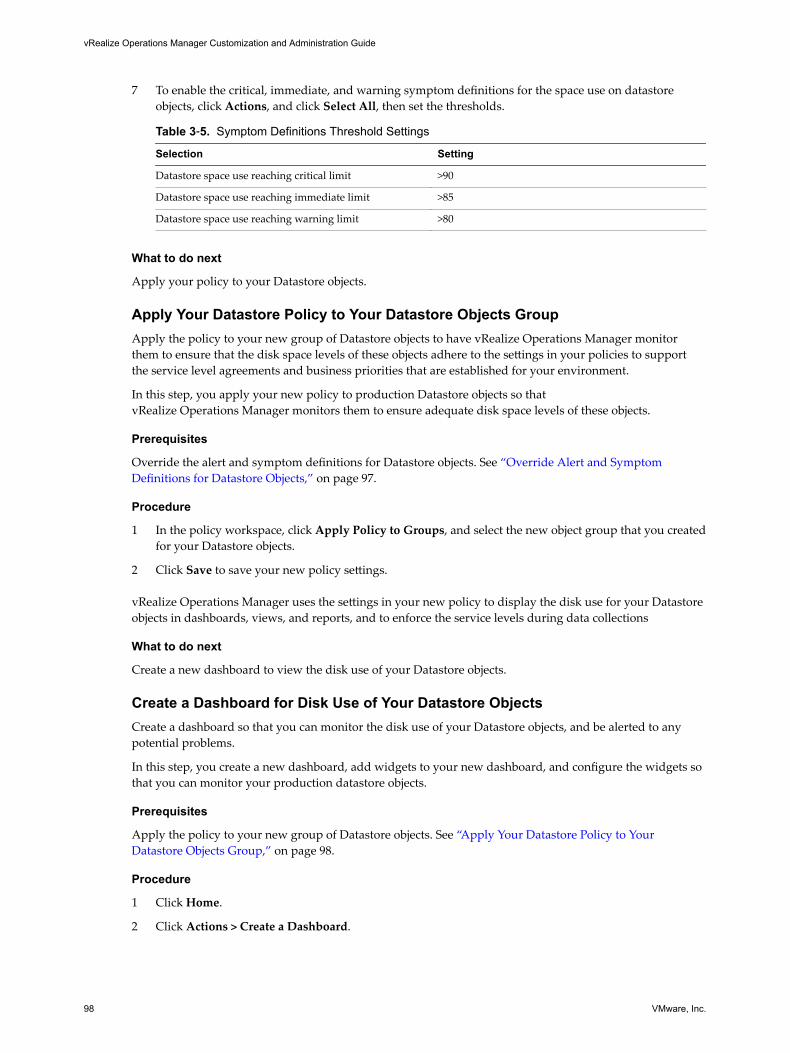
7 To enable the critical, immediate, and warning symptom definitions for the space use on datastoreobjects, click Actions, and click Select All, then set the thresholds.
Table 3‑5. Symptom Definitions Threshold Settings
Selection Setting
Datastore space use reaching critical limit >90
Datastore space use reaching immediate limit >85
Datastore space use reaching warning limit >80
What to do next
Apply your policy to your Datastore objects.
Apply Your Datastore Policy to Your Datastore Objects GroupApply the policy to your new group of Datastore objects to have vRealize Operations Manager monitorthem to ensure that the disk space levels of these objects adhere to the settings in your policies to supportthe service level agreements and business priorities that are established for your environment.
In this step, you apply your new policy to production Datastore objects so thatvRealize Operations Manager monitors them to ensure adequate disk space levels of these objects.
Prerequisites
Override the alert and symptom definitions for Datastore objects. See “Override Alert and SymptomDefinitions for Datastore Objects,” on page 97.
Procedure
1 In the policy workspace, click Apply Policy to Groups, and select the new object group that you createdfor your Datastore objects.
2 Click Save to save your new policy settings.
vRealize Operations Manager uses the settings in your new policy to display the disk use for your Datastoreobjects in dashboards, views, and reports, and to enforce the service levels during data collections
What to do next
Create a new dashboard to view the disk use of your Datastore objects.
Create a Dashboard for Disk Use of Your Datastore ObjectsCreate a dashboard so that you can monitor the disk use of your Datastore objects, and be alerted to anypotential problems.
In this step, you create a new dashboard, add widgets to your new dashboard, and configure the widgets sothat you can monitor your production datastore objects.
Prerequisites
Apply the policy to your new group of Datastore objects. See “Apply Your Datastore Policy to YourDatastore Objects Group,” on page 98.
Procedure
1 Click Home.
2 Click Actions > Create a Dashboard.
vRealize Operations Manager Customization and Administration Guide
98 VMware, Inc.
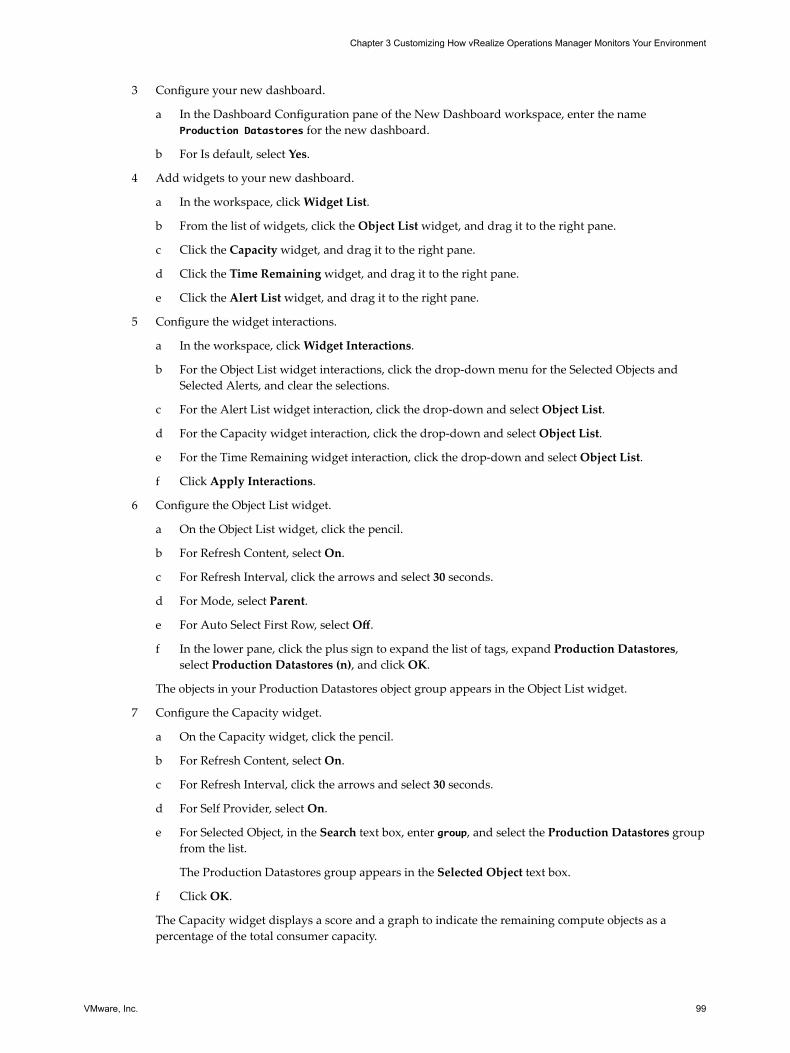
3 Configure your new dashboard.
a In the Dashboard Configuration pane of the New Dashboard workspace, enter the nameProduction Datastores for the new dashboard.
b For Is default, select Yes.
4 Add widgets to your new dashboard.
a In the workspace, click Widget List.
b From the list of widgets, click the Object List widget, and drag it to the right pane.
c Click the Capacity widget, and drag it to the right pane.
d Click the Time Remaining widget, and drag it to the right pane.
e Click the Alert List widget, and drag it to the right pane.
5 Configure the widget interactions.
a In the workspace, click Widget Interactions.
b For the Object List widget interactions, click the drop-down menu for the Selected Objects andSelected Alerts, and clear the selections.
c For the Alert List widget interaction, click the drop-down and select Object List.
d For the Capacity widget interaction, click the drop-down and select Object List.
e For the Time Remaining widget interaction, click the drop-down and select Object List.
f Click Apply Interactions.
6 Configure the Object List widget.
a On the Object List widget, click the pencil.
b For Refresh Content, select On.
c For Refresh Interval, click the arrows and select 30 seconds.
d For Mode, select Parent.
e For Auto Select First Row, select Off.
f In the lower pane, click the plus sign to expand the list of tags, expand Production Datastores,select Production Datastores (n), and click OK.
The objects in your Production Datastores object group appears in the Object List widget.
7 Configure the Capacity widget.
a On the Capacity widget, click the pencil.
b For Refresh Content, select On.
c For Refresh Interval, click the arrows and select 30 seconds.
d For Self Provider, select On.
e For Selected Object, in the Search text box, enter group, and select the Production Datastores groupfrom the list.
The Production Datastores group appears in the Selected Object text box.
f Click OK.
The Capacity widget displays a score and a graph to indicate the remaining compute objects as apercentage of the total consumer capacity.
Chapter 3 Customizing How vRealize Operations Manager Monitors Your Environment
VMware, Inc. 99
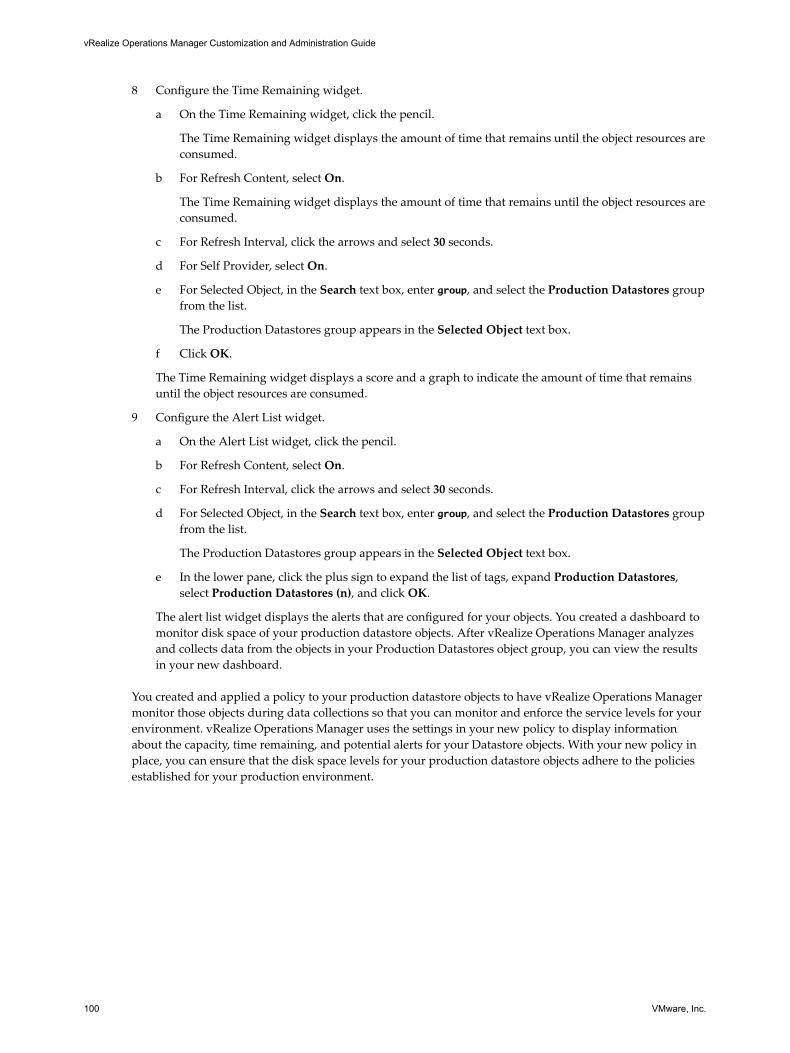
8 Configure the Time Remaining widget.
a On the Time Remaining widget, click the pencil.
The Time Remaining widget displays the amount of time that remains until the object resources areconsumed.
b For Refresh Content, select On.
The Time Remaining widget displays the amount of time that remains until the object resources areconsumed.
c For Refresh Interval, click the arrows and select 30 seconds.
d For Self Provider, select On.
e For Selected Object, in the Search text box, enter group, and select the Production Datastores groupfrom the list.
The Production Datastores group appears in the Selected Object text box.
f Click OK.
The Time Remaining widget displays a score and a graph to indicate the amount of time that remainsuntil the object resources are consumed.
9 Configure the Alert List widget.
a On the Alert List widget, click the pencil.
b For Refresh Content, select On.
c For Refresh Interval, click the arrows and select 30 seconds.
d For Selected Object, in the Search text box, enter group, and select the Production Datastores groupfrom the list.
The Production Datastores group appears in the Selected Object text box.
e In the lower pane, click the plus sign to expand the list of tags, expand Production Datastores,select Production Datastores (n), and click OK.
The alert list widget displays the alerts that are configured for your objects. You created a dashboard tomonitor disk space of your production datastore objects. After vRealize Operations Manager analyzesand collects data from the objects in your Production Datastores object group, you can view the resultsin your new dashboard.
You created and applied a policy to your production datastore objects to have vRealize Operations Managermonitor those objects during data collections so that you can monitor and enforce the service levels for yourenvironment. vRealize Operations Manager uses the settings in your new policy to display informationabout the capacity, time remaining, and potential alerts for your Datastore objects. With your new policy inplace, you can ensure that the disk space levels for your production datastore objects adhere to the policiesestablished for your production environment.
vRealize Operations Manager Customization and Administration Guide
100 VMware, Inc.
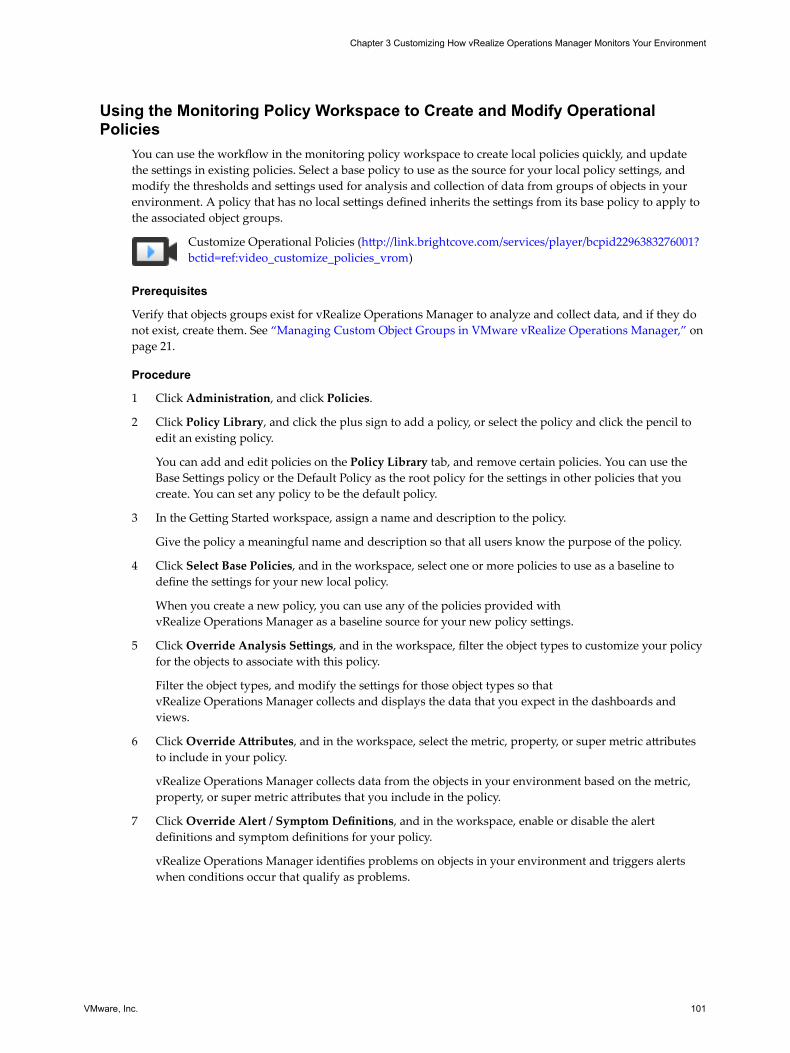
Using the Monitoring Policy Workspace to Create and Modify OperationalPolicies
You can use the workflow in the monitoring policy workspace to create local policies quickly, and updatethe settings in existing policies. Select a base policy to use as the source for your local policy settings, andmodify the thresholds and settings used for analysis and collection of data from groups of objects in yourenvironment. A policy that has no local settings defined inherits the settings from its base policy to apply tothe associated object groups.
Customize Operational Policies (http://link.brightcove.com/services/player/bcpid2296383276001?bctid=ref:video_customize_policies_vrom)
Prerequisites
Verify that objects groups exist for vRealize Operations Manager to analyze and collect data, and if they donot exist, create them. See “Managing Custom Object Groups in VMware vRealize Operations Manager,” onpage 21.
Procedure
1 Click Administration, and click Policies.
2 Click Policy Library, and click the plus sign to add a policy, or select the policy and click the pencil toedit an existing policy.
You can add and edit policies on the Policy Library tab, and remove certain policies. You can use theBase Settings policy or the Default Policy as the root policy for the settings in other policies that youcreate. You can set any policy to be the default policy.
3 In the Getting Started workspace, assign a name and description to the policy.
Give the policy a meaningful name and description so that all users know the purpose of the policy.
4 Click Select Base Policies, and in the workspace, select one or more policies to use as a baseline todefine the settings for your new local policy.
When you create a new policy, you can use any of the policies provided withvRealize Operations Manager as a baseline source for your new policy settings.
5 Click Override Analysis Settings, and in the workspace, filter the object types to customize your policyfor the objects to associate with this policy.
Filter the object types, and modify the settings for those object types so thatvRealize Operations Manager collects and displays the data that you expect in the dashboards andviews.
6 Click Override Attributes, and in the workspace, select the metric, property, or super metric attributesto include in your policy.
vRealize Operations Manager collects data from the objects in your environment based on the metric,property, or super metric attributes that you include in the policy.
7 Click Override Alert / Symptom Definitions, and in the workspace, enable or disable the alertdefinitions and symptom definitions for your policy.
vRealize Operations Manager identifies problems on objects in your environment and triggers alertswhen conditions occur that qualify as problems.
Chapter 3 Customizing How vRealize Operations Manager Monitors Your Environment
VMware, Inc. 101
8 Click Apply Policy to Groups, and in the workspace, select one or more groups to which the policyapplies.
VMware vRealize Operations Manager monitors the objects according to the settings in the policy thatis applied to the object group, triggers alerts when thresholds are violated, and reports the results in thedashboards, views, and reports. If you do not assign a policy to one or more object groups,VMware vRealize Operations Manager does not assign the settings in that policy to any objects, and thepolicy is not active. For an object group that dos not have a policy assigned,VMware vRealize Operations Manager associates the object group with the Default Policy.
9 Click Save to retain the settings defined for your local policy.
What to do next
After vRealize Operations Manager analyzes and collects data from the objects in your environment, reviewthe data in the dashboards and views. If the data is not what you expected, edit your local policy tocustomize and override the settings until the dashboards display the data that you need.
Policy Workspace in vRealize Operations ManagerThe policy workspace allows you to quickly create and modify policies. To create a new policy, you caninherit the settings from an existing policy, and you can modify the settings in existing policies if you haveadequate permissions. After you create a new policy, or edit an existing policy, you can apply the policy toone or more groups of objects.
How the Policy Workspace WorksEvery policy includes a set of packages, and uses the defined problems, symptoms, metrics, and propertiesin those packages to apply to specific object groups in your environment. You can view details for thesettings inherited from the base policy, and display specific settings for certain object types. You can overridethe settings of other policies, and include additional policy settings to apply to object types. For example, acritical production policy includes settings to track use, available resources and the time remaining on them,resource demands on the object group that determine how much stress is applied, and reclaimable capacityamounts for CPU, disk I/O, and network I/O.
Use the Add and Edit options to create new policies and edit existing policies.
Customize Operational Policies (http://link.brightcove.com/services/player/bcpid2296383276001?bctid=ref:video_customize_policies_vrom)
Where You Create and Modify a PolicyTo create and modify policies, click Administration, click Policies, click the Policy Library tab, and click theplus sign to add a policy or click the pencil icon to edit a policy. The policy workspace is where you selectthe base policies, and customize and override the settings for analysis, metrics, properties, alert definitions,and symptom definitions. In this workspace, you can apply the policy to object groups.
To remove a policy from the list, select the policy and click the red X.
Policy Workspace OptionsThe policy workspace includes a step-by-step workflow to create and edit a policy, and apply the policy tocustom object groups.
vRealize Operations Manager Customization and Administration Guide
102 VMware, Inc.
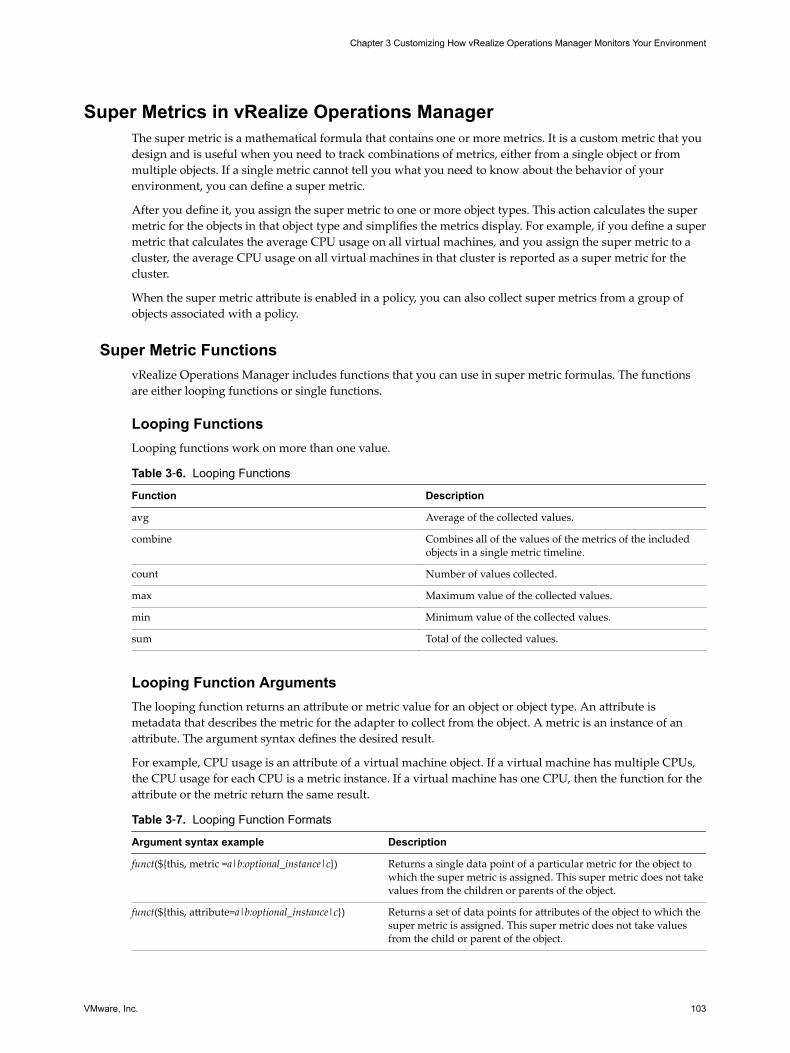
Super Metrics in vRealize Operations ManagerThe super metric is a mathematical formula that contains one or more metrics. It is a custom metric that youdesign and is useful when you need to track combinations of metrics, either from a single object or frommultiple objects. If a single metric cannot tell you what you need to know about the behavior of yourenvironment, you can define a super metric.
After you define it, you assign the super metric to one or more object types. This action calculates the supermetric for the objects in that object type and simplifies the metrics display. For example, if you define a supermetric that calculates the average CPU usage on all virtual machines, and you assign the super metric to acluster, the average CPU usage on all virtual machines in that cluster is reported as a super metric for thecluster.
When the super metric attribute is enabled in a policy, you can also collect super metrics from a group ofobjects associated with a policy.
Super Metric FunctionsvRealize Operations Manager includes functions that you can use in super metric formulas. The functionsare either looping functions or single functions.
Looping FunctionsLooping functions work on more than one value.
Table 3‑6. Looping Functions
Function Description
avg Average of the collected values.
combine Combines all of the values of the metrics of the includedobjects in a single metric timeline.
count Number of values collected.
max Maximum value of the collected values.
min Minimum value of the collected values.
sum Total of the collected values.
Looping Function ArgumentsThe looping function returns an attribute or metric value for an object or object type. An attribute ismetadata that describes the metric for the adapter to collect from the object. A metric is an instance of anattribute. The argument syntax defines the desired result.
For example, CPU usage is an attribute of a virtual machine object. If a virtual machine has multiple CPUs,the CPU usage for each CPU is a metric instance. If a virtual machine has one CPU, then the function for theattribute or the metric return the same result.
Table 3‑7. Looping Function Formats
Argument syntax example Description
funct(${this, metric =a|b:optional_instance|c}) Returns a single data point of a particular metric for the object towhich the super metric is assigned. This super metric does not takevalues from the children or parents of the object.
funct(${this, attribute=a|b:optional_instance|c}) Returns a set of data points for attributes of the object to which thesuper metric is assigned. This super metric does not take valuesfrom the child or parent of the object.
Chapter 3 Customizing How vRealize Operations Manager Monitors Your Environment
VMware, Inc. 103
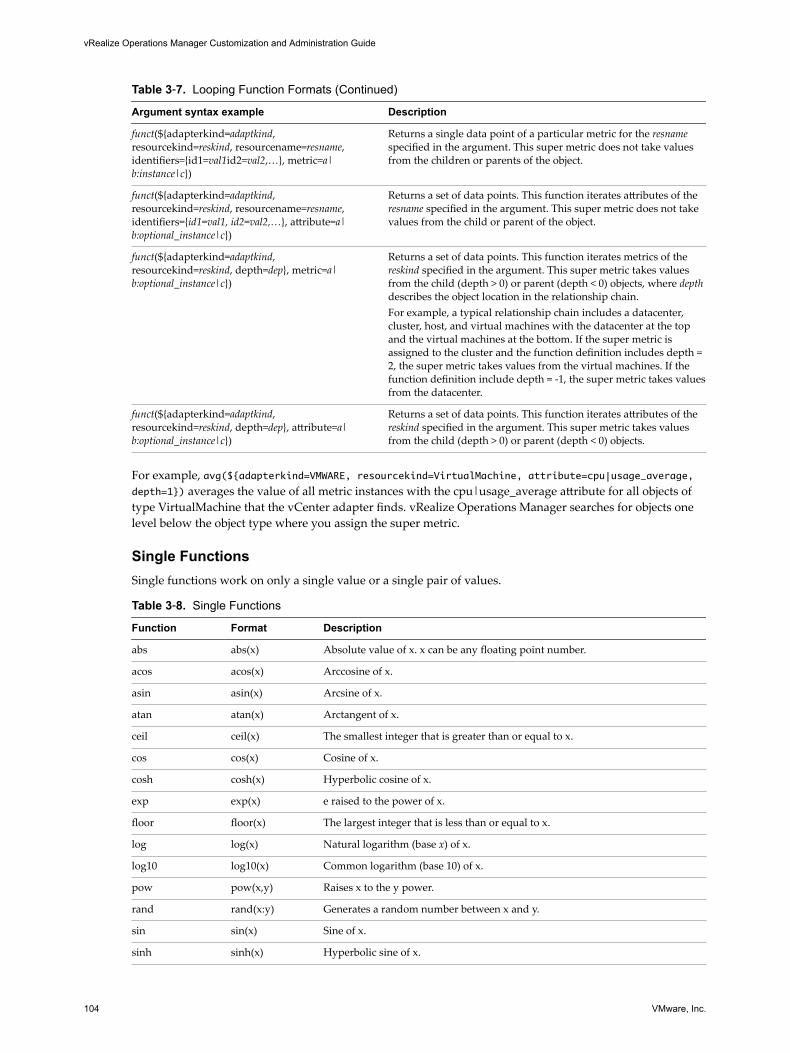
Table 3‑7. Looping Function Formats (Continued)
Argument syntax example Description
funct(${adapterkind=adaptkind,resourcekind=reskind, resourcename=resname,identifiers={id1=val1id2=val2,…}, metric=a|b:instance|c})
Returns a single data point of a particular metric for the resnamespecified in the argument. This super metric does not take valuesfrom the children or parents of the object.
funct(${adapterkind=adaptkind,resourcekind=reskind, resourcename=resname,identifiers={id1=val1, id2=val2,…}, attribute=a|b:optional_instance|c})
Returns a set of data points. This function iterates attributes of theresname specified in the argument. This super metric does not takevalues from the child or parent of the object.
funct(${adapterkind=adaptkind,resourcekind=reskind, depth=dep}, metric=a|b:optional_instance|c})
Returns a set of data points. This function iterates metrics of thereskind specified in the argument. This super metric takes valuesfrom the child (depth > 0) or parent (depth < 0) objects, where depthdescribes the object location in the relationship chain.For example, a typical relationship chain includes a datacenter,cluster, host, and virtual machines with the datacenter at the topand the virtual machines at the bottom. If the super metric isassigned to the cluster and the function definition includes depth =2, the super metric takes values from the virtual machines. If thefunction definition include depth = -1, the super metric takes valuesfrom the datacenter.
funct(${adapterkind=adaptkind,resourcekind=reskind, depth=dep}, attribute=a|b:optional_instance|c})
Returns a set of data points. This function iterates attributes of thereskind specified in the argument. This super metric takes valuesfrom the child (depth > 0) or parent (depth < 0) objects.
For example, avg(${adapterkind=VMWARE, resourcekind=VirtualMachine, attribute=cpu|usage_average,depth=1}) averages the value of all metric instances with the cpu|usage_average attribute for all objects oftype VirtualMachine that the vCenter adapter finds. vRealize Operations Manager searches for objects onelevel below the object type where you assign the super metric.
Single FunctionsSingle functions work on only a single value or a single pair of values.
Table 3‑8. Single Functions
Function Format Description
abs abs(x) Absolute value of x. x can be any floating point number.
acos acos(x) Arccosine of x.
asin asin(x) Arcsine of x.
atan atan(x) Arctangent of x.
ceil ceil(x) The smallest integer that is greater than or equal to x.
cos cos(x) Cosine of x.
cosh cosh(x) Hyperbolic cosine of x.
exp exp(x) e raised to the power of x.
floor floor(x) The largest integer that is less than or equal to x.
log log(x) Natural logarithm (base x) of x.
log10 log10(x) Common logarithm (base 10) of x.
pow pow(x,y) Raises x to the y power.
rand rand(x:y) Generates a random number between x and y.
sin sin(x) Sine of x.
sinh sinh(x) Hyperbolic sine of x.
vRealize Operations Manager Customization and Administration Guide
104 VMware, Inc.
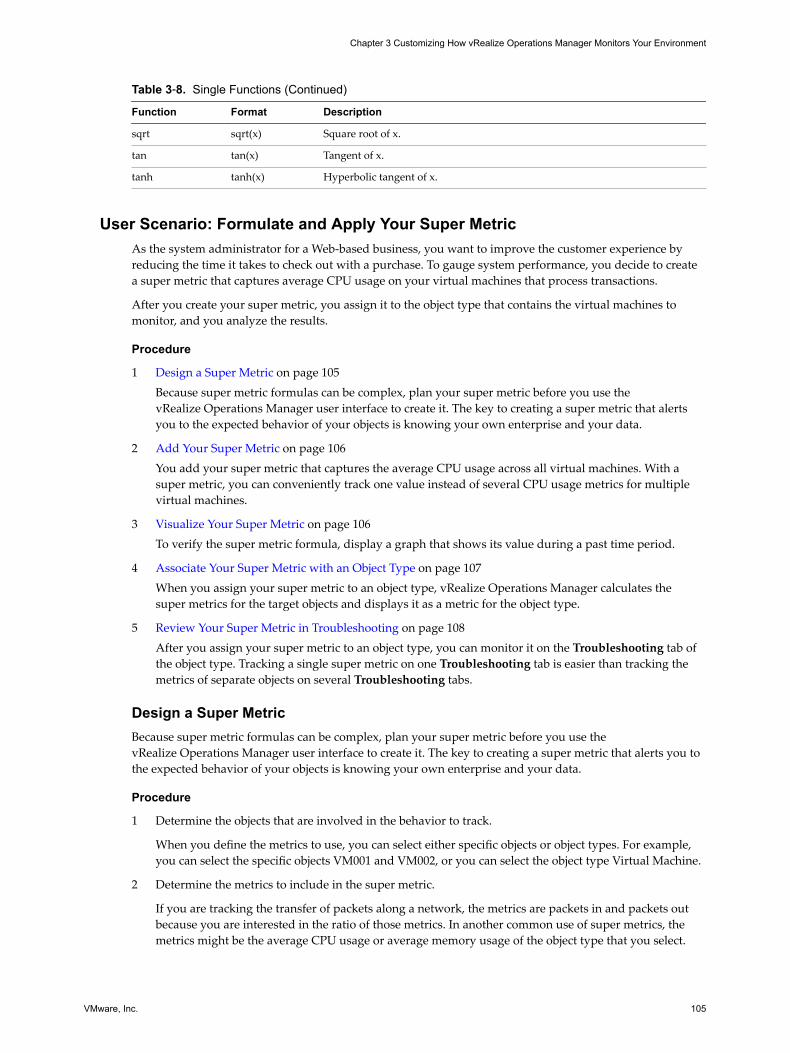
Table 3‑8. Single Functions (Continued)
Function Format Description
sqrt sqrt(x) Square root of x.
tan tan(x) Tangent of x.
tanh tanh(x) Hyperbolic tangent of x.
User Scenario: Formulate and Apply Your Super MetricAs the system administrator for a Web-based business, you want to improve the customer experience byreducing the time it takes to check out with a purchase. To gauge system performance, you decide to createa super metric that captures average CPU usage on your virtual machines that process transactions.
After you create your super metric, you assign it to the object type that contains the virtual machines tomonitor, and you analyze the results.
Procedure
1 Design a Super Metric on page 105Because super metric formulas can be complex, plan your super metric before you use thevRealize Operations Manager user interface to create it. The key to creating a super metric that alertsyou to the expected behavior of your objects is knowing your own enterprise and your data.
2 Add Your Super Metric on page 106You add your super metric that captures the average CPU usage across all virtual machines. With asuper metric, you can conveniently track one value instead of several CPU usage metrics for multiplevirtual machines.
3 Visualize Your Super Metric on page 106To verify the super metric formula, display a graph that shows its value during a past time period.
4 Associate Your Super Metric with an Object Type on page 107When you assign your super metric to an object type, vRealize Operations Manager calculates thesuper metrics for the target objects and displays it as a metric for the object type.
5 Review Your Super Metric in Troubleshooting on page 108After you assign your super metric to an object type, you can monitor it on the Troubleshooting tab ofthe object type. Tracking a single super metric on one Troubleshooting tab is easier than tracking themetrics of separate objects on several Troubleshooting tabs.
Design a Super MetricBecause super metric formulas can be complex, plan your super metric before you use thevRealize Operations Manager user interface to create it. The key to creating a super metric that alerts you tothe expected behavior of your objects is knowing your own enterprise and your data.
Procedure
1 Determine the objects that are involved in the behavior to track.
When you define the metrics to use, you can select either specific objects or object types. For example,you can select the specific objects VM001 and VM002, or you can select the object type Virtual Machine.
2 Determine the metrics to include in the super metric.
If you are tracking the transfer of packets along a network, the metrics are packets in and packets outbecause you are interested in the ratio of those metrics. In another common use of super metrics, themetrics might be the average CPU usage or average memory usage of the object type that you select.
Chapter 3 Customizing How vRealize Operations Manager Monitors Your Environment
VMware, Inc. 105
3 Decide how to combine or compare the metrics.
For example, to find the ratio of packets in to packets out, you must divide the two metrics. If you aretracking CPU usage for an object type, you might want to determine the average use, or you might wantto determine what the highest or lowest use is for any object of that type. In more complex scenarios,you might need a formula that uses constants or trigonometric functions.
4 Decide where to assign the super metric.
You define the objects to track in the super metric, then assign the super metric to the object type thatcontains the objects being tracked. To monitor all the objects in a group, enable the super metric in thepolicy, and apply the policy to the object group.
Add Your Super MetricYou add your super metric that captures the average CPU usage across all virtual machines. With a supermetric, you can conveniently track one value instead of several CPU usage metrics for multiple virtualmachines.
Prerequisites
n Design your super metric formula. See “Design a Super Metric,” on page 105.
n Become familiar with the user interface to build super metric formulas. See “Building a Super MetricFormula,” on page 108.
Procedure
1 Select Content > Super Metrics and click the plus sign.
2 Enter a meaningful name for the super metric such as SM-AvgVMCPUUsage% in the Name text box.
3 Define the formula for the super metric.
Select each function or operator to use and the metrics or attribute kinds to use in each function or witheach operator.
a For Function, select avg.
b In the Operators field, select the left parenthesis, then select the right parenthesis. Click betweenthe two parentheses to position your cursor in the formula.
c In the Adapter Type field of the Object Types pane, select vCenter Adapter.
d From the list of object types that appear, select Virtual Machine.
e In the Attribute Kinds pane, expand the CPU category, scroll down and double-click the Usage (%)metric .
The formula appears as a mathematical function with the format avg(${adapterkind=VMWARE,resourcekind=VirtualMachine, attribute=cpu|usage_average, depth=1}). To view the formula in atextual format, click the Show Formula Description icon. The formula appears as avg(VirtualMachine:CPU|Usage).
If the formula syntax is wrong, an error message appears. For example, vRealize Operations Managerverifies that the number of opening and closing parentheses are the same and that single values andarrays are not mixed. You must correct the formula before you can save the super metric.
Visualize Your Super MetricTo verify the super metric formula, display a graph that shows its value during a past time period.
Before you apply the super metric to an object type such as a host system, verify that it works for an object ofthat type.
vRealize Operations Manager Customization and Administration Guide
106 VMware, Inc.
Prerequisites
n Design your super metric formula. See “Design a Super Metric,” on page 105.
n Create your super metric. See “Add Your Super Metric,” on page 106.
Procedure
1 On the Manage Super Metric workspace, in the Adapter Type field of the Object Types pane, selectvCenter Adapter.
2 From the list of object types that appear, select Host System.
3 In the toolbar above the formula, click the Visualize Super Metric icon.
4 In the Objects pane, double-click one of the host systems listed.
The metric graph replaces the Metrics and Attribute Types panes.
The metric graph shows the values of the metric collected for the host system. Verify that the graph showsvalues over time. If the graph displays no values or zero values, the formula might contain an error.
Associate Your Super Metric with an Object TypeWhen you assign your super metric to an object type, vRealize Operations Manager calculates the supermetrics for the target objects and displays it as a metric for the object type.
You defined super metric SM-AvgVMCPUUsage% to calculate average CPU usage across all virtual machines.The mathematical formula for the super metric is avg(${adapterkind=VMWARE,resourcekind=VirtualMachine, attribute=cpu|usage_average, depth=1}). With depth=1, you assign thesuper metric to an object type that is one level above virtual machines in the relationship chain so that thesuper metric appears as a metric for that object type.
Prerequisites
n Create or import your super metric. See “Add Your Super Metric,” on page 106.
n Visualize your super metric to verify that it works properly. See “Visualize Your Super Metric,” onpage 106.
Procedure
1 Select Content > Super Metrics and select the SM-AvgVMCPUUsage% super metric .
2 Click the Object Types tab and click the plus sign.
3 Under vCenter Adapter, select Host System and click Select.
The super metric calculates the average CPU usage across all virtual machines one level below the host.
The super metric is associated with a parent object type.
What to do next
In the Policies > Edit Policy > Attributes workspace, users must select and enable each super metric. See “Custom Policies,” on page 83.
Wait at least one collection cycle for the super metric to start collecting and processing data. Then reviewyour super metric.
Chapter 3 Customizing How vRealize Operations Manager Monitors Your Environment
VMware, Inc. 107
Review Your Super Metric in TroubleshootingAfter you assign your super metric to an object type, you can monitor it on the Troubleshooting tab of theobject type. Tracking a single super metric on one Troubleshooting tab is easier than tracking the metrics ofseparate objects on several Troubleshooting tabs.
The super metric SM-AvgVMCPUUsage% you defined to calculate average CPU usage across all virtual machinesis assigned to the Host System object type. After one collection cycle has completed, SM-AvgVMCPUUsage%appears as a super metric on each host.
Prerequisites
n Create or import your super metric. See “Add Your Super Metric,” on page 106.
n Visualize your super metric to verify that it works properly. See “Visualize Your Super Metric,” onpage 106.
n Associate your super metric to a an object type. See “Associate Your Super Metric with an Object Type,”on page 107.
Procedure
1 Select Environment > All Objects.
2 Under vCenter Adapter, expand Host System and select one of the objects.
3 On the Troubleshooting tab, select All Metrics.
4 Scroll down the metrics list to expand Super Metric and double-click SM-AvgVMCPUUsage% to view theaverage CPU usage for all virtual machines that are children of the host you selected.
If the average CPU usage is low, system performance is good and your customers should not experiencelong transaction processing times. You can continue monitoring the super metric for changes in averageCPU usage that might affect the customer experience. If the average CPU usage fluctuates, enable the supermetric in a custom policy associated with the host objects to send an alert when the super metric valuereaches an unacceptable threshold.
Building a Super Metric FormulaA super metric formula can include one or more metric specifications, super metric functions, arithmeticoperators such as the plus or minus sign, and constants. You can enter any number of constants as part ofthe formula.
Procedure
u Use the correct procedures and rules to build a super metric formula in thevRealize Operations Manager user interface.
Option Action
To use a function. Select it from the Function drop-down menu. Select the object or objecttype, and metric or attribute type to use in its argument. The database IDsof the object and metric appear in the formula line at the top of thewindow.
To select an object and metric Click the object in the Objects pane and double-click the metric in theMetrics pane.
Define a metric for the object towhich the super metric is assigned.
a Click the This Object icon or enter this on the formula line.
If the This Object icon is not selected, the super metric functionsdisplay the object with a long description.
b In the Objects pane, click an object that contains the metric to use.c In the Metrics pane, double-click the metric.
vRealize Operations Manager Customization and Administration Guide
108 VMware, Inc.
Option Action
To select an object type andattribute type as an argument for alooping function.
Select an object type and double-click an attribute type. The database IDsof the object type and attribute type appear in the formula line.
To shorten the Object Types list. Enter all or part of the adapter type in the Search text box and click thearrow next to the text box.
To see the formula with object andmetric names instead of IDs.
Click the Show Formula Description icon in the area beneath the formulaline.
To select function names andformats and arithmetic operators.
Either enter them directly on the formula line or select them from thedrop-down menus.
To use parentheses to specify theorder of operations in the formula.
Either enter them directly on the formula line or select them from theOperators drop-down menu.
To clear the object or object typesselection.
Click the Refresh icon in the Objects or Object Types pane at any time.
Exporting a Super MetricYou can export a super metric from one vRealize Operations Manager instance and import it to anothervRealize Operations Manager instance. For example, after developing a super metric in a test environment,you can export it to use in a production environment.
Prerequisites
Create a super metric. See “User Scenario: Formulate and Apply Your Super Metric,” on page 105.
Procedure
1 Select Content > Super Metrics.
2 Select the super metric to export and click the Export Selected Super Metric actions icon.
vRealize Operations Manager creates a super metric file, for example, SuperMetric.json.
3 Download the super metric file to your computer.
What to do next
Import the super metric file to another instance of vRealize Operations Manager. See “Importing a SuperMetric,” on page 109.
Importing a Super MetricYou can import a super metric that was exported from another instance of vRealize Operations Manager.For example, after a super metric is developed and tested in a lab environment, you can import a supermetric to a production environment.
If the super metric to import contains a reference to an object that does not exist in the target instance, theimport fails. vRealize Operations Manager returns a brief error message and writes detailed information tothe log file.
Prerequisites
Export a super metric from another vRealize Operations Manager instance. See “Exporting a Super Metric,”on page 109.
Procedure
1 Select Content > Super Metrics and click the Import Super Metric actions icon.
2 (Optional) If the target instance has a super metric with the same name as the super metric you areimporting, you can either overwrite the existing super metric or skip the import, which is the default.
Chapter 3 Customizing How vRealize Operations Manager Monitors Your Environment
VMware, Inc. 109
3 Click Browse, select the super metric file to import, and click Open.
After the import is finished, the super metric is listed.
Customizing IconsEvery object or adapter in your environment has an icon representation. You can customize how the iconappears.
vRealize Operations Manager assigns a default icon to each object type and adapter type . Taken collectively,object types and adapter types are known as objects in your environment. Icons represent objects in the UIand help you to identify the type of object. For example, in the Topology Graph widget on a dashboard,labeled icons show how objects are connected to one other. You can quickly identify the type of object fromthe icon.
If you want to differentiate objects, you can change the icon. For example, a virtual machine icon is generic.If you want to pictorially distinguish the data that a vSphere virtual machine provides from the data that aHypervisor virtual machine provides, you can assign a different icon to each.
Customize an Object Type IconYou can use the default icons that vRealize Operations Manager provides, or you can upload your owngraphics file for an object type. When you change an icon, your changes take effect for all users.
Prerequisites
If you plan to use your own icon files, verify that each image is in PNG format and has the same height andwidth. For best results, use a 256x256 pixel image size.
Procedure
1 Select Content > Icons > Object Type Icons.
2 Assign the Object Type icon.
a Select the object type in the list with the icon to change.
By default, object types for all adapter types are listed. To limit the selection to the object types thatare valid for a single adapter type, select the adapter type from the drop-down menu.
b Click the Upload icon.
c Browse to and select the file to use and click Done.
3 (Optional) To return to the default icon, select the object type and click the Assign Default Icons icon.
The original default icon appears.
Customize an Adapter Type IconYou can use the default icons that vRealize Operations Manager provides, or you can upload your owngraphics file for an adapter type. When you change an icon, your changes take effect for all users.
Prerequisites
If you plan to use your own icon files, verify that each image is in PNG format and has the same height andwidth. For best results, use a 256x256 pixel image size.
Procedure
1 Select Content > Icons > Adapter Type Icons.
vRealize Operations Manager Customization and Administration Guide
110 VMware, Inc.
2 Assign the Adapter Type icon.
a Select the adapter type in the list with the icon to change.
b Click the Upload icon.
c Browse to and select the file to use and click Done.
3 (Optional) To return to the default icon, select the adapter type and click the Assign Default Icons icon.
The original default icon appears.
Managing Objects in Your EnvironmentAn object is the individual managed item in your environment for which vRealize Operations Managercollects data, such as a router, switch, database, virtual machine, host, and vCenter Server instances.
vRealize Operations Manager requires specific information about each object. When you configure anadapter instance, vRealize Operations Manager performs object discovery to start collecting data from theobjects with which the adapter communicates.
An object can be a single entity, such as a database, or a container that holds other objects. For example, ifyou have multiple Web servers, you can define a single object for each Web server and define a separatecontainer object to hold all of the Web server objects. Groups and applications are types of containers.
You categorize your objects using tags, so that you can easily find, group, or filter them later. A tag type canhave multiple tag values. You or vRealize Operations Manager assigns objects to tag values. When you selecta tag value, vRealize Operations Manager displays the objects associated with that tag. For example, if a tagtype is Lifecycle and tag values are Development, Test, Pre-production, and Production, you might assignvirtual machine objects VM1, VM2, or VM3 in your environment to one or more of these tag values,depending on the virtual machine function.
Adding an Object to Your EnvironmentYou might want to add an object by providing its information to vRealize Operations Manager. For example,some solutions cannot discover all the objects that might be monitored. For these solutions, you must eitheruse manual discovery or manually add the object.
When you add an individual object, you provide specific information about it, including the kind of adapterto use to make the connection and the connection method. For example, an SNMP adapter does not knowthe location of the SNMP devices that you want to monitor. You can use manual discovery to perform a portscan through an IP range. If port scans are not allowed on the network for security reasons, you must addthe devices manually.
Prerequisites
Verify that an adapter is present for the object you plan to add. See the vRealize Operations Manager vAppDeployment and Configuration Guide.
Procedure
1 Select Administration > Inventory Explorer.
2 On the toolbar, click the plus sign.
3 Provide the required information.
Option Description
Display name Enter a name for the object. For example, enter SNMP-Switch1.
Description Enter any description. For example, enterSwitch monitored with SNMP adapter
Adapter type Select an adapter type. For example, select SNMP Adapter.
Chapter 3 Customizing How vRealize Operations Manager Monitors Your Environment
VMware, Inc. 111
Option Description
Adapter instance Select an adapter instance.
Object type Select an object type. For an SNMP adapter, select an MIB file.vRealize Operations Manager uses the MIB file to determine what data isavailable on the switch. When you select the object type, the dialog boxselections change to include information you provide so thatvRealize Operations Manager can find and connect with the selected objecttype.
Host IP address Enter the host IP. For example, enter the IP address of the switch.
Port number Accept the default port number or enter a new value. For the SNMPadapter, this port is the SNMP management port number.
Credential Select the Credential, or click the plus sign to add new login credentials forthe object.
Collection interval Enter the collection interval, in minutes. For example, if you expect theswitch to generate performance data every 5 minutes, set the collectioninterval to 5 minutes.
Dynamic Thresholding. Accept the default, Yes.
4 Click OK to add the object.
SNMP-Switch1 appears in the Inventory Explorer as an MIB object type for the SNMP adapter type.
What to do next
For each new object, vRealize Operations Manager assigns tag values for its collector and its object type.Sometimes, you might want to assign other tags.
Creating and Assigning TagsA large enterprise can have thousands of objects defined in vRealize Operations Manager. Creating objecttags and tag values makes it easier to find objects and metrics in vRealize Operations Manager. With objecttags, you select the tag value assigned to an object and view the list of objects that are associated with thattag value.
A tag is a type of information, such as Adapter Types. Adapter Types is a predefined tag invRealize Operations Manager. Tag values are individual instances of that type of information. For example,when vRealize Operations Manager discovers objects using the vCenter Adapter, it assigns all the objects tothe vCenter Adapter tag value under the Adapter Types tag.
You can assign any number of objects to each tag value, and you can assign a single object to tag valuesunder any number of tags. You typically look for an object by looking under its adapter type, its object type,and possibly other tags.
If an object tag is locked, you cannot add objects to it. vRealize Operations Manager maintains locked objecttags.
n Predefined Object Tags on page 113vRealize Operations Manager includes several predefined object tags. It creates values for most ofthese tags and assigns objects to the values.
n Add an Object Tag and Assign Objects to the Tag on page 114An object tag is a type of information, and a tag value is an individual instance of that type ofinformation. If the predefined object tags do not meet your needs, you can create your own object tagsto categorize and manage objects in your environment. For example, you can add a tag for cloudobjects and add tag values for different cloud names. Then you can assign objects to the cloud name.
n Use a Tag to Find an Object on page 114The quickest way to find an object in vRealize Operations Manager is to use tags. Using tags is moreefficient than searching through the entire object list.
vRealize Operations Manager Customization and Administration Guide
112 VMware, Inc.
Predefined Object TagsvRealize Operations Manager includes several predefined object tags. It creates values for most of these tagsand assigns objects to the values.
For example, when you add an object, vRealize Operations Manager assigns it to the tag value for thecollector it uses and the kind of object that it is. It creates tag values if they do not already exist.
If a predefined tag has no values, there is no object of that tag type. For example, if no applications aredefined in your vRealize Operations Manager instance, the applications tag has no tag values.
Each tag value appears with the number of objects that have that tag. Tag values that have no objects appearwith the value zero. You cannot delete the predefined tags or tag values that vRealize Operations Managercreates.
Table 3‑9. Predefined Tags
Tag Description
Collectors (Full Set) Each defined collector is a tag value. Each object is assignedto the tag value for the collector that it uses when you addthe object to vRealize Operations Manager. The defaultcollector is vRealize Operations Manager Collector-vRealize.
Applications (Full Set) Each defined application is a tag value. When you add atier to an application, or an object to a tier in an application,the tier is assigned to that tag value.
Maintenance Schedules (Full Set) Each defined maintenance schedule is a tag value, andobjects are assigned to the value when you give them aschedule by adding or editing them.
Adapter Types Each adapter type is a tag value, and each object that usesthat adapter type is given the tag value.
Adapter Instances Each adapter instance is a tag value, and each object isassigned the tag value for the adapter instance or instancesthrough which its metrics are collected.
Object Types Each type of object is a tag value, and each object isassigned to the tag value for its type when you add theobject.
Recently Added Objects The last day, seven days, 10 days, and 30 days have tagvalues. Objects have this tag value as long as the tag valueapplies to them.
Object Statuses Tag value assigned to objects that are not receiving data.
Collection States Tag value assigned to indicate the object collection state,such as collecting or not collecting.
Health Ranges Good (green), Warning (yellow), Immediate (orange),Critical (red), and Unknown (blue) health statuses have tagvalues. Each object is assigned the value for its currenthealth status.
Entire Enterprise The only tag value is Entire Enterprise Applications. Thistag value is assigned to each application.
Licensing Tag values are License Groups found underAdministration > Licensing. Objects are assigned to thelicense groups during vRealize Operations Managerinstallation.
Untag Drag an object to this tag to delete the tag assignment.
Chapter 3 Customizing How vRealize Operations Manager Monitors Your Environment
VMware, Inc. 113
Add an Object Tag and Assign Objects to the TagAn object tag is a type of information, and a tag value is an individual instance of that type of information. Ifthe predefined object tags do not meet your needs, you can create your own object tags to categorize andmanage objects in your environment. For example, you can add a tag for cloud objects and add tag valuesfor different cloud names. Then you can assign objects to the cloud name.
Prerequisites
Become familiar with the predefined object tags.
Procedure
1 Select Administration > Inventory Explorer.
2 Click the Manage Tags icon above the list of tags.
3 Click the Add New Tag icon to add a new row and type the name of the tag in the row.
For example, type Cloud Objects and click Update.
4 With the new tag selected, click the Add New Tag Value icon to add a new row and type the name ofthe value in the row.
For example, type Video Cloud and click Update.
5 Click OK to add the tag.
6 Click the tag to which you want to add objects to display the list of object tag values.
For example, click Cloud Objects to display the Video Cloud object tag value.
7 Drag objects from the list in the right pane of the Inventory Explorer onto the tag value name.
You can press Ctrl+click to select multiple individual objects or Shift+click to select a range of objects.
For example, if you want to assign datacenters that are connected through the vCenter Adapter, typevCenter in the search filter and select the datacenter objects to add.
Use a Tag to Find an ObjectThe quickest way to find an object in vRealize Operations Manager is to use tags. Using tags is more efficientthan searching through the entire object list.
Tag values that can also be tags are Applications and Object Types. For example, the Object Types tag hasvalues for each object that is in vRealize Operations Manager, such as Virtual Machine, which includes allthe virtual machine objects in your environment. Each of these virtual machines is also a tag value for theVirtual Machine tag. You can expand the tag value list to select the value for which you want to see objects.
Procedure
1 Select Administration > Inventory Explorer.
2 In the tag list in the center pane, click a tag for an object with an assigned value.
When you click a tag, the list of values expands under the tag. The number of objects that is associatedwith each value appears next to the tag value.
A plus sign next to a tag value indicates that the value is also a tag and that it contains other tag values.You can click the plus sign to see the subvalues.
3 Select the tag value.
The objects that have that tag value appear in the pane on the right. If you select multiple tag values, theobjects in the list depend on the values that you select.
vRealize Operations Manager Customization and Administration Guide
114 VMware, Inc.
Tag Value Selection Objects Displayed
More than one value for thesame tag
The list includes objects that have either value. For example, if you select two valuesof the Object Types tag, such as Datacenter and Host System, the list shows objectsthat have either value.
Values for two or moredifferent tags
The list includes only objects that have all of the selected values. For example, if youselect two values of the Object Types tag, such as Datacenter and Host System, andyou also select an adapter instance such as vC-1 of the vCenter Adapter instance tag,only Datacenter or Host System objects associated with vC-1 appear in the list.Datacenter or Host System objects associated with other adapter instances do notappear in the list, nor do objects that are not Datacenter or Host System objects.
4 Select the object from the list.
Configuring Object RelationshipsvRealize Operations Manager shows the relationship between objects in your environment. Mostrelationships are automatically formed when the objects are discovered by an installed adapter. In addition,you can use vRealize Operations Manager to create relationships between objects that might not normally berelated.
Objects are related physically, logically, or structurally.
n Physical relationships represent how objects connect in the physical world. For example, virtualmachines running on a host are physically related.
n Logical relationships represent business silos. For example, all the storage objects in an environment arerelated to one another.
n Structural relationships represent a business value. For example, all the virtual machines that support adatabase are structurally related.
Solutions use adapters to monitor the objects in your environment so that physical relationship changes arereflected in vRealize Operations Manager. To maintain logical or structural relationships, you can usevRealize Operations Manager to define the object relationships. When objects are related, a problem withone object appears as an anomaly on related objects. So object relationships can help you to identifyproblems in your environment quickly.
Adding an Object RelationshipParent-child relationships normally occur between interrelated objects in your environment. For example, adata center object for a vCenter Adapter instance might have datastore, cluster, and host system childobjects.
The most common object relationships gather similar objects into groups. When you define a custom groupwith parent objects, a summary of that group shows alerts for that object and for any of its descendants. Youcan create relationships between objects that might not normally be related. For example, you might define achild object for an object in the group. You define these types of relationships by configuring objectrelationships.
Procedure
1 Select Administration > Object Relationships.
2 In the Parent Selection column, expand the object tag and select a tag value that contains the object toact as the parent object.
The objects for the tag value appear in the top pane of the second column.
3 Select a parent object.
Current child objects appear in the bottom pane of the second column.
Chapter 3 Customizing How vRealize Operations Manager Monitors Your Environment
VMware, Inc. 115
4 In the column to the right of the List column, expand the object tag and select a tag value that containsthe child object to relate to the parent.
5 (Optional) If the list of objects is long, filter the list to find the child object or objects.
Option Action
Navigate the object tag list for anobject
Expand the object tag in the pane to the right of the List column and selecta tag value that contains the object. The objects for the tag value appear inthe List column. If you select more than one value for the same tag, the listcontains objects that have either value. If you select values for two or moredifferent tags, the list includes only objects that have all of the selectedvalues.
Search for an object by name If you know all or part of the object name, enter it in the Search text boxand press Enter.
6 To make an object a child object of the parent object, select the object from the list and drag it to the
parent object in the top pane of the second column, or click the Add All Objects To Parent icon to makeall of the listed objects children of the parent object.
You can use Ctrl+click to select multiple objects or Shift+click to select a range of objects.
Example: Custom Group with Child ObjectsIf you want vRealize Operations Manager to monitor objects in your environment to ensure that servicelevel capacity requirements for your IT department are met, you add the objects to a custom group, apply agroup policy, and define criteria that affect the membership of objects in the group. If you want to monitorthe capacity of an object that does not affect the service level requirements, you can add the object as a childof a parent object in the group. If a capacity problem exists for the child object, the summary of the groupshows an alert for the parent object.
Customizing How Endpoint Operations Management MonitorsOperating Systems
Endpoint Operations Management gathers operating system metrics through agent-based collections. Inaddition to the features available after initial configuration of Endpoint Operations Management, you canenable remote monitoring, enable or disable plug-ins for additional monitoring, and customizeEndpoint Operations Management logging.
Configuring Remote MonitoringWith remote monitoring you can monitor the state of an object from a remote location by configuring aremote check.
You can configure remote monitoring using HTTP, ICMP TCP methods.
When you configure a remote HTTP, ICMP or TCP check, it is created as a child object of the tested objectthat you are monitoring and of the monitoring agent.
If the object that you select to remotely monitor does not already have an alert configured, one is createdautomatically in the format Remote check type failed on a object type. If the object has an existing alert,that is used.
Configure Remote Monitoring of an ObjectUse this procedure to configure remote monitoring of an object.
Configuration options are defined in “HTTP Configuration Options,” on page 117, “ICMP ConfigurationOptions,” on page 120and “TCP Configuration Options,” on page 121. You might need to refer to thisinformation when you are completing this procedure.
vRealize Operations Manager Customization and Administration Guide
116 VMware, Inc.
Procedure
1 In the vRealize Operations Manager user interface, select the remote object to monitor.
2 On the details page for the object, select Monitor this Object Remotely from the Actions menu.
3 In the Monitor Remote Object dialog, select the Endpoint Operations Management agent that willremotely monitor the object from the Monitored From menu.
4 Select the method with which the remote object will be monitored from the Check Method menu.
The relevant parameters for the selected object type appear.
5 Enter values for all of the configuration options and click OK.
HTTP Configuration Options
Here are the options in the configuration schema for the HTTP resource.
For the HTTP resource, the netservices plug-in descriptor default values are:
n port: 80
n sslport: 443
HTTP Configuration Options
Table 3‑10. ssl Option
Option Information Value
Description Use ssl
Default false
Optional true
Type boolean
Notes N/A
Parent Schema ssl
Table 3‑11. hostname Option
Option Information Value
Description Hostname
Default localhost
Optional false
Type N/A
Notes The hostname of system that hosts the service to monitor.For example: mysite.com
Parent Schema sockaddr
Table 3‑12. port Option
Option Information Value
Description Port
Default A default value for port is usually set for each type ofnetwork service by properties in the netservices plug-indescriptor.
Optional false
Type N/A
Chapter 3 Customizing How vRealize Operations Manager Monitors Your Environment
VMware, Inc. 117
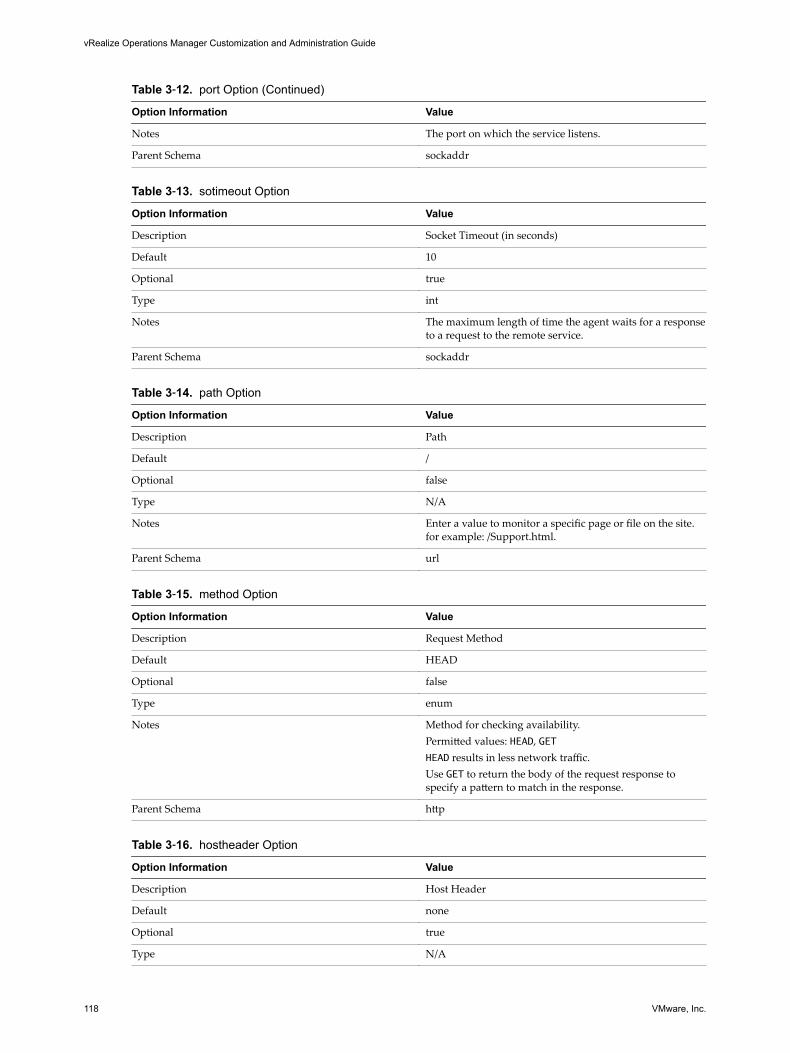
Table 3‑12. port Option (Continued)
Option Information Value
Notes The port on which the service listens.
Parent Schema sockaddr
Table 3‑13. sotimeout Option
Option Information Value
Description Socket Timeout (in seconds)
Default 10
Optional true
Type int
Notes The maximum length of time the agent waits for a responseto a request to the remote service.
Parent Schema sockaddr
Table 3‑14. path Option
Option Information Value
Description Path
Default /
Optional false
Type N/A
Notes Enter a value to monitor a specific page or file on the site.for example: /Support.html.
Parent Schema url
Table 3‑15. method Option
Option Information Value
Description Request Method
Default HEAD
Optional false
Type enum
Notes Method for checking availability.Permitted values: HEAD, GETHEAD results in less network traffic.Use GET to return the body of the request response tospecify a pattern to match in the response.
Parent Schema http
Table 3‑16. hostheader Option
Option Information Value
Description Host Header
Default none
Optional true
Type N/A
vRealize Operations Manager Customization and Administration Guide
118 VMware, Inc.

Table 3‑16. hostheader Option (Continued)
Option Information Value
Notes Use this option to set a Host HTTP header in the request.This is useful if you use name-based virtual hosting.Specify the host name of the Vhost's host, for example,blog.mypost.com.
Parent Schema http
Table 3‑17. follow Option
Option Information Value
Description Follow Redirects
Default enabled
Optional true
Type boolean
Notes Enable if the HTTP request that is generated will be re-directed. This is important, because an HTTP server returnsa different code for a redirect andvRealize Operations Manager determines that the HTTPservice check is unavailable if it is a redirect, unless thisredirect configuration is set.
Parent Schema http
Table 3‑18. pattern Option
Option Information Value
Description Response Match (substring or regex)
Default none
Optional true
Type N/A
Notes Specify a pattern or substring forvRealize Operations Manager to attempt to match againstthe content in the HTTP response. This enables you tocheck that in addition to being available, the resource isserving the content you expect.
Parent Schema http
Table 3‑19. proxy Option
Option Information Value
Description Proxy Connection
Default none
Optional true
Type N/A
Notes If the connection to the HTTP service goes through a proxyserver, supply the hostname and port for the proxy server.For example, proxy.myco.com:3128.
Parent Schema http
Chapter 3 Customizing How vRealize Operations Manager Monitors Your Environment
VMware, Inc. 119
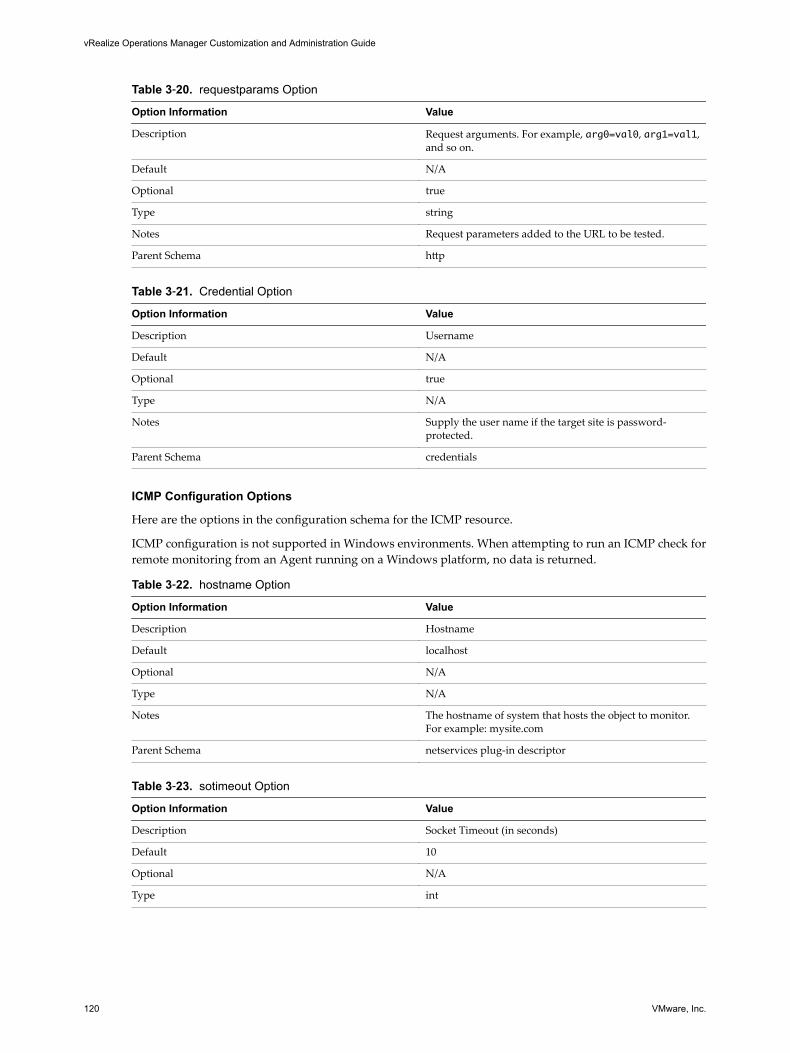
Table 3‑20. requestparams Option
Option Information Value
Description Request arguments. For example, arg0=val0, arg1=val1,and so on.
Default N/A
Optional true
Type string
Notes Request parameters added to the URL to be tested.
Parent Schema http
Table 3‑21. Credential Option
Option Information Value
Description Username
Default N/A
Optional true
Type N/A
Notes Supply the user name if the target site is password-protected.
Parent Schema credentials
ICMP Configuration Options
Here are the options in the configuration schema for the ICMP resource.
ICMP configuration is not supported in Windows environments. When attempting to run an ICMP check forremote monitoring from an Agent running on a Windows platform, no data is returned.
Table 3‑22. hostname Option
Option Information Value
Description Hostname
Default localhost
Optional N/A
Type N/A
Notes The hostname of system that hosts the object to monitor.For example: mysite.com
Parent Schema netservices plug-in descriptor
Table 3‑23. sotimeout Option
Option Information Value
Description Socket Timeout (in seconds)
Default 10
Optional N/A
Type int
vRealize Operations Manager Customization and Administration Guide
120 VMware, Inc.
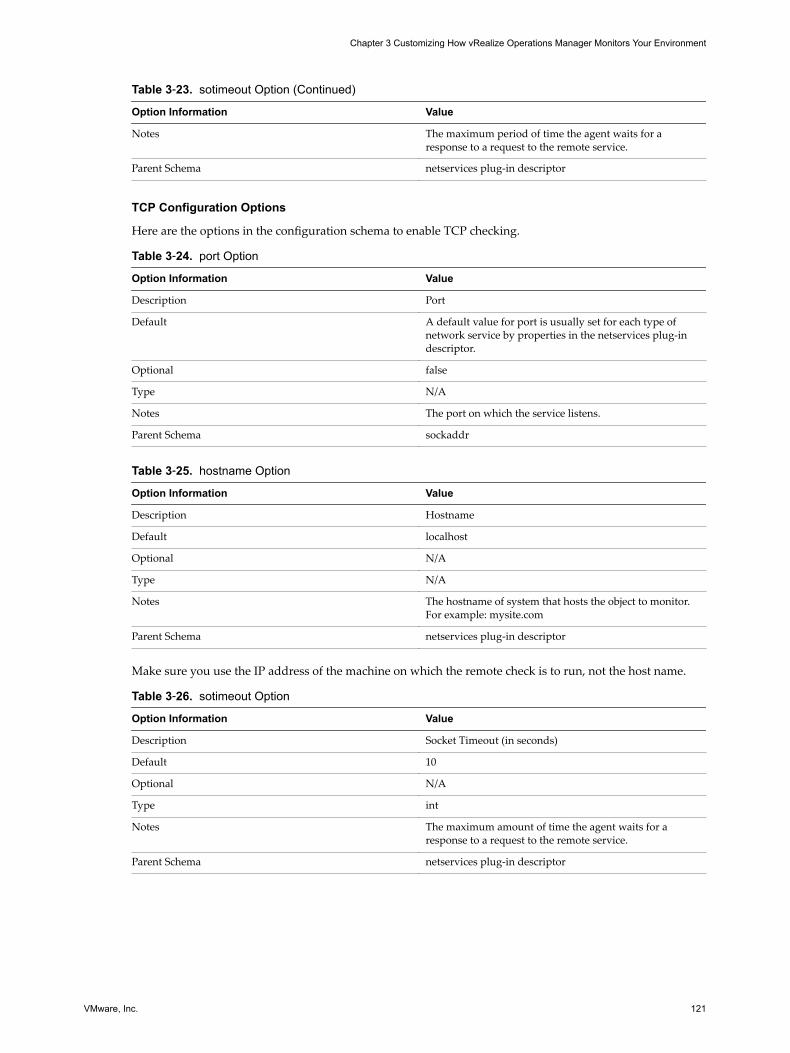
Table 3‑23. sotimeout Option (Continued)
Option Information Value
Notes The maximum period of time the agent waits for aresponse to a request to the remote service.
Parent Schema netservices plug-in descriptor
TCP Configuration Options
Here are the options in the configuration schema to enable TCP checking.
Table 3‑24. port Option
Option Information Value
Description Port
Default A default value for port is usually set for each type ofnetwork service by properties in the netservices plug-indescriptor.
Optional false
Type N/A
Notes The port on which the service listens.
Parent Schema sockaddr
Table 3‑25. hostname Option
Option Information Value
Description Hostname
Default localhost
Optional N/A
Type N/A
Notes The hostname of system that hosts the object to monitor.For example: mysite.com
Parent Schema netservices plug-in descriptor
Make sure you use the IP address of the machine on which the remote check is to run, not the host name.
Table 3‑26. sotimeout Option
Option Information Value
Description Socket Timeout (in seconds)
Default 10
Optional N/A
Type int
Notes The maximum amount of time the agent waits for aresponse to a request to the remote service.
Parent Schema netservices plug-in descriptor
Chapter 3 Customizing How vRealize Operations Manager Monitors Your Environment
VMware, Inc. 121
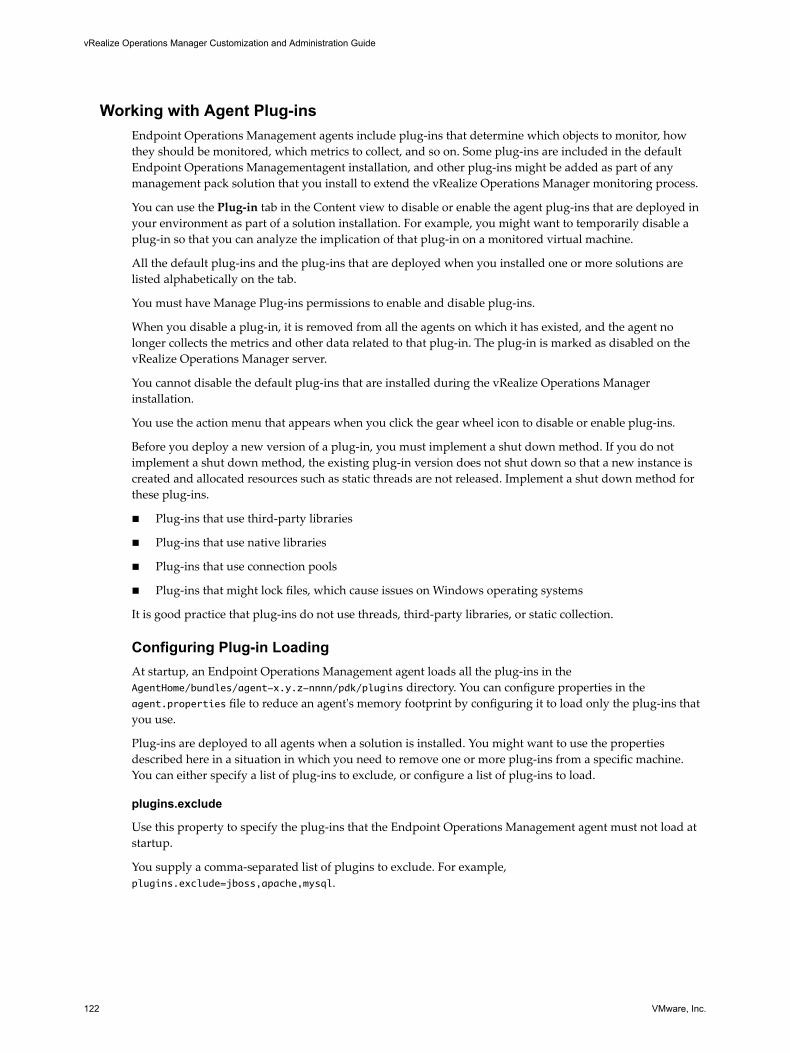
Working with Agent Plug-insEndpoint Operations Management agents include plug-ins that determine which objects to monitor, howthey should be monitored, which metrics to collect, and so on. Some plug-ins are included in the defaultEndpoint Operations Managementagent installation, and other plug-ins might be added as part of anymanagement pack solution that you install to extend the vRealize Operations Manager monitoring process.
You can use the Plug-in tab in the Content view to disable or enable the agent plug-ins that are deployed inyour environment as part of a solution installation. For example, you might want to temporarily disable aplug-in so that you can analyze the implication of that plug-in on a monitored virtual machine.
All the default plug-ins and the plug-ins that are deployed when you installed one or more solutions arelisted alphabetically on the tab.
You must have Manage Plug-ins permissions to enable and disable plug-ins.
When you disable a plug-in, it is removed from all the agents on which it has existed, and the agent nolonger collects the metrics and other data related to that plug-in. The plug-in is marked as disabled on thevRealize Operations Manager server.
You cannot disable the default plug-ins that are installed during the vRealize Operations Managerinstallation.
You use the action menu that appears when you click the gear wheel icon to disable or enable plug-ins.
Before you deploy a new version of a plug-in, you must implement a shut down method. If you do notimplement a shut down method, the existing plug-in version does not shut down so that a new instance iscreated and allocated resources such as static threads are not released. Implement a shut down method forthese plug-ins.
n Plug-ins that use third-party libraries
n Plug-ins that use native libraries
n Plug-ins that use connection pools
n Plug-ins that might lock files, which cause issues on Windows operating systems
It is good practice that plug-ins do not use threads, third-party libraries, or static collection.
Configuring Plug-in LoadingAt startup, an Endpoint Operations Management agent loads all the plug-ins in theAgentHome/bundles/agent-x.y.z-nnnn/pdk/plugins directory. You can configure properties in theagent.properties file to reduce an agent's memory footprint by configuring it to load only the plug-ins thatyou use.
Plug-ins are deployed to all agents when a solution is installed. You might want to use the propertiesdescribed here in a situation in which you need to remove one or more plug-ins from a specific machine.You can either specify a list of plug-ins to exclude, or configure a list of plug-ins to load.
plugins.exclude
Use this property to specify the plug-ins that the Endpoint Operations Management agent must not load atstartup.
You supply a comma-separated list of plugins to exclude. For example,plugins.exclude=jboss,apache,mysql.
vRealize Operations Manager Customization and Administration Guide
122 VMware, Inc.
plugins.include
Use this property to specify the plug-ins that the Endpoint Operations Management agent must load atstartup.
You supply a comma-separated list of plugins to include. For example, plugins.include=weblogic,apache.
Understanding the Unsynchronized Agents GroupAn unsynchronized agent is an agent that is not synchronized with the vRealize Operations Manager serverin terms of its plug-ins. The agent might be missing plug-ins that are registered on the server, include plug-ins that are not registered on the server, or include plug-ins that have a different version to that registeredon the server.
Each agent must be synchronized with the vRealize Operations Manager server. During the time that anagent is not synchronized with the server, it appears in the Unsynchronized Agents list. The list is located inthe vRealize Operations Manager user interface on the Groups tab in the Environment view.
The first time an agent is started, a status message is sent to the server. The server compares the status sentby the agent with that on the server. The server sends commands to the agent to synchronize, download ordelete plug-ins, as required by the differences that it detects.
When a plug-in is deployed, disabled, or enabled as part of a management pack solution update, thevRealize Operations Manager server detects that change and sends a new command to the agents so thatsynchronization occurs.
Commonly, multiple agents are affected at the same time when a plug-in is deployed, disabled or enabled.All agents have an equal need to be updated so, to avoid overloading the server and creating performanceissues that might occur if many agents were all synchronized at the same time, synchronization isperformed in batches and is staggered in one-minute periods. You will notice that the list of unsynchronizedagents decrements over time.
Configuring Agent LoggingYou can configure the name, location, and logging level for Endpoint Operations Management agent logs.You can also redirect system messages to the agent log, and configure the debug log level for an agentsubsystem.
Agent Log FilesThe Endpoint Operations Management agent log files are stored in the AgentHome/log directory.
Agent log files include the following:
agent.log
agent.operations.log This log is applicable to Windows-based agents only.
This is an audit log that records the commands that were run on the agent,together with the parameters that the agent used to action them.
wrapper.log The Java service wrapper-based agent launcher writes messages to thewrapper.log file. For a non-JRE agent, this file is located inagentHome/wrapper/sbin.
In the event that the value was changed ifr the agent.logDir property, the fileis also located in agentHome/wrapper/sbin.
Chapter 3 Customizing How vRealize Operations Manager Monitors Your Environment
VMware, Inc. 123
Configuring the Agent Log Name or LocationUse these properties to change the name or location of the agent log file.
agent.logDir
You can add this property to the agent.properties file to specify the directory where theEndpoint Operations Management agent will write its log file. If you do not specify a fully qualified path,agent.logDir is evaluated relative to the agent installation directory.
This property does not exist in the agent.properties file unless you explicitly add it. The default behavior isequivalent to the agent.logDir=log setting, resulting in the agent log file being written to the AgentHome/logdirectory.
To change the location for the agent log file, add agent.logDir to the agent.properties file and enter a pathrelative to the agent installation directory, or a fully qualified path.
The name of the agent log file is configured with the agent.logFile property.
agent.logFile
This property specifies the path and name of the agent log file.
In the agent.properties file, the default setting for the agent.LogFile property is made up of a variable anda string, agent.logFile=${agent.logDir}\agent.logDir.
n agent.logDir is a variable that supplies the value of an identically named agent property. By default, thevalue of agent.logDir is log, interpreted relative to the agent installation directory.
n agent.log is the name for the agent log file.
By default, the agent log file is named agent.log and is written to the AgentHome/log directory.
To configure the agent to log to a different directory, you must explicitly add the agent.logDir property tothe agent.properties file.
Configuring the Agent Logging LevelUse this property to control the severity level of messages that the Endpoint Operations Management agentwrites to the agent log file.
agent.logLevel
This property specifies the level of detail of the messages that the Endpoint Operations Management agentwrites to the log file.
Setting the agent.logLevel property value to DEBUG level is not advised. This level of logging across allsubsystems imposes overhead, and can also cause the log file to roll over so frequently that log messages ofinterest are lost. It is preferable to configure debug level logging only at the subsystem level.
The changes that you make to this property become effective approximately five minutes after you save theproperties file. It is not necessary to restart the agent to initiate the change.
Redirecting System Messages to the Agent LogYou can use these properties to redirect system-generated messages to theEndpoint Operations Management agent log file.
agent.logLevel.SystemErr
This property redirects System.err to agent.log. Commenting out this setting causes System.err to bedirected to agent.log.startup.
The default value is ERROR.
vRealize Operations Manager Customization and Administration Guide
124 VMware, Inc.
agent.logLevel.SystemOut
This property redirects System.out to agent.log. Commenting out this setting causes System.out to bedirected to agent.log.startup.
The default value is INFO.
Configuring the Debug Level for an Agent SubsystemFor troubleshooting purposes, you can increase the logging level for an individual agent subsystem.
To increase the logging level for an individual agent subsystem, uncomment the appropriate line in thesection of the agent.properties file that is labelled Agent Subsystems: Uncomment individual subsystemsto see debug messages.
Agent log4j Properties
This is the log4j properties in the agent.properties file.
log4j.rootLogger=${agent.logLevel}, R
log4j.appender.R.File=${agent.logFile}
log4j.appender.R.MaxBackupIndex=1
log4j.appender.R.MaxFileSize=5000KB
log4j.appender.R.layout.ConversionPattern=%d{dd-MM-yyyy HH:mm:ss,SSS z} %-5p [%t] [%c{1}@%L] %m%n
log4j.appender.R.layout=org.apache.log4j.PatternLayout
log4j.appender.R=org.apache.log4j.RollingFileAppender
##
## Disable overly verbose logging
##
log4j.logger.org.apache.http=ERROR
log4j.logger.org.springframework.web.client.RestTemplate=ERROR
log4j.logger.org.hyperic.hq.measurement.agent.server.SenderThread=INFO
log4j.logger.org.hyperic.hq.agent.server.AgentDListProvider=INFO
log4j.logger.org.hyperic.hq.agent.server.MeasurementSchedule=INFO
log4j.logger.org.hyperic.util.units=INFO
log4j.logger.org.hyperic.hq.product.pluginxml=INFO
# Only log errors from naming context
log4j.category.org.jnp.interfaces.NamingContext=ERROR
log4j.category.org.apache.axis=ERROR
#Agent Subsystems: Uncomment individual subsystems to see debug messages.
#-----------------------------------------------------------------------
#log4j.logger.org.hyperic.hq.autoinventory=DEBUG
#log4j.logger.org.hyperic.hq.livedata=DEBUG
#log4j.logger.org.hyperic.hq.measurement=DEBUG
#log4j.logger.org.hyperic.hq.control=DEBUG
#Agent Plugin Implementations
#log4j.logger.org.hyperic.hq.product=DEBUG
#Server Communication
#log4j.logger.org.hyperic.hq.bizapp.client.AgentCallbackClient=DEBUG
#Server Realtime commands dispatcher
#log4j.logger.org.hyperic.hq.agent.server.CommandDispatcher=DEBUG
Chapter 3 Customizing How vRealize Operations Manager Monitors Your Environment
VMware, Inc. 125
#Agent Configuration parser
#log4j.logger.org.hyperic.hq.agent.AgentConfig=DEBUG
#Agent plugins loader
#log4j.logger.org.hyperic.util.PluginLoader=DEBUG
#Agent Metrics Scheduler (Scheduling tasks definitions & executions)
#log4j.logger.org.hyperic.hq.agent.server.session.AgentSynchronizer.SchedulerThread=DEBUG
#Agent Plugin Managers
#log4j.logger.org.hyperic.hq.product.MeasurementPluginManager=DEBUG
#log4j.logger.org.hyperic.hq.product.AutoinventoryPluginManager=DEBUG
#log4j.logger.org.hyperic.hq.product.ConfigTrackPluginManager=DEBUG
#log4j.logger.org.hyperic.hq.product.LogTrackPluginManager=DEBUG
#log4j.logger.org.hyperic.hq.product.LiveDataPluginManager=DEBUG
#log4j.logger.org.hyperic.hq.product.ControlPluginManager=DEBUG
Modifying Global SettingsThe global settings control the system settings for vRealize Operations Manager, including data retentionand system timeout settings. You can modify one or more of the settings to monitor your environmentbetter. These settings affect all your users.
The global settings do not affect metric interactions, color indicators, or other object management behaviors.These behaviors are configured in your policies.
Settings related to managing objects with vRealize Operations Manager are available on the Administration> Inventory Explorer page.
You can view tooltips for each option in the Edit Global Settings dialog box.
Global Settings Best PracticesMost of the settings pertain to how long vRealize Operations Manager retains collected and process data.
The default values are common retention periods. You might need to adjust the time periods based on yourlocal policies or disk space.
vRealize Operations Manager Customization and Administration Guide
126 VMware, Inc.

List of Global SettingsThe global settings determine how vRealize Operations Manager retains data, keeps connection sessionsopen, and other settings. These are system settings that affect all users.
Table 3‑27. Global Setting Default Values and Descriptions
SettingDefaultValue Description
Action History 90 days Number of days to retain the recent task data for actions.The data is purged from the system after the specified numberof days.
Deleted Objects 360 hours Number of hours to retain objects that are deleted from anadapter data source or server before deleting them fromvRealize Operations Manager.An object deleted from an adapter data source might beidentified by vRealize Operations Manager as not existing andvRealize Operations Manager can no longer collect data aboutthe object. Whether vRealize Operations Manager identifiesdeleted objects as not existing depends the adapter. This featureis not implemented in some adapters.For example, if the retention time is 360 hour and a virtualmachine is deleted from a vCenter Server instance, the virtualmachine remains as an object in vRealize Operations Managerfor 15 days before it is deleted.This setting applies to objects deleted from the data source orserver, not to any objects you delete fromvRealize Operations Manager on the Inventory Explorer page.A value of -1 deletes objects immediately.
Deletion Schedule Interval 24 hours Determines the frequency to schedule deletion of resources.This setting works with the Deleted Objects setting to removeobjects that no longer exist in the environment.vRealize Operations Manager transparently marks objects forremoval that have not existed for the length of time specifiedunder Deleted Objects. vRealize Operations Manager thenremoves the marked objects at the frequency specified underDeletion Scheduling Interval.
Object History 300 days Number of days to retain the history of the object configuration,relationship, and property data.The configuration data is the collected data from the monitoredobjects on which the metrics are based. The collected dataincludes changes to the configuration of the object.The data is purged from the system after the specified numberof days.
Session Timeout 30 minutes If your connection to vRealize Operations Manager is idle forthe specified amount of time, you are logged out of theapplication.You must provide credentials to log back in.
Symptoms/Alerts 90 days Number of days to retain canceled alerts and symptoms.The alerts and symptoms can be canceled by the system orcanceled by a user.
Time Series Data 6 months Number of months that you want to retain the collected andcalculated metric data for the monitored objects.If available disk space is less than 10%,vRealize Operations Manager purges older data and might notretain the full range specified.
Chapter 3 Customizing How vRealize Operations Manager Monitors Your Environment
VMware, Inc. 127
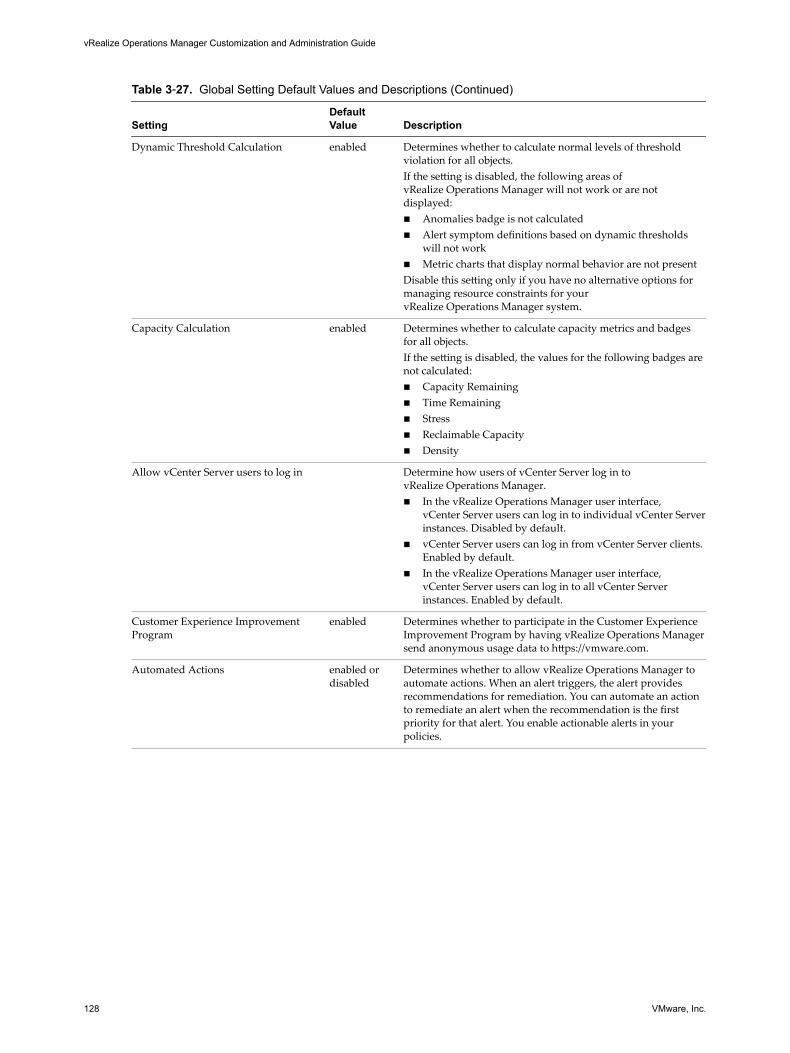
Table 3‑27. Global Setting Default Values and Descriptions (Continued)
SettingDefaultValue Description
Dynamic Threshold Calculation enabled Determines whether to calculate normal levels of thresholdviolation for all objects.If the setting is disabled, the following areas ofvRealize Operations Manager will not work or are notdisplayed:n Anomalies badge is not calculatedn Alert symptom definitions based on dynamic thresholds
will not workn Metric charts that display normal behavior are not presentDisable this setting only if you have no alternative options formanaging resource constraints for yourvRealize Operations Manager system.
Capacity Calculation enabled Determines whether to calculate capacity metrics and badgesfor all objects.If the setting is disabled, the values for the following badges arenot calculated:n Capacity Remainingn Time Remainingn Stressn Reclaimable Capacityn Density
Allow vCenter Server users to log in Determine how users of vCenter Server log in tovRealize Operations Manager.n In the vRealize Operations Manager user interface,
vCenter Server users can log in to individual vCenter Serverinstances. Disabled by default.
n vCenter Server users can log in from vCenter Server clients.Enabled by default.
n In the vRealize Operations Manager user interface,vCenter Server users can log in to all vCenter Serverinstances. Enabled by default.
Customer Experience ImprovementProgram
enabled Determines whether to participate in the Customer ExperienceImprovement Program by having vRealize Operations Managersend anonymous usage data to https://vmware.com.
Automated Actions enabled ordisabled
Determines whether to allow vRealize Operations Manager toautomate actions. When an alert triggers, the alert providesrecommendations for remediation. You can automate an actionto remediate an alert when the recommendation is the firstpriority for that alert. You enable actionable alerts in yourpolicies.
vRealize Operations Manager Customization and Administration Guide
128 VMware, Inc.
Maintaining and ExpandingvRealize Operations Manager 4
vRealize Operations Manager provides features to help you perform maintenance, troubleshoot potentialissues, and optimize your work with vRealize Operations Manager.
The product includes cluster and node management options that let you work with the processing systemsat the heart of vRealize Operations Manager. When you need to troubleshoot the system, various logs collectdetails related to how well vRealize Operations Manager is working and are available for bundling ifTechnical Support needs to review them. You also have the ability to maintain passwords that controloperator access to the product, and authentication certificates that provide system-to-system security.
Some administration activities involve how vRealize Operations Manager monitors objects in theenvironment. For example, maintenance mode settings prevent misleading data from appearing whenobjects are offline or undergoing maintenance. Licensing activates vRealize Operations Manager monitoringand solutions, and license groups organize objects for data collection under a particular license key. Therealso are on-demand options to refresh installed adapter lists and gather information about adapter abilities,and to recalculate dynamic thresholds so that vRealize Operations Manager captures the most recent datafor a particular metric.
When you are performing maintenance operations, it is good practice to stop theEndpoint Operations Management agent and to restart it after the maintenance is complete to avoidunnecessary system overhead.
This chapter includes the following topics:
n “vRealize Operations Manager Cluster and Node Maintenance,” on page 129
n “vRealize Operations Manager Logging,” on page 131
n “vRealize Operations Manager Passwords and Certificates,” on page 131
n “How To Preserve Customized Content,” on page 133
n “Backup and Restore,” on page 134
vRealize Operations Manager Cluster and Node MaintenanceYou perform cluster and node maintenance procedures to help your vRealize Operations Manager performmore efficiently. cluster and node maintenance involves activities such as changing the online or offline stateof the cluster or individual nodes, enabling or disabling high availability (HA), reviewing statistics related tothe installed adapters, and rebalancing the workload for better performance.
You perform most vRealize Operations Manager cluster and node maintenance using the ClusterManagement page in the product interface, or the Cluster Status and Troubleshooting page in theadministration interface. The administration interface provides more options than the product interface.
VMware, Inc. 129
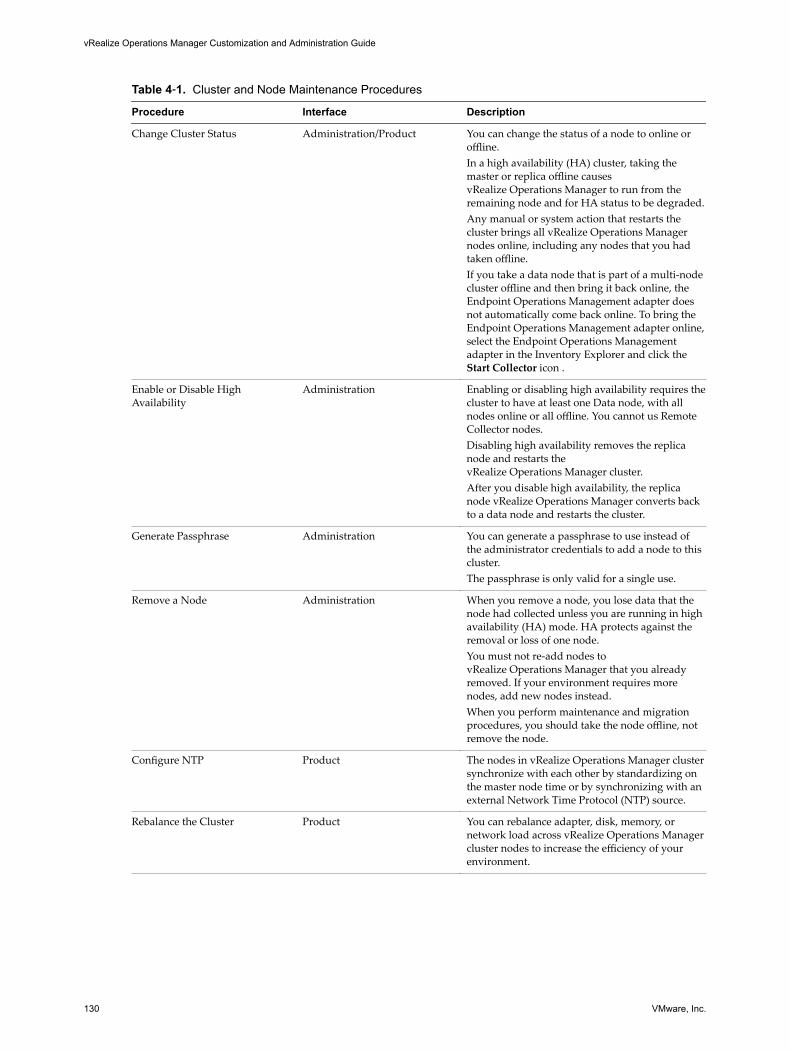
Table 4‑1. Cluster and Node Maintenance Procedures
Procedure Interface Description
Change Cluster Status Administration/Product You can change the status of a node to online oroffline.In a high availability (HA) cluster, taking themaster or replica offline causesvRealize Operations Manager to run from theremaining node and for HA status to be degraded.Any manual or system action that restarts thecluster brings all vRealize Operations Managernodes online, including any nodes that you hadtaken offline.If you take a data node that is part of a multi-nodecluster offline and then bring it back online, theEndpoint Operations Management adapter doesnot automatically come back online. To bring theEndpoint Operations Management adapter online,select the Endpoint Operations Managementadapter in the Inventory Explorer and click theStart Collector icon .
Enable or Disable HighAvailability
Administration Enabling or disabling high availability requires thecluster to have at least one Data node, with allnodes online or all offline. You cannot us RemoteCollector nodes.Disabling high availability removes the replicanode and restarts thevRealize Operations Manager cluster.After you disable high availability, the replicanode vRealize Operations Manager converts backto a data node and restarts the cluster.
Generate Passphrase Administration You can generate a passphrase to use instead ofthe administrator credentials to add a node to thiscluster.The passphrase is only valid for a single use.
Remove a Node Administration When you remove a node, you lose data that thenode had collected unless you are running in highavailability (HA) mode. HA protects against theremoval or loss of one node.You must not re-add nodes tovRealize Operations Manager that you alreadyremoved. If your environment requires morenodes, add new nodes instead.When you perform maintenance and migrationprocedures, you should take the node offline, notremove the node.
Configure NTP Product The nodes in vRealize Operations Manager clustersynchronize with each other by standardizing onthe master node time or by synchronizing with anexternal Network Time Protocol (NTP) source.
Rebalance the Cluster Product You can rebalance adapter, disk, memory, ornetwork load across vRealize Operations Managercluster nodes to increase the efficiency of yourenvironment.
vRealize Operations Manager Customization and Administration Guide
130 VMware, Inc.
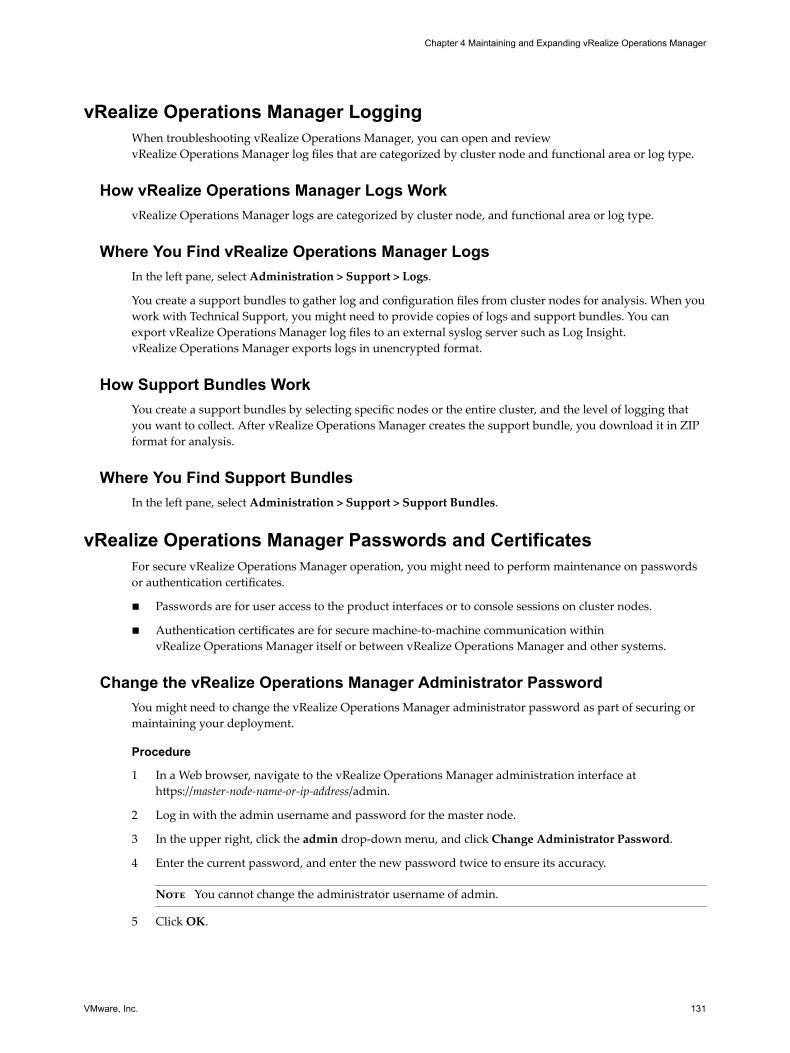
vRealize Operations Manager LoggingWhen troubleshooting vRealize Operations Manager, you can open and reviewvRealize Operations Manager log files that are categorized by cluster node and functional area or log type.
How vRealize Operations Manager Logs WorkvRealize Operations Manager logs are categorized by cluster node, and functional area or log type.
Where You Find vRealize Operations Manager LogsIn the left pane, select Administration > Support > Logs.
You create a support bundles to gather log and configuration files from cluster nodes for analysis. When youwork with Technical Support, you might need to provide copies of logs and support bundles. You canexport vRealize Operations Manager log files to an external syslog server such as Log Insight.vRealize Operations Manager exports logs in unencrypted format.
How Support Bundles WorkYou create a support bundles by selecting specific nodes or the entire cluster, and the level of logging thatyou want to collect. After vRealize Operations Manager creates the support bundle, you download it in ZIPformat for analysis.
Where You Find Support BundlesIn the left pane, select Administration > Support > Support Bundles.
vRealize Operations Manager Passwords and CertificatesFor secure vRealize Operations Manager operation, you might need to perform maintenance on passwordsor authentication certificates.
n Passwords are for user access to the product interfaces or to console sessions on cluster nodes.
n Authentication certificates are for secure machine-to-machine communication withinvRealize Operations Manager itself or between vRealize Operations Manager and other systems.
Change the vRealize Operations Manager Administrator PasswordYou might need to change the vRealize Operations Manager administrator password as part of securing ormaintaining your deployment.
Procedure
1 In a Web browser, navigate to the vRealize Operations Manager administration interface athttps://master-node-name-or-ip-address/admin.
2 Log in with the admin username and password for the master node.
3 In the upper right, click the admin drop-down menu, and click Change Administrator Password.
4 Enter the current password, and enter the new password twice to ensure its accuracy.
Note You cannot change the administrator username of admin.
5 Click OK.
Chapter 4 Maintaining and Expanding vRealize Operations Manager
VMware, Inc. 131
Reset the vRealize Operations Manager Administrator Password on vApp orLinux Clusters
If the admin account password is lost, you need to reset the password.
When the vRealize Operations Manager password for the built-in admin account is lost, follow these stepsto reset it on vApp or Linux clusters.
Prerequisites
This procedure requires root account credentials.
n In vRealize Operations Manager vApp deployments, when you log in to the console of the virtualapplication for the first time, you are forced to set a root password.
n The vRealize Operations Manager console root password can be different than the admin accountpassword that you set when configuring the vRealize Operations Manager master node.
Procedure
1 Log in to the master node command line console as root.
2 Enter the following command, and follow the prompts.
$VMWARE_PYTHON_BIN $VCOPS_BASE/../vmware-
vcopssuite/utilities/sliceConfiguration/bin/vcopsSetAdminPassword.py --reset
Reset the vRealize Operations Manager Administrator Password on WindowsClusters
If the admin account password is lost, you need to reset the password.
When the vRealize Operations Manager password for the built-in admin account is lost, follow these stepsto reset it on Windows clusters.
Procedure
1 Open the command prompt using the Run as Administrator option.
2 Enter the following command, and follow the prompts.
%VMWARE_PYTHON_BIN% %VCOPS_BASE%\..\vmware-
vcopssuite\utilities\sliceConfiguration\bin\vcopsSetAdminPassword.py --reset
Generate a vRealize Operations Manager PassphraseWhen users need to add a node to the vRealize Operations Manager cluster, you can generate a temporarypassphrase instead of giving them the master administrator login credentials, which might be a securityissue.
A temporary passphrase is good for one use only.
Prerequisites
Create and configure the master node.
Procedure
1 In a Web browser, navigate to the vRealize Operations Manager administration interface athttps://master-node-name-or-ip-address/admin.
2 Log in with the admin username and password for the master node.
vRealize Operations Manager Customization and Administration Guide
132 VMware, Inc.
3 In the list of cluster nodes, select the master node.
4 From the toolbar above the list, click the option to generate a passphrase.
5 Enter a number of hours before the passphrase expires.
6 Click Generate.
A random alphanumeric string appears, which you can send to a user who needs to add a node.
What to do next
Have the user supply the passphrase when adding a node.
How To Preserve Customized ContentWhen you upgrade vRealize Operations Manager, it is important that you upgrade the current versions ofcontent types that allow you to alert on and monitor the objects in your environment. With upgraded alertdefinitions, symptom definitions, and recommendations, you can alert on the various states of objects inyour environment and identify a wider range of problem types. With upgraded views, you can createdashboards and reports to easily identify and report on problems in your environment.
You might need to perform certain steps before you upgrade the alert definitions, symptom definitions,recommendations, and views in your vRealize Operations Manager environment.
n If you customized any of the alert definitions, symptom definitions, recommendations, or views thatwere provided with previous versions of vRealize Operations Manager, and you want to retain thosecustomized versions, perform the steps in this procedure.
n If you did not customize any of the alert definitions, symptom definitions, recommendations, or viewsthat were provided with previous versions of vRealize Operations Manager, you do not need to backthem up first. Instead, you can start the upgrade, and during the upgrade select the check box namedReset out-of-the-box content.
Prerequisites
You previously customized versions of your alert definitions, symptom definitions, recommendations, orviews.
Procedure
1 Before you begin the upgrade to vRealize Operations Manager, back up the changes to your alertdefinitions, symptom definitions, recommendations, and views by cloning them.
2 Start the upgrade of vRealize Operations Manager.
3 During the upgrade, select the check box named Reset out-of-the-box content.
After the upgrade completes, you have preserved your customized versions of alert definitions, symptomdefinitions, recommendations, and views, and you have the current versions that were installed during theupgrade.
What to do next
Review the changes in the upgraded alert definitions, symptom definitions, recommendations, and views.Then, determine whether to keep your previously modified versions, or to use the upgraded versions.
Chapter 4 Maintaining and Expanding vRealize Operations Manager
VMware, Inc. 133
Backup and RestoreBackup and restore your vRealize Operations Manager system on a regular basis to avoid downtime anddata loss in case of a system failure. If your system does fail, you can restore the system to the last full orincremental backup.
You can backup and restore vRealize Operations Manager single or multi-node clusters by usingvSphere Data Protection or other backup tools. You can perform full, differential, and incremental backupsand restores of virtual machines.
Note All nodes are backed up and restored at the same time. You cannot back up and restore individualnodes.
Backing Up vRealize Operations Manager SystemsBe aware of these prerequisites when you back up vRealize Operations Manager systems by usingvSphere Data Protection.
n “Disable Quiescing,” on page 135.
n Verify that all nodes are powered on and are accessible while the backup is taking place.
Be aware of these guidelines when you back up vRealize Operations Manager systems by using any tool.
n Use a resolvable host name and a static IP address for all nodes.
n Back up the entire virtual machine. You must back up all VMDK files that are part of the virtualappliance.
n Do not stop the cluster while performing the backup.
n Do not perform backup while dynamic threshold (DT) calculations are running because this might leadto performance issues or loss of nodes.
You are not required to delete any snapshots, however, be aware that tools such as vSphere Data Protectiondelete all existing snapshots at the time of backup.
Restoring vRealize Operations Manager SystemsBe aware of these prerequisites when restoring vRealize Operations Manager systems by using any tool.
n Power off the virtual machines in the multi-node cluster that you want to restore.
n Before restoring to a different host, power off virtual machines at the original location, and then bringup the environment on the new host to avoid hostname or IP conflict. Verify that the datastore on thenew host has sufficient capacity for the new cluster.
n Verify that all VMDK files have been assigned to the same datastore.
When you restore vRealize Operations Manager systems by using any tool, be aware that you need to resetthe root password after the restore completes.
Backing Up and Restoring with vSphere Data ProtectionUse vSphere Data Protection to associate the back up of a vRealize Operations Manager multi-node clusterwith a backup schedule and retention policies. After backup, use vSphere Data Protection to restore avRealize Operations Manager multi-node cluster to its original location.
vRealize Operations Manager Customization and Administration Guide
134 VMware, Inc.
Disable QuiescingBefore you backup your vRealize Operations Manager multi-node cluster by using vSphere Data Protection,disable quiescing of the file system.
Procedure
1 Log in to the ESXi host with an SSH session, and power off all nodes.
2 Navigate to the /vmfs/volumes/virtual_machine_datastore/ virtual_machine/ directory, and open thevirtual_machine.vmx file for editing.
3 Set the disk.EnableUUID parameter to false.
You may have to add the disk.EnableUUID parameter to the virtual_machine.vmx file.
4 Save and close the file.
5 Power on all nodes.
6 Open a console session to the virtual machine, and log in to each node.
7 Navigate to the /etc/vmware-tools directory, and open the tools.conf file for editing.
If you cannot locate the tools.conf file, run the vi tools.conf command to create a file.
8 Add these parameters to the file.
[vmbackup]
enableSyncDriver = false
This runs a synchronization operation before the snapshot, and does not run a freeze on the file system.
9 Save and close the file.
What to do next
Backup your vRealize Operations Manager multi-node cluster by using vSphere Data Protection.
Back Up vRealize Operations Manager By Using vSphere Data ProtectionYou can use vSphere Data Protection to associate the backup of a vRealize Operations Manager multi-nodecluster with a backup schedule and retention policies.
Be aware of these guidelines when you back up vRealize Operations Manager systems.
n Use a resolvable host name and a static IP address for all nodes.
n Back up the entire virtual machine. You must back up all VMDK files that are part of the virtualappliance.
n Do not stop the cluster while performing the backup.
n Do not perform backup while dynamic threshold (DT) calculations are running because this might leadto performance issues or loss of nodes.
You are not required to delete any snapshots, however, be aware that vSphere Data Protection deletes allexisting snapshots at the time of backup.
Prerequisites
n “Disable Quiescing,” on page 135.
n Verify that all nodes are powered on and are accessible while the backup is taking place.
n Deploy and configure the vSphere Data Protection appliance. See the vSphere Data ProtectionAdministration Guide.
Chapter 4 Maintaining and Expanding vRealize Operations Manager
VMware, Inc. 135
n Verify that the vSphere Data Protection appliance is installed on the vCenter Server instance where thevRealize Operations Manager cluster is deployed.
n Verify that you have sufficient disk space available for your vSphere Data Protection instance. Thisdepends on the size of the multi-node cluster that you want to back up.
n Use the vSphere Web Client to log in as an administrator to the vCenter Server instance that managesyour environment.
n In the vSphere Web Client verify that the virtual machines have the latest version of VMware Toolsinstalled.
Procedure
1 In the left pane of the vSphere Web Client, select vSphere Data Protection.
2 Select the preconfigured vSphere Data Protection appliance and click Connect.
3 On the Getting Started tab, select Create Backup Job.
4 Leave the Guest Images option selected, and click Next.
5 Leave the Full Images option selected, and click Next.
6 In the inventory tree select all the nodes of the cluster that you want to back up, and click Next.
7 Set a schedule for the backup job, and click Next.
8 Specify a retention policy for the backup job, and click Next.
9 Enter a name for the backup job, and click Next.
10 Review the summary information for the backup job and click Finish.
The newly created backup job is listed on the Backup tab. The backup runs automatically according tothe schedule you configured.
11 (Optional) To run the backup job manually at a later time.
a On the Backup tab, select the backup job.
b Click Backup Now, and select Backup all sources.
12 (Optional) On the Reports tab, select Job Details to verify that the backup job was completed.
What to do next
Restore a backed up system.
Restore vRealize Operations Manager By Using vSphere Data ProtectionYou can restore a backed up vRealize Operations Manager multi-node cluster to its original location byusing vSphere Data Protection.
Prerequisites
n Power off the virtual machines in the multi-node cluster that you want to restore.
n Before restoring to a different host, power off virtual machines at the original location, and then bringup the environment on the new host to avoid hostname or IP conflict. Verify that the datastore on thenew host has sufficient capacity for the new cluster.
n Verify that all VMDK files have been assigned to the same datastore.
n Deploy and configure the vSphere Data Protection appliance. See the vSphere Data ProtectionAdministration Guide.
n Back up the vRealize Operations Manager multi-node cluster.
vRealize Operations Manager Customization and Administration Guide
136 VMware, Inc.
n Use the vSphere Web Client to log in as an administrator to the vCenter Server instance that managesyour environment.
n In the vSphere Web Client verify that the virtual machines have the latest VMware Tools installed.
Procedure
1 In the left pane of the vSphere Web Client, select vSphere Data Protection.
2 Select the preconfigured vSphere Data Protection appliance, and click Connect.
3 Click the Restore tab.
4 Select the first virtual machine listed that is part of the cluster.
All performed backups for this virtual machine are displayed.
5 Select the backup from which you want to restore components.
6 Double-click the backup job, and select the components that you want to restore.
7 Click Restore to start the Restore backup wizard.
8 On the Select Backup page, verify that the backup is correct and click Next.
9 On the Set Restore Options page, leave the Restore to original location check box selected, and clickNext.
If you deselect the Restore to original location check box, you can select a different destination for therestore. You might have to specify options such as the host name, network, datastore, and folder.
10 On the Ready to complete page, review the summary information for the restore request, and clickFinish.
11 Repeat steps 4 to 10 for the same backed up copies of all other virtual machines that are part of thecluster.
12 Reset the root password.
13 To verify that the restore operation is successful, power on the virtual machines in the cluster and checkthat all vRealize Operations Manager services are running.
What to do next
If you restored your system to a remote location, change the IP address to point the cluster to the new host.
Checking the Restore of vRealize Operations Manager SystemsAfter you have restored a vRealize Operations Manager system, verify that the system nodes are up andrunning.
Procedure
1 Power on the master node for a simple cluster, and the master node and replica node for HA clusters.
2 Use SSH to log into the vRealize Operations Manager master node to check thevRealize Operations Manager service status, and run service vmware-vcops status.
# service vmware-vcops status
Slice Online-true
admin Role Enabled-true
vRealize Operations vPostgres Replication Database is running (31810).
vRealize Operations Gemfire Locator is running (31893).
data Role Enabled-true
vRealize Operations vPostgres Database is running (32013).
vRealize Operations Cassandra Distributed Database is running (21062).
Chapter 4 Maintaining and Expanding vRealize Operations Manager
VMware, Inc. 137
vRealize Operations Analytics is running (32142).
vRealize Operations Collector is running (32225).
vRealize Operations API is running (32331).
ui Role Enabled-true
remote collector Role Enabled-false
3 Confirm that the admin, data, and ui roles are running.
4 Verify that all the nodes in the cluster are up and collecting data. If you have an HA-enabled cluster,verify that HA mode is enabled.
a In a Web browser, navigate to the vRealize Operations Manager administration interface athttps://<Master_Node_IP>/admin/login.action.
b Log in with the admin username and password.
c Verify that each node is online.
d Click each node, and verify that the status of adapter instances is Data receiving.
e Verify that HA mode is enabled. If the cluster is running in degraded mode, restart the cluster.
Change the IP Address of Nodes After Restoring a Cluster on a Remote HostAfter you have restored a vRealize Operations Manager cluster to a remote host, change the IP address ofthe master nodes and data nodes to point to the new host.
Prerequisites
n Verify that the restore job has completed successfully.
n Verify that the datastore on the new host has sufficient capacity for the new cluster.
Procedure
1 Shut down the vRealize Operations Manager cluster at the original location.
2 In the Virtual Appliance Management Interface (VAMI), access the machine from the vCenter consoleand run the /opt/vmware/share/vami/vami_set_network eth0 STATICV4 new IP netmask gateway tochange the IP address for each node in the cluster.
For example:
/opt/vmware/share/vami/vami_set_network
eth0 STATICV4 10.145.152.170 255.255.252.0 10.145.155.253
3 After the command runs successfully, restart the network, reboot each node, and power on the remotecollector node.
4 Use SSH to access the master, data, and remote collector nodes, and run the$VMWARE_PYTHON_BIN /usr/lib/vmware-
vcopssuite/utilities/sliceConfiguration/bin/vcopsConfigureRoles.py --action=bringSliceOffline
--offlineReason=restore cluster command to take the cluster offline.
5 Update the CaSA database with the new IP address first on the master nodes, and then on the datanodes.
a Run the vmware-casa stop command to stop the CaSA service.
b Open the /storage/db/casa/webapp/hsqldb/casa.db.script file for editing, and replace allinstances of the old IP address and with the new IP address.
c Run the vmware-casa start command to start the CaSA service.
vRealize Operations Manager Customization and Administration Guide
138 VMware, Inc.
6 In the following configuration files, use a text editor to replace all instances of the old IP address withthe new IP address.
n /usr/lib/vmware-vcopssuite/utilities/sliceConfiguration/data/roleState.properties.
n /usr/lib/vmware-vcops/user/conf/gemfire.properties.
n /usr/lib/vmware-vcops/user/conf/gemfire.locator.properties. This configuration file only runson the master node. Edit the locater parameter.
n /usr/lib/vmware-vcops/user/conf/gemfire.native.properties.
n /usr/lib/vmware-vcops/user/conf/persistence/persistence.properties.
7 Navigate to the /usr/lib/vmware-vcops/user/conf/cassandra/ directory, and edit the cassandra.yamlfile so that the seeds parameter points to the new IP address of the master node, and thelisten_address and broadcast_rpc_address point to the IP addresses of the data nodes.
8 Log in to the vRealize Operations Manager administration interface, and bring the cluster online.
Manual Backup Procedure Appears to StallWhen you run a backup job manually by using vSphere Data Protection, the progress of the job might reach92% and stall. It appears as though the job has stopped running.
Problem
The task details in the Running tab of the Recent Tasks pane might show that the job has stopped runningwhen it reaches 92%. Often, the job might still be running in the background. The status of the backup jobcan be verified in the vSphere Data Protection Appliance.
Solution
1 Use SSH to log in to vSphere Data Protection appliance.
2 Run mccli activity show to view a list of backup jobs and their status.
3 In the Client column, search for the ID of the backup job, and the corresponding virtual machines.
4 In the Status column, verify that the job is still running.
Chapter 4 Maintaining and Expanding vRealize Operations Manager
VMware, Inc. 139

vRealize Operations Manager Customization and Administration Guide
140 VMware, Inc.
OPS-CLI Command-Line Tool 5The OPS-CLI tool is a Java application that you can use to manipulate the vRealize Operations Managerdatabase. It replaces the VCOPS-CLI andDBCLI tools.
The product includes the executable file in the tools directory or in <VCOPS_BASE>/tools/opscli/.
Operating System File Name
Linux ops-cli.sh
Windows ops-cli.bat
Python ops-cli.py
All OPS-CLI commands use the -h parameter for interactive and localized help.
When you add the control command to the post_install.sh script, it triggers the redescribe process afteran adapter is installed or upgraded.
control -h | redescribe --force
Supported OperationsThe OPS-CLI tool supports the following database operations.
n dashboard Command Operations on page 142You use the dashboard command to import, export, share, unshare, delete, reorder, show, hide, and setthe default summary for dashboards.
n template Command Operations on page 142You use the template command to import, export, share, unshare, delete, and reorder templates.
n supermetric Command Operations on page 143You use the supermetric command to import, export, configure, and delete super metrics.
n attribute Command Operations on page 144You use the attribute command to configure properties of a specific metric in one or more packages.The metric is the object attribute.
n reskind Command Operations for Object Types on page 144You use the reskind command to configure the default settings in your object type as defined by theResourceKind model element. The command sets the default attribute or supermetric package, enablesor disables dynamic thresholds, and enables or disables early warning smart alerts.
n report Command Operations on page 144You use the report command to import, export, configure, and delete super metrics.
VMware, Inc. 141
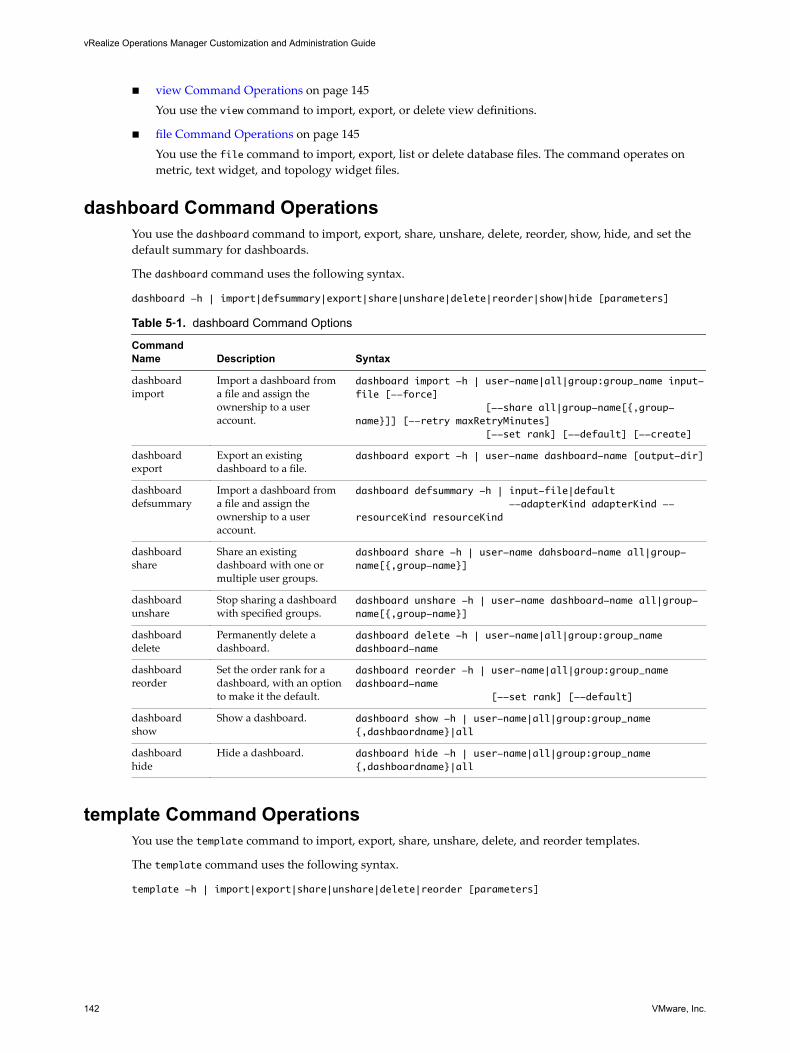
n view Command Operations on page 145You use the view command to import, export, or delete view definitions.
n file Command Operations on page 145You use the file command to import, export, list or delete database files. The command operates onmetric, text widget, and topology widget files.
dashboard Command OperationsYou use the dashboard command to import, export, share, unshare, delete, reorder, show, hide, and set thedefault summary for dashboards.
The dashboard command uses the following syntax.
dashboard -h | import|defsummary|export|share|unshare|delete|reorder|show|hide [parameters]
Table 5‑1. dashboard Command Options
CommandName Description Syntax
dashboardimport
Import a dashboard froma file and assign theownership to a useraccount.
dashboard import -h | user-name|all|group:group_name input-file [--force] [--share all|group-name[{,group-name}]] [--retry maxRetryMinutes] [--set rank] [--default] [--create]
dashboardexport
Export an existingdashboard to a file.
dashboard export -h | user-name dashboard-name [output-dir]
dashboarddefsummary
Import a dashboard froma file and assign theownership to a useraccount.
dashboard defsummary -h | input-file|default --adapterKind adapterKind --resourceKind resourceKind
dashboardshare
Share an existingdashboard with one ormultiple user groups.
dashboard share -h | user-name dahsboard-name all|group-name[{,group-name}]
dashboardunshare
Stop sharing a dashboardwith specified groups.
dashboard unshare -h | user-name dashboard-name all|group-name[{,group-name}]
dashboarddelete
Permanently delete adashboard.
dashboard delete -h | user-name|all|group:group_name dashboard-name
dashboardreorder
Set the order rank for adashboard, with an optionto make it the default.
dashboard reorder -h | user-name|all|group:group_name dashboard-name [--set rank] [--default]
dashboardshow
Show a dashboard. dashboard show -h | user-name|all|group:group_name {,dashbaordname}|all
dashboardhide
Hide a dashboard. dashboard hide -h | user-name|all|group:group_name {,dashboardname}|all
template Command OperationsYou use the template command to import, export, share, unshare, delete, and reorder templates.
The template command uses the following syntax.
template -h | import|export|share|unshare|delete|reorder [parameters]
vRealize Operations Manager Customization and Administration Guide
142 VMware, Inc.
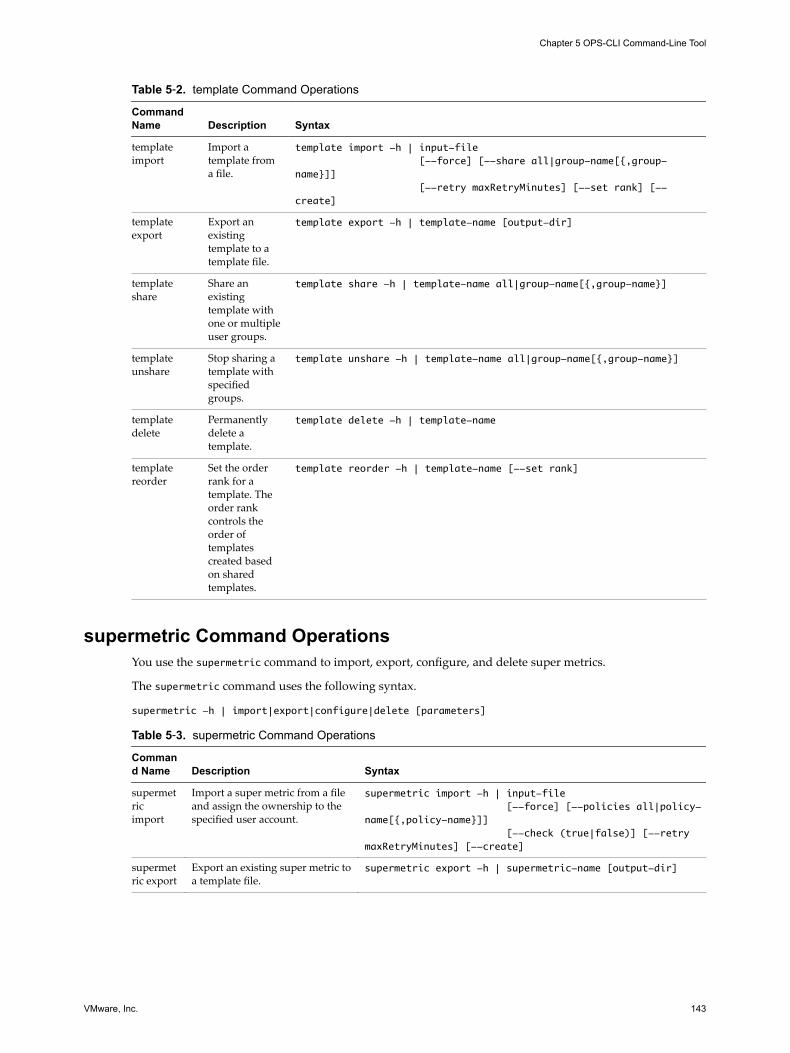
Table 5‑2. template Command Operations
CommandName Description Syntax
templateimport
Import atemplate froma file.
template import -h | input-file [--force] [--share all|group-name[{,group-name}]] [--retry maxRetryMinutes] [--set rank] [--create]
templateexport
Export anexistingtemplate to atemplate file.
template export -h | template-name [output-dir]
templateshare
Share anexistingtemplate withone or multipleuser groups.
template share -h | template-name all|group-name[{,group-name}]
templateunshare
Stop sharing atemplate withspecifiedgroups.
template unshare -h | template-name all|group-name[{,group-name}]
templatedelete
Permanentlydelete atemplate.
template delete -h | template-name
templatereorder
Set the orderrank for atemplate. Theorder rankcontrols theorder oftemplatescreated basedon sharedtemplates.
template reorder -h | template-name [--set rank]
supermetric Command OperationsYou use the supermetric command to import, export, configure, and delete super metrics.
The supermetric command uses the following syntax.
supermetric -h | import|export|configure|delete [parameters]
Table 5‑3. supermetric Command Operations
Command Name Description Syntax
supermetricimport
Import a super metric from a fileand assign the ownership to thespecified user account.
supermetric import -h | input-file [--force] [--policies all|policy-name[{,policy-name}]] [--check (true|false)] [--retry maxRetryMinutes] [--create]
supermetric export
Export an existing super metric toa template file.
supermetric export -h | supermetric-name [output-dir]
Chapter 5 OPS-CLI Command-Line Tool
VMware, Inc. 143
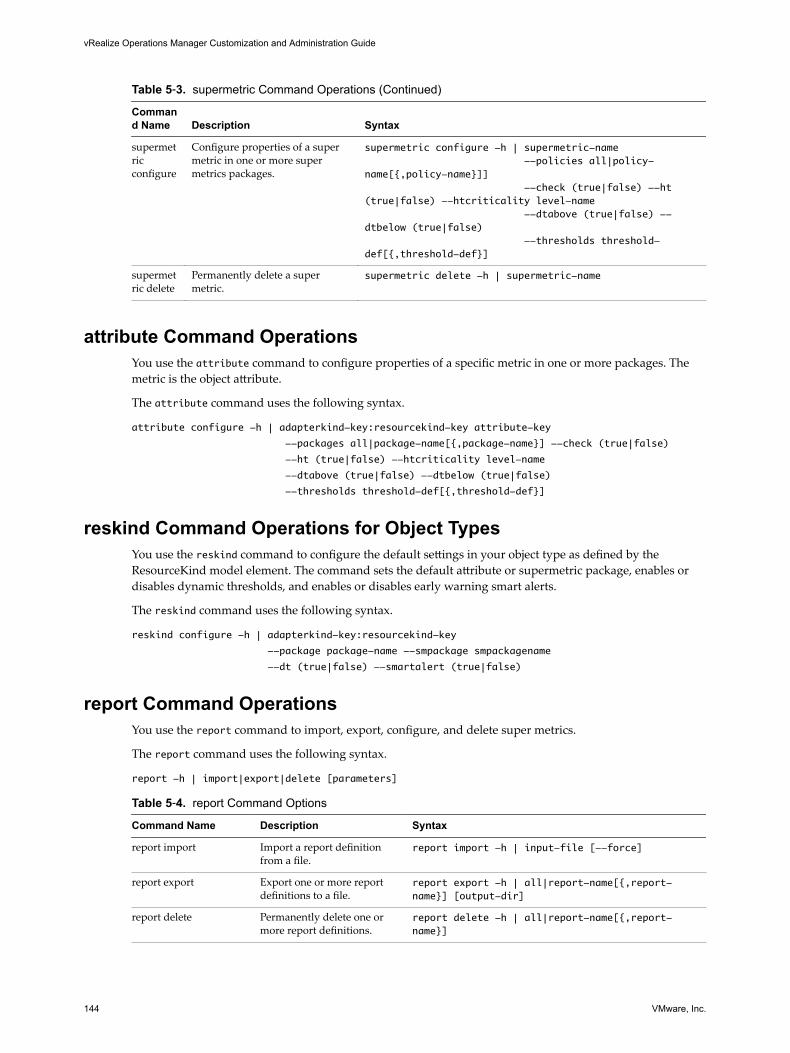
Table 5‑3. supermetric Command Operations (Continued)
Command Name Description Syntax
supermetricconfigure
Configure properties of a supermetric in one or more supermetrics packages.
supermetric configure -h | supermetric-name --policies all|policy-name[{,policy-name}]] --check (true|false) --ht (true|false) --htcriticality level-name --dtabove (true|false) --dtbelow (true|false) --thresholds threshold-def[{,threshold-def}]
supermetric delete
Permanently delete a supermetric.
supermetric delete -h | supermetric-name
attribute Command OperationsYou use the attribute command to configure properties of a specific metric in one or more packages. Themetric is the object attribute.
The attribute command uses the following syntax.
attribute configure -h | adapterkind-key:resourcekind-key attribute-key
--packages all|package-name[{,package-name}] --check (true|false)
--ht (true|false) --htcriticality level-name
--dtabove (true|false) --dtbelow (true|false)
--thresholds threshold-def[{,threshold-def}]
reskind Command Operations for Object TypesYou use the reskind command to configure the default settings in your object type as defined by theResourceKind model element. The command sets the default attribute or supermetric package, enables ordisables dynamic thresholds, and enables or disables early warning smart alerts.
The reskind command uses the following syntax.
reskind configure -h | adapterkind-key:resourcekind-key
--package package-name --smpackage smpackagename
--dt (true|false) --smartalert (true|false)
report Command OperationsYou use the report command to import, export, configure, and delete super metrics.
The report command uses the following syntax.
report -h | import|export|delete [parameters]
Table 5‑4. report Command Options
Command Name Description Syntax
report import Import a report definitionfrom a file.
report import -h | input-file [--force]
report export Export one or more reportdefinitions to a file.
report export -h | all|report-name[{,report-name}] [output-dir]
report delete Permanently delete one ormore report definitions.
report delete -h | all|report-name[{,report-name}]
vRealize Operations Manager Customization and Administration Guide
144 VMware, Inc.
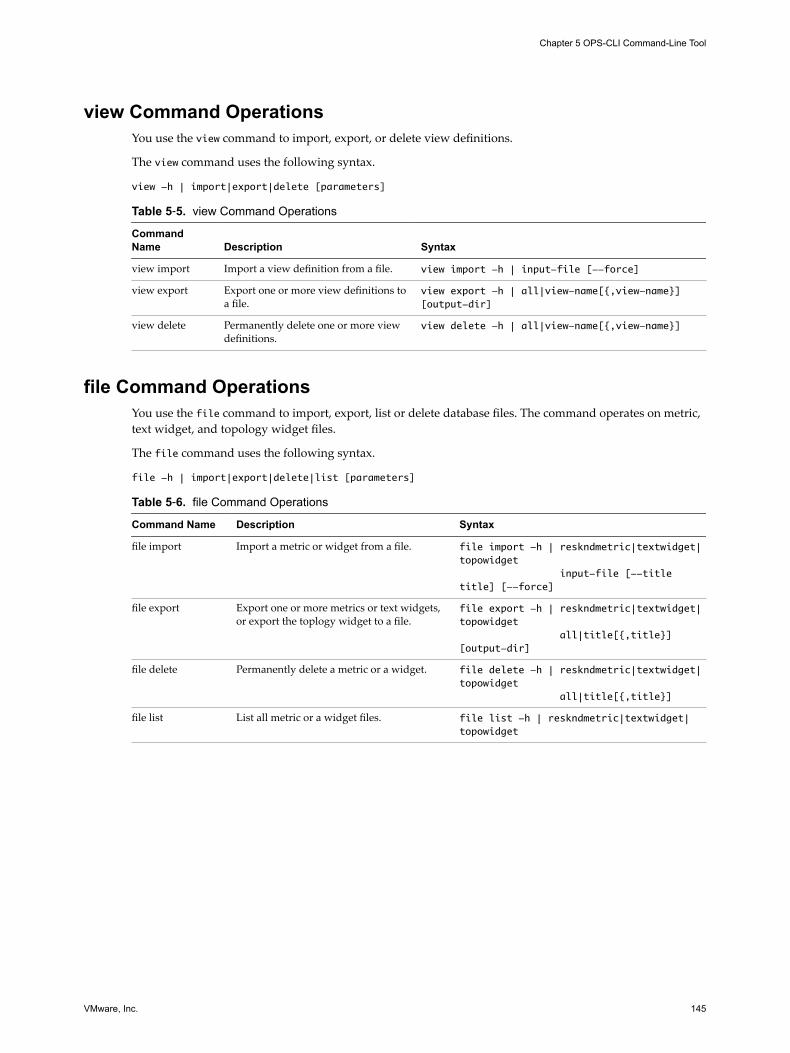
view Command OperationsYou use the view command to import, export, or delete view definitions.
The view command uses the following syntax.
view -h | import|export|delete [parameters]
Table 5‑5. view Command Operations
CommandName Description Syntax
view import Import a view definition from a file. view import -h | input-file [--force]
view export Export one or more view definitions toa file.
view export -h | all|view-name[{,view-name}] [output-dir]
view delete Permanently delete one or more viewdefinitions.
view delete -h | all|view-name[{,view-name}]
file Command OperationsYou use the file command to import, export, list or delete database files. The command operates on metric,text widget, and topology widget files.
The file command uses the following syntax.
file -h | import|export|delete|list [parameters]
Table 5‑6. file Command Operations
Command Name Description Syntax
file import Import a metric or widget from a file. file import -h | reskndmetric|textwidget|topowidget input-file [--title title] [--force]
file export Export one or more metrics or text widgets,or export the toplogy widget to a file.
file export -h | reskndmetric|textwidget|topowidget all|title[{,title}] [output-dir]
file delete Permanently delete a metric or a widget. file delete -h | reskndmetric|textwidget|topowidget all|title[{,title}]
file list List all metric or a widget files. file list -h | reskndmetric|textwidget|topowidget
Chapter 5 OPS-CLI Command-Line Tool
VMware, Inc. 145

vRealize Operations Manager Customization and Administration Guide
146 VMware, Inc.
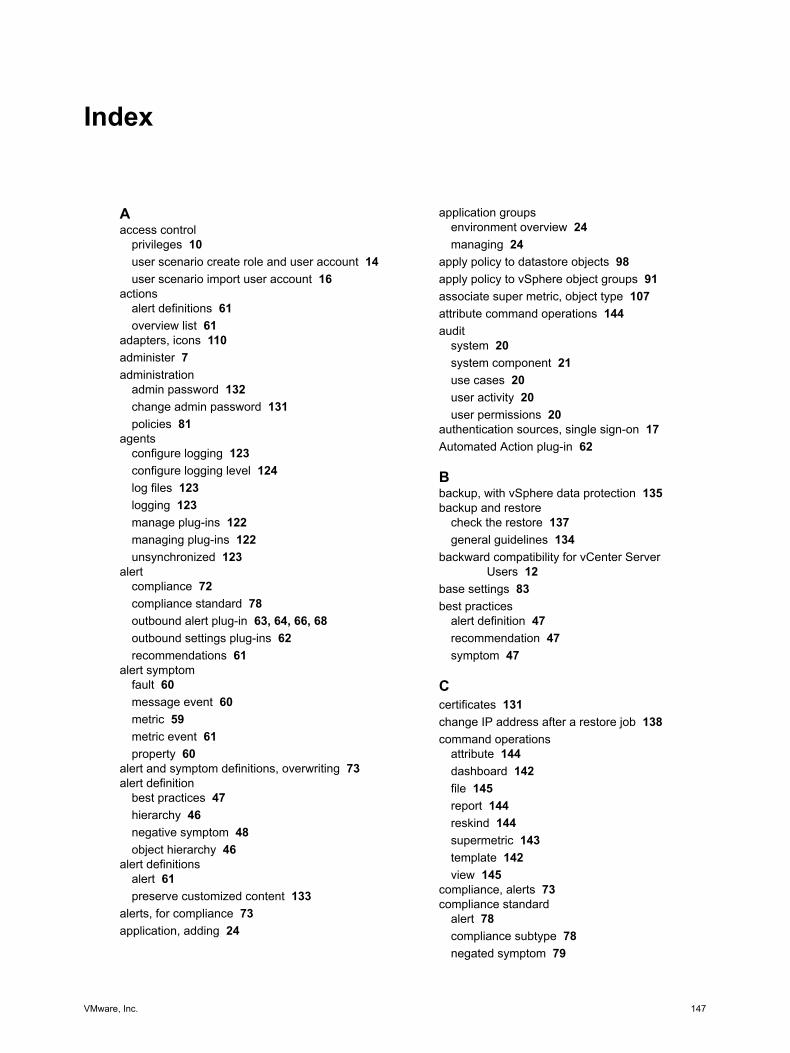
Index
Aaccess control
privileges 10user scenario create role and user account 14user scenario import user account 16
actionsalert definitions 61overview list 61
adapters, icons 110administer 7administration
admin password 132change admin password 131policies 81
agentsconfigure logging 123configure logging level 124log files 123logging 123manage plug-ins 122managing plug-ins 122unsynchronized 123
alertcompliance 72compliance standard 78outbound alert plug-in 63, 64, 66, 68outbound settings plug-ins 62recommendations 61
alert symptomfault 60message event 60metric 59metric event 61property 60
alert and symptom definitions, overwriting 73alert definition
best practices 47hierarchy 46negative symptom 48object hierarchy 46
alert definitionsalert 61preserve customized content 133
alerts, for compliance 73application, adding 24
application groupsenvironment overview 24managing 24
apply policy to datastore objects 98apply policy to vSphere object groups 91associate super metric, object type 107attribute command operations 144audit
system 20system component 21use cases 20user activity 20user permissions 20
authentication sources, single sign-on 17Automated Action plug-in 62
Bbackup, with vSphere data protection 135backup and restore
check the restore 137general guidelines 134
backward compatibility for vCenter ServerUsers 12
base settings 83best practices
alert definition 47recommendation 47symptom 47
Ccertificates 131change IP address after a restore job 138command operations
attribute 144dashboard 142file 145report 144reskind 144supermetric 143template 142view 145
compliance, alerts 73compliance standard
alert 78compliance subtype 78negated symptom 79
VMware, Inc. 147
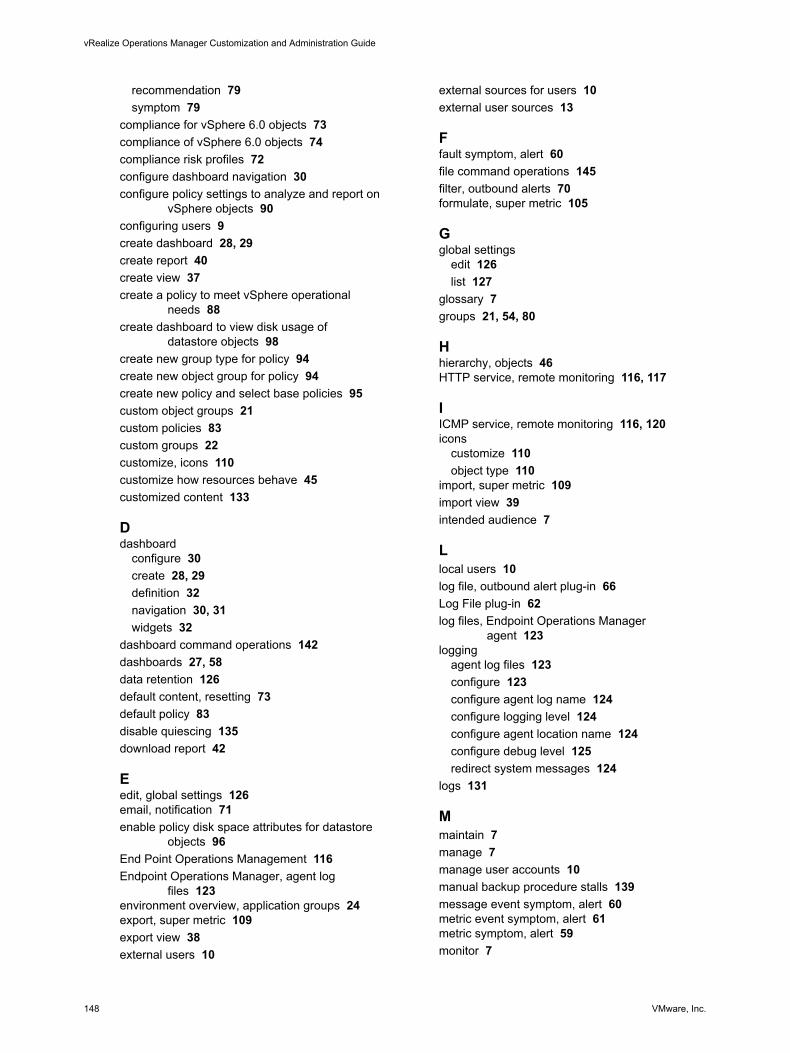
recommendation 79symptom 79
compliance for vSphere 6.0 objects 73compliance of vSphere 6.0 objects 74compliance risk profiles 72configure dashboard navigation 30configure policy settings to analyze and report on
vSphere objects 90configuring users 9create dashboard 28, 29create report 40create view 37create a policy to meet vSphere operational
needs 88create dashboard to view disk usage of
datastore objects 98create new group type for policy 94create new object group for policy 94create new policy and select base policies 95custom object groups 21custom policies 83custom groups 22customize, icons 110customize how resources behave 45customized content 133
Ddashboard
configure 30create 28, 29definition 32navigation 30, 31widgets 32
dashboard command operations 142dashboards 27, 58data retention 126default content, resetting 73default policy 83disable quiescing 135download report 42
Eedit, global settings 126email, notification 71enable policy disk space attributes for datastore
objects 96End Point Operations Management 116Endpoint Operations Manager, agent log
files 123environment overview, application groups 24export, super metric 109export view 38external users 10
external sources for users 10external user sources 13
Ffault symptom, alert 60file command operations 145filter, outbound alerts 70formulate, super metric 105
Gglobal settings
edit 126list 127
glossary 7groups 21, 54, 80
Hhierarchy, objects 46HTTP service, remote monitoring 116, 117
IICMP service, remote monitoring 116, 120icons
customize 110object type 110
import, super metric 109import view 39intended audience 7
Llocal users 10log file, outbound alert plug-in 66Log File plug-in 62log files, Endpoint Operations Manager
agent 123logging
agent log files 123configure 123configure agent log name 124configure logging level 124configure agent location name 124configure debug level 125redirect system messages 124
logs 131
Mmaintain 7manage 7manage user accounts 10manual backup procedure stalls 139message event symptom, alert 60metric event symptom, alert 61metric symptom, alert 59monitor 7
vRealize Operations Manager Customization and Administration Guide
148 VMware, Inc.
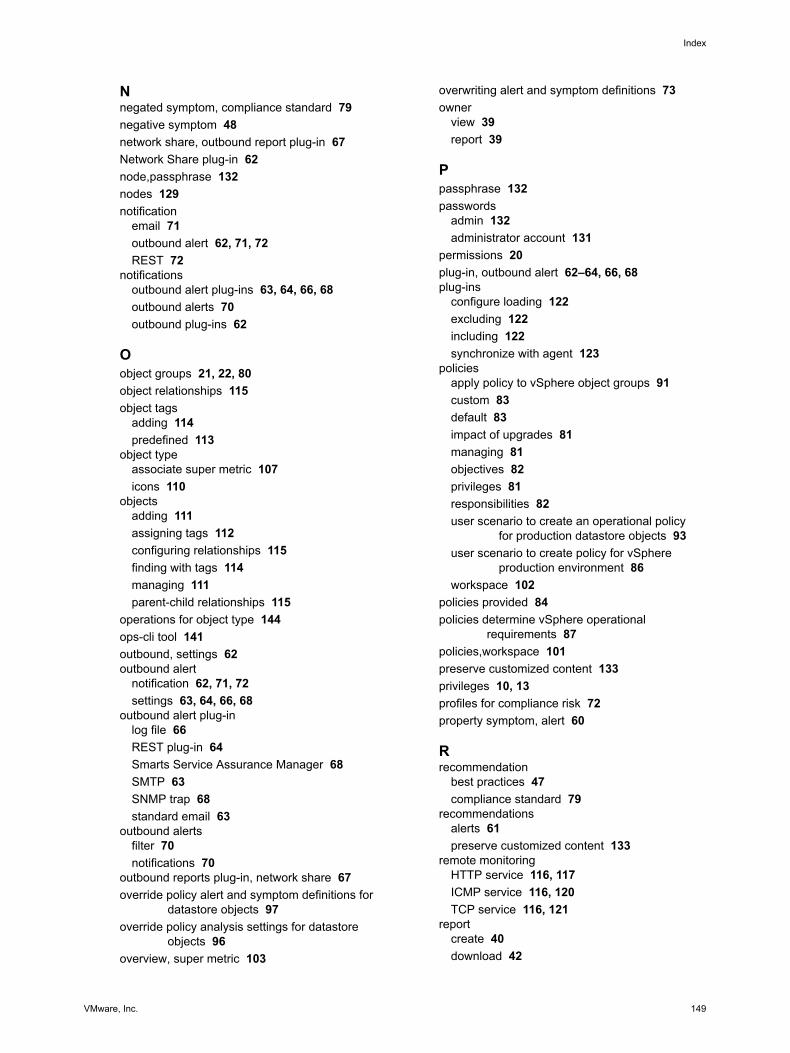
Nnegated symptom, compliance standard 79negative symptom 48network share, outbound report plug-in 67Network Share plug-in 62node,passphrase 132nodes 129notification
email 71outbound alert 62, 71, 72REST 72
notificationsoutbound alert plug-ins 63, 64, 66, 68outbound alerts 70outbound plug-ins 62
Oobject groups 21, 22, 80object relationships 115object tags
adding 114predefined 113
object typeassociate super metric 107icons 110
objectsadding 111assigning tags 112configuring relationships 115finding with tags 114managing 111parent-child relationships 115
operations for object type 144ops-cli tool 141outbound, settings 62outbound alert
notification 62, 71, 72settings 63, 64, 66, 68
outbound alert plug-inlog file 66REST plug-in 64Smarts Service Assurance Manager 68SMTP 63SNMP trap 68standard email 63
outbound alertsfilter 70notifications 70
outbound reports plug-in, network share 67override policy alert and symptom definitions for
datastore objects 97override policy analysis settings for datastore
objects 96overview, super metric 103
overwriting alert and symptom definitions 73owner
view 39report 39
Ppassphrase 132passwords
admin 132administrator account 131
permissions 20plug-in, outbound alert 62–64, 66, 68plug-ins
configure loading 122excluding 122including 122synchronize with agent 123
policiesapply policy to vSphere object groups 91custom 83default 83impact of upgrades 81managing 81objectives 82privileges 81responsibilities 82user scenario to create an operational policy
for production datastore objects 93user scenario to create policy for vSphere
production environment 86workspace 102
policies provided 84policies determine vSphere operational
requirements 87policies,workspace 101preserve customized content 133privileges 10, 13profiles for compliance risk 72property symptom, alert 60
Rrecommendation
best practices 47compliance standard 79
recommendationsalerts 61preserve customized content 133
remote monitoringHTTP service 116, 117ICMP service 116, 120TCP service 116, 121
reportcreate 40download 42
Index
VMware, Inc. 149
generate 42introduction 40owner 39schedule 42
templatedelete 42edit 42
report command operations 144reports 27reset default content 73Reset out-of-the-box content 133reskind 144reskind command operations 144resource interaction mode, widget 35resource behavior customize 45ResourceKind 144REST
notification 72outbound alert plug-in 64
REST Notification plug-in 62restore, with vSphere data protection 136restore a system to a remote location 138retention, data 126review super metric, troubleshooting 108risk profiles for compliance 72roles 10, 13run view 38
Sscenarios
create policy for vSphere productionenvironment 86
adding an application 24create an operational policy for production
datastore objects 93object groups 22user access control create role and user
account 14user access control import user account 16
schedule report 42search for application 24security,passphrase 132settings, global 126single sign-on 17single sign-on source, edit a source 19Smarts SAM Notification plug-in 62Smarts Service Assurance Manager, outbound
alert plug-in 68SMTP, outbound alert plug-in 63SNMP trap, outbound alert plug-in 68SNMP Trap plug-in 62sources for external users 13standard email, outbound alert plug-in 63
Standard Email plug-in 62super metric
export 109formulate 105import 109overview 103visualize 106
super metric functions 103super metrics
adding 106formulas 108preparing to create 105
supermetric command operations 143symptom
best practices 47compliance standard 79fault 60message event 60metric 59metric event 61negated 48property 60
symptom definitions, preserve customizedcontent 133
symptoms 51, 52system audit report 20system component audit 21system messages, redirect to agent log 124
Ttags, objects 112TCP service, remote monitoring 116, 121template command operations 142tool, ops-cli 141troubleshooting, review super metric 108
UUnsynchronized Agents group 123upgrade, Reset out-of-the-box content 133upgrades, impact on policies 81use cases, auditing 20user access control, privileges 10user preferences 9user scenario
create a user account 15dashboard 28dashboard navigation 28reports 40views 37vSphere 6.0 compliance 74widget 28
user scenariosaccess control 14
vRealize Operations Manager Customization and Administration Guide
150 VMware, Inc.
access control create role and useraccount 14
access control import user account 16create an operational policy for production
datastore objects 93create policy for vSphere production
environment 86users
accounts 10external 10external sources 13local 10privileges 10roles 10vCenter Server 10, 11
Users, backward compatibility 12
VvCenter Server users 10, 11vCenter Server Users, backward
compatibility 12view
create 37delete 39edit 39export 38import 39owner 39run 38
view command operations 145views, preserve customized content 133visualize, super metric 106vRealize Operations Manager
backup 134backup and restore 134licenses 129maintenance 129restore 134troubleshooting 129
vSphere 6.0 compliance 74vSphere 6.0 object compliance 73vSphere data protection
backing up 135backup and restore 134restoring with 136
vSphere Hardening Guide 5.5 72, 78vSphere Hardening Guide 6.0 72, 78
Wwidget
interaction 34resource interaction mode 35
widgets, configuring 32work dashboard navigation 31
workspaces, policies 101, 102
Index
VMware, Inc. 151

vRealize Operations Manager Customization and Administration Guide
152 VMware, Inc.