Embed Size (px)
Citation preview

1
VRL Financial Results - Q1 2017-18
Earnings Presentation
Aug 04, 2017

2
• Certain statements contained in this document may be statements of future expectations/forward looking
statements that are based on management‘s current view and assumptions and involve known and unknown
risks and uncertainties that could cause actual results/performance or events to differ materially from those
expressed or implied therein.
•The information contained in this presentation has not been independently verified and no representation or
warranty expressed or implied is made as to and no reliance should be placed on the fairness, accuracy
completeness or correctness of the information or opinions contained herein.
•This presentation may contain certain forward looking statements within the meaning of applicable securities
law and regulations. These statements include descriptions regarding the intent belief or current expectations
of the Company or its directors and officers with respect to the results of operations and financial condition of
the Company. Such forward-looking statements are not guarantees of future performance and involve risks
and uncertainties and actual results may differ from those in such forward-looking statements as a result of
various factors and assumptions which the Company presently believes to be reasonable in light of its
operating experience in recent years. Many factors could cause the actual results, performance or
achievement of the Company to be materially different from any future results performance or achievement
and significant factors that could make a difference to the Company’s operations include domestic and
international economic conditions ,changes in government regulations ,tax regime and other statutes.
• None of VRL Logistics Ltd or any of its affiliates advisors or representatives shall have any liability
whatsoever (in negligence or otherwise) for any loss howsoever arising from any use of this document or its
content or otherwise arising in connection with this document.
• This document does not constitute an offer or invitation to purchase or subscribe for any shares and neither
it nor any part of it shall form the basis of or be relied upon in connection with any contract or commitment
whatsoever.

3
A public listed company on NSE & BSE Exchange with a Market capitalization of INR 30.59
billion (as on 30tH JUNE, 2017).
Passenger transportation through 411 owned buses of various makes.
State - of - the - art workshop facilities with performance enhancing technological
innovations.
Dedicated In house software with own servers and real time data for analysis and MIS
A pre dominantly parcel delivery service provider (68.28 % of total Revenue as of FY 17)
with pan–India last mile connectivity operating through a fleet of 3939 owned Goods
transport vehicles complemented by third party hired vehicles on need basis.
Extensive pan India network with presence in 934 locations ensuring last mile
delivery even in remote locations.
Other Business verticals include Wind power generation, Transport of passengers by Air.

4
REVENUE up
by 11.07%
EBITDA up by
77.78%
PAT up by
302.42%
Consolidated
(INR in Lakhs)Q1 FY18(Unaudited)
Q4 FY17(audited)
Q1 FY17(undited)
FY17 (Audited)
REVENUE49187.37 44286.38 45864.52 180308.51
EBITDA7799.54 4387.30 6950.61 22748.13
EBITDA
MARGINS(%) 15.67% 9.86% 15.08% 12.55%
EBIT5380.00 2002.88 4576.71 12930.28
EBIT MARGINS(%)10.81% 4.50% 9.93% 7.13%
PBT4961.53 1492.82 3894.64 10530.07
PBT MARGINS(%)9.97% 3.35% 8.45% 5.81%
PAT3373.80 838.37 2646.70 7047.26
PAT MARGINS(%)6.78% 1.88% 5.74% 3.89%
PBT up by
232.36%
REVENUE up
by 7.24%
EBITDA up by
12.21%
PAT up by
27.47%
PBT up
by 27.39%
EBIT up by
168.61%
EBIT up by
17.55%

5
Goods transport revenue increased by 4.88% QoQ and increased by 5.75% YoY.
EBITDA increased by 21.09% QoQ and increased by 11.46% YoY.
EBITDA margins increased by 1.82% QoQ and decreased by 0.70% YoY.
EBIT increased by 35.90% QoQ and increased by 13.60% YoY.
EBIT margins increased by 2.35% QoQ and increased by 0.71% YoY.
(INR in lakhs) Goods Transport
Quarter ended Year ended
Particulars 30.06.2017
(unaudited)
31.03.2017
(audited)
30.06.2016
(unaudited)
31.03.2017
(Audited)
Revenue 37498.68 35752.61 35459.31 142615.26
EBITDA 5099.00 4210.87 4574.77 17636.00
EBITDA Margin(%)13.60% 11.78% 12.90% 12.37%
EBIT 3867.84 2846.16 3404.92 12815.91
EBIT Margin(%) 10.31% 7.96% 9.60% 8.99%
6
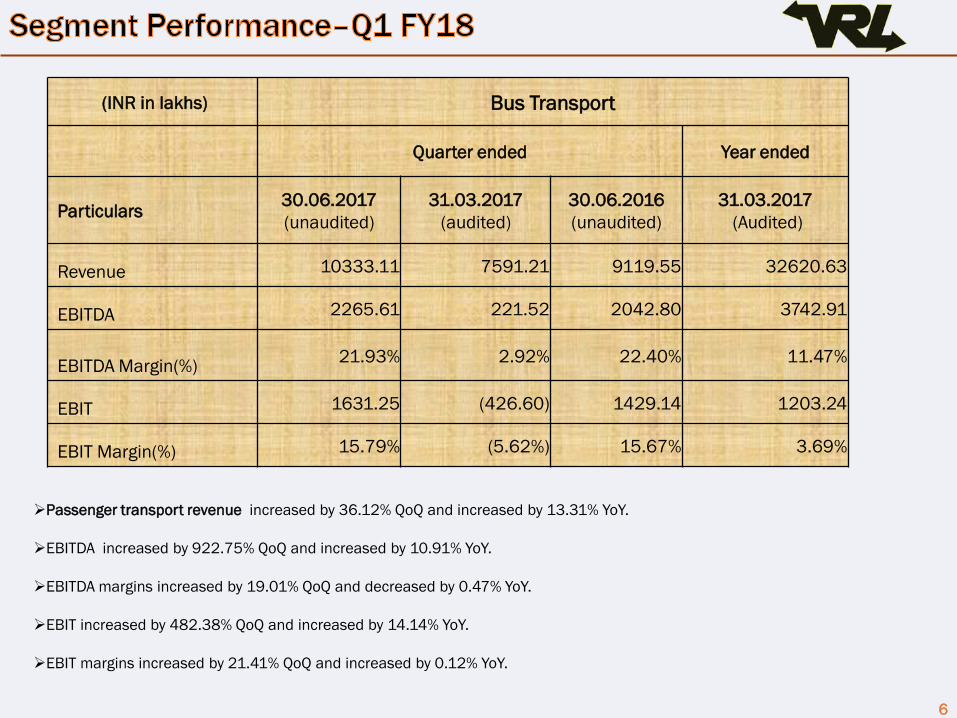
Passenger transport revenue increased by 36.12% QoQ and increased by 13.31% YoY.
EBITDA increased by 922.75% QoQ and increased by 10.91% YoY.
EBITDA margins increased by 19.01% QoQ and decreased by 0.47% YoY.
EBIT increased by 482.38% QoQ and increased by 14.14% YoY.
EBIT margins increased by 21.41% QoQ and increased by 0.12% YoY.
(INR in lakhs) Bus Transport
Quarter ended Year ended
Particulars 30.06.2017
(unaudited)
31.03.2017
(audited)
30.06.2016
(unaudited)
31.03.2017
(Audited)
Revenue 10333.11 7591.21 9119.55 32620.63
EBITDA 2265.61 221.52 2042.80 3742.91
EBITDA Margin(%)21.93% 2.92% 22.40% 11.47%
EBIT 1631.25 (426.60) 1429.14 1203.24
EBIT Margin(%) 15.79% (5.62%) 15.67% 3.69%

7
Sale of Power revenue increased by 234.34% QoQ and increased by 16.19% YoY.
EBITDA increased by 698.20% QoQ and increased by 33.60% YoY.
EBITDA margins increased by 52.47% QoQ and increased by 11.77% YoY.
EBIT increased by 340.68% QoQ and increased by 77.08% YoY.
EBIT margins increased by 134.63% QoQ and increased by 19.38% YoY.
(INR in lakhs) Sale of Power
Quarter ended Year ended
Particulars 30.06.2017
(unaudited)
31.03.2017
(audited)
30.06.2016
(unaudited)
31.03.2017
(Audited)
Revenue 797.78 238.61 686.62 2346.84
EBITDA 720.30 90.24 539.14 1755.86
EBITDA Margin(%)90.29% 37.82% 78.52% 74.82%
EBIT 449.56 (186.79) 253.87 339.69
EBIT Margin(%) 56.35% (78.28%) 36.97% 14.47%

8
Transport of passengers by Air revenue decreased by 37.99% QoQ and decreased by 27.64% YoY.
EBITDA decreased by 599.06% QoQ and decreased by 423.45% YoY.
EBITDA margins decreased by 86.19% QoQ and decreased by 81.51% YoY.
EBIT decreased by 244.75% QoQ and decreased by 203.20% YoY.
EBIT margins decreased by 93.63% QoQ and decreased by 86.92% YoY.
(INR in lakhs) Transport of passengers by Air
Quarter ended Year ended
Particulars 30.06.2017
(unaudited)
31.03.2017
(audited)
30.06.2016
(unaudited)
31.03.2017
(Audited)
Revenue 242.57 391.16 335.23 1603.43
EBITDA (229.43) (32.82) (43.83) 26.26
EBITDA Margin(%)(94.58%) (8.39%) (13.07%) 1.64%
EBIT (276.94) (80.33) (91.34) (163.80)
EBIT Margin(%) (114.17%) (20.54%) (27.25%) (10.22%)

9
GST Compliance - The company has adapted to the new Tax regime by bringing in the necessary
changes in its operational systems.
Procurement of Bio-fuel @ 18.29% of total Quantity- up by 1.84% from 16.45% in Q417
Addition of 8 locations to the existing network of Goods Transport business. Operational
infrastructure consists of 934 locations as on June 30, 2017. (closure of 5 locations.)
Addition of 13 goods transport vehicles. 15 Vehicles sold/scrapped. Total GT vehicles are 3939 as
on June 30, 2017.
Healthy Net Debt to Equity ratio – Improvement from 0.32x as on March 31, 2017 to 0.2x as on
June 30, 2017
Net debt reduced from 17396.35 lakhs as on March 31, 2017 to 11485.78 lakhs as on June 30,
2017
Strong emphasis on growth by building upon the existing infrastructure

10
Hub-and-Spoke model to aggregate small parcels
and maximize capacity utilization of its vehicles
Efficient operations with largest fleet and a robust pan India network in 934 locations
One of the largest
pan-India surface
transportation network
in 23 states and 4 union
territories.
Operational
infrastructure
comprises of 638
branches, 249
agencies & 47
hubs in 934
locations
Strategically
placed
47(7 owned)
transshipment
hubs
Infrastructure facilities
comprising of branches ,
agencies, and
transhipment hubs
enables us to cater to a
diversified customer
base spread across
different geographical
locations
Extensive
network across
the country with
last mile delivery
even in remote
locations
Established
brand since
four decades.
Market leader
in India in the
LTL segment.

11
Goods transportation fleet includes :
3939 owned vehicles as of June 2017.
1003 (25%) vehicles less than 5 years old.
3581 (91%) of vehicles are debt free
2119 (54%) of vehicles have a book value of
Re 1
Average age of Truck fleet is around 9 years
Wide range of vehicles with carrying capacity
from 1 ton to 32 tons
Passenger transportation fleet includes
411 owned vehicles
143 (35%) vehicles are less than 5 years old
344 (84%) of vehicles are debt free
Average age of Passenger vehicles is 5 yrs
Significance of own vehicles
Enables us to significantly reduce hiring and
operational costs
Enables us to cover a large number of routes
and reduce dependence on third party hired
vehicles
Enables better control and time bound
delivery thereby enhancing service quality
Passenger transportation: Owned vehicles
enable us to provide safe and on time travel
experience
NOTE:
(1) Small vehicles are defined as vehicles with carrying capacity up to 2500 kilograms.
(2) Light commercial vehicles are defined as vehicles with carrying capacity between
2500 kilograms and 7500 kilograms.
(3) Heavy commercial vehicles are defined as vehicles with carrying capacity of more
than 7500 kilograms.
(4) Used for transportation of automobiles.
(5) Used for transportation of liquid.
(6) Cranes are predominantly used for internal operations.
As of
Small
Vehicle
(1)
Light
Commercial
Vehicle ( 2)
Heavy
Commercial
Vehicles (3)
Car
Carrier
(4)
Available
Capacity
(tons)
Tanker
(5)
Cranes
(6)
Total
Vehicles
Owned
BUSESTOTAL
FLEET
31-Mar-
13122 883 1941 102 34882 27 13 3088 460 3548
31-Mar-
14122 882 2210 102 40087 23 13 3352 477 3829
31-Mar-
15120 975 2423 102 45538 16 13 3649 375 4024
31-Mar-
16119 982 2639 102 49861 17 13 3872 381 4253
31-Mar-
17117 969 2723 102 52099 17 13 3941 419 4360
30-Jun-
17117 959 2731 102 52184 17 13 3939 411 4350
Total of 4350 owned vehicles provides greater leverage in terms of pricing and service

12
76.24%
21.01%
1.62%
0.49%
0.64%
Q1 FY18
Goods Transport Bus Trasport Sale of Power
Air charter Others
77.31%
19.88%
1.50%
0.73%
0.58%
Q1 FY17
Goods Transport Bus Transport
Sale of Power Aircharter
Others
Segmentwise contribution to total revenue
Goods Transport (76.24%) is the key contributor to total revenue

13
Leverage metrics
Return metrics
1.5 1.0 0.8
4.8
8.9 9.5
FY 15 FY 16 FY 17
Net
debt/Ebitda(x)
Ebitda/finance
cost(x)
23.3% 19.6%
12.8%
27.5%24.0% 13.4%
FY 15 FY 16 FY 17
Return(Net Profit+finance costs )on average capital
employed
Return(Net Profit) on average equity
1.2
0.5 0.3 0.2
FY 15 FY16 FY17 Q1 FY18
Net debt/Equity(x)
17396
.
42899 24501
Net debt position (Lakhs)
11486
Improving debt profile
54.70%
32.28%24.32%
FY 15 FY16 FY17
Gearing RatioNet Debt to Equity
Note : Debt for the above purpose includes
non-current borrowings, current borrowings
and current maturities of non current
borrowings and Interest accrued but not due
on borrowings.

14
69.57%
8.45%
11.32%
0.08% 7.45%
0.10%
3.03%
Promoters
Mutual Funds
Foreign Portfolio
Investors
Financial
Institutes/Banks
Public
NBFC( RBI Registerd)
Others

THANKING YOU
For further discussions/queries Please contact :
Sunil Nalavadi
Chief Financial Officer
+91 93425 59298


![Announces Q1 results [Result]](https://img.pdfslide.net/doc/110x75/577cb4121a28aba7118c4992/announces-q1-results-result.jpg)