Embed Size (px)
DESCRIPTION
VSphere 5 Troubleshooting(1)
Citation preview
VMware vSphere 5 troubleshooting
Lab Guide and Slides
vSphere 5 Troubleshooting: Lab guide
© 2012 – Xylos – http://www.xylos.com 2/14
Table of Content
1. Installing management tools ........................................................................................... 3
1.1. Configuring your IP address ......................................................................................... 3
1.2. Installing the vSphere Client ......................................................................................... 3
1.3. Installing vCLI ............................................................................................................. 3
1.4. Installing PowerCLI / PowerGUI .................................................................................... 3
1.5. Installing RVTOOLS ..................................................................................................... 4
2. Monitoring an vSphere 5 Environment .............................................................................. 5
2.1. Using the vSphere Client .............................................................................................. 5
2.1.1. Monitoring an ESXi host ............................................................................................ 5
2.1.2. Monitoring an individual Virtual Machine ..................................................................... 7
2.2. Using the command-line and esxtop .............................................................................. 8
vSphere 5 Troubleshooting: Lab guide
© 2012 – Xylos – http://www.xylos.com 3/14
1. Installing management tools
All tools can be found on the \\Xylos-Fileserver\Applications share. You should be local administrator to your deskop.
Logon credentials:
- Local workstation: Administrator - Educadmin - Domain low-level: Student - Tr@ining - Domain high-level: AdmStudent - I@mTheBoss - vMA: vi-admin - Vmw@re123
1.1. Configuring your IP address
Please assign a fixed IP address to your PC in the range 172.16.3.x. Subnet mask: 255.255.248.0. Gateway: 172.16.0.1, DNS: 172.16.5.20. This should connect you to the Lab domain (xylos.training)
1.2. Installing the vSphere Client
The vSphere Client is located in the folder “VMware vSphere Client 5”. Run “VMware-viclient-all-5.0.0-623373.exe” as an administrator.
Install to the default directory.
1.3. Installing vCLI
The vSphere vCLI package is located in the folder “VMware vSphere CLI 5.0 U1”. Run “VMware-vSphere-CLI-5.0.0-615831.exe” as an administrator.
Install to the default directory.
1.4. Installing PowerCLI / PowerGUI
The vSphere vCLI package is located in the folder “VMware vSphere PowerCLI 5.0.1”. Run “VMware-PowerCLI-5.0.1-581491.exe” as an administrator.
PowerCLI will install VIX automatically. Install Only the vSphere PowerCLI (Not the vCloud Director PowerCLI). Install to the default directory.
The PowerGui package is located in the folder “PowerGUI”. Run “PowerGUI.3.2.0.2237.msi”
as an administrator. Install using all the defaults.
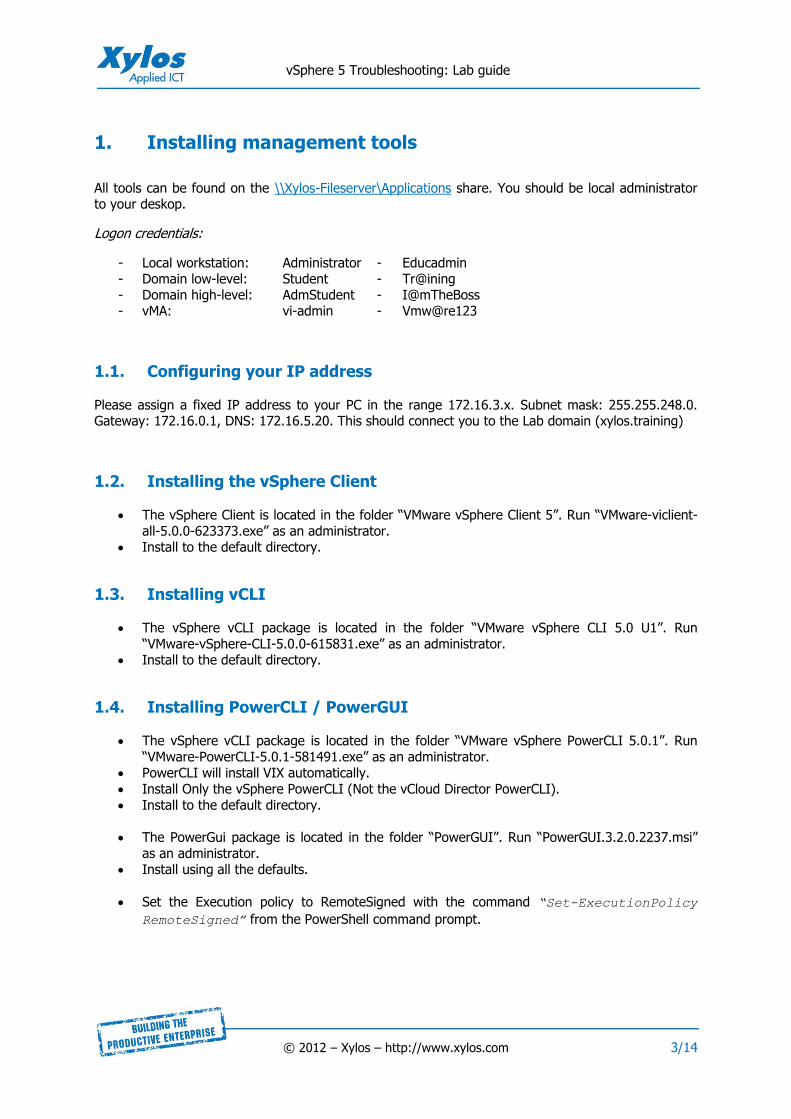
Set the Execution policy to RemoteSigned with the command “Set-ExecutionPolicy
RemoteSigned” from the PowerShell command prompt.
vSphere 5 Troubleshooting: Lab guide
© 2012 – Xylos – http://www.xylos.com 4/14
1.5. Installing RVTOOLS
The RVTools package is located in the folder “RVTools”. Run “RVTools.msi” as an administrator.
Install using the default settings and location.
vSphere 5 Troubleshooting: Lab guide
© 2012 – Xylos – http://www.xylos.com 5/14
2. Monitoring an vSphere 5 Environment
2.1. Using the vSphere Client
2.1.1. Monitoring an ESXi host
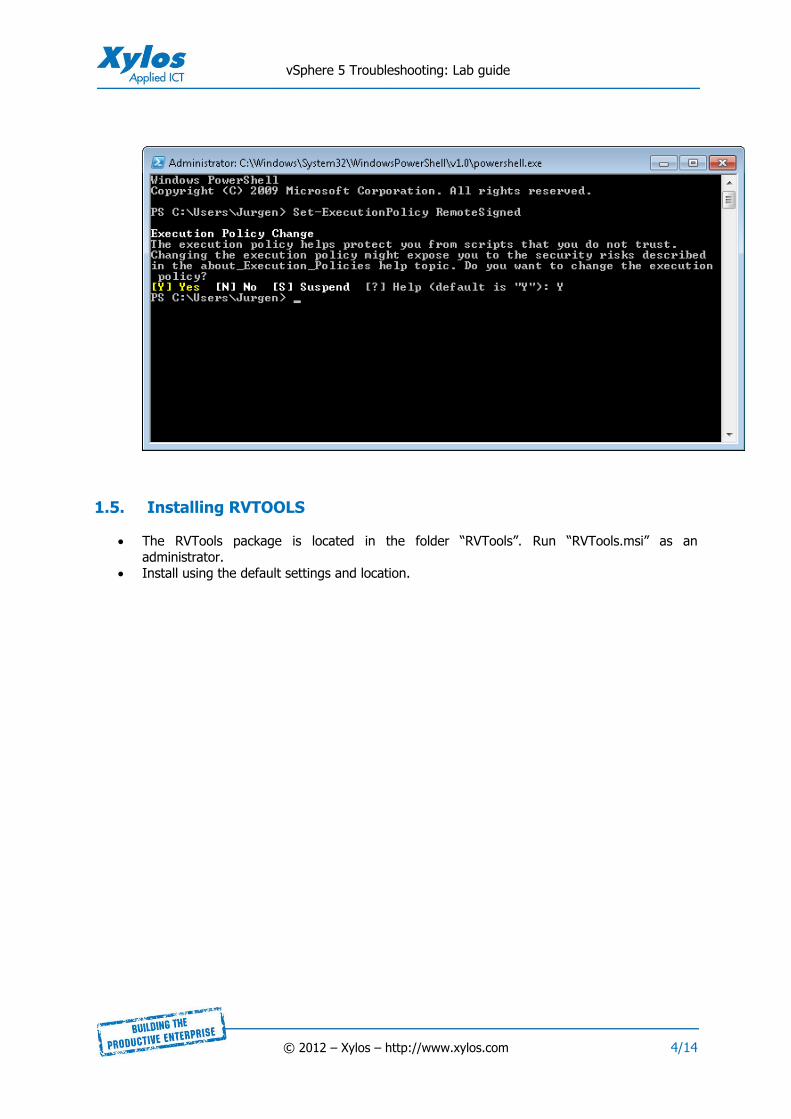
Start the vSphere Client and connect to the vCenter Server (xylos-vCenter.xylos.training) with your admin credentials.
Go to the Home > Inventory > Hosts and Clusters view and select one of the ESXi hosts.
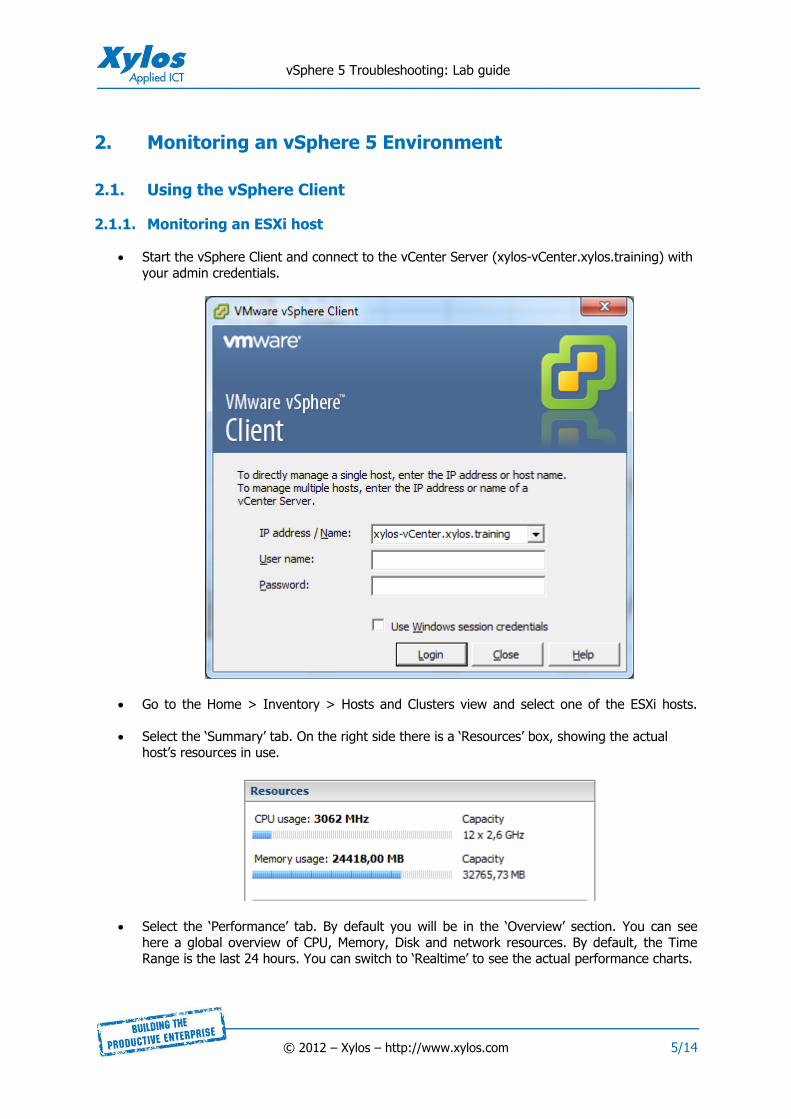
Select the „Summary‟ tab. On the right side there is a „Resources‟ box, showing the actual host‟s resources in use.
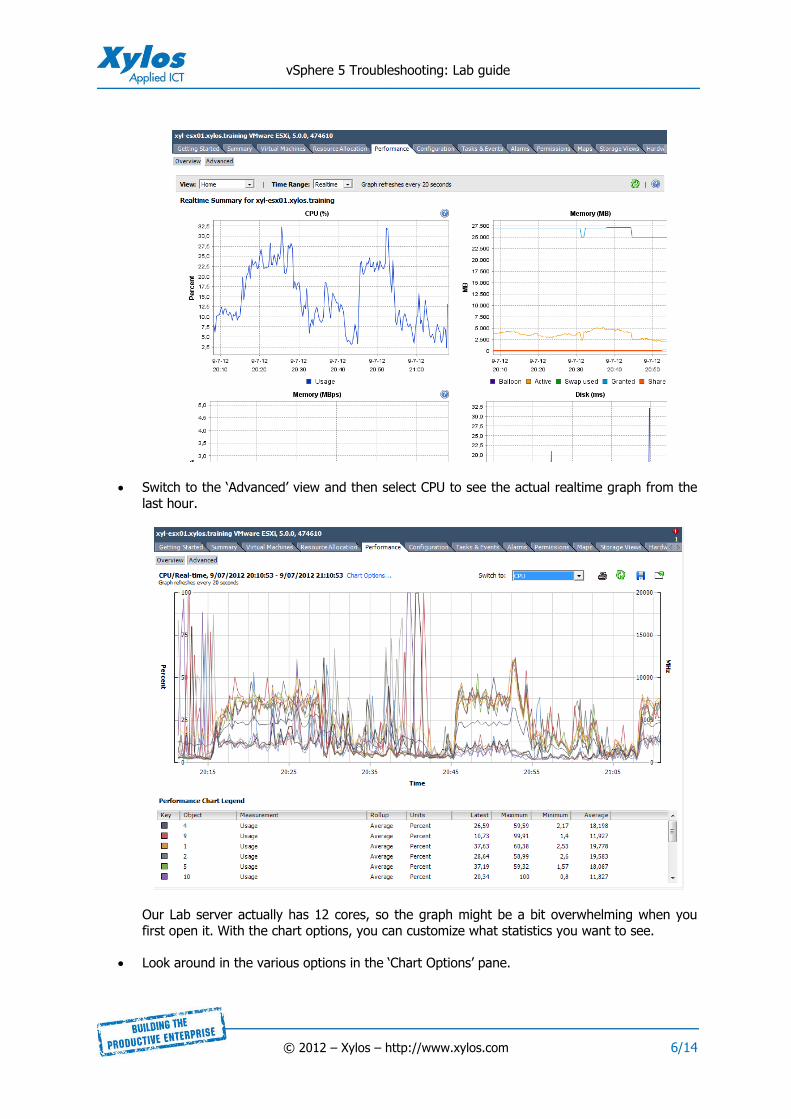
Select the „Performance‟ tab. By default you will be in the „Overview‟ section. You can see here a global overview of CPU, Memory, Disk and network resources. By default, the Time Range is the last 24 hours. You can switch to „Realtime‟ to see the actual performance charts.
vSphere 5 Troubleshooting: Lab guide
© 2012 – Xylos – http://www.xylos.com 6/14
Switch to the „Advanced‟ view and then select CPU to see the actual realtime graph from the last hour.
Our Lab server actually has 12 cores, so the graph might be a bit overwhelming when you first open it. With the chart options, you can customize what statistics you want to see.
Look around in the various options in the „Chart Options‟ pane.
vSphere 5 Troubleshooting: Lab guide
© 2012 – Xylos – http://www.xylos.com 7/14
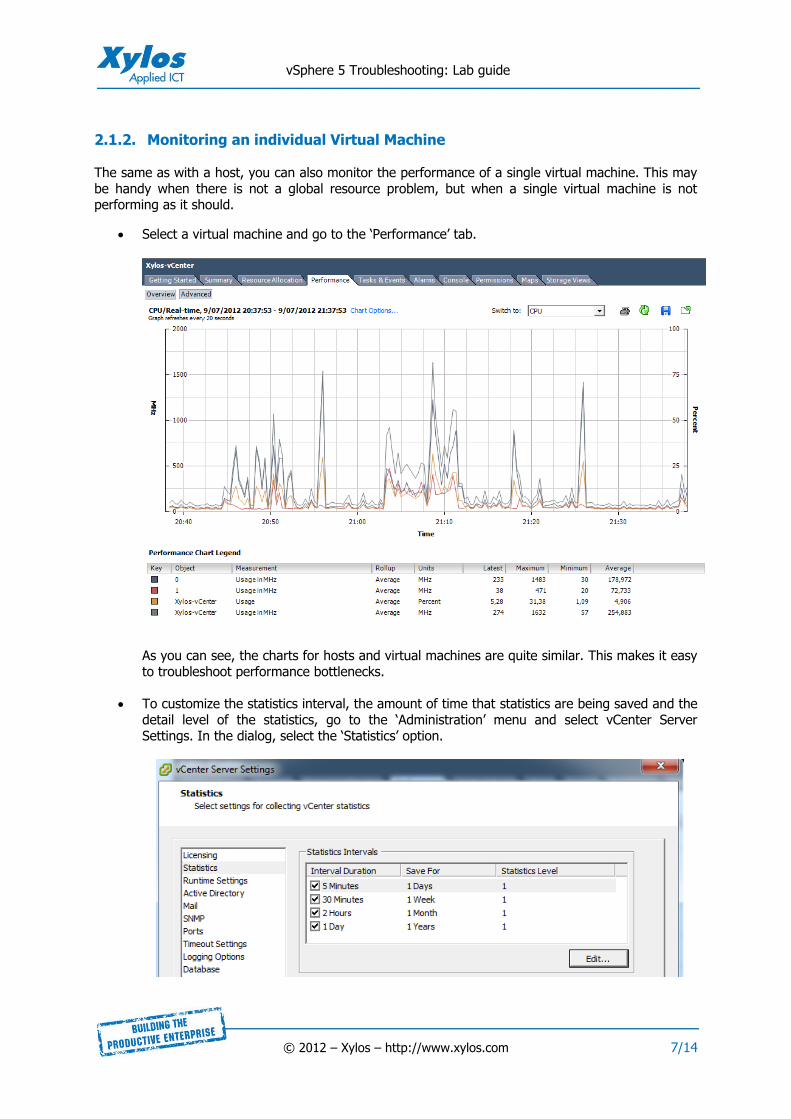
2.1.2. Monitoring an individual Virtual Machine
The same as with a host, you can also monitor the performance of a single virtual machine. This may be handy when there is not a global resource problem, but when a single virtual machine is not performing as it should.
Select a virtual machine and go to the „Performance‟ tab.
As you can see, the charts for hosts and virtual machines are quite similar. This makes it easy to troubleshoot performance bottlenecks.
To customize the statistics interval, the amount of time that statistics are being saved and the detail level of the statistics, go to the „Administration‟ menu and select vCenter Server Settings. In the dialog, select the „Statistics‟ option.
vSphere 5 Troubleshooting: Lab guide
© 2012 – Xylos – http://www.xylos.com 8/14
You can select how long and in what detail level the statistics will be saved. Also, the database size to which the vCenter database will grow will be estimated. Be careful when changing the statistics level as your database will grow exponentially!
2.2. Using the command-line and esxtop
You can also use esxtop from the command-line to monitor an ESXi server. This tool gives you in-depth knowledge of what is going on inside your host.
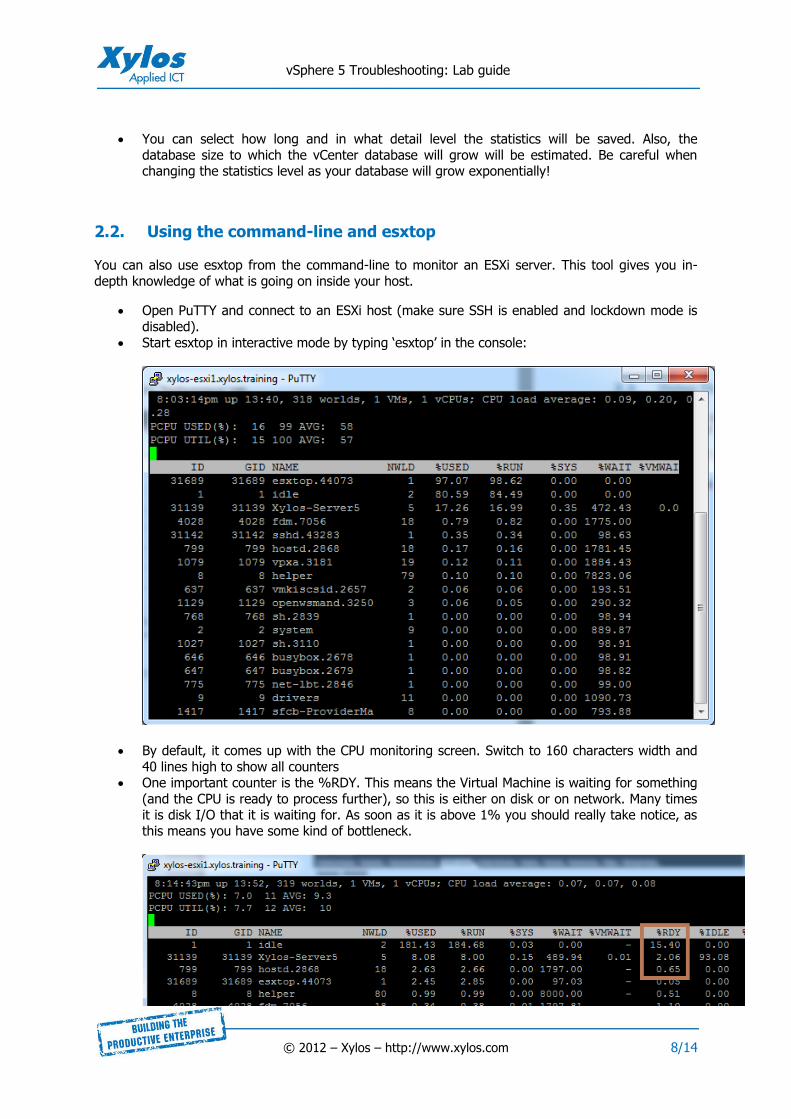
Open PuTTY and connect to an ESXi host (make sure SSH is enabled and lockdown mode is disabled).
Start esxtop in interactive mode by typing „esxtop‟ in the console:
By default, it comes up with the CPU monitoring screen. Switch to 160 characters width and 40 lines high to show all counters
One important counter is the %RDY. This means the Virtual Machine is waiting for something (and the CPU is ready to process further), so this is either on disk or on network. Many times it is disk I/O that it is waiting for. As soon as it is above 1% you should really take notice, as this means you have some kind of bottleneck.
vSphere 5 Troubleshooting: Lab guide
© 2012 – Xylos – http://www.xylos.com 9/14
CPU Panel Statistics:
ID – resource pool or VM ID of the running worlds resource pool or VM or world ID of running world.
GID – Resource pool ID of the running worlds resource pool or VM.
NAME – Name of the virtual machine or process.
NWLD – Number of members in a running worlds resource pool or VM.
%USED –CPU usage with reference to the base core frequency, i.e. the actual CPU value in Mhz.
%RUN – CPU scheduled time. (If using turbo boost will show greater than 100%.)
%SYS – Time spent in the ESX(i) VMkernel on behalf of the resource pool, VM or world to processor interrupts.
%WAIT – Time spent in the blocked or busy wait state.
%RDY – Time CPU is ready to run, waiting for something else.
High %RDY and high %USED can imply CPU overcommitment.
%IDLE – Subtract this from %WAIT to see time waiting for an event. WAIT-IDLE can be used to estimate guest I/O wait time.
%MLMTD (max limited – Time VMkernel didn‟t run because it would violate limit settings on the resource pool, VM or world limits setting.
%SWPWT – Wait time for swap memory.
CPU ALLOC – CPU allocation. Set of CPU statistics made up of the following. (For a world the % are the % of one physical CPU core)
AMIN – Attribute reservation.
AMAX – Attribute limit.
ASHRS – Attribute shares.
SUMMARY STATS – Only applies to worlds.
CPU – Which CPU esxtop was running on.
HTQ – Indicates whether a world is currently quarantined or not. (Y or N)
TIMER/s – Timer rate for this world.
%OVRLP – Time spent on behalf of a different resource pool/VM or world while the local was scheduled. Not included in %SYS.
%CSTP – Time a resource pool spends in a ready/co-scheduled state
vSphere 5 Troubleshooting: Lab guide
© 2012 – Xylos – http://www.xylos.com 10/14
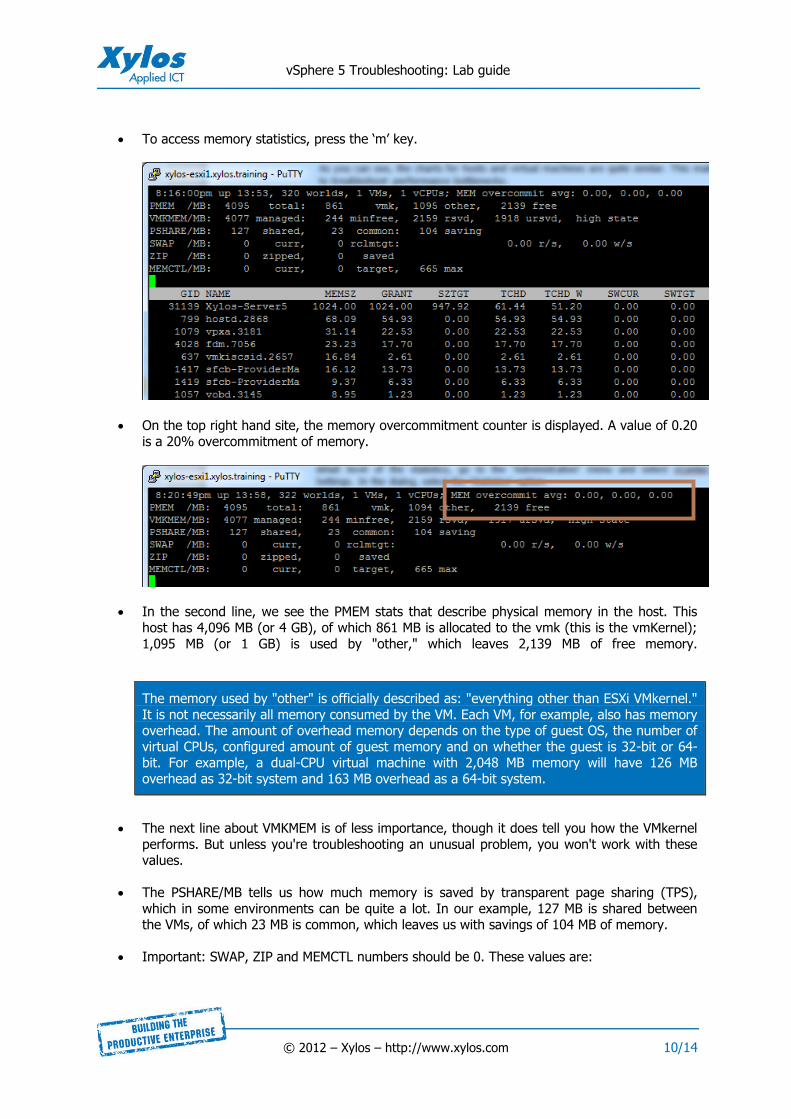
To access memory statistics, press the „m‟ key.
On the top right hand site, the memory overcommitment counter is displayed. A value of 0.20 is a 20% overcommitment of memory.
In the second line, we see the PMEM stats that describe physical memory in the host. This host has 4,096 MB (or 4 GB), of which 861 MB is allocated to the vmk (this is the vmKernel); 1,095 MB (or 1 GB) is used by "other," which leaves 2,139 MB of free memory.
The memory used by "other" is officially described as: "everything other than ESXi VMkernel." It is not necessarily all memory consumed by the VM. Each VM, for example, also has memory overhead. The amount of overhead memory depends on the type of guest OS, the number of virtual CPUs, configured amount of guest memory and on whether the guest is 32-bit or 64-bit. For example, a dual-CPU virtual machine with 2,048 MB memory will have 126 MB overhead as 32-bit system and 163 MB overhead as a 64-bit system.
The next line about VMKMEM is of less importance, though it does tell you how the VMkernel
performs. But unless you're troubleshooting an unusual problem, you won't work with these values.
The PSHARE/MB tells us how much memory is saved by transparent page sharing (TPS), which in some environments can be quite a lot. In our example, 127 MB is shared between the VMs, of which 23 MB is common, which leaves us with savings of 104 MB of memory.
Important: SWAP, ZIP and MEMCTL numbers should be 0. These values are:
vSphere 5 Troubleshooting: Lab guide
© 2012 – Xylos – http://www.xylos.com 11/14
o The SWAP value displays the ESX server swap usages statistics, where "curr" is the current swap usage, "rclmtgt" is how much ESX expects to swap and "r/s" and "w/s" show the rate at which the swapping occurrs.
o ZIP indicates how much memory is being saved by compressing memory pages. This is also a technique to save memory inside the virtual machine. Zipped shows how much memory is compressed and saved shows how much physical memory is saved by doing so.
o MEMCTL shows the total amount (cur) of physical memory reclaimed using the vmmemctl module or the balloondriver, the total amount ESX attempts to reclaim (target) and the maximum amount ESX can reclaim (max).
As soon as you see the SWAP curr, ZIP zipped or MEMCTRL curr rise above zero, you should really start investigating what is wrong. As a rule of thumb, you should never load your ESX memory to more than 80% or 85%. This way you always have spare memory in case VMs start to use more physcial memory. Also, loading your ESX hosts in a cluster at more than 80% to 85% can get you into trouble with your VMware High Availability failover level.
Memory Panel Fields
MEMSZ (MB) – Amount of phyiscal memory allocated to a resource pool or VM.
GRANT (MB) – Guest memory mapped.
SZTGT (MB) – Amount the VMkernel wants to allocate.
TCHD (MB) – Working set estimate.
%ACTV – % guest physical memory referenced by the guest.
%ACTVS – Slow moving version of the above.
%ACTVF – Fast moving.
%ACTVN – Estimation. (This is intended for VMware use only)
MCTL – Memory balloon drive installed or not. (Y/N)
MCTLSZ (MB) – Amount of physical memory reclaimed by ballooning.
MCTLTGT (MB) – Attempts to reclaim by ballooning.
MCTLMAX (MB) – Maximum that can be reclaimed by ballooning.
SWCUR (MB) – Current swap.
vSphere 5 Troubleshooting: Lab guide
© 2012 – Xylos – http://www.xylos.com 12/14
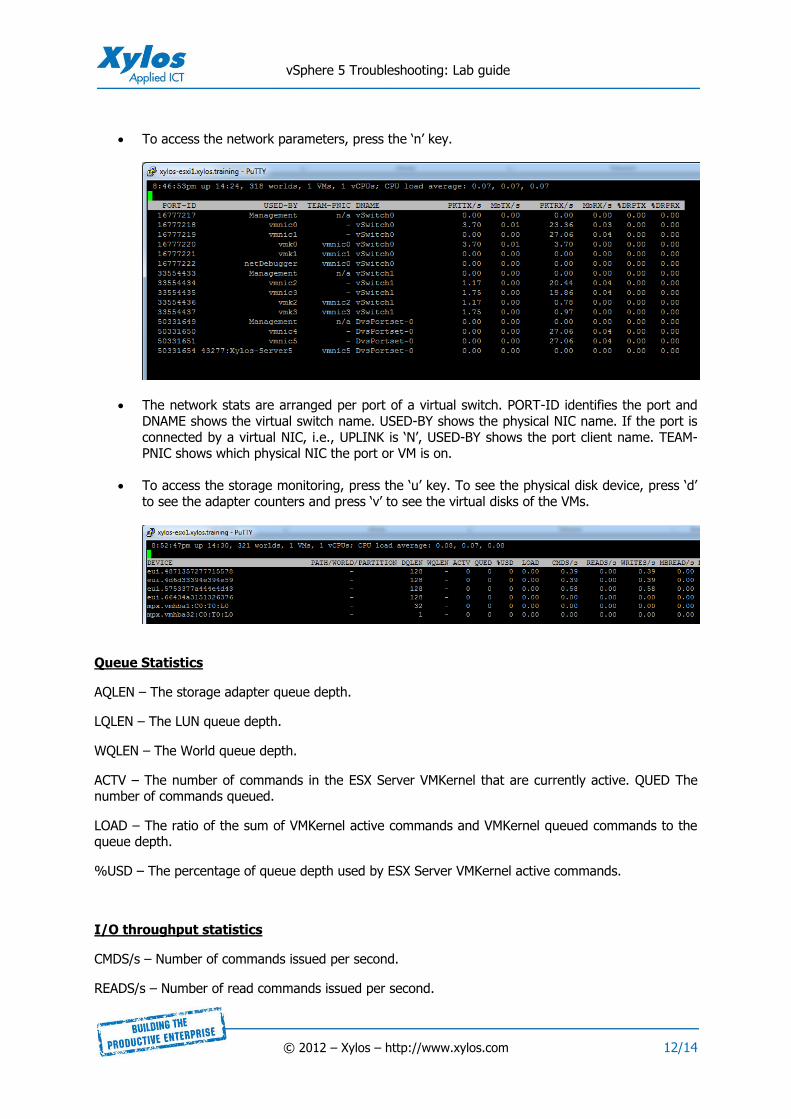
To access the network parameters, press the „n‟ key.
The network stats are arranged per port of a virtual switch. PORT-ID identifies the port and DNAME shows the virtual switch name. USED-BY shows the physical NIC name. If the port is connected by a virtual NIC, i.e., UPLINK is „N‟, USED-BY shows the port client name. TEAM-PNIC shows which physical NIC the port or VM is on.
To access the storage monitoring, press the „u‟ key. To see the physical disk device, press „d‟ to see the adapter counters and press „v‟ to see the virtual disks of the VMs.
Queue Statistics
AQLEN – The storage adapter queue depth.
LQLEN – The LUN queue depth.
WQLEN – The World queue depth.
ACTV – The number of commands in the ESX Server VMKernel that are currently active. QUED The number of commands queued.
LOAD – The ratio of the sum of VMKernel active commands and VMKernel queued commands to the queue depth.
%USD – The percentage of queue depth used by ESX Server VMKernel active commands.
I/O throughput statistics
CMDS/s – Number of commands issued per second.
READS/s – Number of read commands issued per second.
vSphere 5 Troubleshooting: Lab guide
© 2012 – Xylos – http://www.xylos.com 13/14
WRITES/s – Number of write commands issued per second.
MBREAD/s – MB reads per second.
MBWRTN/s – MB written per second.
I/O latencies
I/O latencies are measured per SCSI command so it is not affected by the refresh interval. Reported latencies are average values for all the SCSI commands issued within the refresh interval window. Reported average latencies can be different on different screens, (adapter, LUN, VM) since each screen accounts for different group of I/O‟s.
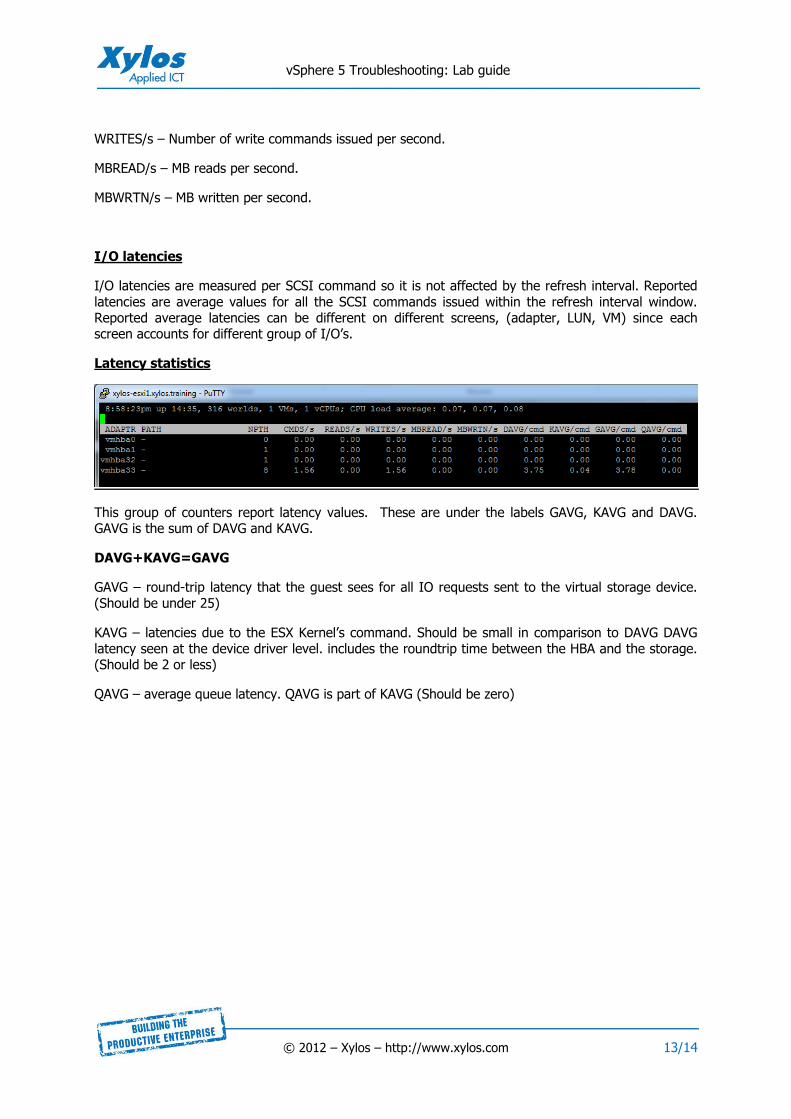
Latency statistics
This group of counters report latency values. These are under the labels GAVG, KAVG and DAVG. GAVG is the sum of DAVG and KAVG.
DAVG+KAVG=GAVG
GAVG – round-trip latency that the guest sees for all IO requests sent to the virtual storage device. (Should be under 25)
KAVG – latencies due to the ESX Kernel‟s command. Should be small in comparison to DAVG DAVG latency seen at the device driver level. includes the roundtrip time between the HBA and the storage. (Should be 2 or less)
QAVG – average queue latency. QAVG is part of KAVG (Should be zero)
vSphere 5 Troubleshooting: Lab guide
© 2012 – Xylos – http://www.xylos.com 14/14
3. Links and interesting Guides
vSphere 5 Troubleshooting guide:
http://pubs.vmware.com/vsphere-50/topic/com.vmware.ICbase/PDF/vsphere-esxi-vcenter-server-50-troubleshooting-guide.pdf