Embed Size (px)
Citation preview
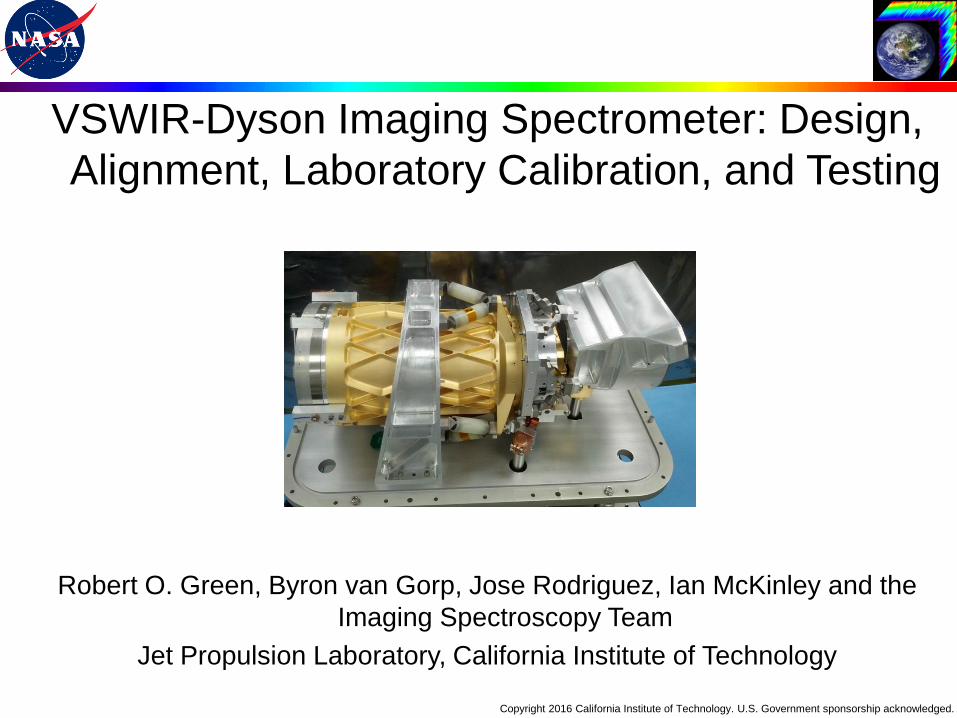
VSWIR-Dyson Imaging Spectrometer: Design,
Alignment, Laboratory Calibration, and Testing
Robert O. Green, Byron van Gorp, Jose Rodriguez, Ian McKinley and the
Imaging Spectroscopy Team
Jet Propulsion Laboratory, California Institute of Technology
Copyright 2016 California Institute of Technology. U.S. Government sponsorship acknowledged.
• Imaging Spectroscopy
• VSWIR-Dyson Description
• Laboratory Tests and Calibration
• Sample Reflectance Measurements
• Vibration Testing
• Summary and Conclusions
Overview
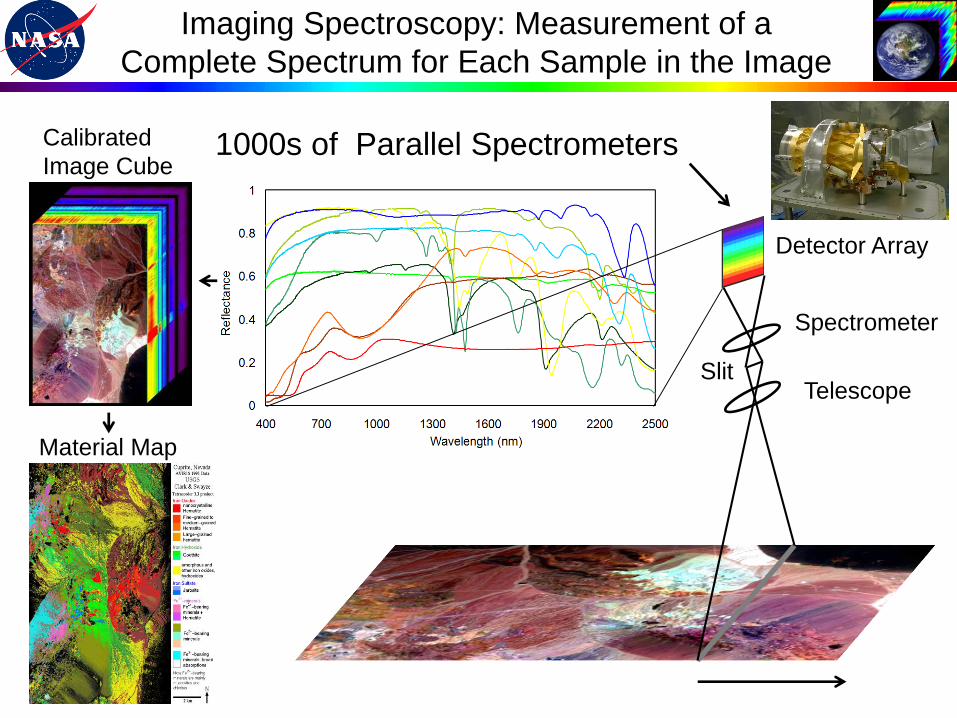
Imaging Spectroscopy: Measurement of a
Complete Spectrum for Each Sample in the Image
Spectrometer
Telescope
Detector Array
Slit
1000s of Parallel SpectrometersCalibrated
Image Cube
Material Map
VSWIR-Dyson Imaging Spectrometer
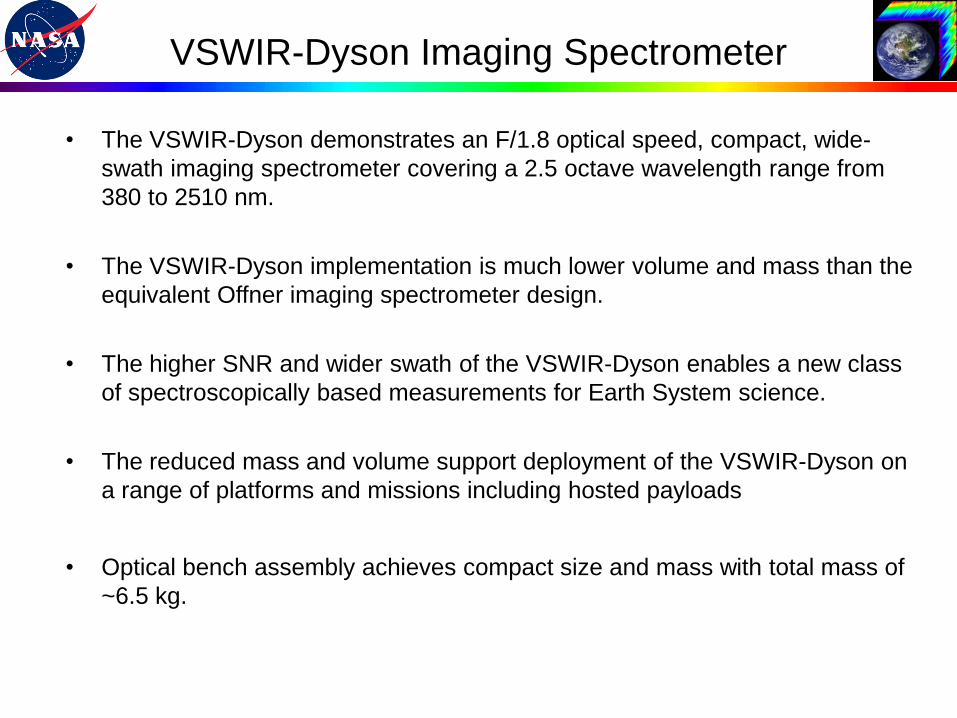
• The VSWIR-Dyson demonstrates an F/1.8 optical speed, compact, wide-
swath imaging spectrometer covering a 2.5 octave wavelength range from
380 to 2510 nm.
• The VSWIR-Dyson implementation is much lower volume and mass than the
equivalent Offner imaging spectrometer design.
• The higher SNR and wider swath of the VSWIR-Dyson enables a new class
of spectroscopically based measurements for Earth System science.
• The reduced mass and volume support deployment of the VSWIR-Dyson on
a range of platforms and missions including hosted payloads
• Optical bench assembly achieves compact size and mass with total mass of
~6.5 kg.
Instrument Description
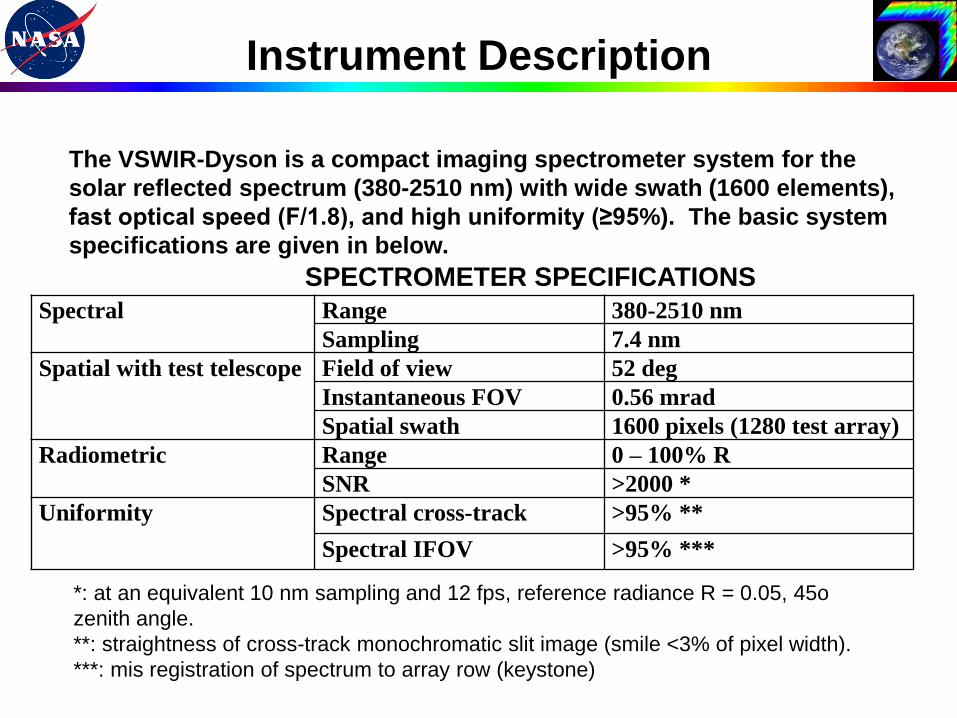
The VSWIR-Dyson is a compact imaging spectrometer system for the
solar reflected spectrum (380-2510 nm) with wide swath (1600 elements),
fast optical speed (F/1.8), and high uniformity (≥95%). The basic system
specifications are given in below.
SPECTROMETER SPECIFICATIONS
*: at an equivalent 10 nm sampling and 12 fps, reference radiance R = 0.05, 45o
zenith angle.
**: straightness of cross-track monochromatic slit image (smile <3% of pixel width).
***: mis registration of spectrum to array row (keystone)
Spectral Range 380-2510 nm
Sampling 7.4 nm
Spatial with test telescope Field of view 52 deg
Instantaneous FOV 0.56 mrad
Spatial swath 1600 pixels (1280 test array)
Radiometric Range 0 – 100% R
SNR >2000 *
Uniformity Spectral cross-track >95% **
Spectral IFOV >95% ***
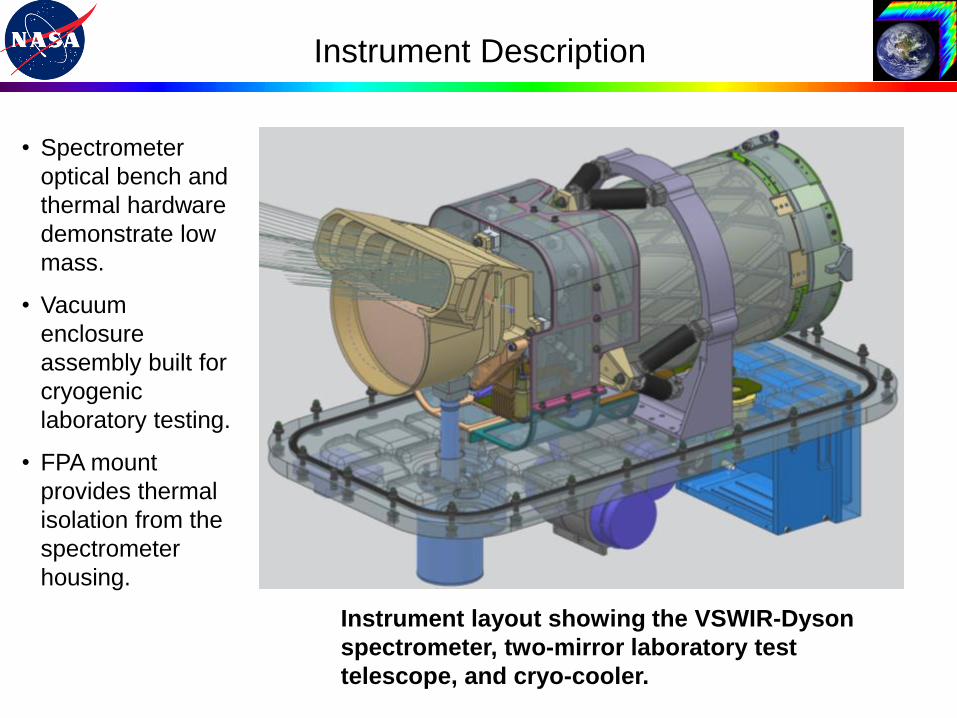
• Spectrometer
optical bench and
thermal hardware
demonstrate low
mass.
• Vacuum
enclosure
assembly built for
cryogenic
laboratory testing.
• FPA mount
provides thermal
isolation from the
spectrometer
housing.
Instrument Description
Instrument layout showing the VSWIR-Dyson
spectrometer, two-mirror laboratory test
telescope, and cryo-cooler.
Instrument Description
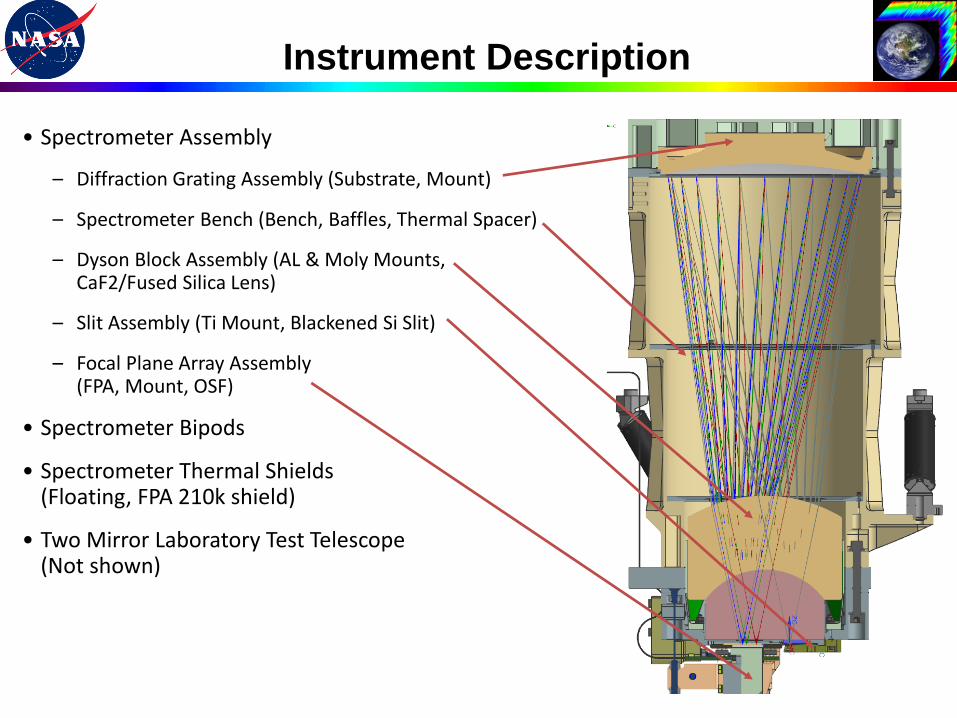
• Spectrometer Assembly
– Diffraction Grating Assembly (Substrate, Mount)
– Spectrometer Bench (Bench, Baffles, Thermal Spacer)
– Dyson Block Assembly (AL & Moly Mounts, CaF2/Fused Silica Lens)
– Slit Assembly (Ti Mount, Blackened Si Slit)
– Focal Plane Array Assembly (FPA, Mount, OSF)
• Spectrometer Bipods
• Spectrometer Thermal Shields (Floating, FPA 210k shield)
• Two Mirror Laboratory Test Telescope(Not shown)
1600pixsplitblocksmalleratF1-8CAF2-silica7p4nmsamplingPLUSONEORDERoptimizedforcoldMTFv3correctedmeritfunction_optim6_tp3_aper_set_therm1_TP_asfab_L1sn2_L2sn1_reoptim3.zmxConfiguration 1 of 6
3D Layout
0.38-2.5micron, 30 micron pixels8/12/2014Scale: 0.6667
30.00 Millimeters
X
Y Z
1600pixsplitblocksmalleratF1-8CAF2-silica7p4nmsamplingPLUSONEORDERoptimizedforcoldMTFv3correctedmeritfunction_optim6_tp3_aper_set_therm1_TP_asfab_L1sn2_L2sn1_reoptim3.zmxConfiguration 1 of 6
3D Layout
0.38-2.5micron, 30 micron pixels8/12/2014Scale: 0.6667
30.00 Millimeters
X
Y
Z
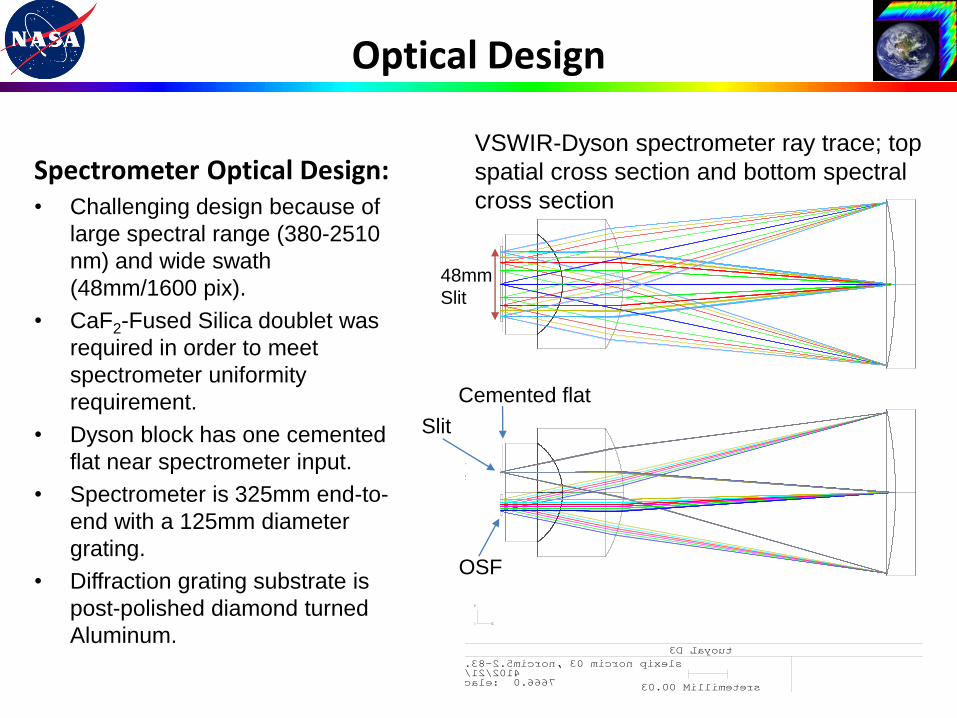
48mm
Slit
VSWIR-Dyson spectrometer ray trace; top
spatial cross section and bottom spectral
cross section
Optical Design
Spectrometer Optical Design:• Challenging design because of
large spectral range (380-2510
nm) and wide swath
(48mm/1600 pix).
• CaF2-Fused Silica doublet was
required in order to meet
spectrometer uniformity
requirement.
• Dyson block has one cemented
flat near spectrometer input.
• Spectrometer is 325mm end-to-
end with a 125mm diameter
grating.
• Diffraction grating substrate is
post-polished diamond turned
Aluminum.
Cemented flat
OSF
Slit
systemtemp_no_fold_CAF2_54mmFL_conics_only.zmx
Configuration: All 1
3D Layout
8/12/2014
Scale: 0.5000
40.00 Millimeters
XY
Z
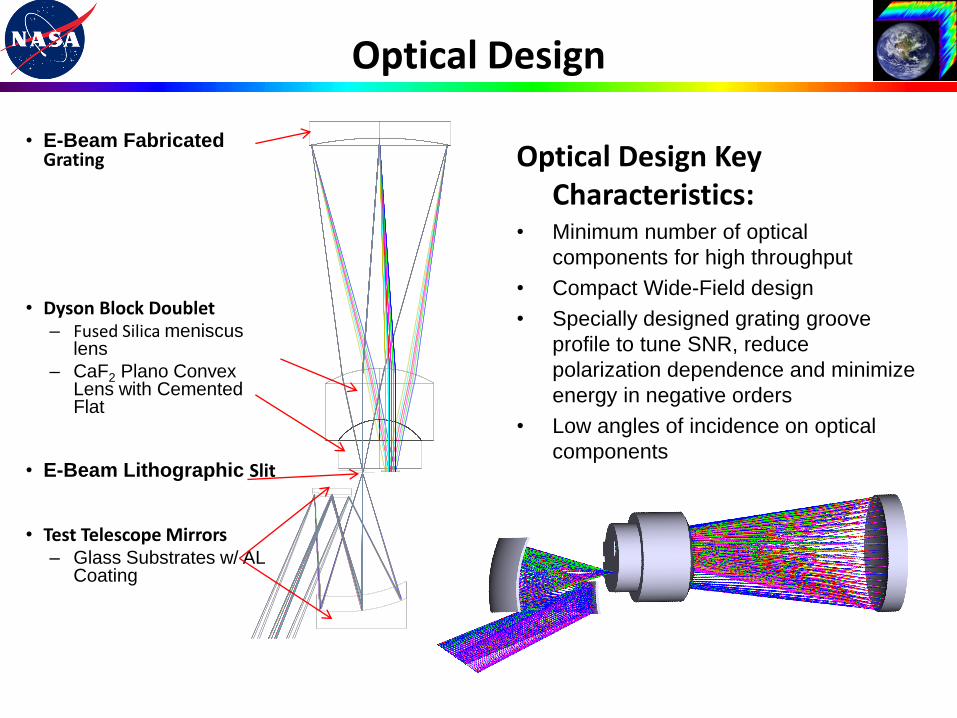
• E-Beam Fabricated Grating
• Dyson Block Doublet– Fused Silica meniscus
lens
– CaF2 Plano Convex Lens with Cemented Flat
• E-Beam Lithographic Slit
• Test Telescope Mirrors– Glass Substrates w/ AL
Coating
Optical Design
Optical Design Key Characteristics:
• Minimum number of optical
components for high throughput
• Compact Wide-Field design
• Specially designed grating groove
profile to tune SNR, reduce
polarization dependence and minimize
energy in negative orders
• Low angles of incidence on optical
components
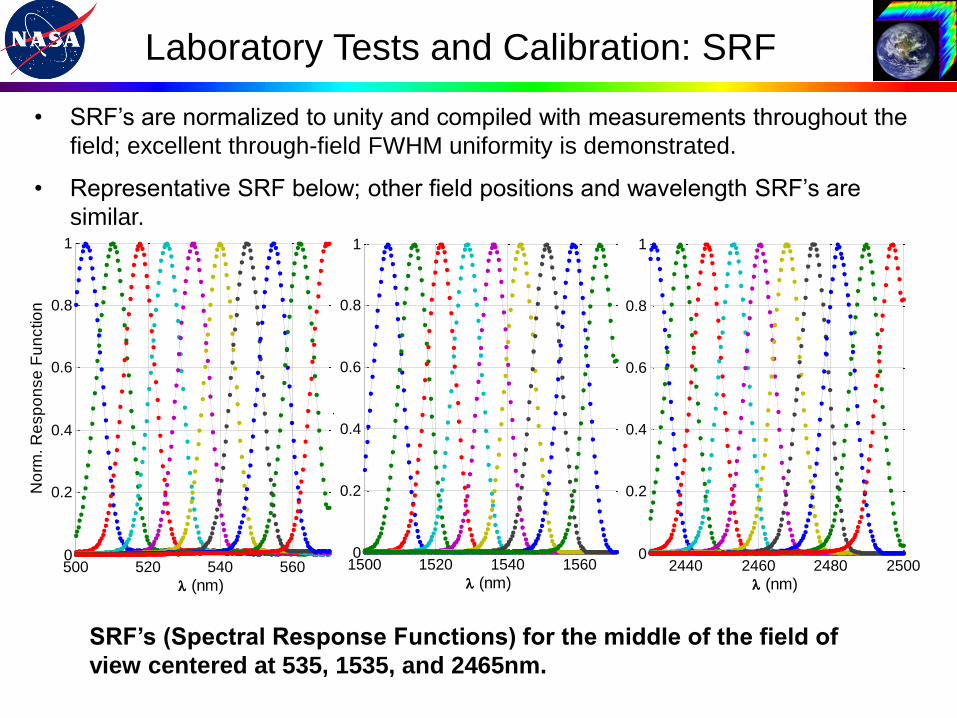
SRF’s (Spectral Response Functions) for the middle of the field of
view centered at 535, 1535, and 2465nm.
Laboratory Tests and Calibration: SRF
• SRF’s are normalized to unity and compiled with measurements throughout the
field; excellent through-field FWHM uniformity is demonstrated.
• Representative SRF below; other field positions and wavelength SRF’s are
similar.
500 520 540 5600
0.2
0.4
0.6
0.8
1
(nm)
No
rm. R
esp
on
se
Fu
nctio
n
1500 1520 1540 15600
0.2
0.4
0.6
0.8
1
(nm)
No
rm. R
esp
on
se
Fu
nctio
n
2440 2460 2480 25000
0.2
0.4
0.6
0.8
1
(nm)
No
rm. R
esp
on
se
Fu
nctio
n
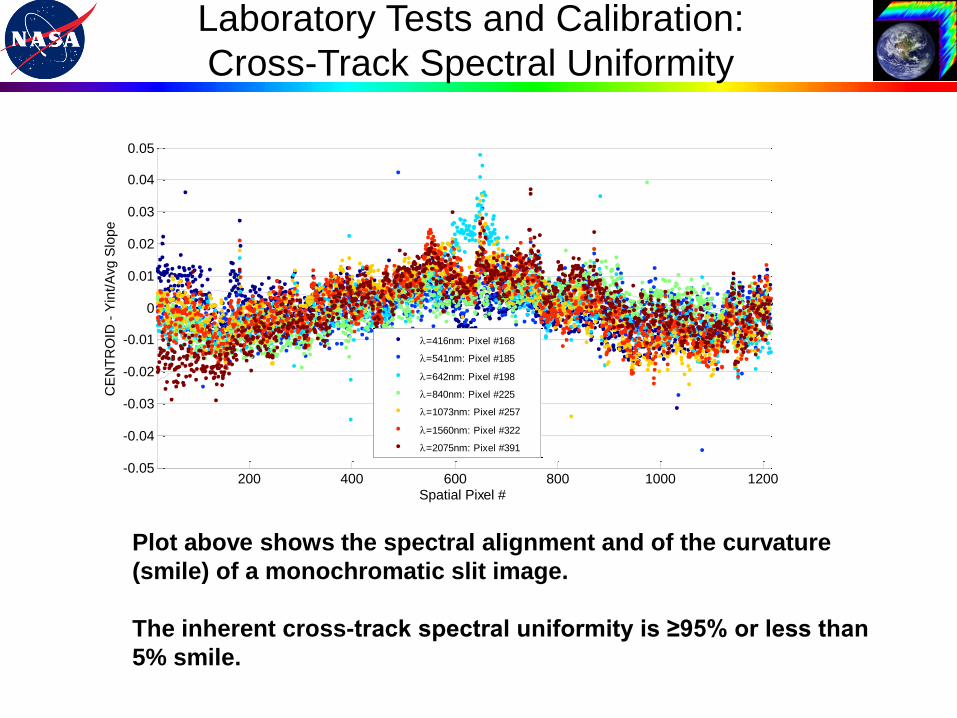
Plot above shows the spectral alignment and of the curvature
(smile) of a monochromatic slit image.
The inherent cross-track spectral uniformity is ≥95% or less than
5% smile.
Laboratory Tests and Calibration:
Cross-Track Spectral Uniformity
200 400 600 800 1000 1200-0.05
-0.04
-0.03
-0.02
-0.01
0
0.01
0.02
0.03
0.04
0.05
CE
NT
RO
ID -
Yin
t/A
vg S
lope
Spatial Pixel #
Centroid-Yint/Slope vs Spatial Pixel #
=416nm: Pixel #168
=541nm: Pixel #185
=642nm: Pixel #198
=840nm: Pixel #225
=1073nm: Pixel #257
=1560nm: Pixel #322
=2075nm: Pixel #391
200 400 600 800 1000 1200-0.1
-0.08
-0.06
-0.04
-0.02
0
0.02
0.04
0.06
0.08
0.1
CE
NT
RO
ID -
Yin
t
Spatial Pixel #
Laser Sphere CENTROID for several 's [TV6]:Centroid-Yint vs Spatial Pixel #
=416nm: y = 8.4708e-05*x + 168.0598
=541nm: y = 0.0001008*x + 184.9018
=642nm: y = 9.6371e-05*x + 198.4971
=840nm: y = 0.00010702*x + 225.0884
=1073nm: y = 8.8488e-05*x + 256.521
=1560nm: y = 9.3053e-05*x + 322.0982
=2075nm: y = 0.00010599*x + 391.3033
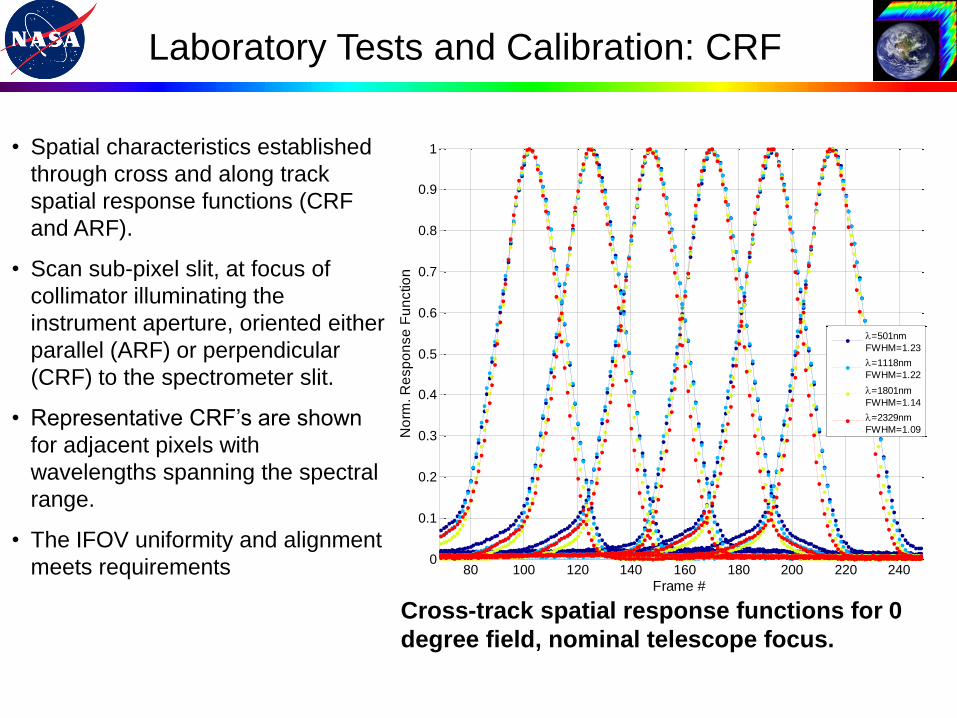
Cross-track spatial response functions for 0
degree field, nominal telescope focus.
Laboratory Tests and Calibration: CRF
• Spatial characteristics established
through cross and along track
spatial response functions (CRF
and ARF).
• Scan sub-pixel slit, at focus of
collimator illuminating the
instrument aperture, oriented either
parallel (ARF) or perpendicular
(CRF) to the spectrometer slit.
• Representative CRF’s are shown
for adjacent pixels with
wavelengths spanning the spectral
range.
• The IFOV uniformity and alignment
meets requirements 80 100 120 140 160 180 200 220 2400
0.1
0.2
0.3
0.4
0.5
0.6
0.7
0.8
0.9
1
Frame #
No
rm. R
esp
on
se
Fu
nctio
n
=501nm
FWHM=1.23
=1118nm
FWHM=1.22
=1801nm
FWHM=1.14
=2329nm
FWHM=1.09
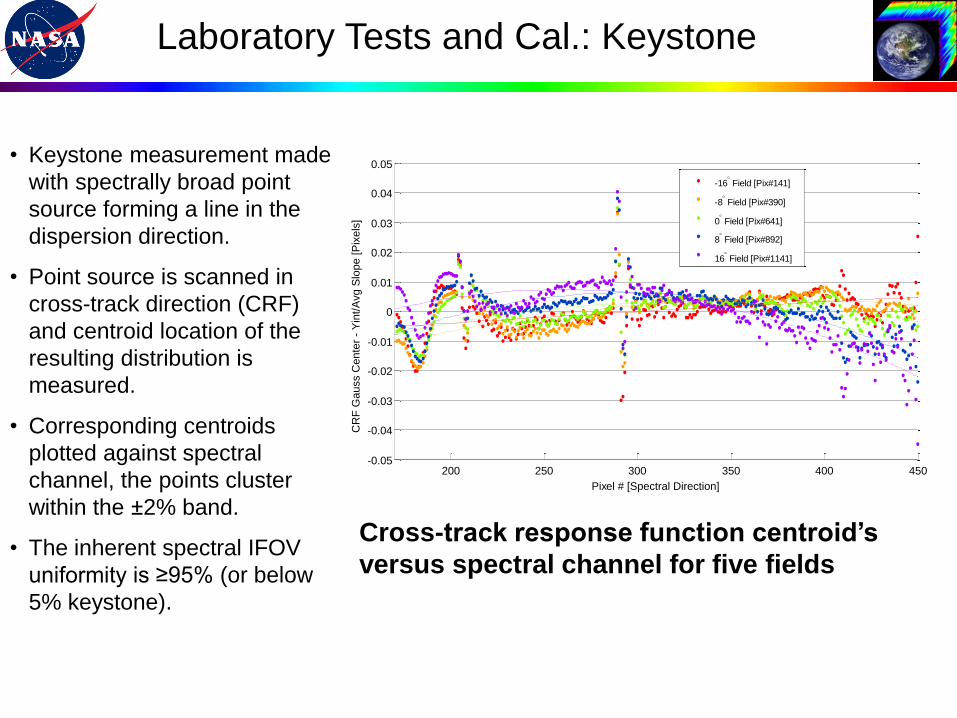
Cross-track response function centroid’s
versus spectral channel for five fields
Laboratory Tests and Cal.: Keystone
• Keystone measurement made
with spectrally broad point
source forming a line in the
dispersion direction.
• Point source is scanned in
cross-track direction (CRF)
and centroid location of the
resulting distribution is
measured.
• Corresponding centroids
plotted against spectral
channel, the points cluster
within the ±2% band.
• The inherent spectral IFOV
uniformity is ≥95% (or below
5% keystone).
200 250 300 350 400 450-0.05
-0.04
-0.03
-0.02
-0.01
0
0.01
0.02
0.03
0.04
0.05
CR
F G
auss C
ente
r -
Yin
t/A
vg S
lope [P
ixels
]
Pixel # [Spectral Direction]
-16 Field [Pix#141]
-8 Field [Pix#390]
0 Field [Pix#641]
8 Field [Pix#892]
16 Field [Pix#1141]
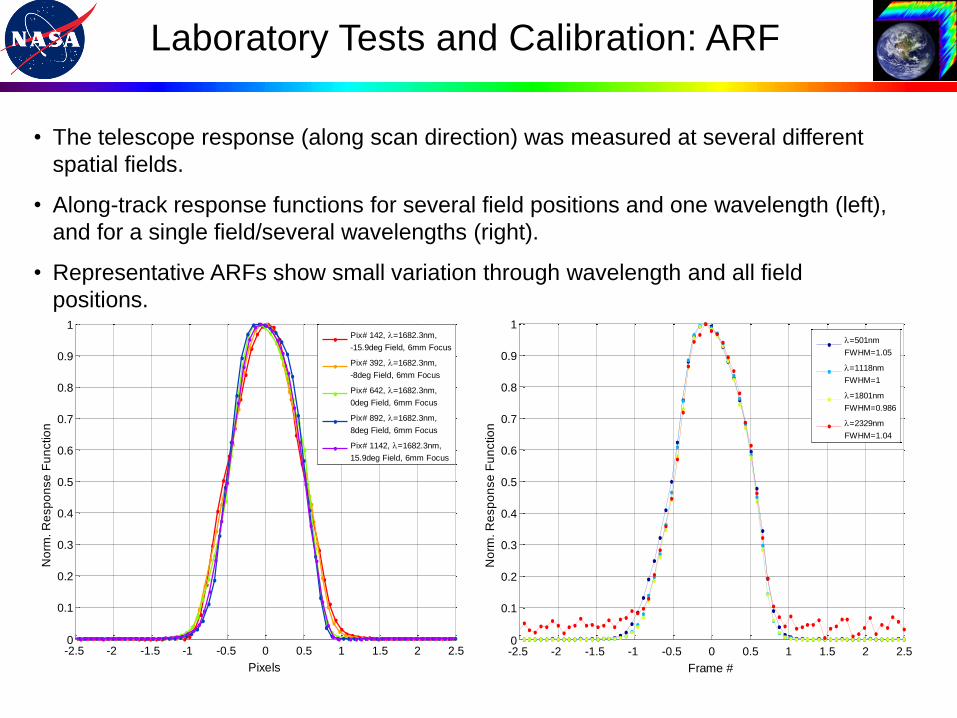
Laboratory Tests and Calibration: ARF
• The telescope response (along scan direction) was measured at several different
spatial fields.
• Along-track response functions for several field positions and one wavelength (left),
and for a single field/several wavelengths (right).
• Representative ARFs show small variation through wavelength and all field
positions.
-2.5 -2 -1.5 -1 -0.5 0 0.5 1 1.5 2 2.50
0.1
0.2
0.3
0.4
0.5
0.6
0.7
0.8
0.9
1
Pixels
No
rm. R
esp
on
se
Fu
nctio
n
Pix# 142, =1682.3nm,
-15.9deg Field, 6mm Focus
Pix# 392, =1682.3nm,
-8deg Field, 6mm Focus
Pix# 642, =1682.3nm,
0deg Field, 6mm Focus
Pix# 892, =1682.3nm,
8deg Field, 6mm Focus
Pix# 1142, =1682.3nm,
15.9deg Field, 6mm Focus
-2.5 -2 -1.5 -1 -0.5 0 0.5 1 1.5 2 2.50
0.1
0.2
0.3
0.4
0.5
0.6
0.7
0.8
0.9
1
Frame #
No
rm. R
esp
on
se
Fu
nctio
n
=501nm
FWHM=1.05
=1118nm
FWHM=1
=1801nm
FWHM=0.986
=2329nm
FWHM=1.04
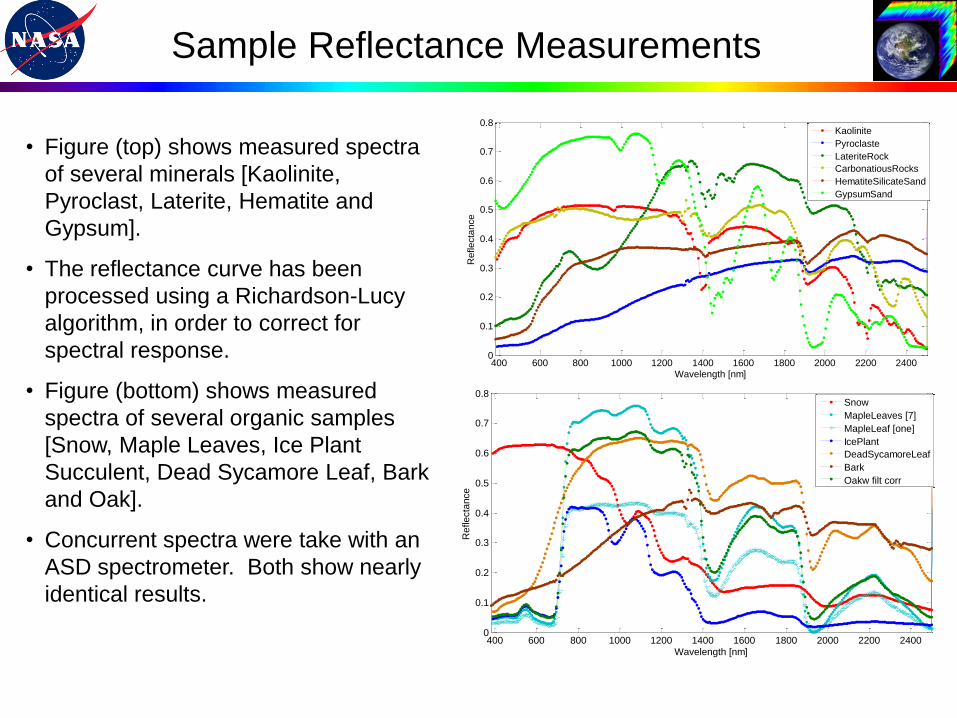
Sample Reflectance Measurements
• Figure (top) shows measured spectra
of several minerals [Kaolinite,
Pyroclast, Laterite, Hematite and
Gypsum].
• The reflectance curve has been
processed using a Richardson-Lucy
algorithm, in order to correct for
spectral response.
• Figure (bottom) shows measured
spectra of several organic samples
[Snow, Maple Leaves, Ice Plant
Succulent, Dead Sycamore Leaf, Bark
and Oak].
• Concurrent spectra were take with an
ASD spectrometer. Both show nearly
identical results.
400 600 800 1000 1200 1400 1600 1800 2000 2200 24000
0.1
0.2
0.3
0.4
0.5
0.6
0.7
0.8
Wavelength [nm]
Re
flecta
nce
Kaolinite
Pyroclaste
LateriteRock
CarbonatiousRocks
HematiteSilicateSand
GypsumSand
400 600 800 1000 1200 1400 1600 1800 2000 2200 24000
0.1
0.2
0.3
0.4
0.5
0.6
0.7
0.8
Wavelength [nm]
Re
flecta
nce
Snow
MapleLeaves [7]
MapleLeaf [one]
IcePlant
DeadSycamoreLeaf
Bark
Oakw filt corr
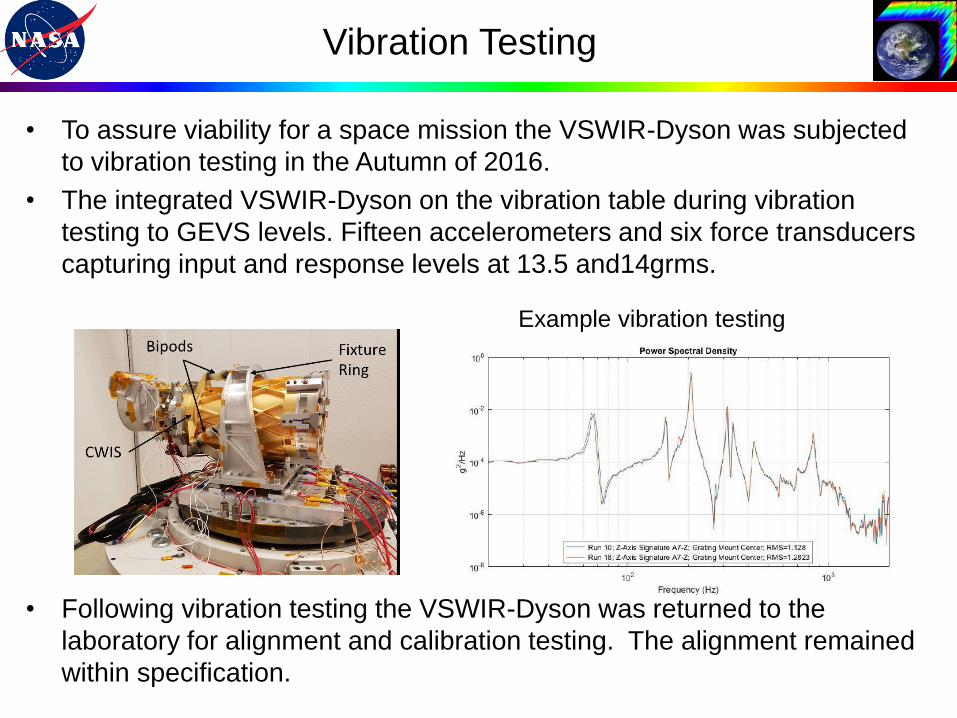
• To assure viability for a space mission the VSWIR-Dyson was subjected
to vibration testing in the Autumn of 2016.
• The integrated VSWIR-Dyson on the vibration table during vibration
testing to GEVS levels. Fifteen accelerometers and six force transducers
capturing input and response levels at 13.5 and14grms.
• Following vibration testing the VSWIR-Dyson was returned to the
laboratory for alignment and calibration testing. The alignment remained
within specification.
Vibration Testing
Example vibration testing
• A VSWIR-Dyson imaging spectrometer has been designed to support a
range of potential NASA space missions including HyspIRI.
• The instrument measures the spectral range from 380 to 2510 nm with
F/1.8 optical throughput and high uniformity (≥95%) and accommodates a
wide swath of up to 1600 samples. An array with 1280 samples has been
used for testing. A scaled dual VSWIR-Dyson can support > 6000
samples.
• The VSWIR-Dyson is currently equipped with a laboratory test telescope
that is expected to be replaced with the appropriate flight telescope as
required.
• The VSWIR-Dyson has been aligned, calibrated and characterized at
cryogenic temperatures.
• To demonstrate viability for space flight, the VSWIR-Dyson was subjected
to random vibration testing in the Autumn of 2016.
• Post vibration testing shows the instrument remained within specifications
and this VSWIR-Dyson design and implementation is suitable for use in a
space mission.
Summary & Conclusions