Embed Size (px)
Citation preview
Vulnerability of Australian Houses to Riverine Inundation
Analytical and empirical vulnerability curves
GEOSCIENCE AUSTRALIA
RECORD 2017/10
M. Wehner, S. Canterford, N. Corby, M. Edwards and V. Juskevics

Department of Industry, Innovation and Science
Minister for Resources and Northern Australia: Senator the Hon Matthew Canavan
Assistant Minister for Industry, Innovation and Science: The Hon Craig Laundy MP
Secretary: Ms Glenys Beauchamp PSM
Geoscience Australia
Chief Executive Officer: Dr James Johnson
This paper is published with the permission of the CEO, Geoscience Australia
© Commonwealth of Australia (Geoscience Australia) 2017
With the exception of the Commonwealth Coat of Arms and where otherwise noted, this product is
provided under a Creative Commons Attribution 4.0 International Licence.
(http://creativecommons.org/licenses/by/4.0/legalcode)
Geoscience Australia has tried to make the information in this product as accurate as possible.
However, it does not guarantee that the information is totally accurate or complete. Therefore, you
should not solely rely on this information when making a commercial decision.
Geoscience Australia is committed to providing web accessible content wherever possible. If you are
having difficulties with accessing this document please email [email protected].
ISSN 2201-702X (PDF)
ISBN 978-1-925297-47-8 (PDF)
eCat 104888
Bibliographic reference: Wehner, M., Canterford, S., Corby, N., Edwards, M., Juskevics, V., 2017.
Vulnerability of Australian Houses to Riverine Inundation: Analytical and empirical vulnerability curves.
Record 2017/10. Geoscience Australia, Canberra.. http://dx.doi.org/10.11636/Record.2017.010
Version: 1701
Vulnerability of Australian Houses to Riverine Inundation iii
Contents
Executive Summary .................................................................................................................................. 1
1 Introduction ............................................................................................................................................ 2
2 Empirical source data ............................................................................................................................ 3
3 Building categorisation for vulnerability ................................................................................................. 4
4 Analytical development of vulnerability curves ...................................................................................... 9
4.1 Specification of repair work to components ..................................................................................... 9
4.2 Insurance regimes ........................................................................................................................... 9
4.3 Scale of repair .................................................................................................................................. 9
4.4 Reparation costing and vulnerability curve suite ...........................................................................10
5 Development of empirical vulnerability curves ....................................................................................11
5.1 Investigation of repair following deep inundation ...........................................................................12
6 Results .................................................................................................................................................13
7 Discussion ...........................................................................................................................................14
8 Conclusions .........................................................................................................................................15
Acknowledgements ................................................................................................................................16
References .............................................................................................................................................17
Appendix A Analytical vulnerability curves .............................................................................................18
A.1 Graphs of analytical vulnerability curves .......................................................................................18
A.2 Numerical definitions of analytical vulnerability curves .................................................................22
Appendix B Empirical vulnerability curves derived from the Brisbane-Ipswich postal survey ...............24
B.1 Graphs of empirical vulnerability curves ........................................................................................24
B.2 Scatter plots of empirical data .......................................................................................................28
B.3 Box plots of empirical data ............................................................................................................32
B.3.1 Box plots ..................................................................................................................................32
B.3.2 Numerical data describing box plots ........................................................................................36
Appendix C Empirical vulnerability curves derived from Bundaberg postal survey ...............................43
C.1 Graphs of empirical vulnerability curves .......................................................................................43
C.2 Scatter plots of empirical data .......................................................................................................46
C.3 Box plots of empirical data ............................................................................................................49
C.3.1 Box plots ..................................................................................................................................49
C.3.2 Numerical data describing box plots ........................................................................................52
Appendix D Empirical vulnerability curves derived from combined Brisbane-Ipswich and Bundaberg postal surveys ......................................................................................................................57
D.1 Graphs of empirical vulnerability curves .......................................................................................57
D.2 Scatter plots of empirical data .......................................................................................................60
D.3 Box plots of empirical data ............................................................................................................64
D.3.1 Box plots ..................................................................................................................................64
D.3.2 Numerical data describing box plots ........................................................................................67
Appendix E Example component level repair specification ....................................................................73


Vulnerability of Australian Houses to Riverine Inundation 1
Executive Summary
Vulnerability functions, that relate damage to hazard magnitude are used in risk and impact
assessments, mitigation studies and associated cost benefit analyses. The development of
vulnerability functions must address the variety of assets exposed to the hazard of interest and the
common scarcity of empirical data to calibrate any functions developed using heuristic or analytical
methods.
This record reports efforts to improve the knowledge of the vulnerability of Australian domestic
housing to riverine inundation. The research is focussed on housing types found in the south-east of
Queensland although the results can be applied to houses of similar type elsewhere in Australia.
In order to address the wide variety of housing types found in the Australian built environment, in this
research representative generic housing types are identified from surveyed building exposure.
Analytical vulnerability relationships are developed for each from assessments of repair works at
different inundation depths. Finally, the analytical vulnerability curves are compared to empirical data
derived from repair costs reported by postal surveys of dwellings affected by flooding in Brisbane-
Ipswich, January 2011, and Bundaberg, January 2013.
Analytical vulnerability curves are presented for twelve generic housing types and two insurance
regimes. The process of developing vulnerability curves analytically is compared to empirical data.
The empirical data shows that for insured houses, the analytically derived vulnerability curves provide
a reasonable estimate of direct losses. However, for uninsured houses the analytical vulnerability
curves are shown to overestimate direct losses. The difference may be due to uninsured residents
tolerating a greater level of residual damage or undertaking repairs themselves at cheaper rates than
those assumed for the analytical work.
Although the results display variability, the empirical data indicate that the presented analytical
methodology for constructing vulnerability curves yields reasonable curves that would be suitable for
modelling impact of riverine flooding on populations of houses provided that adjustments are made to
modelled losses for uninsured dwellings.
2 Vulnerability of Australian Houses to Riverine Inundation
1 Introduction
One of the methodologies used to assess risk to the built environment is the Hazard – Exposure –
Vulnerability paradigm where Hazard describes the severity and associated probability of annual
exceedance of local hazard; Exposure describes the nature (type and location) of the built
environment affected by the hazard and Vulnerability describes the susceptibility to damage of the
exposed structures. In the context of riverine inundation the hazard is expressed as maximum depth of
inundation above the lowermost habitable floor measured in metres. Vulnerability can be expressed as
a relationship between damage index and hazard magnitude where damage index is defined as the
repair cost divided by the replacement cost for an individual building.
A variety of methods have been used by previous authors to represent vulnerability curves for houses
exposed to inundation, for example: Smith (1994), Dale et al (2004), NSW Government (2007) and
Maqsood et al (2014). Some of these methods aimed to express loss as a dollar value while others
expressed loss as a Damage Index (Repair Cost divided by Replacement Cost). This work adopts the
latter definition of loss.
This record reports efforts to improve the knowledge of the vulnerability of domestic housing to riverine
inundation. The research is focussed on housing types found in the south-east of Queensland
although the results could be applied to houses of similar type elsewhere in Australia. The riverine
inundation considered is inundation by slowly rising river water where the water velocity is sufficiently
low as not to cause velocity-related damage. This represents the most common flood environment,
though some catchments may exhibit higher velocity regimes.
To address the wide variety of housing types found in the Australian built environment, representative
generic housing types are identified from surveyed exposure. Analytical vulnerability relationships are
developed from assessments of the repair works required at step-wise increasing inundation depths.
The analytical vulnerability curves are compared to empirical vulnerability results derived from repair
costs reported by postal surveys of dwellings affected by flooding in Brisbane-Ipswich, January, 2011
(Canterford et al, 2016) and in Bundaberg, January, 2013 (Canterford et al, in prep.).
Vulnerability of Australian Houses to Riverine Inundation 3
2 Empirical source data
Flooding of the Bremer and Brisbane Rivers during January, 2011, affected approximately 17,100
dwellings. Following the event, Geoscience Australia led a field survey of residential building damage
in collaboration with other agencies. The survey recorded detailed information about the
characteristics of affected houses and the nature of flood damage sustained by visiting houses in a
door-to-door fashion. The survey captured data for 886 houses of which 754 were affected by riverine
inundation alone without incurring additional velocity related damage. The results of this survey were
used to develop the suite of generic house types used in this research.
Two follow-up surveys in the Brisbane-Ipswich area were undertaken in 2012 and 2013. A postal
survey was undertaken during April to June, 2012. This survey was dispatched to 5,000 dwellings
including those visited during the field survey and generated 1279 responses. The postal survey
asked questions relating to household composition, tenure, potential vulnerability, flood impacts, repair
work and funding. It also asked for the height of flood inundation above floor level and the cost
incurred in repairing damage to the dwelling and its contents. Responses to these questions provided
data to develop empirical vulnerability relationships and check the validity of curves developed by
other methods.
In order to gain some understanding of the nature of repair work following deep inundation a follow-up
survey was undertaken in February, 2013 to examine the nature of repairs to houses subjected to an
inundation depth of 2m or more.
Flooding in the Burnett and Kolan Rivers during January, 2013 affected approximately 1400 dwellings
in Bundaberg and surrounding settlements. A postal survey was undertaken during March and April,
2014. This survey was dispatched to 5,000 dwellings and generated 1288 responses. The postal
survey questions were based on the Brisbane-Ipswich postal survey but were refined and tailored to
the Bundaberg region. The Bundaberg survey population was different to the Brisbane-Ipswich survey
population in that the Bundaberg postal survey included dwellings that had not been flooded as well as
dwellings that had. The Bundaberg survey provided data that supplemented those obtained from the
Brisbane-Ipswich survey for empirical vulnerability relationship development.
4 Vulnerability of Australian Houses to Riverine Inundation
3 Building categorisation for vulnerability
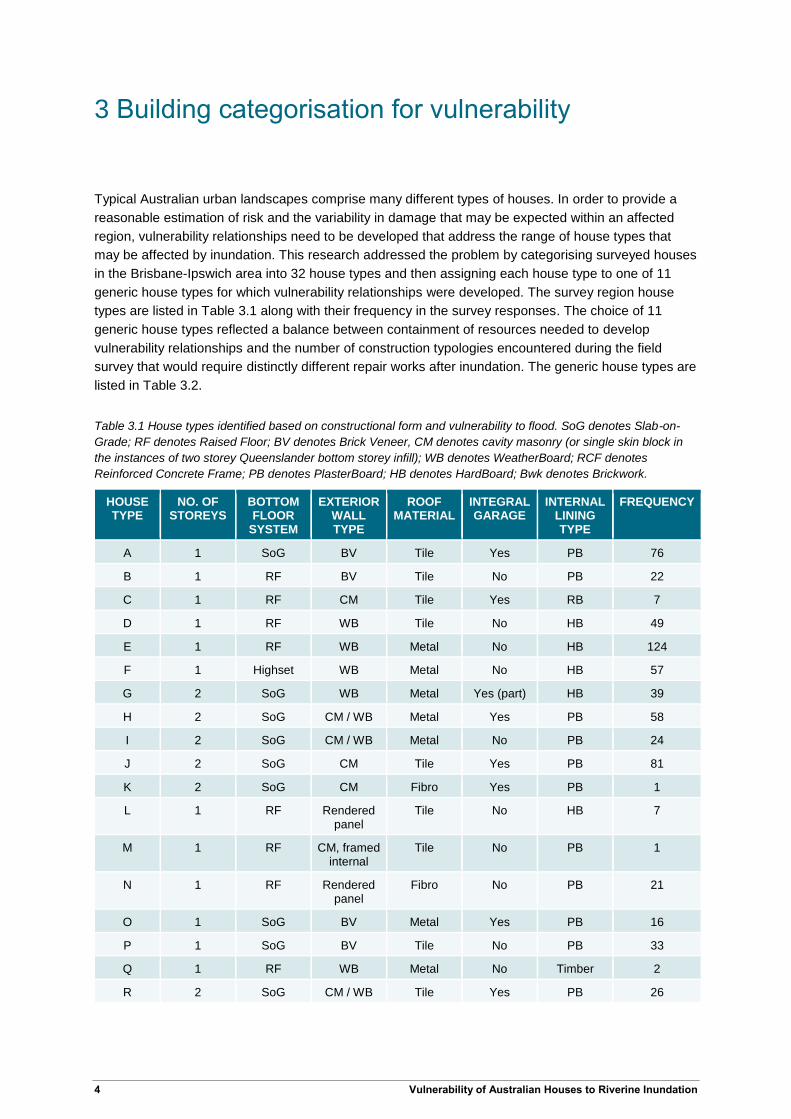
Typical Australian urban landscapes comprise many different types of houses. In order to provide a
reasonable estimation of risk and the variability in damage that may be expected within an affected
region, vulnerability relationships need to be developed that address the range of house types that
may be affected by inundation. This research addressed the problem by categorising surveyed houses
in the Brisbane-Ipswich area into 32 house types and then assigning each house type to one of 11
generic house types for which vulnerability relationships were developed. The survey region house
types are listed in Table 3.1 along with their frequency in the survey responses. The choice of 11
generic house types reflected a balance between containment of resources needed to develop
vulnerability relationships and the number of construction typologies encountered during the field
survey that would require distinctly different repair works after inundation. The generic house types are
listed in Table 3.2.
Table 3.1 House types identified based on constructional form and vulnerability to flood. SoG denotes Slab-on-
Grade; RF denotes Raised Floor; BV denotes Brick Veneer, CM denotes cavity masonry (or single skin block in
the instances of two storey Queenslander bottom storey infill); WB denotes WeatherBoard; RCF denotes
Reinforced Concrete Frame; PB denotes PlasterBoard; HB denotes HardBoard; Bwk denotes Brickwork.
HOUSE TYPE
NO. OF STOREYS
BOTTOM FLOOR
SYSTEM
EXTERIOR WALL TYPE
ROOF MATERIAL
INTEGRAL GARAGE
INTERNAL LINING TYPE
FREQUENCY
A 1 SoG BV Tile Yes PB 76
B 1 RF BV Tile No PB 22
C 1 RF CM Tile Yes RB 7
D 1 RF WB Tile No HB 49
E 1 RF WB Metal No HB 124
F 1 Highset WB Metal No HB 57
G 2 SoG WB Metal Yes (part) HB 39
H 2 SoG CM / WB Metal Yes PB 58
I 2 SoG CM / WB Metal No PB 24
J 2 SoG CM Tile Yes PB 81
K 2 SoG CM Fibro Yes PB 1
L 1 RF Rendered panel
Tile No HB 7
M 1 RF CM, framed internal
Tile No PB 1
N 1 RF Rendered panel
Fibro No PB 21
O 1 SoG BV Metal Yes PB 16
P 1 SoG BV Tile No PB 33
Q 1 RF WB Metal No Timber 2
R 2 SoG CM / WB Tile Yes PB 26
Vulnerability of Australian Houses to Riverine Inundation 5
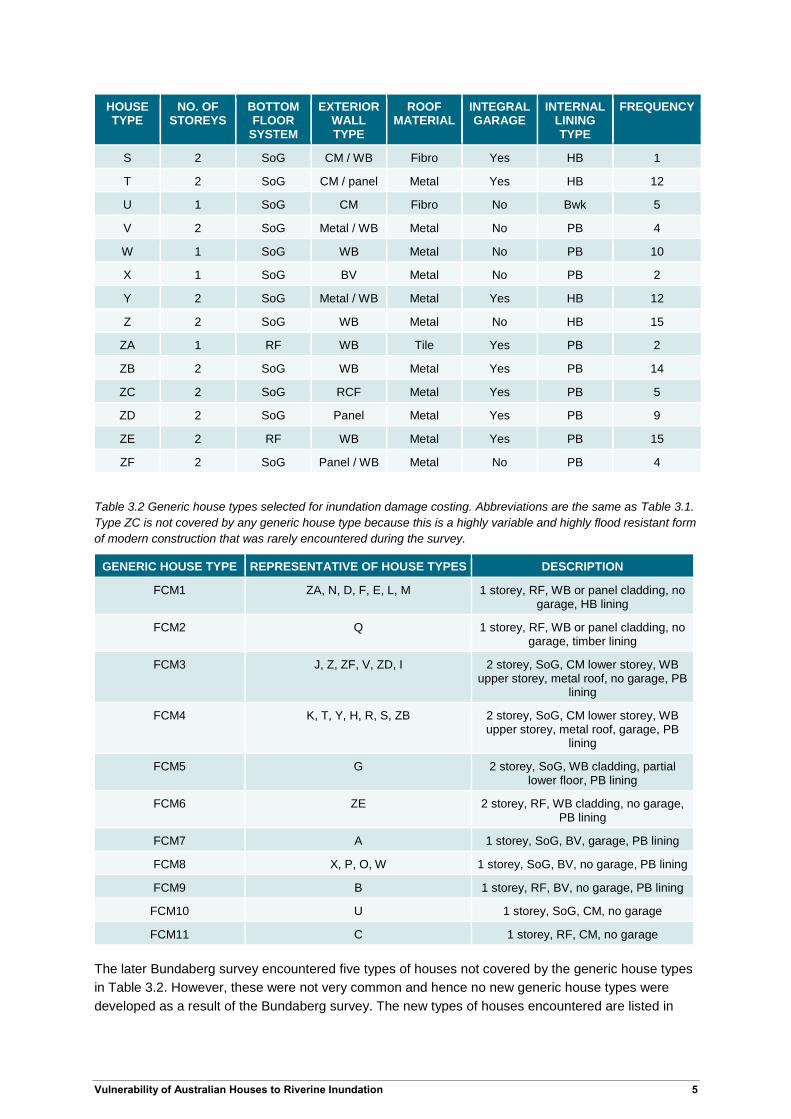
HOUSE TYPE
NO. OF STOREYS
BOTTOM FLOOR
SYSTEM
EXTERIOR WALL TYPE
ROOF MATERIAL
INTEGRAL GARAGE
INTERNAL LINING TYPE
FREQUENCY
S 2 SoG CM / WB Fibro Yes HB 1
T 2 SoG CM / panel Metal Yes HB 12
U 1 SoG CM Fibro No Bwk 5
V 2 SoG Metal / WB Metal No PB 4
W 1 SoG WB Metal No PB 10
X 1 SoG BV Metal No PB 2
Y 2 SoG Metal / WB Metal Yes HB 12
Z 2 SoG WB Metal No HB 15
ZA 1 RF WB Tile Yes PB 2
ZB 2 SoG WB Metal Yes PB 14
ZC 2 SoG RCF Metal Yes PB 5
ZD 2 SoG Panel Metal Yes PB 9
ZE 2 RF WB Metal Yes PB 15
ZF 2 SoG Panel / WB Metal No PB 4
Table 3.2 Generic house types selected for inundation damage costing. Abbreviations are the same as Table 3.1.
Type ZC is not covered by any generic house type because this is a highly variable and highly flood resistant form
of modern construction that was rarely encountered during the survey.
GENERIC HOUSE TYPE REPRESENTATIVE OF HOUSE TYPES DESCRIPTION
FCM1 ZA, N, D, F, E, L, M 1 storey, RF, WB or panel cladding, no garage, HB lining
FCM2 Q 1 storey, RF, WB or panel cladding, no garage, timber lining
FCM3 J, Z, ZF, V, ZD, I 2 storey, SoG, CM lower storey, WB upper storey, metal roof, no garage, PB
lining
FCM4 K, T, Y, H, R, S, ZB 2 storey, SoG, CM lower storey, WB upper storey, metal roof, garage, PB
lining
FCM5 G 2 storey, SoG, WB cladding, partial lower floor, PB lining
FCM6 ZE 2 storey, RF, WB cladding, no garage, PB lining
FCM7 A 1 storey, SoG, BV, garage, PB lining
FCM8 X, P, O, W 1 storey, SoG, BV, no garage, PB lining
FCM9 B 1 storey, RF, BV, no garage, PB lining
FCM10 U 1 storey, SoG, CM, no garage
FCM11 C 1 storey, RF, CM, no garage
The later Bundaberg survey encountered five types of houses not covered by the generic house types
in Table 3.2. However, these were not very common and hence no new generic house types were
developed as a result of the Bundaberg survey. The new types of houses encountered are listed in
6 Vulnerability of Australian Houses to Riverine Inundation
Table 3.3. The Bundaberg survey form contained more questions relating to the nature of the
construction of the respondent’s house than the Brisbane-Ipswich survey form. The additional
exposure data obtained improved the classification of dwellings into the generic house types.
Table 3.3 House types encountered in Bundaberg that differed from the eleven generic house types developed
from the Brisbane-Ipswich surveys. Abbreviations as for Table 3.1.
HOUSE TYPE
NO. OF STOREYS
BOTTOM FLOOR
SYSTEM
EXTERIOR WALL TYPE
ROOF MATERIAL
INTEGRAL GARAGE
INTERNAL LINING TYPE
FREQUENCY
BB1 2 SoG BV / BV Tile Yes PB 4
BB2 1 SoG WB Metal Yes PB 11
BB3 2 SoG WB / WB Metal Yes PB 17
BB4 2 SoG CM / BV Tile Yes Bwk / PB 3
BB5 2 RF BV / BV Tile No PB 3
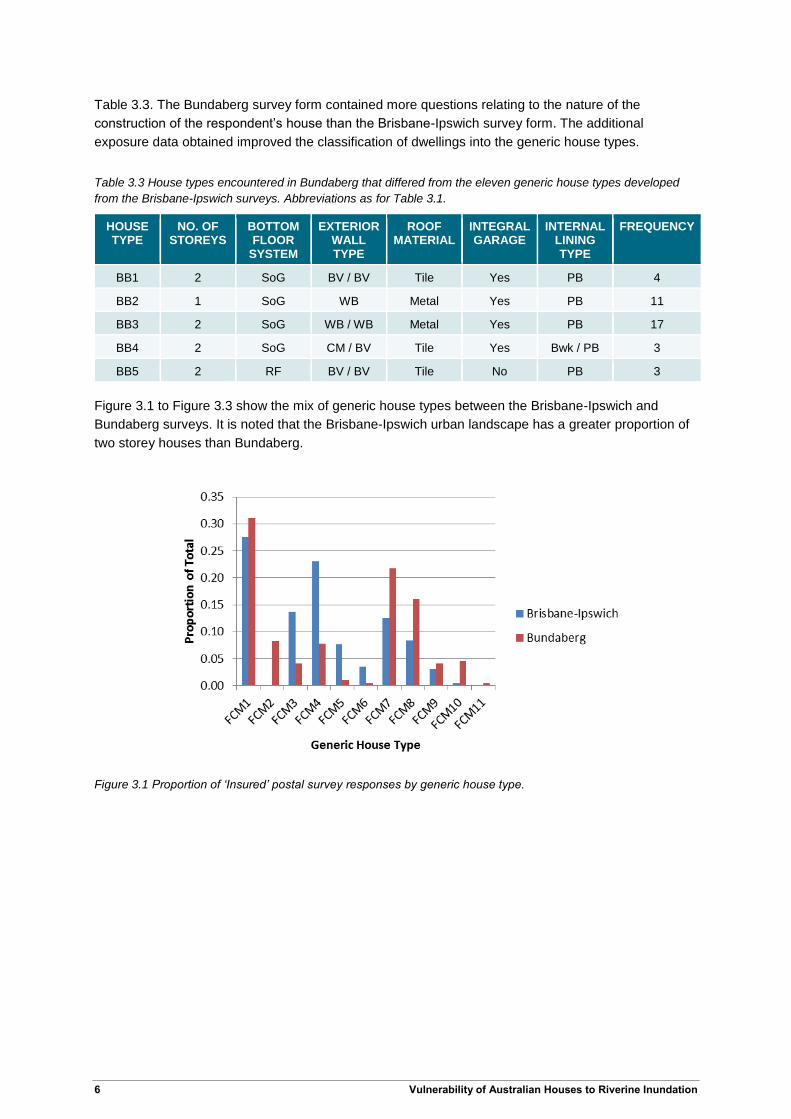
Figure 3.1 to Figure 3.3 show the mix of generic house types between the Brisbane-Ipswich and
Bundaberg surveys. It is noted that the Brisbane-Ipswich urban landscape has a greater proportion of
two storey houses than Bundaberg.
Figure 3.1 Proportion of ‘Insured’ postal survey responses by generic house type.
Vulnerability of Australian Houses to Riverine Inundation 7
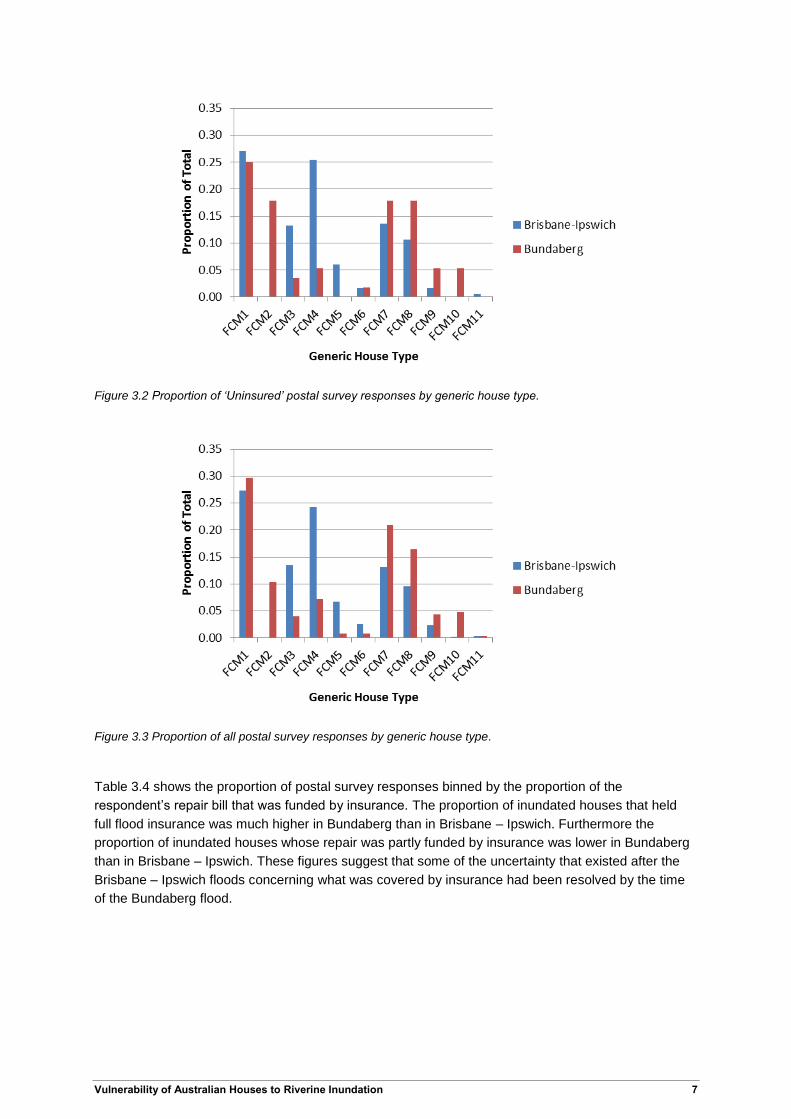
Figure 3.2 Proportion of ‘Uninsured’ postal survey responses by generic house type.
Figure 3.3 Proportion of all postal survey responses by generic house type.
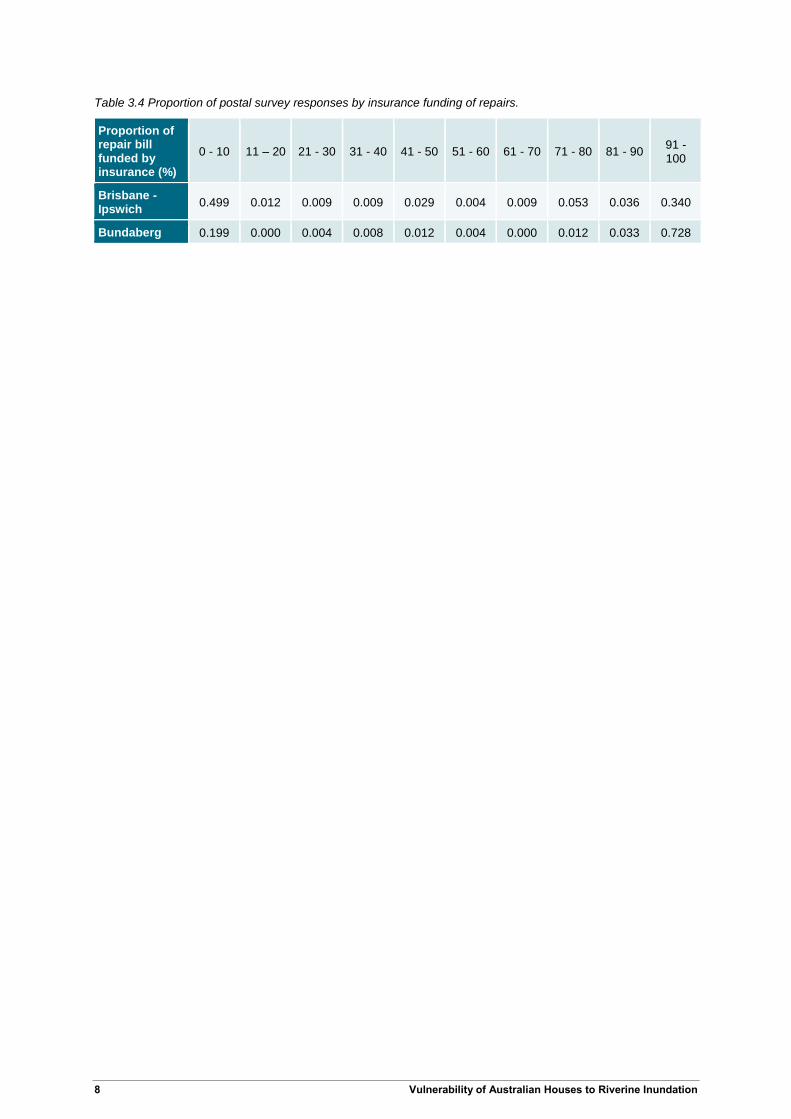
Table 3.4 shows the proportion of postal survey responses binned by the proportion of the
respondent’s repair bill that was funded by insurance. The proportion of inundated houses that held
full flood insurance was much higher in Bundaberg than in Brisbane – Ipswich. Furthermore the
proportion of inundated houses whose repair was partly funded by insurance was lower in Bundaberg
than in Brisbane – Ipswich. These figures suggest that some of the uncertainty that existed after the
Brisbane – Ipswich floods concerning what was covered by insurance had been resolved by the time
of the Bundaberg flood.
8 Vulnerability of Australian Houses to Riverine Inundation
Table 3.4 Proportion of postal survey responses by insurance funding of repairs.
Proportion of repair bill funded by insurance (%)
0 - 10 11 – 20 21 - 30 31 - 40 41 - 50 51 - 60 61 - 70 71 - 80 81 - 90 91 - 100
Brisbane - Ipswich
0.499 0.012 0.009 0.009 0.029 0.004 0.009 0.053 0.036 0.340
Bundaberg 0.199 0.000 0.004 0.008 0.012 0.004 0.000 0.012 0.033 0.728
Vulnerability of Australian Houses to Riverine Inundation 9
4 Analytical development of vulnerability curves
For each generic house type, detailed plans of an example house were prepared and the building
fabric was divided into components such as substructure, floor covering, light switches, window
dressing, ceilings, etc. The number of components per house varied from 62 to 107 depending on the
generic house type. For each component of each generic house type, at each of ten inundation
depths, repair work was identified. Costing was then based on a detailed break-down of building work.
Different repair strategies were identified for when the house was insured and for when it was not, to
capture the difference in the behaviour of uninsured owners attempting to minimise reparation costs. A
total of 15,980 individual repairs that required costing were identified. Some of the repairs were ‘Nil’
when a particular inundation depth did not affect a particular component and others were duplicates of
that required for shallower depths of inundation. Once a component had been inundated, the required
repair tended to remain the same for deeper depths of inundation. An example of repair specifications
for one generic house type is provided in Appendix E.
4.1 Specification of repair work to components
The development of repair strategies for a particular component / inundation depth / insurance
combination was informed by a literature review (Growth Management Queensland, 2011;
Hawkesbury-Nepean Floodplain Management Steering Committee, 2006; Queensland Government
Natural Resources and Mines, 2002; Timber Queensland, 2011), by observations made during the
post-flood surveys and the engineering experience of the authors. All the repair strategies assumed
that efforts are made to expose the wetted structure to drying soon after the water had receded. This
is broadly representative of the actions observed during post-flood field survey activity. Hence no
requirement for replacement of structural timber has been included in the repair strategies.
4.2 Insurance regimes
For each generic house type two insurance regimes were considered as referred to earlier:
1. Fully insured where it is assumed that the owner’s insurance covers full repair of all items to an as-
new condition either through cleaning and reinstatement or removal and replacement.
2. Uninsured where it is assumed that the owner undertakes minor works such as cleaning and
accepts non-repair of some items with minor damage in order to constrain the repair costs to a
minimum.
In practice the analytical vulnerability curves for the two insurance regimes for a single generic house
type show only a small difference as flooding renders most components unusable and requiring
replacement whether insured or not, for example, plasterboard, electrical equipment and cabinetry.
4.3 Scale of repair
The scale of repair work to each component reflected the extent of work required to repair the damage
caused by the level of inundation under consideration. This was not necessarily limited to the wetted
10 Vulnerability of Australian Houses to Riverine Inundation
portion. For example, half the height of wall lining requires replacement for inundation depths ranging
from 0.1m to 1.2m and at greater depths the full height of wall lining requires replacement.
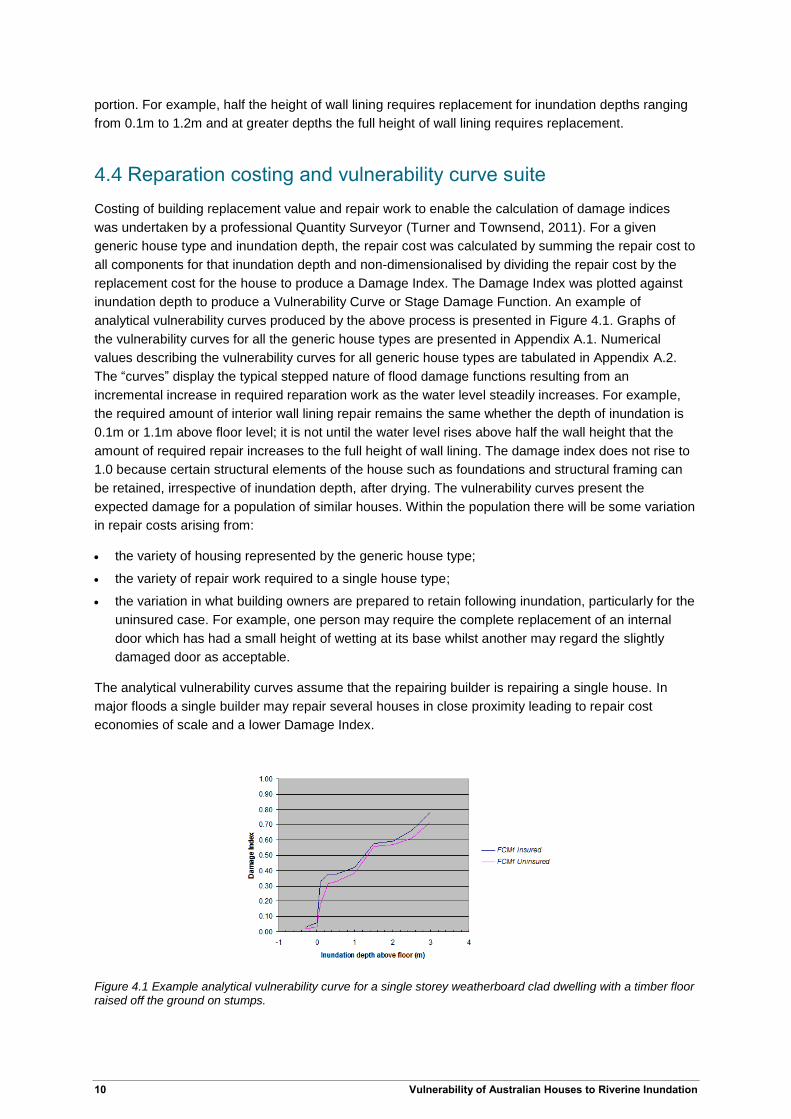
4.4 Reparation costing and vulnerability curve suite
Costing of building replacement value and repair work to enable the calculation of damage indices
was undertaken by a professional Quantity Surveyor (Turner and Townsend, 2011). For a given
generic house type and inundation depth, the repair cost was calculated by summing the repair cost to
all components for that inundation depth and non-dimensionalised by dividing the repair cost by the
replacement cost for the house to produce a Damage Index. The Damage Index was plotted against
inundation depth to produce a Vulnerability Curve or Stage Damage Function. An example of
analytical vulnerability curves produced by the above process is presented in Figure 4.1. Graphs of
the vulnerability curves for all the generic house types are presented in Appendix A.1. Numerical
values describing the vulnerability curves for all generic house types are tabulated in Appendix A.2.
The “curves” display the typical stepped nature of flood damage functions resulting from an
incremental increase in required reparation work as the water level steadily increases. For example,
the required amount of interior wall lining repair remains the same whether the depth of inundation is
0.1m or 1.1m above floor level; it is not until the water level rises above half the wall height that the
amount of required repair increases to the full height of wall lining. The damage index does not rise to
1.0 because certain structural elements of the house such as foundations and structural framing can
be retained, irrespective of inundation depth, after drying. The vulnerability curves present the
expected damage for a population of similar houses. Within the population there will be some variation
in repair costs arising from:
the variety of housing represented by the generic house type;
the variety of repair work required to a single house type;
the variation in what building owners are prepared to retain following inundation, particularly for the
uninsured case. For example, one person may require the complete replacement of an internal
door which has had a small height of wetting at its base whilst another may regard the slightly
damaged door as acceptable.
The analytical vulnerability curves assume that the repairing builder is repairing a single house. In
major floods a single builder may repair several houses in close proximity leading to repair cost
economies of scale and a lower Damage Index.
Figure 4.1 Example analytical vulnerability curve for a single storey weatherboard clad dwelling with a timber floor raised off the ground on stumps.
Vulnerability of Australian Houses to Riverine Inundation 11
5 Development of empirical vulnerability curves
Empirical damage indices were derived from data gathered via postal surveys of flood affected
dwellings. Amongst many other questions, the surveys requested home owners to nominate the depth
of inundation within their home, the cost to repair the flood damage to the building fabric and the
source of repair funds.
For homes from which a postal survey return was received, the house was assigned to a generic
house type based on aerial and street view imagery and, in the case of the Bundaberg survey,
responses to questions about the nature of the respondent’s dwelling construction. Some returns were
not useful for the analysis due to missing data or an inability to assign a generic house type. The
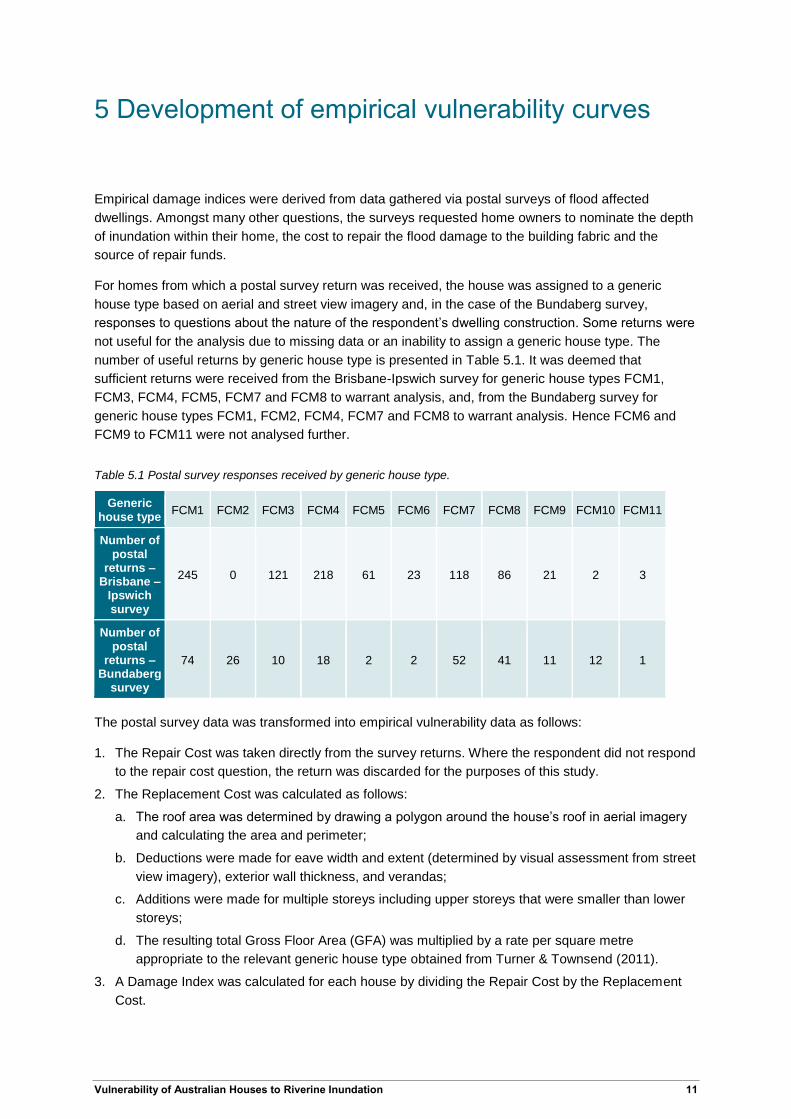
number of useful returns by generic house type is presented in Table 5.1. It was deemed that
sufficient returns were received from the Brisbane-Ipswich survey for generic house types FCM1,
FCM3, FCM4, FCM5, FCM7 and FCM8 to warrant analysis, and, from the Bundaberg survey for
generic house types FCM1, FCM2, FCM4, FCM7 and FCM8 to warrant analysis. Hence FCM6 and
FCM9 to FCM11 were not analysed further.
Table 5.1 Postal survey responses received by generic house type.
Generic house type
FCM1 FCM2 FCM3 FCM4 FCM5 FCM6 FCM7 FCM8 FCM9 FCM10 FCM11
Number of postal
returns – Brisbane –
Ipswich survey
245 0 121 218 61 23 118 86 21 2 3
Number of postal
returns – Bundaberg
survey
74 26 10 18 2 2 52 41 11 12 1
The postal survey data was transformed into empirical vulnerability data as follows:
1. The Repair Cost was taken directly from the survey returns. Where the respondent did not respond
to the repair cost question, the return was discarded for the purposes of this study.
2. The Replacement Cost was calculated as follows:
a. The roof area was determined by drawing a polygon around the house’s roof in aerial imagery
and calculating the area and perimeter;
b. Deductions were made for eave width and extent (determined by visual assessment from street
view imagery), exterior wall thickness, and verandas;
c. Additions were made for multiple storeys including upper storeys that were smaller than lower
storeys;
d. The resulting total Gross Floor Area (GFA) was multiplied by a rate per square metre
appropriate to the relevant generic house type obtained from Turner & Townsend (2011).
3. A Damage Index was calculated for each house by dividing the Repair Cost by the Replacement
Cost.
12 Vulnerability of Australian Houses to Riverine Inundation
4. Each home was flagged as ‘Insured’ or’ Uninsured’ based on the proportion of repair cost that was
sourced from insurance: greater than 50% sourced from insurance was deemed ‘Insured’,
otherwise the house was deemed ‘Uninsured’.
5. The resulting data was plotted against inundation depth above floor level.
Note that by this methodology it is possible to obtain damage indices greater than unity. This is
interpreted as a misinterpretation of the Replacement Cost due to one or more of the following causes:
Physical nature of the house changing between the date of the aerial imagery used for determining
the house plan area and the time of the flood. The house may have been extended or replaced
with a larger house leading to an underestimate of the GFA and hence replacement cost;
Use of an inappropriate replacement rate to calculate the replacement cost. The replacement rates
provided by Turner and Townsend (2011) are for medium standard of internal finish. Thus if they
are applied to a house with a basic standard or a prestige standard of internal finish the
replacement cost will be over or underestimated respectively.
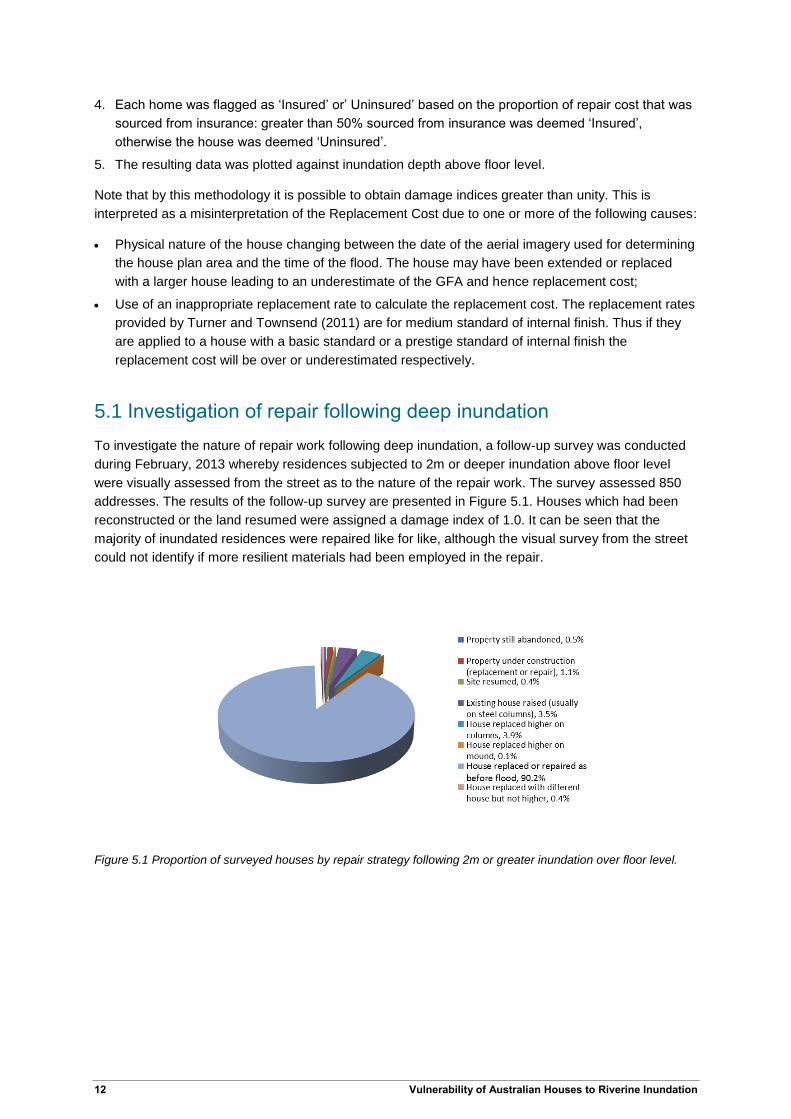
5.1 Investigation of repair following deep inundation
To investigate the nature of repair work following deep inundation, a follow-up survey was conducted
during February, 2013 whereby residences subjected to 2m or deeper inundation above floor level
were visually assessed from the street as to the nature of the repair work. The survey assessed 850
addresses. The results of the follow-up survey are presented in Figure 5.1. Houses which had been
reconstructed or the land resumed were assigned a damage index of 1.0. It can be seen that the
majority of inundated residences were repaired like for like, although the visual survey from the street
could not identify if more resilient materials had been employed in the repair.
Figure 5.1 Proportion of surveyed houses by repair strategy following 2m or greater inundation over floor level.

Vulnerability of Australian Houses to Riverine Inundation 13
6 Results
Results from the Brisbane-Ipswich and Bundaberg postal surveys are presented in Appendix B and
Appendix C respectively. For each generic house type for which sufficient results were obtained to
warrant analysis, results were binned into one of ten inundation depth bins. For each survey the
following results are presented for the generic house types where sufficient returns were received to
warrant analysis:
empirical vulnerability curves consisting of average damage index at each inundation depth bin;
scatter plots of calculated damage index against inundation depth;
box plots describing the variability of damage index against inundation depth by bin;
numerical descriptors defining the box plots.
Statistical analysis indicated that the Brisbane-Ipswich and Bundaberg postal survey results were
obtained from similar populations. Hence the results from both postal surveys were combined and re-
analysed. The empirical vulnerability data for the combined survey results are presented in Appendix
D.
14 Vulnerability of Australian Houses to Riverine Inundation
7 Discussion
The large scatter of results within a generic house type is expected of flood vulnerability. This may be
due to:
a generic house type representing an array of different, although broadly similar, houses;
a range of repairs undertaken for similar inundation depths. This is particularly so for the uninsured
case where households did not have sufficient resources to undertake full repair work. This is
qualitatively evidenced by some of the postal survey responses where households have reported
living in incompletely repaired dwellings, or in a number of instances, are still living away from
damaged houses;
a range of internal finish and fit-out qualities within a single generic house type.
The box plots give some guidance to the range of damage indices that may be expected when
modelling flood risk and impact.
Typically the analytical vulnerability curve for the uninsured single storey generic house types
overestimates the damage index compared to the empirical data. This may indicate that the level of
damage which an uninsured house owner may deem acceptable for occupation was underestimated
during the process of constructing the analytical vulnerability curves. It may also indicate repairs
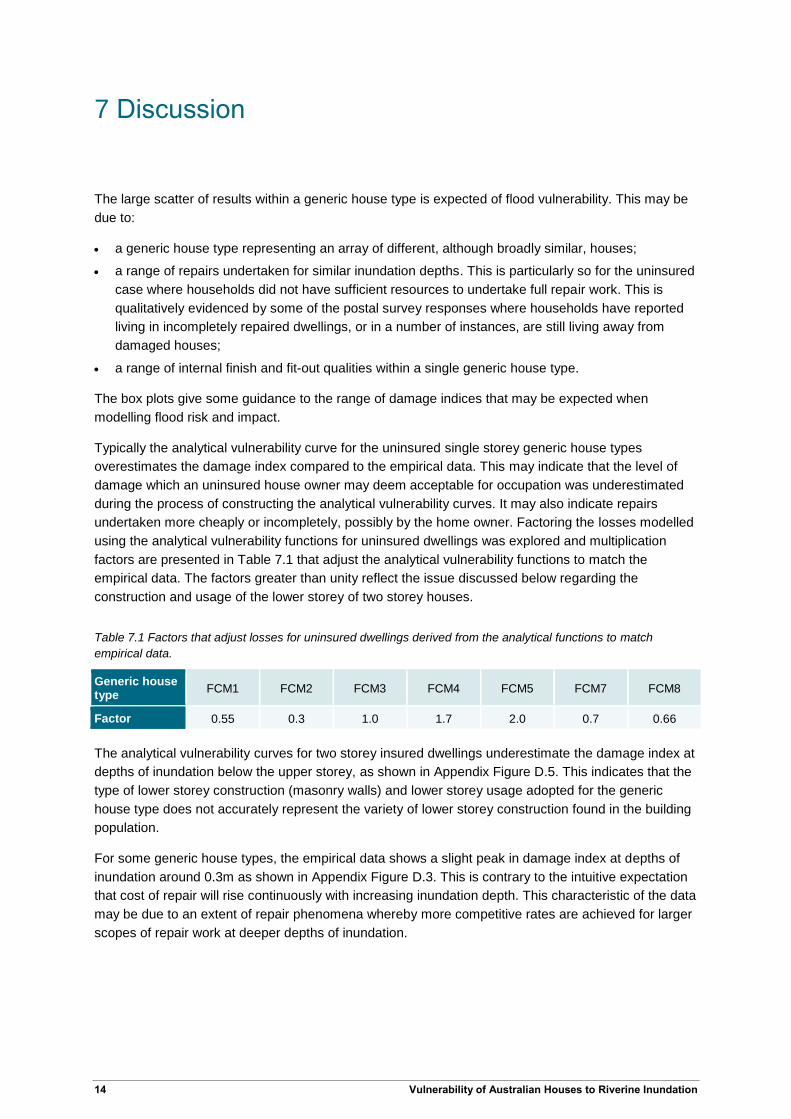
undertaken more cheaply or incompletely, possibly by the home owner. Factoring the losses modelled
using the analytical vulnerability functions for uninsured dwellings was explored and multiplication
factors are presented in Table 7.1 that adjust the analytical vulnerability functions to match the
empirical data. The factors greater than unity reflect the issue discussed below regarding the
construction and usage of the lower storey of two storey houses.
Table 7.1 Factors that adjust losses for uninsured dwellings derived from the analytical functions to match
empirical data.
Generic house type
FCM1 FCM2 FCM3 FCM4 FCM5 FCM7 FCM8
Factor 0.55 0.3 1.0 1.7 2.0 0.7 0.66
The analytical vulnerability curves for two storey insured dwellings underestimate the damage index at
depths of inundation below the upper storey, as shown in Appendix Figure D.5. This indicates that the
type of lower storey construction (masonry walls) and lower storey usage adopted for the generic
house type does not accurately represent the variety of lower storey construction found in the building
population.
For some generic house types, the empirical data shows a slight peak in damage index at depths of
inundation around 0.3m as shown in Appendix Figure D.3. This is contrary to the intuitive expectation
that cost of repair will rise continuously with increasing inundation depth. This characteristic of the data
may be due to an extent of repair phenomena whereby more competitive rates are achieved for larger
scopes of repair work at deeper depths of inundation.
Vulnerability of Australian Houses to Riverine Inundation 15
8 Conclusions
Analytical vulnerability curves are presented for eleven generic house types representative of housing
stock in south-east Queensland. Curves for seven of the generic house types are compared to
empirical values obtained from postal survey data. Although the results display a variability, the
empirical data indicates that the presented analytical methodology for constructing vulnerability curves
yields reasonable curves for insured dwellings that would be suitable for modelling the impact of
riverine flooding on the built environment. Adjustment is required to modelled losses for uninsured
dwellings to modify the analytical vulnerability functions to more closely match the empirical data. The
adjustment factor for each generic house type varied between 0.3 and 2.0 thereby highlighting the
challenge of establishing a general approach for doing so.

16 Vulnerability of Australian Houses to Riverine Inundation
Acknowledgements
The authors acknowledge the generosity of the residents of Brisbane, Ipswich and the Bundaberg
region who made their time available to answer questions during the surveys and, on occasion,
permitted access into their homes.
The authors acknowledge the collaborative contributions of the National Institute for Water and
Atmospheric Science in New Zealand for their field survey support following the Brisbane floods.
Vulnerability of Australian Houses to Riverine Inundation 17
References
Canterford, S., Juskevics, V., Middelmann-Fernandes, M., Wehner, M. and Oh, W., 2016. Household
experiences of flooding in Brisbane and Ipswich, Queensland. Record 2016/30. Geoscience
Australia, Canberra. http://dx.doi.org/10.11636/Record.2016.030
Canterford, S. and Juskevics, V., in prep. Impact of the January 2013 flood on Bundaberg’s
households and businesses. Geoscience Australia, Canberra.
Dale, K., Edwards, M., Middelmann, M. and Zoppou, C., 2004. Structural flood vulnerability and the
Australianisation of Black’s curves. Proc. Risk 2004 Conference, Risk Engineering Society,
Melbourne, Australia.
Growth Management Queensland, 2011. Repairing your house after a flood.
Hawkesbury-Nepean Floodplain Management Steering Committee, 2006. Reducing Vulnerability of
Buildings to Flood Damage.
Maqsood, T., Wehner, M., Ryu, H., Edwards, M., Dale, K. and Miller, V.. 2014. GAR15 Vulnerability
Functions: Reporting on the UNISDR/GA SE Asian Regional Workshop on Structural Vulnerability
Models for the GAR Global Risk Assessment, 11-14 November, 2013, Geoscience Australia,
Canberra, Australia. Record 2014/38. Geoscience Australia. Canberra.
http://dx.doi.org.11636/Record.2014.038
NSW Government, 2005. Floodplain Development Manual; the management of flood liable land.
NSW Government Department of Environment and Climate Change, 2007. Floodplain Risk
Management Guideline – Residential Flood Damages.
Queensland Government Natural Resources and Mines, 2002. Guidance on the Assessment of
Tangible Flood Damages.
Smith, D.I., 1994. Flood damage estimation – a review of urban stage damage curves and loss
functions. Water SA. 20(3), 231 – 238.
Timber Queensland, 2011. Guide to Assessment and Repair of Flood Damaged Timber and Timber
Framed Houses.
Turner & Townsend, 2011. Flood Damage Cost Module Development for Various Residential House
Types. Report prepared for Geoscience Australia
18 Vulnerability of Australian Houses to Riverine Inundation
Appendix A Analytical vulnerability curves
A.1 Graphs of analytical vulnerability curves
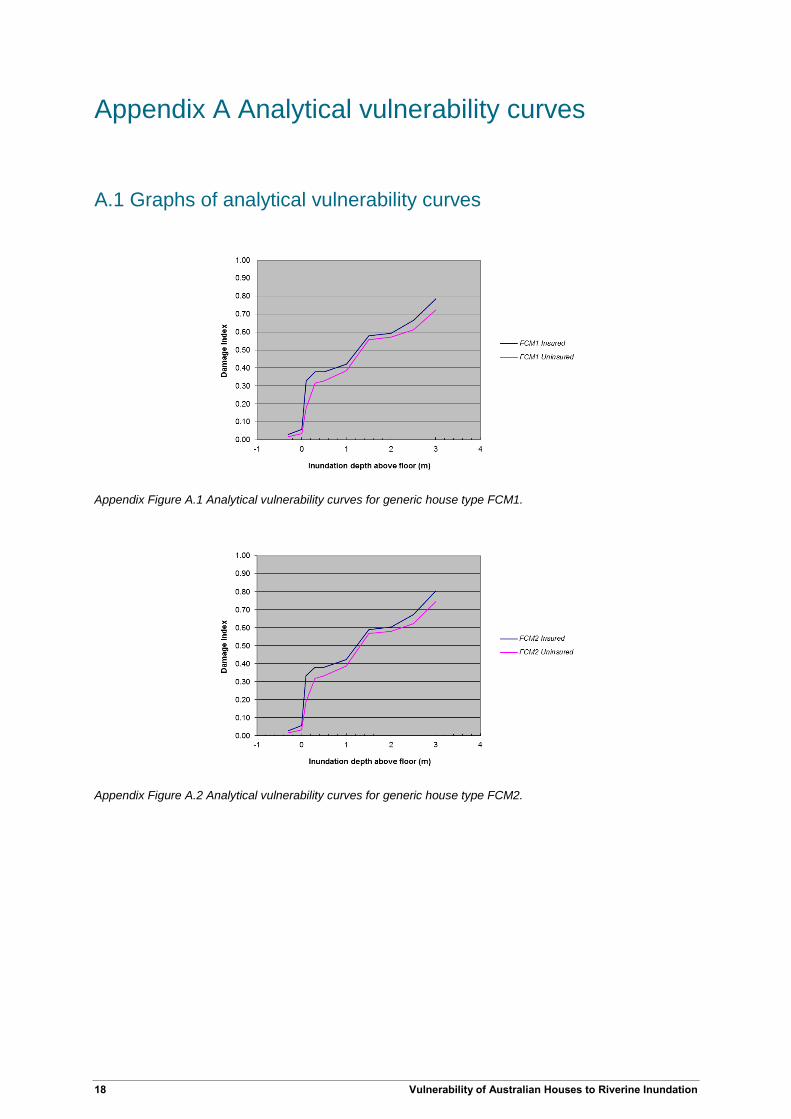
Appendix Figure A.1 Analytical vulnerability curves for generic house type FCM1.
Appendix Figure A.2 Analytical vulnerability curves for generic house type FCM2.
Vulnerability of Australian Houses to Riverine Inundation 19
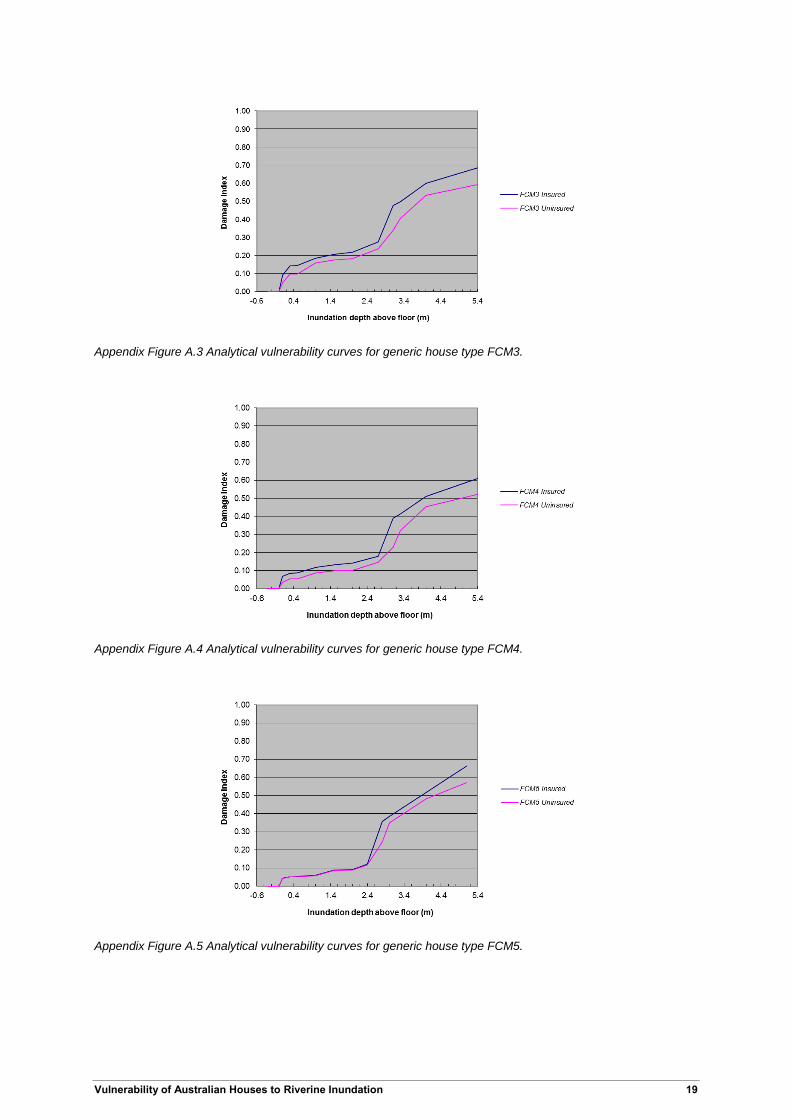
Appendix Figure A.3 Analytical vulnerability curves for generic house type FCM3.
Appendix Figure A.4 Analytical vulnerability curves for generic house type FCM4.
Appendix Figure A.5 Analytical vulnerability curves for generic house type FCM5.
20 Vulnerability of Australian Houses to Riverine Inundation
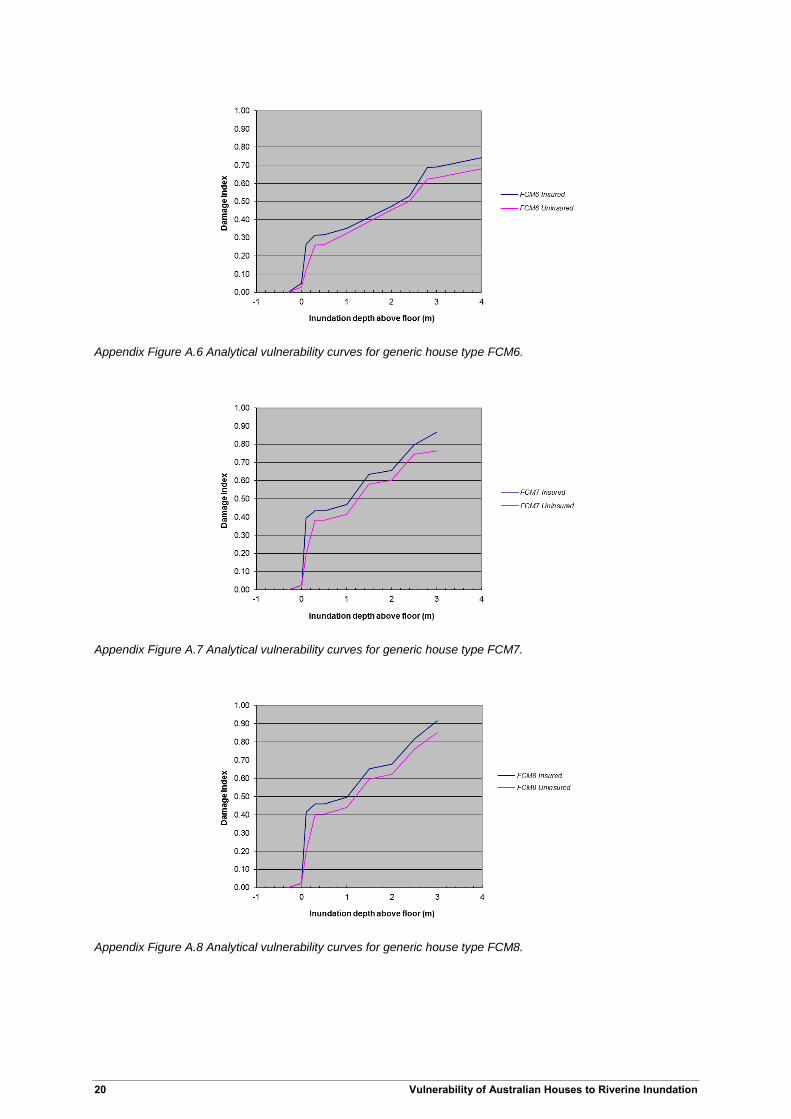
Appendix Figure A.6 Analytical vulnerability curves for generic house type FCM6.
Appendix Figure A.7 Analytical vulnerability curves for generic house type FCM7.
Appendix Figure A.8 Analytical vulnerability curves for generic house type FCM8.
Vulnerability of Australian Houses to Riverine Inundation 21
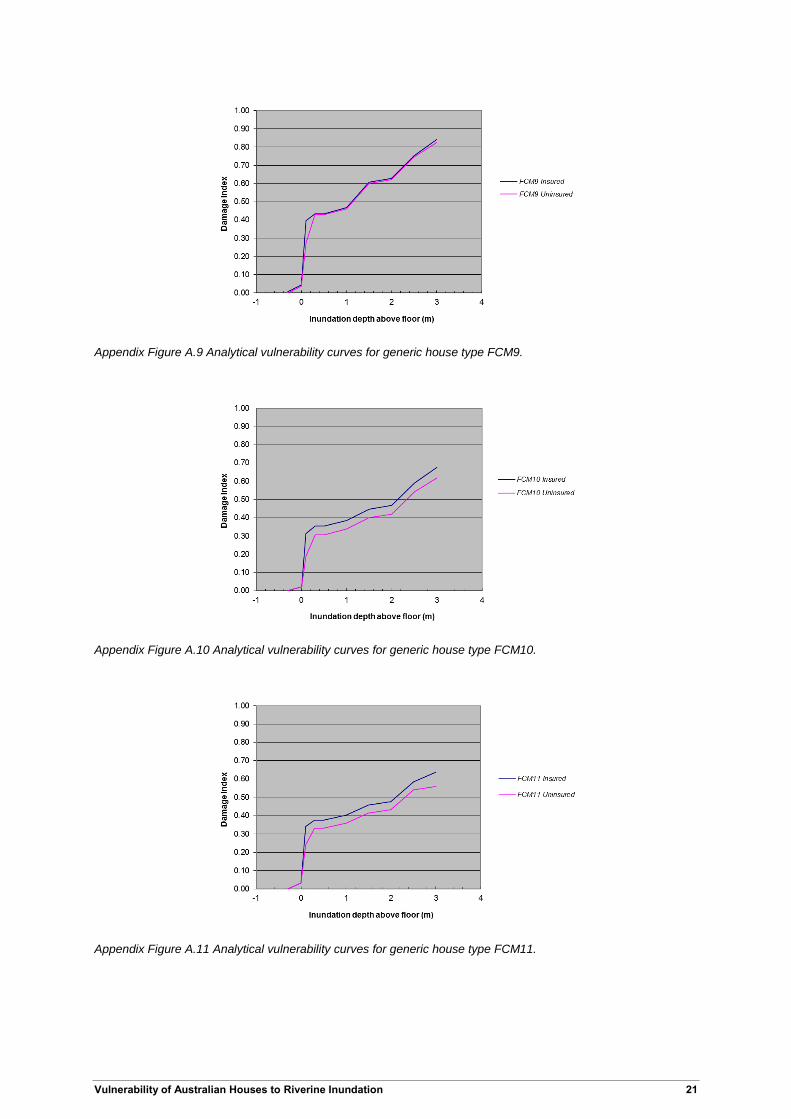
Appendix Figure A.9 Analytical vulnerability curves for generic house type FCM9.
Appendix Figure A.10 Analytical vulnerability curves for generic house type FCM10.
Appendix Figure A.11 Analytical vulnerability curves for generic house type FCM11.
22 Vulnerability of Australian Houses to Riverine Inundation
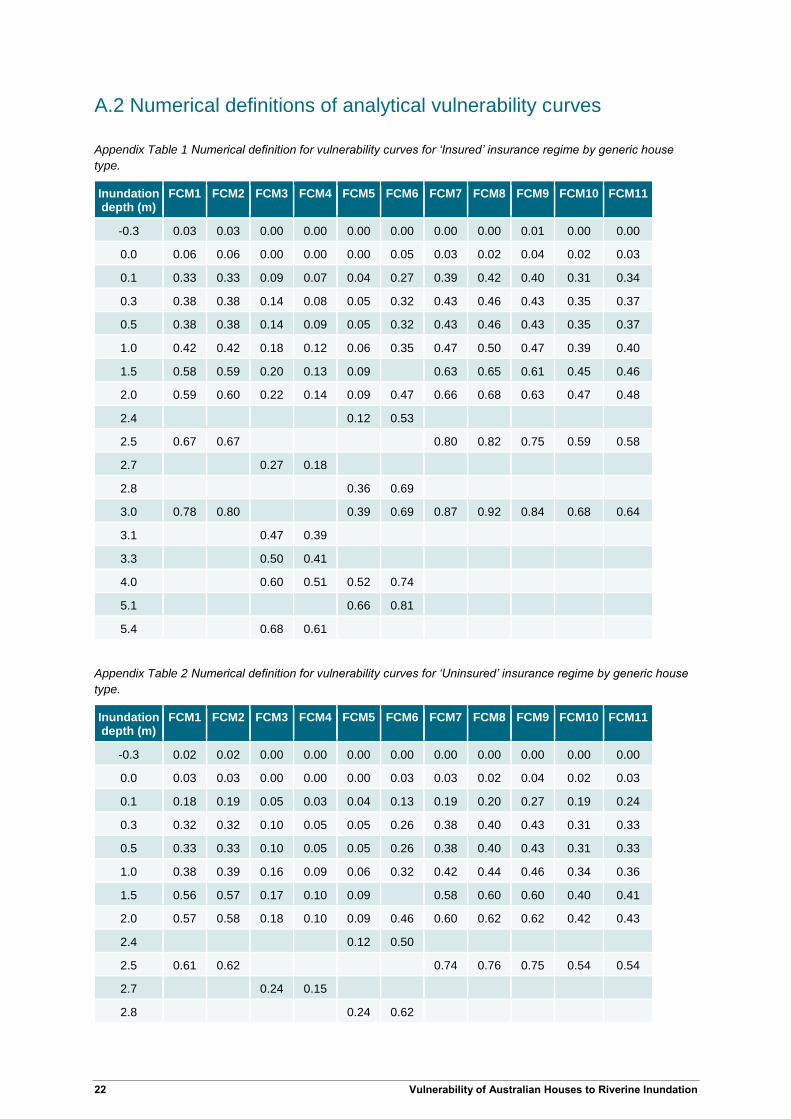
A.2 Numerical definitions of analytical vulnerability curves
Appendix Table 1 Numerical definition for vulnerability curves for ‘Insured’ insurance regime by generic house
type.
Inundation depth (m)
FCM1 FCM2 FCM3 FCM4 FCM5 FCM6 FCM7 FCM8 FCM9 FCM10 FCM11
-0.3 0.03 0.03 0.00 0.00 0.00 0.00 0.00 0.00 0.01 0.00 0.00
0.0 0.06 0.06 0.00 0.00 0.00 0.05 0.03 0.02 0.04 0.02 0.03
0.1 0.33 0.33 0.09 0.07 0.04 0.27 0.39 0.42 0.40 0.31 0.34
0.3 0.38 0.38 0.14 0.08 0.05 0.32 0.43 0.46 0.43 0.35 0.37
0.5 0.38 0.38 0.14 0.09 0.05 0.32 0.43 0.46 0.43 0.35 0.37
1.0 0.42 0.42 0.18 0.12 0.06 0.35 0.47 0.50 0.47 0.39 0.40
1.5 0.58 0.59 0.20 0.13 0.09 0.63 0.65 0.61 0.45 0.46
2.0 0.59 0.60 0.22 0.14 0.09 0.47 0.66 0.68 0.63 0.47 0.48
2.4 0.12 0.53
2.5 0.67 0.67 0.80 0.82 0.75 0.59 0.58
2.7 0.27 0.18
2.8 0.36 0.69
3.0 0.78 0.80 0.39 0.69 0.87 0.92 0.84 0.68 0.64
3.1 0.47 0.39
3.3 0.50 0.41
4.0 0.60 0.51 0.52 0.74
5.1 0.66 0.81
5.4 0.68 0.61
Appendix Table 2 Numerical definition for vulnerability curves for ‘Uninsured’ insurance regime by generic house
type.
Inundation depth (m)
FCM1 FCM2 FCM3 FCM4 FCM5 FCM6 FCM7 FCM8 FCM9 FCM10 FCM11
-0.3 0.02 0.02 0.00 0.00 0.00 0.00 0.00 0.00 0.00 0.00 0.00
0.0 0.03 0.03 0.00 0.00 0.00 0.03 0.03 0.02 0.04 0.02 0.03
0.1 0.18 0.19 0.05 0.03 0.04 0.13 0.19 0.20 0.27 0.19 0.24
0.3 0.32 0.32 0.10 0.05 0.05 0.26 0.38 0.40 0.43 0.31 0.33
0.5 0.33 0.33 0.10 0.05 0.05 0.26 0.38 0.40 0.43 0.31 0.33
1.0 0.38 0.39 0.16 0.09 0.06 0.32 0.42 0.44 0.46 0.34 0.36
1.5 0.56 0.57 0.17 0.10 0.09 0.58 0.60 0.60 0.40 0.41
2.0 0.57 0.58 0.18 0.10 0.09 0.46 0.60 0.62 0.62 0.42 0.43
2.4 0.12 0.50
2.5 0.61 0.62 0.74 0.76 0.75 0.54 0.54
2.7 0.24 0.15
2.8 0.24 0.62
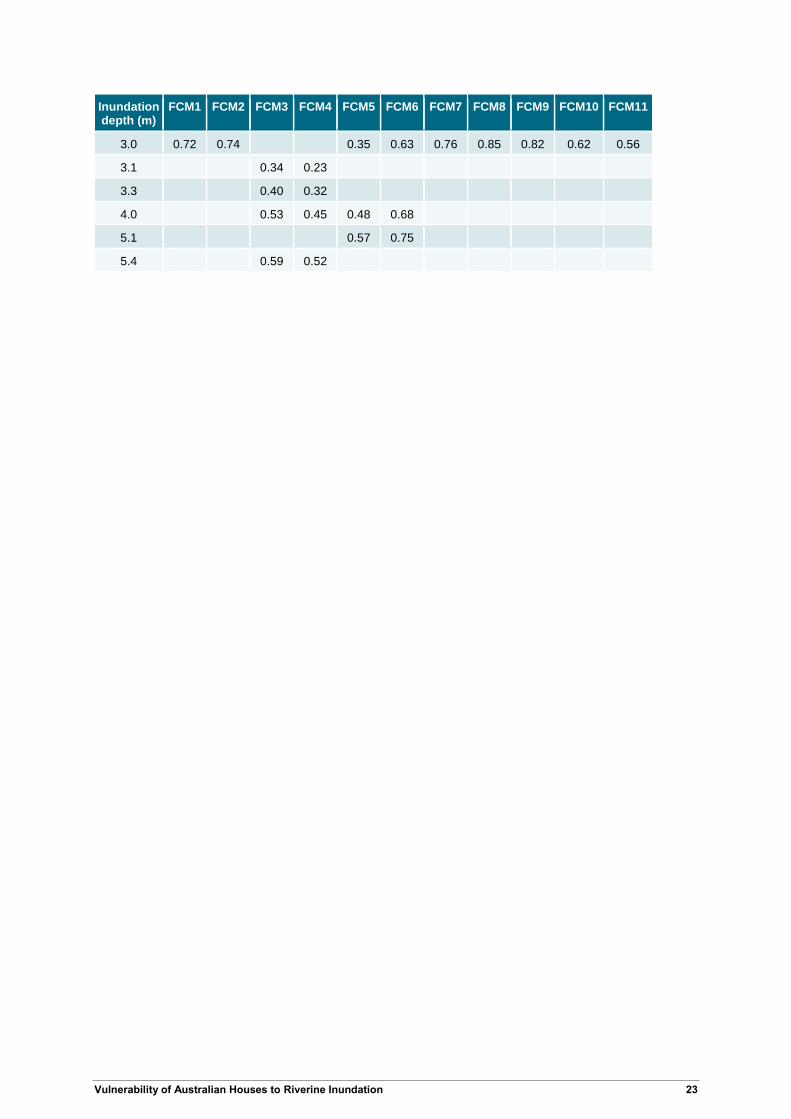
Vulnerability of Australian Houses to Riverine Inundation 23
Inundation depth (m)
FCM1 FCM2 FCM3 FCM4 FCM5 FCM6 FCM7 FCM8 FCM9 FCM10 FCM11
3.0 0.72 0.74 0.35 0.63 0.76 0.85 0.82 0.62 0.56
3.1 0.34 0.23
3.3 0.40 0.32
4.0 0.53 0.45 0.48 0.68
5.1 0.57 0.75
5.4 0.59 0.52
24 Vulnerability of Australian Houses to Riverine Inundation
Appendix B Empirical vulnerability curves derived from the Brisbane-Ipswich postal survey
B.1 Graphs of empirical vulnerability curves
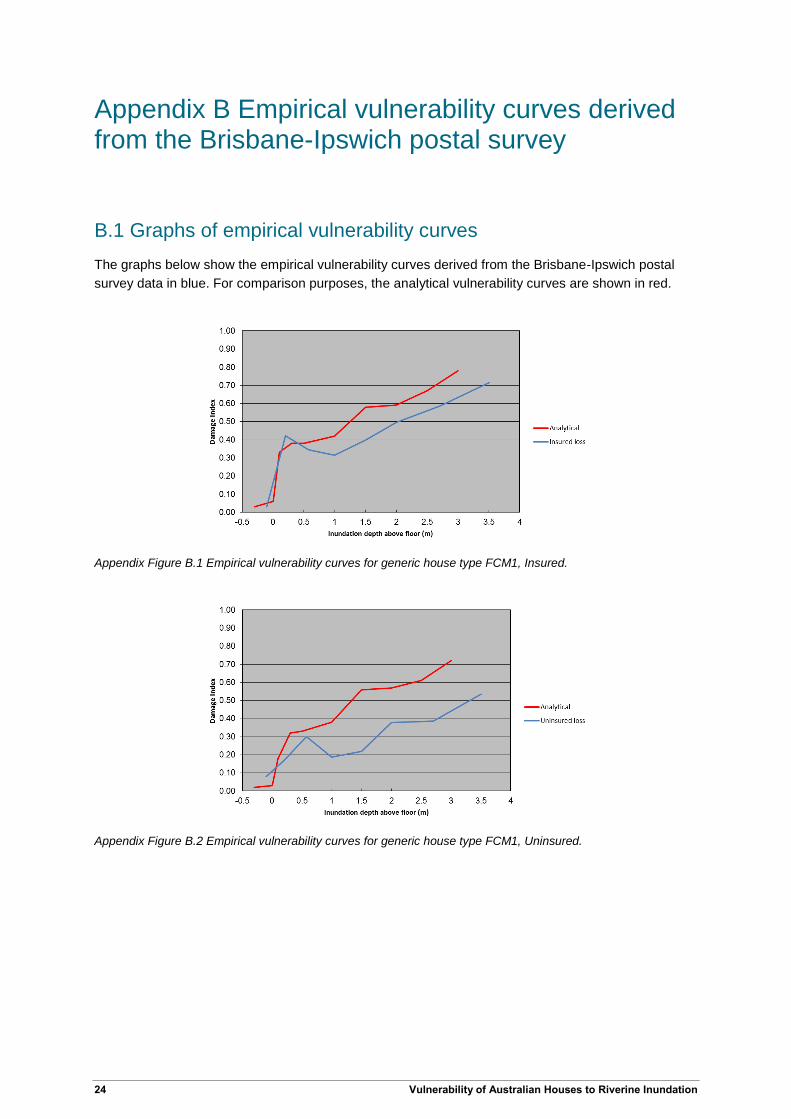
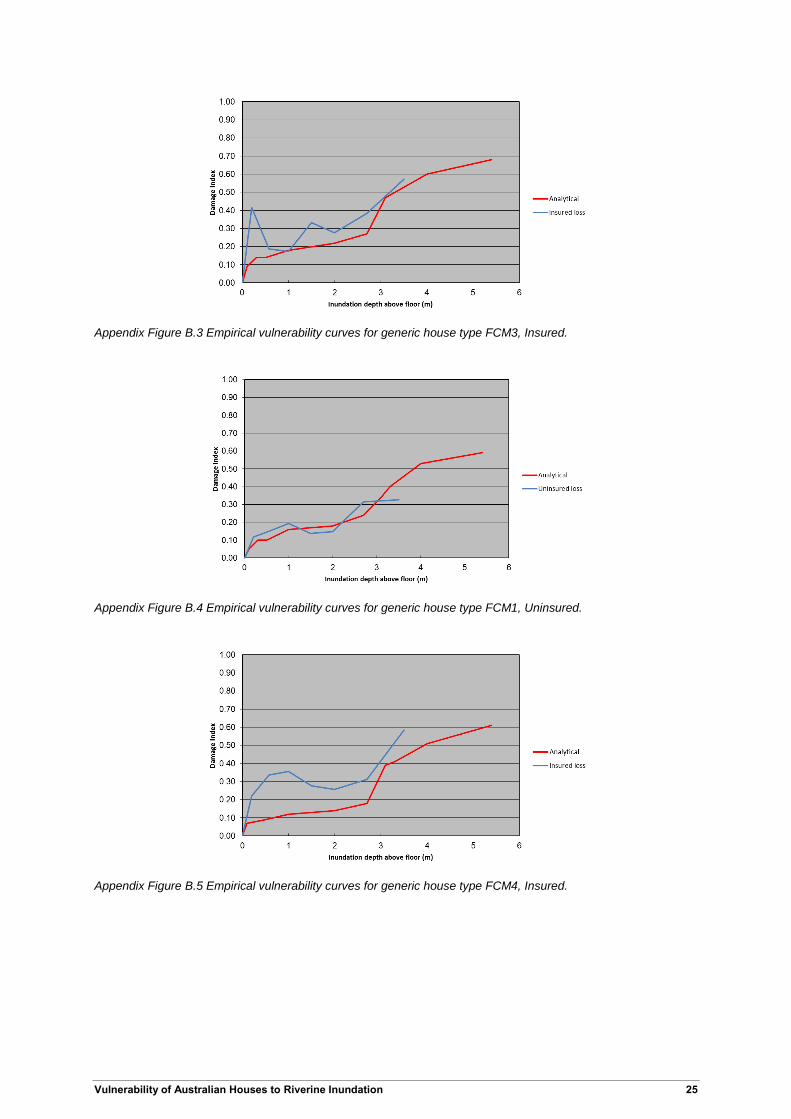
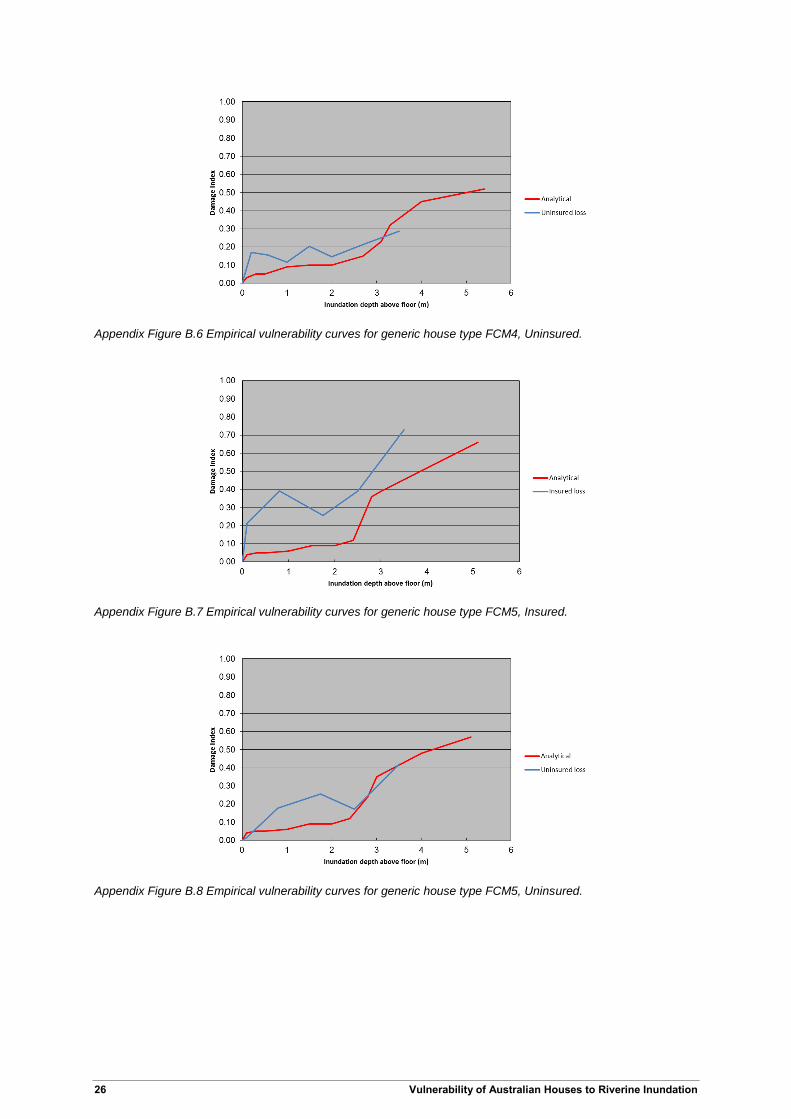
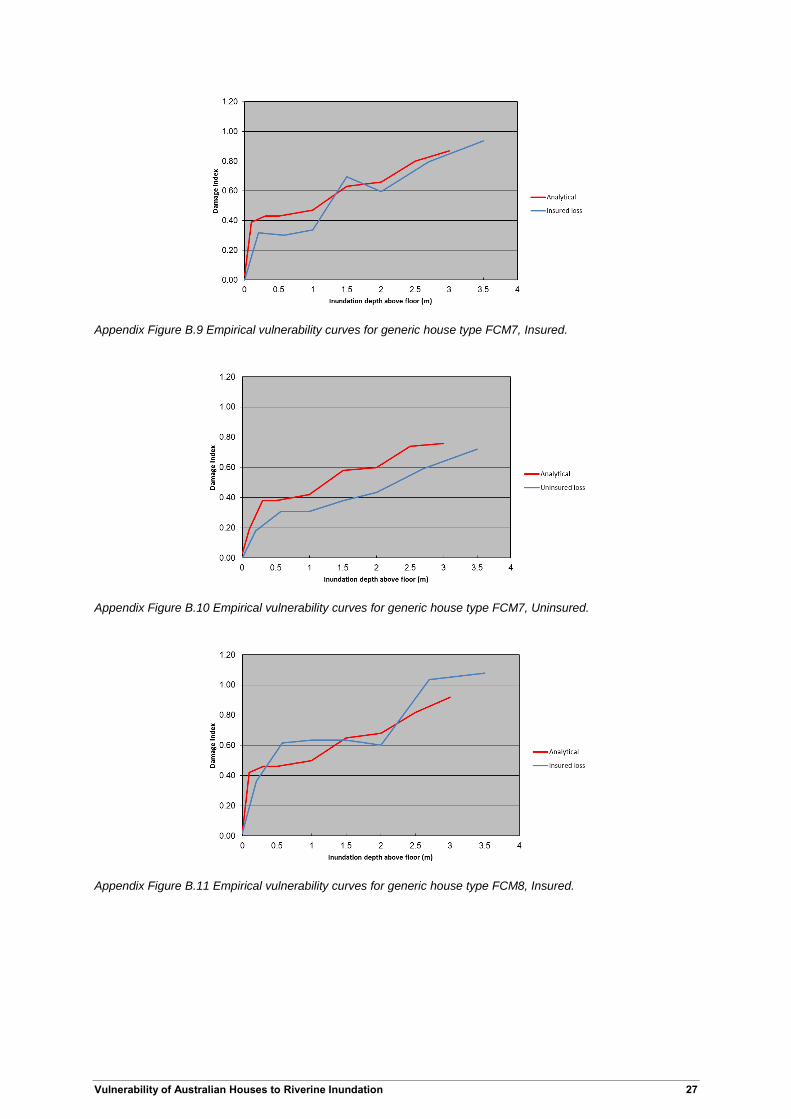
The graphs below show the empirical vulnerability curves derived from the Brisbane-Ipswich postal
survey data in blue. For comparison purposes, the analytical vulnerability curves are shown in red.
Appendix Figure B.1 Empirical vulnerability curves for generic house type FCM1, Insured.
Appendix Figure B.2 Empirical vulnerability curves for generic house type FCM1, Uninsured.
Vulnerability of Australian Houses to Riverine Inundation 25
Appendix Figure B.3 Empirical vulnerability curves for generic house type FCM3, Insured.
Appendix Figure B.4 Empirical vulnerability curves for generic house type FCM1, Uninsured.
Appendix Figure B.5 Empirical vulnerability curves for generic house type FCM4, Insured.
26 Vulnerability of Australian Houses to Riverine Inundation
Appendix Figure B.6 Empirical vulnerability curves for generic house type FCM4, Uninsured.
Appendix Figure B.7 Empirical vulnerability curves for generic house type FCM5, Insured.
Appendix Figure B.8 Empirical vulnerability curves for generic house type FCM5, Uninsured.
Vulnerability of Australian Houses to Riverine Inundation 27
Appendix Figure B.9 Empirical vulnerability curves for generic house type FCM7, Insured.
Appendix Figure B.10 Empirical vulnerability curves for generic house type FCM7, Uninsured.
Appendix Figure B.11 Empirical vulnerability curves for generic house type FCM8, Insured.
28 Vulnerability of Australian Houses to Riverine Inundation
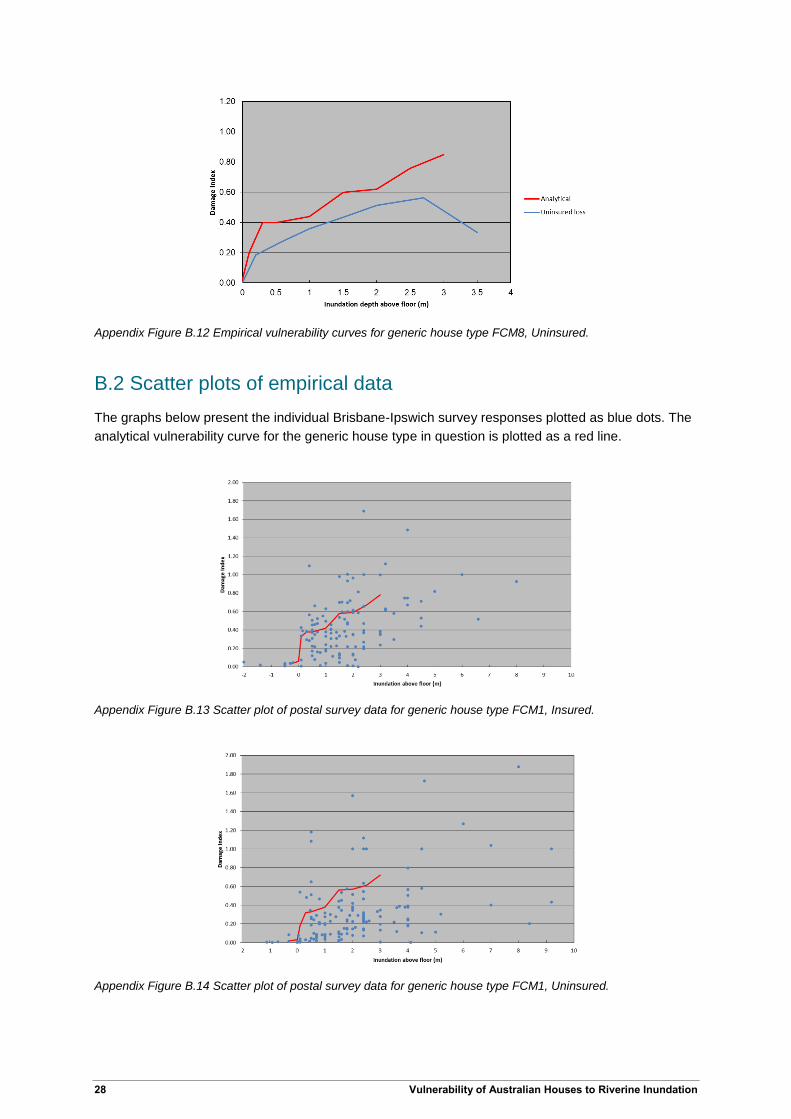
Appendix Figure B.12 Empirical vulnerability curves for generic house type FCM8, Uninsured.
B.2 Scatter plots of empirical data
The graphs below present the individual Brisbane-Ipswich survey responses plotted as blue dots. The
analytical vulnerability curve for the generic house type in question is plotted as a red line.
Appendix Figure B.13 Scatter plot of postal survey data for generic house type FCM1, Insured.
Appendix Figure B.14 Scatter plot of postal survey data for generic house type FCM1, Uninsured.
Vulnerability of Australian Houses to Riverine Inundation 29
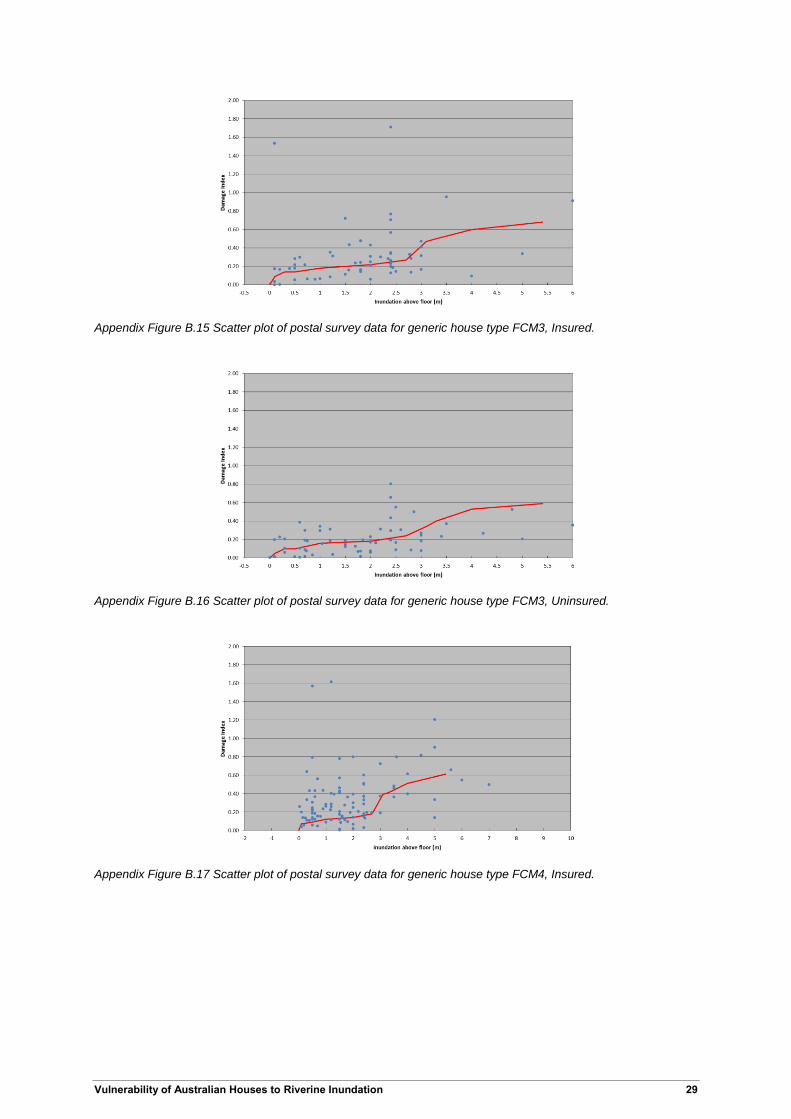
Appendix Figure B.15 Scatter plot of postal survey data for generic house type FCM3, Insured.
Appendix Figure B.16 Scatter plot of postal survey data for generic house type FCM3, Uninsured.
Appendix Figure B.17 Scatter plot of postal survey data for generic house type FCM4, Insured.
30 Vulnerability of Australian Houses to Riverine Inundation
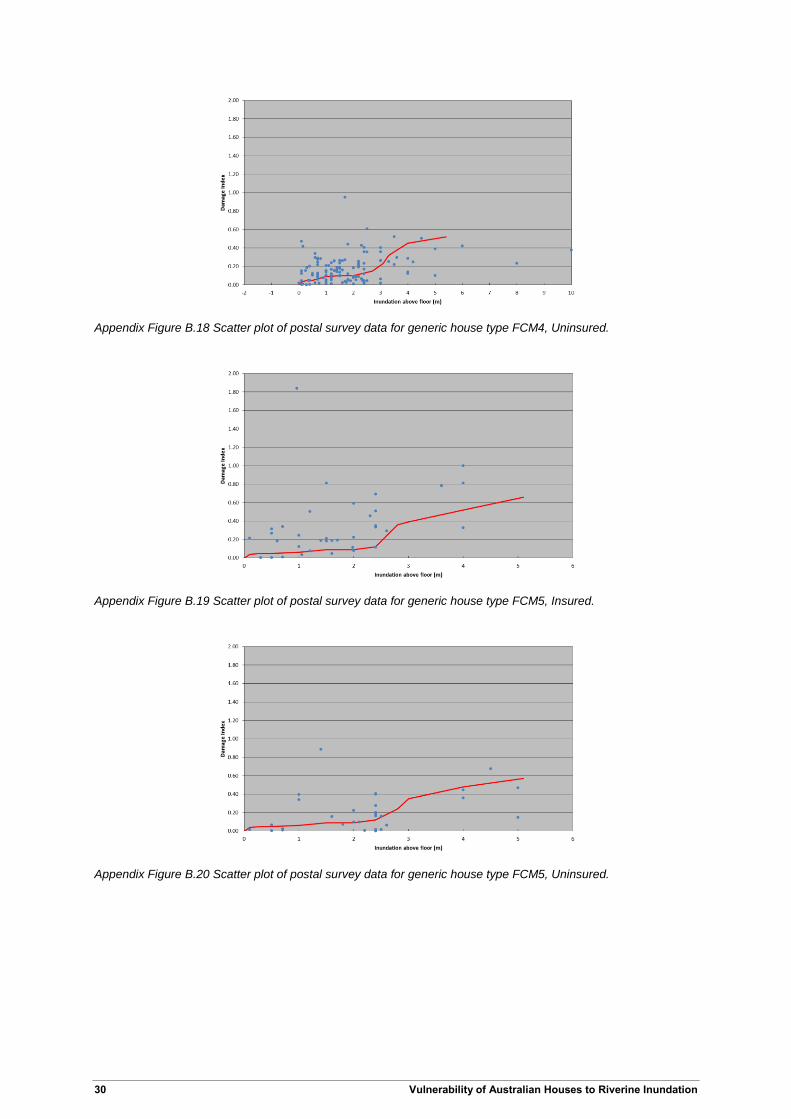
Appendix Figure B.18 Scatter plot of postal survey data for generic house type FCM4, Uninsured.
Appendix Figure B.19 Scatter plot of postal survey data for generic house type FCM5, Insured.
Appendix Figure B.20 Scatter plot of postal survey data for generic house type FCM5, Uninsured.
Vulnerability of Australian Houses to Riverine Inundation 31
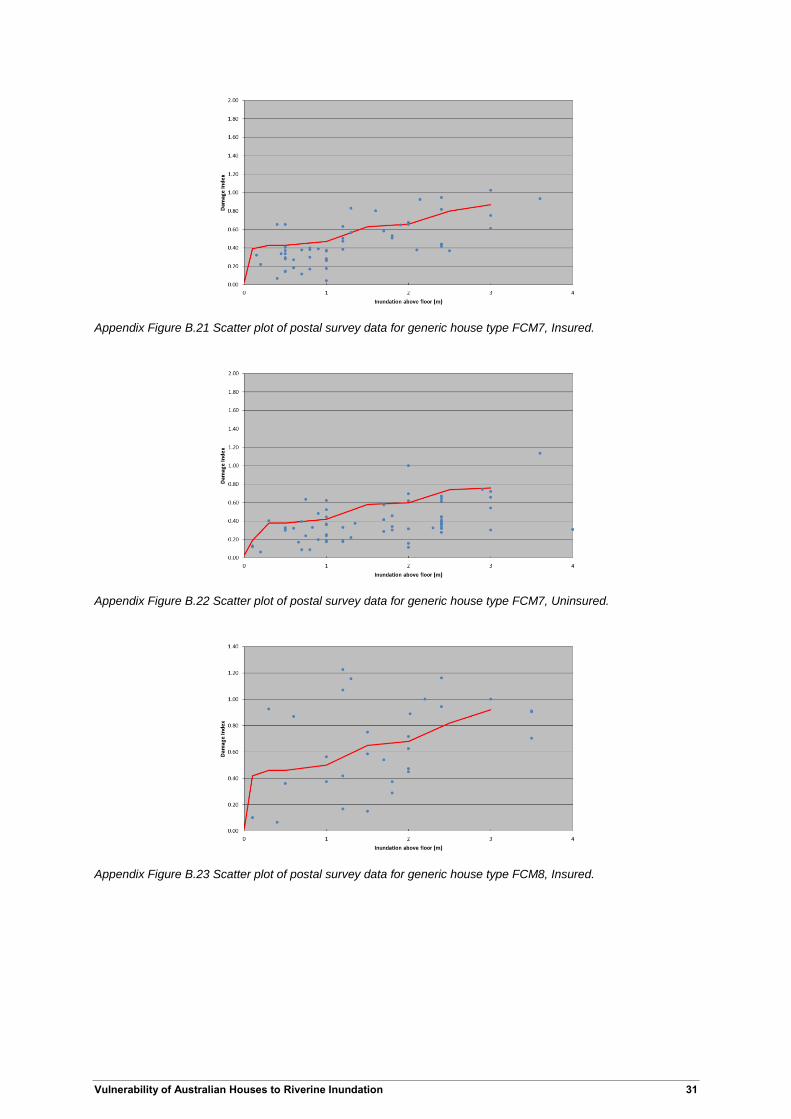
Appendix Figure B.21 Scatter plot of postal survey data for generic house type FCM7, Insured.
Appendix Figure B.22 Scatter plot of postal survey data for generic house type FCM7, Uninsured.
Appendix Figure B.23 Scatter plot of postal survey data for generic house type FCM8, Insured.
32 Vulnerability of Australian Houses to Riverine Inundation
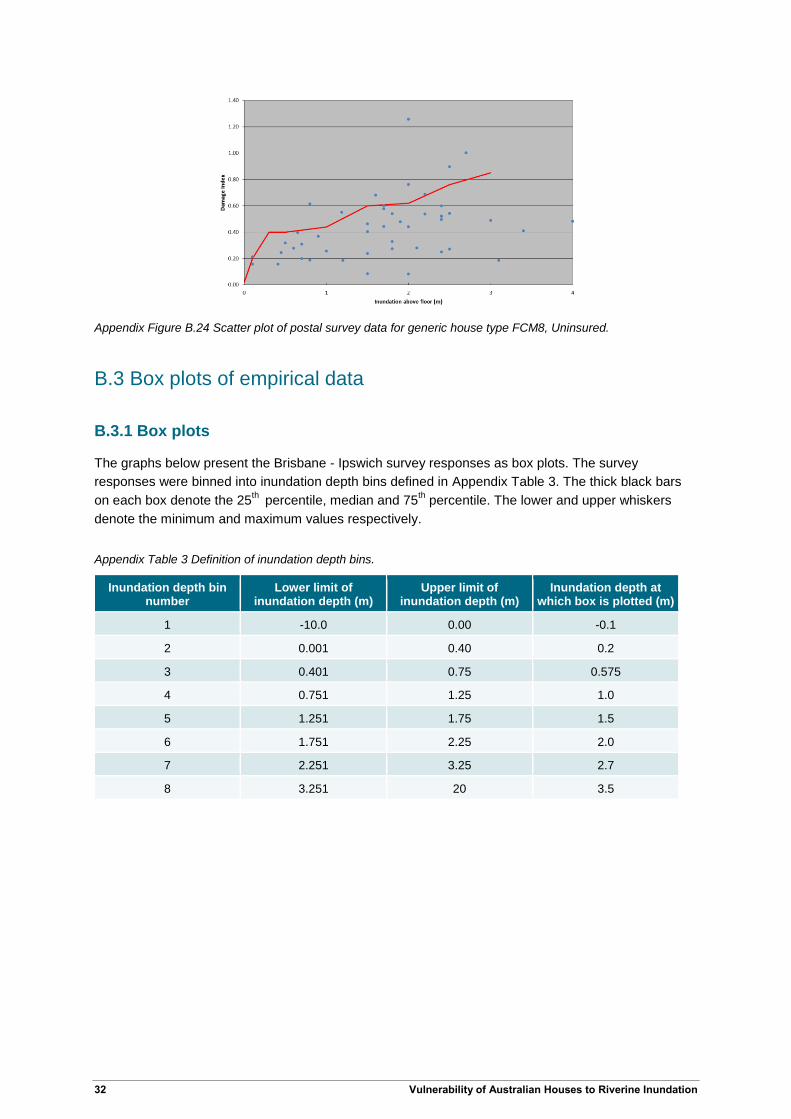
Appendix Figure B.24 Scatter plot of postal survey data for generic house type FCM8, Uninsured.
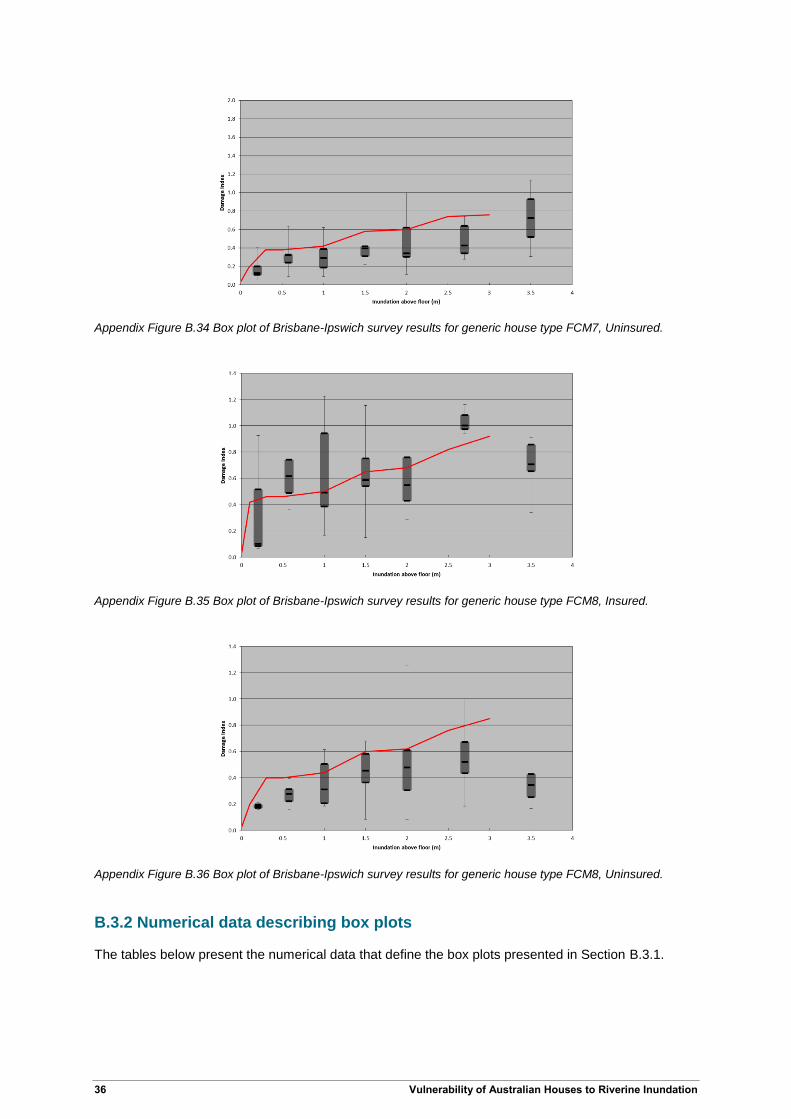
B.3 Box plots of empirical data
B.3.1 Box plots
The graphs below present the Brisbane - Ipswich survey responses as box plots. The survey
responses were binned into inundation depth bins defined in Appendix Table 3. The thick black bars
on each box denote the 25th
percentile, median and 75th percentile. The lower and upper whiskers
denote the minimum and maximum values respectively.
Appendix Table 3 Definition of inundation depth bins.
Inundation depth bin number
Lower limit of inundation depth (m)
Upper limit of inundation depth (m)
Inundation depth at which box is plotted (m)
1 -10.0 0.00 -0.1
2 0.001 0.40 0.2
3 0.401 0.75 0.575
4 0.751 1.25 1.0
5 1.251 1.75 1.5
6 1.751 2.25 2.0
7 2.251 3.25 2.7
8 3.251 20 3.5
Vulnerability of Australian Houses to Riverine Inundation 33
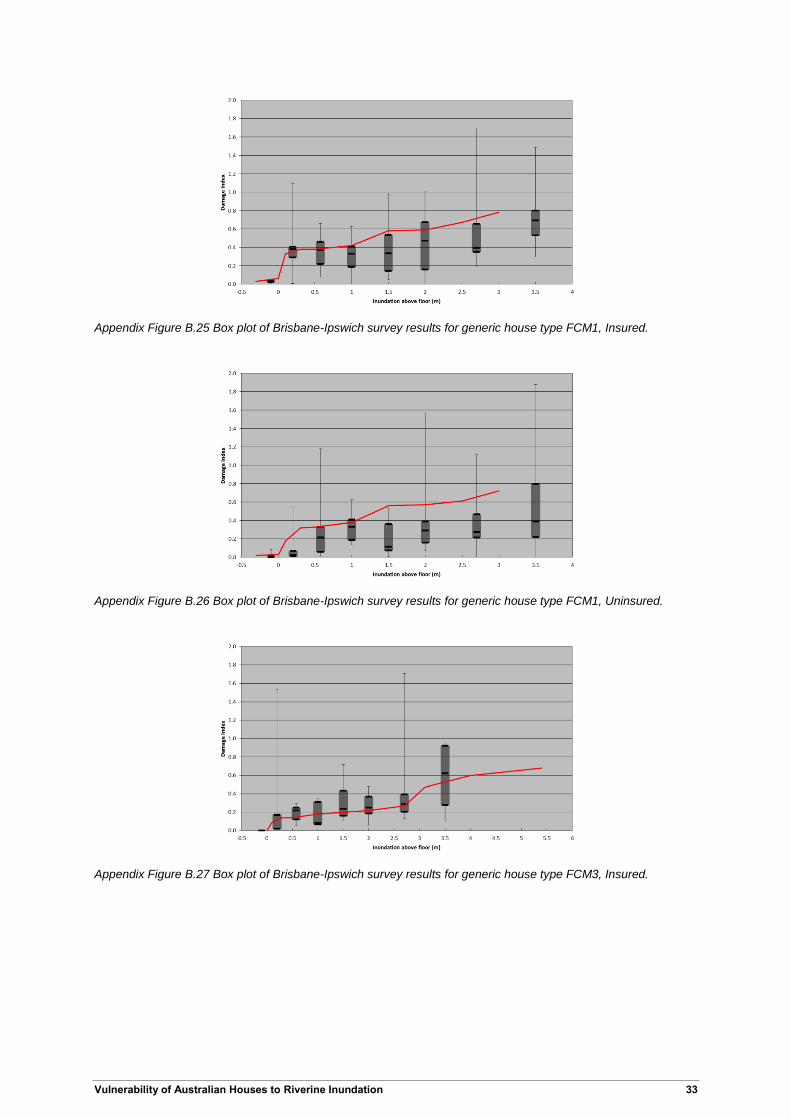
Appendix Figure B.25 Box plot of Brisbane-Ipswich survey results for generic house type FCM1, Insured.
Appendix Figure B.26 Box plot of Brisbane-Ipswich survey results for generic house type FCM1, Uninsured.
Appendix Figure B.27 Box plot of Brisbane-Ipswich survey results for generic house type FCM3, Insured.
34 Vulnerability of Australian Houses to Riverine Inundation
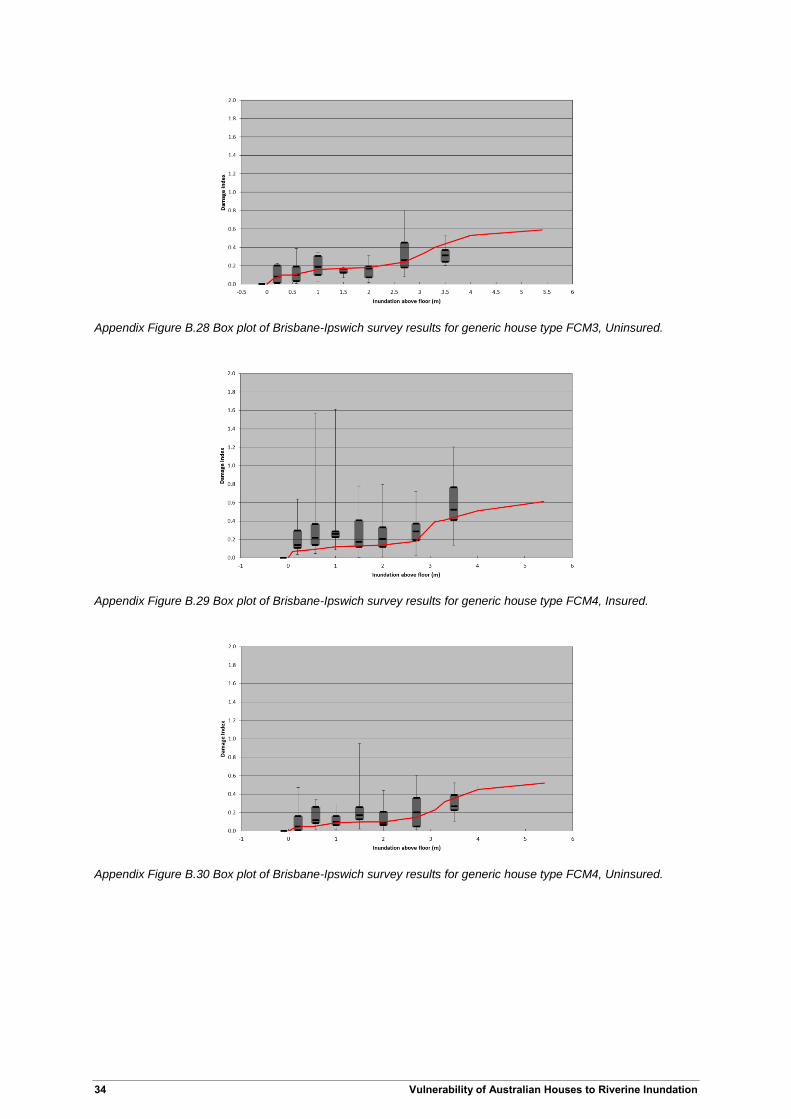
Appendix Figure B.28 Box plot of Brisbane-Ipswich survey results for generic house type FCM3, Uninsured.
Appendix Figure B.29 Box plot of Brisbane-Ipswich survey results for generic house type FCM4, Insured.
Appendix Figure B.30 Box plot of Brisbane-Ipswich survey results for generic house type FCM4, Uninsured.
Vulnerability of Australian Houses to Riverine Inundation 35
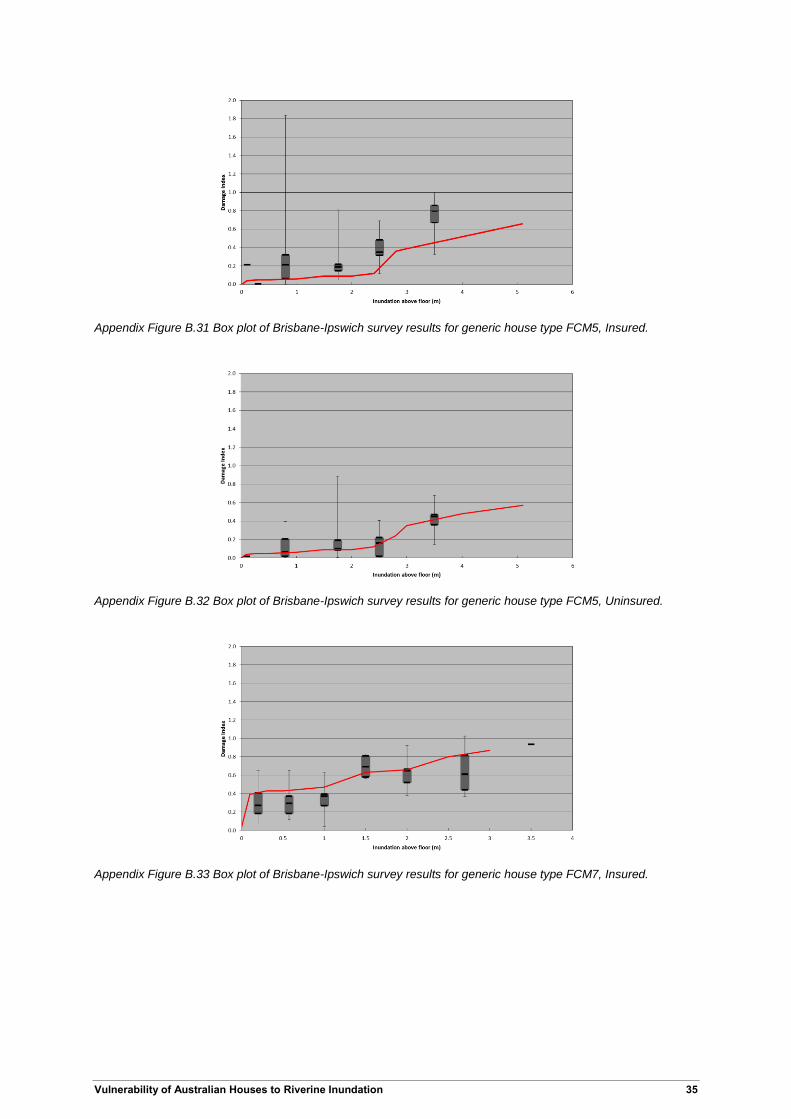
Appendix Figure B.31 Box plot of Brisbane-Ipswich survey results for generic house type FCM5, Insured.
Appendix Figure B.32 Box plot of Brisbane-Ipswich survey results for generic house type FCM5, Uninsured.
Appendix Figure B.33 Box plot of Brisbane-Ipswich survey results for generic house type FCM7, Insured.
36 Vulnerability of Australian Houses to Riverine Inundation
Appendix Figure B.34 Box plot of Brisbane-Ipswich survey results for generic house type FCM7, Uninsured.
Appendix Figure B.35 Box plot of Brisbane-Ipswich survey results for generic house type FCM8, Insured.
Appendix Figure B.36 Box plot of Brisbane-Ipswich survey results for generic house type FCM8, Uninsured.
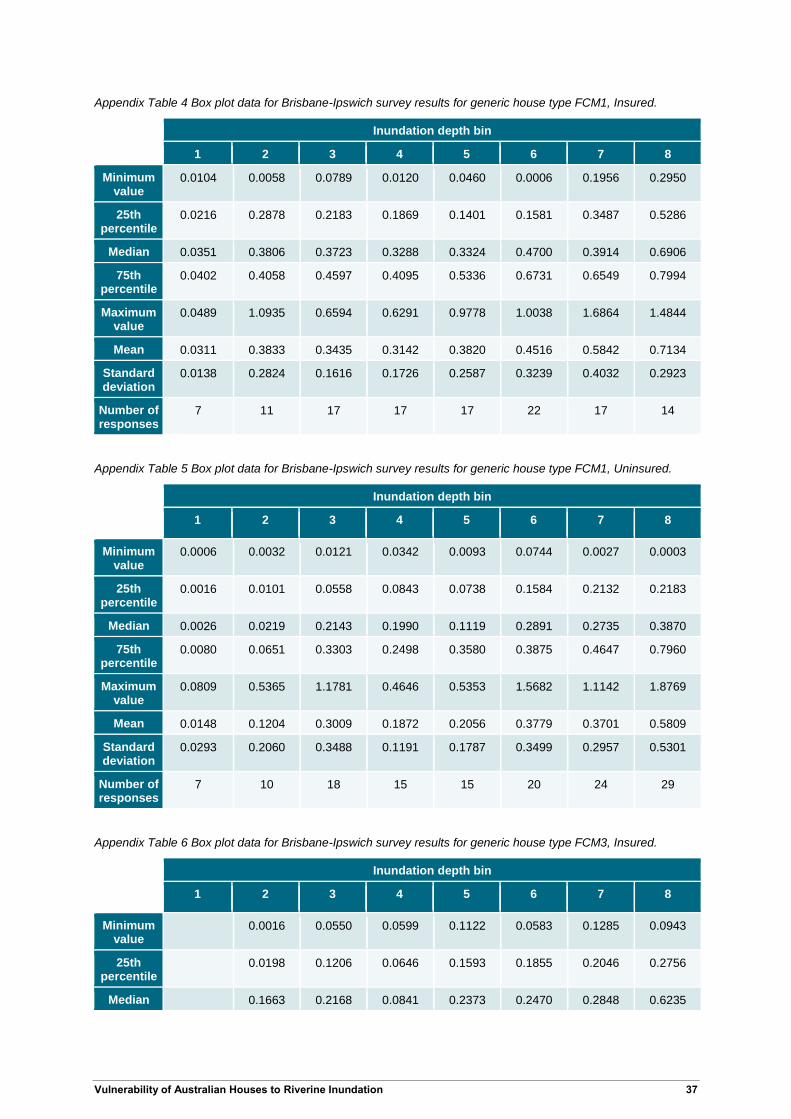
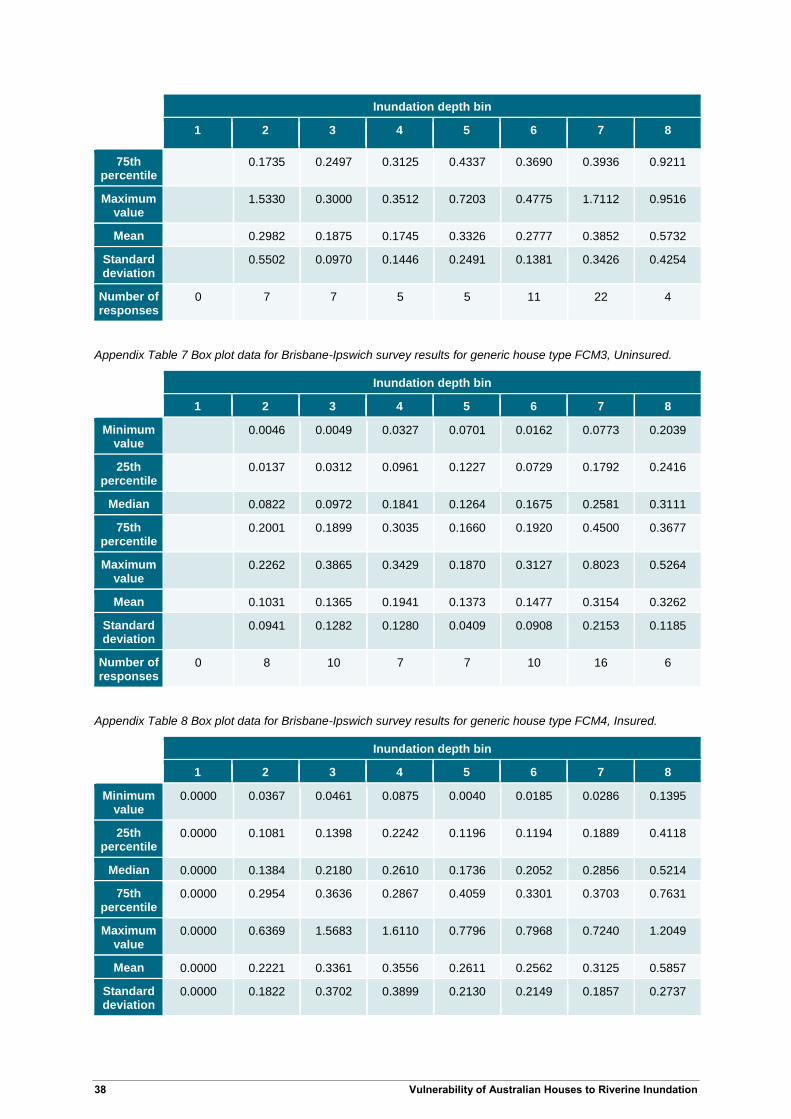
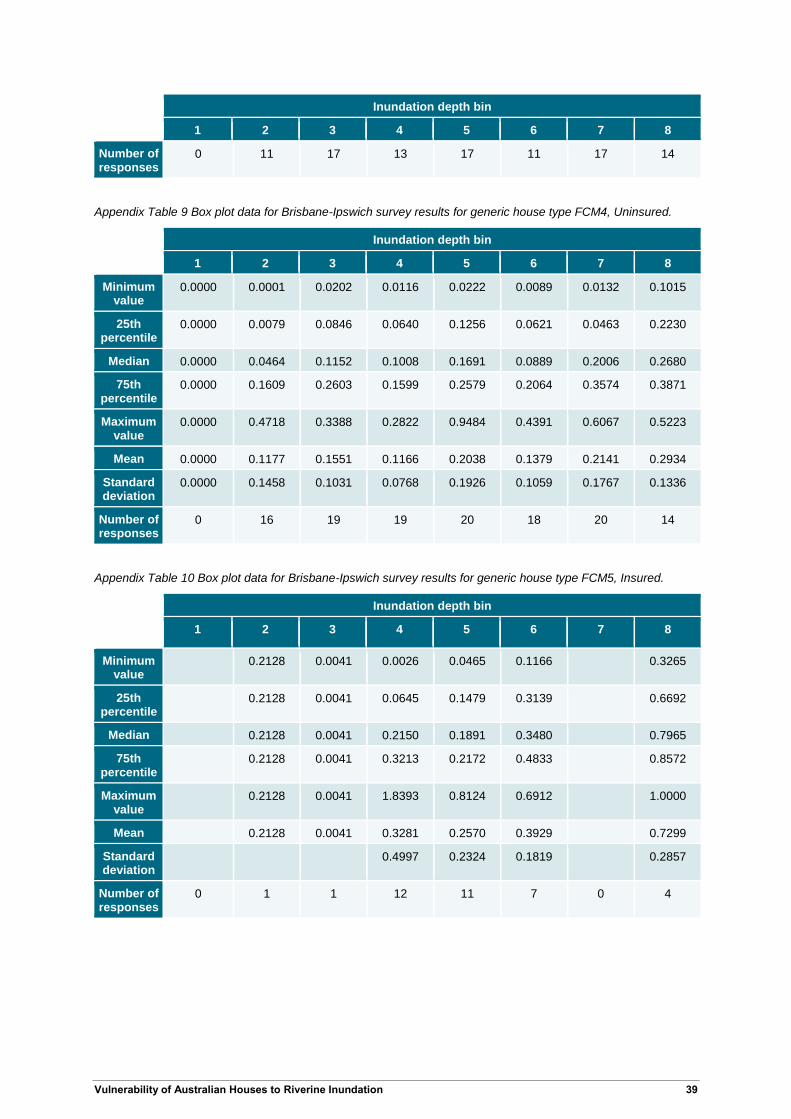
B.3.2 Numerical data describing box plots
The tables below present the numerical data that define the box plots presented in Section B.3.1.
Vulnerability of Australian Houses to Riverine Inundation 37
Appendix Table 4 Box plot data for Brisbane-Ipswich survey results for generic house type FCM1, Insured.
Inundation depth bin
1 2 3 4 5 6 7 8
Minimum value
0.0104 0.0058 0.0789 0.0120 0.0460 0.0006 0.1956 0.2950
25th percentile
0.0216 0.2878 0.2183 0.1869 0.1401 0.1581 0.3487 0.5286
Median 0.0351 0.3806 0.3723 0.3288 0.3324 0.4700 0.3914 0.6906
75th percentile
0.0402 0.4058 0.4597 0.4095 0.5336 0.6731 0.6549 0.7994
Maximum value
0.0489 1.0935 0.6594 0.6291 0.9778 1.0038 1.6864 1.4844
Mean 0.0311 0.3833 0.3435 0.3142 0.3820 0.4516 0.5842 0.7134
Standard deviation
0.0138 0.2824 0.1616 0.1726 0.2587 0.3239 0.4032 0.2923
Number of responses
7 11 17 17 17 22 17 14
Appendix Table 5 Box plot data for Brisbane-Ipswich survey results for generic house type FCM1, Uninsured.
Inundation depth bin
1 2 3 4 5 6 7 8
Minimum value
0.0006 0.0032 0.0121 0.0342 0.0093 0.0744 0.0027 0.0003
25th percentile
0.0016 0.0101 0.0558 0.0843 0.0738 0.1584 0.2132 0.2183
Median 0.0026 0.0219 0.2143 0.1990 0.1119 0.2891 0.2735 0.3870
75th percentile
0.0080 0.0651 0.3303 0.2498 0.3580 0.3875 0.4647 0.7960
Maximum value
0.0809 0.5365 1.1781 0.4646 0.5353 1.5682 1.1142 1.8769
Mean 0.0148 0.1204 0.3009 0.1872 0.2056 0.3779 0.3701 0.5809
Standard deviation
0.0293 0.2060 0.3488 0.1191 0.1787 0.3499 0.2957 0.5301
Number of responses
7 10 18 15 15 20 24 29
Appendix Table 6 Box plot data for Brisbane-Ipswich survey results for generic house type FCM3, Insured.
Inundation depth bin
1 2 3 4 5 6 7 8
Minimum value
0.0016 0.0550 0.0599 0.1122 0.0583 0.1285 0.0943
25th percentile
0.0198 0.1206 0.0646 0.1593 0.1855 0.2046 0.2756
Median 0.1663 0.2168 0.0841 0.2373 0.2470 0.2848 0.6235
38 Vulnerability of Australian Houses to Riverine Inundation
Inundation depth bin
1 2 3 4 5 6 7 8
75th percentile
0.1735 0.2497 0.3125 0.4337 0.3690 0.3936 0.9211
Maximum value
1.5330 0.3000 0.3512 0.7203 0.4775 1.7112 0.9516
Mean 0.2982 0.1875 0.1745 0.3326 0.2777 0.3852 0.5732
Standard deviation
0.5502 0.0970 0.1446 0.2491 0.1381 0.3426 0.4254
Number of responses
0 7 7 5 5 11 22 4
Appendix Table 7 Box plot data for Brisbane-Ipswich survey results for generic house type FCM3, Uninsured.
Inundation depth bin
1 2 3 4 5 6 7 8
Minimum value
0.0046 0.0049 0.0327 0.0701 0.0162 0.0773 0.2039
25th percentile
0.0137 0.0312 0.0961 0.1227 0.0729 0.1792 0.2416
Median 0.0822 0.0972 0.1841 0.1264 0.1675 0.2581 0.3111
75th percentile
0.2001 0.1899 0.3035 0.1660 0.1920 0.4500 0.3677
Maximum value
0.2262 0.3865 0.3429 0.1870 0.3127 0.8023 0.5264
Mean 0.1031 0.1365 0.1941 0.1373 0.1477 0.3154 0.3262
Standard deviation
0.0941 0.1282 0.1280 0.0409 0.0908 0.2153 0.1185
Number of responses
0 8 10 7 7 10 16 6
Appendix Table 8 Box plot data for Brisbane-Ipswich survey results for generic house type FCM4, Insured.
Inundation depth bin
1 2 3 4 5 6 7 8
Minimum value
0.0000 0.0367 0.0461 0.0875 0.0040 0.0185 0.0286 0.1395
25th percentile
0.0000 0.1081 0.1398 0.2242 0.1196 0.1194 0.1889 0.4118
Median 0.0000 0.1384 0.2180 0.2610 0.1736 0.2052 0.2856 0.5214
75th percentile
0.0000 0.2954 0.3636 0.2867 0.4059 0.3301 0.3703 0.7631
Maximum value
0.0000 0.6369 1.5683 1.6110 0.7796 0.7968 0.7240 1.2049
Mean 0.0000 0.2221 0.3361 0.3556 0.2611 0.2562 0.3125 0.5857
Standard deviation
0.0000 0.1822 0.3702 0.3899 0.2130 0.2149 0.1857 0.2737
Vulnerability of Australian Houses to Riverine Inundation 39
Inundation depth bin
1 2 3 4 5 6 7 8
Number of responses
0 11 17 13 17 11 17 14
Appendix Table 9 Box plot data for Brisbane-Ipswich survey results for generic house type FCM4, Uninsured.
Inundation depth bin
1 2 3 4 5 6 7 8
Minimum value
0.0000 0.0001 0.0202 0.0116 0.0222 0.0089 0.0132 0.1015
25th percentile
0.0000 0.0079 0.0846 0.0640 0.1256 0.0621 0.0463 0.2230
Median 0.0000 0.0464 0.1152 0.1008 0.1691 0.0889 0.2006 0.2680
75th percentile
0.0000 0.1609 0.2603 0.1599 0.2579 0.2064 0.3574 0.3871
Maximum value
0.0000 0.4718 0.3388 0.2822 0.9484 0.4391 0.6067 0.5223
Mean 0.0000 0.1177 0.1551 0.1166 0.2038 0.1379 0.2141 0.2934
Standard deviation
0.0000 0.1458 0.1031 0.0768 0.1926 0.1059 0.1767 0.1336
Number of responses
0 16 19 19 20 18 20 14
Appendix Table 10 Box plot data for Brisbane-Ipswich survey results for generic house type FCM5, Insured.
Inundation depth bin
1 2 3 4 5 6 7 8
Minimum value
0.2128 0.0041 0.0026 0.0465 0.1166 0.3265
25th percentile
0.2128 0.0041 0.0645 0.1479 0.3139 0.6692
Median 0.2128 0.0041 0.2150 0.1891 0.3480 0.7965
75th percentile
0.2128 0.0041 0.3213 0.2172 0.4833 0.8572
Maximum value
0.2128 0.0041 1.8393 0.8124 0.6912 1.0000
Mean 0.2128 0.0041 0.3281 0.2570 0.3929 0.7299
Standard deviation
0.4997 0.2324 0.1819 0.2857
Number of responses
0 1 1 12 11 7 0 4
40 Vulnerability of Australian Houses to Riverine Inundation
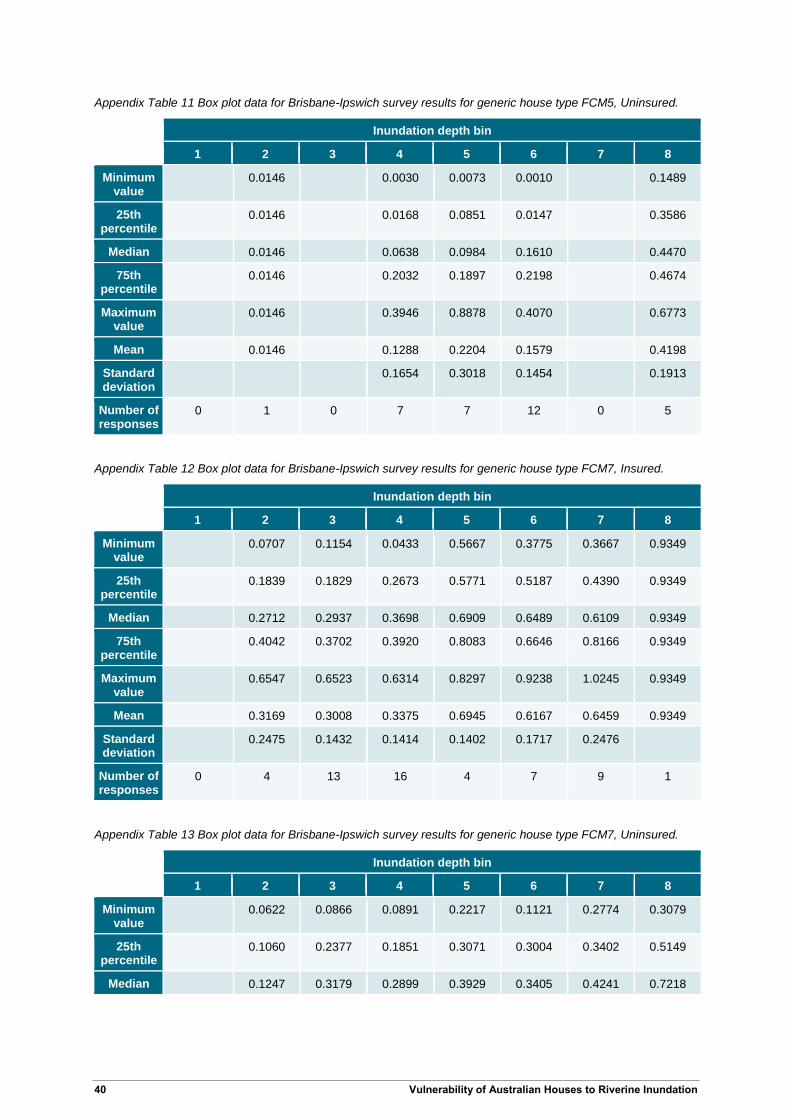
Appendix Table 11 Box plot data for Brisbane-Ipswich survey results for generic house type FCM5, Uninsured.
Inundation depth bin
1 2 3 4 5 6 7 8
Minimum value
0.0146 0.0030 0.0073 0.0010 0.1489
25th percentile
0.0146 0.0168 0.0851 0.0147 0.3586
Median 0.0146 0.0638 0.0984 0.1610 0.4470
75th percentile
0.0146 0.2032 0.1897 0.2198 0.4674
Maximum value
0.0146 0.3946 0.8878 0.4070 0.6773
Mean 0.0146 0.1288 0.2204 0.1579 0.4198
Standard deviation
0.1654 0.3018 0.1454 0.1913
Number of responses
0 1 0 7 7 12 0 5
Appendix Table 12 Box plot data for Brisbane-Ipswich survey results for generic house type FCM7, Insured.
Inundation depth bin
1 2 3 4 5 6 7 8
Minimum value
0.0707 0.1154 0.0433 0.5667 0.3775 0.3667 0.9349
25th percentile
0.1839 0.1829 0.2673 0.5771 0.5187 0.4390 0.9349
Median 0.2712 0.2937 0.3698 0.6909 0.6489 0.6109 0.9349
75th percentile
0.4042 0.3702 0.3920 0.8083 0.6646 0.8166 0.9349
Maximum value
0.6547 0.6523 0.6314 0.8297 0.9238 1.0245 0.9349
Mean 0.3169 0.3008 0.3375 0.6945 0.6167 0.6459 0.9349
Standard deviation
0.2475 0.1432 0.1414 0.1402 0.1717 0.2476
Number of responses
0 4 13 16 4 7 9 1
Appendix Table 13 Box plot data for Brisbane-Ipswich survey results for generic house type FCM7, Uninsured.
Inundation depth bin
1 2 3 4 5 6 7 8
Minimum value
0.0622 0.0866 0.0891 0.2217 0.1121 0.2774 0.3079
25th percentile
0.1060 0.2377 0.1851 0.3071 0.3004 0.3402 0.5149
Median 0.1247 0.3179 0.2899 0.3929 0.3405 0.4241 0.7218
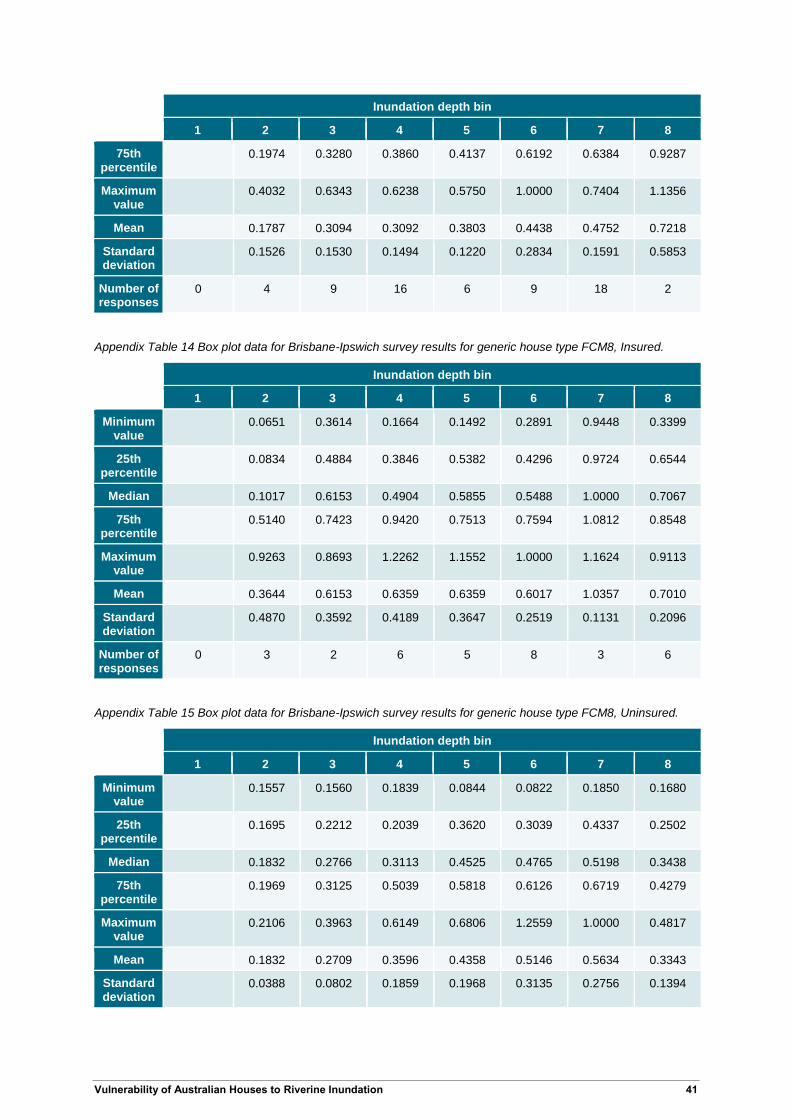
Vulnerability of Australian Houses to Riverine Inundation 41
Inundation depth bin
1 2 3 4 5 6 7 8
75th percentile
0.1974 0.3280 0.3860 0.4137 0.6192 0.6384 0.9287
Maximum value
0.4032 0.6343 0.6238 0.5750 1.0000 0.7404 1.1356
Mean 0.1787 0.3094 0.3092 0.3803 0.4438 0.4752 0.7218
Standard deviation
0.1526 0.1530 0.1494 0.1220 0.2834 0.1591 0.5853
Number of responses
0 4 9 16 6 9 18 2
Appendix Table 14 Box plot data for Brisbane-Ipswich survey results for generic house type FCM8, Insured.
Inundation depth bin
1 2 3 4 5 6 7 8
Minimum value
0.0651 0.3614 0.1664 0.1492 0.2891 0.9448 0.3399
25th percentile
0.0834 0.4884 0.3846 0.5382 0.4296 0.9724 0.6544
Median 0.1017 0.6153 0.4904 0.5855 0.5488 1.0000 0.7067
75th percentile
0.5140 0.7423 0.9420 0.7513 0.7594 1.0812 0.8548
Maximum value
0.9263 0.8693 1.2262 1.1552 1.0000 1.1624 0.9113
Mean 0.3644 0.6153 0.6359 0.6359 0.6017 1.0357 0.7010
Standard deviation
0.4870 0.3592 0.4189 0.3647 0.2519 0.1131 0.2096
Number of responses
0 3 2 6 5 8 3 6
Appendix Table 15 Box plot data for Brisbane-Ipswich survey results for generic house type FCM8, Uninsured.
Inundation depth bin
1 2 3 4 5 6 7 8
Minimum value
0.1557 0.1560 0.1839 0.0844 0.0822 0.1850 0.1680
25th percentile
0.1695 0.2212 0.2039 0.3620 0.3039 0.4337 0.2502
Median 0.1832 0.2766 0.3113 0.4525 0.4765 0.5198 0.3438
75th percentile
0.1969 0.3125 0.5039 0.5818 0.6126 0.6719 0.4279
Maximum value
0.2106 0.3963 0.6149 0.6806 1.2559 1.0000 0.4817
Mean 0.1832 0.2709 0.3596 0.4358 0.5146 0.5634 0.3343
Standard deviation
0.0388 0.0802 0.1859 0.1968 0.3135 0.2756 0.1394

42 Vulnerability of Australian Houses to Riverine Inundation
Inundation depth bin
1 2 3 4 5 6 7 8
Number of responses
0 2 7 6 8 11 12 4
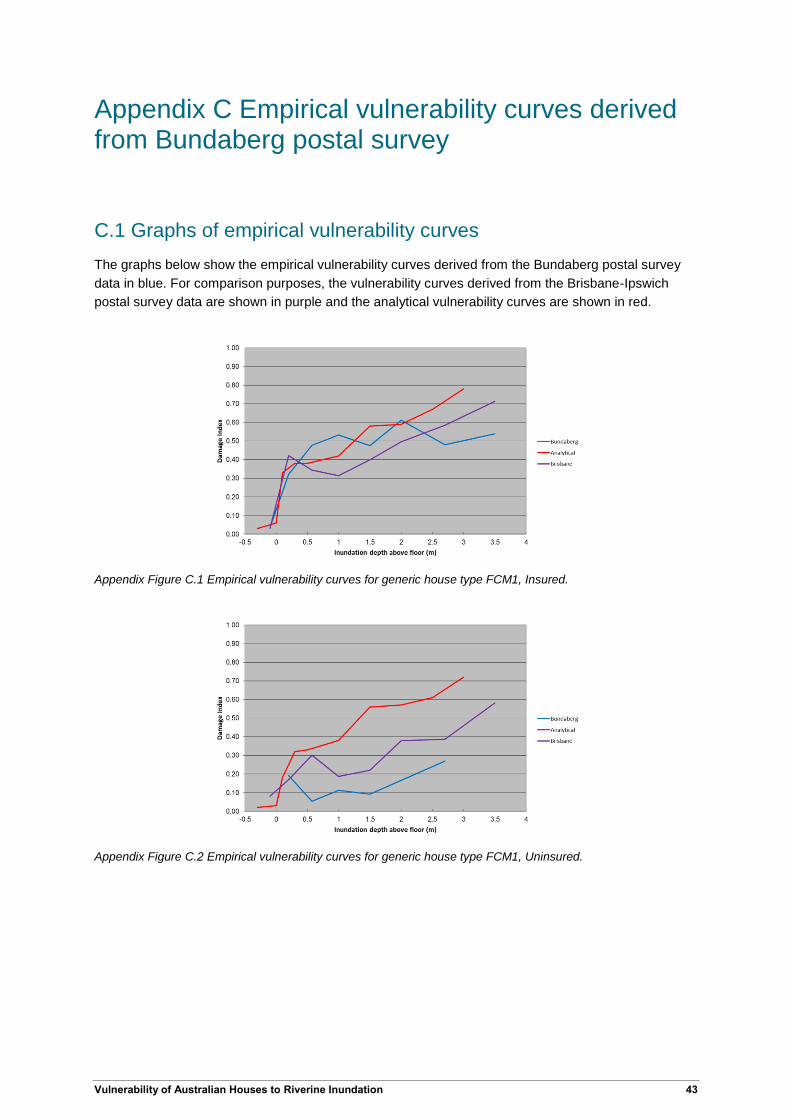
Vulnerability of Australian Houses to Riverine Inundation 43
Appendix C Empirical vulnerability curves derived from Bundaberg postal survey
C.1 Graphs of empirical vulnerability curves
The graphs below show the empirical vulnerability curves derived from the Bundaberg postal survey
data in blue. For comparison purposes, the vulnerability curves derived from the Brisbane-Ipswich
postal survey data are shown in purple and the analytical vulnerability curves are shown in red.
Appendix Figure C.1 Empirical vulnerability curves for generic house type FCM1, Insured.
Appendix Figure C.2 Empirical vulnerability curves for generic house type FCM1, Uninsured.
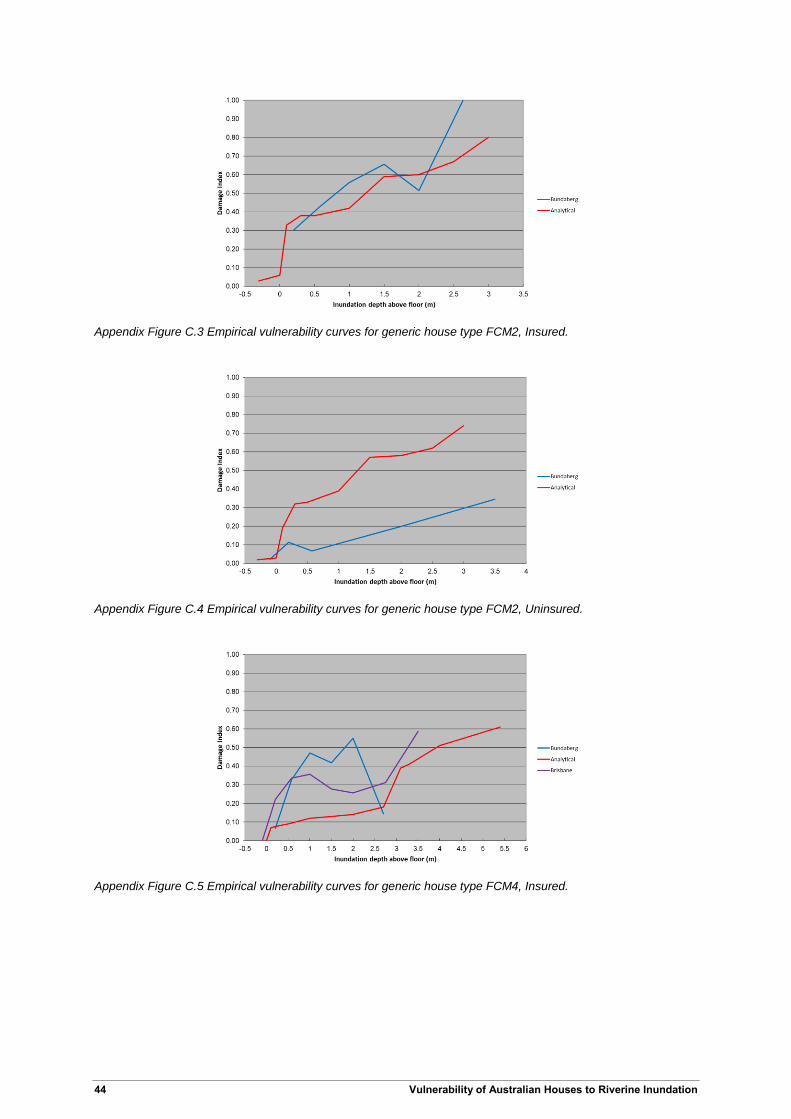
44 Vulnerability of Australian Houses to Riverine Inundation
Appendix Figure C.3 Empirical vulnerability curves for generic house type FCM2, Insured.
Appendix Figure C.4 Empirical vulnerability curves for generic house type FCM2, Uninsured.
Appendix Figure C.5 Empirical vulnerability curves for generic house type FCM4, Insured.
Vulnerability of Australian Houses to Riverine Inundation 45
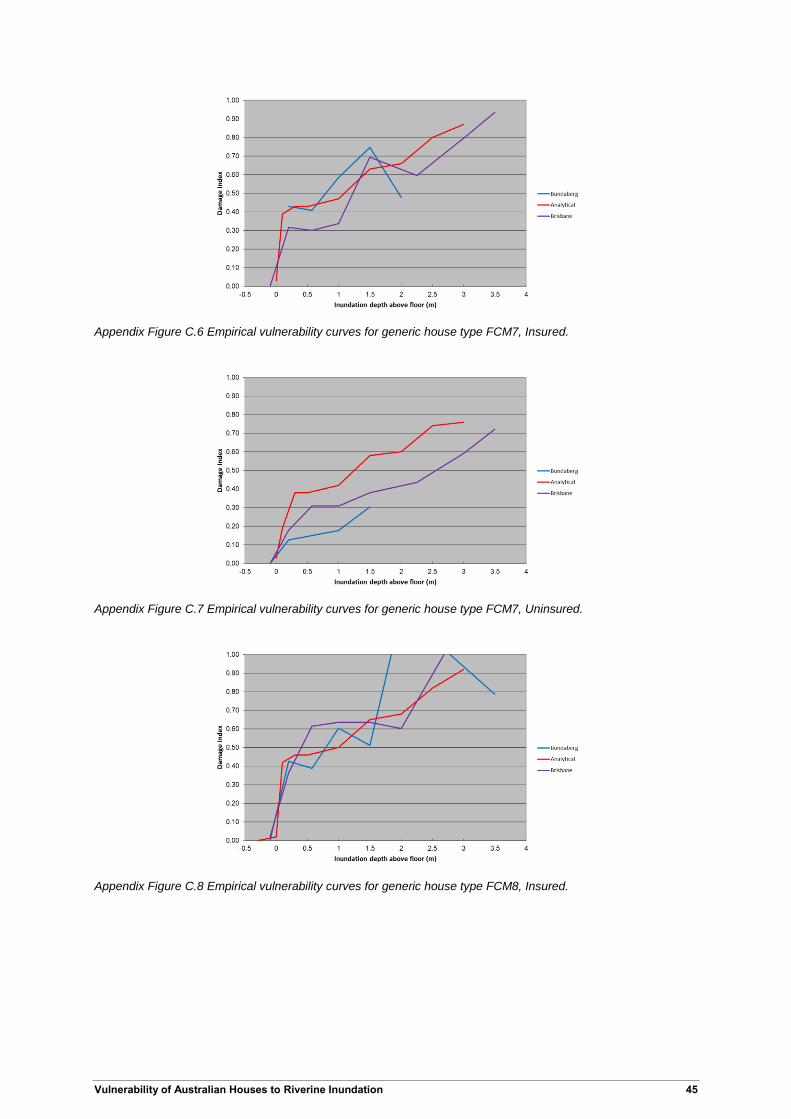
Appendix Figure C.6 Empirical vulnerability curves for generic house type FCM7, Insured.
Appendix Figure C.7 Empirical vulnerability curves for generic house type FCM7, Uninsured.
Appendix Figure C.8 Empirical vulnerability curves for generic house type FCM8, Insured.
46 Vulnerability of Australian Houses to Riverine Inundation
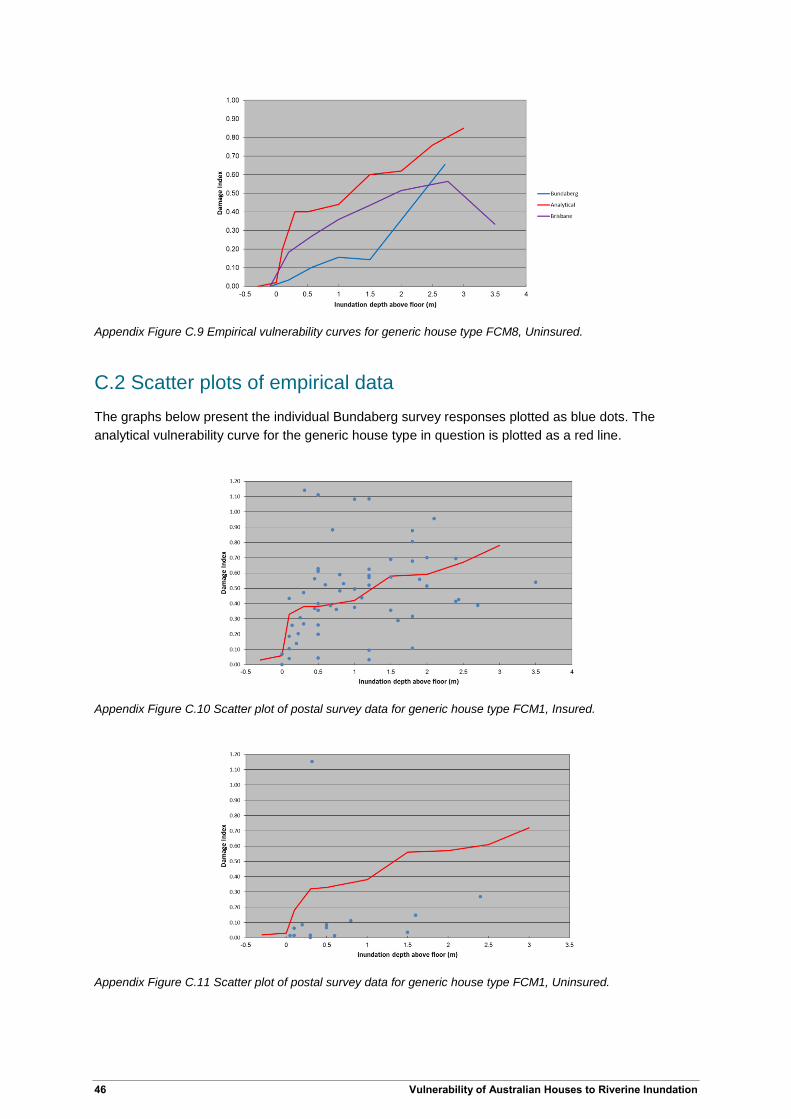
Appendix Figure C.9 Empirical vulnerability curves for generic house type FCM8, Uninsured.
C.2 Scatter plots of empirical data
The graphs below present the individual Bundaberg survey responses plotted as blue dots. The
analytical vulnerability curve for the generic house type in question is plotted as a red line.
Appendix Figure C.10 Scatter plot of postal survey data for generic house type FCM1, Insured.
Appendix Figure C.11 Scatter plot of postal survey data for generic house type FCM1, Uninsured.
Vulnerability of Australian Houses to Riverine Inundation 47
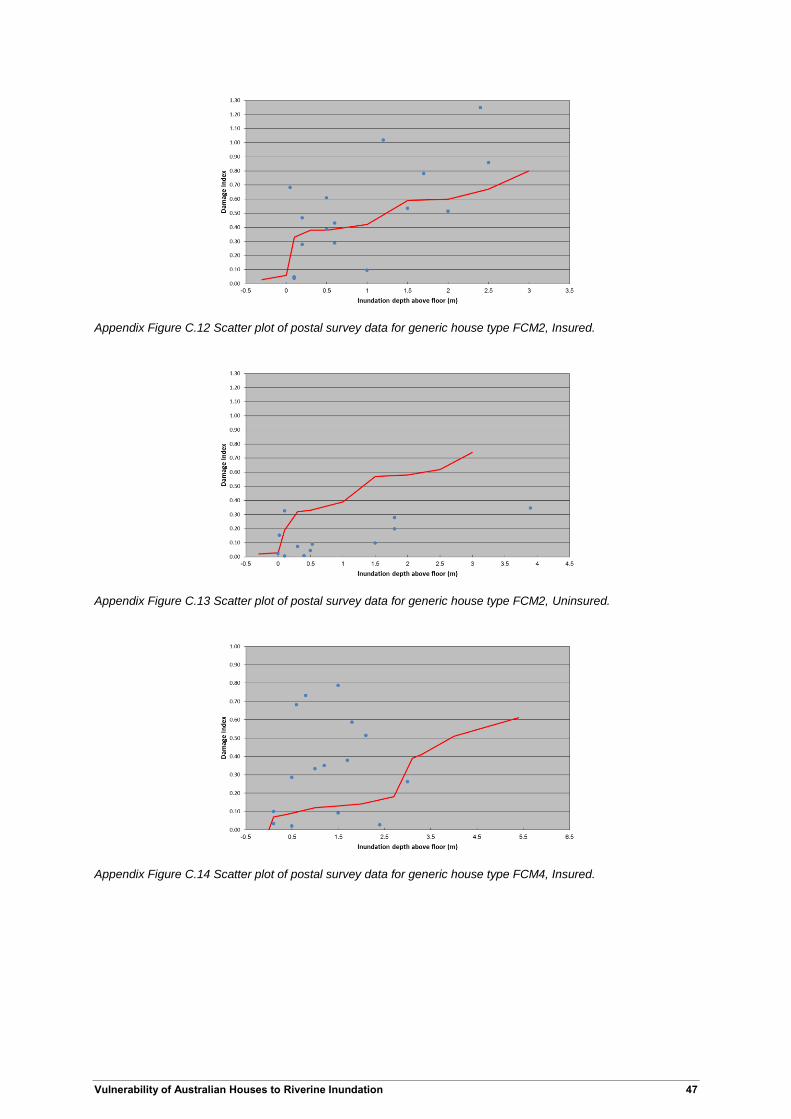
Appendix Figure C.12 Scatter plot of postal survey data for generic house type FCM2, Insured.
Appendix Figure C.13 Scatter plot of postal survey data for generic house type FCM2, Uninsured.
Appendix Figure C.14 Scatter plot of postal survey data for generic house type FCM4, Insured.
48 Vulnerability of Australian Houses to Riverine Inundation
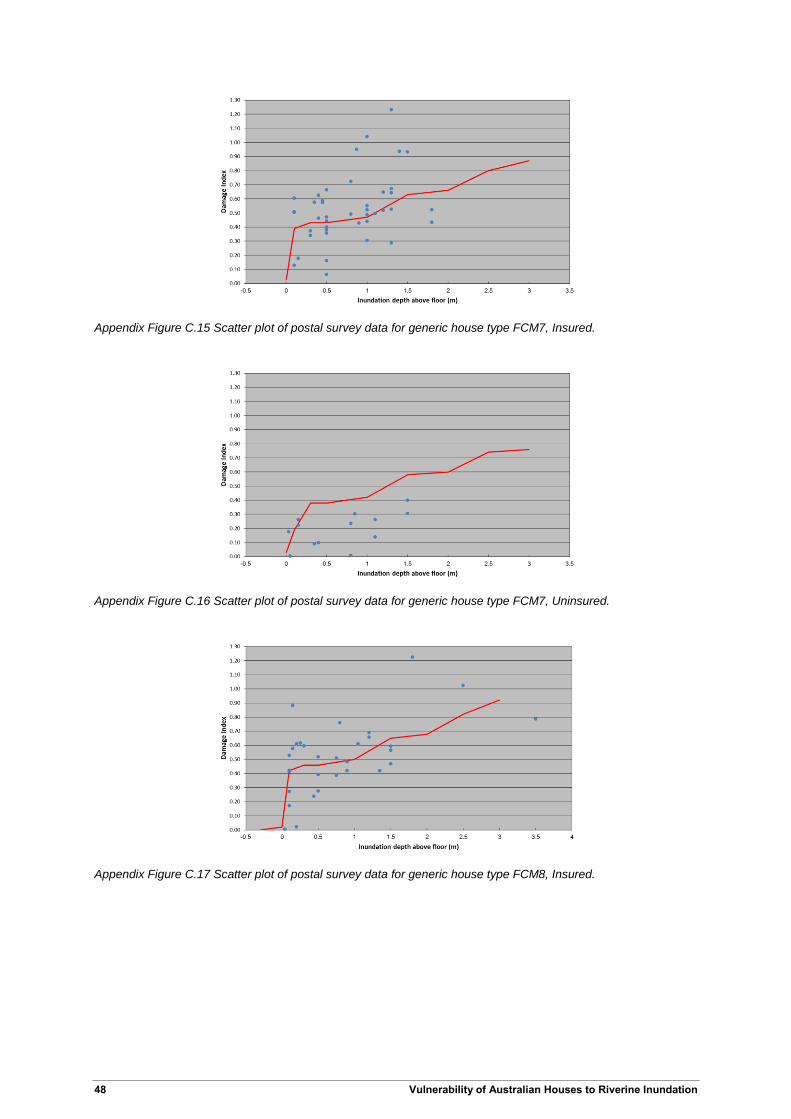
Appendix Figure C.15 Scatter plot of postal survey data for generic house type FCM7, Insured.
Appendix Figure C.16 Scatter plot of postal survey data for generic house type FCM7, Uninsured.
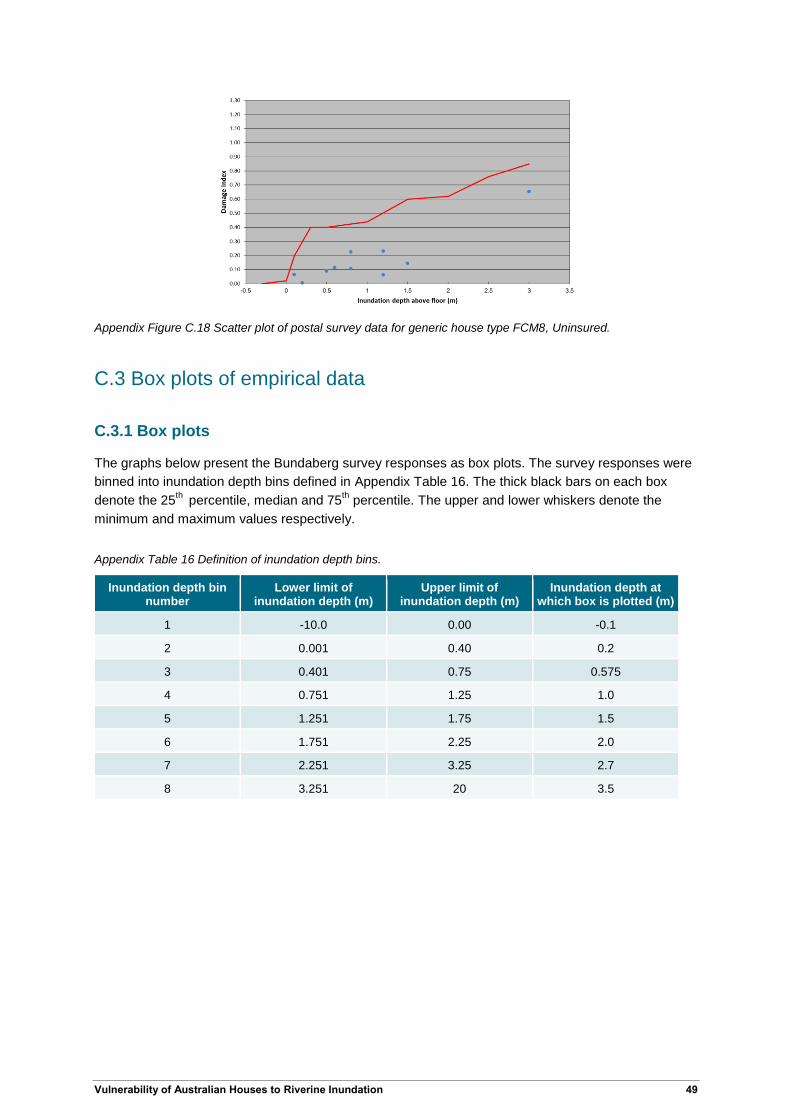
Appendix Figure C.17 Scatter plot of postal survey data for generic house type FCM8, Insured.
Vulnerability of Australian Houses to Riverine Inundation 49
Appendix Figure C.18 Scatter plot of postal survey data for generic house type FCM8, Uninsured.
C.3 Box plots of empirical data
C.3.1 Box plots
The graphs below present the Bundaberg survey responses as box plots. The survey responses were
binned into inundation depth bins defined in Appendix Table 16. The thick black bars on each box
denote the 25th
percentile, median and 75th percentile. The upper and lower whiskers denote the
minimum and maximum values respectively.
Appendix Table 16 Definition of inundation depth bins.
Inundation depth bin number
Lower limit of inundation depth (m)
Upper limit of inundation depth (m)
Inundation depth at which box is plotted (m)
1 -10.0 0.00 -0.1
2 0.001 0.40 0.2
3 0.401 0.75 0.575
4 0.751 1.25 1.0
5 1.251 1.75 1.5
6 1.751 2.25 2.0
7 2.251 3.25 2.7
8 3.251 20 3.5
50 Vulnerability of Australian Houses to Riverine Inundation
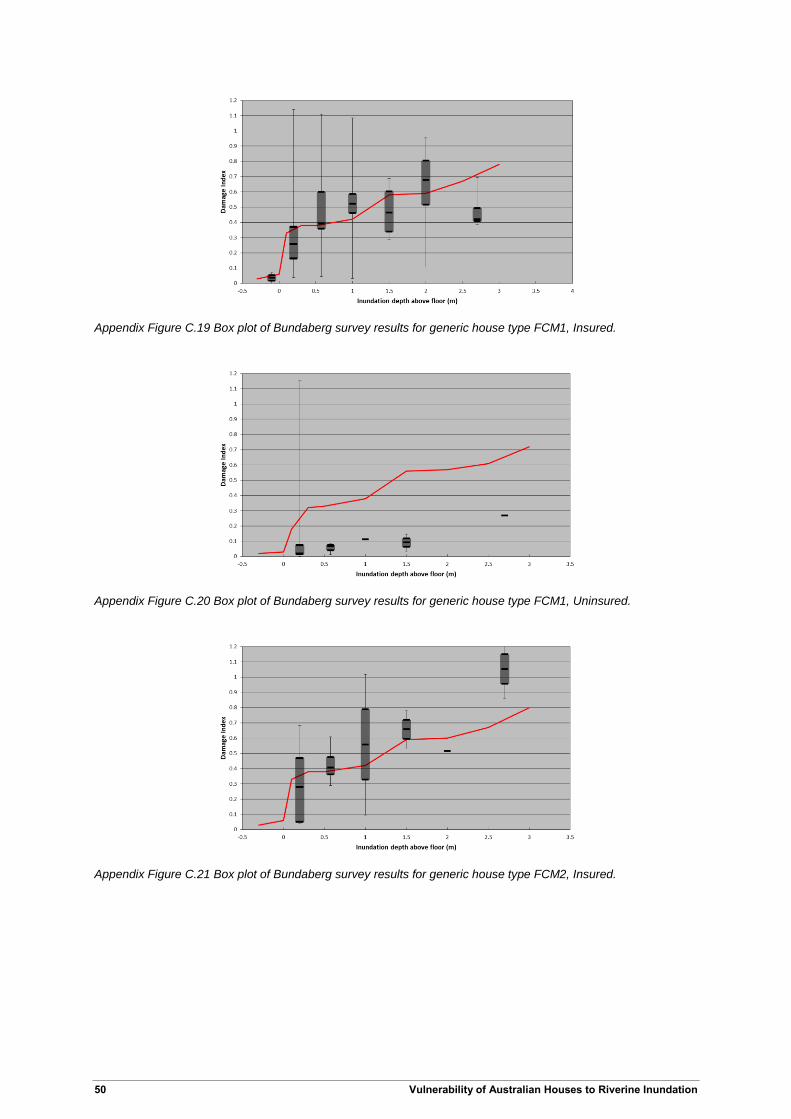
Appendix Figure C.19 Box plot of Bundaberg survey results for generic house type FCM1, Insured.
Appendix Figure C.20 Box plot of Bundaberg survey results for generic house type FCM1, Uninsured.
Appendix Figure C.21 Box plot of Bundaberg survey results for generic house type FCM2, Insured.
Vulnerability of Australian Houses to Riverine Inundation 51
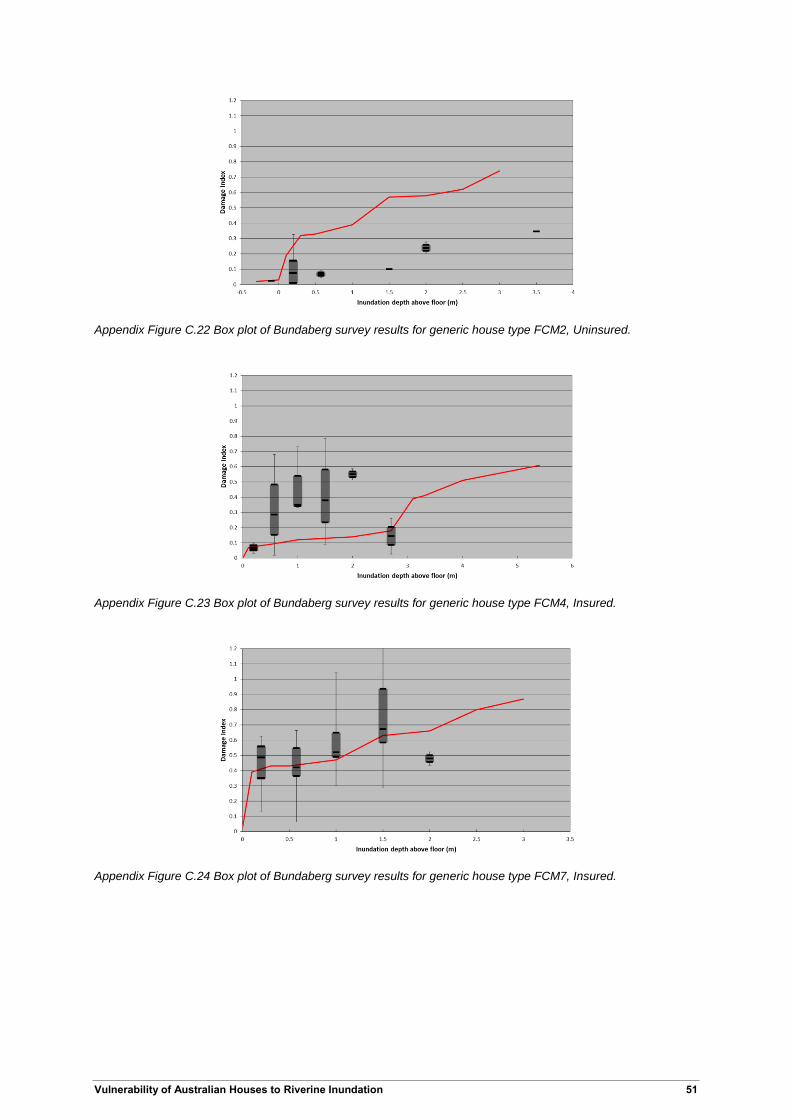
Appendix Figure C.22 Box plot of Bundaberg survey results for generic house type FCM2, Uninsured.
Appendix Figure C.23 Box plot of Bundaberg survey results for generic house type FCM4, Insured.
Appendix Figure C.24 Box plot of Bundaberg survey results for generic house type FCM7, Insured.
52 Vulnerability of Australian Houses to Riverine Inundation
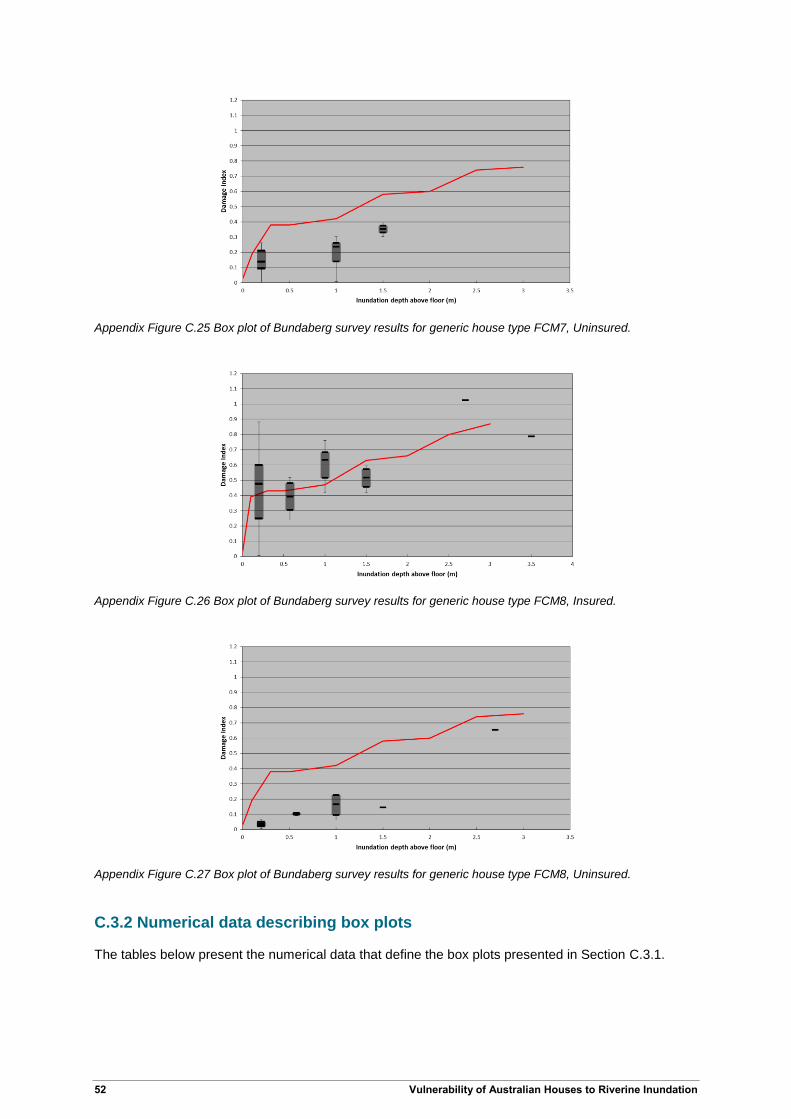
Appendix Figure C.25 Box plot of Bundaberg survey results for generic house type FCM7, Uninsured.
Appendix Figure C.26 Box plot of Bundaberg survey results for generic house type FCM8, Insured.
Appendix Figure C.27 Box plot of Bundaberg survey results for generic house type FCM8, Uninsured.
C.3.2 Numerical data describing box plots
The tables below present the numerical data that define the box plots presented in Section C.3.1.
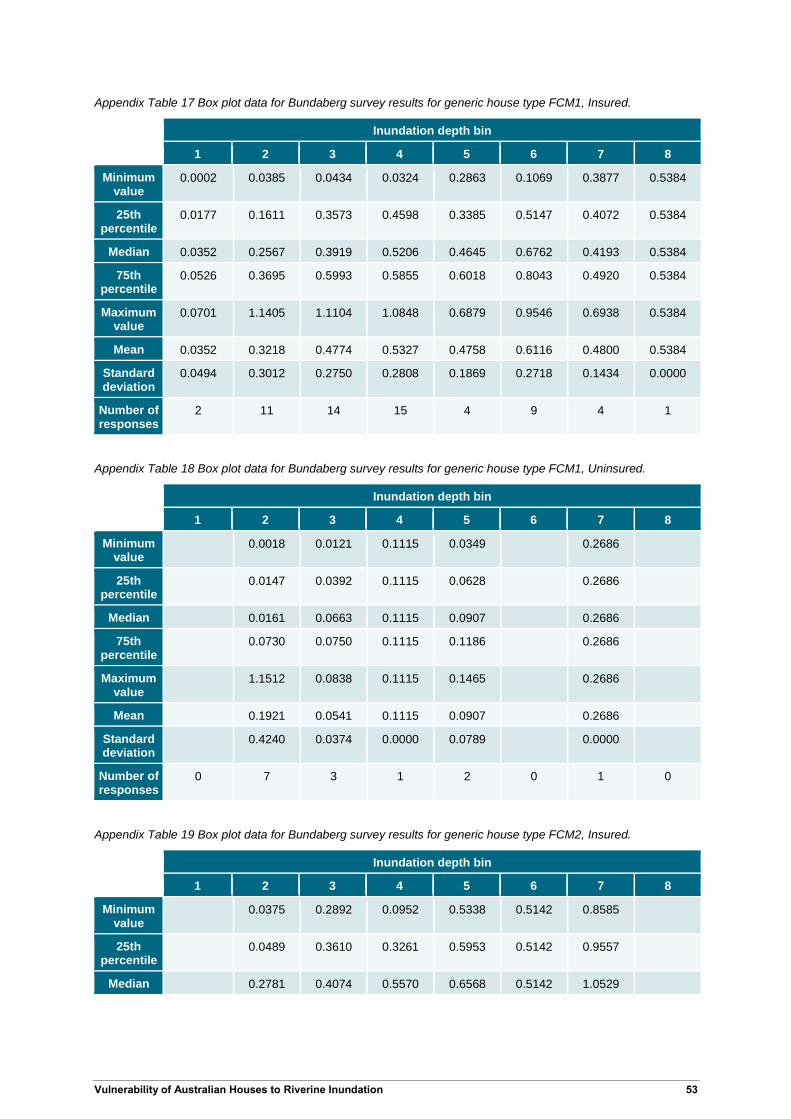
Vulnerability of Australian Houses to Riverine Inundation 53
Appendix Table 17 Box plot data for Bundaberg survey results for generic house type FCM1, Insured.
Inundation depth bin
1 2 3 4 5 6 7 8
Minimum value
0.0002 0.0385 0.0434 0.0324 0.2863 0.1069 0.3877 0.5384
25th percentile
0.0177 0.1611 0.3573 0.4598 0.3385 0.5147 0.4072 0.5384
Median 0.0352 0.2567 0.3919 0.5206 0.4645 0.6762 0.4193 0.5384
75th percentile
0.0526 0.3695 0.5993 0.5855 0.6018 0.8043 0.4920 0.5384
Maximum value
0.0701 1.1405 1.1104 1.0848 0.6879 0.9546 0.6938 0.5384
Mean 0.0352 0.3218 0.4774 0.5327 0.4758 0.6116 0.4800 0.5384
Standard deviation
0.0494 0.3012 0.2750 0.2808 0.1869 0.2718 0.1434 0.0000
Number of responses
2 11 14 15 4 9 4 1
Appendix Table 18 Box plot data for Bundaberg survey results for generic house type FCM1, Uninsured.
Inundation depth bin
1 2 3 4 5 6 7 8
Minimum value
0.0018 0.0121 0.1115 0.0349 0.2686
25th percentile
0.0147 0.0392 0.1115 0.0628 0.2686
Median 0.0161 0.0663 0.1115 0.0907 0.2686
75th percentile
0.0730 0.0750 0.1115 0.1186 0.2686
Maximum value
1.1512 0.0838 0.1115 0.1465 0.2686
Mean 0.1921 0.0541 0.1115 0.0907 0.2686
Standard deviation
0.4240 0.0374 0.0000 0.0789 0.0000
Number of responses
0 7 3 1 2 0 1 0
Appendix Table 19 Box plot data for Bundaberg survey results for generic house type FCM2, Insured.
Inundation depth bin
1 2 3 4 5 6 7 8
Minimum value
0.0375 0.2892 0.0952 0.5338 0.5142 0.8585
25th percentile
0.0489 0.3610 0.3261 0.5953 0.5142 0.9557
Median 0.2781 0.4074 0.5570 0.6568 0.5142 1.0529
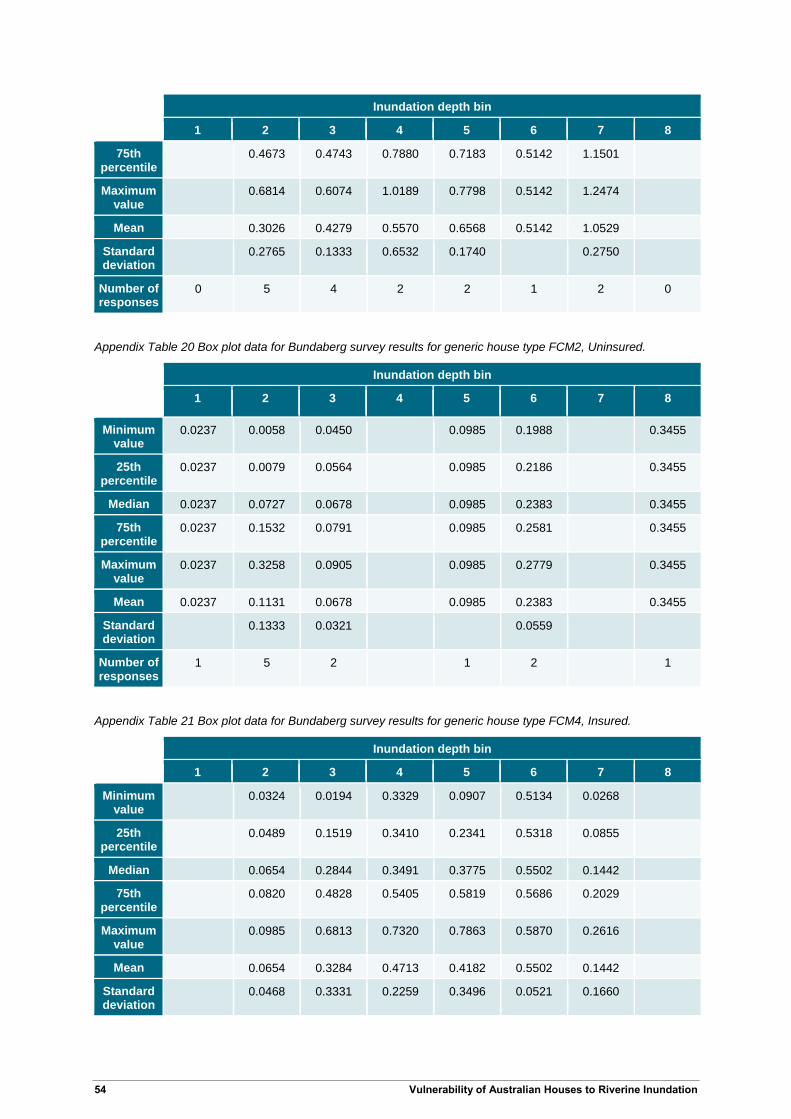
54 Vulnerability of Australian Houses to Riverine Inundation
Inundation depth bin
1 2 3 4 5 6 7 8
75th percentile
0.4673 0.4743 0.7880 0.7183 0.5142 1.1501
Maximum value
0.6814 0.6074 1.0189 0.7798 0.5142 1.2474
Mean 0.3026 0.4279 0.5570 0.6568 0.5142 1.0529
Standard deviation
0.2765 0.1333 0.6532 0.1740 0.2750
Number of responses
0 5 4 2 2 1 2 0
Appendix Table 20 Box plot data for Bundaberg survey results for generic house type FCM2, Uninsured.
Inundation depth bin
1 2 3 4 5 6 7 8
Minimum value
0.0237 0.0058 0.0450 0.0985 0.1988 0.3455
25th percentile
0.0237 0.0079 0.0564 0.0985 0.2186 0.3455
Median 0.0237 0.0727 0.0678 0.0985 0.2383 0.3455
75th percentile
0.0237 0.1532 0.0791 0.0985 0.2581 0.3455
Maximum value
0.0237 0.3258 0.0905 0.0985 0.2779 0.3455
Mean 0.0237 0.1131 0.0678 0.0985 0.2383 0.3455
Standard deviation
0.1333 0.0321 0.0559
Number of responses
1 5 2 1 2 1
Appendix Table 21 Box plot data for Bundaberg survey results for generic house type FCM4, Insured.
Inundation depth bin
1 2 3 4 5 6 7 8
Minimum value
0.0324 0.0194 0.3329 0.0907 0.5134 0.0268
25th percentile
0.0489 0.1519 0.3410 0.2341 0.5318 0.0855
Median 0.0654 0.2844 0.3491 0.3775 0.5502 0.1442
75th percentile
0.0820 0.4828 0.5405 0.5819 0.5686 0.2029
Maximum value
0.0985 0.6813 0.7320 0.7863 0.5870 0.2616
Mean 0.0654 0.3284 0.4713 0.4182 0.5502 0.1442
Standard deviation
0.0468 0.3331 0.2259 0.3496 0.0521 0.1660
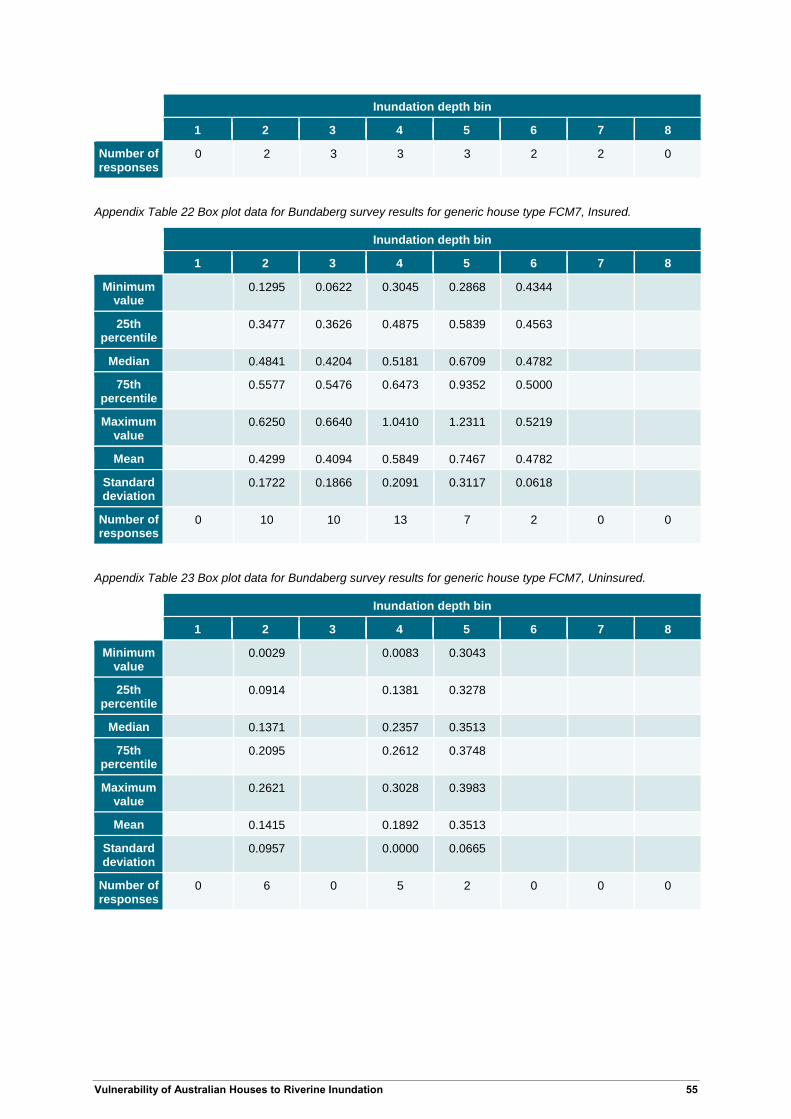
Vulnerability of Australian Houses to Riverine Inundation 55
Inundation depth bin
1 2 3 4 5 6 7 8
Number of responses
0 2 3 3 3 2 2 0
Appendix Table 22 Box plot data for Bundaberg survey results for generic house type FCM7, Insured.
Inundation depth bin
1 2 3 4 5 6 7 8
Minimum value
0.1295 0.0622 0.3045 0.2868 0.4344
25th percentile
0.3477 0.3626 0.4875 0.5839 0.4563
Median 0.4841 0.4204 0.5181 0.6709 0.4782
75th percentile
0.5577 0.5476 0.6473 0.9352 0.5000
Maximum value
0.6250 0.6640 1.0410 1.2311 0.5219
Mean 0.4299 0.4094 0.5849 0.7467 0.4782
Standard deviation
0.1722 0.1866 0.2091 0.3117 0.0618
Number of responses
0 10 10 13 7 2 0 0
Appendix Table 23 Box plot data for Bundaberg survey results for generic house type FCM7, Uninsured.
Inundation depth bin
1 2 3 4 5 6 7 8
Minimum value
0.0029 0.0083 0.3043
25th percentile
0.0914 0.1381 0.3278
Median 0.1371 0.2357 0.3513
75th percentile
0.2095 0.2612 0.3748
Maximum value
0.2621 0.3028 0.3983
Mean 0.1415 0.1892 0.3513
Standard deviation
0.0957 0.0000 0.0665
Number of responses
0 6 0 5 2 0 0 0
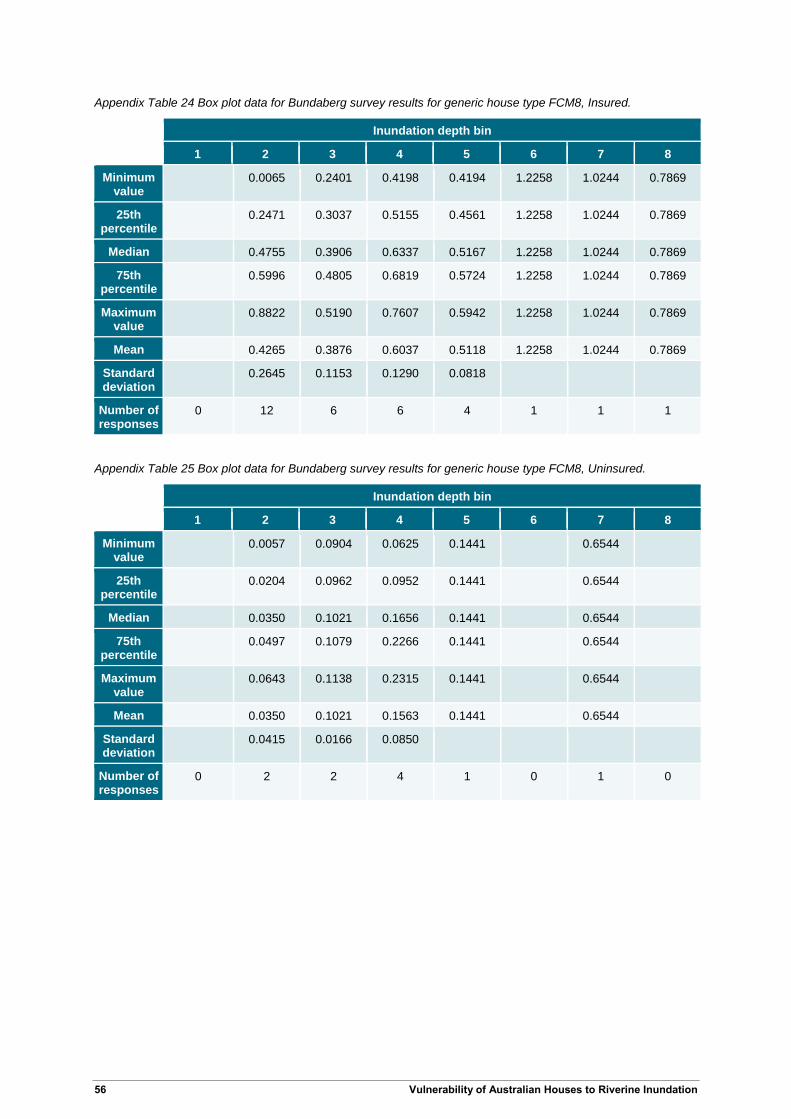
56 Vulnerability of Australian Houses to Riverine Inundation
Appendix Table 24 Box plot data for Bundaberg survey results for generic house type FCM8, Insured.
Inundation depth bin
1 2 3 4 5 6 7 8
Minimum value
0.0065 0.2401 0.4198 0.4194 1.2258 1.0244 0.7869
25th percentile
0.2471 0.3037 0.5155 0.4561 1.2258 1.0244 0.7869
Median 0.4755 0.3906 0.6337 0.5167 1.2258 1.0244 0.7869
75th percentile
0.5996 0.4805 0.6819 0.5724 1.2258 1.0244 0.7869
Maximum value
0.8822 0.5190 0.7607 0.5942 1.2258 1.0244 0.7869
Mean 0.4265 0.3876 0.6037 0.5118 1.2258 1.0244 0.7869
Standard deviation
0.2645 0.1153 0.1290 0.0818
Number of responses
0 12 6 6 4 1 1 1
Appendix Table 25 Box plot data for Bundaberg survey results for generic house type FCM8, Uninsured.
Inundation depth bin
1 2 3 4 5 6 7 8
Minimum value
0.0057 0.0904 0.0625 0.1441 0.6544
25th percentile
0.0204 0.0962 0.0952 0.1441 0.6544
Median 0.0350 0.1021 0.1656 0.1441 0.6544
75th percentile
0.0497 0.1079 0.2266 0.1441 0.6544
Maximum value
0.0643 0.1138 0.2315 0.1441 0.6544
Mean 0.0350 0.1021 0.1563 0.1441 0.6544
Standard deviation
0.0415 0.0166 0.0850
Number of responses
0 2 2 4 1 0 1 0
Vulnerability of Australian Houses to Riverine Inundation 57
Appendix D Empirical vulnerability curves derived from combined Brisbane-Ipswich and Bundaberg postal surveys
D.1 Graphs of empirical vulnerability curves
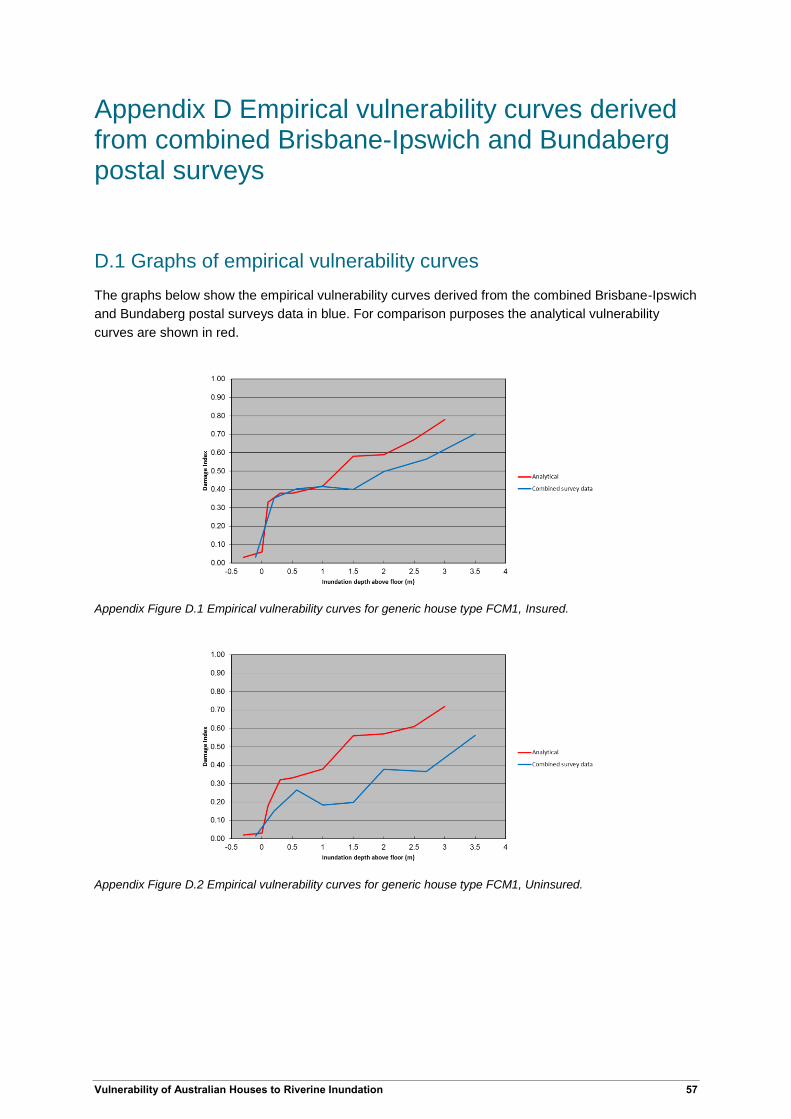
The graphs below show the empirical vulnerability curves derived from the combined Brisbane-Ipswich
and Bundaberg postal surveys data in blue. For comparison purposes the analytical vulnerability
curves are shown in red.
Appendix Figure D.1 Empirical vulnerability curves for generic house type FCM1, Insured.
Appendix Figure D.2 Empirical vulnerability curves for generic house type FCM1, Uninsured.
58 Vulnerability of Australian Houses to Riverine Inundation
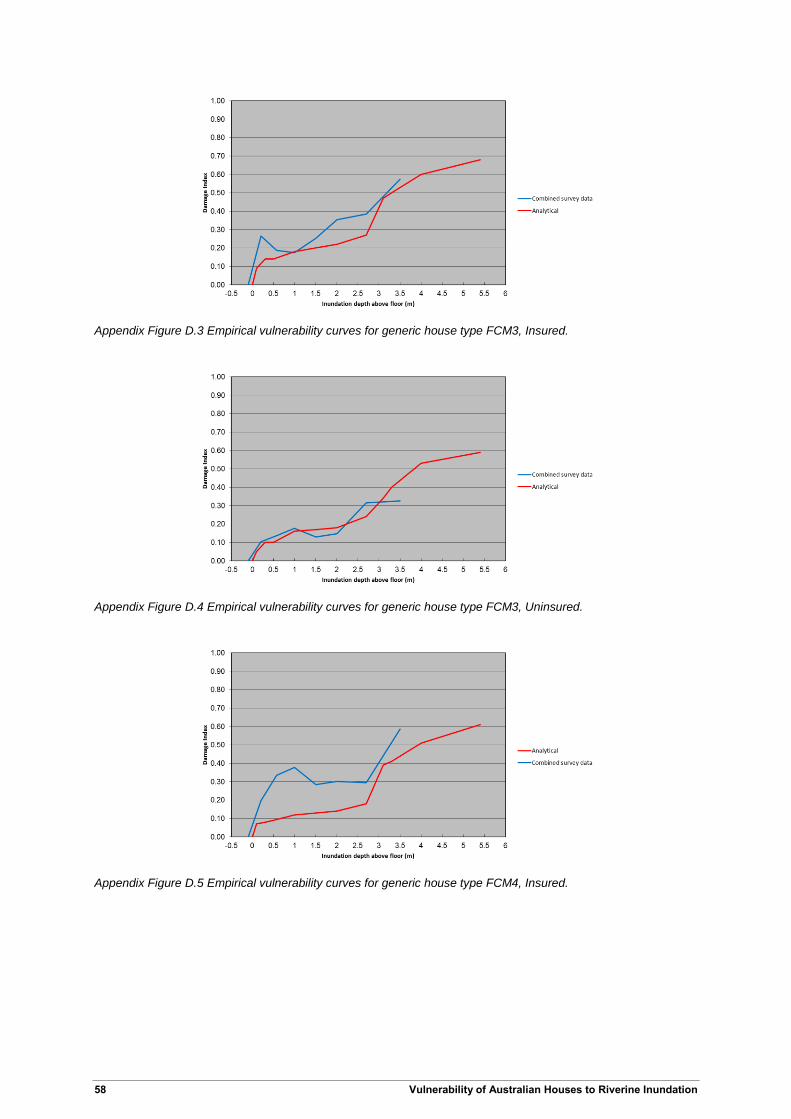
Appendix Figure D.3 Empirical vulnerability curves for generic house type FCM3, Insured.
Appendix Figure D.4 Empirical vulnerability curves for generic house type FCM3, Uninsured.
Appendix Figure D.5 Empirical vulnerability curves for generic house type FCM4, Insured.
Vulnerability of Australian Houses to Riverine Inundation 59
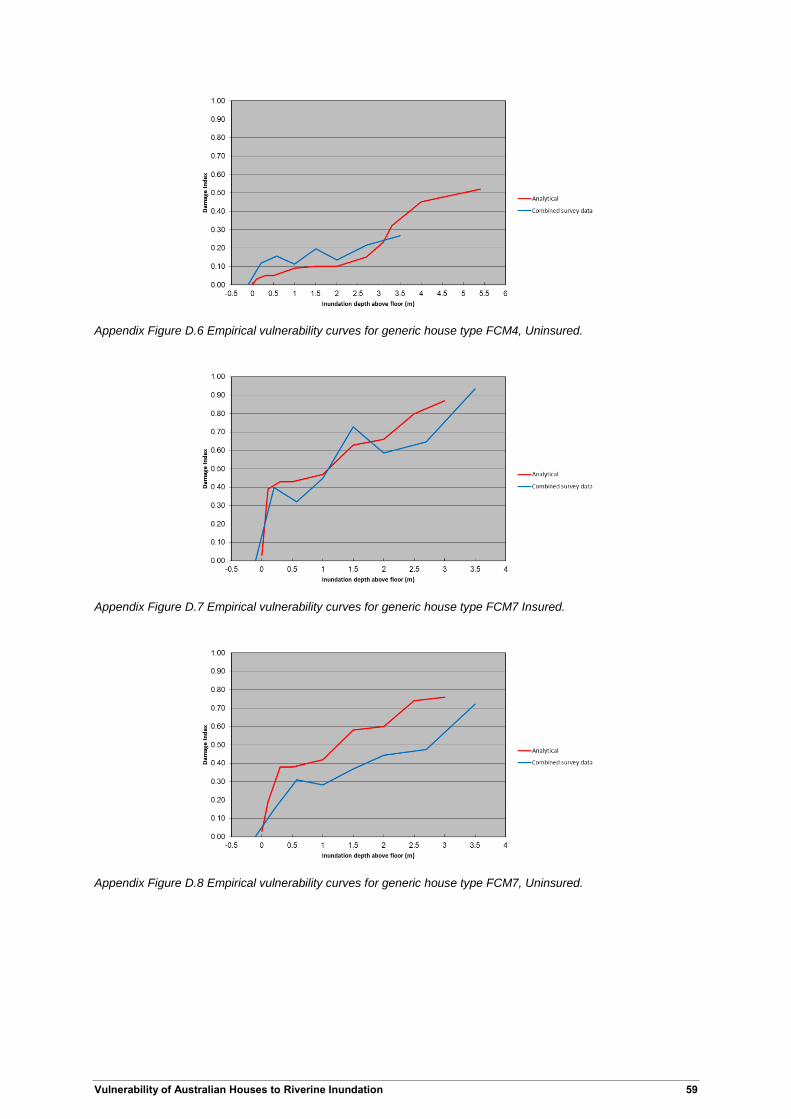
Appendix Figure D.6 Empirical vulnerability curves for generic house type FCM4, Uninsured.
Appendix Figure D.7 Empirical vulnerability curves for generic house type FCM7 Insured.
Appendix Figure D.8 Empirical vulnerability curves for generic house type FCM7, Uninsured.
60 Vulnerability of Australian Houses to Riverine Inundation
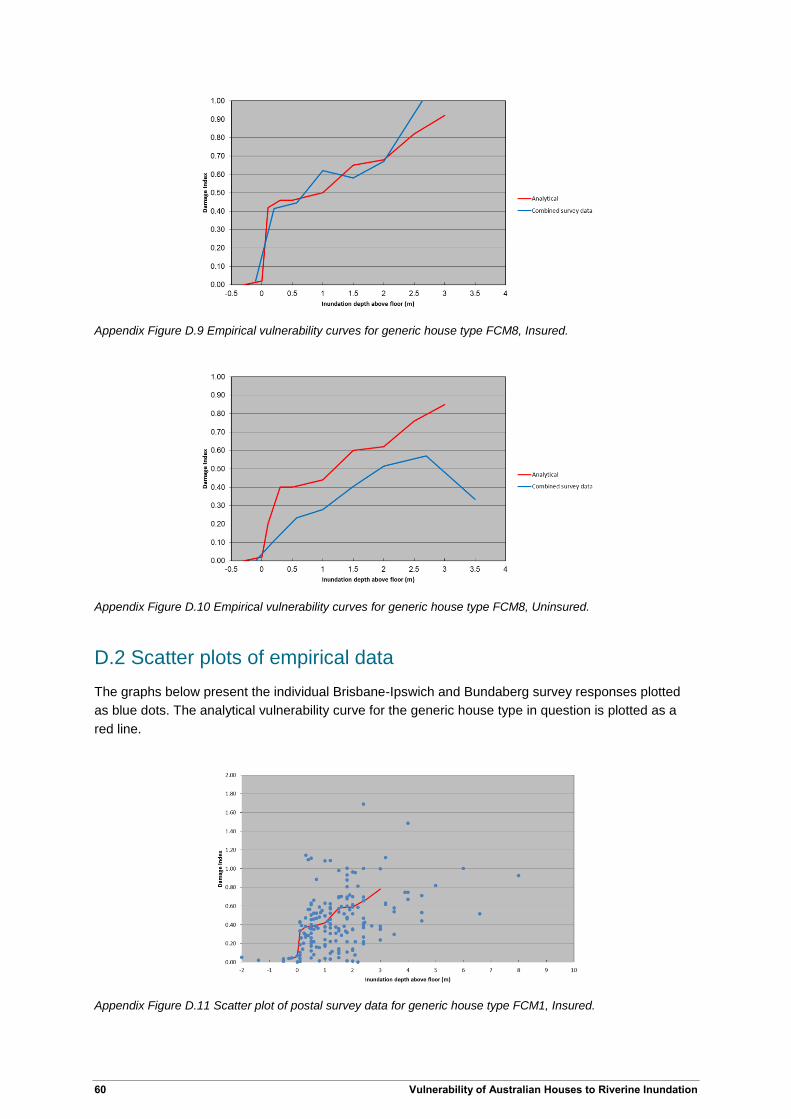
Appendix Figure D.9 Empirical vulnerability curves for generic house type FCM8, Insured.
Appendix Figure D.10 Empirical vulnerability curves for generic house type FCM8, Uninsured.
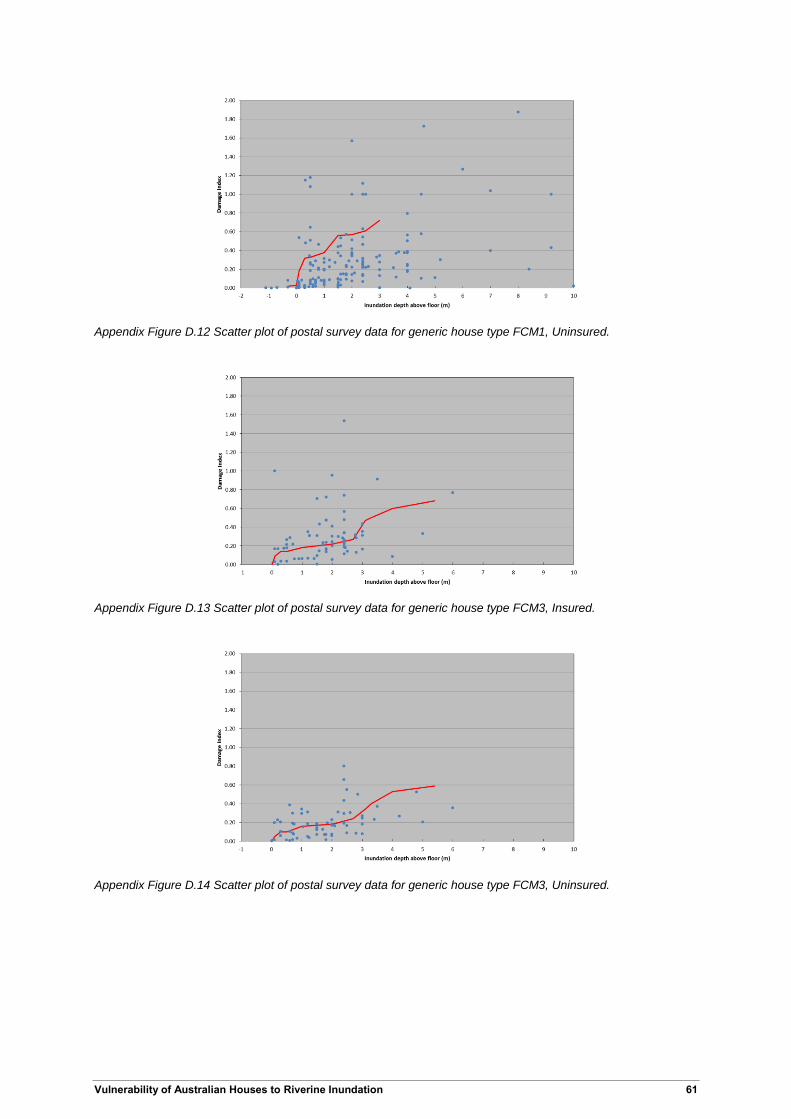
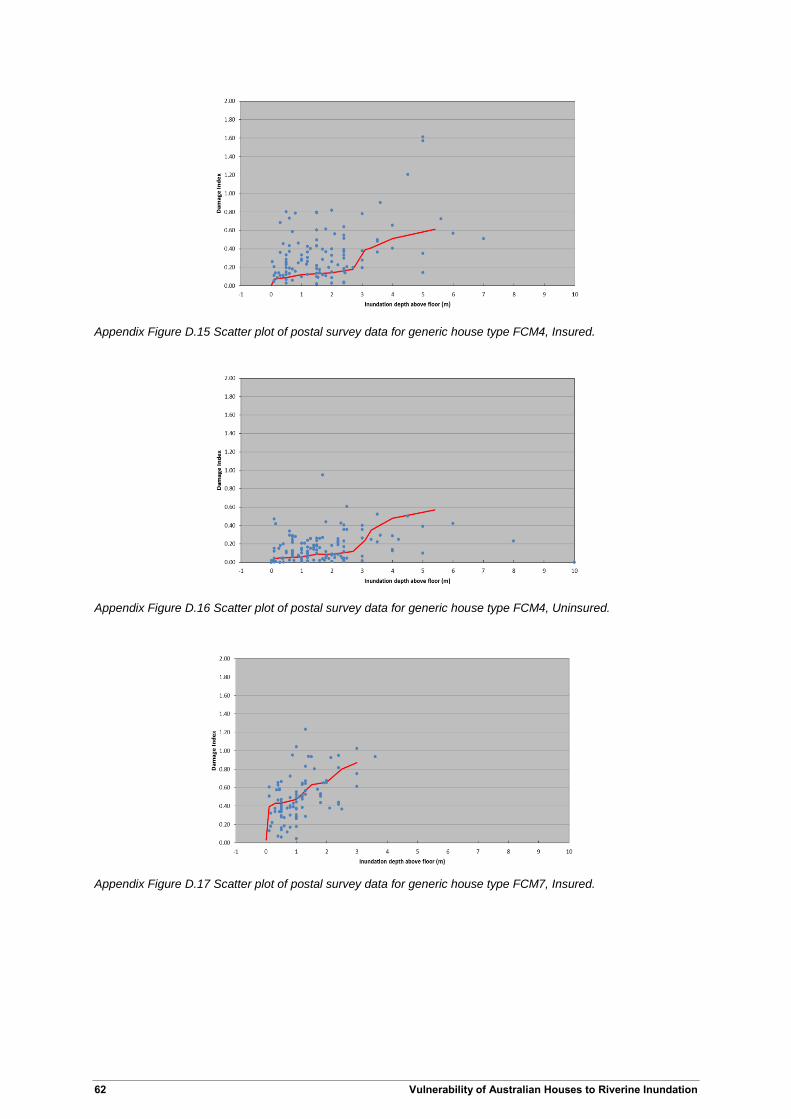
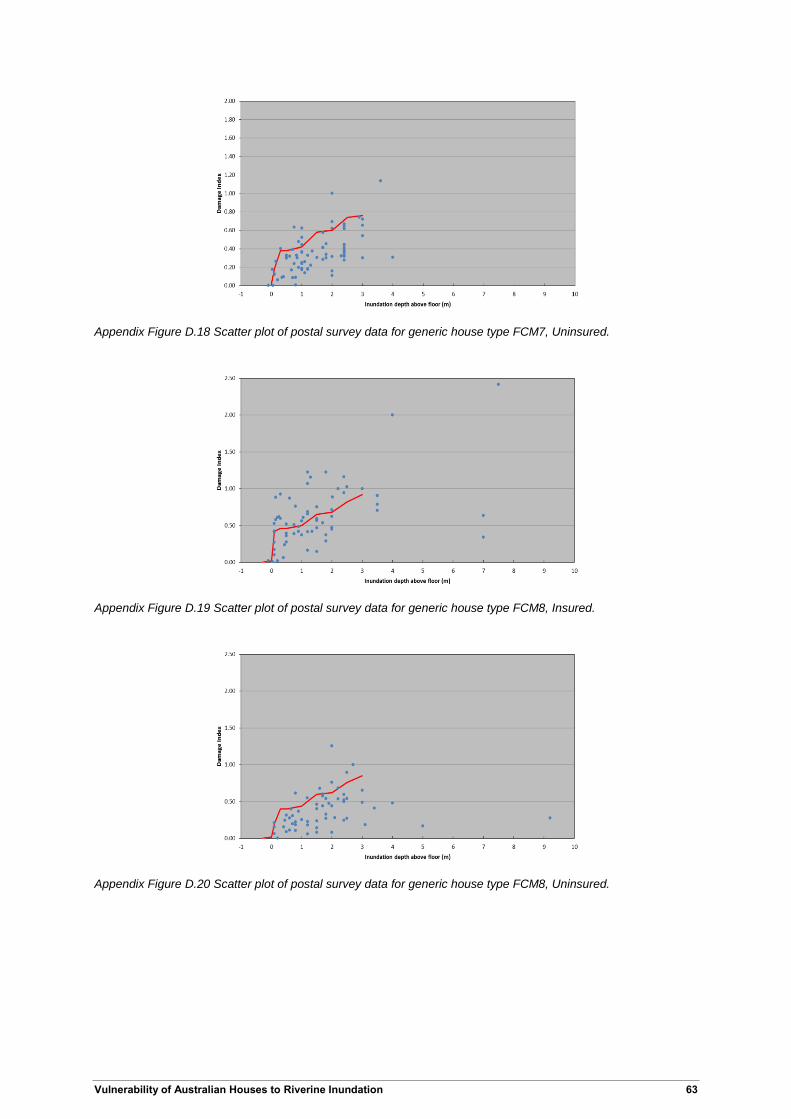
D.2 Scatter plots of empirical data
The graphs below present the individual Brisbane-Ipswich and Bundaberg survey responses plotted
as blue dots. The analytical vulnerability curve for the generic house type in question is plotted as a
red line.
Appendix Figure D.11 Scatter plot of postal survey data for generic house type FCM1, Insured.
Vulnerability of Australian Houses to Riverine Inundation 61
Appendix Figure D.12 Scatter plot of postal survey data for generic house type FCM1, Uninsured.
Appendix Figure D.13 Scatter plot of postal survey data for generic house type FCM3, Insured.
Appendix Figure D.14 Scatter plot of postal survey data for generic house type FCM3, Uninsured.
62 Vulnerability of Australian Houses to Riverine Inundation
Appendix Figure D.15 Scatter plot of postal survey data for generic house type FCM4, Insured.
Appendix Figure D.16 Scatter plot of postal survey data for generic house type FCM4, Uninsured.
Appendix Figure D.17 Scatter plot of postal survey data for generic house type FCM7, Insured.
Vulnerability of Australian Houses to Riverine Inundation 63
Appendix Figure D.18 Scatter plot of postal survey data for generic house type FCM7, Uninsured.
Appendix Figure D.19 Scatter plot of postal survey data for generic house type FCM8, Insured.
Appendix Figure D.20 Scatter plot of postal survey data for generic house type FCM8, Uninsured.
64 Vulnerability of Australian Houses to Riverine Inundation
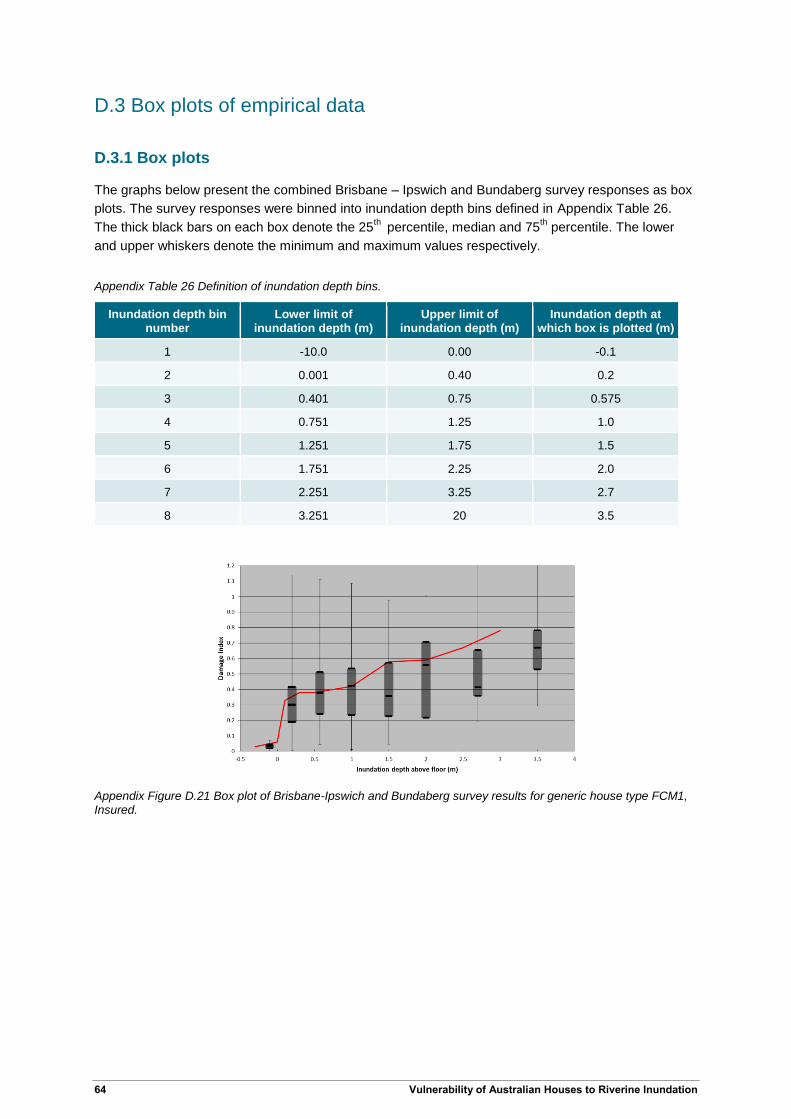
D.3 Box plots of empirical data
D.3.1 Box plots
The graphs below present the combined Brisbane – Ipswich and Bundaberg survey responses as box
plots. The survey responses were binned into inundation depth bins defined in Appendix Table 26.
The thick black bars on each box denote the 25th
percentile, median and 75th percentile. The lower
and upper whiskers denote the minimum and maximum values respectively.
Appendix Table 26 Definition of inundation depth bins.
Inundation depth bin number
Lower limit of inundation depth (m)
Upper limit of inundation depth (m)
Inundation depth at which box is plotted (m)
1 -10.0 0.00 -0.1
2 0.001 0.40 0.2
3 0.401 0.75 0.575
4 0.751 1.25 1.0
5 1.251 1.75 1.5
6 1.751 2.25 2.0
7 2.251 3.25 2.7
8 3.251 20 3.5
Appendix Figure D.21 Box plot of Brisbane-Ipswich and Bundaberg survey results for generic house type FCM1, Insured.
Vulnerability of Australian Houses to Riverine Inundation 65
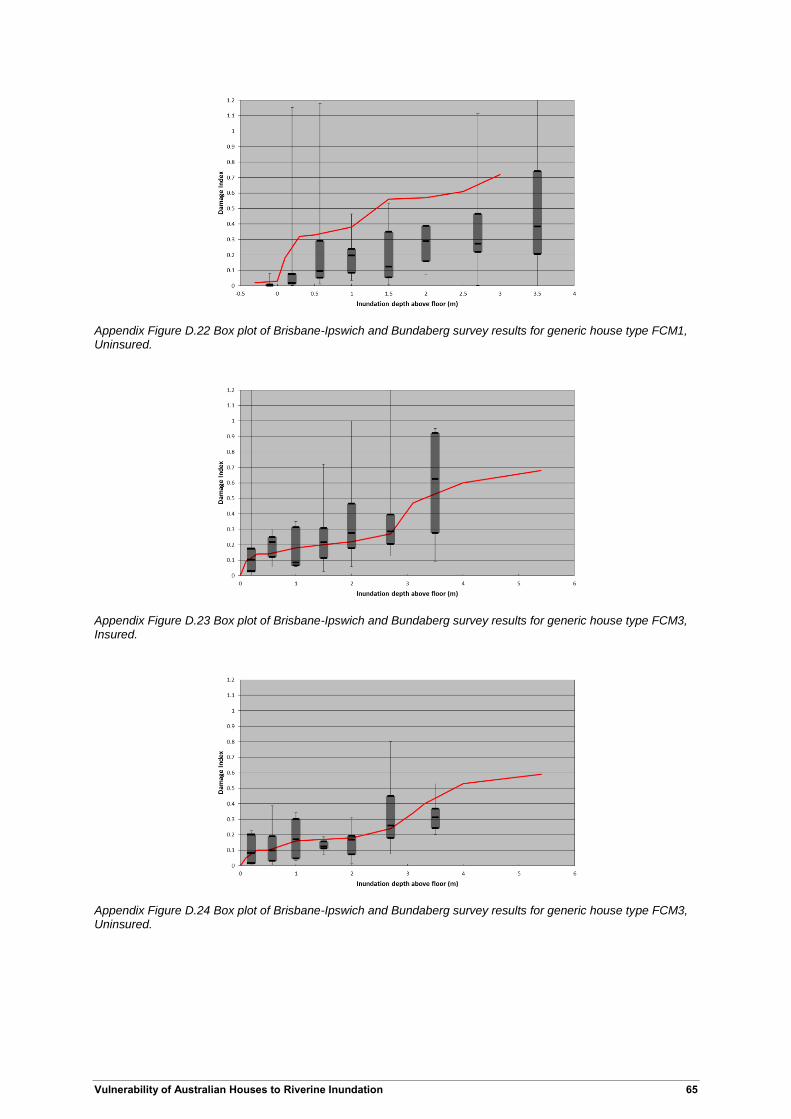
Appendix Figure D.22 Box plot of Brisbane-Ipswich and Bundaberg survey results for generic house type FCM1, Uninsured.
Appendix Figure D.23 Box plot of Brisbane-Ipswich and Bundaberg survey results for generic house type FCM3, Insured.
Appendix Figure D.24 Box plot of Brisbane-Ipswich and Bundaberg survey results for generic house type FCM3, Uninsured.
66 Vulnerability of Australian Houses to Riverine Inundation
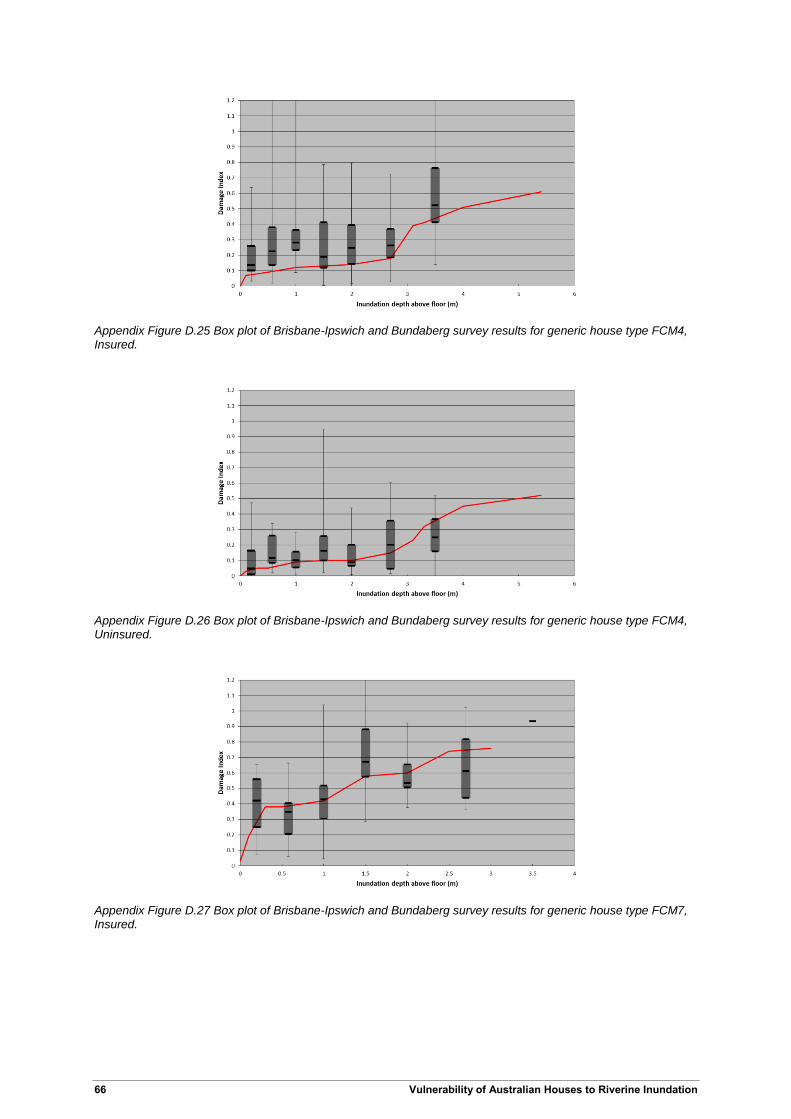
Appendix Figure D.25 Box plot of Brisbane-Ipswich and Bundaberg survey results for generic house type FCM4, Insured.
Appendix Figure D.26 Box plot of Brisbane-Ipswich and Bundaberg survey results for generic house type FCM4, Uninsured.
Appendix Figure D.27 Box plot of Brisbane-Ipswich and Bundaberg survey results for generic house type FCM7, Insured.
Vulnerability of Australian Houses to Riverine Inundation 67
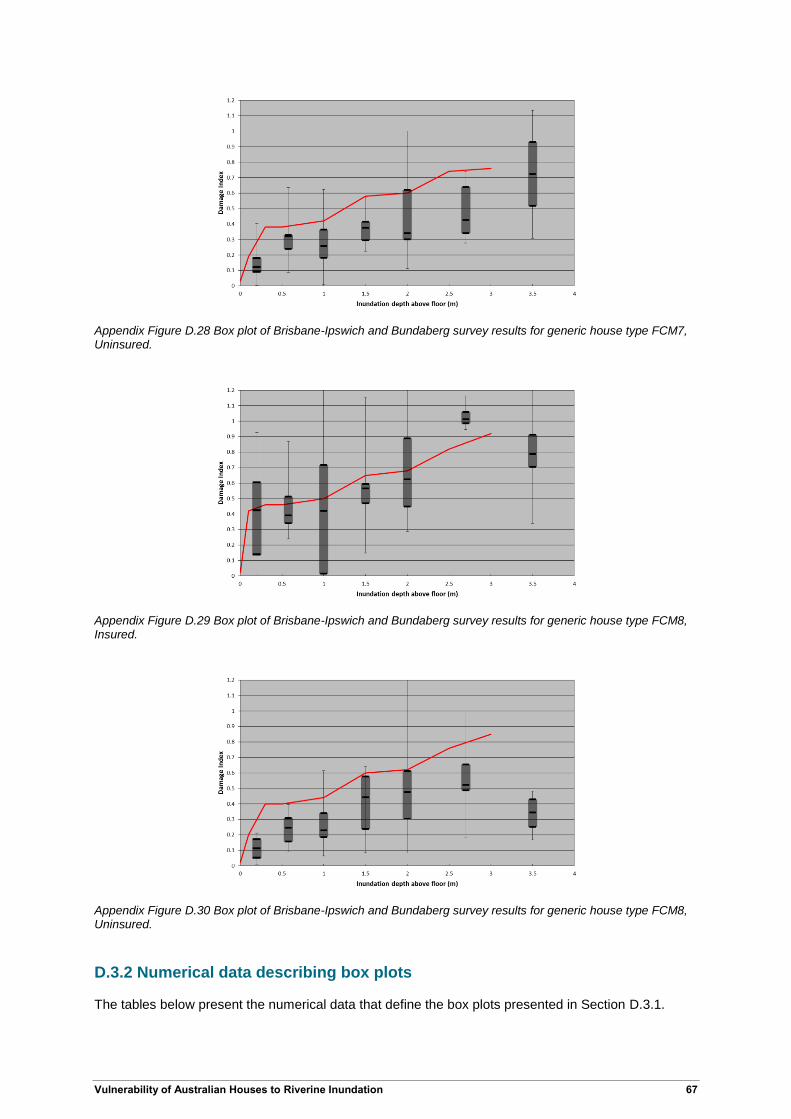
Appendix Figure D.28 Box plot of Brisbane-Ipswich and Bundaberg survey results for generic house type FCM7, Uninsured.
Appendix Figure D.29 Box plot of Brisbane-Ipswich and Bundaberg survey results for generic house type FCM8, Insured.
Appendix Figure D.30 Box plot of Brisbane-Ipswich and Bundaberg survey results for generic house type FCM8, Uninsured.
D.3.2 Numerical data describing box plots
The tables below present the numerical data that define the box plots presented in Section D.3.1.
68 Vulnerability of Australian Houses to Riverine Inundation
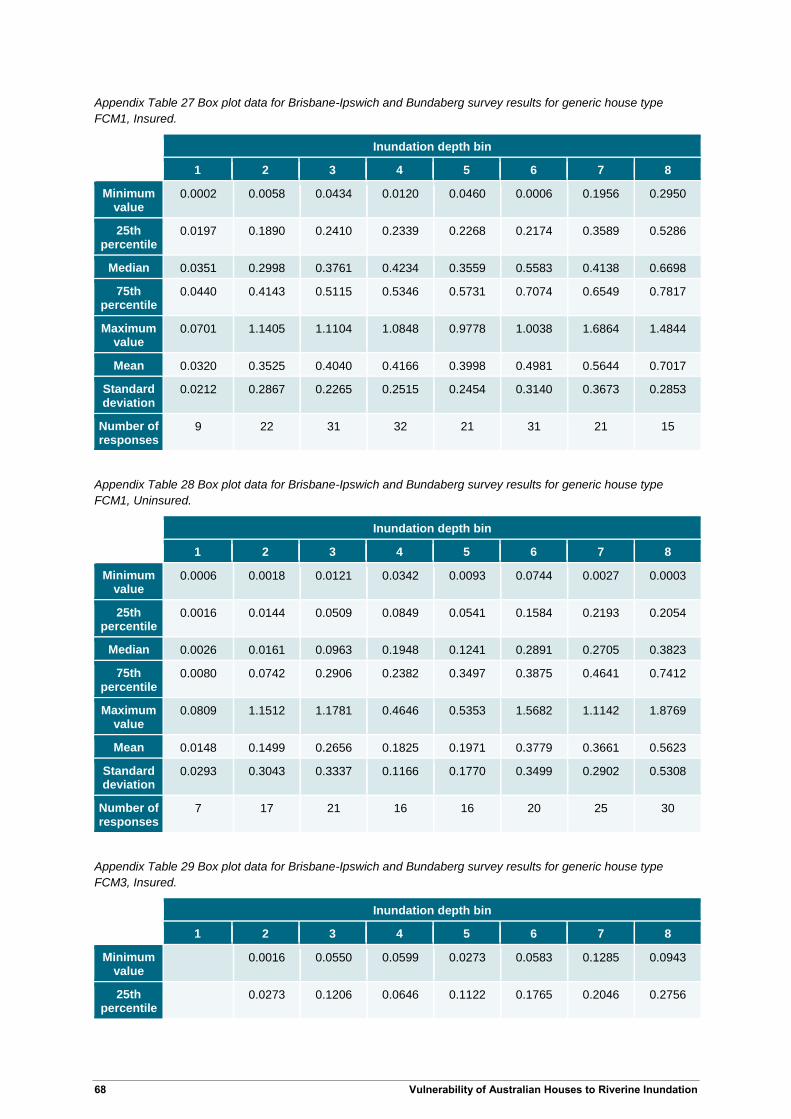
Appendix Table 27 Box plot data for Brisbane-Ipswich and Bundaberg survey results for generic house type
FCM1, Insured.
Inundation depth bin
1 2 3 4 5 6 7 8
Minimum value
0.0002 0.0058 0.0434 0.0120 0.0460 0.0006 0.1956 0.2950
25th percentile
0.0197 0.1890 0.2410 0.2339 0.2268 0.2174 0.3589 0.5286
Median 0.0351 0.2998 0.3761 0.4234 0.3559 0.5583 0.4138 0.6698
75th percentile
0.0440 0.4143 0.5115 0.5346 0.5731 0.7074 0.6549 0.7817
Maximum value
0.0701 1.1405 1.1104 1.0848 0.9778 1.0038 1.6864 1.4844
Mean 0.0320 0.3525 0.4040 0.4166 0.3998 0.4981 0.5644 0.7017
Standard deviation
0.0212 0.2867 0.2265 0.2515 0.2454 0.3140 0.3673 0.2853
Number of responses
9 22 31 32 21 31 21 15
Appendix Table 28 Box plot data for Brisbane-Ipswich and Bundaberg survey results for generic house type
FCM1, Uninsured.
Inundation depth bin
1 2 3 4 5 6 7 8
Minimum value
0.0006 0.0018 0.0121 0.0342 0.0093 0.0744 0.0027 0.0003
25th percentile
0.0016 0.0144 0.0509 0.0849 0.0541 0.1584 0.2193 0.2054
Median 0.0026 0.0161 0.0963 0.1948 0.1241 0.2891 0.2705 0.3823
75th percentile
0.0080 0.0742 0.2906 0.2382 0.3497 0.3875 0.4641 0.7412
Maximum value
0.0809 1.1512 1.1781 0.4646 0.5353 1.5682 1.1142 1.8769
Mean 0.0148 0.1499 0.2656 0.1825 0.1971 0.3779 0.3661 0.5623
Standard deviation
0.0293 0.3043 0.3337 0.1166 0.1770 0.3499 0.2902 0.5308
Number of responses
7 17 21 16 16 20 25 30
Appendix Table 29 Box plot data for Brisbane-Ipswich and Bundaberg survey results for generic house type
FCM3, Insured.
Inundation depth bin
1 2 3 4 5 6 7 8
Minimum value
0.0016 0.0550 0.0599 0.0273 0.0583 0.1285 0.0943
25th percentile
0.0273 0.1206 0.0646 0.1122 0.1765 0.2046 0.2756
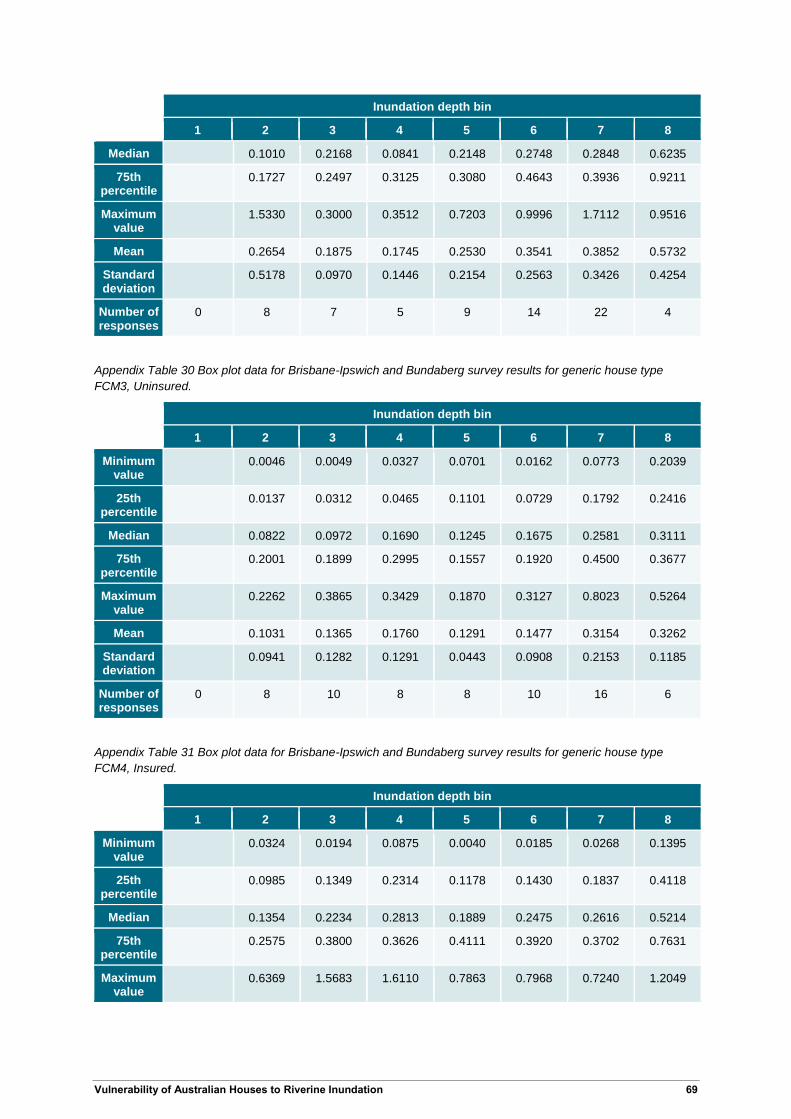
Vulnerability of Australian Houses to Riverine Inundation 69
Inundation depth bin
1 2 3 4 5 6 7 8
Median 0.1010 0.2168 0.0841 0.2148 0.2748 0.2848 0.6235
75th percentile
0.1727 0.2497 0.3125 0.3080 0.4643 0.3936 0.9211
Maximum value
1.5330 0.3000 0.3512 0.7203 0.9996 1.7112 0.9516
Mean 0.2654 0.1875 0.1745 0.2530 0.3541 0.3852 0.5732
Standard deviation
0.5178 0.0970 0.1446 0.2154 0.2563 0.3426 0.4254
Number of responses
0 8 7 5 9 14 22 4
Appendix Table 30 Box plot data for Brisbane-Ipswich and Bundaberg survey results for generic house type
FCM3, Uninsured.
Inundation depth bin
1 2 3 4 5 6 7 8
Minimum value
0.0046 0.0049 0.0327 0.0701 0.0162 0.0773 0.2039
25th percentile
0.0137 0.0312 0.0465 0.1101 0.0729 0.1792 0.2416
Median 0.0822 0.0972 0.1690 0.1245 0.1675 0.2581 0.3111
75th percentile
0.2001 0.1899 0.2995 0.1557 0.1920 0.4500 0.3677
Maximum value
0.2262 0.3865 0.3429 0.1870 0.3127 0.8023 0.5264
Mean 0.1031 0.1365 0.1760 0.1291 0.1477 0.3154 0.3262
Standard deviation
0.0941 0.1282 0.1291 0.0443 0.0908 0.2153 0.1185
Number of responses
0 8 10 8 8 10 16 6
Appendix Table 31 Box plot data for Brisbane-Ipswich and Bundaberg survey results for generic house type
FCM4, Insured.
Inundation depth bin
1 2 3 4 5 6 7 8
Minimum value
0.0324 0.0194 0.0875 0.0040 0.0185 0.0268 0.1395
25th percentile
0.0985 0.1349 0.2314 0.1178 0.1430 0.1837 0.4118
Median 0.1354 0.2234 0.2813 0.1889 0.2475 0.2616 0.5214
75th percentile
0.2575 0.3800 0.3626 0.4111 0.3920 0.3702 0.7631
Maximum value
0.6369 1.5683 1.6110 0.7863 0.7968 0.7240 1.2049
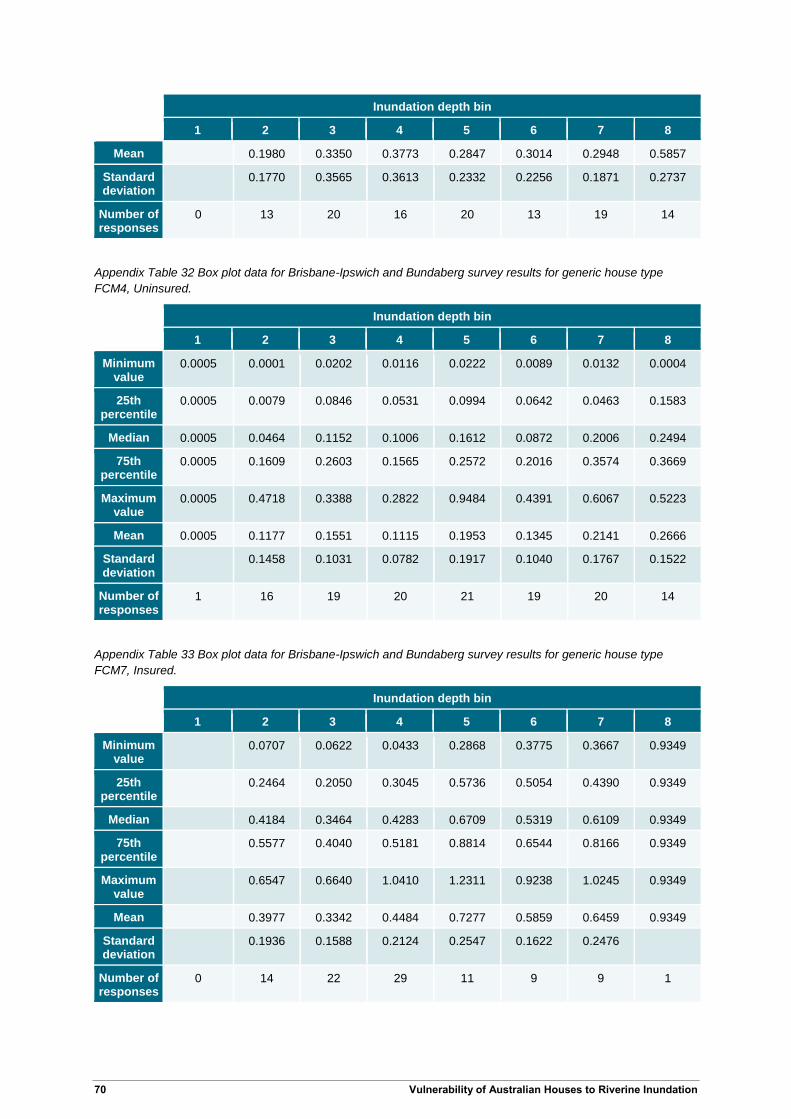
70 Vulnerability of Australian Houses to Riverine Inundation
Inundation depth bin
1 2 3 4 5 6 7 8
Mean 0.1980 0.3350 0.3773 0.2847 0.3014 0.2948 0.5857
Standard deviation
0.1770 0.3565 0.3613 0.2332 0.2256 0.1871 0.2737
Number of responses
0 13 20 16 20 13 19 14
Appendix Table 32 Box plot data for Brisbane-Ipswich and Bundaberg survey results for generic house type
FCM4, Uninsured.
Inundation depth bin
1 2 3 4 5 6 7 8
Minimum value
0.0005 0.0001 0.0202 0.0116 0.0222 0.0089 0.0132 0.0004
25th percentile
0.0005 0.0079 0.0846 0.0531 0.0994 0.0642 0.0463 0.1583
Median 0.0005 0.0464 0.1152 0.1006 0.1612 0.0872 0.2006 0.2494
75th percentile
0.0005 0.1609 0.2603 0.1565 0.2572 0.2016 0.3574 0.3669
Maximum value
0.0005 0.4718 0.3388 0.2822 0.9484 0.4391 0.6067 0.5223
Mean 0.0005 0.1177 0.1551 0.1115 0.1953 0.1345 0.2141 0.2666
Standard deviation
0.1458 0.1031 0.0782 0.1917 0.1040 0.1767 0.1522
Number of responses
1 16 19 20 21 19 20 14
Appendix Table 33 Box plot data for Brisbane-Ipswich and Bundaberg survey results for generic house type
FCM7, Insured.
Inundation depth bin
1 2 3 4 5 6 7 8
Minimum value
0.0707 0.0622 0.0433 0.2868 0.3775 0.3667 0.9349
25th percentile
0.2464 0.2050 0.3045 0.5736 0.5054 0.4390 0.9349
Median 0.4184 0.3464 0.4283 0.6709 0.5319 0.6109 0.9349
75th percentile
0.5577 0.4040 0.5181 0.8814 0.6544 0.8166 0.9349
Maximum value
0.6547 0.6640 1.0410 1.2311 0.9238 1.0245 0.9349
Mean 0.3977 0.3342 0.4484 0.7277 0.5859 0.6459 0.9349
Standard deviation
0.1936 0.1588 0.2124 0.2547 0.1622 0.2476
Number of responses
0 14 22 29 11 9 9 1
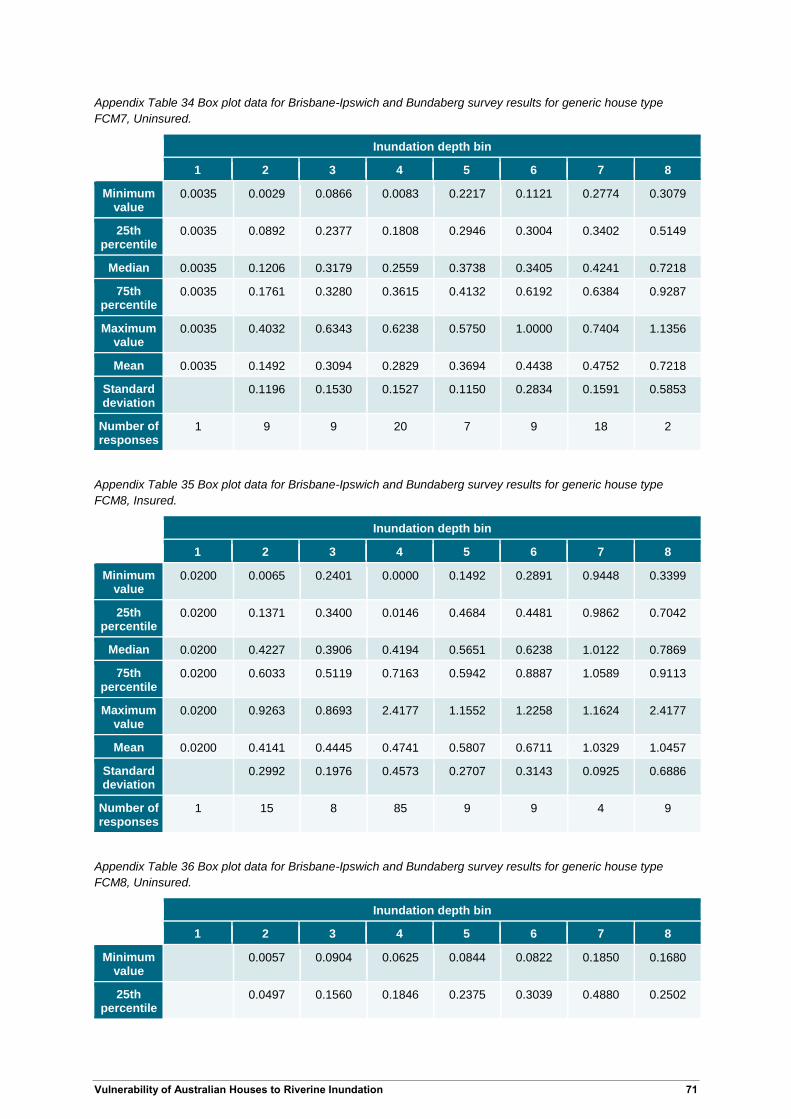
Vulnerability of Australian Houses to Riverine Inundation 71
Appendix Table 34 Box plot data for Brisbane-Ipswich and Bundaberg survey results for generic house type
FCM7, Uninsured.
Inundation depth bin
1 2 3 4 5 6 7 8
Minimum value
0.0035 0.0029 0.0866 0.0083 0.2217 0.1121 0.2774 0.3079
25th percentile
0.0035 0.0892 0.2377 0.1808 0.2946 0.3004 0.3402 0.5149
Median 0.0035 0.1206 0.3179 0.2559 0.3738 0.3405 0.4241 0.7218
75th percentile
0.0035 0.1761 0.3280 0.3615 0.4132 0.6192 0.6384 0.9287
Maximum value
0.0035 0.4032 0.6343 0.6238 0.5750 1.0000 0.7404 1.1356
Mean 0.0035 0.1492 0.3094 0.2829 0.3694 0.4438 0.4752 0.7218
Standard deviation
0.1196 0.1530 0.1527 0.1150 0.2834 0.1591 0.5853
Number of responses
1 9 9 20 7 9 18 2
Appendix Table 35 Box plot data for Brisbane-Ipswich and Bundaberg survey results for generic house type
FCM8, Insured.
Inundation depth bin
1 2 3 4 5 6 7 8
Minimum value
0.0200 0.0065 0.2401 0.0000 0.1492 0.2891 0.9448 0.3399
25th percentile
0.0200 0.1371 0.3400 0.0146 0.4684 0.4481 0.9862 0.7042
Median 0.0200 0.4227 0.3906 0.4194 0.5651 0.6238 1.0122 0.7869
75th percentile
0.0200 0.6033 0.5119 0.7163 0.5942 0.8887 1.0589 0.9113
Maximum value
0.0200 0.9263 0.8693 2.4177 1.1552 1.2258 1.1624 2.4177
Mean 0.0200 0.4141 0.4445 0.4741 0.5807 0.6711 1.0329 1.0457
Standard deviation
0.2992 0.1976 0.4573 0.2707 0.3143 0.0925 0.6886
Number of responses
1 15 8 85 9 9 4 9
Appendix Table 36 Box plot data for Brisbane-Ipswich and Bundaberg survey results for generic house type
FCM8, Uninsured.
Inundation depth bin
1 2 3 4 5 6 7 8
Minimum value
0.0057 0.0904 0.0625 0.0844 0.0822 0.1850 0.1680
25th percentile
0.0497 0.1560 0.1846 0.2375 0.3039 0.4880 0.2502
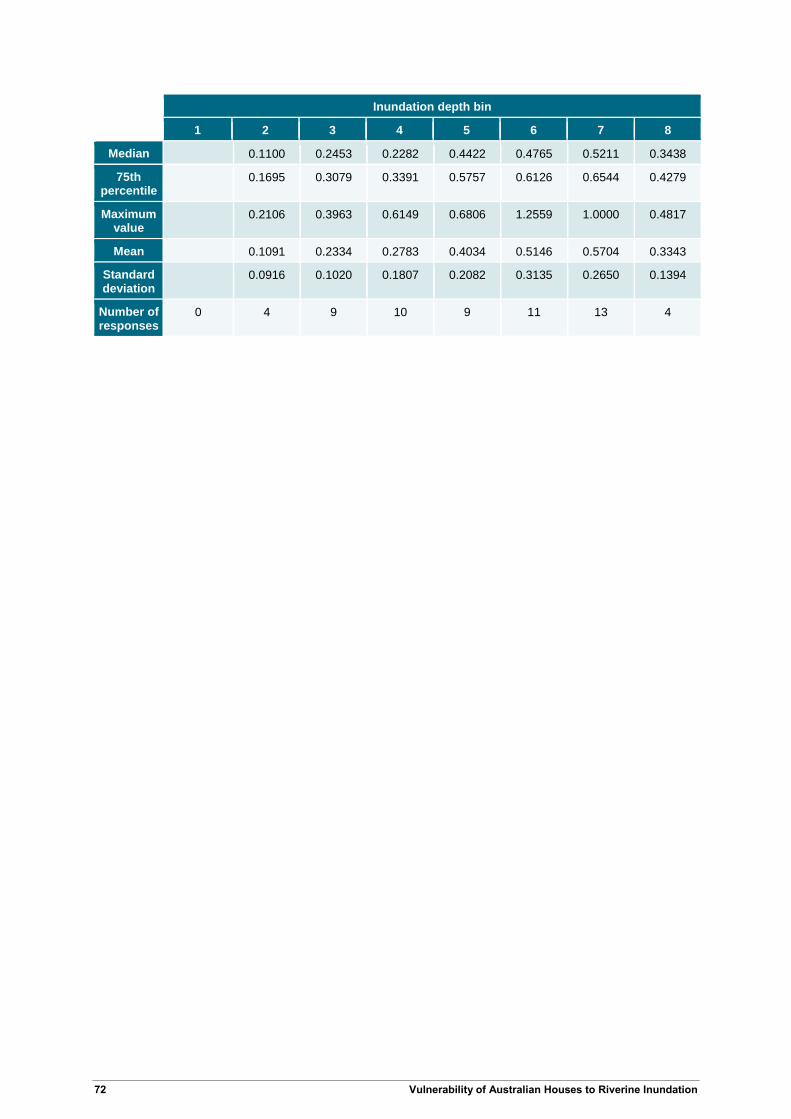
72 Vulnerability of Australian Houses to Riverine Inundation
Inundation depth bin
1 2 3 4 5 6 7 8
Median 0.1100 0.2453 0.2282 0.4422 0.4765 0.5211 0.3438
75th percentile
0.1695 0.3079 0.3391 0.5757 0.6126 0.6544 0.4279
Maximum value
0.2106 0.3963 0.6149 0.6806 1.2559 1.0000 0.4817
Mean 0.1091 0.2334 0.2783 0.4034 0.5146 0.5704 0.3343
Standard deviation
0.0916 0.1020 0.1807 0.2082 0.3135 0.2650 0.1394
Number of responses
0 4 9 10 9 11 13 4
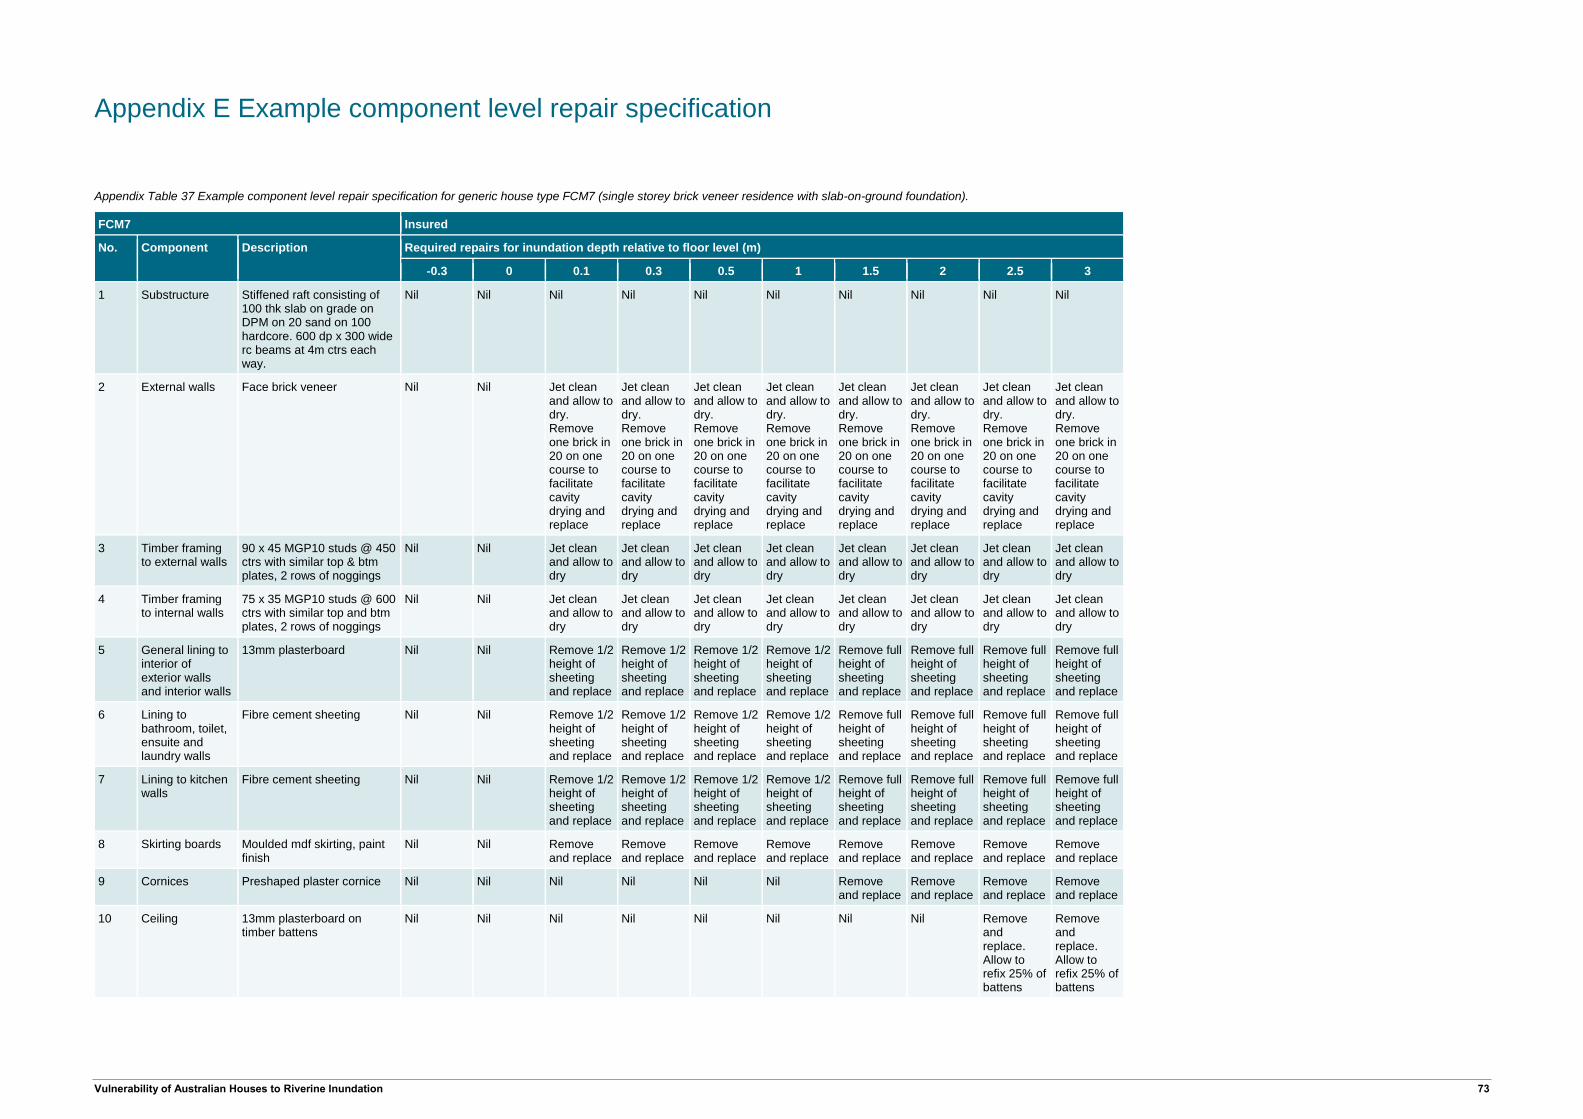
Vulnerability of Australian Houses to Riverine Inundation 73
Appendix E Example component level repair specification
Appendix Table 37 Example component level repair specification for generic house type FCM7 (single storey brick veneer residence with slab-on-ground foundation).
FCM7 Insured
No.
Component
Description
Required repairs for inundation depth relative to floor level (m)
-0.3 0 0.1 0.3 0.5 1 1.5 2 2.5 3
1 Substructure Stiffened raft consisting of 100 thk slab on grade on DPM on 20 sand on 100 hardcore. 600 dp x 300 wide rc beams at 4m ctrs each way.
Nil Nil Nil Nil Nil Nil Nil Nil Nil Nil
2 External walls Face brick veneer Nil Nil Jet clean and allow to dry. Remove one brick in 20 on one course to facilitate cavity drying and replace
Jet clean and allow to dry. Remove one brick in 20 on one course to facilitate cavity drying and replace
Jet clean and allow to dry. Remove one brick in 20 on one course to facilitate cavity drying and replace
Jet clean and allow to dry. Remove one brick in 20 on one course to facilitate cavity drying and replace
Jet clean and allow to dry. Remove one brick in 20 on one course to facilitate cavity drying and replace
Jet clean and allow to dry. Remove one brick in 20 on one course to facilitate cavity drying and replace
Jet clean and allow to dry. Remove one brick in 20 on one course to facilitate cavity drying and replace
Jet clean and allow to dry. Remove one brick in 20 on one course to facilitate cavity drying and replace
3 Timber framing to external walls
90 x 45 MGP10 studs @ 450 ctrs with similar top & btm plates, 2 rows of noggings
Nil Nil Jet clean and allow to dry
Jet clean and allow to dry
Jet clean and allow to dry
Jet clean and allow to dry
Jet clean and allow to dry
Jet clean and allow to dry
Jet clean and allow to dry
Jet clean and allow to dry
4 Timber framing to internal walls
75 x 35 MGP10 studs @ 600 ctrs with similar top and btm plates, 2 rows of noggings
Nil Nil Jet clean and allow to dry
Jet clean and allow to dry
Jet clean and allow to dry
Jet clean and allow to dry
Jet clean and allow to dry
Jet clean and allow to dry
Jet clean and allow to dry
Jet clean and allow to dry
5 General lining to interior of exterior walls and interior walls
13mm plasterboard Nil Nil Remove 1/2 height of sheeting and replace
Remove 1/2 height of sheeting and replace
Remove 1/2 height of sheeting and replace
Remove 1/2 height of sheeting and replace
Remove full height of sheeting and replace
Remove full height of sheeting and replace
Remove full height of sheeting and replace
Remove full height of sheeting and replace
6 Lining to bathroom, toilet, ensuite and laundry walls
Fibre cement sheeting Nil Nil Remove 1/2 height of sheeting and replace
Remove 1/2 height of sheeting and replace
Remove 1/2 height of sheeting and replace
Remove 1/2 height of sheeting and replace
Remove full height of sheeting and replace
Remove full height of sheeting and replace
Remove full height of sheeting and replace
Remove full height of sheeting and replace
7 Lining to kitchen walls
Fibre cement sheeting Nil Nil Remove 1/2 height of sheeting and replace
Remove 1/2 height of sheeting and replace
Remove 1/2 height of sheeting and replace
Remove 1/2 height of sheeting and replace
Remove full height of sheeting and replace
Remove full height of sheeting and replace
Remove full height of sheeting and replace
Remove full height of sheeting and replace
8 Skirting boards Moulded mdf skirting, paint finish
Nil Nil Remove and replace
Remove and replace
Remove and replace
Remove and replace
Remove and replace
Remove and replace
Remove and replace
Remove and replace
9 Cornices Preshaped plaster cornice Nil Nil Nil Nil Nil Nil Remove and replace
Remove and replace
Remove and replace
Remove and replace
10 Ceiling 13mm plasterboard on timber battens
Nil Nil Nil Nil Nil Nil Nil Nil Remove and replace. Allow to refix 25% of battens
Remove and replace. Allow to refix 25% of battens
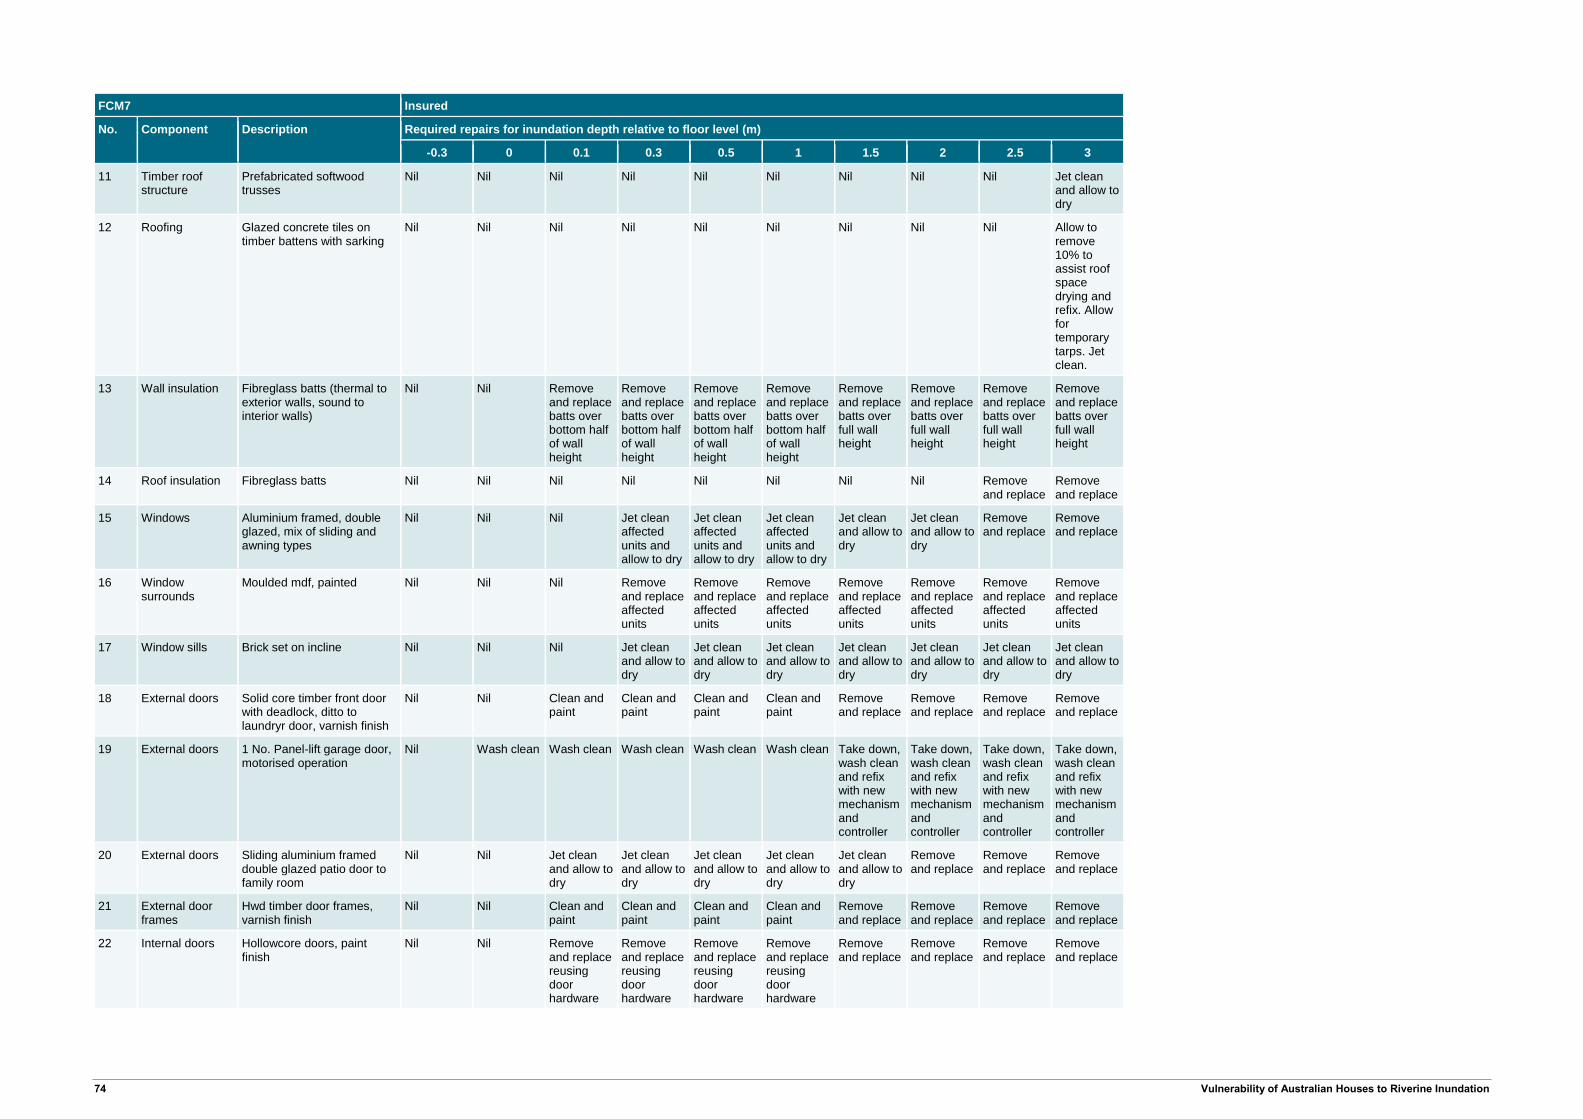
74 Vulnerability of Australian Houses to Riverine Inundation
FCM7 Insured
No.
Component
Description
Required repairs for inundation depth relative to floor level (m)
-0.3 0 0.1 0.3 0.5 1 1.5 2 2.5 3
11 Timber roof structure
Prefabricated softwood trusses
Nil Nil Nil Nil Nil Nil Nil Nil Nil Jet clean and allow to dry
12 Roofing Glazed concrete tiles on timber battens with sarking
Nil Nil Nil Nil Nil Nil Nil Nil Nil Allow to remove 10% to assist roof space drying and refix. Allow for temporary tarps. Jet clean.
13 Wall insulation Fibreglass batts (thermal to exterior walls, sound to interior walls)
Nil Nil Remove and replace batts over bottom half of wall height
Remove and replace batts over bottom half of wall height
Remove and replace batts over bottom half of wall height
Remove and replace batts over bottom half of wall height
Remove and replace batts over full wall height
Remove and replace batts over full wall height
Remove and replace batts over full wall height
Remove and replace batts over full wall height
14 Roof insulation Fibreglass batts Nil Nil Nil Nil Nil Nil Nil Nil Remove and replace
Remove and replace
15 Windows Aluminium framed, double glazed, mix of sliding and awning types
Nil Nil Nil Jet clean affected units and allow to dry
Jet clean affected units and allow to dry
Jet clean affected units and allow to dry
Jet clean and allow to dry
Jet clean and allow to dry
Remove and replace
Remove and replace
16 Window surrounds
Moulded mdf, painted Nil Nil Nil Remove and replace affected units
Remove and replace affected units
Remove and replace affected units
Remove and replace affected units
Remove and replace affected units
Remove and replace affected units
Remove and replace affected units
17 Window sills Brick set on incline Nil Nil Nil Jet clean and allow to dry
Jet clean and allow to dry
Jet clean and allow to dry
Jet clean and allow to dry
Jet clean and allow to dry
Jet clean and allow to dry
Jet clean and allow to dry
18 External doors Solid core timber front door with deadlock, ditto to laundryr door, varnish finish
Nil Nil Clean and paint
Clean and paint
Clean and paint
Clean and paint
Remove and replace
Remove and replace
Remove and replace
Remove and replace
19 External doors 1 No. Panel-lift garage door, motorised operation
Nil Wash clean Wash clean Wash clean Wash clean Wash clean Take down, wash clean and refix with new mechanism and controller
Take down, wash clean and refix with new mechanism and controller
Take down, wash clean and refix with new mechanism and controller
Take down, wash clean and refix with new mechanism and controller
20 External doors Sliding aluminium framed double glazed patio door to family room
Nil Nil Jet clean and allow to dry
Jet clean and allow to dry
Jet clean and allow to dry
Jet clean and allow to dry
Jet clean and allow to dry
Remove and replace
Remove and replace
Remove and replace
21 External door frames
Hwd timber door frames, varnish finish
Nil Nil Clean and paint
Clean and paint
Clean and paint
Clean and paint
Remove and replace
Remove and replace
Remove and replace
Remove and replace
22 Internal doors Hollowcore doors, paint finish
Nil Nil Remove and replace reusing door hardware
Remove and replace reusing door hardware
Remove and replace reusing door hardware
Remove and replace reusing door hardware
Remove and replace
Remove and replace
Remove and replace
Remove and replace
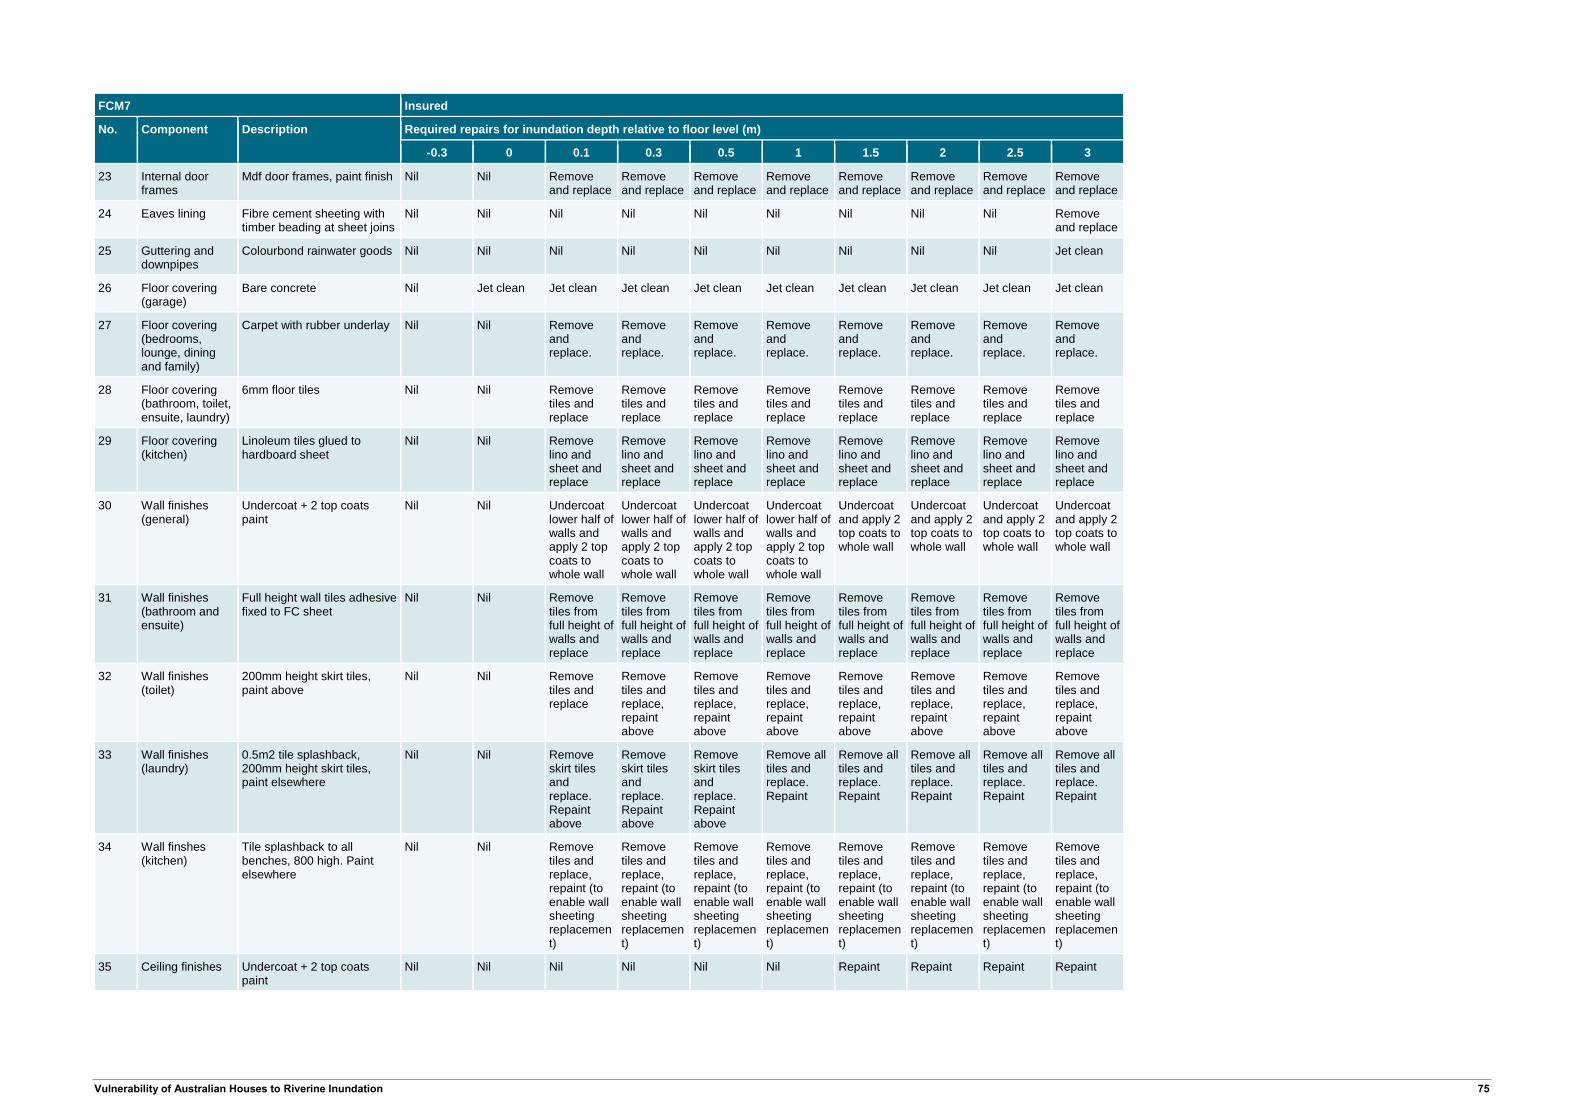
Vulnerability of Australian Houses to Riverine Inundation 75
FCM7 Insured
No.
Component
Description
Required repairs for inundation depth relative to floor level (m)
-0.3 0 0.1 0.3 0.5 1 1.5 2 2.5 3
23 Internal door frames
Mdf door frames, paint finish Nil Nil Remove and replace
Remove and replace
Remove and replace
Remove and replace
Remove and replace
Remove and replace
Remove and replace
Remove and replace
24 Eaves lining Fibre cement sheeting with timber beading at sheet joins
Nil Nil Nil Nil Nil Nil Nil Nil Nil Remove and replace
25 Guttering and downpipes
Colourbond rainwater goods Nil Nil Nil Nil Nil Nil Nil Nil Nil Jet clean
26 Floor covering (garage)
Bare concrete Nil Jet clean Jet clean Jet clean Jet clean Jet clean Jet clean Jet clean Jet clean Jet clean
27 Floor covering (bedrooms, lounge, dining and family)
Carpet with rubber underlay Nil Nil Remove and replace.
Remove and replace.
Remove and replace.
Remove and replace.
Remove and replace.
Remove and replace.
Remove and replace.
Remove and replace.
28 Floor covering (bathroom, toilet, ensuite, laundry)
6mm floor tiles Nil Nil Remove tiles and replace
Remove tiles and replace
Remove tiles and replace
Remove tiles and replace
Remove tiles and replace
Remove tiles and replace
Remove tiles and replace
Remove tiles and replace
29 Floor covering (kitchen)
Linoleum tiles glued to hardboard sheet
Nil Nil Remove lino and sheet and replace
Remove lino and sheet and replace
Remove lino and sheet and replace
Remove lino and sheet and replace
Remove lino and sheet and replace
Remove lino and sheet and replace
Remove lino and sheet and replace
Remove lino and sheet and replace
30 Wall finishes (general)
Undercoat + 2 top coats paint
Nil Nil Undercoat lower half of walls and apply 2 top coats to whole wall
Undercoat lower half of walls and apply 2 top coats to whole wall
Undercoat lower half of walls and apply 2 top coats to whole wall
Undercoat lower half of walls and apply 2 top coats to whole wall
Undercoat and apply 2 top coats to whole wall
Undercoat and apply 2 top coats to whole wall
Undercoat and apply 2 top coats to whole wall
Undercoat and apply 2 top coats to whole wall
31 Wall finishes (bathroom and ensuite)
Full height wall tiles adhesive fixed to FC sheet
Nil Nil Remove tiles from full height of walls and replace
Remove tiles from full height of walls and replace
Remove tiles from full height of walls and replace
Remove tiles from full height of walls and replace
Remove tiles from full height of walls and replace
Remove tiles from full height of walls and replace
Remove tiles from full height of walls and replace
Remove tiles from full height of walls and replace
32 Wall finishes (toilet)
200mm height skirt tiles, paint above
Nil Nil Remove tiles and replace
Remove tiles and replace, repaint above
Remove tiles and replace, repaint above
Remove tiles and replace, repaint above
Remove tiles and replace, repaint above
Remove tiles and replace, repaint above
Remove tiles and replace, repaint above
Remove tiles and replace, repaint above
33 Wall finishes (laundry)
0.5m2 tile splashback, 200mm height skirt tiles, paint elsewhere
Nil Nil Remove skirt tiles and replace. Repaint above
Remove skirt tiles and replace. Repaint above
Remove skirt tiles and replace. Repaint above
Remove all tiles and replace. Repaint
Remove all tiles and replace. Repaint
Remove all tiles and replace. Repaint
Remove all tiles and replace. Repaint
Remove all tiles and replace. Repaint
34 Wall finshes (kitchen)
Tile splashback to all benches, 800 high. Paint elsewhere
Nil Nil Remove tiles and replace, repaint (to enable wall sheeting replacement)
Remove tiles and replace, repaint (to enable wall sheeting replacement)
Remove tiles and replace, repaint (to enable wall sheeting replacement)
Remove tiles and replace, repaint (to enable wall sheeting replacement)
Remove tiles and replace, repaint (to enable wall sheeting replacement)
Remove tiles and replace, repaint (to enable wall sheeting replacement)
Remove tiles and replace, repaint (to enable wall sheeting replacement)
Remove tiles and replace, repaint (to enable wall sheeting replacement)
35 Ceiling finishes Undercoat + 2 top coats paint
Nil Nil Nil Nil Nil Nil Repaint Repaint Repaint Repaint
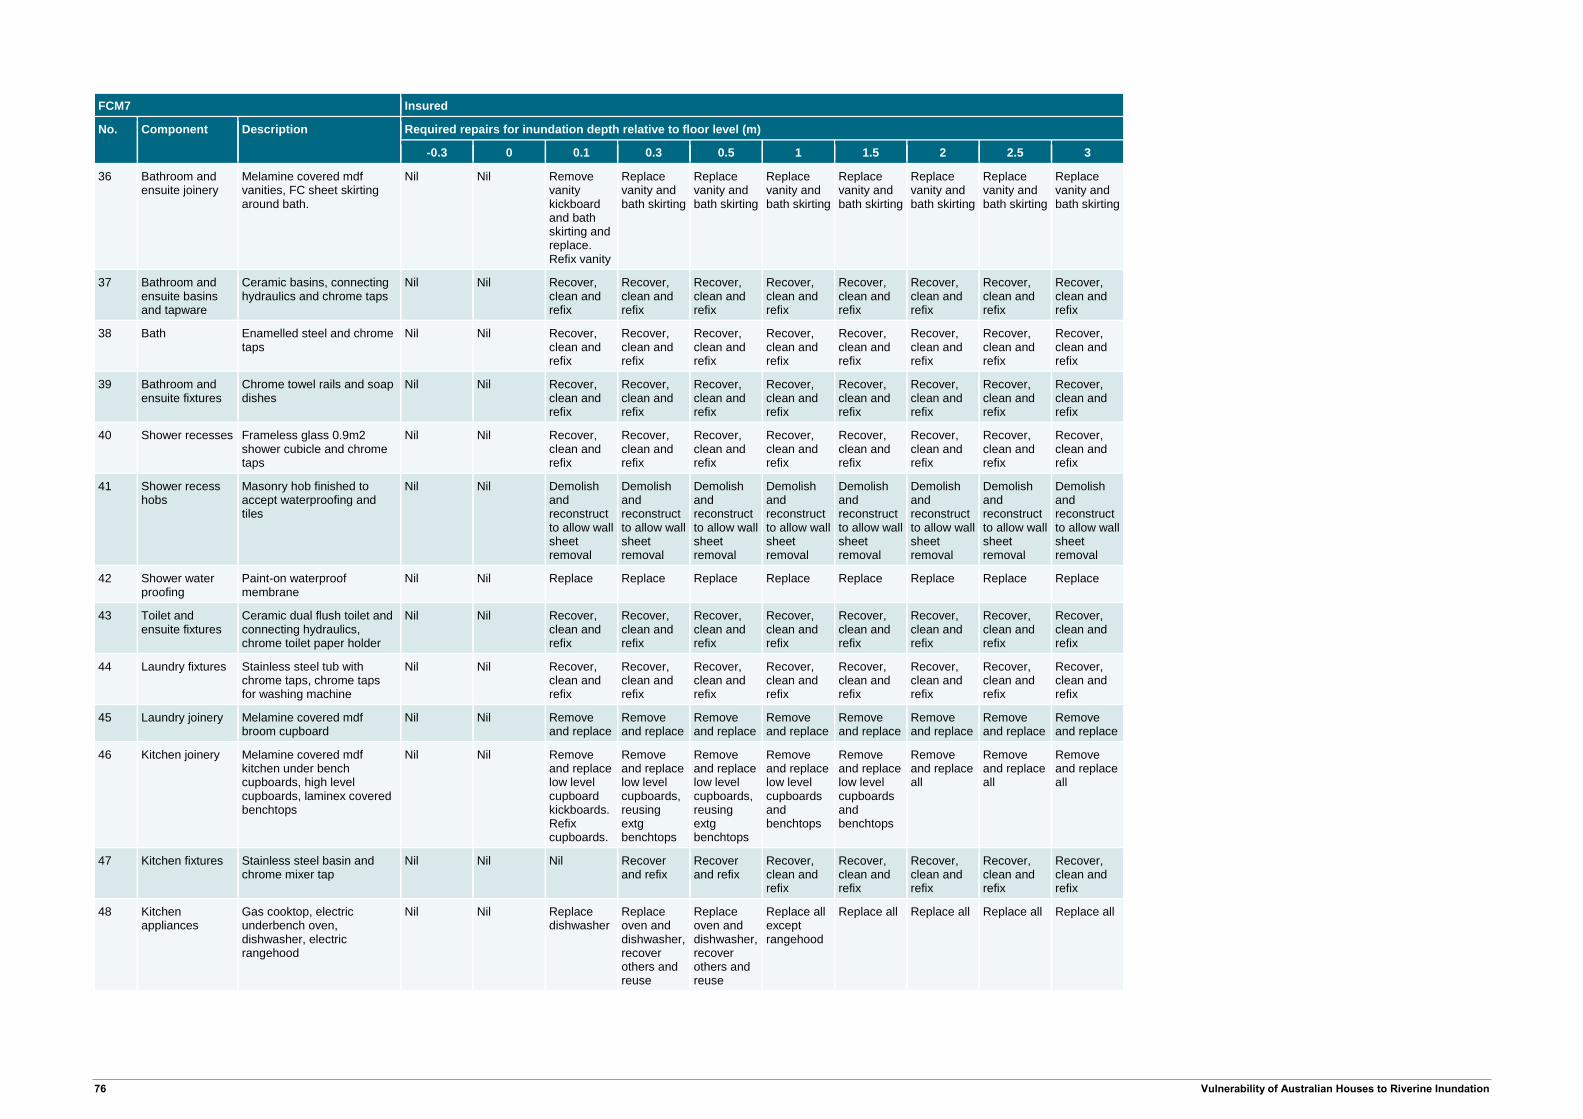
76 Vulnerability of Australian Houses to Riverine Inundation
FCM7 Insured
No.
Component
Description
Required repairs for inundation depth relative to floor level (m)
-0.3 0 0.1 0.3 0.5 1 1.5 2 2.5 3
36 Bathroom and ensuite joinery
Melamine covered mdf vanities, FC sheet skirting around bath.
Nil Nil Remove vanity kickboard and bath skirting and replace. Refix vanity
Replace vanity and bath skirting
Replace vanity and bath skirting
Replace vanity and bath skirting
Replace vanity and bath skirting
Replace vanity and bath skirting
Replace vanity and bath skirting
Replace vanity and bath skirting
37 Bathroom and ensuite basins and tapware
Ceramic basins, connecting hydraulics and chrome taps
Nil Nil Recover, clean and refix
Recover, clean and refix
Recover, clean and refix
Recover, clean and refix
Recover, clean and refix
Recover, clean and refix
Recover, clean and refix
Recover, clean and refix
38 Bath Enamelled steel and chrome taps
Nil Nil Recover, clean and refix
Recover, clean and refix
Recover, clean and refix
Recover, clean and refix
Recover, clean and refix
Recover, clean and refix
Recover, clean and refix
Recover, clean and refix
39 Bathroom and ensuite fixtures
Chrome towel rails and soap dishes
Nil Nil Recover, clean and refix
Recover, clean and refix
Recover, clean and refix
Recover, clean and refix
Recover, clean and refix
Recover, clean and refix
Recover, clean and refix
Recover, clean and refix
40 Shower recesses Frameless glass 0.9m2 shower cubicle and chrome taps
Nil Nil Recover, clean and refix
Recover, clean and refix
Recover, clean and refix
Recover, clean and refix
Recover, clean and refix
Recover, clean and refix
Recover, clean and refix
Recover, clean and refix
41 Shower recess hobs
Masonry hob finished to accept waterproofing and tiles
Nil Nil Demolish and reconstruct to allow wall sheet removal
Demolish and reconstruct to allow wall sheet removal
Demolish and reconstruct to allow wall sheet removal
Demolish and reconstruct to allow wall sheet removal
Demolish and reconstruct to allow wall sheet removal
Demolish and reconstruct to allow wall sheet removal
Demolish and reconstruct to allow wall sheet removal
Demolish and reconstruct to allow wall sheet removal
42 Shower water proofing
Paint-on waterproof membrane
Nil Nil Replace Replace Replace Replace Replace Replace Replace Replace
43 Toilet and ensuite fixtures
Ceramic dual flush toilet and connecting hydraulics, chrome toilet paper holder
Nil Nil Recover, clean and refix
Recover, clean and refix
Recover, clean and refix
Recover, clean and refix
Recover, clean and refix
Recover, clean and refix
Recover, clean and refix
Recover, clean and refix
44 Laundry fixtures Stainless steel tub with chrome taps, chrome taps for washing machine
Nil Nil Recover, clean and refix
Recover, clean and refix
Recover, clean and refix
Recover, clean and refix
Recover, clean and refix
Recover, clean and refix
Recover, clean and refix
Recover, clean and refix
45 Laundry joinery Melamine covered mdf broom cupboard
Nil Nil Remove and replace
Remove and replace
Remove and replace
Remove and replace
Remove and replace
Remove and replace
Remove and replace
Remove and replace
46 Kitchen joinery Melamine covered mdf kitchen under bench cupboards, high level cupboards, laminex covered benchtops
Nil Nil Remove and replace low level cupboard kickboards. Refix cupboards.
Remove and replace low level cupboards, reusing extg benchtops
Remove and replace low level cupboards, reusing extg benchtops
Remove and replace low level cupboards and benchtops
Remove and replace low level cupboards and benchtops
Remove and replace all
Remove and replace all
Remove and replace all
47 Kitchen fixtures Stainless steel basin and chrome mixer tap
Nil Nil Nil Recover and refix
Recover and refix
Recover, clean and refix
Recover, clean and refix
Recover, clean and refix
Recover, clean and refix
Recover, clean and refix
48 Kitchen appliances
Gas cooktop, electric underbench oven, dishwasher, electric rangehood
Nil Nil Replace dishwasher
Replace oven and dishwasher, recover others and reuse
Replace oven and dishwasher, recover others and reuse
Replace all except rangehood
Replace all Replace all Replace all Replace all
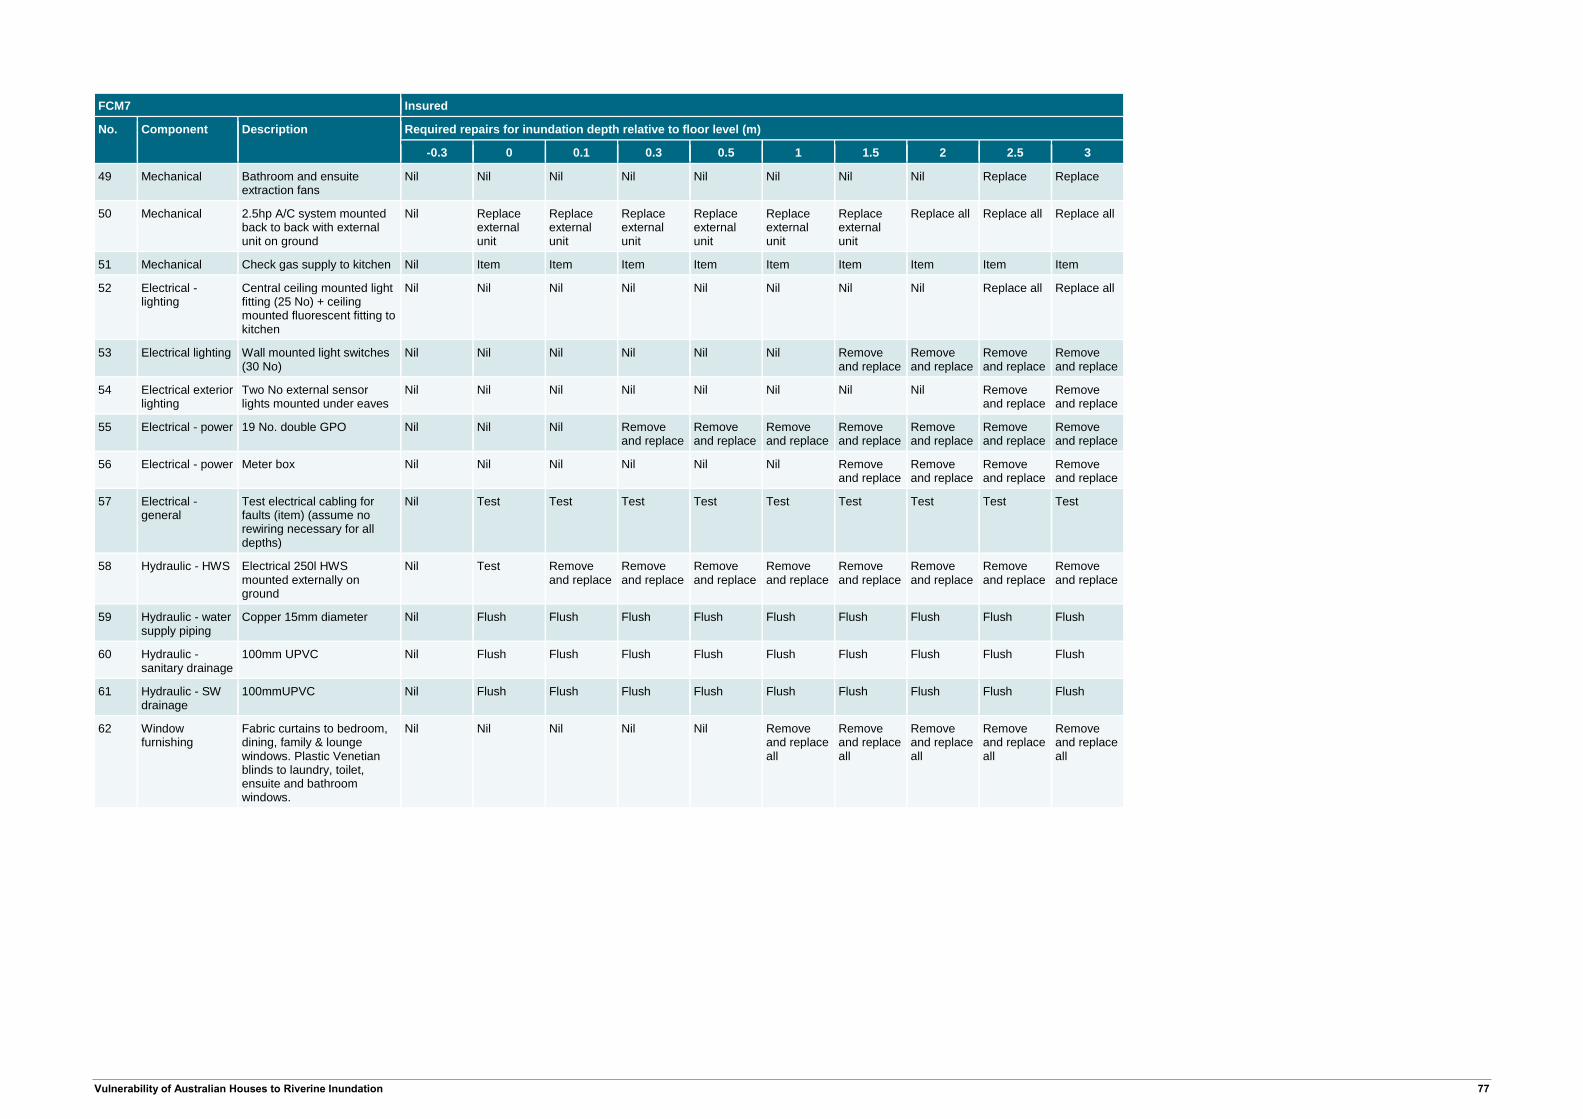
Vulnerability of Australian Houses to Riverine Inundation 77
FCM7 Insured
No.
Component
Description
Required repairs for inundation depth relative to floor level (m)
-0.3 0 0.1 0.3 0.5 1 1.5 2 2.5 3
49 Mechanical Bathroom and ensuite extraction fans
Nil Nil Nil Nil Nil Nil Nil Nil Replace Replace
50 Mechanical 2.5hp A/C system mounted back to back with external unit on ground
Nil Replace external unit
Replace external unit
Replace external unit
Replace external unit
Replace external unit
Replace external unit
Replace all Replace all Replace all
51 Mechanical Check gas supply to kitchen Nil Item Item Item Item Item Item Item Item Item
52 Electrical - lighting
Central ceiling mounted light fitting (25 No) + ceiling mounted fluorescent fitting to kitchen
Nil Nil Nil Nil Nil Nil Nil Nil Replace all Replace all
53 Electrical lighting Wall mounted light switches (30 No)
Nil Nil Nil Nil Nil Nil Remove and replace
Remove and replace
Remove and replace
Remove and replace
54 Electrical exterior lighting
Two No external sensor lights mounted under eaves
Nil Nil Nil Nil Nil Nil Nil Nil Remove and replace
Remove and replace
55 Electrical - power 19 No. double GPO Nil Nil Nil Remove and replace
Remove and replace
Remove and replace
Remove and replace
Remove and replace
Remove and replace
Remove and replace
56 Electrical - power Meter box Nil Nil Nil Nil Nil Nil Remove and replace
Remove and replace
Remove and replace
Remove and replace
57 Electrical - general
Test electrical cabling for faults (item) (assume no rewiring necessary for all depths)
Nil Test Test Test Test Test Test Test Test Test
58 Hydraulic - HWS Electrical 250l HWS mounted externally on ground
Nil Test Remove and replace
Remove and replace
Remove and replace
Remove and replace
Remove and replace
Remove and replace
Remove and replace
Remove and replace
59 Hydraulic - water supply piping
Copper 15mm diameter Nil Flush Flush Flush Flush Flush Flush Flush Flush Flush
60 Hydraulic - sanitary drainage
100mm UPVC Nil Flush Flush Flush Flush Flush Flush Flush Flush Flush
61 Hydraulic - SW drainage
100mmUPVC Nil Flush Flush Flush Flush Flush Flush Flush Flush Flush
62 Window furnishing
Fabric curtains to bedroom, dining, family & lounge windows. Plastic Venetian blinds to laundry, toilet, ensuite and bathroom windows.
Nil Nil Nil Nil Nil Remove and replace all
Remove and replace all
Remove and replace all
Remove and replace all
Remove and replace all