Embed Size (px)
Citation preview
The Social Profile of Youth, 2009–2014 Vulnerable Groups Series I:
Vulnerable Groups Series I: The Social Profile of the Youth,
2009‐2014
Statistics South Africa
Pali LehohlaStatistician‐GeneralReport No. 03‐19‐01
Statistics South Africa
Vulnerable Groups Series I: The Social Profile of the Youth, 2009‐2014
Report 03‐19‐01
ii
Vulnerable Groups Series I: The Social Profile of the Youth, 2009‐2014 / Statistics South Africa Published by Statistics South Africa, Private Bag X44, Pretoria 0001 © Statistics South Africa, 2016 Users may apply or process this data, provided Statistics South Africa (Stats SA) is acknowledged as the original source of the data; that it is specified that the application and/or analysis is the result of the user's independent processing of the data; and that neither the basic data nor any reprocessed version or application thereof may be sold or offered for sale in any form whatsoever without prior permission from Stats SA.
Stats SA Library Cataloguing‐in‐Publication (CIP) Data Vulnerable Groups Series I: The Social Profile of the Youth, 2009‐2014 / Statistics South Africa. Pretoria: Statistics South Africa, 2016 Report Nr: 03‐19‐01 84 pp ISBN: 978‐0‐621‐44433‐9 A complete set of Stats SA publications is available at Stats SA Library and the following libraries: National Library of South Africa, Pretoria Division National Library of South Africa, Cape Town Division Library of Parliament, Cape Town Bloemfontein Public Library Natal Society Library, Pietermaritzburg Johannesburg Public Library Eastern Cape Library Services, King William's Town Central Regional Library, Polokwane Central Reference Library, Nelspruit Central Reference Collection, Kimberley Central Reference Library, Mmabatho This report is available on the Stats SA website: www.statssa.gov.za For technical enquiries please contact: Tshepo Mabela Tel. no.: (012) 310‐8587 Email: [email protected] Isabel Schmidt Tel. no.: (012) 310‐6379 Email: [email protected]
Statistics South Africa
Vulnerable Groups Series I: The Social Profile of the Youth, 2009‐2014
Report 03‐19‐01
iii
Contents
Foreword ............................................................................................................................................ viii
CHAPTER 1: INTRODUCTION ................................................................................................................. 1
Legislation and policy frameworks ........................................................................................................ 2
Objective of the report .......................................................................................................................... 3
Data sources .......................................................................................................................................... 4
Stats SA data sources ............................................................................................................................. 4
External data sources ............................................................................................................................ 4
Definitions ............................................................................................................................................. 5
Layout of the remainder of the report .................................................................................................. 6
CHAPTER 2: DEMOGRAPHY ................................................................................................................... 8
CHAPTER 3: YOUTH MIGRATION ......................................................................................................... 14
Internal migration rates ....................................................................................................................... 15
CHAPTER 4: HOUSEHOLD CHARACTERISTICS ...................................................................................... 18
CHAPTER 5: YOUTH LABOUR MARKET PARTICIPATION ...................................................................... 27
Labour market participation rates ....................................................................................................... 27
Employment ........................................................................................................................................ 28
Unemployment .................................................................................................................................... 30
Youth unemployment and education attainment ............................................................................... 32
Unemployed youth and work experience ........................................................................................... 33
Youth and discouragement ................................................................................................................. 34
Youth culture and creativity ................................................................................................................ 35
CHAPTER 6: YOUTH AND CRIME .......................................................................................................... 37
Assault ................................................................................................................................................. 37
Robbery ............................................................................................................................................... 41
Property theft ...................................................................................................................................... 44
Perpetrators: Assault, robbery and property theft ............................................................................. 47
CHAPTER 7: MORBIDITY AND MORTALITY .......................................................................................... 48
A comparison of the number of deaths by age groups and sex .......................................................... 48
Most common broad underlying causes of death – A comparison among all age groups ................. 49
Causes of death of youth (15 to 34 years) .......................................................................................... 51
Youth: Top eight causes of death ........................................................................................................ 53
Certain infectious and parasitic diseases ............................................................................................ 54
Diseases of the respiratory system ..................................................................................................... 55
External causes of morbidity and mortality ........................................................................................ 56
Main causes of death by province where death occurred .................................................................. 58
Statistics South Africa
Vulnerable Groups Series I: The Social Profile of the Youth, 2009‐2014
Report 03‐19‐01
iv
Certain infectious and parasitic diseases by province ......................................................................... 59
Diseases of the respiratory system by province .................................................................................. 60
Systems and signs not elsewhere classified by province .................................................................... 60
External causes of mortality and morbidity by province..................................................................... 60
Youth Death Occurrence ..................................................................................................................... 62
South African Multidimensional Poverty Index (SAMPI) ..................................................................... 64
CHAPTER 8: YOUTH: LIVING CONDITIONS AND POVERTY ................................................................... 68
Housing ................................................................................................................................................ 68
Youth and accommodation ................................................................................................................. 69
Youth and poverty ............................................................................................................................... 70
Household income: Quintiles .............................................................................................................. 70
Sources of household income ............................................................................................................. 71
Youth living below the poverty line ..................................................................................................... 72
Households that experienced hunger ................................................................................................. 74
CHAPTER 9: CONCLUSION ................................................................................................................... 75
Recommendations ............................................................................................................................... 77
Youth and unemployment ................................................................................................................... 77
Youth and crime .................................................................................................................................. 78
Youth and poverty ............................................................................................................................... 78
Youth and health ................................................................................................................................. 79
Statistics South Africa
Vulnerable Groups Series I: The Social Profile of the Youth, 2009‐2014
Report 03‐19‐01
v
List of tables
Table 2.1: Distribution of SA and youth population (15–34 years) by province, 2009 and 2014 ....................................... 8
Table 2.2: Youth population by age group, geographic type and sex, 2009 and 2014 ..................................................... 10
Table 2.3: Youth population by population group and age group, 2009 and 2014 .......................................................... 11
Table 2.4: Youth population by province and disability status, 2011 ............................................................................... 13
Table 3.1: Percentage distribution of youth (15–34) by province of birth and usual place of residence, 2011 ............... 14
Table 3.2: Number of youth population inflows and outflows by province, 2011 ........................................................... 15
Table 3.3: Percentage distribution of youth migrants (from province of birth) by province of usual residence and age group, 2011 ................................................................................................................................................................ 17
Table 4.1: Proportions of youth‐headed households by age groups, 2009 and 2014 ...................................................... 18
Table 4.2: Youth‐headed households by province and age group, 2009 and 2014 .......................................................... 20
Table 5.1 Employed youth by age and sex, 2009 and 2014 .............................................................................................. 28
Table 5.2: Youth (15–34 years) employment by status in employment, 2009 and 2014 ................................................. 29
Table 5.3: Mean minutes per day spent by youth in relation to adults on social and leisure activities by sex, 2010 .................................................................................................................................................................................. 36
Table 6.1: Victims of assault crimes by age and sex, 2011/12 and 2013/14 .................................................................... 37
Table 6.2: Victims of robbery crimes by age and sex, 2011/12 and 2013/14 ................................................................... 41
Table 6.3: Victims of property theft crimes by age and sex, 2012/13 and 2013/14 ........................................................ 44
Table 6.4: Perpetrators by type of crime and age, 2012/13 and 2013/14 ....................................................................... 47
Table 7.1: Comparison of the population and the deceased by age groups .................................................................... 48
Table 7.2a: Number of deaths by age groups, 2008 ........................................................................................................ 49
Table 7.2b: Number of deaths by age groups, 2013 ......................................................................................................... 49
Table 7.3a: Most common broad underlying causes of death by sex and age group, 2008 ............................................ 49
Table 7.3b: Most common broad underlying causes of death by sex and age group, 2013 ............................................ 50
Table 7.4: Youth: Main underlying causes of death by sex, 2008 and 2013 ..................................................................... 52
Table 7.5: Certain infectious and parasitic diseases (youth 15–34) by sex, 2008 and 2013 ............................................. 55
Table 7.6: Diseases of respiratory system by sex, 2008 and 2013 .................................................................................... 56
Table 7.7: External causes of morbidity and mortality, 2008 and 2013 ........................................................................... 57
Table 7.8: Top 4 causes of youth deaths by province of occurrence and sex, 2008 and 2013 ......................................... 58
Table 8.1: Distribution of households with youth by type of main dwelling and province, 2009 and 2014 .................... 68
Table 8.2: Household living arrangements for households accommodating at least one youth by geo‐type, 2009 and 2014 ........................................................................................................................................................................... 69
Table 8.3: Household income quintiles for households in which youth reside, 2014 ...................................................... 70
Table 8.4: Percentage of households with youth aged 15–34 years by income source and province, 2009–2014 ......... 71
Table 8.5: Percentage of people other than youth living below poverty line, 2010/11 ................................................... 73
Table 8.6: Percentage of households without youth members experiencing hunger, 2014 ............................................ 74
Statistics South Africa
Vulnerable Groups Series I: The Social Profile of the Youth, 2009‐2014
Report 03‐19‐01
vi
List of figures
Figure 2.1: Percentage distribution of youth by province, 2009 and 2014 ........................................................................ 9
Figure 2.2: Percentage distribution of youth population by province and sex, 2009 and 2014 ......................................... 9
Figure 2.3: Percentage distribution of youth (15–34) by province and population group, 2014 ..................................... 10
Figure 2.4: Percentage growth of youth population among population groups, 2009 and 2014 .................................... 12
Figure 2.5: Percentage growth of youth population among population groups by age group, 2009 and 2014 .............. 12
Figure 3.1: In‐ and out‐migration rates by province, 2011 ............................................................................................... 16
Figure 3.2: Net‐migration rates by province, 2011 ........................................................................................................... 16
Figure 4.1: Percentage distribution of youth‐headed households by province and age group, 2009 and 2014 ............. 19
Figure 4.2: Percentage distribution of youth‐headed households by sex and geographic type, (15–34), 2009 and 2014 .................................................................................................................................................................................. 20
Figure 4.3: Percentage distribution of youth by household composition and age group, 2009 and 2014 ...................... 21
Figure 4.4: Percentage distribution of youth by household composition and population group, (15–34), 2009 and 2014 ........................................................................................................................................................................... 22
Figure 4.5: Percentage distribution of youth by household composition by sex (15–34), 2009 and 2014 ...................... 23
Figure 4.6: Percentage distribution of youth across intergenerational households by population group, 2009 and 2014 ........................................................................................................................................................................... 24
Figure 4.7: Percentage distribution of youth across intergenerational households by age group, 2009 and 2014 ......... 25
Figure 4.8: Percentage distribution of main expenditure groups for youth by age groups, 2010/11 .............................. 26
Figure 5.1a: Youth (15–34 years) labour market participation rates, 2009–2014 ............................................................ 27
Figure 5.1b: Adult (35–64 years) labour market participation rates, 2009–2014 ............................................................ 27
Figure 5.1c: Inactivity rate for youth aged 25–34 years, 2009–2014 ............................................................................... 28
Figure 5.2: Share of youth amongst the employed, 2009 and 2014 ................................................................................ 29
Figure 5.3: Share of youth (15–34 years) entrepreneurs amongst total entrepreneurs by sex, 2009 and 2014 ............. 30
Figure 5.4: Percentage shares of youth entrepreneurs by age, 2009 and 2014 ............................................................... 30
Figure 5.5: Share of youth amongst the unemployed, 2009 and 2014 ............................................................................ 30
Figure 5.6: Share of unemployed youth (15–34 years) as a proportion of the unemployed by population group, 2009 and 2014 .................................................................................................................................................................. 31
Figure 5.7: Youth (15–34 years) unemployment rate by .................................................................................................. 32
province, 2014 .................................................................................................................................................................. 32
Figure 5.8a: Share of unemployed youth (15–34 years) by highest level of education, 2009 ......................................... 32
Figure 5.8b: Share of unemployed youth (15–34 years) by highest level of education, 2014 ......................................... 32
Figure 5.9: Percentage of unemployed youth (15–34 years) by highest level of education and sex, 2009 and 2014 .................................................................................................................................................................................. 33
Figure 5.10: Percentage of unemployed youth who have some work experience by geo‐type, 2009 and 2014 ............ 34
Figure 5.11a: Share of discouraged youth (15–34 years), 2009 ....................................................................................... 34
Figure 5.11b: Share of discouraged youth (15–34 years), 2014 ....................................................................................... 34
Figure 5.12: Percentage of youth discouraged work‐seekers by province, 2009 and 2014 ............................................. 35
Figure 6.1: Percentage of youth who experienced assault crimes by age, 2011/12 and 2013/14 ................................... 38

Statistics South Africa
Vulnerable Groups Series I: The Social Profile of the Youth, 2009‐2014
Report 03‐19‐01
vii
Figure 6.2: Percentage of youth who experienced assault by province and age, 2013/14 .............................................. 39
Figure 6.3: Percentage of youth (16–34 years) who experienced assault by sex and province, 2013/14........................ 39
Figure 6.4a: Percentage of victims of assault crimes by province 16 years and above, 2013/14 .................................... 40
Figure 6.4b: Percentage of victims of assault crimes (16 years and above) by age, 2013/14 .......................................... 40
Figure 6.4c: Percentage of victims of assault crimes by age and province, 2013/14 ....................................................... 40
Figure 6.5: Percentage changes in victims of assault between 2011/12 and 2013/14 by province: Youth (16–34 years) ................................................................................................................................................................................ 41
Figure 6.6a: Percentage of youth who experienced robbery crimes by age, 2013/14 ..................................................... 42
Figure 6.6b: Percentage of youth who experienced robbery crimes by province and age, 2013/14 ............................... 42
Figure 6.7: Percentage of persons aged 16 years and above who experienced robbery‐related crimes by age, 2011/12 and 2013/14 ....................................................................................................................................................... 43
Figure 6.8: Percentage changes in victims of robbery crimes between 2011/12 and 2013/14 by province: Youth (16–34 years) .................................................................................................................................................................... 43
Figure 6.9a: Percentage of victims of property theft crimes (16 years and above) by age, 2013/14 .............................. 45
Figure 6.9b: Percentage of victims of property theft crimes by age and province, 2013/14 ........................................... 45
Figure 6.10: Percentage of youth who experienced property theft crimes by age and province, 2013/14..................... 45
Figure 6.11: Percentage changes in victims of property theft between 2012/13 and 2013/14 by province: Youth (16–34 years) .................................................................................................................................................................... 46
Figure 6.12: Perpetrators (16‐34 yrs.) by type of crime: 2012/13 and 2013/14 .............................................................. 47
Figure 7.1a: Percentage of youth deaths by age and sex, 2008 ....................................................................................... 51
Figure 7.1b: Percentage of youth deaths by age and sex, 2013 ....................................................................................... 51
Figure 7.2: Youth: Change in the percentage distribution of deaths between the ages of 15 and 34, 2008 and 2013 .................................................................................................................................................................................. 51
Figure 7.3a: Top eight causes of death for youth, 2008 .................................................................................................. 53
Figure 7.3b: Top eight causes of death for youth, 2013 .................................................................................................. 53
Figure 7.4a: Top eight causes of youth deaths by age, 2008 ............................................................................................ 53
Figure 7.4b: Top eight causes of youth deaths by age, 2013 ............................................................................................ 53
Figure 7.5: Youth: Certain infections and parasitic diseases by sex, 2008 and 2013........................................................ 54
Figure 7.6: Diseases of respiratory system by sex and age, 2013 ..................................................................................... 56
Table 7.6: Diseases of respiratory system by sex, 2008 and 2013 .................................................................................... 56
Figure 7.7: Youth: External causes of morbidity and mortality 2008 and 2013: Proportions of death by age ................ 56
Figure 7.8: Youth: Death from external causes of morbidity and mortality: Actual number of deaths by age, 2008 and 2013 .................................................................................................................................................................. 57
Figure 8.1: Youth living below poverty line by sex and province, LCS 2008/9 and IES 2010/11 ...................................... 73
Figure 8.2: Youth in households that experienced hunger by province, 2010 and 2014 ................................................. 74
Statistics South Africa
Vulnerable Groups Series I: The Social Profile of the Youth, 2009‐2014
Report 03‐19‐01
viii
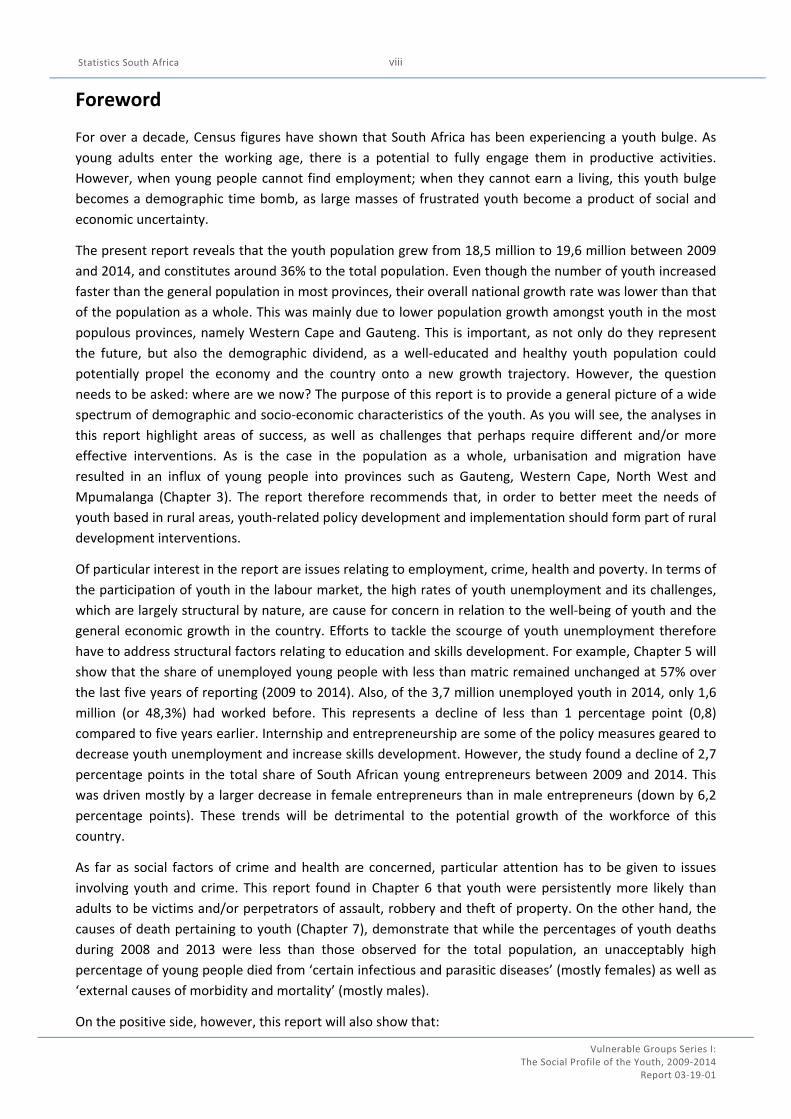
Foreword
For over a decade, Census figures have shown that South Africa has been experiencing a youth bulge. As
young adults enter the working age, there is a potential to fully engage them in productive activities.
However, when young people cannot find employment; when they cannot earn a living, this youth bulge
becomes a demographic time bomb, as large masses of frustrated youth become a product of social and
economic uncertainty.
The present report reveals that the youth population grew from 18,5 million to 19,6 million between 2009
and 2014, and constitutes around 36% to the total population. Even though the number of youth increased
faster than the general population in most provinces, their overall national growth rate was lower than that
of the population as a whole. This was mainly due to lower population growth amongst youth in the most
populous provinces, namely Western Cape and Gauteng. This is important, as not only do they represent
the future, but also the demographic dividend, as a well‐educated and healthy youth population could
potentially propel the economy and the country onto a new growth trajectory. However, the question
needs to be asked: where are we now? The purpose of this report is to provide a general picture of a wide
spectrum of demographic and socio‐economic characteristics of the youth. As you will see, the analyses in
this report highlight areas of success, as well as challenges that perhaps require different and/or more
effective interventions. As is the case in the population as a whole, urbanisation and migration have
resulted in an influx of young people into provinces such as Gauteng, Western Cape, North West and
Mpumalanga (Chapter 3). The report therefore recommends that, in order to better meet the needs of
youth based in rural areas, youth‐related policy development and implementation should form part of rural
development interventions.
Of particular interest in the report are issues relating to employment, crime, health and poverty. In terms of
the participation of youth in the labour market, the high rates of youth unemployment and its challenges,
which are largely structural by nature, are cause for concern in relation to the well‐being of youth and the
general economic growth in the country. Efforts to tackle the scourge of youth unemployment therefore
have to address structural factors relating to education and skills development. For example, Chapter 5 will
show that the share of unemployed young people with less than matric remained unchanged at 57% over
the last five years of reporting (2009 to 2014). Also, of the 3,7 million unemployed youth in 2014, only 1,6
million (or 48,3%) had worked before. This represents a decline of less than 1 percentage point (0,8)
compared to five years earlier. Internship and entrepreneurship are some of the policy measures geared to
decrease youth unemployment and increase skills development. However, the study found a decline of 2,7
percentage points in the total share of South African young entrepreneurs between 2009 and 2014. This
was driven mostly by a larger decrease in female entrepreneurs than in male entrepreneurs (down by 6,2
percentage points). These trends will be detrimental to the potential growth of the workforce of this
country.
As far as social factors of crime and health are concerned, particular attention has to be given to issues
involving youth and crime. This report found in Chapter 6 that youth were persistently more likely than
adults to be victims and/or perpetrators of assault, robbery and theft of property. On the other hand, the
causes of death pertaining to youth (Chapter 7), demonstrate that while the percentages of youth deaths
during 2008 and 2013 were less than those observed for the total population, an unacceptably high
percentage of young people died from ‘certain infectious and parasitic diseases’ (mostly females) as well as
‘external causes of morbidity and mortality’ (mostly males).
On the positive side, however, this report will also show that:
Statistics South Africa
Vulnerable Groups Series I: The Social Profile of the Youth, 2009‐2014
Report 03‐19‐01
ix
the share of the unemployed youth decreased between 2009 and 2014;
the percentage of youth‐headed households declined slightly between the same years of
reporting; and
household expenditure on alcoholic beverages and tobacco accounted for less than 2 per cent of
total annual household expenditure among youth‐headed households.
Pali Lehohla
Statistician‐General
Statistics South Africa
Vulnerable Groups Series I: The Social Profile of the Youth, 2009‐2014
Report 03‐19‐01
1
CHAPTER 1: INTRODUCTION
Youth in South Africa contribute around 36% to the total population. The country is, however, in the midst
of challenging times. Over the last decade, young persons between the ages of 15–34 made up
approximately 70% of total unemployment. Additionally, the NEET (Not in Employment, Education or
Training) rate for youth has also remained at around 30% since 2012, with the highest rate recorded at
33,5% in 2013. Quality of education is another challenge as highlighted in the 2015 Gender Series Volume II
report (Stats SA, 2015)1. The challenges that are facing the South African youth as mentioned above could
lead to far‐reaching, over‐arching socio‐economic consequences for young people; putting them at a higher
risk of falling into poverty, criminal behaviour, ill health and drug use (Barron, 2014; Hammarstrom, 1994)2.
Unless ameliorated through effective policy implementation, the current youth situation may lead to long‐
term detrimental impacts on the general economic, social and physiological well‐being amongst our young
members of society.
Notwithstanding the challenges facing the young people of today, notable progress in the areas of access to
education and skills development have been achieved. This was clearly outlined in the above‐mentioned
gender publication (Stats SA, 2015). Successes around making education and training are largely as a result
of policies around the introduction of free basic education and with the establishment of Technical and
Vocational Education and Training (TVET) colleges, which has seen an overwhelming increase of young
people in tertiary education. Access to free primary health care is another success story, with more young
people accessing free primary health care services. However, much remains to be done in terms of
reducing the number of youth dying from infectious and parasitic diseases such as tuberculosis (TB),
influenza and pneumonia. The number of youth dying from external causes of morbidity and mortality is
also of concern (Chapter 7 provides more details).
The 2016 Vulnerable Groups Series I report is the first in its series and focuses on the socio‐economic and
demographic profile of the youth. It offers a broad understanding of the situation of young people in South
Africa by analysing data that highlights some of the concerns, challenges and successes experienced by the
youth.
1 Stats SA, 2015. Gender Series Volume II: Education, 2004–2014 2 Barron, S. W. 2003. Self‐control, social consequences and criminal behaviour: Street youth and the general theory of crime Journal of Research in
Crime and Delinquency, 40 (4), pp 403‐425 Hammarstrom, A. 1994. Health consequences of youth unemployment, Public health,108 (6), pp 403–412
Statistics South Africa
Vulnerable Groups Series I: The Social Profile of the Youth, 2009‐2014
Report 03‐19‐01
2
Legislation and policy frameworks
The situation of youth in this country exists against a backdrop of a strong legal framework in terms of
policies and legislation put in place to improve the circumstances for youth in the country.
African Youth Charter, 2006: Is aligned with international agreements and declarations on youth
development and flags the sacrifices that youth have made to the liberation and promotion of democratic
processes on the continent.
Broad‐based Black Economic Empowerment Act, 2003: Mandates all spheres of government and the
private sector to promote the constitutional right to equality, increase broad‐based and effective
participation of black people in the economy, increase employment and promote more equitable income
distribution.
Children’s Act, 2005: To give effect to certain rights of children as contained in the Constitution; to set out
principles relating to the care and protection of children.
Commonwealth Youth Charter, 2005: Provides the parameters within which youth policies in all
Commonwealth countries can be developed.
Constitution of the Republic of South Africa, 1996: This is the supreme law of the country entrenching
specific rights, responsibilities and principles that everybody must uphold. It lays the foundation for youth
economic empowerment.
Correctional Services Second Amendment Act, 1996: Regulates the transformation of the Department of
Correctional Services into a non‐military institution.
Draft National Disability Policy Framework, 2008: Central to developmental local government is a
commitment to work with disadvantaged groups to find sustainable solutions to their social, economic and
material challenges, and improve the quality of their lives. This includes people with disabilities.
Industrial Policy Action Plan: This is a plan based on the need for sustainable, long‐term development that
is underpinned by higher growth, exports and labour‐intensive, value‐adding economic activity in the
production sectors, led by manufacturing.
National Development Plan: A long‐term South African development plan, developed by the National
Planning Commission in collaboration and consultation with South Africans from all walks of life.
National Youth Commission Act, 1996: Provide for the establishment, constitution objects and functions of
a National Youth Commission; and to provide for matters connected therewith.
National Youth Development Agency Act, 2008: Aimed at creating and promoting coordination in youth
development matters; to provide for the objects and functions of the Agency; to provide for the manner in
which it is to be managed and governed; to provide for the regulation of its staff matters and financial
affairs.
National Youth Development Policy Framework, 2000–2007: Was designed to accelerate the
mainstreaming of youth development as an integral part of the transformation agenda of the
democratically elected Government of South Africa.
Statistics South Africa
Vulnerable Groups Series I: The Social Profile of the Youth, 2009‐2014
Report 03‐19‐01
3
National Youth Policy, 2009–2014: Promotes integration of delivery mechanisms through the
establishment of the NYDA. The policy is an essential planning tool guiding the country on its approach to
youth development. In this policy document are inherent commitments by government; young South
Africans; and society at large on interventions and services that would have to be rolled out to ensure
effective and efficient mainstreaming of our youth development in the socio‐economic mainstream.
New Growth Path, 2011: Economic growth path aimed at enhancing growth, employment creation and
equity. This framework reflects government’s commitment to prioritising employment creation in all
economic policies.
White Paper on Families, 2013: The family in South Africa was under threat and many were unable to play
its critical roles of socialisation, nurturing, care and protection of family members effectively, due to various
factors. These challenges contributed to family disintegration and vulnerability, hence the development of
the White Paper to try and address this.
White Paper for Social Welfare, 1997: This white paper describes the principles, guidelines,
recommendations, proposed policies and programmes for developmental social welfare in South Africa.
White Paper on Special Needs Education, 2001: It outlines what an inclusive education and training system
is, and how we intend to build it. It provides the framework for establishing such an education and training
system, details a funding strategy, and lists the key steps to be taken in establishing an inclusive education
and training system for South Africa.
World Programme of Action for Youth to the Year 2000 and Beyond, 1995: The World Programme of
Action for Youth (WPAY) provides a policy framework and practical guidelines for national action and
international support to improve the situation of young people. It contains proposals for action, aiming at
fostering conditions and mechanisms to promote improved well‐being and livelihoods among young
people.
Youth Employment Accord, 2013: The Accord sets out the joint commitment to prioritise youth
employment and skills development. The Accord is one in a series of social pacts that are intended to help
achieve the New Growth Path goal of five million new jobs by 2020.
Skills Accord, 2011: The purpose of the skills accord is to empower South Africans to implement the wide‐
ranging commitments that are contained in the Accord and mobilise the private sector, organised labour,
communities and government in a strong partnership to expand skills in the country as a platform for
creating five million new jobs by 2020.
Objective of the report
The purpose of this report is to provide analysis relating to the socio‐economic and demographic profile of
the youth in South Africa using secondary data from Stats SA. The general analysis in the report covers
socio‐economic and demographic trends of the youth over a five‐year period (i.e. 2009 and 2014). Chapter
1 is introductory and briefly provides context to the socio‐economic profile of the youth. Moreover, this
chapter seeks to establish the rationale for producing the report by providing a background to the policy
framework for the report. The rest of the report focusses on covering various socio‐economic and
demographic proofing of the youth through different chapters.

Statistics South Africa
Vulnerable Groups Series I: The Social Profile of the Youth, 2009‐2014
Report 03‐19‐01
4
Data sources
Stats SA data sources
The current report focuses mainly on presenting data comparing the years 2009 and 2014. However, where
data representing the years 2009 and 2014 were not available, the oldest and the most recent survey data
available were used. For example, analyses using causes of morbidity and mortality data amongst youth in
Chapter 6 primarily focuses on comparisons between the years 2008 and 2013.
The main sources of statistics on household, demographic and labour statistics that will be used in this
study are Census 2001 and Census 2011, the Quarterly Labour Force Survey (QLFS) Q4: 2009 and Q4: 2014,
and the General Household Survey (GHS) 2009 and 2014. The other sources of data used for analysis in this
report are the Victims of Crime Survey (VOCS) 2011/12 and 2013/14, 2010 Time Use Survey as well as
administrative data from the Department of Home Affairs which was used for the analysis of causes of
morbidity and mortality. The census data attempted to cover all households, and were weighted to adjust
for the under‐count. QLFS, GHS, Time Use Survey and VOCS household surveys each cover approximately
30 000 households that are representative of all nine provinces. Data from all of the four above‐mentioned
Stats SA surveys are weighted so as to make the results representative of the overall population of the
country. Most of the analysis covers comparisons over a 5‐year period.
External data sources
One of the major challenges of measuring policy monitoring and implementation progress is the lack of
data. Even as the official supplier of statistics in South Africa, Stats SA cannot produce all data required to
measure gender‐related indicators. Administrative sources of data were therefore also used for data
analysis in this report. The main advantage of using administrative sources of data is that information on
administrative unit records is available in the form of registers that facilitate extraction of primary data.
Another advantage is that, since administrative data is collected usually invoking some statutory or
regulatory authority vested with the government organisation, the coverage of data is sometimes better
than those derived through sample surveys. Chapter 7 of this report therefore used annual data on the
causes of death captured by the Department of Home Affairs (DHA), and processed and published by
Stats SA.
The use of multiple sources of data (administrative, survey, census) therefore creates an opportunity for
Stats SA and stakeholders to expand the much‐required information base on statistics relating to youth.
Statistics South Africa
Vulnerable Groups Series I: The Social Profile of the Youth, 2009‐2014
Report 03‐19‐01
5
Definitions
Gender Parity Ratio (GPR): Is calculated as the percentage/number of females divided by the
percentage/number of males with a particular characteristic. Although these ratios are usually
designed to measure the relative access to education of males and females, the ratios can also be
generally applied to calculate gender disparities or gaps on different socio‐economic indicators
(Koronkiewicz, 20083).
Youth: Generally the youth in this report are defined as persons between the ages 15–34 years.
This age group is sometimes disaggregated further to distinguish between younger (15–24) or older
(25–34 years) youth.
Adults: Persons aged 35–64 years.
Graduates: Individuals who have completed a university degree.
Geo‐type: Census 2011 definitions for urban and rural have been applied. According to Stats SA, an
urban area is defined as a continuously built‐up area with characteristics such as type of economic
activity and land use. Cities, towns, townships, suburbs, etc. are typical urban areas.
o An urban area is one which was proclaimed or classified as such (i.e. in an urban
municipality under the old demarcation), or classified as such during census demarcation
by Stats SA, based on its observation of aerial photographs or on other information.
o A rural area is defined as any area that is not classified as urban. Rural areas may comprise
one or more of the following: tribal areas, commercial farms and rural formal areas.
Head of the household: There are many debates on what constitutes the term 'household head'.
Arguments and discussions around the definition usually deal with the subjective assumptions
carried by its interpretation, its implication and influence in socially constructed gender roles
(Hedman et al., 19964; Rosenhouse, 19895). Taking into account arguments for and against, Stats SA
loosely defines the head of the household as the person (male or female) who assumes
responsibility for the household. This person can be the chief economic provider, the chief
decision‐maker or the person designated by other members as the head. Survey officers are
instructed to record this person as person '01', in the first column of the questionnaire during data
collection. However, given that the definition used for households is based on the four‐by‐four
rule6, some individuals, especially migrant workers, who may be considered the head of the
household by the household, are often excluded from the data as a result of their limited presence
within the household. In those cases the acting household head from the household perspective is
indicated in the dataset as the household head.
Internal migration: Mostert et al. (1998:168)7 defines internal migration as the movement between
various provinces, regions and cities as well as the movement from rural to urban areas and vice
versa. Internal migration refers to a process of crossing boundaries but within the country. A
person who leaves an administrative area to live in another administrative area within the same
3 Koronkiewicz, M. 2008. Gender Parity Index, UNESCO, Bangkok. 4 Hedman, B., Perucci, F. and Sundstrom, P. 1996. Engendering Statistics: A Tool for Change. Statistics Sweden: Orebro. 5 Rosenhouse, S. 1989. Identifying the Poor: Is 'Headship' a Useful Concept? LSMS Working Paper No 58, World Bank, Washington DC. 6 The person should have been present in the household for at least four nights per week for the past four weeks.
7 Mostert WP, Hofmeyer BE, Oosthuizen JS and Van Zyl JA (1998), Demography: Texbook for the South African student, Pretoria: Human Sciences Research Council, 168
Statistics South Africa
Vulnerable Groups Series I: The Social Profile of the Youth, 2009‐2014
Report 03‐19‐01
6
country is regarded as an out‐migrant in the administrative area of origin and is regarded as an in‐
migrant in the administrative area of destination.
Gross and net migration: According to Edmonston and Michalowski (2004)8, gross migration is the
absolute sum of immigration and emigration experienced by a country. Gross internal migration is
the absolute sum of in‐migration and out‐migration. Net migration is the difference between the
two flows. The level of gross migration is always greater than the level of net migration (it can
never be less) because of the tendency for counter streams of returning migrants to develop.
Labour market: Economic activities are those that contribute to the production of goods and
services in the country. There are two types of economic activities, namely:
o (1) Market production activities (work done for others and usually associated with pay
or profit); and
o (2) Non‐market production activities (work done for the benefit of the household, e.g.
subsistence farming).
The labour force: Comprises all persons who are employed plus all persons who are unemployed.
Labour force participation rate: The proportion of the working‐age population that is either
employed or unemployed.
Employed persons: Those aged 15–64 years who, during the reference week, did any work for at
least one hour, or had a job or business but were not at work (temporarily absent).
Employment‐to‐population ratio (labour absorption rate): The proportion of the working‐age
population that is employed.
Not economically active: Persons aged 15–64 years who are neither employed nor unemployed in
the reference week.
Unemployment rate: The proportion of the labour force that is unemployed.
Discouraged job‐seeker: A person who was not employed during the reference period, wanted to
work, was available to work/start a business but did not take active steps to find work during the
last four weeks, provided that the main reason given for not seeking work was any of the following:
No jobs available in the area; Unable to find work requiring his/her skills; Lost hope of finding any
kind of work.
Causes of death are all those diseases, morbid conditions, or injuries that either resulted in or
contributed to death, and the circumstances of the accident or violence which produced any such
injuries.
Poverty line: This is a monetary threshold which allows for reporting on the levels of poverty. A
person falling below the poverty line is said to be living in poverty.
Layout of the remainder of the report
As previously discussed, Chapter 1 of the report is introductory and provides the background and objective
to the report.
8 Edmonton B. & M. Michalowski (2004) International Migration, [in:] J. S. Siegel & D. A. Swanson (eds) The methods and materials of demography. Elsevier Academic Press; 455‐492
Statistics South Africa
Vulnerable Groups Series I: The Social Profile of the Youth, 2009‐2014
Report 03‐19‐01
7
Chapter 2 contextualises figures reported in the rest of the publication by detailing the country’s
demographic profile and changes over the period 2009 to 2014 with a focus on the youth.
Chapter 3 explores issues around migration and youth. Migration involves the movement of individuals
over time and the changes of individuals’ place of residence.
The analysis in Chapter 4 deals with household characteristics. This chapter provides information about the
number of youth‐headed households; characteristics of the household heads; household composition as
well as generational household types.
Chapter 5 of this report focuses on economic contribution. This chapter explores the participation of youth
in the labour market. Data analysed in this chapter include the analysis of trends in employment and
unemployment that are assessed and disaggregated by sex, age and geographic location.
Chapter 6 uses data from Stats SA’s Victims of Crime Survey (VOCS) collected in 2011/12 and 2013/14 to
examine experiences of various types of crimes amongst youth. The types of crimes analysed in this part of
the report include assault, robbery and property theft.
Chapter 7 looks at trends in causes of death amongst youth between the years 2008 and 2013. Data
sources used in this chapter include the data from the Department of Home Affairs (DHA) which is
processed and published by Stats SA, as well as data from the General Household Survey.
Chapter 8 is divided into two parts; the first part ascertains living conditions amongst youth in terms of
housing and accommodation. Section 1 looks at different types of dwellings that young people reside in as
well as issues relating to overcrowding. Section 2 on the other hand takes a closer look at youth and
poverty by analysing data around access to food and household income levels.
Chapter 9 concludes the report by summarising some of the main highlight discussions from the
publication.
Statistics South Africa
Vulnerable Groups Series I: The Social Profile of the Youth, 2009‐2014
Report 03‐19‐01
8
CHAPTER 2: DEMOGRAPHY
This section looks at the analysis of the country’s demographic changes over the period 2009 to 2014,
focusing on youth (15 to 34 years). Demographic changes provide fundamental information pertaining to
population growth , various measures of population distribution and the arrangement of the population
according to variables such age, population group, sex, disability status and geography type. For the
purpose of this report, the analysis of the youth population will be done in relation to the general
population as this will provide contextual relevancy to the interpretation of data. This component of the
report used internal data sources namely, the General Household Survey (2009 and 2014) and Census 2011.
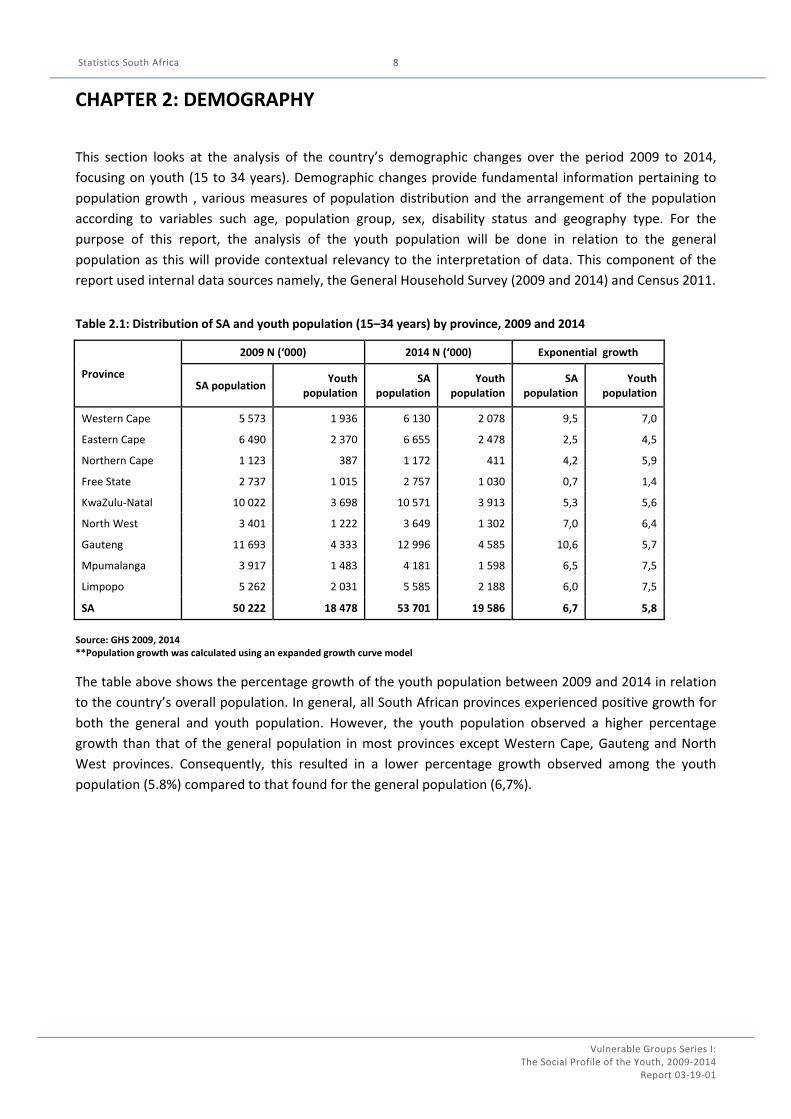
Table 2.1: Distribution of SA and youth population (15–34 years) by province, 2009 and 2014
Province
2009 N (‘000) 2014 N (‘000) Exponential growth
SA population Youth
population SA
population Youth
population SA
population Youth
population
Western Cape 5 573 1 936 6 130 2 078 9,5 7,0
Eastern Cape 6 490 2 370 6 655 2 478 2,5 4,5
Northern Cape 1 123 387 1 172 411 4,2 5,9
Free State 2 737 1 015 2 757 1 030 0,7 1,4
KwaZulu‐Natal 10 022 3 698 10 571 3 913 5,3 5,6
North West 3 401 1 222 3 649 1 302 7,0 6,4
Gauteng 11 693 4 333 12 996 4 585 10,6 5,7
Mpumalanga 3 917 1 483 4 181 1 598 6,5 7,5
Limpopo 5 262 2 031 5 585 2 188 6,0 7,5
SA 50 222 18 478 53 701 19 586 6,7 5,8
Source: GHS 2009, 2014 **Population growth was calculated using an expanded growth curve model
The table above shows the percentage growth of the youth population between 2009 and 2014 in relation
to the country’s overall population. In general, all South African provinces experienced positive growth for
both the general and youth population. However, the youth population observed a higher percentage
growth than that of the general population in most provinces except Western Cape, Gauteng and North
West provinces. Consequently, this resulted in a lower percentage growth observed among the youth
population (5.8%) compared to that found for the general population (6,7%).
Statistics South Africa
Vulnerable Groups Series I: The Social Profile of the Youth, 2009‐2014
Report 03‐19‐01
9
Figure 2.1: Percentage distribution of youth by province, 2009 and 2014
Source: GHS 2009 Source: GHS 2014
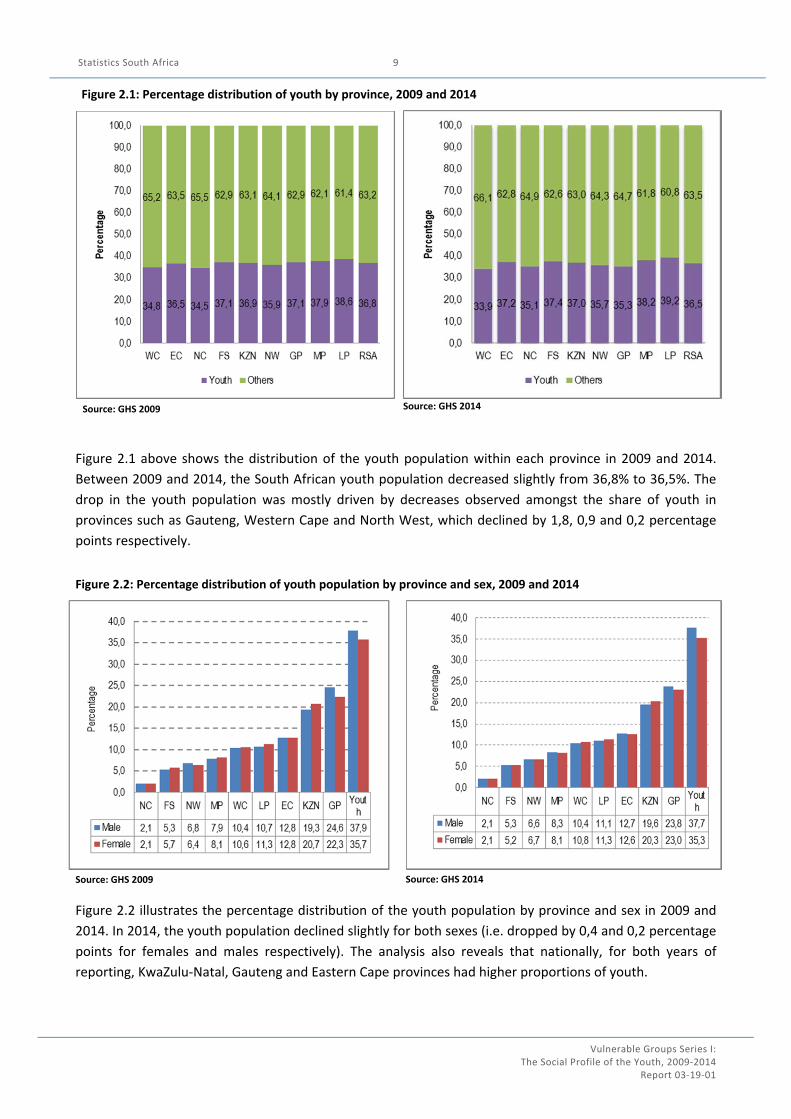
Figure 2.1 above shows the distribution of the youth population within each province in 2009 and 2014.
Between 2009 and 2014, the South African youth population decreased slightly from 36,8% to 36,5%. The
drop in the youth population was mostly driven by decreases observed amongst the share of youth in
provinces such as Gauteng, Western Cape and North West, which declined by 1,8, 0,9 and 0,2 percentage
points respectively.
Figure 2.2: Percentage distribution of youth population by province and sex, 2009 and 2014
Source: GHS 2009 Source: GHS 2014
Figure 2.2 illustrates the percentage distribution of the youth population by province and sex in 2009 and
2014. In 2014, the youth population declined slightly for both sexes (i.e. dropped by 0,4 and 0,2 percentage
points for females and males respectively). The analysis also reveals that nationally, for both years of
reporting, KwaZulu‐Natal, Gauteng and Eastern Cape provinces had higher proportions of youth.
Statistics South Africa
Vulnerable Groups Series I: The Social Profile of the Youth, 2009‐2014
Report 03‐19‐01
10
Figure 2.3: Percentage distribution of youth (15–34) by province and population group, 2014
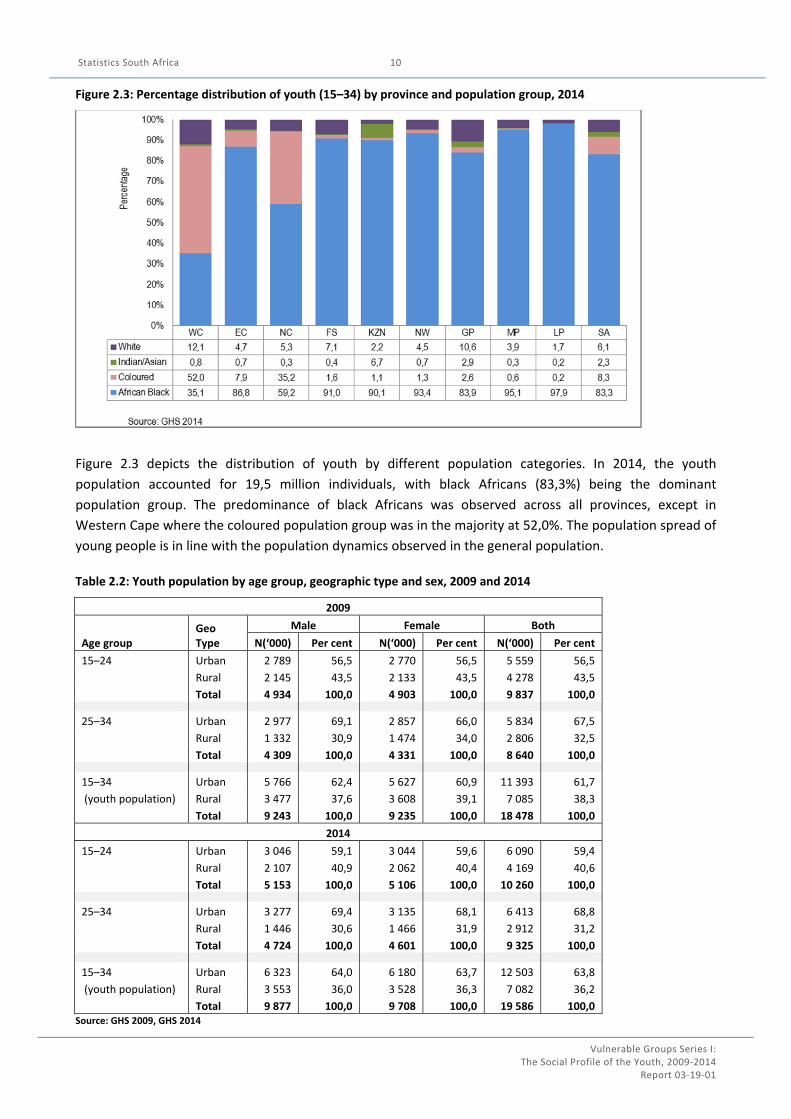
Figure 2.3 depicts the distribution of youth by different population categories. In 2014, the youth
population accounted for 19,5 million individuals, with black Africans (83,3%) being the dominant
population group. The predominance of black Africans was observed across all provinces, except in
Western Cape where the coloured population group was in the majority at 52,0%. The population spread of
young people is in line with the population dynamics observed in the general population.
Table 2.2: Youth population by age group, geographic type and sex, 2009 and 2014
2009
Age group Geo Type
Male Female Both
N(‘000) Per cent N(‘000) Per cent N(‘000) Per cent
15–24 Urban 2 789 56,5 2 770 56,5 5 559 56,5
Rural 2 145 43,5 2 133 43,5 4 278 43,5
Total 4 934 100,0 4 903 100,0 9 837 100,0
25–34 Urban 2 977 69,1 2 857 66,0 5 834 67,5
Rural 1 332 30,9 1 474 34,0 2 806 32,5
Total 4 309 100,0 4 331 100,0 8 640 100,0
15–34 Urban 5 766 62,4 5 627 60,9 11 393 61,7
(youth population) Rural 3 477 37,6 3 608 39,1 7 085 38,3
Total 9 243 100,0 9 235 100,0 18 478 100,0
2014
15–24 Urban 3 046 59,1 3 044 59,6 6 090 59,4
Rural 2 107 40,9 2 062 40,4 4 169 40,6
Total 5 153 100,0 5 106 100,0 10 260 100,0
25–34 Urban 3 277 69,4 3 135 68,1 6 413 68,8
Rural 1 446 30,6 1 466 31,9 2 912 31,2
Total 4 724 100,0 4 601 100,0 9 325 100,0
15–34 Urban 6 323 64,0 6 180 63,7 12 503 63,8
(youth population) Rural 3 553 36,0 3 528 36,3 7 082 36,2
Total 9 877 100,0 9 708 100,0 19 586 100,0 Source: GHS 2009, GHS 2014
Statistics South Africa
Vulnerable Groups Series I: The Social Profile of the Youth, 2009‐2014
Report 03‐19‐01
11
Table 2.2 shows the distribution of the youth population profiled by age categories, geographic type and
sex. In 2009, little differences relating to geographic settlement type existed amongst younger youth (15 to
24 years) by sex. However, in 2014, an increase of 2,6 percentage points among males and 3,1 percentage
points among females aged 15 to 24 years was observed for those settling in urban areas when 2009 and
2014 were compared. Between 2009 and 2014, older youth (25 to 34 years) amongst both sexes were more
likely to live in urban areas relative to their younger counterparts. Youth from this category observed
increases of about 0,3 of a percentage point amongst males and 2,1 percentage points amongst females
who had moved to urban areas. These results indicate a larger shift of females moving from rural areas to
urban areas amongst both age categories.
Also, between 2009 and 2014, figures revealed that there has been a steady decline across both age groups
(and amongst both sexes) who resided in rural areas. It is worth noting that in general, youth prefer to
reside in urban areas rather than rural areas due to perceptions that socio‐economic conditions are better
in urban areas.
Table 2:3: Youth population by population group and age group, 2009 and 2014
Population group
2009 2014
15–24 25–34
Youth Population(15–34) 15–24 25–34
Youth population (15–34)
N (‘000) Per cent N (‘000)
Per cent N (‘000) N (‘000)
Per cent N (‘000)
Per cent ‘000
Black African 8 147 82,8 7 060 81,7 15 208 8 552 83,4 7 760 83,2 16 313
Coloured 819 8,3 762 8,8 1 581 877 8,6 749 8,0 1 627
Indian/Asian 217 2,2 226 2,6 443 210 2,1 241 2,6 452
White 653 6,6 592 6,9 1 245 618 6,0 574 6,2 1 193
Total 9 837 19,6 8 640 17,2 18 478 10 260 19,1 9 325 17,4 19 586
Source: GHS 2009, GHS 2014
* The South African population was used as a divisor for the total percentages of youth age categories.
Table 2.3 illustrates the percentage distribution of the youth population by population group and age
groups. Between 2009 and 2014, younger youth 15 to 24 years had a much greater population size relative
to the youth aged 25 to 34 years, although the total percentage of younger youth declined by half a
percentage point (from 19,6 % to 19,1%).
The black African population group continued to be in the majority among both age categories. It is also the
only population group that showed consistent growth over the five‐year reporting period. Coloureds
observed an increase of 0,3 percentage points for youth aged 15 to 24 years while youth aged 25 to 34
years contracted by 0,8 percentage points. Younger youth declined by 0,1 of a percentage point for
Indians/Asians while those aged 25 to 34 years remained static. The white youth population contracted by
0,6 of a percentage point for age group 15 to 24 years and 0,7 of a percentage point for those aged 25 to 34
years. The findings revealed that the white youth population diminished steadily over the five‐year
reporting period.
Statistics South Africa
Vulnerable Groups Series I: The Social Profile of the Youth, 2009‐2014
Report 03‐19‐01
12
Figure 2.4: Exponential growth of youth population among population groups, 2009 and 2014
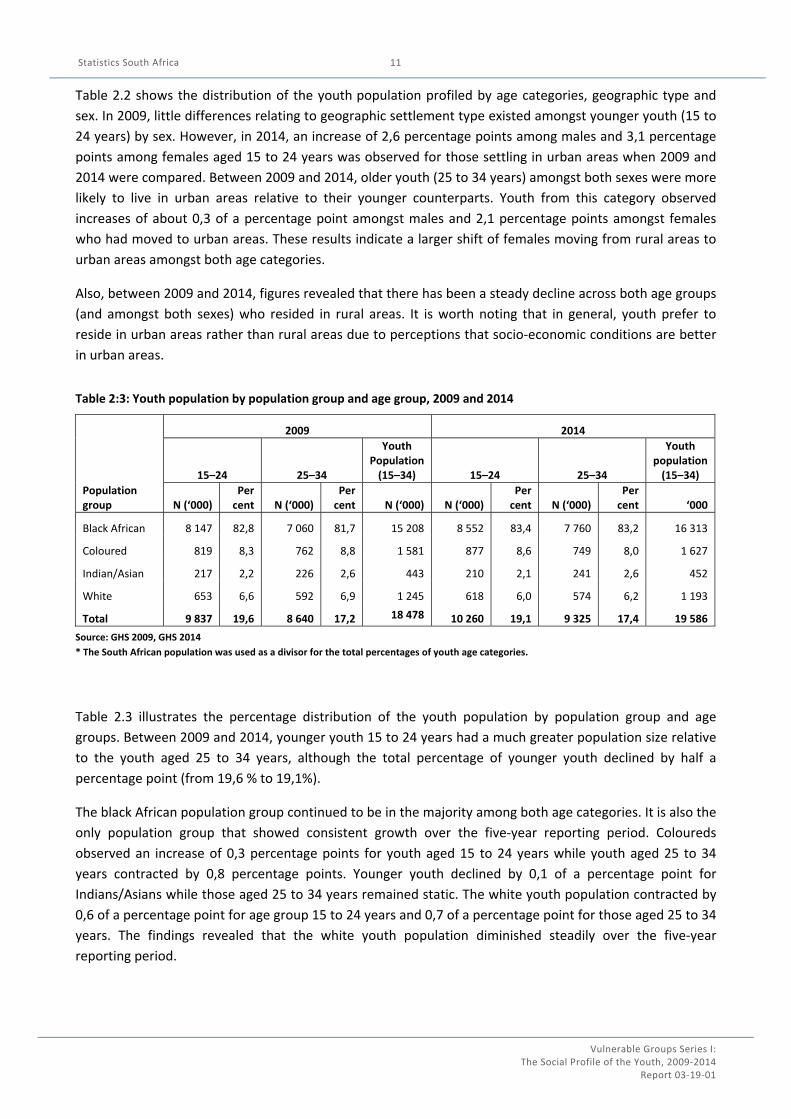
Figure 2.4 depicts the percentage growth of the youth population among different population categories.
Between 2009 and 2014, the South African youth population grew by 5.8%. The black African population
group recorded the biggest increase (by 7,0%) and contributed the highest on the youth bulge observed in
the country over the five‐year period. A negative growth was recorded among the white population
(declined by 4,3%). This can be attributed to emigration and/or low levels of fertility amongst the white
population group.
Figure 2.5: Exponential growth of youth population among population groups by age group, 2009 and 2014
Statistics South Africa
Vulnerable Groups Series I: The Social Profile of the Youth, 2009‐2014
Report 03‐19‐01
13
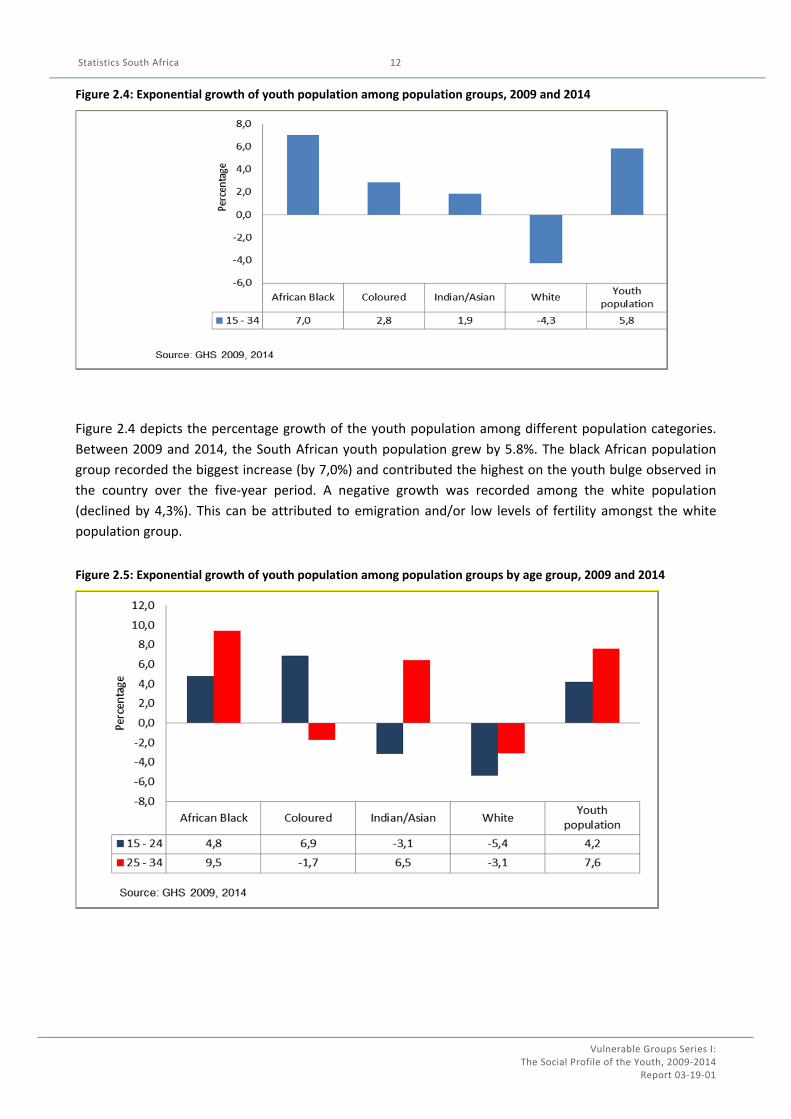
Figure 2.5 depicts the percentage growth of the youth population among different population groups by
age categories. Between 2009 and 2014, the South African youth population for age group 15 to 24 years
grew by less than 5 per cent (4,2%), whereas the growth observed for the age group 25 to 34 years was
7,6%.
Black Africans showed consistent growth amongst both age categories, although the percentage growth
observed among those aged 25 to 34 years was almost double that of their younger counterparts. The
population of coloured youth aged 15 to 24 years grew by over 6 per cent (6,9%) while those in the age
category 25 to 34 years contracted by 1,7%. Similarly, the younger Indian/Asian population group (15–24
years) also recorded negative growth, while that observed among their older counterparts (25 to 34 years)
increased by more than 6 per cent (6,5%). White youth population exhibited negative growth for both age
group categories.
Table 2.4: Youth population by province and disability status, 2011
Province
Not Disabled Disabled Total
Number Per cent Number Per cent Number Per cent
Western Cape 1 986 10,9 40 8,4 2 027 10,8
Eastern Cape 2 077 11,3 64 13,2 2 141 11,4
Northern Cape 374 2,0 12 2,6 386 2,1
Free State 924 5,1 36 7,5 961 5,1
KwaZulu‐Natal 3 690 20,2 118 24,5 3 809 20,3
North West 1 189 6,5 37 7,7 1 226 6,5
Gauteng 4 716 25,8 100 20,6 4 816 25,6
Mpumalanga 1 469 8,0 37 7,7 1 507 8,0
Limpopo 1 874 10,2 38 7,9 1 912 10,2
SA youth population 18 303 97,4 485 945 2,6 18 789 100,0
South African population 41 418 92,6 3 311 7,4 44 730
Source: Census 2011
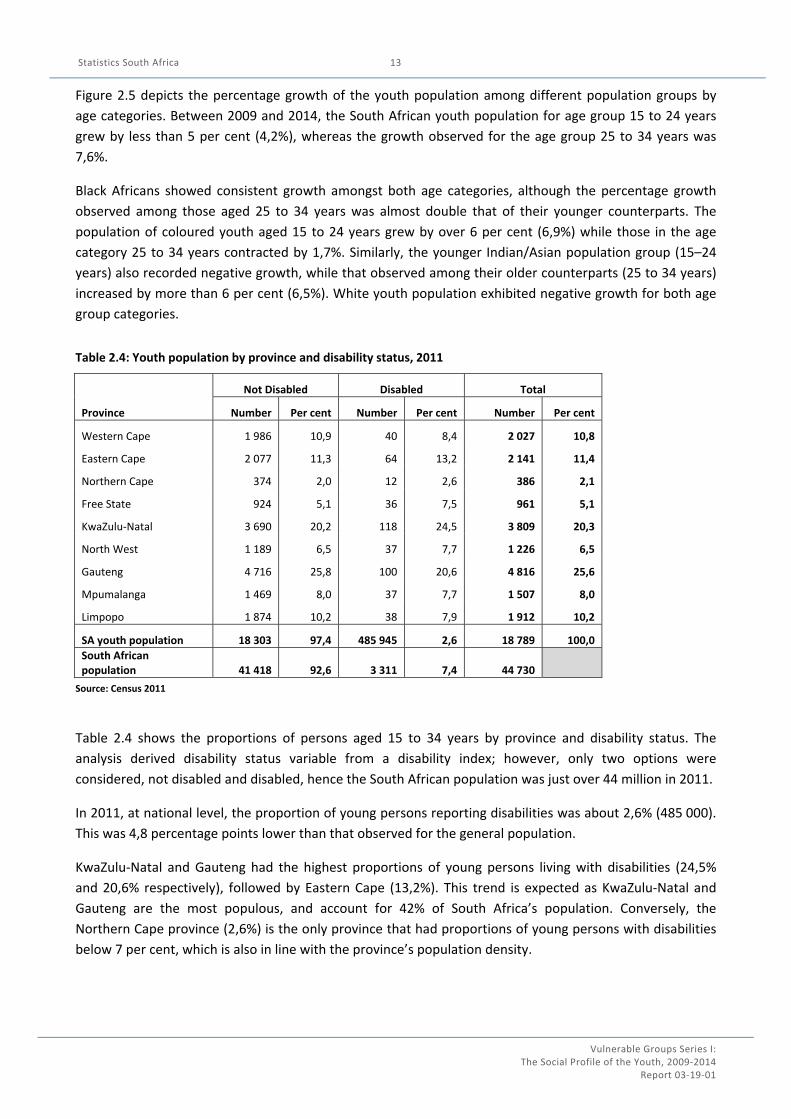
Table 2.4 shows the proportions of persons aged 15 to 34 years by province and disability status. The
analysis derived disability status variable from a disability index; however, only two options were
considered, not disabled and disabled, hence the South African population was just over 44 million in 2011.
In 2011, at national level, the proportion of young persons reporting disabilities was about 2,6% (485 000).
This was 4,8 percentage points lower than that observed for the general population.
KwaZulu‐Natal and Gauteng had the highest proportions of young persons living with disabilities (24,5%
and 20,6% respectively), followed by Eastern Cape (13,2%). This trend is expected as KwaZulu‐Natal and
Gauteng are the most populous, and account for 42% of South Africa’s population. Conversely, the
Northern Cape province (2,6%) is the only province that had proportions of young persons with disabilities
below 7 per cent, which is also in line with the province’s population density.
Statistics South Africa
Vulnerable Groups Series I: The Social Profile of the Youth, 2009‐2014
Report 03‐19‐01
14
CHAPTER 3: YOUTH MIGRATION
Migration involves the movement of individuals over space and the change of an individual's place of residence. Migration may be involuntary, where individuals or households are forced to move (for example, in response to forced removals or evictions) or it may be voluntary, where people "choose" to move. Migration may be internal, where people move within the country, or it may be international with people changing their country of residence. Migration may also be permanent because it implies a permanent change of residency, or it may be temporary in that migrants retain membership in their household (or country) of origin, to which they expect to return at some point in the future (Daniela Casale and Dori Posel, 2006).
For young people, the decision to migrate is often related to important life transitions, such as obtaining higher education, starting work or getting married. Internal or international migration can have a positive impact on young people by opening up new opportunities, a path to participate in higher education, a better and decent job, a chance to gain professional experience or to pursue personal development, by building self‐confidence, and allowing them to acquire skills and competencies beneficial to themselves and their countries and communities of origin as well as destination9 (United Nations, Youth and Migration).
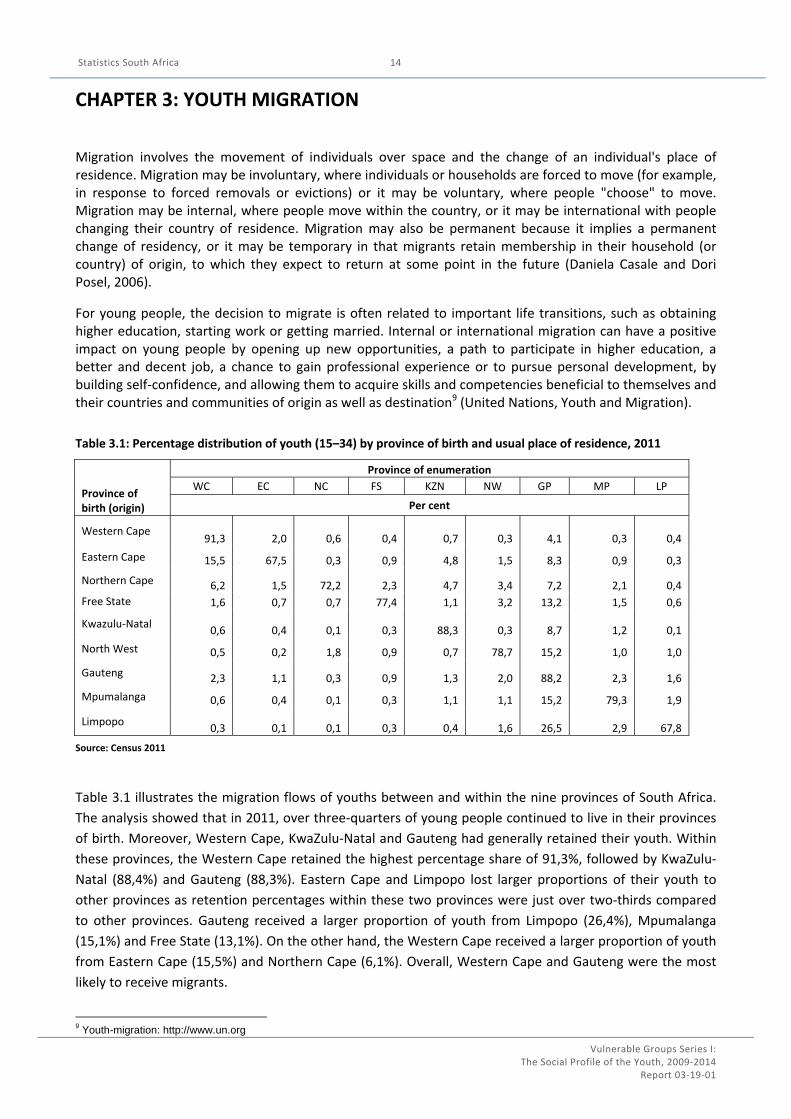
Table 3.1: Percentage distribution of youth (15–34) by province of birth and usual place of residence, 2011
Province of birth (origin)
Province of enumeration
WC EC NC FS KZN NW GP MP LP
Per cent
Western Cape 91,3 2,0 0,6 0,4 0,7 0,3 4,1 0,3 0,4
Eastern Cape 15,5 67,5 0,3 0,9 4,8 1,5 8,3 0,9 0,3
Northern Cape 6,2 1,5 72,2 2,3 4,7 3,4 7,2 2,1 0,4
Free State 1,6 0,7 0,7 77,4 1,1 3,2 13,2 1,5 0,6
Kwazulu‐Natal 0,6 0,4 0,1 0,3 88,3 0,3 8,7 1,2 0,1
North West 0,5 0,2 1,8 0,9 0,7 78,7 15,2 1,0 1,0
Gauteng 2,3 1,1 0,3 0,9 1,3 2,0 88,2 2,3 1,6
Mpumalanga 0,6 0,4 0,1 0,3 1,1 1,1 15,2 79,3 1,9
Limpopo 0,3 0,1 0,1 0,3 0,4 1,6 26,5 2,9 67,8
Source: Census 2011
Table 3.1 illustrates the migration flows of youths between and within the nine provinces of South Africa.
The analysis showed that in 2011, over three‐quarters of young people continued to live in their provinces
of birth. Moreover, Western Cape, KwaZulu‐Natal and Gauteng had generally retained their youth. Within
these provinces, the Western Cape retained the highest percentage share of 91,3%, followed by KwaZulu‐
Natal (88,4%) and Gauteng (88,3%). Eastern Cape and Limpopo lost larger proportions of their youth to
other provinces as retention percentages within these two provinces were just over two‐thirds compared
to other provinces. Gauteng received a larger proportion of youth from Limpopo (26,4%), Mpumalanga
(15,1%) and Free State (13,1%). On the other hand, the Western Cape received a larger proportion of youth
from Eastern Cape (15,5%) and Northern Cape (6,1%). Overall, Western Cape and Gauteng were the most
likely to receive migrants.
9 Youth-migration: http://www.un.org
Statistics South Africa
Vulnerable Groups Series I: The Social Profile of the Youth, 2009‐2014
Report 03‐19‐01
15
Internal migration rates
This section further explores different types of migration rates amongst the youth population. The analysis
looks at out‐migration, in‐migration and net migration rates. The out‐migration rate is defined as the
number of out‐migrants per province of birth divided by the youth population per province and multiplied
by 1 000. The in‐migration rate is defined as the number of in‐migrants per province of birth divided by the
youth population per province and multiplied by 1 000. Lastly, the net‐migration rate is defined as the
number of in‐migrants minus out‐migrants per province of birth divided by the youth population per
province multiplied by 1 000.
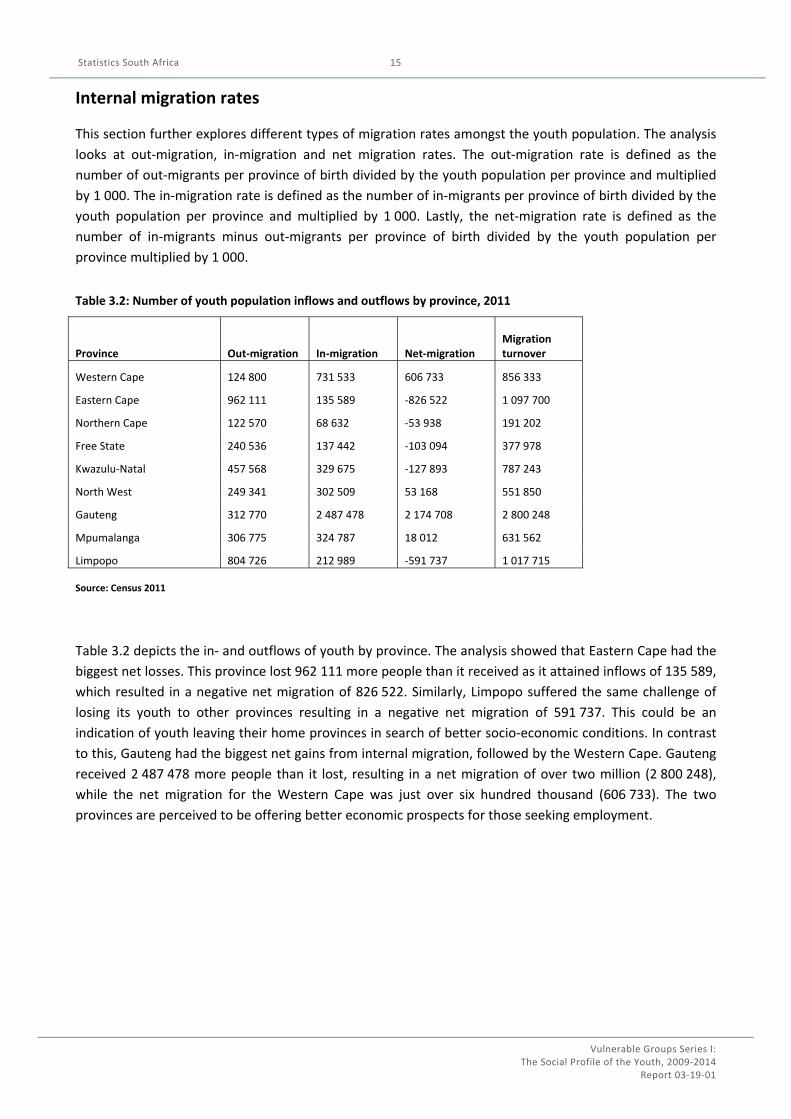
Table 3.2: Number of youth population inflows and outflows by province, 2011
Province Out‐migration In‐migration Net‐migration Migration turnover
Western Cape 124 800 731 533 606 733 856 333
Eastern Cape 962 111 135 589 ‐826 522 1 097 700
Northern Cape 122 570 68 632 ‐53 938 191 202
Free State 240 536 137 442 ‐103 094 377 978
Kwazulu‐Natal 457 568 329 675 ‐127 893 787 243
North West 249 341 302 509 53 168 551 850
Gauteng 312 770 2 487 478 2 174 708 2 800 248
Mpumalanga 306 775 324 787 18 012 631 562
Limpopo 804 726 212 989 ‐591 737 1 017 715 Source: Census 2011
Table 3.2 depicts the in‐ and outflows of youth by province. The analysis showed that Eastern Cape had the
biggest net losses. This province lost 962 111 more people than it received as it attained inflows of 135 589,
which resulted in a negative net migration of 826 522. Similarly, Limpopo suffered the same challenge of
losing its youth to other provinces resulting in a negative net migration of 591 737. This could be an
indication of youth leaving their home provinces in search of better socio‐economic conditions. In contrast
to this, Gauteng had the biggest net gains from internal migration, followed by the Western Cape. Gauteng
received 2 487 478 more people than it lost, resulting in a net migration of over two million (2 800 248),
while the net migration for the Western Cape was just over six hundred thousand (606 733). The two
provinces are perceived to be offering better economic prospects for those seeking employment.
Statistics South Africa
Vulnerable Groups Series I: The Social Profile of the Youth, 2009‐2014
Report 03‐19‐01
16
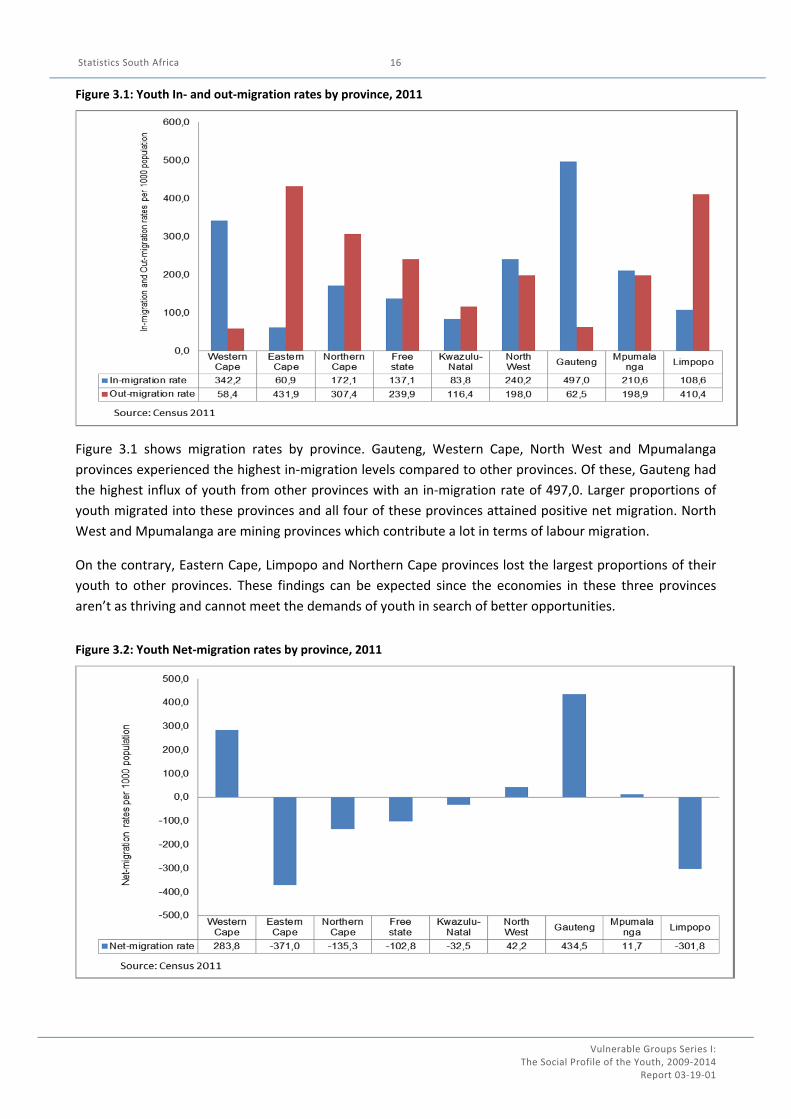
Figure 3.1: Youth In‐ and out‐migration rates by province, 2011
Figure 3.1 shows migration rates by province. Gauteng, Western Cape, North West and Mpumalanga
provinces experienced the highest in‐migration levels compared to other provinces. Of these, Gauteng had
the highest influx of youth from other provinces with an in‐migration rate of 497,0. Larger proportions of
youth migrated into these provinces and all four of these provinces attained positive net migration. North
West and Mpumalanga are mining provinces which contribute a lot in terms of labour migration.
On the contrary, Eastern Cape, Limpopo and Northern Cape provinces lost the largest proportions of their
youth to other provinces. These findings can be expected since the economies in these three provinces
aren’t as thriving and cannot meet the demands of youth in search of better opportunities.
Figure 3.2: Youth Net‐migration rates by province, 2011
Statistics South Africa
Vulnerable Groups Series I: The Social Profile of the Youth, 2009‐2014
Report 03‐19‐01
17
Figure 3.2 above depicts provincial net migration rates. The net migration rate reflects the effect of
migration on the total population of an area. A positive net migration rate means that the number of
people moving into an area exceeds the number of those moving out. Similarly, a negative net migration
rate means that an area has lost more residents than it has gained through migration10.
Provincial variations revealed that Gauteng and Western Cape observed the largest positive net migration
rates. This indicates that the two provinces received large proportions of youth from other provinces and
observed less out‐migrants compared to other provinces. However, Gauteng (434,5) attracted a larger
influx of young people compared to Western Cape (283,8).
Eastern Cape, Limpopo and Northern Cape provinces lost more youth than they gained through migration
as they have negative net migration rates. This phenomenon is expected from these provinces, especially
Eastern Cape and Limpopo as they are perceived to be lacking in terms of affording their youth better
socio‐economic conditions.
Table 3.3: Percentage distribution of youth migrants (from province of birth) by province of enumeration and age group, 2011
Province of enumeration
15 ‐ 24 25 ‐ 34
N('000) Per cent N('000) Per cent
Western Cape 1 003 10,1 1 029 11,7
Eastern Cape 1 285 12,9 846 9,6
Northern Cape 205 2,1 180 2,1
Free State 522 5,2 437 5,0
KwaZulu‐Natal 2 135 21,4 1 649 18,8
North West 642 6,4 582 6,6
Gauteng 2 204 22,1 2 627 29,9
Mpumalanga 830 8,3 671 7,6
Limpopo 1 142 11,5 761 8,7
Total 9 972 100,0 8 785 100,0
Source: Census 2011
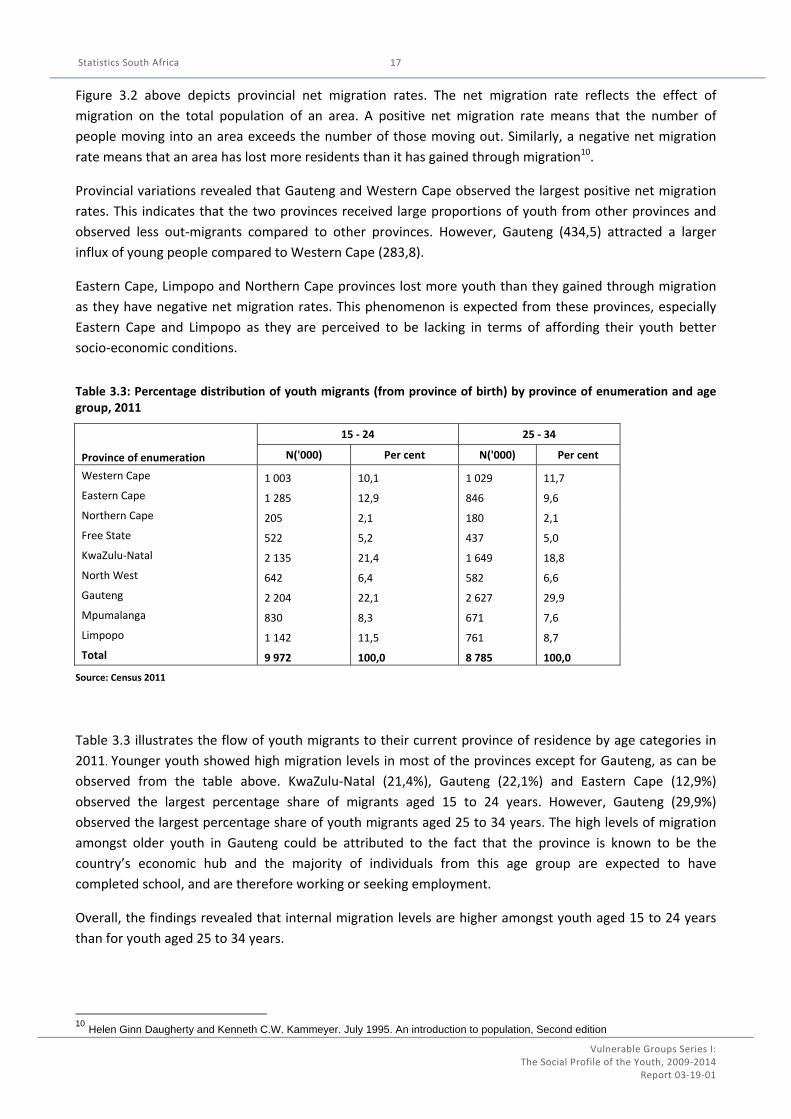
Table 3.3 illustrates the flow of youth migrants to their current province of residence by age categories in
2011. Younger youth showed high migration levels in most of the provinces except for Gauteng, as can be
observed from the table above. KwaZulu‐Natal (21,4%), Gauteng (22,1%) and Eastern Cape (12,9%)
observed the largest percentage share of migrants aged 15 to 24 years. However, Gauteng (29,9%)
observed the largest percentage share of youth migrants aged 25 to 34 years. The high levels of migration
amongst older youth in Gauteng could be attributed to the fact that the province is known to be the
country’s economic hub and the majority of individuals from this age group are expected to have
completed school, and are therefore working or seeking employment.
Overall, the findings revealed that internal migration levels are higher amongst youth aged 15 to 24 years
than for youth aged 25 to 34 years.
10 Helen Ginn Daugherty and Kenneth C.W. Kammeyer. July 1995. An introduction to population, Second edition
Statistics South Africa
Vulnerable Groups Series I: The Social Profile of the Youth, 2009‐2014
Report 03‐19‐01
18
CHAPTER 4: HOUSEHOLD CHARACTERISTICS
The household characteristics section provides information about the number of youth‐headed
households; characteristics of the household heads; household composition as well as the generational
household types.
Table 4.1: Proportions of youth‐headed households by age groups, 2009 and 2014
Province
2009
SA households 15–24 25–34 15–34
N (‘000) Per cent N (‘000) Per cent N (‘000) Per cent N (‘000) Per cent
Western Cape 1 477 74,7 63 4,3 310 21,0 374 25,3
Eastern Cape 1 548 75,2 85 5,5 299 19,3 384 24,8
Northern Cape 275 76,0 14 5,3 51 18,7 65 24,0
Free State 789 72,3 52 6,7 165 21,0 218 27,7
KwaZulu‐Natal 2 290 73,5 116 5,1 490 21,4 606 26,5
North West 1 009 72,4 54 5,4 223 22,2 278 27,6
Gauteng 3 661 70,9 186 5,1 878 24,0 1 064 29,1
Mpumalanga 980 69,9 75 7,7 219 22,4 295 30,1
Limpopo 1 268 70,6 129 10,2 243 19,2 373 29,4
Total 13 301 72,5 779 5,9 2 882 21,7 3 661 27,5
2014
Western Cape 1 720 76,6 45 2,6 357 20,8 402 23,4
Eastern Cape 1 694 75,3 113 6,7 304 18,0 418 24,7
Northern Cape 311 76,9 17 5,5 55 17,7 72 23,1
Free State 883 73,8 58 6,6 173 19,6 231 26,2
KwaZulu‐Natal 2 663 74,2 153 5,8 534 20,1 688 25,8
North West 1 176 72,5 61 5,2 262 22,3 323 27,5
Gauteng 4 500 73,7 218 4,8 967 21,5 1 185 26,3
Mpumalanga 1 167 71,6 77 6,6 254 21,8 331 28,4
Limpopo 1 483 71,8 126 8,5 291 19,6 417 28,2
Total 15 601 73,9 870 5,6 3 201 20,5 4 071 26,1
Source: GHS 2009, 2014
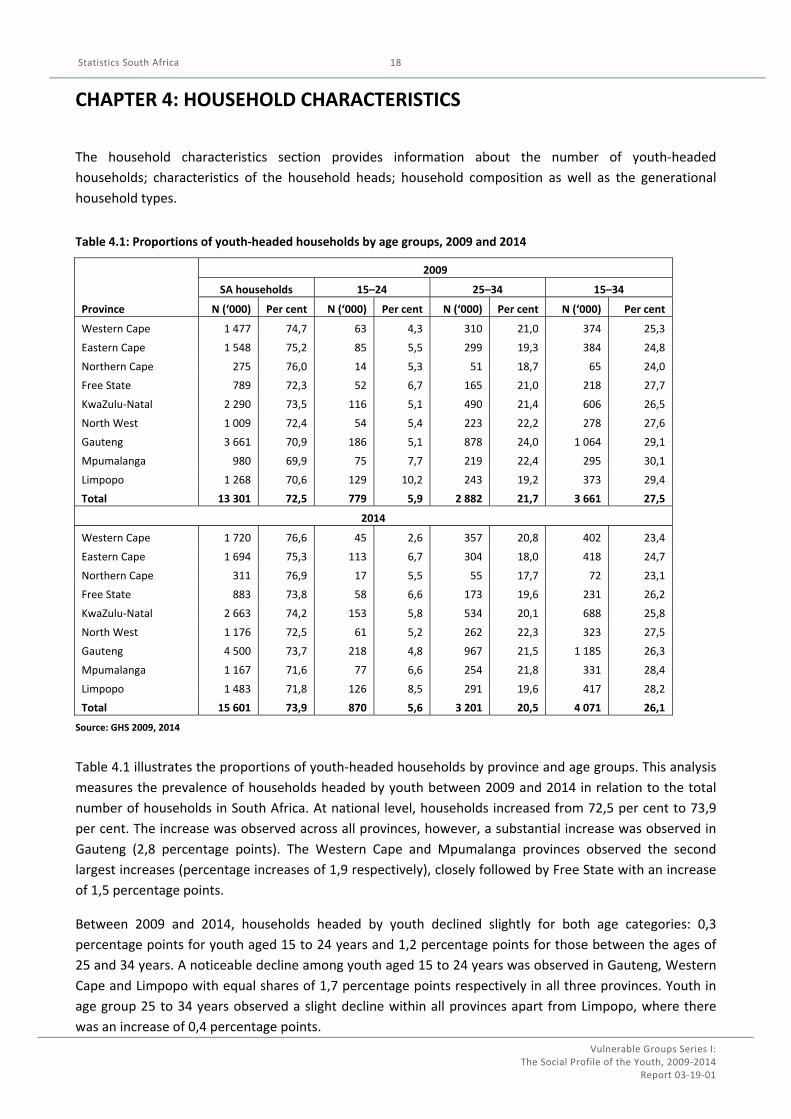
Table 4.1 illustrates the proportions of youth‐headed households by province and age groups. This analysis
measures the prevalence of households headed by youth between 2009 and 2014 in relation to the total
number of households in South Africa. At national level, households increased from 72,5 per cent to 73,9
per cent. The increase was observed across all provinces, however, a substantial increase was observed in
Gauteng (2,8 percentage points). The Western Cape and Mpumalanga provinces observed the second
largest increases (percentage increases of 1,9 respectively), closely followed by Free State with an increase
of 1,5 percentage points.
Between 2009 and 2014, households headed by youth declined slightly for both age categories: 0,3
percentage points for youth aged 15 to 24 years and 1,2 percentage points for those between the ages of
25 and 34 years. A noticeable decline among youth aged 15 to 24 years was observed in Gauteng, Western
Cape and Limpopo with equal shares of 1,7 percentage points respectively in all three provinces. Youth in
age group 25 to 34 years observed a slight decline within all provinces apart from Limpopo, where there
was an increase of 0,4 percentage points.
Statistics South Africa
Vulnerable Groups Series I: The Social Profile of the Youth, 2009‐2014
Report 03‐19‐01
19
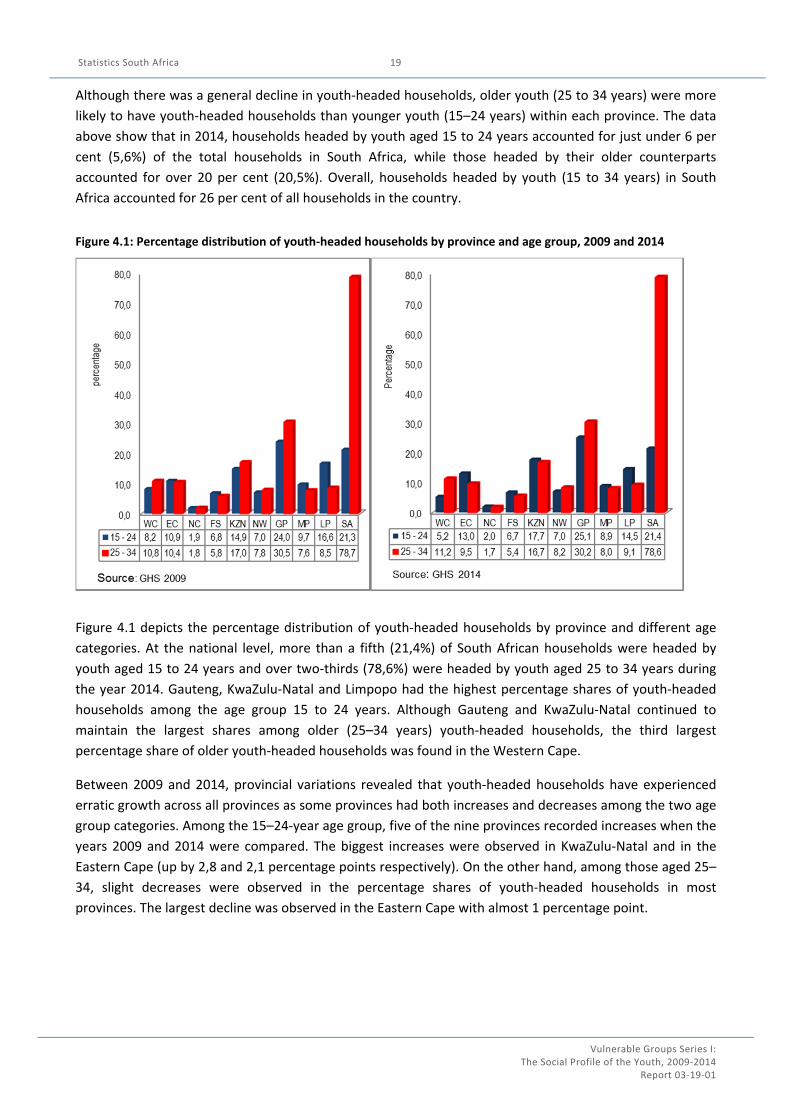
Although there was a general decline in youth‐headed households, older youth (25 to 34 years) were more
likely to have youth‐headed households than younger youth (15–24 years) within each province. The data
above show that in 2014, households headed by youth aged 15 to 24 years accounted for just under 6 per
cent (5,6%) of the total households in South Africa, while those headed by their older counterparts
accounted for over 20 per cent (20,5%). Overall, households headed by youth (15 to 34 years) in South
Africa accounted for 26 per cent of all households in the country.
Figure 4.1: Percentage distribution of youth‐headed households by province and age group, 2009 and 2014
Figure 4.1 depicts the percentage distribution of youth‐headed households by province and different age
categories. At the national level, more than a fifth (21,4%) of South African households were headed by
youth aged 15 to 24 years and over two‐thirds (78,6%) were headed by youth aged 25 to 34 years during
the year 2014. Gauteng, KwaZulu‐Natal and Limpopo had the highest percentage shares of youth‐headed
households among the age group 15 to 24 years. Although Gauteng and KwaZulu‐Natal continued to
maintain the largest shares among older (25–34 years) youth‐headed households, the third largest
percentage share of older youth‐headed households was found in the Western Cape.
Between 2009 and 2014, provincial variations revealed that youth‐headed households have experienced
erratic growth across all provinces as some provinces had both increases and decreases among the two age
group categories. Among the 15–24‐year age group, five of the nine provinces recorded increases when the
years 2009 and 2014 were compared. The biggest increases were observed in KwaZulu‐Natal and in the
Eastern Cape (up by 2,8 and 2,1 percentage points respectively). On the other hand, among those aged 25–
34, slight decreases were observed in the percentage shares of youth‐headed households in most
provinces. The largest decline was observed in the Eastern Cape with almost 1 percentage point.
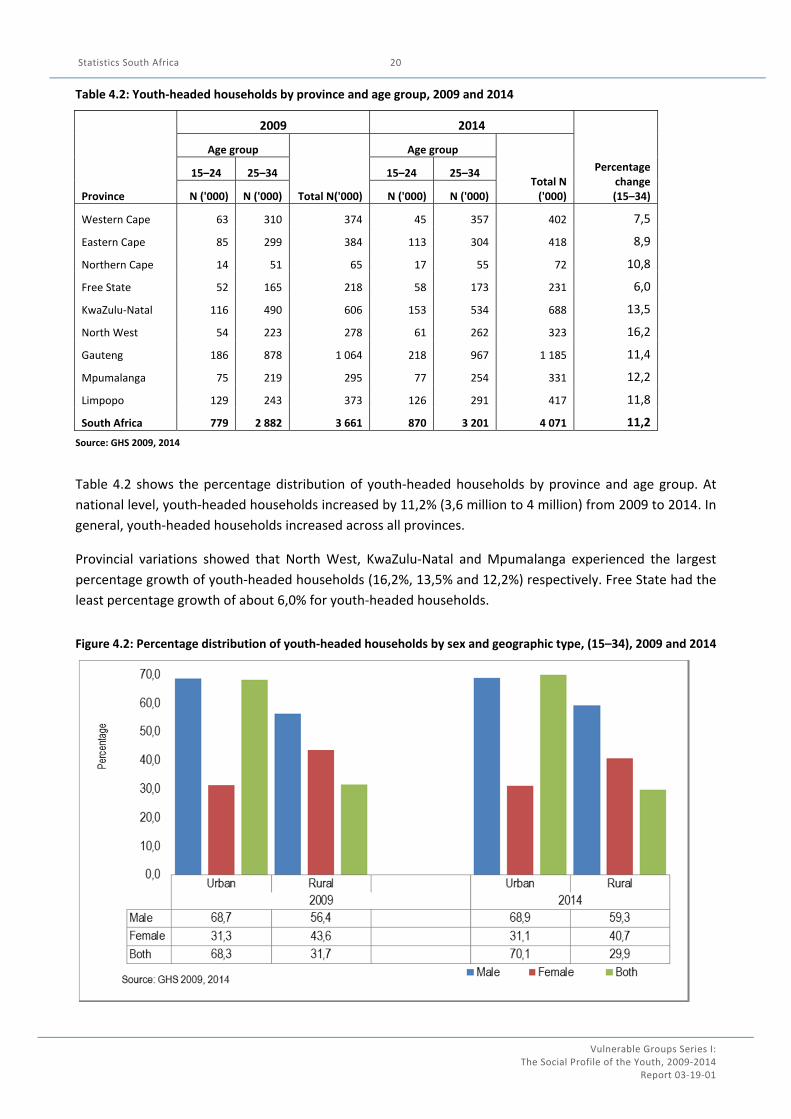
Statistics South Africa
Vulnerable Groups Series I: The Social Profile of the Youth, 2009‐2014
Report 03‐19‐01
20
Table 4.2: Youth‐headed households by province and age group, 2009 and 2014
Province
2009 2014
Percentage change (15–34)
Age group
Total N('000)
Age group
Total N ('000)
15–24 25–34 15–24 25–34
N ('000) N ('000) N ('000) N ('000)
Western Cape 63 310 374 45 357 402 7,5
Eastern Cape 85 299 384 113 304 418 8,9
Northern Cape 14 51 65 17 55 72 10,8
Free State 52 165 218 58 173 231 6,0
KwaZulu‐Natal 116 490 606 153 534 688 13,5
North West 54 223 278 61 262 323 16,2
Gauteng 186 878 1 064 218 967 1 185 11,4
Mpumalanga 75 219 295 77 254 331 12,2
Limpopo 129 243 373 126 291 417 11,8
South Africa 779 2 882 3 661 870 3 201 4 071 11,2
Source: GHS 2009, 2014
Table 4.2 shows the percentage distribution of youth‐headed households by province and age group. At
national level, youth‐headed households increased by 11,2% (3,6 million to 4 million) from 2009 to 2014. In
general, youth‐headed households increased across all provinces.
Provincial variations showed that North West, KwaZulu‐Natal and Mpumalanga experienced the largest
percentage growth of youth‐headed households (16,2%, 13,5% and 12,2%) respectively. Free State had the
least percentage growth of about 6,0% for youth‐headed households.
Figure 4.2: Percentage distribution of youth‐headed households by sex and geographic type, (15–34), 2009 and 2014
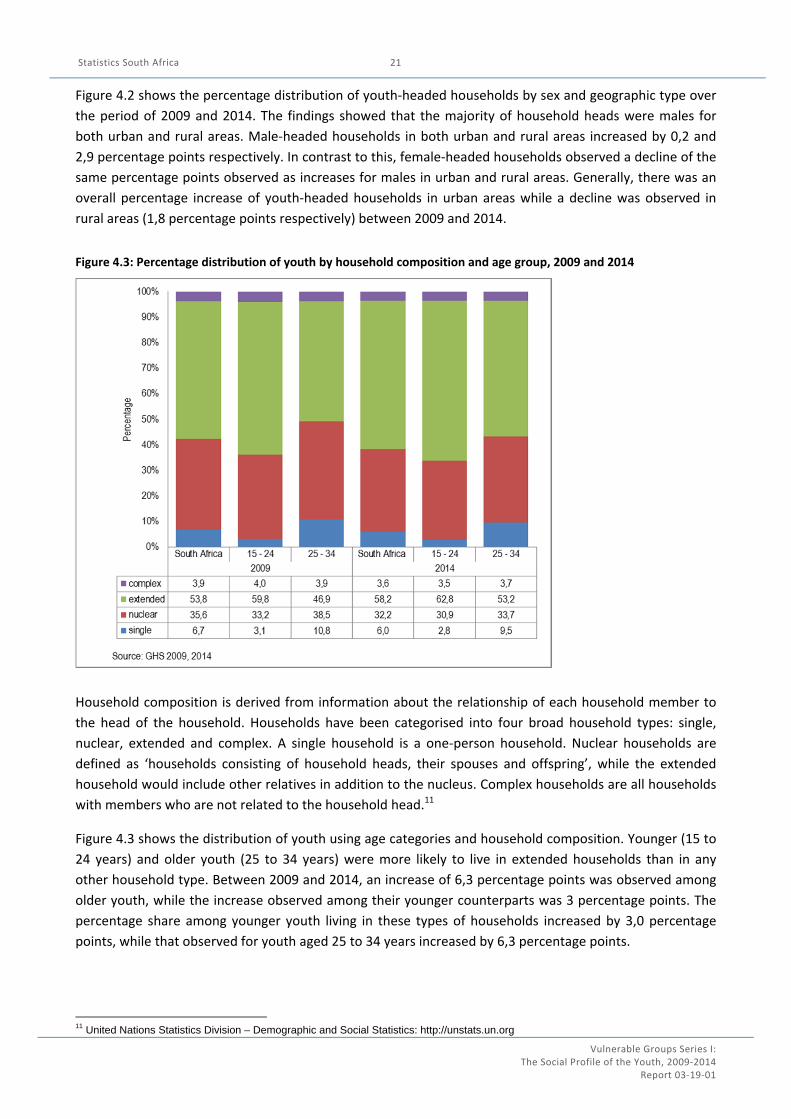
Statistics South Africa
Vulnerable Groups Series I: The Social Profile of the Youth, 2009‐2014
Report 03‐19‐01
21
Figure 4.2 shows the percentage distribution of youth‐headed households by sex and geographic type over
the period of 2009 and 2014. The findings showed that the majority of household heads were males for
both urban and rural areas. Male‐headed households in both urban and rural areas increased by 0,2 and
2,9 percentage points respectively. In contrast to this, female‐headed households observed a decline of the
same percentage points observed as increases for males in urban and rural areas. Generally, there was an
overall percentage increase of youth‐headed households in urban areas while a decline was observed in
rural areas (1,8 percentage points respectively) between 2009 and 2014.
Figure 4.3: Percentage distribution of youth by household composition and age group, 2009 and 2014
Household composition is derived from information about the relationship of each household member to
the head of the household. Households have been categorised into four broad household types: single,
nuclear, extended and complex. A single household is a one‐person household. Nuclear households are
defined as ‘households consisting of household heads, their spouses and offspring’, while the extended
household would include other relatives in addition to the nucleus. Complex households are all households
with members who are not related to the household head.11
Figure 4.3 shows the distribution of youth using age categories and household composition. Younger (15 to
24 years) and older youth (25 to 34 years) were more likely to live in extended households than in any
other household type. Between 2009 and 2014, an increase of 6,3 percentage points was observed among
older youth, while the increase observed among their younger counterparts was 3 percentage points. The
percentage share among younger youth living in these types of households increased by 3,0 percentage
points, while that observed for youth aged 25 to 34 years increased by 6,3 percentage points.
11 United Nations Statistics Division – Demographic and Social Statistics: http://unstats.un.org
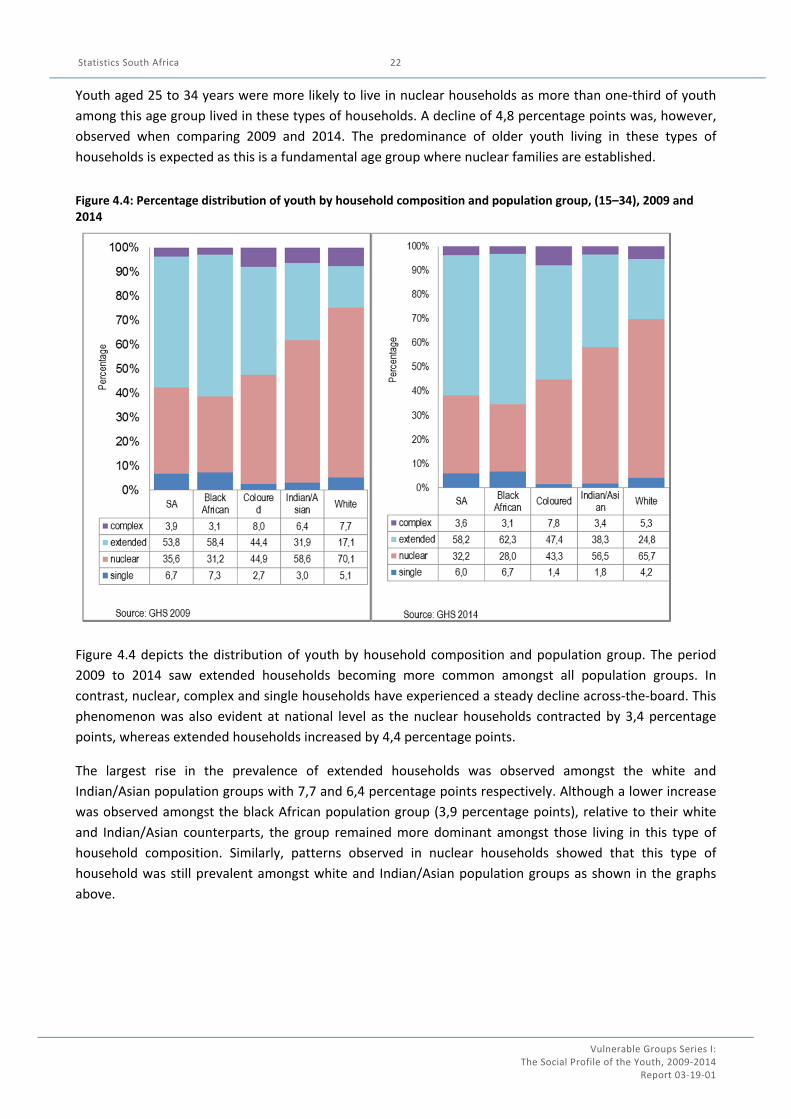
Statistics South Africa
Vulnerable Groups Series I: The Social Profile of the Youth, 2009‐2014
Report 03‐19‐01
22
Youth aged 25 to 34 years were more likely to live in nuclear households as more than one‐third of youth
among this age group lived in these types of households. A decline of 4,8 percentage points was, however,
observed when comparing 2009 and 2014. The predominance of older youth living in these types of
households is expected as this is a fundamental age group where nuclear families are established.
Figure 4.4: Percentage distribution of youth by household composition and population group, (15–34), 2009 and 2014
Figure 4.4 depicts the distribution of youth by household composition and population group. The period
2009 to 2014 saw extended households becoming more common amongst all population groups. In
contrast, nuclear, complex and single households have experienced a steady decline across‐the‐board. This
phenomenon was also evident at national level as the nuclear households contracted by 3,4 percentage
points, whereas extended households increased by 4,4 percentage points.
The largest rise in the prevalence of extended households was observed amongst the white and
Indian/Asian population groups with 7,7 and 6,4 percentage points respectively. Although a lower increase
was observed amongst the black African population group (3,9 percentage points), relative to their white
and Indian/Asian counterparts, the group remained more dominant amongst those living in this type of
household composition. Similarly, patterns observed in nuclear households showed that this type of
household was still prevalent amongst white and Indian/Asian population groups as shown in the graphs
above.
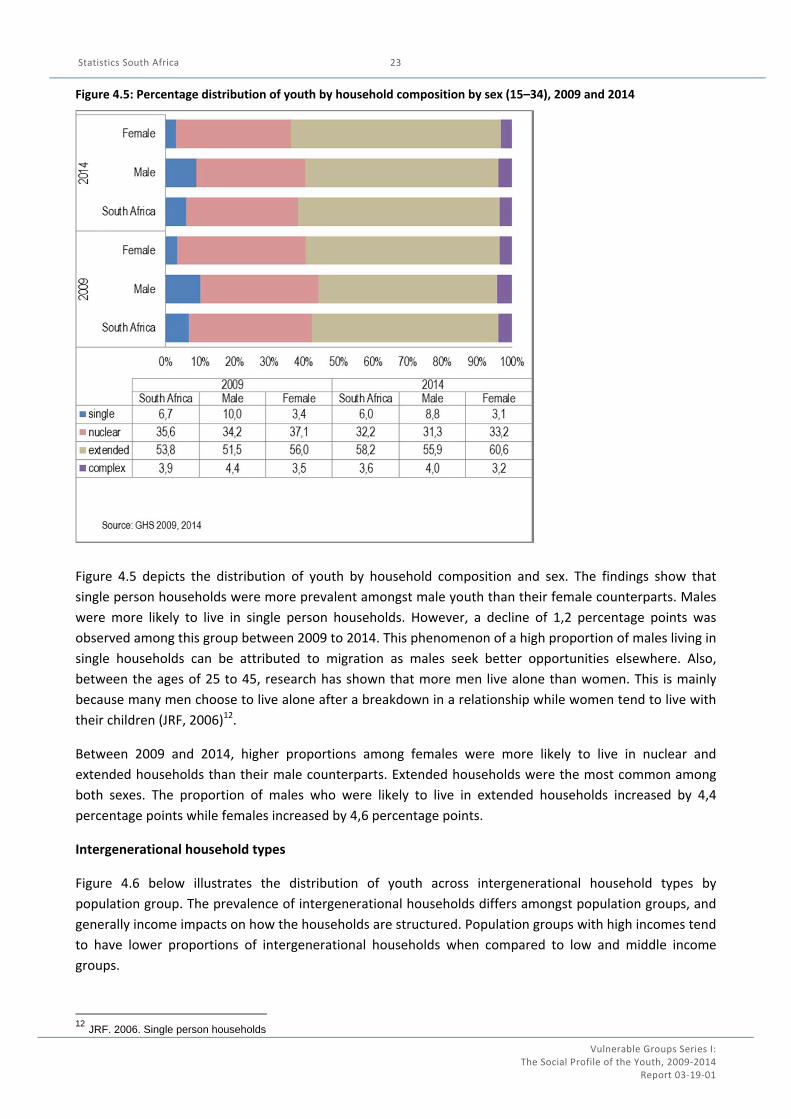
Statistics South Africa
Vulnerable Groups Series I: The Social Profile of the Youth, 2009‐2014
Report 03‐19‐01
23
Figure 4.5: Percentage distribution of youth by household composition by sex (15–34), 2009 and 2014
Figure 4.5 depicts the distribution of youth by household composition and sex. The findings show that
single person households were more prevalent amongst male youth than their female counterparts. Males
were more likely to live in single person households. However, a decline of 1,2 percentage points was
observed among this group between 2009 to 2014. This phenomenon of a high proportion of males living in
single households can be attributed to migration as males seek better opportunities elsewhere. Also,
between the ages of 25 to 45, research has shown that more men live alone than women. This is mainly
because many men choose to live alone after a breakdown in a relationship while women tend to live with
their children (JRF, 2006)12.
Between 2009 and 2014, higher proportions among females were more likely to live in nuclear and
extended households than their male counterparts. Extended households were the most common among
both sexes. The proportion of males who were likely to live in extended households increased by 4,4
percentage points while females increased by 4,6 percentage points.
Intergenerational household types
Figure 4.6 below illustrates the distribution of youth across intergenerational household types by
population group. The prevalence of intergenerational households differs amongst population groups, and
generally income impacts on how the households are structured. Population groups with high incomes tend
to have lower proportions of intergenerational households when compared to low and middle income
groups.
12 JRF. 2006. Single person households
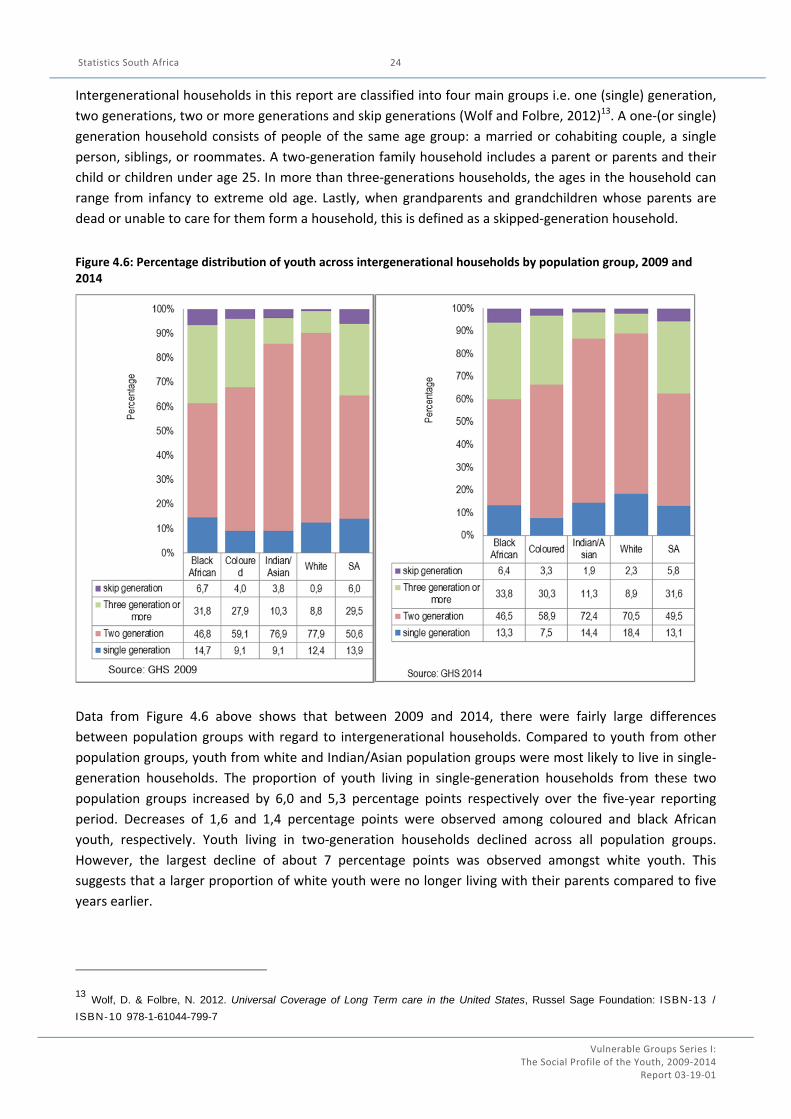
Statistics South Africa
Vulnerable Groups Series I: The Social Profile of the Youth, 2009‐2014
Report 03‐19‐01
24
Intergenerational households in this report are classified into four main groups i.e. one (single) generation,
two generations, two or more generations and skip generations (Wolf and Folbre, 2012)13. A one‐(or single)
generation household consists of people of the same age group: a married or cohabiting couple, a single
person, siblings, or roommates. A two‐generation family household includes a parent or parents and their
child or children under age 25. In more than three‐generations households, the ages in the household can
range from infancy to extreme old age. Lastly, when grandparents and grandchildren whose parents are
dead or unable to care for them form a household, this is defined as a skipped‐generation household.
Figure 4.6: Percentage distribution of youth across intergenerational households by population group, 2009 and 2014
Data from Figure 4.6 above shows that between 2009 and 2014, there were fairly large differences
between population groups with regard to intergenerational households. Compared to youth from other
population groups, youth from white and Indian/Asian population groups were most likely to live in single‐
generation households. The proportion of youth living in single‐generation households from these two
population groups increased by 6,0 and 5,3 percentage points respectively over the five‐year reporting
period. Decreases of 1,6 and 1,4 percentage points were observed among coloured and black African
youth, respectively. Youth living in two‐generation households declined across all population groups.
However, the largest decline of about 7 percentage points was observed amongst white youth. This
suggests that a larger proportion of white youth were no longer living with their parents compared to five
years earlier.
13 Wolf, D. & Folbre, N. 2012. Universal Coverage of Long Term care in the United States, Russel Sage Foundation: ISBN-13 /
ISBN-10 978-1-61044-799-7
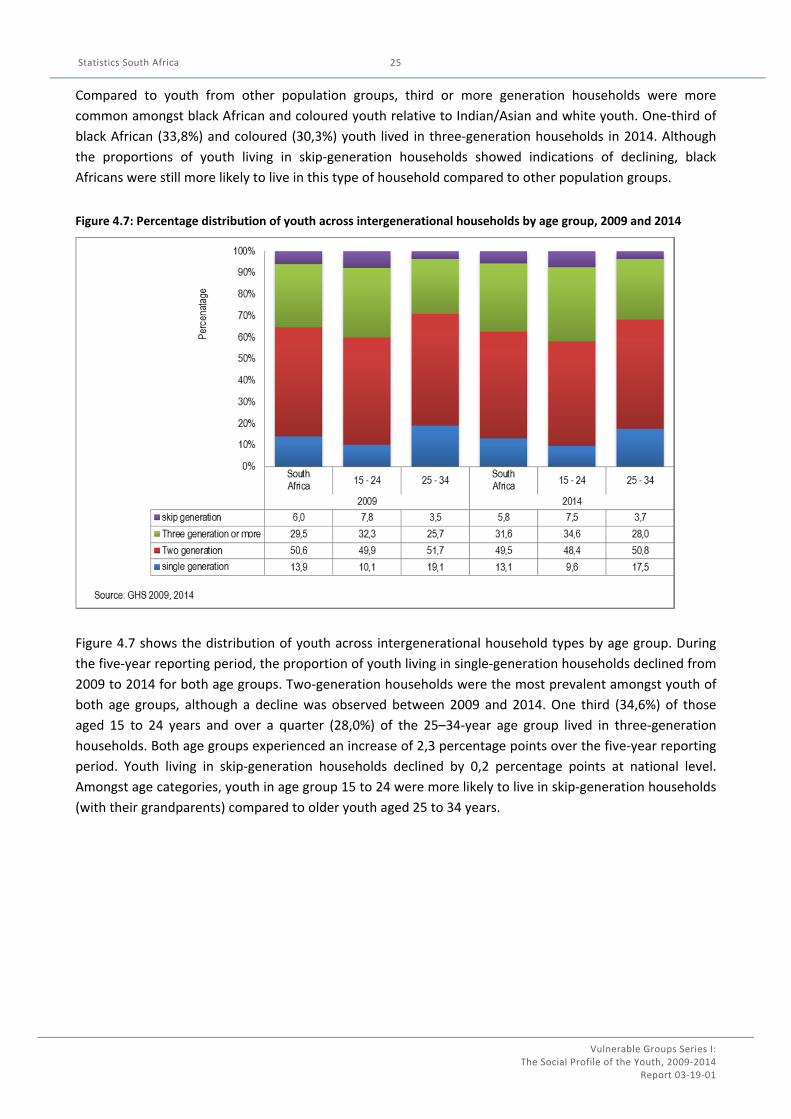
Statistics South Africa
Vulnerable Groups Series I: The Social Profile of the Youth, 2009‐2014
Report 03‐19‐01
25
Compared to youth from other population groups, third or more generation households were more
common amongst black African and coloured youth relative to Indian/Asian and white youth. One‐third of
black African (33,8%) and coloured (30,3%) youth lived in three‐generation households in 2014. Although
the proportions of youth living in skip‐generation households showed indications of declining, black
Africans were still more likely to live in this type of household compared to other population groups.
Figure 4.7: Percentage distribution of youth across intergenerational households by age group, 2009 and 2014
Figure 4.7 shows the distribution of youth across intergenerational household types by age group. During
the five‐year reporting period, the proportion of youth living in single‐generation households declined from
2009 to 2014 for both age groups. Two‐generation households were the most prevalent amongst youth of
both age groups, although a decline was observed between 2009 and 2014. One third (34,6%) of those
aged 15 to 24 years and over a quarter (28,0%) of the 25–34‐year age group lived in three‐generation
households. Both age groups experienced an increase of 2,3 percentage points over the five‐year reporting
period. Youth living in skip‐generation households declined by 0,2 percentage points at national level.
Amongst age categories, youth in age group 15 to 24 were more likely to live in skip‐generation households
(with their grandparents) compared to older youth aged 25 to 34 years.
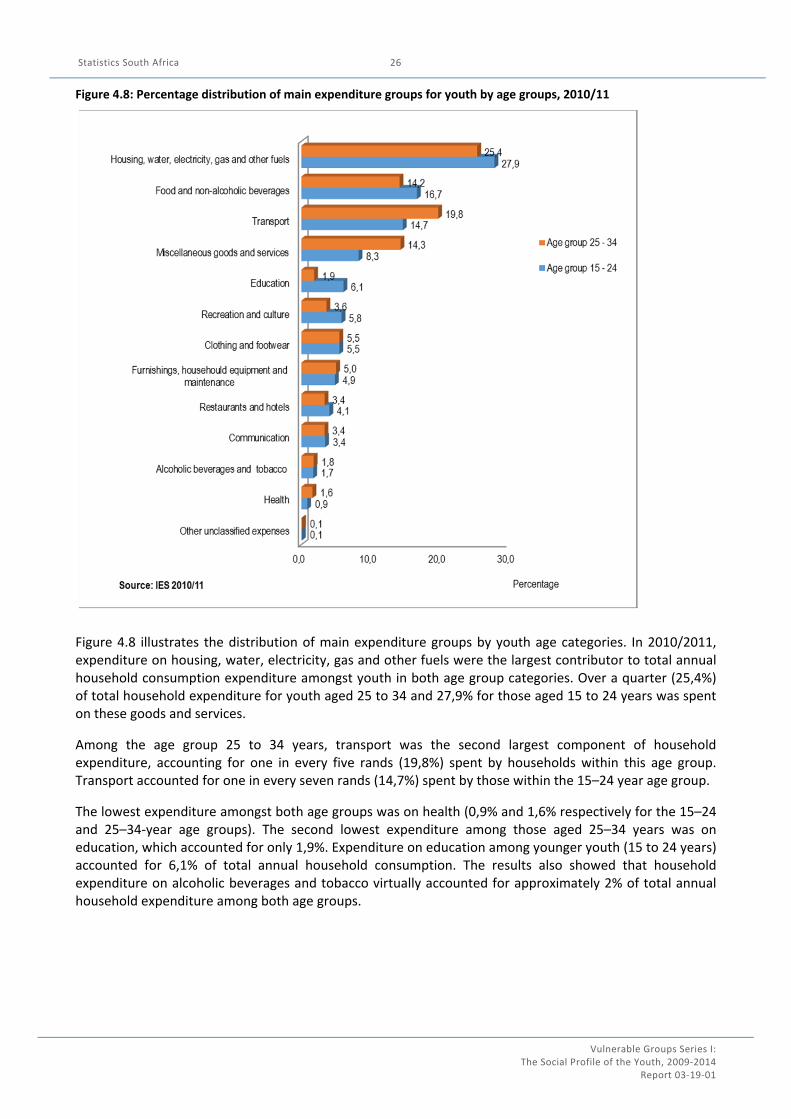
Statistics South Africa
Vulnerable Groups Series I: The Social Profile of the Youth, 2009‐2014
Report 03‐19‐01
26
Figure 4.8: Percentage distribution of main expenditure groups for youth by age groups, 2010/11
Figure 4.8 illustrates the distribution of main expenditure groups by youth age categories. In 2010/2011, expenditure on housing, water, electricity, gas and other fuels were the largest contributor to total annual household consumption expenditure amongst youth in both age group categories. Over a quarter (25,4%) of total household expenditure for youth aged 25 to 34 and 27,9% for those aged 15 to 24 years was spent on these goods and services.
Among the age group 25 to 34 years, transport was the second largest component of household expenditure, accounting for one in every five rands (19,8%) spent by households within this age group. Transport accounted for one in every seven rands (14,7%) spent by those within the 15–24 year age group.
The lowest expenditure amongst both age groups was on health (0,9% and 1,6% respectively for the 15–24 and 25–34‐year age groups). The second lowest expenditure among those aged 25–34 years was on education, which accounted for only 1,9%. Expenditure on education among younger youth (15 to 24 years) accounted for 6,1% of total annual household consumption. The results also showed that household expenditure on alcoholic beverages and tobacco virtually accounted for approximately 2% of total annual household expenditure among both age groups.

Statistics South Africa
Vulnerable Groups Series I: The Social Profile of the Youth, 2009‐2014
Report 03‐19‐01
27
CHAPTER 5: YOUTH LABOUR MARKET PARTICIPATION
Unemployment is one of the major and most persistent problems faced by the country. The unemployment
of young people who continue to make up the largest proportion in figures of unemployment is of
particular concern. Being young involves preparing for the future for adult life. Completing an education,
finding a job and gaining social and economic independence are some of the natural life stages for most
South Africans. However, for many young people, this is not a straightforward transition. The aim of this
chapter is to investigate the recent trends with regard to the participation of youth in the labour market by
primarily focusing on youth employment and unemployment.
Labour market participation rates
Figure 5.1a: Youth (15–34 years) labour market participation rates, 2009–2014
Figure 5.1b: Adult (35–64 years) labour market participation rates, 2009–2014
Source: QLFS 2009–2014
The figures above show labour market participation rates of youth (Figure 5.1a) and adults (Figure 5.1b)
over the period 2009 to 2014. The proportion of economically active youth declined over the last five years.
Between 2009 and 2014, labour force participation rates (LFPR) amongst adults increased slightly by 0,6 of
a percentage point, while that observed amongst youth declined by 1,7 percentage points.
In terms of employment, although a steady decline in the absorption rates (AR) of both adults and youth
was noticed from 2009, the drop was largest amongst youth when 2009 and 2014 were compared. AR for
adults and youth dropped by 1,0 and 2,0 percentage points respectively.
Figures 5.1a and 5.1b also show that unlike trends presented for adults where the rate of unemployed (UR)
is considerably lower than the employment rate (AR), the youth unemployment rate is actually higher than
the employment rate.
At an average of around 52%, inactivity rates for young people between the ages of 15–34 years were
above those observed for adults. This can be expected since most young people (particularly within the age
bracket 15–24 years) are still attending school. However, Figure 5.1c shows that the period 2009 to 2010
was accompanied by a sharp increase of young people aged 25–34 years who were economically inactive.
The inactivity rate amongst this group then stabilised at approximately 27,0% from 2010 to 2014.
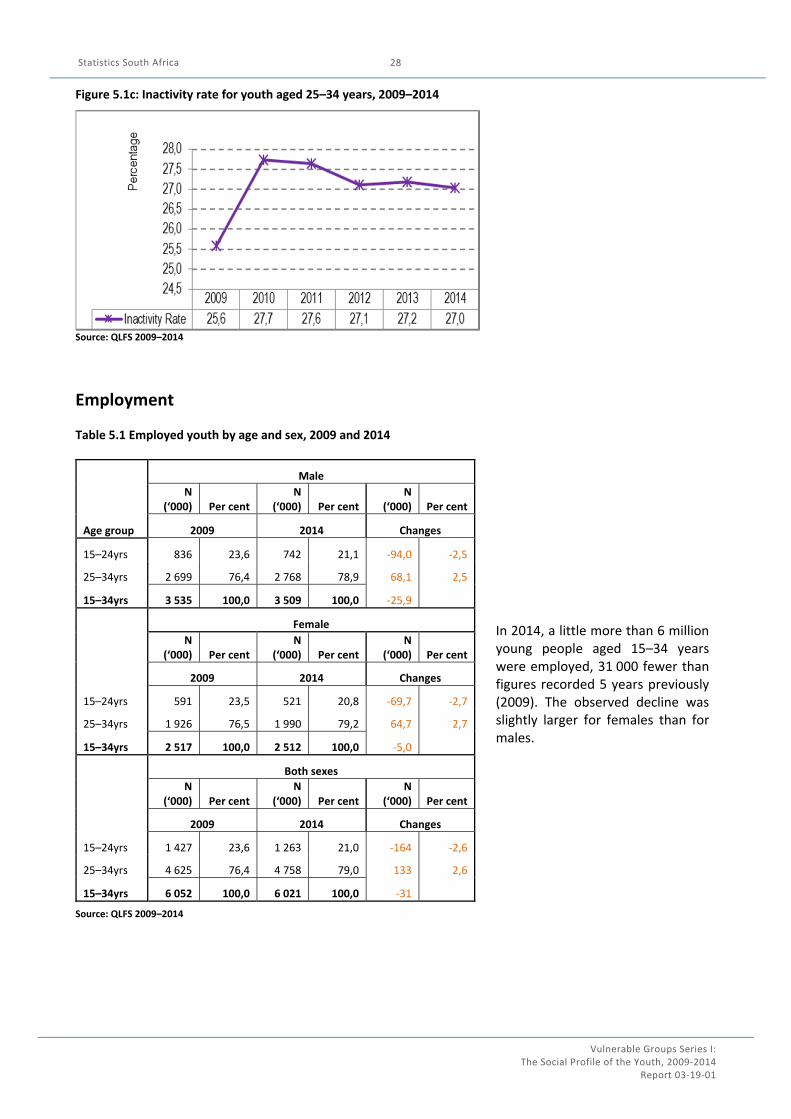
Statistics South Africa
Vulnerable Groups Series I: The Social Profile of the Youth, 2009‐2014
Report 03‐19‐01
28
Figure 5.1c: Inactivity rate for youth aged 25–34 years, 2009–2014
Source: QLFS 2009–2014
Employment
Table 5.1 Employed youth by age and sex, 2009 and 2014
Age group
Male
N (‘000) Per cent
N (‘000) Per cent
N (‘000) Per cent
2009 2014 Changes
15–24yrs 836 23,6 742 21,1 ‐94,0 ‐2,5
25–34yrs 2 699 76,4 2 768 78,9 68,1 2,5
15–34yrs 3 535 100,0 3 509 100,0 ‐25,9
Female
N
(‘000) Per cent N
(‘000) Per cent N
(‘000) Per cent
2009 2014 Changes
15–24yrs 591 23,5 521 20,8 ‐69,7 ‐2,7
25–34yrs 1 926 76,5 1 990 79,2 64,7 2,7
15–34yrs 2 517 100,0 2 512 100,0 ‐5,0
Both sexes
N
(‘000) Per cent N
(‘000) Per cent N
(‘000) Per cent
2009 2014 Changes
15–24yrs 1 427 23,6 1 263 21,0 ‐164 ‐2,6
25–34yrs 4 625 76,4 4 758 79,0 133 2,6
15–34yrs 6 052 100,0 6 021 100,0 ‐31
Source: QLFS 2009–2014
In 2014, a little more than 6 million young people aged 15–34 years were employed, 31 000 fewer than figures recorded 5 years previously (2009). The observed decline was slightly larger for females than for males.

Statistics South Africa
Vulnerable Groups Series I: The Social Profile of the Youth, 2009‐2014
Report 03‐19‐01
29
Figure 5.2: Share of youth amongst the employed, 2009 and 2014
Source: QLFS 2009–2014
Between 2009 and 2014, the share of the youth (15–34 years) amongst the employed declined by 2,8
percentage points (i.e. from 42,6% to 39,8%). Figure 5.2 shows that the drop was slightly higher amongst
those aged 15–24 years (down by 1,8 percentage points) than for those between those aged 25–34 years (a
drop of 1,2 percentage points).
Table 5.2: Youth (15–34 years) employment by status in employment, 2009 and 2014
Type of employment
2009 2014
N (‘000) Per cent N (‘000) Per cent
Working for someone (employee) 5 367 88,7 5 430 90,2
Employer* 181 3,0 177 2,9
Own‐account worker* 428 7,1 366 6,1
Helping without pay in a household business 77 1,3 48 0,8
Total 6 052 100,0 6 021 100,0
Youth (15‐34yrs) entrepreneurs* 609 10,1 543 9,0
Source: QLFS 2009–2014
In 2014, about 2 million employed persons in the country were classified as entrepreneurs, 543 000 of
which were youth between the ages of 15–34 years (Table 5.2). Entrepreneurs in this report are defined as
employers or the self‐employed. Figure 5.3 below reveals that the total share of young entrepreneurs
declined by 2,6 percentage points between 2009 and 2014. A noticeable decline was observed amongst
young females (down by 6,2 percentage points) as opposed to their male counterparts who recorded a
drop of less than a percentage point (0,9).
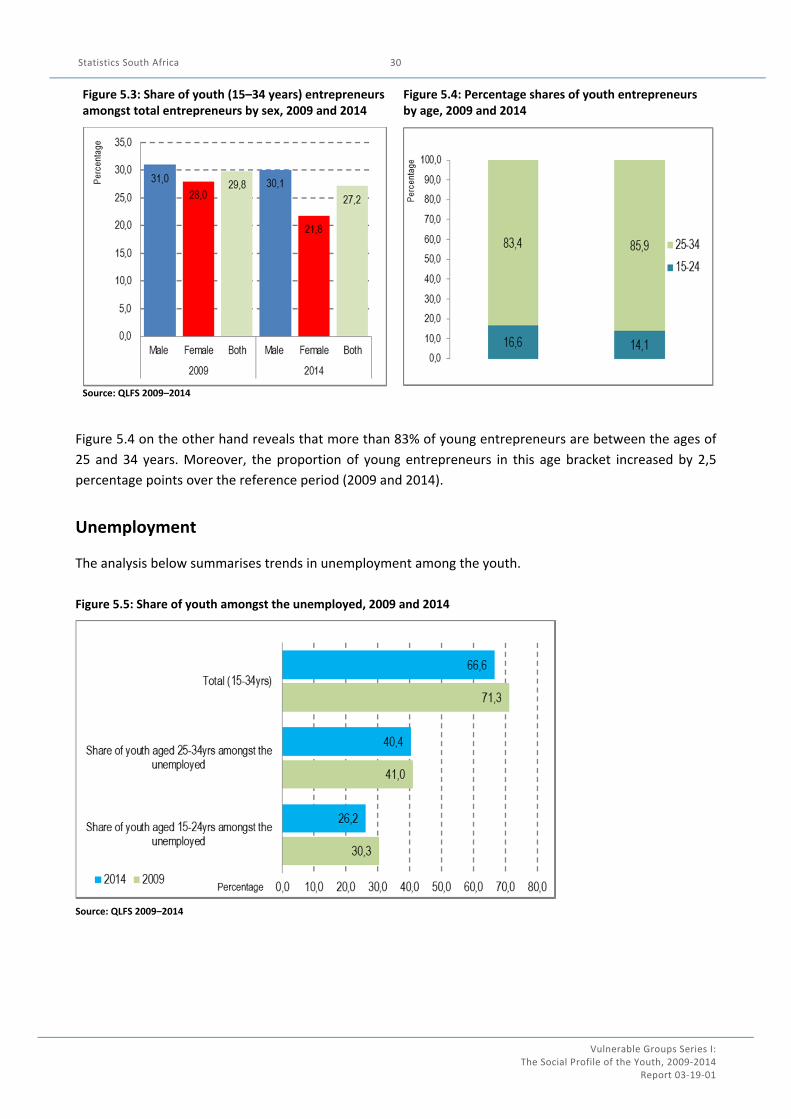
Statistics South Africa
Vulnerable Groups Series I: The Social Profile of the Youth, 2009‐2014
Report 03‐19‐01
30
Figure 5.3: Share of youth (15–34 years) entrepreneurs amongst total entrepreneurs by sex, 2009 and 2014
Figure 5.4: Percentage shares of youth entrepreneurs by age, 2009 and 2014
Source: QLFS 2009–2014
2009 2014
Figure 5.4 on the other hand reveals that more than 83% of young entrepreneurs are between the ages of
25 and 34 years. Moreover, the proportion of young entrepreneurs in this age bracket increased by 2,5
percentage points over the reference period (2009 and 2014).
Unemployment
The analysis below summarises trends in unemployment among the youth.
Figure 5.5: Share of youth amongst the unemployed, 2009 and 2014
Source: QLFS 2009–2014
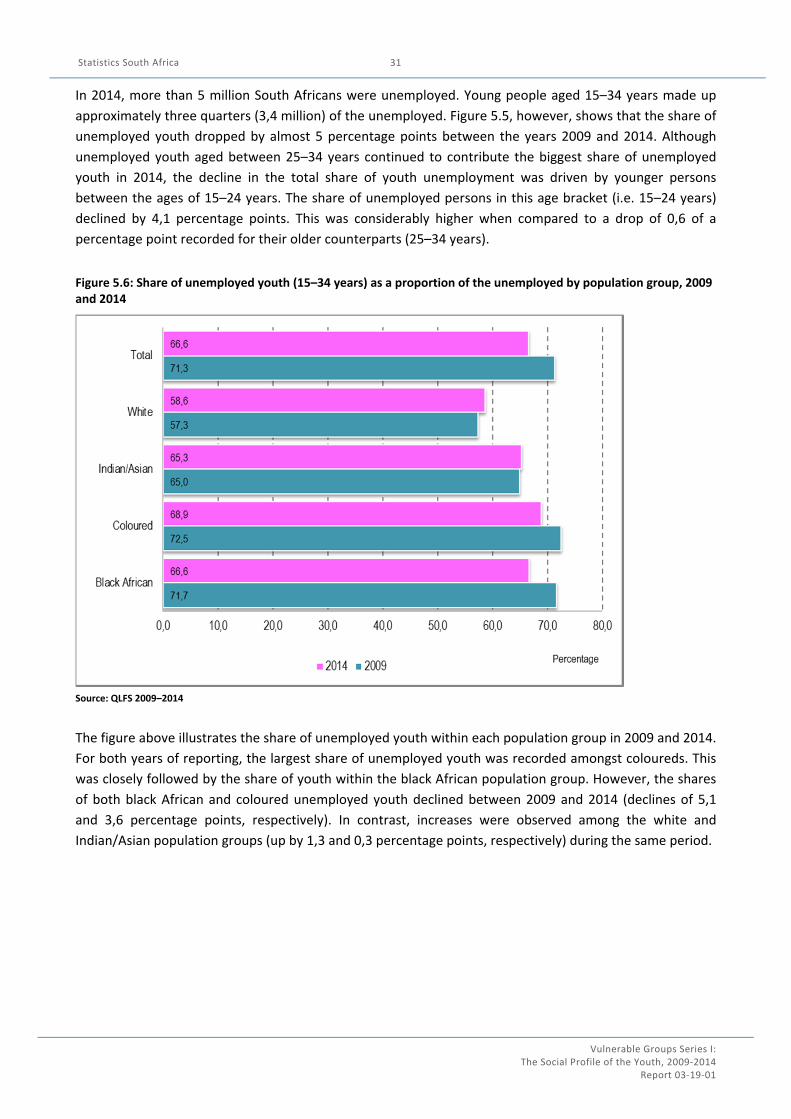
Statistics South Africa
Vulnerable Groups Series I: The Social Profile of the Youth, 2009‐2014
Report 03‐19‐01
31
In 2014, more than 5 million South Africans were unemployed. Young people aged 15–34 years made up
approximately three quarters (3,4 million) of the unemployed. Figure 5.5, however, shows that the share of
unemployed youth dropped by almost 5 percentage points between the years 2009 and 2014. Although
unemployed youth aged between 25–34 years continued to contribute the biggest share of unemployed
youth in 2014, the decline in the total share of youth unemployment was driven by younger persons
between the ages of 15–24 years. The share of unemployed persons in this age bracket (i.e. 15–24 years)
declined by 4,1 percentage points. This was considerably higher when compared to a drop of 0,6 of a
percentage point recorded for their older counterparts (25–34 years).
Figure 5.6: Share of unemployed youth (15–34 years) as a proportion of the unemployed by population group, 2009 and 2014
Source: QLFS 2009–2014
The figure above illustrates the share of unemployed youth within each population group in 2009 and 2014.
For both years of reporting, the largest share of unemployed youth was recorded amongst coloureds. This
was closely followed by the share of youth within the black African population group. However, the shares
of both black African and coloured unemployed youth declined between 2009 and 2014 (declines of 5,1
and 3,6 percentage points, respectively). In contrast, increases were observed among the white and
Indian/Asian population groups (up by 1,3 and 0,3 percentage points, respectively) during the same period.
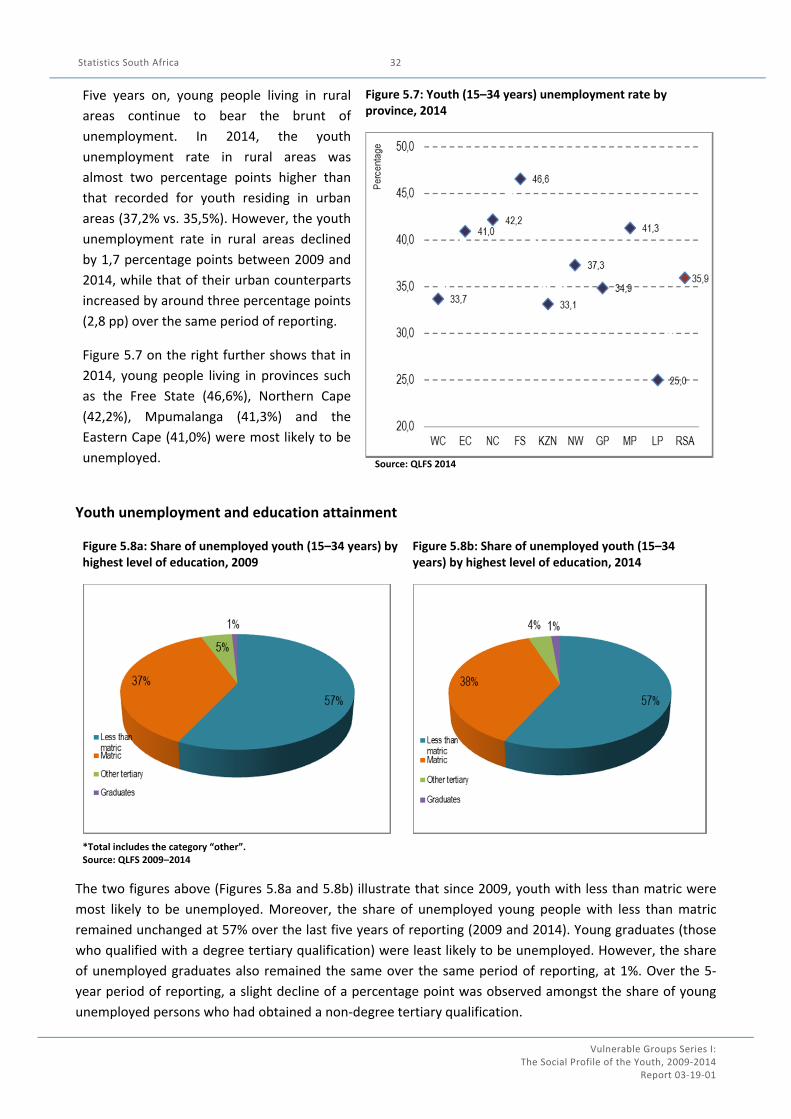
Statistics South Africa
Vulnerable Groups Series I: The Social Profile of the Youth, 2009‐2014
Report 03‐19‐01
32
Five years on, young people living in rural
areas continue to bear the brunt of
unemployment. In 2014, the youth
unemployment rate in rural areas was
almost two percentage points higher than
that recorded for youth residing in urban
areas (37,2% vs. 35,5%). However, the youth
unemployment rate in rural areas declined
by 1,7 percentage points between 2009 and
2014, while that of their urban counterparts
increased by around three percentage points
(2,8 pp) over the same period of reporting.
Figure 5.7 on the right further shows that in
2014, young people living in provinces such
as the Free State (46,6%), Northern Cape
(42,2%), Mpumalanga (41,3%) and the
Eastern Cape (41,0%) were most likely to be
unemployed.
Figure 5.7: Youth (15–34 years) unemployment rate byprovince, 2014
Source: QLFS 2014
Youth unemployment and education attainment
Figure 5.8a: Share of unemployed youth (15–34 years) by highest level of education, 2009
Figure 5.8b: Share of unemployed youth (15–34years) by highest level of education, 2014
*Total includes the category “other”. Source: QLFS 2009–2014
The two figures above (Figures 5.8a and 5.8b) illustrate that since 2009, youth with less than matric were
most likely to be unemployed. Moreover, the share of unemployed young people with less than matric
remained unchanged at 57% over the last five years of reporting (2009 and 2014). Young graduates (those
who qualified with a degree tertiary qualification) were least likely to be unemployed. However, the share
of unemployed graduates also remained the same over the same period of reporting, at 1%. Over the 5‐
year period of reporting, a slight decline of a percentage point was observed amongst the share of young
unemployed persons who had obtained a non‐degree tertiary qualification.
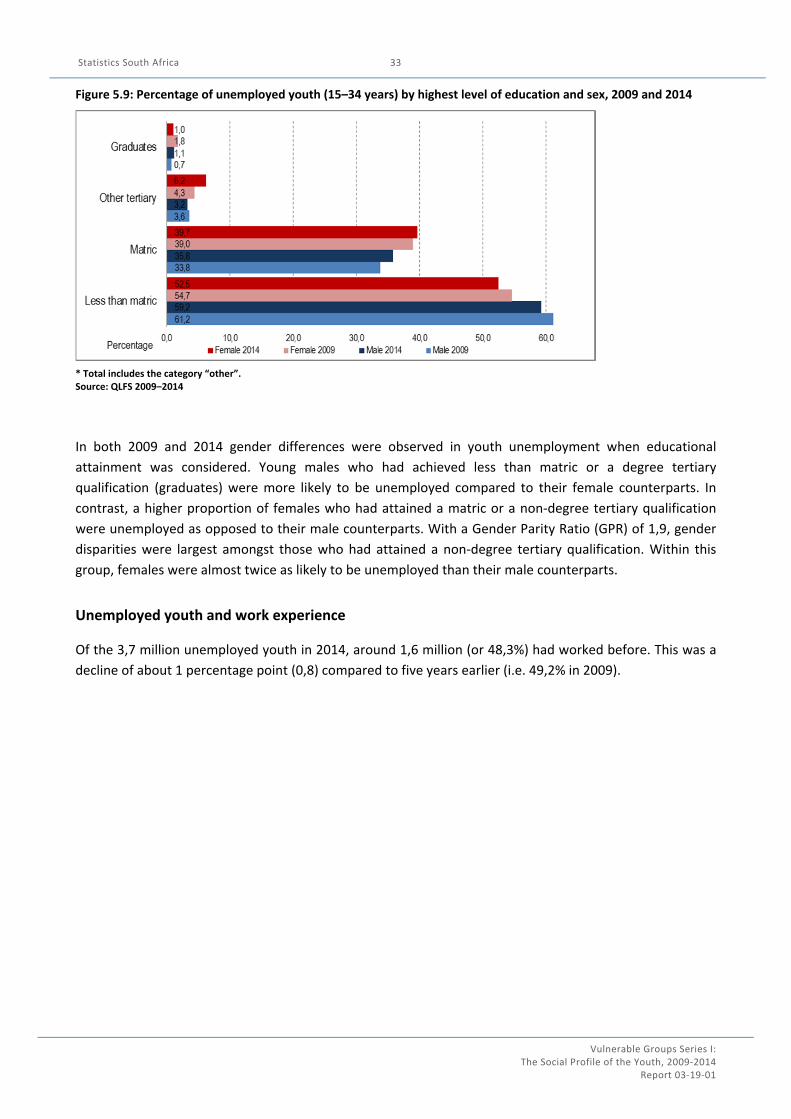
Statistics South Africa
Vulnerable Groups Series I: The Social Profile of the Youth, 2009‐2014
Report 03‐19‐01
33
Figure 5.9: Percentage of unemployed youth (15–34 years) by highest level of education and sex, 2009 and 2014
* Total includes the category “other”. Source: QLFS 2009–2014
In both 2009 and 2014 gender differences were observed in youth unemployment when educational
attainment was considered. Young males who had achieved less than matric or a degree tertiary
qualification (graduates) were more likely to be unemployed compared to their female counterparts. In
contrast, a higher proportion of females who had attained a matric or a non‐degree tertiary qualification
were unemployed as opposed to their male counterparts. With a Gender Parity Ratio (GPR) of 1,9, gender
disparities were largest amongst those who had attained a non‐degree tertiary qualification. Within this
group, females were almost twice as likely to be unemployed than their male counterparts.
Unemployed youth and work experience
Of the 3,7 million unemployed youth in 2014, around 1,6 million (or 48,3%) had worked before. This was a
decline of about 1 percentage point (0,8) compared to five years earlier (i.e. 49,2% in 2009).
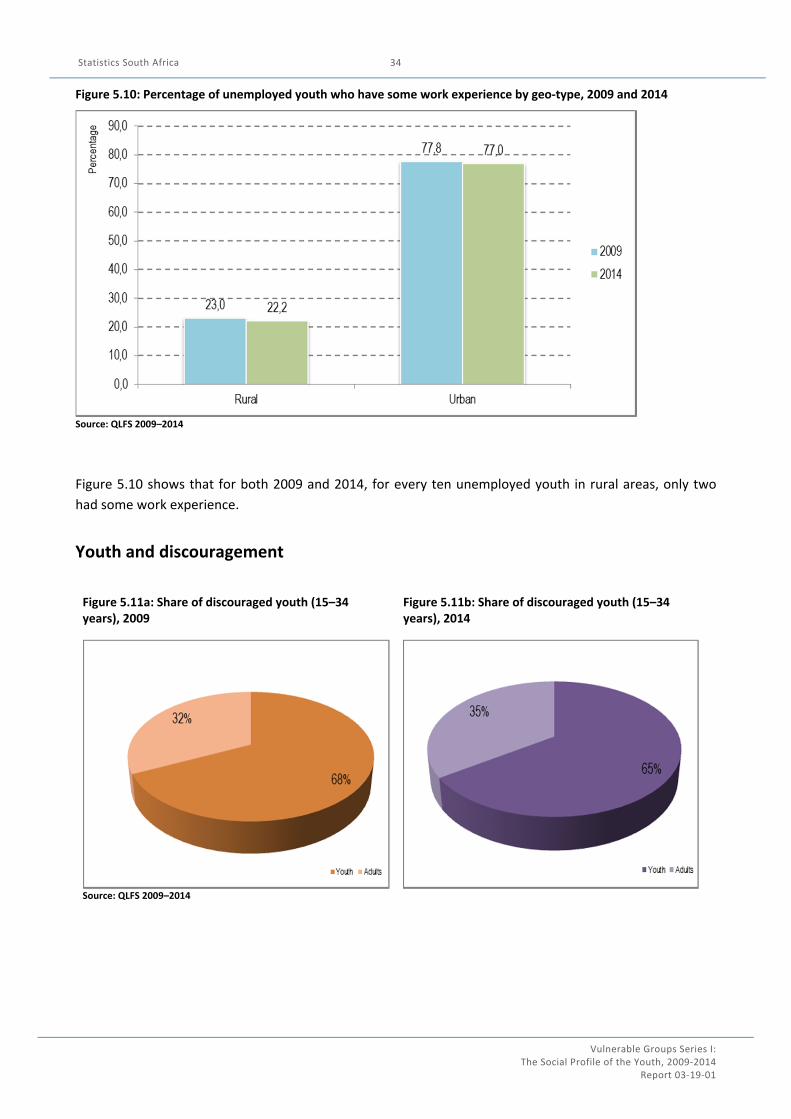
Statistics South Africa
Vulnerable Groups Series I: The Social Profile of the Youth, 2009‐2014
Report 03‐19‐01
34
Figure 5.10: Percentage of unemployed youth who have some work experience by geo‐type, 2009 and 2014
Source: QLFS 2009–2014
Figure 5.10 shows that for both 2009 and 2014, for every ten unemployed youth in rural areas, only two
had some work experience.
Youth and discouragement
Figure 5.11a: Share of discouraged youth (15–34years), 2009
Figure 5.11b: Share of discouraged youth (15–34years), 2014
Source: QLFS 2009–2014
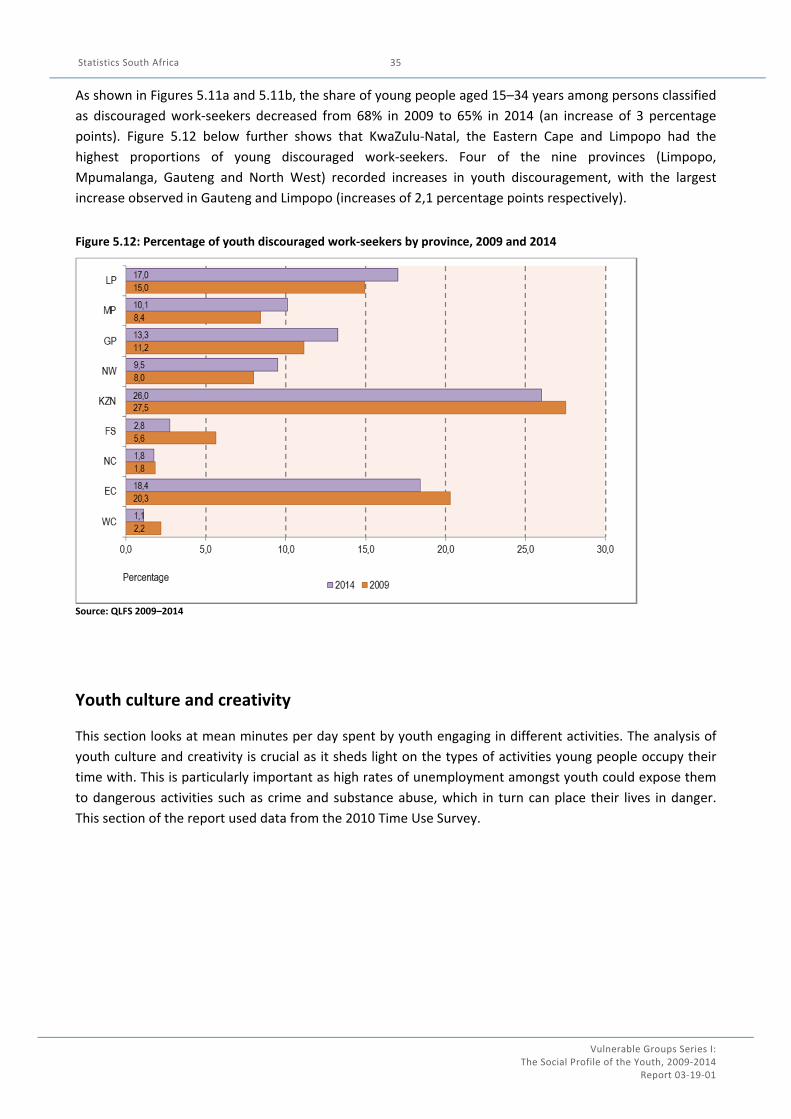
Statistics South Africa
Vulnerable Groups Series I: The Social Profile of the Youth, 2009‐2014
Report 03‐19‐01
35
As shown in Figures 5.11a and 5.11b, the share of young people aged 15–34 years among persons classified
as discouraged work‐seekers decreased from 68% in 2009 to 65% in 2014 (an increase of 3 percentage
points). Figure 5.12 below further shows that KwaZulu‐Natal, the Eastern Cape and Limpopo had the
highest proportions of young discouraged work‐seekers. Four of the nine provinces (Limpopo,
Mpumalanga, Gauteng and North West) recorded increases in youth discouragement, with the largest
increase observed in Gauteng and Limpopo (increases of 2,1 percentage points respectively).
Figure 5.12: Percentage of youth discouraged work‐seekers by province, 2009 and 2014
Source: QLFS 2009–2014
Youth culture and creativity
This section looks at mean minutes per day spent by youth engaging in different activities. The analysis of
youth culture and creativity is crucial as it sheds light on the types of activities young people occupy their
time with. This is particularly important as high rates of unemployment amongst youth could expose them
to dangerous activities such as crime and substance abuse, which in turn can place their lives in danger.
This section of the report used data from the 2010 Time Use Survey.

Statistics South Africa
Vulnerable Groups Series I: The Social Profile of the Youth, 2009‐2014
Report 03‐19‐01
36
Table 5.3: Mean minutes per day spent by youth in relation to adults on social and leisure activities by sex, 2010
Social and Leisure activities
Male Female Both sexes
15–34 yrs 35 yrs + 15–34 yrs 35 yrs + 15–34 yrs 35 yrs +
Mean minutes per day spent
Participating in cultural activities 112 155 116 140 114 146
Participating in religious activities 99 128 111 116 106 121
Socialising with both family & non‐family 152 142 130 134 141 138
Arts, music, hobbies 96 121 76 116 89 118
Indoor & outdoor sports participation 120 80 81 65 113 74
Games & other pastimes 132 92 106 94 124 93
Spectator to sports, exhibitions, concerts 145 130 108 94 134 116
Travel related to social & cultural 68 76 66 68 67 72
Waiting for social & cultural travel 41 61 36 34 38 41
Social, cultural, recreational n.e.c 139 98 54 124 93 111
Reading 64 71 69 74 66 72
Watching TV & video 173 163 163 151 168 157
Listening to music or radio 85 90 77 77 82 84
Accessing information by computer 125 85 69 82 103 84
Visiting library 59 33 25 32 39 32
Travel related to mass media use 39 58 36 29 38 45
Mass media use & entertainment 90 26 47 42 74 34
Average 102 95 81 87 93 90
Source: Time Use Survey 2010
Table 5.3 looks at social and leisure activities that youth engage in, by sex. In 2010, males aged 15 to 34
years were more likely to engage in social and leisure activities compared to females. On average, males
spent 21 minutes more than their female counterparts on social and leisure activities (102 mean minutes
per day for males compared to 81 for females). The table above also shows notably differences in the time
spent engaging in different activities by both males and females who are aged 15 to 34 years. For example,
considering the top three activities, males spent much of their time watching TV (173 minutes), socialising
(152 minutes), and spectator to sports, exhibitions, and concerts (145 minutes). However, even though
females had watching TV as the activity which they engaged in more, it is interesting to note that they still
spent 10 minutes less than their males counterparts (173 mean minutes per day for males compared to 163
for females). Females also spent their time engaging in cultural activities, such as weddings, funerals and
birthday celebrations.
Adults (males and females aged 35 years and older) showed no variation in terms of the top three activities
mentioned above. However, for adults, males spent 12 minutes more watching TV than their female
counterparts (163 mean minutes per day for males compared to 151 for females). Also, males spent 15
more minutes engaging in cultural activities than their female counterparts (155 mean minutes per day for
males compared to 140 for females). Both males and females ranked socialising with both family and non‐
family third. However, males spent 8 more minutes socialising than their female counterparts (142 mean
minutes per day for males compared to 134 for females). Notably, this analysis showed significant variation
in terms of time spent by different groups engaging in the activities presented in Table 5.3 above. Also, the
analysis showed that as people grow older the importance placed on certain activities change to reflect
their transition from youth to adulthood.
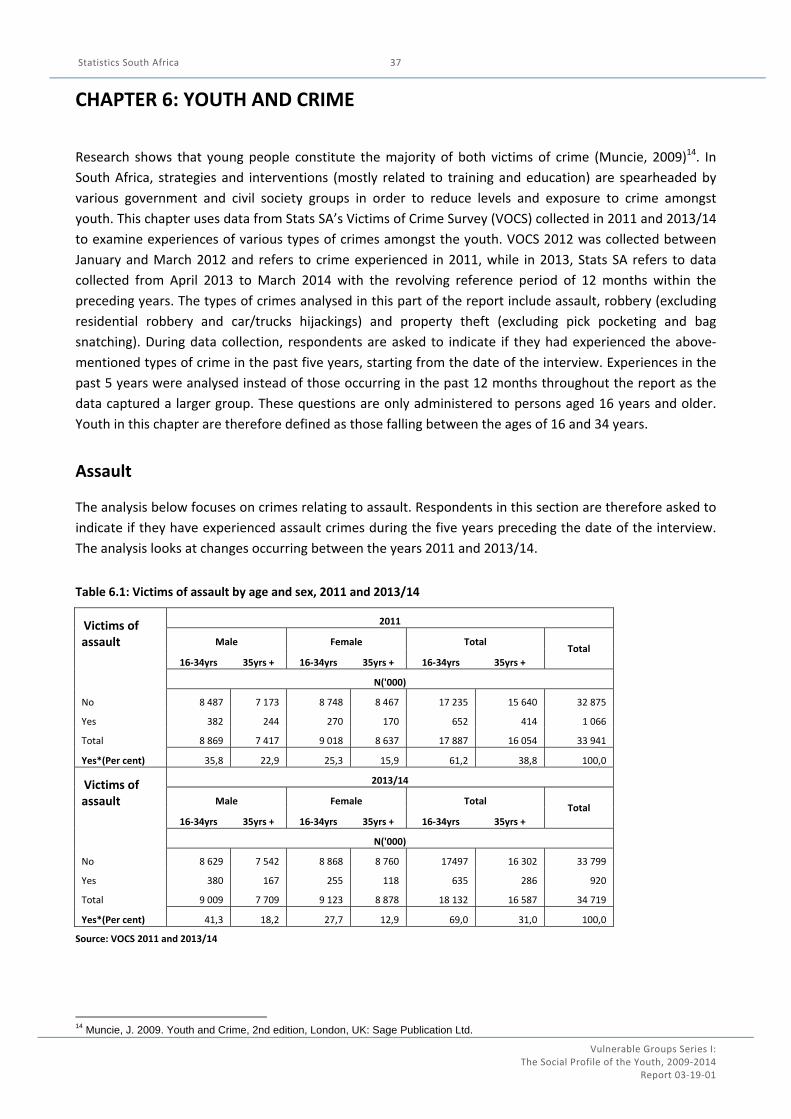
Statistics South Africa
Vulnerable Groups Series I: The Social Profile of the Youth, 2009‐2014
Report 03‐19‐01
37
CHAPTER 6: YOUTH AND CRIME
Research shows that young people constitute the majority of both victims of crime (Muncie, 2009)14. In
South Africa, strategies and interventions (mostly related to training and education) are spearheaded by
various government and civil society groups in order to reduce levels and exposure to crime amongst
youth. This chapter uses data from Stats SA’s Victims of Crime Survey (VOCS) collected in 2011 and 2013/14
to examine experiences of various types of crimes amongst the youth. VOCS 2012 was collected between
January and March 2012 and refers to crime experienced in 2011, while in 2013, Stats SA refers to data
collected from April 2013 to March 2014 with the revolving reference period of 12 months within the
preceding years. The types of crimes analysed in this part of the report include assault, robbery (excluding
residential robbery and car/trucks hijackings) and property theft (excluding pick pocketing and bag
snatching). During data collection, respondents are asked to indicate if they had experienced the above‐
mentioned types of crime in the past five years, starting from the date of the interview. Experiences in the
past 5 years were analysed instead of those occurring in the past 12 months throughout the report as the
data captured a larger group. These questions are only administered to persons aged 16 years and older.
Youth in this chapter are therefore defined as those falling between the ages of 16 and 34 years.
Assault
The analysis below focuses on crimes relating to assault. Respondents in this section are therefore asked to
indicate if they have experienced assault crimes during the five years preceding the date of the interview.
The analysis looks at changes occurring between the years 2011 and 2013/14.
Table 6.1: Victims of assault by age and sex, 2011 and 2013/14
Victims of assault
2011
Male Female Total Total
16‐34yrs 35yrs + 16‐34yrs 35yrs + 16‐34yrs 35yrs +
N('000)
No 8 487 7 173 8 748 8 467 17 235 15 640 32 875
Yes 382 244 270 170 652 414 1 066
Total 8 869 7 417 9 018 8 637 17 887 16 054 33 941
Yes*(Per cent) 35,8 22,9 25,3 15,9 61,2 38,8 100,0
Victims of assault
2013/14
Male Female Total Total
16‐34yrs 35yrs + 16‐34yrs 35yrs + 16‐34yrs 35yrs +
N('000)
No 8 629 7 542 8 868 8 760 17497 16 302 33 799
Yes 380 167 255 118 635 286 920
Total 9 009 7 709 9 123 8 878 18 132 16 587 34 719
Yes*(Per cent) 41,3 18,2 27,7 12,9 69,0 31,0 100,0
Source: VOCS 2011 and 2013/14
14 Muncie, J. 2009. Youth and Crime, 2nd edition, London, UK: Sage Publication Ltd.
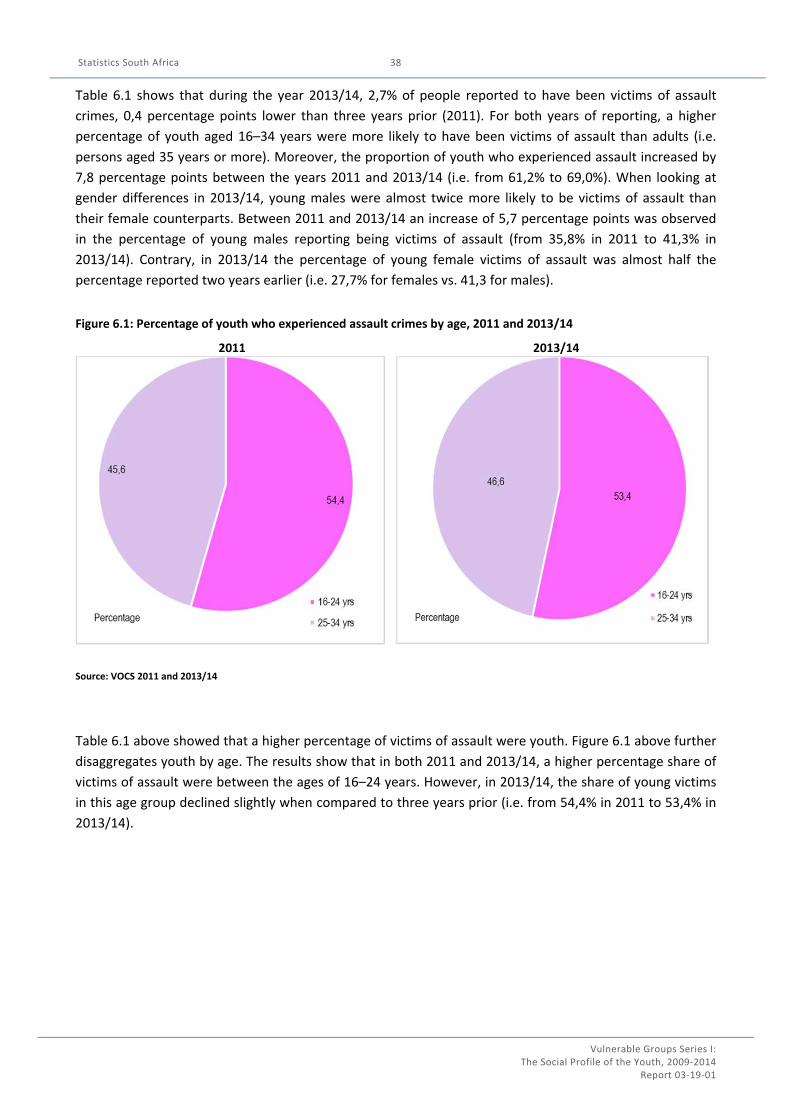
Statistics South Africa
Vulnerable Groups Series I: The Social Profile of the Youth, 2009‐2014
Report 03‐19‐01
38
Table 6.1 shows that during the year 2013/14, 2,7% of people reported to have been victims of assault
crimes, 0,4 percentage points lower than three years prior (2011). For both years of reporting, a higher
percentage of youth aged 16–34 years were more likely to have been victims of assault than adults (i.e.
persons aged 35 years or more). Moreover, the proportion of youth who experienced assault increased by
7,8 percentage points between the years 2011 and 2013/14 (i.e. from 61,2% to 69,0%). When looking at
gender differences in 2013/14, young males were almost twice more likely to be victims of assault than
their female counterparts. Between 2011 and 2013/14 an increase of 5,7 percentage points was observed
in the percentage of young males reporting being victims of assault (from 35,8% in 2011 to 41,3% in
2013/14). Contrary, in 2013/14 the percentage of young female victims of assault was almost half the
percentage reported two years earlier (i.e. 27,7% for females vs. 41,3 for males).
Figure 6.1: Percentage of youth who experienced assault crimes by age, 2011 and 2013/14
2011 2013/14
Source: VOCS 2011 and 2013/14
Table 6.1 above showed that a higher percentage of victims of assault were youth. Figure 6.1 above further
disaggregates youth by age. The results show that in both 2011 and 2013/14, a higher percentage share of
victims of assault were between the ages of 16–24 years. However, in 2013/14, the share of young victims
in this age group declined slightly when compared to three years prior (i.e. from 54,4% in 2011 to 53,4% in
2013/14).
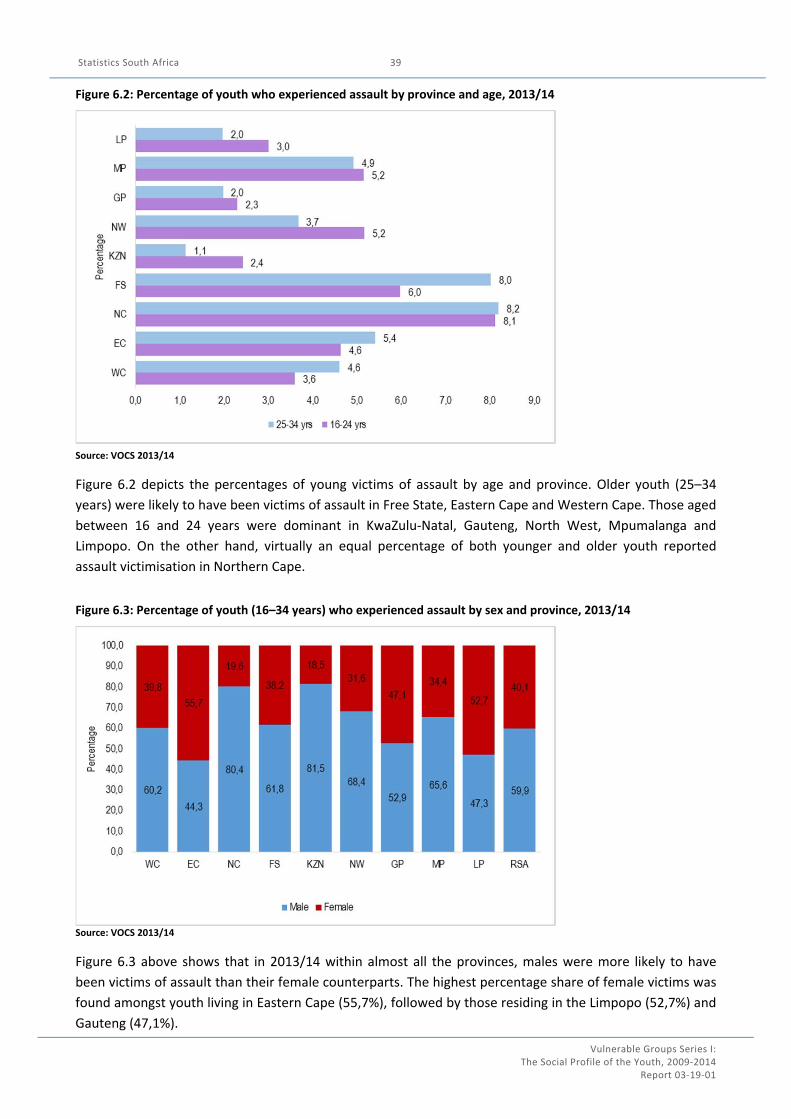
Statistics South Africa
Vulnerable Groups Series I: The Social Profile of the Youth, 2009‐2014
Report 03‐19‐01
39
Figure 6.2: Percentage of youth who experienced assault by province and age, 2013/14
Source: VOCS 2013/14
Figure 6.2 depicts the percentages of young victims of assault by age and province. Older youth (25–34
years) were likely to have been victims of assault in Free State, Eastern Cape and Western Cape. Those aged
between 16 and 24 years were dominant in KwaZulu‐Natal, Gauteng, North West, Mpumalanga and
Limpopo. On the other hand, virtually an equal percentage of both younger and older youth reported
assault victimisation in Northern Cape.
Figure 6.3: Percentage of youth (16–34 years) who experienced assault by sex and province, 2013/14
Source: VOCS 2013/14
Figure 6.3 above shows that in 2013/14 within almost all the provinces, males were more likely to have
been victims of assault than their female counterparts. The highest percentage share of female victims was
found amongst youth living in Eastern Cape (55,7%), followed by those residing in the Limpopo (52,7%) and
Gauteng (47,1%).

Statistics South Africa
Vulnerable Groups Series I: The Social Profile of the Youth, 2009‐2014
Report 03‐19‐01
40
Figure 6.4a: Percentage of victims of assault by province16 years and above, 2013/14
Figure 6.4b: Percentage of victims of assault (16 years and above) by age, 2013/14
Source: VOCS 2013/14
Figure 6.4a shows that in 2013/14, the highest percentage of people classified as victims of assault was
found in Northern Cape (11,9%), Free State (8,8%), and Eastern Cape (7,8%). On the other hand, Figure 6.4b
reveals that youth (16–34 years) make up almost 69% of all assault victims for persons aged 16 years and
above.
Figure 6.4c further disaggregates data by
province and age. In 2013/14, young
people (16–34 years) living in all nine
provinces constituted a higher
percentage of victims of assault. Youth
residing in provinces such as Northern
Cape, Free State, North West and
Mpumalanga were particularly over‐
represented amongst persons reporting
assault crimes when compared to their
adult counterparts.
Figure 6.4c: Percentage of victims of assault by age and province, 2013/14
Source: VOCS 2013/14

Statistics South Africa
Vulnerable Groups Series I: The Social Profile of the Youth, 2009‐2014
Report 03‐19‐01
41
Figure 6.5: Percentage changes in victims of assault between 2011
and 2013/14 by province: Youth (16–34 years)
The percentage young people aged 16–
34 years who experienced assault was
3,6 in 2011 and 3,5% in 2013/14. Figure
6.5 shows that the decline was driven by
notable decreases in North West,
Limpopo and the Western Cape. In
contrast, the percentage of youth victims
of assault increased the most for those
living in Free State and the Eastern Cape
over the same period of reporting.
Source: VOCS 2011 and 2013/14
Robbery
This section examines data relating to victims of robbery between the periods 2011 and 2013/14.
Table 6.2: Victims of robbery by age and sex, 2011 and 2013/14
Victims of robbery
2011
Male Female Total Total
16‐34yrs 35yrs+ 16‐34yrs 35yrs+ 16‐34yrs 35yrs+
N('000)
No 8 604 7 202 8 897 8 526 17 501 15 728 33 229
Yes 283 208 142 125 424 332 756
Total 8 887 7 410 9 038 8 651 17 925 16 061 33 986
Yes*(Per cent) 37,4 27,5 18,8 16,5 56,1 43,9 100,0
Victims of robbery
2013/14
Male Female Total Total
16‐34yrs 35yrs+ 16‐34yrs 35yrs+ 16‐34yrs 35yrs+
N('000)
No 8 758 7 551 8 952 8 740 17 710 16 292 34 002
Yes 256 159 180 116 436 276 711
Total 9 014 7 711 9 132 8 857 18 146 16 567 34 713
Yes*(Per cent) 35,9 22,4 25,3 16,4 61,2 38,8 100,0
Source: VOCS 2011 and 2013/14
Table 6.2 shows that between 2011 and 2013/14, the percentage of people who were victims of robbery
remained virtually unchanged (from 2,2 % in 2011 to 2,0 in 2013/14) per cent. In 2013/14, the percentage
of young victims of robbery was almost double that of their adult counterparts. This resulted in the
widening of the difference between young and adult victims, which increased from 12,2 percentage points
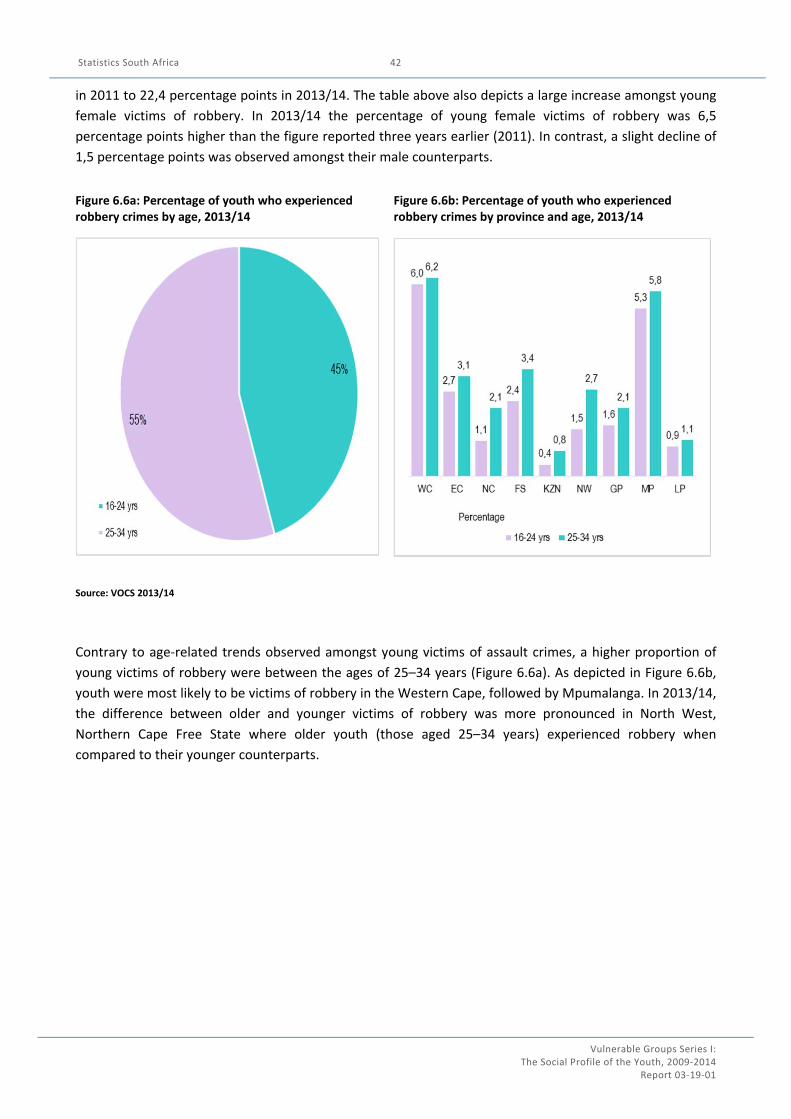
Statistics South Africa
Vulnerable Groups Series I: The Social Profile of the Youth, 2009‐2014
Report 03‐19‐01
42
in 2011 to 22,4 percentage points in 2013/14. The table above also depicts a large increase amongst young
female victims of robbery. In 2013/14 the percentage of young female victims of robbery was 6,5
percentage points higher than the figure reported three years earlier (2011). In contrast, a slight decline of
1,5 percentage points was observed amongst their male counterparts.
Figure 6.6a: Percentage of youth who experienced robbery crimes by age, 2013/14
Figure 6.6b: Percentage of youth who experienced robbery crimes by province and age, 2013/14
Source: VOCS 2013/14
Contrary to age‐related trends observed amongst young victims of assault crimes, a higher proportion of
young victims of robbery were between the ages of 25–34 years (Figure 6.6a). As depicted in Figure 6.6b,
youth were most likely to be victims of robbery in the Western Cape, followed by Mpumalanga. In 2013/14,
the difference between older and younger victims of robbery was more pronounced in North West,
Northern Cape Free State where older youth (those aged 25–34 years) experienced robbery when
compared to their younger counterparts.
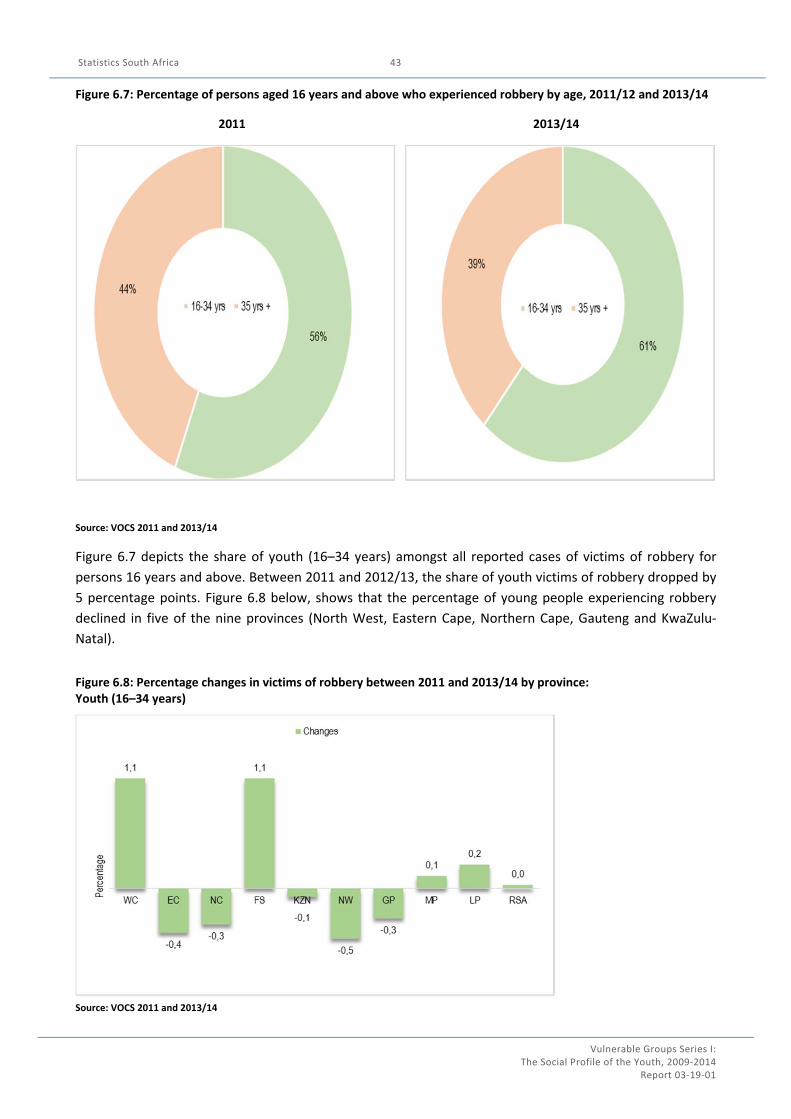
Statistics South Africa
Vulnerable Groups Series I: The Social Profile of the Youth, 2009‐2014
Report 03‐19‐01
43
Figure 6.7: Percentage of persons aged 16 years and above who experienced robbery by age, 2011/12 and 2013/14
2011 2013/14
Source: VOCS 2011 and 2013/14
Figure 6.7 depicts the share of youth (16–34 years) amongst all reported cases of victims of robbery for
persons 16 years and above. Between 2011 and 2012/13, the share of youth victims of robbery dropped by
5 percentage points. Figure 6.8 below, shows that the percentage of young people experiencing robbery
declined in five of the nine provinces (North West, Eastern Cape, Northern Cape, Gauteng and KwaZulu‐
Natal).
Figure 6.8: Percentage changes in victims of robbery between 2011 and 2013/14 by province: Youth (16–34 years)
Source: VOCS 2011 and 2013/14

Statistics South Africa
Vulnerable Groups Series I: The Social Profile of the Youth, 2009‐2014
Report 03‐19‐01
44
Property theft
The analysis below focuses on crimes relating to property theft. Similar to crimes discussed above,
respondents in this section were asked to indicate if they had experienced property theft during the past
five years from the date of the interview. Unlike the two previously discussed crimes (assault and robbery),
the analysis in this section denotes changes between the years 2012 and 2013/14. This is due to the fact
that questions and definitions on property theft in VOCS were only consolidated during the 2012/13 data
collection.
Table 6.3: Victims of property theft by age and sex, 2012 and 2013/14
Victims of property theft
2012
Male Female Total Total
16‐34yrs 35yrs+ 16‐34yrs 35yrs+ 16‐34yrs 35yrs+
N('000)
No 8 226 6 985 8 349 8 240 16 576 15 224 31 800
Yes 664 440 709 420 1 373 861 2 234
Total 8 890 7 425 9 058 8 660 17 948 16 085 34 033
Yes*(Per cent) 29,7 19,7 31,7 18,8 61,5 38,5 100,0
Victims of property theft
2013/14
Male Female Total Total
16‐34yrs 35yrs+ 16‐34yrs 35yrs+ 16‐34yrs 35yrs+
N('000)
No 8 477 7 377 8 593 8 477 17 070 15 854 32 924
Yes 629 378 621 480 1 250 858 2 108
Total 9 106 7 755 9 214 8 957 18 320 16 712 35 032
Yes*(Per cent) 29,9 17,9 29,4 22,8 59,3 40,7 100,0
Source: VOCS 2012 and 2013/14
The year 2013/14 saw a slight decline in the percentage of victims of property theft. In 2011, 6,6% of South
Africans aged 16 years and above were victims of property theft. This figure, however, dropped by 0,6 of a
percentage point reaching 6,0% in 2013/14. Again, as observed in the analysis of assault and robbery,
young people between the ages of 16 and 34 years were more likely to report being victims of property
theft than adults. However, unlike reports on assault and robbery where the proportion of victims
increased over the three year period of reporting, a drop of 2,2 percentage points was observed amongst
young victims of property theft (when 2012 and 2013/14 were compared). Also, unlike trends observed in
assault and robbery in 2013/14, both young males and females were more likely to be victims of property
theft.
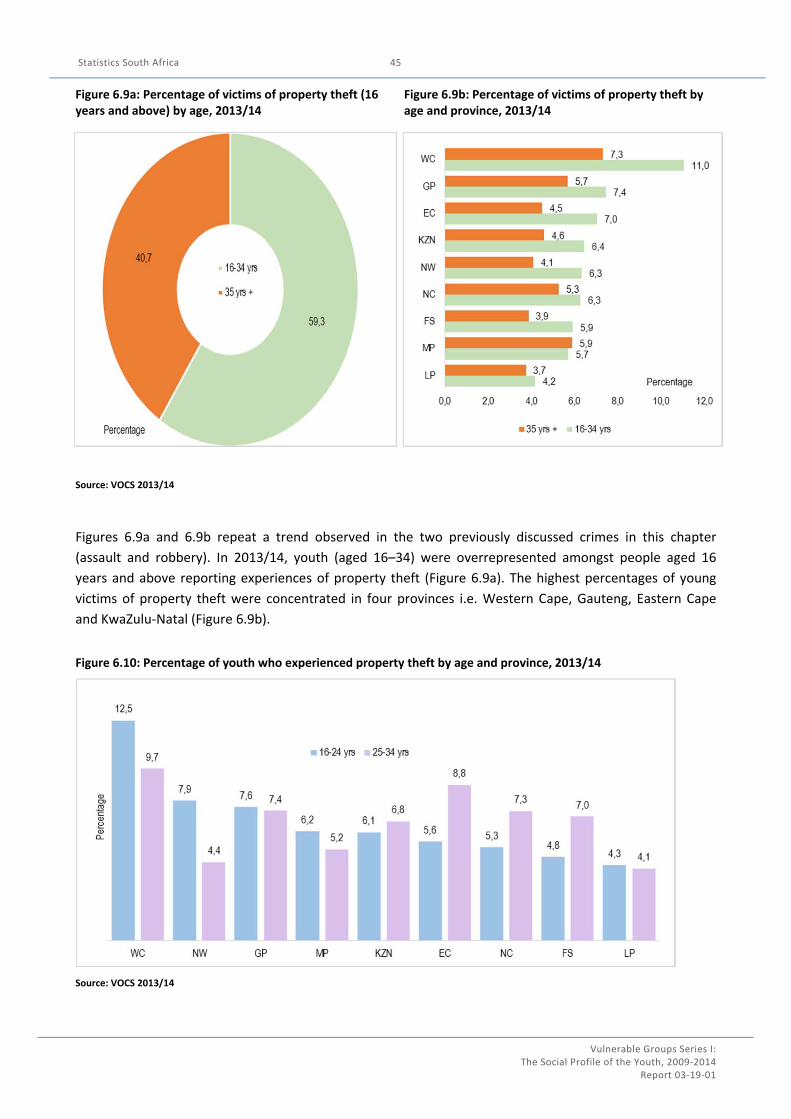
Statistics South Africa
Vulnerable Groups Series I: The Social Profile of the Youth, 2009‐2014
Report 03‐19‐01
45
Figure 6.9a: Percentage of victims of property theft (16 years and above) by age, 2013/14
Figure 6.9b: Percentage of victims of property theft by age and province, 2013/14
Source: VOCS 2013/14
Figures 6.9a and 6.9b repeat a trend observed in the two previously discussed crimes in this chapter
(assault and robbery). In 2013/14, youth (aged 16–34) were overrepresented amongst people aged 16
years and above reporting experiences of property theft (Figure 6.9a). The highest percentages of young
victims of property theft were concentrated in four provinces i.e. Western Cape, Gauteng, Eastern Cape
and KwaZulu‐Natal (Figure 6.9b).
Figure 6.10: Percentage of youth who experienced property theft by age and province, 2013/14
Source: VOCS 2013/14
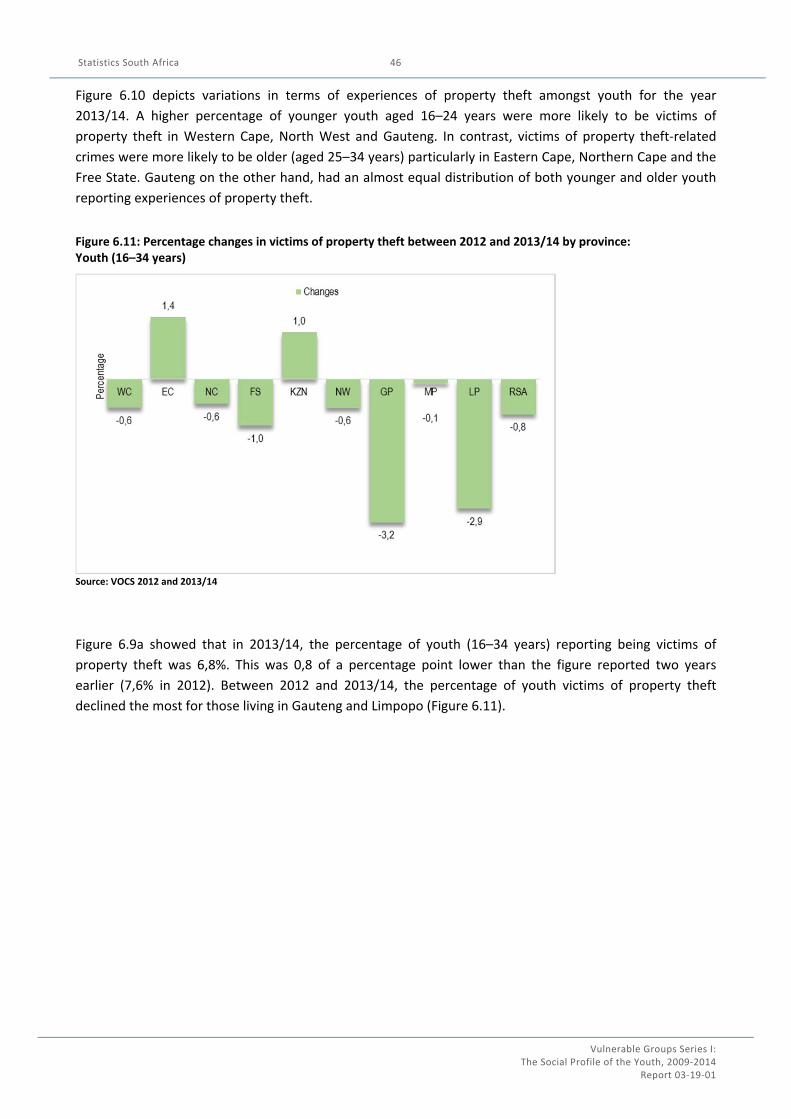
Statistics South Africa
Vulnerable Groups Series I: The Social Profile of the Youth, 2009‐2014
Report 03‐19‐01
46
Figure 6.10 depicts variations in terms of experiences of property theft amongst youth for the year
2013/14. A higher percentage of younger youth aged 16–24 years were more likely to be victims of
property theft in Western Cape, North West and Gauteng. In contrast, victims of property theft‐related
crimes were more likely to be older (aged 25–34 years) particularly in Eastern Cape, Northern Cape and the
Free State. Gauteng on the other hand, had an almost equal distribution of both younger and older youth
reporting experiences of property theft.
Figure 6.11: Percentage changes in victims of property theft between 2012 and 2013/14 by province: Youth (16–34 years)
Source: VOCS 2012 and 2013/14
Figure 6.9a showed that in 2013/14, the percentage of youth (16–34 years) reporting being victims of
property theft was 6,8%. This was 0,8 of a percentage point lower than the figure reported two years
earlier (7,6% in 2012). Between 2012 and 2013/14, the percentage of youth victims of property theft
declined the most for those living in Gauteng and Limpopo (Figure 6.11).
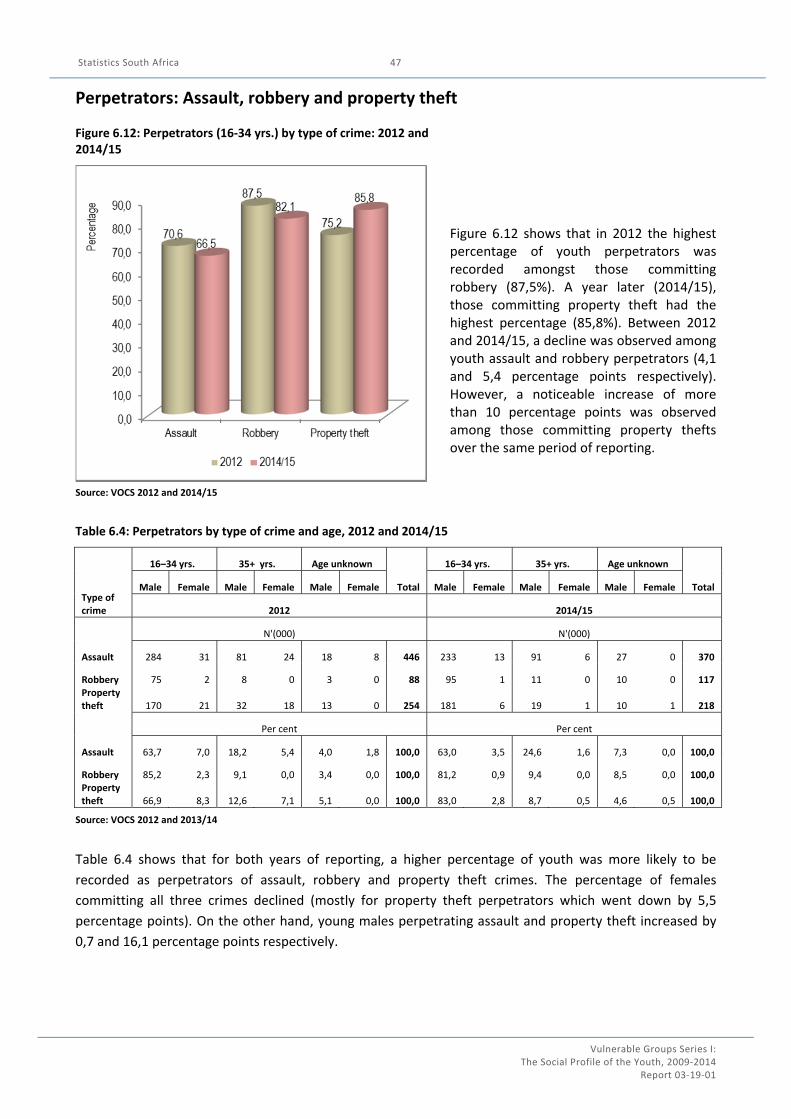
Statistics South Africa
Vulnerable Groups Series I: The Social Profile of the Youth, 2009‐2014
Report 03‐19‐01
47
Perpetrators: Assault, robbery and property theft
Figure 6.12: Perpetrators (16‐34 yrs.) by type of crime: 2012 and 2014/15
Figure 6.12 shows that in 2012 the highest percentage of youth perpetrators was recorded amongst those committing robbery (87,5%). A year later (2014/15), those committing property theft had the highest percentage (85,8%). Between 2012 and 2014/15, a decline was observed among youth assault and robbery perpetrators (4,1 and 5,4 percentage points respectively). However, a noticeable increase of more than 10 percentage points was observed among those committing property thefts over the same period of reporting.
Source: VOCS 2012 and 2014/15
Table 6.4: Perpetrators by type of crime and age, 2012 and 2014/15
Type of crime
16–34 yrs. 35+ yrs. Age unknown
Total
16–34 yrs. 35+ yrs. Age unknown
Total Male Female Male Female Male Female Male Female Male Female Male Female
2012 2014/15
N'(000) N'(000)
Assault 284 31 81 24 18 8 446 233 13 91 6 27 0 370
Robbery 75 2 8 0 3 0 88 95 1 11 0 10 0 117 Property theft 170 21 32 18 13 0 254 181 6 19 1 10 1 218
Per cent Per cent
Assault 63,7 7,0 18,2 5,4 4,0 1,8 100,0 63,0 3,5 24,6 1,6 7,3 0,0 100,0
Robbery 85,2 2,3 9,1 0,0 3,4 0,0 100,0 81,2 0,9 9,4 0,0 8,5 0,0 100,0 Property theft 66,9 8,3 12,6 7,1 5,1 0,0 100,0 83,0 2,8 8,7 0,5 4,6 0,5 100,0
Source: VOCS 2012 and 2013/14
Table 6.4 shows that for both years of reporting, a higher percentage of youth was more likely to be
recorded as perpetrators of assault, robbery and property theft crimes. The percentage of females
committing all three crimes declined (mostly for property theft perpetrators which went down by 5,5
percentage points). On the other hand, young males perpetrating assault and property theft increased by
0,7 and 16,1 percentage points respectively.
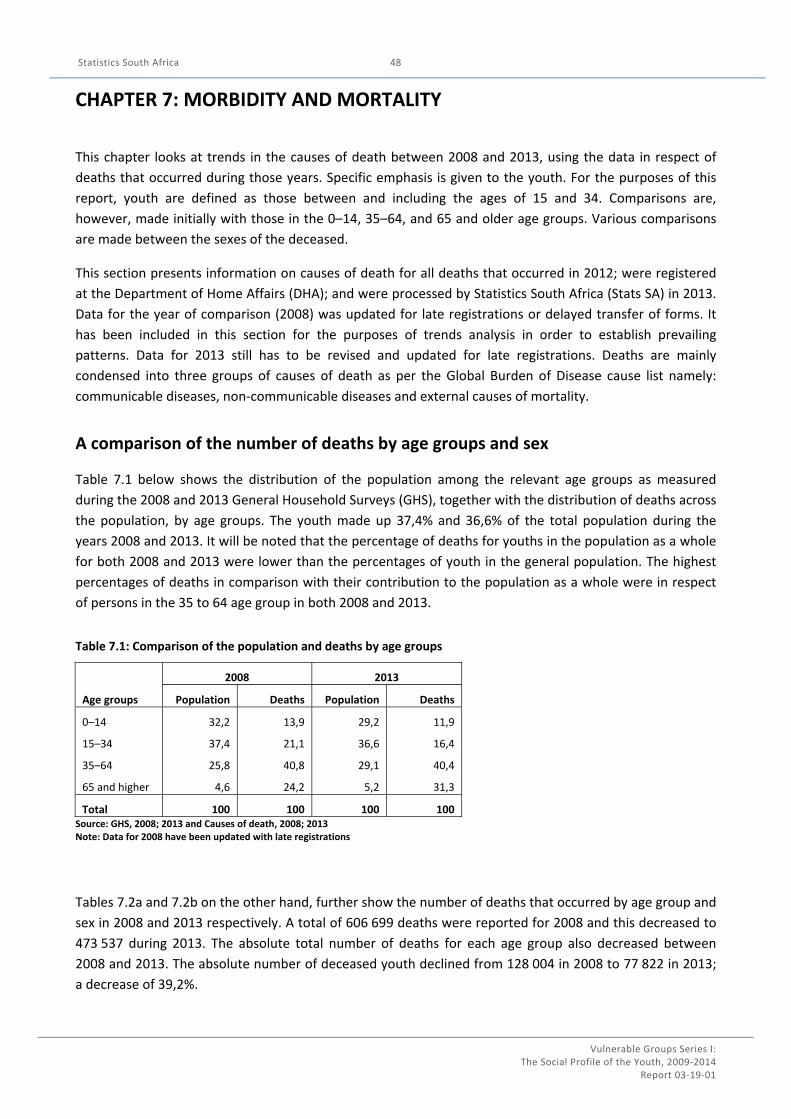
Statistics South Africa
Vulnerable Groups Series I: The Social Profile of the Youth, 2009‐2014
Report 03‐19‐01
48
CHAPTER 7: MORBIDITY AND MORTALITY
This chapter looks at trends in the causes of death between 2008 and 2013, using the data in respect of
deaths that occurred during those years. Specific emphasis is given to the youth. For the purposes of this
report, youth are defined as those between and including the ages of 15 and 34. Comparisons are,
however, made initially with those in the 0–14, 35–64, and 65 and older age groups. Various comparisons
are made between the sexes of the deceased.
This section presents information on causes of death for all deaths that occurred in 2012; were registered
at the Department of Home Affairs (DHA); and were processed by Statistics South Africa (Stats SA) in 2013.
Data for the year of comparison (2008) was updated for late registrations or delayed transfer of forms. It
has been included in this section for the purposes of trends analysis in order to establish prevailing
patterns. Data for 2013 still has to be revised and updated for late registrations. Deaths are mainly
condensed into three groups of causes of death as per the Global Burden of Disease cause list namely:
communicable diseases, non‐communicable diseases and external causes of mortality.
A comparison of the number of deaths by age groups and sex
Table 7.1 below shows the distribution of the population among the relevant age groups as measured
during the 2008 and 2013 General Household Surveys (GHS), together with the distribution of deaths across
the population, by age groups. The youth made up 37,4% and 36,6% of the total population during the
years 2008 and 2013. It will be noted that the percentage of deaths for youths in the population as a whole
for both 2008 and 2013 were lower than the percentages of youth in the general population. The highest
percentages of deaths in comparison with their contribution to the population as a whole were in respect
of persons in the 35 to 64 age group in both 2008 and 2013.
Table 7.1: Comparison of the population and deaths by age groups
Age groups
2008 2013
Population Deaths Population Deaths
0–14 32,2 13,9 29,2 11,9
15–34 37,4 21,1 36,6 16,4
35–64 25,8 40,8 29,1 40,4
65 and higher 4,6 24,2 5,2 31,3
Total 100 100 100 100 Source: GHS, 2008; 2013 and Causes of death, 2008; 2013 Note: Data for 2008 have been updated with late registrations
Tables 7.2a and 7.2b on the other hand, further show the number of deaths that occurred by age group and
sex in 2008 and 2013 respectively. A total of 606 699 deaths were reported for 2008 and this decreased to
473 537 during 2013. The absolute total number of deaths for each age group also decreased between
2008 and 2013. The absolute number of deceased youth declined from 128 004 in 2008 to 77 822 in 2013;
a decrease of 39,2%.
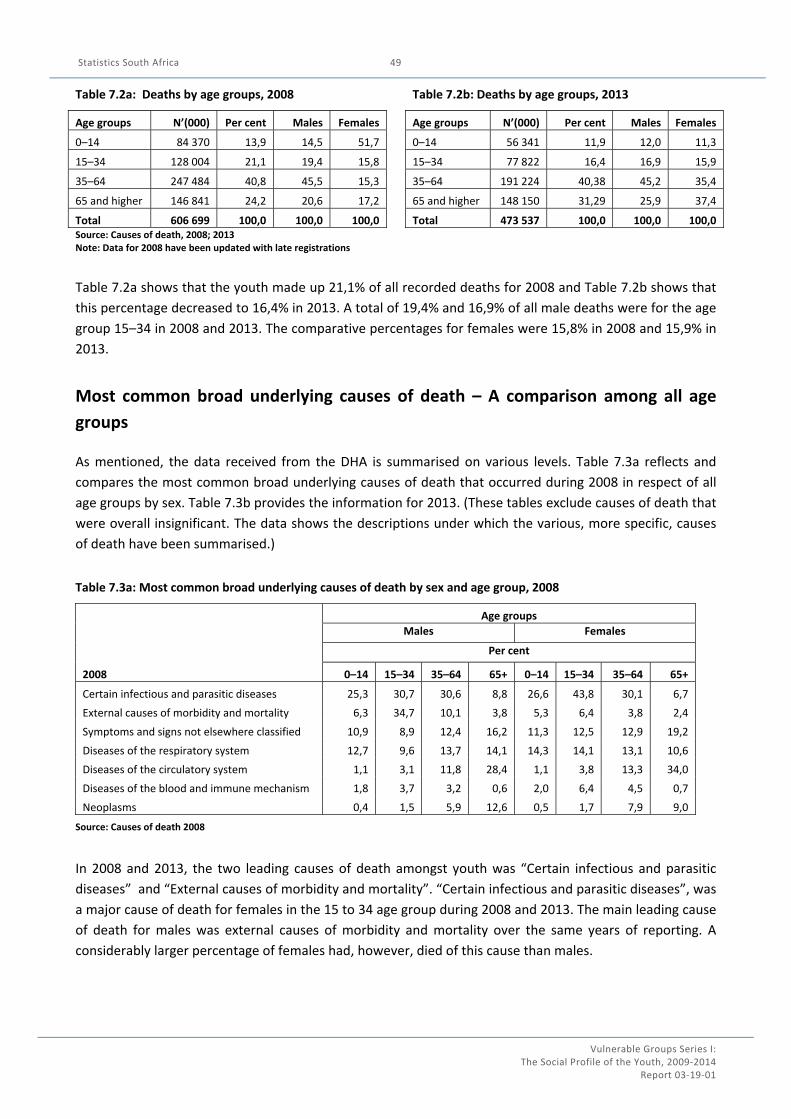
Statistics South Africa
Vulnerable Groups Series I: The Social Profile of the Youth, 2009‐2014
Report 03‐19‐01
49
Table 7.2a: Deaths by age groups, 2008 Table 7.2b: Deaths by age groups, 2013
Age groups N’(000) Per cent Males Females Age groups N’(000) Per cent Males Females
0–14 84 370 13,9 14,5 51,7 0–14 56 341 11,9 12,0 11,3
15–34 128 004 21,1 19,4 15,8 15–34 77 822 16,4 16,9 15,9
35–64 247 484 40,8 45,5 15,3 35–64 191 224 40,38 45,2 35,4
65 and higher 146 841 24,2 20,6 17,2 65 and higher 148 150 31,29 25,9 37,4
Total 606 699 100,0 100,0 100,0 Total 473 537 100,0 100,0 100,0 Source: Causes of death, 2008; 2013 Note: Data for 2008 have been updated with late registrations
Table 7.2a shows that the youth made up 21,1% of all recorded deaths for 2008 and Table 7.2b shows that
this percentage decreased to 16,4% in 2013. A total of 19,4% and 16,9% of all male deaths were for the age
group 15–34 in 2008 and 2013. The comparative percentages for females were 15,8% in 2008 and 15,9% in
2013.
Most common broad underlying causes of death – A comparison among all age
groups
As mentioned, the data received from the DHA is summarised on various levels. Table 7.3a reflects and
compares the most common broad underlying causes of death that occurred during 2008 in respect of all
age groups by sex. Table 7.3b provides the information for 2013. (These tables exclude causes of death that
were overall insignificant. The data shows the descriptions under which the various, more specific, causes
of death have been summarised.)
Table 7.3a: Most common broad underlying causes of death by sex and age group, 2008
2008
Age groups
Males Females
Per cent
0–14 15–34 35–64 65+ 0–14 15–34 35–64 65+
Certain infectious and parasitic diseases 25,3 30,7 30,6 8,8 26,6 43,8 30,1 6,7
External causes of morbidity and mortality 6,3 34,7 10,1 3,8 5,3 6,4 3,8 2,4
Symptoms and signs not elsewhere classified 10,9 8,9 12,4 16,2 11,3 12,5 12,9 19,2
Diseases of the respiratory system 12,7 9,6 13,7 14,1 14,3 14,1 13,1 10,6
Diseases of the circulatory system 1,1 3,1 11,8 28,4 1,1 3,8 13,3 34,0
Diseases of the blood and immune mechanism 1,8 3,7 3,2 0,6 2,0 6,4 4,5 0,7
Neoplasms 0,4 1,5 5,9 12,6 0,5 1,7 7,9 9,0
Source: Causes of death 2008
In 2008 and 2013, the two leading causes of death amongst youth was “Certain infectious and parasitic
diseases” and “External causes of morbidity and mortality”. “Certain infectious and parasitic diseases”, was
a major cause of death for females in the 15 to 34 age group during 2008 and 2013. The main leading cause
of death for males was external causes of morbidity and mortality over the same years of reporting. A
considerably larger percentage of females had, however, died of this cause than males.
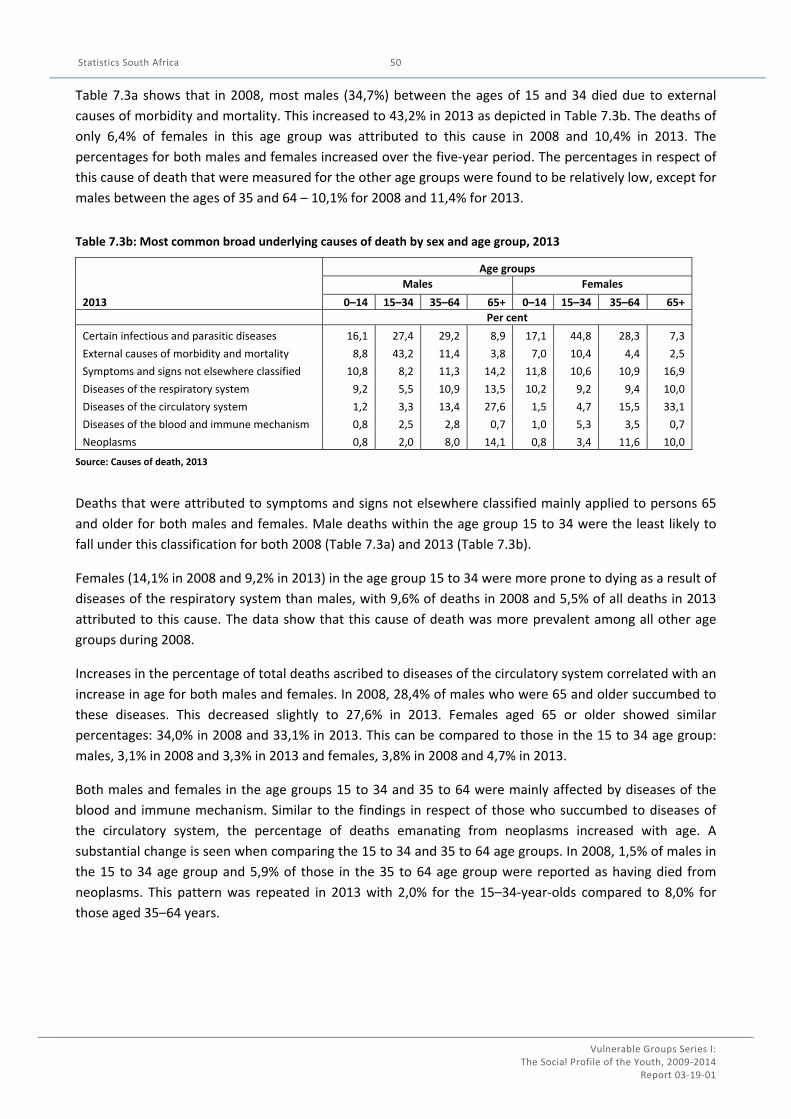
Statistics South Africa
Vulnerable Groups Series I: The Social Profile of the Youth, 2009‐2014
Report 03‐19‐01
50
Table 7.3a shows that in 2008, most males (34,7%) between the ages of 15 and 34 died due to external
causes of morbidity and mortality. This increased to 43,2% in 2013 as depicted in Table 7.3b. The deaths of
only 6,4% of females in this age group was attributed to this cause in 2008 and 10,4% in 2013. The
percentages for both males and females increased over the five‐year period. The percentages in respect of
this cause of death that were measured for the other age groups were found to be relatively low, except for
males between the ages of 35 and 64 – 10,1% for 2008 and 11,4% for 2013.
Table 7.3b: Most common broad underlying causes of death by sex and age group, 2013
2013
Age groups
Males Females
0–14 15–34 35–64 65+ 0–14 15–34 35–64 65+
Per cent
Certain infectious and parasitic diseases 16,1 27,4 29,2 8,9 17,1 44,8 28,3 7,3
External causes of morbidity and mortality 8,8 43,2 11,4 3,8 7,0 10,4 4,4 2,5
Symptoms and signs not elsewhere classified 10,8 8,2 11,3 14,2 11,8 10,6 10,9 16,9
Diseases of the respiratory system 9,2 5,5 10,9 13,5 10,2 9,2 9,4 10,0
Diseases of the circulatory system 1,2 3,3 13,4 27,6 1,5 4,7 15,5 33,1
Diseases of the blood and immune mechanism 0,8 2,5 2,8 0,7 1,0 5,3 3,5 0,7
Neoplasms 0,8 2,0 8,0 14,1 0,8 3,4 11,6 10,0
Source: Causes of death, 2013
Deaths that were attributed to symptoms and signs not elsewhere classified mainly applied to persons 65
and older for both males and females. Male deaths within the age group 15 to 34 were the least likely to
fall under this classification for both 2008 (Table 7.3a) and 2013 (Table 7.3b).
Females (14,1% in 2008 and 9,2% in 2013) in the age group 15 to 34 were more prone to dying as a result of
diseases of the respiratory system than males, with 9,6% of deaths in 2008 and 5,5% of all deaths in 2013
attributed to this cause. The data show that this cause of death was more prevalent among all other age
groups during 2008.
Increases in the percentage of total deaths ascribed to diseases of the circulatory system correlated with an
increase in age for both males and females. In 2008, 28,4% of males who were 65 and older succumbed to
these diseases. This decreased slightly to 27,6% in 2013. Females aged 65 or older showed similar
percentages: 34,0% in 2008 and 33,1% in 2013. This can be compared to those in the 15 to 34 age group:
males, 3,1% in 2008 and 3,3% in 2013 and females, 3,8% in 2008 and 4,7% in 2013.
Both males and females in the age groups 15 to 34 and 35 to 64 were mainly affected by diseases of the
blood and immune mechanism. Similar to the findings in respect of those who succumbed to diseases of
the circulatory system, the percentage of deaths emanating from neoplasms increased with age. A
substantial change is seen when comparing the 15 to 34 and 35 to 64 age groups. In 2008, 1,5% of males in
the 15 to 34 age group and 5,9% of those in the 35 to 64 age group were reported as having died from
neoplasms. This pattern was repeated in 2013 with 2,0% for the 15–34‐year‐olds compared to 8,0% for
those aged 35–64 years.
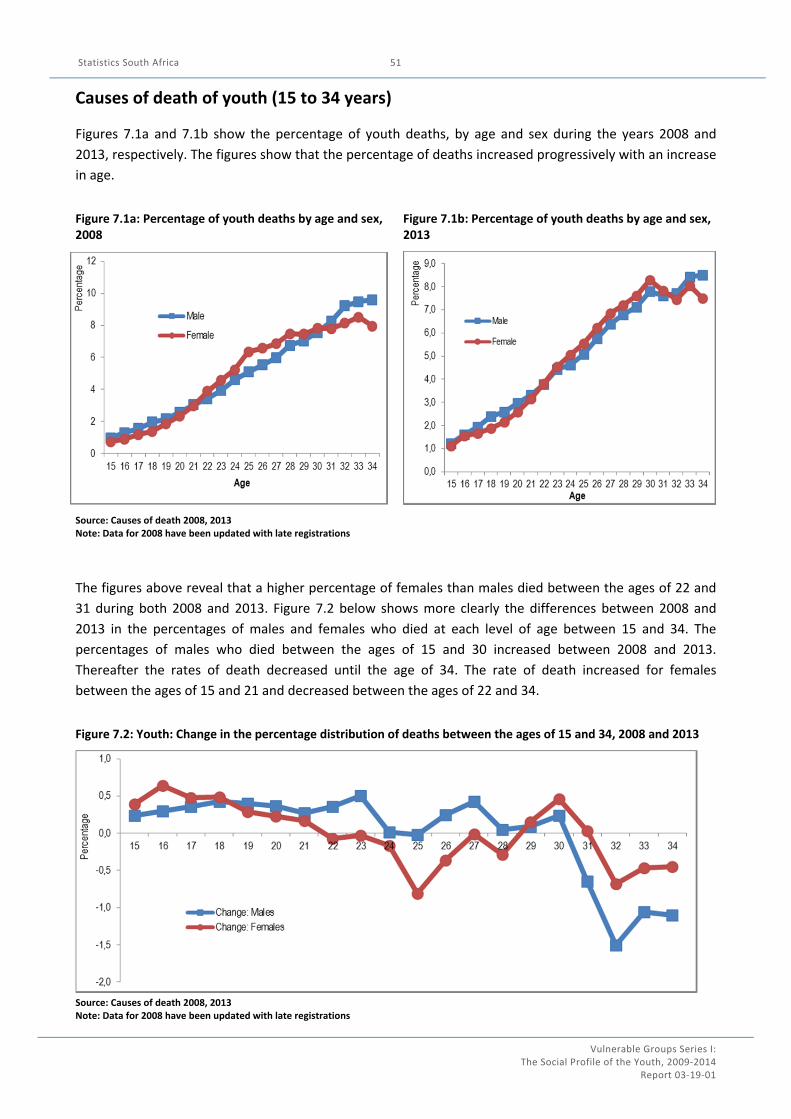
Statistics South Africa
Vulnerable Groups Series I: The Social Profile of the Youth, 2009‐2014
Report 03‐19‐01
51
Causes of death of youth (15 to 34 years)
Figures 7.1a and 7.1b show the percentage of youth deaths, by age and sex during the years 2008 and
2013, respectively. The figures show that the percentage of deaths increased progressively with an increase
in age.
Figure 7.1a: Percentage of youth deaths by age and sex, 2008
Figure 7.1b: Percentage of youth deaths by age and sex, 2013
Source: Causes of death 2008, 2013 Note: Data for 2008 have been updated with late registrations
The figures above reveal that a higher percentage of females than males died between the ages of 22 and
31 during both 2008 and 2013. Figure 7.2 below shows more clearly the differences between 2008 and
2013 in the percentages of males and females who died at each level of age between 15 and 34. The
percentages of males who died between the ages of 15 and 30 increased between 2008 and 2013.
Thereafter the rates of death decreased until the age of 34. The rate of death increased for females
between the ages of 15 and 21 and decreased between the ages of 22 and 34.
Figure 7.2: Youth: Change in the percentage distribution of deaths between the ages of 15 and 34, 2008 and 2013
Source: Causes of death 2008, 2013 Note: Data for 2008 have been updated with late registrations
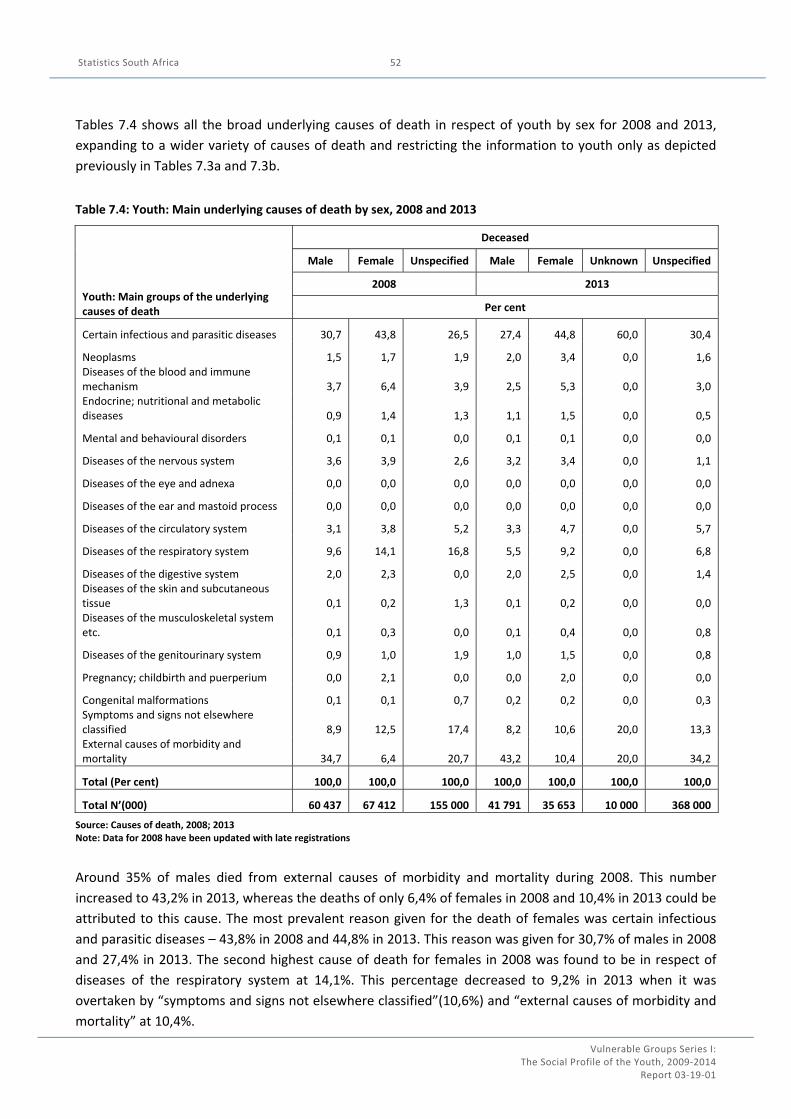
Statistics South Africa
Vulnerable Groups Series I: The Social Profile of the Youth, 2009‐2014
Report 03‐19‐01
52
Tables 7.4 shows all the broad underlying causes of death in respect of youth by sex for 2008 and 2013,
expanding to a wider variety of causes of death and restricting the information to youth only as depicted
previously in Tables 7.3a and 7.3b.
Table 7.4: Youth: Main underlying causes of death by sex, 2008 and 2013
Youth: Main groups of the underlying causes of death
Deceased
Male Female Unspecified Male Female Unknown Unspecified
2008 2013
Per cent
Certain infectious and parasitic diseases 30,7 43,8 26,5 27,4 44,8 60,0 30,4
Neoplasms 1,5 1,7 1,9 2,0 3,4 0,0 1,6 Diseases of the blood and immune mechanism 3,7 6,4 3,9 2,5 5,3 0,0 3,0 Endocrine; nutritional and metabolic diseases 0,9 1,4 1,3 1,1 1,5 0,0 0,5
Mental and behavioural disorders 0,1 0,1 0,0 0,1 0,1 0,0 0,0
Diseases of the nervous system 3,6 3,9 2,6 3,2 3,4 0,0 1,1
Diseases of the eye and adnexa 0,0 0,0 0,0 0,0 0,0 0,0 0,0
Diseases of the ear and mastoid process 0,0 0,0 0,0 0,0 0,0 0,0 0,0
Diseases of the circulatory system 3,1 3,8 5,2 3,3 4,7 0,0 5,7
Diseases of the respiratory system 9,6 14,1 16,8 5,5 9,2 0,0 6,8
Diseases of the digestive system 2,0 2,3 0,0 2,0 2,5 0,0 1,4 Diseases of the skin and subcutaneous tissue 0,1 0,2 1,3 0,1 0,2 0,0 0,0 Diseases of the musculoskeletal system etc. 0,1 0,3 0,0 0,1 0,4 0,0 0,8
Diseases of the genitourinary system 0,9 1,0 1,9 1,0 1,5 0,0 0,8
Pregnancy; childbirth and puerperium 0,0 2,1 0,0 0,0 2,0 0,0 0,0
Congenital malformations 0,1 0,1 0,7 0,2 0,2 0,0 0,3 Symptoms and signs not elsewhere classified 8,9 12,5 17,4 8,2 10,6 20,0 13,3 External causes of morbidity and mortality 34,7 6,4 20,7 43,2 10,4 20,0 34,2
Total (Per cent) 100,0 100,0 100,0 100,0 100,0 100,0 100,0
Total N’(000) 60 437 67 412 155 000 41 791 35 653 10 000 368 000
Source: Causes of death, 2008; 2013 Note: Data for 2008 have been updated with late registrations
Around 35% of males died from external causes of morbidity and mortality during 2008. This number
increased to 43,2% in 2013, whereas the deaths of only 6,4% of females in 2008 and 10,4% in 2013 could be
attributed to this cause. The most prevalent reason given for the death of females was certain infectious
and parasitic diseases – 43,8% in 2008 and 44,8% in 2013. This reason was given for 30,7% of males in 2008
and 27,4% in 2013. The second highest cause of death for females in 2008 was found to be in respect of
diseases of the respiratory system at 14,1%. This percentage decreased to 9,2% in 2013 when it was
overtaken by “symptoms and signs not elsewhere classified”(10,6%) and “external causes of morbidity and
mortality” at 10,4%.
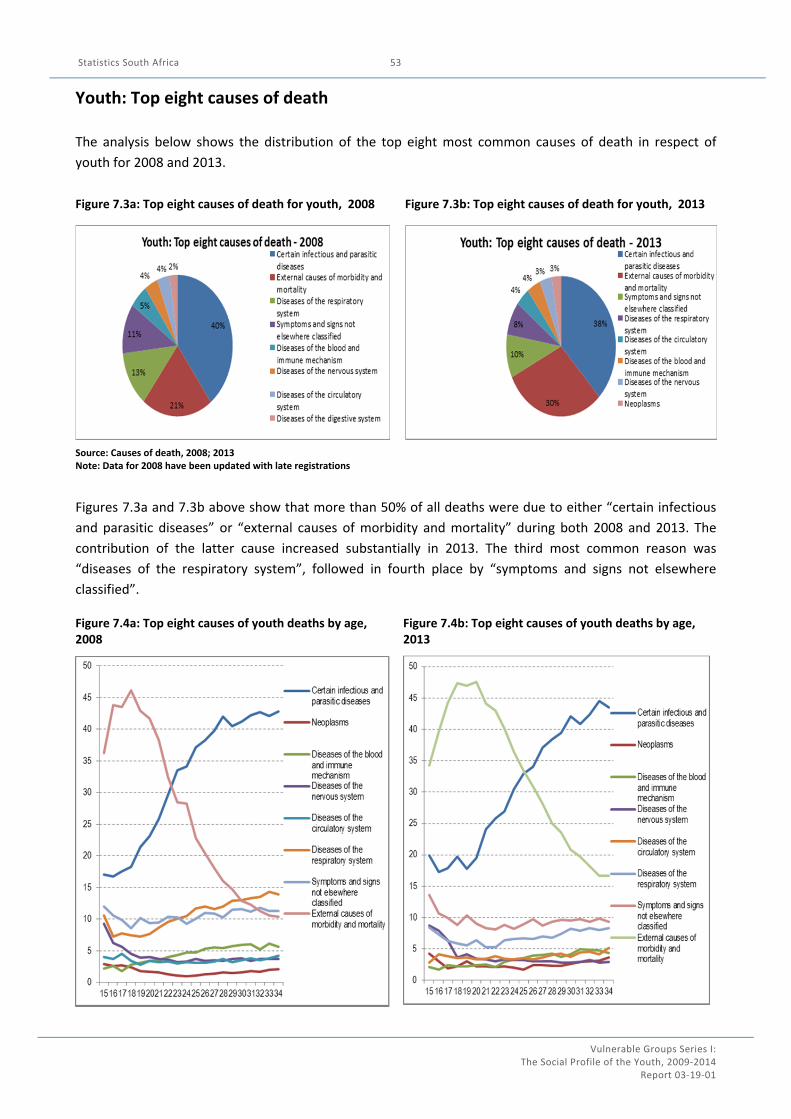
Statistics South Africa
Vulnerable Groups Series I: The Social Profile of the Youth, 2009‐2014
Report 03‐19‐01
53
Youth: Top eight causes of death
The analysis below shows the distribution of the top eight most common causes of death in respect of
youth for 2008 and 2013.
Note: Data for 2008 have been updated with late registrations
Figures 7.3a and 7.3b above show that more than 50% of all deaths were due to either “certain infectious
and parasitic diseases” or “external causes of morbidity and mortality” during both 2008 and 2013. The
contribution of the latter cause increased substantially in 2013. The third most common reason was
“diseases of the respiratory system”, followed in fourth place by “symptoms and signs not elsewhere
classified”.
Figure 7.3a: Top eight causes of death for youth, 2008 Figure 7.3b: Top eight causes of death for youth, 2013
Source: Causes of death, 2008; 2013
Figure 7.4a: Top eight causes of youth deaths by age, 2008
Figure 7.4b: Top eight causes of youth deaths by age, 2013
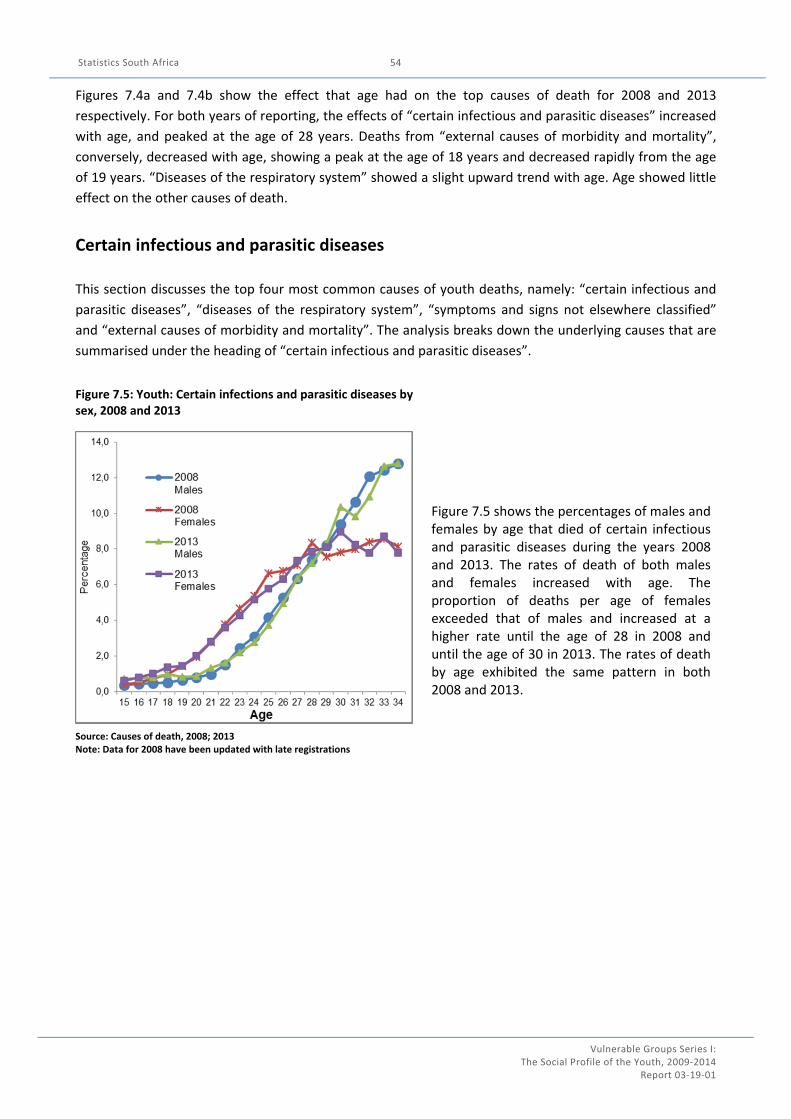
Statistics South Africa
Vulnerable Groups Series I: The Social Profile of the Youth, 2009‐2014
Report 03‐19‐01
54
Figures 7.4a and 7.4b show the effect that age had on the top causes of death for 2008 and 2013
respectively. For both years of reporting, the effects of “certain infectious and parasitic diseases” increased
with age, and peaked at the age of 28 years. Deaths from “external causes of morbidity and mortality”,
conversely, decreased with age, showing a peak at the age of 18 years and decreased rapidly from the age
of 19 years. “Diseases of the respiratory system” showed a slight upward trend with age. Age showed little
effect on the other causes of death.
Certain infectious and parasitic diseases
This section discusses the top four most common causes of youth deaths, namely: “certain infectious and
parasitic diseases”, “diseases of the respiratory system”, “symptoms and signs not elsewhere classified”
and “external causes of morbidity and mortality”. The analysis breaks down the underlying causes that are
summarised under the heading of “certain infectious and parasitic diseases”.
Figure 7.5: Youth: Certain infections and parasitic diseases by sex, 2008 and 2013
Source: Causes of death, 2008; 2013
Figure 7.5 shows the percentages of males and females by age that died of certain infectious and parasitic diseases during the years 2008 and 2013. The rates of death of both males and females increased with age. The proportion of deaths per age of females exceeded that of males and increased at a higher rate until the age of 28 in 2008 and until the age of 30 in 2013. The rates of death by age exhibited the same pattern in both 2008 and 2013.
Note: Data for 2008 have been updated with late registrations
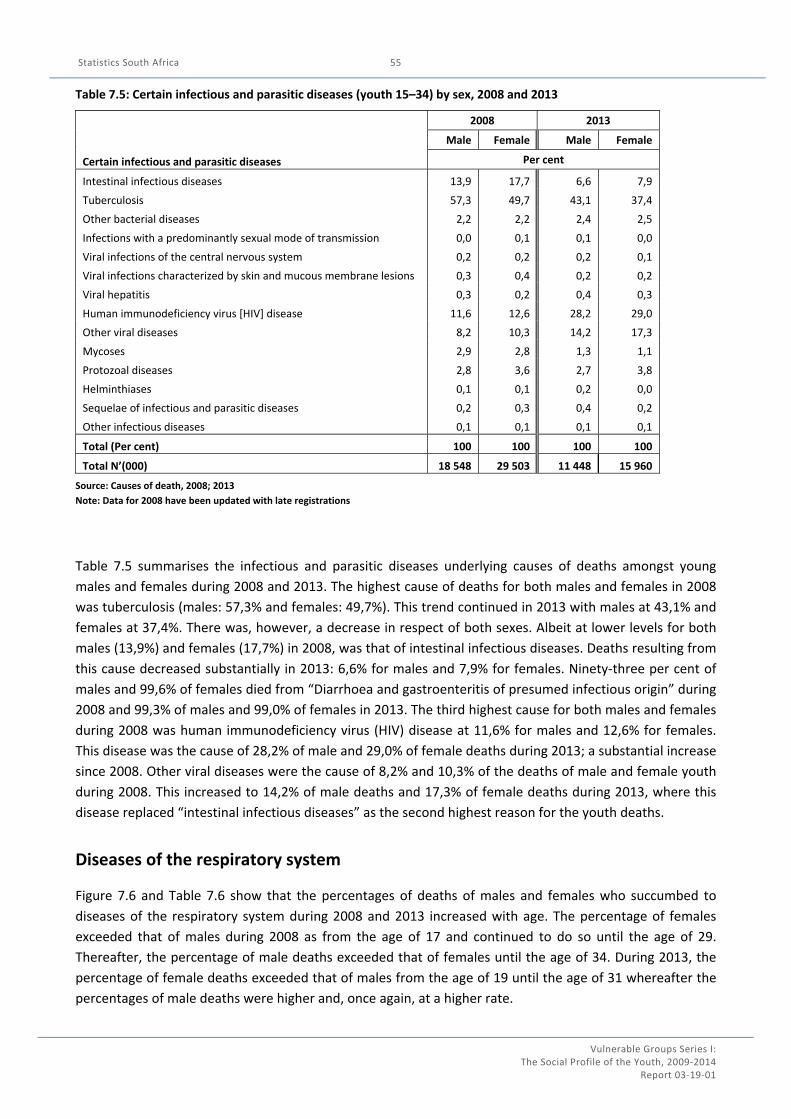
Statistics South Africa
Vulnerable Groups Series I: The Social Profile of the Youth, 2009‐2014
Report 03‐19‐01
55
Table 7.5: Certain infectious and parasitic diseases (youth 15–34) by sex, 2008 and 2013
Certain infectious and parasitic diseases
2008 2013
Male Female Male Female
Per cent
Intestinal infectious diseases 13,9 17,7 6,6 7,9
Tuberculosis 57,3 49,7 43,1 37,4
Other bacterial diseases 2,2 2,2 2,4 2,5
Infections with a predominantly sexual mode of transmission 0,0 0,1 0,1 0,0
Viral infections of the central nervous system 0,2 0,2 0,2 0,1
Viral infections characterized by skin and mucous membrane lesions 0,3 0,4 0,2 0,2
Viral hepatitis 0,3 0,2 0,4 0,3
Human immunodeficiency virus [HIV] disease 11,6 12,6 28,2 29,0
Other viral diseases 8,2 10,3 14,2 17,3
Mycoses 2,9 2,8 1,3 1,1
Protozoal diseases 2,8 3,6 2,7 3,8
Helminthiases 0,1 0,1 0,2 0,0
Sequelae of infectious and parasitic diseases 0,2 0,3 0,4 0,2
Other infectious diseases 0,1 0,1 0,1 0,1
Total (Per cent) 100 100 100 100
Total N’(000) 18 548 29 503 11 448 15 960
Source: Causes of death, 2008; 2013
Note: Data for 2008 have been updated with late registrations
Table 7.5 summarises the infectious and parasitic diseases underlying causes of deaths amongst young
males and females during 2008 and 2013. The highest cause of deaths for both males and females in 2008
was tuberculosis (males: 57,3% and females: 49,7%). This trend continued in 2013 with males at 43,1% and
females at 37,4%. There was, however, a decrease in respect of both sexes. Albeit at lower levels for both
males (13,9%) and females (17,7%) in 2008, was that of intestinal infectious diseases. Deaths resulting from
this cause decreased substantially in 2013: 6,6% for males and 7,9% for females. Ninety‐three per cent of
males and 99,6% of females died from “Diarrhoea and gastroenteritis of presumed infectious origin” during
2008 and 99,3% of males and 99,0% of females in 2013. The third highest cause for both males and females
during 2008 was human immunodeficiency virus (HIV) disease at 11,6% for males and 12,6% for females.
This disease was the cause of 28,2% of male and 29,0% of female deaths during 2013; a substantial increase
since 2008. Other viral diseases were the cause of 8,2% and 10,3% of the deaths of male and female youth
during 2008. This increased to 14,2% of male deaths and 17,3% of female deaths during 2013, where this
disease replaced “intestinal infectious diseases” as the second highest reason for the youth deaths.
Diseases of the respiratory system
Figure 7.6 and Table 7.6 show that the percentages of deaths of males and females who succumbed to
diseases of the respiratory system during 2008 and 2013 increased with age. The percentage of females
exceeded that of males during 2008 as from the age of 17 and continued to do so until the age of 29.
Thereafter, the percentage of male deaths exceeded that of females until the age of 34. During 2013, the
percentage of female deaths exceeded that of males from the age of 19 until the age of 31 whereafter the
percentages of male deaths were higher and, once again, at a higher rate.

Statistics South Africa
Vulnerable Groups Series I: The Social Profile of the Youth, 2009‐2014
Report 03‐19‐01
56
Figure 7.6: Diseases of respiratory system by sex and age, 2013
Table 7.6: Diseases of respiratory system by sex, 2008 and 2013
Diseases of the respiratory system ‐ 2008
Sex ‐ 2008 Sex ‐ 2013
Male Female Male Female
Per cent
Acute upper respiratory infections 0,2 0,4 0,5 0,3 Influenza and pneumonia 67,7 69,5 61,5 66,1Other acute lower respiratory infections 11,9 12,3 15,4 13,4 Other diseases of upper respiratory tract 0,2 0,2 0,8 0,3
Chronic lower respiratory diseases 6,9 5,6 7,8 8,3
Lung diseases due to external agents 1,2 0,6 1,3 0,7
Other respiratory diseases principally affecting the interstitium 3,4 3,8 2,6 2,8
Suppurative and necrotic conditions of lower respiratory tract 0,8 0,3 0,9 0,2
Other diseases of pleura 1,1 1,0 1,3 0,7 Other diseases of the respiratory system 6,6 6,5 7,9 7,2
Total (Per cent) 100 100 100 100
Total N(‘000) 5 817 9 470 2 314 3 273
Source: Causes of death 2008, 2013
The major underlying reasons for deaths that were classified as being due to diseases of the respiratory system are reflected in Figure 7.6 and Table 7.6. This reason was “Influenza and pneumonia”. The percentage of males and females exceeded 60% during both 2008 and 2013 (Table 7.6). These, however, declined slightly in 2013. The second most prominent reason related to “other acute lower respiratory infections”. The percentages of male deaths in 2008 (11,9%) increased considerably to 15,4% in 2013 and that of females increased slightly from 12,3% to 13,4% (Table 7.6).
External causes of morbidity and mortality
Figure 7.7: Youth: External causes of morbidity and mortality 2008 and 2013: Proportions of death by age
Source: Causes of death, 2008; 2013
Note: Data for 2008 have been updated with late registrations
Figure 7.7 displays the percentages of total deaths amongst youth by age and sex for 2008 and 2013. A
uniform pattern is found for both sexes during both years with the percentage of deaths increasing from
the age of 15 to the mid‐twenties and then, at the age of 34, decreasing to a value similar to that found at
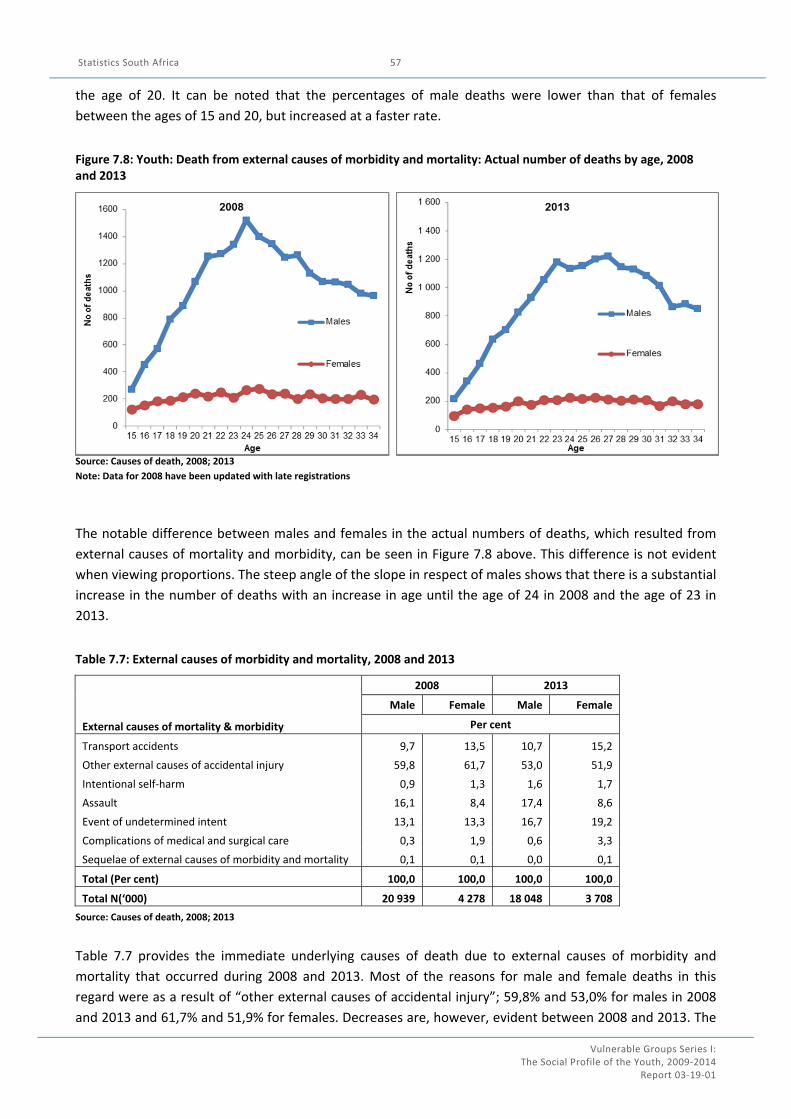
Statistics South Africa
Vulnerable Groups Series I: The Social Profile of the Youth, 2009‐2014
Report 03‐19‐01
57
the age of 20. It can be noted that the percentages of male deaths were lower than that of females
between the ages of 15 and 20, but increased at a faster rate.
Figure 7.8: Youth: Death from external causes of morbidity and mortality: Actual number of deaths by age, 2008 and 2013
Source: Causes of death, 2008; 2013
Note: Data for 2008 have been updated with late registrations
The notable difference between males and females in the actual numbers of deaths, which resulted from
external causes of mortality and morbidity, can be seen in Figure 7.8 above. This difference is not evident
when viewing proportions. The steep angle of the slope in respect of males shows that there is a substantial
increase in the number of deaths with an increase in age until the age of 24 in 2008 and the age of 23 in
2013.
Table 7.7: External causes of morbidity and mortality, 2008 and 2013
External causes of mortality & morbidity
2008 2013
Male Female Male Female
Per cent
Transport accidents 9,7 13,5 10,7 15,2
Other external causes of accidental injury 59,8 61,7 53,0 51,9
Intentional self‐harm 0,9 1,3 1,6 1,7
Assault 16,1 8,4 17,4 8,6
Event of undetermined intent 13,1 13,3 16,7 19,2
Complications of medical and surgical care 0,3 1,9 0,6 3,3
Sequelae of external causes of morbidity and mortality 0,1 0,1 0,0 0,1
Total (Per cent) 100,0 100,0 100,0 100,0
Total N(‘000) 20 939 4 278 18 048 3 708
Source: Causes of death, 2008; 2013
Table 7.7 provides the immediate underlying causes of death due to external causes of morbidity and
mortality that occurred during 2008 and 2013. Most of the reasons for male and female deaths in this
regard were as a result of “other external causes of accidental injury”; 59,8% and 53,0% for males in 2008
and 2013 and 61,7% and 51,9% for females. Decreases are, however, evident between 2008 and 2013. The

Statistics South Africa
Vulnerable Groups Series I: The Social Profile of the Youth, 2009‐2014
Report 03‐19‐01
58
second highest cause for males was “assault” at 16,1% in 2008 and 17,4% in 2013. The second highest
cause of death for females in 2008 were “event of undetermined intent” at 13,3% in 2008 and 15,2% in
2013, followed closely by “events of undetermined intent” – 13,3% in 2008 and 19,2% in 2013.
The underlying reasons for “other causes of accidental injury” for both males and females in 2008 were
“exposure to unspecified factors” at 52,8% for males and 55,6% for females. The second highest reason was
from the “discharge from firearms”: 22,8% for males and 15,1% for females. The third reason was from
“accidental hanging”: 13,72% for males and 11,78% for females.
The main reason for assault is assault with a sharp object for both males (90,8%) and females (82,4%).
Of the underlying causes of death in respect of “other causes of accidental injury”, 52,8% of males died
during 2008 from exposure to unspecified factors. This decreased to 44,4% in 2013. The comparative
percentages for females were 55,6% and 49,0%. Of male deaths during 2008, 22,8% were ascribed to the
“discharge of firearms”. This percentage remained constant at 22,6% during 2013. Corresponding
percentages for females were 15,1% and 11,4%. In 2008, 13,7% of males died from “other accidental
hanging or strangulation” and 19,4% died of this cause in 2013. The percentages of females in this regard
were 11,8% and 17,1%.
Main causes of death by province where death occurred
The following tables show the percentages of the top four causes of youth deaths as percentages of all the
causes of death for males and females within each province (Table 7.8) for 2008 and 2013.
Table 7.8: Top 4 causes of youth deaths by province of occurrence and sex, 2008 and 2013
2008
Youth province of death: Top 4 underlying causes of deaths, 2008
Certain infectious and parasitic diseases
Diseases of the respiratory system
Symptoms and signs not elsewhere classified
External causes of morbidity and mortality
Province
Male Female Male Female Male Female Male Female
Per cent
Western Cape 23,3 53,8 2,7 4,3 6,9 7,1 55,8 15,2
Eastern Cape 26,8 42,7 7,2 10,6 12,1 18,1 38,2 6,2
Northern Cape 29,2 38,6 10,4 13,9 11,0 14,9 35,2 8,9
Free State 30,8 39,4 14,9 20,5 8,5 9,3 26,7 4,7
KwaZulu‐Natal 39,8 52,8 8,2 10,8 8,6 12,0 29,6 5,1
North West 30,1 38,1 12,5 18,3 7,7 12,8 31,9 5,8
Gauteng 24,7 37,3 10,0 15,8 8,7 11,9 38,5 7,9
Mpumalanga 33,2 43,6 13,8 17,9 6,0 7,0 28,7 5,0
Limpopo 25,3 35,3 13,3 17,6 11,0 16,2 31,7 6,2
Outside SA 14,8 28,3 1,2 9,4 37,0 34,0 33,3 7,6
Source: Causes of death, 2008
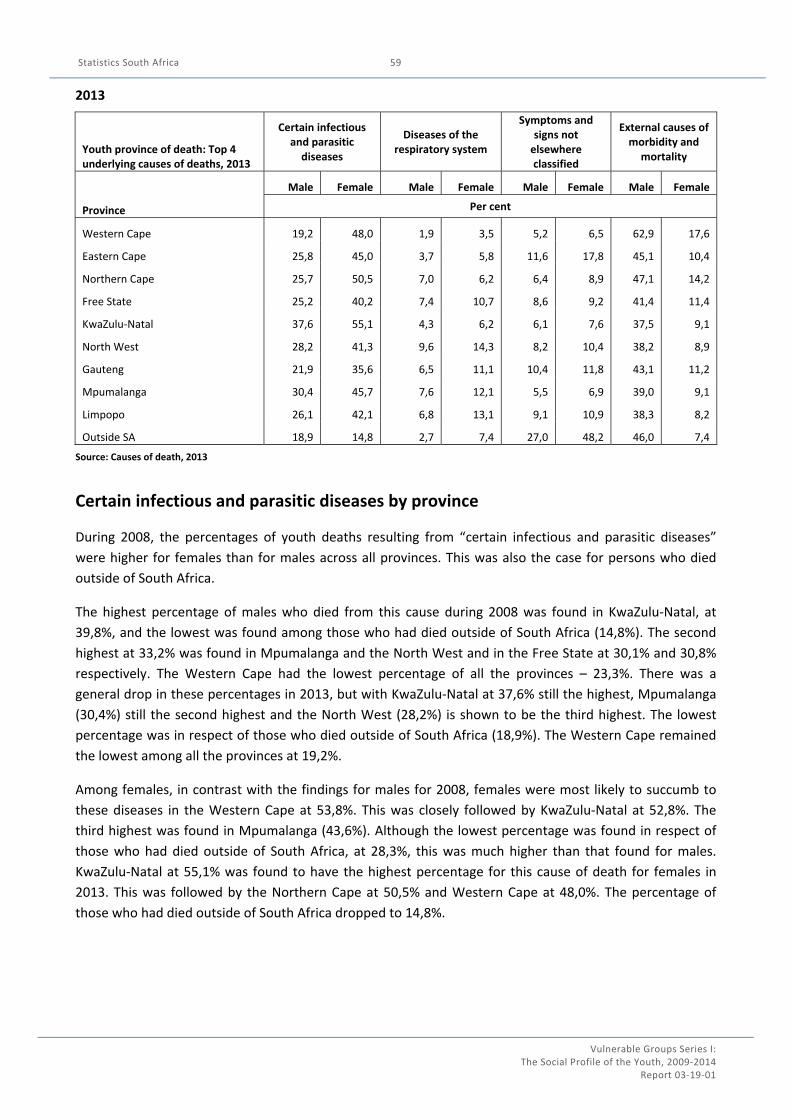
Statistics South Africa
Vulnerable Groups Series I: The Social Profile of the Youth, 2009‐2014
Report 03‐19‐01
59
2013
Youth province of death: Top 4 underlying causes of deaths, 2013
Certain infectious and parasitic diseases
Diseases of the respiratory system
Symptoms and signs not elsewhere classified
External causes of morbidity and
mortality
Province
Male Female Male Female Male Female Male Female
Per cent
Western Cape 19,2 48,0 1,9 3,5 5,2 6,5 62,9 17,6
Eastern Cape 25,8 45,0 3,7 5,8 11,6 17,8 45,1 10,4
Northern Cape 25,7 50,5 7,0 6,2 6,4 8,9 47,1 14,2
Free State 25,2 40,2 7,4 10,7 8,6 9,2 41,4 11,4
KwaZulu‐Natal 37,6 55,1 4,3 6,2 6,1 7,6 37,5 9,1
North West 28,2 41,3 9,6 14,3 8,2 10,4 38,2 8,9
Gauteng 21,9 35,6 6,5 11,1 10,4 11,8 43,1 11,2
Mpumalanga 30,4 45,7 7,6 12,1 5,5 6,9 39,0 9,1
Limpopo 26,1 42,1 6,8 13,1 9,1 10,9 38,3 8,2
Outside SA 18,9 14,8 2,7 7,4 27,0 48,2 46,0 7,4
Source: Causes of death, 2013
Certain infectious and parasitic diseases by province
During 2008, the percentages of youth deaths resulting from “certain infectious and parasitic diseases”
were higher for females than for males across all provinces. This was also the case for persons who died
outside of South Africa.
The highest percentage of males who died from this cause during 2008 was found in KwaZulu‐Natal, at
39,8%, and the lowest was found among those who had died outside of South Africa (14,8%). The second
highest at 33,2% was found in Mpumalanga and the North West and in the Free State at 30,1% and 30,8%
respectively. The Western Cape had the lowest percentage of all the provinces – 23,3%. There was a
general drop in these percentages in 2013, but with KwaZulu‐Natal at 37,6% still the highest, Mpumalanga
(30,4%) still the second highest and the North West (28,2%) is shown to be the third highest. The lowest
percentage was in respect of those who died outside of South Africa (18,9%). The Western Cape remained
the lowest among all the provinces at 19,2%.
Among females, in contrast with the findings for males for 2008, females were most likely to succumb to
these diseases in the Western Cape at 53,8%. This was closely followed by KwaZulu‐Natal at 52,8%. The
third highest was found in Mpumalanga (43,6%). Although the lowest percentage was found in respect of
those who had died outside of South Africa, at 28,3%, this was much higher than that found for males.
KwaZulu‐Natal at 55,1% was found to have the highest percentage for this cause of death for females in
2013. This was followed by the Northern Cape at 50,5% and Western Cape at 48,0%. The percentage of
those who had died outside of South Africa dropped to 14,8%.
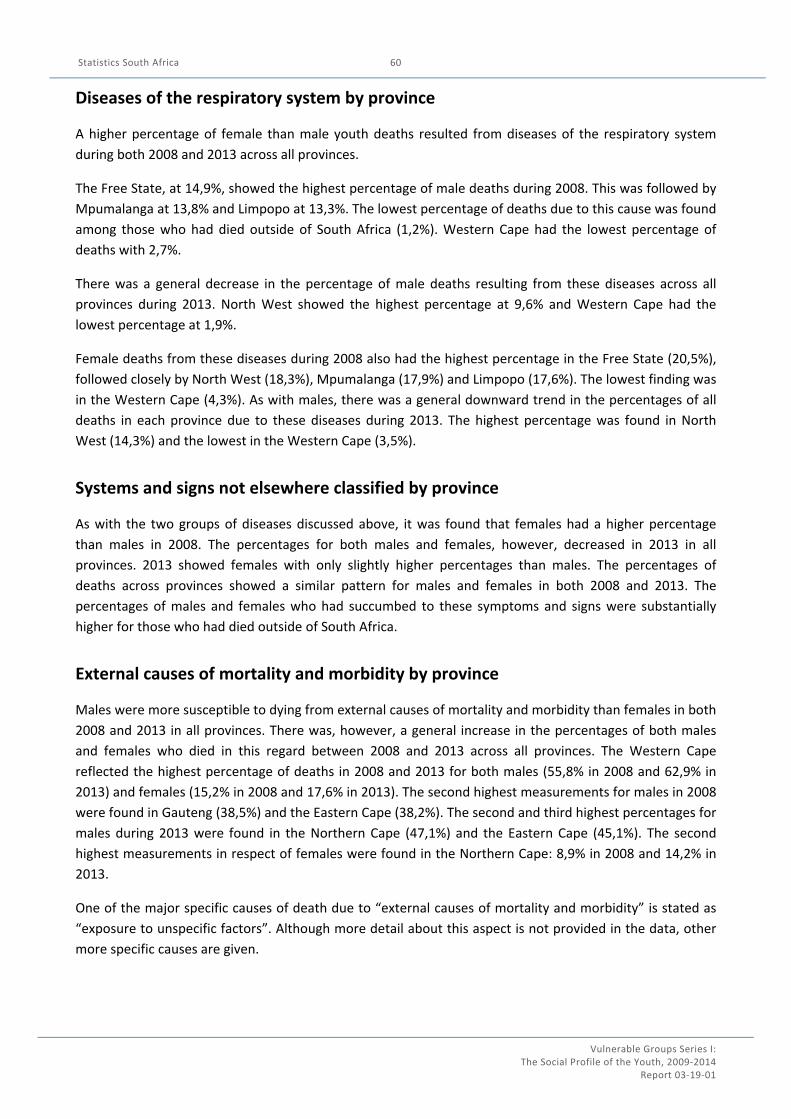
Statistics South Africa
Vulnerable Groups Series I: The Social Profile of the Youth, 2009‐2014
Report 03‐19‐01
60
Diseases of the respiratory system by province
A higher percentage of female than male youth deaths resulted from diseases of the respiratory system
during both 2008 and 2013 across all provinces.
The Free State, at 14,9%, showed the highest percentage of male deaths during 2008. This was followed by
Mpumalanga at 13,8% and Limpopo at 13,3%. The lowest percentage of deaths due to this cause was found
among those who had died outside of South Africa (1,2%). Western Cape had the lowest percentage of
deaths with 2,7%.
There was a general decrease in the percentage of male deaths resulting from these diseases across all
provinces during 2013. North West showed the highest percentage at 9,6% and Western Cape had the
lowest percentage at 1,9%.
Female deaths from these diseases during 2008 also had the highest percentage in the Free State (20,5%),
followed closely by North West (18,3%), Mpumalanga (17,9%) and Limpopo (17,6%). The lowest finding was
in the Western Cape (4,3%). As with males, there was a general downward trend in the percentages of all
deaths in each province due to these diseases during 2013. The highest percentage was found in North
West (14,3%) and the lowest in the Western Cape (3,5%).
Systems and signs not elsewhere classified by province
As with the two groups of diseases discussed above, it was found that females had a higher percentage
than males in 2008. The percentages for both males and females, however, decreased in 2013 in all
provinces. 2013 showed females with only slightly higher percentages than males. The percentages of
deaths across provinces showed a similar pattern for males and females in both 2008 and 2013. The
percentages of males and females who had succumbed to these symptoms and signs were substantially
higher for those who had died outside of South Africa.
External causes of mortality and morbidity by province
Males were more susceptible to dying from external causes of mortality and morbidity than females in both
2008 and 2013 in all provinces. There was, however, a general increase in the percentages of both males
and females who died in this regard between 2008 and 2013 across all provinces. The Western Cape
reflected the highest percentage of deaths in 2008 and 2013 for both males (55,8% in 2008 and 62,9% in
2013) and females (15,2% in 2008 and 17,6% in 2013). The second highest measurements for males in 2008
were found in Gauteng (38,5%) and the Eastern Cape (38,2%). The second and third highest percentages for
males during 2013 were found in the Northern Cape (47,1%) and the Eastern Cape (45,1%). The second
highest measurements in respect of females were found in the Northern Cape: 8,9% in 2008 and 14,2% in
2013.
One of the major specific causes of death due to “external causes of mortality and morbidity” is stated as
“exposure to unspecific factors”. Although more detail about this aspect is not provided in the data, other
more specific causes are given.

Statistics South Africa
Vulnerable Groups Series I: The Social Profile of the Youth, 2009‐2014
Report 03‐19‐01
61
The data show that Limpopo consistently had the highest percentage of youth deaths due to vehicle
accidents for both males and females. Deaths as a result of “motor‐ or non‐motor vehicle accidents” were
32,9% for males and 35,5% for females. The percentages are almost the same in 2013: 31,0% for males and
35,2% for females. The Western Cape consistently had the lowest rate of youth deaths due to vehicle
accidents: males – 2,5% in 2008 and 2,1% in 2013. Female percentages were 4,0% in 2008 and 2,3% in
2013.
“Death from the discharge of firearms” was highest in KwaZulu‐Natal at 21,7% for males in 2008 and 15,7%
for females in that year. The highest percentage (22,7%) of male deaths in this regard shifted to the
Western Cape in 2013. The highest percentage of females was in Gauteng at 8,8%.
Of males in 2008, 15,1% met their demise through “other accidental hanging or strangulation.” Western
Cape also had the highest proportion of male hangings or strangulations in 2013 at 15,0%. Female deaths
due to this reason were highest in KwaZulu‐Natal: 9,2% in 2008 and 12,9% in 2013.
Male deaths as a result of “assault by sharp object” was highest in the Western Cape in 2008 at 24,6% and
in 2013 at 25,1%. The highest percentage among females was found in the Free State at 12,3% in 2008 and
in the Northern Cape at 11,3% in 2013.
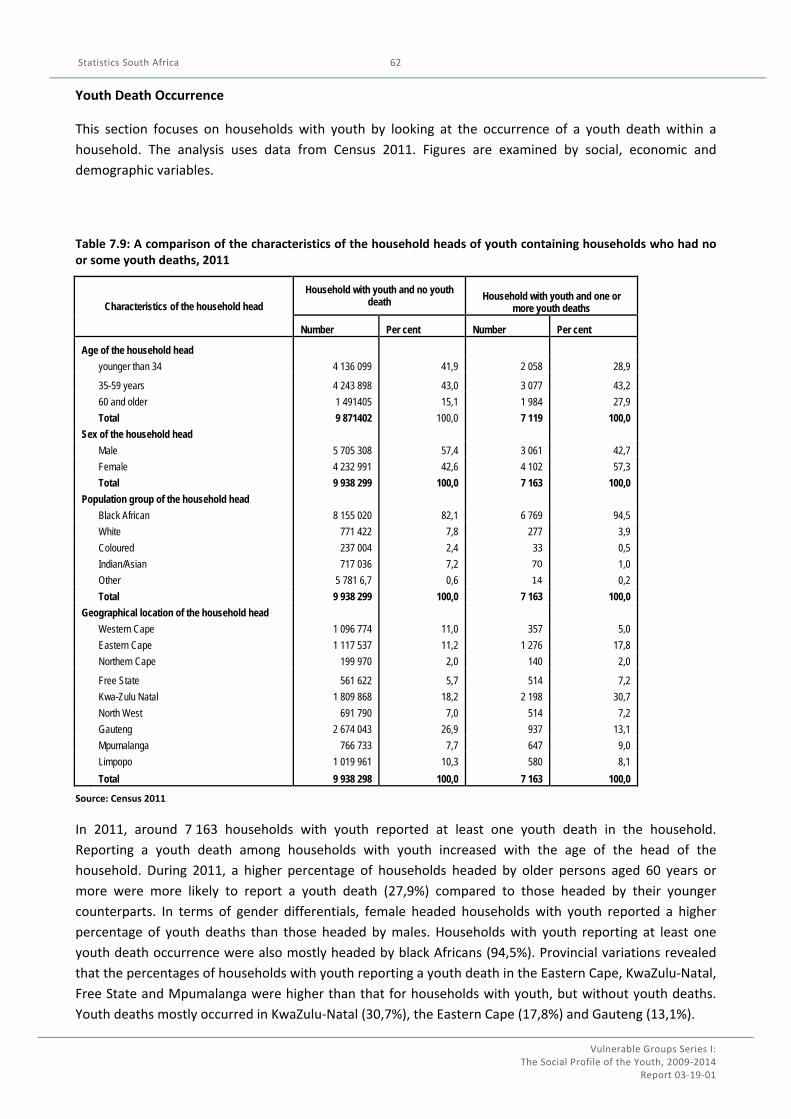
Statistics South Africa
Vulnerable Groups Series I: The Social Profile of the Youth, 2009‐2014
Report 03‐19‐01
62
Youth Death Occurrence
This section focuses on households with youth by looking at the occurrence of a youth death within a
household. The analysis uses data from Census 2011. Figures are examined by social, economic and
demographic variables.
Table 7.9: A comparison of the characteristics of the household heads of youth containing households who had no or some youth deaths, 2011
Characteristics of the household head
Household with youth and no youth death Household with youth and one or
more youth deaths
Number Per cent Number Per cent
Age of the household head
younger than 34 4 136 099 41,9 2 058 28,9
35-59 years 4 243 898 43,0 3 077 43,2
60 and older 1 491405 15,1 1 984 27,9
Total 9 871402 100,0 7 119 100,0
Sex of the household head
Male 5 705 308 57,4 3 061 42,7
Female 4 232 991 42,6 4 102 57,3
Total 9 938 299 100,0 7 163 100,0
Population group of the household head
Black African 8 155 020 82,1 6 769 94,5
White 771 422 7,8 277 3,9
Coloured 237 004 2,4 33 0,5
Indian/Asian 717 036 7,2 70 1,0
Other 5 781 6,7 0,6 14 0,2
Total 9 938 299 100,0 7 163 100,0
Geographical location of the household head
Western Cape 1 096 774 11,0 357 5,0
Eastern Cape 1 117 537 11,2 1 276 17,8
Northern Cape 199 970 2,0 140 2,0
Free State 561 622 5,7 514 7,2
Kwa-Zulu Natal 1 809 868 18,2 2 198 30,7
North West 691 790 7,0 514 7,2
Gauteng 2 674 043 26,9 937 13,1
Mpumalanga 766 733 7,7 647 9,0
Limpopo 1 019 961 10,3 580 8,1
Total 9 938 298 100,0 7 163 100,0
Source: Census 2011
In 2011, around 7 163 households with youth reported at least one youth death in the household.
Reporting a youth death among households with youth increased with the age of the head of the
household. During 2011, a higher percentage of households headed by older persons aged 60 years or
more were more likely to report a youth death (27,9%) compared to those headed by their younger
counterparts. In terms of gender differentials, female headed households with youth reported a higher
percentage of youth deaths than those headed by males. Households with youth reporting at least one
youth death occurrence were also mostly headed by black Africans (94,5%). Provincial variations revealed
that the percentages of households with youth reporting a youth death in the Eastern Cape, KwaZulu‐Natal,
Free State and Mpumalanga were higher than that for households with youth, but without youth deaths.
Youth deaths mostly occurred in KwaZulu‐Natal (30,7%), the Eastern Cape (17,8%) and Gauteng (13,1%).

Statistics South Africa
Vulnerable Groups Series I: The Social Profile of the Youth, 2009‐2014
Report 03‐19‐01
63
Table 7.10: A comparison of housing and service delivery of youth containing households who had no or some youth deaths, 2011
Housing and Service delivery Household with youth and no youth
death Household with youth and one or more youth deaths
Number Per cent Number Per cent Type of dwelling
Formal 7659121 77,1 5139 71,7
Traditional 797128 8,0 1115 15,6
Informal 1398210 14,1 877 12,2
Other 83841 0,8 32 0,4
Total 9938300 100,0 7163 100,0 Type of water
Piped water 8415255 84,8 5475 76,4
Other 1512506 15,2 1688 23,6
Total 9927761 100,0 7163 100,0
Type of sanitation
Flush toilet or improved pit latrine 7011041
70,5 4178
58,3
Other 2927258 29,5 2986 41,7 Total 9938299 100,0 7163 100,0
Type of refuse removal
Municipality (once a week) 6098289 61,4 3225 45,0
Other 3840010 38,6 3939 55,0
Total 9938299 100,0 7163 100,0
Availability of energy lighting Yes 8453505 85,1 5863 81,8 No 1484795 14,9 1300 18,2
Total 9938300 100,0 7163 100,0
Source: Census 2011
The table above looks at the effects of housing and service delivery and the reporting of youth deaths for
households with youth. The figures show that the percentages of households with youth reporting a youth
death for those living in traditional housing and using sources of water other than piped water was higher
than that for households with youth, but without youth deaths. The results further show that inadequate
refuse removal, the lack of sanitation and energy lighting were all positively related to increased chances of
reporting youth death among households with youth who reported death.
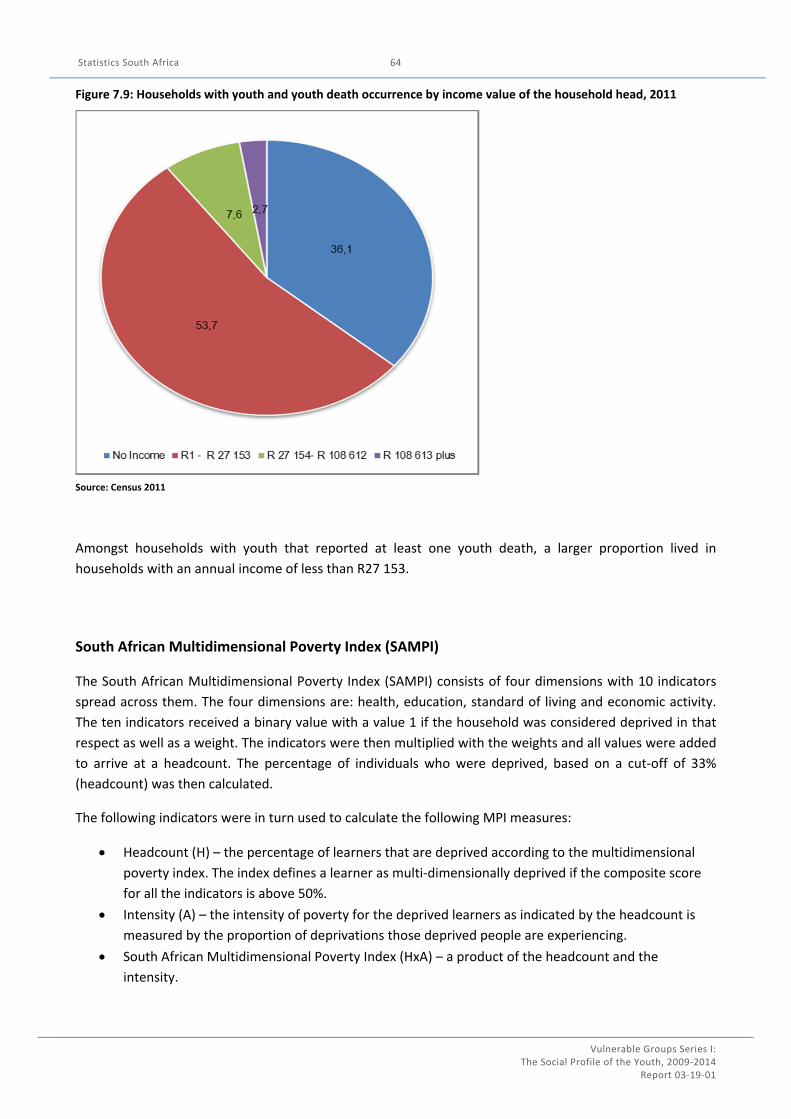
Statistics South Africa
Vulnerable Groups Series I: The Social Profile of the Youth, 2009‐2014
Report 03‐19‐01
64
Figure 7.9: Households with youth and youth death occurrence by income value of the household head, 2011
Source: Census 2011
Amongst households with youth that reported at least one youth death, a larger proportion lived in
households with an annual income of less than R27 153.
South African Multidimensional Poverty Index (SAMPI)
The South African Multidimensional Poverty Index (SAMPI) consists of four dimensions with 10 indicators
spread across them. The four dimensions are: health, education, standard of living and economic activity.
The ten indicators received a binary value with a value 1 if the household was considered deprived in that
respect as well as a weight. The indicators were then multiplied with the weights and all values were added
to arrive at a headcount. The percentage of individuals who were deprived, based on a cut‐off of 33%
(headcount) was then calculated.
The following indicators were in turn used to calculate the following MPI measures:
Headcount (H) – the percentage of learners that are deprived according to the multidimensional
poverty index. The index defines a learner as multi‐dimensionally deprived if the composite score
for all the indicators is above 50%.
Intensity (A) – the intensity of poverty for the deprived learners as indicated by the headcount is
measured by the proportion of deprivations those deprived people are experiencing.
South African Multidimensional Poverty Index (HxA) – a product of the headcount and the
intensity.
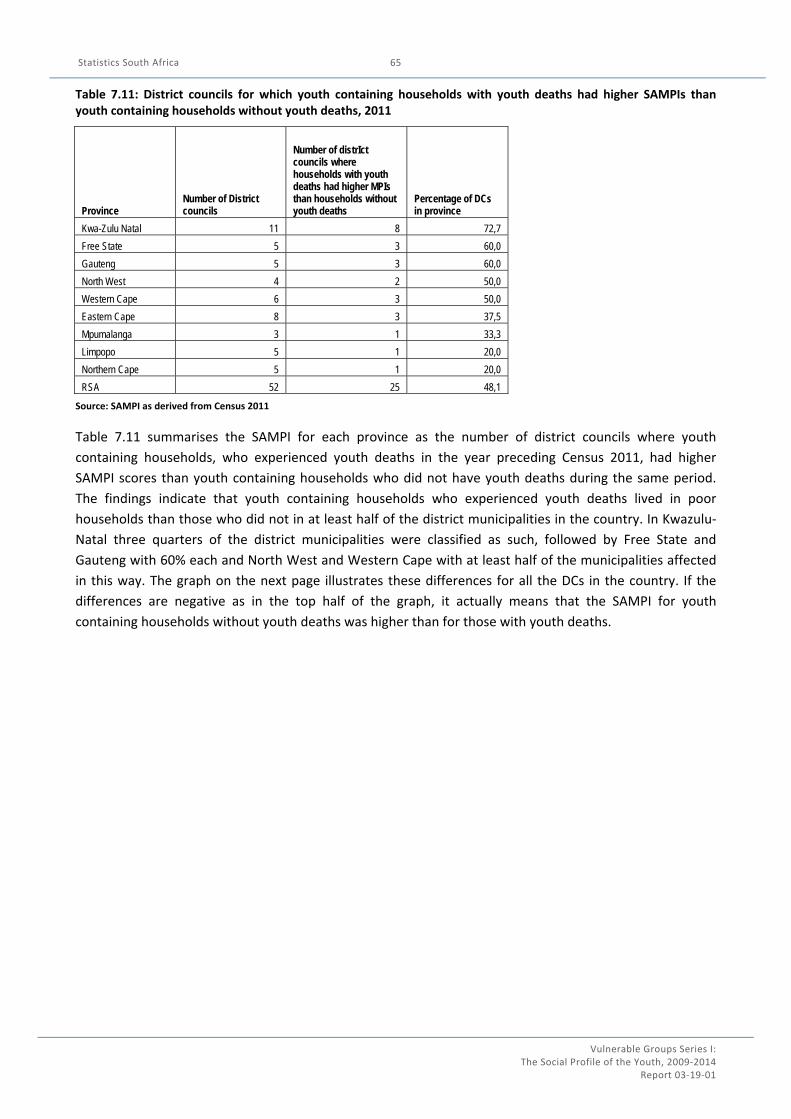
Statistics South Africa
Vulnerable Groups Series I: The Social Profile of the Youth, 2009‐2014
Report 03‐19‐01
65
Table 7.11: District councils for which youth containing households with youth deaths had higher SAMPIs than youth containing households without youth deaths, 2011
Province Number of District councils
Number of distrIct councils where households with youth deaths had higher MPIs than households without youth deaths
Percentage of DCs in province
Kwa-Zulu Natal 11 8 72,7
Free State 5 3 60,0
Gauteng 5 3 60,0
North West 4 2 50,0
Western Cape 6 3 50,0
Eastern Cape 8 3 37,5
Mpumalanga 3 1 33,3
Limpopo 5 1 20,0
Northern Cape 5 1 20,0
RSA 52 25 48,1
Source: SAMPI as derived from Census 2011
Table 7.11 summarises the SAMPI for each province as the number of district councils where youth
containing households, who experienced youth deaths in the year preceding Census 2011, had higher
SAMPI scores than youth containing households who did not have youth deaths during the same period.
The findings indicate that youth containing households who experienced youth deaths lived in poor
households than those who did not in at least half of the district municipalities in the country. In Kwazulu‐
Natal three quarters of the district municipalities were classified as such, followed by Free State and
Gauteng with 60% each and North West and Western Cape with at least half of the municipalities affected
in this way. The graph on the next page illustrates these differences for all the DCs in the country. If the
differences are negative as in the top half of the graph, it actually means that the SAMPI for youth
containing households without youth deaths was higher than for those with youth deaths.
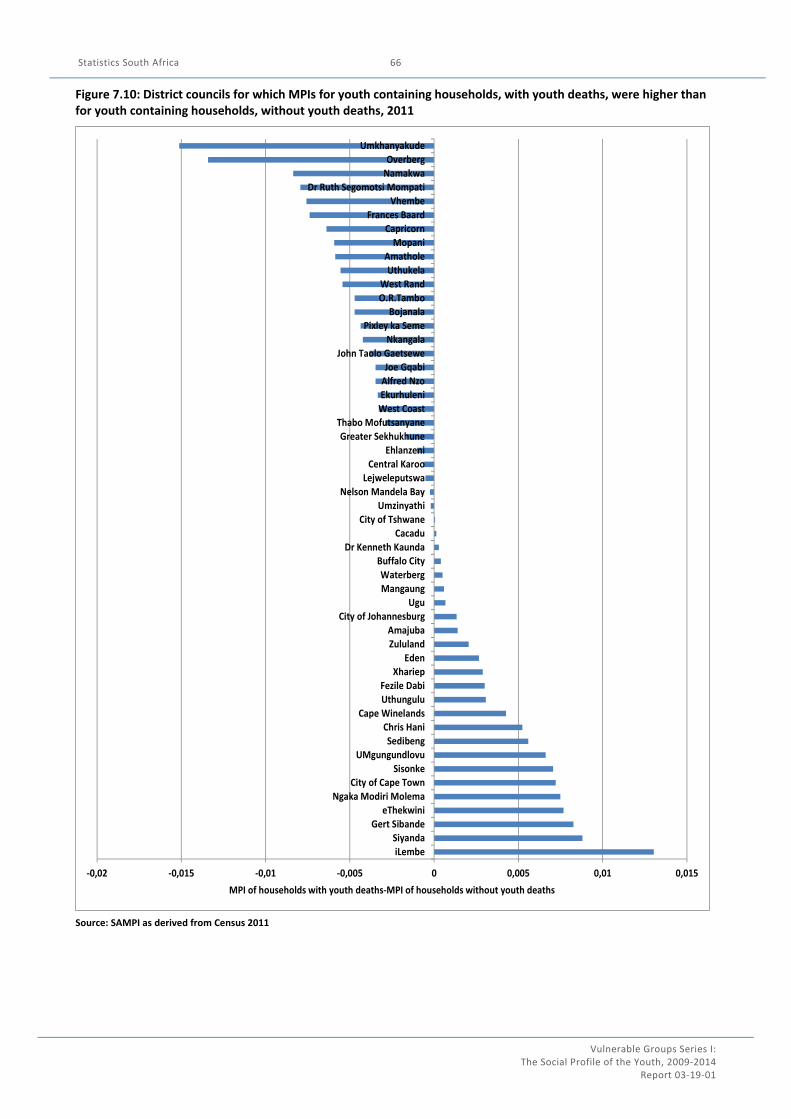
Statistics South Africa
Vulnerable Groups Series I: The Social Profile of the Youth, 2009‐2014
Report 03‐19‐01
66
Figure 7.10: District councils for which MPIs for youth containing households, with youth deaths, were higher than for youth containing households, without youth deaths, 2011
Source: SAMPI as derived from Census 2011
‐0,02 ‐0,015 ‐0,01 ‐0,005 0 0,005 0,01 0,015
iLembe
SiyandaGert Sibande
eThekwiniNgaka Modiri Molema
City of Cape TownSisonke
UMgungundlovuSedibeng
Chris HaniCape Winelands
UthunguluFezile Dabi
XhariepEden
ZululandAmajuba
City of JohannesburgUgu
MangaungWaterberg
Buffalo CityDr Kenneth Kaunda
CacaduCity of Tshwane
UmzinyathiNelson Mandela Bay
LejweleputswaCentral Karoo
EhlanzeniGreater Sekhukhune
Thabo MofutsanyaneWest Coast
EkurhuleniAlfred Nzo
Joe GqabiJohn Taolo Gaetsewe
NkangalaPixley ka Seme
BojanalaO.R.Tambo
West RandUthukela
AmatholeMopani
CapricornFrances Baard
VhembeDr Ruth Segomotsi Mompati
NamakwaOverberg
Umkhanyakude
MPI of households with youth deaths‐MPI of households without youth deaths
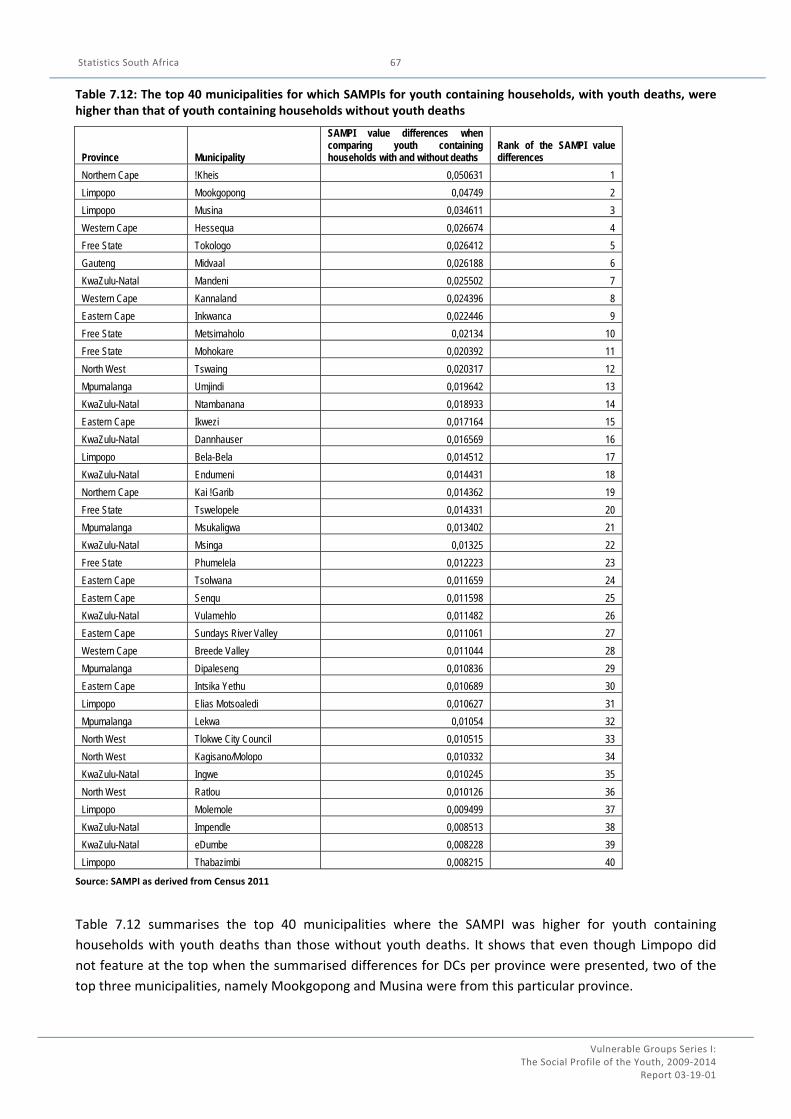
Statistics South Africa
Vulnerable Groups Series I: The Social Profile of the Youth, 2009‐2014
Report 03‐19‐01
67
Table 7.12: The top 40 municipalities for which SAMPIs for youth containing households, with youth deaths, were higher than that of youth containing households without youth deaths
Province Municipality
SAMPI value differences when comparing youth containing households with and without deaths
Rank of the SAMPI value differences
Northern Cape !Kheis 0,050631 1
Limpopo Mookgopong 0,04749 2
Limpopo Musina 0,034611 3
Western Cape Hessequa 0,026674 4
Free State Tokologo 0,026412 5
Gauteng Midvaal 0,026188 6
KwaZulu-Natal Mandeni 0,025502 7
Western Cape Kannaland 0,024396 8
Eastern Cape Inkwanca 0,022446 9
Free State Metsimaholo 0,02134 10
Free State Mohokare 0,020392 11
North West Tswaing 0,020317 12
Mpumalanga Umjindi 0,019642 13
KwaZulu-Natal Ntambanana 0,018933 14
Eastern Cape Ikwezi 0,017164 15
KwaZulu-Natal Dannhauser 0,016569 16
Limpopo Bela-Bela 0,014512 17
KwaZulu-Natal Endumeni 0,014431 18
Northern Cape Kai !Garib 0,014362 19
Free State Tswelopele 0,014331 20
Mpumalanga Msukaligwa 0,013402 21
KwaZulu-Natal Msinga 0,01325 22
Free State Phumelela 0,012223 23
Eastern Cape Tsolwana 0,011659 24
Eastern Cape Senqu 0,011598 25
KwaZulu-Natal Vulamehlo 0,011482 26
Eastern Cape Sundays River Valley 0,011061 27
Western Cape Breede Valley 0,011044 28
Mpumalanga Dipaleseng 0,010836 29
Eastern Cape Intsika Yethu 0,010689 30
Limpopo Elias Motsoaledi 0,010627 31
Mpumalanga Lekwa 0,01054 32
North West Tlokwe City Council 0,010515 33
North West Kagisano/Molopo 0,010332 34
KwaZulu-Natal Ingwe 0,010245 35
North West Ratlou 0,010126 36
Limpopo Molemole 0,009499 37
KwaZulu-Natal Impendle 0,008513 38
KwaZulu-Natal eDumbe 0,008228 39
Limpopo Thabazimbi 0,008215 40
Source: SAMPI as derived from Census 2011
Table 7.12 summarises the top 40 municipalities where the SAMPI was higher for youth containing
households with youth deaths than those without youth deaths. It shows that even though Limpopo did
not feature at the top when the summarised differences for DCs per province were presented, two of the
top three municipalities, namely Mookgopong and Musina were from this particular province.
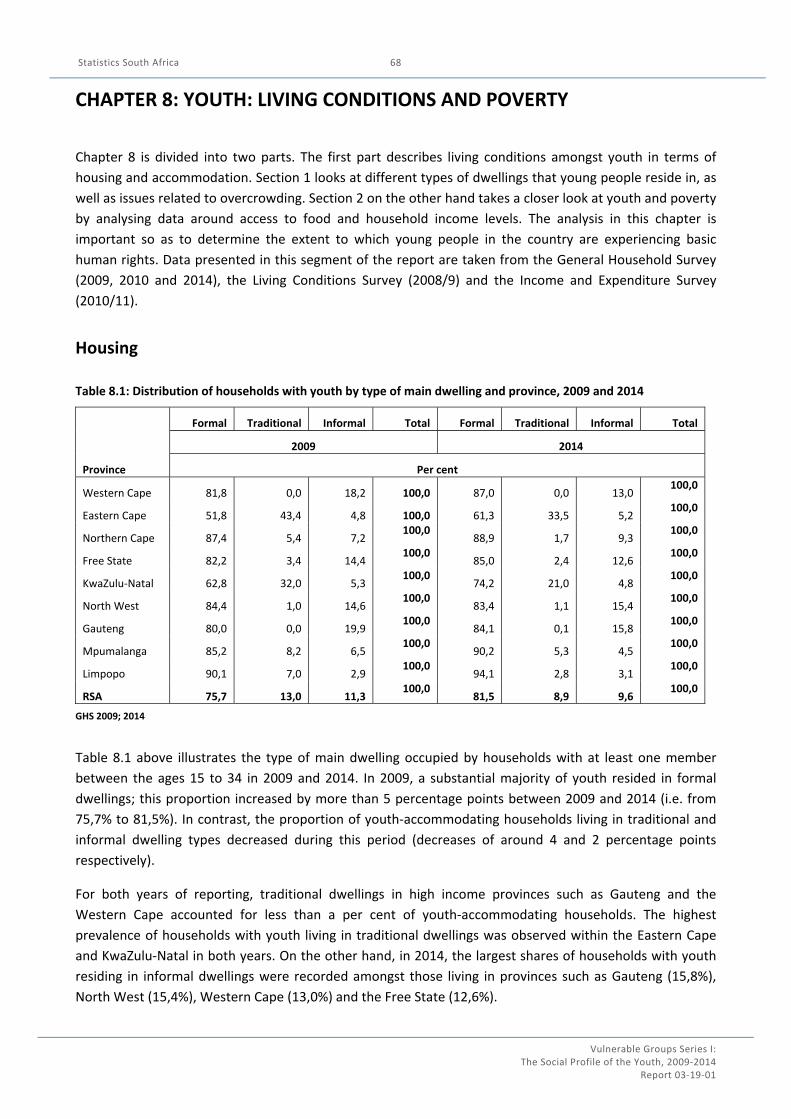
Statistics South Africa
Vulnerable Groups Series I: The Social Profile of the Youth, 2009‐2014
Report 03‐19‐01
68
CHAPTER 8: YOUTH: LIVING CONDITIONS AND POVERTY
Chapter 8 is divided into two parts. The first part describes living conditions amongst youth in terms of
housing and accommodation. Section 1 looks at different types of dwellings that young people reside in, as
well as issues related to overcrowding. Section 2 on the other hand takes a closer look at youth and poverty
by analysing data around access to food and household income levels. The analysis in this chapter is
important so as to determine the extent to which young people in the country are experiencing basic
human rights. Data presented in this segment of the report are taken from the General Household Survey
(2009, 2010 and 2014), the Living Conditions Survey (2008/9) and the Income and Expenditure Survey
(2010/11).
Housing
Table 8.1: Distribution of households with youth by type of main dwelling and province, 2009 and 2014
Province
Formal Traditional Informal Total Formal Traditional Informal Total
2009 2014
Per cent
Western Cape 81,8 0,0 18,2 100,0 87,0 0,0 13,0 100,0
Eastern Cape 51,8 43,4 4,8 100,0 61,3 33,5 5,2 100,0
Northern Cape 87,4 5,4 7,2 100,0
88,9 1,7 9,3 100,0
Free State 82,2 3,4 14,4 100,0
85,0 2,4 12,6 100,0
KwaZulu‐Natal 62,8 32,0 5,3 100,0
74,2 21,0 4,8 100,0
North West 84,4 1,0 14,6 100,0
83,4 1,1 15,4 100,0
Gauteng 80,0 0,0 19,9 100,0
84,1 0,1 15,8 100,0
Mpumalanga 85,2 8,2 6,5 100,0
90,2 5,3 4,5 100,0
Limpopo 90,1 7,0 2,9 100,0
94,1 2,8 3,1 100,0
RSA 75,7 13,0 11,3 100,0
81,5 8,9 9,6 100,0
GHS 2009; 2014
Table 8.1 above illustrates the type of main dwelling occupied by households with at least one member
between the ages 15 to 34 in 2009 and 2014. In 2009, a substantial majority of youth resided in formal
dwellings; this proportion increased by more than 5 percentage points between 2009 and 2014 (i.e. from
75,7% to 81,5%). In contrast, the proportion of youth‐accommodating households living in traditional and
informal dwelling types decreased during this period (decreases of around 4 and 2 percentage points
respectively).
For both years of reporting, traditional dwellings in high income provinces such as Gauteng and the
Western Cape accounted for less than a per cent of youth‐accommodating households. The highest
prevalence of households with youth living in traditional dwellings was observed within the Eastern Cape
and KwaZulu‐Natal in both years. On the other hand, in 2014, the largest shares of households with youth
residing in informal dwellings were recorded amongst those living in provinces such as Gauteng (15,8%),
North West (15,4%), Western Cape (13,0%) and the Free State (12,6%).
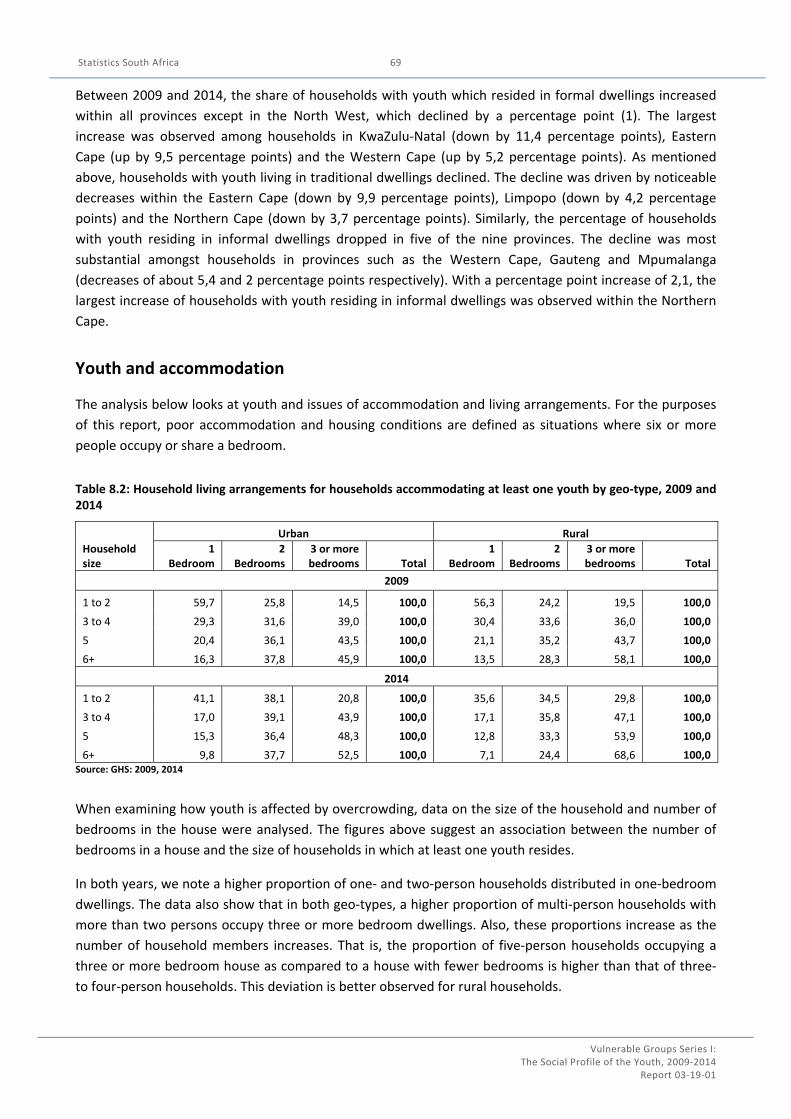
Statistics South Africa
Vulnerable Groups Series I: The Social Profile of the Youth, 2009‐2014
Report 03‐19‐01
69
Between 2009 and 2014, the share of households with youth which resided in formal dwellings increased
within all provinces except in the North West, which declined by a percentage point (1). The largest
increase was observed among households in KwaZulu‐Natal (down by 11,4 percentage points), Eastern
Cape (up by 9,5 percentage points) and the Western Cape (up by 5,2 percentage points). As mentioned
above, households with youth living in traditional dwellings declined. The decline was driven by noticeable
decreases within the Eastern Cape (down by 9,9 percentage points), Limpopo (down by 4,2 percentage
points) and the Northern Cape (down by 3,7 percentage points). Similarly, the percentage of households
with youth residing in informal dwellings dropped in five of the nine provinces. The decline was most
substantial amongst households in provinces such as the Western Cape, Gauteng and Mpumalanga
(decreases of about 5,4 and 2 percentage points respectively). With a percentage point increase of 2,1, the
largest increase of households with youth residing in informal dwellings was observed within the Northern
Cape.
Youth and accommodation
The analysis below looks at youth and issues of accommodation and living arrangements. For the purposes
of this report, poor accommodation and housing conditions are defined as situations where six or more
people occupy or share a bedroom.
Table 8.2: Household living arrangements for households accommodating at least one youth by geo‐type, 2009 and 2014
Household size
Urban Rural
1 Bedroom
2 Bedrooms
3 or more bedrooms Total
1 Bedroom
2 Bedrooms
3 or more bedrooms Total
2009
1 to 2 59,7 25,8 14,5 100,0 56,3 24,2 19,5 100,0
3 to 4 29,3 31,6 39,0 100,0 30,4 33,6 36,0 100,0
5 20,4 36,1 43,5 100,0 21,1 35,2 43,7 100,0
6+ 16,3 37,8 45,9 100,0 13,5 28,3 58,1 100,0
2014
1 to 2 41,1 38,1 20,8 100,0 35,6 34,5 29,8 100,0
3 to 4 17,0 39,1 43,9 100,0 17,1 35,8 47,1 100,0
5 15,3 36,4 48,3 100,0 12,8 33,3 53,9 100,0
6+ 9,8 37,7 52,5 100,0 7,1 24,4 68,6 100,0 Source: GHS: 2009, 2014
When examining how youth is affected by overcrowding, data on the size of the household and number of
bedrooms in the house were analysed. The figures above suggest an association between the number of
bedrooms in a house and the size of households in which at least one youth resides.
In both years, we note a higher proportion of one‐ and two‐person households distributed in one‐bedroom
dwellings. The data also show that in both geo‐types, a higher proportion of multi‐person households with
more than two persons occupy three or more bedroom dwellings. Also, these proportions increase as the
number of household members increases. That is, the proportion of five‐person households occupying a
three or more bedroom house as compared to a house with fewer bedrooms is higher than that of three‐
to four‐person households. This deviation is better observed for rural households.
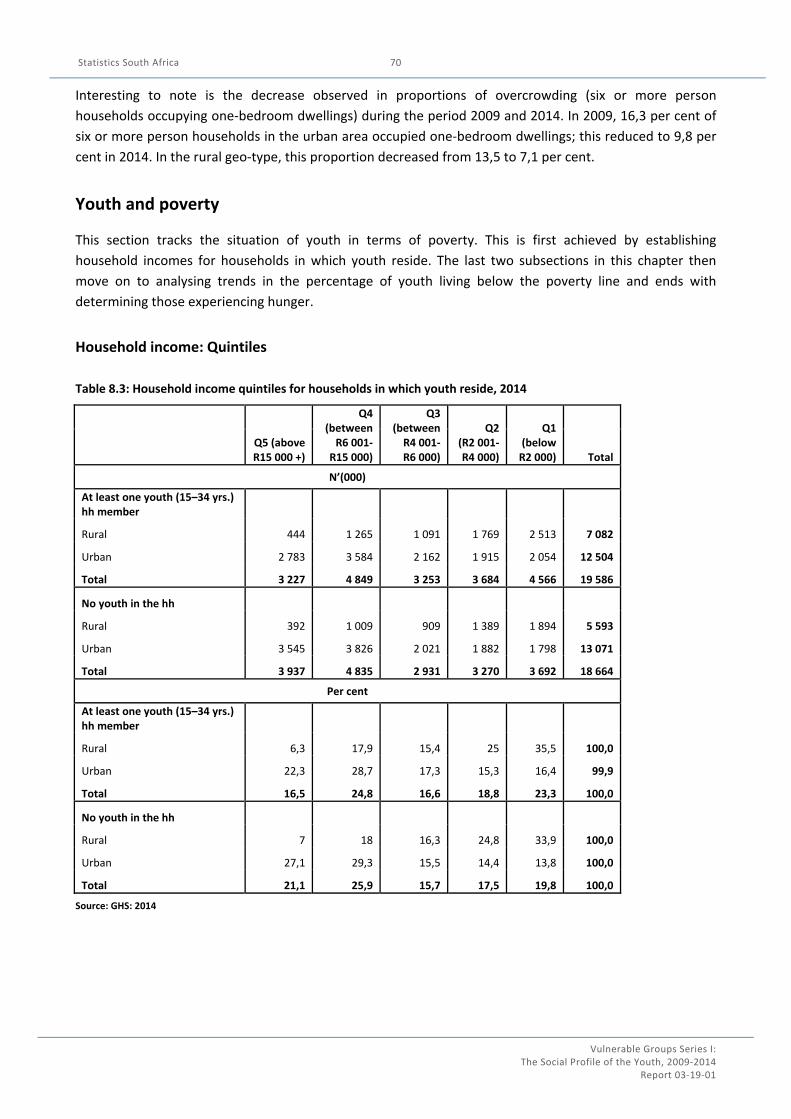
Statistics South Africa
Vulnerable Groups Series I: The Social Profile of the Youth, 2009‐2014
Report 03‐19‐01
70
Interesting to note is the decrease observed in proportions of overcrowding (six or more person
households occupying one‐bedroom dwellings) during the period 2009 and 2014. In 2009, 16,3 per cent of
six or more person households in the urban area occupied one‐bedroom dwellings; this reduced to 9,8 per
cent in 2014. In the rural geo‐type, this proportion decreased from 13,5 to 7,1 per cent.
Youth and poverty
This section tracks the situation of youth in terms of poverty. This is first achieved by establishing
household incomes for households in which youth reside. The last two subsections in this chapter then
move on to analysing trends in the percentage of youth living below the poverty line and ends with
determining those experiencing hunger.
Household income: Quintiles
Table 8.3: Household income quintiles for households in which youth reside, 2014
Q5 (above R15 000 +)
Q4 (between R6 001‐
R15 000)
Q3 (between R4 001‐R6 000)
Q2 (R2 001‐R4 000)
Q1 (below R2 000) Total
N’(000)
At least one youth (15–34 yrs.) hh member
Rural 444 1 265 1 091 1 769 2 513 7 082
Urban 2 783 3 584 2 162 1 915 2 054 12 504
Total 3 227 4 849 3 253 3 684 4 566 19 586
No youth in the hh
Rural 392 1 009 909 1 389 1 894 5 593
Urban 3 545 3 826 2 021 1 882 1 798 13 071
Total 3 937 4 835 2 931 3 270 3 692 18 664
Per cent
At least one youth (15–34 yrs.) hh member
Rural 6,3 17,9 15,4 25 35,5 100,0
Urban 22,3 28,7 17,3 15,3 16,4 99,9
Total 16,5 24,8 16,6 18,8 23,3 100,0
No youth in the hh
Rural 7 18 16,3 24,8 33,9 100,0
Urban 27,1 29,3 15,5 14,4 13,8 100,0
Total 21,1 25,9 15,7 17,5 19,8 100,0
Source: GHS: 2014
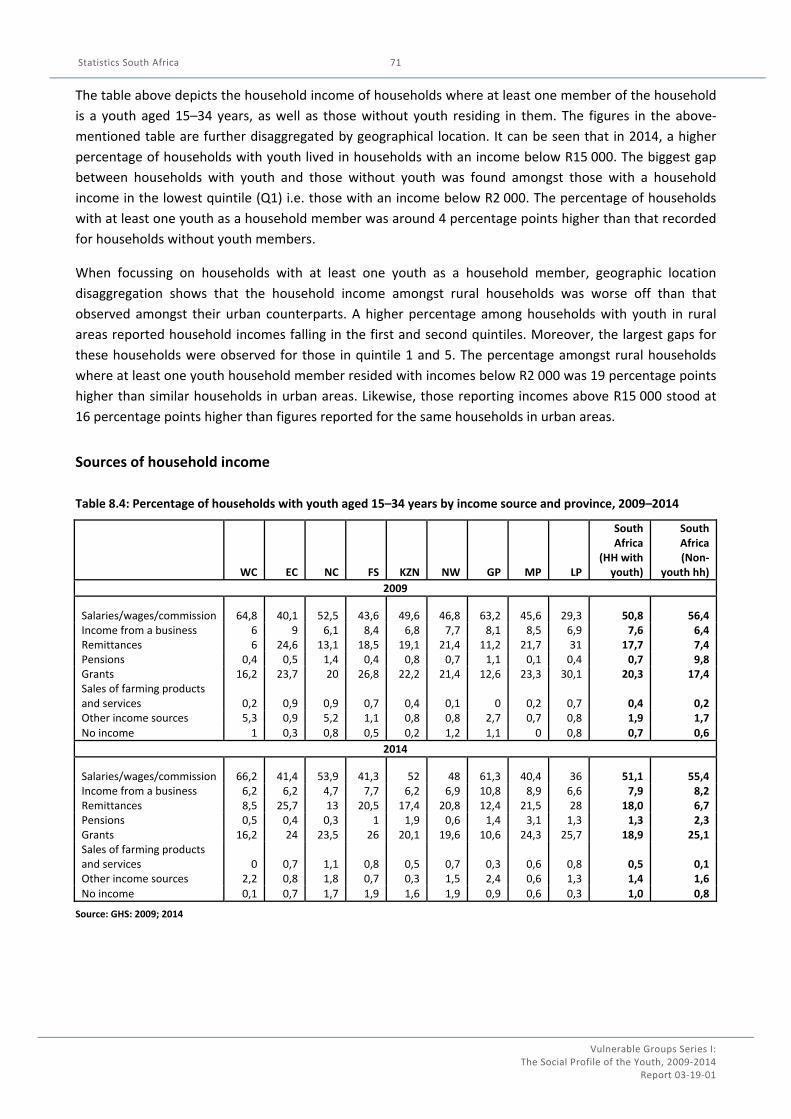
Statistics South Africa
Vulnerable Groups Series I: The Social Profile of the Youth, 2009‐2014
Report 03‐19‐01
71
The table above depicts the household income of households where at least one member of the household
is a youth aged 15–34 years, as well as those without youth residing in them. The figures in the above‐
mentioned table are further disaggregated by geographical location. It can be seen that in 2014, a higher
percentage of households with youth lived in households with an income below R15 000. The biggest gap
between households with youth and those without youth was found amongst those with a household
income in the lowest quintile (Q1) i.e. those with an income below R2 000. The percentage of households
with at least one youth as a household member was around 4 percentage points higher than that recorded
for households without youth members.
When focussing on households with at least one youth as a household member, geographic location
disaggregation shows that the household income amongst rural households was worse off than that
observed amongst their urban counterparts. A higher percentage among households with youth in rural
areas reported household incomes falling in the first and second quintiles. Moreover, the largest gaps for
these households were observed for those in quintile 1 and 5. The percentage amongst rural households
where at least one youth household member resided with incomes below R2 000 was 19 percentage points
higher than similar households in urban areas. Likewise, those reporting incomes above R15 000 stood at
16 percentage points higher than figures reported for the same households in urban areas.
Sources of household income
Table 8.4: Percentage of households with youth aged 15–34 years by income source and province, 2009–2014
WC EC NC FS KZN NW GP MP LP
South Africa
(HH with youth)
South Africa (Non‐
youth hh)
2009
Salaries/wages/commission 64,8 40,1 52,5 43,6 49,6 46,8 63,2 45,6 29,3 50,8 56,4 Income from a business 6 9 6,1 8,4 6,8 7,7 8,1 8,5 6,9 7,6 6,4 Remittances 6 24,6 13,1 18,5 19,1 21,4 11,2 21,7 31 17,7 7,4 Pensions 0,4 0,5 1,4 0,4 0,8 0,7 1,1 0,1 0,4 0,7 9,8 Grants 16,2 23,7 20 26,8 22,2 21,4 12,6 23,3 30,1 20,3 17,4 Sales of farming products and services 0,2 0,9 0,9 0,7 0,4 0,1 0 0,2 0,7 0,4 0,2 Other income sources 5,3 0,9 5,2 1,1 0,8 0,8 2,7 0,7 0,8 1,9 1,7
No income 1 0,3 0,8 0,5 0,2 1,2 1,1 0 0,8 0,7 0,6
2014
Salaries/wages/commission 66,2 41,4 53,9 41,3 52 48 61,3 40,4 36 51,1 55,4 Income from a business 6,2 6,2 4,7 7,7 6,2 6,9 10,8 8,9 6,6 7,9 8,2 Remittances 8,5 25,7 13 20,5 17,4 20,8 12,4 21,5 28 18,0 6,7 Pensions 0,5 0,4 0,3 1 1,9 0,6 1,4 3,1 1,3 1,3 2,3 Grants 16,2 24 23,5 26 20,1 19,6 10,6 24,3 25,7 18,9 25,1 Sales of farming products and services 0 0,7 1,1 0,8 0,5 0,7 0,3 0,6 0,8 0,5 0,1 Other income sources 2,2 0,8 1,8 0,7 0,3 1,5 2,4 0,6 1,3 1,4 1,6
No income 0,1 0,7 1,7 1,9 1,6 1,9 0,9 0,6 0,3 1,0 0,8
Source: GHS: 2009; 2014
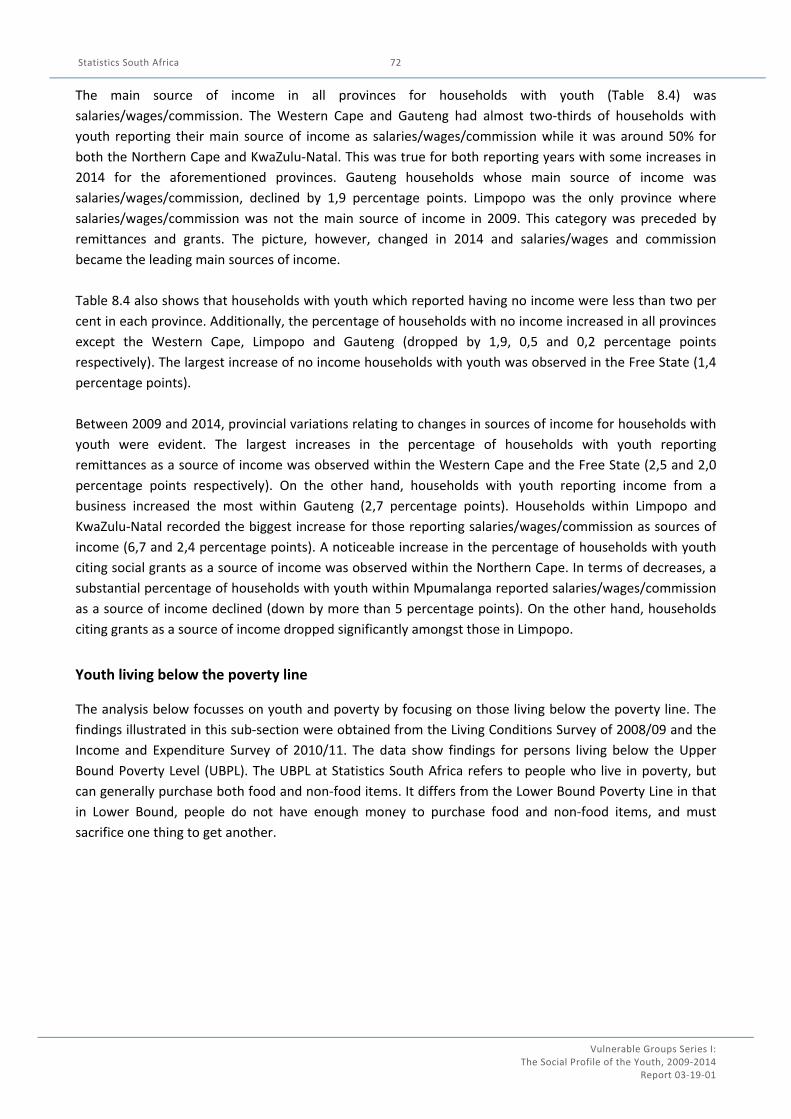
Statistics South Africa
Vulnerable Groups Series I: The Social Profile of the Youth, 2009‐2014
Report 03‐19‐01
72
The main source of income in all provinces for households with youth (Table 8.4) was
salaries/wages/commission. The Western Cape and Gauteng had almost two‐thirds of households with
youth reporting their main source of income as salaries/wages/commission while it was around 50% for
both the Northern Cape and KwaZulu‐Natal. This was true for both reporting years with some increases in
2014 for the aforementioned provinces. Gauteng households whose main source of income was
salaries/wages/commission, declined by 1,9 percentage points. Limpopo was the only province where
salaries/wages/commission was not the main source of income in 2009. This category was preceded by
remittances and grants. The picture, however, changed in 2014 and salaries/wages and commission
became the leading main sources of income.
Table 8.4 also shows that households with youth which reported having no income were less than two per
cent in each province. Additionally, the percentage of households with no income increased in all provinces
except the Western Cape, Limpopo and Gauteng (dropped by 1,9, 0,5 and 0,2 percentage points
respectively). The largest increase of no income households with youth was observed in the Free State (1,4
percentage points).
Between 2009 and 2014, provincial variations relating to changes in sources of income for households with
youth were evident. The largest increases in the percentage of households with youth reporting
remittances as a source of income was observed within the Western Cape and the Free State (2,5 and 2,0
percentage points respectively). On the other hand, households with youth reporting income from a
business increased the most within Gauteng (2,7 percentage points). Households within Limpopo and
KwaZulu‐Natal recorded the biggest increase for those reporting salaries/wages/commission as sources of
income (6,7 and 2,4 percentage points). A noticeable increase in the percentage of households with youth
citing social grants as a source of income was observed within the Northern Cape. In terms of decreases, a
substantial percentage of households with youth within Mpumalanga reported salaries/wages/commission
as a source of income declined (down by more than 5 percentage points). On the other hand, households
citing grants as a source of income dropped significantly amongst those in Limpopo.
Youth living below the poverty line
The analysis below focusses on youth and poverty by focusing on those living below the poverty line. The
findings illustrated in this sub‐section were obtained from the Living Conditions Survey of 2008/09 and the
Income and Expenditure Survey of 2010/11. The data show findings for persons living below the Upper
Bound Poverty Level (UBPL). The UBPL at Statistics South Africa refers to people who live in poverty, but
can generally purchase both food and non‐food items. It differs from the Lower Bound Poverty Line in that
in Lower Bound, people do not have enough money to purchase food and non‐food items, and must
sacrifice one thing to get another.
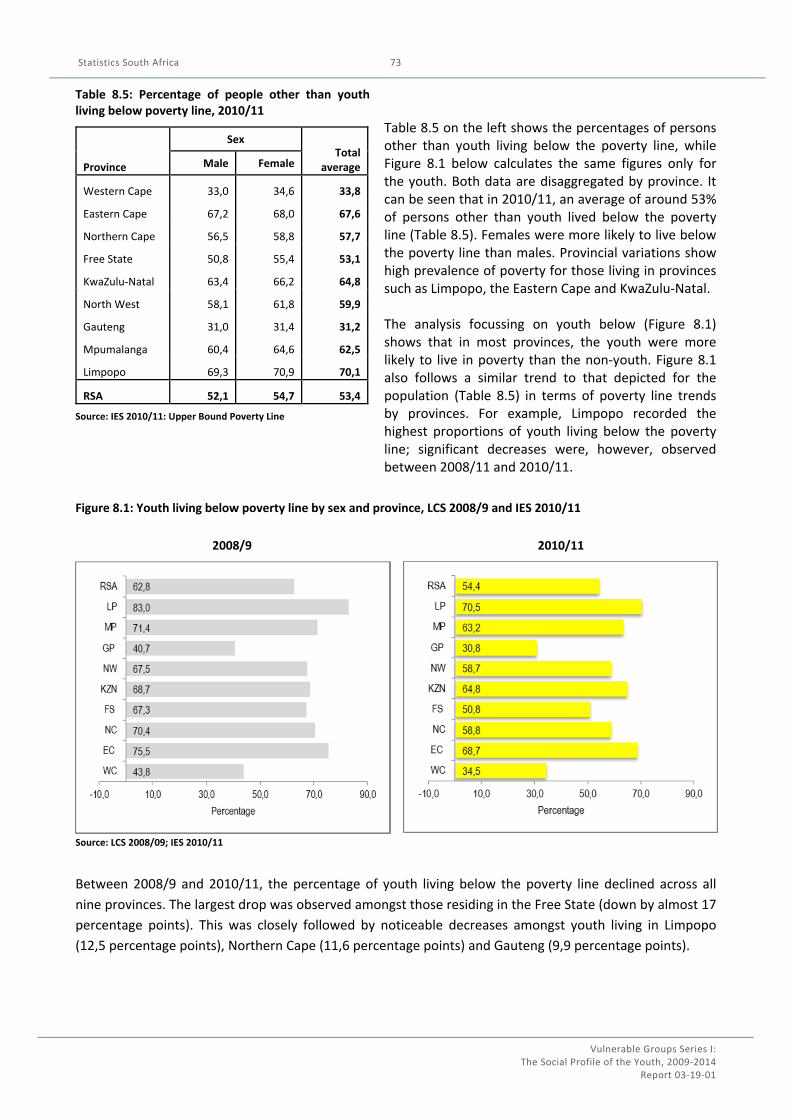
Statistics South Africa
Vulnerable Groups Series I: The Social Profile of the Youth, 2009‐2014
Report 03‐19‐01
73
Table 8.5: Percentage of people other than youthliving below poverty line, 2010/11
Province
Sex Total
average Male Female
Western Cape 33,0 34,6 33,8
Eastern Cape 67,2 68,0 67,6
Northern Cape 56,5 58,8 57,7
Free State 50,8 55,4 53,1
KwaZulu‐Natal 63,4 66,2 64,8
North West 58,1 61,8 59,9
Gauteng 31,0 31,4 31,2
Mpumalanga 60,4 64,6 62,5
Limpopo 69,3 70,9 70,1
RSA 52,1 54,7 53,4
Source: IES 2010/11: Upper Bound Poverty Line
Table 8.5 on the left shows the percentages of persons other than youth living below the poverty line, while Figure 8.1 below calculates the same figures only for the youth. Both data are disaggregated by province. It can be seen that in 2010/11, an average of around 53% of persons other than youth lived below the poverty line (Table 8.5). Females were more likely to live below the poverty line than males. Provincial variations show high prevalence of poverty for those living in provinces such as Limpopo, the Eastern Cape and KwaZulu‐Natal. The analysis focussing on youth below (Figure 8.1) shows that in most provinces, the youth were more likely to live in poverty than the non‐youth. Figure 8.1 also follows a similar trend to that depicted for the population (Table 8.5) in terms of poverty line trends by provinces. For example, Limpopo recorded the highest proportions of youth living below the poverty line; significant decreases were, however, observed between 2008/11 and 2010/11.
Figure 8.1: Youth living below poverty line by sex and province, LCS 2008/9 and IES 2010/11
2008/9 2010/11
Source: LCS 2008/09; IES 2010/11
Between 2008/9 and 2010/11, the percentage of youth living below the poverty line declined across all
nine provinces. The largest drop was observed amongst those residing in the Free State (down by almost 17
percentage points). This was closely followed by noticeable decreases amongst youth living in Limpopo
(12,5 percentage points), Northern Cape (11,6 percentage points) and Gauteng (9,9 percentage points).
Statistics South Africa
Vulnerable Groups Series I: The Social Profile of the Youth, 2009‐2014
Report 03‐19‐01
74
Households that experienced hunger
Figure 8.2: Youth in households that experienced hunger by province, 2010 and 2014
Source: GHS 2010; 2014
Table 8.6: Percentage of households without youth members experiencing hunger, 2014
No hunger Hunger
WC 84,9 15,1
EC 82,6 17,4
NC 81,9 18,1
FS 89,5 10,5
KZN 82,0 18,0
NW 83,4 16,6
GP 91,9 8,1
MP 89,4 10,6
LP 93,8 6,2
RSA 87,1 12,9 Source: GHS 2014
Table 8.6 to the left shows that in 2014, the percentage of households with no youth members who reported experiences of hunger was 12,9%. The highest percentages were observed in KwaZulu‐Natal, Northern Cape and the Eastern Cape. Figure 8.2 above, however, indicates that in the same year (2014), the figure for households with at least one youth household member reporting experiences of hunger was more than 3 percentage points higher than that reported for households without youth members.
The analysis on households with youth and experiences of hunger above (Figure 8.2) further shows that in 2010 the highest percentages of such households were found mainly in Northern Cape (19,4%), Eastern Cape (18,6%) and KwaZulu‐Natal (18,2%). Those least likely to report hunger were observed in Limpopo (6,1%), Gauteng (7,9%) and Mpumalanga (11%). Household hunger experiences increased between 2010 and 2014, mostly in the Northern Cape and the Eastern Cape (by around 10 and 6 percentage points, respectively).
Interestingly, increases were also observed in provinces that reported the least hunger in 2010, with 2,1%
in Limpopo, 1,9% in Gauteng and 1,6% in Mpumalanga.
Statistics South Africa
Vulnerable Groups Series I: The Social Profile of the Youth, 2009‐2014
Report 03‐19‐01
75
CHAPTER 9: CONCLUSION
The purpose of this report was to provide analyses relating to the situation of the youth in this country.
Different chapters in the report covered various demographic and socio‐economic characteristics of the
youth. Various areas where good progress has been made as well as continued concerns and challenges
were identified.
In terms of the demographic profile of the youth, the period between 2009 and 2014 saw the percentage of
the youth population (those aged 15–34 years) in South Africa growing from 18,5 million to 19,6 million. In
general, all South African provinces experienced positive growth for both the general and youth population.
However, the youth population grew more rapidly than the general population in most provinces, except in
Western Cape, Gauteng and North West. This resulted in a lower percentage growth observed among the
youth population (6,0%) compared to that found for adults (6,9%).
The growth observed in the youth population was mostly driven by those aged 25–34 years which
increased by 7,9% (vs. 4,3% observed for those between 15–24 years). In addition, the black African
population group recorded the biggest increase (by 7,3%) and contributed the most to the youth bulge
between 2009 and 2014. The white youth population declined by 4,2%.
In terms of migration patterns, Chapter 3 showed that in 2014, over three‐quarters of young people
continued to live in their provinces of birth. However, Eastern Cape and Limpopo lost larger proportions of
their youth to other provinces as their retention percentages were just over two‐thirds compared to other
provinces. Gauteng, Western Cape, North West and Mpumalanga provinces had the highest in‐migration
rates compared to other provinces.
In relation to household characteristics (Chapter 4), the analysis in the report showed that households
headed by youth accounted for 26,1% in 2014. Those aged 25–34 years accounted for a higher percentage
of youth‐headed households (20,5%) compared to their younger counterparts (15–24 years) at 5,6%. The
share of youth‐headed households was higher for those in urban areas compared to rural areas (70,1% vs.
29,9%). Youth‐headed households increased in urban areas during that period while a decline was recorded
in rural areas (1,8 percentage points respectively). The findings further showed that the majority of youth
household heads were males for both urban and rural areas. Male‐headed households in both urban and
rural areas increased by 0,2 and 2,9 percentage points respectively.
When the data was examined in relation to household composition trends and factors of intergeneration,
compared to youth from other population groups, white and Indian/Asian youth were most likely to live in
single‐generation households. Black African and coloured youth were more likely to live in third or more
generation households, relative to Indian/Asian and white youth. Although the proportions of youth living
in skip‐generation households declined slightly, black Africans were still more likely to live in this type of
household compared to other population groups. Lastly, in 2010/2011, expenditure on housing, water,
electricity, gas and other fuels were the largest contributors to total annual household consumption
expenditure amongst youth. The lowest expenditure amongst both age groups was on health.
The second half of the report (Chapters 5–8) dealt with employment, crime, health and poverty. In terms of
the participation of the youth, the primary labour market concern is the high rate of unemployment among
youth. The share of unemployed youth remained persistent at around 70% of the unemployed. High rates
of unemployment among youth are also reflected in higher prevalence of poverty as shown in Chapter 8.
Statistics South Africa
Vulnerable Groups Series I: The Social Profile of the Youth, 2009‐2014
Report 03‐19‐01
76
On the bright side, the share of unemployed youth dropped by almost 5 percentage points between 2009
and 2014. Although youth aged between 25–34 years continued to contribute the biggest share of
unemployed youth in 2014, the decline in the total share of youth unemployment was driven by younger
persons between the ages of 15–24 years (declined by 4,1 percentage points). This was considerably higher
when compared to a drop of 0,6 of a percentage point recorded for their older counterparts (25–34 years).
Efforts directed towards tackling the scourge of youth unemployment have to address structural factors
contributing to this troubling phenomenon. The structural factors mentioned above relate mainly to
education, skills insofar as work experience is concerned and race. For example, Chapter 5 showed that
unemployed youth were mostly most likely to have a highest level of education of less than matric.
Moreover, the share of unemployed young people with less than matric remained unchanged at 57% over
the last five years of reporting (2009 and 2014). Also, of the 3,7 million unemployed youth in 2014, only 1,6
million (or 48,3%) had worked before, a decline of less than 1 percentage point (0,8) compared to five years
earlier (i.e. 49,2% in 2009). Internship and entrepreneurship are some of the policy measures geared
towards decreasing youth unemployment and skills development. However, the total share of young
entrepreneurs declined by 2,7 percentage points between 2009 and 2014. This was driven mostly by a
larger decrease amongst female entrepreneurs (down by 6,2 percentage points) than males (down by 0,9).
Lastly, historical racial aspects continue to define employment outcomes in that, for both years of
reporting, the largest share of the unemployed youth was found amongst the coloured and black African
population groups. On the positive side, the shares of both black African and coloured unemployed youth
declined between 2009 and 2014 (declines of 5,1 and 3,6 percentage points, respectively).The above‐
mentioned elements of youth unemployment are linked to worrying trends observed in labour force
participation rates, inactivity rates and discouraged work‐seekers. For example, between 2009 and 2014,
labour force participation rates (LFPR) amongst adults increased slightly by 0,6 of a percentage point, while
that observed amongst youth declined by 1,9 percentage points; the inactivity rate amongst youth has
remained stubborn at approximately 27,0% from 2010 to 2014; and an increase in the share of discouraged
work‐seekers amongst the youth declined from 32% in 2009 to 35% in 2014. These trends could have
detrimental effects on the future work force of this country.
Insofar as social factors are concerned, issues involving youth and crime are of particular importance. This
report showed (Chapter 6) that youth were persistently more likely to be victims and/or perpetrators of
assault, robbery and theft of property than adults. In both 2011 and 2013/14, younger youth between the
ages of 16–24 years were more likely to be victims of assault and property theft crimes, while those
experiencing robbery were older (25–34 years). Gender variations were also observed in terms of young
victims of crime. In 2013/14, in most provinces, males were more likely to be victims of assault than their
female counterparts. The highest percentage share of female victims was found amongst youth living in
Eastern Cape (55,7%), followed by amongst those residing in the Limpopo (52,7%) and Gauteng (47,1%).
Further geographical trends showed that the share of youth victims (16–34 years) of assault increased the
most for those living in Free State and the Eastern Cape. In terms of robbery, the percentage of young
people experiencing robbery declined in five of the nine provinces (North West, Eastern Cape, Northern
Cape, Gauteng and KwaZulu‐Natal). Also, between 2012 and 2013/14, the percentage of youth victims of
property theft declined the most for those living in Gauteng and Limpopo (down by 3,2 and 2,9 percentage
points respectively).
Statistics South Africa
Vulnerable Groups Series I: The Social Profile of the Youth, 2009‐2014
Report 03‐19‐01
77
In terms of perpetrators, results discussed in this report revealed a higher percentage of youth recorded as
perpetrators of assault, robbery and property theft crimes than adults. There was a decrease in the period
2012/13 and 2013/14 in youth assault and robbery perpetrators (4,1 and 5,4 percentage points
respectively), while a noticeable increase of over 16 percentage points was observed among those
committing assault.
Lastly, Chapter 7 examined the causes of death pertaining to youth. The percentages of youth deaths
during 2008 and 2013 were less than that observed for the total population. Youth made up 21,1% of all
recorded deaths for 2008. This percentage decreased to 16,4% in 2013 (16,9% for males and 15,9% for
females). The two leading causes of death amongst youth were ‘certain infectious and parasitic disease’
(e.g. tuberculosis (TB), intestinal infectious diseases, HIV, viral diseases) and “external causes of morbidity
and mortality’ (i.e. unnatural death e.g. car accidents, murder). Male youths mainly succumbed to “external
causes of morbidity and mortality’ in both 2008 (34,7%)and 2013 (43,2%). The main cause of death for
female youth was found to be ‘certain infectious and parasitic disease’ – 43,8% in 2008 and 44,8% in 2013.
The deaths of both male and female youth increased year‐by‐year as they progressed in age.
Recommendations
This section provides recommendations for some of the issues highlighted in the report.
Youth and unemployment
The analysis of this report revealed that the youth population has grown by 6,0% between 2009 and 2014,
which should be a good sign in terms of the demographic development of the country. The country is
currently experiencing a youth bulge: a demographic dividend that can be leveraged on. For the
demographic dividend to materialise, there must be in place a conducive policy environment, including:
sufficient flexibility in the labour market to allow its expansion through creation of adequate employment
opportunities; macroeconomic policies that permit and encourage investment. However, the analysis of
this report showed that the youth continue to bear the brunt of high levels of unemployment when
compared to adults. This was evidenced by persistent high unemployment rates among the youth. The
plight of rural provinces was reflected by the fact that youth from rural areas experienced even higher
unemployment levels than youth from urban areas (37,2% vs. 35,5%). This can be expected considering the
slower‐paced economic development in rural areas, which in turn lead to higher proportions of young
people migrating to big cities (see migration section) in pursuit of better economic prospects. In terms of
gender disparities, females continue to have high levels of unemployment when compared to their male
counterparts. This was also evident in the declining levels of entrepreneurship among young people which
saw females experiencing a bigger percentage point decrease than males (6,2% compared to 0,9%. Levels
of education and work experience are still the major catalysts for employment market penetration. The
following recommendations are suggested in terms of youth and unemployment:
Encourage and improve on the implementation of programmes that promote internship
opportunities.
Create enabling environments that attract young people into starting businesses. The report
showed a decline in entrepreneurs in the country. Small businesses can provide new employment
opportunities and contribute to the growth of the country’s economy.
Encourage rural development to bridge the gap between urban and rural economies in terms of
employment.
Statistics South Africa
Vulnerable Groups Series I: The Social Profile of the Youth, 2009‐2014
Report 03‐19‐01
78
Accelerate the implementation of some policies that will promptly advocate for gender equality
and women empowerment. The analysis revealed that women are still confronted by high levels of
unemployment when compared to men. The country has made some strides in some aspects
concerning this issue. However, a lot can still be done to ensure that women do not continue to be
the marginalised group.
Youth and crime
The findings in this report showed that young people constitute the majority of both victims and
perpetrators of crime in the country. The analysis revealed that assault, robbery and property theft were
more prevalent among young people than for adults. Of these, assault and robbery among youth was on
the rise. Young males were more likely to be victims than their female counterparts in most provinces
except in the Eastern Cape and Limpopo. In terms of age differences, younger youth (16 to 24 years) were
particularly vulnerable to assault and property theft. Older youth (25 to 34 years) were more vulnerable to
robbery. Research has indicated that the youth face high risks of being vulnerable to crime due to two main
factors: the indirect association between crime and unemployment, and due to the fact that they are more
mobile in nature. It is therefore recommended that:
Supportive environments which will enable victims to feel part of the criminal justice system be
created so as to allow young people to become a part of efforts aimed at finding solutions to crime.
Promote socio‐economic stability: persistent unemployment and low levels of incomes among the
young that could increase the likelihood of their involvement in criminal activities.
Establish and increase access to a wide range of recreational facilities and services of particular
interest to young people.
Youth and poverty
A higher percentage of households with youth in rural areas was likely to report household incomes falling
in the first and second quintiles, i.e. those falling below R2 000 (quintile 1) and between R2 001 and R4 001
(quintile 2). Across all provinces, higher proportions of households with youth indicated a greater reliance
on salaries/wages/commission, followed by social grants. These results could also be linked to the high
levels of unemployment observed among young people. Although the percentage of youth living below the
poverty line declined between 2008/9 and 2010/11, female youth continued to be most likely to live below
the poverty line. In light of the discussion above, the following interventions are recommended:
Provide vocational skills for unemployed youth, school leavers and graduates of tertiary
institutions. This will improve the chances of young people to penetrate the labour market,
whether as the self‐employed (which will lower heavy reliance on salaries/wages) or as employees.
Creating employment amongst youth will have a great impact on lowering the burden on the social
grant system.
Create an enabling environment that will propel young people to consider education as the best
tool to poverty alleviation.
Statistics South Africa
Vulnerable Groups Series I: The Social Profile of the Youth, 2009‐2014
Report 03‐19‐01
79
Youth and health
Insofar as health outcomes are concerned, particular attention was given to the leading causes of death
among the youth. The results showed that while the percentages of youth deaths during 2008 and 2013
were less than that observed for the total population, an unacceptable high percentage of young people
died from ‘certain infectious and parasitic diseases’ as well as ‘external causes of morbidity and mortality’
(mostly males). As indicated above, “Certain infectious and parasitic diseases” include but are not limited
to: intestinal infectious diseases, TB and HIV. It is therefore recommended that:
Sexual and reproductive health education should continue to remain a focus of all stakeholders in
health care for the youth, educating particularly from a younger age. This will ensure that young
people receive regular messages that could lead to sexual behavioural changes over time.
External causes of morbidity and mortality can be mitigated by ensuring that young people have
access to life skills training, advocating positive responsible behaviour and promoting parental
involvement in the lives of young people.
APPENDIX
YOUTH INDICATORS

1. DEMOGRAPHY
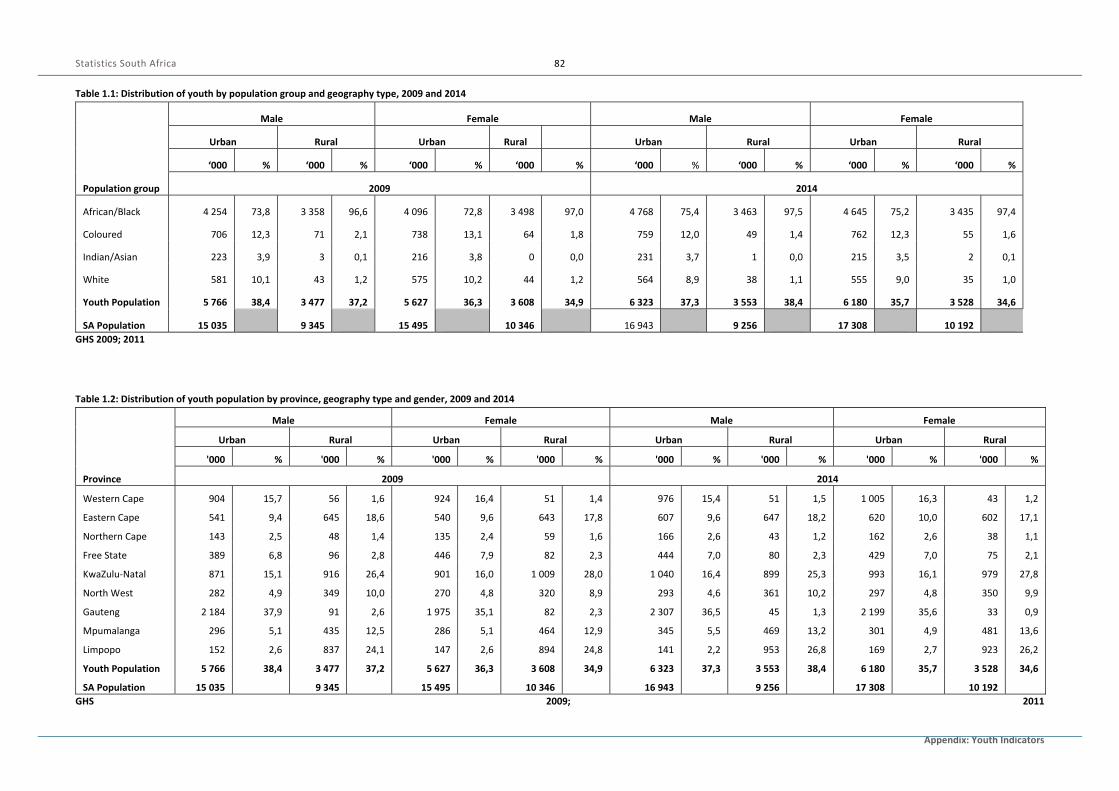
Statistics South Africa
Appendix: Youth Indicators
82
Table 1.1: Distribution of youth by population group and geography type, 2009 and 2014
Population group
Male Female Male Female
Urban Rural Urban Rural Urban Rural Urban Rural
‘000 % ‘000 % ‘000 % ‘000 % ‘000 % ‘000 % ‘000 % ‘000 %
2009 2014
African/Black 4 254 73,8 3 358 96,6 4 096 72,8 3 498 97,0 4 768 75,4 3 463 97,5 4 645 75,2 3 435 97,4
Coloured 706 12,3 71 2,1 738 13,1 64 1,8 759 12,0 49 1,4 762 12,3 55 1,6
Indian/Asian 223 3,9 3 0,1 216 3,8 0 0,0 231 3,7 1 0,0 215 3,5 2 0,1
White 581 10,1 43 1,2 575 10,2 44 1,2 564 8,9 38 1,1 555 9,0 35 1,0
Youth Population 5 766 38,4 3 477 37,2 5 627 36,3 3 608 34,9 6 323 37,3 3 553 38,4 6 180 35,7 3 528 34,6
SA Population 15 035 9 345 15 495 10 346 16 943 9 256 17 308 10 192
GHS 2009; 2011
Table 1.2: Distribution of youth population by province, geography type and gender, 2009 and 2014
Province
Male Female Male Female
Urban Rural Urban Rural Urban Rural Urban Rural
'000 % '000 % '000 % '000 % '000 % '000 % '000 % '000 %
2009 2014
Western Cape 904 15,7 56 1,6 924 16,4 51 1,4 976 15,4 51 1,5 1 005 16,3 43 1,2
Eastern Cape 541 9,4 645 18,6 540 9,6 643 17,8 607 9,6 647 18,2 620 10,0 602 17,1
Northern Cape 143 2,5 48 1,4 135 2,4 59 1,6 166 2,6 43 1,2 162 2,6 38 1,1
Free State 389 6,8 96 2,8 446 7,9 82 2,3 444 7,0 80 2,3 429 7,0 75 2,1
KwaZulu‐Natal 871 15,1 916 26,4 901 16,0 1 009 28,0 1 040 16,4 899 25,3 993 16,1 979 27,8
North West 282 4,9 349 10,0 270 4,8 320 8,9 293 4,6 361 10,2 297 4,8 350 9,9
Gauteng 2 184 37,9 91 2,6 1 975 35,1 82 2,3 2 307 36,5 45 1,3 2 199 35,6 33 0,9
Mpumalanga 296 5,1 435 12,5 286 5,1 464 12,9 345 5,5 469 13,2 301 4,9 481 13,6
Limpopo 152 2,6 837 24,1 147 2,6 894 24,8 141 2,2 953 26,8 169 2,7 923 26,2
Youth Population 5 766 38,4 3 477 37,2 5 627 36,3 3 608 34,9 6 323 37,3 3 553 38,4 6 180 35,7 3 528 34,6
SA Population 15 035 9 345 15 495 10 346 16 943 9 256 17 308 10 192
GHS 2009; 2011
2. YOUTH MIGRATION
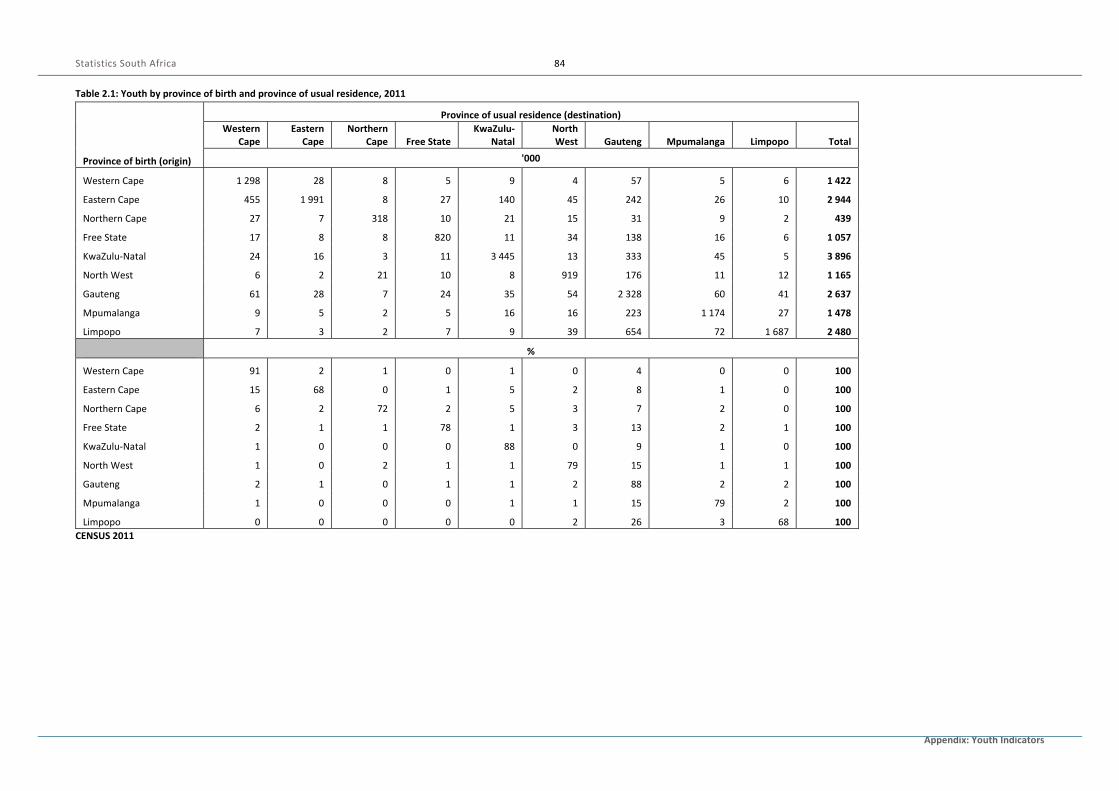
Statistics South Africa
Appendix: Youth Indicators
84
Table 2.1: Youth by province of birth and province of usual residence, 2011
Province of birth (origin)
Province of usual residence (destination)
Western Cape
Eastern Cape
Northern Cape Free State
KwaZulu‐Natal
North West Gauteng Mpumalanga Limpopo Total
'000
Western Cape 1 298 28 8 5 9 4 57 5 6 1 422
Eastern Cape 455 1 991 8 27 140 45 242 26 10 2 944
Northern Cape 27 7 318 10 21 15 31 9 2 439
Free State 17 8 8 820 11 34 138 16 6 1 057
KwaZulu‐Natal 24 16 3 11 3 445 13 333 45 5 3 896
North West 6 2 21 10 8 919 176 11 12 1 165
Gauteng 61 28 7 24 35 54 2 328 60 41 2 637
Mpumalanga 9 5 2 5 16 16 223 1 174 27 1 478
Limpopo 7 3 2 7 9 39 654 72 1 687 2 480
%
Western Cape 91 2 1 0 1 0 4 0 0 100
Eastern Cape 15 68 0 1 5 2 8 1 0 100
Northern Cape 6 2 72 2 5 3 7 2 0 100
Free State 2 1 1 78 1 3 13 2 1 100
KwaZulu‐Natal 1 0 0 0 88 0 9 1 0 100
North West 1 0 2 1 1 79 15 1 1 100
Gauteng 2 1 0 1 1 2 88 2 2 100
Mpumalanga 1 0 0 0 1 1 15 79 2 100
Limpopo 0 0 0 0 0 2 26 3 68 100
CENSUS 2011
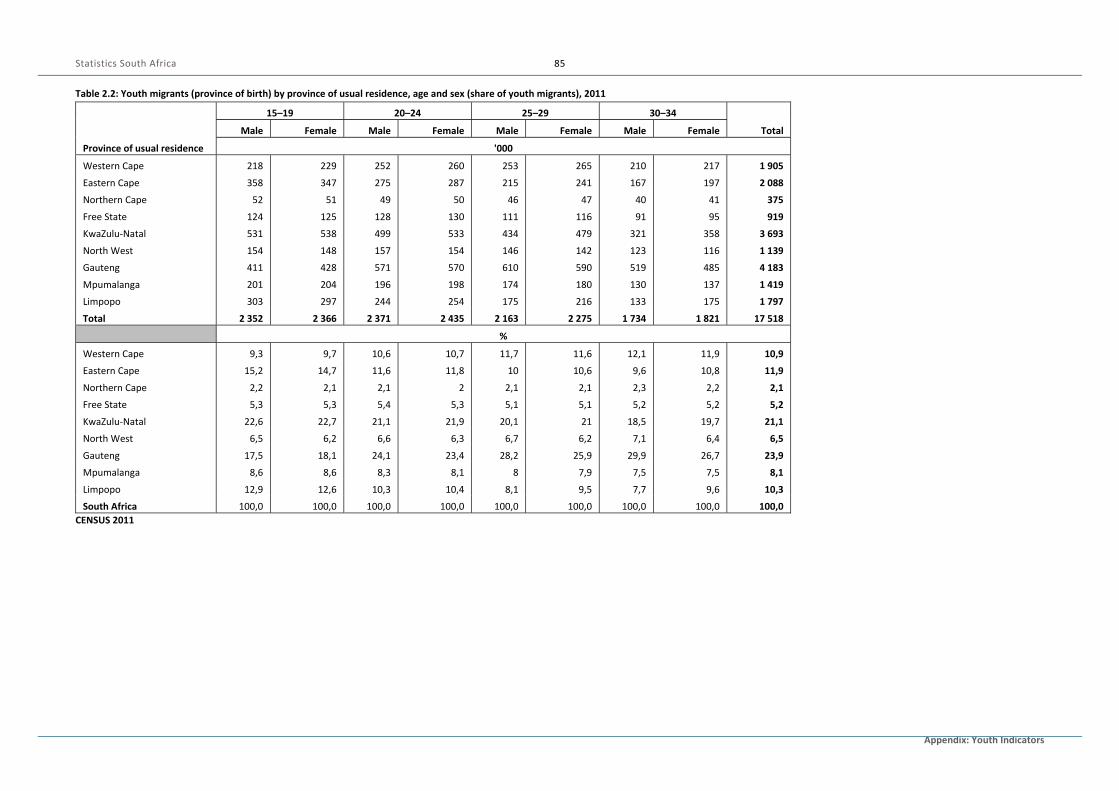
Statistics South Africa
Appendix: Youth Indicators
85
Table 2.2: Youth migrants (province of birth) by province of usual residence, age and sex (share of youth migrants), 2011
Province of usual residence
15–19 20–24 25–29 30–34
Total Male Female Male Female Male Female Male Female
'000
Western Cape 218 229 252 260 253 265 210 217 1 905
Eastern Cape 358 347 275 287 215 241 167 197 2 088
Northern Cape 52 51 49 50 46 47 40 41 375
Free State 124 125 128 130 111 116 91 95 919
KwaZulu‐Natal 531 538 499 533 434 479 321 358 3 693
North West 154 148 157 154 146 142 123 116 1 139
Gauteng 411 428 571 570 610 590 519 485 4 183
Mpumalanga 201 204 196 198 174 180 130 137 1 419
Limpopo 303 297 244 254 175 216 133 175 1 797
Total 2 352 2 366 2 371 2 435 2 163 2 275 1 734 1 821 17 518
%
Western Cape 9,3 9,7 10,6 10,7 11,7 11,6 12,1 11,9 10,9
Eastern Cape 15,2 14,7 11,6 11,8 10 10,6 9,6 10,8 11,9
Northern Cape 2,2 2,1 2,1 2 2,1 2,1 2,3 2,2 2,1
Free State 5,3 5,3 5,4 5,3 5,1 5,1 5,2 5,2 5,2
KwaZulu‐Natal 22,6 22,7 21,1 21,9 20,1 21 18,5 19,7 21,1
North West 6,5 6,2 6,6 6,3 6,7 6,2 7,1 6,4 6,5
Gauteng 17,5 18,1 24,1 23,4 28,2 25,9 29,9 26,7 23,9
Mpumalanga 8,6 8,6 8,3 8,1 8 7,9 7,5 7,5 8,1
Limpopo 12,9 12,6 10,3 10,4 8,1 9,5 7,7 9,6 10,3
South Africa 100,0 100,0 100,0 100,0 100,0 100,0 100,0 100,0 100,0
CENSUS 2011
3. HOUSEHOLD CHARACTERISTICS
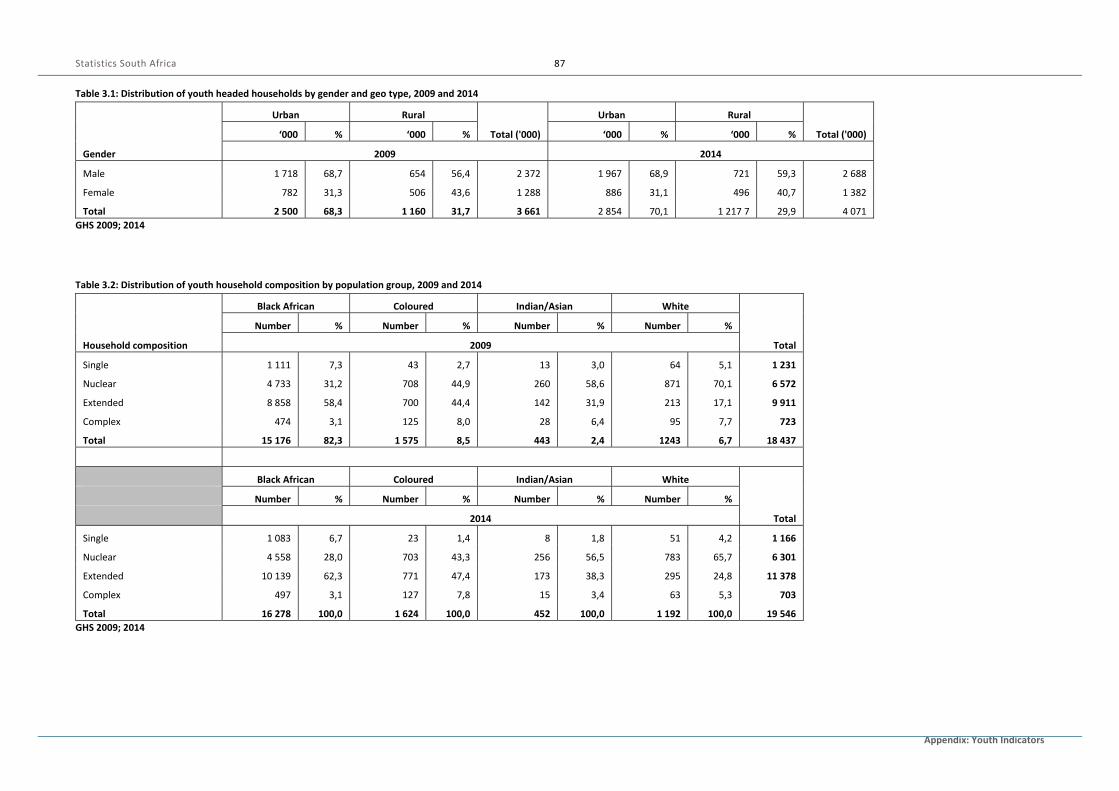
Statistics South Africa
Appendix: Youth Indicators
87
Table 3.1: Distribution of youth headed households by gender and geo type, 2009 and 2014
Gender
Urban Rural
Total ('000)
Urban Rural
Total ('000) ‘000 % ‘000 % ‘000 % ‘000 %
2009 2014
Male 1 718 68,7 654 56,4 2 372 1 967 68,9 721 59,3 2 688
Female 782 31,3 506 43,6 1 288 886 31,1 496 40,7 1 382
Total 2 500 68,3 1 160 31,7 3 661 2 854 70,1 1 217 7 29,9 4 071
GHS 2009; 2014
Table 3.2: Distribution of youth household composition by population group, 2009 and 2014
Household composition
Black African Coloured Indian/Asian White
Total
Number % Number % Number % Number %
2009
Single 1 111 7,3 43 2,7 13 3,0 64 5,1 1 231
Nuclear 4 733 31,2 708 44,9 260 58,6 871 70,1 6 572
Extended 8 858 58,4 700 44,4 142 31,9 213 17,1 9 911
Complex 474 3,1 125 8,0 28 6,4 95 7,7 723
Total 15 176 82,3 1 575 8,5 443 2,4 1243 6,7 18 437
Black African Coloured Indian/Asian White
Total
Number % Number % Number % Number %
2014
Single 1 083 6,7 23 1,4 8 1,8 51 4,2 1 166
Nuclear 4 558 28,0 703 43,3 256 56,5 783 65,7 6 301
Extended 10 139 62,3 771 47,4 173 38,3 295 24,8 11 378
Complex 497 3,1 127 7,8 15 3,4 63 5,3 703
Total 16 278 100,0 1 624 100,0 452 100,0 1 192 100,0 19 546
GHS 2009; 2014
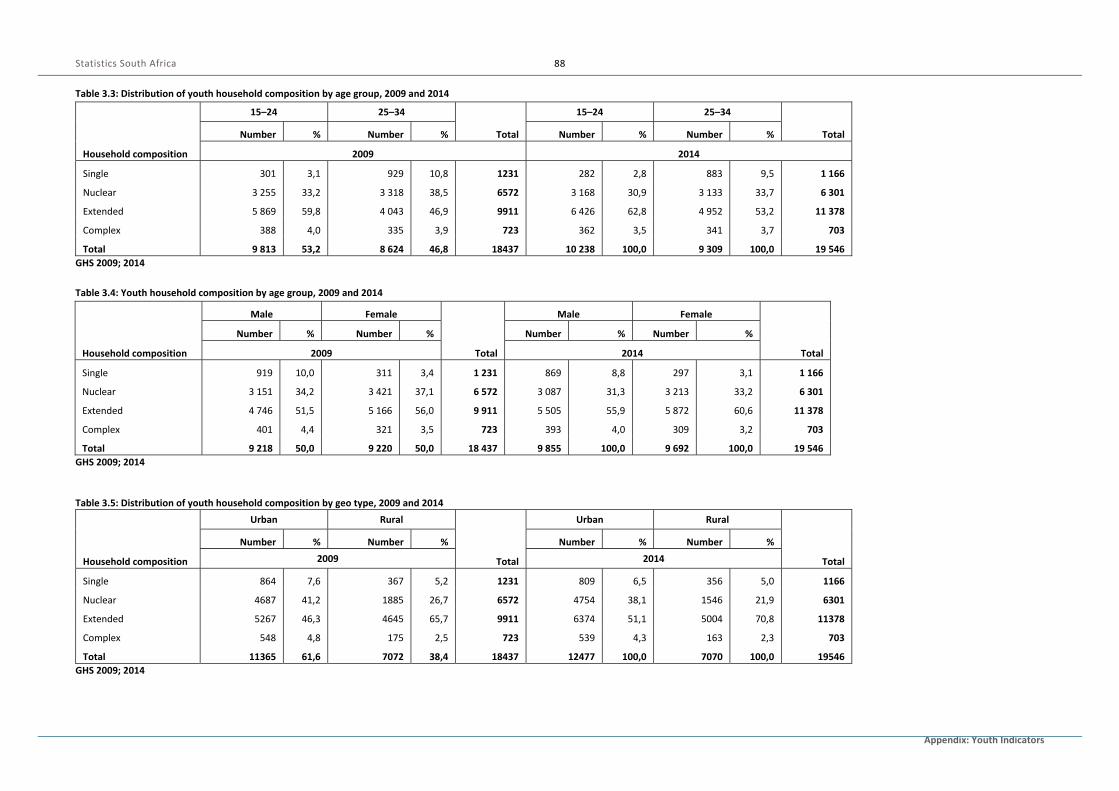
Statistics South Africa
Appendix: Youth Indicators
88
Table 3.3: Distribution of youth household composition by age group, 2009 and 2014
Household composition
15–24 25–34
Total
15–24 25–34
Total Number % Number % Number % Number %
2009 2014
Single 301 3,1 929 10,8 1231 282 2,8 883 9,5 1 166
Nuclear 3 255 33,2 3 318 38,5 6572 3 168 30,9 3 133 33,7 6 301
Extended 5 869 59,8 4 043 46,9 9911 6 426 62,8 4 952 53,2 11 378
Complex 388 4,0 335 3,9 723 362 3,5 341 3,7 703
Total 9 813 53,2 8 624 46,8 18437 10 238 100,0 9 309 100,0 19 546
GHS 2009; 2014
Table 3.4: Youth household composition by age group, 2009 and 2014
Household composition
Male Female
Total
Male Female
Total
Number % Number % Number % Number %
2009 2014
Single 919 10,0 311 3,4 1 231 869 8,8 297 3,1 1 166
Nuclear 3 151 34,2 3 421 37,1 6 572 3 087 31,3 3 213 33,2 6 301
Extended 4 746 51,5 5 166 56,0 9 911 5 505 55,9 5 872 60,6 11 378
Complex 401 4,4 321 3,5 723 393 4,0 309 3,2 703
Total 9 218 50,0 9 220 50,0 18 437 9 855 100,0 9 692 100,0 19 546
GHS 2009; 2014
Table 3.5: Distribution of youth household composition by geo type, 2009 and 2014
Household composition
Urban Rural
Total
Urban Rural
Total
Number % Number % Number % Number %
2009 2014
Single 864 7,6 367 5,2 1231 809 6,5 356 5,0 1166
Nuclear 4687 41,2 1885 26,7 6572 4754 38,1 1546 21,9 6301
Extended 5267 46,3 4645 65,7 9911 6374 51,1 5004 70,8 11378
Complex 548 4,8 175 2,5 723 539 4,3 163 2,3 703
Total 11365 61,6 7072 38,4 18437 12477 100,0 7070 100,0 19546
GHS 2009; 2014

Statistics South Africa
Appendix: Youth Indicators
89
Table 3.6: Distribution of youth across intergenerational households types by population group, 2009 and 2014
Intergenerational household type
Black African Coloured Indian/Asian White
Total
Number % Number % Number % Number %
2009
Single generation 1 794 14,7 116 9,1 31 9,1 123 12,4 2 064
Two generation 5 708 46,8 757 59,1 263 76,9 775 77,9 7 504
Three generation or more 3 884 31,8 357 27,9 35 10,3 87 8,8 4 364
Skip generation 812 6,7 52 4,0 13 3,8 9 0,9 885
Total 12 198 100,0 1 283 100,0 342 100 995 100 14 817
Black African Coloured Indian/Asian White
Total
Number % Number % Number % Number %
2014
Single generation 1 870 13,3 109 7,5 54 14,4 172 18,4 2 205
Two generation 6 525 46,5 848 58,9 273 72,4 659 70,5 8 305
Three generation or more 4 745 33,8 436 30,3 43 11,3 83 8,9 5 306
Skip generation 895 6,4 47 3,3 7 1,9 21 2,3 970
Total 14 034 100,0 1 439 100 376 100,0 936 100,0 16 786
GHS 2009; 2014
Table 3.7: Distribution of youth across intergenerational households types by gender, 2009 and 2014
Intergenerational household type
Male Female
Total
Male Female
Total Number % Number % Number % Number %
2009 2014
Single generation 1 059 15,5 1 005 12,6 2 064 1 150 14,9 1 055 11,7 2 205
Two generation 3 492 51,2 4 012 50,1 7 504 3 837 49,6 4 467 49,4 8 305
Three generation or more 1 854 27,2 2 510 31,4 4 364 2 279 29,5 3 028 33,5 5 306
Skip generation 409 6,0 476 6,0 885 468 6,1 502 970
Total 6 814 100,0 8 003 100,0 14 817 7 734 100,0 9 051 94,5 16 786
GHS 2009; 2014
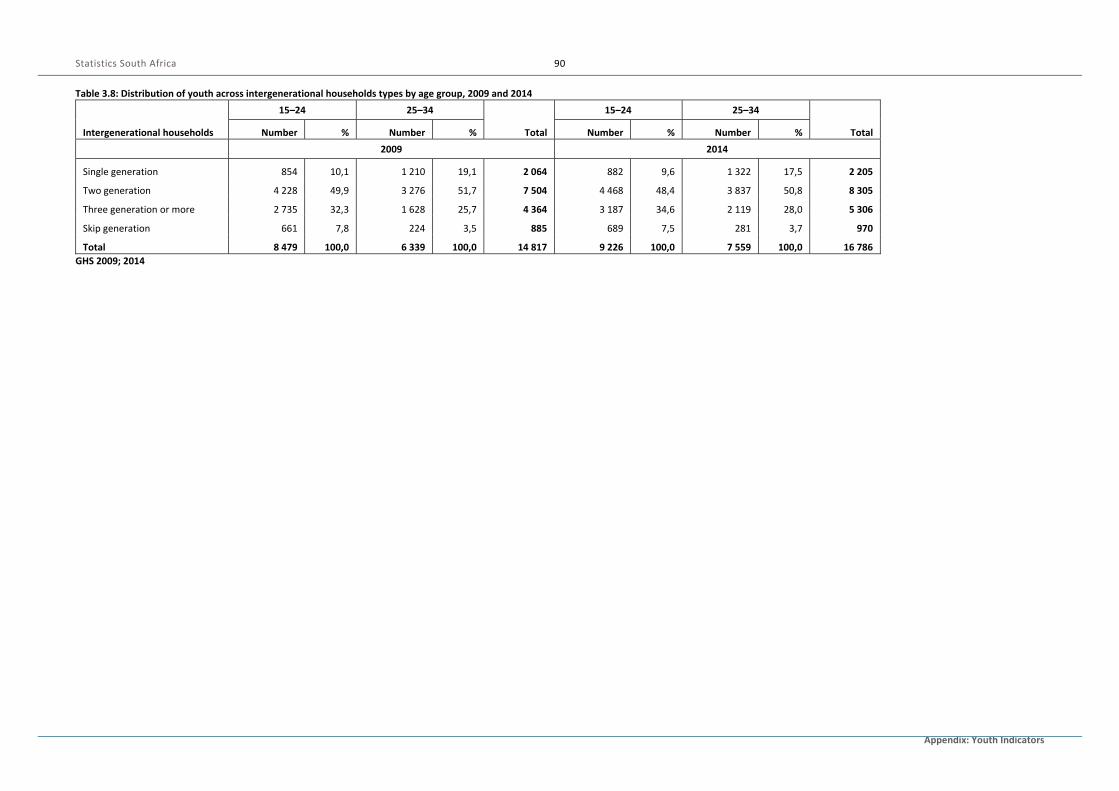
Statistics South Africa
Appendix: Youth Indicators
90
Table 3.8: Distribution of youth across intergenerational households types by age group, 2009 and 2014
Intergenerational households
15–24 25–34
Total
15–24 25–34
Total Number % Number % Number % Number %
2009 2014
Single generation 854 10,1 1 210 19,1 2 064 882 9,6 1 322 17,5 2 205
Two generation 4 228 49,9 3 276 51,7 7 504 4 468 48,4 3 837 50,8 8 305
Three generation or more 2 735 32,3 1 628 25,7 4 364 3 187 34,6 2 119 28,0 5 306
Skip generation 661 7,8 224 3,5 885 689 7,5 281 3,7 970
Total 8 479 100,0 6 339 100,0 14 817 9 226 100,0 7 559 100,0 16 786
GHS 2009; 2014

4. YOUTH LABOUR MARKET
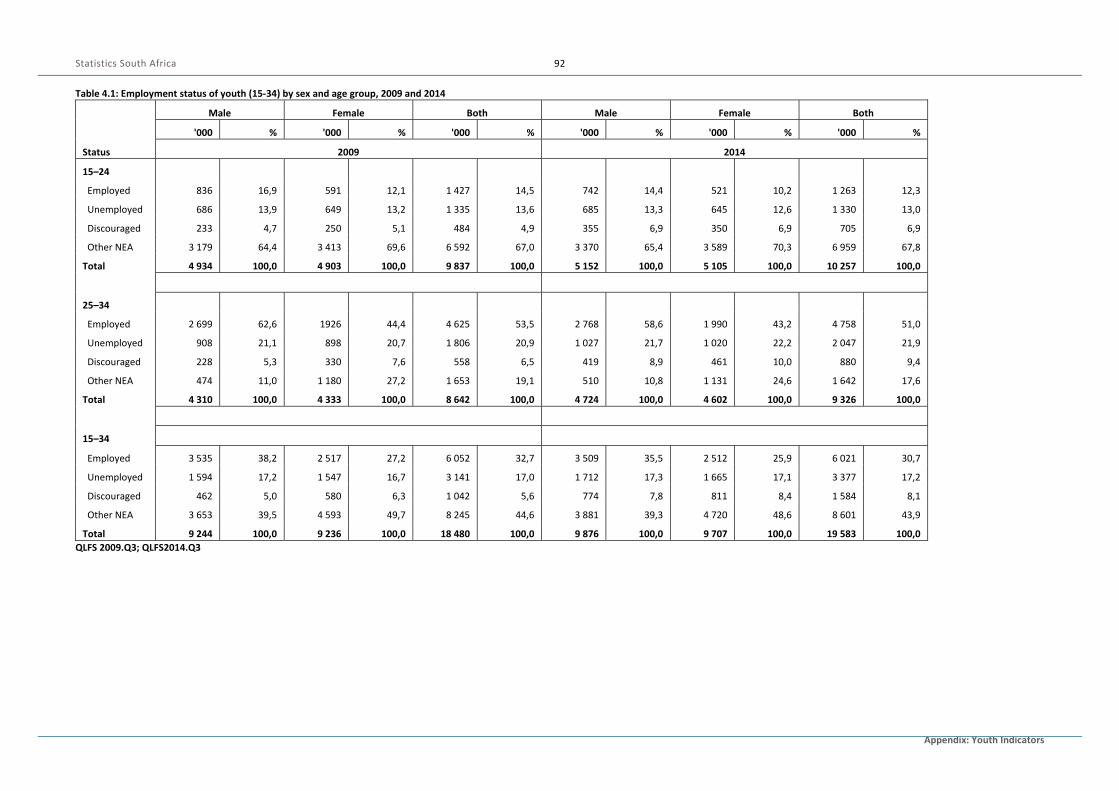
Statistics South Africa
Appendix: Youth Indicators
92
Table 4.1: Employment status of youth (15‐34) by sex and age group, 2009 and 2014
Status
Male Female Both Male Female Both
'000 % '000 % '000 % '000 % '000 % '000 %
2009 2014
15–24
Employed 836 16,9 591 12,1 1 427 14,5 742 14,4 521 10,2 1 263 12,3
Unemployed 686 13,9 649 13,2 1 335 13,6 685 13,3 645 12,6 1 330 13,0
Discouraged 233 4,7 250 5,1 484 4,9 355 6,9 350 6,9 705 6,9
Other NEA 3 179 64,4 3 413 69,6 6 592 67,0 3 370 65,4 3 589 70,3 6 959 67,8
Total 4 934 100,0 4 903 100,0 9 837 100,0 5 152 100,0 5 105 100,0 10 257 100,0
25–34
Employed 2 699 62,6 1926 44,4 4 625 53,5 2 768 58,6 1 990 43,2 4 758 51,0
Unemployed 908 21,1 898 20,7 1 806 20,9 1 027 21,7 1 020 22,2 2 047 21,9
Discouraged 228 5,3 330 7,6 558 6,5 419 8,9 461 10,0 880 9,4
Other NEA 474 11,0 1 180 27,2 1 653 19,1 510 10,8 1 131 24,6 1 642 17,6
Total 4 310 100,0 4 333 100,0 8 642 100,0 4 724 100,0 4 602 100,0 9 326 100,0
15–34
Employed 3 535 38,2 2 517 27,2 6 052 32,7 3 509 35,5 2 512 25,9 6 021 30,7
Unemployed 1 594 17,2 1 547 16,7 3 141 17,0 1 712 17,3 1 665 17,1 3 377 17,2
Discouraged 462 5,0 580 6,3 1 042 5,6 774 7,8 811 8,4 1 584 8,1
Other NEA 3 653 39,5 4 593 49,7 8 245 44,6 3 881 39,3 4 720 48,6 8 601 43,9
Total 9 244 100,0 9 236 100,0 18 480 100,0 9 876 100,0 9 707 100,0 19 583 100,0
QLFS 2009.Q3; QLFS2014.Q3

Statistics South Africa
Appendix: Youth Indicators
93
Table 4.2: Employment status of female youth by sex and highest level of education attained, 2009 and 2014
Status
Less than matric Matric Other
tertiary Graduates Other Total Less than
matric Matric Other
tertiary Graduates Other Total
2009 2014
'000
Employed 956 1 024 359 163 14 2 517 953 1 063 269 201 25 2 512
Unemployed 813 613 96 16 8 1 547 910 649 72 29 4 1 665
Discouraged 407 155 13 3 3 580 538 249 16 5 2 811
Other NEA 3 575 900 67 27 24 4 593 3 478 1 113 58 41 30 4 720
Total 5 751 2 692 536 208 49 9 236 5 880 3 074 416 277 61 9 707
%
Employed 16,6 38,0 67,1 78,3 28,8
27,2 16,2 34,6 64,8 72,7 40,6 25,9
Unemployed 14,1 22,8 18,0 7,6 17,4
16,7 15,5 21,1 17,4 10,7 6,6 17,1
Discouraged 7,1 5,7 2,4 1,3 5,5
6,3 9,2 8,1 3,9 1,8 3,5 8,4
Other NEA 62,2 33,4 12,6 12,8 48,3
49,7 59,2 36,2 13,9 14,8 49,3 48,6
Total 100,0 100,0 100,0 100,0 100,0
100,0 100,0 100,0 100,0 100,0 100,0 100,0
QLFS 2009.Q3; QLFS2014.Q3
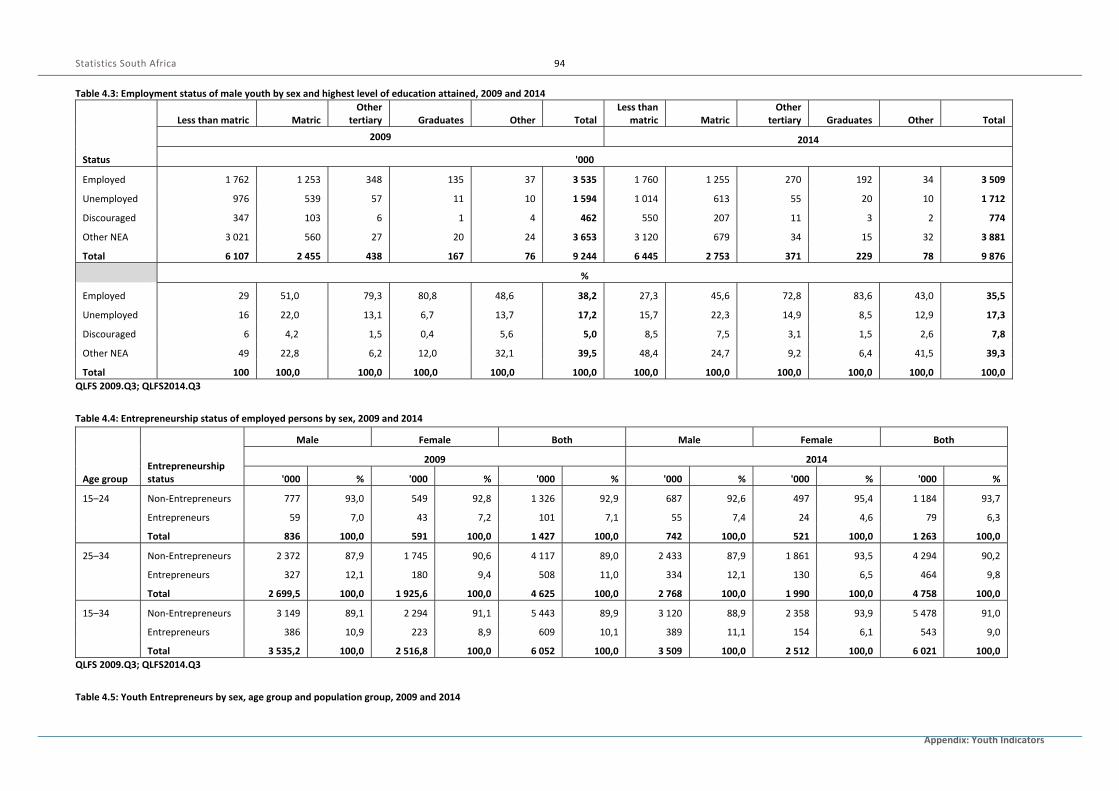
Statistics South Africa
Appendix: Youth Indicators
94
Table 4.3: Employment status of male youth by sex and highest level of education attained, 2009 and 2014
Status
Less than matric Matric Other
tertiary Graduates Other Total Less than
matric Matric Other
tertiary Graduates Other Total
2009 2014
'000
Employed 1 762 1 253 348 135 37 3 535 1 760 1 255 270 192 34 3 509
Unemployed 976 539 57 11 10 1 594 1 014 613 55 20 10 1 712
Discouraged 347 103 6 1 4 462 550 207 11 3 2 774
Other NEA 3 021 560 27 20 24 3 653 3 120 679 34 15 32 3 881
Total 6 107 2 455 438 167 76 9 244 6 445 2 753 371 229 78 9 876
%
Employed 29 51,0 79,3 80,8 48,6 38,2 27,3 45,6 72,8 83,6 43,0 35,5
Unemployed 16 22,0 13,1 6,7 13,7 17,2 15,7 22,3 14,9 8,5 12,9 17,3
Discouraged 6 4,2 1,5 0,4 5,6 5,0 8,5 7,5 3,1 1,5 2,6 7,8
Other NEA 49 22,8 6,2 12,0 32,1 39,5 48,4 24,7 9,2 6,4 41,5 39,3
Total 100 100,0 100,0 100,0 100,0 100,0 100,0 100,0 100,0 100,0 100,0 100,0
QLFS 2009.Q3; QLFS2014.Q3
Table 4.4: Entrepreneurship status of employed persons by sex, 2009 and 2014
Age group Entrepreneurship status
Male Female Both Male Female Both
2009 2014
'000 % '000 % '000 % '000 % '000 % '000 %
15–24 Non‐Entrepreneurs 777 93,0 549 92,8 1 326 92,9 687 92,6 497 95,4 1 184 93,7
Entrepreneurs 59 7,0 43 7,2 101 7,1 55 7,4 24 4,6 79 6,3
Total 836 100,0 591 100,0 1 427 100,0 742 100,0 521 100,0 1 263 100,0
25–34 Non‐Entrepreneurs 2 372 87,9 1 745 90,6 4 117 89,0 2 433 87,9 1 861 93,5 4 294 90,2
Entrepreneurs 327 12,1 180 9,4 508 11,0 334 12,1 130 6,5 464 9,8
Total 2 699,5 100,0 1 925,6 100,0 4 625 100,0 2 768 100,0 1 990 100,0 4 758 100,0
15–34 Non‐Entrepreneurs 3 149 89,1 2 294 91,1 5 443 89,9 3 120 88,9 2 358 93,9 5 478 91,0
Entrepreneurs 386 10,9 223 8,9 609 10,1 389 11,1 154 6,1 543 9,0
Total 3 535,2 100,0 2 516,8 100,0 6 052 100,0 3 509 100,0 2 512 100,0 6 021 100,0
QLFS 2009.Q3; QLFS2014.Q3
Table 4.5: Youth Entrepreneurs by sex, age group and population group, 2009 and 2014
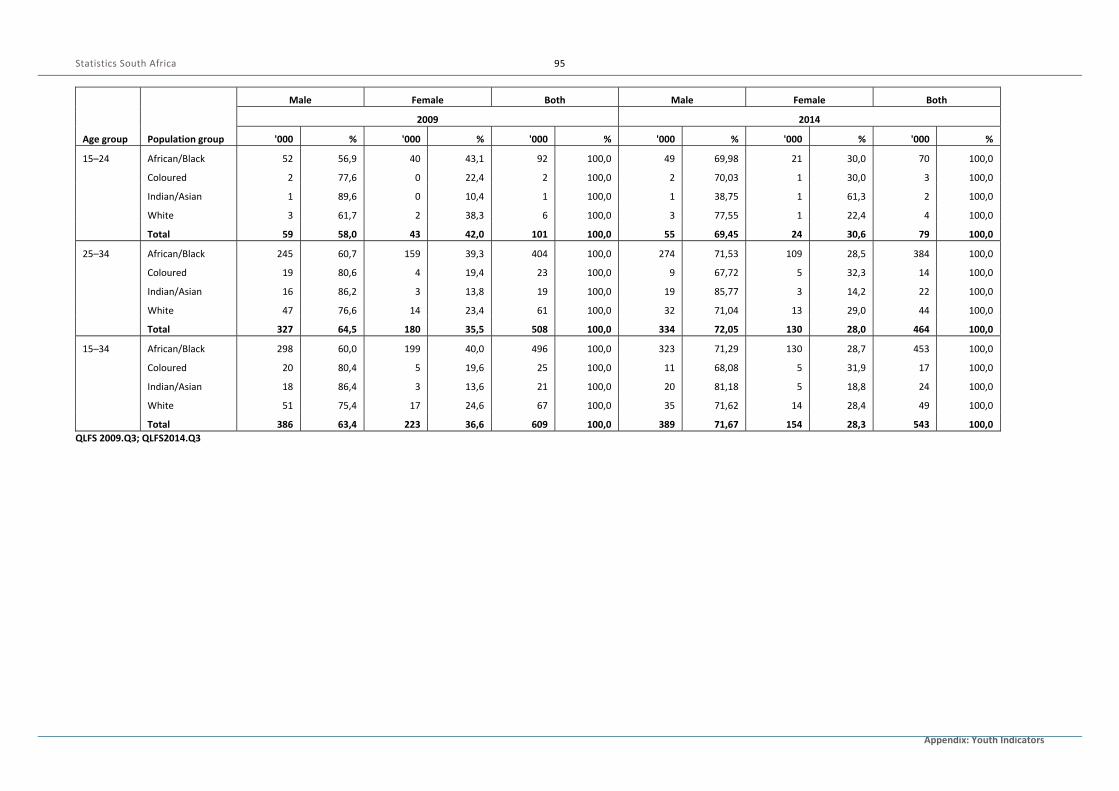
Statistics South Africa
Appendix: Youth Indicators
95
Age group Population group
Male Female Both Male Female Both
2009 2014
'000 % '000 % '000 % '000 % '000 % '000 %
15–24 African/Black 52 56,9 40 43,1 92 100,0 49 69,98 21 30,0 70 100,0
Coloured 2 77,6 0 22,4 2 100,0 2 70,03 1 30,0 3 100,0
Indian/Asian 1 89,6 0 10,4 1 100,0 1 38,75 1 61,3 2 100,0
White 3 61,7 2 38,3 6 100,0 3 77,55 1 22,4 4 100,0
Total 59 58,0 43 42,0 101 100,0 55 69,45 24 30,6 79 100,0
25–34 African/Black 245 60,7 159 39,3 404 100,0 274 71,53 109 28,5 384 100,0
Coloured 19 80,6 4 19,4 23 100,0 9 67,72 5 32,3 14 100,0
Indian/Asian 16 86,2 3 13,8 19 100,0 19 85,77 3 14,2 22 100,0
White 47 76,6 14 23,4 61 100,0 32 71,04 13 29,0 44 100,0
Total 327 64,5 180 35,5 508 100,0 334 72,05 130 28,0 464 100,0
15–34 African/Black 298 60,0 199 40,0 496 100,0 323 71,29 130 28,7 453 100,0
Coloured 20 80,4 5 19,6 25 100,0 11 68,08 5 31,9 17 100,0
Indian/Asian 18 86,4 3 13,6 21 100,0 20 81,18 5 18,8 24 100,0
White 51 75,4 17 24,6 67 100,0 35 71,62 14 28,4 49 100,0
Total 386 63,4 223 36,6 609 100,0 389 71,67 154 28,3 543 100,0
QLFS 2009.Q3; QLFS2014.Q3
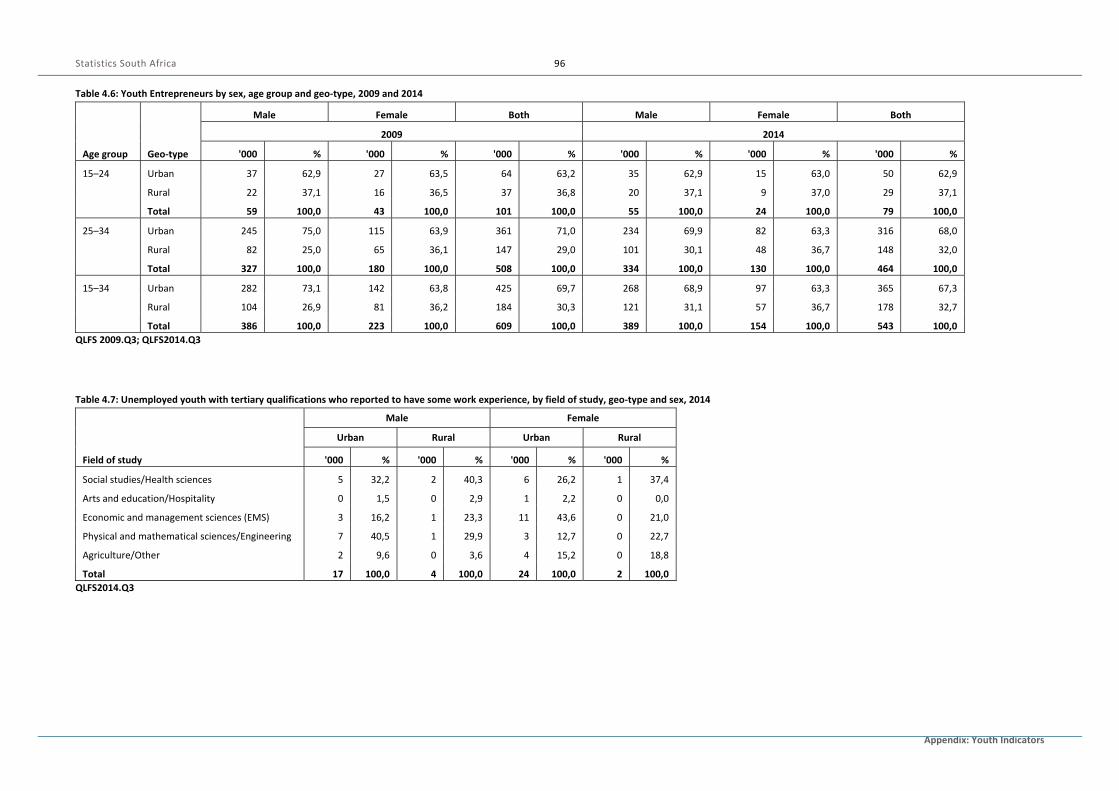
Statistics South Africa
Appendix: Youth Indicators
96
Table 4.6: Youth Entrepreneurs by sex, age group and geo‐type, 2009 and 2014
Age group Geo‐type
Male Female Both Male Female Both
2009 2014
'000 % '000 % '000 % '000 % '000 % '000 %
15–24 Urban 37 62,9 27 63,5 64 63,2 35 62,9 15 63,0 50 62,9
Rural 22 37,1 16 36,5 37 36,8 20 37,1 9 37,0 29 37,1
Total 59 100,0 43 100,0 101 100,0 55 100,0 24 100,0 79 100,0
25–34 Urban 245 75,0 115 63,9 361 71,0 234 69,9 82 63,3 316 68,0
Rural 82 25,0 65 36,1 147 29,0 101 30,1 48 36,7 148 32,0
Total 327 100,0 180 100,0 508 100,0 334 100,0 130 100,0 464 100,0
15–34 Urban 282 73,1 142 63,8 425 69,7 268 68,9 97 63,3 365 67,3
Rural 104 26,9 81 36,2 184 30,3 121 31,1 57 36,7 178 32,7
Total 386 100,0 223 100,0 609 100,0 389 100,0 154 100,0 543 100,0
QLFS 2009.Q3; QLFS2014.Q3
Table 4.7: Unemployed youth with tertiary qualifications who reported to have some work experience, by field of study, geo‐type and sex, 2014
Field of study
Male Female
Urban Rural Urban Rural
'000 % '000 % '000 % '000 %
Social studies/Health sciences 5 32,2 2 40,3 6 26,2 1 37,4
Arts and education/Hospitality 0 1,5 0 2,9 1 2,2 0 0,0
Economic and management sciences (EMS) 3 16,2 1 23,3 11 43,6 0 21,0
Physical and mathematical sciences/Engineering 7 40,5 1 29,9 3 12,7 0 22,7
Agriculture/Other 2 9,6 0 3,6 4 15,2 0 18,8
Total 17 100,0 4 100,0 24 100,0 2 100,0
QLFS2014.Q3
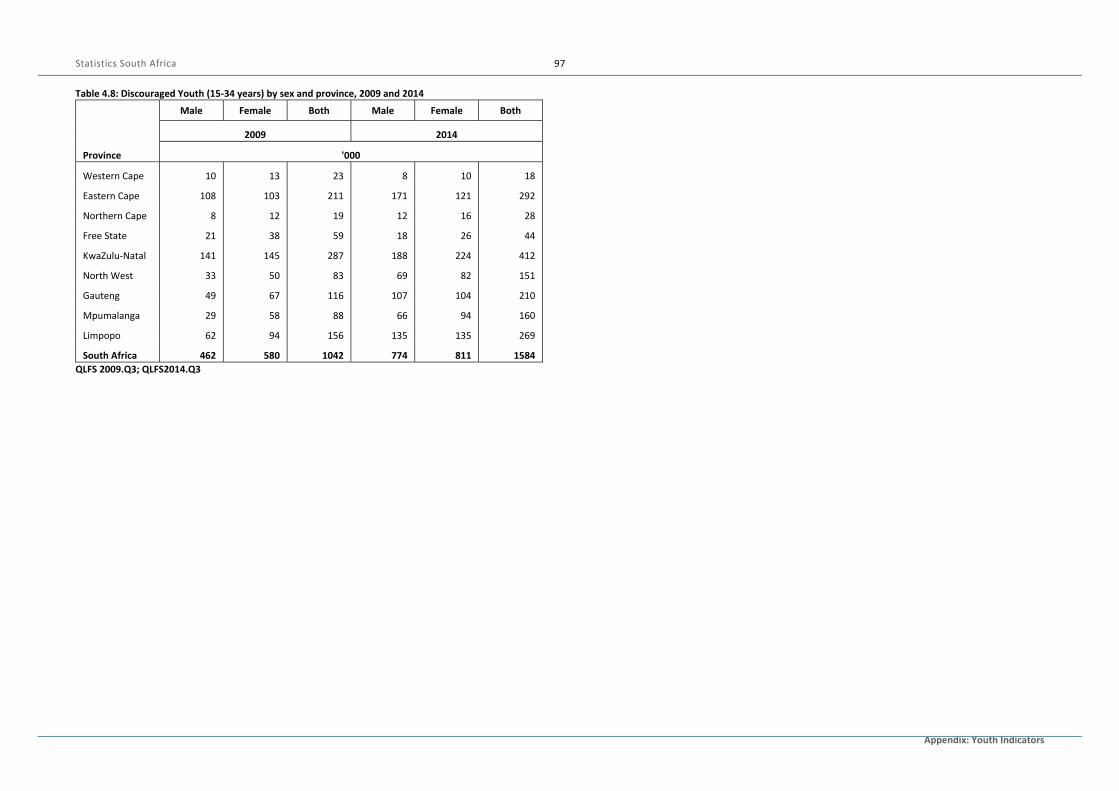
Statistics South Africa
Appendix: Youth Indicators
97
Table 4.8: Discouraged Youth (15‐34 years) by sex and province, 2009 and 2014
Province
Male Female Both Male Female Both
2009 2014
'000
Western Cape 10 13 23 8 10 18
Eastern Cape 108 103 211 171 121 292
Northern Cape 8 12 19 12 16 28
Free State 21 38 59 18 26 44
KwaZulu‐Natal 141 145 287 188 224 412
North West 33 50 83 69 82 151
Gauteng 49 67 116 107 104 210
Mpumalanga 29 58 88 66 94 160
Limpopo 62 94 156 135 135 269
South Africa 462 580 1042 774 811 1584
QLFS 2009.Q3; QLFS2014.Q3
5. MORBIDITY AND MORTALITY
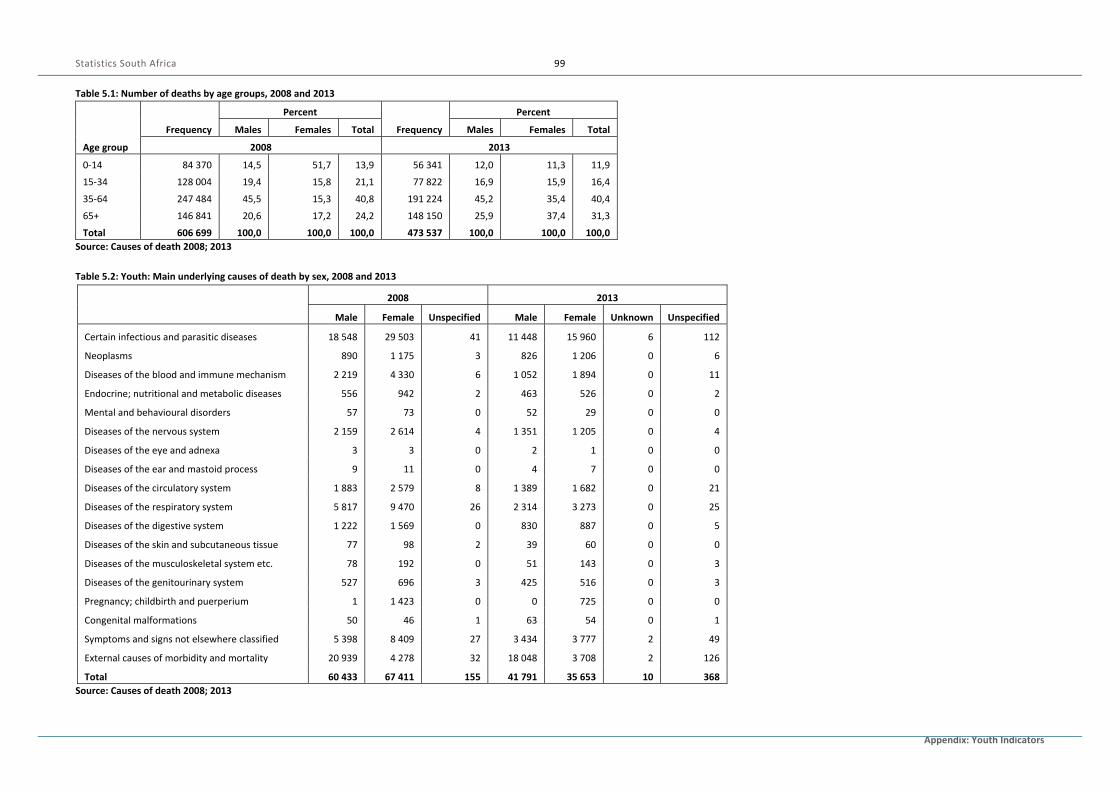
Statistics South Africa
Appendix: Youth Indicators
99
Table 5.1: Number of deaths by age groups, 2008 and 2013
Age group
Frequency
Percent
Frequency
Percent
Males Females Total Males Females Total
2008 2013
0‐14 84 370 14,5 51,7 13,9 56 341 12,0 11,3 11,9
15‐34 128 004 19,4 15,8 21,1 77 822 16,9 15,9 16,4
35‐64 247 484 45,5 15,3 40,8 191 224 45,2 35,4 40,4
65+ 146 841 20,6 17,2 24,2 148 150 25,9 37,4 31,3
Total 606 699 100,0 100,0 100,0 473 537 100,0 100,0 100,0
Source: Causes of death 2008; 2013
Table 5.2: Youth: Main underlying causes of death by sex, 2008 and 2013
2008 2013
Male Female Unspecified Male Female Unknown Unspecified
Certain infectious and parasitic diseases 18 548 29 503 41 11 448 15 960 6 112
Neoplasms 890 1 175 3 826 1 206 0 6
Diseases of the blood and immune mechanism 2 219 4 330 6 1 052 1 894 0 11
Endocrine; nutritional and metabolic diseases 556 942 2 463 526 0 2
Mental and behavioural disorders 57 73 0 52 29 0 0
Diseases of the nervous system 2 159 2 614 4 1 351 1 205 0 4
Diseases of the eye and adnexa 3 3 0 2 1 0 0
Diseases of the ear and mastoid process 9 11 0 4 7 0 0
Diseases of the circulatory system 1 883 2 579 8 1 389 1 682 0 21
Diseases of the respiratory system 5 817 9 470 26 2 314 3 273 0 25
Diseases of the digestive system 1 222 1 569 0 830 887 0 5
Diseases of the skin and subcutaneous tissue 77 98 2 39 60 0 0
Diseases of the musculoskeletal system etc. 78 192 0 51 143 0 3
Diseases of the genitourinary system 527 696 3 425 516 0 3
Pregnancy; childbirth and puerperium 1 1 423 0 0 725 0 0
Congenital malformations 50 46 1 63 54 0 1
Symptoms and signs not elsewhere classified 5 398 8 409 27 3 434 3 777 2 49
External causes of morbidity and mortality 20 939 4 278 32 18 048 3 708 2 126
Total 60 433 67 411 155 41 791 35 653 10 368
Source: Causes of death 2008; 2013
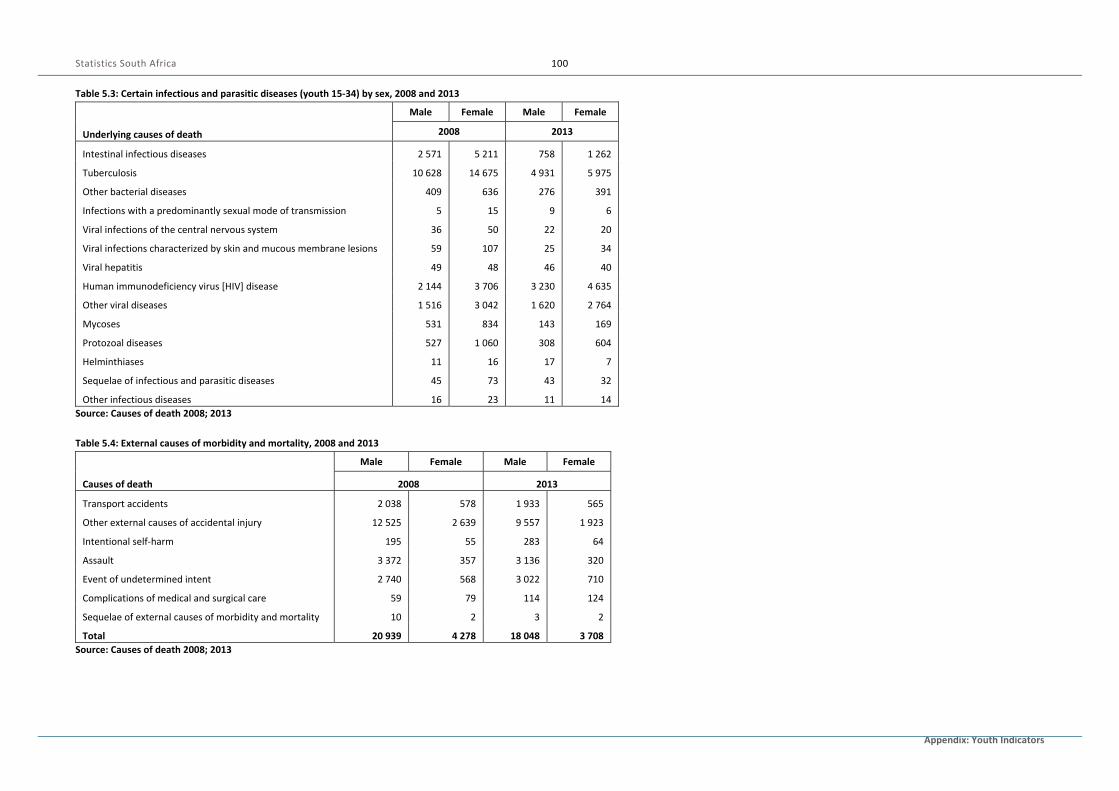
Statistics South Africa
Appendix: Youth Indicators
100
Table 5.3: Certain infectious and parasitic diseases (youth 15‐34) by sex, 2008 and 2013
Underlying causes of death
Male Female Male Female
2008 2013
Intestinal infectious diseases 2 571 5 211 758 1 262
Tuberculosis 10 628 14 675 4 931 5 975
Other bacterial diseases 409 636 276 391
Infections with a predominantly sexual mode of transmission 5 15 9 6
Viral infections of the central nervous system 36 50 22 20
Viral infections characterized by skin and mucous membrane lesions 59 107 25 34
Viral hepatitis 49 48 46 40
Human immunodeficiency virus [HIV] disease 2 144 3 706 3 230 4 635
Other viral diseases 1 516 3 042 1 620 2 764
Mycoses 531 834 143 169
Protozoal diseases 527 1 060 308 604
Helminthiases 11 16 17 7
Sequelae of infectious and parasitic diseases 45 73 43 32
Other infectious diseases 16 23 11 14
Source: Causes of death 2008; 2013
Table 5.4: External causes of morbidity and mortality, 2008 and 2013
Causes of death
Male Female Male Female
2008 2013
Transport accidents 2 038 578 1 933 565
Other external causes of accidental injury 12 525 2 639 9 557 1 923
Intentional self‐harm 195 55 283 64
Assault 3 372 357 3 136 320
Event of undetermined intent 2 740 568 3 022 710
Complications of medical and surgical care 59 79 114 124
Sequelae of external causes of morbidity and mortality 10 2 3 2
Total 20 939 4 278 18 048 3 708
Source: Causes of death 2008; 2013
6. LIVING CONDITIONS AND POVERTY
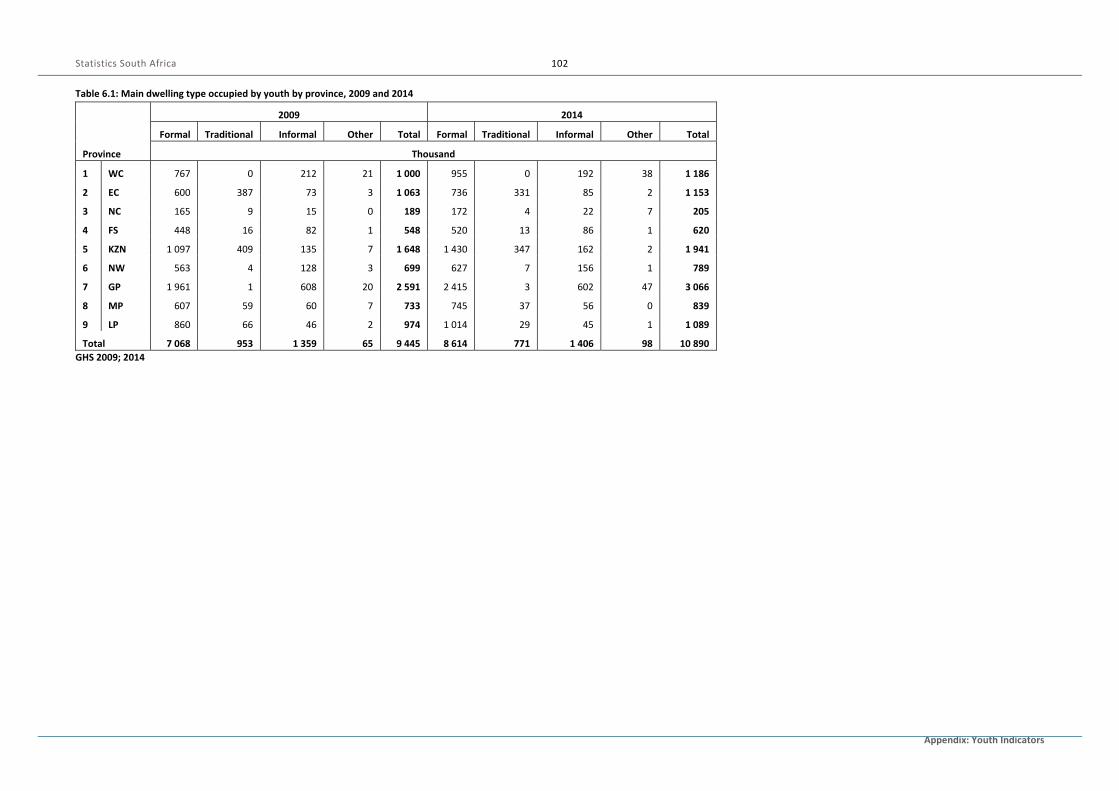
Statistics South Africa
Appendix: Youth Indicators
102
Table 6.1: Main dwelling type occupied by youth by province, 2009 and 2014
Province
2009 2014
Formal Traditional Informal Other Total Formal Traditional Informal Other Total
Thousand
1 WC 767 0 212 21 1 000 955 0 192 38 1 186
2 EC 600 387 73 3 1 063 736 331 85 2 1 153
3 NC 165 9 15 0 189 172 4 22 7 205
4 FS 448 16 82 1 548 520 13 86 1 620
5 KZN 1 097 409 135 7 1 648 1 430 347 162 2 1 941
6 NW 563 4 128 3 699 627 7 156 1 789
7 GP 1 961 1 608 20 2 591 2 415 3 602 47 3 066
8 MP 607 59 60 7 733 745 37 56 0 839
9 LP 860 66 46 2 974 1 014 29 45 1 1 089
Total 7 068 953 1 359 65 9 445 8 614 771 1 406 98 10 890
GHS 2009; 2014
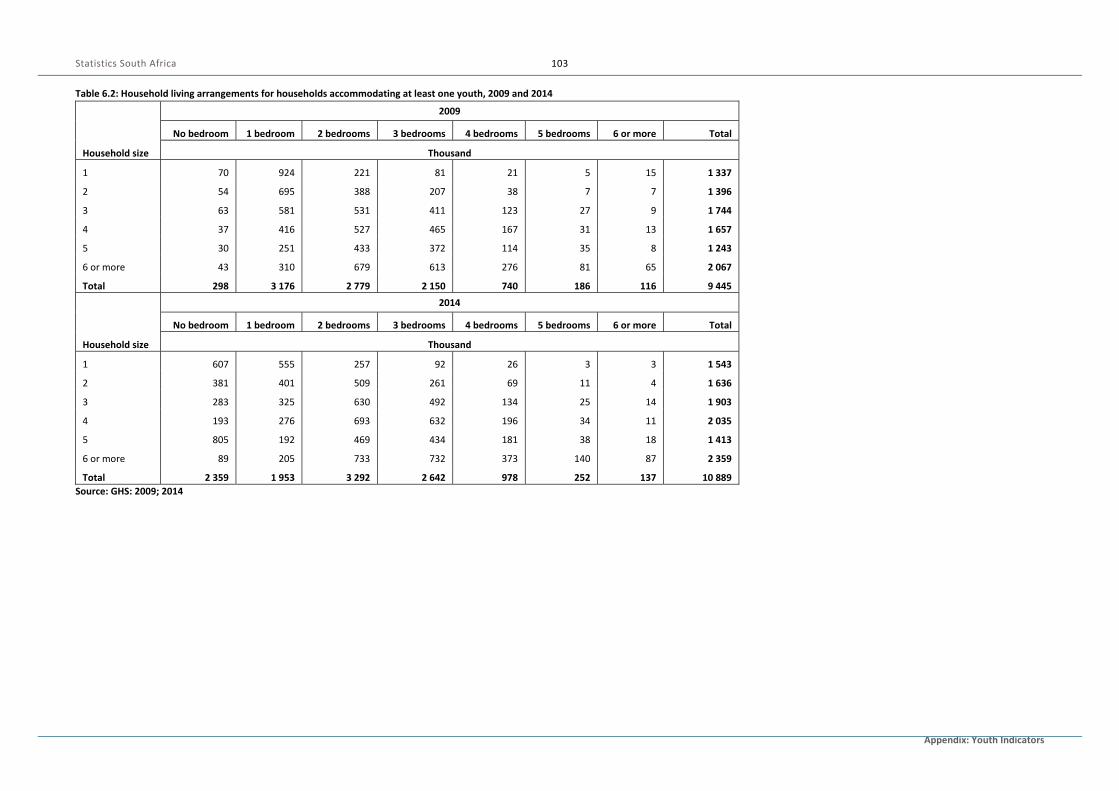
Statistics South Africa
Appendix: Youth Indicators
103
Table 6.2: Household living arrangements for households accommodating at least one youth, 2009 and 2014
Household size
2009
No bedroom 1 bedroom 2 bedrooms 3 bedrooms 4 bedrooms 5 bedrooms 6 or more Total
Thousand
1 70 924 221 81 21 5 15 1 337
2 54 695 388 207 38 7 7 1 396
3 63 581 531 411 123 27 9 1 744
4 37 416 527 465 167 31 13 1 657
5 30 251 433 372 114 35 8 1 243
6 or more 43 310 679 613 276 81 65 2 067
Total 298 3 176 2 779 2 150 740 186 116 9 445
Household size
2014
No bedroom 1 bedroom 2 bedrooms 3 bedrooms 4 bedrooms 5 bedrooms 6 or more Total
Thousand
1 607 555 257 92 26 3 3 1 543
2 381 401 509 261 69 11 4 1 636
3 283 325 630 492 134 25 14 1 903
4 193 276 693 632 196 34 11 2 035
5 805 192 469 434 181 38 18 1 413
6 or more 89 205 733 732 373 140 87 2 359
Total 2 359 1 953 3 292 2 642 978 252 137 10 889
Source: GHS: 2009; 2014
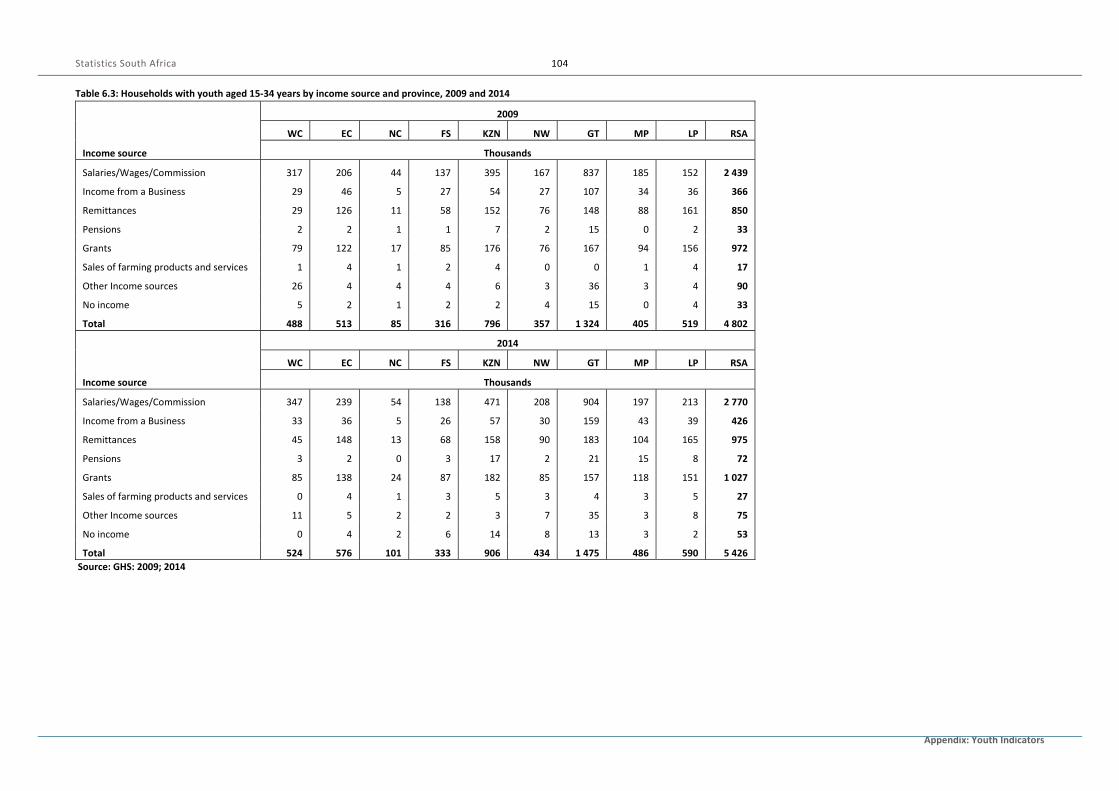
Statistics South Africa
Appendix: Youth Indicators
104
Table 6.3: Households with youth aged 15‐34 years by income source and province, 2009 and 2014
Income source
2009
WC EC NC FS KZN NW GT MP LP RSA
Thousands
Salaries/Wages/Commission 317 206 44 137 395 167 837 185 152 2 439
Income from a Business 29 46 5 27 54 27 107 34 36 366
Remittances 29 126 11 58 152 76 148 88 161 850
Pensions 2 2 1 1 7 2 15 0 2 33
Grants 79 122 17 85 176 76 167 94 156 972
Sales of farming products and services 1 4 1 2 4 0 0 1 4 17
Other Income sources 26 4 4 4 6 3 36 3 4 90
No income 5 2 1 2 2 4 15 0 4 33
Total 488 513 85 316 796 357 1 324 405 519 4 802
Income source
2014
WC EC NC FS KZN NW GT MP LP RSA
Thousands
Salaries/Wages/Commission 347 239 54 138 471 208 904 197 213 2 770
Income from a Business 33 36 5 26 57 30 159 43 39 426
Remittances 45 148 13 68 158 90 183 104 165 975
Pensions 3 2 0 3 17 2 21 15 8 72
Grants 85 138 24 87 182 85 157 118 151 1 027
Sales of farming products and services 0 4 1 3 5 3 4 3 5 27
Other Income sources 11 5 2 2 3 7 35 3 8 75
No income 0 4 2 6 14 8 13 3 2 53
Total 524 576 101 333 906 434 1 475 486 590 5 426
Source: GHS: 2009; 2014

ISBN: 978-0-621-44433-9