Embed Size (px)
Citation preview
Appendices __________________________________________________________________________________________________________
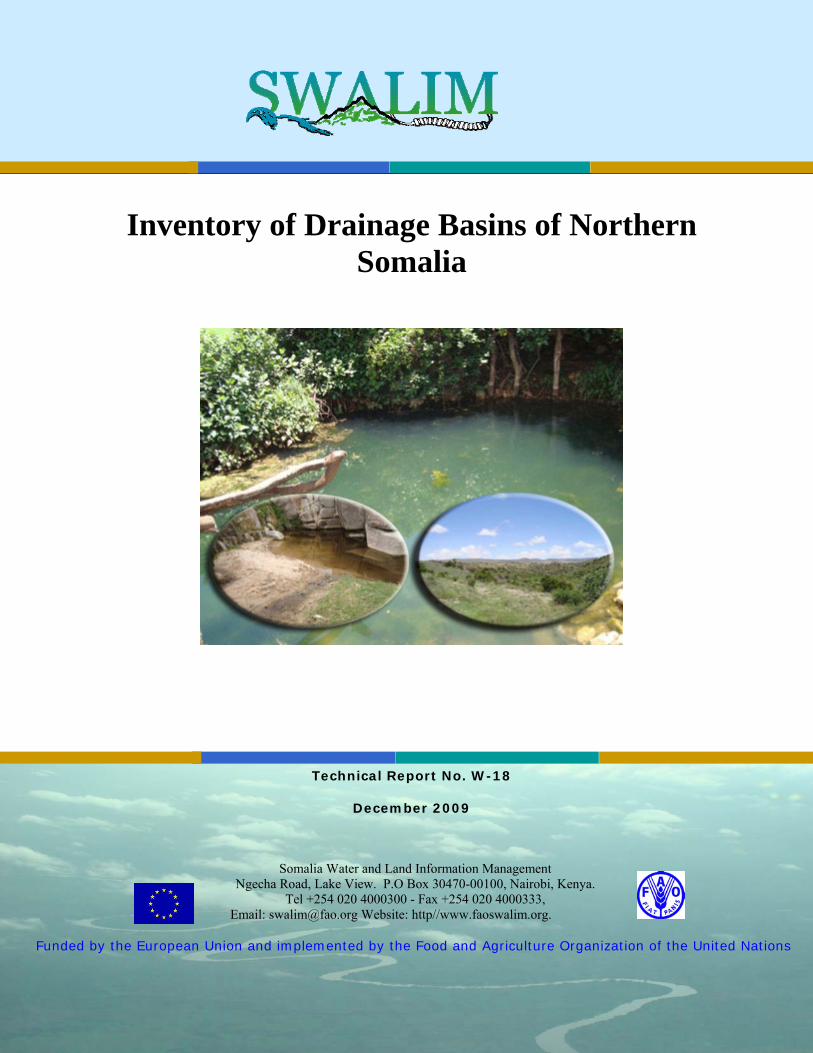
Inventory of Drainage Basins of Northern
Somalia
Technical Report No. W-18
December 2009 Somalia Water and Land Information Management
Ngecha Road, Lake View. P.O Box 30470-00100, Nairobi, Kenya. Tel +254 020 4000300 - Fax +254 020 4000333,
Email: [email protected] Website: http//www.faoswalim.org.
Funded by the European Union and implemented by the Food and Agriculture Organization of the United Nations
i
Disclaimer
The designations employed and the presentation of material in th is information product do not imply the expression of any opinion whatsoever on the part of the Food and Agriculture Organization of the United Nations and the SWALIM Project concerning the legal status of any country , territory , ci ty or area o f i ts au thorities, o r co ncerning the d elimitation of its frontiers or boundaries. The document should be cited as follows: Muchiri, P. W. (2009) , Inventory of Northern S omalia Drainage Basins. Technical Report No W-18, FAO-SWALIM, Nairobi, Kenya
ii
Acknowledgements
The author w ould lik e to sin cerely thank Dr. Zolt an Balint, SWALIM Chi ef Te chnical Advisor and Hussei n Gadain, SWALIM Water Coordinator for their enormous support and guidance during the preparation of this report. A special mention is made of Gabriel Oduori, SWALIM GIS expert for compiling all the maps in this document. Thanks are due to Dr. Jeremiah Gitonga and Muse Shaie both of SWALIM and Dr. Christian Omuto (University of Nairobi) f or their contributions as techn ical reviewers of this document. The author also wishes to thank Emily Mutai, SWA LIM Communication Officer for her efforts in language editing.
iii
Table of Contents
Disclaimer.................................................................................................................................... i
Acknowledgement ..................................................................................................................... ii
Table of Contents...................................................................................................................... iii
List of figures.............................................................................................................................. v
List of abbreviations.................................................................................................................. vi
1.0 INTRODUCTION ...............................................................................................................1
1.1 Data Availability ..............................................................................................................3
2.0 GULF OF ADEN DRAINAGE BASIN ..............................................................................5
2.1 General Description of the Gulf of Aden Drainage Basin ...............................................5
2.2 Climate of the Gulf of Aden Drainage Basin...................................................................7
2.3 Surface Water Resources of the Gulf of Aden Drainage Basin.....................................11
2.4 Land Resources of the Gulf of Aden Drainage Basin....................................................14
3.0 DARROR DRAINAGE BASIN ........................................................................................18
3.1 General Description of Darror Drainage Basin .............................................................18
3.4 Land Resources of Darror Drainage Basin ....................................................................26
4.0: TUG DER/NUGAAL DRAINAGE BASIN ....................................................................30
4.1 General Description of Tug Der/Nugaal Drainage Basin ..............................................30
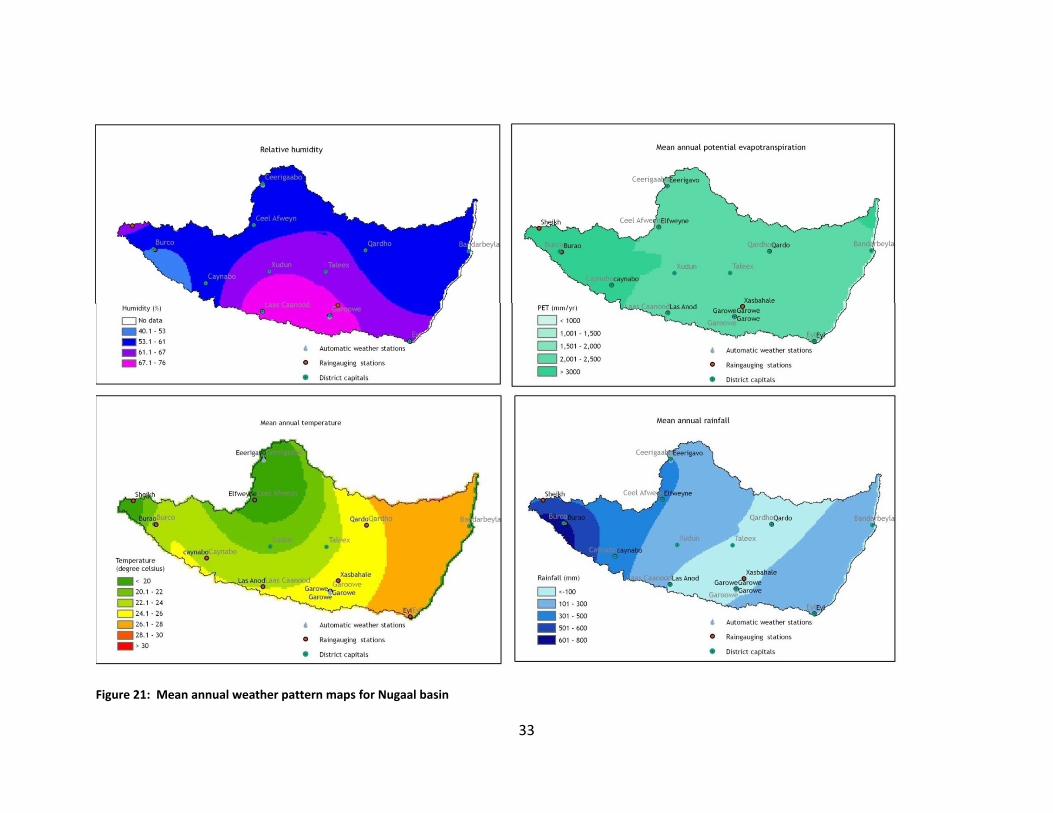
4.2 Climate of Tug Der/Nugal Drainage Basin ...................................................................32
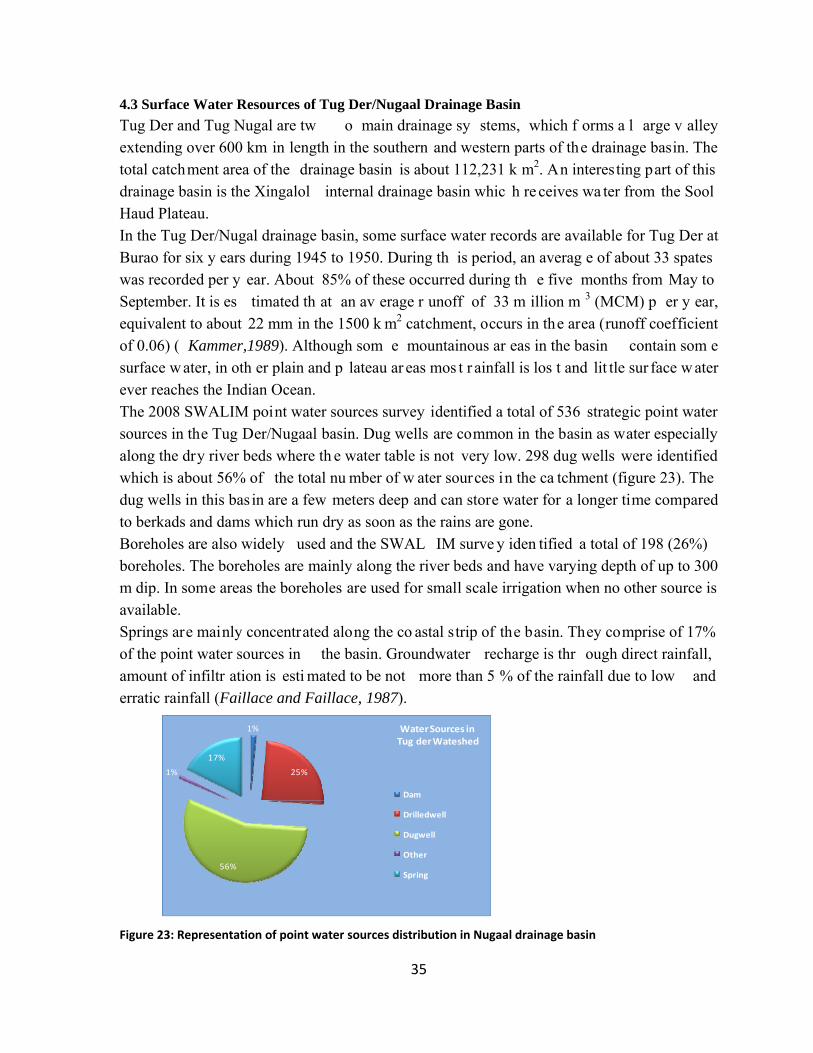
4.3 Surface Water Resources of Tug Der/Nugaal Drainage Basin ......................................35
4.4 Land Resources of Tug Der/Nugal Drainage Basin ......................................................37
5.0: OGADEN DRAINAGE BASIN.......................................................................................42
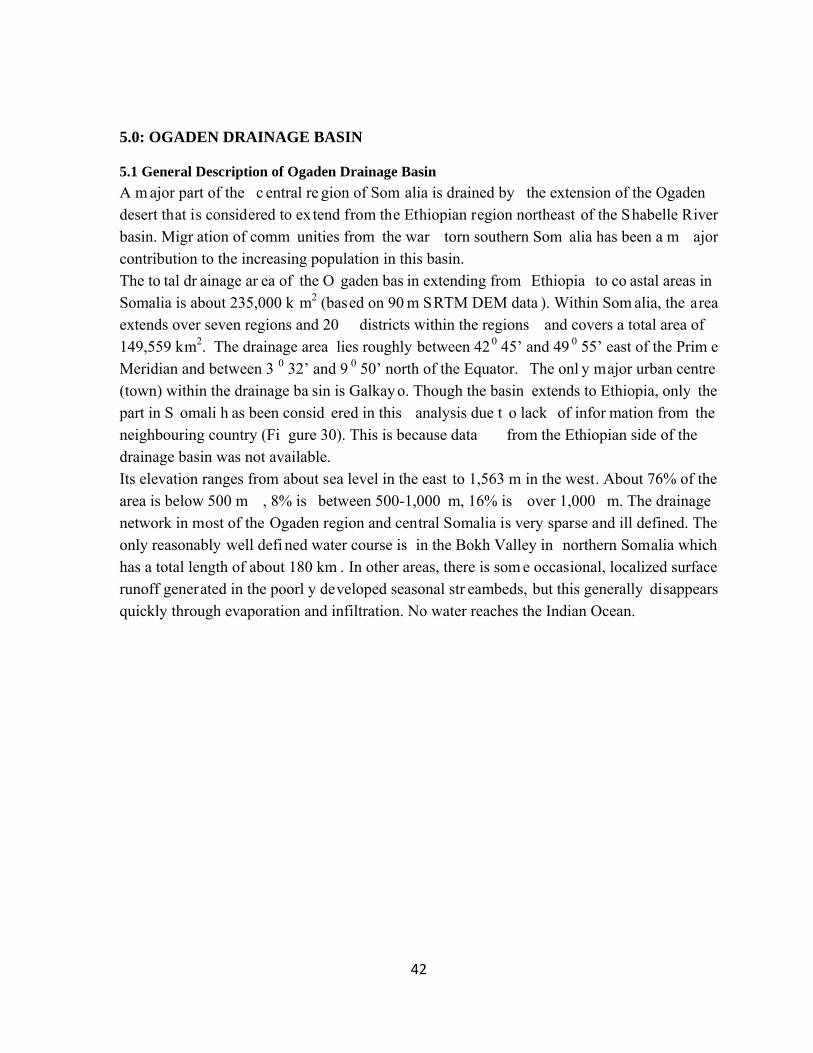
5.1 General Description of Ogaden Drainage Basin............................................................42
5.2 Climate of Ogaden Drainage Basin ...............................................................................44
5.3 Surface Water Resources of Ogaden Drainage Basin....................................................48
5.4 Land Resources of Ogaden Drainage Basin ..................................................................50
References ...............................................................................................................................55

iv
v
List of figures
Figure 1: Map of drainage basins in northern Somalia..............................................................2
Figure 2: General description maps of Gulf of Aden drainage basin .......................................6 Figure 3: Mean annual weather pattern maps for Gulf of Aden..............................................8
Figure 4: Monthly rainfall and PET for selected stations in Gulf of Aden Basin........................9
Figure 5: Climate maps for Gulf of Aden Basin........................................................................10
Figure 6: Point water sources representation in Gulf of Aden Basin ......................................12
Figure 7: Water resources maps for Gulf of Aden Basin .........................................................13
Figure 8: Soil type percentages in the Gulf of Aden Basin.......................................................14
Figure 9: Geology and soil maps of the Gulf of Aden Basin.....................................................16
Figure 10: Land resources map for the Gulf of Aden Basin ....................................................17
Figure 11: General description maps of Darror drainage basin ..............................................19
Figure 12: Mean annual weather pattern maps for Darror Basin ...........................................21
Figure 13: Climate maps for Darror Basin................................................................................22
Figure 14: Mean monthly weather observations at Iscushban ...............................................23
Figure 15: Water resources maps of Darror Basin..................................................................25
Figure 16: Land Resources Maps for the Darror Basin ...........................................................27
Figure 17: Geology and Soils Maps for the Darror Basin.........................................................28
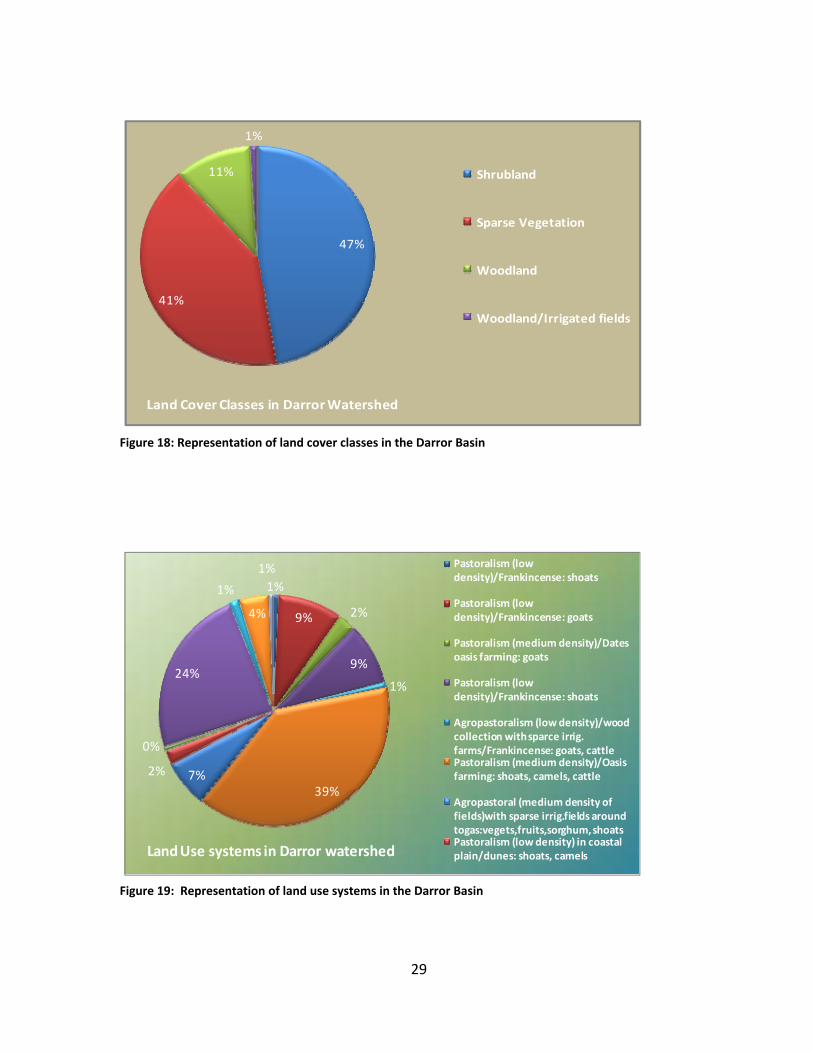
Figure 18: Representation of land cover classes in the Darror Basin......................................29
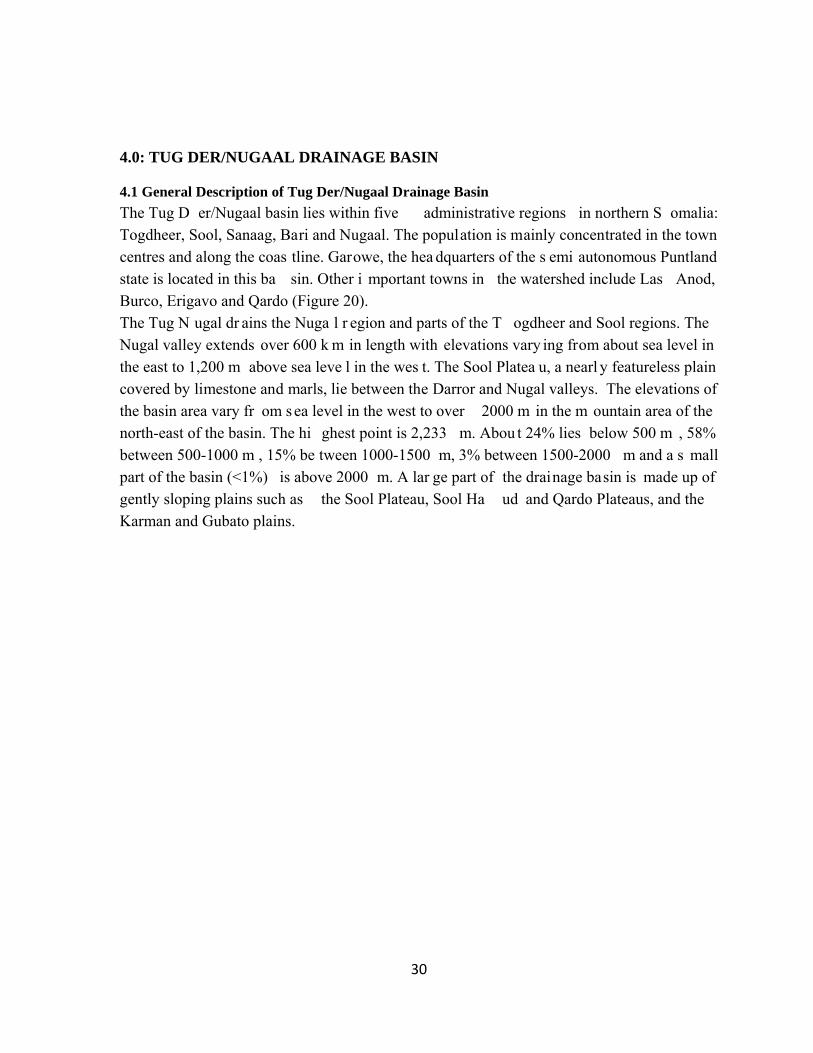
Figure 19: Representation of land use systems in the Darror Basin ......................................29
Figure 20: General description maps of Nugaal drainage basin..............................................31
Figure 21: Mean annual weather pattern maps for Nugaal basin..........................................33
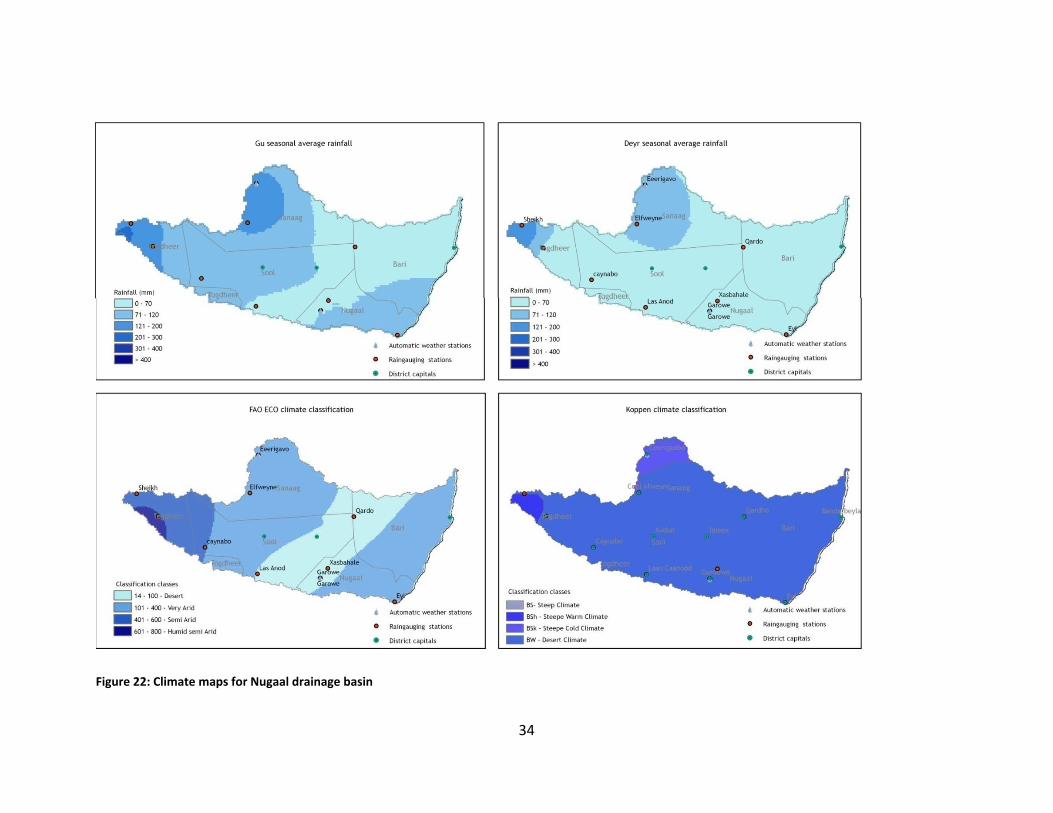
Figure 22: Climate maps for Nugaal drainage basin................................................................34
Figure 23: Representation of point water sources distribution in Nugaal drainage basin .....35
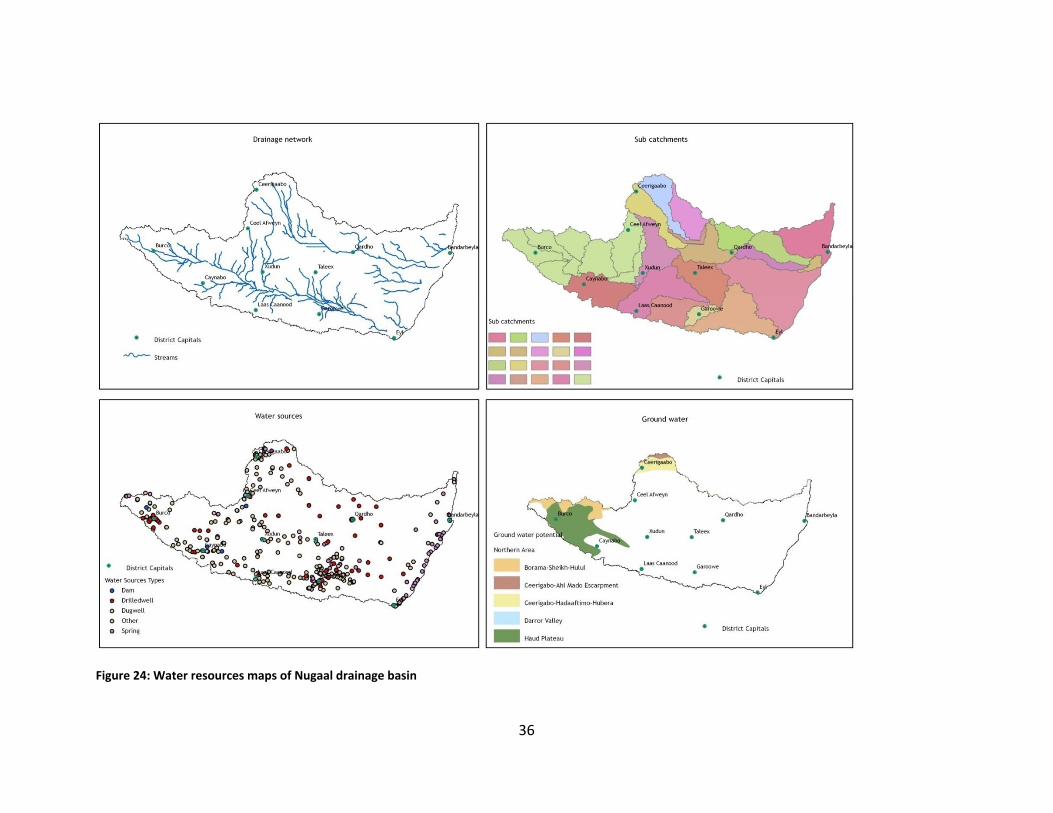
Figure 24: Water resources maps of Nugaal drainage basin...................................................36
Figure 25: Geology and soil map for Nugaal drainage basin ...................................................38
Figure 26: Land resources map for Nugaal drainage basin ....................................................39 Figure 27: Legend for Agro‐Ecological Zones (AEZ) in Nugaal basin .......................................40
Figure 28: Legend for land use systems in Nugaal basin .........................................................41
Figure 29: General description of Ogaden drainage Basin ......................................................43
Figure 30: Mean annual weather pattern maps for Ogaden Basin .........................................46
Figure 31: Climate maps of Ogaden basin ...............................................................................47
Figure 32: Water Resources maps for Ogaden basin ..............................................................49
Figure 33: Geological and soil map for Ogaden basin .............................................................52
Figure 34: Land resources maps in Ogaden basin ...................................................................53
Figure 35: Legend for land use systems in Ogaden basin........................................................54
vi
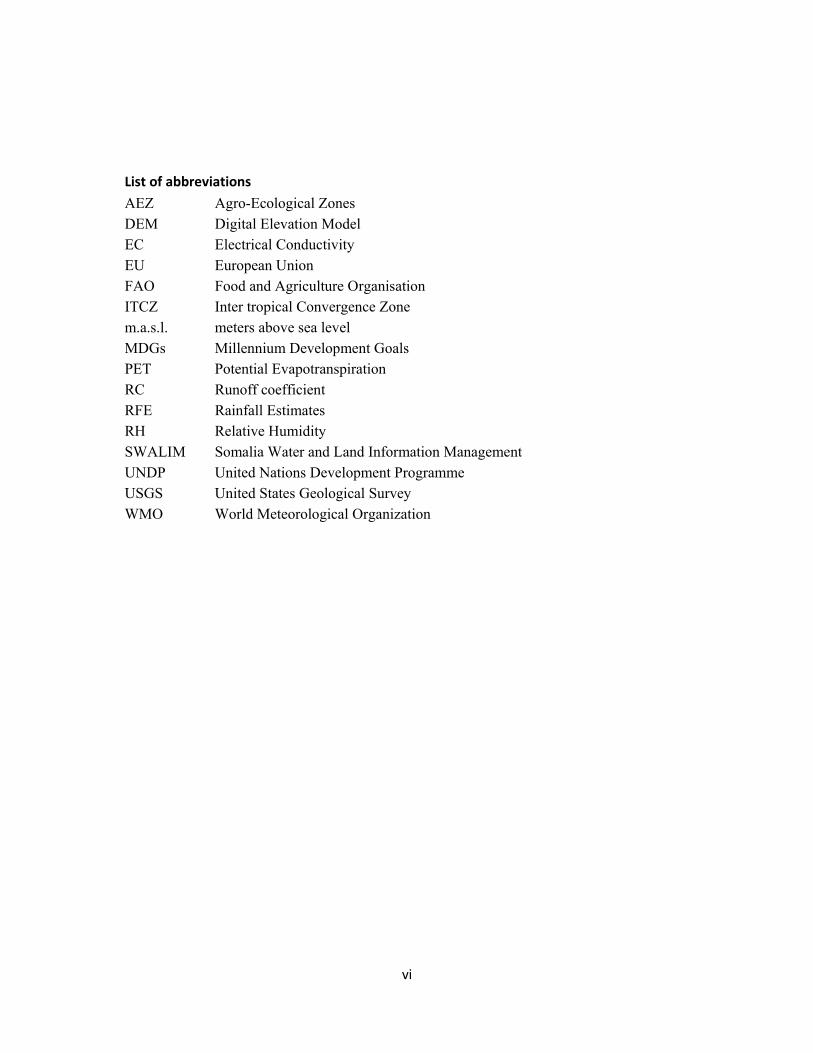
List of abbreviations
AEZ Agro-Ecological Zones DEM Digital Elevation Model EC Electrical Conductivity EU European Union FAO Food and Agriculture Organisation ITCZ Inter tropical Convergence Zone m.a.s.l. meters above sea level MDGs Millennium Development Goals PET Potential Evapotranspiration RC Runoff coefficient RFE Rainfall Estimates RH Relative Humidity SWALIM Somalia Water and Land Information Management UNDP United Nations Development Programme USGS United States Geological Survey WMO World Meteorological Organization
1
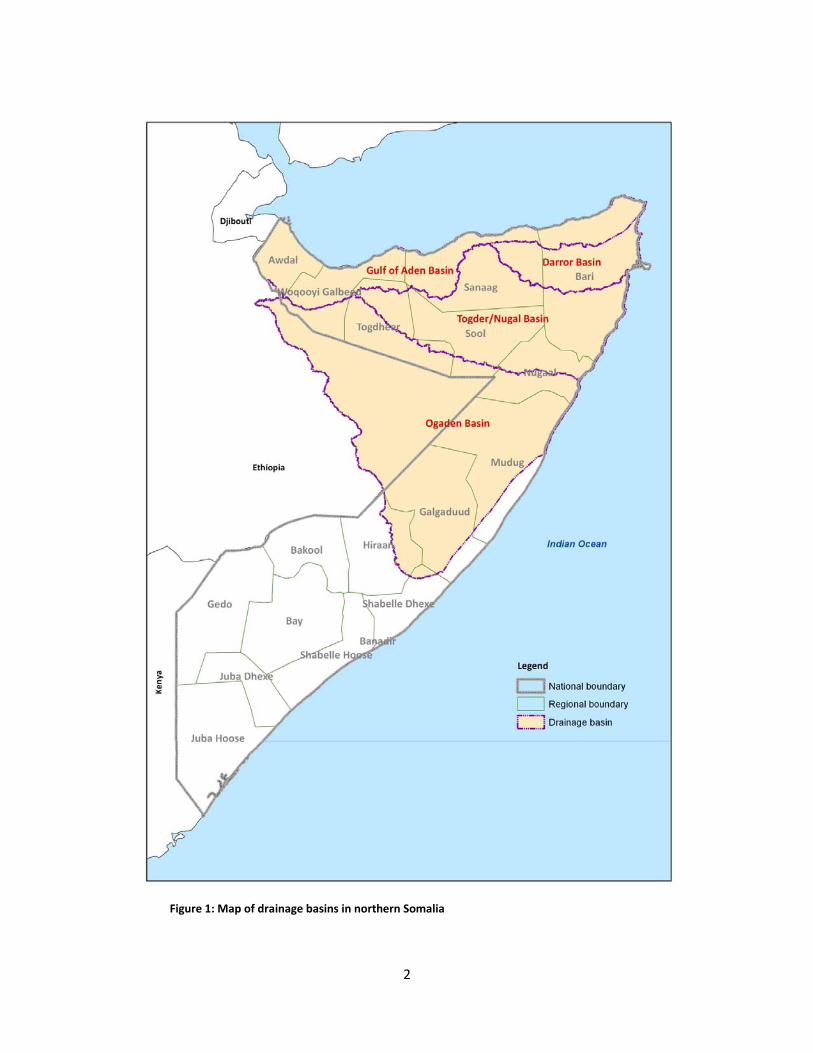
1.0 INTRODUCTION Addressing i ssues of n atural resources requires a ho listic a pproach that recognizes the interdependence between c ompeting demands and lim ited resources. Integrated watershed management is recognized a s t he best instru ment for d ealing with w ater and nat ural resources. This would also contribute t o th e erad ication of extreme poverty and hunger (MDG 1) through improved fo od sec urity (main focus of FAO) and su stainable environmental management (MDG 7). To enable start a process of integrated water resources management in Northern Somalia, the Somalia Water and Land Information Management (SWALIM) project has been mandated by the European Union (EU) to develop an inventory of the drainage basins of the area. A great percentage of the Somalia population relies directly on the natural resource base to meet their daily needs. This do cument, “Inv entory of Northern Somalia Drainage Bas ins” is a first attem pt to develop a working document for planners in many fields in northern Somalia. This document is therefore likely to be updated and refined as information continues to flow in from actors in all the involved sectors. As a working document, there is s cope for im proving the accuracy and w e must inv est in furthe r research and field acti ons. T he i nventory p rovides b aseline information on climate, water resources and land r esources. This information is u seful for policy development, p rioritization o f initiatives on watershed management, coordin ation of actions and further assessments. The major d rainage b asins in N orthern reg ions of So malia are: the Gulf of Aden Basin, Darror Basin, Tug Der/Nugal Basin and Ogad en Basin (Figure 1). I n addition to these, the narrow strip of land alo ng the Indian Ocean ha s short drainag e networ ks and th ere is no t much flow in th ese drainage channels that reaches the Ind ian Ocean. This narrow strip h as been discussed in this report. Unlike the Juba and Shab elle riv er basins in southern Somalia whi ch ori ginate in the Ethiopian and Kenyan highlands, the northern Somalia basins have little surface r unoff and rainfall in the basins are mostly lost through infiltration and evaporation. There are, however, some sh ort streams ( toggas) esp ecially i n th e mountainous re gions in th e north that flo w throughout the y ear in so me str etches. Th ere is a complex surface water-groundwa ter interaction along t he toggas, whereby in some stretches there is surface runoff and in other s there are mostly sub-surface interflows and rech arging of groundw ater aquif ers. N atural springs are also common in t he mountainous regions of the north where th e rocky outcrops intersect th e groundw ater tables. Sub-surface flow s alon g th e toggas and grou ndwater available in springs (mountainous areas) and in shallow and deep aquifers are an important source of wate r for people and livestock in these drai nage basins. Cat chment rainwater harvesting through dams(wars) and berkads is also prevalent.
2
Figure 1: Map of drainage basins in northern Somalia
3
1.1 Data Availability General Description Data: The general description da ta used in this repor t consists of set tlement data, and p hysical environment o f each d rainage basin. The settlement data was derived from United Na tions development Programme (UNDP) datasets. While the physical environment data was derived from th e Unit ed States Geologi cal Surve y (U SGS) global 90 m Dig ital Elev ation Mod el (DEM). Climate data: The d ensity of cl imate monitoring net work in So malia has n ever b een good enough to support a meaningful analysis of weather in th e country . However, many researchers hav e attempted to do so, usi ng different datasets to indicate average condit ions of the climate of Somalia. Most ava ilable datasets are ch aracterised by large gaps of missing dat a. Th e outbreak of civil w ar in the early nineties made the s ituation worse. A ttempts to carry out analyses have become difficult since then, due to the loss of important datasets as well as the collapse of m onitoring n etworks. SWALIM a nd other p artner N GOs have b een trying to revive the clim ate monitoring n etwork. No si gnificant weather observation was carried out between 1990 and 2004. The Somalia climate archive held within SWALIM contains data as far back as 1894 (for Kismayo) and 1904 (for Mogadishu). In this analysis, the most recent consistent available data has been used, most of which have been extr acted from the FAO global cli mate database for the period between 1963 - 1990. However, the database has missing information for some periods from some stations. In such cases missing data was interpolated to improve the analysis. Water Resources The USGS 90m D EM was used to gene rate t he drain age network for all th e watersheds. Hydrometric information on the ca tchment is limited and s ome basins like the Ogaden and Darror have never been investigated. The last intervention was carried out by SOGREAH in 1981 in some selected sub catch ments. Water sources data was obtain ed from S WALIM’s water sources inv entory. The inv entory holds a lot of i nformation on thousands o f w ater sources which were collected during the 2008/2009 point water sources survey. Ground water information wa s d erived from hi storical da ta or records t hat exist wi thin the SWA LIM database. This da ta is to be used w ith caution because no further investigations have taken place since the break of civil war in Somalia. Agro Ecological Zones (AEZ) Agro-ecological zones (AEZ) are land resource mapping units, def ined in ter ms of c limate, landform and so ils, and/or land cover, having a speci fic range of potentials a nd constraints (FAO, 1996). The purpose of Agro-ecological zoning is to give an inventory and overview of the physical agricultural potential of an area. SWALIM delineated agro-ecological zones for Somalia by mapping and defin ing through a combination of information on soi ls, landform and climate. Information on soils and landform was mainly derived from the Soil and Terrain
4
(SOTER) Da tabase for north-eastern Africa (F AO, 1998 ), updated with recent information from the SWALIM s tudy areas. Available data on rainfall and potential evapotranspiration (FAOCLIM, 2001) has been used to define Length of Growing Period Zones (LGP Zones) Length of Growing Period (LGP) The length of the growing period ( LGP) as defined by FAO is the period (in d ays) during a year when precipitation exceeds half the potential evapotranspiration, plus a period required to transpire an assumed 100 mm of water from excess precipitation stored in the soil profile. It is a useful concept for calculating agricultural potential and can be used as a criterion for classifying areas and roughly det ermining crop cycle lengths. Cal culation of the growing period is based on a sim ple water balan ce model, comparing precipitat ion with PET, using monthly values. PET and Rainfall data in SWALIM climate archive were used to calculate LGP for Somalia. Geology and Soils Data The existin g soil classifica tion sy stems suffer from considerable c onfusion and a lack o f consistency between countries. Therefore, presenting a standardized classification is not easy. There are a nu mber major soil groups in northe rn S omalia with differ ent tex tural characteristics and fertil ity pr ofiles for purpose s of consistency with other SWALIM an d generally FAO soil information, FAO SOTER datasets (at a scale of 1:1500000)(FAO, 1998) were used in this document to extract both geological and soils information.
5
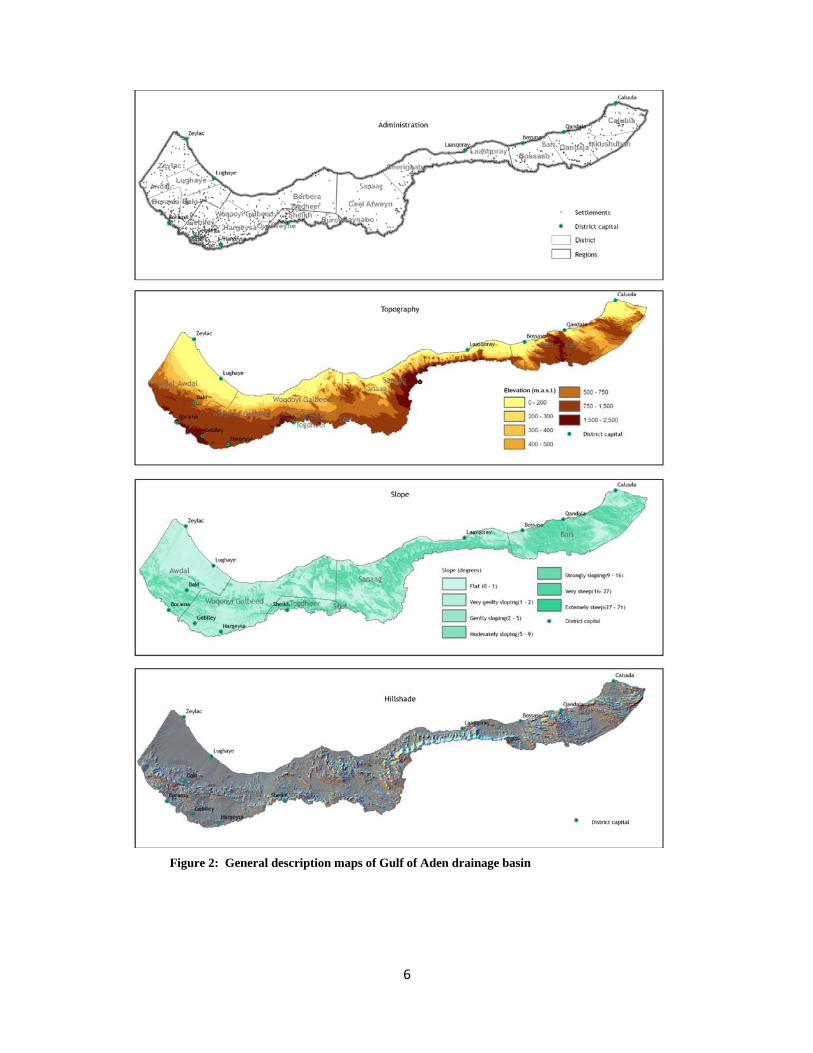
2.0 GULF OF ADEN DRAINAGE BASIN 2.1 General Description of the Gulf of Aden Drainage Basin The Gulf of Aden basin, situated in the northern parts of Somalia, covers the areas drained by the small wadis and toggas that originate from the gently sloping plateau and passes through the mountain range extending in an east-west direction. The drainage area covered by these small seasonal streams, collectively known as t he Gulf of Aden basin, is about 74,422 k m2 (based on the 90 m SRTM DEM data). The drainage area is sprea d over five administrative regions - Awdal, West Galbeed, Togdheer, Sanaag and Bari. As administrative boundaries of regions do not necessarily match the basin boundaries, the drainage basin covers only parts of some of these regions. The drainage area li es roughly between 42o 42’ and 51o 22’ East and between 9 o 28’ and 12o 1’ North. Figure 2 show s the ad ministration boundaries with in the basin and the location of major towns. The figure also shows the distribution of settlements in the basin wit h majority of the settlement being around the major town centre s. P opulation estimates (UNDP 2008) in some of the towns include; Borama (82,921), Hargeisa (422,515), Berbera, Ceerigavo (31,098), Bosasso (107 ,181). N o popu lation d ata is av ailable for other towns. The elevation varies from sea level in the coastal areas to over 2000 m a.s.l in the mountain ranges that extend from the east to the west of the basin. The area slopes from the south to the north with the drainage flowing towards the Gulf of Aden. 42 % of the area is below 500 m a.s.l, 94% below 1500 m a.s.l and 5% of the area lie s between 1500 m a.s.l to 2000 m a.s.l. The high est peak is Mt. S urud; wi th an elevation of 2 ,408 m a.s.l. Figure 2 shows th e topography within the basin. The Gulf of Aden basin includes a variet y of morphological featur es, such as accentuated relief, escarpment, s teep slopes, coastal plains, internal plateaus and valleys (Figure 2). Th e high mountain range runs parallel to the shore of the Gulf of A den. The mountain range is constituted by crystalline rocks which are deeply inc ised by nu merous toggas tha t fl ow towards the Gulf of Aden. Some of the major toggas include Tug Jangarra (3700 km2), Tug Hodmo (3 800 k m2) and Tug Belgeabbili (4,8 00 k m2). The water from the toggas ba rely reaches the seas but infiltrates in the coastal plains.
6
Figure 2: General description maps of Gulf of Aden drainage basin
7
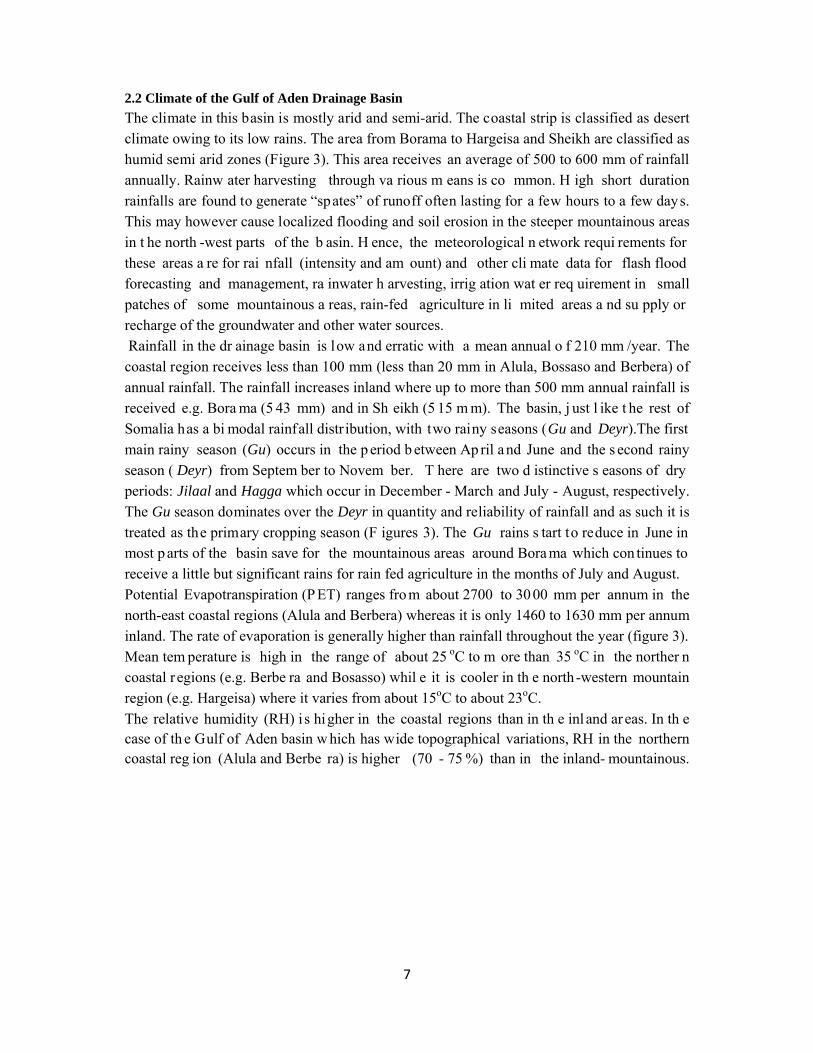
2.2 Climate of the Gulf of Aden Drainage Basin The climate in this basin is mostly arid and semi-arid. The coastal strip is classified as desert climate owing to its low rains. The area from Borama to Hargeisa and Sheikh are classified as humid semi arid zones (Figure 3). This area receives an average of 500 to 600 mm of rainfall annually. Rainw ater harvesting through va rious m eans is co mmon. H igh short duration rainfalls are found to generate “spates” of runoff often lasting for a few hours to a few days. This may however cause localized flooding and soil erosion in the steeper mountainous areas in t he north -west parts of the b asin. H ence, the meteorological n etwork requi rements for these areas a re for rai nfall (intensity and am ount) and other cli mate data for flash flood forecasting and management, ra inwater h arvesting, irrig ation wat er req uirement in small patches of some mountainous a reas, rain-fed agriculture in li mited areas a nd su pply or recharge of the groundwater and other water sources. Rainfall in the dr ainage basin is low and erratic with a mean annual o f 210 mm /year. The coastal region receives less than 100 mm (less than 20 mm in Alula, Bossaso and Berbera) of annual rainfall. The rainfall increases inland where up to more than 500 mm annual rainfall is received e.g. Bora ma (5 43 mm) and in Sh eikh (5 15 m m). The basin, j ust l ike t he rest of Somalia has a bi modal rainfall distr ibution, with two rainy seasons (Gu and Deyr).The first main rainy season (Gu) occurs in the p eriod b etween Ap ril and June and the s econd rainy season ( Deyr) from Septem ber to Novem ber. T here are two d istinctive s easons of dry periods: Jilaal and Hagga which occur in December - March and July - August, respectively. The Gu season dominates over the Deyr in quantity and reliability of rainfall and as such it is treated as the primary cropping season (F igures 3). The Gu rains s tart to reduce in June in most p arts of the basin save for the mountainous areas around Bora ma which con tinues to receive a little but significant rains for rain fed agriculture in the months of July and August. Potential Evapotranspiration (P ET) ranges fro m about 2700 to 30 00 mm per annum in the north-east coastal regions (Alula and Berbera) whereas it is only 1460 to 1630 mm per annum inland. The rate of evaporation is generally higher than rainfall throughout the year (figure 3). Mean tem perature is high in the range of about 25 oC to m ore than 35 oC in the norther n coastal r egions (e.g. Berbe ra and Bosasso) whil e it is cooler in th e north -western mountain region (e.g. Hargeisa) where it varies from about 15oC to about 23oC. The relative humidity (RH) i s higher in the coastal regions than in th e inl and ar eas. In th e case of th e Gulf of Aden basin w hich has wide topographical variations, RH in the northern coastal reg ion (Alula and Berbe ra) is higher (70 - 75 %) than in the inland- mountainous.
8
Figure 3: Mean annual weather pattern maps for Gulf of Aden
9
In the mountainous areas (e.g. Hargeisa) the wind speed is quite high, ranging from around 7 m/s to a peak wind speed of about 11 m/s in Jul y and Augus t. The n orthern coastal areas (e.g. Berb era and Bosasso) have wind speeds varying from around 4 m/s to a high of around 8 m/s in July and August. Like the rest of Somalia, the basin is highly vulnerable to weather related natural disasters with both flash flo ods an d dro ught affecting the watersh ed. SWALIM together with lin e ministries in the respective a reas are r esponsible f or eff ective a nd ti mely collection, analysis a nd di ssemination o f weather i nformation i n S omalia. T he we ather data co llected is very vital in p roducing weat her forecasts and early warning. The weather monitoring network in Somalia was largely reduced by the break of civil war. However, S WALIM and partners have com e on the frontline in efforts t o revive the crucial weather monitoring network all over Somalia. Table 1 summarises the monthly and annual average conditions for the Gulf of Aden Basin.
Figure 4: Monthly rainfall and PET for selected stations in Gulf of Aden Basin
Table 1: Mean Monthly Climate Stat ist ics in Gulf of Drainage Basin
Weather Parameter Jan Feb Mar Apr May Jun Jul Aug Sep Oct Nov Dec Mean Annual
Rainfall (mm) 4 7 15 39 25 12 21 33 30 10 11 4 211
PET (mm) 164 140 176 176 209 274 282 284 238 179 146 141 201
Wind speed (m/s) 6 5 6 5 5 8 9 9 6 5 5 5 6
Mean Temperature (0C) 23 23 25 27 28 31 31 30 29 26 24 23 27
Minimum Temperature (0C ) 17 18 20 22 23 26 26 26 25 21 18 17 22
Maximum Temperature (0C ) 31 29 30 32 34 38 37 37 36 31 29 28 33
10
Figure 5: Climate maps for Gulf of Aden Basin
11
2.3 Surface Water Resources of the Gulf of Aden Drainage Basin The hy drology of the northern parts of the country has been briefly d ocumented by Hunt (1951), Macfadyen (1950) and Humphreys (1960). The most recent one was done in 1980 by SOGREAH and Halcrow. No much attention has been paid to such studies in the recent past despite the need to do so. A wate rshed delineation by SWALIM from 90m DEM shows that there are numerous short togg as dissecting the escarpment facing the Gulf of Aden. Larger toggas are located in the western parts of the basin and drain the mountain areas of Borama, Hargeisa and from Sheikh to Erig avo all dis charging their water to the coastal p lain of the Gulf of Aden. No perennial river of an y importance exists in the basin. Much of the su rface water of the Gulf of Aden b asin is ephemeral and co mmonly appear ing as seasonal pond s (balleh). Streams that flow permanently generally lie on the impervious rock of the highlands, coastal a rea. Streams a lso o ccur in togg as as spat es which transport large a mount of sediments. The w adis and togg as, the sea sonal streams, w here d rainage n etworks are developed, have surface runoff only aft er heavy rainfall. A fter intense rainfall, these small streams can carry high floods and debris. The surface runoff lasts from a few hours to a few days. No long term surface water monitoring has been done in any of these wadis and toggas. Some surface water observations were made in the small streams originating from the plateau in the western region of the Gulf of A den basin by Sogreah in 1980 and 1981. Sogreah monitored 12 hydrometric stations, four w ith water level recorders and eight with staff gauge only in four main catchments in the Gulf of Aden drainage basin. In addition, nine stations were also installed in small catchments with drainage areas between 6 and 1 72 km 2. Sogreah (1981) also concluded that, on average, for unit drainage areas of 100 km2 on the pla teau, the runoff threshold is 24 mm an d the corresponding runoff coefficient is 0.65. In t he case of sm all catchment areas (2-3 km 2) used for rainwater harvesting, the thr eshold rainfall v alue for runoff generation was estimated at 15-20 mm. Wars a nd berkads (also called bailey or water pan, ponds, dam s) used for rain water (catchment) harvesting are common in N orthern So malia. The 2008 point w ater sources survey in n orthern Som alia identified 492 point water sou rces with in th e Gulf of Aden drainage basin. The study b y SWALIM t argeted str ategic point water sour ces including boreholes, dugwells, springs and big dams. Most point water sources are located around the settlements and along the toggas (figure 5). The point water sources in the basin are used for both human and livestock and sometimes for irrigated agriculture. Water quality of the point water sourc es varies fro m plac e to place; th e coastal wate r sources have less quality compared to the ones inland. For instance, during the SWALIM surv ey (2008) it was found that some wells along th e coast had temperatures of about 40 oC and electro condu ctivity of about 8000 µS/cm. The pH was also beyond World Health Organisation (WHO) acceptable levels making such w ater unsuitable for h uman, livestock and agricultural purposes. Due to lack of other better available sources the community still use the wells in their poor quality. Of the 492 water poi nts identified 58% are dug well s (figure 6). This is the majority water point type in the basin. Dugwells are always preferred to boreholes because they are cheaper, easy to maintain and the water level is less deep. The dugwells in the catchment have a depth
12
of up to 30 m and are multipurpose owing to their relative good quality. Springs are also common and comprises of 24 %. The springs are located all over the basin. These are permanent natural point water sources. In some cases the local community protect the springs by building a cover over the well and trapping the water thr ough a pip e. This is recommended to prevent the water from contamination. 12% of them are boreholes. This is a smaller percentage even though the water quality from boreholes is always preferable over that of other well types. Boreholes are expensive to drill and maintain. Most boreholes depths range from 26 t 50 m while there are few that more than 100 m deep.
Figure 6: Point water sources representation in Gulf of Aden Basin
13
Figure 7: Water resources maps for Gulf of Aden Basin
14
2.4 Land Resources of the Gulf of Aden Drainage Basin The Gu lf o f Ad en d rainage ba sin i s mainly made up of sedim entary rocks comprising of limestone, sandstone and evaporatic rocks. Small patches of metamorphic and igneous rocks of the P recambrian and Palaeozoic age ex ists i n the w estern parts of the bas in. T he bas ic structures in this basin are due to normal faulting (Macfadyen 1933) which dates back from the upper Eocene to Oligocene. Faulting of the Gulf of Aden was responsible for the uplift of the p lateau found in no rthern Somalia w hich comprises o f the Golis mountains that are incised by numerous togga. The coastal plain o the Gulf of Aden is about 1km in the east and 60 km wide in the west and is covered by a mantle of stony and sandy alluvium and raised beach deposits. The land surface is of quaternary age with most of the shoreline consisting of raised beaches except for the wide western side which is a basin of subsidence. About 65km west of B erbera there are extensive high dun es (8km wide) of loose sand that are the most desert like in the Gulf of Aden ba sin. These sands a re de rived fro m cr etaceous sandstone, which are locall y up to 1700 m thick (Abate et al 1993 ). 92 % of th e un derlying rock is classified as undifferentiated unconsolidated sediments There are no recent studies of the soils. Historical studies indicate that the soils of the Gulf of Aden basin are dominantly loam and clayey loams that lie on undifferentiated unconsolidated sediments. All soils are strongly reflective of an arid to semi arid climate and the rocks upon which they have been for med, but vary with in texture and composition with l andform and the length of time that the surface has been exposed to biogeochemical weathering. In the agricultural areas ranging from Baki, Gebilley, Hargeisa, down to Sheikh and Erigavo, the soils are mostly loam to clay roam and widely used for crop production. Th e north most region of Awdal is fully covered by sandy soils that are not suitable for crop production. The soil map of the Gulf of Aden identifies eight classes of soil; Aeronosols, calcisols, cambisols, fluvisols, leptosols, rogosols, solonchaks and vertisols.
Figure 8: Soil type percentages in the Gulf of Aden Basin
15
Based on t he agro-eco logical zon es for Somalia th at have been d efined and mapped by SWALIM, the land in t he Gulf of Aden basin is cat egorized as no t suitable for irrigated agriculture. However, some patches of areas along the toggas in the mountainous regions in North Somalia are suited for irrigated agriculture (e.g. Durdur and Gebiley watersheds within the Gulf of Aden drainage basin). S ome ar eas i n the plateau areas in the west parts of t he basin (around Hargeisa) are marginally suitable for rain-fed cultivation. However, these areas are mostly moderately or marginally suitable f or extensive grazing an d forestry plan tation. SWALIM Technical Report No . L-12 (2007) more details of the agro -ecological zon es for Somalia. SWALIM has u ndertaken a la nd suitability assessment in tw o main areas of interest, one in the nort h in the Dur Dur and Gebiley watersheds i n the Gulf of Aden drainag e basi n in Somaliland (Technical Report L-09, 2007) and another in the riverine areas of the Juba and Shabelle rivers (Technical Report L-09, 2007). These were based on v arious land resources surveys carried out by SWALIM. The results of these surveys are documented in SWALIM Technical R eports Nos. L-0 2 (Lan dform), L-0 3 ( Land cover), L-07 (Land use), and L- 08 (Soils), respectively. From SWALIM land suitability studies with the basin, it is seen that only the plateau area with relatively high rainfall is (moderately) suitable for rain fed crops. This area has two short growing pe riods (Gu and D eyr, re spectively), separated b y a sho rt dry period (Hagaa) . Farmers can follow two strategies: either grow a crop with a very short growing period in the Gu and/or Deyr period, or plant a drought resistant crop with a long growth cycle which can make use of both Gu and De yr. Presently farmers in the a rea follow the la tter strategy and grow a sorg hum v ariety w ith a g rowing period of 180 day s. However, an improved early maturing variety is likely to give a better yield then the traditional late maturing variety. Also, any early maturing crop gives the farmer the opportunity to plant a second sequential or relay crop on the same land within a year (SWALIM Technical Report No. L-06, 2007). The Length of Growing Period (LG P) is the period (in days) that moisture supply exceeds half potential evapotranspiration2 (P > 0.5PET). The LGP is calculated over a whole year and may consist of one or more “nor mal” or “intermediate” Growing Periods (GP ), whereby a normal GP is a period in which P exceeds full PET (P>PET) and an intermediate GP a period in which P exceeds half PET, but is less than PET (0.5PET<P<PET). Figure 10 shows maps land resources in the Gulf of Aden Basin.
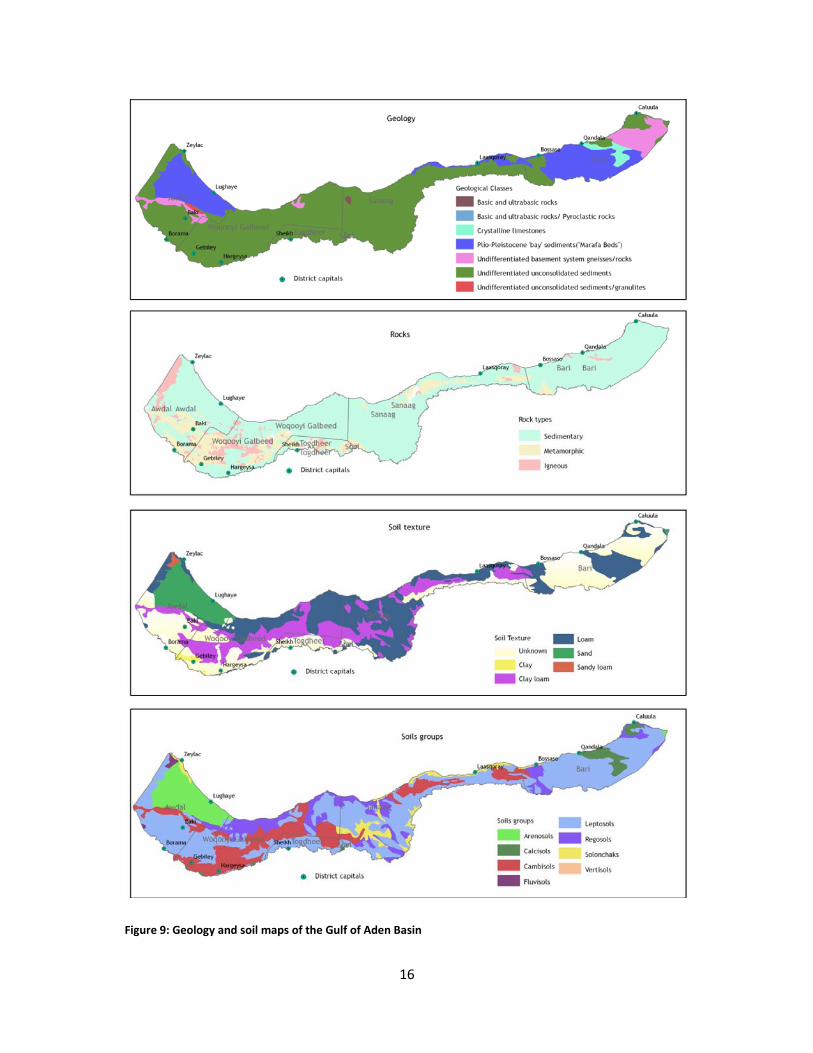
16
Figure 9: Geology and soil maps of the Gulf of Aden Basin
17
Figure 10: Land resources map for the Gulf of Aden Basin
18
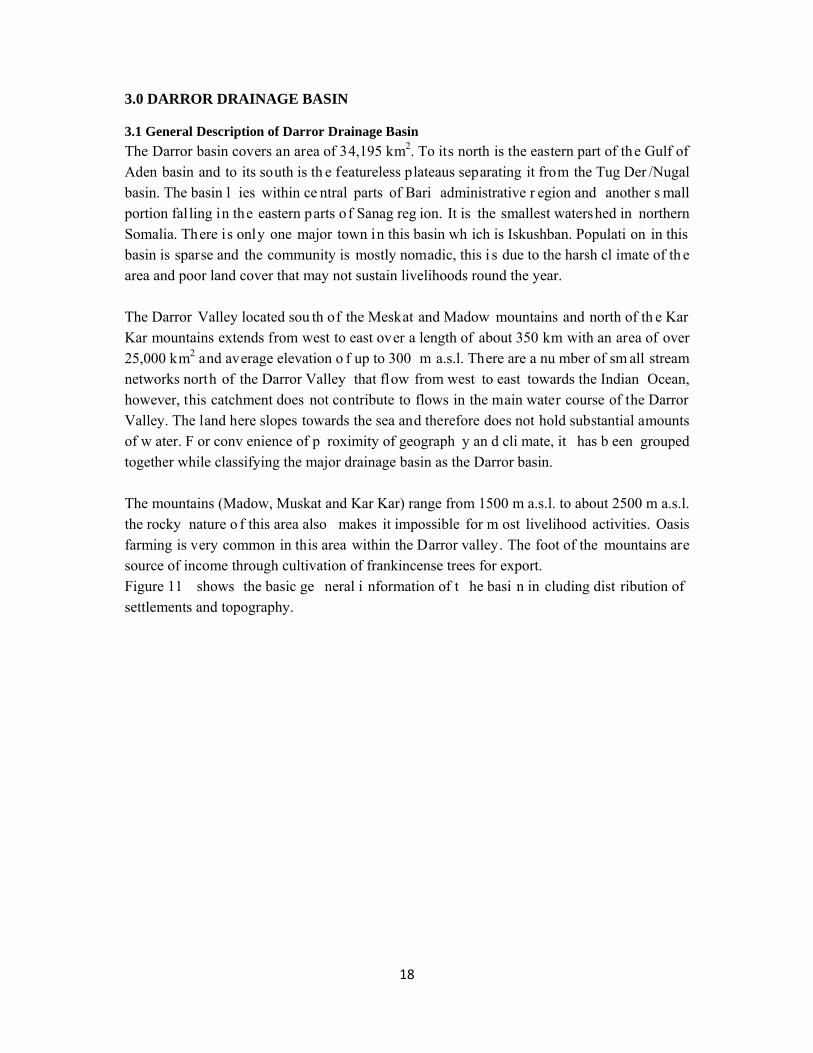
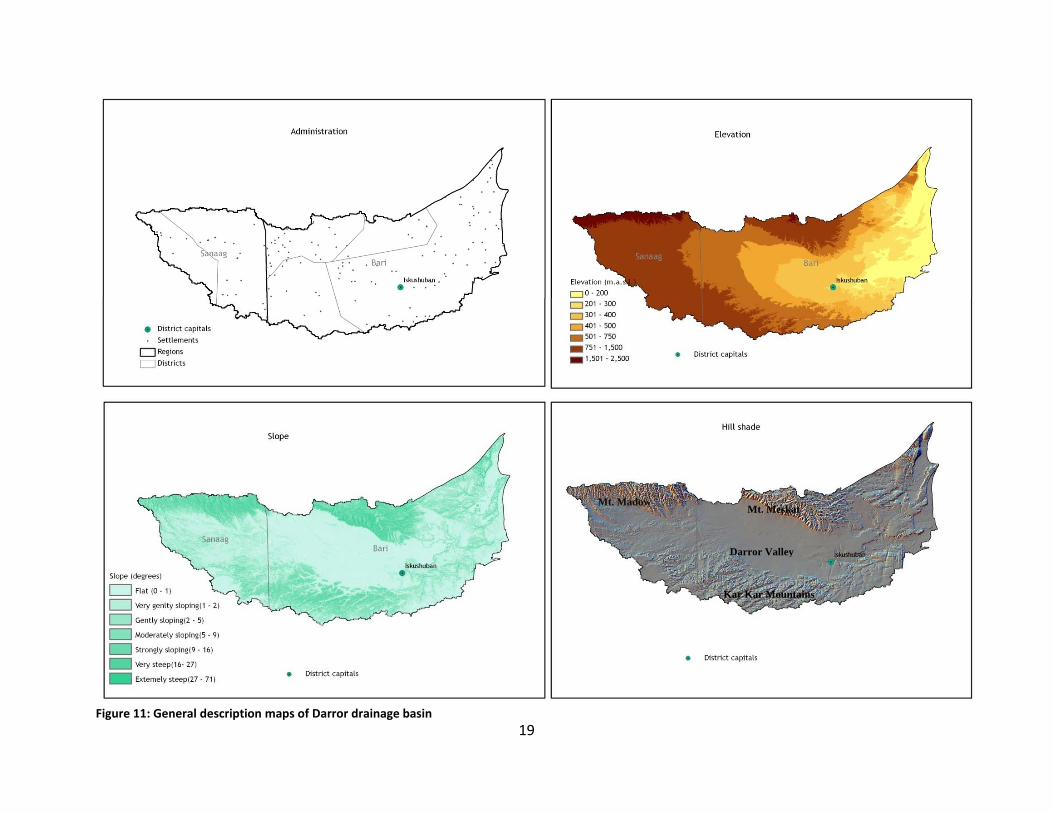
3.0 DARROR DRAINAGE BASIN
3.1 General Description of Darror Drainage Basin The Darror basin covers an area of 34,195 km2. To its north is the eastern part of the Gulf of Aden basin and to its south is th e featureless plateaus separating it from the Tug Der /Nugal basin. The basin l ies within ce ntral parts of Bari administrative r egion and another s mall portion fal ling in the eastern parts of Sanag reg ion. It is the smallest watershed in northern Somalia. There is only one major town in this basin wh ich is Iskushban. Populati on in this basin is sparse and the community is mostly nomadic, this i s due to the harsh cl imate of th e area and poor land cover that may not sustain livelihoods round the year. The Darror Valley located sou th of the Meskat and Madow mountains and north of th e Kar Kar mountains extends from west to east over a length of about 350 km with an area of over 25,000 km2 and average elevation o f up to 300 m a.s.l. There are a nu mber of sm all stream networks north of the Darror Valley that flow from west to east towards the Indian Ocean, however, this catchment does not contribute to flows in the main water course of the Darror Valley. The land here slopes towards the sea and therefore does not hold substantial amounts of w ater. F or conv enience of p roximity of geograph y an d cli mate, it has b een grouped together while classifying the major drainage basin as the Darror basin. The mountains (Madow, Muskat and Kar Kar) range from 1500 m a.s.l. to about 2500 m a.s.l. the rocky nature o f this area also makes it impossible for m ost livelihood activities. Oasis farming is very common in this area within the Darror valley. The foot of the mountains are source of income through cultivation of frankincense trees for export. Figure 11 shows the basic ge neral i nformation of t he basi n in cluding dist ribution of settlements and topography.
19
Figure 11: General description maps of Darror drainage basin
Mt. Madow Mt. Meskat
Kar Kar Mountains
Darror Valley
20
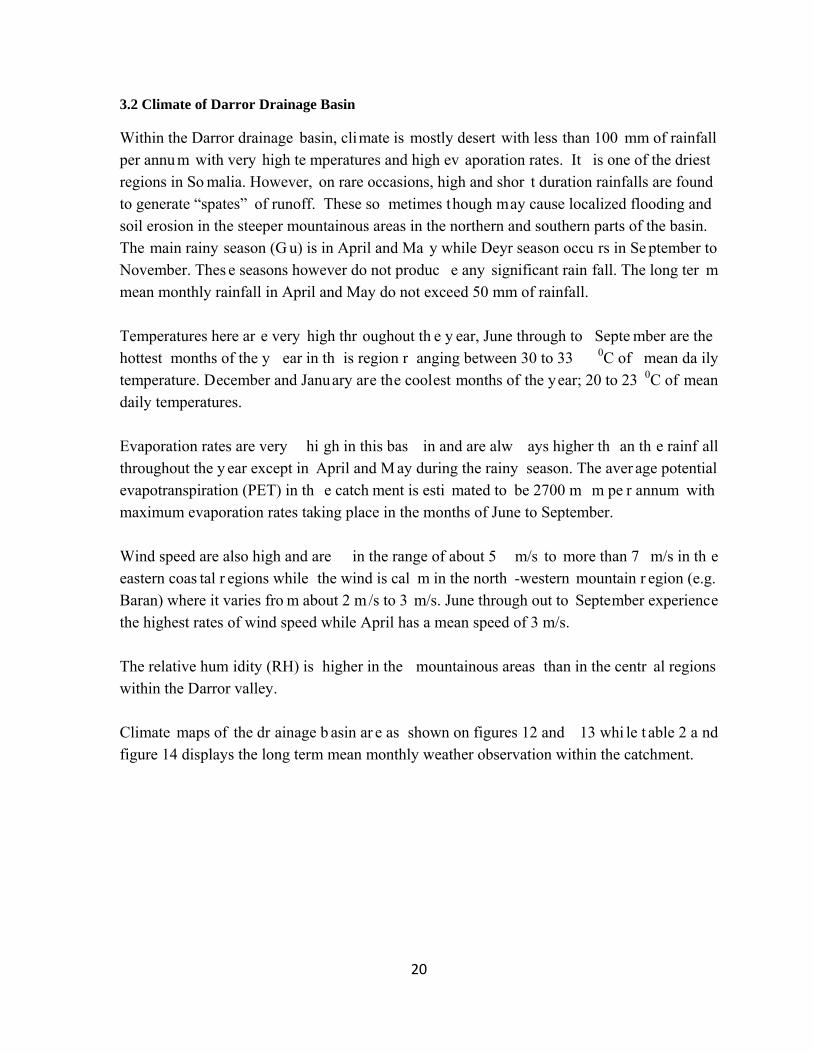
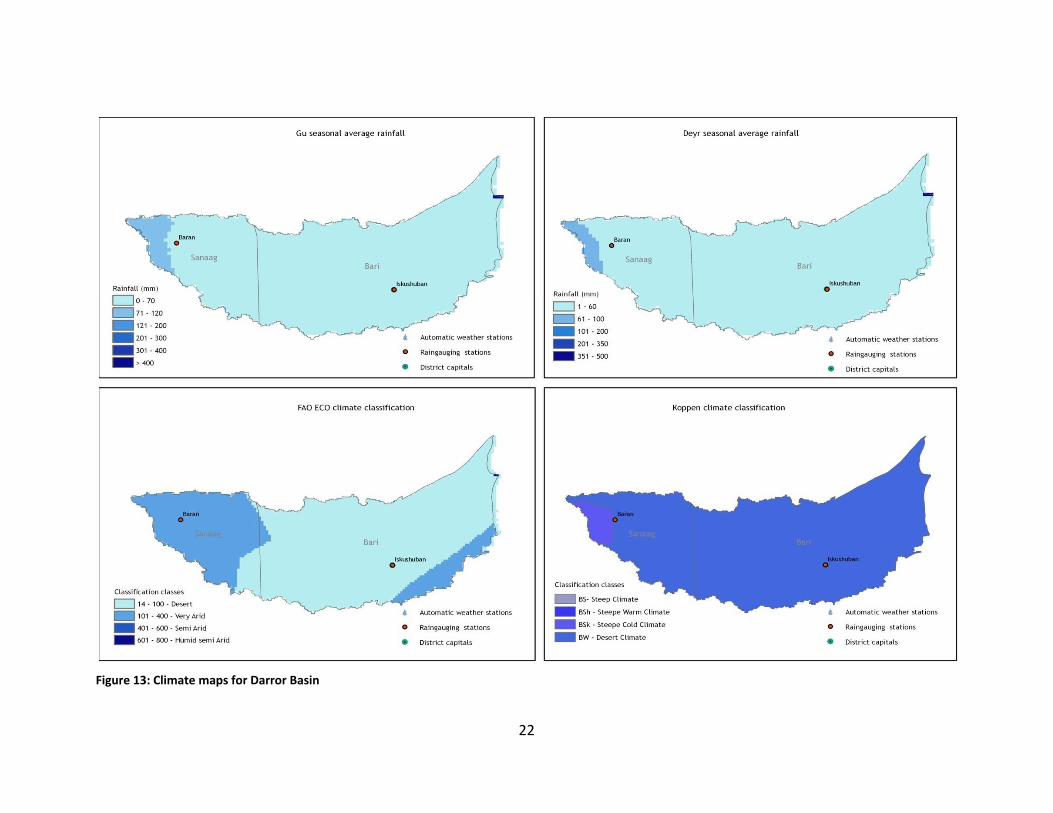
3.2 Climate of Darror Drainage Basin
Within the Darror drainage basin, climate is mostly desert with less than 100 mm of rainfall per annu m with very high te mperatures and high ev aporation rates. It is one of the driest regions in So malia. However, on rare occasions, high and shor t duration rainfalls are found to generate “spates” of runoff. These so metimes though may cause localized flooding and soil erosion in the steeper mountainous areas in the northern and southern parts of the basin. The main rainy season (G u) is in April and Ma y while Deyr season occu rs in Se ptember to November. Thes e seasons however do not produc e any significant rain fall. The long ter m mean monthly rainfall in April and May do not exceed 50 mm of rainfall. Temperatures here ar e very high thr oughout th e y ear, June through to Septe mber are the hottest months of the y ear in th is region r anging between 30 to 33 0C of mean da ily temperature. December and January are the coolest months of the year; 20 to 23 0C of mean daily temperatures. Evaporation rates are very hi gh in this bas in and are alw ays higher th an th e rainf all throughout the y ear except in April and M ay during the rainy season. The aver age potential evapotranspiration (PET) in th e catch ment is esti mated to be 2700 m m pe r annum with maximum evaporation rates taking place in the months of June to September. Wind speed are also high and are in the range of about 5 m/s to more than 7 m/s in th e eastern coas tal r egions while the wind is cal m in the north -western mountain r egion (e.g. Baran) where it varies fro m about 2 m /s to 3 m/s. June through out to September experience the highest rates of wind speed while April has a mean speed of 3 m/s. The relative hum idity (RH) is higher in the mountainous areas than in the centr al regions within the Darror valley. Climate maps of the dr ainage b asin ar e as shown on figures 12 and 13 whi le t able 2 a nd figure 14 displays the long term mean monthly weather observation within the catchment.
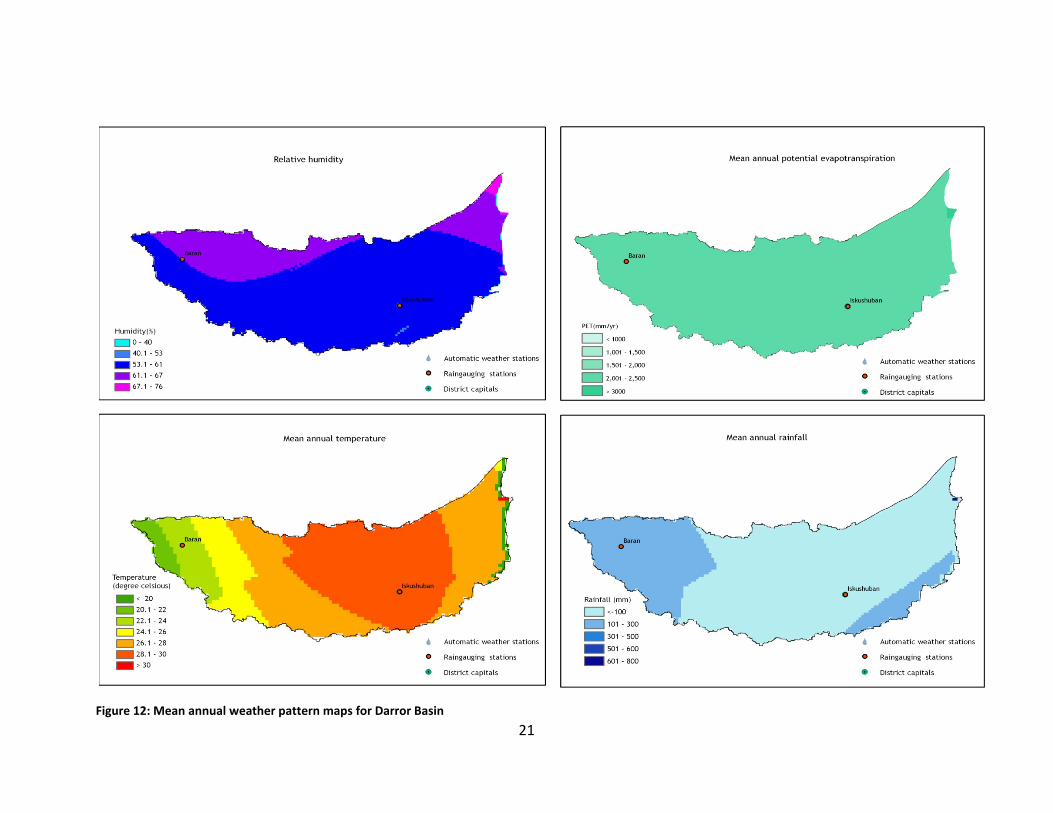
21
Figure 12: Mean annual weather pattern maps for Darror Basin
22
Figure 13: Climate maps for Darror Basin
23
0
50
100
150
200
250
300
350
0.0
5.0
10.0
15.0
20.0
25.0
Jan Feb Mar Apr May Jun Jul Aug Sep Oct Nov Dec
Rainfall (m
m)
PET (m
m)
Iscushban
RainPET
Figure 14: Mean monthly weather observations at Iscushban
Table 1: Mean Monthly Climate Statistics in Darror Drainage Basin
Weather Parameter Jan Feb Mar Apr May Jun Jul Aug Sep Oct Nov Dec
Mean Monthly Rainfall (mm) 0.0 0. 0 3. 0 22.0 21.0 2.0 0. 0 5. 0 7. 0 6. 0 5. 0 1. 0
Mean Monthly Vapour pressure
20.1 21.1 23.0 25.0 25.2 26.3 26.0 26.3 26.3 24.2 22.0 21.0
Monthly PET 173.6 151. 2 198. 4 201. 0 272. 8 315. 0 300. 7 310. 0 288. 0 207. 7 165. 0 170. 5
Monthly Wind speed (m/s) 5.6 4.2 3.9 3.0 4.4 7.5 7.4 7.5 6.5 3.4 3.5 4.5
Mean Daily Temperature (0C) 25.9 26. 2 29. 3 31. 7 34. 9 34. 9 33. 7 34. 2 34. 4 31. 4 28. 2 27. 2
Minimum Temperature (0C) 17.7 17.8 20.0 22.6 24.0 25.2 25.1 25.2 24.7 21.2 19.1 18.5
Maximum Temperature (0C) 29.8 30. 1 33. 6 36. 0 40. 0 39. 5 37. 7 38. 5 39. 0 36. 2 32. 5 31. 3
24
3.3 Surface Water Resources of Darror Drainage Basin
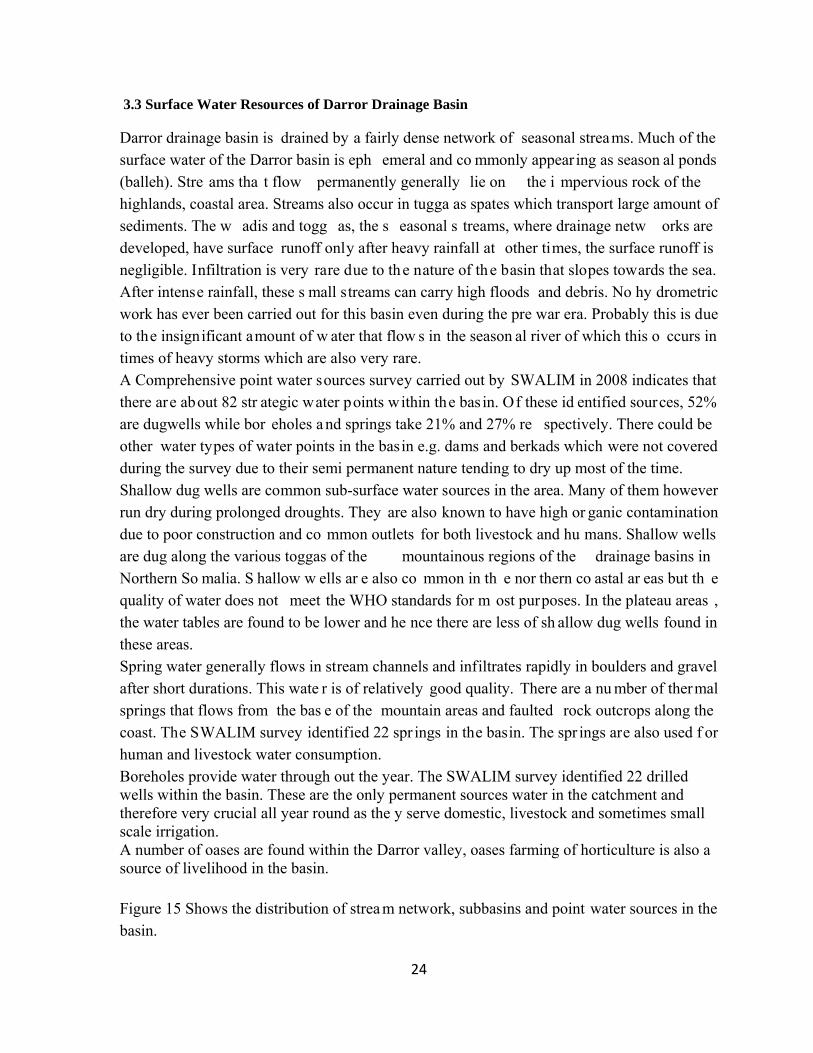
Darror drainage basin is drained by a fairly dense network of seasonal streams. Much of the surface water of the Darror basin is eph emeral and co mmonly appear ing as season al ponds (balleh). Stre ams tha t flow permanently generally lie on the i mpervious rock of the highlands, coastal area. Streams also occur in tugga as spates which transport large amount of sediments. The w adis and togg as, the s easonal s treams, where drainage netw orks are developed, have surface runoff only after heavy rainfall at other times, the surface runoff is negligible. Infiltration is very rare due to the nature of the basin that slopes towards the sea. After intense rainfall, these s mall streams can carry high floods and debris. No hy drometric work has ever been carried out for this basin even during the pre war era. Probably this is due to the insignificant amount of w ater that flow s in the season al river of which this o ccurs in times of heavy storms which are also very rare. A Comprehensive point water sources survey carried out by SWALIM in 2008 indicates that there are about 82 str ategic water points within the bas in. Of these id entified sources, 52% are dugwells while bor eholes a nd springs take 21% and 27% re spectively. There could be other water types of water points in the basin e.g. dams and berkads which were not covered during the survey due to their semi permanent nature tending to dry up most of the time. Shallow dug wells are common sub-surface water sources in the area. Many of them however run dry during prolonged droughts. They are also known to have high or ganic contamination due to poor construction and co mmon outlets for both livestock and hu mans. Shallow wells are dug along the various toggas of the mountainous regions of the drainage basins in Northern So malia. S hallow w ells ar e also co mmon in th e nor thern co astal ar eas but th e quality of water does not meet the WHO standards for m ost purposes. In the plateau areas , the water tables are found to be lower and he nce there are less of sh allow dug wells found in these areas. Spring water generally flows in stream channels and infiltrates rapidly in boulders and gravel after short durations. This wate r is of relatively good quality. There are a nu mber of thermal springs that flows from the bas e of the mountain areas and faulted rock outcrops along the coast. The SWALIM survey identified 22 spr ings in the basin. The spr ings are also used f or human and livestock water consumption. Boreholes provide water through out the year. The SWALIM survey identified 22 drilled wells within the basin. These are the only permanent sources water in the catchment and therefore very crucial all year round as the y serve domestic, livestock and sometimes small scale irrigation. A number of oases are found within the Darror valley, oases farming of horticulture is also a source of livelihood in the basin. Figure 15 Shows the distribution of strea m network, subbasins and point water sources in the basin.
25
Figure 15: Water resources maps of Darror Basin
26
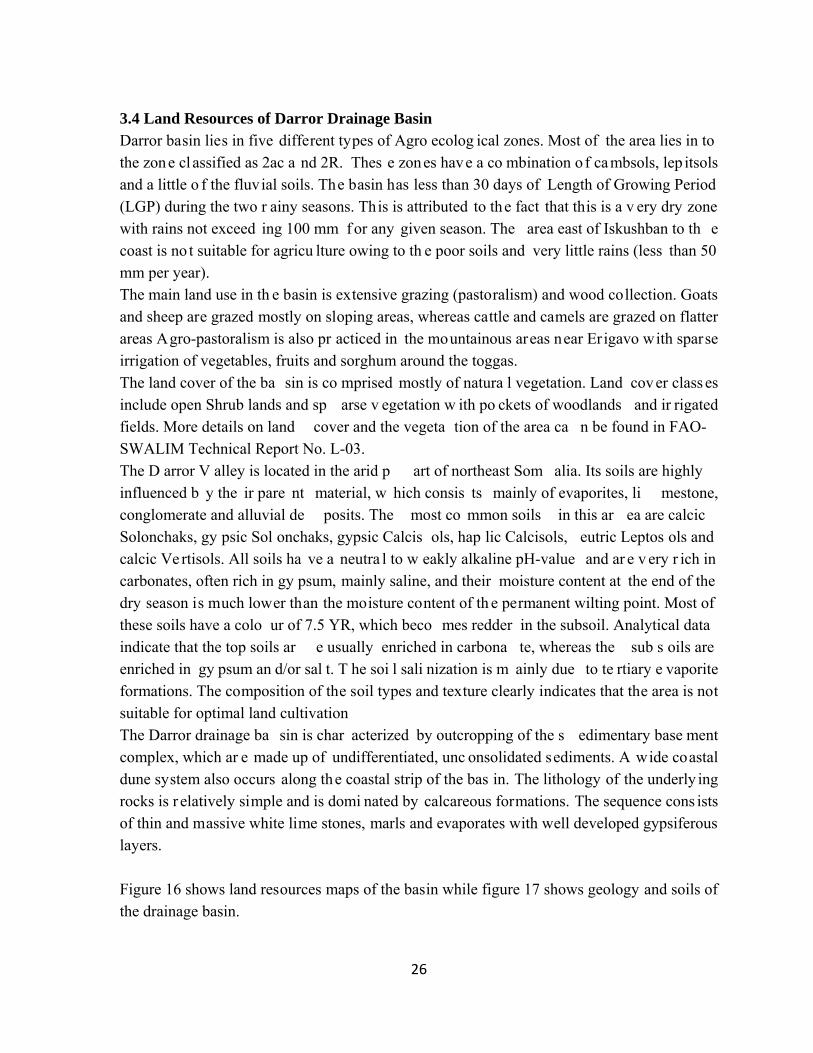
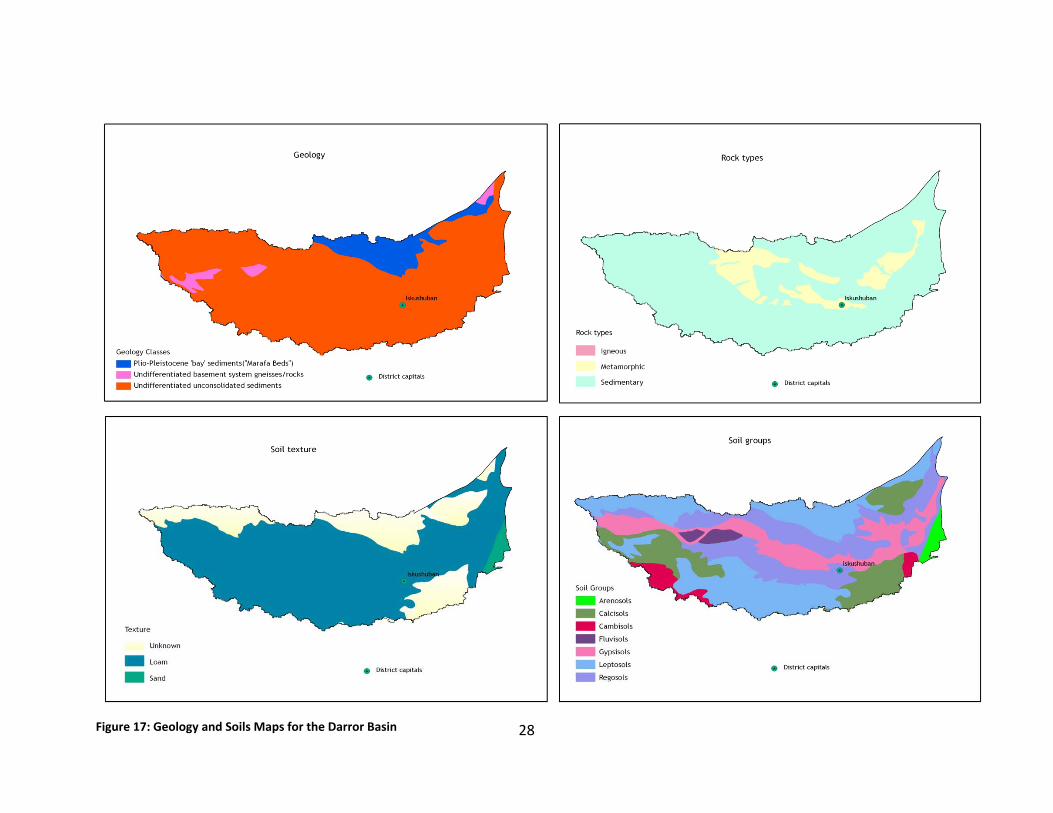
3.4 Land Resources of Darror Drainage Basin Darror basin lies in five different types of Agro ecolog ical zones. Most of the area lies in to the zone cl assified as 2ac a nd 2R. Thes e zones have a co mbination o f cambsols, lep itsols and a little o f the fluvial soils. The basin has less than 30 days of Length of Growing Period (LGP) during the two r ainy seasons. This is attributed to the fact that this is a v ery dry zone with rains not exceed ing 100 mm f or any given season. The area east of Iskushban to th e coast is no t suitable for agricu lture owing to th e poor soils and very little rains (less than 50 mm per year). The main land use in th e basin is extensive grazing (pastoralism) and wood collection. Goats and sheep are grazed mostly on sloping areas, whereas cattle and camels are grazed on flatter areas Agro-pastoralism is also pr acticed in the mountainous areas near Erigavo with sparse irrigation of vegetables, fruits and sorghum around the toggas. The land cover of the ba sin is co mprised mostly of natura l vegetation. Land cov er class es include open Shrub lands and sp arse v egetation w ith po ckets of woodlands and ir rigated fields. More details on land cover and the vegeta tion of the area ca n be found in FAO-SWALIM Technical Report No. L-03. The D arror V alley is located in the arid p art of northeast Som alia. Its soils are highly influenced b y the ir pare nt material, w hich consis ts mainly of evaporites, li mestone, conglomerate and alluvial de posits. The most co mmon soils in this ar ea are calcic Solonchaks, gy psic Sol onchaks, gypsic Calcis ols, hap lic Calcisols, eutric Leptos ols and calcic Ve rtisols. All soils ha ve a neutra l to w eakly alkaline pH-value and ar e v ery r ich in carbonates, often rich in gy psum, mainly saline, and their moisture content at the end of the dry season is much lower than the moisture content of th e permanent wilting point. Most of these soils have a colo ur of 7.5 YR, which beco mes redder in the subsoil. Analytical data indicate that the top soils ar e usually enriched in carbona te, whereas the sub s oils are enriched in gy psum an d/or sal t. T he soi l sali nization is m ainly due to te rtiary e vaporite formations. The composition of the soil types and texture clearly indicates that the area is not suitable for optimal land cultivation The Darror drainage ba sin is char acterized by outcropping of the s edimentary base ment complex, which ar e made up of undifferentiated, unc onsolidated sediments. A wide coastal dune system also occurs along the coastal strip of the bas in. The lithology of the underly ing rocks is r elatively simple and is domi nated by calcareous formations. The sequence cons ists of thin and massive white lime stones, marls and evaporates with well developed gypsiferous layers. Figure 16 shows land resources maps of the basin while figure 17 shows geology and soils of the drainage basin.

27
Figure 16: Land Resources Maps for the Darror Basin
28
Figure 17: Geology and Soils Maps for the Darror Basin
29
47%
41%
11%
1%
Land Cover Classes in Darror Watershed
Shrubland
Sparse Vegetation
Woodland
Woodland/Irrigated fields
Figure 18: Representation of land cover classes in the Darror Basin
1%
9% 2%
9%
1%
39%7%2%
0%
24%
1%
4%
1%
Land Use systems in Darror watershed
Pastoralism (low density)/Frankincense: shoats
Pastoralism (low density)/Frankincense: goats
Pastoralism (medium density)/Dates oasis farming: goats
Pastoralism (low density)/Frankincense: shoats
Agropastoralism (low density)/wood collection with sparce irrig. farms/Frankincense: goats, cattlePastoralism (medium density)/Oasis farming: shoats, camels, cattle
Agropastoral (medium density of fields)with sparse irrig.fields around togas:vegets,fruits,sorghum, shoatsPastoralism (low density) in coastal plain/dunes: shoats, camels
Figure 19: Representation of land use systems in the Darror Basin
30
4.0: TUG DER/NUGAAL DRAINAGE BASIN
4.1 General Description of Tug Der/Nugaal Drainage Basin The Tug D er/Nugaal basin lies within five administrative regions in northern S omalia: Togdheer, Sool, Sanaag, Bari and Nugaal. The population is mainly concentrated in the town centres and along the coas tline. Garowe, the hea dquarters of the s emi autonomous Puntland state is located in this ba sin. Other i mportant towns in the watershed include Las Anod, Burco, Erigavo and Qardo (Figure 20). The Tug N ugal dr ains the Nuga l r egion and parts of the T ogdheer and Sool regions. The Nugal valley extends over 600 k m in length with elevations vary ing from about sea level in the east to 1,200 m above sea leve l in the wes t. The Sool Platea u, a nearl y featureless plain covered by limestone and marls, lie between the Darror and Nugal valleys. The elevations of the basin area vary fr om sea level in the west to over 2000 m in the m ountain area of the north-east of the basin. The hi ghest point is 2,233 m. Abou t 24% lies below 500 m , 58% between 500-1000 m , 15% be tween 1000-1500 m, 3% between 1500-2000 m and a s mall part of the basin (<1%) is above 2000 m. A lar ge part of the drainage basin is made up of gently sloping plains such as the Sool Plateau, Sool Ha ud and Qardo Plateaus, and the Karman and Gubato plains.
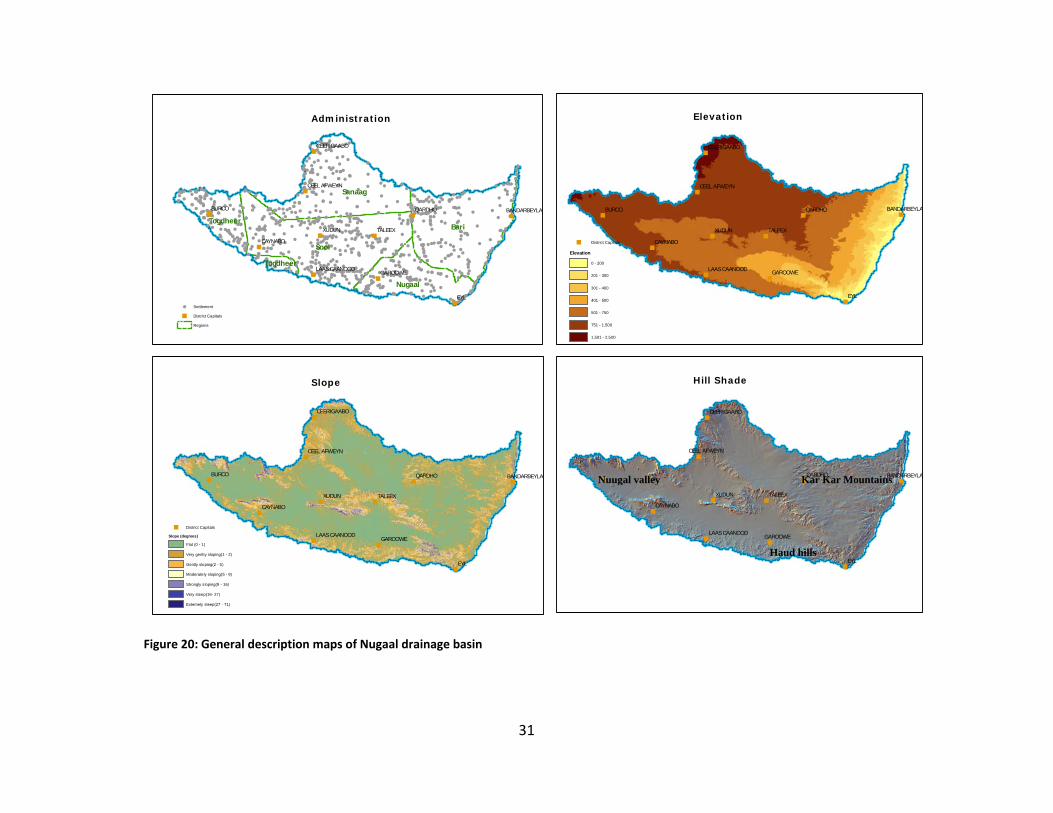
31
Figure 20: General description maps of Nugaal drainage basin
""
"
"
"
"
"
"
""
"
EYL
BURCO
XUDUN TALEEX
QARDHO
CAYNABO
GAROOWE
CEERIGAABO
CEEL AFWEYN
BANDARBEYLA
LAAS CAANOOD
""
"
"
"
"
"
"
""
"
Sool
Bari
Sanaag
Nugaal
Togdheer
Togdheer
EYL
XUDUN TALEEX
QARDHO
CAYNABO
GAROOWE
CEERIGAABO
CEEL AFWEYN
BANDARBEYLA
LAAS CAANOOD" District Capitals
Slope (degrees)
Flat (0 - 1)
Very genlty sloping(1 - 2)
Gently sloping(2 - 5)
Moderately sloping(5 - 9)
Strongly sloping(9 - 16)
Very steep(16- 27)
Extemely steep(27 - 71)
!
!
!!
!! !!
!!
!!
!
!
!
!
!
!
!
!
!
!
! !
!
!
!
!!
!
!
!
! !!
!
!
!
!
!
!
!!
!
!!!
!
! !
!
!!
!!
!
!
!
!
!!
!!!
!
!
!
!!!!
!
!
!
!
!!!
!
!!
! !
!
!
!
!
!
!!!
!!
!! !
!!
!
!
!
!!!
!
!!
!!
!!
!
!
!
!
!
!
!
!
!
!
!!!
!
!
!
!
!!
!!!
!
!
!!
!
!
!
!
!
!
!
!
!
!
!
!
!!
!
!!!
!!
! !
!
!!
!!
!
!
!
!
!
!
!
!!
!
!
!
!
!
!
!
!
!
!
!
!!
!
!
! !
!
!
!
!
!
!
!
!
!
!
!!
!
!
!
!!
!
!
!
!
!
! !
!
!
!
!
!
!
!
!
!
!
!
!
!!
!
!!
!
!
!
!!
!
!
!!
!
!
!
!
!
!
!
!
!
!!
!
!
!!
!
!
!
!
!
!
!
!!
!
!
!
!!
!
!
!
!
!
!
!
!
!
!!
!!
!
!!
!
!
!!!
! !
!
!
!
!!
!
!!
!!
!!
! !
!
!!!!
!!!!!
!
!
!
!
!
!
! !
!
!
!
!
!! ! !
!
!
!
!
!
!!
!
!
!
!!
!
!
!
!
!
!!
!
!!
!
!
!!
!
!
!!!
!!
!
!
!!!!
!
!
!
!
!
!
!
!
!!
!
!!
!
!
!
!
!
!
!!
!
!
!
!
!
!
!
!
!
!
!
!!
!
!
!
!
!
!
!!
!
!
!
!
!
!
!!
!
!
!! !
!
!
!
!
!!
!
!
!!
!
!!
!
!
!!
!
!
!
!
!
!
!
!
!!
!
!
!
!!
!
!
!
!
!
!
!
!
!
!!
!
!!
!
!
!
!
!
!!
!
!!
!
!!
!!
!
!!
!!
!
!
!
!
!
!!
!
!
!!
!
!!
!
!!!!!
!!!
!
!!
!
!
!!!
!
!
!!
!
!
!
!
!!
!
!!!!
!
!
!
!
!
!!!
!
!
!
!
!
!
!
!
!
!!!
!!!
!
!!
!!!
!
!
!
!
!
!
!!
!
!
!
!
!
!!
!
!!!!
!!!!
!
!!!!!!!!
!
!
!!
!
!!!!
!
!!!!
!
! !!
!!
!!
!!
!!!!!
!!
!!
!!
!!
!!!!
!
!!!!!!!
!!!
!!
!!!!
!
!
!
!!!
!!
! !!!
!!!!
!!!!!!
!!!!! !!!!!!!
!!!! !
!!
!!!!!!
!!!!!!!
!!!!
!!!
! !
!
!!!
!
!!!! ! !!!
!!!!! !
!!!!!
!
!
! !! !
!!!!!!
!!!!!
!!!!! !!
!!
!!
!!!
!
!!
!!!!!
!
!!!!!
!!!
!!
!!
!!!!!!!!!!
!!!!!!!
!!
!!
!
! !
!
!
!!!!!
!!!
!!!!!!! !!!!
!!!!
!
!!!
!!
!!!!
!
! !!!
!!!!!
!
!!!!!!!!!!!
!!!
!!
!! !!
!
!!!!
!!
!!
!! !!
!!!!
!!
!!!
! !
!! !!!
!
!!
!!!!!
! !!!!!
""
"
"
"
"
"
"
""
"
Sool
Bari
Sanaag
Nugaal
Togdheer
Togdheer
EYL
BURCO
XUDUN TALEEX
QARDHO
CAYNABO
GAROOWE
CEERIGAABO
CEEL AFWEYN
BANDARBEYLA
LAAS CAANOOD
! Settlement
" District Capitals
Regions
""
"
"
"
"
"
"
""
"
EYL
BURCO
XUDUN TALEEX
QARDHO
CAYNABO
GAROOWE
CEERIGAABO
CEEL AFWEYN
BANDARBEYLA
LAAS CAANOOD
" District Capitals
Elevation
0 - 200
201 - 300
301 - 400
401 - 500
501 - 750
751 - 1,500
1,501 - 2,500
Hill ShadeSlope
Administration Elevation
Kar Kar Mountains
Haud hills
Nuugal valley
32
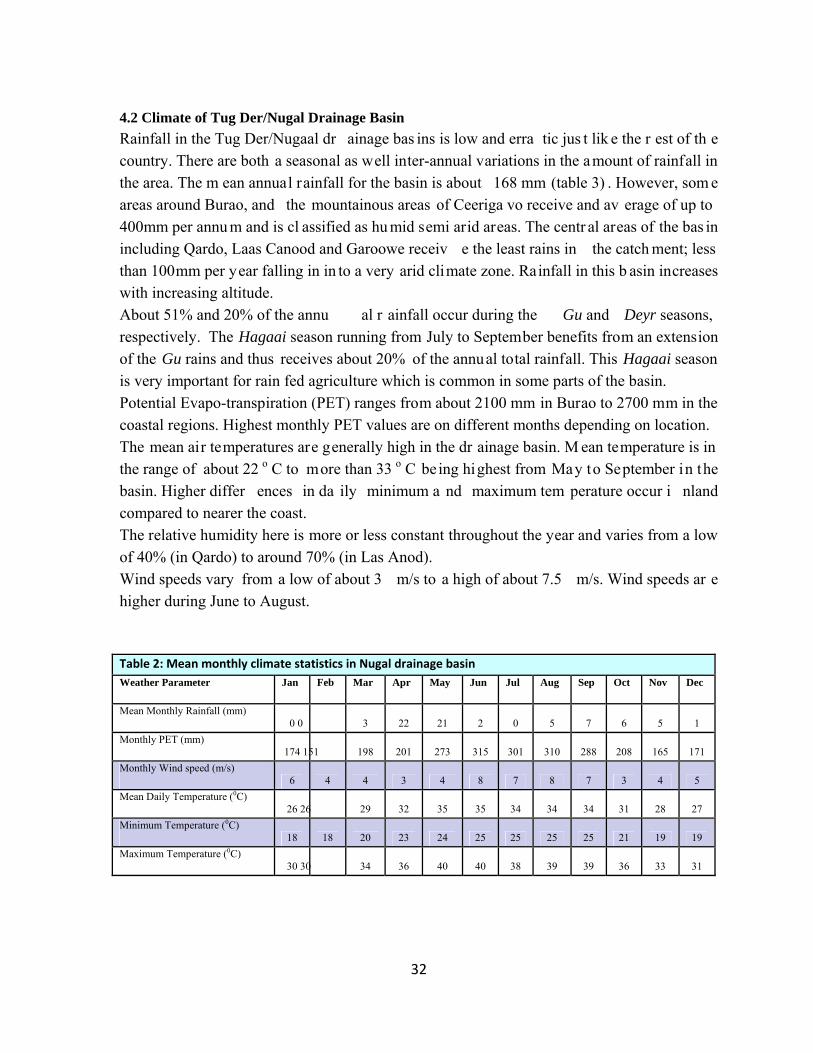
4.2 Climate of Tug Der/Nugal Drainage Basin Rainfall in the Tug Der/Nugaal dr ainage bas ins is low and erra tic jus t lik e the r est of th e country. There are both a seasonal as well inter-annual variations in the amount of rainfall in the area. The m ean annual rainfall for the basin is about 168 mm (table 3) . However, som e areas around Burao, and the mountainous areas of Ceeriga vo receive and av erage of up to 400mm per annu m and is cl assified as hu mid semi arid areas. The centr al areas of the bas in including Qardo, Laas Canood and Garoowe receiv e the least rains in the catch ment; less than 100mm per year falling in in to a very arid climate zone. Rainfall in this b asin increases with increasing altitude. About 51% and 20% of the annu al r ainfall occur during the Gu and Deyr seasons, respectively. The Hagaai season running from July to September benefits from an extension of the Gu rains and thus receives about 20% of the annual total rainfall. This Hagaai season is very important for rain fed agriculture which is common in some parts of the basin. Potential Evapo-transpiration (PET) ranges from about 2100 mm in Burao to 2700 mm in the coastal regions. Highest monthly PET values are on different months depending on location. The mean air temperatures are generally high in the dr ainage basin. M ean temperature is in the range of about 22 o C to more than 33 o C being highest from May to September in the basin. Higher differ ences in da ily minimum a nd maximum tem perature occur i nland compared to nearer the coast. The relative humidity here is more or less constant throughout the year and varies from a low of 40% (in Qardo) to around 70% (in Las Anod). Wind speeds vary from a low of about 3 m/s to a high of about 7.5 m/s. Wind speeds ar e higher during June to August. Table 2: Mean monthly climate statistics in Nugal drainage basin Weather Parameter Jan Feb Mar Apr May Jun Jul Aug Sep Oct Nov Dec
Mean Monthly Rainfall (mm) 0 0 3 22 21 2 0 5 7 6 5 1
Monthly PET (mm) 174 151 198 201 273 315 301 310 288 208 165 171
Monthly Wind speed (m/s) 6 4 4 3 4 8 7 8 7 3 4 5
Mean Daily Temperature (0C) 26 26 29 32 35 35 34 34 34 31 28 27
Minimum Temperature (0C) 18 18 20 23 24 25 25 25 25 21 19 19
Maximum Temperature (0C) 30 30 34 36 40 40 38 39 39 36 33 31
33
Figure 21: Mean annual weather pattern maps for Nugaal basin
34
Figure 22: Climate maps for Nugaal drainage basin
35
4.3 Surface Water Resources of Tug Der/Nugaal Drainage Basin Tug Der and Tug Nugal are tw o main drainage sy stems, which f orms a l arge v alley extending over 600 km in length in the southern and western parts of the drainage basin. The total catchment area of the drainage basin is about 112,231 k m2. An interesting part of this drainage basin is the Xingalol internal drainage basin whic h re ceives wa ter from the Sool Haud Plateau. In the Tug Der/Nugal drainage basin, some surface water records are available for Tug Der at Burao for six y ears during 1945 to 1950. During th is period, an averag e of about 33 spates was recorded per y ear. About 85% of these occurred during th e five months from May to September. It is es timated th at an av erage r unoff of 33 m illion m 3 (MCM) p er y ear, equivalent to about 22 mm in the 1500 k m2 catchment, occurs in the area (runoff coefficient of 0.06) ( Kammer,1989). Although som e mountainous ar eas in the basin contain som e surface w ater, in oth er plain and p lateau ar eas mos t r ainfall is los t and lit tle sur face w ater ever reaches the Indian Ocean. The 2008 SWALIM point water sources survey identified a total of 536 strategic point water sources in the Tug Der/Nugaal basin. Dug wells are common in the basin as water especially along the dry river beds where th e water table is not very low. 298 dug wells were identified which is about 56% of the total nu mber of w ater sources in the ca tchment (figure 23). The dug wells in this bas in are a few meters deep and can store water for a longer time compared to berkads and dams which run dry as soon as the rains are gone. Boreholes are also widely used and the SWAL IM surve y iden tified a total of 198 (26%) boreholes. The boreholes are mainly along the river beds and have varying depth of up to 300 m dip. In some areas the boreholes are used for small scale irrigation when no other source is available. Springs are mainly concentrated along the co astal strip of the basin. They comprise of 17% of the point water sources in the basin. Groundwater recharge is thr ough direct rainfall, amount of infiltr ation is esti mated to be not more than 5 % of the rainfall due to low and erratic rainfall (Faillace and Faillace, 1987).
Figure 23: Representation of point water sources distribution in Nugaal drainage basin
1%
25%
56%
1%
17%
Water Sources inTug der Wateshed
Dam
Drilledwell
Dugwell
Other
Spring
36
Figure 24: Water resources maps of Nugaal drainage basin
37
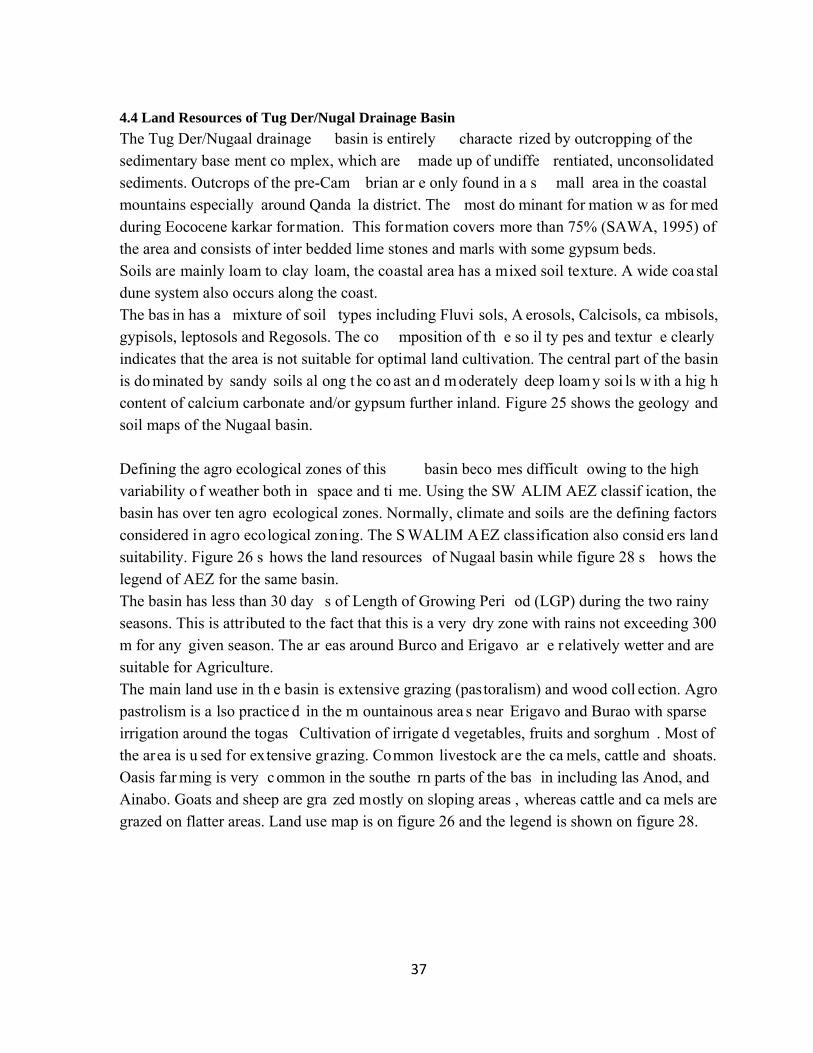
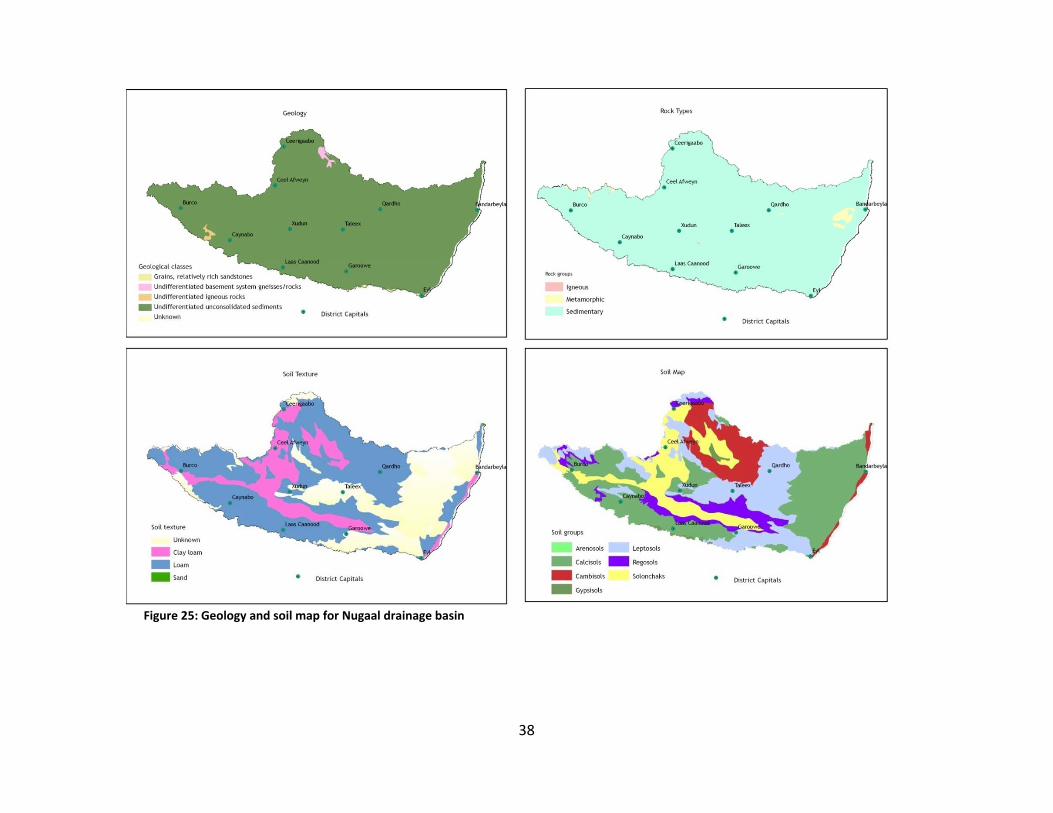
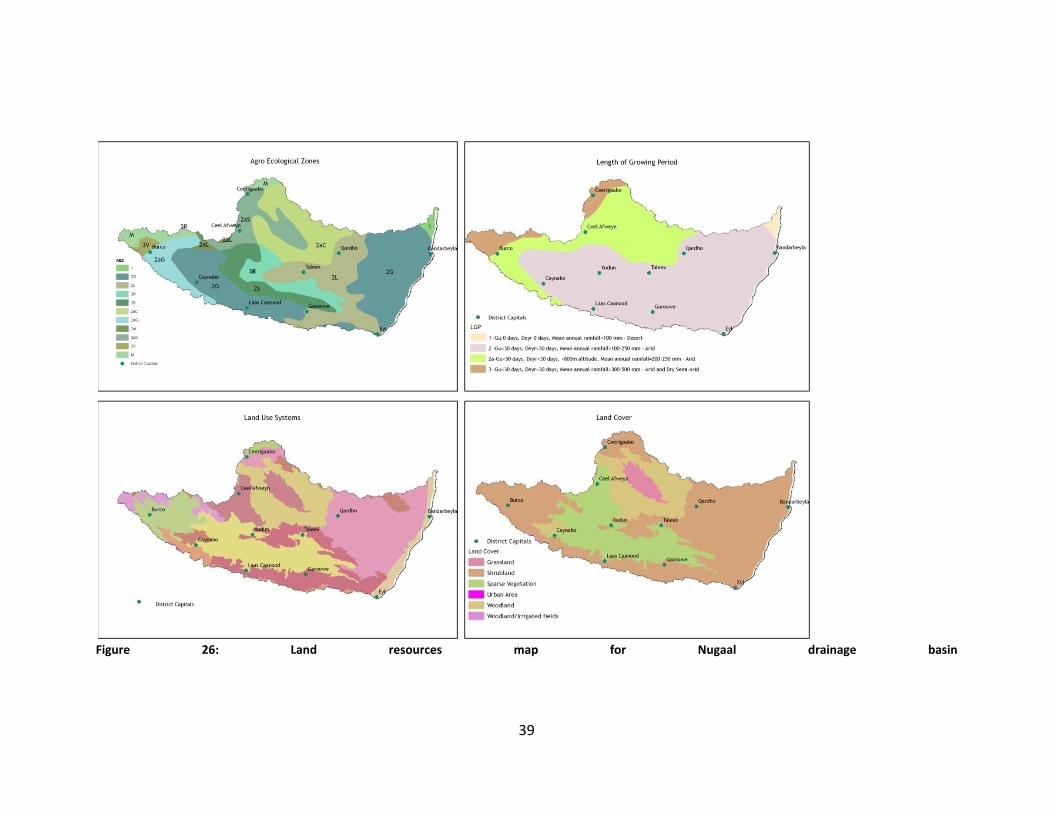
4.4 Land Resources of Tug Der/Nugal Drainage Basin The Tug Der/Nugaal drainage basin is entirely characte rized by outcropping of the sedimentary base ment co mplex, which are made up of undiffe rentiated, unconsolidated sediments. Outcrops of the pre-Cam brian ar e only found in a s mall area in the coastal mountains especially around Qanda la district. The most do minant for mation w as for med during Eococene karkar formation. This formation covers more than 75% (SAWA, 1995) of the area and consists of inter bedded lime stones and marls with some gypsum beds. Soils are mainly loam to clay loam, the coastal area has a mixed soil texture. A wide coastal dune system also occurs along the coast. The bas in has a mixture of soil types including Fluvi sols, A erosols, Calcisols, ca mbisols, gypisols, leptosols and Regosols. The co mposition of th e so il ty pes and textur e clearly indicates that the area is not suitable for optimal land cultivation. The central part of the basin is do minated by sandy soils al ong t he co ast an d m oderately deep loamy soi ls w ith a hig h content of calcium carbonate and/or gypsum further inland. Figure 25 shows the geology and soil maps of the Nugaal basin. Defining the agro ecological zones of this basin beco mes difficult owing to the high variability o f weather both in space and ti me. Using the SW ALIM AEZ classif ication, the basin has over ten agro ecological zones. Normally, climate and soils are the defining factors considered in agro ecological zoning. The S WALIM AEZ classification also consid ers land suitability. Figure 26 s hows the land resources of Nugaal basin while figure 28 s hows the legend of AEZ for the same basin. The basin has less than 30 day s of Length of Growing Peri od (LGP) during the two rainy seasons. This is attributed to the fact that this is a very dry zone with rains not exceeding 300 m for any given season. The ar eas around Burco and Erigavo ar e relatively wetter and are suitable for Agriculture. The main land use in th e basin is extensive grazing (pastoralism) and wood coll ection. Agro pastrolism is a lso practice d in the m ountainous area s near Erigavo and Burao with sparse irrigation around the togas Cultivation of irrigate d vegetables, fruits and sorghum . Most of the area is u sed for extensive grazing. Common livestock are the ca mels, cattle and shoats. Oasis far ming is very c ommon in the southe rn parts of the bas in including las Anod, and Ainabo. Goats and sheep are gra zed mostly on sloping areas , whereas cattle and ca mels are grazed on flatter areas. Land use map is on figure 26 and the legend is shown on figure 28.
38
Figure 25: Geology and soil map for Nugaal drainage basin
39
Figure 26: Land resources map for Nugaal drainage basin
40
Figure 27: Legend for Agro‐Ecological Zones (AEZ) in Nugaal basin
Agropastoral (medium density of fields)with sparse irrig.fields around togas:vegets,fruits,sorghum, shoats
Agropastoralism (high density)/wood collection and irrigated fields:fodder, sorghum, camels, shoats
Agropastoralism (low density)/wood collection with sparce irrig. farms/Frankincense: goats, cattle
Pastoralism (high density) with scattered irrigated fields: shoats, camels, cattle
Pastoralism (high density) with scattered oasis farming: shoats, camels, horses
Pastoralism (high density): camels, shoats, cattle
Pastoralism (high density): sheep, goats, camels
Pastoralism (high density): shoats, camels, cattle
Pastoralism (low density) in coastal plain/dunes: shoats, camels
Pastoralism (low density): shoats
Pastoralism (low density): shoats, camels
Pastoralism (medium density) with scattered oasis farming: shoats, camels, horses
Pastoralism (medium density)/Oasis farming: shoats, camels, cattle
Pastoralism (medium density)/wood collection: camels, shoats
Pastoralism (medium density): shoats, camels, cattle
Urban area
Legend for land use systems in Nugaal basin
AEZ
LGP
Soils
Land suitability
Climate R
Rainfed Agric
I
Irrigated Agric
P
Extensive
Grazing
F
Forestry
plantation Gu Deyr description classification
1 0 0 various N N S3/N N desert
2G <30 <30 calcareous and stony Calcisols, Gypsisols N N S3 S3
arid
2L <30 <30 shallow Leptosols N N S3/N S3, N
2S <30 <30 high salt content Solonchaks N N S3 S3
2R <30 <30 1 calcareous
2 shallow
Regosols, Fluvisols
Leptosols N N S3 S3, N
2aG <30 <30 high lime, gypsum content Calcisols, Gypsisols N N S3 S3 arid
+
altitude
>500m
2aL <30 <30 shallow Leptosols N N S3/N S3, N
2aS <30 <30 high salt content Solonchaks N N S3 S3 2aC <30 <30 calcareous Cambisols N N S3 S3
3V <30 <30 1 calcareous, clayey
2 calcareous, loamy
Vertisols
Regosols S3 N S3 S2, S3
arid
M Mountains shallow Leptosols N N S3 N, S3
Land Suitability: S1=Highly suitable; S2=Moderately suitable; S3=Marginally suitable; N=Not suitable

41
Figure 28: Legend for land use systems in Nugaal basin
42
5.0: OGADEN DRAINAGE BASIN
5.1 General Description of Ogaden Drainage Basin A m ajor part of the c entral re gion of Som alia is drained by the extension of the Ogaden desert that is considered to ex tend from the Ethiopian region northeast of the Shabelle River basin. Migr ation of comm unities from the war torn southern Som alia has been a m ajor contribution to the increasing population in this basin. The to tal dr ainage ar ea of the O gaden bas in extending from Ethiopia to co astal areas in Somalia is about 235,000 k m2 (based on 90 m SRTM DEM data ). Within Som alia, the area extends over seven regions and 20 districts within the regions and covers a total area of 149,559 km2. The drainage area lies roughly between 420 45’ and 49 0 55’ east of the Prim e Meridian and between 3 0 32’ and 9 0 50’ north of the Equator. The onl y major urban centre (town) within the drainage ba sin is Galkayo. Though the basin extends to Ethiopia, only the part in S omali h as been consid ered in this analysis due t o lack of infor mation from the neighbouring country (Fi gure 30). This is because data from the Ethiopian side of the drainage basin was not available. Its elevation ranges from about sea level in the east to 1,563 m in the west. About 76% of the area is below 500 m , 8% is between 500-1,000 m, 16% is over 1,000 m. The drainage network in most of the Ogaden region and central Somalia is very sparse and ill defined. The only reasonably well defi ned water course is in the Bokh Valley in northern Somalia which has a total length of about 180 km . In other areas, there is som e occasional, localized surface runoff generated in the poorl y developed seasonal str eambeds, but this generally disappears quickly through evaporation and infiltration. No water reaches the Indian Ocean.
43
Figure 29: General description of Ogaden drainage Basin
44
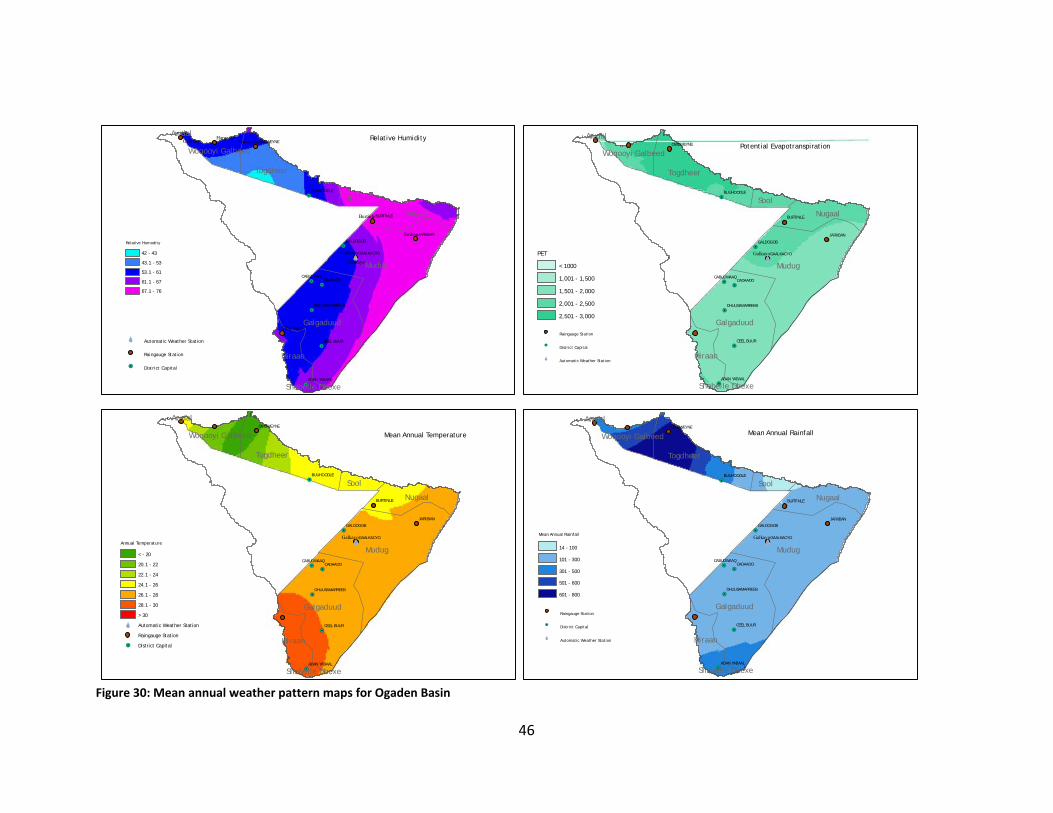
5.2 Climate of Ogaden Drainage Basin Rainfall in Ogaden drainage basins is low and erratic. Th ere are both seasonal as w ell inter-annual variations in the amount of rainfall in the area. The mean annual rainfall for the basin is about 280 mm. However, the north western parts of the basi n receive an av erage of up to 500 mm/year and are classified as humid to semi arid climate zone. The area to the south of the basin bordering the Shabelle basin in southern Som alia is also s emi humid with annual rains of up to 400mm /year (figure 30). The rest of the basin w hich includes the central par ts is largely classified as desert. During the pre war era, only two (Galckayo and Gebilley) rainfall stations existed inside the basin. However, stations bordering the basin in other watersheds could be used to analyse the climate conditions of the O gaden basin. Currently a nu mber of rainfall stations exis t in th e basin including Odwe yne, Ge billey, B urtinle, Ja ribaan, B urtinle a nd Ga lckayo. Galckay o station has both the manual rain gauge and an automatic weather station. It is regrettable that there is no climate or water resources data that is available from the Ethiopian part that lies in Ogaden basin. This again calls for more collaboration between the relevant authorities. Potential Evapo-transp iration (PET) ranges from about 2100 in Bura o to 3000 m m in the coastal regions. In general the evaporation is higher than rainfall through out the year except the months of May and October which happens to be the peak of Gu and Deyr rainy seasons respectively. The mean air temperatures are generally high in the drainage basin. Mean temperature is high in the range of about 220 C to more than 330 C. March and April are the hottest months of the year in this basin. The relative hu midity (RH) is high er in th e coastal regions (up to 70%) than in the inland (50% to 60%) areas. The southern parts of Togdheer region located in this basin is said to be the coolest area in Somalia. Wind speeds vary from a low of about 4.2 m/s to a high of about 8.2 m/s. Wind speeds are higher during June to A ugust. On an average th e lowest values of wind speed occur in the months of April and Nove mber in the coun try coinciding w ith th e p eaks of th e t wo r ainy seasons, Gu and Deyr, respectively.

45
46
!.!.
!.
!.
!.
!.
!.
!.
!.
!.
!.
ÔÕMudug
Galgaduud
Togdheer
Nugaal
Sool
Hiraan
Woqooyi Galbeed
Shabelle Dhexe
Awdal
CADAADO
OWDWEYNE
BURTINLE
JARIIBAN
GALDOGOB
BUUHOODLE
GAALKACYO
CEEL BUUR
CABUDWAAQ
ADAN YABAAL
DHUUSAMARREEB
Galkayo
!.!.
!.
!.
!.
!.
!.
!.
!.
!.
!.
ÔÕMudug
Galgaduud
Togdheer
Nugaal
Sool
Hiraan
Woqooyi Galbeed
Shabelle Dhexe
Awdal
CADAADO
OWDWEYNE
BURTINLE
JARIIBAN
GALDOGOB
BUUHOODLE
GAALKACYO
CEEL BUUR
CABUDWAAQ
ADAN YABAAL
DHUUSAMARREEB
GalkayoMean Annual Rainfall
14 - 100
101 - 300
301 - 500
501 - 600
601 - 800
Annual Temperature
< - 20
20.1 - 22
22.1 - 24
24.1 - 26
26.1 - 28
28.1 - 30
> 30
ÔÕ Automatic Weather Station
Raingauge Station
!. District Capital
Mean Annual RainfallMean Annual Temperature
!.!.
!.
!.
!.
!.
!.
!.
!.
!.
!.
ÔÕMudug
Galgaduud
Togdheer
Nugaal
Sool
Hiraan
Woqooyi Galbeed
Shabelle Dhexe
Awdal
CADAADO
OWDWEYNE
BURTINLE
JARIIBAN
GALDOGOB
BUUHOODLE
GAALKACYO
CEEL BUUR
CABUDWAAQ
ADAN YABAAL
DHUUSAMARREEB
Jariban
Odweyne
Galkayo
Burtinle
HargeisaGebilley
Yibir Suge
Galkayo
Relative Humodity
42 - 43
43.1 - 53
53.1 - 61
61.1 - 67
67.1 - 76
Relative Humidity
!.!.
!.
!.
!.
!.
!.
!.
!.
!.
!.
ÔÕMudug
Galgaduud
Togdheer
Nugaal
Sool
Hiraan
Woqooyi Galbeed
Shabelle Dhexe
Awdal
CADAADO
OWDWEYNE
BURTINLE
JARIIBAN
GALDOGOB
BUUHOODLE
GAALKACYO
CEEL BUUR
CABUDWAAQ
ADAN YABAAL
DHUUSAMARREEB
Galkayo
Potential Evapotranspiration
PET
< 1000
1,001 - 1,500
1,501 - 2,000
2,001 - 2,500
2,501 - 3,000
ÔÕ Automatic Weather Station
Raingauge Station
!. District Capital
Raingauge Station
!.District Capital
ÔÕ Automatic Weather Station
Raingauge Station
!. District Capital
ÔÕ Automatic Weather Station
Figure 30: Mean annual weather pattern maps for Ogaden Basin
47
Figure 31: Climate maps of Ogaden basin
ÔÕ
!.!.
!.
!.
!.
!.
!.
!.
!.
!.
!.
Mudug
Galgaduud
Togdheer
Nugaal
Hiraan
Sool
Woqooyi Galbeed
Shabelle Dhexe
Awdal
Galkayo
CADAADO
OWDWEYNE
BURTINLE
JARIIBAN
GALDOGOB
BUUHOODLE
GAALKACYO
CEEL BUUR
CABUDWAAQ
DHUUSAMARREEB
Jariban
Odweyne
Galkayo
Burtinle
HargeisaGebilley
Yibir Suge
!.!.
!.
!.
!.
!.
!.
!.
!.
!.
!.
ÔÕMudug
Galgaduud
Togdheer
Nugaal
Hiraan
Sool
Woqooyi Galbeed
Shabelle Dhexe
Awdal
CADAADO
OWDWEYNE
BURTINLE
JARIIBAN
GALDOGOB
BUUHOODLE
GAALKACYO
CEEL BUUR
CABUDWAAQ
ADAN YABAAL
DHUUSAMARREEB
Jariban
Odweyne
Galkayo
Burtinle
HargeisaGebilley
Yibir Suge
Galkayo
Climate Classification Classes
BS- Steep Climate
BSh - Steepe Warm Climate
BSk - Steepe Cold Climate
BW - Desert Climate
Climate Classification Classes
14 - 100 - Desert
101 - 400 - Very Arid
401 - 600 - Semi Arid
601 - 800 - Humid Semi Arid
Koppen Climate ClassificationFAO ECO Climate Classification
!.!.
!.
!.
!.
!.
!.
!.
!.
!.
!.
ÔÕMudug
Galgaduud
Togdheer
Nugaal
Hiraan
Sool
Woqooyi Galbeed
Shabelle Dhexe
Awdal
CADAADO
OWDWEYNE
BURTINLE
JARIIBAN
GALDOGOB
BUUHOODLE
GAALKACYO
CEEL BUUR
CABUDWAAQ
ADAN YABAAL
DHUUSAMARREEB
Jariban
Odweyne
Galkayo
Burtinle
HargeisaGebilley
Yibir Suge
Galkayo
Rainfall (mm)
<VALUE>
2 - 70
71 - 120
121 - 200
201 - 300
301 - 400
401 - 517.0355835
Gu Seasonal Rainfall
ÔÕ
!.!.
!.
!.
!.
!.
!.
!.
!.
!.
!.
Mudug
Galgaduud
Togdheer
Nugaal
Hiraan
Sool
Woqooyi Galbeed
Shabelle Dhexe
Awdal
Galkayo
CADAADO
OWDWEYNE
BURTINLE
JARIIBAN
GALDOGOB
BUUHOODLE
GAALKACYO
CEEL BUUR
CABUDWAAQ
ADAN YABAAL
DHUUSAMARREEB
Jariban
Odweyne
Galkayo
Burtinle
HargeisaGebilley
Yibir Suge
Deyr Seasonal Rainfall
Rainfall (mm)
1 - 60
61 - 100
101 - 200
201 - 350
351 - 500
Raingauge Station
!. District Capital
ÔÕ Automatic Weather Station
Raingauge Station
!. District Capital
ÔÕ Automatic Weather Station
Raingauge Station
!. District Capital
ÔÕ Automatic Weather Station
Raingauge Station
!. District Capital
ÔÕ Automatic Weather Station
48
5.3 Surface Water Resources of Ogaden Drainage Basin No perennial river of any importance exists in the basin. The wadis and toggas, the seasona l streams, w here dr ainage netw orks ar e dev eloped, hav e sur face r unoff only af ter heavy rainfall. No long ter m surface water monitoring has been done in any of thes e w adis and toggas. The 2008/09 point water sources surve y in northern and centr al Somalia by SWALIM identified a total of 420 point wa ter sources within th e basin. The study indicates that ther e are numerous such points which could not be fu lly covered by the surv eys due to tim e and resources. Wa rs a nd be rkads use d for ra in wa ter (catc hment) ha rvesting a re not ve ry common in Northe rn Somalia. The survey identified only 24 such points. These ar e mainly berkads and are located on the southern part s of Togdheer region. Da ms are als o ver y common south east of Galbeed region. A total of 77 dams were identified during the survey. Dug wells and bore wells ar e very co mmon in the eastern parts of the basin (Mudug and Galgadud). A total of 209 (50%) dug wells were identified. Boreholes act as the main source of water here. There are 108 ( 26%) of such points (Figure 32) . The dug wells and boreholes are used for all kinds of water use including small scale irrigation. Groundwater is an i mportant source of water to m eet the needs of the human and livestock population. Data on the aquifers and groundwater systems are scattered and scarce.
49
Figure 32: Water Resources maps for Ogaden basin
!.!.
!.
!.
!.
!.
!.
!.
!.
!.
!.
$###
####
#
$
$G$
######
$
$$$
#
#
$
$
$
[
[[[[
####G
##
#####
#G
[#
#
#####
#
#
[
#
[###
#$
#
$
##$
[[
######
# [[[[
#
#
$
$ $
$$$
$$
$[[
#
#### [
[[[[ [
#G [[[[[[[[[[[[[
###
[[#########
###
#
$
#
G
[
[[[[G
[
G
[[[
G [G G GG G[[[[ [[
GGG
GG
G
GGGG
[
G[[[[[[[
[[[
[[
X
[[X
G
G GG
[
GGG
GGG
GG
GG
GG
G
[[[[
GGGGGGG
G
G
G
G
G
GGGGG
[[[[
G
[[G[[[[[
[[
[G[[G[GG [[[[ [ G[G[[G[[G[G[G[[GG[[[[ [[ [[[[[ [[[[ [[ [[[[ [[G [G[G[[[G [GG [ [GGGG [[[GG[ [[[ [ [[G [G [G [[[ [ [[[[ [[[[ [[[GG [ [[[G [ G[ [G [GG[[[[G[[G [[G [GGGG[G[G [G[[ [[[ [ [[[G[G [G[[ [[[ [[[[[[[[ [[G[Mudug
Galgaduud
Togdheer
Nugaal
Hiraan
Sool
Woqooyi Galbeed
Shabelle Dhexe
Awdal
CADAADO
OWDWEYNE
BURTINLE
JARIIBAN
GALDOGOB
BUUHOODLE
GAALKACYO
CEEL BUUR
CABUDWAAQ
ADAN YABAAL
DHUUSAMARREEB
!.!.
!.
!.
!.
!.
!.
!.
!.
!.
!.
ÔÕMudug
Galgaduud
Togdheer
Nugaal
Hiraan
Sool
Woqooyi Galbeed
Shabelle Dhexe
Awdal
CADAADO
OWDWEYNE
BURTINLE
JARIIBAN
GALDOGOB
BUUHOODLE
GAALKACYO
CEEL BUUR
CABUDWAAQ
ADAN YABAAL
DHUUSAMARREEB
Galkayo
!. District Capital
Salty Ground Water
Central Rangeland
Border Belt between Balanbaal and Buur Yacab
Dhusamarreb-Ceel Buur Artesian Sub-Basin
Dhusamarreb-Galcacyo-Balli-Busle Balli-Busle
Southwestern side of the Mudug-Galgadud Plateau
!. District Capital
Water Sources
# Dam
G Drilledwell
[ Dugwell
$ Other
X Spring
Ground WaterWater Sources
!.!.
!.
!.
!.
!.
!.
!.
!.
!.
!.
Mudug
Galgaduud
Togdheer
Nugaal
Hiraan
Sool
Woqooyi Galbeed
Shabelle Dhexe
Awdal
CADAADO
OWDWEYNE
BURTINLE
JARIIBAN
GALDOGOB
BUUHOODLE
GAALKACYO
CEEL BUUR
CABUDWAAQ
ADAN YABAAL
DHUUSAMARREEB
Streams
!. District Capital
Drainage Network
!.!.
!.
!.
!.
!.
!.
!.
!.
!.
!.
Mudug
Galgaduud
Togdheer
Nugaal
Hiraan
Sool
Woqooyi Galbeed
Shabelle Dhexe
Awdal
CADAADO
OWDWEYNE
BURTINLE
JARIIBAN
GALDOGOB
BUUHOODLE
GAALKACYO
CEEL BUUR
CABUDWAAQ
ADAN YABAAL
DHUUSAMARREEB
Sub Catchments
!. District Capital
50
5.4 Land Resources of Ogaden Drainage Basin Ogaden basin has a mix of geological classes as indicated on figure 33. The ro ck type in this basin is primarily sedimentary. The basin has a mix of soil groups including Fl uvisols, Arenosols, Ca lcisols, cam bisols, gypisols, leptosols and Regosols. The central part of the basin is dominated by loam and clay soils while the coastal strip is covered by sandy soils. The length of the growing period in the bas in is less th an 30 days both in gu and deyr rain y seasons owing to the low rains experienced in most parts of the drainage basin.

51
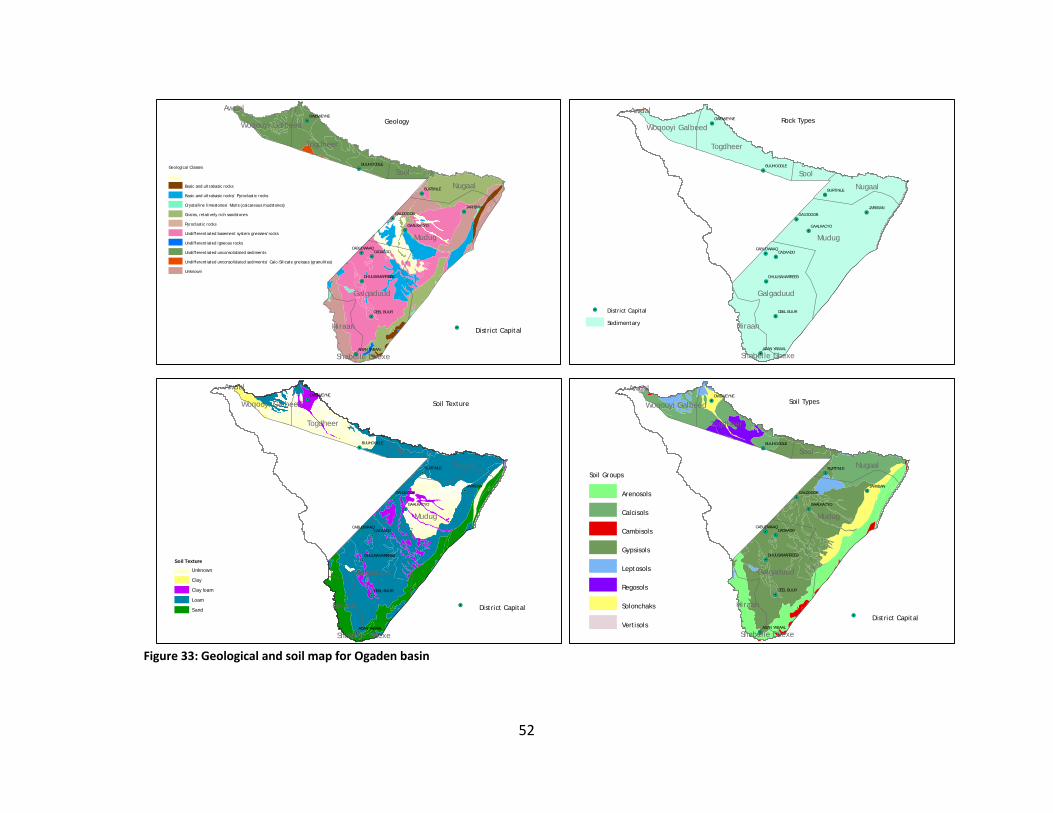
52
Figure 33: Geological and soil map for Ogaden basin
!.!.
!.
!.
!.
!.
!.
!.
!.
!.
!.
Mudug
Galgaduud
Togdheer
Nugaal
Sool
Hiraan
Woqooyi Galbeed
Shabelle Dhexe
Awdal
CADAADO
OWDWEYNE
BURTINLE
JARIIBAN
GALDOGOB
BUUHOODLE
GAALKACYO
CEEL BUUR
CABUDWAAQ
ADAN YABAAL
DHUUSAMARREEB
!.!.
!.
!.
!.
!.
!.
!.
!.
!.
!.
Mudug
Galgaduud
Togdheer
Nugaal
Sool
Hiraan
Woqooyi Galbeed
Shabelle Dhexe
Awdal
CADAADO
OWDWEYNE
BURTINLE
JARIIBAN
GALDOGOB
BUUHOODLE
GAALKACYO
CEEL BUUR
CABUDWAAQ
ADAN YABAAL
DHUUSAMARREEB
Soil Texture
Unknown
Clay
Clay loam
Loam
Sand
Soil TypesSoil Texture
!.!.
!.
!.
!.
!.
!.
!.
!.
!.
!.
Mudug
Galgaduud
Togdheer
Nugaal
Sool
Hiraan
Woqooyi Galbeed
Shabelle Dhexe
Awdal
CADAADO
OWDWEYNE
BURTINLE
JARIIBAN
GALDOGOB
BUUHOODLE
GAALKACYO
CEEL BUUR
CABUDWAAQ
ADAN YABAAL
DHUUSAMARREEB
Geological Classes
Basic and ultrabasic rocks
Basic and ultrabasic rocks/ Pyroclastic rocks
Crystalline limestones/ Marls (calcareous mudstones)
Grains, relatively rich sandstones
Pyroclastic rocks
Undifferentiated basement system gneisses/rocks
Undifferentiated igneous rocks
Undifferentiated unconsolidated sediments
Undifferentiated unconsolidated sediments/ Calc-Silicate gneisses (granulites)
Unknown
Geology
!.!.
!.
!.
!.
!.
!.
!.
!.
!.
!.
Mudug
Galgaduud
Togdheer
Nugaal
Sool
Hiraan
Woqooyi Galbeed
Shabelle Dhexe
Awdal
CADAADO
OWDWEYNE
BURTINLE
JARIIBAN
GALDOGOB
BUUHOODLE
GAALKACYO
CEEL BUUR
CABUDWAAQ
ADAN YABAAL
DHUUSAMARREEB
Rock Types
!. District Capital
Sedimentary
Soil Groups
Arenosols
Calcisols
Cambisols
Gypsisols
Leptosols
Regosols
Solonchaks
Vertisols
!. District Capital
!. District Capital
!. District Capital
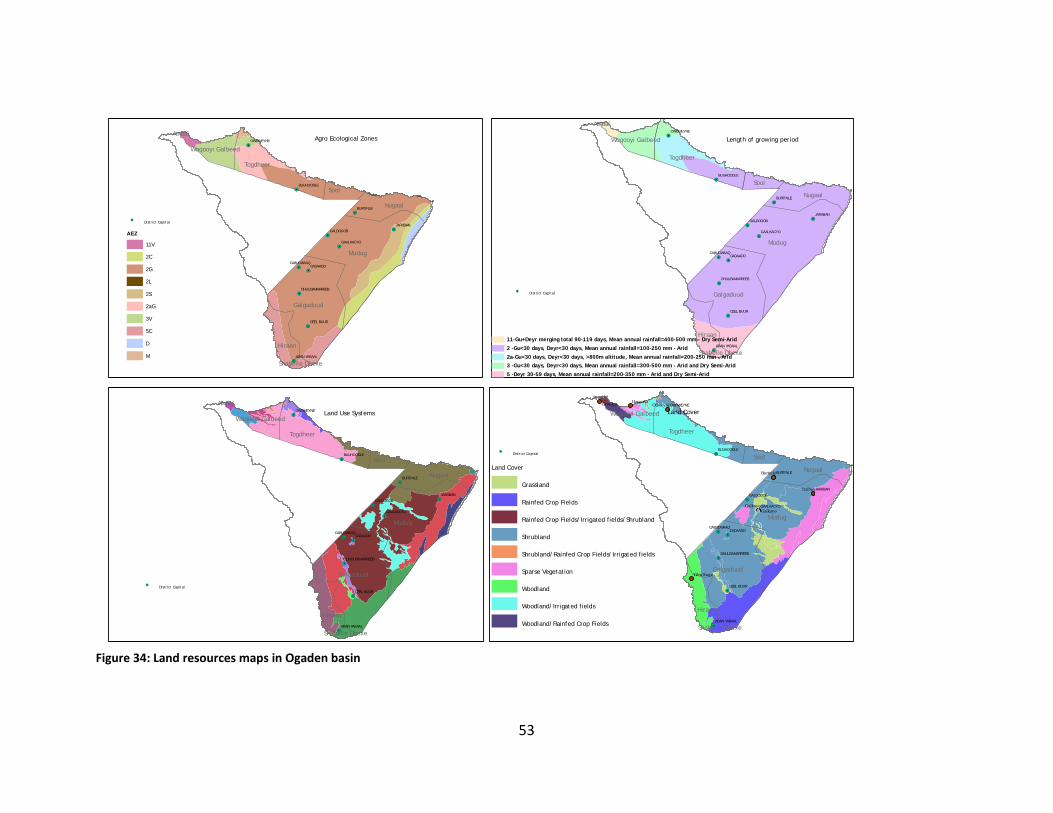
53
Figure 34: Land resources maps in Ogaden basin
!.!.
!.
!.
!.
!.
!.
!.
!.
!.
!.
Mudug
Galgaduud
Togdheer
Nugaal
Hiraan
Sool
Woqooyi Galbeed
Shabelle Dhexe
Awdal
CADAADO
OWDWEYNE
BURTINLE
JARIIBAN
GALDOGOB
BUUHOODLE
GAALKACYO
CEEL BUUR
CABUDWAAQ
ADAN YABAAL
DHUUSAMARREEB
!.!.
!.
!.
!.
!.
!.
!.
!.
!.
!.
ÔÕMudug
Galgaduud
Togdheer
Nugaal
Hiraan
Sool
Woqooyi Galbeed
Shabelle Dhexe
Awdal
CADAADO
OWDWEYNE
BURTINLE
JARIIBAN
GALDOGOB
BUUHOODLE
GAALKACYO
CEEL BUUR
CABUDWAAQ
ADAN YABAAL
DHUUSAMARREEB
Jariban
Odweyne
Galkayo
Burtinle
HargeisaGebilley
Yibir Suge
Galkayo
Land Cover
Grassland
Rainfed Crop Fields
Rainfed Crop Fields/Irrigated fields/Shrubland
Shrubland
Shrubland/Rainfed Crop Fields/Irrigated fields
Sparse Vegetation
Woodland
Woodland/Irrigated fields
Woodland/Rainfed Crop Fields
Land CoverLand Use Systems
!.!.
!.
!.
!.
!.
!.
!.
!.
!.
!.
Mudug
Galgaduud
Togdheer
Nugaal
Hiraan
Sool
Woqooyi Galbeed
Shabelle Dhexe
Awdal
CADAADO
OWDWEYNE
BURTINLE
JARIIBAN
GALDOGOB
BUUHOODLE
GAALKACYO
CEEL BUUR
CABUDWAAQ
ADAN YABAAL
DHUUSAMARREEB
AEZ
11V
2C
2G
2L
2S
2aG
3V
5C
D
M
Agro Ecological Zones
!.!.
!.
!.
!.
!.
!.
!.
!.
!.
!.
Mudug
Galgaduud
Togdheer
Nugaal
Hiraan
Sool
Woqooyi Galbeed
Shabelle Dhexe
Awdal
CADAADO
OWDWEYNE
BURTINLE
JARIIBAN
GALDOGOB
BUUHOODLE
GAALKACYO
CEEL BUUR
CABUDWAAQ
ADAN YABAAL
DHUUSAMARREEB
Length of growing period
11-Gu+Deyr merging total 90-119 days, Mean annual rainfall=400-500 mm - Dry Semi-Arid
2 -Gu<30 days, Deyr<30 days, Mean annual rainfall=100-250 mm - Arid
2a-Gu<30 days, Deyr<30 days, >800m altitude, Mean annual rainfall=200-250 mm - Arid3 -Gu<30 days, Deyr<30 days, Mean annual rainfall=300-500 mm - Arid and Dry Semi-Arid
5 -Deyr 30-59 days, Mean annual rainfall=200-350 mm - Arid and Dry Semi-Arid
!. District Capital
!. District Capital
!. District Capital
!. District Capital
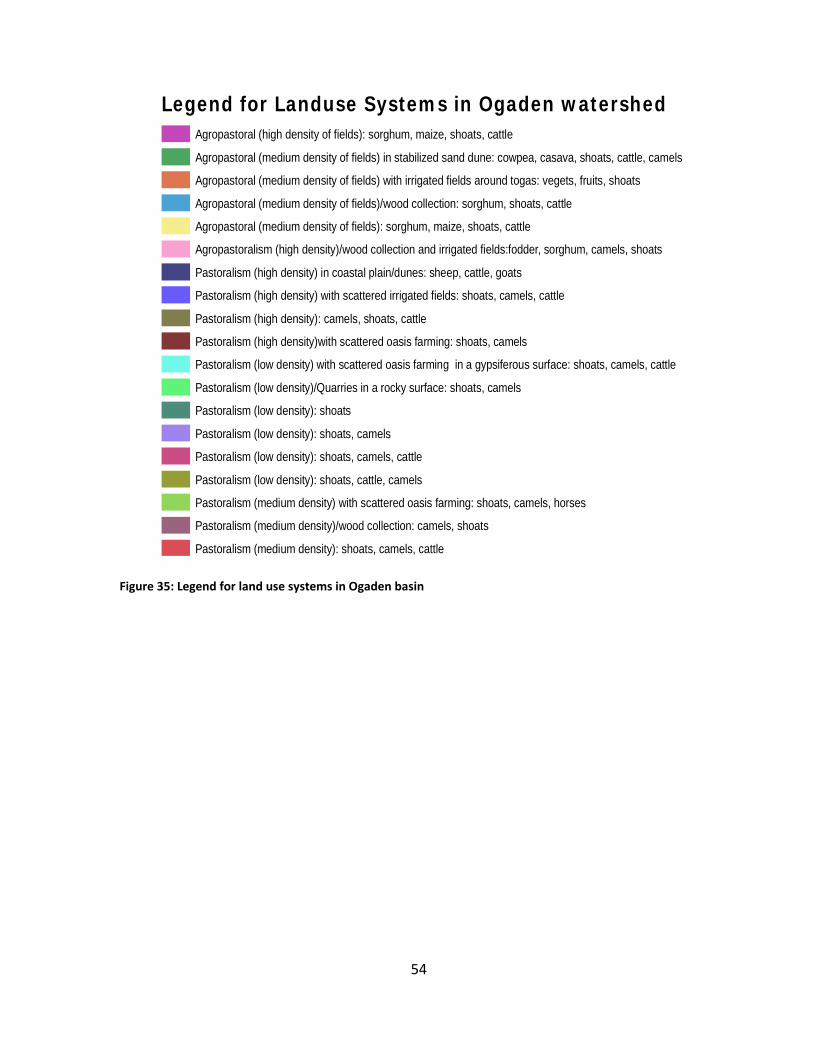
54
Figure 35: Legend for land use systems in Ogaden basin
Legend for Landuse Systems in Ogaden watershedAgropastoral (high density of fields): sorghum, maize, shoats, cattle
Agropastoral (medium density of fields) in stabilized sand dune: cowpea, casava, shoats, cattle, camels
Agropastoral (medium density of fields) with irrigated fields around togas: vegets, fruits, shoats
Agropastoral (medium density of fields)/wood collection: sorghum, shoats, cattle
Agropastoral (medium density of fields): sorghum, maize, shoats, cattle
Agropastoralism (high density)/wood collection and irrigated fields:fodder, sorghum, camels, shoats
Pastoralism (high density) in coastal plain/dunes: sheep, cattle, goats
Pastoralism (high density) with scattered irrigated fields: shoats, camels, cattle
Pastoralism (high density): camels, shoats, cattle
Pastoralism (high density)with scattered oasis farming: shoats, camels
Pastoralism (low density) with scattered oasis farming in a gypsiferous surface: shoats, camels, cattle
Pastoralism (low density)/Quarries in a rocky surface: shoats, camels
Pastoralism (low density): shoats
Pastoralism (low density): shoats, camels
Pastoralism (low density): shoats, camels, cattle
Pastoralism (low density): shoats, cattle, camels
Pastoralism (medium density) with scattered oasis farming: shoats, camels, horses
Pastoralism (medium density)/wood collection: camels, shoats
Pastoralism (medium density): shoats, camels, cattle
55
References
Agrar-Und Hydrotechnik GMBH. 1990. Master Pl an for Juba Valley Develop ment. Main
Report. Ministry of Juba Valley Development, Somali Democratic Republic.
Alim, M. S. 1997. Inventory Report Som alia. I nternal Report No. 1. GCP/RAF/287/ITA. Food and Agriculture Organization of the United Nations.
Faillace, C. 1964. Surface Water and Underground Wate r Resources of the Shebeli Valley . Ministry of Public Works & Communication. Mogadishu.
Faillace, C and Fail lace, E. R. 1987. Water Quality Data Book of So malia. General Report. GTZ Project No. 80.2193.3-09.112. GTZ and Water Develop ment Agency (WDA), Somalia.
Faillace, C. 1993. Resu lts of a Co untry-wide Groundwater Quality S tudy in S omalia. In. Geology and Mineral Resour ces of Som alia and Surroundi ng Regions. Eds. Abbate, E., Sagri. M. and S assi, F. P. Instituto A gronomico Per L’oltremare, Firenze. Pages: 615-632.
Faillace, C. 1993. The N eed to use Si mple and Appropria te Technology to Develop the Water Re sources in Som alia. In. Geology and Miner al Resources of Som alia and Surrounding Regions. Eds. Abbate, E., S agri. M. and S assi, F . P . Instituto Agronomico Per L’oltremare, Firenze. Pages: 633-648..
Hutchinson, P. and Polishchouk, O. The Agrocl imatology of Som alia. Food Ear ly Warning Department. Ministry of Agriculture. Som ali Democratic Republic. Technical Repor t No. 12. F.E.W.S. Project.
Kammer, D. 1989. A Brief Des cription of M ajor Drainage Basins affe cting So malia with special re ference to Surfa ce Wa ter Re sources. Na tional Wa ter Ce nter, Moga dishu, Field Document No. 14. FAO/SOM/85/008, Rome.
Mbara C.J., Gadain H.M and Mu thusi F.M. (2007), Status of Medium to Large Irrigation Schemes in Southern Som alia, Technical Repor t No W-05, FAO-SWALIM, Nairobi, Kenya.
Mink, A. 2007. Rural Water, Sani tation and Hygiene in Northwest Som alia. Technical Backstopping Mission to the EC f unded Project. Caritas Luxem bourg and
56
Switzerland and EU.
Muchiri P.W. (2007), Cli mate of Som alia. Technical Repo rt No W-01, FAO-SWALIM, Nairobi, Kenya.
Muchiri, P. W. (2007), Inventor y of Hydro-Meteorologi cal Data of Som alia. Technical Report No W-03. FAO-SWALIM, Nairobi, Kenya.
Musgrave, H. 2002. Drought and Hydrological Variability in Southern So malia. A dissertation subm itted in pa rtial fulfillm ent of the re quirements for the de gree of Master of Science in the University of London. London.
Oduori, S.M., Vargas, R.R. and Alim, M.S. (2007) Land Res ources Assessment of So malia, Technical Report No L-12, FAO-SWALIM
Print, C. 2000. Development of a Water Information System for Somalia. Final Report to the SACB WSIS Committee. UNICEF Somalia.
SWALIM. 2007. Somalia Dynamic Atlas. FAO, Nairobi.
UNDP and FAO, 1968. Agricultural and Water Surveys, Somalia, Final Report, Six Volumes (Series), Wa ter Re sources (Volu me II). DP/FAO/Sf:36/SOM. F AO Libra ry Fisc he AN: 04002-004.
UNDP and FAO. 1973. Surface Water Resources. Report to the Government of Somalia. No. TA 3190. FAO Library Fische AN: 23906.
Venema, J.H. and Vargas, R.R. (2007), Land Su itability Assess ment of Selected Area in Somaliland, Technical Report No L-06, FAO-SWALIM
Venema, J.H. and Vargas, R.R. (2007), Land Suitability Assessment of the Juba and Shabelle Riverine Areas in Southern Somalia, Technical Report No. L-07, FAO-SWALIM