Embed Size (px)
Citation preview
NASATechnical
Memorandum
NASA TM _ 108389
oo
L_ f,,,,,
I ,'- ,3,
Z _ o
D
LL'
LL _ _
Z
0
G_Z_CO0__q_O
_OZ
p- LL r--jI U
<¢ c,_ tic
Z-JDv(_
_op,.
L9
/w-v
13e /7
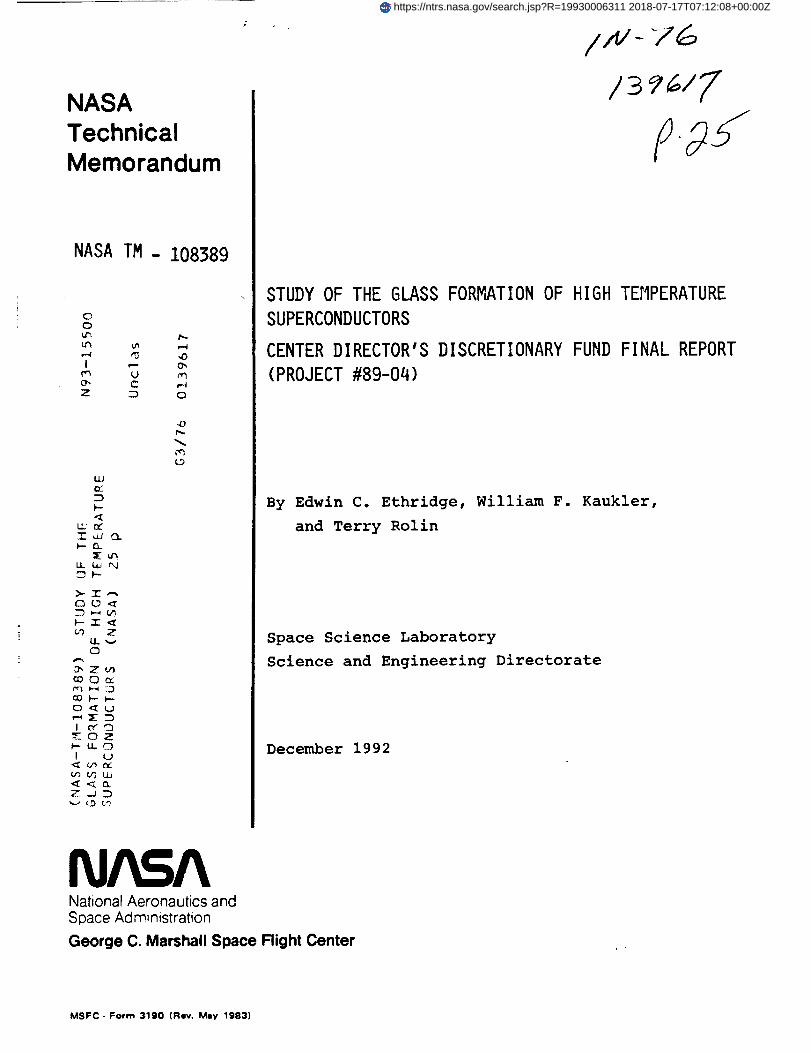
STUDY OF THE GLASS FORMATION OF HIGH TEMPERATURE
SUPERCONDUCTORS
CENTER DIRECTOR'S DISCRETIONARY FUND FINAL REPORT
(PROJECT #89-04)
By Edwin C. Ethridge, William F. Kaukler,
and Terry Rolin
Space Science Laboratory
Science and Engineering Directorate
December 1992
NASANational Aeronautics andSpace Administration
George C. Marshall Space Flight Center
MSFC - Form 3190 (Rev. Mmy 1983)
https://ntrs.nasa.gov/search.jsp?R=19930006311 2018-07-17T07:12:08+00:00Z
±
!
|!|
ii
-- iw_
i!
lwIE
Form Approved
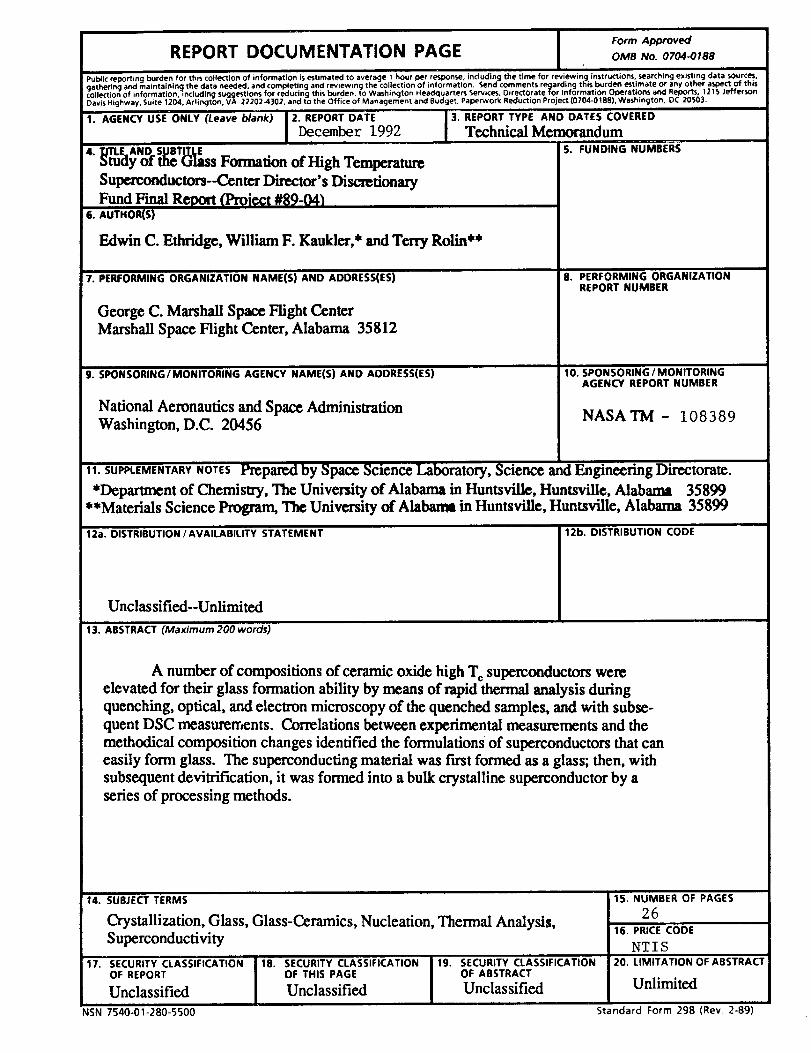
REPORT DOCUMENTATION PAGE OMBNo. oTo*olse
Publ c reporting burden for this collection of information is estimated to average 1 hour per response, including the time for reviewing Instructions, searching existing data sOurces,
gathering and maintaining the data needed and completing and rewewmg the collection of information. Send comments re_arding this burden estimate or any other a_oect of this
collection of information, including suggestions for reducing this burden, to Washington HeaclquaRe_ Services, Directorate tOT Information Operations and Repots, 1215 Jefferson
Davis Highway, Suite 1204, Arlington, VA 22202-4302. and to the Office of Management and Budget, Paperwork Reduction ProJect (0704-0188), WaNning ton, uL zu_uJ.
1. AGENCY USE ONLY (Leave blank) 2. REPORT DATE
December 1992
4. TJTLEAND SUBTITLE
Study of the Glass Formation of High Temperature
Superconductors--Center Director ss Discretionary
Fund Final Report (Project #89-04)6. AUTHOR{S)
Edwin C. Ethridge, William F. Kaukler,* and Terry Rolin**
7. PERFORMINGORGANIZATIONNAME(S)ANDADDRESS(ES)
George C. Marshall Space Flight Center
Marshall Space Flight Center, Alabama 35812
9. SPONSORING/MONITORINGAGENCYNAME(S)AND ADDRESS(ES)
National Aeronautics and Space Administration
Washington, D.C. 20456
3. REPORT TYPE AND DATES COVERED
Technical MemorandumS. FUNDING NUMBERS
8. PERFORMING ORGANIZATION
REPORT NUMBER
10. SPON SORING / MONITORING
AGENCY REPORT NUMBER
NASA TM- 108389
11. SUPPLEMENTARYNOTES Prepared by Space Science Laboratory, Science and Engineering Directorate.
*Department of Chemistry, The University of Alabama in Huntsville, Huntsville, Alabama 35899
**Materials Science Program, The University of Alabama in Huntsville, Huntsville, Alabama 35899
12a. DISTRIBUTION/AVAILABILITY STATEMENT
Unclassified--Unlimited
12b. DISTRIBUTION CODE
13. ABSTRACT (Maximum 200words)
A number of compositions of ceramic oxide high Tc superconductors were
elevated for their glass formation ability by means of rapid thermal analysis during
quenching, optical, and electron microscopy of the quenched samples, and with subse-
quent DSC measurements. Correlations between experimental measurements and the
methodical composition changes identified the formulations of superconductors that can
easily form glass. The superconducting material was first formed as a glass; then, with
subsequent devitrification, it was formed into a bulk crystalline superconductor by a
series of processing methods.
14. SUBJECT TERMS
Crystallization, Glass, Glass-Ceramics, Nucleation, Thermal Analysis,
Superconductivity
17. SECURITY CLASSIFICATION 18. SECURITY CLASSIFICATION lg. SECURITY CLASSIFICATIONOF REPORT OF THIS PAGE OF ABSTRACT
Unclassified Unclassified Unclassified
NSN 7540-01-280-5500
15. NUMBER OF PAGES
2616. PRICE CODE
NTIS
20. LIMITATIONOFABSTRACT
Unlimited
Standard Form 298 (Rev 2-89)

TABLE OF CONTENTS
Introduction
Experimental Procedure
Results and Discussion
Conclusions
References
Page
1
1
5
14
19
r
FAG[, _ / IttJL,_]JONALLYBLANK
,f,111
PRECEDING PAGE BLANK NOT FILMED

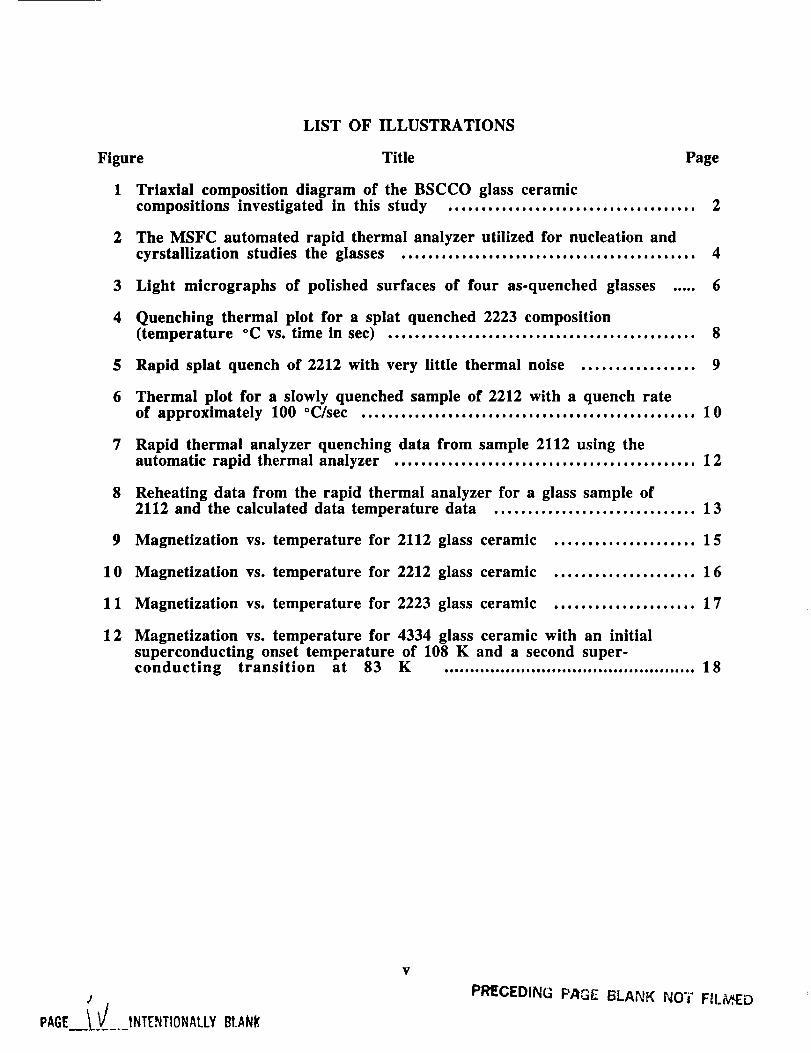
LIST OF ILLUSTRATIONS
Figure Title Page
1 Triaxial composition diagram of the BSCCO glass ceramiccompositions investigated in this study ..................................... 2
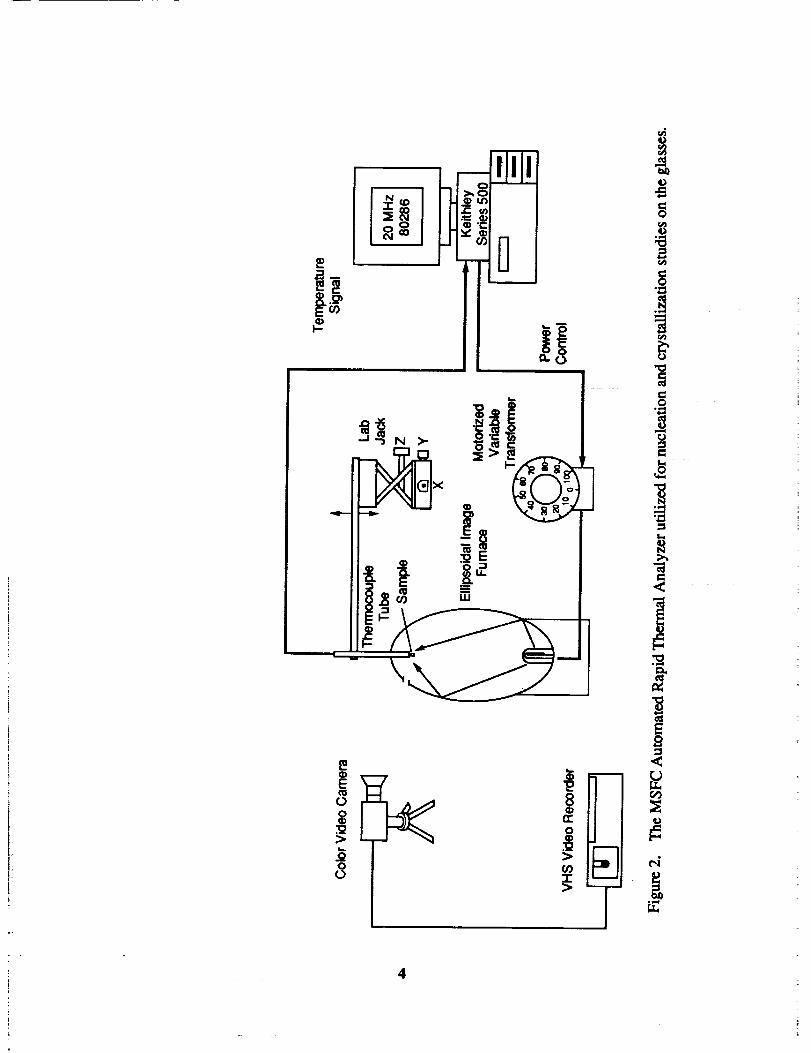
2 The MSFC automated rapid thermal analyzer utilized for nucleation andcyrstallization studies the glasses ............................................ 4
3 Light micrographs of polished surfaces of four as-quenched glasses ..... 6
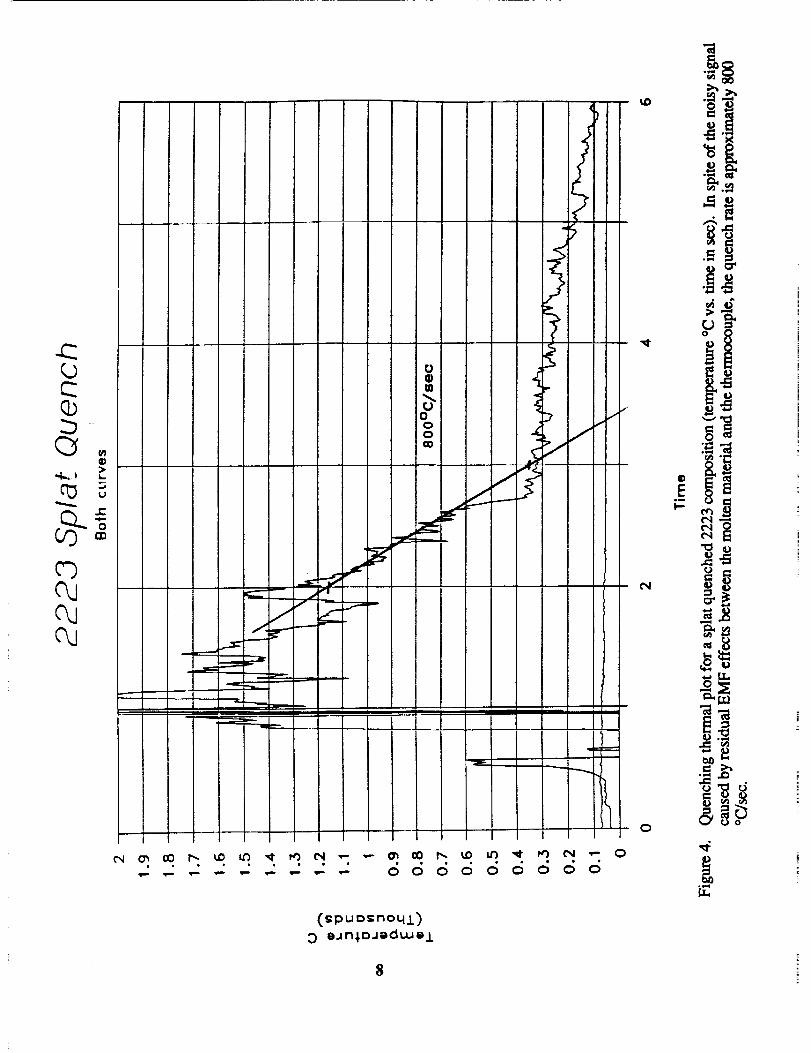
4 Quenching thermal plot for a splat quenched 2223 composition(temperature °C vs. time in sec) .............................................. 8
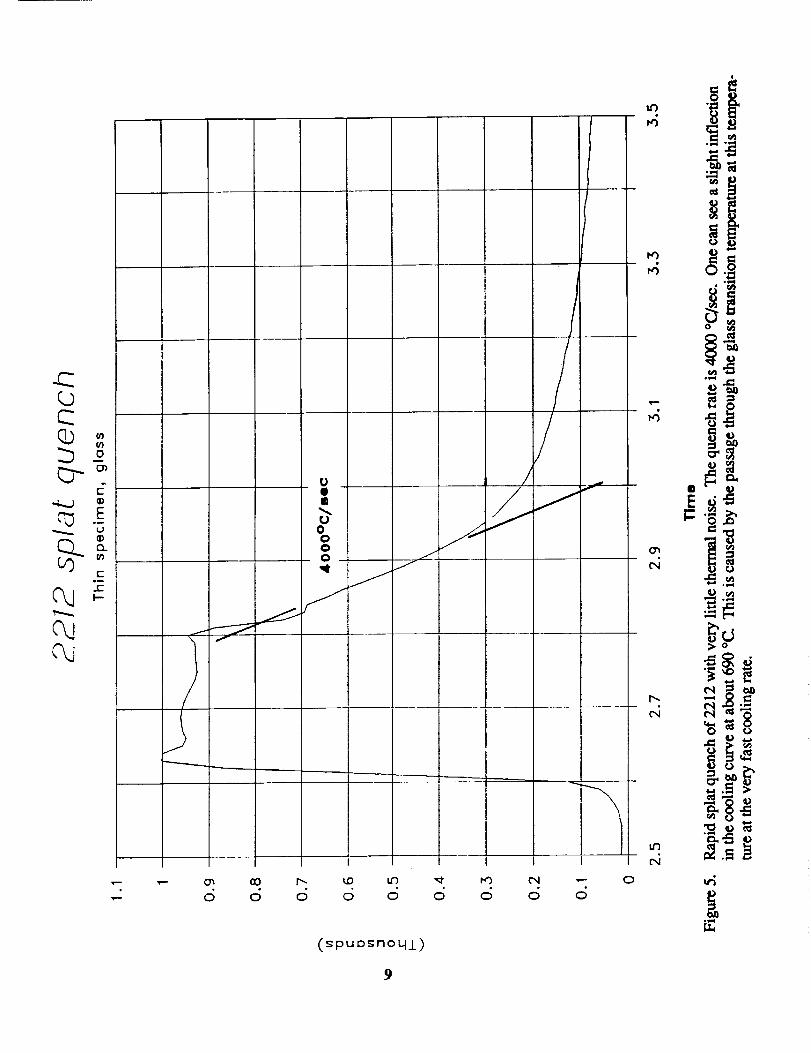
$ Rapid splat quench of 2212 with very little thermal noise ................. 9
6
7
8
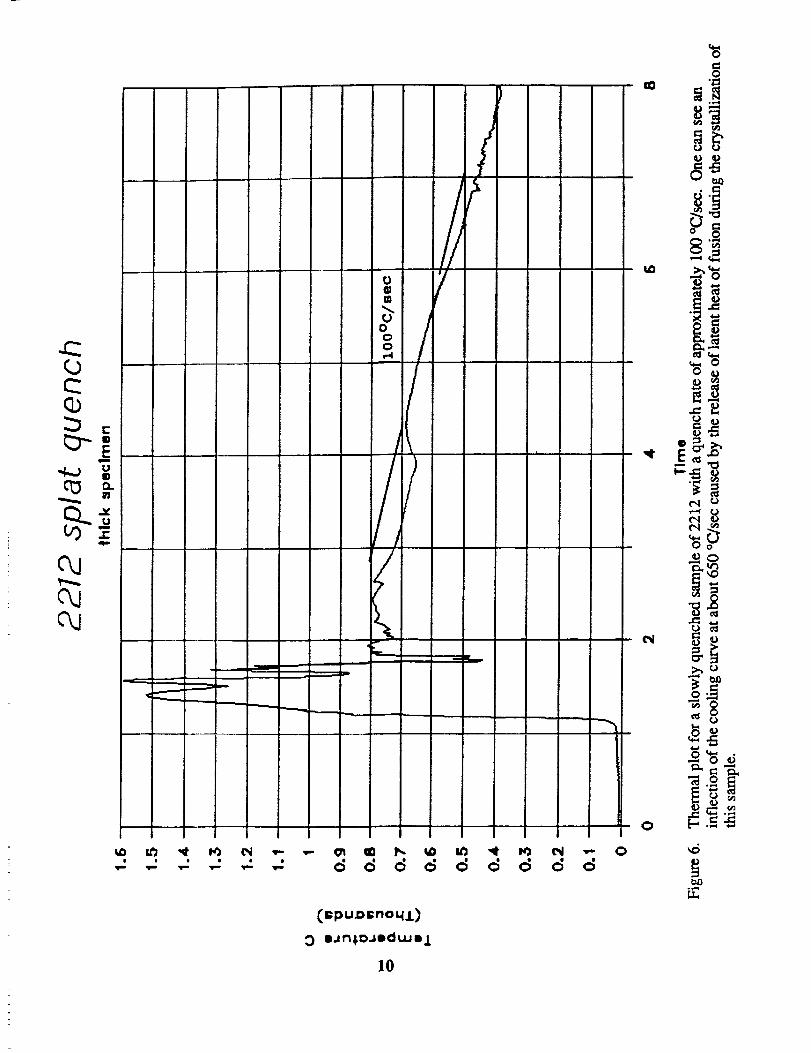
Thermal plot for a slowly quenched sample of 2212 with a quench rateof approximately 100 °C/sec .................................................. 10
Rapid thermal analyzer quenching data from sample 2112 using theautomatic rapid thermal analyzer ............................................. 12
Reheating data from the rapid thermal analyzer for a glass sample of2112 and the calculated data temperature data .............................. 13
9 Magnetization vs. temperature for 2112 glass ceramic
10 Magnetization vs. temperature for 2212 glass ceramic
1 1 Magnetization vs. temperature for 2223 glass ceramic
12
..................... 15
..................... 16
..................... 17
Magnetization vs. temperature for 4334 glass ceramic with an initialsuperconducting onset temperature of 108 K and a second super-conducting transition at 83 K ................................................. 18
PAGE
J
V
PRECEDING P_GE BLANK NOT FIL/,,/f,ED
Table
1 Nominal Compositions
2 Glass Formability in
LIST OF TABLES
Title Page
........................................................ 3
the BSCCO System .................................... 11
vi
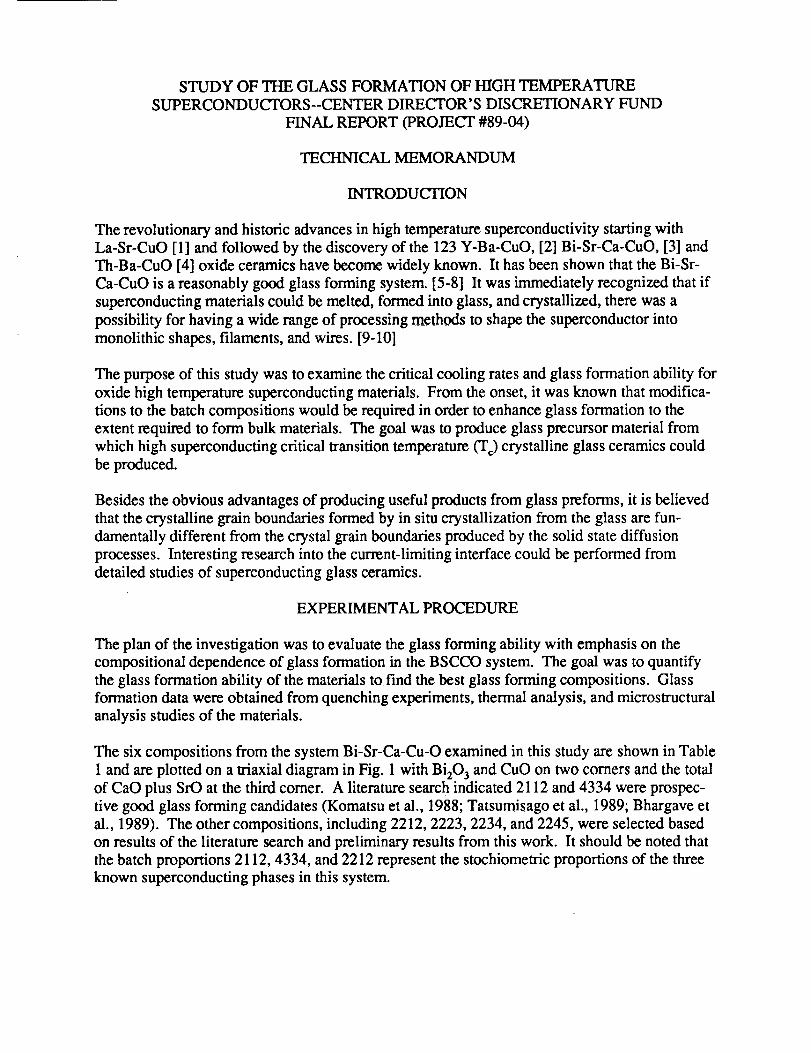
STUDY OF THE GLASS FORMATION OF HIGH TEMPERATURE
SUPERCONDUCTORS--CENTER DIRECTOR' S DISCRETIONARY FUND
FINAL REPORT (PROJECT #89-04)
TECHNICAL MEMORANDUM
INTRODUCTION
The revolutionary and historic advances in high temperature superconductivity starting with
La-Sr-CuO [1] and followed by the discovery of the 123 Y-Ba-CuO, [2] Bi-Sr-Ca-CuO, [3] and
Th-Ba-CuO [4] oxide ceramics have become widely known. It has been shown that the Bi-Sr-
Ca-CuO is a reasonably good glass forming system. [5-8] It was immediately recognized that if
superconducting materials could be melted, formed into glass, and crystallized, there was a
possibility for having a wide range of processing methods to shape the superconductor into
monolithic shapes, filaments, and wires. [9-10]
The purpose of this study was to examine the critical cooling rates and glass formation ability for
oxide high temperature superconducting materials. From the onset, it was known that modifica-
tions to the batch compositions would be required in order to enhance glass formation to the
extent required to form bulk materials. The goal was to produce glass precursor material from
which high superconducting critical transition temperature (T c) crystalline glass ceramics could
be produced.
Besides the obvious advantages of producing useful products from glass preforms, it is believed
that the crystalline grain boundaries formed by in situ crystallization from the glass are fun-
damentally different from the crystal grain boundaries produced by the solid state diffusion
processes. Interesting research into the current-limiting interface could be performed from
detailed studies of superconducting glass ceramics.
EXPERIMENTAL PROCEDURE
The plan of the investigation was to evaluate the glass forming ability with emphasis on the
compositional dependence of glass formation in the BSCCO system. The goaI was to quantify
the glass formation ability of the materials to find the best glass forming compositions. Glass
formation data were obtained from quenching experiments, thermal analysis, and microstructural
analysis studies of the materials.
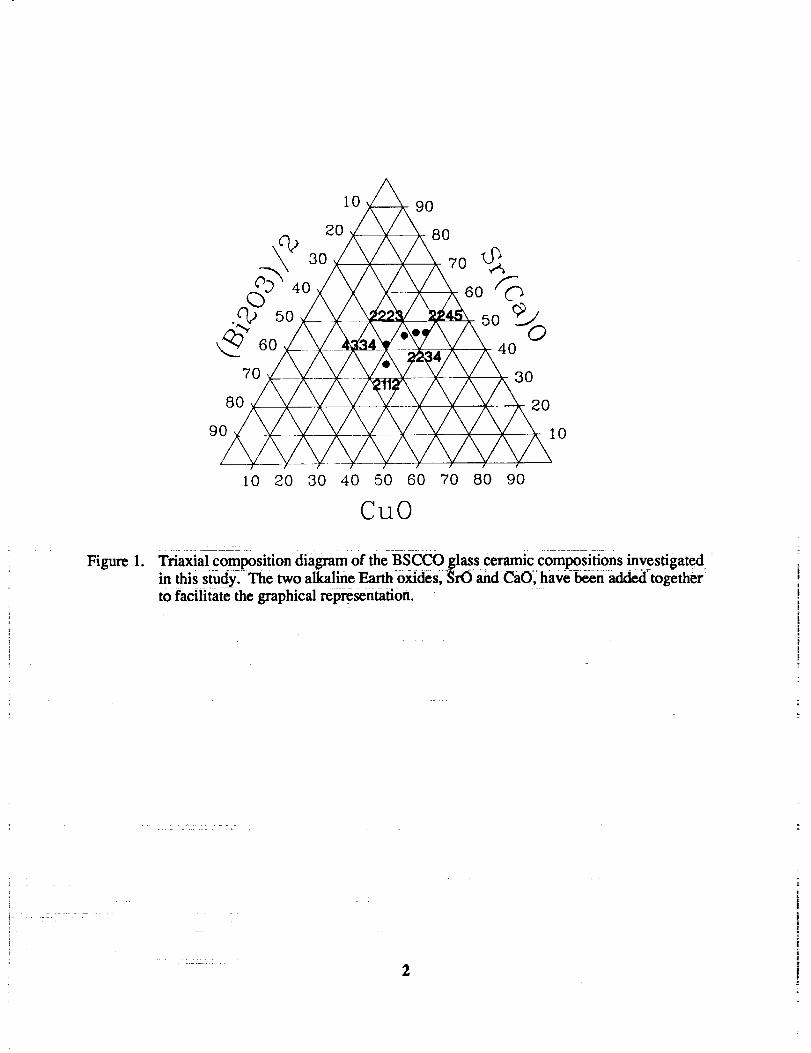
The six compositions from the system Bi-Sr-Ca-Cu-O examined in this study are shown in Table
1 and are plotted on a lriaxial diagram in Fig. 1 with Bi203 and CuO on two comers and the total
of CaO plus SrO at the third comer. A literature search indicated 2112 and 4334 were prospec-
tive good glass forming candidates (Komatsu et al., 1988; Tatsumisago et al., 1989; Bhargave et
al., 1989). The other compositions, including 2212, 2223, 2234, and 2245, were selected based
on results of the literature search and preliminary results from this work. It should be noted that
the batch proportions 2112, 4334, and 2212 represent the stochiometric proportions of the three
known superconducting phases in this system.
i0 9O
20 80rb30 70
O- 60
60 40
7O 30
80 20
90 10
10 20 30 40 50 60 70 80 90
CuO
Figure 1. Tria×ial com_sition diagram Of theBSCCO glass ceramic Compositions investigated
in thisstudy. The two alkaI_e _oxides, StO __dCaO,have_n _ together
to faciiitatcthe graphical representation.
i
2
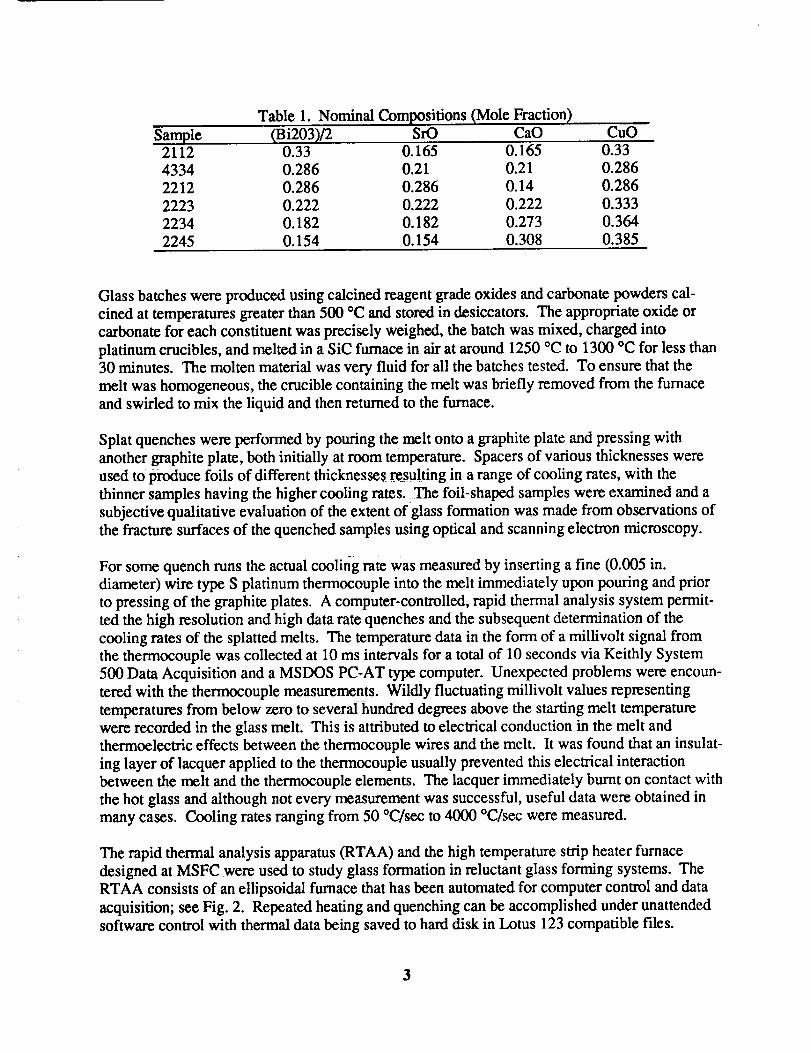
Table 1. Nominal Compositions (Mole Fraction)
Sample (Bi203)/2 SrO CaO CuO2112 0.33 0.165 0.165 0.33
4334 0.286 0.21 0.21 0.286
2212 0.286 0.286 0.14 0.286
2223 0.222 0.222 0.222 0.333
2234 0.182 0.182 0.273 0.364
2245 0.154 0.154 0.308 0.385
Glass batches were produced using calcined reagent grade oxides and carbonate powders cal-
cined at temperatures greater than 500 °C and stored in desiccators. The appropriate oxide or
carbonate for each constituent was precisely weighed, the batch was mixed, charged into
platinum crucibles, and melted in a SiC furnace in air at around 1250 °C to 1300 °C for less than
30 minutes. The molten material was very fluid for all the batches tested. To ensure that the
melt was homogeneous, the crucible containing the melt was briefly removed from the furnace
and swirled to mix the liquid and then returned to the furnace.
Splat quenches were performed by pouring the melt onto a graphite plate and pressing with
another graphite plate, both initially at room temperature. Spacers of various thicknesses were
used to produce foils of different thicknesses resulting in a range of cooling rates, with the
thinner samples having the higher cooling rates. The foil-shaped samples were examined and a
subjective qualitative evaluation of the extent of glass formation was made from observations of
the fracture surfaces of the quenched samples using optical and scanning electron microscopy.
For some quench runs the actual cooling rate was measured by inserting a fine (0.005 in.
diameter) wire type S platinum thermocouple into the melt immediately upon pouring and prior
to pressing of the graphite plates. A computer-controlled, rapid thermal analysis system permit-
ted the high resolution and high data rate quenches and the subsequent determination of the
cooling rates of the splatted melts. The temperature data in the form of a millivolt signal from
the thermocouple was collected at 10 ms intervals for a total of 10 seconds via Keithly System
500 Data Acquisition and a MSDOS PC-AT type computer. Unexpected problems were encoun-
tered with the thermocouple measurements. Wildly fluctuating millivolt values representing
temperatures from below zero to several hundred degrees above the starting melt temperature
were recorded in the glass melt. This is attributed to electrical conduction in the melt and
thermoelectric effects between the thermocouple wires and the melt. It was found that an insulat-
ing layer of lacquer applied to the thermocouple usually prevented this electrical interaction
between the melt and the thermocouple elements. The lacquer immediately burnt on contact with
the hot glass and although not every measurement was successful, useful data were obtained in
many cases. Cooling rates ranging from 50 °C/see to 4000 °C/sec were measured.
The rapid thermal analysis apparatus (RTAA) and the high temperature strip heater furnace
designed at MSFC were used to study glass formation in reluctant glass forming systems. The
RTAA consists of an ellipsoidal furnace that has been automated for computer control and data
acquisition; see Fig. 2. Repeated heating and quenching can be accomplished under unattended
software control with thermal data being saved to hard disk in Lotus 123 compatible files.
3
Illll
I_1 __ _
I!_, _"I1_ L.--f---_,_
• I!_ 4_ __
e4
A snip heater was utilized for sample preparation for use in the RTAA. Pieces of premelted
glass were placed onto Pt snip heater foil. The voltage was ramped up until melting was ob-
served. A prefabricated fine gauge type S platinum thermocouple connected to a thermocouplemeter was inserted into the molten material to produce a superconducting coating on the ther-
mocouple bead.
Differential scanning calorimetry and differential thermal analysis are very useful methods for
the investigation of nucleation kinetics. It was recognized that our group needed a state-of-the-
m system for these studies and to correlate thermal data obtained with known methods with
those obtained with the RTTA. At the beginning of the study a differential scanning calorimeter
was ordered. Due to the long procurement time it did not arrive until nearly 1 year after the
scheduled completion of the study. In the interim we were able to utilize an Omnitherm STA
1500 DTA/TG at the Co-I's UAH laboratory.
The research was focused on the processing of compositions that could form the highest tempera-
ture superconducting phases. Initial experiments indicated that compositions around the
stoichiomenic high T c phase could be quenched to glass quite easily. The glass could then be
transformed into the high Tc phase with the appropriate thermal annealing process. Glass batches
of a number of BSCCO compositions were prepared. The good glasses were crystallized and
annealed in an oxygen-containing atmosphere in the temperature range of 775 °C to 825 °C for
extended times (1 to 48 hours) to develop the high temperature superconducting phases. Super-
conducting properties of nominally 50 mg size samples were determined with a Quantum Design
Magnetic Measurement System SQUID magnetometer using standard procedures.
RESULTS AND DISCUSSION
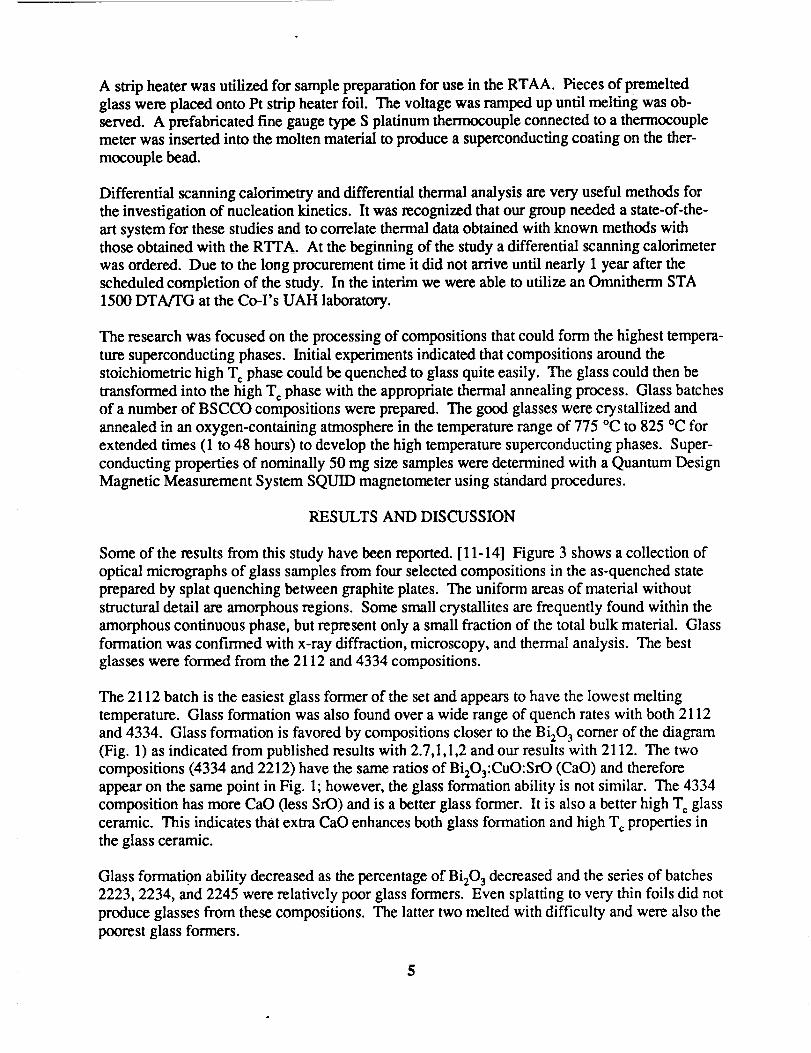
Some of the results from this study have been reported. [11-14] Figure 3 shows a collection of
optical micrographs of glass samples from four selected compositions in the as-quenched state
prepared by splat quenching between graphite plates. The uniform areas of material without
structural detail are amorphous regions. Some small crystallites are frequently found within the
amorphous continuous phase, but represent only a small fraction of the total bulk material. Glass
formation was confirmed with x-ray diffraction, microscopy, and thermal analysis. The best
glasses were formed from the 2112 and 4334 compositions.
The 2112 batch is the easiest glass former of the set and appears to have the lowest melting
temperature. Glass formation was also found over a wide range of quench rates with both 2112
and 4334. Glass formation is favored by compositions closer to the Bi203 comer of the diagram
(Fig. 1) as indicated from published results with 2.7,1,1,2 and our results with 2112. The two
compositions (4334 and 2212) have the same ratios of Bi203:CuO:SrO (CaO) and therefore
appear on the same point in Fig. 1; however, the glass formation ability is not similar. The 4334
composition has more CaO (less SrO) and is a better glass former. It is also a better high T_ glass
ceramic. This indicates that extra CaO enhances both glass formation and high T¢ properties in
the glass ceramic.
Glass formation ability decreased as the percentage of Bi203 decreased and the series of batches
2223, 2234, and 2245 were relatively poor glass formers. Even splatting to very thin foils did not
produce glasses from these compositions. The latter two melted with difficulty and were also the
poorest glass formers.
5
6
.,&;..3
e4
¢,0
ORIGINAL PAGE
BLACK AND WHITE PHOTOGRAPH
Estimates were made of the critical cooling rates for glass formation based on a set of quenches
coveting a wide range of quench rates. Critical cooling rates for formation were measured as low
as 200 °C/sec for the good glass formers and as high as 2000 °C/sec for the poor glass formers.
Typical cooling curves produced by rapid cooling between graphite plates are shown in Figs. 4,
5, and 6. Quench rates from 50 to 4000 °C/sec could be obtained. Analysis of the data was
performed using a spreadsheet to permit plotting the cooling curves and their derivatives to
determine cooling rates. Most of the quenches were in the range from 60 to 800 °C/sec. Table 2
shows qualitative data on the extent of glass formation, sample thicknesses, and quench rates for
some of experiments.
In several hundred quenching experiments with the automated rapid thermal analyzer it was
shown that many of the compositions from the BSCCO system are glass formers without the
addition of glass forming additives. The RTA was also used to quench samples to determine
critical cooling rates. Figures 7a and 8a show quenching and reheating curves, respectively, for
2112, whereas Figs. 7b and 8b show the calculated derivative of the cooling (heating) curve,
which is the instantaneous quenching or heating rate.
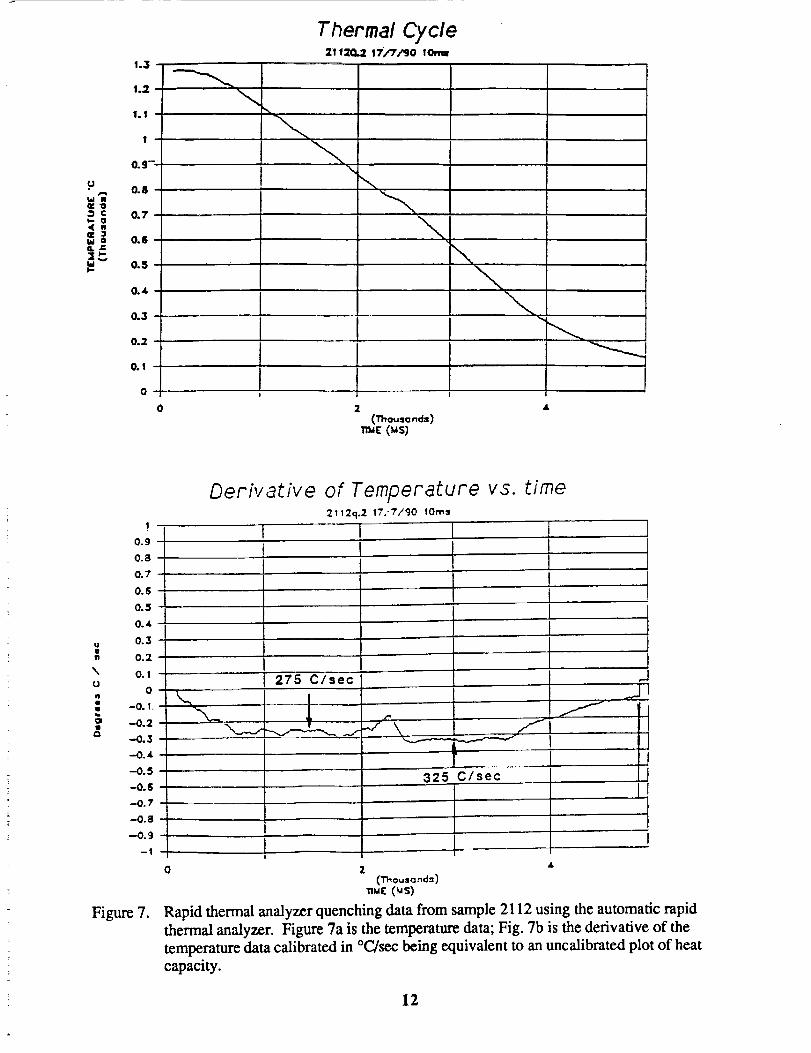
Rapid thermal analyzer quenching data from sample 2112 using the automated rapid thermal
analyzer are shown in Fig. 7. Figure 7a shows the temperature data, whereas Fig. 7b shows the
derivative of the temperature data calibrated in °C/sec being equivalent to an uncalibrated plot of
heat capacity. One can see an inflection in the cooling curve at about 780 °C. This is an
anomalous heat capacity effect at glass transition. Before the glass transition the cooling rate is
275 °C/sec and after the glass transition the cooling rate is 325 °C/sec. This indicates that the
heat capacity of the undercooled liquid is more than the heat capacity of the glass, which isreasonable for most oxides.
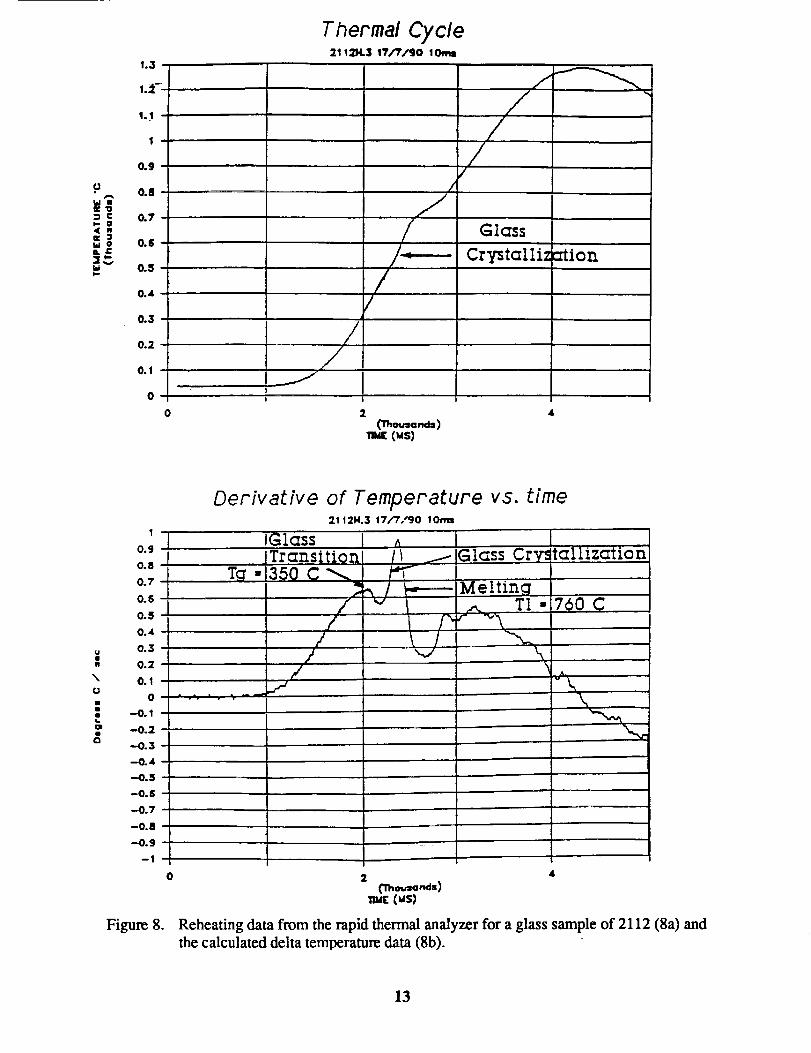
Figure 8 shows reheating data from the rapid thermal analyzer for a glass sample of 2112 (8a)
and the calculated delta temperature data (8b). The plot of cooling rate vs. time (temperature) is
very similar to conventional differential thermal analyzer (DTA) data. A peak indicating an
increased heating rate corresponds to an exotherm (i.e., glass crystallization being attributed to a
peak at about 520 °C). Endotherms are indicated by a decrease in the heating rate (i.e., glass
transition at 460 °C). Melting begins with an endotherm at about 760 °C.
Crystallization from glass is most dependent on the viscosity of the undercooled liquid. A
viscometer was ordered and set up for measurements. Utilizing viscosity data for composition
close to 2112, theoretical nucleation and crystal growth calculations were performed with Math-
CAD. Calculations of the crystallization rate were performed. These classical calculations
predicted glass formation in agreement with the _spl-at quenching and RTAA experiments. [13-15]
Based on these experiments we found the crystallization behavior of these glasses is similar to
the LBAN class of fluoride glass. A wealth of information exists for the formation of glass fibers
and bulk performs of the low viscosity fluorides. The same processing methods might be utilized
to produce useful shapes from the high temperature superconductors.
7
-C(J
qJ
c_
c]c__j
(_puD_noq±)
3 gjn_Djodu_o±
t_
0
_._
t
°!
.,I:=
$
i
- c_ o d o o d o d
(spu Dsnoq.I.)
9
r.)a)m
.c: °°
/
ql,
_J tP
(:cpuol;no _.IL)
:0 ojn;.oJocluuo I,
10
0
0
,v,-t
0
Oo
:3
£,,) c_
°_o"
',d
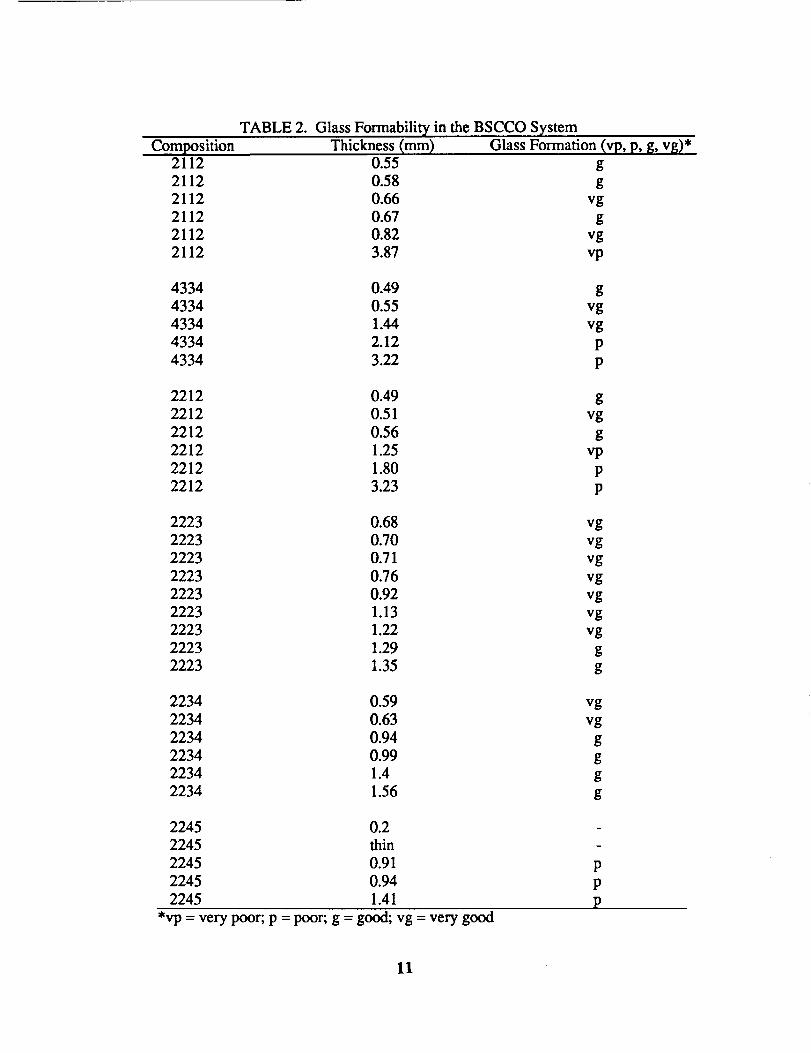
TABLE 2. Glass Formability in the BSCCO System
Composition Thickness (mm) Glass Formation (vp, p, g, vg)*2112 0.55 g
2112 0.58 g
2112 0.66 vg
2112 0.67 g
2112 0.82 vg
2112 3.87 vp
4334 0.49 g
4334 0.55 vg
4334 1.44 vg
4334 2.12 p
4334 3.22 p
2212 0.49 g
2212 0.51 vg
2212 0.56 g
2212 1.25 vp
2212 1.80 p
2212 3.23 p
2223 0.68 vg
2223 0.70 vg
2223 0.71 vg
2223 0.76 vg
2223 0.92 vg
2223 1.13 vg
2223 1.22 vg
2223 1.29 g
2223 1.35 g
2234 0.59 vg
2234 0.63 vg
2234 0.94 g
2234 0.99 g
2234 1.4 g
2234 1.56 g
2245 0.2 -
2245 thin -
2245 0.91 p
2245 0.94 p
2245 1.41 p
*vp = very poor; p = poor; g = good; vg = very good
11
u
0<n
a, f,,It J-ul
!.3
1.2
1.1.
1 ....
0.9--_
0.8 •
0.7.
0.8
O.S
0.,4,
O.3
O.2
0.1
0
Thermal Cycle2112G,2I7/7,,'S0 lOmw
\
\
..._
\
2
(l"ho_sa.d-)4
O.g -
0.8 r
0.7-
0.5-
0.5 -
O.,t
0.3
- 0.2
"" 0.1t.I
0
• -0.1.
-0.2
(: --0.3
--0.4
-0.5.
-0.7 •
-0.8
--0.9
-1
Figure 7.
Derivative of Temperature vs. time2112(.2 17/7/90 lores
I T 1
0
,J275 [Clsec_[
F325 Clsec
ff-,. !i
J
I
2('mo_sa_dn)
auc (_s)
Rapid thermal analyzer quenching data from sample 2112 using the automatic rapid
thermal analyzer. Figure 7a is the temperature data; Fig. 7b is the derivative of the
temperature data calibrated in °C/sec being equivalent to an uncalibrated plot of heat
capacity.
12
I-, •< w
1.3
1.!
1
0.9
0.8
0.7
0.8
0.5
0.4
0.3
0.2
0.1
0
Thermal Cycle2112H.3 17,77/g0 lO,,m
J|
/
/
//
Glass
Cry_talIi= :tion
/
2
_m_ (Ms)
Derivative of Temperature vs. time2.112H.3 17/'7/90 lores
m
\(J
0.9 "[0.8-
0.7-
0.6-
0.5 "-_
O.,L
0.3
0.2
0.1
0
--0.1
-0.2
-0.3
--O.A
-0.5 -
-O.S -
-0.7 -
-0.8-
-0.9-
0
Figure 8.
1Glass /
iTrans_t_on ,,_....-- IGlass Cry:T_-135oc --.. ] _----Me!ti_q
. / /" v _ _ TI-
_talltzation
760 C
2('_o,..,o-e_)
Reheating data from the rapid thermal analyzer for a glass sample of 2112 (8a) and
the calculated delta temperature data (8b).
13
Annealing of the glassy specimens in oxygen or air is required to recrystallize the specimen into
a useful superconducting material. Broken, bulk pieces were annealed in air at 800 °C for 20
hours followed by soaking at 825 °C for 86 hours in oxygen. Since 2112 showed signs of
melting at the above conditions, the annealing was performed at 775 °C in air for 20 hours and
then in oxygen for 72 hours. Some measurements of annealed specimens have been made at
UAH with the Quantum Design SQUID Magnetometer, a JEOL SEM, and a Norelco X-Ray
Diffraction Analyzer. Optical microscopy was performed on polished sections of both splatted
and annealed specimens. Based on these observations, it appears two main phases are forming in
these materials after annealing. Depending on the batch composition, the glassy splats show
varying small volume fractions of crystalline inclusions, as may be seen in Fig. 3. All splats for
all batches showed at least a tiny fraction of crystalline phase. Some, like 2212 and 4334,
showed significant quantities of crystalline phases. These phases lose their identity after anneal-
ing. With 4334 splats, the crystalline, acicular, needle-like precipitates were found emanating
inward from the quench surfaces indicating a susceptibility for surface heterogeneous nucleation.
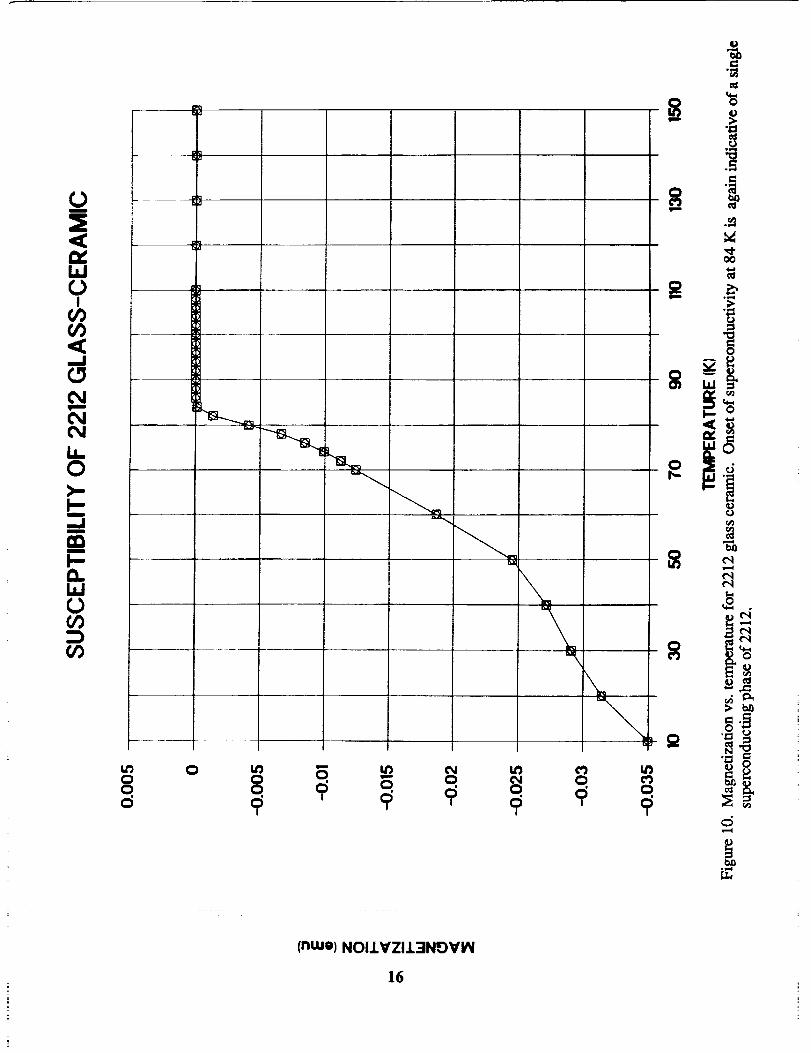
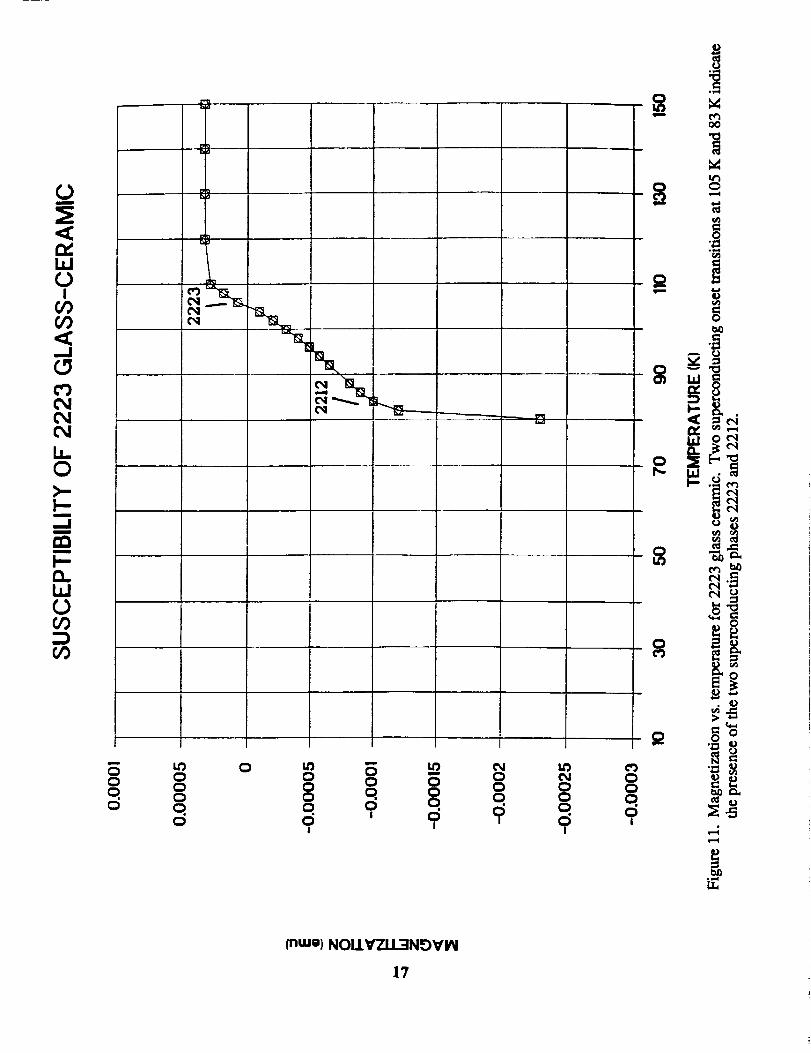
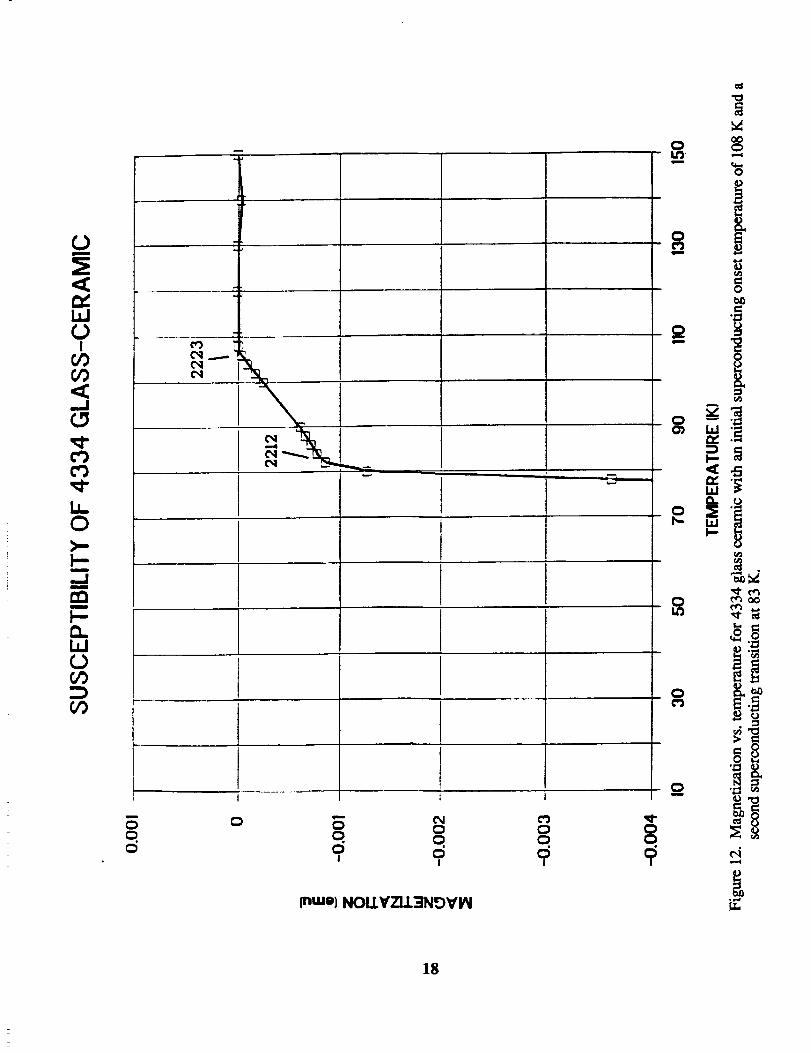
The magnetization vs. temperature of the resulting glass ceramics for four of the samples is
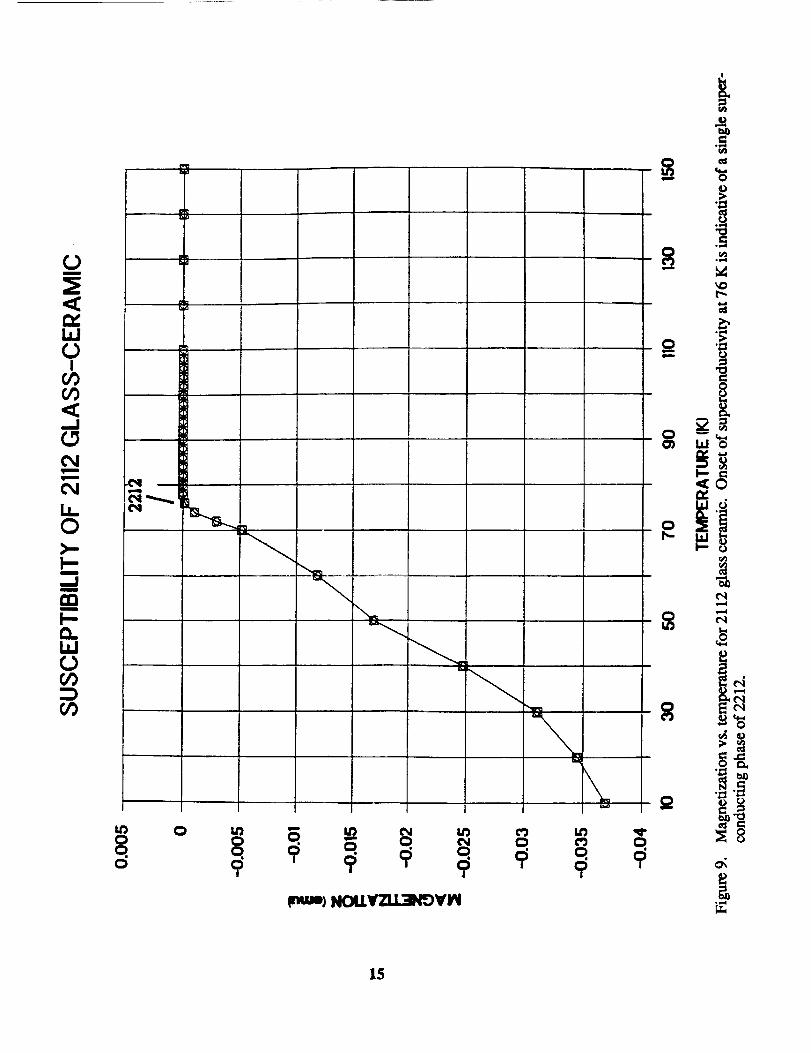
shown in Figs. 9, 10, 11, and 12. Diamagnetism as indicated by a negative value for magnetiza-
tion on this plot is confirmation of the presence of superconducting phases in the sample. The
extent of diamagnetism is proportional to the volume fraction of superconducting phase. Figure
9 shows that the glass ceramic produced from the good glass forming 2112 composition con-
tained primarily one superconducting phase, 2212 with a T c of 82 K. As can be seen in Figs. 10,
11, and 12, glass ceramics from the glass batches 2212, 2223, a0d 4334 contained the same two
superconducting phases, 2212 and 2223, with superconducting transition temperatures of 110 K
and 85 K, respectively. One of the best glass formers, 4334, contained the largest concentration
of the highest onset transition temperature for superconductivity (110 K); see Figure 12.
DTA analysis of the quenched amorphous specimens was performed in air using heating and
cooling rates of 2 °C/min. Glass transition temperatures, crystallization temperatures, melting
points, etc. were obtained for a number of samples. The glass transition, crystallization, and
apparent de-oxygenation temperatures were measured. There was little difference in the
devitrification temperatures and de-oxygenation temperatures among the various compositions
tested. The onset of devitrification was found to be around 400 °C and oxygen uptake by the
devitrified material becomes significant in this same general temperature range (Minami et al.,
1989; Yoshimura et al., 1988). But, it is only after annealing at 750 °C to 800 °C that these
materials show evidence of the presence of one or more superconducting phases. The details of
these important oxygenation and glass ceramic crystallization studies are to be reported in a
subsequent NASA Technical Memorandum [13].
CONCLUSIONS
Glass formation in the BSCCO system is relatively good. High Tc crystalline ceramics can be
produced from glass ceramics produced from these glasses. The glass ceramics contain signifi-
cant volume fraction of high Tc superconducting phases. These results are supportive proposals
to produce high T c glass ceramics from glass preform monolithic bodies and fibers. More workis indicated for examining the oxidation reduction behavior of glass formation and the effects on
high T¢ phase production.
14
0
r_bJ
I(/)(/)
m
b_0)-.l'--m
m
rnm
I--0..b_0
r/)
.C_41 m
_=o :_
Qm _ _ _
d
]5
C_J
la.,O>-l,--m
__Jlm
COm
I.-O.,l,IJ
CO
t_
,.?,o
i
-[
J=
c5
¢,,)
OO
c'q
E_.o
>, b.o
O
O
d
L_
(nuJe) NOI.LVZI.L':INOVI61
16
>,,,,I--,m
.--,Im
D0m
I,"-O,,,b,,lO00:O00
QOo,C3
D_b_
k...____.__._____
I,OOOOoO
OO OO Oo o.o, oO i
I
_ w
Oo,O
!
O("g
l,,-
c_
13 °
• qJ
o";3 i)
(_ i,)
(nma) NOI I VZU.3NOVI_
17
$
.--I
I.i.O
i-ra..Jm
cC_i
W
rT ,, •
"O
0oC_ om
O
t_
t_
2_I.IJ
f_
_oQ
- I-O
"'t:J
-o • _4.) ,'_
o _...(
m
C_
C_
Q D
C_o!
(nwe) NOLLYZU.':INOYI_I
18
REFERENCES
1. Bednorz, J.G. and K.A. Muller, Z. Phys. B 64, 189-193 (1986).
2. Wu, M.K., J.R. Ashburn, C.J. Tomg, P.H. Hor, R.J. Meng, L. Gao, Z.J. Huang, Y.Q. Wang,
and C.W. Chu, Phys. Rev. Lett. 58, 908 (1987).
3. Maeda, H., Y. Taraka, M. Fukutomi, and T. Asano, Japan J. Appl. Phys. 27, L209 (1988).
4. Sheng, Z.Z. and A.M. Hermann, Nature 332, 138 (1988).
5. Hinks, D.G., Appl. Phys. Lett. 54, 323 (1988).
6. Komatsu, T., R. Sato, K. Imai, K. Matusita, and T. Yamashita, "High T c Superconducting
Glass-Ceramics Based on the Bi-Sr-Ca-Cu-O System," Japan J. Appl. Phys. 27, L550-L552
(1988).
7. Tatsumisago, M., L.A. Angell, S. Tsuboi, Y. Akamatsu, N. Tohge, and T. Minami,
"Transition Range Viscosity of Rapidly Quenched Bi-Sr-Ca-Cu-O Glasses,"
Lett. 54 2268-2270 (1989).
8. Bhargave, A., R.L. Snyder, and A.K. Varshneya, "Preliminary Investigations of Supercon-
ducting Glass-Ceramics in the Bi-Sr-Ca-Cu-O System," Materials Letters 8, 425-431
(1989).
9. Minami, T., Y. Akamatsu, M. Tatsumisago, N. Tohge, and Y. Kowada, "Glass Formation of
High Tc Compound Bi-Sr-Ca-Cu20 x by Rapid Quenching," Japan J. Appl. Phys. 27, L777-
L778 (1988).
10. Yoshimura, M., T. Sung, Z. Nakagawa, and T. Nakamura, "Preparation of High T¢ (110 K)
Bi-Sr-Ca-Cu-O Superconductors from Amorphous Films by Rapid Quenching After Rapid
Melting," J. Mater. Sci. Lett. 8, 687-688 (1989).
I1.
12.
13.
14.
15.
Kaukler, W.F., T. Rolin, and E.C. Ethridge, "Glass Formability in BSCCO Supercon-
ductors," presented at the Am. Chem. Soc. Southeast-Southwest Regional Meeting, New
Orleans, LA, December 1990.
Kaukler, W.F., T. Rolin, and E.C. Ethridge, "Glass Formation in Bi-Sr-Ca-Cu-O Supercon-
ductors," presented at the Alabama Mater. Res. Soc. Meeting, Tuscaloosa, AL, October1990.
Ethridge, E.C. and W.F. Kaukler, "Glass Ceramic Processing Methods for BSCCO High
Temperature Supei'conducting Ceramics, Final Report MSFC-CDDF 90-03," in preparation
(1992).
Rolin, T.D., W.F. Kaukler, E.E. Anderson, and E.C. Ethridge, "Glass Formation in the
Bi-Sr-Ca-Cu-O System," presented at the Am. Physical. Soc. Meeting, Indianapolis, IN,March 1992.
Ethridge, E.C. and T.D. Rolin, "Theoretical Calculations of Crystallization Kinetics forBi-Sr- Ca-Cu-O Glass/Ceramics," in preparation (1992).
19

APPROVAL
STUDY OF THE GLASS FORMATION OF HIGH TEMPERATURESUPERCONDUCTORS--CENTER DIRECTOR'S DISCRETIONARY
FUND FINAL REPORT (PROJECT #89-04)
By
Edwin C. Ethridge, William F. Kaulker, and Terry Rolin
The information in this report has been reviewed for technical content. Review
of any information concerning Department of Defense or nuclear energy activitiesor programs has been made the MSFC Security Classification Officer. Thisreport, in its entirety, has been determined to be unclassified.
J f •
E. TANDBERG-_ANSSEN
Acting DirectorSpace Science Laboratory
'_ U.S. GOVERNMENT PRINTING OFFICE 1993--733-050/80011